sow herd monitoring tools in prrsv control programs prrs diagnostic and control workshop...
TRANSCRIPT
Sow Herd Monitoring Tools in PRRSv Control Programs
PRRS Diagnostic and Control WorkshopThessaloniki, Greece. August, 2012
Jose Angulo DVM
Boehringer Ingelheim Animal Health GmbH – Global PRRS Solutions

Outline
PRRSv Sow herd stability
Measurement tools
Applications (sharing field examples)

PRRS control / Sow Herd Stability
Prevent Infection
Maximize Herd Immunity
Minimize Exposure
Definition: Absent of clinical signs attributed to PRRSv and NO EVIDENCE of resident virus circulation within the population. = Weaning PCR negative pigs.*
*Gillespie(2003), Dufresne (2004)
First milestone in PRRSv control: To Achieve Sow Herd Stability

Using dx test as monitoring tool
Goal of testing
Accuracy and Confidence level
Cost of the sampling and testing
Frequency of the sampling Vs size sampling
Characteristics of the test (Sp,Se)

Using ELISA IDEXX Herd Check
Commercial kit (Standard)
Reliable and well implemented across D-Labs.
Costless vs PCR
Keep in mind: Measure Exposure, NO
protection. Consistent absent of
anamnesic Ab response in present of complete protection vs disease ( ab ≠ protection)
Unable to differentiate Field exposure vs Vaccine
Seropositive pigs become seronegative overtime or following repeated vaccination
Murtaugh (2005)
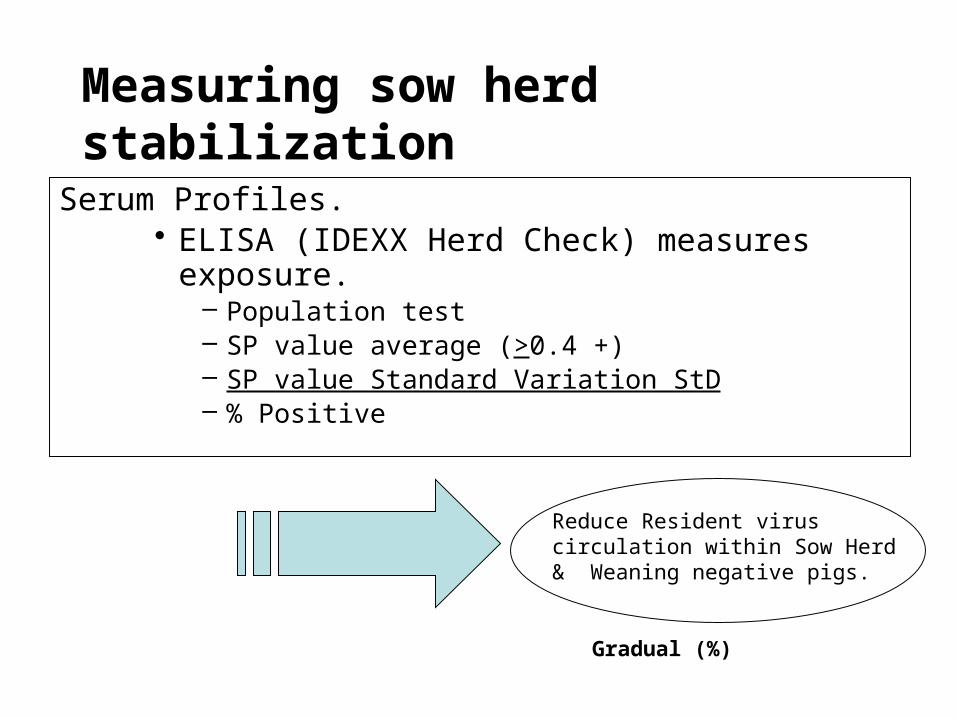
Measuring sow herd stabilization
Serum Profiles. • ELISA (IDEXX Herd Check) measures exposure.
– Population test– SP value average (>0.4 +)– SP value Standard Variation StD– % Positive
Reduce Resident virus circulation within Sow Herd & Weaning negative pigs.
Gradual (%)

Understanding the serological picture with ELISA Idexx
Comportamiento Serologico Hembras de Reemplazo Inoculo Vivo (LVI)
-0.4000
-0.2000
0.0000
0.2000
0.4000
0.6000
0.8000
1.0000
D0/A
D0/B
D0/C
D0/D
D0/E
D0/F
D0/G
D0/H
D0/I
D0/J
D0/K
D0/L
D28/A
D28/B
D28/C
D28/D
D28/E
D28/F
D28/G
D28/H
D28/I
D28/J
D28/K
D28/L
D77/A
D77/B
D77/C
D77/D
D77/E
D77/F
D77/G
D77/H
D77/I
D77/J
D77/K
D77/L
Des
viac
ion
Est
and
ar
0%
10%
20%
30%
40%
50%
60%
70%
80%
90%
100%
% P
osi
tivo
s
DS % Pos Poly. (DS)
Days in GDU D0 D28 D77Standard Dev 0.004 0.652 0.476
Replacement naive gilts batches LVI in GDU (n=35)
Angulo, Private practice, 2003

Understanding the serological picture with ELISA Idexx
0%
10%
20%
30%
40%
50%
60%
70%
80%
90%
100%
0
0,5
1
1,5
2
2,5
3
2003 2004 Apr 05 Okt 05
Po
st
sp
Seguimiento perfiles serologico hato
Prom s/p Dev. Stand. % Positivos
2003 2004Abril-
05Octubre -
05
SP Avg2.393
a
0.848b 0.575b 0.422b
Stand Dev 1.015 0.622 0.989 0.319
% Positive 100 70 57 57
Sow herd serum profile monitoring along the line with MLV mass vaccinations.
Angulo, IPVS proceedings, 2006
n=35 (Parity structure)

Applying quality tools in the analysis: Box Plot.
Data exploration tool to analyze and find trends and relationships identifying unique characteristics of the data analyzed. Facilitating its description and interpretation.
Daniel (2004). Biostats, 4th ed.
0
1
2
3
4
SP
PR
RS
Hato
agost 07 Feb-08
Fecha
agost 07
Feb-08
Level
0
0
Minimum
0.114795
0.395297
10%
0.440744
0.944963
25%
0.944229
1.743764
Median
1.658523
2.620429
75%
2.356496
3.028118
90%
2.896979
4.027211
Maximum
Quantiles
agost 07
Feb-08
Level
60
60
Number
1.11777
1.74107
Mean
0.785800
0.978845
Std Dev
0.10145
0.12637
Std Err Mean
0.9148
1.4882
Lower 95%
1.3208
1.9939
Upper 95%
Means and Std Deviations
Oneway Analysis of SP PRRS Hato By Fecha
NWA Quality Analyst Software
JMP Software

Using Box Plot in Serology Profiles
321
4
3
2
1
0
Data
Boxplot of 1, 2, 3
Information about: Shape, Dispersion and Center of the data. » Central Tendency» Dispersion stats» Skew» Outlying
Measurements» Quick look at expected
values
Smallest Value
25th Percentile
50th Percentile
75th Percentile
Median
Mean
Largest Value
Interval coefficient
Outlier
MINITAB, 2012

Sow Herd PRRSv serology
Based on Median and Quartiles
s/p
Hato reproductor Vx PRRS Ma
Pre Vx PRRS
Samples Mean Std. Dev. Target
70 1.03543 1.18679 0.4
70 0.369097 0.417897 0.4
PRRS_MARZO_08
PRRS_HR_AGO08
Variable
0 0.5 1 1.5 2 2.5 3 3.5 4
SpecsTarget

PRRSv Serology after PRRSv program implementation
0
1
2
3
4
5
6
SP
PR
RS
Siti
o 5
hato
7-Jun Dic 07
Mes
7-Jun
Dic 07
Level
0.046
0.186
Minimum
0.409
0.413
10%
0.9145
0.689
25%
1.932
1.311
Median
3.848
1.748
75%
4.7236
1.9088
90%
5.617
2.375
Maximum
Quantiles
7-Jun
Dic 07
Level
37
35
Number
2.38370
1.26434
Mean
1.62982
0.60027
Std Dev
0.26794
0.10146
Std Err Mean
1.8403
1.0581
Lower 95%
2.9271
1.4705
Upper 95%
Means and Std Deviations
Oneway Analysis of SP PRRS Sitio 5 hato By Mes
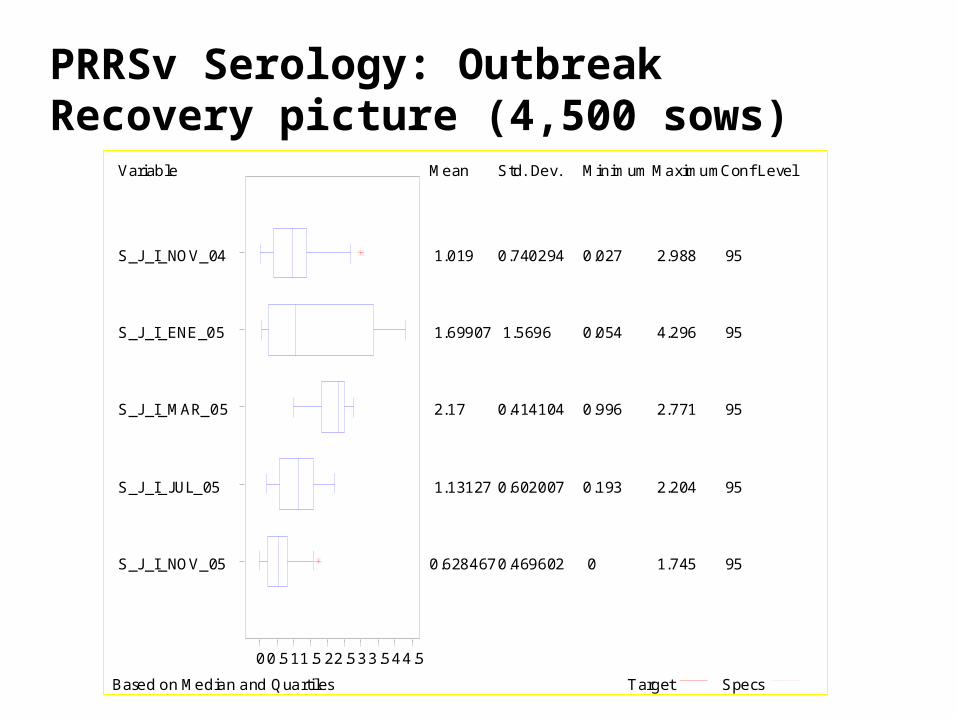
PRRSv Serology: Outbreak Recovery picture (4,500 sows)
Based on Median and Quarti les
Mean Std. Dev. Minimum MaximumConf Level
1.019 0.740294 0.027 2.988 95
1.69907 1.5696 0.054 4.296 95
2.17 0.414104 0.996 2.771 95
1.13127 0.602007 0.193 2.204 95
0.628467 0.469602 0 1.745 95
S_J_I_NOV_04
S_J_I_ENE_05
S_J_I_MAR_05
S_J_I_JUL_05
S_J_I_NOV_05
Variable
0 0.511.5 22.5 3 3.54 4.5
SpecsTarget

PRRSv Serology: Outbreak picture
Based on Median and Quartiles
48% post
74% post
57% post
71% post
79% post
72% post
Mean Std. Dev. Minimum Maximum Conf Level
0.627769 0.639422 0 3.045 95
0.853828 0.568553 0.09 2.11 95
0.641371 0.516166 0 1.805 95
0.837429 0.581574 0.092 2.112 95
0.899152 0.688371 0.103 2.842 95
2.02106 2.13882 0 7.488 95
SP_ABR05
SP_SEP05
SP_FEB06
SP_SEPT_06
SP_ABR_07
SP_JUL_07
Variable
0 1 2 3 4 5 6 7 8
SpecsTarget
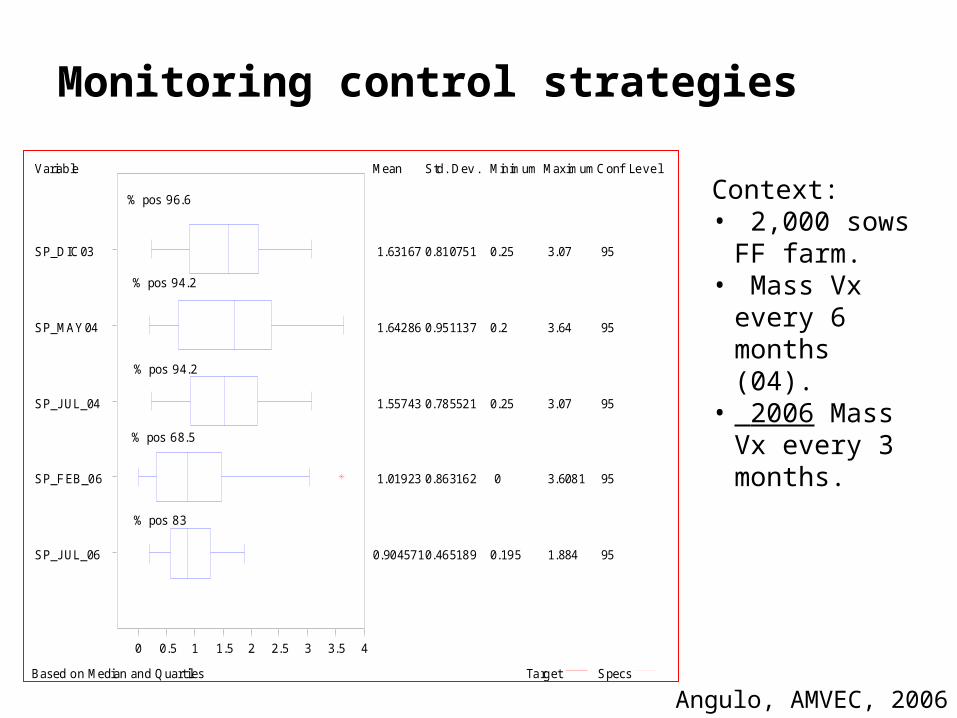
Monitoring control strategies
Based on Median and Quartiles
% pos 96.6
% pos 94.2
% pos 94.2
% pos 68.5
% pos 83
Mean Std. Dev . Minimum MaximumConf Level
1.63167 0.810751 0.25 3.07 95
1.64286 0.951137 0.2 3.64 95
1.55743 0.785521 0.25 3.07 95
1.01923 0.863162 0 3.6081 95
0.9045710.465189 0.195 1.884 95
SP_DIC03
SP_MAY 04
SP_JUL_04
SP_FEB_06
SP_JUL_06
Variable
0 0.5 1 1.5 2 2.5 3 3.5 4
SpecsTarget
Context: • 2,000 sows
FF farm.• Mass Vx
every 6 months (04).
• 2006 Mass Vx every 3 months.
Angulo, AMVEC, 2006

Home take messages
Tools for measuring sow herd stability are available
Understanding of diagnostic tests is critical
Add all measurements to bring the general picture
Link tools with goals
Simple tools like Box Plot can add value to the analysis, interpretation and decision making process.» Statistic Software or Excel!!

Thanks for your attention