southern california freight management … california freight... · the southern california freight...
TRANSCRIPT
Prepared for Office of the Secretary of Transportation
and
United States Department of Transportation
Federal Highway Administration
Office of Freight Management and Operations
January 2002
SOUTHERN CALIFORNIA FREIGHT MANAGEMENT CASE STUDY
(Six County SCAG Region)
DDRRAAFFTT
DRAFT – February 12, 2002 i
Southern California Freight Management Case Study
ABSTRACT The Southern California Freight Management Case Study is one of five regional studies being conducted across the country at the behest of the Office of Freight Management and Operations of the Federal Highways Administration (FHWA). The FHWA is examining how different regions address freight transportation needs. Consistent with recent FHWA efforts, the Southern California study discusses regional freight movement and its broader national significance. The Los Angeles County Metropolitan Transportation Authority (MTA), the Southern California Association of Governments (SCAG), and the California Department of Transportation (California DOT) conducted the Southern California study. Their collaborative effort, together with input from freight industry partners, provides a broad overview of freight movement in the region. The study also contributes to Southern California’s pursuit of a statewide goal – articulated in the soon-to-be-released Global Gateways Development Program (GGDP) authorized by California State Senate Concurrent Resolution 96 – to “improve major freight gateways in California to enhance overall mobility.” Freight movement is a core component of the Southern California economy. The six counties of Los Angeles, Orange, Riverside, San Bernardino, Imperial and Ventura form an economic powerhouse that sees massive freight flows. Much of the freight volume is generated internally. The region boasts a vast network of warehousing and distribution centers to serve its enormous local market, and is one of the largest manufacturing centers in the United States. These local freight flows are exacerbated by the region’s role as a major international trade center for the state and the nation. Two trends – population growth and trade– will shape the future of freight movement in Southern California. Preserving the region’s quality of life and economic competitiveness will require meeting freight challenges in the areas of congestion, the environment, safety and security. The region will have to work within a complex decision making environment to resolve issues of burden sharing and fairness, inefficient use of existing infrastructure, and public antipathy to freight movement. The region will also have to find ways to increase funding, public-private partnerships, and the collecting and sharing of data. The case study draws some lessons from the successful Alameda Corridor project, before concluding with a description of the other promising freight projects in the region and recommendations for stakeholders to consider when addressing the remaining freight movement challenges for the region.
DRAFT – February 12, 2002 ii
Acknowledgements The project team at the Los Angeles County Metropolitan Transportation Authority acknowledges the collaboration and support of all the people and organizations that contributed to the Southern California Freight Management Case Study (Case Study). Participants who helped develop the Case Study are identified in the following section. Among them are leaders from the freight industry, including the trucking, rail, steamship, and information technology sectors. Their commitment and patience have greatly improved the Case Study, which now reflects the perspective of those in the supply chain who ensure the timely delivery of all the products we as a society have come to take for granted. Just as critical to the success of this Case Study were the partners in the public sector who gave so much of their time and effort. The public sector participants included all levels of government, from federal to state to county and city governments, including the port and airport authorities. This project would not have been possible without information from these public sector participants. Finally, the Office of Freight Management and Operations of the FHWA has provided input and guidance at each stage in the development of this Case Study, from rough outline to full report. Many thanks to all who have contributed. Robert Cálix Project Manager Systems Analysis and Research Section Countywide Planning and Development Division Los Angeles County Metropolitan Transportation Authority Mail Stop: 99-23-7 Los Angeles, CA 90012-2952 Telephone: 213-922-5644 E-mail: [email protected]

DRAFT – February 12, 2002 iii
Acknowledgements
The Southern California Freight Management Case Study was prepared by: Los Angeles County Metropolitan Transportation Authority Chaushie Chu, Director Michelle Smith, Planning Manager Robert Calix, Project Manager Abdollah Ansari, Planning Manager Luke Cheng, Planning Manager Kimberly Few, Planning Intern Sharad Mulchand, Planning Manager Gareth Osborn, Planning Intern Kyoung Lee, Transportation Planner Southern California Association of Governments Hasan Ihkrata, Manager Alan Havens, Senior Regional Planner Mark Griffin, Senior Regional Planner Philbert Wong, Assistant Regional Planner California Department of Transportation Rose Casey, District 7, Deputy District Director Dilara Rodriguez, Project Coordinator, National I-10 Corridor Tahirih Smith, Senior Transportation Planner Ali Zaghari, District 7, Truck Services Manager Stan Randolph, Goods Movement Specialist Charles Lau, District 8, Transportation Planner In Cooperation with (In Alphabetical Order): Alameda Corridor East Construction Authority Sharon Neely, Director, Transportation Policy Alameda Corridor Transportation Authority Art Goodwin, Assistant Director, Engineering and Construction Burlington Northern Santa Fe Railway LaDonna DiCamilo, Director, Government Affairs California Cartage Company James Gill, Vice-President California Highway Patrol Calvin Aubrey, Captain
DRAFT – February 12, 2002 iv
Acknowledgements
California Trucking Association Warren Hoemann, Vice President Cambridge Systematics Michael Fischer, Senior Associate Center for International Trade and Transportation, California State University, Long Beach Marianne Venieris, Executive Director City of Los Angeles Department of Transportation Susan Bok, Supervising Transportation Planner eModal John Cushing, President Gunnar Gose, Manager, Sales & Marketing Gill V. Hicks and Associates Gill Hicks, President Los Angeles Economic Development Corporation Wally Baker, Vice President Nancy Sidhu, Senior Economist Gregory Freeman, Public Policy Analyst Los Angeles World Airports Jim Ritchie, Deputy Executive Director The National Transportation Center (METRANS)/University of Southern California Genevieve Giuliano, Professor and Executive Director Orange County Transportation Authority Michelle Bitner-Smith, Senior Transportation Analyst Orange North-American Trade Rail Access Corridor (OnTrac) Authority Chris Becker, Executive Director Port of Hueneme William Buenger, Executive Director

DRAFT – February 12, 2002 v
Acknowledgements Port of Long Beach Kerry Cartwright, Manager, Transportation Planning Port of Los Angeles Larry Keller, Executive Director Ron Reddick, Director, Engineering Development Tony Gioiello, Chief of Design, Engineering and Construction Riverside County Transportation Commission Stephanie Wiggins, Program Manager San Bernardino Associated Governments Kim Shultz, Senior Transportation Analyst Steamship Association of Southern California Jay Winter, Executive Director Transport Express Patty Senecal, Vice President Union Pacific Railroad Jeff Verhall, Vice President United States Coast Guard Captain John Holmes Cdr. George Cummings, Executive Officer Zim Container Philip Wright, Vice President

DRAFT – February 12, 2002 vi
Table of Contents
I. Key Characteristics of Freight Movement in Southern California ........................................1 1) Southern California operates on a scale normally associated with states and countries. 1 2) Southern California is the gateway to the Pacific for the region, state and country. ......2 3) Freight and people movement are so tightly interwoven in Southern California that they are inseparable. ............................................................................................................4
II. Trends Shaping Freight Movement.......................................................................................5 1) Population Growth ..........................................................................................................5 2) Freight Growth ................................................................................................................6
III. Implications for Freight Movement: Quality of Life and Competitiveness..........................8 1) Congestion.......................................................................................................................8 2) Environmental Issues ......................................................................................................9 3) Safety.............................................................................................................................11 4) Security..........................................................................................................................12
IV. Bumps on the Road: Freight Movement Challenges ..........................................................13 1) Burden Sharing and Fairness.........................................................................................13 2) Regional Coordination and Decision Making ...............................................................14 3) Funding..........................................................................................................................16 4) Public and Private Partnership ......................................................................................17 5) Efficient Use of Existing Infrastructure ........................................................................18 6) Public Perception of Freight Movement .......................................................................19 7) Limited Data Availability..............................................................................................21 8) Intelligent Transportation System and Information Technology.... .............................22
V. Success Stories: Lessons from the Alameda Corridor ........................................................23 VI. Freight Projects in Southern California ..............................................................................26
1) Highways.......................................................................................................................26 2) Rail ................................................................................................................................29 3) Ports...............................................................................................................................33 4) Airports..........................................................................................................................38 5) Education and Training .................................................................................................41 6) Information Technology Serving the Port Community - eModal ................................42
VII. Recommendations .............................................................................................................43 1) Planning ........................................................................................................................43 2) Funding .........................................................................................................................43 3) Coalition Building.........................................................................................................44
Appendix A Reference List of Goods Movement in Southern California .............................A-1
DRAFT – February 12, 2002 1
I. Key Characteristics of Freight Movement in Southern California
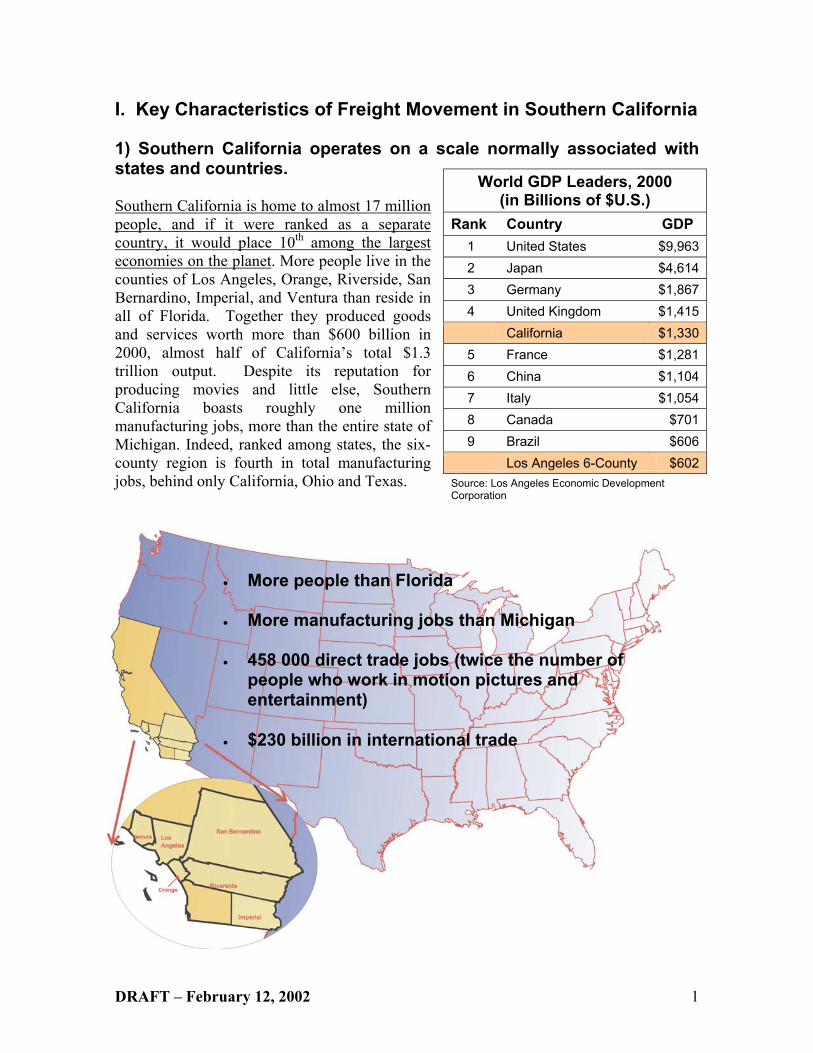
1) Southern California operates on a scale normally associated with states and countries. Southern California is home to almost 17 million people, and if it were ranked as a separate country, it would place 10th among the largest economies on the planet. More people live in the counties of Los Angeles, Orange, Riverside, San Bernardino, Imperial, and Ventura than reside in all of Florida. Together they produced goods and services worth more than $600 billion in 2000, almost half of California’s total $1.3 trillion output. Despite its reputation for producing movies and little else, Southern California boasts roughly one million manufacturing jobs, more than the entire state of Michigan. Indeed, ranked among states, the six-county region is fourth in total manufacturing jobs, behind only California, Ohio and Texas.
World GDP Leaders, 2000 (in Billions of $U.S.)
Rank Country GDP 1 United States $9,963 2 Japan $4,614 3 Germany $1,867 4 United Kingdom $1,415 California $1,330
5 France $1,281 6 China $1,104 7 Italy $1,054 8 Canada $701 9 Brazil $606
Los Angeles 6-County $602 Source: Los Angeles Economic Development Corporation
• More people than Florida • More manufacturing jobs than Michigan
• 458 000 direct trade jobs (twice the number of
people who work in motion pictures and entertainment)
• $230 billion in international trade

DRAFT – February 12, 2002 2
Southern California is home to almost 200 different nationalities and cultures, making it one of the most diverse places on earth. The City of Los Angeles is the nation’s second largest manufacturing center, regularly swapping the top spot with Chicago, and home of the country’s largest and most famous film production facilities. The region, overall, is the number one tourist destination in the country, and comprises one of the most important consumer markets in the world. All of these distinctions – from trade to tourism – depend on freight movement. California is the number one freight destination in the United States by value, and second only to Texas in overall freight movement by tonnage. The state’s freight movement is centered on the six-county Southern California region, which accounts for $421 billion in freight movement, or more than half of the state’s $802 billion total. Southern California moves the freight via three deep-water international ports, two international airports, five major rail corridors, and the most extensive h ighway system in the United States. The area’s ports, at Los Angeles and Long Beach, are the nation’s largest, both by value and container traffic.
2) Southern California is the gateway to the Pacific for the region, state and country. Southern California has emerged as a leading trade center because of its massive internal market, heavy investment in world-class trade infrastructure, and its new role as the distribution center for U.S.-Pacific Rim trade. The massive internal market draws trade both for final consumption and for inputs in value-added products ranging from shirts that are labeled and placed on hangers to parts that are used in manufacturing. These two factors help to pull in still more trade, and drive up the percentage of international cargo that makes its first stop in Southern California. With so much cargo destined here in the first place, it makes sense for shippers to use the region as a distribution center for the rest of the United States. This role is confirmed by data from the Los Angeles Customs District, which recorded almost one-quarter trillion dollars in trade for year 2000. The District accounts for 11% of all U.S. foreign trade yet collects 37% of all import duties. The discrepancy reflects the imbalance between imports (which are taxed) and exports (which are not). Keep in mind that the Customs District data underestimate Southern California’s role as trade center because the region’s trade with Mexico and Canada is not included. Trade with those countries tends to be shipped by truck and is counted in the districts where it enters the U.S.
LA Customs District Share ofTotal U.S. Import Duties (Billions of US$)
29.3%30.1% 30.3%
31.2% 31.5%32.8%
34.3%35.3% 35.8% 35.2%
36.5%
1990 1991 1992 1993 1994 1995 1996 1997 1998 1999 200020%
25%
30%
35%
40%
Note: Dollar figures are billions of dollars of customs duties collectedSource: U.S. Dept. of Commerce, Bureau of the Census, U.S. Import Merchandise Trade
$4.8$4.9 $5.2
$5.7 $6.3$6.1
$6.2$6.5 $6.5 $6.5
$7.2
DRAFT – February 12, 2002 3
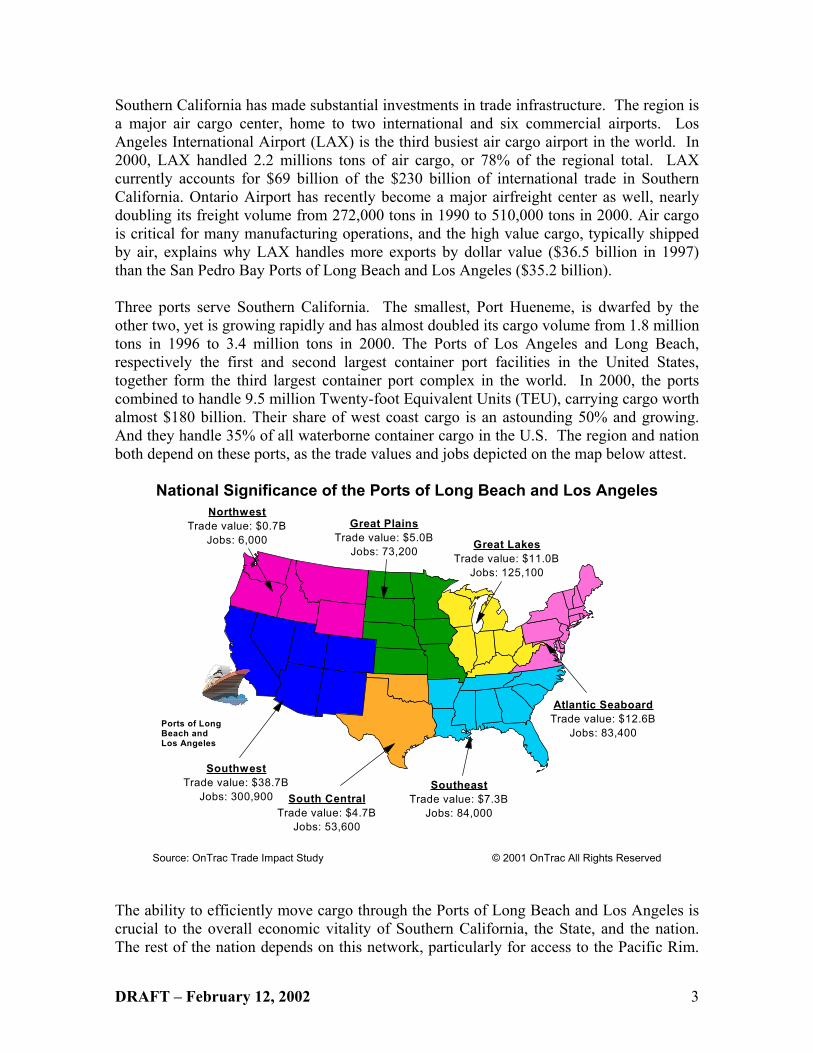
Southern California has made substantial investments in trade infrastructure. The region is a major air cargo center, home to two international and six commercial airports. Los Angeles International Airport (LAX) is the third busiest air cargo airport in the world. In 2000, LAX handled 2.2 millions tons of air cargo, or 78% of the regional total. LAX currently accounts for $69 billion of the $230 billion of international trade in Southern California. Ontario Airport has recently become a major airfreight center as well, nearly doubling its freight volume from 272,000 tons in 1990 to 510,000 tons in 2000. Air cargo is critical for many manufacturing operations, and the high value cargo, typically shipped by air, explains why LAX handles more exports by dollar value ($36.5 billion in 1997) than the San Pedro Bay Ports of Long Beach and Los Angeles ($35.2 billion). Three ports serve Southern California. The smallest, Port Hueneme, is dwarfed by the other two, yet is growing rapidly and has almost doubled its cargo volume from 1.8 million tons in 1996 to 3.4 million tons in 2000. The Ports of Los Angeles and Long Beach, respectively the first and second largest container port facilities in the United States, together form the third largest container port complex in the world. In 2000, the ports combined to handle 9.5 million Twenty-foot Equivalent Units (TEU), carrying cargo worth almost $180 billion. Their share of west coast cargo is an astounding 50% and growing. And they handle 35% of all waterborne container cargo in the U.S. The region and nation both depend on these ports, as the trade values and jobs depicted on the map below attest.
National Significance of the Ports of Long Beach and Los Angeles
Source: OnTrac Trade Impact Study © 2001 OnTrac All Rights Reserved
The ability to efficiently move cargo through the Ports of Long Beach and Los Angeles is crucial to the overall economic vitality of Southern California, the State, and the nation. The rest of the nation depends on this network, particularly for access to the Pacific Rim.
Atlantic SeaboardTrade value: $12.6B
Jobs: 83,400
SouthwestTrade value: $38.7B
Jobs: 300,900 South CentralTrade value: $4.7B
Jobs: 53,600
SoutheastTrade value: $7.3B
Jobs: 84,000
Great LakesTrade value: $11.0B
Jobs: 125,100
Great PlainsTrade value: $5.0B
Jobs: 73,200
NorthwestTrade value: $0.7B
Jobs: 6,000
Ports of Long Beach and Los Angeles
DRAFT – February 12, 2002 4
For example, 60 percent of the imported goods consumed in the Chicago area, are shipped through the ports of Los Angeles and Long Beach. Nationwide, 2.5 million jobs are linked to this trade from the Southern California region. Additionally, $23 billion is generated in Customs, Federal Income/Business Tax, and state/local tax revenue. The ports’ national significance reflects a shift in the orientation of the U.S. economy. Manufactured goods from what is now the nation’s “rust belt” used to flow west to California. Today, manufactured items arrive at Southern California ports for distribution to points across the country. Much of the port trade moves via railroad. Southern California is served by two major trunk-line railroads—operated by Union Pacific (UP) and Burlington Northern Santa Fe (BNSF). Within this region also exist four shortline or switching railroads—Pacific Harbor Lines, Los Angeles Junction Railroad Company, Ventura County Railway, and San Jacinto Branch Line. High freight volumes at the ports help make BNSF’s Hobart Intermodal Facility the busiest in the U.S., handling over 90,000 lifts per month. The rest of the international trade moves via the most extensive highway and arterial network in the nation; Southern California’s road network includes over 9,000 miles of freeways and 32,600 miles of major and minor arterials. Southern California freight flows support 32,538 wholesale trade establishments and 7,345 trucking firms.
3) Freight and people movement are so tightly interwoven in Southern California that they are inseparable. Southern California, unlike some regions of the country, cannot solve freight movement independently of people movement. The combination of a massive internal market, a large manufacturing base, an enormous volume of international trade, and one of the highest population densities of any metropolitan area in the U.S., makes freight and people movement inseparable. While Southern California does not approach the population density of Manhattan (which covers a much smaller geographic area), it is a built-out urban center with a moderately high population density that extends uninterrupted on a north-south axis for more than 100 miles, and inland for more than 60 miles. The high population density leads to competition among manufacturing, housing, education, warehousing and distribution, recreation, and other land uses. Encroachment and conflict among incompatible uses (such as residential and any truck-intensive use) is a common problem. Thus, a critical piece of the freight movement puzzle in Southern California, is the extent to which freight is bound up with people movement.

DRAFT – February 12, 2002 5
Since freight is not confined to a few busy truck routes or isolated on a single rail line, commuter and freight patterns interfere with one another. Freight conflicts with people – most notably when cars compete with trucks for space on already over-crowded freeways – and with other modes of freight, i.e., when trucks are delayed at railroad crossings. Thus, ensuring mobility for freight and people will require looking at the entire transportation system. Considering each mode or corridor in isolation may produce unintended consequences. Attempting to relieve traffic congestion with expanded rail service, for example, may actually make the situation worse. If the extra passenger trains delay freight trains, it could lead freight forwarders to switch containers from trains to trucks. The resulting additional truck traffic would likely swamp any congestion relief resulting from the commuters who swapped their cars for passenger rail.
II. Trends Shaping Freight Movement
1) Population Growth The six-county Southern California region will add more than 5 million people over the next 20 years. This is equivalent to the combined populations of the Cities of Los Angeles and San Diego, or twice the population of Chicago. Southern California is growing faster than the rest of the nation, adding roughly 2.5 million people during the 1990s. The current population of almost 17 million is expected to reach 22 million sometime around the year 2020. Most of the growth will be internally generated. In addition to having the largest population base among the 50 states, California has also one of the highest rates of natural increase (births minus deaths as a share of total population) in the nation. The natural increase will be supplemented by immigration. California also has the highest rate of net international migration of any state, helping make Los Angeles a modern Ellis Island.

DRAFT – February 12, 2002 6
Population growth will exacerbate trends in congestion and land use competition while creating an even larger internal market. Ultimately, of course, freight growth is driven by demand. Goods do not move for their own sake; their final destination is always our homes. We as a society create the demand for manufactured goods
and products of all kinds. Enterprising people and firms attempt to meet these demands, often by importing from overseas. A growing population will lead to greater demand, and thus even greater freight volumes.
2) Freight Growth Economic and population growth, along with the increasing importance of international trade, will help boost freight movement in Southern California by over 80% from 1995 to 2020. Southern California has a vibrant mix of economic activity, and is particularly strong in creative industries. Some of Southern California’s leading industries include: aircraft, biomedical technology, business services, food, furniture, metal fabrication, motion pictures and television production, textiles and apparel, and tourism. Growth in these industries and population increases will generate additional trips by employees, suppliers, customers and visitors. Rapidly increasing international trade will also add trips. China’s entry into the World Trade Organization – to take a high profile example – is expected to boost U.S. exports to China. All of this new traffic will compete with freight for limited space on an already congested surface transportation network. Freight volumes in Southern California have been steadily increasing, fueled by demand for all types of goods from a growing population, domestic economic growth, increased globalization, and reduced trade restrictions. Because of the region’s importance to international and domestic freight movement, total goods movement traffic by all modes including truck, railroad, ship, and air, will grow by over 80% by 2020. As the following chart shows, forecasts suggest heavy-duty truck traffic will rise 65%, from 1995 to 2020. Rail tonnage in the region is expected to increase 240%, from 91 million tons to 309 million tons, and air cargo will leap an astonishing 300% from 1995 to 2020.
Southern California Population Growth: 1930-2020
2.6 3.34.9
7.8
10.011.5
14.6
16.7
18.9
21.5
1930 1940 1950 1960 1970 1980 1990 2000 2010f 2020f0
5
10
15
20
25M
illion
s
Source: California Dept. of Finance

DRAFT – February 12, 2002 7
The forecast growth in truck traffic will have a dramatic impact on our streets and freeways. Some freeways in the region currently handle up to 40,000 trucks per day, and by 2025, they may need to handle up to 80,000 trucks per day. Owing to their large size and operating characteristics, trucks use a much greater share of the freeway capacity than their numbers might suggest. Already, heavy trucks use 45% to 60% of capacity on certain freeways, most notably the I-710. Trucks tend to be favored for shorter moves, and are indispensable for connecting other modes, to each other, and to their customers. According to the 1997 Commodity Flow Survey, the average truck trip was 288 miles, compared to 1,525 miles for the average rail move. The Commodity Flow Survey also revealed that trucks move 81% of all tonnage originating in Southern California; so increasing freight flows will mean more trucks on the freeways.
Air cargo volume in the six-county SCAG region is forecast to more than triple from its current 2.9 million tons to 9.5 million tons per year by 2025. The majority of air cargo in the region is handled by Los Angeles International Airport (LAX), though other airports, particularly Ontario, will handle much of the additional air freight.
Freight Forecasts by Mode: 1995-2020
309
527
8.9
91
319
2.2
Rail Truck Air0
100
200
300
400
500
600
Milli
ons
of T
ons
1995 2020f
Source: Southern California Association of Governments
240%increase
65%increase
304%increase
Southern California Air Cargo Forecast: 1990-2025
1.5
2.9
6.3
8.99.5
1990 2000 2010f 2020f 2025f0
1
2
3
4
5
6
7
8
9
10
Milli
ons
of T
ons
Source: Southern California Association of Governments

DRAFT – February 12, 2002 8
The Ports of Los Angeles and Long Beach currently handle 9.5 million TEUs annually, or about 7,000 TEUs a day. The chart at right shows that container traffic at these two ports is expected to almost double by 2010, then double again by 2025. The forecast growth may seem incredible, but if anything, it is probably conservative. Indeed, the wide range for the year 2025 forecast is a tacit acknowledgement that current traffic levels have surpassed all previous estimates. To place these numbers in perspective, consider that a single large ship typically carries 6,000 TEUs. That is enough containers, placed end to end, to build a wall of boxes more than twenty miles long.
III. Implications for Freight Movement: Quality of Life and Competitiveness
1) Congestion Traffic congestion in Southern California is among the worst in the nation, and will get even worse, before it gets better. Most of the area’s freeways are at (or beyond) capacity during peak periods, and Los Angeles has four of the ten most congested freeway interchanges in the country. Southern Californians lose, on average, an estimated 82 person-hours annually to delay – the highest per capita loss to traffic congestion in the country. Trucks exacerbate the problem on freeways such as the I-710 and SR-60 where 30% to 60% of the capacity is used by trucks, and truck vehicle miles traveled are expected to jump from approximately 38 million miles in 2000 to 50 million miles as early as 2010. Congestion will also worsen as the population increases: at current ownership levels, 5 million new residents will add more than 2.7 million additional cars by 2020.
Container Counts: 1995-2025
30.0
5.4 5.7 6.5 7.5 8.29.5
17.0
36.0
1995 1996 1997 1998 1999 2000 2010f 2025f0.0
10.0
20.0
30.0
40.0
Milli
ons
of T
EUs
Sources: 1995-2000 data from Port of Los Angeles, 2010 and 2025 forecasts by LAEDC
Range ofestimate

DRAFT – February 12, 2002 9
Ports of Long Beach and Los Angeles
Congestion is a problem across all modes. Growing demand suggests that the region will struggle to accommodate future freight operations; the intermodal facilities at local ports and rail yards are projected to reach capacity over the next 20 years; and without major investments, the rail lines east of downtown Los Angeles will be congested as well. These problems will be exacerbated by congestion on the roads. Air cargo facilities rely on trucks to feed shipments to the airport and to deliver freight to its final destination yet
traffic is terribly congested in the vicinity of LAX. Intermodal rail facilities also rely on trucks to connect the rail system to its customers. Yet the region’s largest intermodal facility, the BNSF Hobart Yard in downtown Los Angeles, is just a few miles from four of the most delay-prone interchanges in the country.
2) Environmental Issues While there are numerous environmental challenges in Southern California – such as storm water runoff and open space preservation – air quality preservation looms as the most significant challenge for freight movement. The region has made tremendous strides over the past 30 years, primarily by controlling emissions from cars and stationary sources, such as refineries. Despite these gains, the region comprises all or part of seven different air quality non-attainment or maintenance areas in five air basins. The South Coast Air Basin in particular, is designated “a severe non-attainment area” which makes it hard to expand capacity because projects must demonstrate conformity with air quality goals.

DRAFT – February 12, 2002 10
Future air quality improvements will be difficult because additional congestion and slower traffic increase tailpipe emissions, especially for trucks. Likely changes include stricter controls on diesel powered vehicles, which until recently were one of the only major sources of air pollution in the region to have escaped stricter emissions standards. Marine, rail, and truck modes predominantly use diesel fuels – a major source of NOx (an ozone
precursor) and the primary mobile source of particulate matter. Even with the adoption of new truck emission standards, however, the share of total mobile source NOx emissions in the South Coast Air Basin attributable to trucks is expected to increase from 44% to 53% between 2000 and 2010. Increasingly stringent emission standards and requirements for cleaner burning diesel fuels will add costs to freight transportation and create competitive problems relative to out-of-state operations. The importance of air quality management for freight movement is not limited to trucks. The EPA found, for example, that ships using the ports were the largest uncontrolled source of nitrogen and sulfur oxides in California, accounting for approximately 40% of all SOx emissions and 12% of NOx emissions from both mobile and stationary sources statewide. Across California, aircraft, ships, trains, and heavy duty trucks emit 3,173 tons of carbon monoxide, 981.63 tons of nitrogen oxides, and 36.73 tons of particulate matter
Air Pollution-Related Cancer Risk (per million people) Source: SCAQMD, MATES-II

DRAFT – February 12, 2002 11
(10 microns or less) annually. Trucking, however, is the most likely target for future air quality controls. Historically, California has had its own emission and fuel standards. This has proved challenging for freight movement, given the wide range of trucks operating in interstate commerce and the California Trucking Association and the Air Resources Board have long disagreed about the regulations’ impact on the trucking industry. New truck engine technologies are already having a positive impact on diesel emissions as many of the larger trucking firms adopt them when turning over their fleets. The numerous smaller fleets and owner/operators, however, have had difficulty raising the capital needed to invest in new trucks.
3) Safety Safety is a freight transportation priority in Southern California, because the interaction of passengers and freight on the regional transportation network creates significant safety concerns. There are far fewer total fatalities each year from truck-related accidents than from passenger-vehicle accidents. However, truck-related accidents tend to be more severe: they involve a higher incidence of fatality, property damage and economic loss than non-truck related accidents. Truck-related accidents also generate serious traffic congestion because they involve a larger number of lanes blocked or closed. Many truck accidents result from outdated highway designs that no longer reflect vehicle size, performance, or driving habits. The lack of proper medians and narrow highway shoulders both contribute to increased accident risk. Over-loading or improper loading of vehicles also creates safety concerns. Truck driver turnover rates are particularly high due to low wages and stressful working conditions in many parts of the industry. The lack of experienced truck drivers has contributed to an increase in truck-related accidents.
Source: Port of Long Beach

DRAFT – February 12, 2002 12
Reducing the number of truck-related accidents is crucial. California has the dubious distinction of ranking first among all states in the number of fatal heavy truck crashes (360 in 1997) and is second for hazardous material incidents (1,090). In Southern California, there were over 27,000 truck-related accidents with 10,200 injuries, 232 fatalities and over 20,000 cases of property damage. Safety issues are particularly pressing on the corridors
with heavy volume of truck traffic. On a single 27-mile stretch of the I-710 (the Long Beach Freeway), for example, almost one-third (698) of all the accidents in year 2000 involved trucks. In half of those collisions (348) the trucks were at fault. Some of the safety problems stem from over-loading, which has become more of a problem due to the recent closure of the I-405 weight station and the complete absence of a weigh station on the I-710. Another safety concern is the relative inexperience of many truck drivers, owing to the high turnover among drivers. The California Highway Patrol has attempted to stem this problem through many projects including the Commercial Industry Education Program (CIEP) and the I-710 Truck Corridor Safety Project. CIEP is an on-going educational program designed to provide educational information and safety awareness to anyone operating commercial vehicles. The I-710 Safety
Project was funded by TEA-21 and seeks to reduce fatal and injury collisions on the I-710. Rail accidents are another source of concern, particularly where rail and roadways intersect. Fatalities related to railroad traffic have declined by two-thirds since 1960 as the result of improvements in rail crossing technology, better education, and improvements to rail infrastructure. Nevertheless, between 1997 and 2000, the State of California experienced over 40 deaths and 345 injuries due to rail crossing accidents. Rail safety will be addressed as part of a larger effort to grade-separate the rail and road infrastructure.
4) Security In the aftermath of the terrorist attacks on September 11, 2001, transportation security has become a priority. The Coast Guard has dramatically stepped up its harbor patrols and monitoring efforts. The California Highway Patrol has recertified all 1,000 companies licensed to carry hazardous materials in Southern California. Yet the current inspection process for all containers is costly and time consuming. Containers are selected (often at random), stopped, opened and sifted before

DRAFT – February 12, 2002 13
being allowed to continue. Greater security would require increasing the number of inspections, adding significant additional costs to freight movement. Air cargo facilities have a unique security issue because passengers and freight often travel together on commercial aircraft that carry cargo in their belly holds. Security procedures for air cargo are likely to come under increased scrutiny, with possible changes ranging from requirements for better screening equipment to mandating that freight travel separately on dedicated air freighters. Increased security will raise costs, and the most extreme solution (completely separating freight from passengers) will dramatically raise prices for both air cargo and air passengers. In Southern California, more intensive inspection procedures will be further complicated by the high percentage of international freight. Prior to September 11, 2001, the primary freight security concern was cargo theft. Cargo theft is a major and growing problem. Between $10 billion and $12 billion worth of cargo is stolen each year in the U.S. Two to three billion dollars of these losses occur in the Golden State, mainly in Southern California. These numbers are probably understated since cargo theft often goes unreported. Even when it is reported, cargo theft is frequently classified as a standard robbery or theft, making it difficult to estimate the full extent of the problem. Nonetheless, estimates suggest cargo theft levels in Los Angeles County have doubled since 1995. Cargo theft is growing in part because freight can be stolen so easily. Many freight facilities lack basic security provisions such as guards, video cameras, proper fencing, and I.D. check points. Enforcement agencies have begun working with private companies on help explain steps they can follow to lower their risk of theft. The agencies have come together to create a unique multi-jurisdictional law enforcement program. This unit, the Cargo Cats, is managed by the Los Angeles County Sheriff Department but includes officers from many jurisdictions including the FBI, the California Highway Patrol Cargo Theft Interdiction Program, and the LAPD B.A.D. Cargo unit. The multi-jurisdictional composition of the group has allowed it to make 1,042 arrests and recover more than $152 million in stolen property.
IV. Bumps on the Road: Freight Movement Challenges
1) Burden Sharing and Fairness Major transportation infrastructure projects confer diffuse benefits and impose concentrated costs, making them unpopular with their neighbors. The Orangethorpe Corridor in Northern Orange County is a typical example. The Burlington Northern Santa Fe rail line connecting the L.A. and Long Beach ports (via the Alameda Corridor) with the rest of the country (via Colton Crossing) runs through the Orangethorpe Corridor. Trains traversing the corridor carry freight that supports trade and jobs across the country. Local residents, however, must endure train whistles blowing at all hours, and put up with additional pollution and traffic congestion caused by vehicles lined up at railroad

DRAFT – February 12, 2002 14
crossings. Airports, ports, highways and other rail corridors are similarly burdensome for their neighbors. NIMBYism (Not In My Back Yard) has often been the response, particularly when projects are perceived as unfairly burdening particular communities. For now, the issue of burden sharing and fairness is limited to the immediate neighbors of major transportation improvements such as freeways, rail corridors and airports. A similar argument, however, may soon be applied to the burdens placed on Southern California with respect to the rest of the nation and international trade. Projects such as the Alameda Corridor, Alameda Corridor East (ACE), the Orangethorpe Corridor, and the San Bernardino and Riverside County grade separation projects are all dealing with increased delay and safety problems at railroad grade crossings created in part by increasing levels of international trade traffic. The Ports of Los Angeles and Long Beach, in particular, serve the entire country, and more than 40% of inbound containers make their first stop outside Southern California. Before leaving the region, however, these containers will add to regional congestion and pollution. Winning community support for desperately needed infrastructure improvements will require spreading the burden around (in the case of airports) and providing appropriate, if expensive, mitigation for the rest. 2) Regional Coordination and Decision-Making The sheer number of stakeholders complicates freight transportation issues in Southern California. Since freight bottlenecks do not respect jurisdictional boundaries, there are frequently multiple governments (federal, state, county, municipal, special districts, and the agencies of each) along with regional organizations that can legitimately claim jurisdiction over significant freight movement projects. Coordinating their competing
Regional Freight Movement: Who Has Jurisdiction?
3 Joint Powers Rail Corridor Authorities (ACTA, ACE, OnTrac)
3 Sea Ports (LA, LB, Hueneme)
4 State/Regional Agencies (Caltrans, SCAG, CARB, SCAQMD)
6 Counties
6 County Transportation Planning Agencies
8 Airports
13 Subregional Councils of Government
184 Cities

DRAFT – February 12, 2002 15
priorities, fragmented funding resources and authorities, and overlapping geographic jurisdictions can make projects extremely complex, adding delay and expense. SCAG is one of the agencies that have taken the lead in freight movement planning. In 1994, SCAG convened the Goods Movement Advisory Committee (GMAC), a group that includes shippers, carriers, industry associations, infrastructure managers, regulatory bodies, as well as elected officials. SCAG also convened a Truck Lane Task Force to help plan a regional network of truck lanes. SCAG has also been a catalyst at the local level, funding freight movement studies in many of the sub-regions within Southern California. These studies have been used to identify key freight-related projects for inclusion in the Regional Transportation Improvement Plan (RTIP). The six County Transportation Commissions/Authorities (CTCs) in Southern California are another key group dealing with freight movement. They have been responsible for programming and funding the transportation projects in Southern California. These agencies provide substantial funding for goods movement projects and must make critical decision regarding the allocation of transportation funds. Several of the CTCs, such as the Los Angeles County Metropolitan Transportation Authority (LACMTA), have been major funding partners for principal freight movement projects and are beginning to undertake comprehensive freight movement planning, data collection, and freight model development. Other major public players include the public port and airport authorities, along with the California Air Resources Board and the regional air districts. The ports and airports help plan, construct and maintain the region’s freight movement infrastructure. In particular, they coordinate with Caltrans, SCAG, the CTCs, and local agencies on landside access improvements. The California Air Resources Board and the regional air districts play a major regulatory function that impacts all freight modes. Air quality agencies have also been at the forefront in developing new methods of forecasting freight transportation activity. For example, the South Coast Air Quality Management District funded the development of SCAG’s regional Heavy Duty Truck Model. Besides these public agencies, numerous private entities such as shippers, the California Trucking Association, Steamship Association and the railroads are important stakeholders in freight movement in Southern California. Sometimes just defining the appropriate boundaries of freight movement projects can create problems. While it may be convenient to define a freight movement project so that it coincides with jurisdictional boundaries, this does not necessarily produce the most cost-effective system-level solutions. For example, the definition of the ACE project is significant because it is a designated corridor eligible for funding under the National Corridor Development Program. But the definition of the corridor in the Transportation Equity Act of 1998 (TEA-21) legislation does not include portions beyond Colton Junction in San Bernardino County, nor does it include segments in Riverside and Orange County. Some planners in the region believe that this broader definition is more reflective of actual railroad operations. Today, separate projects are being planned for each segment of this rail

DRAFT – February 12, 2002 16
corridor that is not officially part of ACE. All of these projects (including ACE) compete with each other for funding. One lesson in solving this problem is offered by the Alameda Corridor project. The Alameda Corridor Transportation Authority (ACTA) was formed as a joint powers agreement between the City of Los Angeles and the City of Long Beach (both San Pedro Bay ports are overseen by departments of their respective cities). ACTA bought the rights to the railroad for the project, acted as developer, and (after morphing into an operating agency) will collect tolls on containers passing through the corridor. The efficiency gained by concentrating authority in ACTA, however, was only realized after lawsuits involving the smaller cities along the corridor were resolved by ACTA’s agreement to provide $12 million in mitigation funds to the cities in exchange for expedited permitting for ACTA construction. Successful coordination on future transportation projects will require seeking consensus (or at least compromise) from all interested parties as early as possible in the planning process. A good example of this is offered by the joint efforts of the various agencies involved in compiling the Southern California trade corridor report required by California Assembly Bill 2928. The Los Angeles County Economic Development Corporation supported the Critical Infrastructure Council – which seeks to get business leaders and the wider community involved in infrastructure planning issues – offers another good example. Private sector participation will be crucial, as outlined in Section 4 below.
3) Funding Even if local opposition and institutional complexity were not problematic, existing funding mechanisms would be insufficient to finance Southern California’s transportation infrastructure needs. The rapid population and freight growth expected over the next twenty-five years require infrastructure investments and operational improvements that exceed the region’s ability to pay. Just the official, planned freight movement transportation projects in the Southern California Association of Governments (SCAG) Regional Transportation Plan (RTP) will cost in excess of $15 billion through 2025. If other desperately needed (but as yet unfunded) projects were included, the total would be much higher. Making up the shortfall will require a combination of state and federal funding, user fees, and creative financing alternatives. The $15 billion estimate in the 2001 RTP for the region’s freight related highway and rail improvement needs consists of three distinct categories of expenditures. As shown in the table at right, these include baseline, constrained, and unconstrained projects.
Identified Funding Needs for Freight Movement in Southern California
(Billions of Year 2000 Dollars) Freight Project Categories Estimated Cost Baseline $3.44 Constrained (Public) $5.91 Constrained (Private/Other) $2.12 Unconstrained $3.68 Total $15.15 Source: SCAG 2001 Regional Transportation Plan
DRAFT – February 12, 2002 17
Baseline costs are short-term capital commitments, as well as expenses associated with operating and maintaining the existing transportation system. Short-term capital commitments include projects identified in the 2000 Regional Transportation Improvement Program (RTIP), projects identified in the Traffic Congestion Relief Program (TCRP), TEA-21 High Priority Projects, and State Transportation Improvement Program(STIP) Projects. The constrained (or planned) category includes costs for those projects in the 2001 RTP (above the baseline or existing system). According to federal requirements, RTP projects must be financially constrained. That is, total estimated cost of projects, within the time horizon of the RTP, must not exceed estimated revenues. The unconstrained cost category, however, includes projects that are beyond the means of currently identifiable revenue sources, and therefore these projects are not part of the adopted RTP. Rather, they represent a list of needed improvements for future consideration. Once funds have been identified, these projects may be moved to the financially constrained portion of a future RTP. Federal funding makes sense for projects handling trade flows that confer significant national benefits and impose major local costs. Good examples include the Alameda Corridor and future I-710 improvements. Federal funding is particularly helpful in overcoming local opposition because it helps create the impression that the local burden is acknowledged and being mitigated. User fees can provide a bondable revenue stream for project finance. The $30 per container fee on all cargo moving through the Alameda Corridor, for example, allowed almost two-thirds of the financing of the project to come from debt instruments. However, user fees are not a funding panacea. Many freight projects cannot be adequately financed with user fees: a feasibility study of truck lanes on the SR-60 freeway indicated that even if tolls were optimally applied, only about 30% of the project’s costs could be recovered with toll revenues. An alternative strategy, such as imposing a surcharge on each container that is imported through the ports, would help finance freight infrastructure improvements but may have an adverse effect on the region’s competitive position in both international and domestic trade. Another (partial) solution might be to distribute revenues from fees already collected by the federal government in connection with trade activities. One possibility along these lines would be to redirect some of the customs fees (estimated to be approximately $900/container) and Harbor Maintenance Tax revenue to local jurisdictions to pay for trade-related transportation improvements.
4) Public-Private Partnerships Meeting Southern California’s freight transportation challenges will require extensive collaboration with the private sector. Public-private collaboration has been hindered by the distrust engendered by some contentious regulatory relationships. The trucking industry, for example, is often at loggerheads with the Air Resources Board and the South Coast Air Quality Management District. The thorny issue of using public funds for private sector projects with broad public sector benefits has also complicated collaborative efforts. A prime example is offered by the region’s rail capacity problems. Improvements to the regional rail system could help reduce delay at grade crossings and would create opportunities to divert truck traffic from congested freeways. Thus, public investment

DRAFT – February 12, 2002 18
could help improve overall traffic flows, but the fact that the railroads are privately held makes the use of public funds problematic. Even if everyone agrees public-private collaboration is justified and feasible, merely keeping the private sector engaged may be difficult. Private businesses, particularly the numerous small trucking and warehousing operations, do not have the staff time to stay involved on a regular basis with all the numerous public agencies involved in solving transportation needs. Moreover, regional public-private forums on freight movement often fail to address the issues that most concern shippers and carriers such as local regulations (parking and route restrictions), design of loading areas and on-street parking, and geometric configuration of local streets. The time frame of the private sector also tends to be compressed relative to the public sector’s 20-25 year planning horizon, and even compared with elected state and local officials whose time horizons have been truncated by term limits. A decade after the ISTEA, freight industry representation and participation in planning and programming decisions at the state and Metropolitan Planning Organization (MPO) levels (and even at the federal level) remains limited despite considerable efforts to bridge the two different worlds. Yet, private sector participation in statewide and regional planning processes is critical. The private sector can provide the background, training, expertise and freight flow data necessary for efficient, effective freight transportation management. This mismatch in planning horizons (“generational” versus “quarterly”), and the fact that the private sector perceives the public-sector planning process as overly slow, inflexible, and disjointed compared to the private sector’s market-driven needs and expectations, make it difficult to keep the private sector engaged in the public sector planning process. An initial approach to overcoming this mismatch may be to identify and develop “soft solutions” through freight improvement programs targeted at low-cost capital, operations, and maintenance projects with relatively immediate improvements. This will enhance the relationship between the public and private sectors, and create possibilities for further collaboration on more long-term issues.
5) Efficient Use of Existing Infrastructure Southern California’s freight industry will have to change its business practices to make the most efficient use possible of existing infrastructure. Freight movement to and from the ports, for example, is grossly inefficient, with most container moves concentrated during the peak commuting periods. Spreading these moves throughout the day could improve efficiency, increase the number of turns a driver could complete during a shift, and reduce congestion for non-freight traffic on the freeways. Realizing these gains, however, would require changing business practices, and inducing a degree of cooperation among private businesses that will be difficult to achieve given the competitive nature of the freight industry. Terminal operators, for example, would have to offer extended hours of operation – which they prefer to avoid because it means paying overtime wages or changing labor rules – and the businesses receiving the cargo would have to have warehouse staff available outside standard business hours.
DRAFT – February 12, 2002 19
Private sector collaboration at the ports could provide efficiency gains from other operating changes such as reducing the number of trips back to the marine terminals by allowing exchanges of empty containers among carriers and shippers away from the ports. Adopting uniform appointment practices, and increasing internet-based shipment tracking and appointment system use would also be helpful. The West Coast Waterfront Coalition appears to be heading in this direction, bringing together terminal operators, steamship lines, carriers, shippers, and other interested parties on the waterfront to discuss ways of working together. The National Transportation Center (METRANS) at the University of Southern California has also facilitated dialogue among industry and labor stakeholders in international trade through its “town hall” meetings. Ultimately, the industry will have to solve its coordination problems, or risk having sub-optimal solutions – such as a peak period fee on containers that leave the port by truck between 7AM and 6PM – imposed upon them.
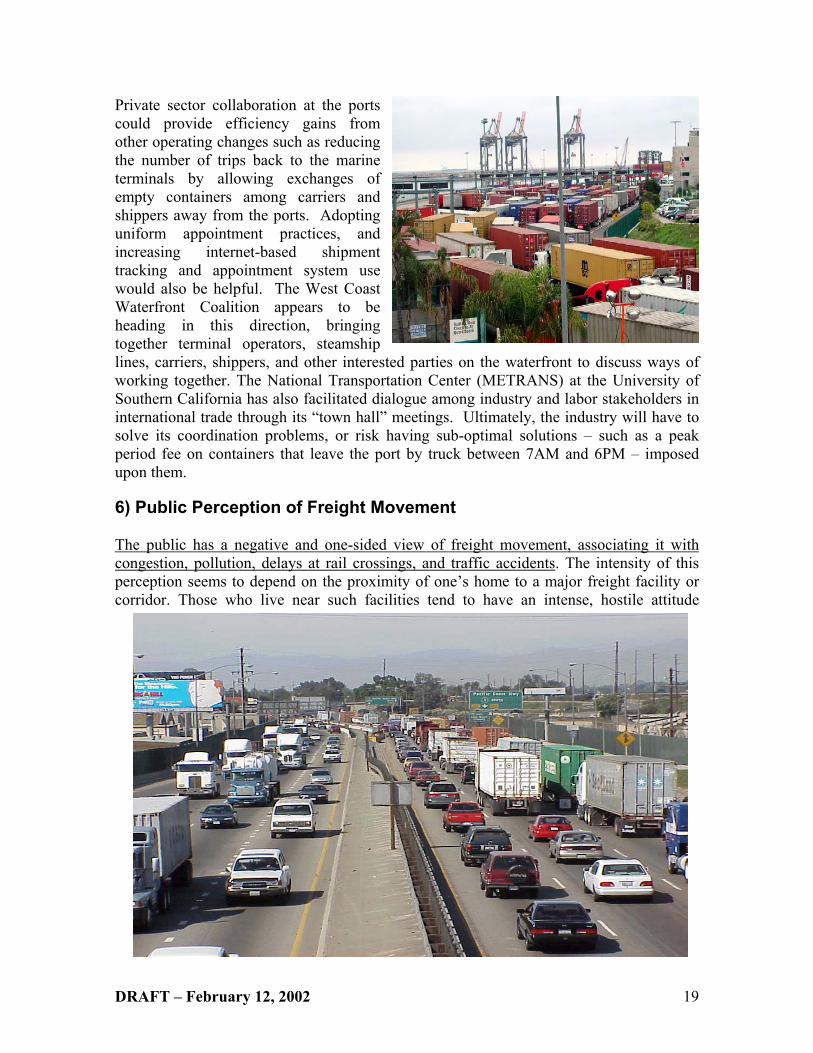
6) Public Perception of Freight Movement The public has a negative and one-sided view of freight movement, associating it with congestion, pollution, delays at rail crossings, and traffic accidents. The intensity of this perception seems to depend on the proximity of one’s home to a major freight facility or corridor. Those who live near such facilities tend to have an intense, hostile attitude
DRAFT – February 12, 2002 20
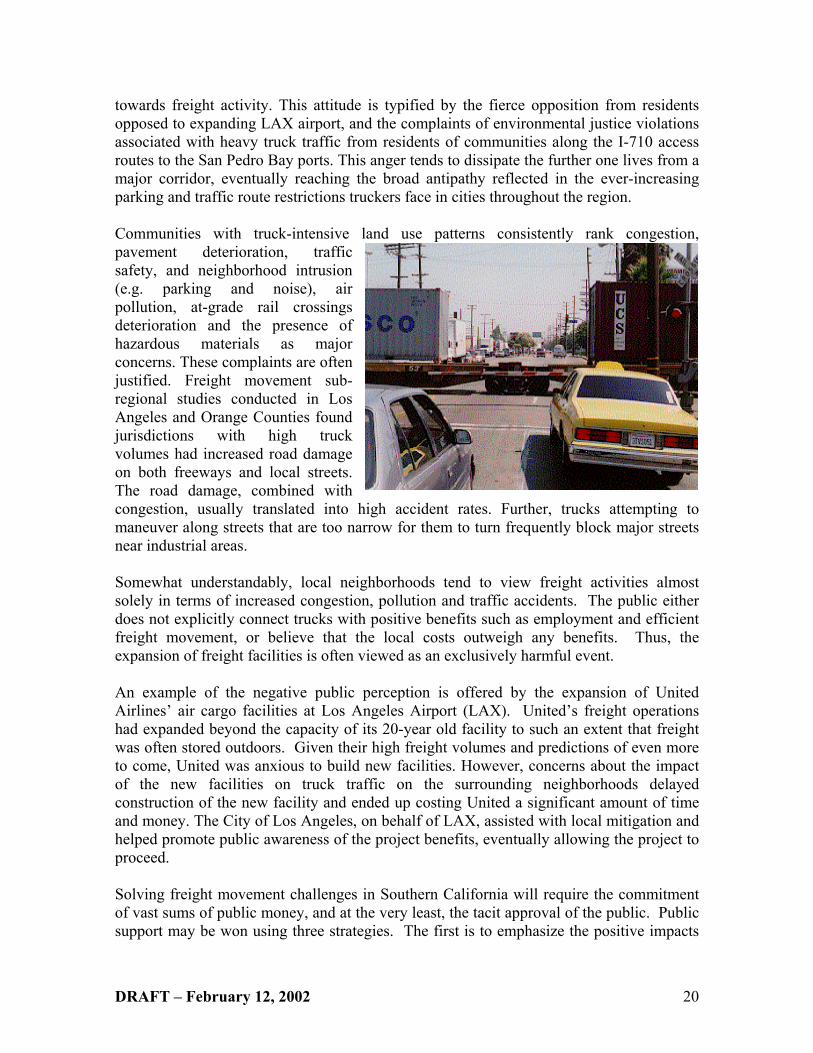
towards freight activity. This attitude is typified by the fierce opposition from residents opposed to expanding LAX airport, and the complaints of environmental justice violations associated with heavy truck traffic from residents of communities along the I-710 access routes to the San Pedro Bay ports. This anger tends to dissipate the further one lives from a major corridor, eventually reaching the broad antipathy reflected in the ever-increasing parking and traffic route restrictions truckers face in cities throughout the region. Communities with truck-intensive land use patterns consistently rank congestion, pavement deterioration, traffic safety, and neighborhood intrusion (e.g. parking and noise), air pollution, at-grade rail crossings deterioration and the presence of hazardous materials as major concerns. These complaints are often justified. Freight movement sub-regional studies conducted in Los Angeles and Orange Counties found jurisdictions with high truck volumes had increased road damage on both freeways and local streets. The road damage, combined with congestion, usually translated into high accident rates. Further, trucks attempting to maneuver along streets that are too narrow for them to turn frequently block major streets near industrial areas. Somewhat understandably, local neighborhoods tend to view freight activities almost solely in terms of increased congestion, pollution and traffic accidents. The public either does not explicitly connect trucks with positive benefits such as employment and efficient freight movement, or believe that the local costs outweigh any benefits. Thus, the expansion of freight facilities is often viewed as an exclusively harmful event. An example of the negative public perception is offered by the expansion of United Airlines’ air cargo facilities at Los Angeles Airport (LAX). United’s freight operations had expanded beyond the capacity of its 20-year old facility to such an extent that freight was often stored outdoors. Given their high freight volumes and predictions of even more to come, United was anxious to build new facilities. However, concerns about the impact of the new facilities on truck traffic on the surrounding neighborhoods delayed construction of the new facility and ended up costing United a significant amount of time and money. The City of Los Angeles, on behalf of LAX, assisted with local mitigation and helped promote public awareness of the project benefits, eventually allowing the project to proceed. Solving freight movement challenges in Southern California will require the commitment of vast sums of public money, and at the very least, the tacit approval of the public. Public support may be won using three strategies. The first is to emphasize the positive impacts

DRAFT – February 12, 2002 21
of freight, and the dependence of our way of life on fast, efficient freight movement. Half a million people are employed directly in the region handling freight, numerous others work in jobs that depend on the products being shipped, and the entire economy would suffer if the region’s freight flows slowed or stopped. The second, and perhaps more effective strategy, would be to downplay the role of freight and focus instead on explaining the environmental, safety, security and congestion relief benefits of ostensibly freight-oriented projects. The third strategy is to mitigate truck-related impacts. Most local jurisdictions share common concerns about truck-related traffic, and there are many ways to mitigate truck-related impacts. Increased enforcement of existing truck laws and/or changes in local truck parking regulations will help reduce the number of truckers operating overweight and unsafe vehicles. This step would lessen the amount of pavement deterioration and accidents caused by trucks. Operational improvements in local traffic management can also provide better truck movements and enhance safety. Possible steps include synchronizing signals to allow trucks adequate time to clear intersections; replacing on-street parking with off-site parking; and providing better signing for designated truck lanes/route. Finally, developing uniform truck design guidelines for roadway intersections, on/off ramps, and parking and loading areas should help preserve the roadway system and related infrastructure.
7) Limited Data Availability Limited data makes it difficult to properly design alternative strategies and evaluate freight projects. Increased freight flows have rendered traditional methods of transportation demand forecasting inadequate. Better modeling and forecasting of freight movement by truck and other modes must be developed to identify and to measure the impact of the freight transportation on the transportation infrastructure. Yet, a major barrier to developing better models is the lack of affordable, disaggregate freight and truck movement data. Obtaining adequate data on truck and freight movement by commodity, distance, mode and type of shipment, etc. is essential to forecasting future needs. Most existing flow data (e.g. Commodity Flow Data of U.S. DOT Bureau of Transportation Statistics), however, tends to be highly aggregated, and thus of limited use for metropolitan level analysis. Manual collection of data is very costly and therefore infrequent. Data collected by MPOs are often small in size to be statistically reliable and vary in formats. More detailed data

DRAFT – February 12, 2002 22
would allow states and MPOs to pinpoint congestion and capacity problems, and identify future freight infrastructure improvements. Collecting such data will require collaboration among different players in the freight industry, many of whom are hesitant to participate. The development of a regional truck model, for example, has been hampered by the unwillingness of carriers to participate in major origin and destination studies, citing their lack of time and concerns about the proprietary nature of origin-destination information. The truck model is also hindered by the limited availability of disaggregate commodity flow information, described above. 8) Intelligent Transportation Systems and Information Technology The adoption of Intelligent Transportation Systems (ITS) by transportation-related public agencies for use in freight transportation planning is similarly beset with unresolved data issues. Nonetheless, information technology (IT) is transforming the freight industry by enabling the integration of operations across the supply chain. In recent years, public agencies including the Ports of Los Angeles and Long Beach, California Department of Transportation and local jurisdictions have begun to use ITS to mitigate congestion and improve traffic operation. ITS provides real-time information on freight operations and congestion on the physical transportation network. Examples of current and proposed technologies include: Electronic Data Interchange (EDI) technologies, automated vehicle and container identification systems, weigh station clearance systems, railcar planning systems, customs clearance systems, location and navigational systems, railroad grade crossing management systems, terminal inventory management systems, mobile computers, database management and value-added data manipulation systems, and advanced traffic information and management systems. Enough of these tracking and communications systems are in operation today to be linked in a demonstration of information flow for end-to-end monitoring of the intermodal movement. Sharing information about congestion and operations across the intermodal freight system is critical for achieving increased capacity and reliability. The application of IT and ITS to freight management, especially between the public and private sectors, has been uneven and inconsistent to date. Today, much of the ITS information is owned by separate private entities, raising proprietary issues, and creating problems related to inconsistent and incompatible formats. In addition, private systems operators have not effectively linked to public data sources nor do they share data among themselves. The security of data from private systems is a critical concern as efforts to share these data are explored. Similarly, consistent standards that allow interoperability and harmonization will be required to prevent uneven adoption and implementation of IT and ITS across port, terminal, carrier, and metropolitan traffic management systems. Preventing such scenario may require the development of national and regional objectives for IT and ITS in freight management.
DRAFT – February 12, 2002 23
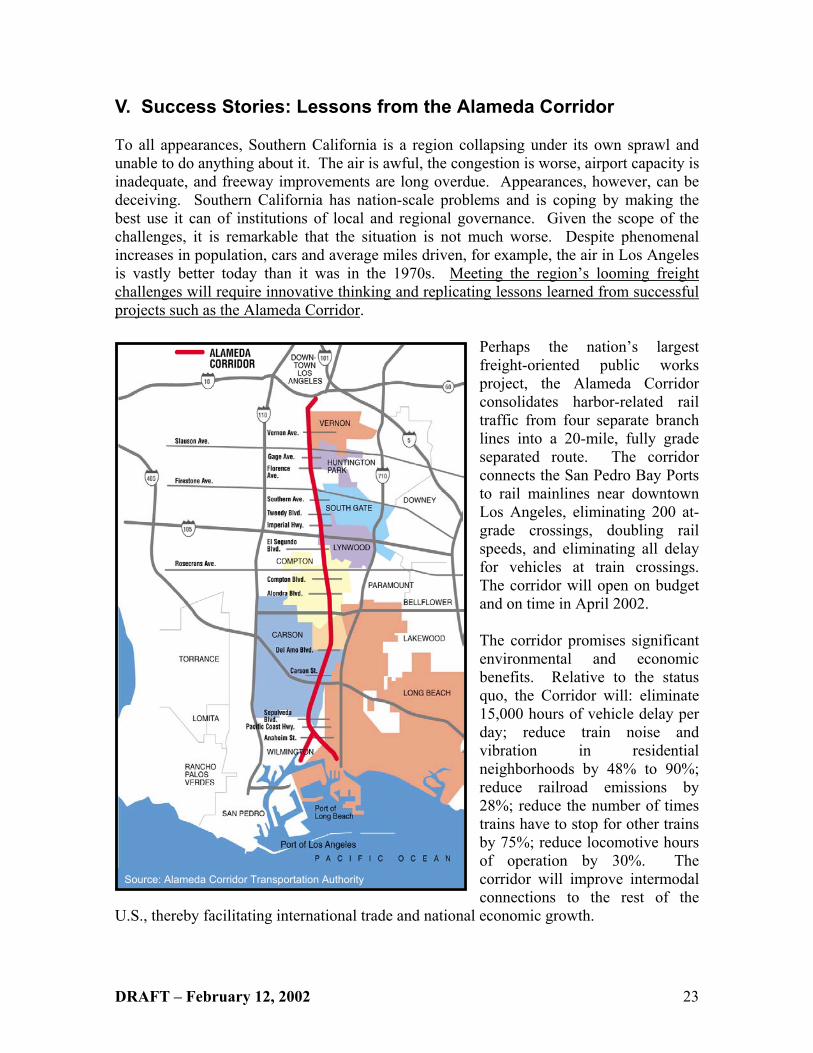
V. Success Stories: Lessons from the Alameda Corridor To all appearances, Southern California is a region collapsing under its own sprawl and unable to do anything about it. The air is awful, the congestion is worse, airport capacity is inadequate, and freeway improvements are long overdue. Appearances, however, can be deceiving. Southern California has nation-scale problems and is coping by making the best use it can of institutions of local and regional governance. Given the scope of the challenges, it is remarkable that the situation is not much worse. Despite phenomenal increases in population, cars and average miles driven, for example, the air in Los Angeles is vastly better today than it was in the 1970s. Meeting the region’s looming freight challenges will require innovative thinking and replicating lessons learned from successful projects such as the Alameda Corridor.
Perhaps the nation’s largest freight-oriented public works project, the Alameda Corridor consolidates harbor-related rail traffic from four separate branch lines into a 20-mile, fully grade separated route. The corridor connects the San Pedro Bay Ports to rail mainlines near downtown Los Angeles, eliminating 200 at-grade crossings, doubling rail speeds, and eliminating all delay for vehicles at train crossings. The corridor will open on budget and on time in April 2002. The corridor promises significant environmental and economic benefits. Relative to the status quo, the Corridor will: eliminate 15,000 hours of vehicle delay per day; reduce train noise and vibration in residential neighborhoods by 48% to 90%; reduce railroad emissions by 28%; reduce the number of times trains have to stop for other trains by 75%; reduce locomotive hours of operation by 30%. The corridor will improve intermodal connections to the rest of the
U.S., thereby facilitating international trade and national economic growth.
Source: Alameda Corridor Transportation Authority

DRAFT – February 12, 2002 24
1) Federal Role Demonstrating the national importance of the Alameda Corridor was the key to securing federal funding for this regional trade infrastructure project. Freight moving through Southern California has a direct and significant economic impact on all regions of the country in terms of trade and jobs. If the rest of the country is going to make a substantial investment in regional transportation projects, it is reasonable to expect that the projects be able to demonstrate national benefits. 2) Local Community Buy-in The Alameda Corridor project clearly illustrates the importance of community support. Since transportation infrastructure projects impose concentrated costs on their neighbors while providing diffuse benefits to everyone else, local opposition is a common phenomenon. Assuaging local concerns, therefore, was critical to ensuring the smooth construction of the corridor. ACTA managed this feat by agreeing to spend millions of dollars on local mitigation, and by creating an extensive jobs training program with guaranteed local hiring. These tangible local benefits made the costs of living next to the corridor more palatable.
The Alameda Corridor
Source: Alameda Corridor Transportation Authority

DRAFT – February 12, 2002 25
3) Project Structure: Joint Powers Authority Absent a lead agency with both jurisdiction and authority, a project’s chances for success are greatly diminished. The jurisdiction requirement may seem benign, but in Southern California’s complex governance and regulatory environment, jurisdictional issues cannot be taken for granted. Multiple, overlapping and even competing jurisdictions are common. For the Alameda Corridor, the Ports of Los Angeles and Long Beach (along with their respective cities), the railroads, and several smaller cities along the route resolved their jurisdictional conflicts by creating a joint powers authority. The Alameda Corridor Transportation Authority (ACTA) is a joint powers authority similar in principle to the Port Authority of New York/New Jersey. Properly structured, joint powers authorities have numerous advantages. Foremost among these are the ability to issue revenue bonds and their task-specific focus. Thus, ACTA has the virtue of concentrating in a single organization, the jurisdiction and authority to design, fund and build the corridor. ACTA negotiated a design/build construction contract for the mid-corridor trench to reduce construction risk and time, and ACTA’s product-oriented “lean and mean” management structure has kept the entire project on time and on budget. 4) Creative Financing: Public and Private Funding The need for transportation infrastructure improvements greatly exceeds the region’s ability to finance projects using traditional funding arrangements. The type of financing devised for the Alameda Corridor will become more common for transportation projects. The corridor was built using a combination of revenue bonds, federal loans, port financing and local contributions. Notable among the local contributions is $347 million from the Los Angeles County Metropolitan Transportation Authority (LACMTA). Better known for operating buses and rail transit, the LACMTA’s contribution demonstrated the agency’s early recognition that freight and people movement in Southern California are closely intertwined and virtually inseparable.
Alameda Corridor Funding Sources
Revenue Bonds 47.7%
Federal Loan
16.5%
Port Contributions
16.2%
LACMTA Grants
14.3%
Other
5.3%
Source: Alameda Corridor Transportation Authority
$1,160 Million
$130 Million $347 Million
$394 Million
$400 Million

DRAFT – February 12, 2002 26
VI. Freight Projects in Southern California Southern California is preparing for massive growth in freight traffic. The state is helping by raising the transportation budget by $2.2 billion to $9.6 billion, and allocating $1.2 billion for projects in San Bernardino and Riverside counties alone. The California STIP is also allowing the State and California DOT to become more involved with local projects in Southern California. The STIP is one of the primary sources of funds for projects such as the $1.2 billion SR-55 North Improvement in Orange County. California DOT has been partnering with counties to pay for sound walls, truck bypass lanes, grade separations, and freeway construction as well. The 2001 Regional Transportation Plan contains over $15 billion in highway and arterial improvement projects in addition to committed or programmed projects. Moreover, the Southern California Association of Governments has created a Goods Movement Advisory Committee (GMAC) and a Truck Lane Task Force. Currently, GMAC, the Truck Lane Task Force, California Department of Transportation, and freight movement stakeholders are reviewing design options for truck lanes and truck climbing lanes for four of the six counties in the region. Proposed grade crossing corridors for five of the six counties are also being reviewed at the regional level. Finally, $689 million is being spent on ITS throughout the region. The rest of this section provides a brief description of some of the major freight-related projects in planning, underway, nearing completion, or recently completed in Southern California. The projects have been grouped by transportation mode.
1) Highways The California Department of Transportation and the Los Angeles County Metropolitan Authority are undertaking the I-710 Corridor Study. The I-710 is the major truck route serving the Ports of Los Angeles and Long Beach. Even with more efficient use of existing infrastructure, the I-710 will require major improvements. The study is expected to be completed by 2003, and will recommend the best alternatives for improving the freeway’s chronic congestion. Likely improvements include separate truck lanes, improvement of parallel arterial streets, Intelligent Transportation Systems (ITS), and improved interchanges. The improvements are expected to cost in the neighborhood of $4 billion. SCAG conducted a Truck Lane Feasibility Study on the SR-60, one of the freeways most heavily traveled by trucks in the region. Linking downtown LA with the Inland Empire (Western portion of San Bernardino and Riverside Counties), it serves major industrial areas and warehouses, rail intermodal facilities, truck facilities, and the Ontario Airport. Segments of the SR-60 now carry over 20,000 trucks per day, and by 2020, will carry over 40,000 trucks per day. The study was completed in February 2001 and recommends construction of two dedicated, fully grade-separated truck lanes in each direction. Truck tolls would pay for 30% of the $4.3 billion construction cost. If constructed, the Truck Lanes will provide congestion relief along the SR-60 Corridor, improve safety by

DRAFT – February 12, 2002 27
eliminating car and truck conflicts, increase efficiency in the delivery of goods, and improve air quality. The City of Los Angeles, with funding from SCAG, began a Goods Movement Improvement Program in 1995. The Program identifies problems with truck movement and access to intermodal facilities, warehouses and distribution centers, industrial sites and freeways. The goal is to develop specific mitigation projects for each problem area, typically changes to city-controlled traffic operations, minor or major capital improvements, rerouting of truck traffic, and changes in city policy. Phase I of the program identified 43 problem locations in Central City East, a heavily-industrialized area east of downtown Los Angeles. Located at the north end of the Alameda Corridor, the area is crossed by both the BNSF and the UP rail lines. It is also adjacent to three rail inter-modal facilities (Los Angeles Intermodal Center, Hobart Yard and East Los Angeles Yard) and is home to numerous distribution centers and several major manufacturing centers. Trucks form a significant proportion of the area’s traffic, operating around the clock. The program led to the creation of a methodology for identifying and analyzing truck movement and access problems in urban industrial areas. Existing and new data, fieldwork, GIS mapping and a database integrator were utilized in this methodology. The work led to $1.8 million in discretionary funding from the 1999 Regional Transportation Improvement Program to implement recommended improvements for six of the most significant problem locations. Other mitigation programs have also been completed, including a developer-funded signal installation to improve access to the Los Angeles Intermodal Center and allowing on-street loading activity in the Jewelry District. City engineers are currently working on improving truck access to a key on-ramp to the eastbound I-10 Freeway. Phase II work in Northeast Los Angeles and the San Fernando Valley is nearing completion. Circulation problems were found at numerous grade crossings with the UP rail line, which traverses both of these areas. In Phase III, truck movement problems will be examined in Hollywood, the Westside and the area around LAX. The I-5 North Improvement Project, which extends 9.5 miles between the I-5/SR-22/SR-57 interchange and Beach Boulevard, is the latest I-5 improvement project in Orange County. The $1.1 billion project took four years and was completed in 2001. The aim was to improve the efficiency of the freeway system by increasing capacity and improving mobility on both the I-5 and the SR-91. Project highlights include new freeway lanes; direct transitions from high occupancy vehicle (HOV) lanes on one freeway to HOV lanes on the next at the I-5/SR91 Interchange; direct access ramps for the HOV lanes; and improvements to major street bridges over the freeway to accommodate the new lanes. The majority of the project funding (75%) came from Measure M, the half-cent sales tax approved by Orange County voters in 1990.
DRAFT – February 12, 2002 28
The SR-55 North Improvement Project, which begins at the SR-55/SR-22 interchange near the cities of Tustin and Santa Ana, and continues north to the SR-55/SR-91 interchange in Anaheim, adds one new freeway lane and widens the existing freeway lanes in each direction. The $1.2 billion project is scheduled for completion in 2002. Highlights include improvements to the SR-55/SR-22 interchange; reconstruction of improved freeway on-and-off ramps; and rebuilt bridges. State Transportation Improvement Funds (STIP) and Measure M were the primary funding sources for the SR-55 North project. The San Bernardino County area has experienced dramatic growth over the past 30 years, as it has evolved from a rural agricultural area to a suburban bedroom community with an extensive warehousing and manufacturing sector. The tremendous freight growth in the region helped persuade voters to approve Measure I, a half-cent voter-approved sales tax increase. Measure I has generated over $600 million dollars for transportation projects. To date the San Bernardino County has spent $540 million on regional highways, arterial roads and local streets, and an additional $70 million on commuter rail and bus transit. San Bernardino County has combined the Measure I money with traditional state and federal transportation funds, and plans numerous improvements integral to freight movement. SR-210 was extended 28.2 miles from Los Angeles to San Bernardino at a cost of $1.1 billion. Forty lane miles were added to SR-60 between the Los Angeles County Line and I-15 at a cost of $40 million and 20 lane miles were added to I 10 between the Los Angeles County Line and I-15 at Ontario International Airport at a cost of $110 million. SR-71 will be upgraded from a two-lane highway to an eight-lane freeway connecting Los Angeles and Riverside Counties at a cost of $200 million. Ontario International Airport ground access was improved by $157 million in work on 5 freeway interchanges, 4 arterial/rail grade separations, and over 20 miles of arterial improvements. Finally, $375 million in improvements are planned for I-215 to enhance
The New SR-55/SR-22 Interchange

DRAFT – February 12, 2002 29
access to the City of San Bernardino, the San Bernardino International Airport and the BNSF Intermodal Facility. Project IMAJINE, the Inter-Modal and Jurisdictional Integrated Network Environment, is the product of a partnership between the LACMTA, California DOT, the City of South Gate, and Access Services Inc. established to connect all four independent transportation agencies to a regional ITS architecture. Costing $4 million and financed by the FHWA, MTA, and Caltrans, this project was completed in November 2001. Project IMAJINE will allow all four agencies to utilize and derive data from the many (previously incompatible) traffic flow tools present within this region. Each IMAJINE partner has a workstation in which all the traffic flows in Los Angeles County can be monitored and all traffic incidents can be viewed through changeable message signs (CMS) and Closed Circuit Television (CCTV) cameras in real-time. ITS capabilities developed in Project IMAJINE will now be expanded to integrate MTA Bus and Rail operations, Metrolink, local police and fire departments, and airport operators. The Santa Monica Freeway (I-10) Smart Transportation Corridor is a joint effort of the LACMTA, California DOT, the CHP, LADOT, and the cities of Culver City, Beverly Hills, and Santa Monica to increase driver information and increase speeds up to 15% on certain arterials. The $48 million project uses video cameras, roadway sensors and other traffic management devices to coordinate the activities of ramp meters, traffic lights, and call boxes. In addition, the system uses radio transmissions, touch-tone phone centers, and on-highway message boards to inform motorists of problems and allow them to better plan their routing.
2) Rail Railroad grade crossings cause safety concerns and delay on the highway system. They also affect the operations of the railroad. Reducing number of grade crossings will minimize these problems and promote a better quality of life for neighborhoods adjacent the railroad lines. To face this challenge, the region has formulated an ambitious program in SCAG’s Regional Transportation Plan to improve/eliminate the region’s railroad grade crossing. The Alameda Corridor East (ACE) improvement plan proposes grade separation and improvements at 130 crossings along the 282-mile trade corridor. The Transportation Equity Act for the 21st Century (TEA-21) designated ACE a high priority corridor encompassing “a 52.8 mile corridor from east Los Angeles (terminus of Alameda Corridor) through the San Gabriel Valley terminating at Colton Junction in San Bernardino.” This definition, however, has since been expanded to include the tracks beyond the Colton Junction in San Bernardino County, as well as those in north Orange County and in Riverside County. The primary mobility issue for the ACE Trade Corridor’s rail lines is growing at-grade conflicts between trains, trucks and cars. The sheer number of corridor trains by 2020 -- more than one every ten minutes along the more heavily used portions of the rail network -

DRAFT – February 12, 2002 30
- will inevitably cause greater vehicle delays, vehicle emissions, grade crossing accidents and noise impacts if not mitigated by the ACE Trade Corridor’s grade-separation projects.
The program will likely cost more than $3 billion. With $561 million in funds committed, including money from the Governor Davis’s Transportation Congestion Relief Program, this leaves an unfunded need of $2.5 billion. The price includes: (a) $1.3 billion for 43 grade separations in Los Angeles County; (b) $476 million for eleven grade separations in Orange County; (c) $725 million for 47 grade separations in Riverside County; and (d) $560 million for 29 grade separations in San Bernardino County. The four-county ACE Trade Corridor Plan will enhance public safety in Southern California by virtually eliminating pedestrian and vehicle conflicts at 130 crossings. The project will eliminate 13,000 vehicle hours of delay that would have occurred annually by 2020 as train traffic increases. The improvements will also help avoid about 320 annual accidents, given the expected volume of rail and road traffic. ACE will also help eliminate 287 tons of pollutant emissions, thereby having a positive impact on the quality of life in the region and contributing to the attainment of federal air quality standards.
Source: Alameda Corridor East

DRAFT – February 12, 2002 31
The Orange County Gateway (OCG) Project will grade-separate the BNSF’s main line through northern Orange County. The $476 million project will eliminate traffic conflicts at eleven grade crossings in Placentia, Anaheim and Fullerton, and is administered by the Orange North-American Trade Rail Access Corridor (OnTrac) Authority, a joint powers authority formed in April of 2000. Phase I of the project includes closing the grade crossing at Bradford Street and building standard underpasses at Melrose Street and Placentia Avenue. Phase II involves lowering the rail corridor into a five-mile trench between Melrose Street and Imperial Highway. Commercial redevelopment, including a transit village near Bradford Street, has also been proposed. The OCG project is part of the larger Alameda Corridor-East project described earlier, and will reduce traffic congestion, noise, and air pollution, improve safety and enhance emergency services across the corridor. On a daily basis, more BNSF freight trains traverse the Orangethorpe Corridor than will use the Alameda Corridor. (This remarkable
Source: OnTrac
Source: OnTrac
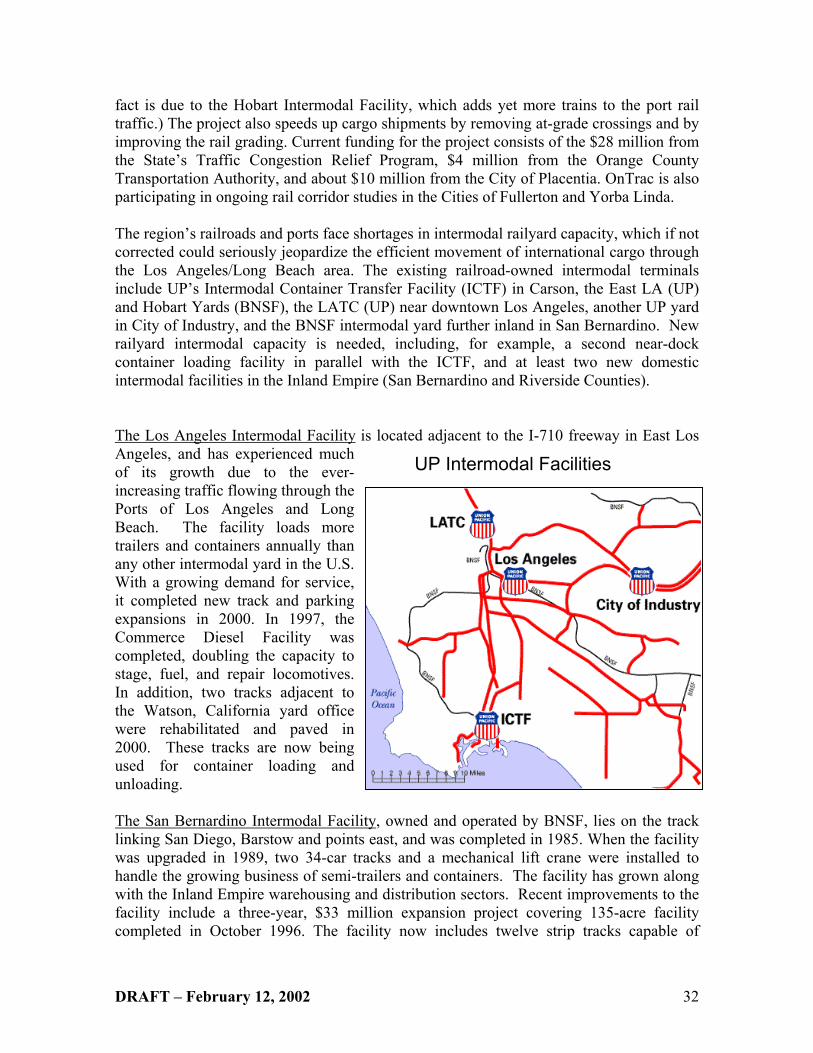
DRAFT – February 12, 2002 32
fact is due to the Hobart Intermodal Facility, which adds yet more trains to the port rail traffic.) The project also speeds up cargo shipments by removing at-grade crossings and by improving the rail grading. Current funding for the project consists of the $28 million from the State’s Traffic Congestion Relief Program, $4 million from the Orange County Transportation Authority, and about $10 million from the City of Placentia. OnTrac is also participating in ongoing rail corridor studies in the Cities of Fullerton and Yorba Linda. The region’s railroads and ports face shortages in intermodal railyard capacity, which if not corrected could seriously jeopardize the efficient movement of international cargo through the Los Angeles/Long Beach area. The existing railroad-owned intermodal terminals include UP’s Intermodal Container Transfer Facility (ICTF) in Carson, the East LA (UP) and Hobart Yards (BNSF), the LATC (UP) near downtown Los Angeles, another UP yard in City of Industry, and the BNSF intermodal yard further inland in San Bernardino. New railyard intermodal capacity is needed, including, for example, a second near-dock container loading facility in parallel with the ICTF, and at least two new domestic intermodal facilities in the Inland Empire (San Bernardino and Riverside Counties). The Los Angeles Intermodal Facility is located adjacent to the I-710 freeway in East Los Angeles, and has experienced much of its growth due to the ever-increasing traffic flowing through the Ports of Los Angeles and Long Beach. The facility loads more trailers and containers annually than any other intermodal yard in the U.S. With a growing demand for service, it completed new track and parking expansions in 2000. In 1997, the Commerce Diesel Facility was completed, doubling the capacity to stage, fuel, and repair locomotives. In addition, two tracks adjacent to the Watson, California yard office were rehabilitated and paved in 2000. These tracks are now being used for container loading and unloading. The San Bernardino Intermodal Facility, owned and operated by BNSF, lies on the track linking San Diego, Barstow and points east, and was completed in 1985. When the facility was upgraded in 1989, two 34-car tracks and a mechanical lift crane were installed to handle the growing business of semi-trailers and containers. The facility has grown along with the Inland Empire warehousing and distribution sectors. Recent improvements to the facility include a three-year, $33 million expansion project covering 135-acre facility completed in October 1996. The facility now includes twelve strip tracks capable of
UP Intermodal Facilities

DRAFT – February 12, 2002 33
working 248 car lengths of intermodal equipment, storage for 200 car lengths, four lots totaling 2005 painted parking spaces, two canopied checkpoints, twelve lanes, and forty closed-circuit remote controlled surveillance cameras. 3) Ports Major infrastructure improvements – including dredging and landfill projects, terminal expansions, development of on-dock rail facilities, grade separations, interchange construction, and bridge replacements – are underway at all three of the region’s deep-water ports (Los Angeles, Long Beach and Hueneme). In the late 1980’s, the Port of Los Angeles adopted the 2020 plan providing a blueprint for new marine facilities and infrastructure improvements to meet the projected cargo handling needs of the Port through the year 2020. As a phased program of dredging, land filling, facilities and transportation improvements, the plan provides the basis for the largest integrated marine-highway transportation hub in the world. Between 1994 and 1997, the Port invested $650 million in the initial implementation of this plan. Today the Port is in the middle of the next component of this plan, the Pier 400 container terminal and infrastructure improvements, at a cost of over $500 million. Similarly, the Port of Long Beach has also spent approximately $1 billion on terminal projects and $350 million on regional transportation system projects over the last ten years. Nevertheless, the transportation system in and adjacent to the ports is still constrained. In particular, the I-710 and Ocean Boulevard/Seaside Avenue (including the Gerald Desmond and Vincent Thomas Bridges) are currently operating at poor levels of service with severe congestion that will continue to worsen. This will include major landfill projects, recycling of older piers, and construction of new marine terminals and intermodal facilities. It is currently estimated that the Port of Long Beach alone will need to invest close to $3 billion
Source: Port of Long Beach

DRAFT – February 12, 2002 34
dollars over the next ten years on terminal development alone (this amount does not include off-terminal roadway and rail projects). The Port of Los Angeles has been increasing its capacity and efficiency. The Port in 1994 launched a $328 million, two-stage dredging and landfill project. This landfill is known as the Pier 400. The first stage of this massive undertaking was completed in just six years and stands as the largest dredging and landfill achievement in U.S. maritime history. The second stage, which will be completed by mid 2002, involves construction of the 484-acre Pier 400 container terminal–the largest proprietary container complex in the world. An on-dock railyard will serve as the vital link between shoreside ship/cargo operations at Pier 400 and the Alameda Corridor. The Pier 400 dredging project also deepened shipping channels for vessels calling at two other cargo terminals that opened in 1997: the 262-acre Global Gateway South container terminal for American President Lines—and the 120-acre Los Angeles Export Terminal for coal and petroleum coke. A third facility opened that year, the Terminal Island Container Transfer Facility (intermodal rail facility). Major components of these projects included the Badger Avenue Bridge Replacement ($49 million); grade separation of the Dock Street-Henry Ford Avenue Intersection ($48 million); grade separation of the Seaside Avenue-Navy Way intersection ($37 million); reconstruction of the Anaheim Street Viaduct ($20 million).
Port of Los Angeles Pier 400 Source: Los Angeles Port Authority

DRAFT – February 12, 2002 35
Other projects under design or construction include the Main Channel Deepening Program; the West Basin Development Program; and terminal improvements for berths 136-147. The port has also proposed transportation infrastructure projects such as Neptune Street Grade Separation, improvements to the I-110/Terminal Island Freeway/ SR-47/SR-103 Interchange, and additional work at the Seaside Avenue/Navy Way Freeway Interchange. In addition to completing the deepening of the West Basin and the extension of the Pier T Wharf in 2001, the Port of Long Beach has been busy designing and proposing infrastructure improvements to be completed in the next ten years. Projects set to begin construction in the next five years include:
• Terminal Island Freeway (SR47) Ocean Boulevard Interchange (May 2002)
• Gerald Alameda Corridor/Pier
B Street Terminus Railyard Expansion (July 2003)
• Port of LB/LA Advanced
Traveler Management, Information, and Seaport Security System project (July 2003)
• I-710 Southern Terminus
Bridge Rehabilitation project (January 2005)
• Gerald Despond Bridge
Replacement
These projects are expected to cost a total of $566 million.
Port of Long Beach
Source: Port of Long

DRAFT – February 12, 2002 36
Incomplete projects with a remaining portion yet to be approved include:
• Pier S: Site Remediation under construction, to be completed March 2002; terminal planning (not construction) underway (environmental documentation, master planning); terminal completion currently only proposed (not approved), for completion by 2005
• Piers G/J: Environmental documentation completed; Phase I improvements
under design, construction to be completed May 2004; construction of subsequent terminal expansion Phases II-IV currently only proposed, for completion by 2012
• Pier J: Environmental documentation for terminal expansion to be complete
early 2002; construction of after minimal expansion phases currently only proposed, for completion by 2009; and
• Pier A: Environmental documentation for terminal expansion to be completed in
2002; improvements to existing terminal to be completed in 2003; construction of terminal expansion phases currently only proposed, for completion by 2010.
The Marine Transportation System (MTS) initiative is a U.S. DOT-led effort to assist seaports in addressing the changing nature of maritime trade and the predicted growth in cargo volume over the next two decades. It is based on recommendations that came from the 1999 Report to Congress titled “An Assessment of the U.S. Marine Transportation System.” The Coast Guard is leading the initiative at the national, state, and local levels, and has been promoting participation and encouraging private sector leadership in issues such as security, mobility, and environmental protection.
The MTS Committee for the Port of Los Angeles and Long Beach is the Southern California MTS Advisory Council, which also covers the Port of Hueneme and the Port of San Diego. This group of approximately 60 organizations from the freight industry and government are working towards preparing policy, projects, and funding recommendations for US DOT to include in the upcoming TEA-21 reauthorization process. The MTS Committee has met several times since its inception in Summer 2001 has established four sub-committees, Safety & Security, Infrastructure, Environmental, and Competitiveness. The Oxnard Harbor District, which operates the Port of Hueneme, has completed an aggressive port expansion program. The Port of Hueneme ranks among the top seaports in California for general cargo throughput, serving niche markets including the import and export of automobiles, heavy agricultural equipment and industrial vehicles, fresh fruit, fresh produce, forest products, and project cargo.

DRAFT – February 12, 2002 37
Port of Hueneme FAST Expansion
Source: Port of Hueneme
The Southern Terminal - FAST Expansion Project, completed in 1999, greatly enhanced the Port of Hueneme’s ability to handle refrigerated containers and roll-on/roll-off cargoes. A new rail yard, which is still under construction, will eventually create
a seamless flow of cargo in the terminal areas between ship, truck or rail. When completed this $6 million project will
increase the total acreage of the port by 33 acres. The second component of the Port of Hueneme Expansion Plan is the development of the former Sunkist Fruit Facility as a multimodal facility. Covering 14 acres, and budgeted at $4 million, this project should enhance the port’s ability to handle railcars and will improve truck access. Ports of Los Angeles and Long Beach are working to improve truck access and security, mitigate congestion on area streets and freeways, including I-710, through a joint ITS Project. The ports will apply ITS technology to provide real-time traffic information to better assist travel and manage incidents. The Ports Automatic Traffic Management & Information System will include terminal gate queue detection cameras at all container terminals, closed circuit television surveillance at container terminal gates and key roadway locations, and Congestion Management System at gate exits. The system also provides links to the state DOT Traveler Information System, eModal, and the Long Beach Traffic Management Center (TMC), Los Angeles TMC, and the California DOT TMC.
Ports of Los Angeles and Long Beach

DRAFT – February 12, 2002 38
4) Airports LAX and Ontario Airport (ONT) together handle almost all of the region’s air cargo. Both airports are trying to expand their air cargo capacity. There is an effort to develop an ITS system for trucks serving LAX, and road access improvements were recently completed for ONT. Rapid growth in demand for air cargo services will not be satisfied by existing facilities, particularly with constraints on LAX expansion. By 2025, demand for air freight services in the region is expected to more than triple from 2 million to 9.5 million tons. Unfortunately, even with the development proposed in the LAX Master Plan, LAX will not be able to handle more than 4 million tons of cargo. Failure to accommodate this growth will cause the region to forego major economic opportunities, divert air cargo to other cities (Las Vegas, Phoenix, etc.), which will then be trucked in, and cause some cargo previously transported by air to be transported by expedited transcontinental truck movements. This would result in increased congestion on the freeway system and increased truck-related emissions. Challenges for accommodating air cargo demand include:
• Limited cargo capacity of existing airports in the inland area (ONT); long-distances between airports and populations centers and/or limited service at Palmdale and newly developed airports at former military bases such as Norton, March, and George; and local opposition to the conversion of El Toro to a commercial airport.
• Insufficient arterial/highway access to airports, which generates or potentially
generates high volumes of air cargo.
• Lack of Investment in intersection, signalization and Intelligent Transportation System (ITS) improvements.
• Poorly designed ramps, access lanes to cargo terminals, parking and turning
areas, etc.
• Inefficient use of existing cargo terminal space, which includes joint use facilities that are operated by a third party rather than individual cargo terminals controlled by a single carrier and operating older cargo facilities that do not accommodate modern cargo handling operations.

DRAFT – February 12, 2002 39
Los Angeles International Airport (LAX) Proposed and on-going freight improvement projects in progress include:
• The Cargo City Redevelopment Project will demolish and reconstruct cargo terminals in the oldest cargo area at LAX. The first cargo building is complete (145,000 sq. ft.) and a second new building is planned (150,000 sq. ft.) to replace existing buildings.
• United Airlines is completing a new
180,000 sq. ft. cargo terminal at LAX. • An ITS program, which includes an Automated Traffic Control System (ATCS)
and centralized control of changeable message signs. The signs can alert truck drivers to incidents and delays and suggest alternative routes. The ACTS can adjust the traffic signal timing based on roadway volumes to minimize delays.
• The development of new cargo terminal space and aircraft parking positions. • Relocation, modernization, and redevelopment of existing facilities to improve
efficiency. The United Air Cargo project was initiated because of space limitations at the existing facility, and forecasts suggest the demand for air freight will continue to increase rapidly. The $2-3 million construction project was financed by United on land leased from LAX, even though air cargo facilities have traditionally been owned by airports. Generally, airports pay for improvements using airport funds and then lease the space to one or even multiple tenants. In this case, United decided airfreight growth trends justify ownership of the new facility. The project is a win for both the public and private sectors. LAX avoided having to spend money on new facilities and will receive higher lease payments from United. United, on the other hand, will make more money because the new facility will make its operation more efficient, and will allow it to handle a greater volume of cargo. Ontario International Airport (ONT) Air Cargo-Related Improvements The ONT Ground Access Program (GAP) consisting of 27 phases, or separate projects totaling over $157 million in surface transportation improvements. Ground access is critical for the second largest air cargo facility in Southern California, which has grown 134% since 1987, and is surrounded by more than 60 million square feet of warehousing and distribution facilities.
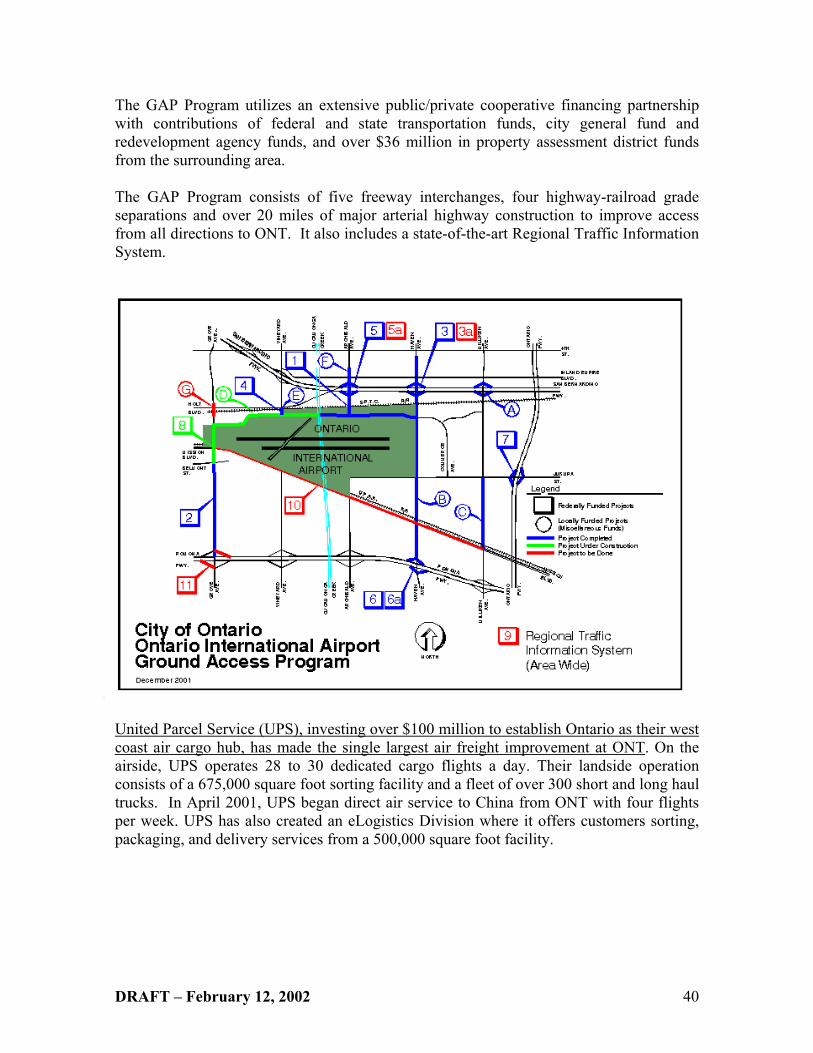
DRAFT – February 12, 2002 40
The GAP Program utilizes an extensive public/private cooperative financing partnership with contributions of federal and state transportation funds, city general fund and redevelopment agency funds, and over $36 million in property assessment district funds from the surrounding area. The GAP Program consists of five freeway interchanges, four highway-railroad grade separations and over 20 miles of major arterial highway construction to improve access from all directions to ONT. It also includes a state-of-the-art Regional Traffic Information System.
United Parcel Service (UPS), investing over $100 million to establish Ontario as their west coast air cargo hub, has made the single largest air freight improvement at ONT. On the airside, UPS operates 28 to 30 dedicated cargo flights a day. Their landside operation consists of a 675,000 square foot sorting facility and a fleet of over 300 short and long haul trucks. In April 2001, UPS began direct air service to China from ONT with four flights per week. UPS has also created an eLogistics Division where it offers customers sorting, packaging, and delivery services from a 500,000 square foot facility.

DRAFT – February 12, 2002 41
5) Education and Training Education and training are not actually a mode of freight transportation, yet have earned a separate section in the "current projects" section because of their far-reaching potential for improvements across the freight industry. In 1998, the U.S. Department of Transportation (DOT) decided to fund the National Center for Metropolitan Research (METRANS), which is one of seventeen designated University Transportation Centers. METRANS is devoted to solving the transportation problems confronting major metropolitan areas using an integrated approach that blends the multiple disciplines. Participants of METRANS include the University of Southern California and the California State University, Long
Beach (CSULB). Local and regional transportation agencies, as well as private transportation companies also have funded the center. The main responsibilities of METRANS are research, technology transfer, and education. METRANS focuses on four transportation issues:
• Congestion on highway, rail, shipping and air transport systems; • Mobility and accessibility of immigrant, disadvantaged and minority
populations; • Economic development of the infrastructure and processes to support
international trade and transportation industries; and • Reducing adverse impacts of transportation including pollution, noise,
pedestrian/motorist accidents and crime.

DRAFT – February 12, 2002 42
The Center for International Trade and Transportation (CITT) was formed as a partnership between USC and CSULB to address the community services needs of the international trade and intermodal transportation industry of Southern California. The primary functions of the CITT are to:
• Be the primary technology transfer arm of METRANS; • Provide a neutral forum where all parties in the logistics industry and its
community stakeholders can come together; and • Be a catalyst for training, growth and competitiveness.
Current CITT activities include:
• Degrees programs such as the Global Logistics Specialist Program, Master of Arts in Global Logistics and HazMat Certification Training; and
• Hosting conferences and meetings such as the Annual Town Hall Meetings and the Southern California Goods Movement Summit.
6) Information Technology Serving the Port Community - eModal Increasing congestion and long queues at the marine terminals, along with growing fragmentation in the industry, raised a need to improve communication and coordination between the terminals and trucking companies. eModal, launched in February 2000, has designed and developed its single-source web site for a Port Community System that provides container availability information to cargo owners, carriers and terminal operators. eModal was first deployed at the Port of Long Beach, then to the Ports of Los Angeles and Oakland. All three port agencies provided funds to assist in the development of eModal. Today, eModal serves more than 2,500 registered companies including shippers, consignees, marine terminals, customs brokers, steamship lines and truckers at 45 participating marine terminals in 12 port complexes across the U.S. The heart of the eModal site is the ‘Activity Folder’, which consolidates the participating marine terminals’ information into the single-source page for easy review. eModal users list their containers, check availability and other status in their Activity Folders and dispatch

DRAFT – February 12, 2002 43
drivers using the information. eModal has also developed ‘Scheduler,’ an appointment system for the Port Community, which can solve the problems of long lines at the terminals, idling trucks, frustrated drivers, and increased pollution. eModal b enefits include:
• Reduced congestion at the marine terminals; • Integration of data Integration; • Heightened level of security through Trucker Check system, a verification
system for truck drivers and trucking companies; and • Better dialogue among the industry participants including the Ports, marine
terminals, trucking companies, customs brokers, freight forwarders, railroads, etc.
VII. Recommendations The following are planning, funding and coalition-building recommendations for stakeholders in the region to consider as a means of addressing the challenges that remain in the area of freight movement.
1) Planning
• Regional Transportation Agencies and Metropolitan Planning Organizations should adopt guidelines consistent with the statewide efforts outlined in the forthcoming Global Gateways Development Program report.
• Freight transportation elements should be specifically defined and included in
long range transportation plans.
• Freight projects should be assigned a higher priority than they have been granted in the past.
• Project eligibility rules in MPO’s planning should be expanded so that more
freight projects will be eligible.
2) Funding
• Dedicated funding programs should be established for freight research projects, freight operations and management planning, and for freight-related education and training programs.
• Cost sharing between the public and private sectors should be increased.
• Seek additional state and federal funding for:
DRAFT – February 12, 2002 44
− Collecting compiling, and managing freight movement data relevant to
future freight intermodal development; − Planning and developing a local level freight movement model for
analyzing freight flows, their environmental impact and the required capital investments;
− Assessing the impact of freight traffic (particularly trucks) on neighborhoods and on traffic congestion on freeways and arterials throughout the region;
− Implementing regionally significant capital projects that contribute to mobility and air quality improvements; and
− Fostering IT and ITS projects that facilitate information dissemination along the freight industry supply chain.
3) Coalition Building
• Establish multi-jurisdictional freight advisory committees or working groups that include private sector representatives.
• Where appropriate, use joint powers authorities and joint powers agreements to
address jurisdictional conflicts.
• Build regional consensus in support of freight-related improvement.
Contact Information Form more information on the Southern California Freight Management Case Study contact: Robert Cálix Project Manager Systems Analysis and Research Section Countywide Planning and Development Division Los Angeles County Metropolitan Transportation Authority Mail Stop: 99-23-7 Los Angeles, CA 90012-2952 Telephone: 213-922-5644 E-mail: [email protected]

Appendix A Reference List of Goods Movement Studies in Southern California (1980s – 2001)
Page A-1
Prepared By Study Agency Year Completed
1 Meyer Mohaddes East Valley Traffic and Truck Forecasts Study SANBAG In progress
2 VRPA Technologies Truck Count Study SCAG 2002
3 LAEDC LA-Inland Empire Mainline Planning Study SCAG 2002
4 Tioga Group Empty Ocean Container Logistics Study SCAG 2001
5 Wilbur Smith and Assoc. South Bay Cities Railroad Study Southbay Dec 2001
6 Eugene Tseng and Associates Freight Bottlenecks - Alameda Corridor LA City 2001
7 Cal State Long Beach Goods Movement Strategy and Performance Measurement SCAG Dec 2001
8 Korve Engineering, LAEDC Alameda Corridor-East Trade Corridor Plan OCTA, ACE, RCTC,
OnTrac, SANBAG June 2001
9 Camp Dresser & McKey Brownfields Project (aka Freight Bottlenecks) LA City June 2001
10 Meyer Mohaddes Port of Long Beach/Los Angeles Transportation Study Port of LB/Port of LA June 2001
11 Parsons Brinckerhoff Western Riverside Comprehensive Transportation Plan Goods Movement Analysis WRCOG 2001
12 USC (P. Gordon and Q. Pan)
Assembling and Processing Freight Shipment Data: Developing a GIS-Based Origin-Destination Matrix for Southern California
METRANS June 2001
13 Korve Engineering Grade Crossing Study for Gateway Cities Council of Governments Gateway 2000
14 Kaku Associates Long-Range Transportation Plan Off-Model Analysis Methodology Goods Movement Category LAMTA Oct. 2000
15 USC (P. Loannou and A. Chassiakos)
Modeling and Route Guidance of Trucks in Metropolitan Areas METRANS Aug 2000

Appendix A
Page A-2
Prepared By Study Agency Year Completed
13 Korve Engineering Grade Crossing Study for Gateway Cities Council of Governments Gateway 2000
14 Kaku Associates Long-Range Transportation Plan Off-Model Analysis Methodology Goods Movement Category LAMTA Oct. 2000
15 USC (P. Loannou and A. Chassiakos)
Modeling and Route Guidance of Trucks in Metropolitan Areas METRANS Aug 2000
16 Katz, Okitsu & Associates Calexico/Mexicali Border Transportation Study Caltrans, SCAG Aug 2001
17 Wilbur Smith and Assoc. Port Hueneme Access Study VCTC 2000
18 Meyer Mohaddes Truck Movement/Freight Operations Study Report SBCCG June 2000
19 Parsons Brinckerhoff Inland Goods Movement Corridor Study (superseeded by the ACE Corridor Report) SANBAG Apr 2000
20 Robert Kahn, John Kain & Associates Arterial Plan Freight Bottlenecks Study/Cross Border Impacts IVAG 2000
21 SCAG Alameda Corridor/Brownfields Project Proposal SCAG
22 Kaku Associates SR-60 Truck Lane Feasibility Study SCAG 2000
23 Kaku Associates Truck Lane Feasibilty Study, Task 5: Concept Designs and Costs SCAG 2000
24 Kaku Associates Truck Lane Feasibility Study; Task 4: Existing Conditions SCAG 1999
25 Kaku Associates Truck Lane Feasibility Study; Task 3: Data Collection SCAG 1999
26 Kaku Associates Truck Lane Feasibility Study; Task 2: Literature Review SCAG 1999
27 Korve Engineering Gateway Cities Truck Impacted Intersection Study And Rail Grade Crossing Study Gateway 1999
28 Bruce Nestande Regional Railroad Emissions Reduction Program SCAG

Appendix A
Page A-3
Prepared By Study Agency Year Completed
29 ICF Incorporated Agile Port/Fast Ship Study (No study released) SCAG
30 SANBAG San Bernardino Inland Goods Movement Corridor Study SANBAG 1999
31 LADOT Improving Truck Movement in Urban Industrial Districts (Goods Movement Improvement Program Phase 1) LA City 1999
32 Meyer Mohaddes San Gabriel Valley Truck Study: Traffic Data and Issues Identification Report SGVCG August 1999
33 SCAG Potential Terminal Island Freeway-San Diego Freeway Connector SCAG 1999
34 Meyer Mohaddes Heavy Duty Truck Model and VMT Estimation SCAG 1999
35 Meyer Mohaddes SELAC Subregional Planning Trucking Environmental Assessment VCTC Comprehensive Rail Planning Work Program
ACTA 1995
36 Traffic Data Systems Branch
1997 Annual Average Daily Truck Traffic on the California State Highway System Caltrans 1998
37 Meyer Mohaddes Orange County Goods Movement Study OCTA 1998
38 Cambridge Systematics SCAG 1998 Regional Transportation Plan’s Freight Element Financing Study SCAG May 1998
39 Korve Engineering Grade Crossing Study-Final Report San Gabriel Valley
Council of Governments
1997
40 Wilbur Smith and Assoc. Railroad Consolidation Study SCAG 1996
41 Meyer Mohaddes Gateway Cities Trucking Study Gateway 1996
42 Loretta Sanchez Brixey Regional Railroad Emissions Reduction Program
43 IBI Group Orangethorpe Rail/Highway Study (Orange County subregion) ON TRAC

Appendix A
Page A-4
Prepared By Study Agency Year Completed
44 Jack Faucet Associates The Southwest Passage Study SCAG 1996
45 Jack Faucet Associates Freight Performance Indicators SCAG 1996
46 OCTA, SCAG Fullerton, Anaheim, Yorba Linda, Placentia & Atchinson Topeka Santa Fe RR Agreement 1999
47 SCAG Freight Facilities Program for a Reauthorized ISTEA SCAG 1996
48 SCAG Freight Movement Strategy SCAG Draft, 1996.
49 Mercer March Interregional Goods Movement Study, Final Task 6 Report: Scenario Selection SCAG 1996
50 Barton-Aschman Associates California Trade and Goods Movement Study Caltrans 1996
51 DRI/McGraw-Hill SELAC Subregional Planning-Alameda Corridor Study
52 DRI/McGraw Hill Interregional Goods Movement Study SCAG 1995
53 SCAG Route 710 Truckway Feasibility Study Report SCAG 1993
54 Lockheed IMS Truck Operation Survey Results South Coast Air
Quality Management District
1993
55 Arthur Bauer & Associates Goods Movement Study SCAG 1990
56 Urban Innovations Group Railroad Right of Way Study SCAG
57 Wilbur Smith & Associates LAX Goods Movement Study SCAG 1990
58 SCAG International Trade and Goods Movement: The Southern California Experience and Its Future SCAG 1989

Appendix A
Page A-5
Prepared By Study Agency Year Completed
59 SCAG Truck Movement Study SCAG 1988
60 The Port of Long Beach The Port of Long Beach and Its Impact on the Southern California Economy (POLB study, not SCAG funded) POLB 1988
61 SCAG Improving Access to the Port of Hueneme SCAG 1988
62 SCAG Port of Hueneme Access Study SCAG 1988
63 SCAG The Importance of Goods Movement and Regional Transportation to the Southern California Economy and International Trade
SCAG 1983
64 SCAG San Pedro Bay Ports Access Study Vol. 2 - Railroad Access SCAG 1984
65 Applied Economics System Goods Movement Forecast and Implications for the Region SCAG 82-83
66 SCAG San Pedro Bay Ports Access Study Vol. 1 - Highway Access SCAG 1982
67 SCAG Route 5 Truck AADT from Mexican border through LA County SCAG
68 Cordoba Corp. The NAFTA Transportation Impacts in SCAG Region Study SCAG