southern border recession predictability in the united
TRANSCRIPT
University of Texas at El PasoDigitalCommons@UTEP
Border Region Modeling Project Department of Economics and Finance
2-2017
Southern Border Recession Predictability in theUnited States: 1990-2015Thomas M. Fullerton Jr.University of Texas at El Paso, [email protected]
Elías D. Saenz-Rojo
Adam G. WalkeUniversity of Texas at El Paso, [email protected]
Follow this and additional works at: https://digitalcommons.utep.edu/border_region
Part of the Regional Economics CommonsComments:Technical Report TX17-1A revised version of this study is forthcoming in Applied Economics.
This Article is brought to you for free and open access by the Department of Economics and Finance at DigitalCommons@UTEP. It has been acceptedfor inclusion in Border Region Modeling Project by an authorized administrator of DigitalCommons@UTEP. For more information, please [email protected].
Recommended CitationFullerton, Thomas M. Jr.; Saenz-Rojo, Elías D.; and Walke, Adam G., "Southern Border Recession Predictability in the United States:1990-2015" (2017). Border Region Modeling Project. 35.https://digitalcommons.utep.edu/border_region/35
T H E U N I V E R S I T Y O F T E X A S AT E L P A S O
U T E P B O R D E R R E G I O N M O D E L I N G P R O J E C T
Technical Report TX17-1
SOUTHERN BORDER RECESSION PREDICTABILITY IN THE UNITED STATES: 1990-2015*
Produced by University Communications, February 2017
Cover art courtesy of Clear Channel Communications


1
T H E U N I V E R S I T Y O F T E X A S AT E L P A S O
U T E P B O R D E R R E G I O N M O D E L I N G P R O J E C T
Technical Report TX17-1
SOUTHERN BORDER RECESSION PREDICTABILITY IN THE UNITED STATES: 1990-2015*

UTEP TECHNICAL REPORT TX17-1 | FEBRUARY 2017
This technical report is a publication of the Border Region Modeling Project and the Department of Economics & Finance at the University of Texas at El Paso. For additional Border Region information, please visit the www.academics.utep.edu/border section of the UTEP web site.
Please send comments to Border Region Modeling Project - CBA 236, Department of Economics & Finance, 500 West University, El Paso, TX 79968-0543.
UTEP does not discriminate on the basis of race, color, national origin, sex, religion, age, or disability in employment or the provision of services.
University of Texas at El Paso Diana Natalicio, President Howard Daudistel, Interim Provost Roberto Osegueda, Vice Provost
UTEP College of Business Administration Border Economics & Trade Bob Nachtmann, Dean Steve Johnson, Associate Dean Erik Devos, Associate Dean Tim Roth, Templeton Professor of Banking & Economics

3
UTEP Border Region Econometric Modeling Project
Corporate and Institutional Sponsors:
Hunt Communities El Paso Water Utilities UTEP College of Business Administration UTEP Department of Economics & Finance City of El Paso Office of Management & Budget UTEP Hunt Institute for Global Competitiveness UTEP Center for the Study of Western Hemispheric Trade
Special thanks are given to the corporate and institutional sponsors of the UTEP Border Region Econometric Modeling Project. In particular, El Paso Water Utilities, Hunt Communities, and The University of Texas at El Paso have invested substantial time, effort, and financial resources in making this research project possible.
Continued maintenance and expansion of the UTEP business modeling system requires ongoing financial support. For information on potential means for supporting this research effort, please contact Border Region Modeling Project - CBA 236, Department of Economics & Finance, 500 West University, El Paso, TX 79968-0543.
UTEP TECHNICAL REPORT TX17-1 | FEBRUARY 2017
SOUTHERN BORDER RECESSION PREDICTABILITY IN THE UNITED STATES: 1990-2015*
Thomas M. Fullerton, Jr., Elías D. Saenz-Rojo, and Adam G. Walke Department of Economics & Finance, University of Texas at El Paso, El Paso, TX 79968-0543, Telephone 915-747-7747, Facsimile 915-747-6282, Email [email protected]; [email protected]
* A revised version of this study is forthcoming in Applied Economics.
ABSTRACT Prior research establishes that the spread between long- and short-term bond yields often provides valuable information for predicting business cycle downturns. This study examines the predictive capacity of the yield spread for United States metropolitan economies situated along the border with Mexico. Because of the location of these urban economies and various economic ties linking them with twin cities across the border, the Mexico yield spread, and the real dollar/peso exchange rate are also employed as potential recession predictors. Results suggest that a flattening of the yield curve for either country tends to increase the probability of recessions in border economies. Furthermore, declines in the real value of the peso, which are typically associated with greater cross-border manufacturing activity, are found to reduce recession likelihoods in the metropolitan economies examined on the north side of the international boundary.
JEL Categories: E32, Business Cycles; E43, Interest Rates; R15, Regional Econometric Models
Keywords: Recession Prediction; Yield Curves; Real Exchange Rates
Acknowledgements: Financial support for this research was provided by El Paso Water Utilities, City of El Paso Office of Management & Budget, the UTEP Center for the Study of Western Hemispheric Trade, and the Hunt Institute for Global Competitiveness at UTEP. Helpful comments and suggestions were provided by Dennis Bixler-Márquez and two anonymous referees. Econometric research assistance was provided by Ernesto Duarte and Omar Solis.

5
INTRODUCTION Economic recession prediction has received substantial attention in recent years. The topic is clearly relevant to decision making in both the public and private sectors. Unemployment, business bankruptcies, and personal bankruptcies all increase during business cycles downturns. However, it is difficult to identify reliable precursors of business cycle downturns. One widely touted candidate is the difference between the yields of long-run treasury bonds and short run treasury bills, commonly known as the yield spread (Estrella and Mishkin 1996; Dueker 1997; Kauppi and Saikkonen 2008; Nyberg 2010).
Estrella and Mishkin (1998) compare the effectiveness of different economic variables that can potentially help predict recessions. These variables are interest rates, interest rate spreads, stock price indexes, and monetary aggregates. The yield spread is found to be the indicator with the most predictive power. A major advantage of the yield spread is that it predicts recessions relatively well at longer lead times (more than 6 months). In contrast, the other indicators often prove to be more reliable in the short-run (6 months or less). For regional economies, the slope of the yield curve has also been found to help forecast downturns (Gauger and Schunk, 2002; Shoesmith, 2003).
This paper examines the ability of the yield spread (difference between the 10-year Treasury bond rate and the 3-month Treasury bill rate) to predict recessions for the eight largest metropolitan economies along the United States southern border with Mexico. Varying degrees of economic interdependence exist between the border urban economies and the adjacent sister municipalities across the international boundary in Mexico. Given that, international variables are also included in the sample. Those variables include a dollar/peso real exchange rate and the yield curve for Mexico (the difference between the 1-year and the 3-month Treasury bill rates). The following section provides a literature review. The data and methodology are then discussed, followed by a presentation of the empirical results, and a concluding summary.

UTEP TECHNICAL REPORT TX17-1 | FEBRUARY 2017
LITERATURE REVIEW Mishkin (1990) asks at which term (whether short-run or long-run) yield curves are more accurate in predicting recessions. By using interest rates from treasury bonds with maturities of up to five years, multiple yield spreads are calculated. When using interest rates for instruments with maturities of less than six months, the term structure of interest rates contains almost no information about the path of future inflation. However, the predictive power of the term structure appears to increase as the length of the maturities increases. For interest rates of instruments with maturities greater than 9 months, the term structure is more reliable at predicting recessions.
An even longer yield spread, the difference between the ten-year Treasury bond and the three-month Treasury bill interest rates, is used in Estrella and Mishkin (1996). That spread is used to analyse three common recession indicators. For lead times of more than 6 months, that yield spread proves to be the most effective predictor of recessions. Estrella and Mishkin (1998) analyse additional variables as potential recession predictors. The list includes interest rates, other interest rate spreads, stock price indexes, and monetary aggregates. The results indicate that the yield spread has the most predictive power, but only for lead times of one quarter or more in advance of downturns.
Most early models use binary recession indicators as dependent variables, but not as right-hand side regressors. Such indicators take a value of 1 if there is a recession and 0 if not. A drawback of static binary response models is a lack of a dynamic structures that take into account dependent variable autocorrelation. By including a lag of the binary recession indicator, the predictive power of the yield curve often increases and out of sample simulations become more reliable (Dueker, 1997; Kauppi and Saikkonen, 2008).
In many developing economies, including Mexico, this kind of research has not yet been extensively employed. Financial data constraints often prove binding. Longer maturity financial instruments do not exist in many developing economies, which prevents the calculation of longer term yield spreads. Gonzalez, Spencer, and Walz (2000) study the predictive power of the yield curve in Mexico. Due to interest rate data constraints, the yield spread is defined as the difference between one month and six month bond interest rates. The yield spread proves to be an adequate predictor of recessions in Mexico for some time periods but not for others.

7
Mohapi and Botha (2013) employ a dynamic autoregressive probit model to predict recessions in South Africa. Given the dependence of smaller economies on larger economies, yield spreads of other economies (China, U.S.A., and Germany), are used as independent variables in several different probit models. Negative correlation is found for the Chinese and United States yield spreads as expected, but the German spread is found to be countercyclical. Similarly, Mehl (2009) finds that the United States and euro area yield curves contain information that is useful for predicting changes in inflation and industrial production in various emerging economies.
Several studies also consider the impacts of yield spreads in foreign countries on business cycles in high-income economies. Nyberg (2010) reports that the United States and German term spreads are useful for forecasting both domestic and foreign recessions. Similarly, Bernard and Gerlach (1998) find that interest rate differentials in both of those countries help predict recessions in some other developed countries. In a study of stock markets in Canada, Australia, and six European countries, Liu, Resnick, and Shoesmith (2004) report that the United States yield spread contains more market-timing information than the home-country yield spreads. Plosser and Rouwenhorst (1994) find evidence that the term structure of interest rates in the United States embodies information that is useful for predicting industrial production growth in Germany and the United Kingdom and that the yield spreads of the latter two countries also help predict United States growth.
Mehl (2009) documents that yield spreads in high-income countries serve as bellwethers for business cycle movements in many developing nations. However, relatively little is known about the cross-border predictive capabilities of emerging-economy yield spreads. Regions of the United States that are located immediately adjacent to Mexico are appropriate settings to test the hypothesis that an emerging-economy yield spread, that of Mexico, can help predict regional business cycles in a high-income country. Businesses in these regional economies rely on cross-border shoppers and other clientele living directly across the international boundary. Recessions in Mexico therefore have potentially serious adverse repercussions for local economic activity on the northern side of the border (Fullerton, 2001; Phillips and Cañas, 2008). One contribution of this analysis is to examine whether Mexico’s yield spread helps signal the onset of recessions in United States border cities. In addition, this research will also evaluate the predictive potential of another cross-border variable, the real dollar/peso exchange rate
The vast majority of recession prediction research has been conducted for national economies, but a few regional studies have also been completed. One of those studies was developed using data for eight multi-state regions in the United States (Gauger and Schunk, 2002). A similar effort
UTEP TECHNICAL REPORT TX17-1 | FEBRUARY 2017
employs data for each of the 50 states (Shoesmith, 2003). Probit results in both studies exhibit reliable predictive properties for forecasting regional economic contractions.
The objective of this study is to develop probit recession models for eight of the most important United States metropolitan economies along the border with Mexico. Those economies encompass the following Metropolitan and Micropolitan Statistical Areas: San Diego, CA; El Centro, CA; Yuma, AZ; Nogales, AZ; El Paso, TX; Laredo, TX; McAllen, TX; and Brownsville, TX. The total combined population of these urban areas in 2010 was 5.7 million (USCB, 2010). In that year, 87 percent of all personal vehicle border crossings from Mexico to the United States, totalling more than 55 million, occurred within these urban areas (BTS, 2016a). These cities also handled 70 percent of Mexico’s 2010 trade with the United States with a value of $276 billion (BTS, 2016b). Because the eight urban areas listed above host a large percentage of the economic exchanges between the United States and Mexico, they are well suited for testing hypotheses regarding cross-border predictors of regional business cycles.
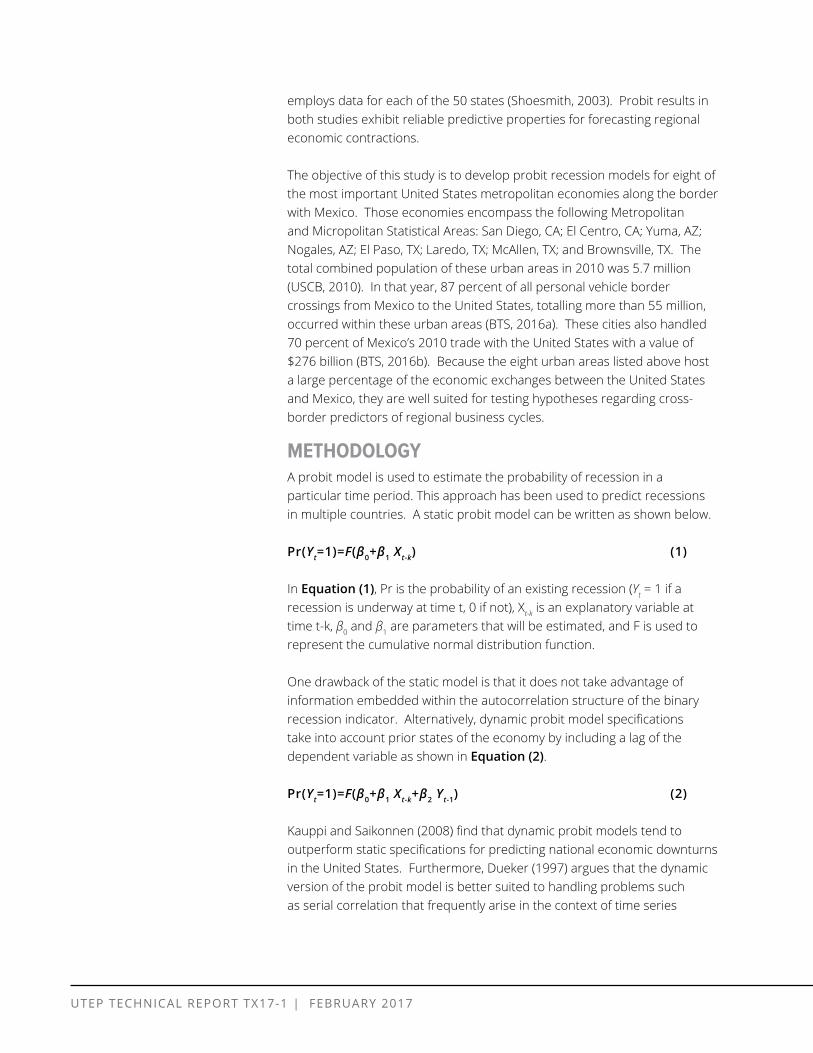
METHODOLOGY A probit model is used to estimate the probability of recession in a particular time period. This approach has been used to predict recessions in multiple countries. A static probit model can be written as shown below.
Pr(Y =1)=F(β0+β1 ) (1)t Xt-k
In Equation (1), Pr is the probability of an existing recession (Yt = 1 if a recession is underway at time t, 0 if not), Xt-k is an explanatory variable at time t-k, β0 and β1 are parameters that will be estimated, and F is used to represent the cumulative normal distribution function.
One drawback of the static model is that it does not take advantage of information embedded within the autocorrelation structure of the binary recession indicator. Alternatively, dynamic probit model specifications take into account prior states of the economy by including a lag of the dependent variable as shown in Equation (2).
Pr(Y =1)=F(β0+β1 +β2 Y ) (2)t Xt-k t-1
Kauppi and Saikonnen (2008) find that dynamic probit models tend to outperform static specifications for predicting national economic downturns in the United States. Furthermore, Dueker (1997) argues that the dynamic version of the probit model is better suited to handling problems such as serial correlation that frequently arise in the context of time series
9
modelling. The model in Equation (2) can be augmented with additional explanatory variables. Standard selection criteria such as pseudo-R2 can be used to identify which lags of candidate explanatory variables to include in an equation (Nyberg, 2010).
To help select estimated equation functional form, the pseudo-R2 metric developed by Estrella (1998) is employed. The metric is calculated as shown below.
)-(2/n) LcAdjusted Pseudo-R2=1-(Lu/Lc (3)
In Equation (3), Lu is the unconstrained maximum value of the log-likelihood, Lc is the constrained maximum value of the log-likelihood assuming all coefficients except the constant are zero, and n is the sample size. Standard diagnostic measures such the t-statistic are also utilized.
The modelling framework employed in this study posits probabilities of recession in the United States-Mexico border region as functions of macroeconomic variables in both countries. This is consistent with the framework outlined by Fullerton (2001), in which national-level and bi-national economic indicators serve as predictors for border region economic performance. Prior studies have found, in particular, that the dollar/peso exchange rate strongly influences business activity along the border (Patrick and Renforth, 1996; Coronado and Phillips, 2007). This study extends previous work on business cycle modelling for this border region by analysing the potential predictive power of the United States and Mexico yield spreads.
The dichotomous dependent variables identify downturns in each metropolitan economy. According to Klein and Moore (1983), the binary variables can be constructed using the coincident values of the unemployment growth rate for each period. Thus, the dependent variables are defined on the basis of quarterly growth in seasonally adjusted local unemployment rates. A common definition of recession is two consecutive quarters (or more) of negative growth. Because unemployment rates are used, two consecutive quarters of positive growth is used instead of negative growth. The United States yield spread is defined as the 10-year Treasury bond rate minus the 3-month Treasury bill rate. In addition to this variable, a 5-year versus 3-month interest rate differential is also calculated to serve as an alternative yield spread measure. All unemployment and United States interest rate data are from the Federal Reserve Bank of St. Louis (FRED, 2015).
Philips and Cañas (2008) find that economic conditions in Mexico sometimes have pronounced impacts on the business cycles of United States border cities. Due to the close economic ties between the cities
UTEP TECHNICAL REPORT TX17-1 | FEBRUARY 2017
selected for this study and their cross-border counterparts in Mexico, international economic variables are also included in the sample. A dollar/ peso (USD/MXN) real exchange rate index is obtained from the University of Texas at El Paso Border Region Modeling Project. Also, the difference between interest rates for 1-year and 3-month Treasury bills (CETES) is used to define a yield spread variable for Mexico. An alternative yield spread variable for Mexico is calculated as the difference between yields on 1-year and 1-month CETES. The latter interest rate data are obtained from the central bank (BM, 2015).
By incorporating all of the variables that are used in the model, the equation to be estimated takes the form shown in (4).
Pr(Y =1)=F(β0+β1 USSPt-h+β2 MXSPt-j+β3 REXRt-k+ β4 Y +ε ) (4)t t-1 t
In Equation (4), USSP is the United States yield spread, MXSP is the yield spread for Mexico, REXR is the inflation adjusted dollar/peso exchange rate index, and Yt-1 is a lag of the dependent variable. This model is estimated for each of the metropolitan economies mentioned above.
Equation (4) is used to examine whether the yield spreads and the real exchange rate index can help predict recessions in the eight border economies comprising the sample. A decrease in the United States yield spread, which entails higher short-term interest rates and/or lower longterm rates, is hypothesized to increase the probability that a recession will occur in future quarters. That is because high short-term interest rates are often associated with contractionary monetary policy and lower long-term rates may reflect expectations of an economic slowdown in coming years (Dueker, 1997).
For similar reasons, the yield spread for Mexico is expected to have an inverse relationship with the probability of recession. Economic slowdowns in Mexico may coincide with downturns in cities on the north side of the border for a variety of reasons. First, retail sectors in many United States border cities rely on a steady influx of Mexican shoppers and sales tend to decline when such shoppers reduce consumption, as typically occurs when Mexico faces a recession (Coronado and Phillips, 2007; Phillips and Cañas, 2008). Other sectors of border city economies such as freight transportation, wholesale trade, and financial services also rely on customers located in Mexico (Cañas et al., 2013). Thus, a higher probability of recession in Mexico, as signalled by a flattening or inversion of that country’s yield curve, is hypothesized to increase the probability of recession on the north side of the border.

11
There is not sufficient evidence to advance a specific hypothesis regarding the impact of the real exchange rate on border city economies. Some prior research suggests that peso depreciations can have strong adverse impacts on retail sectors in United States border cities (Patrick and Renforth, 1996). However, peso depreciations also tend to stimulate export-processing activity in Mexican border cities, which may help fuel economic activity on the north side of the border (Niño et al., 2015). If a real depreciation of the peso lowers the probability of recession for any of the border economies examined, then the exchange rate coefficients will be negative. The converse will occur if peso weakness increases the likelihood of a business cycle downturn.
Correlations between the explanatory Table 1. Explanatory Variable Correlation Coefficients variables from Equation (4) are shown in Table 1. The United States and Mexico yield USSP MXSP REXR spreads exhibit a weak positive correlation. The small magnitude of this correlation USSP 1.000 coefficient is likely due to the fact that, over the course of the sample period, the yield MXSP 0.120 1.000 curves of the two countries have not always evolved in similar patterns. The lowest value REXR -0.226 -0.464 1.000
of Mexico’s yield spread during the sample period, -10.8 percent, occurred in the first Note: The sample period analyzed is 1990:Q4 to 2015:Q3.
quarter of 1995 at a time when the United States yield spread remained well above zero. The large dip in MXSP in 1994-1995 signalled the onset of a very severe recession in Mexico that had no counterpart in the United States. It is also noteworthy that lower yield spreads in both Mexico and the United States are associated with real peso depreciations. This suggests that signs of economic slowdowns in both Mexico and its largest trading partner often coincide with lower currency market values for the peso.
EMPIRICAL RESULTS As noted above, a series of equations is estimated for each metropolitan area. Model selection is accomplished by taking into account pseudo-R2
values, the plausibility of lag lengths, and the number of statistically significant coefficients (Gauger and Schunk, 2002; Nyberg, 2010; Mohapi and Botha, 2013). Dynamic terms are included in the model to take into account potential autocorrelation structures of the dependent variables. Given that, no specific interpretations are attempted for these coefficients (Ng, 2012). The data used for estimation span 25 years, from the fourth quarter of 1990 to the third quarter of 2015. Estimation results are summarized in Tables 2 and 3.
All of the yield spread parameter estimates have negative signs as hypothesized. The United States yield spread predicts recessions with leads

UTEP TECHNICAL REPORT TX17-1 | FEBRUARY 2017
of six to nine quarters suggesting that this variable provides ample advance warning of potential economic downturns in these border economies. Some other studies find that yield spreads contain useful information for predicting recessions at least two years into the future (Gauger and Schunk, 2002; Nakaota, 2005; Mehl, 2009). However, most of the prior literature suggests that lead times of six quarters or less are more commonly observed (Estrella and Mishkin, 1998; Shoesmith, 2003).
One factor that may help explain the comparatively long lead times for some urban economies considered in this study is the relatively large role of the public sector in these economies. On average, between 1990 and 2015, government employment accounted for between 18 and 37 percent of total nonfarm employment in these urban areas, compared to 16 percent for the United States as a whole (BLS, 2016). Many of the US-Mexico border cities have relatively high concentrations of customs, border security, social services and/or military-related employment. Given the large public sector footprint in the border region, countercyclical public spending may somewhat offset or delay the local impacts of national recessions due to public budgeting mechanics.
For all of the urban economies examined, the lead times for the Mexico yield spread are shorter than those for the United States yield spread, ranging from one to five quarters. The shorter lead times for the Mexico yield spread may be partially attributed to the way that it is defined. Because the long-term Treasury bills used to define the Mexican yield spread have a maturity of only one year, it is likely that MXSP provides information on recessionary expectations for a time horizon of around one year or less. The longest lead time observed, that for San Diego, is only slightly longer than one year and all of the other lead times reported in Tables 2 and 3 are between one and three quarters. Similarly, Reyna-Cerecero, Salazar-Cavazos, and Salgado-Banda (2008) find that the 1-year minus 3-month Mexico yield spread generally has higher explanatory power for lead times of two quarters or less.
As previously mentioned, the yield spread can be defined in different ways. To assess the robustness of the yield spread parameter estimates reported in Tables 2 and 3, the equations are sequentially re-estimated using alternative definitions of both the Mexico and U.S. yield spreads (the results are not tabulated). A 5-year minus 3-month U.S. yield spread is estimated to have somewhat larger impacts on the probability of recession (in terms of absolute value) than those shown in Tables 2 and 3, although the standard errors of the estimated yield spread coefficients are also larger. Estimated coefficients for a 1-year minus 1-month interest rate differential variable for Mexico are slightly larger for five out of the eight cities. Regardless of the specific yield spread variable utilized, the parameter estimates change relatively little and always maintain the same signs as those reported in Tables 2 and 3.

13
Table 2. Estimation Results for California and Arizona Border Cities
San Diego El Centro Yuma Nogales
Model Dynamic Dynamic Dynamic Dynamic
USSPt-6 -0.243575**
USSPt-9 -0.833461** -0.244392* -0.273505**
MXSPt-1 -0.266303**
MXSPt-3 -0.010819 -0.379842***
MXSPt-5 -0.245676***
REXt-1 -0.050393** -0.031803*
REXt-8 -0.043194** -0.013254
yt-1 1.841782*** 1.492645*** 1.698913*** 2.119707***
Constant 4.572127* 3.662514* 0.712754 2.415482
Pseudo-R2 0.715799 0.441343 0.415210 0.554550
Log-likelihood -18.35125 -39.42880 -41.66594 -32.61615
Akaike Info. Criterion
0.513214 0.965844 1.025625 0.826728
Likelihood Ratio Stat.
70.29571*** 43.36929*** 40.33705*** 55.04378***
Note: The sample period analyzed is 1990:Q4 to 2015:Q3.
* Statistically significant at 10%
** Statistically significant at 5%
*** Statistically significant at 1%

UTEP TECHNICAL REPORT TX17-1 | FEBRUARY 2017
Table 3. Estimation Results for Texas Border Cities
El Paso Laredo McAllen Brownsville
Model Dynamic Dynamic Dynamic Dynamic
USSPt-6 -0.455950*** -0.284469* -0.321527**
USSPt-9 -0.297215**
MXSPt-1 -0.144953*
MXSPt-2 -0.180982* -0.085532 -0.138004*
REXt-4 -0.045661** -0.074906*** -0.025614 0.000795
yt-1 1.472176*** 1.385111*** 2.269207*** 1.669666***
Constant 3.758856* 6.740427*** 1.361657 -0.702318
Pseudo-R2 0.404745 0.493109 0.518903 0.356789
Log-likelihood -34.41404 -32.77413 -23.99703 -37.19735
Akaike Info. 0.866243 0.803705 0.616958 0.897816 Criterion
Likelihood Ratio 38.17012*** 48.95328*** 49.31443*** 34.49423*** Stat.
Note: The sample period analyzed is 1990:Q4 to 2015:Q3.
* Statistically significant at 10%
** Statistically significant at 5%
*** Statistically significant at 1

15
The results in Tables 2 and 3 also indicate that a real depreciation of the peso relative to the dollar signals a lower probability of recession in most of the United States border cities considered. The impact of exchange rates on the probability of recession in Brownsville is positive but insignificant. One possible explanation for an inverse relationship between the exchange rate variable and most of the binary recession indicators is suggested by the tendency of export-processing activity in Mexican border cities to expand when the peso depreciates (Coronado, Fullerton, and Clark, 2004; Fullerton and Torres-Ruiz, 2004; Cañas, Fullerton and Smith, 2007). Factors that increase cross-border manufacturing activity may lead to positive spill-over effects for cities on the north side of the border (Hanson, 1996; 2001; Varella-Mollick, Cortez-Rayas and Olivas-Moncisvais, 2006; Cañas et al., 2013). As in the case of the yield curve coefficients, the exchange rate coefficients vary considerably depending on the specific city examined.
Prior research suggests that the yield curve may have greater predictive power for regions dominated by industries such as manufacturing and construction that are sensitive to changes in interest rates (Gauger and Schunk, 2002). Baghestani and Kaya (2016) report that yield spread variations affect real estate market dynamics. Shoesmith (2003) finds that changes in interest rate spreads have strong impacts on manufacturing-intensive states. To consider whether patterns of regional variation in predictive performance documented in earlier studies generalize to border economies, data on the share of manufacturing and construction employment in total employment are collected for each urban area. Several of these urban economies have prominent transportation and warehousing sectors that transport cross-border manufactured goods (Cañas et al., 2013). Transportation and warehousing employment is also likely to be fairly cyclical with respect to interest rate fluctuations.
Table 4 indicates that the yield spread seems to have relatively strong predictive capacity among cities with high concentrations of interest-ratesensitive employment sectors (construction, manufacturing, transportation, and warehousing). The yield spread has the greatest predictive power, as judged by the likelihood ratio statistics, in San Diego, Nogales, El Paso, and Laredo. Of those metropolitan economies, the last three also have the highest proportions of construction, manufacturing, and transportation employment among the eight urban areas considered. Though not conclusive, these results point to one possible explanation underlying the regional variation observed in the predictive power of the yield spread variables.
In-sample simulations are also completed to examine if the model can predict recessions. Figures 1 through 8 graph the actual and fitted values of the dependent variables for each urban economy in the sample. Each graph measures the probability of recession on the vertical axis. The

UTEP TECHNICAL REPORT TX17-1 | FEBRUARY 2017
existing literature employs various different probability thresholds to identify likely periods of recession. For example, Ng (2012) classifies months with probability values greater than 50 percent as recession periods because lower thresholds increase the likelihood of false signals. Nyberg (2010) defines probability values between 25 and 50 percent as weak recession signals, whereas values over 50 percent are strong signals of a likely economic downturn. The rationale for considering probability values as low as 25 percent as signals of a possible recession is the potential asymmetry in market participant valuations of correctly predicting recessions versus correctly predicting expansions. Businesses may be more concerned about failing to anticipate an oncoming recession than preparing for a recession that does not materialize (Dueker, 2002).
Table 4. Regional Industry Shares and the Predictive Power of the Yield Spread
Industry Share of Total Employment*
Construction & Manufacturing
Construction, Manufacturing & Transportation
Likelihood Ratio Test Statistic**
San Diego 11.3853 13.0337 20.77024
El Centro 7.2164 10.7433 4.24234
Yuma 8.7460 10.8384 6.85556
Nogales 7.4956 15.9305 21.10336
El Paso 12.6287 17.3027 13.36554
Laredo 5.4762 18.8150 14.38052
McAllen 9.6165 13.2203 4.01024
Brownsville 10.1784 14.0912 6.94082
* Employment data are for the period 2001-2014; the data are from the Bureau of Economic Analysis.
** The 5% critical value of the chi-squared distribution is 5.99; the null hypothesis is that excluding both yield spread coefficients does not significantly reduce the fit of the model.

17
Figure 1. San Diego Actual and Fitted values
Figure 2. El Centro Actual and Fitted Values

UTEP TECHNICAL REPORT TX17-1 | FEBRUARY 2017
Figure 3. Yuma Actual and Ffitted values
Figure 4. Nogales Actual and Fitted Values

19
Figure 5. El Paso Actual and Fitted Values
Figure 6. Laredo Actual and Fitted Values

UTEP TECHNICAL REPORT TX17-1 | FEBRUARY 2017
Figure 7. McAllen Actual and Fitted Values
Figure 8. Brownsville Actual and Fitted Values

21
The dynamic probit models estimated for each border economy provide generally adequate information regarding the probability of recessions. In most cases, predicted probabilities exceed 50 percent during periods when recessions actually occurred. Predicted probabilities tend to fall below 50 percent during expansionary phases of local business cycles. For El Paso and Laredo, there is at least one economic downturn that is not correctly predicted when a 50-percent probability threshold is employed as the basis for defining a likely recession period. However, the probability values in those cases do surpass the 25-percent ‘weak recession signal’ criterion.
CONCLUSION Modelling and predicting recessions for border economies is a difficult task due to the complex interplay of domestic and international factors affecting those urban areas. In recognition of these factors, the real dollar/peso exchange rate and a yield spread for interest rates in Mexico are employed in this study in addition to the domestic yield spread. Most prior research focuses on domestic yield spreads as the principal recession prediction tool (Estrella, 2005). Also, most studies are done at a national level, with very few conducted at a regional level (Gauger and Schunk, 2002; Shoesmith, 2003). Most of those efforts show that yield spreads are effective as recession predictors due to close relationships with business cycles.
The United States yield spread is a reliable predictor of economic downturns in the United States-Mexico border region, with statistical significance at the 5-percent level across six of the eight metropolitan economies in the sample. Furthermore, the Mexico yield spread is a significant predictor for three out of eight cities, while the real exchange rate is helpful in four cases. At least one of the two cross-border financial and currency-market variables is a significant recession predictor for five of the eight urban areas. The predictive power of cross-border variables confirms that several of the sub-regions along the southern border of the United States are markedly influenced by economic conditions in Mexico. As in previous studies, regional variations in industry structure may help explain why interest rate differentials are more effective predictors of recessions in certain areas. In particular, the prevalence of cross-border freight transportation in local economies may account for some portion of the observed variations in the predictive power of the yield spread. Finally, in-sample simulations confirm the predictive capacity of the models used in this study.
Future research might obtain better results when more data are available, especially for the Mexico yield spread. Better results are sometimes obtained as the maturity differential between long- and short-term instruments increases (Mishkin, 1990). Consequently, when more data for longer term interest rates become available, improved outcomes might result. Additionally, time series data on municipal bond yields for specific

UTEP TECHNICAL REPORT TX17-1 | FEBRUARY 2017
metropolitan areas might allow calculation of local-area yield spreads, which could potentially facilitate more nuanced analysis of regional business cycles. Such data sources might help business and policy analysts gain better insights into future economic prospects and may also facilitate more finely tuned policy decisions.
From a geographic perspective, this effort concentrates solely on border economies near Mexico. Additional research using data for regional economies along the border between Canada and the United States would help shed additional light on this topic. Logical candidates for inclusion in such a sample on the southern side of that boundary would include Bellingham, WA; Great Falls, MT; Duluth, MN; Detroit, MI; and Buffalo, NY. Border business cycles are frequently out-of-step with national business cycles. Analysis of economies along the border between Canada and the United States would enjoy an advantage of having both long-term and short-term interest rate data available for modelling purposes.
REFERENCES Baghestani, H., and I. Kaya. 2016. “Do Financial Indicators Have Directional Predictability for US Home Sales?” Applied Economics 48 (15): 1349-1360.
Bernard, H., and S. Gerlach. 1998. “Does the Term Structure Predict Recessions? The International Evidence.” International Journal of Finance and Economics 3 (3): 195-215.
BLS (2016). State and Area Employment, Hours, and Earnings. Washington, DC: U.S. Bureau of Labor Statistics.
BM (2015). Securities Market. México, DF: Banco de México.
BTS (2016a). Border Crossing/Entry Data. Washington, DC: U.S. Bureau of Transportation Statistics.
BTS (2016b). North American Transborder Freight Data. Washington, DC: U.S. Bureau of Transportation Statistics.
Cañas, J., R. Coronado, R. W. Gilmer, and E. Saucedo. 2013. “The Impact of the Maquiladora Industry on US Border Cities.” Growth and Change 44 (3): 415-442.
Cañas, J., T. M. Fullerton, Jr., and W. D. Smith. 2007. “Maquiladora Employment Dynamics in Nuevo Laredo.” Growth and Change 38 (1): 23-28.
Coronado, R., T. M. Fullerton, Jr., and D. P. Clark. 2004. “Short-Run Maquiladora Employment Dynamics in Tijuana.” Annals of Regional Science 38 (4): 751–763.
Coronado, R., and K.R. Phillips. 2007. “Exported Retail Sales along the Texas-Mexico Border.” Journal of Borderlands Studies 22 (1): 19-38.
Dueker, M. J. 1997. “Strengthening the Case for the Yield Curve as a Predictor of U.S. Recessions.” Federal Reserve Bank of St. Louis Review 79 (2): 41-51.
Dueker, M. J. 2002. “Regime-Dependent Recession Forecasts and the 2001 Recession.” Federal Reserve Bank of St. Louis Review 84 (6): 29-36.
Estrella, A. 1998. “A New Measure of Fit for Equations with Dichotomous Dependent Variables.” Journal of Business and Economic Statistics 16 (2): 198-205.
Estrella, A. 2005. “Why does the Yield Curve predict Output and Inflation?” Economic Journal 115 (505): 722-744. Estrella, A., and F.S. Mishkin. 1996. “The Yield Curve as a Predictor of U.S. Recessions.” Current Issues in Economic and Finance 2 (7): 1-6.
Estrella, A., and F.S. Mishkin. 1998. “Predicting U.S. Recessions: Financial Variables as Leading Indicators.” Review of Economics and Statistics 80 (1): 45-61.

23
FRED. 2015. Economic Data. St. Louis, MO: Federal Reserve Bank of St. Louis.
Fullerton, T.M., Jr. 2001. “Specification of a Borderplex Econometric Forecasting Model.” International Regional Science Review 24 (2): 245-260.
Fullerton, T.M., Jr., and L.B. Torres-Ruiz. 2004. “Maquiladora Employment Dynamics in Chihuahua City, Mexico,” Journal of Developing Areas 38 (1): 1-17.
Gauger, J., and D. Schunk. 2002. “Predicting Regional Recessions via the Yield Spread.” Review of Regional Studies 32 (2): 151-170.
Gonzalez, J. G., R. W. Spencer, and D. T. Walz. 2000. “The Term Structure of Interest Rates and the Mexican Economy.” Contemporary Economic Policy 18 (3): 284-294.
Hanson, G. H. 1996. “Economic Integration, Intraindustry Trade, and Frontier Regions.” European Economic Review 40 (3-5): 941-949.
Hanson, G. H. 2001. “U.S.-Mexico Integration and Regional Economies: Evidence from Border City Pairs.” Journal of Urban Economics 50 (2): 259-287.
Kauppi, H., and P. Saikkonen. 2008. “Predicting U.S. Recessions with Dynamic Binary Response Models.” Review of Economics and Statistics 90 (4): 777-791.
Klein, P. A., and G. H. Moore. 1983. “The Leading Indicator Approach to Economic Forecasting— Retrospect and Prospect.” Journal of Forecasting, 2 (2): 119-135.
Liu, W., B.G. Resnick, and G.L. Shoesmith. 2004. “Market Timing of International Stock Markets.” Journal of Financial Research 27 (3): 373-391.
Mehl, A. 2009. “The Yield Curve as a Predictor and Emerging Economies.” Open Economies Review 20 (5): 683-716.
Mishkin, F. S. 1990. “The Information in the Longer Maturity Term Structure about Future Inflation.” Quarterly Journal of Economics 105 (3): 815-828.
Mohapi, T. A., and I. Botha. 2013. “The Explanatory Power of the Yield Curve in Predicting Recessions in South Africa.” International Business & Economics Research Journal 12 (6): 613-634.
Nakaota, H. 2005. “The Term Structure of Interest Rates in Japan: The Predictability of Economic Activity.” Japan and the World Economy 17 (3): 311-326.
Ng, E.C. 2012. “Forecasting US Recessions with various Risk Factors and Dynamic Probit Models.” Journal of Macroeconomics 34 (1): 112-125.
Niño, P., Jr., R.A. Coronado, T.M. Fullerton, Jr., and A.G. Walke. 2015. “Cross-Border Homicide Impacts on Economic Activity in El Paso.” Empirical Economics 49 (4): 1543-1559.
Nyberg, H. 2010. “Dynamic Probit Models and Financial Variables in Recession Forecasting.” Journal of Forecasting 29 (1-2): 215-230.
Patrick, J. M., and W. Renforth. 1996. “The Effects of the Peso Devaluation on Cross-Border Retailing.” Journal of Borderlands Studies 11 (1): 25-41.
Phillips, K.R., and J. Cañas. 2008. “Regional Business Cycle Integration along the US-Mexico Border.” Annals of Regional Science 42 (1): 153-168.
Plosser, C.I., and K.G. Rouwenhorst. 1994. “International Term Structures and Real Economic Growth.” Journal of Monetary Economics 33 (1): 133-155.
Reyna-Cerecero, M., D. Salazar-Cavazos, and H. Salgado-Banda. 2008. “La Curva de Rendimiento y su Relación con la Actividad Económica: Una Aplicación para México.” Banco de México Working Papers 15: 1-47.
Shoesmith, G. L. 2003. “Predicting National and Regional Recessions using Probit Modeling and Interest-Rate spreads.” Journal of Regional Science 43 (2): 373-392.
USCB. 2010. 2010 Census. Washington, DC: U.S. Census Bureau.
Varella-Mollick, A., A. Cortez-Rayas, and R.A. Olivas-Moncisvais. 2006. “Local Labor Markets in U.S.Mexican Border Cities and the Impact of Maquiladora Production.” Annals of Regional Science 40 (1): 95-116.

UTEP TECHNICAL REPORT TX17-1 | FEBRUARY 2017
_____________________________________ _____________________________________ _____________________________________ _____________________________________ _____________________________________ _____________________________________ _____________________________________
The University of Texas at El Paso Announces
Borderplex Economic Outlook to 2018
UTEP is pleased to announce the 2016 edition of its primary source of border business information. Topics covered include demography, employment, personal income, retail sales, residential real estate, transportation, international commerce, and municipal water consumption. Forecasts are generated utilizing the 250-equation UTEP Border Region Econometric Model developed under the auspices of a corporate research gift from El Paso Electric Company and maintained using externally funded research support from El Paso Water and Hunt Communities.
The authors of this publication are UTEP Professor & Trade in the Americas Chair Tom Fullerton and UTEP Associate Economist Adam Walke. Dr. Fullerton holds degrees from UTEP, Iowa State University, Wharton School of Finance at the University of Pennsylvania, and University of Florida. Prior experience includes positions as Economist in the Executive Office of the Governor of Idaho, International Economist in the Latin America Service of Wharton Econometrics, and Senior Economist at the Bureau of Economic and Business Research at the University of Florida. Adam Walke holds an M.S. in Economics from UTEP and has published research on energy economics, mass transit demand, and cross-border regional growth patterns.
The border business outlook through 2018 can be purchased for $10 per copy. Please indicate to what address the report(s) should be mailed (also include telephone, fax, and email address):
Send checks made out to University of Texas at El Paso for $10 to:
Border Region Modeling Project - CBA 236 UTEP Department of Economics & Finance 500 West University Avenue El Paso, TX 79968-0543
Request information from 915-747-7775 or [email protected] if payment in pesos is preferred.

25
_____________________________________ _____________________________________ _____________________________________ _____________________________________ _____________________________________ _____________________________________ _____________________________________
The University of Texas at El Paso Announces
Borderplex Long-Term Economic Trends to 2029
UTEP is pleased to announce the availability of an electronic version of the 2010 edition of its primary source of long-term border business outlook information. Topics covered include detailed economic projections for El Paso, Las Cruces, Ciudad Juárez, and Chihuahua City. Forecasts are generated utilizing the 225-equation UTEP Border Region Econometric Model developed under the auspices of a 12-year corporate research support program from El Paso Electric Company.
The authors of this publication are UTEP Professor & Trade in the Americas Chair Tom Fullerton and former UTEP Associate Economist Angel Molina. Dr. Fullerton holds degrees from UTEP, Iowa State University, Wharton School of Finance at the University of Pennsylvania, and University of Florida. Prior experience includes positions as Economist in the Executive Office of the Governor of Idaho, International Economist in the Latin America Service of Wharton Econometrics, and Senior Economist at the Bureau of Economic and Business Research at the University of Florida. Angel Molina holds an M.S. Economics degree from UTEP and has conducted econometric research on international bridge traffic, peso exchange rate fluctuations, and cross-border economic growth patterns.
The long-term border business outlook through 2029 can be purchased for $10 per copy. Please indicate to what address the report(s) should be mailed (also include telephone, fax, and email address):
Send checks made out to University of Texas at El Paso for $10 to:
Border Region Modeling Project - CBA 236 UTEP Department of Economics & Finance 500 West University Avenue El Paso, TX 79968-0543
Request information at 915-747-7775 or [email protected] if payment in pesos is preferred.

UTEP TECHNICAL REPORT TX17-1 | FEBRUARY 2017
The UTEP Border Region Modeling Project & UACJ Press Announce the Availability of
Basic Border Econometrics The University of Texas at El Paso Border Region Modeling Project is pleased to announce Basic Border Econometrics, a publication from Universidad Autónoma de Ciudad Juárez. Editors of this new collection are Martha Patricia Barraza de Anda of the Department of Economics at Universidad Autónoma de Ciudad Juárez and Tom Fullerton of the Department of Economics & Finance at the University of Texas at El Paso.
Professor Barraza is an award winning economist who has taught at several universities in Mexico and has published in academic research journals in Mexico, Europe, and the United States. Dr. Barraza currently serves as Research Provost at UACJ. Professor Fullerton has authored econometric studies published in academic research journals of North America, Europe, South America, Asia, Africa, and Australia. Dr. Fullerton has delivered economics lectures in Canada, Colombia, Ecuador, Finland, Germany, Japan, Korea, Mexico, the United Kingdom, the United States, and Venezuela.
Border economics is a field in which many contradictory claims are often voiced, but careful empirical documentation is rarely attempted. Basic Border Econometrics is a unique collection of ten separate studies that empirically assess carefully assembled data and econometric evidence for a variety of different topics. Among the latter are peso fluctuations and cross-border retail impacts, border crime and boundary enforcement, educational attainment and border income performance, pre- and post-NAFTA retail patterns, self-employed Mexican-American earnings, maquiladora employment patterns, merchandise trade flows, and Texas border business cycles.
Contributors to the book include economic researchers from the University of Texas at El Paso, New Mexico State University, University of Texas Pan American, Texas A&M International University, El Colegio de la Frontera Norte, and the Federal Reserve Bank of Dallas. Their research interests cover a wide range of fields and provide multi-faceted angles from which to examine border economic trends and issues.
A limited number of Basic Border Econometrics can be purchased for $10 per copy. Please contact Professor Servando Pineda of Universidad Autónoma de Ciudad Juárez at [email protected] to order copies of the book. Additional information for placing orders is also available from Professor Martha Patricia Barraza de Anda at [email protected].
27
The University of Texas at El Paso Technical Report Series:
TX97-1: Currency Movements and International Border Crossings TX97-2: New Directions in Latin American Macroeconometrics TX97-3: Multimodal Approaches to Land Use Planning TX97-4: Empirical Models for Secondary Market Debt Prices TX97-5: Latin American Progress under Structural Reform TX97-6: Functional Form for United States-Mexico Trade Equations TX98-1: Border Region Commercial Electricity Demand TX98-2: Currency Devaluation and Cross-Border Competition TX98-3: Logistics Strategy and Performance in a Cross-Border Environment TX99-1: Inflationary Pressure Determinants in Mexico TX99-2: Latin American Trade Elasticities CSWHT00-1: Tariff Elimination Staging Categories and NAFTA TX00-1: Borderplex Business Forecasting Analysis TX01-1: Menu Prices and the Peso TX01-2: Education and Border Income Performance TX02-1: Regional Econometric Assessment of Borderplex Water Consumption TX02-2: Empirical Evidence on the El Paso Property Tax Abatement Program TX03-1: Security Measures, Public Policy, Immigration, and Trade with Mexico TX03-2: Recent Trends in Border Economic Analysis TX04-1: El Paso Customs District Cross-Border Trade Flows TX04-2: Borderplex Bridge and Air Econometric Forecast Accuracy: 1998-2003 TX05-1: Short-Term Water Consumption Patterns in El Paso TX05-2: Menu Price and Peso Interactions: 1997-2002 TX06-1: Water Transfer Policies in El Paso TX06-2: Short-Term Water Consumption Patterns in Ciudad Juárez TX07-1: El Paso Retail Forecast Accuracy TX07-2: Borderplex Population and Migration Modeling TX08-1: Borderplex 9/11 Economic Impacts TX08-2: El Paso Real Estate Forecast Accuracy: 1998-2003 TX09-1: Tolls, Exchange Rates, and Borderplex Bridge Traffic TX09-2: Menu Price and Peso Interactions: 1997-2008 TX10-1: Are Brand Name Medicine Prices Really Lower in Ciudad Juárez? TX10-2: Border Metropolitan Water Forecast Accuracy TX11-1: Cross Border Business Cycle Impacts on El Paso Housing: 1970-2003 TX11-2: Retail Peso Exchange Rate Discounts and Premia in El Paso TX12-1: Borderplex Panel Evidence on Restaurant Price and Exchange Rate Dynamics TX12-2: Dinámica del Consumo de Gasolina en Ciudad Juárez: 2001-2009 TX13-1: Physical Infrastructure and Economic Growth in El Paso: 1976-2009 TX13-2: Tolls, Exchange Rates, and Northbound International Bridge Traffic: 1990-2006 TX14-1: Freight Transportation Costs and the Thickening of the U.S.-Mexico Border TX14-2: Are Online Pharmacy Prices Really Lower in Mexico? TX15-1: Drug Violence, the Peso, and Northern Border Retail Activity in Mexico TX15-2: Downtown Parking Meter Demand in El Paso TX16-1: North Borderplex Retail Gasoline Price Fluctuations: 2000-2013 TX16-2: Residential Electricity Demand in El Paso: 1977-2014 TX17-1: Southern Border Recession Predictability in the United States: 1990-2015

UTEP TECHNICAL REPORT TX17-1 | FEBRUARY 2017
The University of Texas at El Paso Border Business Forecast Series:
SR98-1: El Paso Economic Outlook: 1998-2000 SR99-1: Borderplex Economic Outlook: 1999-2001 SR00-1: Borderplex Economic Outlook: 2000-2002 SR01-1: Borderplex Long-Term Economic Trends to 2020 SR01-2: Borderplex Economic Outlook: 2001-2003 SR02-1: Borderplex Long-Term Economic Trends to 2021 SR02-2: Borderplex Economic Outlook: 2002-2004 SR03-1: Borderplex Long-Term Economic Trends to 2022 SR03-2: Borderplex Economic Outlook: 2003-2005 SR04-1: Borderplex Long-Term Economic Trends to 2023 SR04-2: Borderplex Economic Outlook: 2004-2006 SR05-1: Borderplex Long-Term Economic Trends to 2024 SR05-2: Borderplex Economic Outlook: 2005-2007 SR06-1: Borderplex Long-Term Economic Trends to 2025 SR06-2: Borderplex Economic Outlook: 2006-2008 SR07-1: Borderplex Long-Term Economic Trends to 2026 SR07-2: Borderplex Economic Outlook: 2007-2009 SR08-1: Borderplex Long-Term Economic Trends to 2027 SR08-2: Borderplex Economic Outlook: 2008-2010 SR09-1: Borderplex Long-Term Economic Trends to 2028 SR09-2: Borderplex Economic Outlook: 2009-2011 SR10-1: Borderplex Long-Term Economic Trends to 2029 SR10-2: Borderplex Economic Outlook: 2010-2012 SR11-1: Borderplex Economic Outlook: 2011-2013 SR12-1: Borderplex Economic Outlook: 2012-2014 SR13-1: Borderplex Economic Outlook: 2013-2015 SR14-1: Borderplex Economic Outlook to 2016 SR15-1: Borderplex Economic Outlook to 2017 SR16-1: Borderplex Economic Outlook to 2018
Technical Report TX17-1 is a publication of the Border Region Modeling Project and the Department of Economics & Finance at the University of Texas at El Paso. For additional Border Region information, please visit the www.academics.utep. edu/border section of the UTEP web site.

Bord
er R
egio
n M
odel
ing
Proj
ect –
CBA
236
U
TEP
Dep
artm
ent o
f Eco
nom
ics
& F
inan
ce
500
Wes
t Uni
vers
ity A
venu
e El
Pas
o, T
X 79
968-
0543
ww
w.u
tep.
edu