southeastern massachusetts - umass donahue institute · massachusetts benchmarks.... 16 ....summer...
TRANSCRIPT

MASSACHUSETTS BENCHMARKS SUMMER 2002. . . . 16 . . . .
○
○
○
○
○
○
○
○
○
○
○
○
○
○
○
○
○
○
○
○
○
○
○
○
Historically, Southeastern Massachusetts has beendefined by its five cities—Attleboro, Brockton,Fall River, New Bedford, and Taunton—whose
common industrial history extends back to the early 1800s.These cities have risen and declined along with the fortunesof traditional manufacturing industries, such as textiles andapparel and metals fabrication. In the late 1920s, when thetextile and apparel industries left the state, the cities wentinto a long period of decline.1
Between 1920 and 1990, the populations of NewBedford and Fall River dropped by approximately 20 per-cent. Since the end of World War II, each of the region’scities has experienced a pathology of de-industrialization: lowincomes, high unemployment, low rates of educational at-
From the Field
Southeastern MassachusettsBuilding a New Economy
tainment, decaying municipal infrastructure, population loss,low property values, and a weak tax base.
In Search of a SolutionThe region’s identity has long reflected its economic, po-litical, and geographic isolation. During the 1980s, it con-tinued to experience high unemployment rates, low in-comes, and population loss, despite a full employmenteconomy statewide and income growth that was the high-est in the nation.2 Concerned that residents were not ben-efiting from the Massachusetts Miracle, the region’s fivemayors established the Southeastern Massachusetts Part-nership in 1986.
Their concerns were reinforced shortly after the
CLYDE BARROW
The southeastern corner of the Commonwealth flourishedduring the industrial age, but for most of the past century, itscities and towns have been in decline. With employment,education, and general economic conditions paling in com-parison to state averages, there was nowhere to go but up.Numerous studies—and an influx of funds—have begun tolay the groundwork for recovery.

SUMMER 2002 MASSACHUSETTS BENCHMARKS. . . . 17 . . . .
partnership’s establishment,when the region’s cities beganlosing jobs at a pace not seensince the Great Depression. Theentire state followed Southeast-ern Massachusetts into the 1990–91 recession and, by its trough,Southeastern Massachusetts hada regional unemployment rate of12 percent. Some of its cities re-ported unemployment rates inexcess of 20 percent.
In response to the crisis, theSoutheastern Massachusetts Part-nership sponsored the first com-prehensive study of the region’seconomy, drawing explicitly onthe framework developed byMichael Porter.3 In 1991, thepartnership released The HighSkills Path for Southeastern Massachusetts: A Framework forDecisionmakers, and convened a conference of regional lead-ers to discuss its findings. The study defined SoutheasternMassachusetts as five counties—Bristol, Plymouth,Barnstable, Dukes, and Nantucket—though it recognizedthat many other plausible definitions could be advanced,based on federal planning districts, labor market areas, ser-vice delivery areas, and state administrative districts.
The study’s main conclusion was that policymakers,business executives, and educators would “need to attendto underlying structural problems” in the regional economybefore efforts to attract or retain businesses could be suc-cessful. These structural problems included low educationalattainment and a modest base of higher-education institu-tions that was not adequate to support technological inno-vation or technology transfer. The study called attention to“the critical importance of human capital” in the neweconomy, which in Southeastern Massachusetts was notadequate to sustain the knowledge-intensive service indus-tries and high-technology manufacturing that has supportedthe state’s last two economic expansions.4
In Choosing to Compete,5 the state’s Executive Officeof Economic Affairs, in collaboration with the Universityof Massachusetts, narrowed the working definition of South-eastern Massachusetts to 40 towns and cities in Bristol andPlymouth Counties. The region’s boundaries were rede-fined in response to demands from Cape Cod residents thatthe Cape and Islands be treated as a separate region. Infact, the Cape’s unique tourism-based economy warrantsthis modification for statistical and planning purposes.6 TheMassachusetts EOEA’s redefinition of Southeastern Mas-sachusetts also established new geographic boundaries thatwere more consistent with those of the Southeast Regional
○
○
○
○
○
○
○
○
○
○
○
○
○
○
○
○
○
○
○
○
○
○
○
○
○
○
○
○
○
○
○
○
○
○
○
○
○
○
○
○
○
○
○
○
○
○
○
○
○
○
○
○
○
○
○
○
○
○
Southeastern Massachusetts: Population by Town, 1990 and 2000
City or Town 1990 2000 Numerical PercentageChange Change
Top Gains:Taunton 49,832 55,976 6,144 12.3Plymouth 45,608 51,701 6,093 13.4Mansfield 16,568 22,414 5,846 35.3Bridgewater 21,249 25,185 3,936 18.5Norton 14,265 18,036 3,771 26.4
Top Losses:New Bedford 99,922 93,768 -6,154 -6.2Fall River 92,703 91,938 -765 -0.8Avon 4,558 4,443 -115 -2.5Freetown 8,522 8,472 -50 -0.6
Southeast Region Total 949,520 1,015,843 66,323 7.0
Source: U.S. Bureau of the Census
Planning and Economic Development District and the OldColony Planning Council, which assist communities withtransportation and land use planning.
The regional analysis of Southeastern Massachusetts inChoosing to Compete identified significant business clustersin textiles,7 electronics and communications, marine scienceand technology,8 food processing, metals fabrication, fish-ing,9 and tourism.10 The report concluded that despite itseconomic difficulties, the region had several competitiveadvantages, particularly within the northeastern UnitedStates, such as an extensive highway network, lower busi-ness costs, affordable housing, and workforce availability inspecialized industries and occupations. Its main conclusion,however, reinforced the partnership’s earlier findings: Thebusiness clusters most likely to anchor the region’s futureeconomy—including its “traditional” manufacturing firms—had finally started to adopt improvements in technologyand productivity that created a need for enhanced workforceskills and higher levels of educational attainment. Thus,Choosing to Compete concluded that new private investmentin technology and public investment in education, workforcetraining, and technology transfer were the main economicdevelopment priorities in the region.
During this period, State Senator Marc Pacheco andState Representative Joan Menard convened the Southeast-ern Massachusetts Legislative Caucus to address many ofthese problems at the regional and state policy level. TheSMLC was established to develop a regional legislativeagenda that would address economic development issues,which cut across the artificial town, city, and legislative dis-trict lines that had often hampered regional economic de-velopment initiatives in the past. The SMLC includes statelegislators from all 48 cities and towns in Plymouth and
MASSACHUSETTS BENCHMARKS SUMMER 2002. . . . 18 . . . .
○
○
○
○
○
○
○
○
○
○
○
○
○
○
○
○
○
○
○
○
○
○
○
○
○
○
○
○
○
○
○
○
○
○
○
○
○
○
○
○
○
○
○
○
○
○
○
○
○
○
○
Bristol Counties and, thus, includes some South Shore townsthat are members of the Metropolitan Area Planning Coun-cil but were excluded from the Choosing to Compete defini-tion of the region.
The SMLC’s conferences have been co-sponsored bythe Southeastern Massachusetts Partnership, Southeast-ern Regional Planning and Economic Development Dis-trict, Old Colony Planning Council, UMass Dartmouth,and Bridgewater State College, and have effectively estab-lished a common definition of the region among legisla-tive, planning, and academic institutions for the first time.Consequently, when the University of MassachusettsBenchmarks Project was begun in 1998, it adopted theSMLC definition of Southeastern Massachusetts with onlyminor modifications.
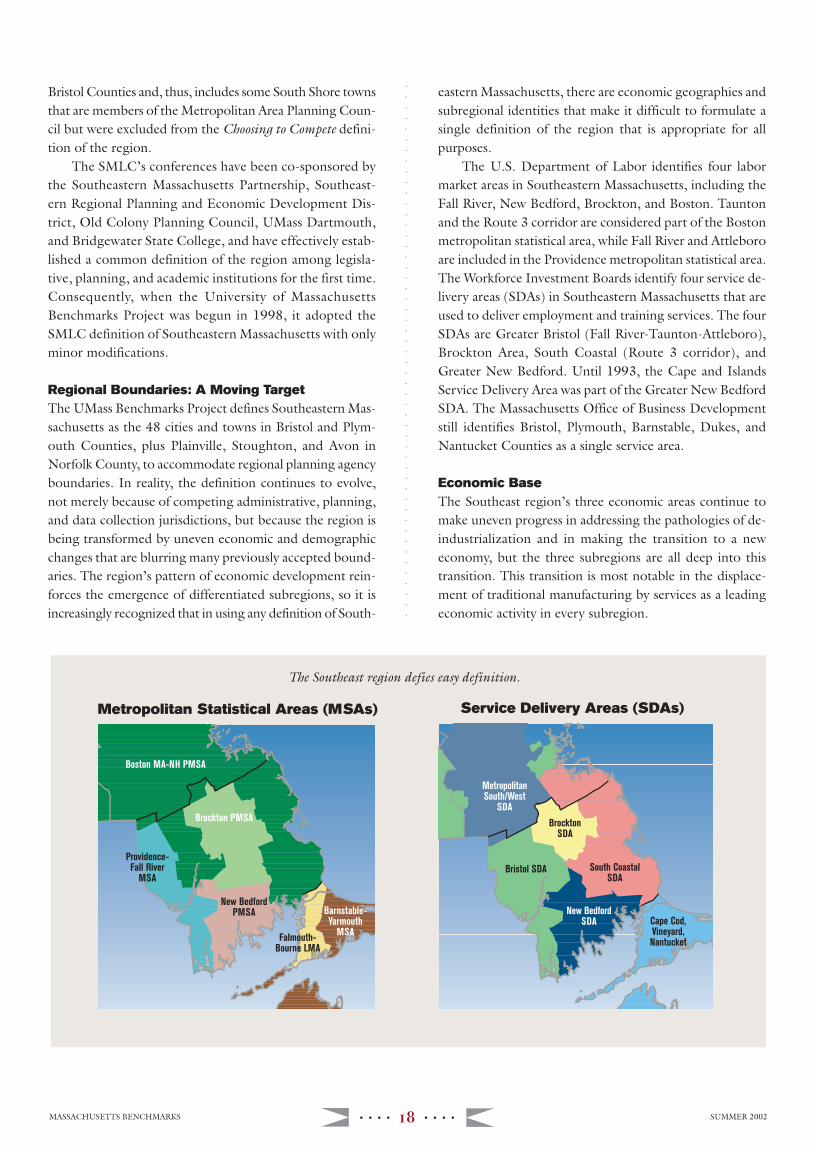
Regional Boundaries: A Moving TargetThe UMass Benchmarks Project defines Southeastern Mas-sachusetts as the 48 cities and towns in Bristol and Plym-outh Counties, plus Plainville, Stoughton, and Avon inNorfolk County, to accommodate regional planning agencyboundaries. In reality, the definition continues to evolve,not merely because of competing administrative, planning,and data collection jurisdictions, but because the region isbeing transformed by uneven economic and demographicchanges that are blurring many previously accepted bound-aries. The region’s pattern of economic development rein-forces the emergence of differentiated subregions, so it isincreasingly recognized that in using any definition of South-
eastern Massachusetts, there are economic geographies andsubregional identities that make it difficult to formulate asingle definition of the region that is appropriate for allpurposes.
The U.S. Department of Labor identifies four labormarket areas in Southeastern Massachusetts, including theFall River, New Bedford, Brockton, and Boston. Tauntonand the Route 3 corridor are considered part of the Bostonmetropolitan statistical area, while Fall River and Attleboroare included in the Providence metropolitan statistical area.The Workforce Investment Boards identify four service de-livery areas (SDAs) in Southeastern Massachusetts that areused to deliver employment and training services. The fourSDAs are Greater Bristol (Fall River-Taunton-Attleboro),Brockton Area, South Coastal (Route 3 corridor), andGreater New Bedford. Until 1993, the Cape and IslandsService Delivery Area was part of the Greater New BedfordSDA. The Massachusetts Office of Business Developmentstill identifies Bristol, Plymouth, Barnstable, Dukes, andNantucket Counties as a single service area.
Economic BaseThe Southeast region’s three economic areas continue tomake uneven progress in addressing the pathologies of de-industrialization and in making the transition to a neweconomy, but the three subregions are all deep into thistransition. This transition is most notable in the displace-ment of traditional manufacturing by services as a leadingeconomic activity in every subregion.
○
○
○
○
○
○
○
○
○
○
○
○
○
○
○
○
○
○
○
○
○
○
○
○
○
○
○
○
○
○
○
○
○
○
Metropolitan Statistical Areas (MSAs)
Boston MA-NH PMSA
Brockton PMSA
Providence-Fall River
MSA
New BedfordPMSA
Falmouth-Bourne LMA
Barnstable-Yarmouth
MSA
MetropolitanSouth/West
SDA
BrocktonSDA
South CoastalSDA
Bristol SDA
New BedfordSDA Cape Cod,
Vineyard,Nantucket
Service Delivery Areas (SDAs)
The Southeast region defies easy definition.

SUMMER 2002 MASSACHUSETTS BENCHMARKS. . . . 19 . . . .
ILLUSTRATION: NAOMI SHEAMajor Employment Sectors in Southeast Subregions
2000 2000 Percent of Area’s Average
Employment Earnings
South Shore Area Total: 100.0 $33,121Services: Allied Health Services 9.2 $32,907 Professional Services 3.2 $51,560 Business Services 5.5 $38,237 Financial Services 3.2 $43,662Tourism: 5.4 $14,346
Tri-Cities Area Total: 100.0 $33,498Services Allied Health Services 8.6 $35,228 Business Services 4.1 $25,620Manufacturing: High Technology 3.6 $51,550 Metals Manufacturing 1.8 $40,491Distribution: 8.5 $46,672
South Coast Area Total: 100.0 $29,162Services: Allied Health Services 12.9 $32,172 Social Services 3.7 $20,414 Business Services 4.1 $16,500Manufacturing: Textiles and Apparel 7.2 $26,845 High Technology 3.0 $42,725Distribution: 6.0 $33,613
Massachusetts Total: n/a $44,329
Source: Massachusetts Division of Employment and Training
○
○
○
○
○
○
○
○
○
○
○
○
○
○
○
○
○
○
○
○
○
○
○
○
○
○
○
○
○
○
○
○
○
The South Shore. The South Shore subregion consists oftwelve towns in Plymouth County. Its population of197,07411 reflects an increase of 11 percent since 1990.There are no cities in the subregion, but the area’s twolargest towns—Plymouth (51,701) and Marshfield (24,324)—account for 38.6 percent of the area’s population. Thearea’s economic growth continues to be fueled by popula-tion and income growth (e.g., health care, retail) and theemergence of professional, business, and financial servicesfirms that serve Boston-area businesses and local residents.The area is also developing a more vibrant off-Cape tour-ism industry.
The Tri-Cities. The Tri-Cities subregion consists of 22 cit-ies and towns in Bristol and Plymouth Counties. Its popu-lation of 473,15912 reflects an increase of 9.9 percent over1990. The area’s three cities—Brockton (94,304), Taunton(55,976), and Attleboro (42,068)—account for 40.7 per-cent of the area’s population. This is the least integrated
and most diffuse of the subregions. The Route 24/I-495axis links these communities with the Providence and Bos-ton Metro areas.
This subregion continues to benefit from the south-ward movement of the Boston metropolitan economy andfrom the northeastward movement of the Providence met-ropolitan economy. It is making a successful transition froma traditional manufacturing economy to a new economyanchored by services and high-tech manufacturing. Becauseof its extensive intermodal transportation linkages, thishas also become a regional distribution center. As the Tri-Cities makes this transition, its unemployment rate movessteadily downward, while its educational attainment andincome levels approach state averages.
The South Coast. The South Coast subregion consists offourteen cities and towns in the southernmost part of Bristoland Plymouth Counties. Its population of 345,61013 re-flects an increase of 0.97 percent since 1990. The area’s
two cities—New Bedford (93,768) and FallRiver (91,938)—account for 53.7 percentof its population. Despite business and hous-ing costs that are much lower than Boston’s,the South Coast has been less successful inattracting “high-end” businesses than otherareas of the region, partly because it is stillstruggling with low educational attainmentlevels, a poor external image, and relativeisolation from Boston. Thus, while the SouthCoast has made notable progress in closingits unemployment gap with the rest of thestate, its income and wage levels are stillamong the state’s lowest.
The South Coast has seen significant jobgrowth in health care, business services, hightechnology manufacturing, and distribution,which has finally begun to offset the con-tinuing loss of jobs in textiles, apparel, andmiscellaneous manufacturing. Many of thearea’s growth sectors (e.g., high technologyand distribution) provide above-average an-nual earnings that exceed those of the jobsbeing lost in declining sectors. This trendbodes well for the South Coast’s future, ifthe area can improve its educational attain-ment levels, workforce skills, and technol-ogy transfer capacities.
Improvements in Education FundingRegional cooperation among state legisla-tors, mayors, town officials, regional plan-ning agencies, and higher education insti-tutions has paid dividends for Southeastern

MASSACHUSETTS BENCHMARKS SUMMER 2002. . . . 20 . . . .
○
○
○
○
○
○
○
○
○
○
○
○
○
○
○
○
○
○
○
○
○
○
○
○
○
○
○
○
○
○
○
○
○
○
○
○
○
○
○
○
○
○
○
○
○
○
○
○
○
○
○
○
○
○
○
○
○
○
○
○
○
○
○
○
○
○
○
○
○
○
○
○
○
○
○
○
○
○
○
○
○
○
○
○
○
○
○
○
○
○
○
○
○
Massachusetts. A central feature of the larger region’s eco-nomic development strategy in the 1990s was its focus onK–12 education, adult literacy, and the development of uni-versity research capacities. The passage of the MassachusettsEducation Reform Act of 1993 reinforced this strategy,though the five cities and their adjacent communities arereporting different degrees of success in implementing it.
The Southeast region has been a major financial ben-eficiary of education reform. Since 1993, state aid per pupil(K–12) has increased by $3,150 in Brockton, $2,564 inFall River, and $2,753 in New Bedford. By FY 1999, theintegrated annual cost per pupil (expenditures) was $6,836in Brockton, $7,282 in Fall River, and $6,767 in NewBedford, compared to $6,978 for the state overall. As aresult of the state’s financial commitment to education re-form, the region’s major urban school districts have at leastachieved a foundation budget comparable to the state aver-age.14 To the extent that funding disparities have had a nega-tive impact on student performance in the past, one shouldreasonably expect the region’s urban school districts to showimproved performance in the coming decade.
The entry of Southeastern Massachusetts Universityinto an expanded University of Massachusetts system in1993 has also improved the region’s long-term capacity fortechnology transfer and business support, but theDartmouth campus is still early in its development as a uni-versity-level research institution. These capacities wererecently improved with the addition of a Marine Science Labo-ratory in New Bedford, an Advanced Manufacturing Tech-nology Center in Fall River, and a Center for BusinessResearch in North Darmouth that provides marketing assis-tance to private businesses. The Dartmouth campus is alsoadding a corporate education center in downtown Fall River.
ConclusionDespite the importance of these efforts, the Southeastregion’s separation into three economic areas is likely tocontinue for the foreseeable future. The competitive ad-vantages in each area have successfully attracted, retained,or stimulated the growth of specific business and industryclusters. The subregions continue to have widely divergentdemographic profiles (e.g., incomes and education), whichare both a cause and an effect of this clustering, and thesefactors will not change in a short period of time. Any futureeconomic development strategies for the region must takeinto consideration the different competitive advantages anddevelopment trajectories of each economic area.
1 Seymour Harris, The Economics of New England: Case Study of an OlderArea (Cambridge: Harvard University Press, 1952), Chap. 26; SeymourLouis Wolfbein, The Decline of a Cotton Textile City: A Study of New Bedford(New York: Columbia University Press, 1944).
2 Lynn Elaine Brown and Steven Sass, “The Transition from a Mill-Basedto a Knowledge-Based Economy: New England, 1940–2000,” in PeterTemin, ed., Engines of Enterprise: An Economic History of New England(Cambridge, Mass.: Harvard University Press, 2000), pp. 201–49; DavidR. Lampe, ed., The Massachusetts Miracle (Cambridge, Mass.: MIT Press,1988).
3 Michael Porter, The Competitive Advantage of Massachusetts (Boston:Massachusetts Secretary of the Commonwealth, 1991).
4 Susan Rosegrant and David R. Lampe, Route 128: Lessons from Boston’sHigh-Tech Community (New York: Basic Books, 1992); Barry Bluestoneand Mary Huff Stevenson, The Boston Renaissance (New York: RussellSage Foundation, 2000).
5 William Weld and Michael Hooker, Choosing to Compete: A StatewideJob Strategy for Job Creation and Economic Growth (Boston: Massachu-setts Office of Executive Affairs and University of Massachusetts, 1993).
6 Clyde W. Barrow, “Cape Cod and the Islands: More Than a ResortEconomy,” Massachusetts Benchmarks: The Quarterly Review of Economic News& Insight, vol. 4, no. 3 (Summer 2001): 17–23. www.massbenchmarks.org/issues/01summer/01summer_from_the_field.html
7 See Clyde W. Barrow, Economic Impacts of the Textile and Apparel In-dustries in Massachusetts (Amherst: University of Massachusetts DonahueInstitute, 2000).
8 Clyde W. Barrow and David R. Borges, “SouthCoast Signals: SouthCoastEconomy Facing Some Changes,” The New Bedford Sunday Standard-Times, February 10, 2002, p. B-6
9 See Daniel Georgianna, The Massachusetts Marine Economy (Amherst:University of Massachusetts Donahue Institute, 2000). Clyde W. Barrowand David R. Borges, “SouthCoast Signals: Agriculture, Fishing Still Im-portant to Economy,” The New Bedford Sunday Standard-Times, January17, 2002, p. B-7.
10 Commonwealth of Massachusetts, Convention & Public Assembly Fa-cilities Market & Feasibility Study: Southeast Region (Boston: ExecutiveOffice for Administration and Finance, 1998), chap. 4.
11 U.S. Census 2000
12 Ibid.
13 Ibid.
14 David R. Borges and Clyde W. Barrow, Fall River Public Schools: Com-munity Report Card, 2000 (North Dartmouth, Mass.: Center for PolicyAnalysis, 2001). www.umassd.edu/cfpa/rptcd00.pdf
CLYDE BARROW is a professor of political science and the director of the Uni-versity of Massachusetts Dartmouth Center for Policy Analysis.

SUMMER 2002 MASSACHUSETTS BENCHMARKS. . . . 15 . . . .
The Education Gap
1980
Workers with college degrees 25% of labor force, earning $40,100
Workers without college degrees 75% of labor force, earning $26,000
Gap in annual median earnings: $14,100
2000
Workers with college degrees 38% of labor force, earning $46,500
Workers without college degrees 62% of labor force, earning $26,000
Gap in annual median earnings: $20,500
$30,800$28,500
$39,000
$29,600
1980 2000
The Sector Gap
1980
Workers in knowledge sectors 32% of labor force, earning $30,800
Workers in other sectors 63% of labor force, earning $28,500
Gap in annual median earnings: $2,300
2000
Workers in knowledge sectors 36% of labor force, earning $39,000
Workers in other sectors 63% of labor force, earning $29,600
Gap in annual average salaries: $9,400
○
○
○
○
○
○
○
○
○
○
○
○
○
○
○
○
○
○
○
○
○
○
○
○
○
○
○
○
○
○
○
○
○
○
○
○
○
○
○
○
○
○
○
○
○
○
○
○
○
○
○
○
○
○
○
○
○
○
○
○
○
○
○
○
○
○
○
○
○
○
○
○
○
○
○
○
○
○
○
○
○
○
○
$40,100
$26,000
$46,500
$26,000
1980 2000
and bargaining rights. At the same time, there could be anemphasis on enabling more people to become college-edu-cated workers in the knowledge sectors. This is also a soundobjective, since these are the workers with the greatest op-portunity.
1 The knowledge sectors referred to in this article are professionalservices (knowledge creation), health care, financial services, andinformation technology.
2 Data in this article are from the March CPS in 1999, 2000, and 2001.The universe is people aged 25 to 62 in the U.S. labor force, weightedto represent total population. All dollar figures are expressed in 2000dollars.
RALPH WHITEHEAD, JR., is the Public Service Professor at the University ofMassachusetts in Amherst.
ROBERT J. LACEY is a doctoral candidate in political science at theUniversity of Massachusetts in Amherst.