south somerset profile · south somerset profile 2016 v5 ... centre faces competition from...
TRANSCRIPT
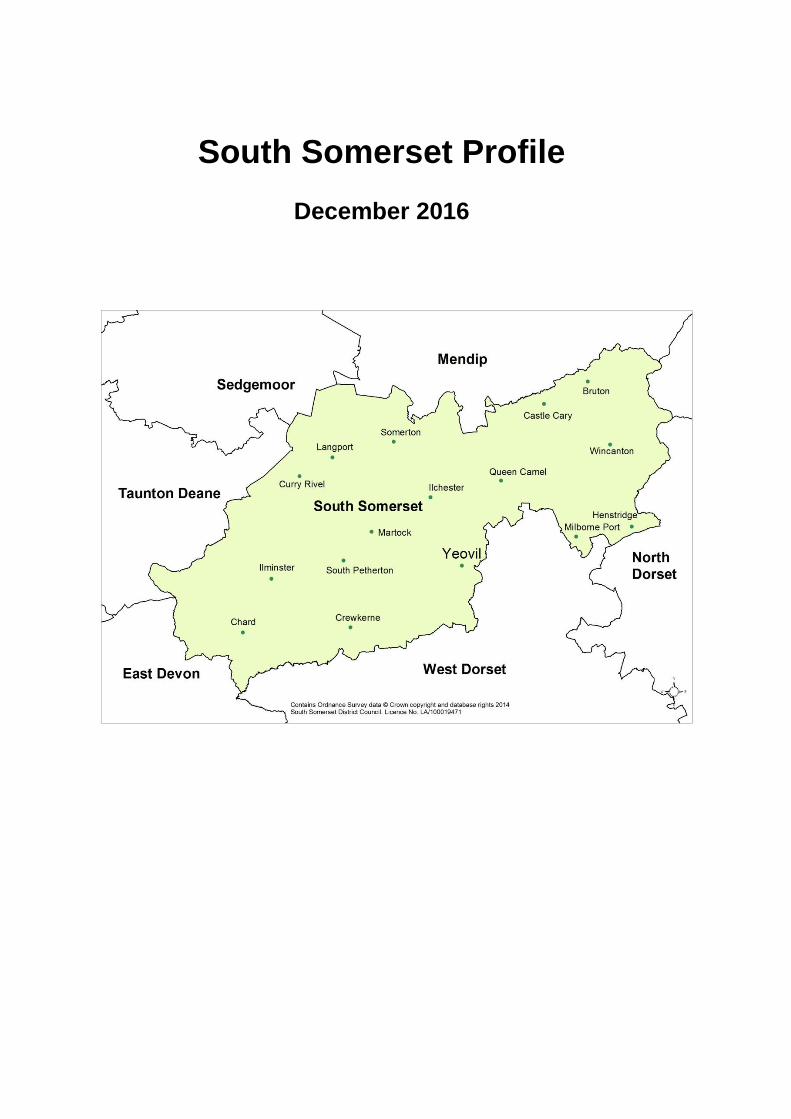
South Somerset Profile
December 2016

South Somerset Profile 2016 V5
SUMMARY OF KEY ISSUES:
Population & Demographics:
South Somerset’s population of 164,982 (2015) is the largest of the five local
authorities in Somerset. Population growth has been consistent, with South
Somerset showing the largest overall increase in population across the
County since 2001. The main cause of population growth in South Somerset
is internal migration from elsewhere in the UK.
South Somerset is an ageing district, with sharp growth in those aged over 60.
This is twinned with recent data showing significant losses in those aged 15 to
29. If this trend is to continue over the long term, the district may face major
challenges in providing a sufficiently large and competitive labour force.
South Somerset has a number of settlements of similar size - reflecting their
historic market town status. This dispersed pattern of people and
development has strengths and weaknesses. Yeovil continues to be the
largest town in South Somerset. However, the largest population growth
between 2001 and 2011 took place in Ilminster.
Housing & Households:
Between 2001 and 2011 South Somerset has delivered more dwellings than
any other local authority in the county (7,263 dwellings). Most of the main
settlements saw an approximate 10% increase in the number of dwellings
over the period 2001 to 2011.
Latest projections for future household numbers show that South Somerset
will need to provide for the second highest amount in Somerset, after
Sedgemoor.
The affordability of an average house in South Somerset is around 7.5 times
the average income. Affordable housing need in South Somerset remains
high. With approximately 25% of all need in the county arising from the
district.
Economy:
South Somerset’s Functional Economic Area extends along the A303 corridor.

South Somerset Profile 2016 V5
Total number of jobs in South Somerset (which includes self-employed,
government-supported trainees and HM Forces) was 82,000 in 2015. The
‘Public administration, education and health sector’ is the largest employer in
South Somerset. Although the ‘manufacturing’ sector is a significant
employer. In 2015, Manufacturing generated £785 million to the South
Somerset economy. This sector’s economic value has grown by over 25%
since 2001.
The number of enterprises in South Somerset has grown since 2010, but only
steadily. The agricultural sector has the largest number of enterprises.
Manufacturing, whilst the most valuable sector to the economy only has the
third highest number of enterprises. In 2015, 98% of all businesses employed
fewer than 50 employees. This Shows South Somerset’s reliance on Small &
Medium Enterprises (SMEs).
Economic activity rates are at their highest recorded levels. In 2015, 85,600
people were economically active, which represents 84% of the population.
Gross weekly wages for both males and females are lower than the national
and regional average. The number of claimants in South Somerset is at the
lowest level since 2001.
Retail:
The future of the high street remains uncertain. With challenging conditions
for both local and national retailers.
Yeovil remains most important retail centre within the district. But the town
centre faces competition from out-of-town retail estates and adjacent retail
estates including in West Dorset.
Vacancy rates in Yeovil town centre have increased since 2006 and
recessionary impacts have been felt within the town centre and Primary
Shopping Area.
Future plans for the regeneration of Yeovil Town Centre are integral to the
Council’s “Investing in Infrastructure” programme. Further investment in the
town centre needs to be co-ordinated to ensure the town remains its vitality.

South Somerset Profile 2016 V5
For more information please also see the source of the above: South Somerset
Authority Monitoring Report September 2016 available here:
https://www.southsomerset.gov.uk/authority_monitoring_report

South Somerset Profile 2016 V5
Contents 1. Introduction ..................................................................................................................... 7
2. Place ................................................................................................................................ 8
2.1 Location and Geography ............................................................................................................... 8
2.2 Transport ....................................................................................................................................... 8
Table 1: Licensed vehicles by body type 2015¹ ............................................................................... 9
2.3 Housing ......................................................................................................................................... 9
Table 2: Proportion (%) of dwellings in each council tax band by area (June 2016)³ ..................... 9
Table 3: SSDC Number of dwellings by type (June 2016)³ ............................................................ 10
Table 4: Average residential property prices (quarterly rolling year Q1 2016)⁴ ........................... 10
Chart 1: Number of residential property sales by District (2015/16)⁴ .......................................... 11
2.4 Households.................................................................................................................................. 11
2.5 Environment ................................................................................................................................ 12
Table 5: Average Domestic Electricity Consumption per household (2014)⁶ ............................... 12
Map 1: Estimated proportion of households in fuel poverty (based on Low income high costs
indicator)⁷ ...................................................................................................................................... 13
Table 6: Fuel Poverty Levels 2014 as published in June 20166 ..................................................... 14
3. People ............................................................................................................................ 15
3.1 Population ................................................................................................................................... 15
Table 7: Total Resident Population (2015)⁸ .................................................................................. 15
Table 8: Proportion (%) of the population by age range⁸ ............................................................. 15
Chart 2: Proportion (%) of the population by age range8 ............................................................. 16
3.2 Population Projections ................................................................................................................ 17
Chart 3: 2015-2039 South Somerset Population Projections (based on 2014 predictions)⁸ ........ 17
3.3 Migration ..................................................................................................................................... 18
Chart 4: Trends in Net Flow of migrants into and out of Somerset9 ............................................ 18
Table 9: Internal migration flows for each District within Somerset year ending June 2015
(released June 2016)¹⁰ .................................................................................................................. 19
Chart 5: Migration inflow and outflow for South Somerset by age range from UK areas year
ending June 2015¹⁰ ........................................................................................................................ 19
Table 10: Internal migration flows for each District within Somerset June 2015¹⁰ ...................... 20
3.4 Ethnicity ...................................................................................................................................... 21
3.5 Deprivation ................................................................................................................................. 21
Map 2: Index of Multiple Deprivation (IMD) 2015 in Yeovil¹² ....................................................... 22
Table 11: Somerset District IMD 2015 rankings¹² ......................................................................... 22

South Somerset Profile 2016 V5
Table 12.1 South Somerset LSOAs within the most deprived 20% in England¹²........................... 23
Table 12.2 South Somerset LSOAs within the least deprived 20% in England¹² ........................... 23
3.7 Crime ........................................................................................................................................... 25
Table 13: Trends in Crime for England and Wales¹³ ...................................................................... 25
Chart 6: Rolling year crime statistics¹³ .......................................................................................... 25
Chart 7: Crime & ASB Breakdown for South Somerset District Council Nov 2015 – Oct 2016¹⁴ .. 26
Table 14: Breakdown of crime & ASB by type in 2015/16¹⁴ ......................................................... 26
3.8 Health Overview.......................................................................................................................... 27
Chart 8: Personal Well-being by Somerset District, 2015/16¹⁶ ..................................................... 28
4. Economy ........................................................................................................................ 29
4.1 People in Employment¹⁷ .............................................................................................................. 29
Table 13: Gross Weekly Income (2016)¹⁸ ...................................................................................... 29
Table 14: Businesses by industry 2015 (released October 2016)¹⁸ ............................................... 30
4.2 Unemployment ........................................................................................................................... 31
4.3 Skills and Qualifications .............................................................................................................. 31
Chart 9: Qualifications of people aged 16 to 64 (Jan 2015-Dec 2015)¹⁸ ....................................... 31
4.4 Business and Enterprise .............................................................................................................. 32
Table 15: Business by size of employment 2015 (released October 2016)¹⁹ ................................ 32
Table 16: Total Businesses 2014²⁰ ................................................................................................ 33
4.5 Tourism ....................................................................................................................................... 34
Chart 10: Breakdown of tourism expenditure21 ........................................................................... 34
5. South Somerset Parish and Ward Profiles. ................................................................. 35
Sources of evidence ......................................................................................................... 36

South Somerset Profile 2016 V5
1. Introduction
The South Somerset Community Profile has been collated to provide an overview of
the communities that live here. The purpose of the profile is to provide a
comprehensive and up to date picture of the district that will support strategic
thinking and decision making.
The South Somerset profile will be reviewed on an annual basis and is due to be
reviewed in December 2017. This profile has been produced by the Performance
Service, if you have any queries or suggestions for this profile please contact the
Performance Officer Anna-Maria Lenz [email protected].

South Somerset Profile 2016 V5
2. Place
2.1 Location and Geography
South Somerset is situated on the eastern side of the County of Somerset. It covers
an area of 370 (958 km2) square miles and has an estimated population of 165,000.
South Somerset has both rural areas and a network of market towns. The rural
nature of the area is emphasised by the low population density of 1.7 persons per
hectare (the England average is 4.1).
2.2 Transport The main roads in South Somerset are the A30, A37 and the A303. London is
accessible via the A303 and can be reached in about 3 hours by car.
The county of Somerset is strategically well positioned between Bristol and the
South West peninsula. The M5 and A303 trunk routes pass through the county, as
do the main railways linking the peninsula to London and to Wales, the Midlands and
the rest of England. Compared with the South West and England generally,
Somerset also has a relatively high proportion of its roads in rural areas (88%).
The 2011 Census highlights that the levels of car ownership reflect the rural nature
of the district. In 2011 85.4% of households owned at least one vehicle, nationally
the figure was 74.3%, The average number of cars per household was 1.43 which
compared against the England and Wales average of 1.17 and 43.4% of households
have more than one vehicle again above the national average of 32%1.
In 2015 there have been 120,500 Licensed vehicles in South Somerset, the average
number per cars per household was 1.67 which is an increase compared to the 2011
average of 1.43.

South Somerset Profile 2016 V5
Table 1: Licensed vehicles by body type 2015¹
Figures in thousands
Region/Local Authority
Cars Motor cycles
Light goods
Heavy goods
Buses and
coaches
Other vehicles
Total
United Kingdom 31,170.7 1,253.1 3,736.0 506.2 168.2 736.3 37,570.6
Great Britain 30,250.3 1,230.8 3,633.6 483.4 162.7 706.8 36,467.5
England 25,732.6 1,093.1 3,107.4 418.3 136.4 564.2 31,052.0
South West 3,025.10 150 441.1 46.3 18.9 95 3,776.40
Somerset 303.4 16.1 43.2 6.0 1.5 15.0 385.2
Mendip 62.6 3.0 9.6 1.5 0.3 3.0 80.1
Sedgemoor 65.7 3.7 9.5 1.6 0.2 2.8 83.6
South Somerset 95.2 5.1 13.0 1.7 0.4 5.1 120.5
Taunton Deane 60.5 3.2 7.9 1.0 0.4 2.4 75.5
West Somerset 19.3 0.9 3.1 0.2 0.1 1.6 25.3
2.3 Housing
There are estimated to be 72,100 households² in South Somerset (75,260
dwellings).
South Somerset has the lowest proportion of houses in the cheapest tax band (Band
A); 13.54% of the dwellings in South Somerset are in band A, which is below the
Somerset average of 16.15%. South Somerset has the highest proportion in
Somerset of band E properties at 12.10% see table 2 on the following page for more
details.
Table 2: Proportion (%) of dwellings in each council tax band by area (June 2016)³
A B C D E F G H Total
Somerset 16.15 27.23 21.56 14.84 11.01 6.08 2.93 0.20 247,970
South Somerset
13.54 29.72 21.30 14.48 12.10 6.19 2.44 0.23 75,260
Mendip 13.76 26.16 24.25 14.73 11.09 6.17 3.60 0.26 50,230
Sedgemoor 23.99 22.97 21.34 14.69 9.41 4.90 2.59 0.11 53,240
Taunton Deane 14.34 30.77 19.61 14.16 11.26 6.67 3.01 0.19 51,410
West Somerset 15.76 22.21 21.42 19.01 10.26 7.23 3.81 0.28 17,830
The majority of houses or bungalows in South Somerset (27,750) are detached and
account for 36.58% of the properties in South Somerset.

South Somerset Profile 2016 V5
Table 3: SSDC Number of dwellings by type (June 2016)³
South Somerset Property type B
un
galo
w
Fla
t/
Ma
iso
nett
e
Ho
us
e :
Terr
ace
d
Ho
us
e :
Se
mi-
deta
ch
ed
Ho
us
e :
De
tac
he
d
An
ne
xe
Oth
er7
Un
kn
ow
n8
All
pro
pe
rtie
s
10,850 8,260 19,470 17,120 16,900 280 630 2,350 75,860
14.30% 10.89% 25.67% 22.57% 22.28% 0.37% 0.83% 3.10% 100.00% *7Property type "Other" includes mobile homes and caravans.
*8Property type "Unknown" includes properties whose details are not recorded/not known.
House prices in South Somerset are ranging from average flat prices of £97,205 to
detached properties averaging at £292,125. If compared to the average property
prices in 2011, the price of Terraced properties, Semi-detached properties and the
overall average property price have increased in all of the Somerset Districts.
Table 4: Average residential property prices (quarterly rolling year Q1 2016)⁴
Flat Terraced Semi-
detached
Detached Overall
Average
South Somerset £97,205 £163,396 £184,720 £292,125 £201,995
Mendip £132,198 £194,460 £220,080 £326,532 £232,035
Sedgemoor £101,025 £158,202 £187,341 £250,746 £196,816
Taunton Deane £117,478 £168,845 £196,875 £273,370 £211,436
West Somerset £106,167 £169,795 £209,900 £286,700 £213,900
South Somerset had the highest number of existing properties sold within the
County, a total of 1862 existing properties and 289 new properties have been sold in
2015/16. West Somerset had the lowest number of properties sold with 632 existing
and 31 new properties sold in 2015/16.

South Somerset Profile 2016 V5
Chart 1: Number of residential property sales by District (2015/16)⁴
2.4 Households
The size and structure of households within South Somerset will have implications
for planning, housing demand, facilities and entitlement to benefits. The 2011 census
described the average household size in the district as follows:
- Average household size of 2.3 residents, the same as the Somerset average.
- Main composition for South Somerset is a one person household accounting
for 29.5%.
- The percentage of households with residents aged 65 and over accounts for
26.8% of all households.
- Only 24.2% of households in South Somerset have dependent children living
in them, this is very close to the Somerset figure of 24.6% but below the
England figure of 29% of households.
- The proportion of lone parent households in South Somerset is 7.8%, lower
than both the Somerset figure of 8.4% and the national figure of 10.65%.
31
536
284
227
289
632
1784
1874
1823
2862
0 500 1000 1500 2000 2500 3000 3500
West Somerset
Taunton Deane
Sedgemoor
Mendip
South Somerset
Number of property sales
Dis
tric
t
Property Sales 2015/16
Existing Properties New Properties
South Somerset Profile 2016 V5
2.5 Environment
In 2015 the Somerset Rivers Authority was established to ensure issues associated
with flooding are addressed. This has partially been driven due to the severe flooding
of areas which are on or just above sea-level, as a result of extreme weather in
2014. As part of a twenty year plan the Somerset Levels and Moors Flood Action
Plan was produced by a partnership of organisations⁵.
South Somerset has over 1,000 miles of paths and tracks that help attract tourism,
particularly people who love rambling and walking. The diverse landscape includes
wooded hills and valleys and the Somerset Levels and Moors - one of the lowest and
flattest places in the UK and an important habitat.
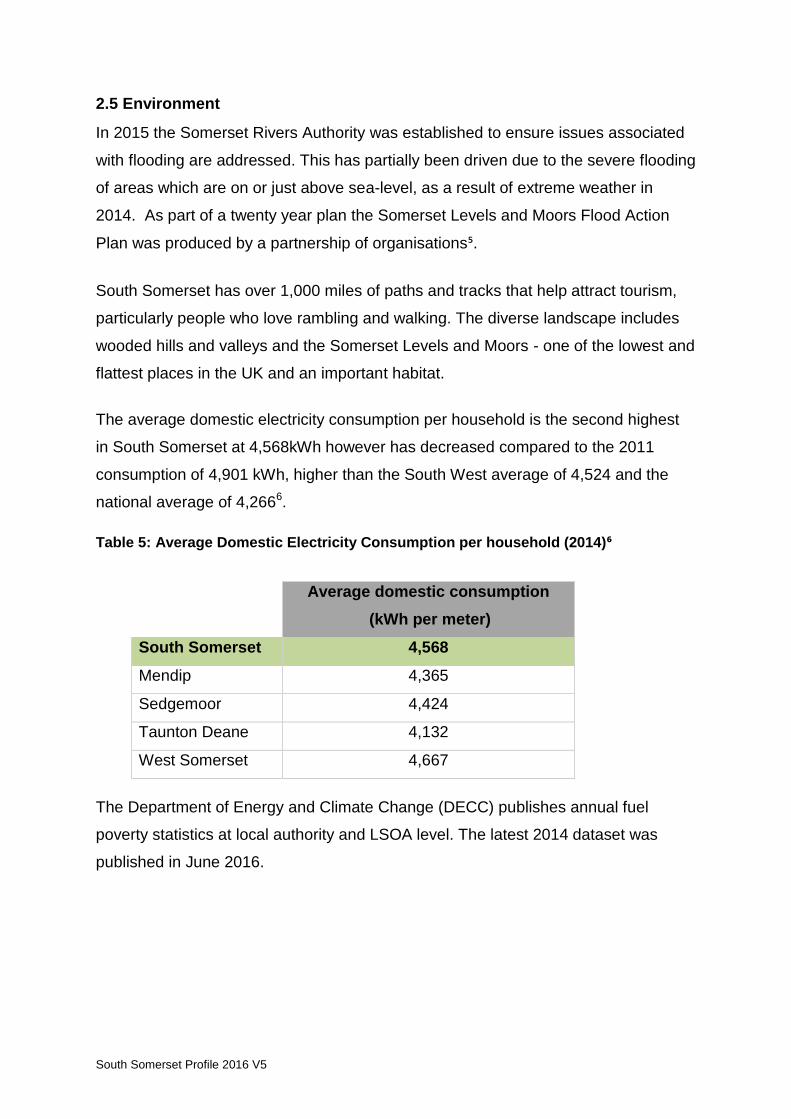
The average domestic electricity consumption per household is the second highest
in South Somerset at 4,568kWh however has decreased compared to the 2011
consumption of 4,901 kWh, higher than the South West average of 4,524 and the
national average of 4,2666.
Table 5: Average Domestic Electricity Consumption per household (2014)⁶
Average domestic consumption
(kWh per meter)
South Somerset 4,568
Mendip 4,365
Sedgemoor 4,424
Taunton Deane 4,132
West Somerset 4,667
The Department of Energy and Climate Change (DECC) publishes annual fuel
poverty statistics at local authority and LSOA level. The latest 2014 dataset was
published in June 2016.
South Somerset Profile 2016 V5
A household is said to be in fuel poverty if it needs to spend more than 10% of its
income on fuel to maintain an adequate level of warmth (usually defined as 21
degrees for the main living area, and 18 degrees for other occupied rooms). The
above formula means that the key elements in determining whether a household is
‘fuel poor’ are:
- Income
- Fuel prices
- Consumption (dependent on the lifestyle of the household and the energy efficiency
of the dwelling)
- Poor energy efficiency of a home, e.g. through low levels of insulation and old or
inefficient heating systems
- Under-occupancy: according to UK government statistics, on average those in the
most extreme fuel poverty live in larger than average homes
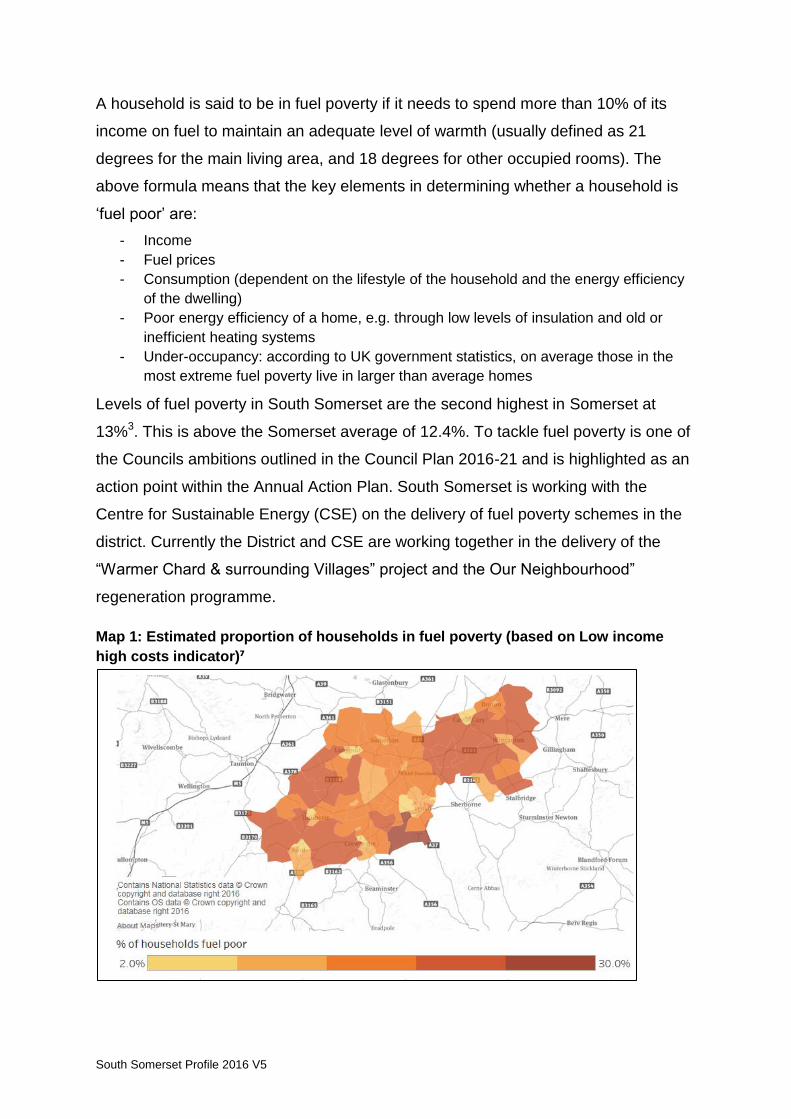
Levels of fuel poverty in South Somerset are the second highest in Somerset at
13%3. This is above the Somerset average of 12.4%. To tackle fuel poverty is one of
the Councils ambitions outlined in the Council Plan 2016-21 and is highlighted as an
action point within the Annual Action Plan. South Somerset is working with the
Centre for Sustainable Energy (CSE) on the delivery of fuel poverty schemes in the
district. Currently the District and CSE are working together in the delivery of the
“Warmer Chard & surrounding Villages” project and the Our Neighbourhood”
regeneration programme.
Map 1: Estimated proportion of households in fuel poverty (based on Low income
high costs indicator)⁷

South Somerset Profile 2016 V5
Four of the top ten ‘fuel poor’ LSOAs in Somerset, in 2014 were in South Somerset.
This includes Hardington Mandeville, Barrington and Kingsbury Episcopi, Cricket St
Thomas and East Chinnock and Chiselborough. These LSOAs had ratings between
23.7% and 24.8% fuel poor households.
For the second consecutive year the proportion of fuel poor households has
increased in Somerset; from 9.2% in 2012 to 11.2% in 2013 and 12.4% in 2014. At
District level, West Somerset (14.5%) has the highest proportion of households living
in fuel poverty whilst Taunton Deane has the lowest proportion with only 11.3%
much closer to the national proportion of 10.6%.
Fuel poverty in rural areas is often higher than in urban areas as this relates to the
make-up of the rural population which tends to live in larger, older and less energy
efficient properties. This is paired with issues in relation to income and lifestyle as for
example, lower income levels in South Somerset then the national average. The
district also has a high proportion of older residents who are likely to spend more of
their time in their homes.
Table 6: Fuel Poverty Levels 2014 as published in June 20166
Fuel poor number
of households
Fuel poor % of
households
Somerset 29,663 12.4%
South Somerset 9,487 13%
Mendip 6,034 12.4%
Sedgemoor 6,174 12%
Taunton Deane 5580 11.3%
West Somerset 2388 14.5%

South Somerset Profile 2016 V5
3. People
3.1 Population
The 2015 mid-year estimates published in June 2016 estimated the population of
South Somerset to be 165,000. The 45-74s account for 40.7% of the South
Somerset population this compares against 41.54% across Somerset.
Table 7: Total Resident Population (2015)⁸
South
Somerset
South
West
Great Britain
All People 165,000 5,471,200 63,258,400
Males 81,000 2,688,100 31,165,300
Females 84,000 2,783,100 32,093,100
Table 8: Proportion (%) of the population by age range⁸ (Mid-2015 Middle Layer Super Output Area population estimates) as at 26 October 2016
Age
0-4
Age
5-9
Age
10-15
Age
16-24
Age
25-44
Age
45-64
Age
65-74
Age
75 &
over
SOMERSET % 5.27 5.44 6.30 9.38 20.75 28.19 13.35 11.31
South Somerset % 5.40 5.66 6.48 9.17 21.56 27.57 13.13 11.03
Mendip % 5.32 5.68 7.00 9.83 21.16 28.97 12.13 9.91
Sedgemoor % 5.69 5.74 6.55 9.87 21.70 28.12 12.37 9.96
Taunton Deane % 5.75 5.73 6.50 9.60 23.23 27.08 11.54 10.57
West Somerset % 4.19 4.41 4.98 8.41 16.12 29.21 17.61 15.07
Notes: % is a proportion of total population)

South Somerset Profile 2016 V5
Without a university, limited employment prospects and high house prices relative to
income a large proportion of the younger adults are choosing to relocate outside of
the county.
Chart 2: Proportion (%) of the population by age range8
0
10
20
30
40
50
60
70
80
90
100
Somerset Mendip Sedgemoor SouthSomerset
TauntonDeane
WestSomerset
Age 75 &overAge 65-74
Age 45-64
Age 25-44
Age 16-24
Age 10-15
Age5-9
South Somerset Profile 2016 V5
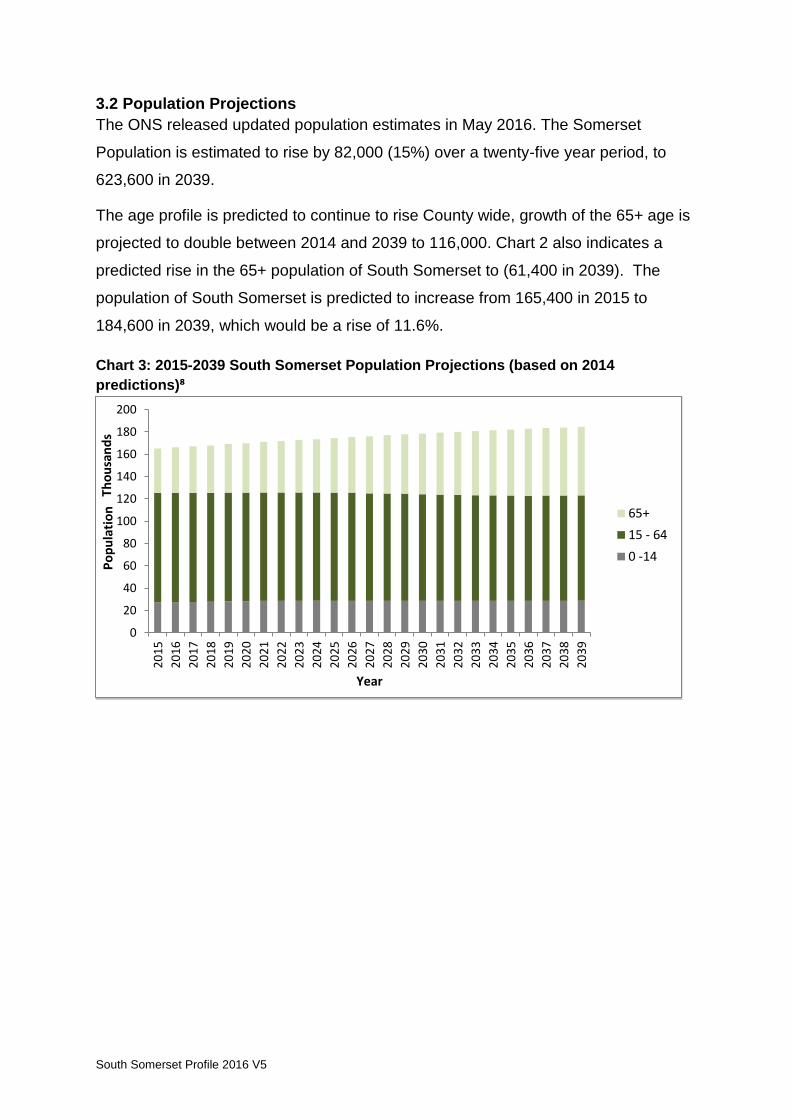
3.2 Population Projections
The ONS released updated population estimates in May 2016. The Somerset
Population is estimated to rise by 82,000 (15%) over a twenty-five year period, to
623,600 in 2039.
The age profile is predicted to continue to rise County wide, growth of the 65+ age is
projected to double between 2014 and 2039 to 116,000. Chart 2 also indicates a
predicted rise in the 65+ population of South Somerset to (61,400 in 2039). The
population of South Somerset is predicted to increase from 165,400 in 2015 to
184,600 in 2039, which would be a rise of 11.6%.
Chart 3: 2015-2039 South Somerset Population Projections (based on 2014
predictions)⁸
0
20
40
60
80
100
120
140
160
180
200
20
15
20
16
20
17
20
18
20
19
20
20
20
21
20
22
20
23
20
24
20
25
20
26
20
27
20
28
20
29
20
30
20
31
20
32
20
33
20
34
20
35
20
36
20
37
20
38
20
39
Po
pu
lati
on
Th
ou
san
ds
Year
65+
15 - 64
0 -14

South Somerset Profile 2016 V5
3.3 Migration
In the year ending June 2015, there were an estimated 40,000 people moving within
the UK into or out of Somerset, Chart 6 outlines the net flow of migrant into Somerset
from other parts of the UK.
The net flow into Somerset (the number coming in, less the number going out) from
other parts of England and Wales increased from 1,630 in 2008-09 and 2009-10 to
3305 in 2014-15. In this period, each of the five Somerset districts experienced a net
flow into their borders with Taunton Deane having the highest net flow at just over
1,100. This accounts for 33% of the inflow in Somerset.
Chart 4: Trends in Net Flow of migrants into and out of Somerset9

South Somerset Profile 2016 V5
Table 9: Internal migration flows for each District within Somerset year ending June
2015 (released June 2016)¹⁰
So
uth
So
me
rse
t
Me
nd
ip
Se
dge
mo
or
Tau
nto
n
Dea
ne
We
st
So
me
rset
Flow IN 7570 6280 5660 6090 2120
Flow OUT 7190 5540 4900 4980 1810
Net flow IN 380 740 760 1110 310
The migration of population into South Somerset from other parts of the UK show
that in 2015, there were 380 more people moving into the area than out. However,
South Somerset and West Somerset have had a less consistent inflow of migrants
than the other Districts within the County.
Chart 5: Migration inflow and outflow for South Somerset by age range from UK areas
year ending June 2015¹⁰
In South Somerset, there is a consistent net flow out amongst 15-24 year-olds. This
has increased further from 2011/12 outturn of 400 to 510 in June 2015. The table
below highlights that the majority of the outflow is generated by 15-44 year old which
account for 54.25% of the total outflow.
1290 1270
2340
1680
990 1120
1780
2120
1240
930
180
-510
230 430
60
-550
-50
450
950
1450
1950
2450
2950
0-14 15-24 15-44 15-64 65+
Ind
ivid
ua
ls
Age Range
Inflow
Outflow
Net

South Somerset Profile 2016 V5
Table 10: Internal migration flows for each District within Somerset June 2015¹⁰
0-14 15-24 25-44 45-64 65+ Total
South Somerset
Inflow 1,290 1,270 2,340 1,680 990 7570
% 17.04 16.78 30.91 22.19 13.08 100.00
Outflow 1,120 1,780 2,120 1,240 930 7,190
% 15.58 24.76 29.49 17.25 12.93 100.00
Mendip
Inflow 1,050 1,150 2,018 1,310 690 6,218
% 16.89 18.49 32.45 21.07 11.10 100.00
Outflow 640 1,640 1,640 1,060 560 5,540
% 11.55 29.60 29.60 19.13 10.11 100.00
Sedgemoor
Inflow 950 940 1,760 1,280 730 5,660
% 16.78 16.61 31.10 22.61 12.90 100.00
Outflow 700 1,220 1,460 970 550 4,900
% 14.29 24.90 29.80 19.80 11.22 100.00
Taunton Deane
Inflow 940 1,140 2,090 1,110 810 6,090
% 15.44 18.72 34.32 18.23 13.30 100.00
Outflow 660 1,450 1,700 790 380 4,980
% 13.25 29.12 34.14 15.86 7.63 100.00
West Somerset
Inflow 280 380 440 620 400 2,120
% 13 18 21 29 19 100
Outflow 250 430 540 330 260 1,810
% 14 24 30 18 14 100
The outflow of 15-24s is driven largely by the 18-20 age group in particular. This is
believed to be due to there being no university in the county. Areas in the South
West with universities - Bristol, Bournemouth, Plymouth and Bath & NE Somerset -
have a net inflow of young people.

South Somerset Profile 2016 V5
3.4 Ethnicity
From the 2014 mid-year estimates South Somerset’s population is predominantly
from a white British background accounting for 94.96% of residents and 5.04% of the
district’s population is from an ethnic background, this is a small increase on the
2011 census figure of 1.9%. This figure is low compared to the national figure,
however, is in line with the rest of Somerset, where the average is 5.36%¹¹.
Of those not white British in South Somerset, 2.6% are white other, 1.89% are Black
and Minority Ethnic, 0.34% are white Irish and less than 1% are White Gypsy or Irish
Traveller.
94% of the population in South Somerset are born within the UK and 6% were born
outside the UK, this matches the Somerset Average.
Christianity is the largest religion practiced in South Somerset at 65.9%, 25.2% of
residents indicated that they followed no religion, 1.2& stated that they followed a
non-Christian religion and 7.7% chose not to state a religion¹¹.
3.5 Deprivation
The Index of Multiple Deprivation (IMD) is based upon 37 indicators across seven
domains of deprivation which include:
Income
Employment
Health and Disability
Education Skills and Training
Barriers to Housing and Services
Living Environment
Crime
The above are weighted and combined to create the overall IMD.
Somerset is better than the national average in regard to overall deprivation, there
has been a slight shift towards a greater level of deprivation in Somerset relative to
the rest of England. Overall, the health of people in South Somerset is mixed
compared with the England average.

South Somerset Profile 2016 V5
Map 2: Index of Multiple Deprivation (IMD) 2015 in Yeovil¹²
Table 11: Somerset District IMD 2015 rankings¹²
Of the 326 Local authorities with 1, being the most deprived.
IMD Rank
of average
rank
IMD Rank
of average
score
IMD Rank of
proportion of
LSOAs in most
deprived 10%
nationally
IMD
Rank of
extent
IMD Rank of
local
concentration
South Somerset
180 186 175 186 180
Mendip 160 179 181 202 203
Sedgemoor 146 144 139 138 138
Taunton Deane 193 189 138 177 163
West Somerset 56 106 200 190 208
South Somerset is ranked 202nd out of 326 in terms of levels of deprivation in 2010 in
2015 the South Somerset ranked 180th out of 326 it is not possible to make direct
comparisons due changes in the way in which deprivation is captured. The IMD only

South Somerset Profile 2016 V5
provides a relative picture of deprivation meaning that relative to the rest of England
South Somerset has become more deprived then it has been in 2010.
South Somerset has seven LSOAs in the top 20%. The most deprived LSOA in
South Somerset is Yeovil Westfield. At the opposite end of the scale, fourteen
LSOAs in South Somerset are within the least deprived 20% in England. The least
deprived LSOA in South Somerset also falls within the 1% least deprived in England.
Table 12.1 South Somerset LSOAs within the most
deprived 20% in England¹²
LSOA LSOA Overall Rank
Yeovil Westfield 2,659
Yeovil Town Centre 3,220
Yeovil Sherborne Road 3,326
Chard Jocelyn West 4,302
Yeovil Penn Mill North 4,515
Yeovil Birchfield 6,441
Yeovil Summerlands 6,485
Table 12.2 South Somerset LSOAs within the least
deprived 20% in England¹²
LSOA LSOA Overall Rank
Barton St David and Keinton Mandeville
26,301
Chard Jocelyn East 26,533
Milborne Wick 26,987
Misterton 27,017
Broadway 27,192
Crewkerne North 28,042
Curry Rivel South 28,382
Yeovil Fairmead Road 28,755
Chard Crimchard West 29,630
Yeovil Houndstone West 29,670
Yeovil Houndstone North 30,125
Ansford 30,342
Yeovil Buckler's Mead 31,384
Yeovil Sampson's Wood 32,539
3.6 Digital Inclusion
The government published a Digital inclusion strategy in 2014, which outlines the
benefits of access to and use of the internet as well as challenges the public is facing
in the day to day use and how the government will try to address this.

South Somerset Profile 2016 V5
It outlines that:
- 21% of Britain’s population lack the basic digital skills and capabilities
required to realise the benefits of the internet;
- Around a third of small and medium enterprises (SMEs) don’t have a website,
rising to 50% of voluntary, community and social enterprises (VCSEs).
The Somerset Intelligence Partnership developed a ‘heat map’ to identify areas that
are at higher risk of being digitally excluded. Below is a map of the Somerset area
highlighting areas that are at higher risk of deprivation.
The above map highlights that there are communities located in South Somerset that
are at high risk of digital exclusion.
Additional information on digital inclusion is available via the following links:
- Connecting Devon and Somerset
- Digital Inclusion Group for Somerset (DIGS)
- Go ON UK digital skills charity

South Somerset Profile 2016 V5
3.7 Crime
Crime in South Somerset has been steadily decreasing since March 2011, with
6,398 crimes being recorded in 2016 compared to 9,446 in 2011.
Table 13: Trends in Crime for England and Wales¹³
Rolling Year Total no of offences
March 2007 10942
March 2008 9842
March 2009 10283
March 2010 9,344
March 2011 9,446
March 2012 9,345
March 2013 8,487
March 2014 7,318
June 2015 6,482
June 2016 6,398
*Please note that some forces have revised their data and police recorded crime totals may not agree with those previously published in the 2013 South Somerset Profile.
Chart 6: Rolling year crime statistics¹³
0
2000
4000
6000
8000
10000
12000
14000
Total no of offences
Total no of offences

South Somerset Profile 2016 V5
In 2015/16, the most common recorded crime is accounted for by recorded
Antisocial Behaviour incidents (ASB) which account for 28.19%, of the recorded
offences; this is closely followed by the type violent which accounts for 23.61% of the
recorded crime.
Chart 7: Crime & ASB Breakdown for South Somerset District Council Nov 2015 – Oct
2016¹⁴
Table 14: Breakdown of crime & ASB by type in 2015/16¹⁴
Crime/ASB Type Total
Recorded
Percentage
of total
recorded
ASB 2981 28.19
Violent 2497 23.61
CD&A 1143 10.81
Burglary 836 7.91
Shoplifting 827 7.82
Other theft 785 7.42
Public order 676 6.39
Vehicle 396 3.75
Drugs 166 1.57
Other 100 1.04
Bike theft 63 0.60
Robbery 33 0.31
Theft from the person 31 0.29
Weapons 30 0.28

South Somerset Profile 2016 V5
Since 2003, many crime types have seen a reduction in the level of crime as shown in
Chart 5. The Avon and Somerset Police and Crime Commissioner has published a
Police and Crime Plan 2015/2017, this is a statutory requirement by the Police
Reform and Social Responsibility Act 2011. You can access the plan here:
http://www.avonandsomerset-pcc.gov.uk/Document-Library/TERM-ONE/Police-and-
Crime-Plan/PoliceandCrimePlan15/AS-Avon-Somerset-Crime-Plan-2015-web.pdf
Additional information on Community safety can be accessed via SSDC Community
Safety.
3.8 Health Overview
The life expectancy at time of birth for South Somerset residents in 2014, males 80.9
and females 84.40¹⁵, this compares well to the South West life expectancy of 80.2 for
males and 83.2 woman. The national average is a life expectancy of 79.5 years for
males and 83.2 for females⁸.
As part of the Opinions and Lifestyles Survey 2013 the population across Great
Britain was asked what their health had been like in the past 12 months. 79% of
residents said that they were in good or very good health⁸.
In September of 2016 the ONS published details on the Measuring National Well-
being programme which aims to provide insight to peoples quality of life. Questions
related to life satisfaction, worthwhileness things an individual does in life, happiness
and anxiety¹⁶. Results suggest that over-all personal well-being seems to be better
than the national average. South-Somerset residents have indicated the highest
levels of life satisfaction, worthwhile and happiness and least anxiety. See more
details in Chart 8 below.

South Somerset Profile 2016 V5
Chart 8: Personal Well-being by Somerset District, 2015/16¹⁶
From: SIP: Subjective Well-being
Additional information on Health and Wellbeing can be accessed via the following
links:
- County and District Profiles
- Health and Wellbeing strategy
- SSDC Community Health and Leisure

South Somerset Profile 2016 V5
4. Economy
4.1 People in Employment¹⁷
In South Somerset there are 80,500 people in employment between July 2015 and
June 2016, 13.0% of which are self-employed. Of the residents in employment,
67.2% work full time, between 31 and 49 hours per week. Part time workers account
for the remaining 32.80%¹⁷
The average gross weekly earnings of those working in South Somerset is lower
than the South West and the Great Britain average, with the weekly earnings for full
time workers of £478.20 in 2016. This compares against a gross national weekly pay
of £541.00. Male full time workers earn more per week at £501.70 than females at
£433.00. The gap between male and female income is consistent across Somerset,
In Somerset. Taunton Deane residents have the highest gross weekly income and
Sedgemoor residents have the lowest weekly income at £465.9 (see table below for
more details).
Table 13: Gross Weekly Income (2016)¹⁸
All Full Time
Workers
Male Full Time
Workers
Female Full Time
Workers
South Somerset £478.20 £501.7 £433.0
Taunton Deane £506.5 £559.6 £435.6
Sedgemoor £465.9 £540.0 £372.2
West Somerset Sample size too small for a reliable estimate.
Mendip £499.7 £598.6 £396.8

South Somerset Profile 2016 V5
Table 14: Businesses by industry 2015 (released October 2016)¹⁸
Industry
SO
ME
RS
ET
To
tal
So
uth
So
me
rse
t %
Me
nd
ip
%
Se
dg
em
oo
r
%
Tau
nto
n
Dea
ne %
We
st
So
me
rse
t %
Agriculture; forestry and fishing 3,765 16.4 13.9 14.3 14.3 29.4
Production 1,610 7.3 7.7 7.4 5.4 4.3
Construction 3,005 12.8 13.6 13.5 12.4 8.3
Motor trades 875 3.9 3.2 3.9 4.1 2.9
Wholesale 860 3.7 3.4 3.8 4.1 2.6
Retail 1,685 6.9 7.1 6.9 7.3 8.6
Transport & Storage (including postal) 650 2.3 3.2 3.6 2.3 2.0
Accommodation and food service
activities 1,460 5.5 6.0 7.3 5.3 8.9
Information and communication 1,125 5.1 5.9 3.9 4.6 2.6
Financial and insurance activities 350 1.3 1.2 1.7 2.1 0.9
Property 725 2.8 3.2 3.1 3.8 2.0
Professional, scientific and technical
activities 3,195 13.8 14.1 13.2 14.3 9.7
Business Administration & support
services 1,560 6.5 6.7 6.8 6.6 6.3
Public administration and defence 160 0.7 0.6 0.7 0.6 0.9
Education 370 1.6 1.6 1.7 1.5 1.1
Health 810 3.5 2.8 2.9 5.0 2.6
Arts, recreation & other services 1,410 5.9 5.9 5.5 6.3 7.1

South Somerset Profile 2016 V5
4.2 Unemployment
The labour market in South Somerset is good with low levels of unemployment and
good qualification levels. However, it is important to note that the ageing population
of South Somerset will have an impact on the labour market as there will be a
reduction in those who are economically active.
The proportion of the working age population who are unemployed in South
Somerset is very low. In South Somerset, 0.8% (as a proportion of resident
population of area aged 16-64 and) of people were claiming out-of-work benefits in
2016, compared with 1.2% in the South West and 1.8% nationally¹⁸.
4.3 Skills and Qualifications
In South Somerset, the majority of residents, 36%, with qualifications hold a level 4
or above qualification, an increase from the 2011 figure of 25.1%.
Chart 9: Qualifications of people aged 16 to 64 (Jan 2015-Dec 2015)¹⁸
Qualification Key:
Level Includes
Level 1 fewer than 5 GCSEs at grades A-C, Foundation Diploma
Level 2 5 or more GCSEs at grades A-C, Higher Diploma
Level 3 AS/A Level, Advance Diploma
Level 4 and above Professional Diplomas, Degree, Honours, Masters, Doctoral.
0
50
100
150
200
250
300
Mendip Sedgemoor SouthSomerset
TaontonDeane
WestSomerset
Other Qualifications
NVQ4 And Above
NVQ3 And Above
NVQ2 And Above
NVQ1 And Above
No Qualifications

South Somerset Profile 2016 V5
4.4 Business and Enterprise
South Somerset has a high number of micro and small businesses with 89.74%
employing less than 9 members of staff. South Somerset is just above the Somerset
figure of 89.52% and the South West figure of 88.71% (see Table 15 for more
details). When compared to the other authorities in Somerset, South Somerset has
the highest total number of businesses at 7,070, accounting for nearly a third of all
businesses in Somerset (29.94%).
Table 15: Business by size of employment 2015 (released October 2016)¹⁹
Employment size
0-4
(%)
5-9
(%)
10-19
(%)
20-49
(%)
50-99
(%)
100-
249
(%)
250-
499
(%)
TOTAL
number
UNITED
KINGDOM 76.31 12.42 6.10 3.20 1.01 0.58 0.38 2,449,415
SOUTH WEST 75.63 13.08 6.26 3.27 0.94 0.50 0.31 220,825
Somerset County 76.46 13.06 5.78 3.18 0.89 0.42 0.21 23,615
South Somerset 77.51 12.23 5.37 3.18 0.99 0.50 0.21 7,070
Mendip 75.81 13.09 6.77 2.80 0.81 0.54 0.18 5,540
Sedgemoor 76.24 13.83 5.39 3.17 0.95 0.32 0.11 4,735
Taunton Deane 75.33 13.16 5.97 3.87 0.88 0.33 0.44 4,520
West Somerset 77.71 14.00 4.86 2.57 0.57 0.29 0.00 1,750
South Somerset has a business density of 41 per 1000 population, this compares
against 42 (per 1000 population) across Somerset and 36 (per 1000 population)
across the UK. West Somerset has the highest business density with 49 businesses
per 1000 population, Taunton Deane has the lowest business density (39 per 1000).

South Somerset Profile 2016 V5
Table 16: Total Businesses 2014²⁰
Total
businesses
2014
Business
density (per
1000 population)
Change 2008-2014
Number of
businesses
% of
businesses
United
Kingdom 2,263,650 36 102,095 4.7%
Somerset 22,370 42 -560 -2.4%
South
Somerset 6,680 41 -180 -2.6%
Mendip 5,210 48 -65 -1.2%
Sedgemoor 4,530 40 -25 -0.5%
Taunton Deane 4,265 39 -155 -3.5%
West Somerset 1,685 49 -135 -7.4%

South Somerset Profile 2016 V5
4.5 Tourism
The South West Tourism data for 2015 demonstrates the high numbers of tourists
that South Somerset attracts and the benefits to the economy:
2,851,000 day trips to South Somerset16
£103,033,000 spent in South Somerset by day visitors16
1,053,000 visitors staying in South Somerset16
£51,004,000 spent by visitors staying in South Somerset16
4% of employment is supported by tourism (estimated 2,373 full time jobs)16
Chart 10: Breakdown of tourism expenditure21
Accommodation
Shopping Food and drinkAttractions/
entertainmentTravel
Day visitors £0 £37,657,000 £41,118,000 £12,483,000 £11,775,000
Overseas staying £2,550,000 £2,504,000 £2,089,000 £1,002,000 £948,000
UK staying £14,077,000 £5,457,000 £9,858,000 £4,730,000 £7,788,000
£0
£10,000,000
£20,000,000
£30,000,000
£40,000,000
£50,000,000
£60,000,000
Tourism Expenditure

South Somerset Profile 2016 V5
5. South Somerset Parish and Ward Profiles.
Up to date Parish and Ward Profiles can be viewed by visiting the Somerset
Intelligence Website here: http://www.somersetintelligence.org.uk/community-
profiles.html. Data contained within these profiles include:
Age & Ethnicity
Crime & Mortality
School information
Housing
Qualifications and Adult Social Care Services
Country of Birth & Religion
Language, Health & Car access
Industry
Deprivation

South Somerset Profile 2016 V5
Sources of evidence
1 Office National Statistics: Department for Transport
2 Somerset Intelligence Partnership: household-estimates-and-projections
3 Gov.uk: Valuation Office Agency
4 Office National Statistics: Housing
5 Somerset Intelligence Partnership: Environment
6 Office National Statistics: Department of Energy & Climate Change
7 Somerset Intelligence Partnership: Fuel Poverty
8 Office National Statistics: Population and migration
9 Somerset Intelligence Partnership: Migration
10 Office National Statistics: Migration
11 Somerset Intelligence Partnership: South Somerset Profile
12 Somerset Intelligence Partnership : Index of Multiple Deprivation
13 Office National Statistics: Recorded Crime
14 UK Crime statistics
15 Somerset Intelligence Partnership: Life expectancy
16 Somerset Intelligence Partnership: Subjective Well-being
17 NOMIS local Authority Profile
18 Office National Statistics Employment and labour market
19 Office National Statistics Business, industry and trade
20 Somerset Intelligence Partnership: Business Profile
21 Produced on behalf of Somerset County Council by The South West Research
Company Ltd