south jersey/patco presentation
TRANSCRIPT
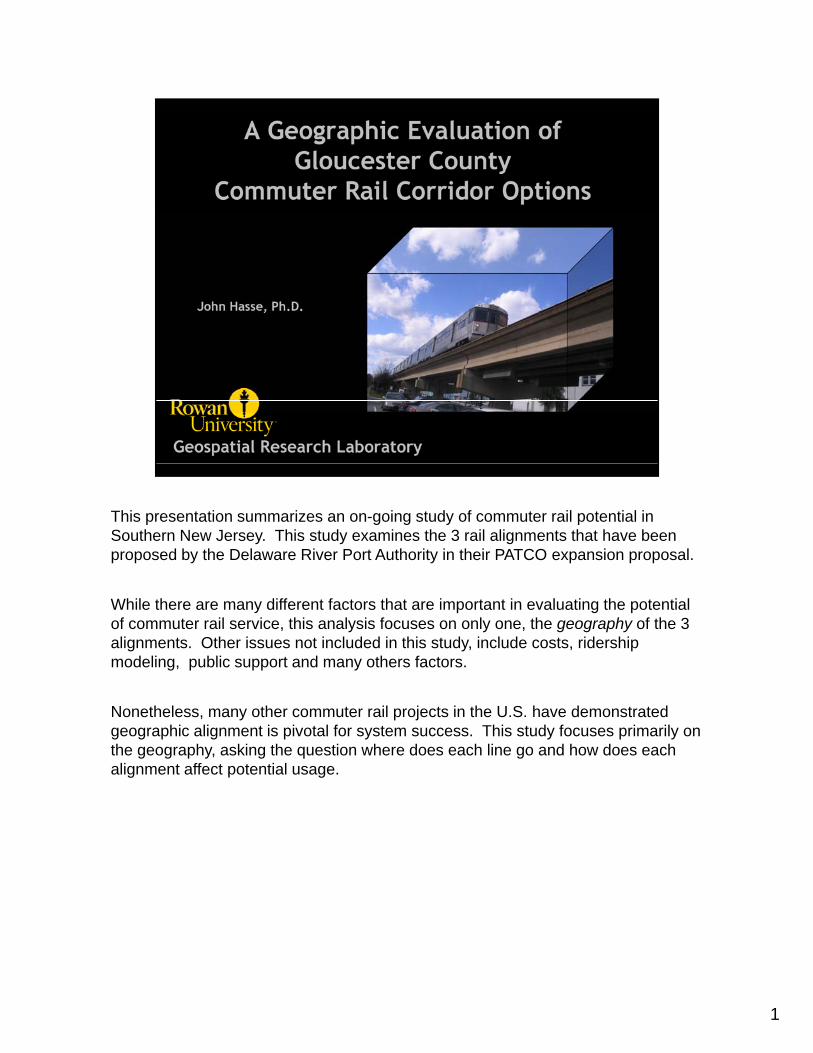
This presentation summarizes an on-going study of commuter rail potential in Southern New Jersey. This study examines the 3 rail alignments that have been proposed by the Delaware River Port Authority in their PATCO expansion proposal.
While there are many different factors that are important in evaluating the potential of commuter rail service, this analysis focuses on only one, the geography of the 3 alignments. Other issues not included in this study, include costs, ridership modeling, public support and many others factors.
Nonetheless, many other commuter rail projects in the U.S. have demonstrated geographic alignment is pivotal for system success. This study focuses primarily on the geography, asking the question where does each line go and how does each alignment affect potential usage.g g
1

It’s common to hear the phrase “the three most important things in real-estate are, location, location and location”. Location is critical because some things are desirable to be near and other things are desirable to avoid and the value of a place is reflected in this desirability.
The same concept can be said for geography. In fact geography can be thought of as the science of location. What makes something happen in one place while not in another? Location, location, location, is the purview of geography.
Geographic researchers, such as our team in the Rowan Geolab, utilize Geographic Information Systems (GIS) or computer map analysis to evaluate the geography of processes be them environmental or human. In this study we utilize GIS to evaluate the land use functionality of the three proposed rail alingments.y g
2

South Jersey certainly has many of quality of life issues related to transportation. In spite of being a small state, the Garden State has the 3rd worst commute to work time in the nation.
3
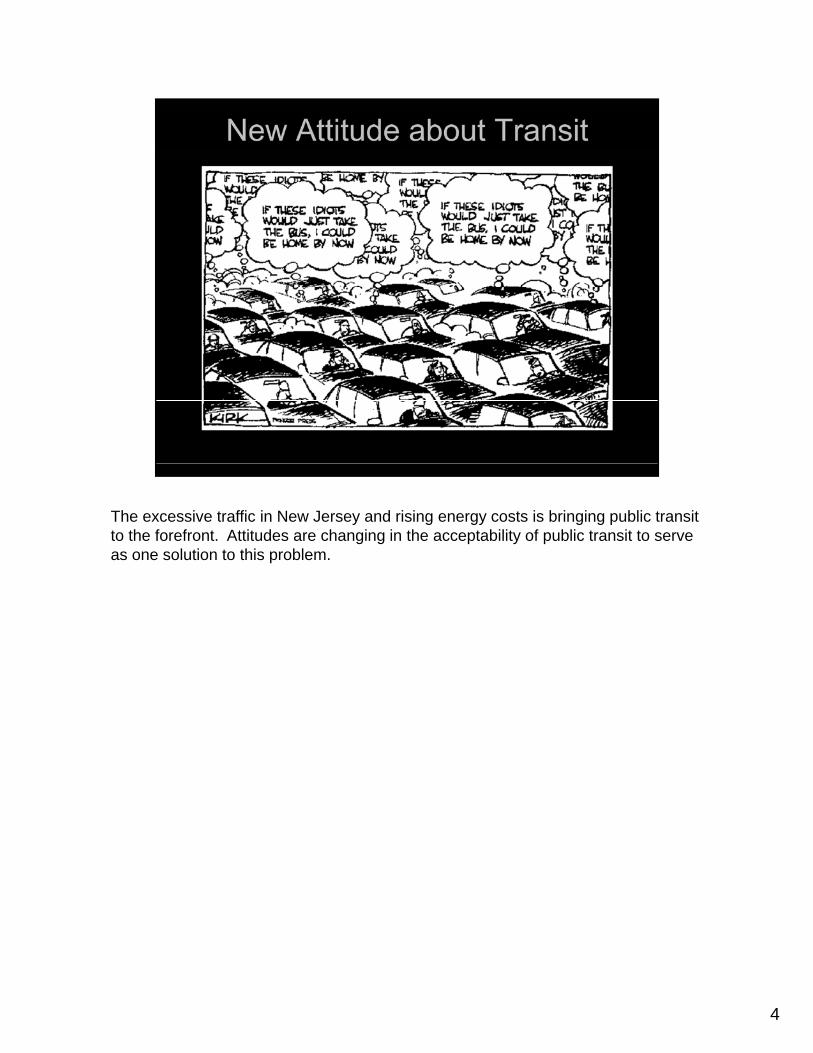
The excessive traffic in New Jersey and rising energy costs is bringing public transit to the forefront. Attitudes are changing in the acceptability of public transit to serve as one solution to this problem.
4
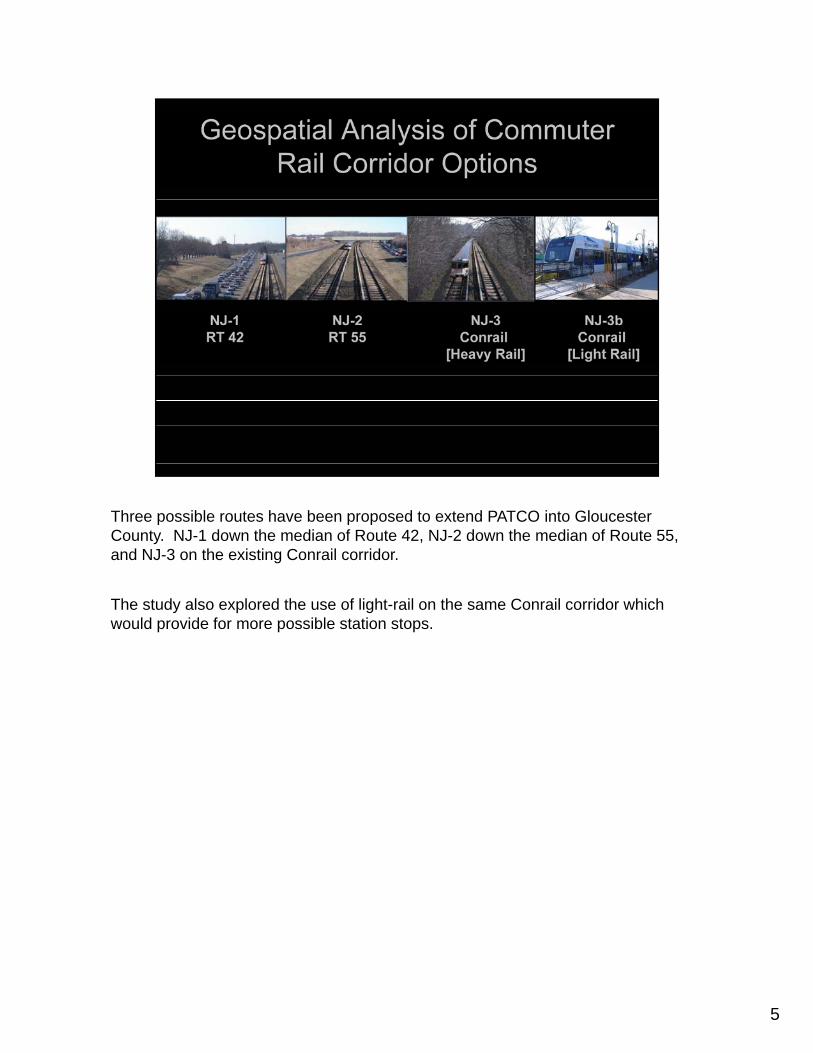
Three possible routes have been proposed to extend PATCO into Gloucester County. NJ-1 down the median of Route 42, NJ-2 down the median of Route 55, and NJ-3 on the existing Conrail corridor.
The study also explored the use of light-rail on the same Conrail corridor which would provide for more possible station stops.
5
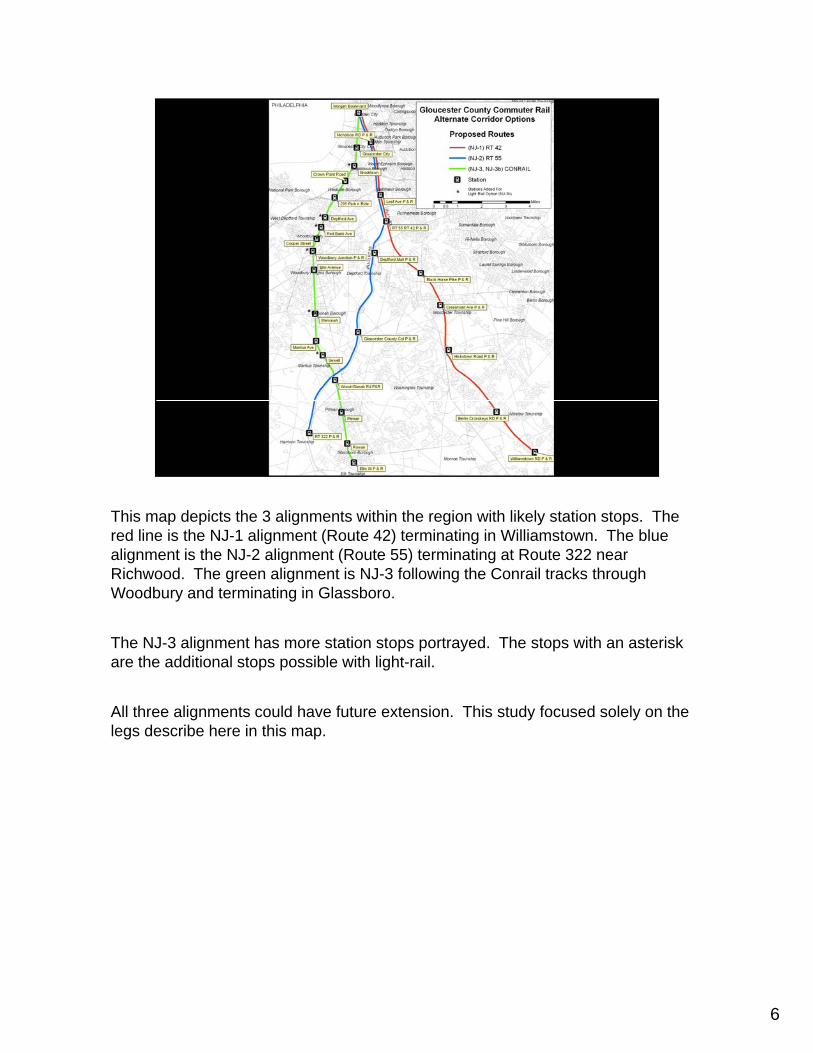
This map depicts the 3 alignments within the region with likely station stops. The red line is the NJ-1 alignment (Route 42) terminating in Williamstown. The blue alignment is the NJ-2 alignment (Route 55) terminating at Route 322 near Richwood. The green alignment is NJ-3 following the Conrail tracks through Woodbury and terminating in Glassboro.
The NJ-3 alignment has more station stops portrayed. The stops with an asterisk are the additional stops possible with light-rail.
All three alignments could have future extension. This study focused solely on the legs describe here in this map.
6
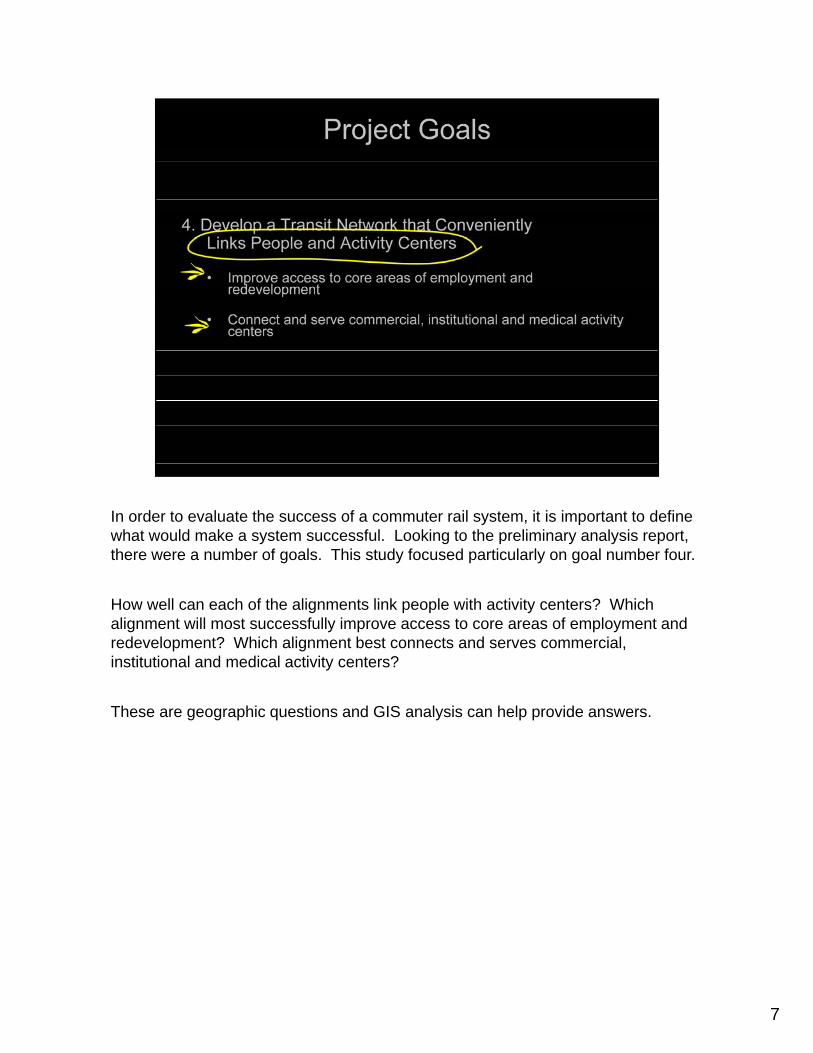
In order to evaluate the success of a commuter rail system, it is important to define what would make a system successful. Looking to the preliminary analysis report, there were a number of goals. This study focused particularly on goal number four.
How well can each of the alignments link people with activity centers? Which alignment will most successfully improve access to core areas of employment and redevelopment? Which alignment best connects and serves commercial, institutional and medical activity centers?
These are geographic questions and GIS analysis can help provide answers.
7
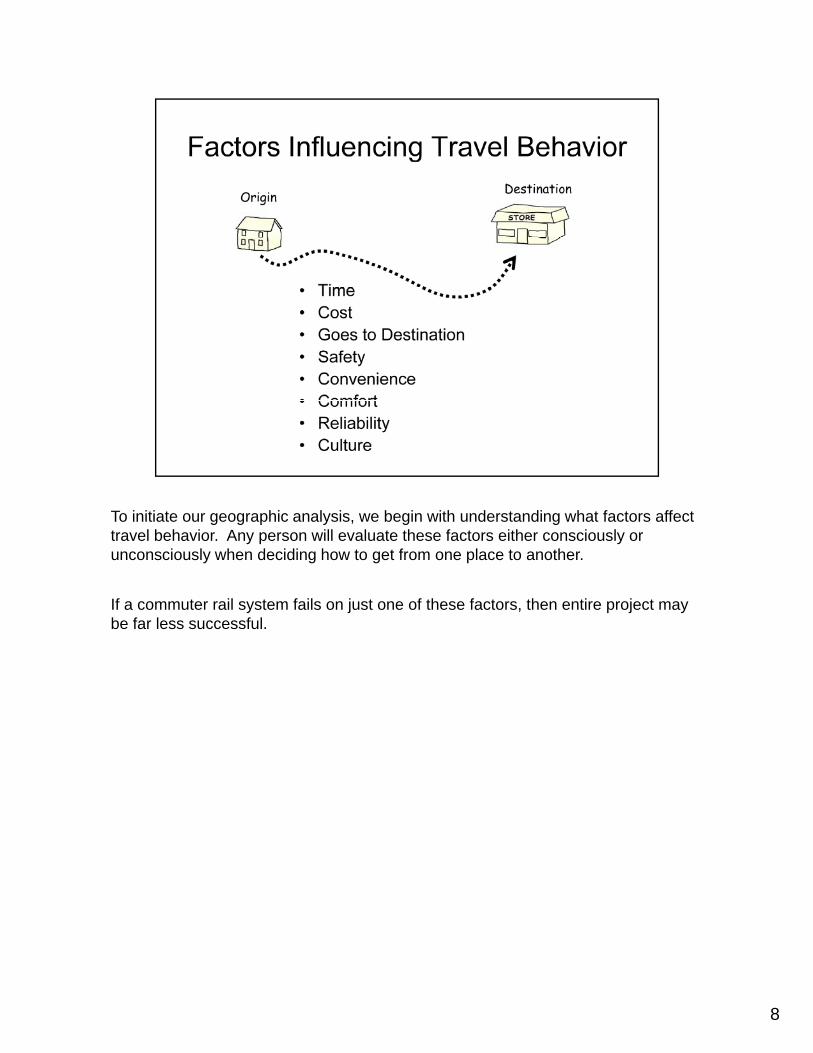
To initiate our geographic analysis, we begin with understanding what factors affect travel behavior. Any person will evaluate these factors either consciously or unconsciously when deciding how to get from one place to another.
If a commuter rail system fails on just one of these factors, then entire project may be far less successful.
8
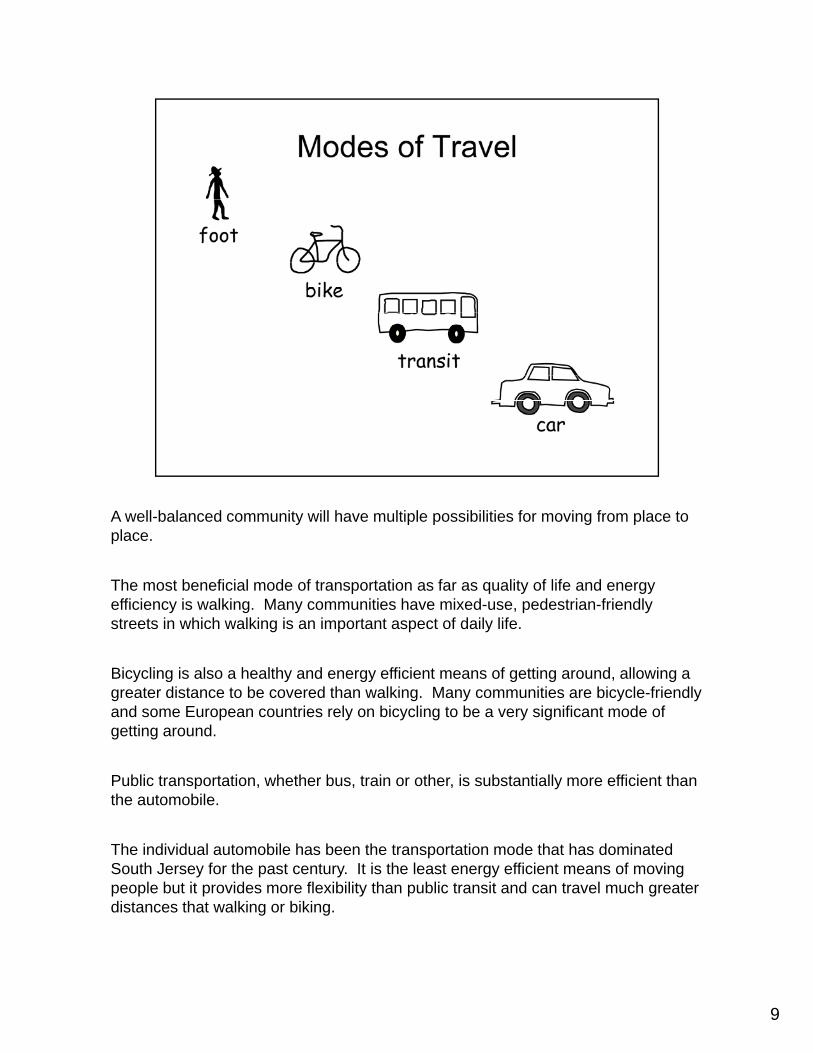
A well-balanced community will have multiple possibilities for moving from place to place.
The most beneficial mode of transportation as far as quality of life and energy efficiency is walking. Many communities have mixed-use, pedestrian-friendly streets in which walking is an important aspect of daily life.
Bicycling is also a healthy and energy efficient means of getting around, allowing a greater distance to be covered than walking. Many communities are bicycle-friendly and some European countries rely on bicycling to be a very significant mode of getting around.
P blic transportation hether b s train or other is s bstantiall more efficient thanPublic transportation, whether bus, train or other, is substantially more efficient than the automobile.
The individual automobile has been the transportation mode that has dominated South Jersey for the past century. It is the least energy efficient means of moving people but it provides more flexibility than public transit and can travel much greater di t th t lki biki
9
distances that walking or biking.
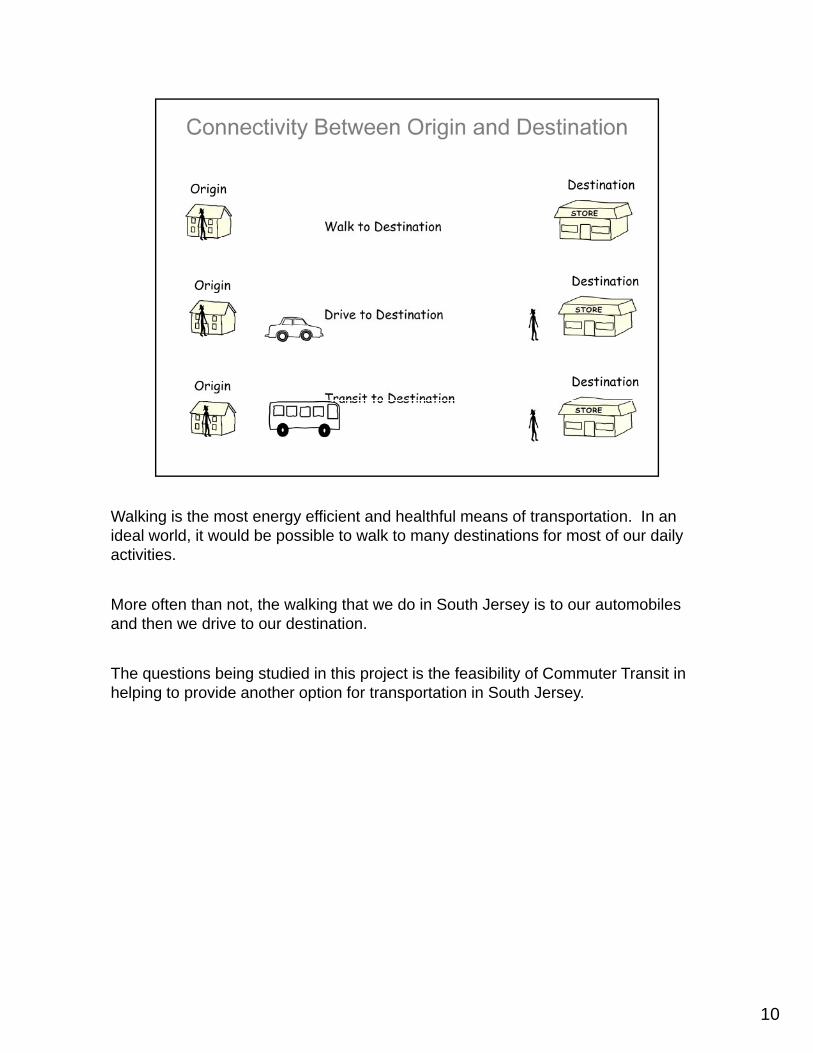
Walking is the most energy efficient and healthful means of transportation. In an ideal world, it would be possible to walk to many destinations for most of our daily activities.
More often than not, the walking that we do in South Jersey is to our automobiles and then we drive to our destination.
The questions being studied in this project is the feasibility of Commuter Transit in helping to provide another option for transportation in South Jersey.
10
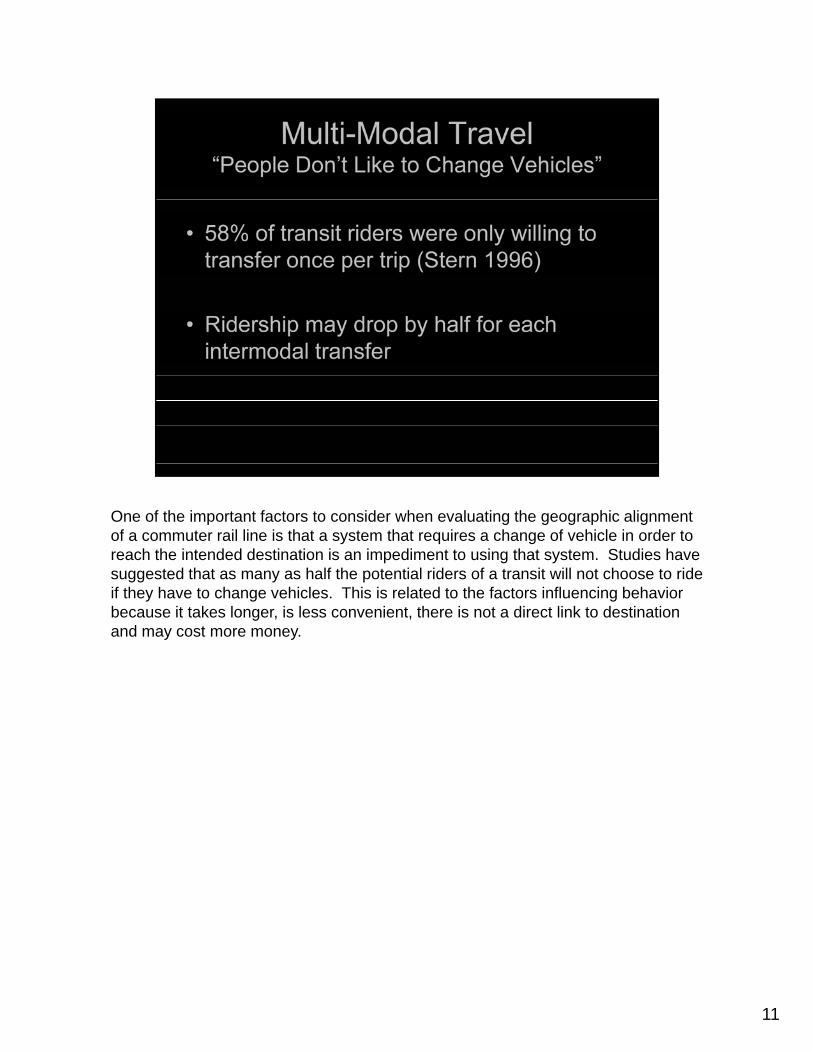
One of the important factors to consider when evaluating the geographic alignment of a commuter rail line is that a system that requires a change of vehicle in order to reach the intended destination is an impediment to using that system. Studies have suggested that as many as half the potential riders of a transit will not choose to ride if they have to change vehicles. This is related to the factors influencing behavior because it takes longer, is less convenient, there is not a direct link to destination and may cost more money.
11
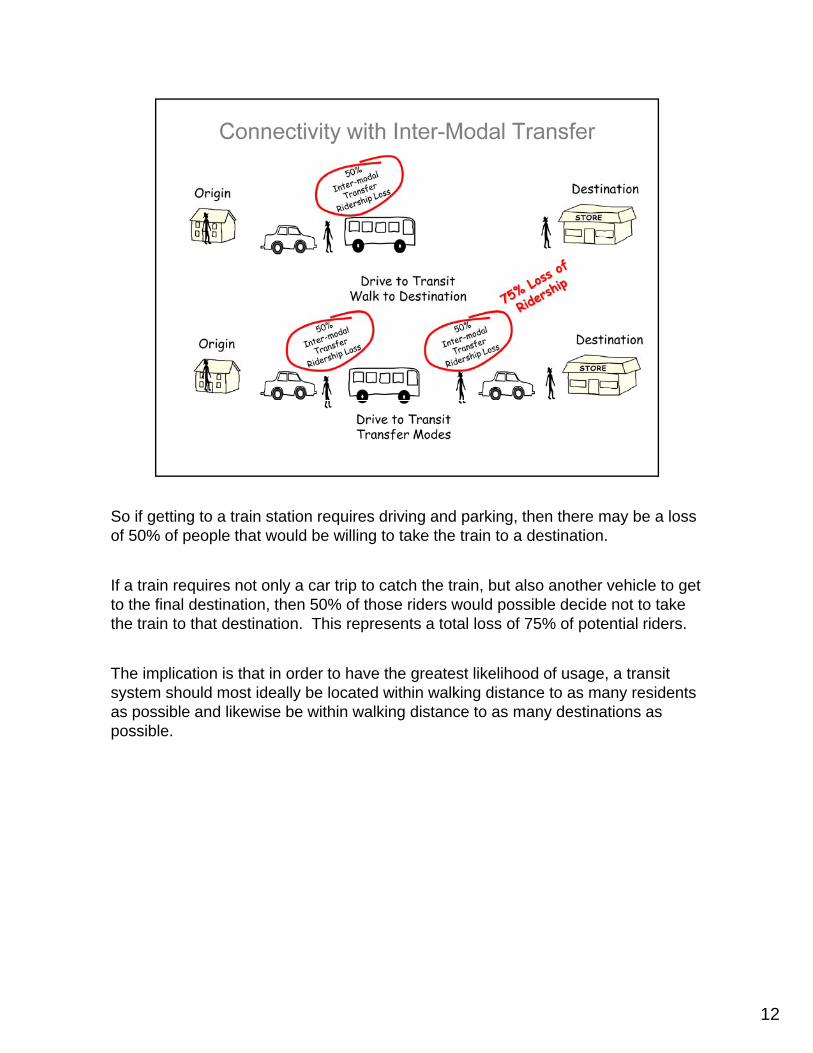
So if getting to a train station requires driving and parking, then there may be a loss of 50% of people that would be willing to take the train to a destination.
If a train requires not only a car trip to catch the train, but also another vehicle to get to the final destination, then 50% of those riders would possible decide not to take the train to that destination. This represents a total loss of 75% of potential riders.
The implication is that in order to have the greatest likelihood of usage, a transit system should most ideally be located within walking distance to as many residents as possible and likewise be within walking distance to as many destinations as possible.
12
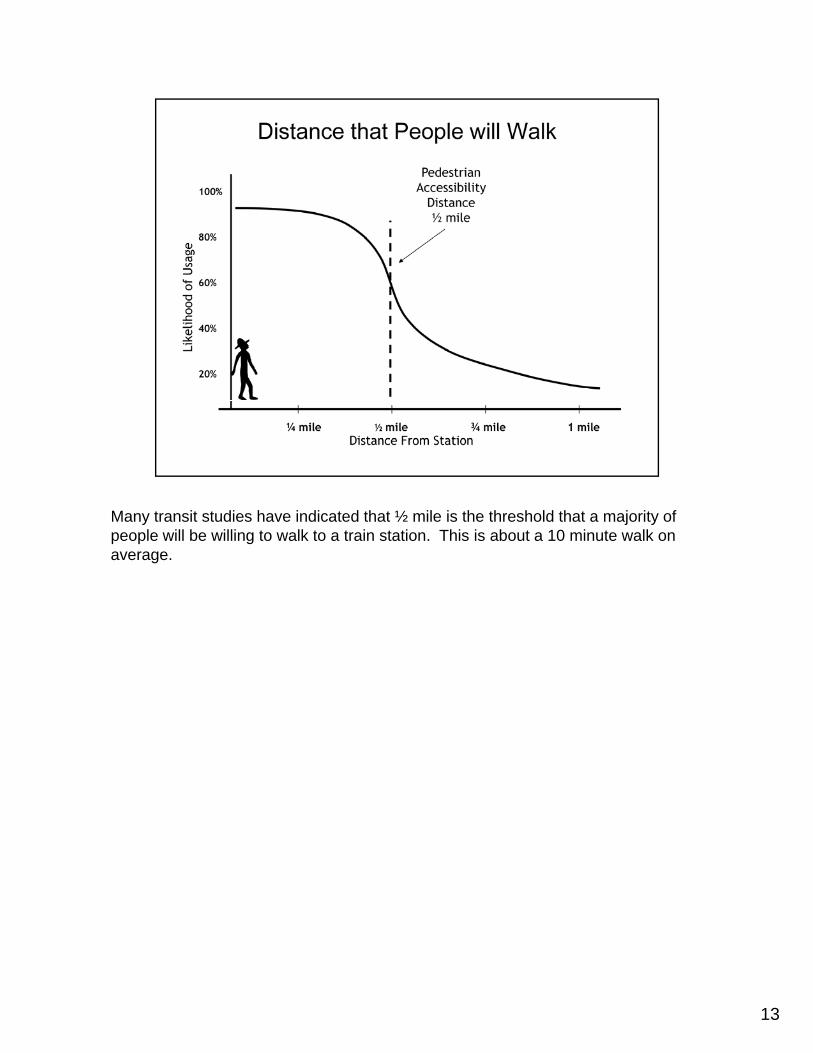
Many transit studies have indicated that ½ mile is the threshold that a majority of people will be willing to walk to a train station. This is about a 10 minute walk on average.
13
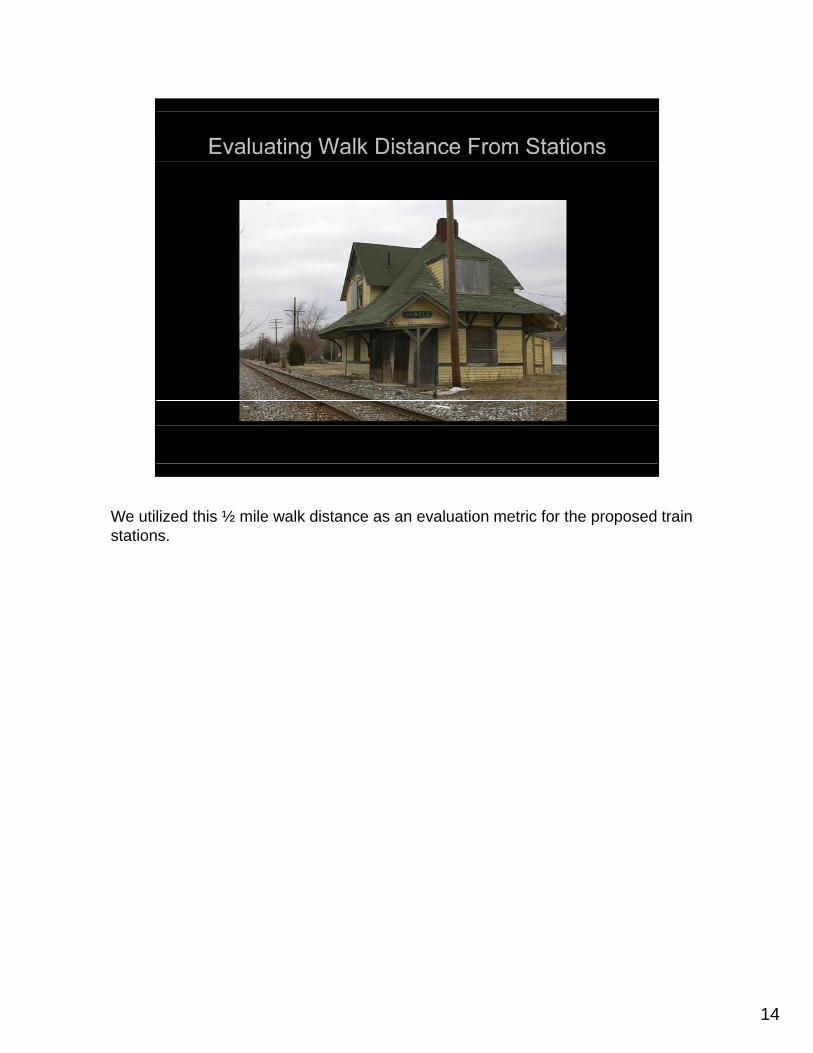
We utilized this ½ mile walk distance as an evaluation metric for the proposed train stations.
14
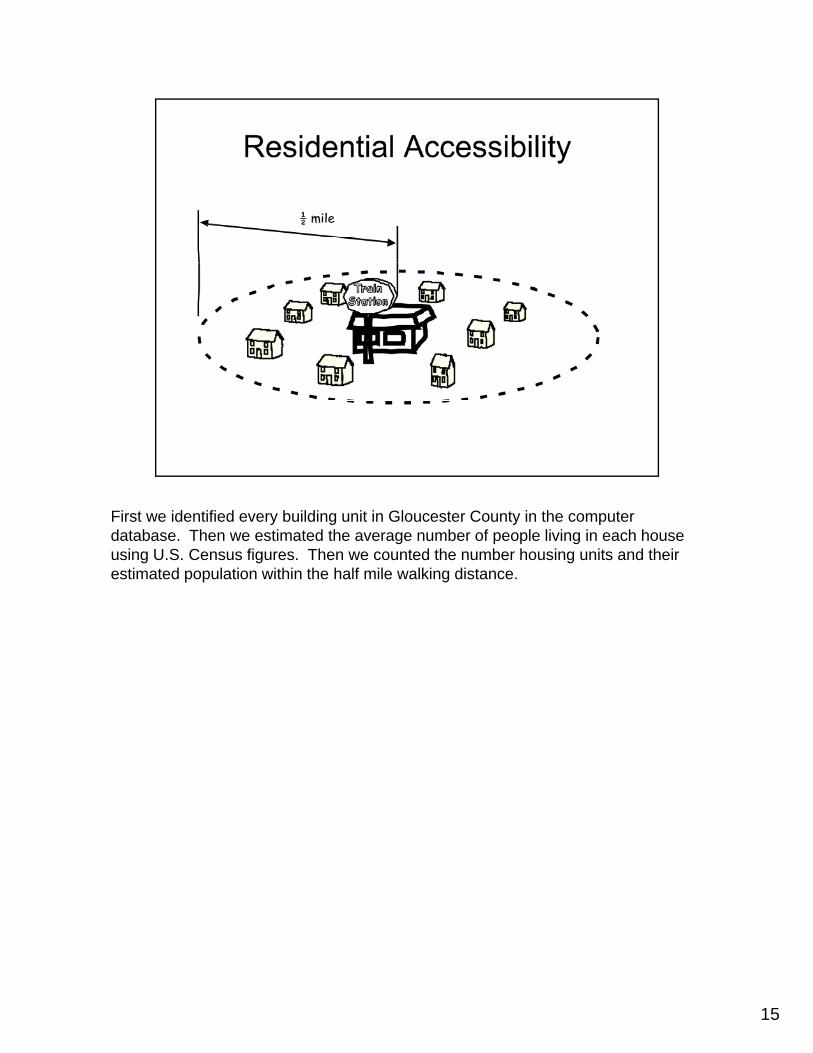
First we identified every building unit in Gloucester County in the computer database. Then we estimated the average number of people living in each house using U.S. Census figures. Then we counted the number housing units and their estimated population within the half mile walking distance.
15
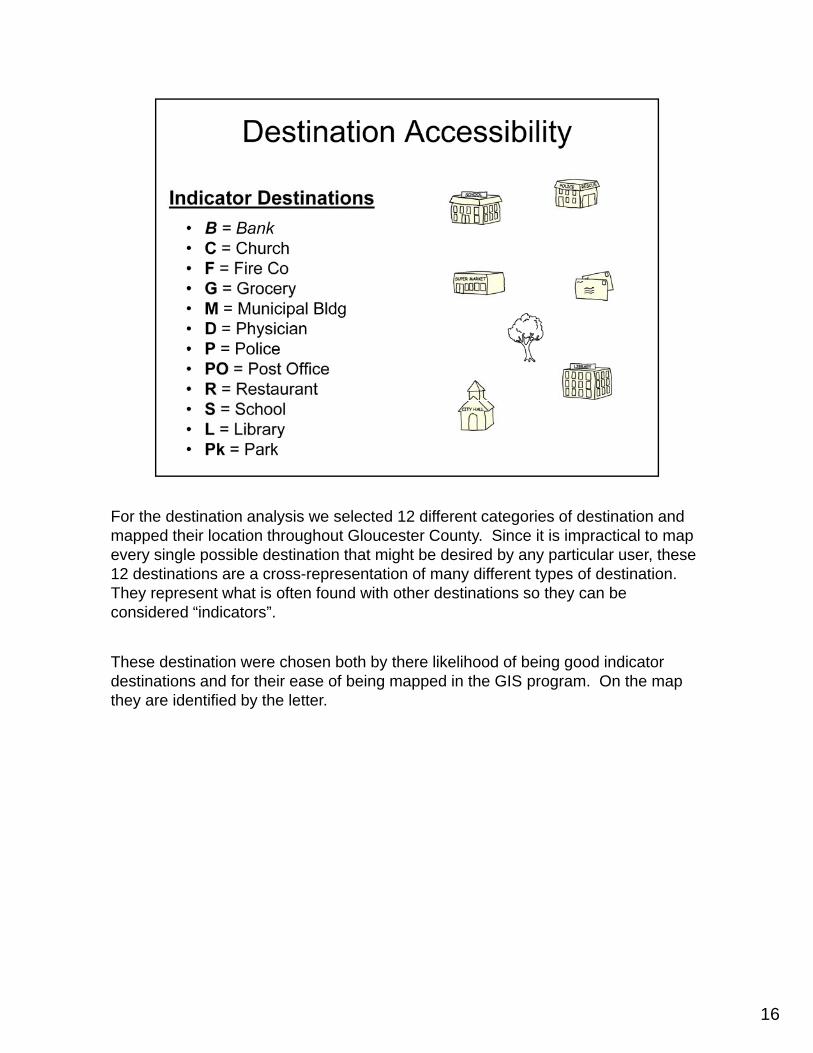
For the destination analysis we selected 12 different categories of destination and mapped their location throughout Gloucester County. Since it is impractical to map every single possible destination that might be desired by any particular user, these 12 destinations are a cross-representation of many different types of destination. They represent what is often found with other destinations so they can be considered “indicators”.
These destination were chosen both by there likelihood of being good indicator destinations and for their ease of being mapped in the GIS program. On the map they are identified by the letter.
16
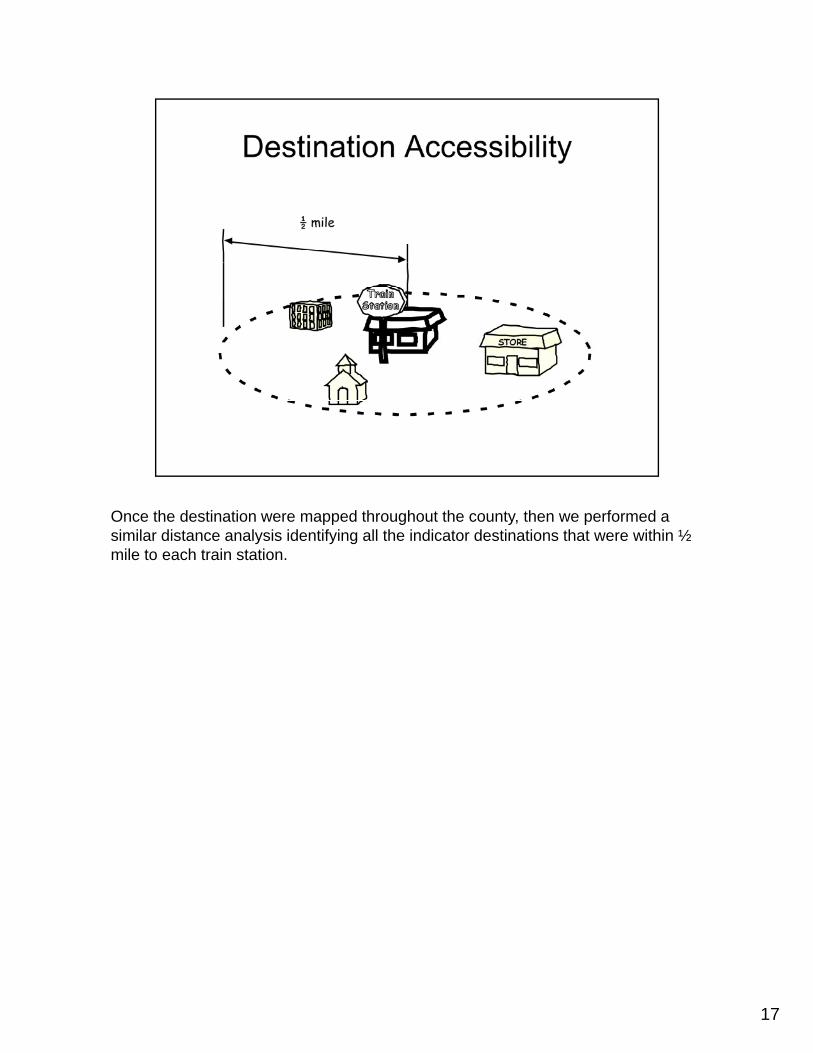
Once the destination were mapped throughout the county, then we performed a similar distance analysis identifying all the indicator destinations that were within ½ mile to each train station.
17
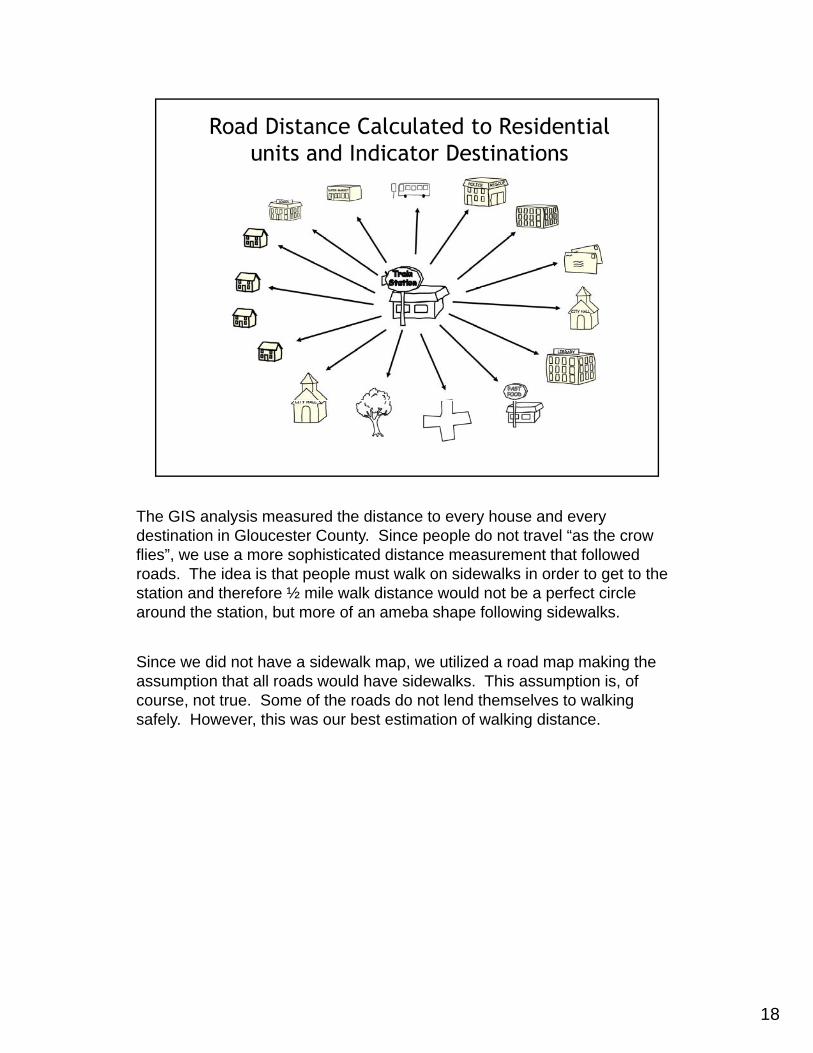
The GIS analysis measured the distance to every house and every destination in Gloucester County. Since people do not travel “as the crow flies”, we use a more sophisticated distance measurement that followed roads. The idea is that people must walk on sidewalks in order to get to the station and therefore ½ mile walk distance would not be a perfect circle around the station, but more of an ameba shape following sidewalks.
Since we did not have a sidewalk map, we utilized a road map making the assumption that all roads would have sidewalks. This assumption is, of course, not true. Some of the roads do not lend themselves to walking safely. However, this was our best estimation of walking distance.
18
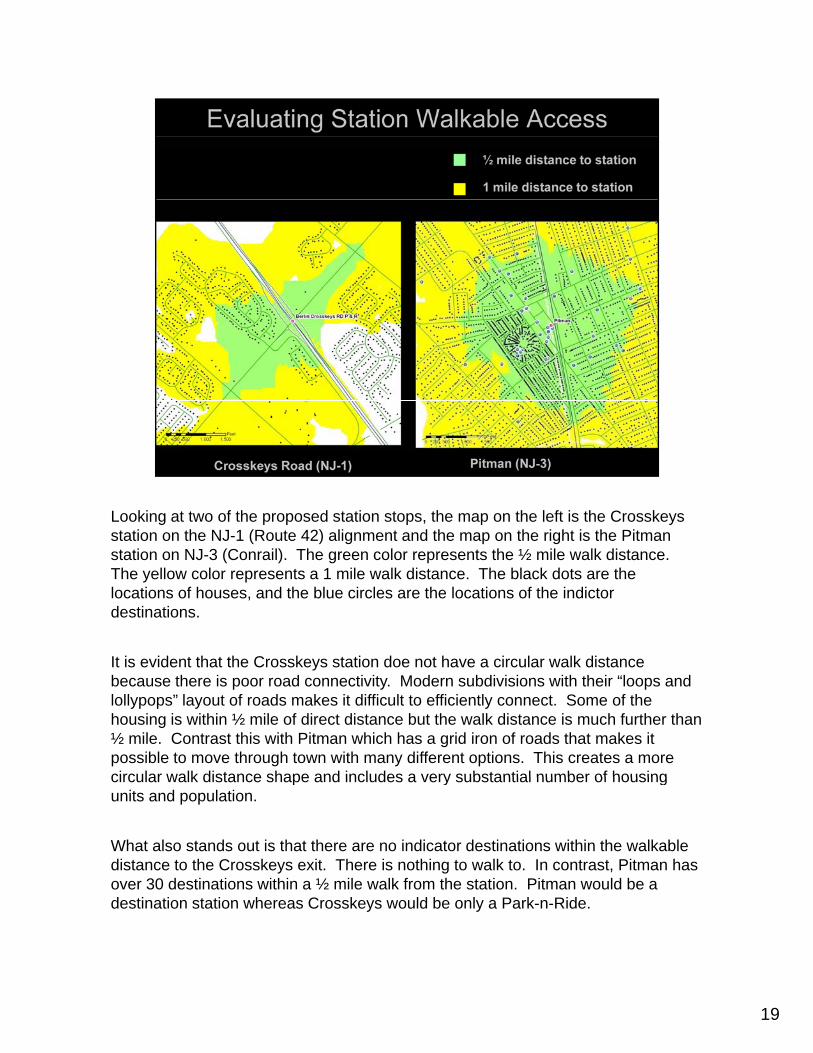
Looking at two of the proposed station stops, the map on the left is the Crosskeysstation on the NJ-1 (Route 42) alignment and the map on the right is the Pitman station on NJ-3 (Conrail). The green color represents the ½ mile walk distance. The yellow color represents a 1 mile walk distance. The black dots are the locations of houses, and the blue circles are the locations of the indictor destinations.
It is evident that the Crosskeys station doe not have a circular walk distance because there is poor road connectivity. Modern subdivisions with their “loops and lollypops” layout of roads makes it difficult to efficiently connect. Some of the housing is within ½ mile of direct distance but the walk distance is much further than ½ mile. Contrast this with Pitman which has a grid iron of roads that makes it possible to move through town with many different options. This creates a more circular walk distance shape and includes a very substantial number of housingcircular walk distance shape and includes a very substantial number of housing units and population.
What also stands out is that there are no indicator destinations within the walkabledistance to the Crosskeys exit. There is nothing to walk to. In contrast, Pitman has over 30 destinations within a ½ mile walk from the station. Pitman would be a destination station whereas Crosskeys would be only a Park n Ride
19
destination station whereas Crosskeys would be only a Park-n-Ride.

This analysis was conducted for all proposed station stops on all three lines. The Conrail line was treated twice, once with fewer stops for heavy rail, and again with multiple stops for light rail.
20
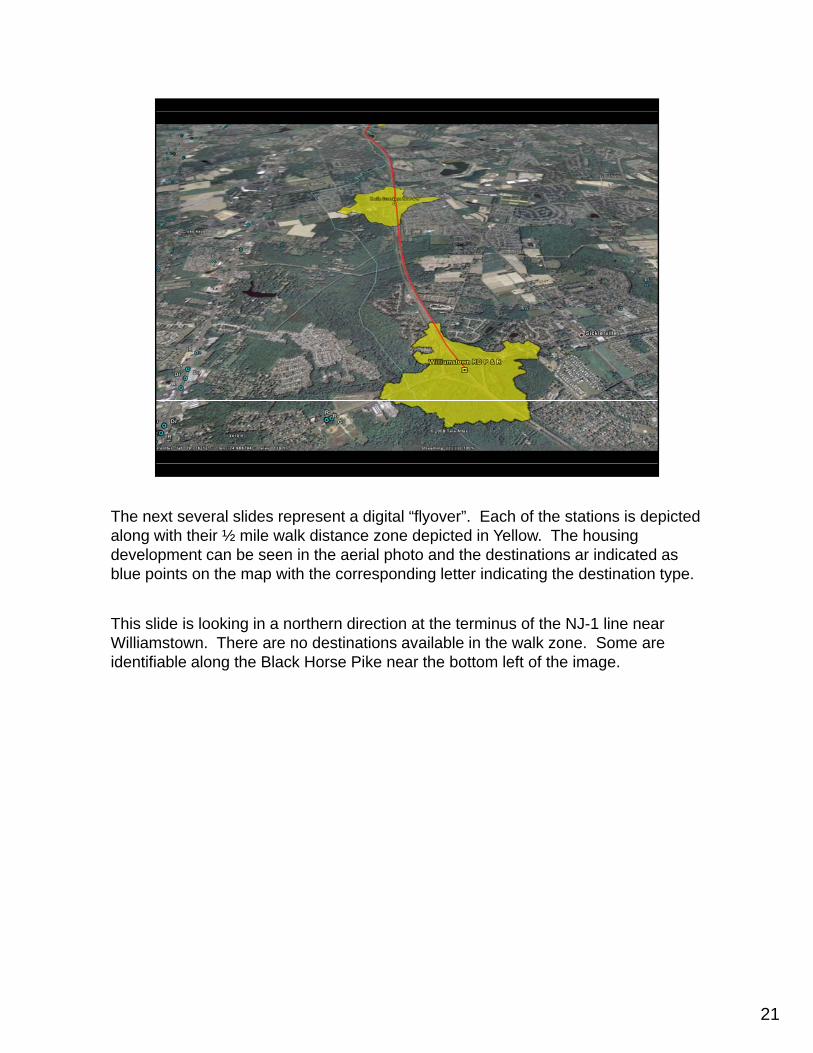
The next several slides represent a digital “flyover”. Each of the stations is depicted along with their ½ mile walk distance zone depicted in Yellow. The housing development can be seen in the aerial photo and the destinations ar indicated as blue points on the map with the corresponding letter indicating the destination type.
This slide is looking in a northern direction at the terminus of the NJ-1 line near Williamstown. There are no destinations available in the walk zone. Some are identifiable along the Black Horse Pike near the bottom left of the image.
21
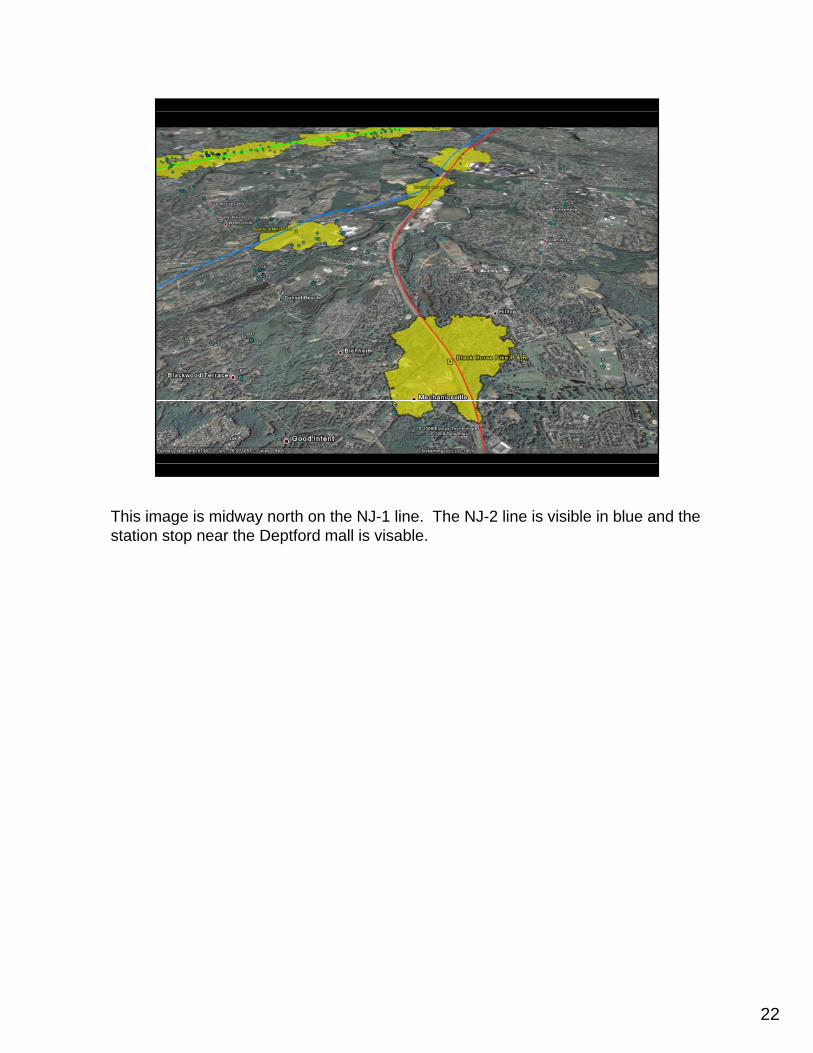
This image is midway north on the NJ-1 line. The NJ-2 line is visible in blue and the station stop near the Deptford mall is visable.
22
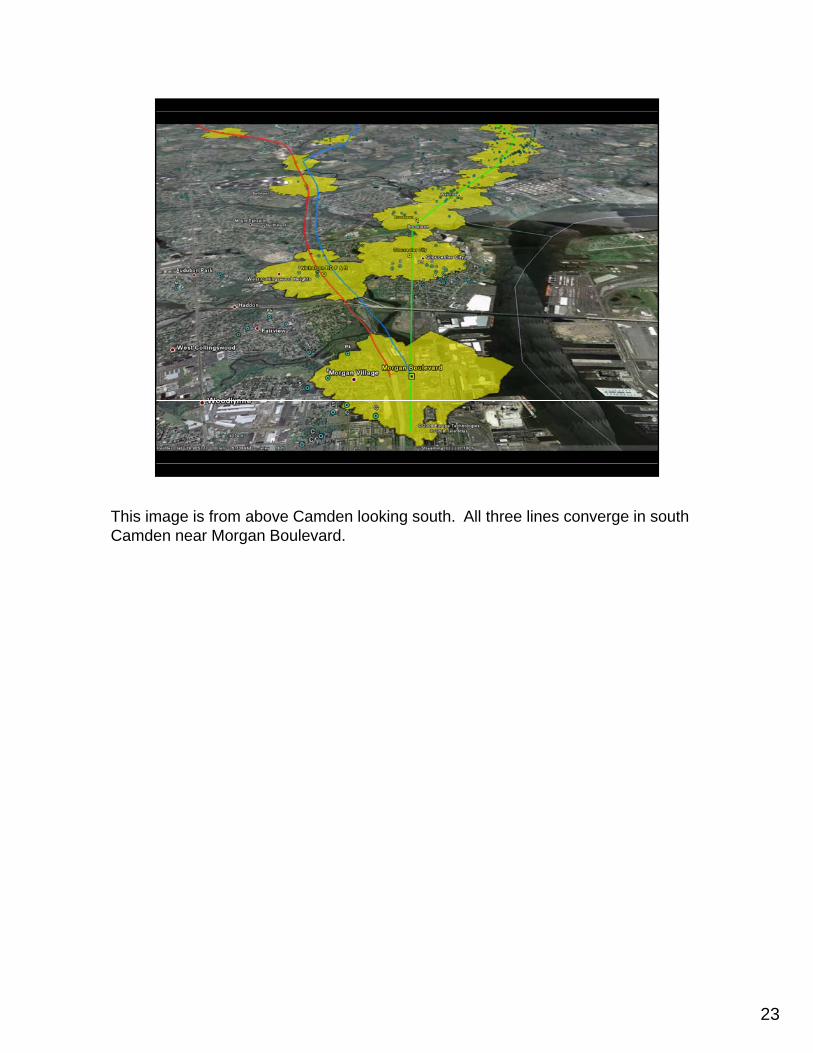
This image is from above Camden looking south. All three lines converge in south Camden near Morgan Boulevard.
23
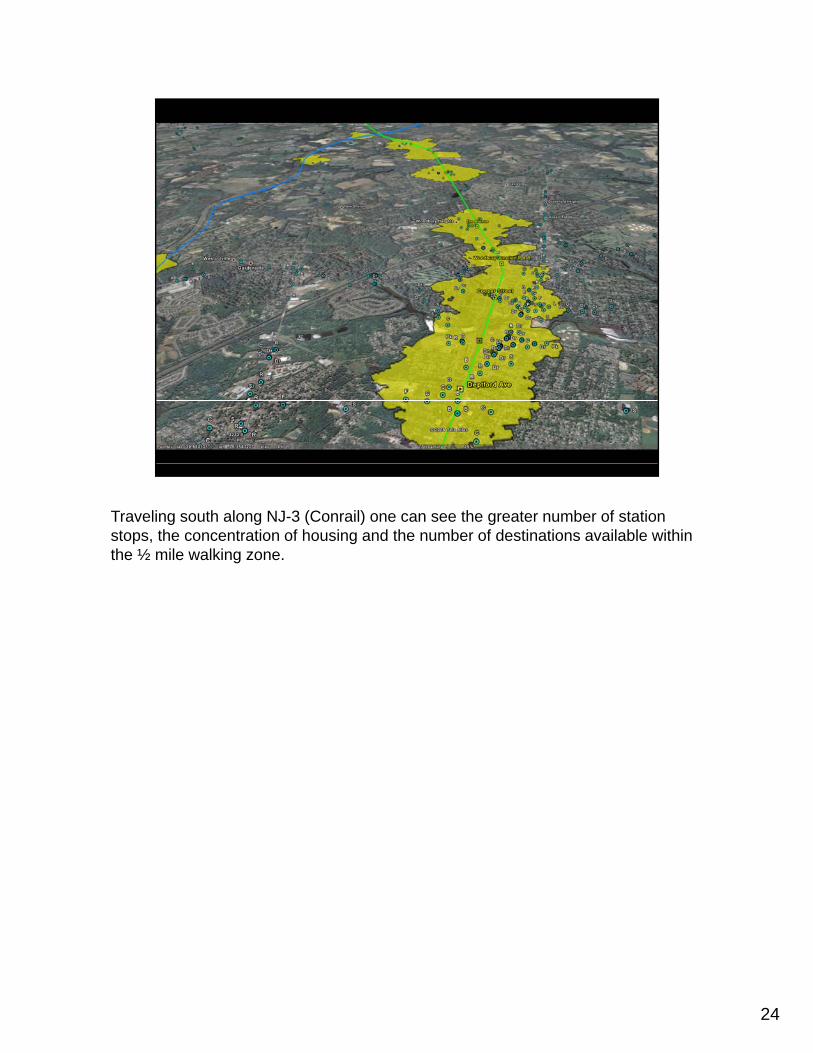
Traveling south along NJ-3 (Conrail) one can see the greater number of station stops, the concentration of housing and the number of destinations available within the ½ mile walking zone.
24
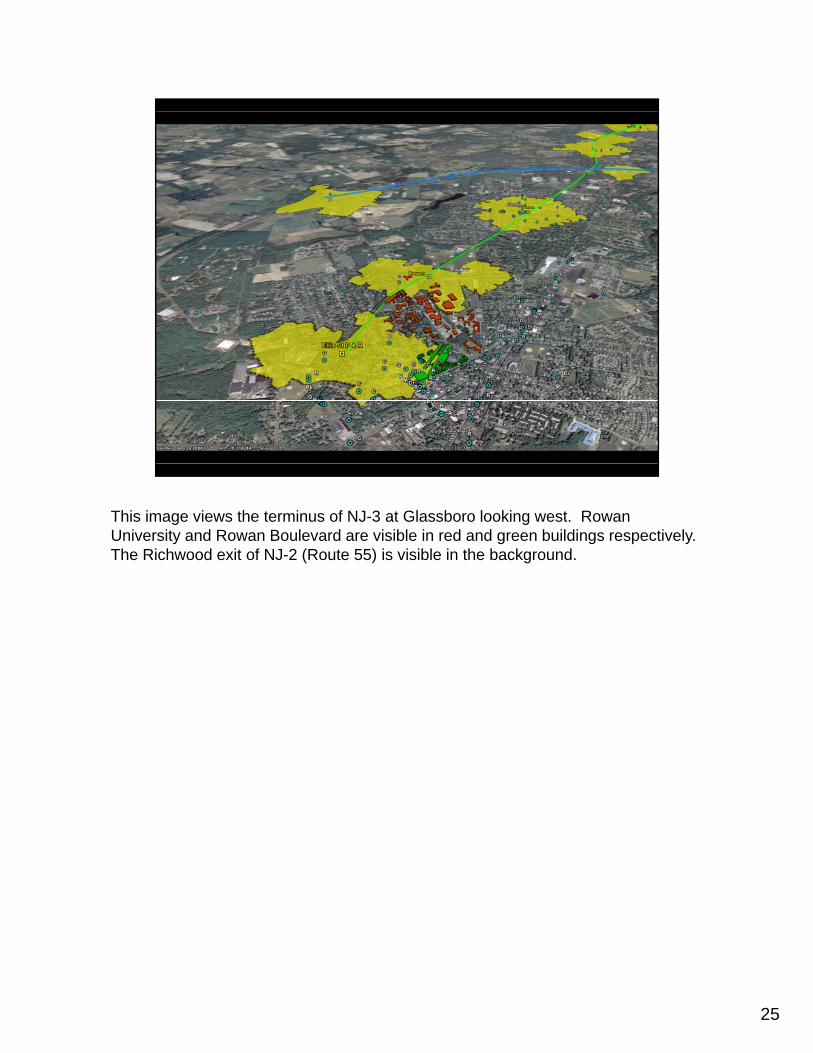
This image views the terminus of NJ-3 at Glassboro looking west. Rowan University and Rowan Boulevard are visible in red and green buildings respectively. The Richwood exit of NJ-2 (Route 55) is visible in the background.
25

26
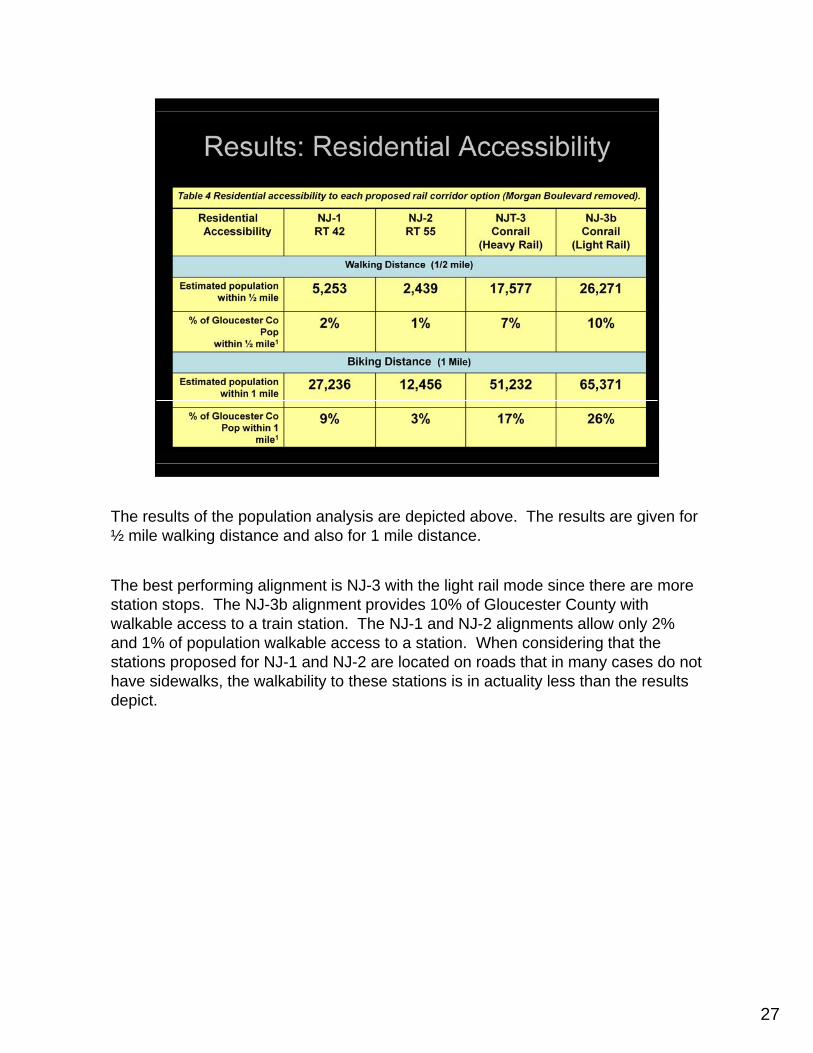
The results of the population analysis are depicted above. The results are given for ½ mile walking distance and also for 1 mile distance.
The best performing alignment is NJ-3 with the light rail mode since there are more station stops. The NJ-3b alignment provides 10% of Gloucester County with walkable access to a train station. The NJ-1 and NJ-2 alignments allow only 2% and 1% of population walkable access to a station. When considering that the stations proposed for NJ-1 and NJ-2 are located on roads that in many cases do not have sidewalks, the walkability to these stations is in actuality less than the results depict.
27
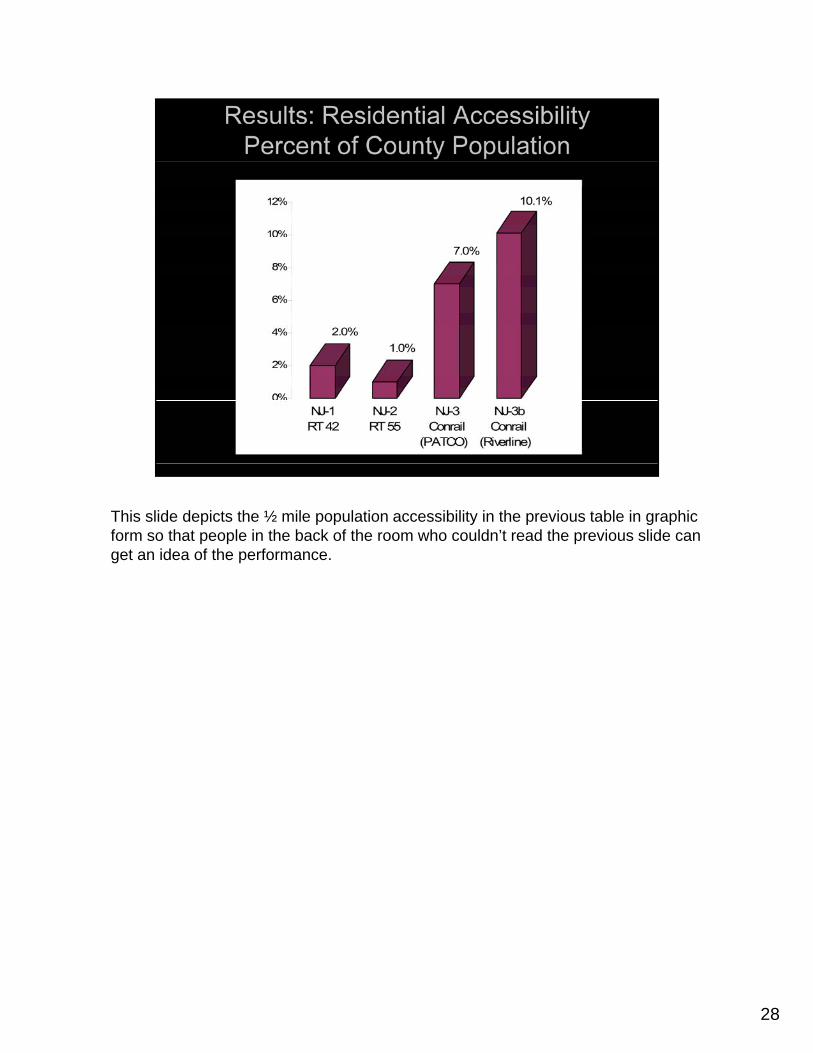
This slide depicts the ½ mile population accessibility in the previous table in graphic form so that people in the back of the room who couldn’t read the previous slide can get an idea of the performance.
28
29
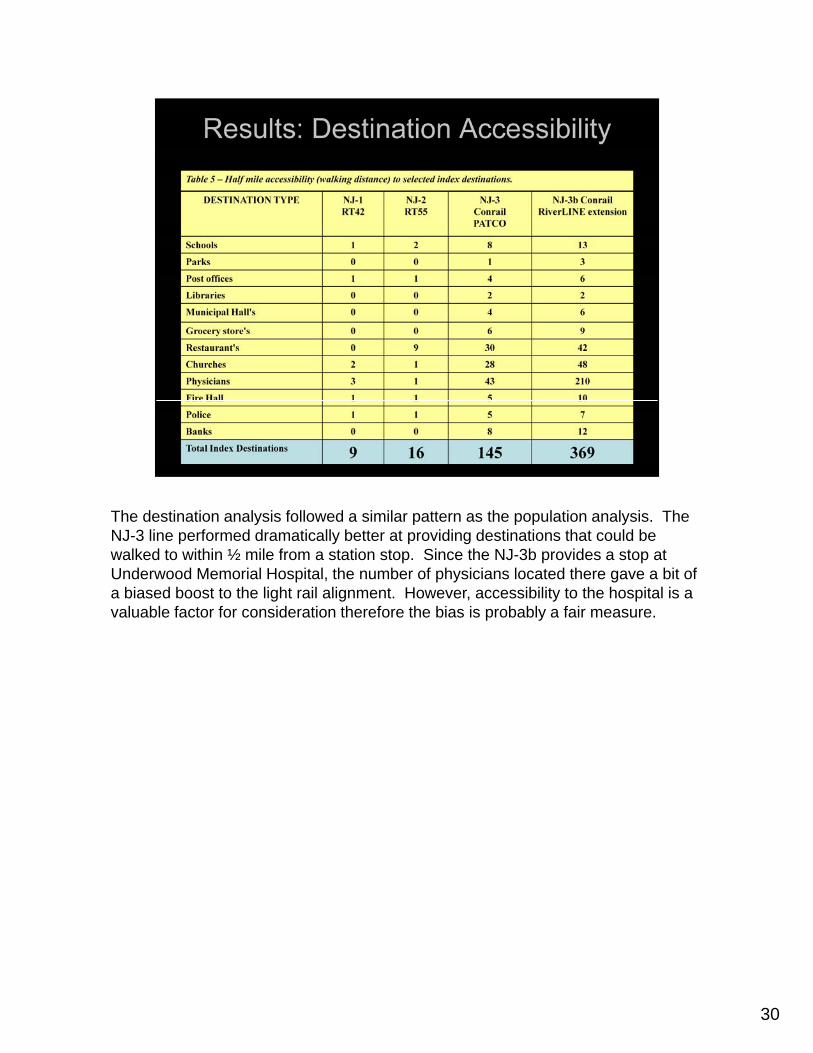
The destination analysis followed a similar pattern as the population analysis. The NJ-3 line performed dramatically better at providing destinations that could be walked to within ½ mile from a station stop. Since the NJ-3b provides a stop at Underwood Memorial Hospital, the number of physicians located there gave a bit of a biased boost to the light rail alignment. However, accessibility to the hospital is a valuable factor for consideration therefore the bias is probably a fair measure.
30

Here is the graphical depiction of the previous table.
31

32
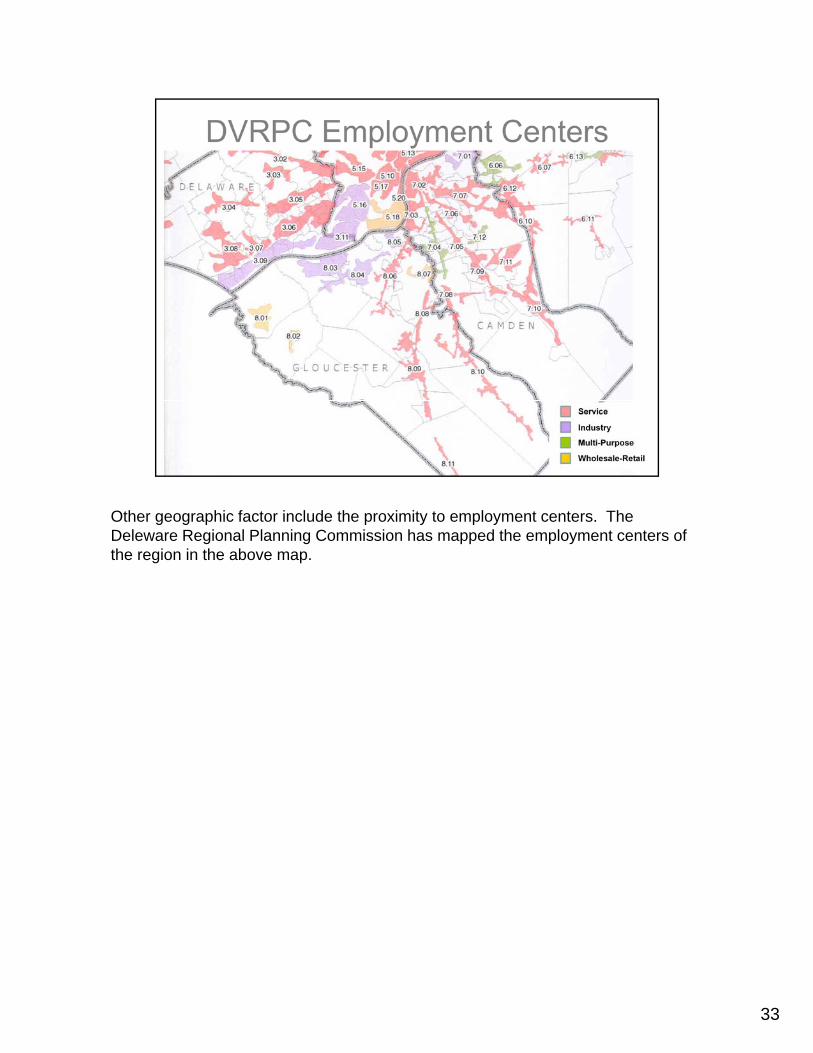
Other geographic factor include the proximity to employment centers. The Deleware Regional Planning Commission has mapped the employment centers of the region in the above map.
33

By overlaying the proposed rail alignments and a ½ mile circle around each of the proposed station stops, one can see that the NJ-3 alignment has the best overlap with employment center zones.
The slide also maps 4 of the most significant employment locations within the county.Underwood Hospital – the counties largest employerUnderwood Hospital the counties largest employer.Rowan University – the counties second largest employerThe Gloucester County Courthouse and Judicial ComplexRowan Boulevard, Glassboro’s downtown revitalization project.
34
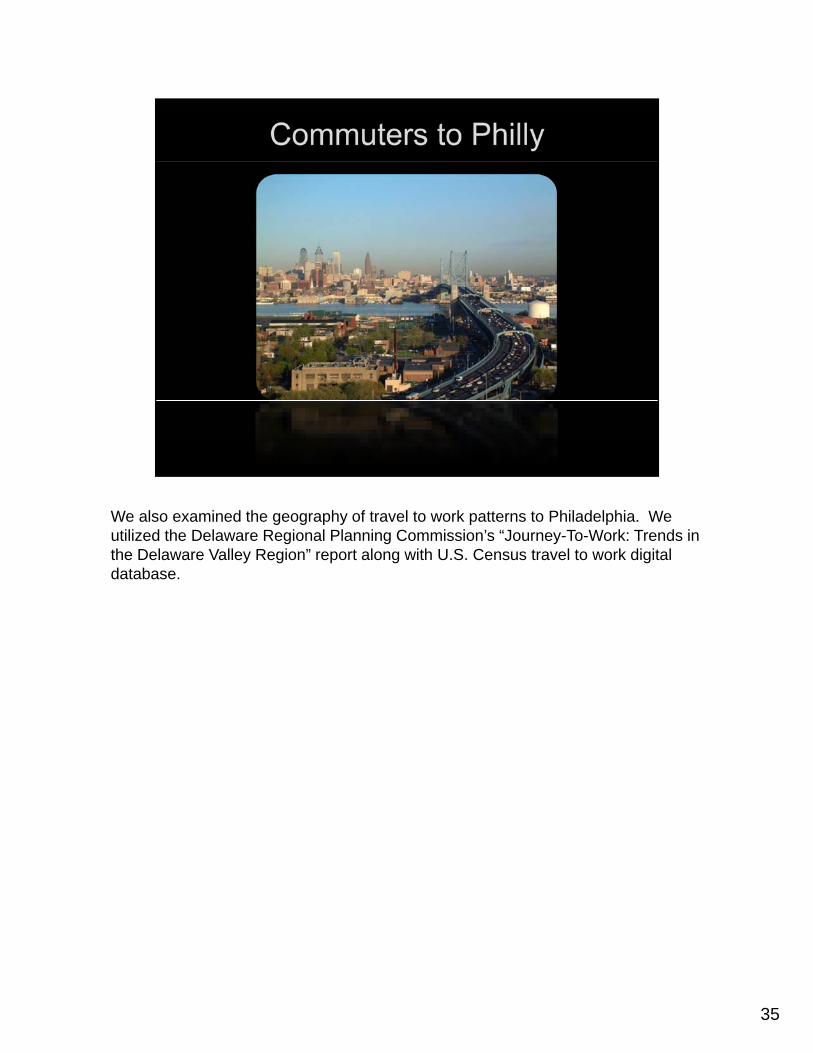
We also examined the geography of travel to work patterns to Philadelphia. We utilized the Delaware Regional Planning Commission’s “Journey-To-Work: Trends in the Delaware Valley Region” report along with U.S. Census travel to work digital database.
35
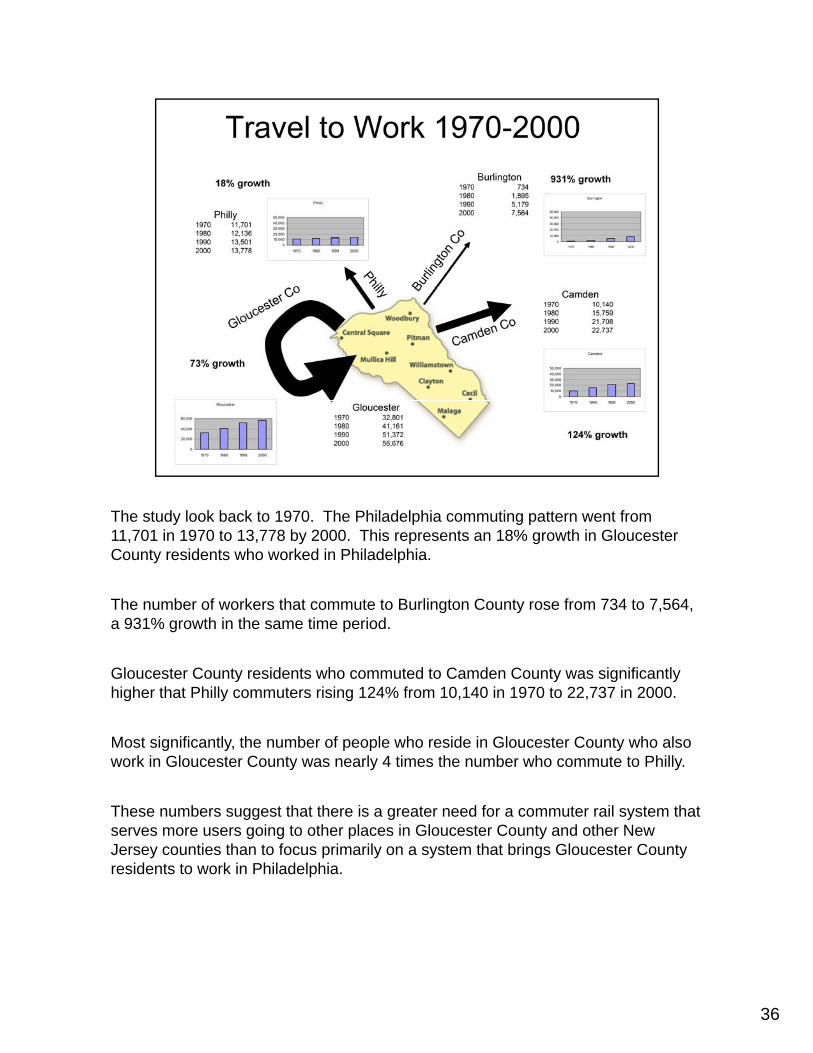
The study look back to 1970. The Philadelphia commuting pattern went from 11,701 in 1970 to 13,778 by 2000. This represents an 18% growth in Gloucester County residents who worked in Philadelphia.
The number of workers that commute to Burlington County rose from 734 to 7,564, a 931% growth in the same time period.
Gloucester County residents who commuted to Camden County was significantly higher that Philly commuters rising 124% from 10,140 in 1970 to 22,737 in 2000.
Most significantly, the number of people who reside in Gloucester County who also work in Gloucester County was nearly 4 times the number who commute to Philly.
These numbers suggest that there is a greater need for a commuter rail system that serves more users going to other places in Gloucester County and other New Jersey counties than to focus primarily on a system that brings Gloucester County residents to work in Philadelphia.
36
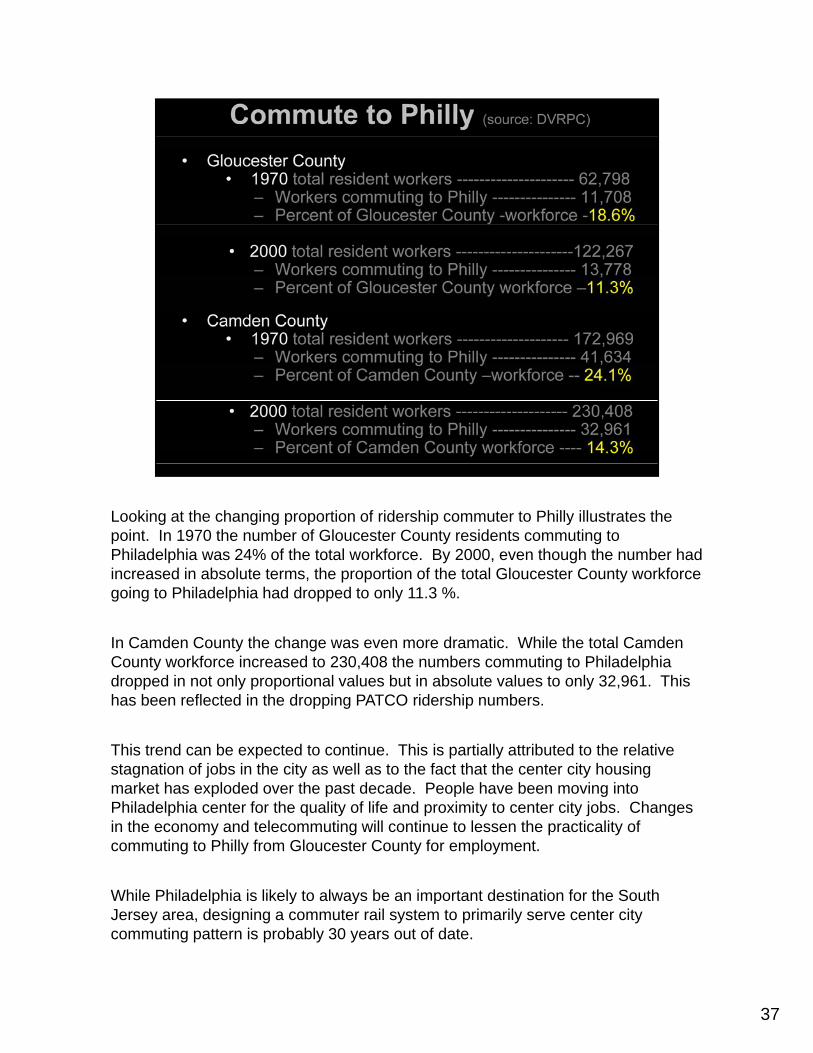
Looking at the changing proportion of ridership commuter to Philly illustrates the point. In 1970 the number of Gloucester County residents commuting to Philadelphia was 24% of the total workforce. By 2000, even though the number had increased in absolute terms, the proportion of the total Gloucester County workforce going to Philadelphia had dropped to only 11.3 %.
In Camden County the change was even more dramatic. While the total Camden County workforce increased to 230,408 the numbers commuting to Philadelphia dropped in not only proportional values but in absolute values to only 32,961. This has been reflected in the dropping PATCO ridership numbers.
This trend can be expected to continue. This is partially attributed to the relative stagnation of jobs in the city as well as to the fact that the center city housing g j y y gmarket has exploded over the past decade. People have been moving into Philadelphia center for the quality of life and proximity to center city jobs. Changes in the economy and telecommuting will continue to lessen the practicality of commuting to Philly from Gloucester County for employment.
While Philadelphia is likely to always be an important destination for the South
37
p y y pJersey area, designing a commuter rail system to primarily serve center city commuting pattern is probably 30 years out of date.
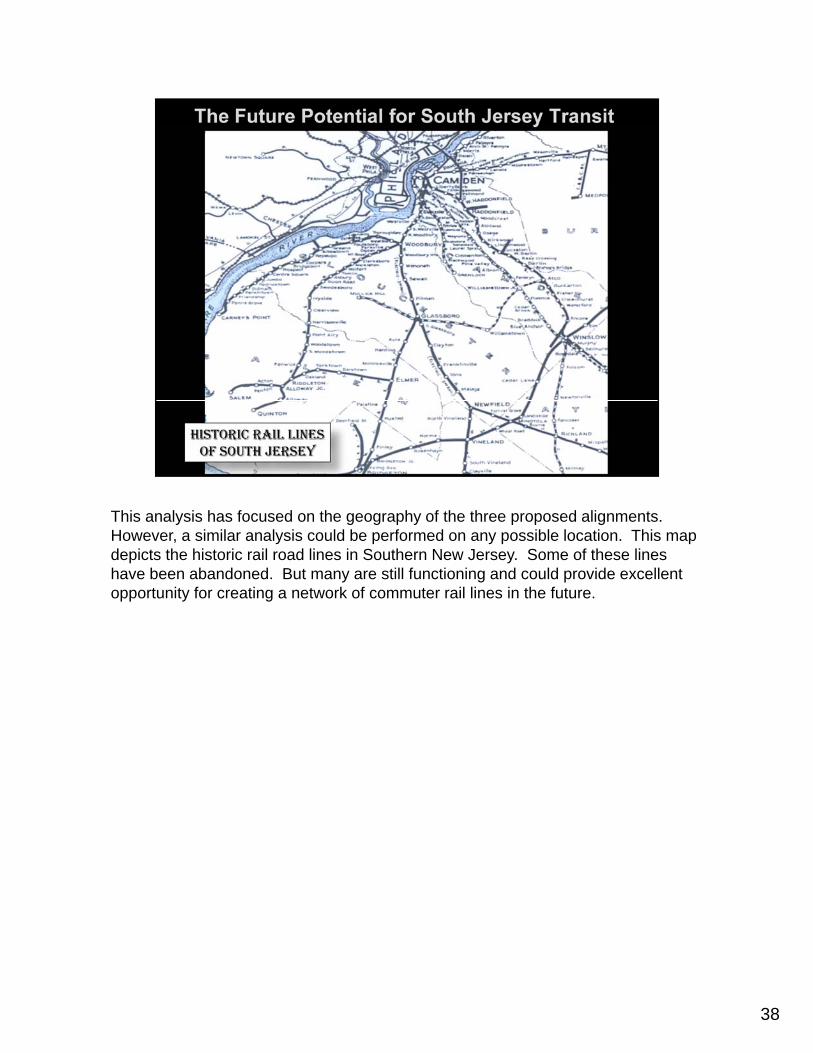
This analysis has focused on the geography of the three proposed alignments. However, a similar analysis could be performed on any possible location. This map depicts the historic rail road lines in Southern New Jersey. Some of these lines have been abandoned. But many are still functioning and could provide excellent opportunity for creating a network of commuter rail lines in the future.
38
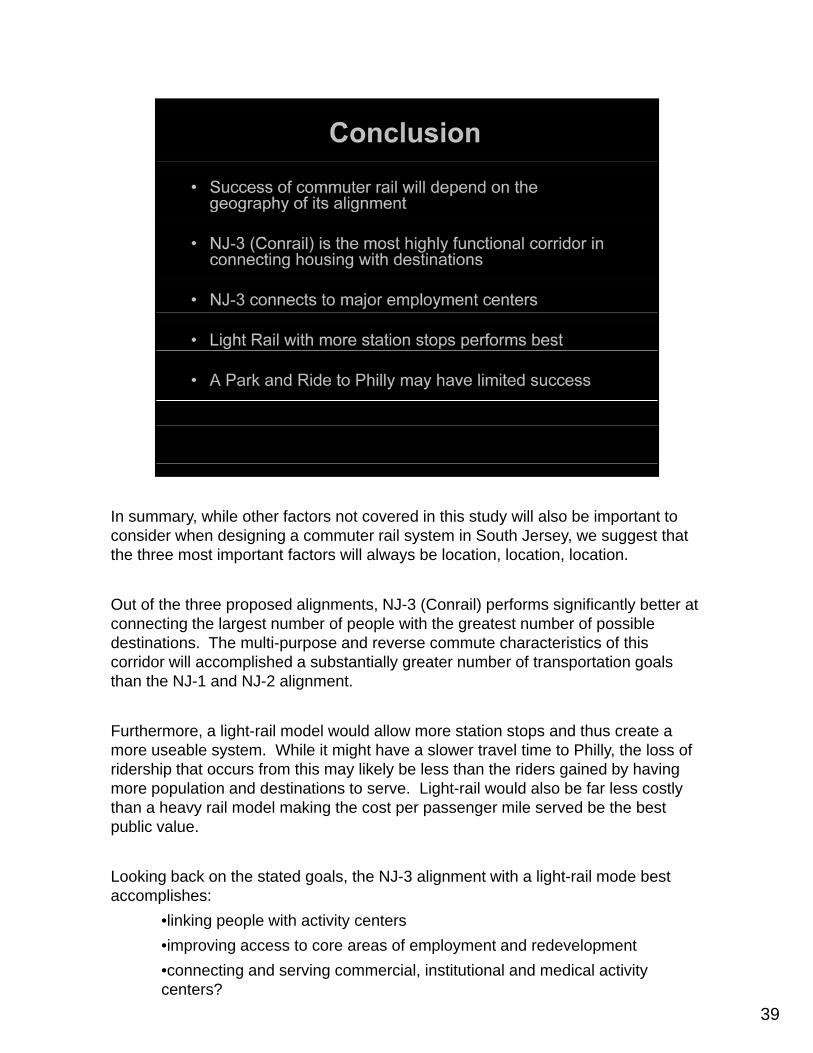
In summary, while other factors not covered in this study will also be important to consider when designing a commuter rail system in South Jersey, we suggest that the three most important factors will always be location, location, location.
Out of the three proposed alignments, NJ-3 (Conrail) performs significantly better at connecting the largest number of people with the greatest number of possible destinations. The multi-purpose and reverse commute characteristics of this corridor will accomplished a substantially greater number of transportation goals than the NJ-1 and NJ-2 alignment.
Furthermore, a light-rail model would allow more station stops and thus create a more useable system. While it might have a slower travel time to Philly, the loss of ridership that occurs from this may likely be less than the riders gained by having y y g y gmore population and destinations to serve. Light-rail would also be far less costly than a heavy rail model making the cost per passenger mile served be the best public value.
Looking back on the stated goals, the NJ-3 alignment with a light-rail mode best accomplishes:
39
p•linking people with activity centers•improving access to core areas of employment and redevelopment•connecting and serving commercial, institutional and medical activity centers?
More information can be found at http://rowan.edu/geolab
40