south dakota workforce report
TRANSCRIPT
2020
South DakotaWorkforce Report
dlrsdgovlmic 6056262314
Labor Market Information Center
PopulationWorkforce Demographics Page 1Language Spoken Page 3
Gross Domestic Product Page 5
Workforce Page 7Labor Force Participation Rate Page 7Labor Force Page 92021 Update Page 10Unemployment and Educational Levels Page 11
Total Employment Page 13 Self Employment Page 15
Worker Commuting Page 17
Advertised Job Openings Page 19
Nonfarm Wage and Salaried Workers Page 212020 Industry Trends Page 232021 Update Page 27
Quarterly Census of Employment and Wages Page 29Number of Covered Workers Page 30 Annual Pay of Workers Page 33 Noteworthy Industry Trends Page 35 Establishment Size Page 44
Personal Income Page 47
Poverty Page 49
Population Projections Page 51
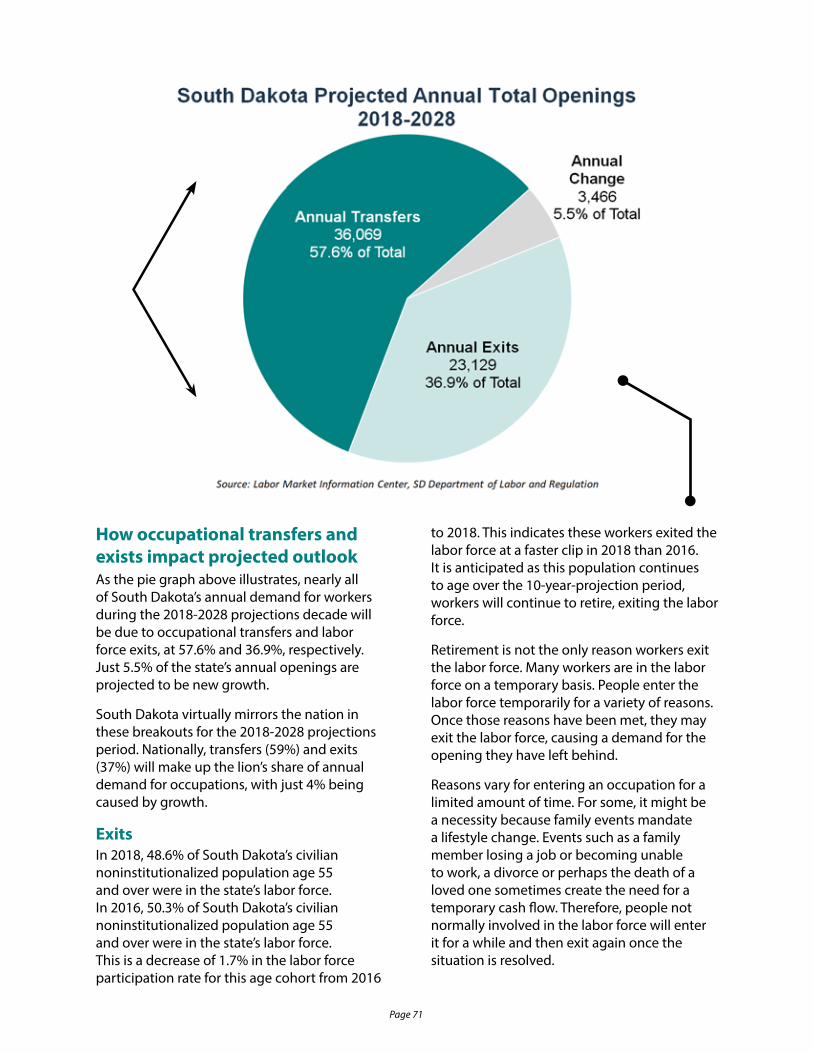
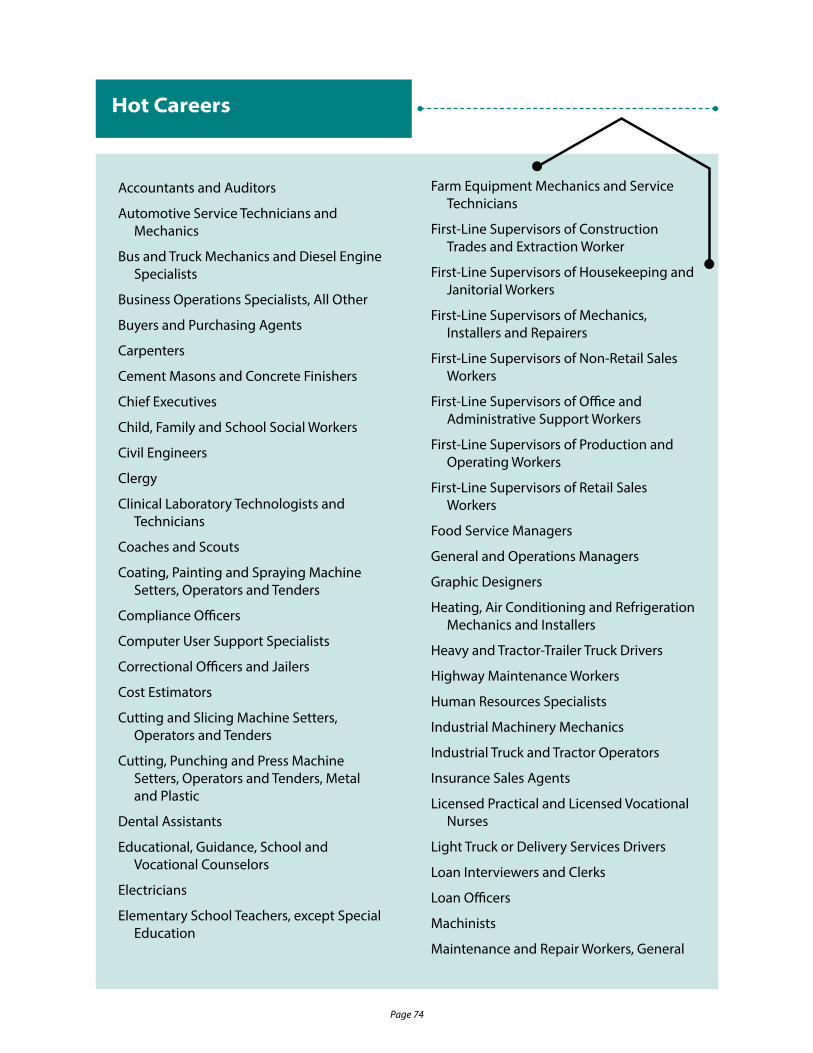
Employment Projections Page 53 Industry Employment Projections Page 53 Occupational Employment Projections Page 62 Occupational Demand Projections Page 69Hot Careers (High Demand-High Wage Occupations) Page 73Top 30 Careers Page 75Hot Career and Top Career Resources Page 78
Table of Contents
Page 1
Population and Workforce Demographics
South Dakotarsquos total population has been steadily increasing since 1990 growing by nearly 200000 (29) between 1990 and 2020 According to estimates published by the US Census Bureau our population increased by 77000 or 94 between 2010 and 2020 exceeding the US
population increase of 65 over the same time period
Much of the growth has taken place in our two Metropolitan Statistical Areas (MSAs) Rapid City and Sioux Falls Population in those two metro areas increased by 137 and 194 respectively over the last 10 years Nearly half of South Dakotarsquos 427100 population (478) resides in either the Sioux Falls or Rapid City MSAs
427100
Page 2
Between 2019 and 2020 population growth remained consistent from previous years with the MSAs growing at a slightly faster pace than the rest of the state
The 2019 American Community Survey (ACS) data produced by the US Census Bureau shows the largest percent of the state population by race is comprised of White residents (867) followed by American Indian and Alaskan (105) Regarding ethnicity 37 of South Dakotarsquos population is Hispanic or Latino
South Dakota Population by Race and Ethnicity
Number Percent
Total population 884659 1000
White 766781 867
Black or African American 26679 30
American Indian and Alaska Native 92709 105
Asian 14395 16
Native Hawaiian and Other Pacific Islander 2868 03
Some other race 6973 08
Hispanic or Latino (of any race) 33018 37
Source US Census Bureau 2019 American Community Survey
South Dakota Population Estimates (as of July 1 each year)
2019 2020
South Dakota 887100 892700
Rapid City MSA 151800 153500
Sioux Falls MSA 269300 273600
Source US Census Bureau 2020 population estimates
Page 3
Data available from the 2019 American Community Survey (ACS) for the linguistics of our state population show that a large majority of state residents (942) speak only English Of those residents who have the ability to speak in other languages (47700) some struggle with
language barriers as an estimated 6500 (137) speak English lsquonot wellrsquo or lsquonot well at allrsquo
Language Spoken at Home by Ability to Speak English for the Population 5 Years and Over
Language Spoken5 to 17 years
18 to 64 years
65+ years Total
Percent of Total
Total 156410 515591 153799 825800 1000
Speak only English 149331 481365 147365 778061 942
Speak Spanish 2137 12047 1647 15831 19
Speak English ldquovery wellrdquo 1125 7144 842 9111 11
Speak English ldquowellrdquo 646 2244 98 2988 04
Speak English ldquonot wellrdquo 366 1946 615 2927 04
Speak English ldquonot at allrdquo 0 713 92 805 01
Speak other Indo-European languages 840 5501 1827 8168 10
Speak English ldquovery wellrdquo 774 3736 1542 6052 07
Speak English ldquowellrdquo 0 912 205 1117 01
Speak English ldquonot wellrdquo 66 853 80 999 01
Speak English ldquonot at allrdquo 0 0 0 0 00
Speak Asian and Pacific Island languages 1145 6081 514 7740 09
Speak English ldquovery wellrdquo 390 2467 335 3192 04
Speak English ldquowellrdquo 755 2937 139 3831 05
Speak English ldquonot wellrdquo 0 677 26 703 01
Speak English ldquonot at allrdquo 0 0 14 14 00
Speak other languages 2957 10597 2446 16000 19
Speak English ldquovery wellrdquo 2331 7840 1841 12012 15
Speak English ldquowellrdquo 626 1952 329 2907 04
Speak English ldquonot wellrdquo 0 480 257 737 01
Speak English ldquonot at allrdquo 0 325 19 344 00
Source US Census Bureau 2019 American Community Survey
Language Spoken
Page 4
Page 5
Gross Domestic Product
Gross domestic product (GDP) by state is the market value of goods and services produced by the labor and property located in the state It is the state counterpart of the nationrsquos GDP which is the Bureau of Economic Analysisrsquo most comprehensive measure of US economic
activity Analysis of the change in South Dakota GDP data from 2019 to 2020 reflects an overall decline (all industry total) of 02 which is a decrease from the previous yearrsquos 32 growth Half of the 14 industries had increases in GDP between 2019 and 2020 The three industries with the most growth were the Agriculture Forestry Fishing and Hunting (118) Construction (65) and Utilities (42)
The three industries which had the largest decrease in GDP were Mining Quarrying and Oil and Gas Extraction (267) Transportation and Warehousing (175) and Arts Entertainment Recreation Accommodation and Food Services (156) The Mining Quarrying and Oil and Gas Extraction is the only industry which decreased over the past two years It is also the smallest industry in South Dakota making up only 02 of total GDP which enhances the volatility of this industry from year to year
South Dakota Gross Domestic Product (GDP) by Industry Sector(Millions of Dollars)
Industry2018 GDP
2019 GDP
2020 GDP
Change from
2018-2019
Change from
2019-2020
All Industry Total 53239 54941 54852 32 -02
Private Industries 47388 48889 48818 32 -01
Agriculture Forestry Fishing and Hunting 3702 3340 3735 -98 118
Mining Quarrying and Oil and Gas Extraction 137 125 92 -86 -267
Utilities 880 928 967 55 42
Construction 2049 2168 2308 58 65
Manufacturing 5054 5121 5085 13 -07
Wholesale Trade 3550 3648 3580 28 -19
Retail Trade 3486 3611 3725 36 32
Transportation and Warehousing 1218 1271 1048 44 -175
Information 1292 1383 1414 71 23
Finance Insurance Real Estate Rental and Leasing 14396 15030 15067 44 02
Professional and Business Services 3127 3323 3368 63 14
Educational Services Health Care and Social Assistance 5384 5679 5565 55 -20
Arts Entertainment Recreation Accommodation and Food Services 2019 2093 1767 37 -156
Other services except Government 1095 1169 1096 68 -62
Government 5851 6052 6035 34 -03
Note NAICS Industry detail is based on the 2012 North American Industry Classification System (NAICS)Last updated March 26 2021 reflecting Census Bureau midyear population estimates available as of December 2020Source US Bureau of Economic Analysis
Page 6
Page 7
Workforce
Current Population Survey (CPS) figures from the Bureau of Labor Statistics show South Dakotarsquos labor force participation rate was 689 in 2020 In other words nearly 70 of all (non-institutionalized) residents age 16 years and older were in the labor force either working or
looking for work
Labor Force Participation Rate
South Dakota Labor Force Participation
7 out of
10
This compares to a 2020 national average of 617 Historically South Dakota consistently has higher rates of labor force participation than the nation as a whole
South Dakotarsquos participation rate of 689 is the fourth highest rate of all states and the District of Columbia Nebraska had the highest rate at 701 followed by the District of Columbia at 695 and Minnesota at 692
Page 8
Youth in South Dakota were also very active labor force participants In 2020 646 of the statersquos young population (age 16-24 years) were in the labor force compared to the national rate of 539 At the other end of the age spectrum South Dakotarsquos labor force participation rate of 65 and over is 278 compared to the national average of 194
A closer look at some of the demographic groups shows South Dakotarsquos percentage of residents in the labor force ranks near the top nationally in both the male and female categories With a female labor force participation rate of 642 South Dakota ranks as the fifth highest behind the District of Columbia at 667 Minnesota at 656 Nebraska at 650 and North Dakota at 645 The national labor force participation rate for women in 2020 was 562
The states male labor force participation rate ranked fourth at 735 behind Utah at 756 Nebraska at 754 and Colorado at 745 The national labor force participation rate for men was 677 in 2020
There can be several reasons why South Dakota civilians are not in the labor force Approximately 93 of South Dakotans who are not in the labor force do not want a job at this time Other reasons include specific barriers to employment such as discouragement and poor job prospects as detailed in the following table
2020 Annual Average Labor Force Participation Rates by Age
Total 16-24 25-34 35-44 45-54 55-64 65+
United States 617 539 814 822 806 647 194
South Dakota 689 646 861 873 865 730 278
Source US Bureau of Labor Statistics Current Population Survey
South Dakota Civilians Not in the Labor Force by Age and Sex
Age Sex
Total 16 to 24 25 to 54 55 years Men Women
Total not in the labor force 211200 35200 42100 134000 89700 121600
Do not want a job now 195700 29900 36000 129800 81300 114500
Want a job 15500 5300 6100 4100 8400 7100
Did not search for work in previous year 11900 4000 4100 3700 6100 5800
Searched for work in previous year 3600 1300 1900 400 2200 1300
Not available to work now 1000 500 400 100 600 400
Available to work now 2600 800 1600 200 1700 900
Reason not currently looking
Discouragement over job prospects 700 300 400 100 500 300
Reasons other than discouragement 1900 500 1200 100 1200 700
Note Subject to high rates of variability January 2020 - December 2020 reference periodSource Special tabulations of unpublished Current Population Survey (CPS) US Bureau of Labor Statistics
642735
Page 9
South Dakotarsquos labor force which consists of the employed and unemployed continues to grow indicating a healthy labor market Using seasonally adjusted data for a more straightforward economic indicator over
the long term South Dakotarsquos labor force had been increasing gradually since the recession ended in 2009 The number of unemployed began to increase in March 2016 and continued this movement until October 2017 when it began to decrease for the next 11 months Another upward trend began in November 2018 which continued until November 2019
Unemployment had stabilized in 2020 until the COVID-19 pandemic hit South Dakotarsquos economy in April sending the number of unemployed to unprecedented levels
The unemployed data series consists of more than those people who have lost a job It includes those who have quit their jobs to look for other employment workers whose temporary jobs have ended individuals looking for their first job and experienced workers looking for jobs after an absence from the labor force (for example stay-at-home parents who return to the labor force after their children have entered school)
The level of employed also took a big hit in April 2020 when the pandemic began But as illustrated in the line graph below South Dakota was quick to recover after the initial shock of COVID-19 Our state was one of seven that did not issue stay-at-home orders and the only one that did not require any businesses to close during the pandemic This helped soften the blows the pandemic dealt impacts in South Dakota were less severe than in other states and nation By the end of 2020 the number of unemployed was close to pre-pandemic levels And by December 2020 the number of employed South Dakotans actually exceeded 2019 levels
The 2020 annual unemployment rate was 46 in South Dakota compared to the national rate of 81 After the unemployment rate spiked to 92 in April 2020 it declined rapidly and was back to 33 by December 2020
Labor ForceEmployed +
Unemployed= Labor Force
Page 10
2021 Labor Force Data Show Pandemic Recovery Continues
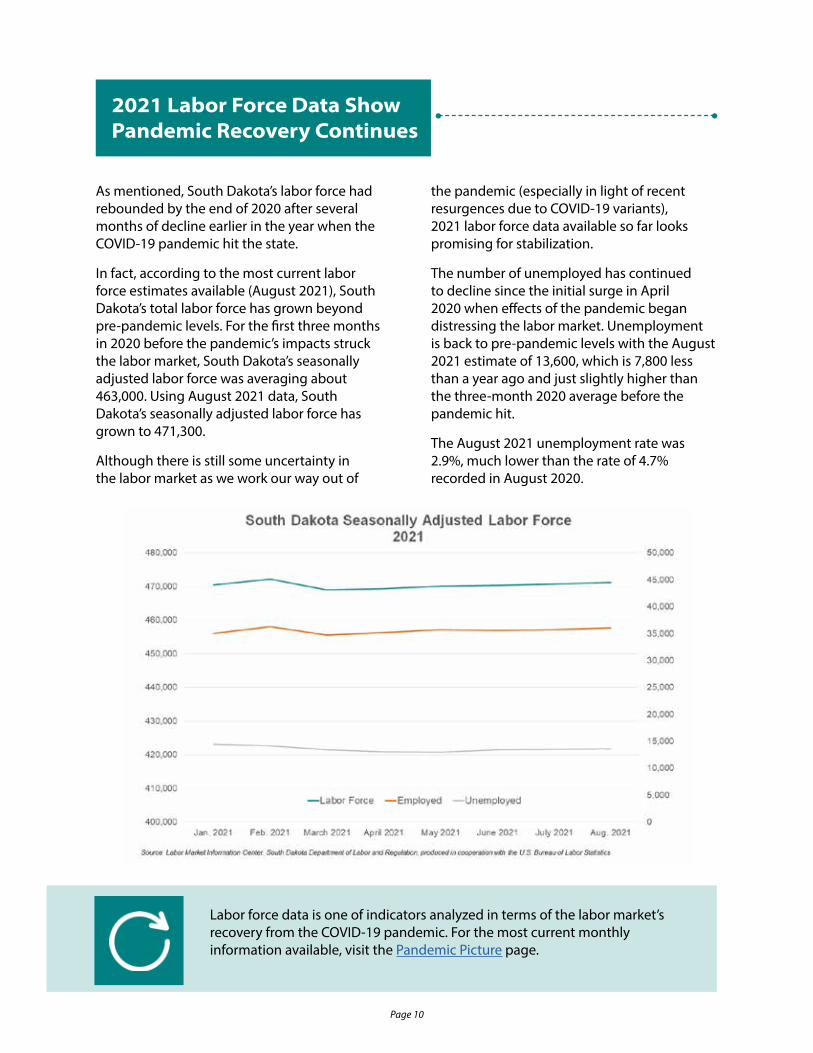
As mentioned South Dakotarsquos labor force had rebounded by the end of 2020 after several months of decline earlier in the year when the COVID-19 pandemic hit the state
In fact according to the most current labor force estimates available (August 2021) South Dakotarsquos total labor force has grown beyond pre-pandemic levels For the first three months in 2020 before the pandemicrsquos impacts struck the labor market South Dakotarsquos seasonally adjusted labor force was averaging about 463000 Using August 2021 data South Dakotarsquos seasonally adjusted labor force has grown to 471300
Although there is still some uncertainty in the labor market as we work our way out of
the pandemic (especially in light of recent resurgences due to COVID-19 variants) 2021 labor force data available so far looks promising for stabilization
The number of unemployed has continued to decline since the initial surge in April 2020 when effects of the pandemic began distressing the labor market Unemployment is back to pre-pandemic levels with the August 2021 estimate of 13600 which is 7800 less than a year ago and just slightly higher than the three-month 2020 average before the pandemic hit
The August 2021 unemployment rate was 29 much lower than the rate of 47 recorded in August 2020
Labor force data is one of indicators analyzed in terms of the labor marketrsquos recovery from the COVID-19 pandemic For the most current monthly information available visit the Pandemic Picture page
Page 11
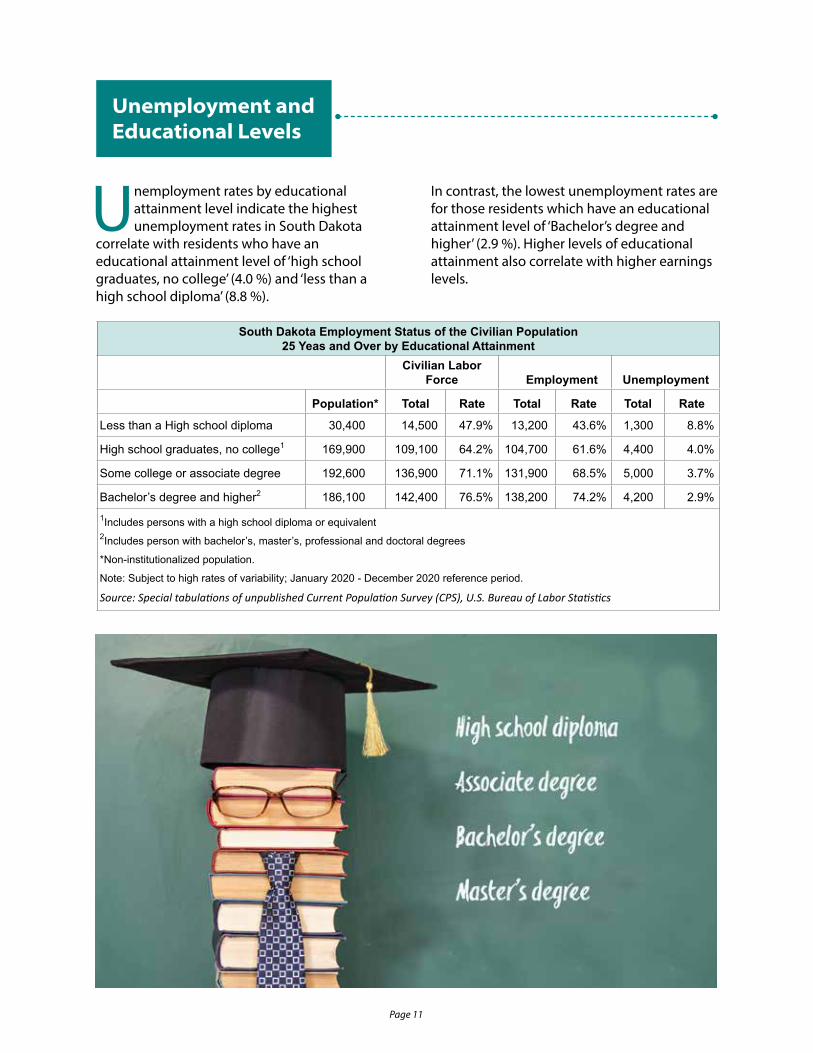
Unemployment rates by educational attainment level indicate the highest unemployment rates in South Dakota
correlate with residents who have an educational attainment level of lsquohigh school graduates no collegersquo (40 ) and lsquoless than a high school diplomarsquo (88 )
Unemployment and Educational Levels
In contrast the lowest unemployment rates are for those residents which have an educational attainment level of lsquoBachelorrsquos degree and higherrsquo (29 ) Higher levels of educational attainment also correlate with higher earnings levels
South Dakota Employment Status of the Civilian Population 25 Yeas and Over by Educational Attainment
Civilian Labor Force Employment Unemployment
Population Total Rate Total Rate Total Rate
Less than a High school diploma 30400 14500 479 13200 436 1300 88
High school graduates no college1 169900 109100 642 104700 616 4400 40
Some college or associate degree 192600 136900 711 131900 685 5000 37
Bachelorrsquos degree and higher2 186100 142400 765 138200 742 4200 291Includes persons with a high school diploma or equivalent2Includes person with bachelorrsquos masterrsquos professional and doctoral degrees
Non-institutionalized population
Note Subject to high rates of variability January 2020 - December 2020 reference period
Source Special tabulations of unpublished Current Population Survey (CPS) US Bureau of Labor Statistics
Page 12
Page 13
Total Employment
The US Bureau of Economic Analysis (BEA) also publishes employment data for state and local areas which includes an estimate of the total number of jobs including detail by full-time or part-time status (full-time and part-time jobs are counted at equal weight) and by place of
work Employees sole proprietors and active partners are all included but unpaid family workers and volunteers are not Proprietors are those workers who own and operate their own businesses and are reported as either farm or nonfarm workers
The number of workers covered by unemployment insurance is a key component of the employment data published by the BEA and in information compiled by the US Bureau of Labor Statistics More information regarding covered workers in South Dakota is available on the Labor Market Information Center website
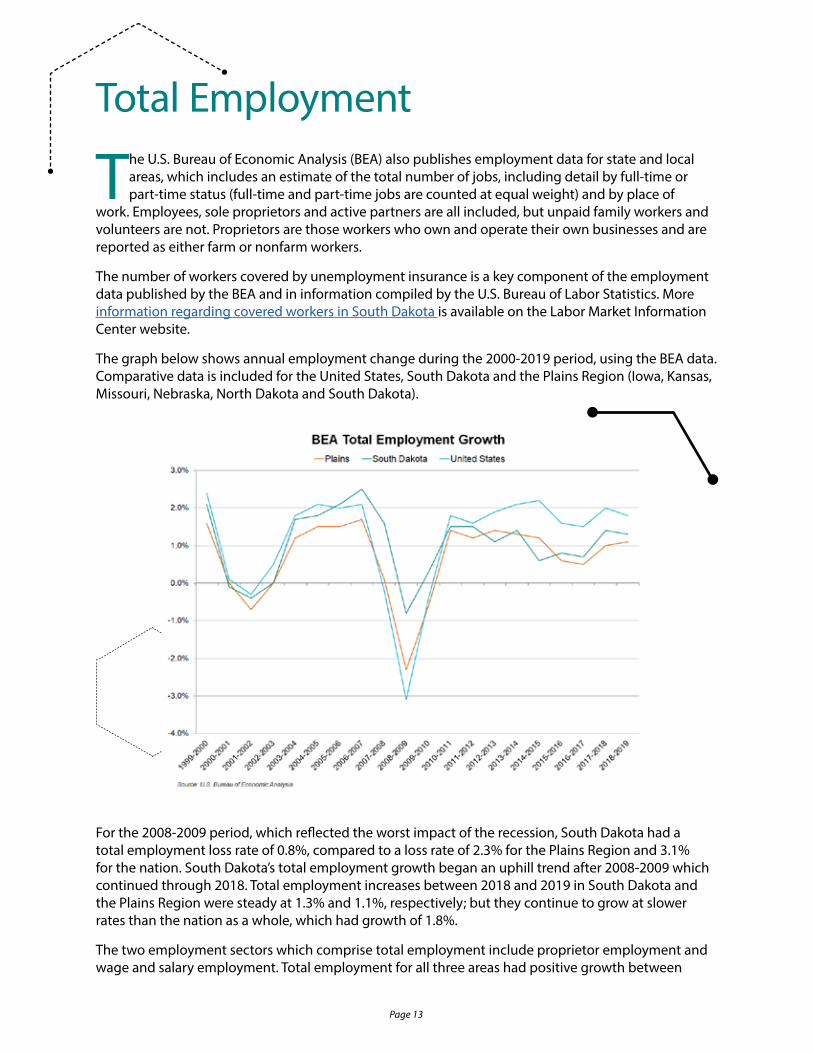
The graph below shows annual employment change during the 2000-2019 period using the BEA data Comparative data is included for the United States South Dakota and the Plains Region (Iowa Kansas Missouri Nebraska North Dakota and South Dakota)
For the 2008-2009 period which reflected the worst impact of the recession South Dakota had a total employment loss rate of 08 compared to a loss rate of 23 for the Plains Region and 31 for the nation South Dakotarsquos total employment growth began an uphill trend after 2008-2009 which continued through 2018 Total employment increases between 2018 and 2019 in South Dakota and the Plains Region were steady at 13 and 11 respectively but they continue to grow at slower rates than the nation as a whole which had growth of 18
The two employment sectors which comprise total employment include proprietor employment and wage and salary employment Total employment for all three areas had positive growth between
Page 14
2014-2019 The largest percent employment increases have come from proprietor employment however wage and salary employment has also had positive growth annually
In South Dakota total employment growth from 2018-2019 outpaced the Plains Region by 02 percentage points but was a behind the United States as a whole by 05 percentage points South Dakota was also slightly ahead of the Plains Region in wage and salary employment growth South Dakotarsquos proprietor employment grew at a faster rate of 26 than wage and salary employment at 08 over the most recent period Both the Plains Region and the United States experienced this trend
Growth by Employment Sector
Total Employment 2014-2015 2015-2016 2016-2017 2017-2018 2018-2019
South Dakota 06 08 07 14 13
Plains Region 12 06 05 10 11
United States 22 16 15 20 18
Proprietor Employment 2014-2015 2015-2016 2016-2017 2017-2018 2018-2019
South Dakota 02 09 07 25 26
Plains Region 09 07 02 17 27
United States 28 18 23 33 31
Wage and Salary Employment 2014-2015 2015-2016 2016-2017 2017-2018 2018-2019
South Dakota 07 08 06 10 08
Plains Region 13 06 06 08 07
United States 20 15 13 16 13
Source US Bureau of Economic Analysis
Page 15
The Bureau of Labor Statistics (BLS) also publishes national estimates of the self-employed for both the agriculture (and related industries) and the nonfarm industry sectors The data is from the Current Population Survey (CPS) data Total self-employed workers decreased by 287000
or 30 in 2020 following a decrease of 17 in 2019 Total self-employed workers are comprised of two components agriculture forestry fishing and hunting industries and nonagricultural industries The agricultural forestry fishing and hunting industries increased by 1000 (01) while the nonagricultural industries decreased by 288000 (33)
United States Self-Employed Workers
Year Total
Agriculture Forestry Fishing
and HuntingNonagricultural
Industries
2016 9604000 853000 8751000
2017 9526000 790000 8736000
2018 9707000 766000 8941000
2019 9540000 741000 8799000
2020 9253000 742000 8511000
Net Change 2016-2020 -351000 -111000 -240000
Percent Change -37 -130 -27
Source US Bureau of Labor Statistics Current Population Survey
Self Employment
Page 16
Page 17
Worker Commuting
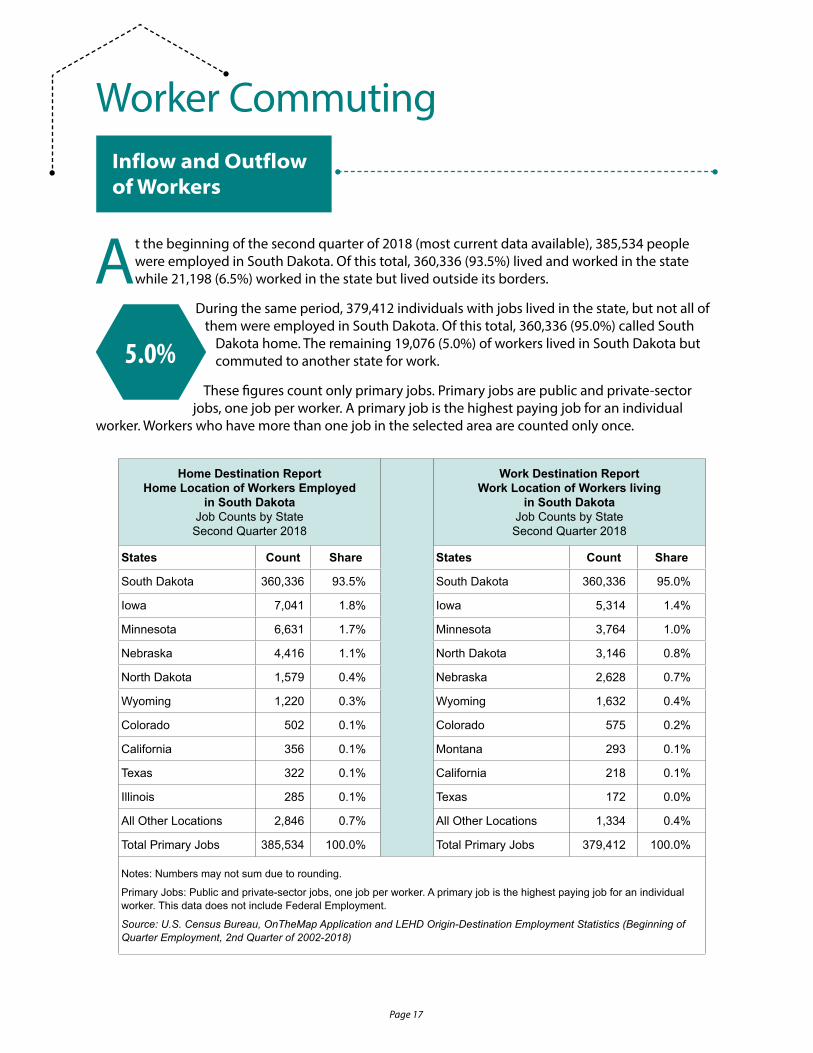
At the beginning of the second quarter of 2018 (most current data available) 385534 people were employed in South Dakota Of this total 360336 (935) lived and worked in the state while 21198 (65) worked in the state but lived outside its borders
During the same period 379412 individuals with jobs lived in the state but not all of them were employed in South Dakota Of this total 360336 (950) called South
Dakota home The remaining 19076 (50) of workers lived in South Dakota but commuted to another state for work
These figures count only primary jobs Primary jobs are public and private-sector jobs one job per worker A primary job is the highest paying job for an individual
worker Workers who have more than one job in the selected area are counted only once
Inflow and Outflow of Workers
Home Destination Report Home Location of Workers Employed
in South DakotaJob Counts by State
Second Quarter 2018
Work Destination Report Work Location of Workers living
in South DakotaJob Counts by State
Second Quarter 2018
States Count Share States Count Share
South Dakota 360336 935 South Dakota 360336 950
Iowa 7041 18 Iowa 5314 14
Minnesota 6631 17 Minnesota 3764 10
Nebraska 4416 11 North Dakota 3146 08
North Dakota 1579 04 Nebraska 2628 07
Wyoming 1220 03 Wyoming 1632 04
Colorado 502 01 Colorado 575 02
California 356 01 Montana 293 01
Texas 322 01 California 218 01
Illinois 285 01 Texas 172 00
All Other Locations 2846 07 All Other Locations 1334 04
Total Primary Jobs 385534 1000 Total Primary Jobs 379412 1000
Notes Numbers may not sum due to rounding
Primary Jobs Public and private-sector jobs one job per worker A primary job is the highest paying job for an individual worker This data does not include Federal Employment
Source US Census Bureau OnTheMap Application and LEHD Origin-Destination Employment Statistics (Beginning of Quarter Employment 2nd Quarter of 2002-2018)
50
Page 18
South Dakota Working Commuting Flows
Commuting to work data is possible through a partnership between the US Census Bureau and the Labor Market Information Center (LMIC) on the Longitudinal Employer-Household Dynamics program Call the Labor Market Information Center at 6056262314 if you are interested in siimilar data for your specific area of the state
Page 19
Advertised Job Openings
This data is developed by Geographic Solutions Inc the vendor of the virtual labor market data system It uses ldquospideringrdquo to collect content from job openings posted by a wide variety of entities from major job boards to employersrsquo websites
Although a rather erratic measure data on the number of job openings advertised online (available in the virtual labor
market data system) provides an indicator of more recent activity in the labor market than the more traditional workfirce data sets allow This measure includes all job openings advertised online whether those openings are advertised on employer websites or major job boards including SDWORKS the statersquos jobs database
There were 177118 South Dakota jobs advertised online in 2020 As the line graph below shows the lowest pandemic-related slump in advertised job openings was in May 2020 at just under 30000 Job opening
numbers then began rebounding climbing to September 2020 Numbers then began a downslide to Decemberrsquos level of 36108 which was likely more of a seasonal reflection
Job openings data downloaded daily from the virtual system during the worst of the pandemic shows the very lowest point for jobs being advertised online was in late April 2020
Monthly data available as of August 2021 show job openings climbing from January to May hitting a new high mark of 42468 in May 2021 before dropping slightly in June 2021
177118
Page 20
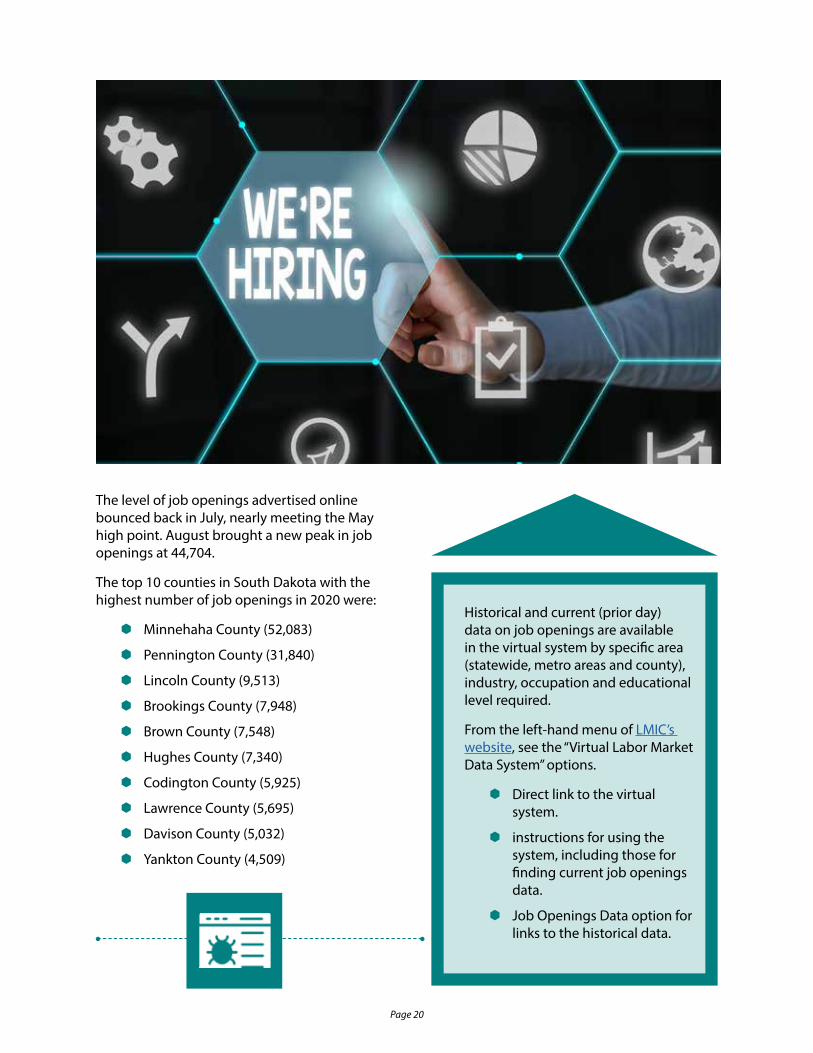
The level of job openings advertised online bounced back in July nearly meeting the May high point August brought a new peak in job openings at 44704
The top 10 counties in South Dakota with the highest number of job openings in 2020 were
yen Minnehaha County (52083)
yen Pennington County (31840)
yen Lincoln County (9513)
yen Brookings County (7948)
yen Brown County (7548)
yen Hughes County (7340)
yen Codington County (5925)
yen Lawrence County (5695)
yen Davison County (5032)
yen Yankton County (4509)
Historical and current (prior day) data on job openings are available in the virtual system by specific area (statewide metro areas and county) industry occupation and educational level required
From the left-hand menu of LMICrsquos website see the ldquoVirtual Labor Market Data Systemrdquo options
yen Direct link to the virtual system
yen instructions for using the system including those for finding current job openings data
yen Job Openings Data option for links to the historical data
Page 21
Nonfarm Wage and Salaried Workers
This sample-based data set is a leading economic indicator nationally providing employment levels by industry each month
South Dakotarsquos nonfarm worker levels had significant declines in 2020 dropping 15100 workers (34) The
2020 annual average number of workers was 425400 Statewide privately owned nonfarm establishments had an average annual loss of 11800 workers (33) dropping to 348700 workers in 2020
The Sioux Falls Metropolitan Statistical Area (MSA) nonfarm worker level decreased 4300 workers (27) for a 2020 annual average of 155800 workers The Rapid City MSA also declined with a loss of 2600 workers (38) The bulk of the over-the-year worker level losses were due to COVID-19 with many establishments having reduced staffing in 2020 compared to 2019
South Dakota Statewide Nonfarm Wage amp Salaried Workers by Industry
(Not Seasonally Adjusted)
Industry
2019 Annual Average
2020 Annual Average
Actual Change
Percent Change
Total Nonfarm 440500 425400 -15100 -34
Total Private 360500 348700 -11800 -33
Goods Producing 69600 68300 -1300 -19
Service Providing 370900 357000 -13900 -37
Mining Logging and Construction 24600 25200 600 24
Manufacturing 45000 43200 -1800 -40
Wholesale Trade 21100 21000 -100 -05
Retail Trade 51200 49600 -1600 -31
Transportation Warehousing and Utilities 13500 13300 -200 -15
Information 5500 5000 -500 -91
Financial Activities 29000 28400 -600 -21
Professional and Business Services 33200 32700 -500 -15
Education and Health Services 73200 73100 -100 -01
Leisure and Hospitality 47400 40700 -6700 -141
Other Services (except Public Administration) 16800 16600 -200 -12
Government 80000 76700 -3300 -41
Note Numbers may not add due to rounding Source Labor Market Information Center South Dakota Department of Labor and Regulation in cooperation with US Bureau of Labor Statistics
Page 22
Nonfarm worker levels can be divided into two major components
yen Goods Producing
yen Service Providing
Goods Producing industries (including the Mining Logging and Construction and the Manufacturing sector designated in the lighter color in the bar graph below) decreased by 1300 workers (19) from 2019 to 2020
Service Providing industries (all other sectors listed in the table above) had a loss of 13900 workers (37)
Page 23
Mining Logging and ConstructionMining Logging and Construction increased 600 workers (24) for a 2020 annual average of 25200 Construction paved the way to this increase adding 600 workers and reaching an annual average of 24200 workers in 2020
Heavy and Civil Engineering Construction accounted for the majority of the growth in construction with the addition of 500 workers (125) This growth was related to infrastructure improvements as locations throughout the state continue to grow or need repairs Highway and street construction land development development or repair of utilities systems (including water sewer power and communication networks) are a few of types of projects undertaken
Specialty Trade Contractors had a modest growth of 100 workers (07) and Construction of Buildings remained unchanged at 5800 workers
Mining and Logging remained unchanged from 2019 to 2020 with 1000 workers
ManufacturingManufacturing declined 1800 workers (40) over the year dropping to a 2020 annual average of 43200 workers Durable Goods Manufacturing accounted for all of this decline (63)
Durable goods produced in South Dakota such as trailers furniture and electronic equipment are not immediately consumed and can be kept for a longer time This drop was related to small worker level declines throughout many establishments along with challenges intensified by COVID-19 (such as supply chain issues and demand fluctuations)
Non-Durable Goods Manufacturing remained unchanged with a 2020 annual average of 16300 workers Non-durable goods are immediately consumed in one use or have a lifespan of less than three years Examples of non-durable goods produced or processed in South Dakota include food and beverage products paper products and fuel
2020 Industry Trends
Page 24
Wholesale TradeWholesale Trade had a modest loss of 100 workers (05) dropping to a 2020 annual average of 21000 workers Losses in Wholesale Trade took place outside of the Sioux Falls and Rapid City MSAs
The Wholesale Trade sector consists of establishments engaged in wholesaling merchandise and rendering services incidental to merchandise The merchandise in this sector consists of the outputs of agriculture mining manufacturing and certain information industries like publishing Wholesale Trade worker levels tend to follow the same path as Manufacturing however South Dakotarsquos strong agriculture economy helped keep this sectorrsquos loss minimal during 2020
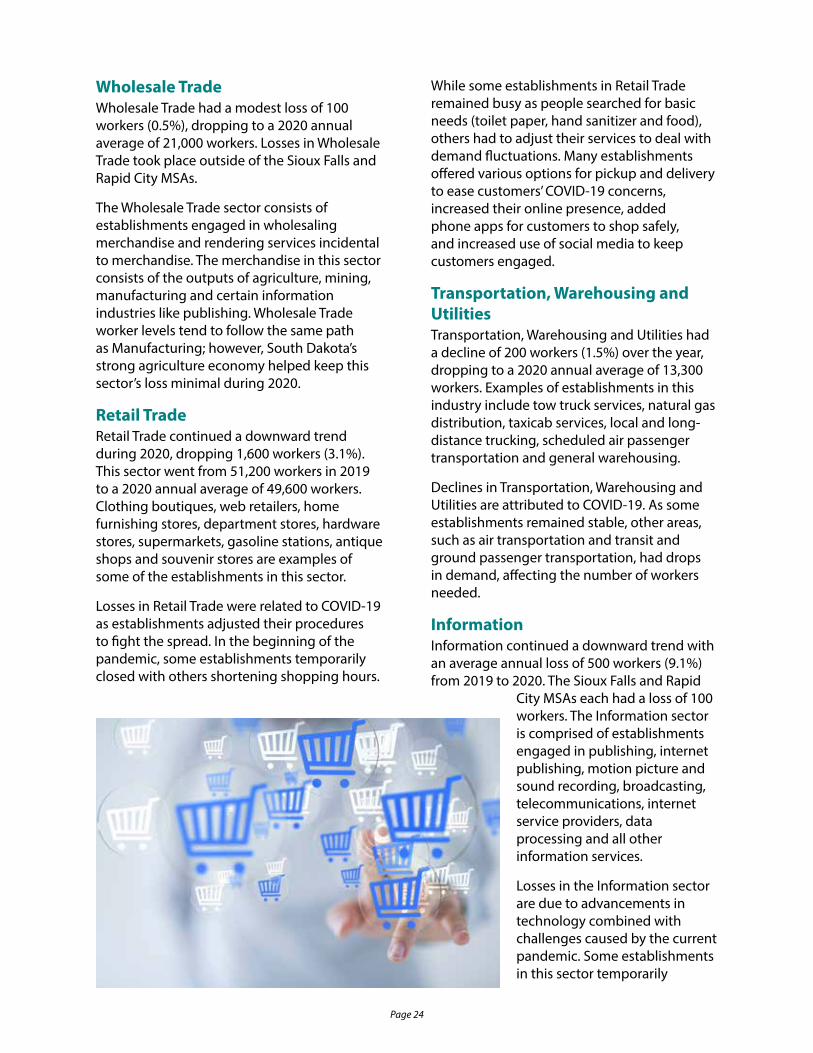
Retail TradeRetail Trade continued a downward trend during 2020 dropping 1600 workers (31) This sector went from 51200 workers in 2019 to a 2020 annual average of 49600 workers Clothing boutiques web retailers home furnishing stores department stores hardware stores supermarkets gasoline stations antique shops and souvenir stores are examples of some of the establishments in this sector
Losses in Retail Trade were related to COVID-19 as establishments adjusted their procedures to fight the spread In the beginning of the pandemic some establishments temporarily closed with others shortening shopping hours
While some establishments in Retail Trade remained busy as people searched for basic needs (toilet paper hand sanitizer and food) others had to adjust their services to deal with demand fluctuations Many establishments offered various options for pickup and delivery to ease customersrsquo COVID-19 concerns increased their online presence added phone apps for customers to shop safely and increased use of social media to keep customers engaged
Transportation Warehousing and UtilitiesTransportation Warehousing and Utilities had a decline of 200 workers (15) over the year dropping to a 2020 annual average of 13300 workers Examples of establishments in this industry include tow truck services natural gas distribution taxicab services local and long-distance trucking scheduled air passenger transportation and general warehousing
Declines in Transportation Warehousing and Utilities are attributed to COVID-19 As some establishments remained stable other areas such as air transportation and transit and ground passenger transportation had drops in demand affecting the number of workers needed
InformationInformation continued a downward trend with an average annual loss of 500 workers (91) from 2019 to 2020 The Sioux Falls and Rapid
City MSAs each had a loss of 100 workers The Information sector is comprised of establishments engaged in publishing internet publishing motion picture and sound recording broadcasting telecommunications internet service providers data processing and all other information services
Losses in the Information sector are due to advancements in technology combined with challenges caused by the current pandemic Some establishments in this sector temporarily
Page 25
closed when the pandemic began with some dealing with a decline in demand Consumers now have more opportunities to stream new entertainment releases once available only at movie theaters The opportunities are endless when it comes to what you can do with your phone computer tablet or smart TV Pandemic-induced sheltering at home further intensified use of such options for remote entertainment As technology continues to evolve the demand for workers in this sector will continue to fluctuate
Financial ActivitiesFinancial Activities had a loss of 600 workers (21) over the year This supersector went from a 2019 annual average of 29000 to a 2020 annual average of 28400 workers
Over half of the workers in the Financial Activities supersector are located in the Sioux Falls MSA (15400 workers) This supersector had a loss of 300 workers in the Sioux Falls MSA and 200 workers in the Rapid City MSA
Credit card banks saving institutions portfolio fund managing insurance claims adjusting real estate agencies residential property management and home health equipment rental are examples of establishments in this supersector
During 2020 many establishments in this industry made significant changes in how they operate due to COVID-19 These changes included switching from in-person appointments to online meetings temporarily closing lobby areas to the public and the increased utilization of electronic signatures all which impacted the demand for workers
Professional and Business ServicesProfessional and Business Services decreased 500 workers (15) dropping to an average of 32700 A bulk of this decline took place in the Sioux Falls MSA (500 workers or 32)
The Professional and Business Services supersector is broken down into the following sectors
yen Professional Scientific and Technical Services
yen Management of Companies and Enterprises
yen Administrative and Support and Waste Management and Remediation Services
As travel decreased and events were canceled in 2020 due to COVID-19 the demand for services in establishments involved in areas such as travel planning sports ticket offices security guard services and temporary help services decreased
Education and Health ServicesEducation and Health Services had a modest decline with the loss of 100 workers (01) Worker level losses in Educational Services accounted for this decline dropping 400 workers (57) This number includes private educational services as public educational services are included in government worker levels
Health Care and Social Assistance added 300 workers (05) reaching an annual average of 66500 in 2020 Establishments in Health Care and Social Assistance include dentist offices chiropractors childcare centers assisted living facilities and vocational rehabilitation agencies
Page 26
Hospitals had significant gains from 2019 to 2020 adding 1100 workers (43) Increases may be related to establishments increasing worker levels due to increased patient load as well as safety procedures (such as temperature checks and even more extensive cleaning and disinfecting) to combat the spread of COVID-19
Leisure and HospitalityLeisure and Hospitality had the largest decrease of all supersectors in 2020 with a loss of 6700 workers (141) Establishments included in this supersector include hotels restaurants performing arts fitness centers museums and parks
COVID-19 significantly affected Leisure and Hospitality establishments with patronage of such businesses down drastically among both local residents and visitors from outside the area due to health concerns Both leisure and business travel were limited during the worst of the pandemic According to the South Dakota Department of Tourism 126 million visitors traveled to South Dakota in 2020 compared to 145 million visitors 2019
Had it not been for the resiliency and adaptability of South Dakota employers declines in this supersector would have been even worse Establishments made every effort to remain open reassuring patrons to keep their business during the pandemic Businesses increased cleaning efforts and made changes to promote social distancing such as limited seating Many restaurants offered only drive-through service curb-side pick-up or delivery Lodging facilities offered contactless check-in and switched breakfast offerings to only pre-packaged items
Other ServicesOther Services (except Public Administration) declined 200 workers (12) over the year dropping from 16800 workers in 2019 to 16600 in 2020 A majority of the losses were due to the pandemic Many establishments
reduced their workforce to lower the impact with some temporary closing in the beginning of the pandemic Examples of establishments in this sector include beauty salons car washes wedding planning services civic and social organizations general automotive repair shops and pet boarding services
GovernmentGovernment decreased 41 from 2019 to 2020 with the loss of 3300 workers Federal Government added 300 workers (27) State Government lost 1200 workers (65) with the bulk (1100 workers 117) in State Government Educational Services
Local Government declined 2400 workers (48) Tribal city and county governments along with public and tribal school districts are included in Local Government Local Government Educational Services decreased 1100 workers (42) over the year and Local Government excluding Educational Services declined 1300 workers (54)
Worker declines in both State and Local Government Education were due to schools adapting operations to lower the spread of COVID-19 which in turn impacted the demand for workers Changes included moving from in-person classes to an online format canceling sports and social activities and closing on-campus facilities like recreation centers and food service Losses in other Local Government were due to city programs and services put on hold to slow COVID-19rsquos impact
Page 27
As mentioned earlier the nonfarm wage and salaried worker series provides the most current data available on industry
employment levels Although the main focus of this publication is calendar year 2020 the pandemic heightened the value of the nonfarm estimates as the latest indicators of monthly trends in South Dakotarsquos industries
Using not seasonally adjusted data letrsquos start with a look at what transpired month to month during the height of the pandemic in 2020 While the number of nonfarm workers rose by 2300 from January to February 2020 worker levels began declining by March (down 1100)
Even though establishments began altering their processes or closing temporarily in March 2020 as the pandemic first hit South Dakota April brought far more pronounced worker declines Worker levels plummeted from March to April 2020 dropping an unprecedented 36600 workers (85) to hit a low of 395800
May estimates hinted a recovery was beginning with worker levels up 13700 from April Worker levels continued trending upward to October 2020 reaching 433700 Many nonfarm establishments throughout South Dakota had adopted new procedures
Measuring industry recovery from pandemic using most current data
in order to combat the spread while trying to get back on track with their business operations Some increased worker levels as demand for products and services resumed
Worker levels dipped in November (3200 workers) and had a modest increase in December 2020 (100 workers) reaching 430600 workers
In January 2021 worker levels declined 9300 Worker level drops are common this time of year as many seasonal establishments
(Retail Trade Construction and Leisure and Hospitality) reduce their workforce after the winter holidays and as the weather turns cold
As the line graph on the following page illustrates South Dakota nonfarm worker levels have trended upward for the most part in 2021 Thankfully many events canceled in 2020 due to COVID-19 are back on the calendars in 2021 Stores expanded hours restaurants reopened dining rooms and establishments increased capacitymdashall increasing the demand for workers
From January to February 2021 the total nonfarm level increased 2900 Government accounted for much of the growth a typical seasonal pattern as state education returned to normal staffing levels after winter break
In March 2021 worker levels gained 3300 with relatively small increases throughout many of the industries The upward climb continued to April 2021 with the addition of 4400 workers half in Construction Construction worker levels typically start ticking up along with
2021
Page 28
temperatures in the spring as crews begin repairing roads and building construction activity picks up
May brought a continued upswing of nonfarm worker levels (6300) the total reached 438200 Leisure and Hospitality had the largest over-the-month growth (4100) a positive sign as businesses ramped up staffing to prepare for the inflow of visitors over the summer
In June 2021 worker levels shot up another 8000 reaching 446200 workers This gain was again largely in Leisure and Hospitality (3900 workers) but Construction (2000 workers) Retail Trade (1100 workers) and Professional and Business Services (1000 workers) also made considerable contributions to the growth Seasonal gains are common in the summer as establishments hire more part-time workers during the summer
These jobs provide many high school and college students opportunities to gain work experience and earn money during summer break
South Dakota nonfarm worker levels dipped in July to 444200 workers but the drop was largely seasonal and not unexpected Government dropped 5200 workers in July with educational workers dropping off school payrolls for the summer break
Worker levels continued to trend downward in August dipping to 443200 Other Services (except Public Administration) had the largest over-the-month drop with the loss of 900 workers (49 percent) Losses in Other Services (except Public Administration) are due to small worker declines throughout many types of establishments in this sector
Nonfarm worker data is one of indicators analyzed in terms of the labor marketrsquos recovery from the COVID-19 pandemic For the most current monthly information available visit the Pandemic Picture page
Page 29
Quarterly Census of Employment and Wages (QCEW)
The Quarterly Census of Employment and Wages program provides information about workers covered by South Dakota
unemployment insurance law and the Unemployment Compensation for Federal Employees (UCFE) program Covered workers include employees who are paid a wage or salary during the year it excludes the self-employed and unpaid family workers
Wage and salaried workers are covered regardless of type of ownership Employees working at privately owned businesses and
federal state and local government agencies are all included
However not all employees are covered workers South Dakota wage and salaried workers not covered by South Dakota unemployment insurance laws include railroad employees government elected officials election workers work-study students and religious organization employees (Some religious organizations opt to provide unemployment insurance coverage to their employees those organizations are included in this publication) Nonprofit organizations
As implied by ldquocensusrdquo in the title this is the most comprehensive data set on employment and pay
Page 30
may or may not be covered by unemployment insurance depending upon whether they meet specific employment requirements
Smaller businesses may also be exempted from coverage if they do not meet unemployment insurance law minimum payroll and employment criteria Businesses who hire only a few workers on a part-time or seasonal basis such as agricultural businesses make up a large part of the exempted group
The data on workers covered by South Dakota unemployment insurance law is collected through the quarterly employment and wage reports submitted by South Dakota employers to the Division of Reemployment Assistance of the South Dakota Department of Labor and Regulation Each employer is assigned an industry classification and a county code The industry classification is determined by the business activity and type of ownership The county code is determined by worksite location (store branch office etc)
96
The Labor Market Information Center (LMIC) also collects supplemental data from employers in cooperation with the US Bureau of Labor Statistics For example although the quarterly reports submitted by liable employers are based on employer serial number the LMIC gathers additional data by establishment A covered employer could include one or more establishments Those establishments could be conducting business at one or more worksite locations Each establishment is given an industry and county code
In 2020 the number of covered wage and salaried workers equaled 960 of South Dakotarsquos wage and salaried workers Covered workers are counted at their place of work A person who works for more than one covered employer is counted at each job
Number of Covered Workers
The number of employees covered by unemployment insurance in 2020 was 417110 a decrease of 30 from 2019 As the bar graph below illustrates just three supersectors showed worker gains (one increasing just 01) during the year Illustrating the plight of the pandemic more
commonly experienced by South Dakota employers employment in eight supersectors decreased during 2020 as shown in the table and graph at the right
Page 31
South Dakota Average Number of Covered Workers by Ownership and Supersector
Private Ownership 2019 2020Percent Change
2019-2020
Natural Resources and Mining 6985 7137 22
Construction 23609 24411 34
Manufacturing 44972 43131 -41
Trade Transportation and Utilities 85125 83190 -23
Information 5500 5074 -77
Financial Activities 28483 27810 -24
Professional and Business Services 33118 32773 -10
Education and Health Services 68913 68991 01
Leisure and Hospitality Services 47413 41003 -135
Other Services 11324 11078 -22
Total Private Ownership 355442 344598 -31
Public Administration
Federal Government 11291 11569 25
State Government 14933 14371 -38
Local Government 48452 46573 -39
Total Government 74676 72512 -29
Statewide Total 430117 417110 -30
Source Quarterly Census of Employment and Wages Labor Market Information Center South Dakota Department of Labor and Regulation in cooperation with the US Bureau of Labor Statistics
Page 32
industries in 2020 See page 41 for more information
Pandemicrsquos ImpactEmployment trends detected by the Quarterly Census of Employment and Wages program during 2020 were much more erratic than normal because of the impacts of the COVID-19 pandemic
Employment levels started out strong in early 2020 before the pandemic hit South Dakota In fact when comparing South Dakota QCEW employment data for the first quarter of 2020 to the first quarter of 2019 there was actually very slight growth in early 2020
As expected first quarter 2020 data did not reflect pandemic-related economic impacts on South Dakota industry employment March 2020 data began showing the pandemicrsquos impacts on South Dakotamdashbut it was slight at first Employment dropped just 405 from 421268 in February 2020 to 420863 in March The big hit came in April 2020 with employers reporting nearly 34000 fewer workers in April than for March In fact April 2020 levels were the lowest point seen throughout the pandemic at 387234
The rebound began in May 2020 with a strong boost of 15260 workers added back to payrolls June brought just about as strong of bounce-back with employment up 13 394 Although the rate of recovery slowed employment continued to climb in July and August reaching 422802
September brought a minimal and seasonally expected decline of 334 workers (01) Continuing to demonstrate the volatility of the pandemicrsquos impact October brought a gain of 08 followed by a 07 decline in worker levels in November Worker levels grew slightly in December ending the year at 423927mdashhigher than before the pandemic hit
More recent QCEW data available indicates South Dakotarsquos strong recovery from the pandemic has continued See the ldquoQCEW Data Show Pandemic Recovery Continuesrdquo section on page 46 for more information
ConstructionConstruction led the pack among the three supersectors showing growth during 2020 with an increase of 802 workers (34) At the sector level Construction had more establishments than any other in 2020 The number of establishments increased by 54 bringing the total to 4202 establishments in 2020 The Construction employment growth was spread throughout all three of its subsectors listed below
yen Heavy and Civil Engineering Construction
yen Construction of Buildings
yen Specialty Trade Contractors
Learn more about Constructionrsquos performance during 2020 on page 37 where it is featured as one of the yearrsquos most noteworthy industries
Natural Resources and MiningMost of the growth in the Natural Resources and Mining supersector during 2020 was in the Agriculture Forestry Fishing and Hunting sector which added 152 workers (22) Soil preparation and planting firms added workers for help with crop planting cultivation spraying and dusting Workers were also hired some in new establishments for animal production activities such as beef cattle ranching and farming Beef cattle farming can be a very profitable business but raising dairy cattle for herd replacement and breeding and raising beef cattle for eventual consumption are labor-intensive operations
Education and Health ServicesAlthough it was the third and final supersector to show growth during 2020 employment growth in Education and Health Services was nearly neglible at 78 workers (01) Slowing growth in Healthcare and Social Services (336 or 05) offset a decline (258 workers 70) in Educational Services
Because of its significance to total covered employment in South Dakota the Education and Health Services supersector is also featured as one of the statersquos noteworthy
Page 33
Annual Pay
Annual pay reflects total compensation paid to covered workers in the form of wages salaries bonuses commission
and overtime pay during the year Annual pay is calculated by dividing total payroll by the average number of workers The 2020 statewide annual pay for workers was $49165 an 89 increase from 2019
Annual pay figures for 2020 were impacted to some extent by government programs designed to provide payroll assistance to businesses negatively impacted by the COVID-19 pandemic As mentioned above annual pay figures include bonuses In some cases bonuses distributed to upper management positions were substantial enough to impact average pay figures
Annual pay is affected by the number of hours worked and the rate of pay Full-time workers normally have higher annual pay than part-time workers do Many of the industries with the lowest annual pay have a sizable percentage of part-time jobs Industry-specific annual pay is determined by the mix of full-time and part-time workers and high-paying and low-paying jobs
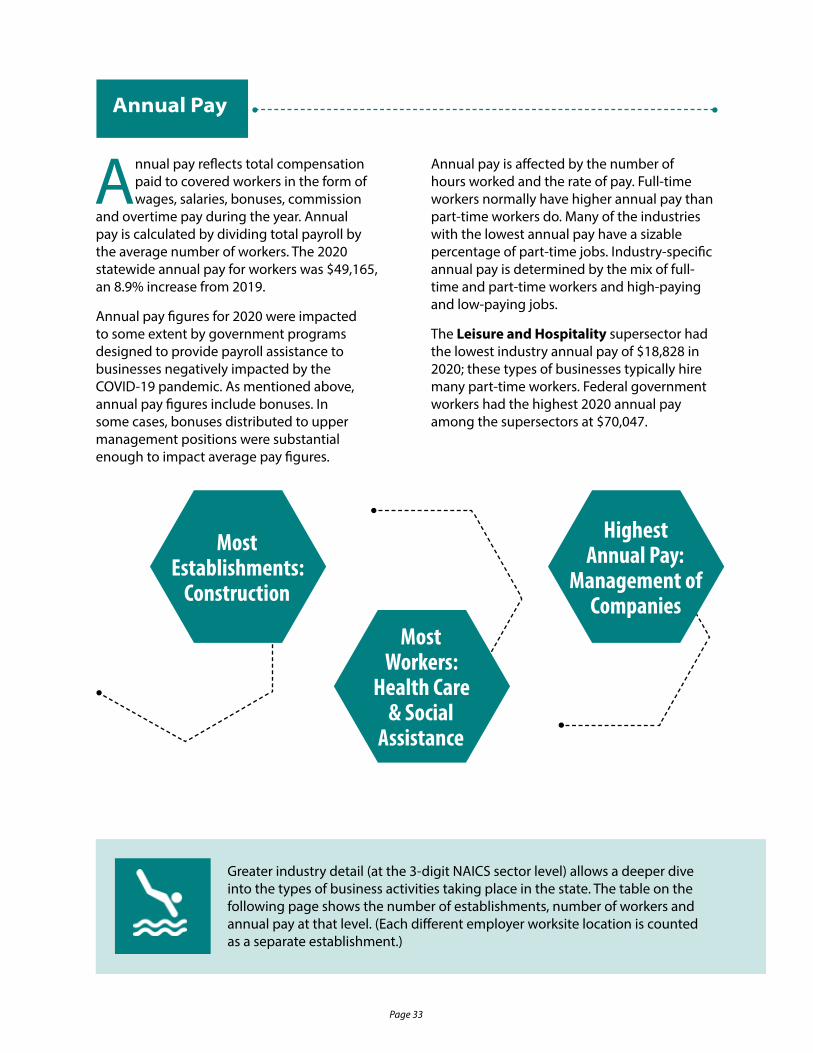
The Leisure and Hospitality supersector had the lowest industry annual pay of $18828 in 2020 these types of businesses typically hire many part-time workers Federal government workers had the highest 2020 annual pay among the supersectors at $70047
Most Establishments
Construction
Most Workers
Health Care amp Social
Assistance
Highest Annual Pay
Management of Companies
Greater industry detail (at the 3-digit NAICS sector level) allows a deeper dive into the types of business activities taking place in the state The table on the following page shows the number of establishments number of workers and annual pay at that level (Each different employer worksite location is counted as a separate establishment)
Page 34
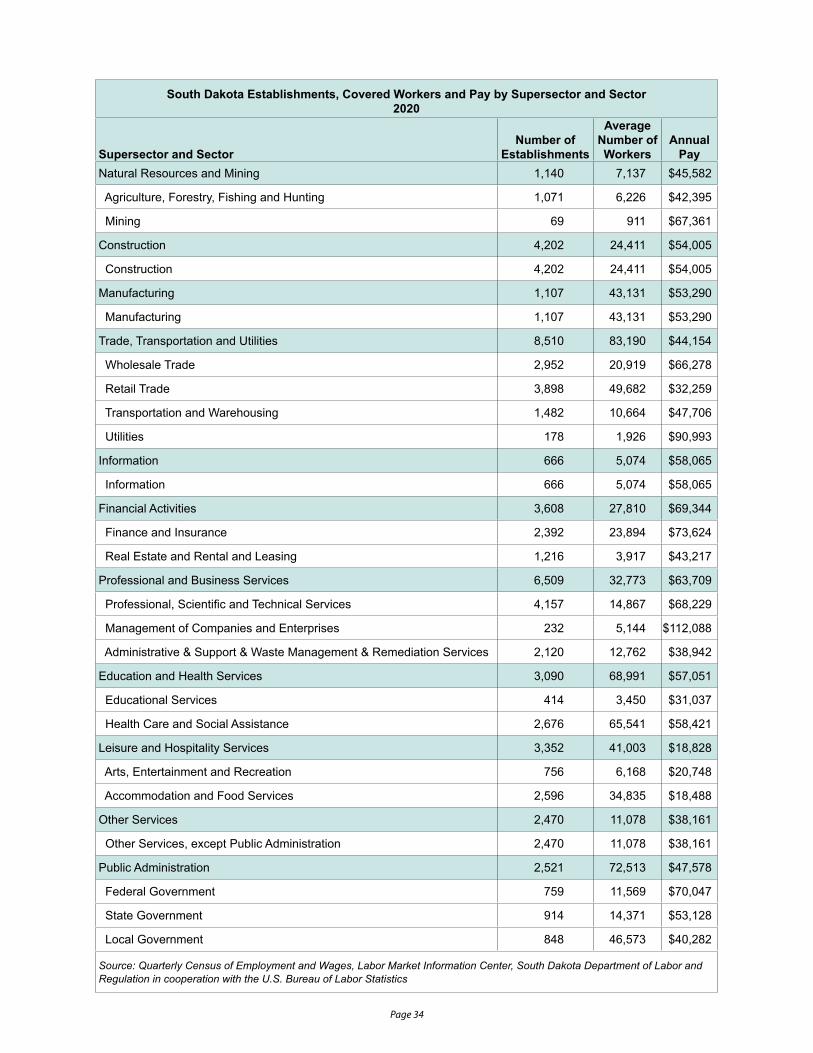
South Dakota Establishments Covered Workers and Pay by Supersector and Sector 2020
Supersector and SectorNumber of
Establishments
Average Number of Workers
Annual Pay
Natural Resources and Mining 1140 7137 $45582
Agriculture Forestry Fishing and Hunting 1071 6226 $42395
Mining 69 911 $67361
Construction 4202 24411 $54005
Construction 4202 24411 $54005
Manufacturing 1107 43131 $53290
Manufacturing 1107 43131 $53290
Trade Transportation and Utilities 8510 83190 $44154
Wholesale Trade 2952 20919 $66278
Retail Trade 3898 49682 $32259
Transportation and Warehousing 1482 10664 $47706
Utilities 178 1926 $90993
Information 666 5074 $58065
Information 666 5074 $58065
Financial Activities 3608 27810 $69344
Finance and Insurance 2392 23894 $73624
Real Estate and Rental and Leasing 1216 3917 $43217
Professional and Business Services 6509 32773 $63709
Professional Scientific and Technical Services 4157 14867 $68229
Management of Companies and Enterprises 232 5144 $112088
Administrative amp Support amp Waste Management amp Remediation Services 2120 12762 $38942
Education and Health Services 3090 68991 $57051
Educational Services 414 3450 $31037
Health Care and Social Assistance 2676 65541 $58421
Leisure and Hospitality Services 3352 41003 $18828
Arts Entertainment and Recreation 756 6168 $20748
Accommodation and Food Services 2596 34835 $18488
Other Services 2470 11078 $38161
Other Services except Public Administration 2470 11078 $38161
Public Administration 2521 72513 $47578
Federal Government 759 11569 $70047
State Government 914 14371 $53128
Local Government 848 46573 $40282
Source Quarterly Census of Employment and Wages Labor Market Information Center South Dakota Department of Labor and Regulation in cooperation with the US Bureau of Labor Statistics
Page 35
Noteworthy Industry Trends
Hospitality establishments dropped by 43 (13) from 2019 to 2020 while employment declined 6410 (135) Much of this supersector is heavily reliant upon tourism and local residents being ldquoout and aboutrdquo which explains its challenges during the pandemic
Accommodation and Food ServicesThe Accommodation and Food Services sector accounts for the lionrsquos share of both establishments (774) and employment (850) in Leisure and Hospitality (2020 data) Employment in the Accommodation and Food Service sector declined from 40494 workers in 2019 to 34835 workers in 2020
The range of activities in Accommodation and Food Services varies from providing lodging facilities to preparing meals snacks and beverages to patrons for immediate consumption Since both types of services are often found in the same establishment they are included in the same sector
Four industry supersectors are being highlighted below as having especially noteworthy trends during 2020 the year
of the COVID-19 pandemic The highlights below identify North American Industry Classification System (NAICS) codes Learn more about NAICS
yen Leisure and Hospitality
yen Construction
yen Trades Transportation and Utilities
yen Education and Health Services
Leisure and Hospitality ServicesThe Leisure and Hospitality supersector is comprised of the Arts Entertainment
and Recreation sector (NAICS 71) and the Accommodation and Food Services sector (NAICS 72) The number of Leisure and
Page 36
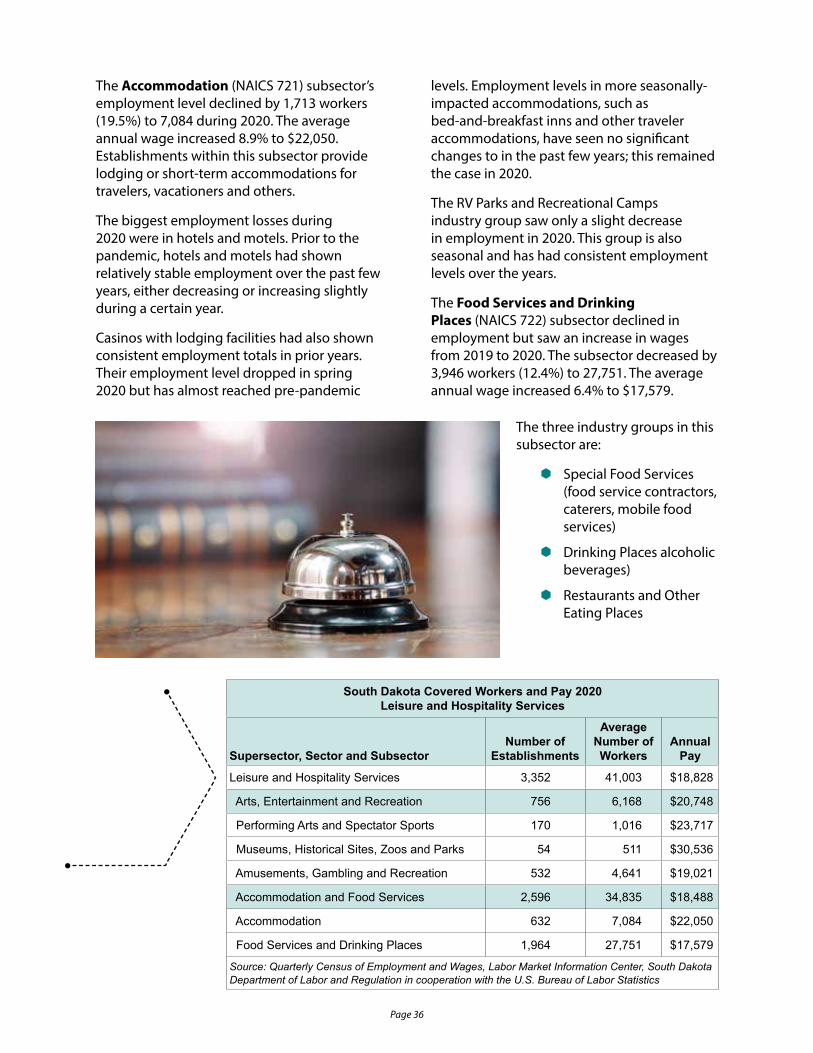
The Accommodation (NAICS 721) subsectorrsquos employment level declined by 1713 workers (195) to 7084 during 2020 The average annual wage increased 89 to $22050 Establishments within this subsector provide lodging or short-term accommodations for travelers vacationers and others
The biggest employment losses during 2020 were in hotels and motels Prior to the pandemic hotels and motels had shown relatively stable employment over the past few years either decreasing or increasing slightly during a certain year
Casinos with lodging facilities had also shown consistent employment totals in prior years Their employment level dropped in spring 2020 but has almost reached pre-pandemic
levels Employment levels in more seasonally-impacted accommodations such as bed-and-breakfast inns and other traveler accommodations have seen no significant changes to in the past few years this remained the case in 2020
The RV Parks and Recreational Camps industry group saw only a slight decrease in employment in 2020 This group is also seasonal and has had consistent employment levels over the years
The Food Services and Drinking Places (NAICS 722) subsector declined in employment but saw an increase in wages from 2019 to 2020 The subsector decreased by 3946 workers (124) to 27751 The average annual wage increased 64 to $17579
South Dakota Covered Workers and Pay 2020 Leisure and Hospitality Services
Supersector Sector and SubsectorNumber of
Establishments
Average Number of Workers
Annual Pay
Leisure and Hospitality Services 3352 41003 $18828
Arts Entertainment and Recreation 756 6168 $20748
Performing Arts and Spectator Sports 170 1016 $23717
Museums Historical Sites Zoos and Parks 54 511 $30536
Amusements Gambling and Recreation 532 4641 $19021
Accommodation and Food Services 2596 34835 $18488
Accommodation 632 7084 $22050
Food Services and Drinking Places 1964 27751 $17579
Source Quarterly Census of Employment and Wages Labor Market Information Center South Dakota Department of Labor and Regulation in cooperation with the US Bureau of Labor Statistics
The three industry groups in this subsector are
yen Special Food Services (food service contractors caterers mobile food services)
yen Drinking Places alcoholic beverages)
yen Restaurants and Other Eating Places
Page 37
yen Construction of Buildings (NAICS 236) ndash perform new building work additions alterations maintenance and repairs
yen Heavy and Civil Engineering Construction (NAICS 237) ndash construct entire engineering projects Also included are contractors whose primary activity is the production of a specific component for such projects-- such as the design and installation of the power structure for a project
yen Specialty Trade Contractors (NAICS 238) ndash perform detailed activities involved in building construction such as pouring concrete site preparation plumbing painting etc
All three Construction subsectors had worker level increases during 2020 The Heavy and
Establishments prepare meals snacks and beverages to customer order for immediate onoff premises consumption Some provide food and drink only while others provide various combinations of seating space waiterwaitress services and incidental amenities such as limited entertainment
All three industry groups contributed to the employment decline Based on longer-term trends employment in the Special Food Services industry group would likely have shown growth had it not been for the pandemic Availability of workers to staff restaurants and bars is especially challenging which was heightened by the pandemic
ConstructionAs noted earlier Construction was one of only three supersectors which showed growth during 2020 There
were 54 establishments added during 2020 and employment increased by 802 (34) over 2019 levels The Construction sector had more establishments than any other sector in 2020 at 4202
The Construction industry is divided into three subsectors
South Dakota Covered Workers and Pay 2020 Construction
Supersector Sector and SubsectorNumber of
Establishments
Average Number of Workers
Annual Pay
Construction 4202 24411 $54005
Construction 4202 24411 $54005
Construction of Buildings 1349 5889 $50969
Heavy and Civil Engineering Construction 440 4535 $67976
Specialty Trade Contractors 2413 13986 $50757
Source Quarterly Census of Employment and Wages Labor Market Information Center South Dakota Department of Labor and Regulation in cooperation with the US Bureau of Labor Statistics
Page 38
Civil Engineering subsector gained the most establishments at 32 followed by Specialty Trade which added 18
The average annual pay for this industry sector increased by $3008 (59) during 2020 bringing the average annual pay to $54005 in 2020 Annual pay increased in all three subsectors
The Heavy and Civil Engineering Construction subsector gained 555 workers (139) in 2020 Utility System Construction was accountable for about two-thirds of this growth Many water sewer power and communication systems needed replacing due to age and damage
Infrastructure remains at the forefront of many construction projects and the trend is expected to continue Many of these projects require assistance from Specialty Trade Contractors as they have the necessary skill sets for parts of the system development such as concrete work and electrical wiring
The Construction of Buildings subsector increased by 97 workers (17) in 2020 to bring the subsectorrsaquorsquos total to 5889 workers
Specialty Trade Contractors added 150 workers (11) While sheltering at home during the pandemic many homeowners showed heightened interest in having house and yard improvement projects completed Projects ranged from home offices and kitchen remodeling to decks and fences Building and specialty trade contractors alike commonly report having projects lined up for months out These sectors also continue to benefit from a booming housing market
Trade Transportation and UtilitiesBusinesses within this supersector sell or arrange the sale of goods and supplies
and retail merchandise to the public provide transportation of passengers or cargo or generate andor distribute electricity gas or water
Although employment in this supersector declined slightly during 2020 (1934 workers 23) it remained the largest-employing of South Dakotarsquos supersectors at 83191
This supersector includes the following
yen Wholesale Trade (NAICS 42)
yen Retail Trade (NAICS 44-45)
yen Transportation and Warehousing (NAICS 48-49)
yen Utilities (NAICS 22)
Wholesale TradeWholesale Trade had a loss of 196 workers (09) from 2019 to 2020 dropping to 20919 in 2020 This modest loss can be related to establishments adjusting their staffing levels throughout 2020 as a result of pandemic-related challenges including supply chain issues rapidly shifting demand transportation restrictions in other states and economic uncertainty
The number of establishments jumped up 64 from the previous year to 2952 in 2020 The average annual pay increased by $4127 (66) climbing to $66278
The Wholesale Trade sector comprises establishments engaged in wholesaling merchandise and rendering services incidental to the sale of merchandise The wholesaling process in an intermediate step in the distribution of merchandise as they sell merchandise to other businesses and normally operate from a warehouse or office
Merchant Wholesale Durable Goods added 87 establishments in 2020 climbing to 1450 establishments Worker levels fell 37 (04)
Businesses in this subsector sell capital or durable goods to other businesses Durable goods are new or used items that have a normal life expectancy of three years or more producing utility over time rather than consumption after a few uses They include motor vehicles furniture sporting goods jewelry toys construction materials and recyclable materials
Page 39
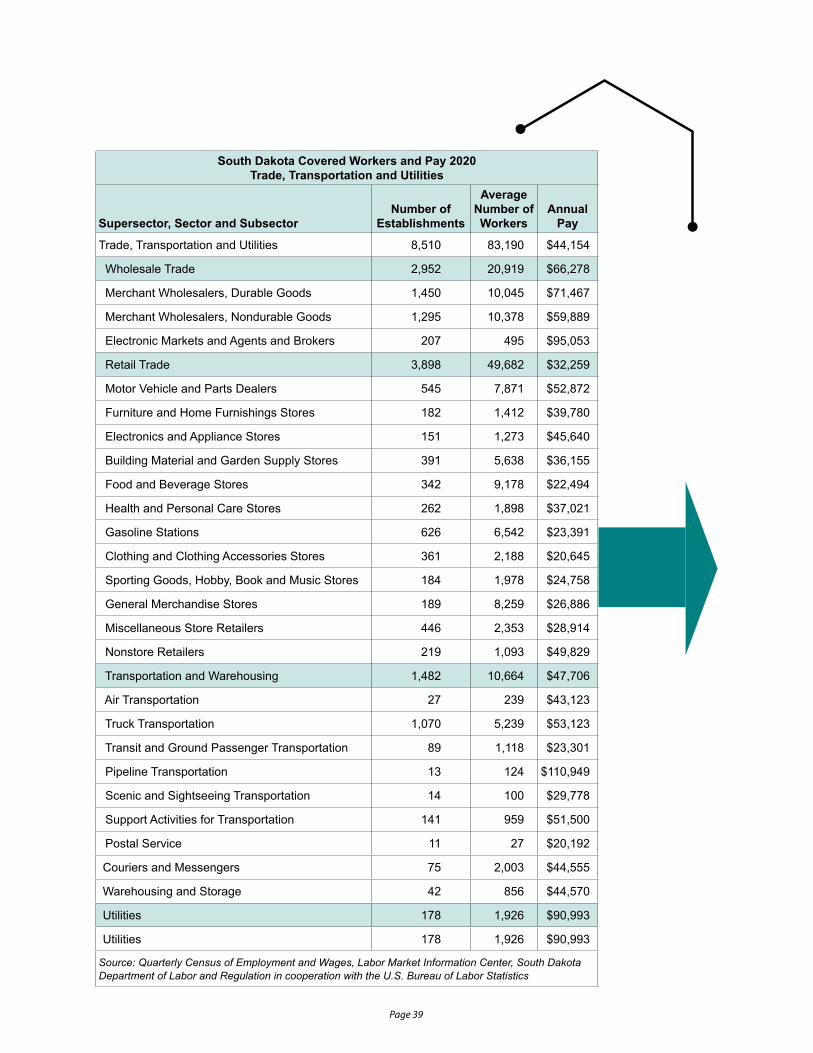
South Dakota Covered Workers and Pay 2020 Trade Transportation and Utilities
Supersector Sector and SubsectorNumber of
Establishments
Average Number of Workers
Annual Pay
Trade Transportation and Utilities 8510 83190 $44154
Wholesale Trade 2952 20919 $66278
Merchant Wholesalers Durable Goods 1450 10045 $71467
Merchant Wholesalers Nondurable Goods 1295 10378 $59889
Electronic Markets and Agents and Brokers 207 495 $95053
Retail Trade 3898 49682 $32259
Motor Vehicle and Parts Dealers 545 7871 $52872
Furniture and Home Furnishings Stores 182 1412 $39780
Electronics and Appliance Stores 151 1273 $45640
Building Material and Garden Supply Stores 391 5638 $36155
Food and Beverage Stores 342 9178 $22494
Health and Personal Care Stores 262 1898 $37021
Gasoline Stations 626 6542 $23391
Clothing and Clothing Accessories Stores 361 2188 $20645
Sporting Goods Hobby Book and Music Stores 184 1978 $24758
General Merchandise Stores 189 8259 $26886
Miscellaneous Store Retailers 446 2353 $28914
Nonstore Retailers 219 1093 $49829
Transportation and Warehousing 1482 10664 $47706
Air Transportation 27 239 $43123
Truck Transportation 1070 5239 $53123
Transit and Ground Passenger Transportation 89 1118 $23301
Pipeline Transportation 13 124 $110949
Scenic and Sightseeing Transportation 14 100 $29778
Support Activities for Transportation 141 959 $51500
Postal Service 11 27 $20192
Couriers and Messengers 75 2003 $44555
Warehousing and Storage 42 856 $44570
Utilities 178 1926 $90993
Utilities 178 1926 $90993
Source Quarterly Census of Employment and Wages Labor Market Information Center South Dakota Department of Labor and Regulation in cooperation with the US Bureau of Labor Statistics
Page 40
The Merchant Wholesale Nondurable Goods subsector had the largest drop in the number of workers within this sector with the loss of 135 workers (13) Establishments in this industry sell nondurable goods to other businesses Nondurable goods or consumables are the opposite of durable goods They may be defined as goods that are nearly consumed in one use or those that have a lifespan of less than three years They include paper and paper products chemicals drugs petroleum food apparel and newspapers Most of the losses in this subsector occurred in Grocery and Related Product Merchant Wholesalers and Farm Product Raw Material Merchant Wholesalers
Transportation and WarehousingThe Transportation and Warehousing sector includes industries that provide passenger and cargo transportation warehousing and storage for goods scenic and sightseeing transportation and support activities related to modes of transportation It is common for a business in this sector to operate a network of facilities workers and equipment over a widespread area
The Transportation and Warehousing sector splits into several subsectors
yen Each mode of transportation (Air Rail Water Truck Transit and Ground Passenger and Pipeline (NAICS 481-486)
yen Warehousing and Storage (NAICS 493)
yen Support Activities for Transportation (NAICS 488)
yen Scenic and Sightseeing Transportation (NAICS 487)
yen Postal Services (NAICS 491)
yen Courier Services (NAICS 492)
Despite a gain of 16 establishments employment in Transportation and Warehousing dropped 163 workers (15) from
2019 to 2020 Worker losses in the Transit and Ground Passenger Transportation (NAICS 485) subsector accounted for a majority of the decline in this sector
While most of the subsectors in Transportation and Warehousing had worker level declines from 2019 to 2020 two subsectors had gains The Couriers and Messengers added 138 workers reaching 2003 workers in 2020 Couriers and Messengers provide intercity andor local delivery of parcels and documents without operating under a universal service obligation The restriction to small parcels partly distinguishes these establishments from those in the transportation industries Worker level gains can be tied to increases in Couriers and Express Delivery Services As more consumers increased their online shopping deliveries to consumers also grew
Pipeline Transportation also had increases in establishments worker levels and the average annual pay from 2019 to 2020 Establishments in this subsector use transmission pipelines to transport products such as crude oil natural gas refined petroleum products and slurry or a semi-liquid mixture of fine particles
Worker levels in Truck Transportation fell 75 (14) from 2019 to 2020 This subsector accounts for almost half of the workforce in this sector with 5239 workers in 2020 Establishments included in this subsector haul a variety of goods including used furniture farm products (both locally and long-distance) and trucking containers (local and long-distance)
Page 41
Transit and Ground Passenger Transportation had the largest 2020 decline in worker levels in this sector dropping 173 workers (134) This subsector provides passenger transportation in vehicles such as charter buses limousines school buses and taxi cabs Declines were related to the pandemic as many people postponed or canceled travel plans
UtilitiesThe Utilities sector added seven establishments but decreased 24 workers (12) over the year for a level of 1926 The Utilities sector experiences one of the highest annual pay statistics at $90993 in 2020 increasing $3793 (43) from 2019 This sector ranked second overall in annual wage in 2020 following only the Management of Companies and Enterprises (NAICS 55)
Establishments in this subsector provide electric power natural gas steam supply water supply and sewage removal through a permanent infrastructure of lines mains and pipes Within this sector the specific activities associated with the utilities services provided vary by utility Electric power encompasses transmission and distribution natural gas includes distribution steam supply involves distribution water supply offers treatment and distribution while sewage removal includes collection and disposal of waste Waste management services are excluded from this sector since they do not use sewer systems or
sewage treatment facilities however they do collect treat and dispose waste materials
Although the overall total employment and establishment numbers in Utilities are ranked toward the bottom of all sectors the importance of the workers and their unique knowledge and skill sets remain critical (helping explain their high annual pay) In essence the rest of the economy is reliant upon the smooth and constant operation of this sector since it provides vital infrastructures needed for a full range of other industry operations
Education and Health ServicesThe Education and Health Services supersector is comprised of the Education
Services sector (NAICS 61) and the Health Services and Social Assistance sector (NAICS 62) Businesses within this supersector provide instruction and training or provide health care and social assistance to individuals
This subsector is highlighted here because it was South Dakotarsquos second largest employing industry and contributed the most to total wages paid out in the state in 2020
Educational ServicesThe private Educational Services sector saw a loss in employment during 2020 decreasing by 258 workers (70) to a level of 3450 The average annual wage increased $2268 (79)
from 2019 to 2020 to a new average of $31037
The Educational Services sector is made up of schools colleges universities and training centers providing instruction and training in a wide variety of subjects These establishments may also offer food and accommodation services to their students
Establishments in this sector are privately owned and operated for profit or not for profit
Page 42
Publicly owned establishments usually owned and operated by state and local governments are not included in this analysis Statistics for those types of establishments are analyzed under the Public Administration supersector Roughly 10 of the employment in Education falls in privately owned establishments
Educational Services is comprised of only one subsector Within the subsector are the following industry groups
yen Elementary and Secondary Schools (NAICS 6111)
yen Junior Colleges (NAICS 6112)
yen Colleges and Universities (NAICS 6113)
yen Business Computer and Management Training (NAICS 6114)
yen Technical and Trade Schools (NAICS 6115)
yen Other Schools and Instruction (NAICS 6116)
yen Educational Support Services (NAICS 6117)
Colleges and Universities lost the most employment with Technical and Trade Schools and Other Schools and Instruction also losing employment The other four industry groups had slight employment gains in 2020 Most colleges sent students home at the beginning of the pandemic and instruction was done online Remaining staff like food service and facility workers were not needed to the extent they had been and their hours were greatly reduced or they were temporarily laid off
The Educational Services sector is widely considered counter-cyclical Typically when the economy is doing well and unemployment is at a very low rate more working adults decide to go to work More career and job prospects available for working adults in turn leads to lower enrollment decreased profit and a lower need for teachersinstructors at schools
Health Care and Social AssistanceThe Health Care and Social Assistance sector saw both employment and wages rise in 2020 Compared to other sectors this sector has the highest employment and largest amount of total wages paid out in South Dakota The number of workers in 2020 increased by 336 (05) to 65541 Average annual wages increased $4664 (87) to $58421
This sector includes both health care and social assistance because sometimes it is difficult to distinguish between the boundaries of the two The Health Care and Social Assistance sector is made up of four subsectors
yen Ambulatory Health Care Services (NAICS 621)
yen Hospitals (NAICS 622)
yen Nursing and Residential Care Facilities (NAICS 623)
yen Social Assistance (NAICS 624)
Establishments in Ambulatory Health Care Services provide services directly or indirectly to ambulatory patients and do not usually provide inpatient services The subsector lost 88 workers (05) in 2020 for an employment level of 17902 The average annual wage increased $4252 (55) to $81891
Health practitioners in this subsector provide outpatient services with facilities and equipment not usually the most significant part of the service One example is home health care where skilled nursing services
Page 43
South Dakota Covered Workers and Pay 2020 Education and Health Services
Supersector Sector and SubsectorNumber of
Establishments
Average Number of Workers
Annual Pay
Education and Health Services 3090 68991 $57051
Educational Services 414 3450 $31037
Educational Services 414 3450 $31037
Health Care and Social Assistance 2676 65541 $58421
Ambulatory Health Care Services 1591 17902 $81891
Hospitals 63 26809 $64978
Nursing and Residential Care Facilities 344 12829 $31674
Social Assistance 678 8001 $26822
Source Quarterly Census of Employment and Wages Labor Market Information Center South Dakota Department of Labor and Regulation in cooperation with the US Bureau of Labor Statistics
such as physical therapy medication help counseling dietary guidance speech therapy and intravenous therapy are provided in the patientrsquos residence
Establishments in the Hospitals subsector provide medical diagnostic and treatment services that include physician nursing and other health services to inpatients and the specialized accommodation services required by inpatients Hospitals may also provide outpatient services as a secondary activity Some of the largest establishments in South Dakota belong to the Hospitals subsector The number of workers in 2020 increased by 41 to 26809 This subsectorrsquos average annual wage increased $5842 (99) to $64978
The Nursing and Residential Care Facilities subsector saw employment decline 28 to 12829 workers The average annual wage increased 92 to $31674 per worker This subsectorrsquos establishments provide residential care combined with either nursing supervisory or other types of care as required by the residents Examples are nursing homes and assisted and unassisted
continuing care retirement community facilities
Establishments in the Social Assistance subsector provide a wide variety of social assistance services directly to their clients Vocational rehabilitation services belong to this subsector Business activities include providing job counseling job training and employment for persons with disabilities Some of the 266 loss (32) of workers in this subsector during 2020 can be attributed to child day care services as many daycare services were limited due to COVID-19
Individual and family services and services for the elderly and disabled also had some worker loss
Page 44
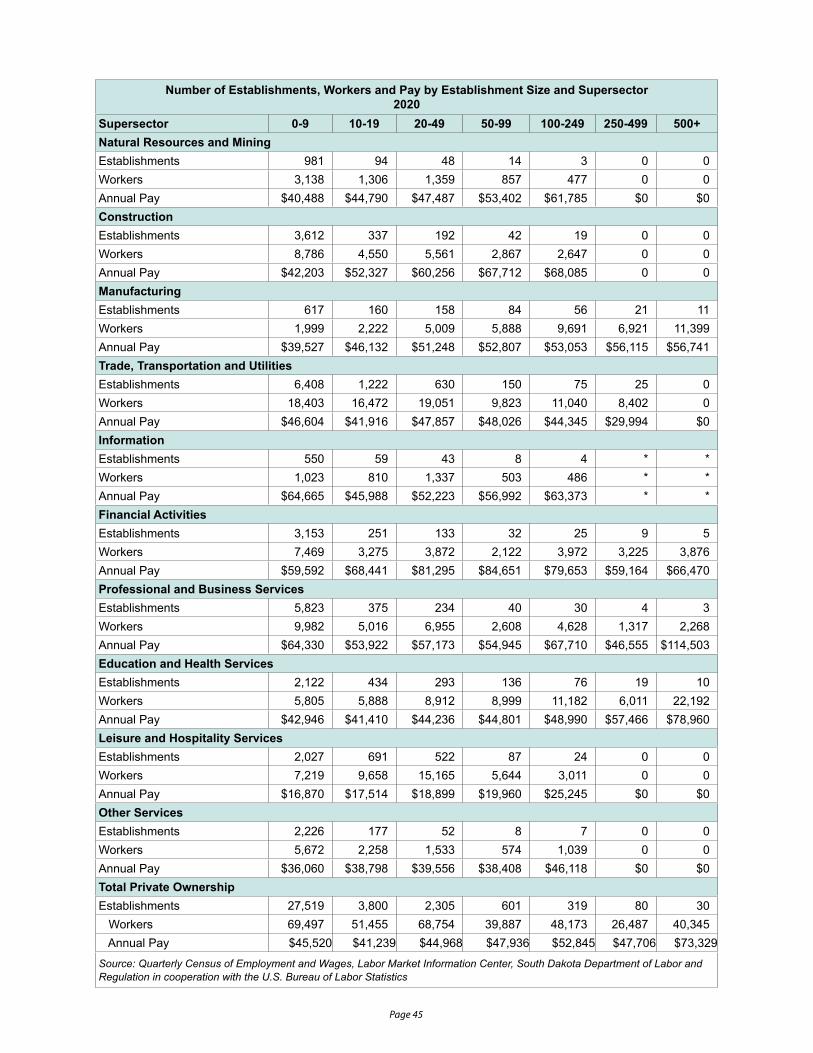
Establishment Size
Establishment size data provides a comparison of the number of small and large businesses in South Dakota The average number of workers at the worksite location determines establishment size A worksite is generally defined as a single physical location at which predominantly one type
of economic activity is conducted
The graph at the left displays the number of South Dakota establishments by establishment size showing the predominance of small businesses in South Dakota During 2020 the 0-9 workers size class had the largest number of establishments accounting for 794 percent of all establishments
The distribution of employees by establishment size shows a different picture than the distribution of establishments Smaller businesses have a much smaller slice of the pie
The pie graph at the right indicates smaller businesses (with fewer than 10 workers) employed only 202 percent of the covered workers in South Dakota in 2020 The number of workers is evenly dispersed among the establishment size groups
The table on the next page provides detailed data on establishment size by industry supersector
Page 45
Number of Establishments Workers and Pay by Establishment Size and Supersector 2020
Supersector 0-9 10-19 20-49 50-99 100-249 250-499 500+Natural Resources and MiningEstablishments 981 94 48 14 3 0 0Workers 3138 1306 1359 857 477 0 0Annual Pay $40488 $44790 $47487 $53402 $61785 $0 $0ConstructionEstablishments 3612 337 192 42 19 0 0Workers 8786 4550 5561 2867 2647 0 0Annual Pay $42203 $52327 $60256 $67712 $68085 0 0ManufacturingEstablishments 617 160 158 84 56 21 11Workers 1999 2222 5009 5888 9691 6921 11399Annual Pay $39527 $46132 $51248 $52807 $53053 $56115 $56741Trade Transportation and UtilitiesEstablishments 6408 1222 630 150 75 25 0Workers 18403 16472 19051 9823 11040 8402 0Annual Pay $46604 $41916 $47857 $48026 $44345 $29994 $0InformationEstablishments 550 59 43 8 4 Workers 1023 810 1337 503 486 Annual Pay $64665 $45988 $52223 $56992 $63373 Financial ActivitiesEstablishments 3153 251 133 32 25 9 5Workers 7469 3275 3872 2122 3972 3225 3876Annual Pay $59592 $68441 $81295 $84651 $79653 $59164 $66470Professional and Business ServicesEstablishments 5823 375 234 40 30 4 3Workers 9982 5016 6955 2608 4628 1317 2268Annual Pay $64330 $53922 $57173 $54945 $67710 $46555 $114503Education and Health ServicesEstablishments 2122 434 293 136 76 19 10Workers 5805 5888 8912 8999 11182 6011 22192Annual Pay $42946 $41410 $44236 $44801 $48990 $57466 $78960Leisure and Hospitality ServicesEstablishments 2027 691 522 87 24 0 0Workers 7219 9658 15165 5644 3011 0 0Annual Pay $16870 $17514 $18899 $19960 $25245 $0 $0Other ServicesEstablishments 2226 177 52 8 7 0 0Workers 5672 2258 1533 574 1039 0 0Annual Pay $36060 $38798 $39556 $38408 $46118 $0 $0Total Private OwnershipEstablishments 27519 3800 2305 601 319 80 30 Workers 69497 51455 68754 39887 48173 26487 40345 Annual Pay $45520 $41239 $44968 $47936 $52845 $47706 $73329Source Quarterly Census of Employment and Wages Labor Market Information Center South Dakota Department of Labor and Regulation in cooperation with the US Bureau of Labor Statistics
Page 46
One of the greatest strengths of the QCEW program is the ldquocensusrdquo concept it is considered the most accurate and complete source of wage and salaried employment data One of the downsides of that
powerful data set is the inherent time lag involved with data availability
Because of the various processes and procedures to ensure QCEW data is accurate and appropriately reflects the recent labor market it generally takes a minimum of five months after the close of a quarterly reporting cycle until the new QCEW data can be published For example first quarter 2021 (January February and March) data became available at a summary level in July 2021 more detailed data by industry became available in mid-August 2021
The most current data available (for second quarter 2021) indicate South Dakotarsquos strong recovery from the pandemic is continuing in 2021 Employment has been rebounding steadily increasing to a preliminary employment high of 442089 in June 2021 which is 1050 of the level recorded in March 2020
COVID-19rsquos impact on the total number of establishments reporting employment and wages was not nearly as severe overall as on employment levels In fact the reported number of establishments reached a historical high of 36241 in the second quarter of 2021
2021 QCEW Data Show Pandemic Recovery Continues
QCEW data is another of the indicators analyzed in terms of the labor marketrsquos recovery from the COVID-19 pandemic For the most current monthly information available visit the Pandemic Picture page
Page 47
Personal Income
The Bureau of Economic Analysis (BEA) releases personal income data The personal income of an area is the income
received by or on behalf of all the individuals who live in a specific geographic area
Personal income includes income from all sources including not only salaries wages and bonuses received from employment or self-employment but income from sources such as investments and government social benefits (including unemployment benefits Medicare Medicaid Social Security and pandemic-related payments)
Dividing the total personal income of an area by the residents of that given area produces a widely used economic indicator called per capita personal income South Dakotarsquos per capita personal income has trended upward since 2000 except for a small setback in 2009 following the recession Between 2019 and 2020 South Dakotarsquos per capita personal income increased $3461 (64)
During that same time frame the United States and Plains Region grew at slightly
slower rates of 58 and 53 respectively South Dakota ranked 22nd out of the 50 states and the District of Columbia with a per capita personal income of $57273 in 2020
Looking further back South Dakotarsquos personal income grew steadily for several years prior to the recession In fact South Dakotarsquos growth in personal income for the 2000-2009 period surpassed the rate for the Plains Region (Iowa Kansas Missouri Nebraska North Dakota and South Dakota) and the nation South Dakotarsquos personal income grew by 468 from 2000 to 2009 compared to a rate of 324 for the Plains Region and 281 for the nation
Since the recession and during the economic recovery phase South Dakotarsquos personal income has grown comparably to the Plains Region and the nation From 2010 to 2020 the nationrsquos personal income increased 473 followed by the Plains Region at 421 and South Dakota at 391
$57273
Page 48
Page 49
Poverty
Poverty status is determined by comparing annual income to a set of dollar values called thresholds that vary by family
size number of children and the age of the householder If a familyrsquos before-tax money income is less than the dollar value of their threshold then that family and every individual in it is considered to be in poverty For people not living in families poverty status is determined the comparing the individualrsquos income to his or her threshold
The poverty thresholds are updated annually
to allow for changes in the
cost of living using the
Consumer Price Index (CPI-U) The
thresholds do not vary geographically
American Community Survey South Dakota and US
Comparative Poverty EstimatesPercentage of Families and People Whose Income in the Past 12 Months Is Below the Poverty Level
All Families 2013 2014 2015 2016 2017 2018 2019
United States 116 113 106 100 95 93 86
South Dakota 92 94 83 82 84 80 73
All People 2013 2014 2015 2016 2017 2018 2019
United States 158 155 147 140 134 131 123
South Dakota 142 142 137 133 130 131 119
Source US Census Bureau 2019 American Community Survey
The number of people living below the poverty level in South Dakota for the population in which poverty status was measured is approximately 101900 or 119 This is according to the 2019 American Community Survey (ACS) The races with the highest percentage of their population living below the poverty level is American Indian and Alaska Natives at 468 and Black or African Americans at 199
The percent of families in South Dakota with incomes below the poverty level decreased slightly by 07 from 2018 to 2019
The percentage of South Dakota families in poverty is consistently below the number of families living in poverty at the national level Nationally the percent of all families in poverty in 2019 decreased 07 to 86 which is 13 percentage points higher than South Dakota at 73
The percent of lsquoall peoplersquo in the US and South Dakota with incomes below the poverty threshold was 123 and 119 respectively in 2019
73 of South Dakota Families live in
Poverty
119 of South
Dakotans live in poverty
Females in South Dakota are slightly more likely to be living below the poverty level with 131 versus 108 of the male population
Children under the age of five are the most likely age demographic to be living below the poverty level The table on the following page shows poverty status by age demographic
Page 50
Population for Whom Poverty Status is Determined
PopulationPopulation Below
Poverty Level
Percent of Population Below
Poverty Level
Total 854648 101946 119
Under 5 years 57292 9887 173
5 to 17 years 152486 21538 141
18 to 64 years 497445 59134 119
65 years and over 147425 11387 77
Source US Census Bureau 2019 American Community Survey
Because of the close interrelationship between population demographics and workforce data Labor Market Information Center staff are well versed in demographic information available from the US Census Bureau They are also proficient using the Census Bureaursquos website and other online tools Contact LMIC at 6056262314 when you need demographic data
Page 51
Population Projections
Population projections for the 2010-2035 time period released by the South Dakota State Data Center show South Dakotarsquos total population will reach 922748 by the year 2025 This reflects an increase in the core potential workforce (age 16-64) of approximately 16600 (32)
Although most of the counties in South Dakota are expected to show population declines the Rapid City (Custer Meade and Pennington counties) and Sioux Falls (Lincoln McCook Minnehaha and Turner counties) Metropolitan Statistical Areas (MSAs) will be the fastest growing areas in the state
South Dakota Population ProjectionsMedium Series
Age 2010 2015 2020 2025 2030 2035
0-4 59621 57567 60089 60941 61413 62656
5-9 55531 60094 58068 60533 61386 61846
10-14 53960 56098 60651 58650 61067 61925
15-19 57628 54556 56625 61169 59196 61570
16-19 46102 43645 45300 48935 47357 49256
20-24 57596 58030 54948 56947 61468 59533
25-29 55570 57993 58423 55332 57268 61771
30-34 49859 55883 58336 58765 55672 57548
35-39 45766 50101 56111 58593 59024 55935
40-44 47346 45997 50260 56250 58759 59194
45-49 57519 47587 46109 50294 56253 58785
50-54 59399 57326 47491 45904 49988 55879
55-59 54231 58790 56783 47102 45429 49393
60-64 43573 52854 57344 55432 46037 44314
65-69 31944 41677 50577 54920 53134 44182
70-74 25683 29666 38624 46897 50971 49357
75-79 21724 22873 26368 34250 41616 45283
80-84 18004 18084 18985 21837 28282 34401
85+ 19226 27449 33655 38932 44922 54002
Total 814180 852624 889447 922748 951885 977574
Source South Dakota State Data Center South Dakota State University
Population growth in the statersquos metro areas is projected to continue outpacing the state as a whole
Page 52
Page 53
Employment Projections
Industry employment projections for 2018 to 2028 were completed and published by the Labor Market Information Center (LMIC) in July 2020 Long-term projections (for a 10-year period) are completed every other year and published on even-numbered years
State and national economic trends along with a historical time-series employment data set were incorporated in various statistical models to project employment levels The projections are not intended to be precise point estimates of employment for each industry or occupation It is unlikely the projections data will precisely predict actual employment developments due to unforeseen state national and international trends and policies However the basic trends should prove accurate and aid in successful decision making Users should view the projected worker estimates as indicators of relative magnitude and direction rather than estimates of absolute values and use the data as a starting point when studying expected occupational employment levels
A special note about the COVID-19 pandemic The projections methodology includes a general assumption no major catastrophic event or natural disaster will significantly affect economic activities during the projections period The COVID-19 pandemic is a perfect example It rocked the United States and the world in 2020 But even though projections would not and could not account for the ramification of this pandemic it is important to remember the pandemic had not yet struck by 2018 The long-term
2018-2028 employment projections round has a base year of 2018 in other words 2018 employment estimates were used when modeling employment to 2028
Only time will tell for sure whether or not future long-term projections series will be significantly impacted by the 2020 pandemic However based on South Dakotarsquos relatively rapid and strong recovery indicated by the various employment measures included elsewhere in this report it appears hopeful the pandemicrsquos long-term impact on South Dakotarsquos industry landscape will be minor
A look at which types of industries are growing and which are not over the long-term provides great insights on the economy Based on the 2018-2028 projections the outlook for South Dakota can be categorized by healthy job growth in the next 10 years Some factors playing a role in certain industriesrsquo growth or decline are an aging and growing population technological improvements tourism and an ever-increasing demand driven by consumers for information and goods via computer or mobile device
Industry Projections
Page 54
Industry employment projections for 2018 to 2028 were completed and published by the Labor Market Information Center (LMIC) in
July 2020 Long-term projections (for a 10-year period) are completed every other year and published on even-numbered years
State and national economic trends along with a historical time-series employment data set were incorporated in various statistical models to project employment levels The projections are not intended to be precise point estimates of employment
South Dakota Wage and Salaried Workers by Employment Category 2018-2028
Industry Title2018
Workers2028
WorkersActual
ChangePercent Growth
Total of All Industries 491588 526251 34663 71
Non-agricultural Self-employed and Unpaid Family Workers 23441 24711 1270 54
Agriculture Forestry Fishing and Hunting (Farm Employment) 31955 33077 1122 35
Nonfarm Total Wage and Salaried Workers (excludes Self-employed and Unpaid Family Workers) 436192 468463 32271 74
Notes Data is preliminary and subject to revisionSource Labor Market Information Center South Dakota Department of Labor and Regulation
for each industry or occupation It is unlikely the projections data will precisely predict actual employment developments due to unforeseen state national and international trends and policies However the basic trends should prove accurate and aid in successful decision making Users should view the projected worker estimates as indicators of relative magnitude and direction rather than estimates of absolute values and use the data as a starting point when studying expected occupational employment levels
Distribution of South Dakota Nonfarm Wage and Salaried Workforce by Employment Category
Source Labor Market Information Center South Dakota Department of Labor and Regulation
Page 55
Categories of EmploymentNonfarm Wage and Salaried WorkersThe Nonfarm Wage and Salaried Workers employment category consists of only those wage and salaried workers who are covered under the South Dakota Reemployment Assistance (unemployment insurance) program and those who work for non-profit organizations such as private colleges and religious organizations Overall nonfarm wage and salaried workers are the major element of South Dakotarsquos labor force making up 887 This group is also projected to have the highest growth with a 74 rise projected by 2028
Farm EmploymentAnother important element of South Dakotarsquos labor force is Agriculture Forestry Fishing and Hunting (sometimes referred to as farm employment) This category is expected to grow slightly in South Dakota from 31955 to 33077 by 2028 (35) The slow growth can be
attributed to the sluggish employment growth in the crop production industry mainly due to increased productivity South Dakota farms have been trending toward larger operations for years with consolidation of smaller farms and greater production expected to continue
Non-agricultural Self-employed and Unpaid Family WorkersThe final component of South Dakotarsquos labor force is the Non-agricultural Self-employed and Unpaid Family Workers category According to BLS and based on data from the Current Population Survey and the American Time Use Survey self-employed persons are individuals who work for profit or fees in their own business profession trade or farm The smallest portion (48) of South Dakotarsquos labor force is expected to have a growth rate of 54 (05 annually) in the coming decade On a national level this category is expected to have annual growth of 06
Among industries at the three-digit North American Industry Classification (NAICS) NAICS level those projected to grow the fastest to 2028 are shown in the table at the top of the following page
Museums Historical Sites and Similar Institution
The number of workers employed in South Dakotarsquos Museums Historical Sites and Similar Institutions subsector is projected to increase by 131 workers (or 206) Industries in this subsector engage in the preservation and exhibition of objects sites and natural wonders of historical cultural andor educational value Some examples of South Dakota entities in this industry are the Crazy Horse Memorial Childrenrsquos Museum of South Dakota Reptile Gardens and other zoos and museums around the state The demand in this subsector is driven by tourism and visitor spending
Visitor spending increased statewide by $27272 million (74) from 2014 to 2018 in South Dakota according to the South Dakota
Department of Tourism In particular the Black Hills and Badlands Region made up almost 40 of total statewide visitor spending increasing $10196 million or 7 since 2014 Sightseeing in the Black Hills and Badlands and the Sturgis Bike Rally and similar events generate visitor spending positively impacting this industry and driving the need for more workers on a seasonal basis
Management of Companies and Enterprises
The Management of Companies and Enterprises subsector is projected to add 815 workers in South Dakota (155 increase) over the projections cycle This subsector is comprised of establishments that administer oversee and manage the strategic or organizational planning and decision-making
Top Ten Fastest Growing Industries to 2028Top
10Industries
Page 56
South Dakota Industry Employment Projections 2018-2028 Top Ten in Employment Growth Rate
NAICS Code Industry Title
2018 Workers
2028 Workers
Actual Change
Percent Growth
712 Museums Historical Sites and Similar Institution 635 766 131 206551 Management of Companies and Enterprises 5265 6080 815 155492 Couriers and Messengers 1684 1944 260 154493 Warehousing and Storage 831 955 124 149562 Waste Management and Remediation Service 929 1062 133 143336 Transportation Equipment Manufacturing 3594 4099 505 141488 Support Activities for Transportation 988 1122 134 136541 Professional Scientific and Technical Services 14053 15894 1841 131621 Ambulatory Health Care Services 17468 19711 2243 128311 Food Manufacturing 10280 11593 1313 128
Notes Data is preliminary and subject to revisionData for industries with 2018 employment less than 200 not included Data presented for industries will not sum to totals due to non-publishable data for additional industries being included in totalsNAICS Codes and Industry Titles are based largely on the North American Industry Classification System (NAICS) Learn more about NAICS codesSource Labor Market Information Center South Dakota Department of Labor and Regulation
role of a company or enterprise South Dakota experienced a 232 increase in the number of companies in this subsector from 2008 to 2018 The favorable business and tax environment and central geographic location has played a role in attracting businesses to headquarter their corporate offices and establishments in South Dakota According to the South Dakota Governorrsquos Office of Economic Development South Dakotarsquos private business sector has seen 1366 growth in Gross Domestic Product since 2000 the sixth highest growth in the nation
Couriers and MessengersThe number of workers in South Dakotarsquos Couriers and Messengers subsector is projected to increase by 260 workers (or 154) over the next 10 years This subsector is comprised of entities that provide intercity local andor international delivery of parcels and documents (including express delivery services) without operating under a universal service obligation Since 2008 the number of workers has dramatically risen from 1287 to 1684 in 2018 The increasing demand from consumers shopping online has a direct
relationship with the increase in demand for workers to deliver those goods Retail is trending more toward online services rather than the brick and mortar stores of the past Shoppers tend to prefer the convenience of shopping online via mobile devices or computers rather than having to make a trip to a store to obtain goods
Warehousing and StorageEstablishments in this industry group are engaged in operating warehousing and storage facilities for general merchandise refrigerated goods and other warehouse products Warehousing and storage establishments may also provide a range of services often referred to as logistics related to the distribution of goods The number of workers employed in the Warehousing and Storage subsector is projected to rise by 124 workers (or 149) over the next 10 years in South Dakota As companies try to get their products to their final destinations in the most cost effective convenient and organized way the demand grows for workers to help accomplish this goal This subsector is not driven by the goods they are selling
Page 57
or retailing but rather by sales from other companies for which this subsector stores and arranges the distribution of those goods
Waste Management and Remediation Service
The Waste Management and Remediation Services subsector in South Dakota is expected to increase by 133 workers (or 143) by 2028 This subsector is engaged in the collection treatment and disposal of waste materials Waste collection and remediation are expected to be driving forces The US Census Bureau estimates South Dakotarsquos population rose from 816166 to 878698 from 2010 to 2018 an increase of 62532 (77) people An increasing population generates more waste and an increased need for workers to pick up and properly dispose of that waste
Transportation Equipment Manufacturing
The Transportation Equipment Manufacturing subsector is projected to add 505 workers in South Dakota (a 141 increase) over the next decade This subsector is comprised of businesses that produce equipment for transporting people and goods An entire subsector is devoted to this activity because of the significance of its economic size Driving the growth within this subsector are three four-digit NAICS industries expected to have double digit employment growth in the coming decade
yen Motor Vehicle Body and Trailer Manufacturing (NAICS 3362)
yen Motor Vehicle Manufacturing (NAICS 3361)
yen Motor Vehicle Parts Manufacturing (NAICS 3363)
The growth can be attributed to the needs of consumers purchasing the products this subsector manufactures as well as a growth in disposable income According to the US Bureau of Economic Analysis (BEA) South Dakotarsquos per capita disposable personal income increased from $37513 in 2008 to $47947 in 2018
Support Activities for Transportation
The Support Activities for Transportation subsector is projected to increase by 134 workers (or 136) over the next 10 years in South Dakota The Support Activities for Transportation industry group is comprised of entities that provide services which support transportation Services such as motor vehicle towing or railroad switching are examples of the support provided There is a direct relationship to the growth of manufacturing of transportation equipment sale and the services providing support for the end users of that equipment The continued need for workers to support the transportation subsector can be traced back to an increase in consumer demand for transportation equipment From 2008 to 2018 the number of companies in this subsector increased 259 and the number of workers employed in these companies increased 193 to keep up with the demand in South Dakota
Professional Scientific and Technical Services
The Professional Scientific and Technical Services subsector is projected to add 1841 workers (131 increase) over the next decade in the state This industry is one of the largest and most diverse industries in South Dakota and workers are selling knowledge and expertise rather than a good This subsector is comprised of establishments that make available the knowledge and skills of their employees often on an assignment basis where an individual or team is responsible for the delivery of services to the client
The individual industries of this subsector are defined by the particular expertise and training of the services provider At the four-digit NAICS level there are four industries projected to have substantial growth
yen Computer System Design and Related Services (NAICS 5415)
yen Management Scientific and Technical Consulting Services (NAICS 5416)
Page 58
yen Scientific Research and Development Services (NAICS 5417)
yen Architectural Engineering and Related Services (NAICS 5413)
The increasing demand in this subsector can be attributed to efficiencies gained by advancements in science and technology An establishment that manufactures a good could contact an expert in this subsector to automate a process or get technical advice to gain a competitive edge for example As long as businesses continue to strive for reduced costs through technology and greater productivity to produce the best products at the lowest prices the demand for experts and consultants in this industry will remain high
Ambulatory Health Care Services
The number of workers in South Dakotarsquos Ambulatory Health Care Services subsector is projected to increase by 2243 workers (or 128) over the next 10 years Based on employment size this subsector was the sixth largest of South Dakotarsquos three-digit subsectors in 2018 with 17468 workers This subsector is comprised of entities providing health care services directly or indirectly to ambulatory patients and which do not usually provide inpatient services The ongoing healthcare
needs and preferences of an aging population will continue to drive the need for employment in this industry in South Dakota
According to the US Census Bureau South Dakotarsquos population 65 years and older rose 252 from 2010 to 2018 At the four-digit NAICS level itrsquos expected six of the eight categories under Ambulatory Health Care Services will have double digit growth in the coming decade Leading the way is Home Health Care Services due to continually increasing demand for outpatient care rather than inpatient care Treatments such as physical therapy and certain medications can be administered by a healthcare professional at home rather than in a clinical environment According to BLS the aging of the population correlates with an expected rise in chronic conditions like diabetes helping increase the demand for all types of healthcare services and social services geared toward older people
Food ManufacturingThe Food Manufacturing subsector is projected to add 1313 workers in South Dakota (128 increase) over the next decade This subsector consists of entities that transform livestock and agricultural products into products for intermediate or final consumption The industry groups are distinguished by the raw materials (generally of animal or vegetable origin) processed into food products
Declining and Slowest Growth Industries to 2028
Several factors can contribute to the declining or slow growth of an industry not only in South Dakota but also nationally According to BLS the labor force and changing demographics of the population affect employment growth just as they affect Gross Domestic Product (GDP) and other macroeconomic measures
Since the base year (2018) occurs after a long economic expansion growth rates can be expected to be somewhat lower than in the previous projections cycles In addition an aging population leads to a declining labor force participation rate limiting the number of workers available for employment
Nationally the largest employment declines are expected to be in Manufacturing Agriculture and the Federal Government sectors to 2028 In South Dakota the only sector expected to decline overall is the Information sector
Two of the top 10 declining or slowest growing South Dakota subsectors at the three-digit NAICS level are within the Information sector
Bottom
10Industries
Page 59
South Dakota Industry Employment Projections 2018-2028 Declining or Slowest Growing Industries
NAICS Code Industry Title
2018 Workers
2028 Workers
Actual Change
Percent Growth
511 Publishing Industries (except Internet) 1212 1057 -155 -128
443 Electronics and Appliance Stores 1428 1335 -93 -65
323 Printing and Related Support Activities 1320 1237 -83 -63
515 Broadcasting (except Internet) 979 941 -38 -39
453 Miscellaneous Store Retailers 2567 2485 -82 -32
425 Wholesale Electronic Markets and Agents and Brokers 541 529 -12 -22
452 General Merchandise Stores 9323 9218 -105 -11
322 Paper Manufacturing 637 635 -2 -03
454 Nonstore Retailers 1089 1095 6 06
221 Utilities 1978 1990 12 06
Notes Data is preliminary and subject to revisionData for industries with 2018 employment less than 200 not included Data presented for industries will not sum to totals due to non-publishable data for additional industries being included in totalsNAICS Codes and Industry Titles are based largely on the North American Industry Classification System (NAICS) Learn more about NAICS codesSource Labor Market Information Center South Dakota Department of Labor and Regulation
The industry declines in South Dakota are projected to be very minimal at the subsector level Since many South Dakota industries are considered small even a small employment loss in the projected 2028 level can substantially impact a subsector Technological improvements content displayed via internet business classifications changes (NAICS code) and consumer shopping preferences are some of the factors which have played a role in the declines in some industries in South Dakota
Publishing Industries (except Internet)
The Publishing Industries (except Internet) subsector is projected to decrease by 155 workers (or 128) through 2028 in South Dakota This subsector is found in the Information sector mentioned above as South Dakotarsquos only sector expected to show an overall decline This subsector contains establishments engaged in the publishing of newspapers magazines periodicals and books as well directory and mailing lists and software publishing The availability of information
online has had a huge influence on this subsector Consumers favor the convenience of getting information such as news sports and other content in the convenience of their own home using computers or streaming television services or on their smart phones and other mobile devices while on the go wherever they are According to the US Census Bureau an estimated 868 of South Dakota households had a computer from 2014-2018 and an estimated 780 had a broadband internet subscription The pervasiveness of smart phones in todayrsquos society is evident
Electronics and Appliance Stores
The Electronics and Appliance Stores subsector in South Dakota is projected to decline 93 workers (65) by 2028 Industries in the Electronics and Appliance Stores subsector retail new electronics and appliances from point-of sale locations Establishments in this subsector often operate from locations with special provisions for floor displays requiring special electrical capacity to accommodate
Page 60
the proper demonstration of the products The growth of e-commerce and rapidly evolving technology have had a negative impact on this industry In South Dakota the number of companies in this subsector declined 126 over the last 10 years and employment has declined 118
Printing and Related Support Activities
The number of workers employed in the Printing and Related Support Activities subsector is expected to decrease by 83 (or 63) in South Dakota by 2028 The Printing and Related Support Activities industry is comprised of establishments that print products such as newspapers books labels business cards stationery business forms and other materials and perform support activities such as data imaging platemaking services and bookbinding Consumer preferences have changed over the last few decades and with information such as books magazines and newspapers available online the demand has decreased for physically printed information South Dakota worker levels in this subsector showed a double-digit percent decline from 2008 to2018
Broadcasting (except Internet)Worker levels in the Broadcasting (except Internet) subsector are projected to decrease 38 workers (or 39) by 2028 in South Dakota This subsector includes establishments that create content or acquire the right to distribute content and subsequently broadcast the content A decrease of 38 workers is small but it represents a larger impact in percent change due to very little employment within this industry statewide This subsector is contained within the Information Sector which as mentioned above is expected to have an overall decline in the next decade in South Dakota From 2008 to 2018 South Dakota noted decreases in both the number of companies and employment in this subsector at 172 and 156 respectively
Miscellaneous Store RetailersIn South Dakota the Miscellaneous Store Retailers subsector is projected to decrease
by 82 workers (or 32) over the next 10 years This retail trade subsector is a catch-all for retailers who sell specific products not otherwise categorized in a specified retail code Examples of these unique retailers are florists used merchandise stores gift stores office supply stores and pet and pet supply stores From 2008 to 2018 the number of companies and employment in this subsector in South Dakota showed double-digit percentage loss The losses can be attributed to several factors such as competition from large retailers the rise of online shopping and NAICS coding changes of particular establishments Large box store retailers usually offer the same types of goods and have less overhead therefore offering lower prices and taking demand away from specialty stores
Wholesale Electronic Markets and Agents and Brokers
The level of workers employed in the Wholesale Electronic Markets and Agents and Brokers subsector is projected to decrease by 12 (or 22) in South Dakota by 2028 Businesses in this subsector arrange for the sale of goods owned by others generally on a fee or commission basis They act on behalf of the buyers and sellers of goods This subsector contains agents and brokers as well as business-to-business electronic markets that facilitate wholesale trade The decline in this subsector can be traced primarily to a national industry coding change Most of the businesses once coded as Wholesale Electronic Markets and Agents and Brokers are now instead classified as Merchant Wholesalers for Durable or Nondurable Goods
General Merchandise StoresGeneral Merchandise Stores are expected to decrease by 105 workers (or 11) over the next 10 years Businesses contained in this subsector retail new general merchandise from fixed point-of-sale locations Establishments are unique in that they have the equipment and staff capable of retailing a large variety of goods from a single location This includes a variety of display equipment and staff trained to provide information on many lines of products From 2008 to 2018 the number of
Page 61
South Dakota companies increased however the employment level decreased by 59 The expected continued decrease in the number of workers is in correlation with the advancements in technology Large retailers are embracing technology and saving money by replacing workers with machines that can accomplish the same task but costing the retailer less overhead An illustrative example is the implementation of self-checkouts at larger retailers like Walmart and Target lowering the number of cashiers needed
Paper ManufacturingWorker levels in the Paper Manufacturing subsector are projected to decrease by two workers (or 03) This subsector includes establishments that make pulp paper or converted paper products The manufacturing of pulp involves separating the cellulose fibers from other impurities in wood or used paper The manufacturing of paper involves matting these fibers into a sheet Converted paper products are made from paper and other materials by various cutting and shaping techniques Several factors such as the transition from print to online information consumer demand and improved manufacturing and automation processes can be pointed to for declining employment in this industry Paper manufacturers have tried to reduce costs though automation processes and logistics reducing the need for workers to accomplish the same tasks
Nonstore RetailersWorker levels in South Dakotarsquos Nonstore Retailers subsector are projected to increase by just six workers (or 06) over the next decade These establishments retail merchandise
using methods such as the broadcasting of infomercials the broadcasting and publishing of direct-response advertising the publishing of paper and electronic catalogs door-to-door solicitation in-home demonstrations selling from portable stalls and distribution through vending machines The availability of goods and convenience of shopping online has had a negative impact on employment levels in this subsector Since 2008 in South Dakota this subsector has shown an overall employment decline as consumer preference has trended away from this industry
UtilitiesThe Utilities subsector is projected to slightly increase by 12 workers (or 06) over the next 10 years Industries in the Utilities subsector provide electric power natural gas steam supply water supply and sewage removal through a permanent infrastructure of lines mains and pipes Establishments are grouped together based on the utility service provided and the system or facilities required to perform the service In South Dakota over the last decade the Utilities industry saw a slight decline in employment levels as well as companies
The driving factor in modest projected growth can be seen at the four-digit NAICS level In the base year (2018) the Electric Power Generation Transmission and Distribution industry made up 777 of the Utilities subsector and is expected to generate a slight increase in the number of workers employed in the next ten years Technology has been a contributing factor in the stagnant trend in employment levels Energy companies used to employ more people however now jobs such as a meter reading and bill paying can be done online
Employment projections data for 2018 to 2028 is available for all three-digit NAICS industries in on the virtual labor market data system and on our website in Adobe PDF and Microsoft Excel format Please visit our Industry Employment Projections menu page for the latest options and data at any point in time
Page 62
Occupational Projections
Data by occupation provides a more focused picture of skills in demand than data by industry A look at the
occupations projected to grow the most rapidly in South Dakota in the future provides insight into the skills that may be most needed
South Dakotarsquos occupational growth is projected to be faster (at 71) than the nation (52) for the 2018-2028 decade LMIC released projections for 531 detailed occupations in July 2020 Employment for 480 occupations is projected to increase or remain the same while 51 occupations are projected to decline
LMIC completed 2018-2028 statewide projections using the nationally adopted projections methodology which allows for comparability of this data across states and to the nation This methodology incorporates historical time-series employment data as well as state and national economic trends and utilizes a variety of statistical models
It is important to note a general assumption is made no major catastrophic event or natural disaster will significantly affect the economic activities of the occupations during the projections period An example of a catastrophic event would be the COVID-19 pandemic which rocked the United States and the world in 2020 However even though projections would not and could not account for the ramification of this pandemic it is important to remember this event had not taken place by 2018 This employment projections round has a base year of 2018 in other words 2018 employment estimates were used when modeling employment to 2028
Whether or not the pandemic of 2020 will significantly impact future rounds of projections will depend on how long the downturn in the economy lasts and how well state and national labor markets recover from its affects Whether or not future projections
Page 63
series will be significantly impacted by the 2020 pandemic remains unclear at this time
Monthly employment estimates from data sets such as labor force and nonfarm wage and salaried worker series since the COVID-19 pandemic first struck South Dakota indicate a strong and relatively quick recovery They imply a hopefulness the pandemicrsquos long-term impact on South Dakotarsquos industry landscape will be minor
At a macro level two factors affect employment change in an occupation
yen Changes in industry employment This is easy to understand If an industryrsquos employment grows or contracts occupations within the industry will do the same
yen Changes in the mix of occupations (commonly known as staffing pattern) in an industry This factor is more complicated and requires more research and analysis Research includes examining historical staffing pattern data and analyzing factors which may affect occupations within the given industry
Some examples of micro level factors include but are not limited to demographics technology replacement of one product or service for another outsourcing and organizationalwork restructuring
Because occupational employment and demand projections are impacted by both industry employment trends and changes in staffing patterns it is especially difficult to predict the pandemicrsquos long-term impact
Many of the occupations on South Dakotarsquos top 10 fastest growing list are growing due to one or more of the micro-factors mentioned above
DemographicsDemoraphic data refers to data which is statistically socio-economic in nature such as age of the population race income education and employment The data vary by geographic location and often over time South Dakotarsquos
demographics play a definite role in the statersquos economic landscape
TechnologyChanges in technology such as new machines or software can affect the growth of an occupation Technology can increase productivity which usually leads to the need for fewer workers or in some cases even eliminate the need for workers all together However on the flip-side technology can bring with it the advent of new or emerging occupations which creates new jobs Very often technology can cause a decrease in one occupation while creating a demand for a different occupation within the same staffing pattern An industry may expand or contract or it may remain at the same employment level but because of technological changes in the industry the occupational composition can change significantly
Replacement of one service or product for another Changes in the need or preference for different services and products by consumers can also affect the growth of an occupation
OrganizationalWork RestructuringA change in job duties can result in the same output but increase or decrease the utilization of some occupations relative to others within the same industry These changes cause occupations to grow at different rates Many times organizationalwork restructuring results in the consolidation of job duties
South Dakotarsquos Major Occupational GroupsThere are 22 major occupational groups All of South Dakotarsquos major occupational groups are expected to add jobs over the projected decade Fourteen of these groups are projected to show growth faster than the state average
South Dakotarsquos computer and mathematical occupations (123) personal care and service occupations (116) and health care practitioners and technical occupations (113) are projected to be among some of the fastest growing occupational groups during the 2018-2028 projections decade
Page 64
When combined these three major groups account for half of the top 10 fastest growing occupations in South Dakota including the number one spot
Factors such as the increased need by individuals and businesses for information security and technology and an aging population longer life expectancies and growing rates of chronic conditions will continue to be driving forces in the demand for computer technology and health related occupations Another reason health care services in South Dakota will continue to see fast occupational growth is the influx of population
According to an article by United Van Lines regarding the top 10 places to move in 2018 South Dakota tied with North Carolina for 8th and 9th position (at just over 57) (For more information see the 2018 United Van Lines National Movers Study) According to Eily Cummings director of corporate communications at United Van Lines the 42nd annual United Van Lines study not only accurately reflects where Americans are moving to and from but also the reasons
why Unlike its neighboring states (which were either balanced or experienced medium outbound population during 2018) South Dakota experienced a medium inbound population The statistics indicate 57 of those moving into to South Dakota moved here for employment or to look for a job Other groups relocating to South Dakota were those looking to or had already retired (20) those looking to live closer to family (17) and those who moved here for the lifestyle (11)
According to an article by the American Association for Retired Persons (AARP) more retirees are calling smaller less-populated states like South Dakota home This article cites findings from the National Movers Study which is an annual report of migration patterns in the United States The article indicates while the larger warm-weather states still draw many retirees the smaller more sparsely populated states with a retirement-income-friendly tax environment are becoming more popular With South Dakotarsquos population growth occupations in health services will continue to grow to meet the demand for these services
Page 65
South Dakota Occupational Employment Projections 2018-2028 Top 10 in Employment Growth Rate
Ranking Occupation
2018 Estimated
Employment
2028 Projected
EmploymentNumeric Change
2018-2028 Percent Change
1 Information Security Analysts 253 342 89 352
2 Computer Numerically Controlled Machine Tool Programmers Metal and Plastic 77 102 25 325
3 Respiratory Therapists 336 430 94 280
4 Nursing Instructors and Teachers Postsecondary 245 312 67 273
5 Nurse Practitioners 549 697 148 270
6 Personal Care Aides 2981 3783 802 269
7 Physician Assistants 544 685 141 259
8 Software Developers Applications 1041 1300 259 249
9 Health Specialties Teachers Postsecondary 161 201 40 248
10 Occupational Therapy Assistants 119 147 28 235
NotesFor descriptions of the Standard Occupational Classification (SOC) occupations above please visit our websiteData is preliminatary and subject to revisionSource Labor Market Information Center South Dakota Department of Labor and Regulation
South Dakotarsquos 10 Fastest Growing Occupations for 2018-2028Occupational employment is expected to increase by 71 in South Dakota between 2018 and 2028 The table above features the 10 occupations projected to grow the fastest The following narrative explores the reasons for the predicted growth
Top
10Occupations
Information Security AnalystsInformation Security Analysts work in a variety of industries to plan and carry out security measures to protect an organizationrsquos computer networks and systems Their responsibilities are continually expanding as the number and types of cyberattacks and skills of hackers continue to increase
These analysts take the number one spot in South Dakotarsquos fastest growing occupations list This projected growth is outpacing the nationrsquos projected growth for this occupation South Dakota is projecting growth of 35 and nationally information security analysts are projected to grow by 32
Over the 2018-2028 decade demand for this occupation is expected to be very high As cyberattacks have grown in frequency the demand for managed security has increased These analysts will be depended upon for innovative solutions to prevent hackers from stealing critical information or creating problems for networks
Computer Numerically Controlled (CNC) Machine Tool Programmers Metal and Plastic
Metal and Plastic Computer Numerically Controlled (CNC) Machine Tool Programmers moved from its respectable fifth place in
Page 66
the 2016-2026 projections to second place in the 2018-2028 round with a growth rate of 32 This is a small occupation however because it is relatively new it is significant to the economic landscape of South Dakotarsquos production industry These workers develop computer programs which control the machining or processing of metal or plastic parts by automatic machine tools equipment or systems
Although CNC machine tool operators have been around for a while CNC machine tool programmers are fairly new to production South Dakota employers are finding value in staffing workers who are capable of writing CNC programs which are specific to the products their company produces Making changes on the fly is perhaps one of the biggest advantages companies who employ these workers have There is less down time because employers can modify products in a more efficient way and are therefore able to produce unique products for their clients
In addition in the production industry down time for machines not working as they should equates to lost money If the CNC machinersquos preloaded program fails having a programmer on staff is invaluable There is generally less down time because these programmers either know how to correct the issue or can troubleshoot the issues with programmers from the vendor company in an expediate fashion saving the company precious time
Finally some companies have found they can recoup part of the cost of these positions by subcontracting to develop plastic and metal parts for other producers Many producers some of which are too small to have a CNC programmer on staff or are doing a special one-time product run will subcontract with these companies to either have the their CNCs set up to do a special run or in some cases have the company produce the unique part
South Dakotarsquos production industry is restructuring to embrace new technologies which will require the skills of CNC programmers rather than machine setters operators and tenders Therefore demand for manual machine tool operators and
tenders is likely to be reduced by these new technologies and conversely demand for CNC machine programmers is expected to be strong in the 2018-2028 decade in South Dakota
Respiratory TherapistsHealth related occupations take up several of the top 10 fastest growing occupational slots in South Dakota The first of the health-related occupations is respiratory therapists number three on the list Respiratory therapists are expected to grow at four times the state rate for all occupations at 28 from 2018 to 2028 Respiratory therapists care for patients who have trouble breathing for a variety of reasons ranging from chronic respiratory disease such as asthma or emphysema to premature infants with under-developed lungs to patients suffering from heart attacks drowning or shock
South Dakota is following the national trend of much faster than the average growth in this occupation Continued growth of the middle-aged and elderly population is anticipated to lead to increased incidence of respiratory conditions such as chronic obstructive pulmonary disease (COPD) and pneumonia which are lifelong disorders and permanently damage lungs and restrict lung function
And finally growth in this occupation is occurring because these therapists are increasingly found in more types of establishments Just a few years ago most respiratory therapists worked in hospitals today it is becoming common to find these workers in nursing homes doctorsrsquo offices and clinics Not only is it more convenient for residents and patients it cuts down on hospital readmissions which lowers medical expenses for treatment
Nursing Instructors and Teachers Postsecondary
Although not found in the health care industry postsecondary nursing instructors and teachers have definite ties to the strong occupational growth occurring in health care This occupation is the fourth fastest-growing occupation at 27 Because of the high
Page 67
demand for health care workers and especially nursing occupations it should come as no surprise this occupation made the top 10 fastest growing occupations list
Remember although registered nurses did not make the list of fastest growing occupations it does not mean this occupation is not growing The registered nurse occupation is a large occupation in South Dakota so although this occupation is growing at a fast pace (13) because of the sheer number of workers in this occupation the percentage is not high enough to make the top 10 fastest growing occupations Because of the need to train new workers to enter nursing occupations postsecondary nursing instructors and teachers are projected to grow rapidly from 2018-2028
Nurse PractitionersRounding off the top five fastest growing list is the nurse practitioner occupation boasting a 27 change in employment Demographics certainly play a part in the fast-paced growth of this occupation Nationally the aging population is playing a huge role In South Dakota just as important as the aging of the population is the size of the population in South Dakota Because it is such a rural state nurse practitioners are pivotal to services provided
Many nurse practitioners work in small towns sometimes in remote locations These workers are the first-line of defense in staving off everyday aliments treating common injuries and broken bones They are often the eyes and ears which detect more serious sicknesses and disease These workers generally work at a satellite clinic or office for the larger regional medical centers in the state Using internet and satellite communications they serve their clients right where they are most of the time
Many patients who used to travel great distances for medical treatment can now do most of their doctoring even for serious illnesses right in their own hometown thanks in part to nurse practitioners Some of these workers even take their services right to their patients The elderly shut-ins and those recovering from serious illnesses injuries or
operations often have nobody to take them to appointments This is where the traveling nurse practitioners come in Some of these workers travel great distances to see and treat their patients
Practitioners who work in the statersquos larger andor more specialized clinics also provide vital services These workers allow both doctors and patients to make the most of their medical visits by handling the more run-of-the-mill appointments They also perform initial patient consultation and medical check-ups on patients recovering from surgery illnesses or injury This frees up time of physicians specialists and surgeon so they can deal with the more serious cases requiring their attention
Many nursing home and elderly care facilities also have nurse practitioners on staff By employing these workers they can save their residents trips to the doctor for common illnesses or injuries
Personal Care AidesPersonal care aides also called care givers or personal attendants generally provide non-medical services such as cleaning cooking shopping driving their clients to appointments and in general being companions to people with disabilities chronic illnesses or the elderly As the baby boom generation continues to age the need for these workers will increase Personal care aides are often the difference between individuals remaining in their home or having to go to nursing homes
Not only is it more economical to pay for the services of a personal care aid than to live in a nursing home but most generally people prefer to remain in their homes so it is not surprising the demand for these workers is strong Nationally personal care aides are growing at a faster pace (36) than South Dakota However this occupation came in as the sixth fastest growing occupations in South Dakota at (27)
Physician AssistantsPhysician assistants provide health care services typically performed by a physician under the supervision of a physician or a
Page 68
surgeon They conduct complete physicals provide treatment and counsel patients They may in some cases prescribe medication These workers must graduate from an accredited educational program for physician assistants The training they receive is the primary difference between physician assistants and nurse practitioners
Like nurse practitioners physician assistants fill gaps in medical services physicians andor surgeons are either too busy to complete or the demand for services is higher than the supply of physicians and surgeons Physician assistant employment is projected to grow fast increasing by 26 from 2018 to 2028 The reasons for the fast growth in employment are mirroring nurse practitioners in South Dakota
Software Developers Applications
Applications software developers are projected to grow 25 from 2018 to 2028 This growth nearly mirrors the nationrsquos growth for this occupation (26) Although at first this might not seem like an occupation prevalent in health care the health and medical insurance and reinsurance carrierrsquos industry will need the innovative software these programmers write to manage new health care policy enrollments and administer existing policies digitally
However unlike most of the occupations we have just looked at as well as those yet to come applications software developers work in a wide variety of industries not just one industry Therefore the fast pace at which this occupation is growing is caused by many different reasons
First and foremost this occupation is growing due to technological changes occurring in nearly every industry and aspect of our lives Conveniences ranging from personal assistants like Alexa or Google Nest to home security services to the latest streaming services being offered all run off electronic applications
Not only do the ways we use these applications continue to grow but so do the different types of platforms on which these applications must work Each of these various applications and platforms require the skill of someone who
can develop the apps that make them work In South Dakota many government and private employers hire these workers to develop software relevant to their business or the services they offer Some developers work on a contract basis and may enjoy living in South Dakota while programming for a client halfway around the world
Technology is here to stay and filtering into everyday life in ways few would have thought of just a few years ago Because this occupation can be found in so many industries (including workers who are self-employed and work on a contract basis) and virtually in any location this occupation is projected to see strong growth nationally and in South Dakota for a long time to come
Health Specialties Teachers Post-Secondary
With South Dakotarsquos health care industry booming post-secondary health specialties teachers are also growing much faster than the average at 25 These instructors teach courses in fields such as dentistry laboratory technology medicine pharmacy public health therapy and veterinary medicine
With the increased demand for these types of health workers South Dakotarsquos schools of higher education will be meeting these demands by offering more training opportunities from 2018-2028 This trend is again closely mirroring the national trend where post-secondary health specialties teachers are projected to grow 23 during the same time
Occupational Therapy Assistants
Rounding out the list of the 10 fastest growing occupations in South Dakota to 2028 is Occupational therapy assistants They work with patients and help them develop recover improve and maintain the skills needed for daily living after a traumatic event like an accident stroke heart attack or surgery
Some of the growth in this occupation will be due to the graying of South Dakotarsquos population however some of it because of
Page 69
the influx of people migrating into South Dakota Regardless of age a larger population equates to more health care needs In addition to an older and larger population some of the growth in this occupation is because of the availability of these workers to patients
As more insurance companies cover the expense of this therapy the demand for these
workers has increased Not too many years ago a broken hip would likely have resulted in a move to a nursing home However with medical advancements and treatments today after a successful surgery many people can return to their everyday lives with the help of these assistants to rehabilitate
Employment projections data for 2018 to 2028 is available for more than 500 detailed occupations in the virtual labor market data system and on our website in Adobe PDF and Microsoft Excel format Please visit our Occupational Employment Projections menu page for the latest options and data at any point in time
Occupational Demand Projections
The previous section on occupational employment projections focused on employment growth through 2028 specifically on those occupations projected to grow the fastest However growth is only one portion of the demand for workers in each occupation In fact when considering
future workforce needs employment growth is a relatively minor factor in the number of workers who will be needed The second component of demand is created when workers leave one occupation for a job in another occupation (this is known as transfer) or leave the workforce entirely (this is called exit)
The table at the top of the next page shows the occupations projected to have the greatest demand for workers in South Dakota each year on average through 2028 As you can see annual demand (for workers) due to employment growth accounts for a relatively small portion of the total annual demand for workers
The methodology used for employment projections at the national level and by all state agencies like ours in South Dakota is developed by the US Bureau of Labor Statistics (BLS) Use of the BLS methodology ensures not only statistically sound reliable and unbiased data but also allows for comparability of the data among geographic areas
BLS continuously strives to improve the methodology to ensure projections are accurately reflecting the dynamics of the current labor market This latest improvement to the BLS methodology which was released for the first time during the 2016-2026 statewide round of projections allows for a more comprehensive measure of the demand for workers National employment projections for 2018 to 2028 based on the new methodology were released in September 2019 state projections were rolled out in June 2020
Prior to the 2016-2026 occupational projections round the BLS methodology focused on replacement demand created by workers exiting the labor force completelymdashfor reasons such as retirement and death In todayrsquos workforce it is more common for workers to leave an occupation for reasons other than retirement such as changing careers being promoted into management or completing a training program to enter a different occupation
For this reason BLS established a new methodology which is known as separations The separations methodology was designed to better understand and project what will happen within the dynamic new economy in which workers will likely have multiple occupations in a lifetime This methodology
Page 70
South Dakota Occupational Projections 2018-2028 Top 10 in Demand
Occupational Title2018
Workers2028
Workers
Numeric Change 2018 to
2028
Annual Demand Due to
Employment Growth
Labor Force Exits
Occupational Transfers Total
Total All Occupations 491588 526251 34663 3466 23129 36069 62664
Retail Salespersons 16138 17072 934 93 954 1471 2518
Cashiers 12654 12868 214 21 1139 1268 2428
Combined Food Preparation and Serving Workers including Fast Food
8845 10432 1587 159 768 948 1875
Waiters and Waitresses 7511 7963 452 45 537 948 1530
Janitors and Cleaners except Maids and Housekeeping Cleaners 9650 10623 973 97 620 715 1432
Bookkeeping Accounting and Auditing Clerks 10986 11000 14 1 669 612 1282
Customer Service Representatives 8693 8702 9 1 418 742 1161
Heavy and Tractor-Trailer Truck Drivers 8645 9399 754 75 371 654 1100
Laborers and Freight Stock and Material Movers Hand 6517 7198 681 68 310 643 1021
Counter Attendants Cafeteria Food Concession and Coffee Shop 4066 4319 253 25 472 438 935
Source Labor Market Information Center SD Department of Labor and Regulation
incorporates past data patterns and trends to general employment projections and captures two types of separations
yen Workers who leave the labor force entirely (shown in the table above as ldquoAnnual Demand Due to Labor Force Exitsrdquo)
yen Workers who leave one major occupational group for another one (shown in the table above as ldquoAnnual Demand Due to Occupational Transfersrdquo)
Every personrsquos career journey varies but certain trends are common
yen Transfers between occupational groups are more common at younger ages as workers explore possible careers
yen Transfers between occupations also tend to be more common in occupations often considered ldquoentry levelrdquo where working conditions such as work schedules and employee benefits are less desirable
yen Movements out of the labor force known as exits happen at any age but are more common at older ages when workers typically retire
Page 71
How occupational transfers and exists impact projected outlookAs the pie graph above illustrates nearly all of South Dakotarsquos annual demand for workers during the 2018-2028 projections decade will be due to occupational transfers and labor force exits at 576 and 369 respectively Just 55 of the statersquos annual openings are projected to be new growth
South Dakota virtually mirrors the nation in these breakouts for the 2018-2028 projections period Nationally transfers (59) and exits (37) will make up the lionrsquos share of annual demand for occupations with just 4 being caused by growth
ExitsIn 2018 486 of South Dakotarsquos civilian noninstitutionalized population age 55 and over were in the statersquos labor force In 2016 503 of South Dakotarsquos civilian noninstitutionalized population age 55 and over were in the statersquos labor force This is a decrease of 17 in the labor force participation rate for this age cohort from 2016
to 2018 This indicates these workers exited the labor force at a faster clip in 2018 than 2016 It is anticipated as this population continues to age over the 10-year-projection period workers will continue to retire exiting the labor force
Retirement is not the only reason workers exit the labor force Many workers are in the labor force on a temporary basis People enter the labor force temporarily for a variety of reasons Once those reasons have been met they may exit the labor force causing a demand for the opening they have left behind
Reasons vary for entering an occupation for a limited amount of time For some it might be a necessity because family events mandate a lifestyle change Events such as a family member losing a job or becoming unable to work a divorce or perhaps the death of a loved one sometimes create the need for a temporary cash flow Therefore people not normally involved in the labor force will enter it for a while and then exit again once the situation is resolved
Page 72
In other cases individuals drop out of the labor force to stay home with their children until they start school or to home school them Other reasons for not participating in the labor force for a time include taking care of an aging or chronically ill relative or pursuing education
Annual Occupational TransfersAnother portion of occupational demand comes from occupational transfers This important component of occupational demand hinges on a workerrsquos attachment to or a lack thereof to an occupation Most workers have multiple jobs throughout their career When different jobs fall into completely separate occupations the result is an occupaitonal transfer
The South Dakota occupations with the highest projected demand due to occupational transfers are all large occupations with many workers Examples include Retail Salespersons Cashiers Combined Food Preparation and Serving Workers Including Fast Food Waiters and Waitresses Customer Service Representatives Janitors and Cleaners Heavy and Tractor-Trailer Truck Drivers and Laborers and Hand Material Movers
With a few exceptions most of the occupations with the greatest demand due to occupational transfers are transitory in nature By transitory we mean these occupations tend to work well as stepping stones for employees who plan to be in the occupation for a brief time want or need part-time work or simply need basic work experience before finding employment in another occupation
Young or new labor force entrants create many openings when they transfer from one occupation to another occupation in a different vocation These workers tend to accept employment in many of the occupations in the table above to gain work experience and begin creating a resume Most employers who hire these workers know it is unlikely they will retain them long-term but also realize they are helping develop the workforce When a special worker comes along if possible an employer makes room in the business to retain the skills the worker has acquired However usually in this situation the worker advances in the ranks moving into a different occupation with the same employer The result is still an opening created by an occupational transfer
Page 73
Hot Careers
When decision-makers are analyzing labor market data to make determinations of occupational training or educational programs to fund or provide assistance with the Department of Labor and Regulation encourages the use of both occupational demand and
wage estimates This helps ensure an adequate return on investmentmdashwith a greater likelihood of a trainee or graduate finding employment in an occupation related to the program and also being able to improve his or her earning potential
To that end and also to help individual career planners and job seekers identify occupations with the most favorable job outlook from a labor market perspective the Labor Market Information Center identifies high demand-high wage occupations or ldquoHot Careersrdquo
The current Hot Careers were identified in fall 2020 using the latest employment projections (2018-2028) and wage data (2019) available at the time With 2020 wage estimates becoming available since the criteria was updated accordingly To be on the Hot Careers list an occupation has to meet each of the three following criteria
yen Be projected to show employment growth to 2028
yen Have projected annual openings (a measure of demand for workers) greater than the average across all occupations (85) for 2018-2028
yen Have an averagemean wage greater than the median wage across all occupations in 2020 ($34754)
The 69 South Dakota occupations meeting the Hot Careers criteria are listed on the following pages
Page 74
Accountants and Auditors
Automotive Service Technicians and Mechanics
Bus and Truck Mechanics and Diesel Engine Specialists
Business Operations Specialists All Other
Buyers and Purchasing Agents
Carpenters
Cement Masons and Concrete Finishers
Chief Executives
Child Family and School Social Workers
Civil Engineers
Clergy
Clinical Laboratory Technologists and Technicians
Coaches and Scouts
Coating Painting and Spraying Machine Setters Operators and Tenders
Compliance Officers
Computer User Support Specialists
Correctional Officers and Jailers
Cost Estimators
Cutting and Slicing Machine Setters Operators and Tenders
Cutting Punching and Press Machine Setters Operators and Tenders Metal and Plastic
Dental Assistants
Educational Guidance School and Vocational Counselors
Electricians
Elementary School Teachers Except Special Education
Farm Equipment Mechanics and Service Technicians
First-Line Supervisors of Construction Trades and Extraction Worker
First-Line Supervisors of Housekeeping and Janitorial Workers
First-Line Supervisors of Mechanics Installers and Repairers
First-Line Supervisors of Non-Retail Sales Workers
First-Line Supervisors of Office and Administrative Support Workers
First-Line Supervisors of Production and Operating Workers
First-Line Supervisors of Non-Retail Sales Workers
Food Service Managers
General and Operations Managers
Graphic Designers
Heating Air Conditioning and Refrigeration Mechanics and Installers
Heavy and Tractor-Trailer Truck Drivers
Highway Maintenance Workers
Human Resources Specialists
Industrial Machinery Mechanics
Industrial Truck and Tractor Operators
Insurance Sales Agents
Licensed Practical and Licensed Vocational Nurses
Light Truck or Delivery Services Drivers
Loan Interviewers and Clerks
Loan Officers
Machinists
Maintenance and Repair Workers General
Management Analysts
Market Research Analysts and Marketing Specialists
Hot Careers
Accountants and Auditors
Automotive Service Technicians and Mechanics
Bus and Truck Mechanics and Diesel Engine Specialists
Business Operations Specialists All Other
Buyers and Purchasing Agents
Carpenters
Cement Masons and Concrete Finishers
Chief Executives
Child Family and School Social Workers
Civil Engineers
Clergy
Clinical Laboratory Technologists and Technicians
Coaches and Scouts
Coating Painting and Spraying Machine Setters Operators and Tenders
Compliance Officers
Computer User Support Specialists
Correctional Officers and Jailers
Cost Estimators
Cutting and Slicing Machine Setters Operators and Tenders
Cutting Punching and Press Machine Setters Operators and Tenders Metal and Plastic
Dental Assistants
Educational Guidance School and Vocational Counselors
Electricians
Elementary School Teachers except Special Education
Farm Equipment Mechanics and Service Technicians
First-Line Supervisors of Construction Trades and Extraction Worker
First-Line Supervisors of Housekeeping and Janitorial Workers
First-Line Supervisors of Mechanics Installers and Repairers
First-Line Supervisors of Non-Retail Sales Workers
First-Line Supervisors of Office and Administrative Support Workers
First-Line Supervisors of Production and Operating Workers
First-Line Supervisors of Retail Sales Workers
Food Service Managers
General and Operations Managers
Graphic Designers
Heating Air Conditioning and Refrigeration Mechanics and Installers
Heavy and Tractor-Trailer Truck Drivers
Highway Maintenance Workers
Human Resources Specialists
Industrial Machinery Mechanics
Industrial Truck and Tractor Operators
Insurance Sales Agents
Licensed Practical and Licensed Vocational Nurses
Light Truck or Delivery Services Drivers
Loan Interviewers and Clerks
Loan Officers
Machinists
Maintenance and Repair Workers General
Page 75
Additionally the Top 30 occupations were identified In addition to meeting the criteria for the Hot Careers South Dakotarsquos Top 30 Careers are those which additionally meet this criteria
yen Rank in the top 30 for projected annual openings (a measure of demand for workers)
For each of the Top 30 careers the table on the following pages shows the 2018-2028 projected employment and outlook information and the 2020 wage data Also on the following page is a legend explaining the row colors
Top 30 Careers
Management Analysts
Market Research Analysts and Marketing Specialists
Middle School Teachers except Special and CareerTechnical Education
Network and Computer Systems Administrators
Operating Engineers and Other Construction Equipment Operators
Painters Construction and Maintenance
Parts Salespersons
Pesticide Handlers Sprayers and Applicators Vegetation
Plumbers Pipefitters and Steamfitters
Police and Sheriffrsquos Patrol Officers
Property Real Estate and Community Association Managers
Registered Nurses
Sales Representatives Wholesale and Manufacturing except Technical and Scientific Products
Sales Representatives Wholesale and Manufacturing Technical and Scientific Products
Secondary School Teachers except Special and CareerTechnical Education
Software Developers Applications
Soil and Plant Scientists
Structural Iron and Steel Workers
Substance Abuse Behavioral Disorder and Mental Health Counselors
Water and Wastewater Treatment Plant and System Operators
Welders Cutters Solderers and Brazers
69 Hot
Careers
Page 76
South Dakota Top 30 Occupations 2018-2028 Employment and Demand Projections and 2020 Wage Estimates
Rank Occupational TitleAnnual
Openings2018
Employment2028
EmploymentNumeric Change
Percent Change
Average Wage
1 Heavy and Tractor-Trailer Truck Drivers 1100 8645 9399 754 87 $46232
2 Registered Nurses 907 12940 14643 1703 132 $60956
3 Carpenters 659 5696 6160 464 82 $38094
4Sales Representatives Wholesale and Manufacturing except Technical and Scientific Products
655 5449 6003 554 102 $65925
5 Accountants and Auditors 538 4998 5491 493 99 $69174
6 First-Line Supervisors of Retail Sales Workers 466 4059 4190 131 32 $49305
7 Light Truck or Delivery Services Drivers 447 3387 3777 390 115 $36996
8 Welders Cutters Solderers and Brazers 432 3321 3758 437 132 $40874
9 General and Operations Managers 404 4038 4412 374 93 $131895
10 Management Analysts 377 3334 3762 428 128 $75916
11 Elementary School Teachers except Special Education 349 4264 4516 252 59 $44793
12 Maintenance and Repair Workers General 334 3007 3294 287 95 $40319
13 Electricians 322 2464 2696 232 94 $47672
14 Insurance Sales Agents 296 2562 2882 320 125 $72640
15Secondary School Teachers except Special and CareerTechnical Education
275 3502 3718 216 62 $45810
16 Loan Interviewers and Clerks 245 2001 2282 281 140 $39104
17 Automotive Service Technicians and Mechanics 244 2321 2441 120 52 $42841
18 Cement Masons and Concrete Finishers 239 2010 2195 185 92 $37562
19 Clergy 225 1860 2008 148 80 $47240
20 Parts Salespersons 224 1616 1800 184 114 $39169
21 Plumbers Pipefitters and Steamfitters 219 1684 1896 212 126 $45333
22 Operating Engineers and Other Construction Equipment Operators 213 1702 1805 103 61 $46576
23 Highway Maintenance Workers 211 1796 1870 74 41 $37319
Page 77
Color Coding Key for
Level of Education Recommended in South Dakota
High school diploma or equivalent
Some postsecondary education
Associate degree
Bachelorrsquos degree
South Dakota Top 30 Occupations continued 2018-2028 Employment and Demand Projections and 2020 Wage Estimates
Rank Occupational TitleAnnual
Openings2018
Employment2028
EmploymentNumeric Change
Percent Change
Average Wage
24First-Line Supervisors of Office and Administrative Support Workers
198 1824 1875 51 28 $51636
25 Industrial Truck and Tractor Operators 197 1533 1693 160 104 $37187
26 Child Family and School Social Workers 195 1846 1947 101 55 $41940
27Sales Representatives Wholesale and Manufacturing Technical and Scientific Products
191 1600 1753 153 96 $104815
28 Coaches and Scouts 178 1081 1201 120 111 $39623
29Substance Abuse Behavioral Disorder and Mental Health Counselors
176 1352 1603 251 186 $44195
30 Loan Officers 175 1703 1930 227 133 $70141
Notes
For more information on average annual openings and other employment projections data used in the table above (2018 workers 2028 workers percent change 2018-2028) see our Employment Projections Technical Notes page
For more information on average annual wages please see our Occupational Wages Technical Notes page
Employment projections for additional occupations are available in the virtual labor market data system please see our Occupational Projections menu
Wage data is also available for additional occupations in the virtual labor market data system please see our Occupational Wages menu
Source Labor Market Information Center South Dakota Department of Labor and Regulation
Page 78
A number of resources on the Hot Careers and Top 30 Careers are available as listed below To learn more visit our Hot Careers web page or call the Labor Market Information Center at 6056262314
Current Job Openings in Hot Careers
Top 30 Hot Careers flier (Adobe PDF format also available in print upon request)
Learn even more about each Hot Career in the virtual labor market data system
Occupational Profiles
The Top 30 Careers and many of the 69 Hot Careers are also featured in the career awareness and exploration materials LMIC develops for K-12 students The materials are available in PDF format for downloading from the website and are also available in print upon request
Career Peeks (activity packet for students in kindergarten through second grade)
Career Aware (activity booklet for students in grades three through five)
Career Cluster Poster Series
Hot Career Resources
Published byLabor Market Information Center
South Dakota Department of Labor and RegulationSeptember 2021
Auxiliary aids and services are available upon request to individuals with disabilities State and federal laws require the Department of Labor and Regulation to provide services to all qualified persons without regard to race color creed religion age sex ancestry political affiliation or belief national origin or disability
This workforce product was funded by a grant awarded by the US Department of Laborrsquos Employment and Training Administration The product was created by the recipient and does not necessarily reflect the official po-sition of the US Department of Labor The Department of Labor makes no guarantees warranties or assurances of any kind express or implied with respect to such information including any information on linked sites and including but not limited to accuracy of the information or its completeness timeliness usefulness adequacy continued availability or ownership This product is copyrighted by the institution that created it Internal use by an organization andor personal use by an individual for non-commercial purposes is permissible All other uses require the prior authorization of the copyright owner

PopulationWorkforce Demographics Page 1Language Spoken Page 3
Gross Domestic Product Page 5
Workforce Page 7Labor Force Participation Rate Page 7Labor Force Page 92021 Update Page 10Unemployment and Educational Levels Page 11
Total Employment Page 13 Self Employment Page 15
Worker Commuting Page 17
Advertised Job Openings Page 19
Nonfarm Wage and Salaried Workers Page 212020 Industry Trends Page 232021 Update Page 27
Quarterly Census of Employment and Wages Page 29Number of Covered Workers Page 30 Annual Pay of Workers Page 33 Noteworthy Industry Trends Page 35 Establishment Size Page 44
Personal Income Page 47
Poverty Page 49
Population Projections Page 51
Employment Projections Page 53 Industry Employment Projections Page 53 Occupational Employment Projections Page 62 Occupational Demand Projections Page 69Hot Careers (High Demand-High Wage Occupations) Page 73Top 30 Careers Page 75Hot Career and Top Career Resources Page 78
Table of Contents
Page 1
Population and Workforce Demographics
South Dakotarsquos total population has been steadily increasing since 1990 growing by nearly 200000 (29) between 1990 and 2020 According to estimates published by the US Census Bureau our population increased by 77000 or 94 between 2010 and 2020 exceeding the US
population increase of 65 over the same time period
Much of the growth has taken place in our two Metropolitan Statistical Areas (MSAs) Rapid City and Sioux Falls Population in those two metro areas increased by 137 and 194 respectively over the last 10 years Nearly half of South Dakotarsquos 427100 population (478) resides in either the Sioux Falls or Rapid City MSAs
427100
Page 2
Between 2019 and 2020 population growth remained consistent from previous years with the MSAs growing at a slightly faster pace than the rest of the state
The 2019 American Community Survey (ACS) data produced by the US Census Bureau shows the largest percent of the state population by race is comprised of White residents (867) followed by American Indian and Alaskan (105) Regarding ethnicity 37 of South Dakotarsquos population is Hispanic or Latino
South Dakota Population by Race and Ethnicity
Number Percent
Total population 884659 1000
White 766781 867
Black or African American 26679 30
American Indian and Alaska Native 92709 105
Asian 14395 16
Native Hawaiian and Other Pacific Islander 2868 03
Some other race 6973 08
Hispanic or Latino (of any race) 33018 37
Source US Census Bureau 2019 American Community Survey
South Dakota Population Estimates (as of July 1 each year)
2019 2020
South Dakota 887100 892700
Rapid City MSA 151800 153500
Sioux Falls MSA 269300 273600
Source US Census Bureau 2020 population estimates
Page 3
Data available from the 2019 American Community Survey (ACS) for the linguistics of our state population show that a large majority of state residents (942) speak only English Of those residents who have the ability to speak in other languages (47700) some struggle with
language barriers as an estimated 6500 (137) speak English lsquonot wellrsquo or lsquonot well at allrsquo
Language Spoken at Home by Ability to Speak English for the Population 5 Years and Over
Language Spoken5 to 17 years
18 to 64 years
65+ years Total
Percent of Total
Total 156410 515591 153799 825800 1000
Speak only English 149331 481365 147365 778061 942
Speak Spanish 2137 12047 1647 15831 19
Speak English ldquovery wellrdquo 1125 7144 842 9111 11
Speak English ldquowellrdquo 646 2244 98 2988 04
Speak English ldquonot wellrdquo 366 1946 615 2927 04
Speak English ldquonot at allrdquo 0 713 92 805 01
Speak other Indo-European languages 840 5501 1827 8168 10
Speak English ldquovery wellrdquo 774 3736 1542 6052 07
Speak English ldquowellrdquo 0 912 205 1117 01
Speak English ldquonot wellrdquo 66 853 80 999 01
Speak English ldquonot at allrdquo 0 0 0 0 00
Speak Asian and Pacific Island languages 1145 6081 514 7740 09
Speak English ldquovery wellrdquo 390 2467 335 3192 04
Speak English ldquowellrdquo 755 2937 139 3831 05
Speak English ldquonot wellrdquo 0 677 26 703 01
Speak English ldquonot at allrdquo 0 0 14 14 00
Speak other languages 2957 10597 2446 16000 19
Speak English ldquovery wellrdquo 2331 7840 1841 12012 15
Speak English ldquowellrdquo 626 1952 329 2907 04
Speak English ldquonot wellrdquo 0 480 257 737 01
Speak English ldquonot at allrdquo 0 325 19 344 00
Source US Census Bureau 2019 American Community Survey
Language Spoken
Page 4
Page 5
Gross Domestic Product
Gross domestic product (GDP) by state is the market value of goods and services produced by the labor and property located in the state It is the state counterpart of the nationrsquos GDP which is the Bureau of Economic Analysisrsquo most comprehensive measure of US economic
activity Analysis of the change in South Dakota GDP data from 2019 to 2020 reflects an overall decline (all industry total) of 02 which is a decrease from the previous yearrsquos 32 growth Half of the 14 industries had increases in GDP between 2019 and 2020 The three industries with the most growth were the Agriculture Forestry Fishing and Hunting (118) Construction (65) and Utilities (42)
The three industries which had the largest decrease in GDP were Mining Quarrying and Oil and Gas Extraction (267) Transportation and Warehousing (175) and Arts Entertainment Recreation Accommodation and Food Services (156) The Mining Quarrying and Oil and Gas Extraction is the only industry which decreased over the past two years It is also the smallest industry in South Dakota making up only 02 of total GDP which enhances the volatility of this industry from year to year
South Dakota Gross Domestic Product (GDP) by Industry Sector(Millions of Dollars)
Industry2018 GDP
2019 GDP
2020 GDP
Change from
2018-2019
Change from
2019-2020
All Industry Total 53239 54941 54852 32 -02
Private Industries 47388 48889 48818 32 -01
Agriculture Forestry Fishing and Hunting 3702 3340 3735 -98 118
Mining Quarrying and Oil and Gas Extraction 137 125 92 -86 -267
Utilities 880 928 967 55 42
Construction 2049 2168 2308 58 65
Manufacturing 5054 5121 5085 13 -07
Wholesale Trade 3550 3648 3580 28 -19
Retail Trade 3486 3611 3725 36 32
Transportation and Warehousing 1218 1271 1048 44 -175
Information 1292 1383 1414 71 23
Finance Insurance Real Estate Rental and Leasing 14396 15030 15067 44 02
Professional and Business Services 3127 3323 3368 63 14
Educational Services Health Care and Social Assistance 5384 5679 5565 55 -20
Arts Entertainment Recreation Accommodation and Food Services 2019 2093 1767 37 -156
Other services except Government 1095 1169 1096 68 -62
Government 5851 6052 6035 34 -03
Note NAICS Industry detail is based on the 2012 North American Industry Classification System (NAICS)Last updated March 26 2021 reflecting Census Bureau midyear population estimates available as of December 2020Source US Bureau of Economic Analysis
Page 6
Page 7
Workforce
Current Population Survey (CPS) figures from the Bureau of Labor Statistics show South Dakotarsquos labor force participation rate was 689 in 2020 In other words nearly 70 of all (non-institutionalized) residents age 16 years and older were in the labor force either working or
looking for work
Labor Force Participation Rate
South Dakota Labor Force Participation
7 out of
10
This compares to a 2020 national average of 617 Historically South Dakota consistently has higher rates of labor force participation than the nation as a whole
South Dakotarsquos participation rate of 689 is the fourth highest rate of all states and the District of Columbia Nebraska had the highest rate at 701 followed by the District of Columbia at 695 and Minnesota at 692
Page 8
Youth in South Dakota were also very active labor force participants In 2020 646 of the statersquos young population (age 16-24 years) were in the labor force compared to the national rate of 539 At the other end of the age spectrum South Dakotarsquos labor force participation rate of 65 and over is 278 compared to the national average of 194
A closer look at some of the demographic groups shows South Dakotarsquos percentage of residents in the labor force ranks near the top nationally in both the male and female categories With a female labor force participation rate of 642 South Dakota ranks as the fifth highest behind the District of Columbia at 667 Minnesota at 656 Nebraska at 650 and North Dakota at 645 The national labor force participation rate for women in 2020 was 562
The states male labor force participation rate ranked fourth at 735 behind Utah at 756 Nebraska at 754 and Colorado at 745 The national labor force participation rate for men was 677 in 2020
There can be several reasons why South Dakota civilians are not in the labor force Approximately 93 of South Dakotans who are not in the labor force do not want a job at this time Other reasons include specific barriers to employment such as discouragement and poor job prospects as detailed in the following table
2020 Annual Average Labor Force Participation Rates by Age
Total 16-24 25-34 35-44 45-54 55-64 65+
United States 617 539 814 822 806 647 194
South Dakota 689 646 861 873 865 730 278
Source US Bureau of Labor Statistics Current Population Survey
South Dakota Civilians Not in the Labor Force by Age and Sex
Age Sex
Total 16 to 24 25 to 54 55 years Men Women
Total not in the labor force 211200 35200 42100 134000 89700 121600
Do not want a job now 195700 29900 36000 129800 81300 114500
Want a job 15500 5300 6100 4100 8400 7100
Did not search for work in previous year 11900 4000 4100 3700 6100 5800
Searched for work in previous year 3600 1300 1900 400 2200 1300
Not available to work now 1000 500 400 100 600 400
Available to work now 2600 800 1600 200 1700 900
Reason not currently looking
Discouragement over job prospects 700 300 400 100 500 300
Reasons other than discouragement 1900 500 1200 100 1200 700
Note Subject to high rates of variability January 2020 - December 2020 reference periodSource Special tabulations of unpublished Current Population Survey (CPS) US Bureau of Labor Statistics
642735
Page 9
South Dakotarsquos labor force which consists of the employed and unemployed continues to grow indicating a healthy labor market Using seasonally adjusted data for a more straightforward economic indicator over
the long term South Dakotarsquos labor force had been increasing gradually since the recession ended in 2009 The number of unemployed began to increase in March 2016 and continued this movement until October 2017 when it began to decrease for the next 11 months Another upward trend began in November 2018 which continued until November 2019
Unemployment had stabilized in 2020 until the COVID-19 pandemic hit South Dakotarsquos economy in April sending the number of unemployed to unprecedented levels
The unemployed data series consists of more than those people who have lost a job It includes those who have quit their jobs to look for other employment workers whose temporary jobs have ended individuals looking for their first job and experienced workers looking for jobs after an absence from the labor force (for example stay-at-home parents who return to the labor force after their children have entered school)
The level of employed also took a big hit in April 2020 when the pandemic began But as illustrated in the line graph below South Dakota was quick to recover after the initial shock of COVID-19 Our state was one of seven that did not issue stay-at-home orders and the only one that did not require any businesses to close during the pandemic This helped soften the blows the pandemic dealt impacts in South Dakota were less severe than in other states and nation By the end of 2020 the number of unemployed was close to pre-pandemic levels And by December 2020 the number of employed South Dakotans actually exceeded 2019 levels
The 2020 annual unemployment rate was 46 in South Dakota compared to the national rate of 81 After the unemployment rate spiked to 92 in April 2020 it declined rapidly and was back to 33 by December 2020
Labor ForceEmployed +
Unemployed= Labor Force
Page 10
2021 Labor Force Data Show Pandemic Recovery Continues
As mentioned South Dakotarsquos labor force had rebounded by the end of 2020 after several months of decline earlier in the year when the COVID-19 pandemic hit the state
In fact according to the most current labor force estimates available (August 2021) South Dakotarsquos total labor force has grown beyond pre-pandemic levels For the first three months in 2020 before the pandemicrsquos impacts struck the labor market South Dakotarsquos seasonally adjusted labor force was averaging about 463000 Using August 2021 data South Dakotarsquos seasonally adjusted labor force has grown to 471300
Although there is still some uncertainty in the labor market as we work our way out of
the pandemic (especially in light of recent resurgences due to COVID-19 variants) 2021 labor force data available so far looks promising for stabilization
The number of unemployed has continued to decline since the initial surge in April 2020 when effects of the pandemic began distressing the labor market Unemployment is back to pre-pandemic levels with the August 2021 estimate of 13600 which is 7800 less than a year ago and just slightly higher than the three-month 2020 average before the pandemic hit
The August 2021 unemployment rate was 29 much lower than the rate of 47 recorded in August 2020
Labor force data is one of indicators analyzed in terms of the labor marketrsquos recovery from the COVID-19 pandemic For the most current monthly information available visit the Pandemic Picture page
Page 11
Unemployment rates by educational attainment level indicate the highest unemployment rates in South Dakota
correlate with residents who have an educational attainment level of lsquohigh school graduates no collegersquo (40 ) and lsquoless than a high school diplomarsquo (88 )
Unemployment and Educational Levels
In contrast the lowest unemployment rates are for those residents which have an educational attainment level of lsquoBachelorrsquos degree and higherrsquo (29 ) Higher levels of educational attainment also correlate with higher earnings levels
South Dakota Employment Status of the Civilian Population 25 Yeas and Over by Educational Attainment
Civilian Labor Force Employment Unemployment
Population Total Rate Total Rate Total Rate
Less than a High school diploma 30400 14500 479 13200 436 1300 88
High school graduates no college1 169900 109100 642 104700 616 4400 40
Some college or associate degree 192600 136900 711 131900 685 5000 37
Bachelorrsquos degree and higher2 186100 142400 765 138200 742 4200 291Includes persons with a high school diploma or equivalent2Includes person with bachelorrsquos masterrsquos professional and doctoral degrees
Non-institutionalized population
Note Subject to high rates of variability January 2020 - December 2020 reference period
Source Special tabulations of unpublished Current Population Survey (CPS) US Bureau of Labor Statistics
Page 12
Page 13
Total Employment
The US Bureau of Economic Analysis (BEA) also publishes employment data for state and local areas which includes an estimate of the total number of jobs including detail by full-time or part-time status (full-time and part-time jobs are counted at equal weight) and by place of
work Employees sole proprietors and active partners are all included but unpaid family workers and volunteers are not Proprietors are those workers who own and operate their own businesses and are reported as either farm or nonfarm workers
The number of workers covered by unemployment insurance is a key component of the employment data published by the BEA and in information compiled by the US Bureau of Labor Statistics More information regarding covered workers in South Dakota is available on the Labor Market Information Center website
The graph below shows annual employment change during the 2000-2019 period using the BEA data Comparative data is included for the United States South Dakota and the Plains Region (Iowa Kansas Missouri Nebraska North Dakota and South Dakota)
For the 2008-2009 period which reflected the worst impact of the recession South Dakota had a total employment loss rate of 08 compared to a loss rate of 23 for the Plains Region and 31 for the nation South Dakotarsquos total employment growth began an uphill trend after 2008-2009 which continued through 2018 Total employment increases between 2018 and 2019 in South Dakota and the Plains Region were steady at 13 and 11 respectively but they continue to grow at slower rates than the nation as a whole which had growth of 18
The two employment sectors which comprise total employment include proprietor employment and wage and salary employment Total employment for all three areas had positive growth between
Page 14
2014-2019 The largest percent employment increases have come from proprietor employment however wage and salary employment has also had positive growth annually
In South Dakota total employment growth from 2018-2019 outpaced the Plains Region by 02 percentage points but was a behind the United States as a whole by 05 percentage points South Dakota was also slightly ahead of the Plains Region in wage and salary employment growth South Dakotarsquos proprietor employment grew at a faster rate of 26 than wage and salary employment at 08 over the most recent period Both the Plains Region and the United States experienced this trend
Growth by Employment Sector
Total Employment 2014-2015 2015-2016 2016-2017 2017-2018 2018-2019
South Dakota 06 08 07 14 13
Plains Region 12 06 05 10 11
United States 22 16 15 20 18
Proprietor Employment 2014-2015 2015-2016 2016-2017 2017-2018 2018-2019
South Dakota 02 09 07 25 26
Plains Region 09 07 02 17 27
United States 28 18 23 33 31
Wage and Salary Employment 2014-2015 2015-2016 2016-2017 2017-2018 2018-2019
South Dakota 07 08 06 10 08
Plains Region 13 06 06 08 07
United States 20 15 13 16 13
Source US Bureau of Economic Analysis
Page 15
The Bureau of Labor Statistics (BLS) also publishes national estimates of the self-employed for both the agriculture (and related industries) and the nonfarm industry sectors The data is from the Current Population Survey (CPS) data Total self-employed workers decreased by 287000
or 30 in 2020 following a decrease of 17 in 2019 Total self-employed workers are comprised of two components agriculture forestry fishing and hunting industries and nonagricultural industries The agricultural forestry fishing and hunting industries increased by 1000 (01) while the nonagricultural industries decreased by 288000 (33)
United States Self-Employed Workers
Year Total
Agriculture Forestry Fishing
and HuntingNonagricultural
Industries
2016 9604000 853000 8751000
2017 9526000 790000 8736000
2018 9707000 766000 8941000
2019 9540000 741000 8799000
2020 9253000 742000 8511000
Net Change 2016-2020 -351000 -111000 -240000
Percent Change -37 -130 -27
Source US Bureau of Labor Statistics Current Population Survey
Self Employment
Page 16
Page 17
Worker Commuting
At the beginning of the second quarter of 2018 (most current data available) 385534 people were employed in South Dakota Of this total 360336 (935) lived and worked in the state while 21198 (65) worked in the state but lived outside its borders
During the same period 379412 individuals with jobs lived in the state but not all of them were employed in South Dakota Of this total 360336 (950) called South
Dakota home The remaining 19076 (50) of workers lived in South Dakota but commuted to another state for work
These figures count only primary jobs Primary jobs are public and private-sector jobs one job per worker A primary job is the highest paying job for an individual
worker Workers who have more than one job in the selected area are counted only once
Inflow and Outflow of Workers
Home Destination Report Home Location of Workers Employed
in South DakotaJob Counts by State
Second Quarter 2018
Work Destination Report Work Location of Workers living
in South DakotaJob Counts by State
Second Quarter 2018
States Count Share States Count Share
South Dakota 360336 935 South Dakota 360336 950
Iowa 7041 18 Iowa 5314 14
Minnesota 6631 17 Minnesota 3764 10
Nebraska 4416 11 North Dakota 3146 08
North Dakota 1579 04 Nebraska 2628 07
Wyoming 1220 03 Wyoming 1632 04
Colorado 502 01 Colorado 575 02
California 356 01 Montana 293 01
Texas 322 01 California 218 01
Illinois 285 01 Texas 172 00
All Other Locations 2846 07 All Other Locations 1334 04
Total Primary Jobs 385534 1000 Total Primary Jobs 379412 1000
Notes Numbers may not sum due to rounding
Primary Jobs Public and private-sector jobs one job per worker A primary job is the highest paying job for an individual worker This data does not include Federal Employment
Source US Census Bureau OnTheMap Application and LEHD Origin-Destination Employment Statistics (Beginning of Quarter Employment 2nd Quarter of 2002-2018)
50
Page 18
South Dakota Working Commuting Flows
Commuting to work data is possible through a partnership between the US Census Bureau and the Labor Market Information Center (LMIC) on the Longitudinal Employer-Household Dynamics program Call the Labor Market Information Center at 6056262314 if you are interested in siimilar data for your specific area of the state
Page 19
Advertised Job Openings
This data is developed by Geographic Solutions Inc the vendor of the virtual labor market data system It uses ldquospideringrdquo to collect content from job openings posted by a wide variety of entities from major job boards to employersrsquo websites
Although a rather erratic measure data on the number of job openings advertised online (available in the virtual labor
market data system) provides an indicator of more recent activity in the labor market than the more traditional workfirce data sets allow This measure includes all job openings advertised online whether those openings are advertised on employer websites or major job boards including SDWORKS the statersquos jobs database
There were 177118 South Dakota jobs advertised online in 2020 As the line graph below shows the lowest pandemic-related slump in advertised job openings was in May 2020 at just under 30000 Job opening
numbers then began rebounding climbing to September 2020 Numbers then began a downslide to Decemberrsquos level of 36108 which was likely more of a seasonal reflection
Job openings data downloaded daily from the virtual system during the worst of the pandemic shows the very lowest point for jobs being advertised online was in late April 2020
Monthly data available as of August 2021 show job openings climbing from January to May hitting a new high mark of 42468 in May 2021 before dropping slightly in June 2021
177118
Page 20
The level of job openings advertised online bounced back in July nearly meeting the May high point August brought a new peak in job openings at 44704
The top 10 counties in South Dakota with the highest number of job openings in 2020 were
yen Minnehaha County (52083)
yen Pennington County (31840)
yen Lincoln County (9513)
yen Brookings County (7948)
yen Brown County (7548)
yen Hughes County (7340)
yen Codington County (5925)
yen Lawrence County (5695)
yen Davison County (5032)
yen Yankton County (4509)
Historical and current (prior day) data on job openings are available in the virtual system by specific area (statewide metro areas and county) industry occupation and educational level required
From the left-hand menu of LMICrsquos website see the ldquoVirtual Labor Market Data Systemrdquo options
yen Direct link to the virtual system
yen instructions for using the system including those for finding current job openings data
yen Job Openings Data option for links to the historical data
Page 21
Nonfarm Wage and Salaried Workers
This sample-based data set is a leading economic indicator nationally providing employment levels by industry each month
South Dakotarsquos nonfarm worker levels had significant declines in 2020 dropping 15100 workers (34) The
2020 annual average number of workers was 425400 Statewide privately owned nonfarm establishments had an average annual loss of 11800 workers (33) dropping to 348700 workers in 2020
The Sioux Falls Metropolitan Statistical Area (MSA) nonfarm worker level decreased 4300 workers (27) for a 2020 annual average of 155800 workers The Rapid City MSA also declined with a loss of 2600 workers (38) The bulk of the over-the-year worker level losses were due to COVID-19 with many establishments having reduced staffing in 2020 compared to 2019
South Dakota Statewide Nonfarm Wage amp Salaried Workers by Industry
(Not Seasonally Adjusted)
Industry
2019 Annual Average
2020 Annual Average
Actual Change
Percent Change
Total Nonfarm 440500 425400 -15100 -34
Total Private 360500 348700 -11800 -33
Goods Producing 69600 68300 -1300 -19
Service Providing 370900 357000 -13900 -37
Mining Logging and Construction 24600 25200 600 24
Manufacturing 45000 43200 -1800 -40
Wholesale Trade 21100 21000 -100 -05
Retail Trade 51200 49600 -1600 -31
Transportation Warehousing and Utilities 13500 13300 -200 -15
Information 5500 5000 -500 -91
Financial Activities 29000 28400 -600 -21
Professional and Business Services 33200 32700 -500 -15
Education and Health Services 73200 73100 -100 -01
Leisure and Hospitality 47400 40700 -6700 -141
Other Services (except Public Administration) 16800 16600 -200 -12
Government 80000 76700 -3300 -41
Note Numbers may not add due to rounding Source Labor Market Information Center South Dakota Department of Labor and Regulation in cooperation with US Bureau of Labor Statistics
Page 22
Nonfarm worker levels can be divided into two major components
yen Goods Producing
yen Service Providing
Goods Producing industries (including the Mining Logging and Construction and the Manufacturing sector designated in the lighter color in the bar graph below) decreased by 1300 workers (19) from 2019 to 2020
Service Providing industries (all other sectors listed in the table above) had a loss of 13900 workers (37)
Page 23
Mining Logging and ConstructionMining Logging and Construction increased 600 workers (24) for a 2020 annual average of 25200 Construction paved the way to this increase adding 600 workers and reaching an annual average of 24200 workers in 2020
Heavy and Civil Engineering Construction accounted for the majority of the growth in construction with the addition of 500 workers (125) This growth was related to infrastructure improvements as locations throughout the state continue to grow or need repairs Highway and street construction land development development or repair of utilities systems (including water sewer power and communication networks) are a few of types of projects undertaken
Specialty Trade Contractors had a modest growth of 100 workers (07) and Construction of Buildings remained unchanged at 5800 workers
Mining and Logging remained unchanged from 2019 to 2020 with 1000 workers
ManufacturingManufacturing declined 1800 workers (40) over the year dropping to a 2020 annual average of 43200 workers Durable Goods Manufacturing accounted for all of this decline (63)
Durable goods produced in South Dakota such as trailers furniture and electronic equipment are not immediately consumed and can be kept for a longer time This drop was related to small worker level declines throughout many establishments along with challenges intensified by COVID-19 (such as supply chain issues and demand fluctuations)
Non-Durable Goods Manufacturing remained unchanged with a 2020 annual average of 16300 workers Non-durable goods are immediately consumed in one use or have a lifespan of less than three years Examples of non-durable goods produced or processed in South Dakota include food and beverage products paper products and fuel
2020 Industry Trends
Page 24
Wholesale TradeWholesale Trade had a modest loss of 100 workers (05) dropping to a 2020 annual average of 21000 workers Losses in Wholesale Trade took place outside of the Sioux Falls and Rapid City MSAs
The Wholesale Trade sector consists of establishments engaged in wholesaling merchandise and rendering services incidental to merchandise The merchandise in this sector consists of the outputs of agriculture mining manufacturing and certain information industries like publishing Wholesale Trade worker levels tend to follow the same path as Manufacturing however South Dakotarsquos strong agriculture economy helped keep this sectorrsquos loss minimal during 2020
Retail TradeRetail Trade continued a downward trend during 2020 dropping 1600 workers (31) This sector went from 51200 workers in 2019 to a 2020 annual average of 49600 workers Clothing boutiques web retailers home furnishing stores department stores hardware stores supermarkets gasoline stations antique shops and souvenir stores are examples of some of the establishments in this sector
Losses in Retail Trade were related to COVID-19 as establishments adjusted their procedures to fight the spread In the beginning of the pandemic some establishments temporarily closed with others shortening shopping hours
While some establishments in Retail Trade remained busy as people searched for basic needs (toilet paper hand sanitizer and food) others had to adjust their services to deal with demand fluctuations Many establishments offered various options for pickup and delivery to ease customersrsquo COVID-19 concerns increased their online presence added phone apps for customers to shop safely and increased use of social media to keep customers engaged
Transportation Warehousing and UtilitiesTransportation Warehousing and Utilities had a decline of 200 workers (15) over the year dropping to a 2020 annual average of 13300 workers Examples of establishments in this industry include tow truck services natural gas distribution taxicab services local and long-distance trucking scheduled air passenger transportation and general warehousing
Declines in Transportation Warehousing and Utilities are attributed to COVID-19 As some establishments remained stable other areas such as air transportation and transit and ground passenger transportation had drops in demand affecting the number of workers needed
InformationInformation continued a downward trend with an average annual loss of 500 workers (91) from 2019 to 2020 The Sioux Falls and Rapid
City MSAs each had a loss of 100 workers The Information sector is comprised of establishments engaged in publishing internet publishing motion picture and sound recording broadcasting telecommunications internet service providers data processing and all other information services
Losses in the Information sector are due to advancements in technology combined with challenges caused by the current pandemic Some establishments in this sector temporarily
Page 25
closed when the pandemic began with some dealing with a decline in demand Consumers now have more opportunities to stream new entertainment releases once available only at movie theaters The opportunities are endless when it comes to what you can do with your phone computer tablet or smart TV Pandemic-induced sheltering at home further intensified use of such options for remote entertainment As technology continues to evolve the demand for workers in this sector will continue to fluctuate
Financial ActivitiesFinancial Activities had a loss of 600 workers (21) over the year This supersector went from a 2019 annual average of 29000 to a 2020 annual average of 28400 workers
Over half of the workers in the Financial Activities supersector are located in the Sioux Falls MSA (15400 workers) This supersector had a loss of 300 workers in the Sioux Falls MSA and 200 workers in the Rapid City MSA
Credit card banks saving institutions portfolio fund managing insurance claims adjusting real estate agencies residential property management and home health equipment rental are examples of establishments in this supersector
During 2020 many establishments in this industry made significant changes in how they operate due to COVID-19 These changes included switching from in-person appointments to online meetings temporarily closing lobby areas to the public and the increased utilization of electronic signatures all which impacted the demand for workers
Professional and Business ServicesProfessional and Business Services decreased 500 workers (15) dropping to an average of 32700 A bulk of this decline took place in the Sioux Falls MSA (500 workers or 32)
The Professional and Business Services supersector is broken down into the following sectors
yen Professional Scientific and Technical Services
yen Management of Companies and Enterprises
yen Administrative and Support and Waste Management and Remediation Services
As travel decreased and events were canceled in 2020 due to COVID-19 the demand for services in establishments involved in areas such as travel planning sports ticket offices security guard services and temporary help services decreased
Education and Health ServicesEducation and Health Services had a modest decline with the loss of 100 workers (01) Worker level losses in Educational Services accounted for this decline dropping 400 workers (57) This number includes private educational services as public educational services are included in government worker levels
Health Care and Social Assistance added 300 workers (05) reaching an annual average of 66500 in 2020 Establishments in Health Care and Social Assistance include dentist offices chiropractors childcare centers assisted living facilities and vocational rehabilitation agencies
Page 26
Hospitals had significant gains from 2019 to 2020 adding 1100 workers (43) Increases may be related to establishments increasing worker levels due to increased patient load as well as safety procedures (such as temperature checks and even more extensive cleaning and disinfecting) to combat the spread of COVID-19
Leisure and HospitalityLeisure and Hospitality had the largest decrease of all supersectors in 2020 with a loss of 6700 workers (141) Establishments included in this supersector include hotels restaurants performing arts fitness centers museums and parks
COVID-19 significantly affected Leisure and Hospitality establishments with patronage of such businesses down drastically among both local residents and visitors from outside the area due to health concerns Both leisure and business travel were limited during the worst of the pandemic According to the South Dakota Department of Tourism 126 million visitors traveled to South Dakota in 2020 compared to 145 million visitors 2019
Had it not been for the resiliency and adaptability of South Dakota employers declines in this supersector would have been even worse Establishments made every effort to remain open reassuring patrons to keep their business during the pandemic Businesses increased cleaning efforts and made changes to promote social distancing such as limited seating Many restaurants offered only drive-through service curb-side pick-up or delivery Lodging facilities offered contactless check-in and switched breakfast offerings to only pre-packaged items
Other ServicesOther Services (except Public Administration) declined 200 workers (12) over the year dropping from 16800 workers in 2019 to 16600 in 2020 A majority of the losses were due to the pandemic Many establishments
reduced their workforce to lower the impact with some temporary closing in the beginning of the pandemic Examples of establishments in this sector include beauty salons car washes wedding planning services civic and social organizations general automotive repair shops and pet boarding services
GovernmentGovernment decreased 41 from 2019 to 2020 with the loss of 3300 workers Federal Government added 300 workers (27) State Government lost 1200 workers (65) with the bulk (1100 workers 117) in State Government Educational Services
Local Government declined 2400 workers (48) Tribal city and county governments along with public and tribal school districts are included in Local Government Local Government Educational Services decreased 1100 workers (42) over the year and Local Government excluding Educational Services declined 1300 workers (54)
Worker declines in both State and Local Government Education were due to schools adapting operations to lower the spread of COVID-19 which in turn impacted the demand for workers Changes included moving from in-person classes to an online format canceling sports and social activities and closing on-campus facilities like recreation centers and food service Losses in other Local Government were due to city programs and services put on hold to slow COVID-19rsquos impact
Page 27
As mentioned earlier the nonfarm wage and salaried worker series provides the most current data available on industry
employment levels Although the main focus of this publication is calendar year 2020 the pandemic heightened the value of the nonfarm estimates as the latest indicators of monthly trends in South Dakotarsquos industries
Using not seasonally adjusted data letrsquos start with a look at what transpired month to month during the height of the pandemic in 2020 While the number of nonfarm workers rose by 2300 from January to February 2020 worker levels began declining by March (down 1100)
Even though establishments began altering their processes or closing temporarily in March 2020 as the pandemic first hit South Dakota April brought far more pronounced worker declines Worker levels plummeted from March to April 2020 dropping an unprecedented 36600 workers (85) to hit a low of 395800
May estimates hinted a recovery was beginning with worker levels up 13700 from April Worker levels continued trending upward to October 2020 reaching 433700 Many nonfarm establishments throughout South Dakota had adopted new procedures
Measuring industry recovery from pandemic using most current data
in order to combat the spread while trying to get back on track with their business operations Some increased worker levels as demand for products and services resumed
Worker levels dipped in November (3200 workers) and had a modest increase in December 2020 (100 workers) reaching 430600 workers
In January 2021 worker levels declined 9300 Worker level drops are common this time of year as many seasonal establishments
(Retail Trade Construction and Leisure and Hospitality) reduce their workforce after the winter holidays and as the weather turns cold
As the line graph on the following page illustrates South Dakota nonfarm worker levels have trended upward for the most part in 2021 Thankfully many events canceled in 2020 due to COVID-19 are back on the calendars in 2021 Stores expanded hours restaurants reopened dining rooms and establishments increased capacitymdashall increasing the demand for workers
From January to February 2021 the total nonfarm level increased 2900 Government accounted for much of the growth a typical seasonal pattern as state education returned to normal staffing levels after winter break
In March 2021 worker levels gained 3300 with relatively small increases throughout many of the industries The upward climb continued to April 2021 with the addition of 4400 workers half in Construction Construction worker levels typically start ticking up along with
2021
Page 28
temperatures in the spring as crews begin repairing roads and building construction activity picks up
May brought a continued upswing of nonfarm worker levels (6300) the total reached 438200 Leisure and Hospitality had the largest over-the-month growth (4100) a positive sign as businesses ramped up staffing to prepare for the inflow of visitors over the summer
In June 2021 worker levels shot up another 8000 reaching 446200 workers This gain was again largely in Leisure and Hospitality (3900 workers) but Construction (2000 workers) Retail Trade (1100 workers) and Professional and Business Services (1000 workers) also made considerable contributions to the growth Seasonal gains are common in the summer as establishments hire more part-time workers during the summer
These jobs provide many high school and college students opportunities to gain work experience and earn money during summer break
South Dakota nonfarm worker levels dipped in July to 444200 workers but the drop was largely seasonal and not unexpected Government dropped 5200 workers in July with educational workers dropping off school payrolls for the summer break
Worker levels continued to trend downward in August dipping to 443200 Other Services (except Public Administration) had the largest over-the-month drop with the loss of 900 workers (49 percent) Losses in Other Services (except Public Administration) are due to small worker declines throughout many types of establishments in this sector
Nonfarm worker data is one of indicators analyzed in terms of the labor marketrsquos recovery from the COVID-19 pandemic For the most current monthly information available visit the Pandemic Picture page
Page 29
Quarterly Census of Employment and Wages (QCEW)
The Quarterly Census of Employment and Wages program provides information about workers covered by South Dakota
unemployment insurance law and the Unemployment Compensation for Federal Employees (UCFE) program Covered workers include employees who are paid a wage or salary during the year it excludes the self-employed and unpaid family workers
Wage and salaried workers are covered regardless of type of ownership Employees working at privately owned businesses and
federal state and local government agencies are all included
However not all employees are covered workers South Dakota wage and salaried workers not covered by South Dakota unemployment insurance laws include railroad employees government elected officials election workers work-study students and religious organization employees (Some religious organizations opt to provide unemployment insurance coverage to their employees those organizations are included in this publication) Nonprofit organizations
As implied by ldquocensusrdquo in the title this is the most comprehensive data set on employment and pay
Page 30
may or may not be covered by unemployment insurance depending upon whether they meet specific employment requirements
Smaller businesses may also be exempted from coverage if they do not meet unemployment insurance law minimum payroll and employment criteria Businesses who hire only a few workers on a part-time or seasonal basis such as agricultural businesses make up a large part of the exempted group
The data on workers covered by South Dakota unemployment insurance law is collected through the quarterly employment and wage reports submitted by South Dakota employers to the Division of Reemployment Assistance of the South Dakota Department of Labor and Regulation Each employer is assigned an industry classification and a county code The industry classification is determined by the business activity and type of ownership The county code is determined by worksite location (store branch office etc)
96
The Labor Market Information Center (LMIC) also collects supplemental data from employers in cooperation with the US Bureau of Labor Statistics For example although the quarterly reports submitted by liable employers are based on employer serial number the LMIC gathers additional data by establishment A covered employer could include one or more establishments Those establishments could be conducting business at one or more worksite locations Each establishment is given an industry and county code
In 2020 the number of covered wage and salaried workers equaled 960 of South Dakotarsquos wage and salaried workers Covered workers are counted at their place of work A person who works for more than one covered employer is counted at each job
Number of Covered Workers
The number of employees covered by unemployment insurance in 2020 was 417110 a decrease of 30 from 2019 As the bar graph below illustrates just three supersectors showed worker gains (one increasing just 01) during the year Illustrating the plight of the pandemic more
commonly experienced by South Dakota employers employment in eight supersectors decreased during 2020 as shown in the table and graph at the right
Page 31
South Dakota Average Number of Covered Workers by Ownership and Supersector
Private Ownership 2019 2020Percent Change
2019-2020
Natural Resources and Mining 6985 7137 22
Construction 23609 24411 34
Manufacturing 44972 43131 -41
Trade Transportation and Utilities 85125 83190 -23
Information 5500 5074 -77
Financial Activities 28483 27810 -24
Professional and Business Services 33118 32773 -10
Education and Health Services 68913 68991 01
Leisure and Hospitality Services 47413 41003 -135
Other Services 11324 11078 -22
Total Private Ownership 355442 344598 -31
Public Administration
Federal Government 11291 11569 25
State Government 14933 14371 -38
Local Government 48452 46573 -39
Total Government 74676 72512 -29
Statewide Total 430117 417110 -30
Source Quarterly Census of Employment and Wages Labor Market Information Center South Dakota Department of Labor and Regulation in cooperation with the US Bureau of Labor Statistics
Page 32
industries in 2020 See page 41 for more information
Pandemicrsquos ImpactEmployment trends detected by the Quarterly Census of Employment and Wages program during 2020 were much more erratic than normal because of the impacts of the COVID-19 pandemic
Employment levels started out strong in early 2020 before the pandemic hit South Dakota In fact when comparing South Dakota QCEW employment data for the first quarter of 2020 to the first quarter of 2019 there was actually very slight growth in early 2020
As expected first quarter 2020 data did not reflect pandemic-related economic impacts on South Dakota industry employment March 2020 data began showing the pandemicrsquos impacts on South Dakotamdashbut it was slight at first Employment dropped just 405 from 421268 in February 2020 to 420863 in March The big hit came in April 2020 with employers reporting nearly 34000 fewer workers in April than for March In fact April 2020 levels were the lowest point seen throughout the pandemic at 387234
The rebound began in May 2020 with a strong boost of 15260 workers added back to payrolls June brought just about as strong of bounce-back with employment up 13 394 Although the rate of recovery slowed employment continued to climb in July and August reaching 422802
September brought a minimal and seasonally expected decline of 334 workers (01) Continuing to demonstrate the volatility of the pandemicrsquos impact October brought a gain of 08 followed by a 07 decline in worker levels in November Worker levels grew slightly in December ending the year at 423927mdashhigher than before the pandemic hit
More recent QCEW data available indicates South Dakotarsquos strong recovery from the pandemic has continued See the ldquoQCEW Data Show Pandemic Recovery Continuesrdquo section on page 46 for more information
ConstructionConstruction led the pack among the three supersectors showing growth during 2020 with an increase of 802 workers (34) At the sector level Construction had more establishments than any other in 2020 The number of establishments increased by 54 bringing the total to 4202 establishments in 2020 The Construction employment growth was spread throughout all three of its subsectors listed below
yen Heavy and Civil Engineering Construction
yen Construction of Buildings
yen Specialty Trade Contractors
Learn more about Constructionrsquos performance during 2020 on page 37 where it is featured as one of the yearrsquos most noteworthy industries
Natural Resources and MiningMost of the growth in the Natural Resources and Mining supersector during 2020 was in the Agriculture Forestry Fishing and Hunting sector which added 152 workers (22) Soil preparation and planting firms added workers for help with crop planting cultivation spraying and dusting Workers were also hired some in new establishments for animal production activities such as beef cattle ranching and farming Beef cattle farming can be a very profitable business but raising dairy cattle for herd replacement and breeding and raising beef cattle for eventual consumption are labor-intensive operations
Education and Health ServicesAlthough it was the third and final supersector to show growth during 2020 employment growth in Education and Health Services was nearly neglible at 78 workers (01) Slowing growth in Healthcare and Social Services (336 or 05) offset a decline (258 workers 70) in Educational Services
Because of its significance to total covered employment in South Dakota the Education and Health Services supersector is also featured as one of the statersquos noteworthy
Page 33
Annual Pay
Annual pay reflects total compensation paid to covered workers in the form of wages salaries bonuses commission
and overtime pay during the year Annual pay is calculated by dividing total payroll by the average number of workers The 2020 statewide annual pay for workers was $49165 an 89 increase from 2019
Annual pay figures for 2020 were impacted to some extent by government programs designed to provide payroll assistance to businesses negatively impacted by the COVID-19 pandemic As mentioned above annual pay figures include bonuses In some cases bonuses distributed to upper management positions were substantial enough to impact average pay figures
Annual pay is affected by the number of hours worked and the rate of pay Full-time workers normally have higher annual pay than part-time workers do Many of the industries with the lowest annual pay have a sizable percentage of part-time jobs Industry-specific annual pay is determined by the mix of full-time and part-time workers and high-paying and low-paying jobs
The Leisure and Hospitality supersector had the lowest industry annual pay of $18828 in 2020 these types of businesses typically hire many part-time workers Federal government workers had the highest 2020 annual pay among the supersectors at $70047
Most Establishments
Construction
Most Workers
Health Care amp Social
Assistance
Highest Annual Pay
Management of Companies
Greater industry detail (at the 3-digit NAICS sector level) allows a deeper dive into the types of business activities taking place in the state The table on the following page shows the number of establishments number of workers and annual pay at that level (Each different employer worksite location is counted as a separate establishment)
Page 34
South Dakota Establishments Covered Workers and Pay by Supersector and Sector 2020
Supersector and SectorNumber of
Establishments
Average Number of Workers
Annual Pay
Natural Resources and Mining 1140 7137 $45582
Agriculture Forestry Fishing and Hunting 1071 6226 $42395
Mining 69 911 $67361
Construction 4202 24411 $54005
Construction 4202 24411 $54005
Manufacturing 1107 43131 $53290
Manufacturing 1107 43131 $53290
Trade Transportation and Utilities 8510 83190 $44154
Wholesale Trade 2952 20919 $66278
Retail Trade 3898 49682 $32259
Transportation and Warehousing 1482 10664 $47706
Utilities 178 1926 $90993
Information 666 5074 $58065
Information 666 5074 $58065
Financial Activities 3608 27810 $69344
Finance and Insurance 2392 23894 $73624
Real Estate and Rental and Leasing 1216 3917 $43217
Professional and Business Services 6509 32773 $63709
Professional Scientific and Technical Services 4157 14867 $68229
Management of Companies and Enterprises 232 5144 $112088
Administrative amp Support amp Waste Management amp Remediation Services 2120 12762 $38942
Education and Health Services 3090 68991 $57051
Educational Services 414 3450 $31037
Health Care and Social Assistance 2676 65541 $58421
Leisure and Hospitality Services 3352 41003 $18828
Arts Entertainment and Recreation 756 6168 $20748
Accommodation and Food Services 2596 34835 $18488
Other Services 2470 11078 $38161
Other Services except Public Administration 2470 11078 $38161
Public Administration 2521 72513 $47578
Federal Government 759 11569 $70047
State Government 914 14371 $53128
Local Government 848 46573 $40282
Source Quarterly Census of Employment and Wages Labor Market Information Center South Dakota Department of Labor and Regulation in cooperation with the US Bureau of Labor Statistics
Page 35
Noteworthy Industry Trends
Hospitality establishments dropped by 43 (13) from 2019 to 2020 while employment declined 6410 (135) Much of this supersector is heavily reliant upon tourism and local residents being ldquoout and aboutrdquo which explains its challenges during the pandemic
Accommodation and Food ServicesThe Accommodation and Food Services sector accounts for the lionrsquos share of both establishments (774) and employment (850) in Leisure and Hospitality (2020 data) Employment in the Accommodation and Food Service sector declined from 40494 workers in 2019 to 34835 workers in 2020
The range of activities in Accommodation and Food Services varies from providing lodging facilities to preparing meals snacks and beverages to patrons for immediate consumption Since both types of services are often found in the same establishment they are included in the same sector
Four industry supersectors are being highlighted below as having especially noteworthy trends during 2020 the year
of the COVID-19 pandemic The highlights below identify North American Industry Classification System (NAICS) codes Learn more about NAICS
yen Leisure and Hospitality
yen Construction
yen Trades Transportation and Utilities
yen Education and Health Services
Leisure and Hospitality ServicesThe Leisure and Hospitality supersector is comprised of the Arts Entertainment
and Recreation sector (NAICS 71) and the Accommodation and Food Services sector (NAICS 72) The number of Leisure and
Page 36
The Accommodation (NAICS 721) subsectorrsquos employment level declined by 1713 workers (195) to 7084 during 2020 The average annual wage increased 89 to $22050 Establishments within this subsector provide lodging or short-term accommodations for travelers vacationers and others
The biggest employment losses during 2020 were in hotels and motels Prior to the pandemic hotels and motels had shown relatively stable employment over the past few years either decreasing or increasing slightly during a certain year
Casinos with lodging facilities had also shown consistent employment totals in prior years Their employment level dropped in spring 2020 but has almost reached pre-pandemic
levels Employment levels in more seasonally-impacted accommodations such as bed-and-breakfast inns and other traveler accommodations have seen no significant changes to in the past few years this remained the case in 2020
The RV Parks and Recreational Camps industry group saw only a slight decrease in employment in 2020 This group is also seasonal and has had consistent employment levels over the years
The Food Services and Drinking Places (NAICS 722) subsector declined in employment but saw an increase in wages from 2019 to 2020 The subsector decreased by 3946 workers (124) to 27751 The average annual wage increased 64 to $17579
South Dakota Covered Workers and Pay 2020 Leisure and Hospitality Services
Supersector Sector and SubsectorNumber of
Establishments
Average Number of Workers
Annual Pay
Leisure and Hospitality Services 3352 41003 $18828
Arts Entertainment and Recreation 756 6168 $20748
Performing Arts and Spectator Sports 170 1016 $23717
Museums Historical Sites Zoos and Parks 54 511 $30536
Amusements Gambling and Recreation 532 4641 $19021
Accommodation and Food Services 2596 34835 $18488
Accommodation 632 7084 $22050
Food Services and Drinking Places 1964 27751 $17579
Source Quarterly Census of Employment and Wages Labor Market Information Center South Dakota Department of Labor and Regulation in cooperation with the US Bureau of Labor Statistics
The three industry groups in this subsector are
yen Special Food Services (food service contractors caterers mobile food services)
yen Drinking Places alcoholic beverages)
yen Restaurants and Other Eating Places
Page 37
yen Construction of Buildings (NAICS 236) ndash perform new building work additions alterations maintenance and repairs
yen Heavy and Civil Engineering Construction (NAICS 237) ndash construct entire engineering projects Also included are contractors whose primary activity is the production of a specific component for such projects-- such as the design and installation of the power structure for a project
yen Specialty Trade Contractors (NAICS 238) ndash perform detailed activities involved in building construction such as pouring concrete site preparation plumbing painting etc
All three Construction subsectors had worker level increases during 2020 The Heavy and
Establishments prepare meals snacks and beverages to customer order for immediate onoff premises consumption Some provide food and drink only while others provide various combinations of seating space waiterwaitress services and incidental amenities such as limited entertainment
All three industry groups contributed to the employment decline Based on longer-term trends employment in the Special Food Services industry group would likely have shown growth had it not been for the pandemic Availability of workers to staff restaurants and bars is especially challenging which was heightened by the pandemic
ConstructionAs noted earlier Construction was one of only three supersectors which showed growth during 2020 There
were 54 establishments added during 2020 and employment increased by 802 (34) over 2019 levels The Construction sector had more establishments than any other sector in 2020 at 4202
The Construction industry is divided into three subsectors
South Dakota Covered Workers and Pay 2020 Construction
Supersector Sector and SubsectorNumber of
Establishments
Average Number of Workers
Annual Pay
Construction 4202 24411 $54005
Construction 4202 24411 $54005
Construction of Buildings 1349 5889 $50969
Heavy and Civil Engineering Construction 440 4535 $67976
Specialty Trade Contractors 2413 13986 $50757
Source Quarterly Census of Employment and Wages Labor Market Information Center South Dakota Department of Labor and Regulation in cooperation with the US Bureau of Labor Statistics
Page 38
Civil Engineering subsector gained the most establishments at 32 followed by Specialty Trade which added 18
The average annual pay for this industry sector increased by $3008 (59) during 2020 bringing the average annual pay to $54005 in 2020 Annual pay increased in all three subsectors
The Heavy and Civil Engineering Construction subsector gained 555 workers (139) in 2020 Utility System Construction was accountable for about two-thirds of this growth Many water sewer power and communication systems needed replacing due to age and damage
Infrastructure remains at the forefront of many construction projects and the trend is expected to continue Many of these projects require assistance from Specialty Trade Contractors as they have the necessary skill sets for parts of the system development such as concrete work and electrical wiring
The Construction of Buildings subsector increased by 97 workers (17) in 2020 to bring the subsectorrsaquorsquos total to 5889 workers
Specialty Trade Contractors added 150 workers (11) While sheltering at home during the pandemic many homeowners showed heightened interest in having house and yard improvement projects completed Projects ranged from home offices and kitchen remodeling to decks and fences Building and specialty trade contractors alike commonly report having projects lined up for months out These sectors also continue to benefit from a booming housing market
Trade Transportation and UtilitiesBusinesses within this supersector sell or arrange the sale of goods and supplies
and retail merchandise to the public provide transportation of passengers or cargo or generate andor distribute electricity gas or water
Although employment in this supersector declined slightly during 2020 (1934 workers 23) it remained the largest-employing of South Dakotarsquos supersectors at 83191
This supersector includes the following
yen Wholesale Trade (NAICS 42)
yen Retail Trade (NAICS 44-45)
yen Transportation and Warehousing (NAICS 48-49)
yen Utilities (NAICS 22)
Wholesale TradeWholesale Trade had a loss of 196 workers (09) from 2019 to 2020 dropping to 20919 in 2020 This modest loss can be related to establishments adjusting their staffing levels throughout 2020 as a result of pandemic-related challenges including supply chain issues rapidly shifting demand transportation restrictions in other states and economic uncertainty
The number of establishments jumped up 64 from the previous year to 2952 in 2020 The average annual pay increased by $4127 (66) climbing to $66278
The Wholesale Trade sector comprises establishments engaged in wholesaling merchandise and rendering services incidental to the sale of merchandise The wholesaling process in an intermediate step in the distribution of merchandise as they sell merchandise to other businesses and normally operate from a warehouse or office
Merchant Wholesale Durable Goods added 87 establishments in 2020 climbing to 1450 establishments Worker levels fell 37 (04)
Businesses in this subsector sell capital or durable goods to other businesses Durable goods are new or used items that have a normal life expectancy of three years or more producing utility over time rather than consumption after a few uses They include motor vehicles furniture sporting goods jewelry toys construction materials and recyclable materials
Page 39
South Dakota Covered Workers and Pay 2020 Trade Transportation and Utilities
Supersector Sector and SubsectorNumber of
Establishments
Average Number of Workers
Annual Pay
Trade Transportation and Utilities 8510 83190 $44154
Wholesale Trade 2952 20919 $66278
Merchant Wholesalers Durable Goods 1450 10045 $71467
Merchant Wholesalers Nondurable Goods 1295 10378 $59889
Electronic Markets and Agents and Brokers 207 495 $95053
Retail Trade 3898 49682 $32259
Motor Vehicle and Parts Dealers 545 7871 $52872
Furniture and Home Furnishings Stores 182 1412 $39780
Electronics and Appliance Stores 151 1273 $45640
Building Material and Garden Supply Stores 391 5638 $36155
Food and Beverage Stores 342 9178 $22494
Health and Personal Care Stores 262 1898 $37021
Gasoline Stations 626 6542 $23391
Clothing and Clothing Accessories Stores 361 2188 $20645
Sporting Goods Hobby Book and Music Stores 184 1978 $24758
General Merchandise Stores 189 8259 $26886
Miscellaneous Store Retailers 446 2353 $28914
Nonstore Retailers 219 1093 $49829
Transportation and Warehousing 1482 10664 $47706
Air Transportation 27 239 $43123
Truck Transportation 1070 5239 $53123
Transit and Ground Passenger Transportation 89 1118 $23301
Pipeline Transportation 13 124 $110949
Scenic and Sightseeing Transportation 14 100 $29778
Support Activities for Transportation 141 959 $51500
Postal Service 11 27 $20192
Couriers and Messengers 75 2003 $44555
Warehousing and Storage 42 856 $44570
Utilities 178 1926 $90993
Utilities 178 1926 $90993
Source Quarterly Census of Employment and Wages Labor Market Information Center South Dakota Department of Labor and Regulation in cooperation with the US Bureau of Labor Statistics
Page 40
The Merchant Wholesale Nondurable Goods subsector had the largest drop in the number of workers within this sector with the loss of 135 workers (13) Establishments in this industry sell nondurable goods to other businesses Nondurable goods or consumables are the opposite of durable goods They may be defined as goods that are nearly consumed in one use or those that have a lifespan of less than three years They include paper and paper products chemicals drugs petroleum food apparel and newspapers Most of the losses in this subsector occurred in Grocery and Related Product Merchant Wholesalers and Farm Product Raw Material Merchant Wholesalers
Transportation and WarehousingThe Transportation and Warehousing sector includes industries that provide passenger and cargo transportation warehousing and storage for goods scenic and sightseeing transportation and support activities related to modes of transportation It is common for a business in this sector to operate a network of facilities workers and equipment over a widespread area
The Transportation and Warehousing sector splits into several subsectors
yen Each mode of transportation (Air Rail Water Truck Transit and Ground Passenger and Pipeline (NAICS 481-486)
yen Warehousing and Storage (NAICS 493)
yen Support Activities for Transportation (NAICS 488)
yen Scenic and Sightseeing Transportation (NAICS 487)
yen Postal Services (NAICS 491)
yen Courier Services (NAICS 492)
Despite a gain of 16 establishments employment in Transportation and Warehousing dropped 163 workers (15) from
2019 to 2020 Worker losses in the Transit and Ground Passenger Transportation (NAICS 485) subsector accounted for a majority of the decline in this sector
While most of the subsectors in Transportation and Warehousing had worker level declines from 2019 to 2020 two subsectors had gains The Couriers and Messengers added 138 workers reaching 2003 workers in 2020 Couriers and Messengers provide intercity andor local delivery of parcels and documents without operating under a universal service obligation The restriction to small parcels partly distinguishes these establishments from those in the transportation industries Worker level gains can be tied to increases in Couriers and Express Delivery Services As more consumers increased their online shopping deliveries to consumers also grew
Pipeline Transportation also had increases in establishments worker levels and the average annual pay from 2019 to 2020 Establishments in this subsector use transmission pipelines to transport products such as crude oil natural gas refined petroleum products and slurry or a semi-liquid mixture of fine particles
Worker levels in Truck Transportation fell 75 (14) from 2019 to 2020 This subsector accounts for almost half of the workforce in this sector with 5239 workers in 2020 Establishments included in this subsector haul a variety of goods including used furniture farm products (both locally and long-distance) and trucking containers (local and long-distance)
Page 41
Transit and Ground Passenger Transportation had the largest 2020 decline in worker levels in this sector dropping 173 workers (134) This subsector provides passenger transportation in vehicles such as charter buses limousines school buses and taxi cabs Declines were related to the pandemic as many people postponed or canceled travel plans
UtilitiesThe Utilities sector added seven establishments but decreased 24 workers (12) over the year for a level of 1926 The Utilities sector experiences one of the highest annual pay statistics at $90993 in 2020 increasing $3793 (43) from 2019 This sector ranked second overall in annual wage in 2020 following only the Management of Companies and Enterprises (NAICS 55)
Establishments in this subsector provide electric power natural gas steam supply water supply and sewage removal through a permanent infrastructure of lines mains and pipes Within this sector the specific activities associated with the utilities services provided vary by utility Electric power encompasses transmission and distribution natural gas includes distribution steam supply involves distribution water supply offers treatment and distribution while sewage removal includes collection and disposal of waste Waste management services are excluded from this sector since they do not use sewer systems or
sewage treatment facilities however they do collect treat and dispose waste materials
Although the overall total employment and establishment numbers in Utilities are ranked toward the bottom of all sectors the importance of the workers and their unique knowledge and skill sets remain critical (helping explain their high annual pay) In essence the rest of the economy is reliant upon the smooth and constant operation of this sector since it provides vital infrastructures needed for a full range of other industry operations
Education and Health ServicesThe Education and Health Services supersector is comprised of the Education
Services sector (NAICS 61) and the Health Services and Social Assistance sector (NAICS 62) Businesses within this supersector provide instruction and training or provide health care and social assistance to individuals
This subsector is highlighted here because it was South Dakotarsquos second largest employing industry and contributed the most to total wages paid out in the state in 2020
Educational ServicesThe private Educational Services sector saw a loss in employment during 2020 decreasing by 258 workers (70) to a level of 3450 The average annual wage increased $2268 (79)
from 2019 to 2020 to a new average of $31037
The Educational Services sector is made up of schools colleges universities and training centers providing instruction and training in a wide variety of subjects These establishments may also offer food and accommodation services to their students
Establishments in this sector are privately owned and operated for profit or not for profit
Page 42
Publicly owned establishments usually owned and operated by state and local governments are not included in this analysis Statistics for those types of establishments are analyzed under the Public Administration supersector Roughly 10 of the employment in Education falls in privately owned establishments
Educational Services is comprised of only one subsector Within the subsector are the following industry groups
yen Elementary and Secondary Schools (NAICS 6111)
yen Junior Colleges (NAICS 6112)
yen Colleges and Universities (NAICS 6113)
yen Business Computer and Management Training (NAICS 6114)
yen Technical and Trade Schools (NAICS 6115)
yen Other Schools and Instruction (NAICS 6116)
yen Educational Support Services (NAICS 6117)
Colleges and Universities lost the most employment with Technical and Trade Schools and Other Schools and Instruction also losing employment The other four industry groups had slight employment gains in 2020 Most colleges sent students home at the beginning of the pandemic and instruction was done online Remaining staff like food service and facility workers were not needed to the extent they had been and their hours were greatly reduced or they were temporarily laid off
The Educational Services sector is widely considered counter-cyclical Typically when the economy is doing well and unemployment is at a very low rate more working adults decide to go to work More career and job prospects available for working adults in turn leads to lower enrollment decreased profit and a lower need for teachersinstructors at schools
Health Care and Social AssistanceThe Health Care and Social Assistance sector saw both employment and wages rise in 2020 Compared to other sectors this sector has the highest employment and largest amount of total wages paid out in South Dakota The number of workers in 2020 increased by 336 (05) to 65541 Average annual wages increased $4664 (87) to $58421
This sector includes both health care and social assistance because sometimes it is difficult to distinguish between the boundaries of the two The Health Care and Social Assistance sector is made up of four subsectors
yen Ambulatory Health Care Services (NAICS 621)
yen Hospitals (NAICS 622)
yen Nursing and Residential Care Facilities (NAICS 623)
yen Social Assistance (NAICS 624)
Establishments in Ambulatory Health Care Services provide services directly or indirectly to ambulatory patients and do not usually provide inpatient services The subsector lost 88 workers (05) in 2020 for an employment level of 17902 The average annual wage increased $4252 (55) to $81891
Health practitioners in this subsector provide outpatient services with facilities and equipment not usually the most significant part of the service One example is home health care where skilled nursing services
Page 43
South Dakota Covered Workers and Pay 2020 Education and Health Services
Supersector Sector and SubsectorNumber of
Establishments
Average Number of Workers
Annual Pay
Education and Health Services 3090 68991 $57051
Educational Services 414 3450 $31037
Educational Services 414 3450 $31037
Health Care and Social Assistance 2676 65541 $58421
Ambulatory Health Care Services 1591 17902 $81891
Hospitals 63 26809 $64978
Nursing and Residential Care Facilities 344 12829 $31674
Social Assistance 678 8001 $26822
Source Quarterly Census of Employment and Wages Labor Market Information Center South Dakota Department of Labor and Regulation in cooperation with the US Bureau of Labor Statistics
such as physical therapy medication help counseling dietary guidance speech therapy and intravenous therapy are provided in the patientrsquos residence
Establishments in the Hospitals subsector provide medical diagnostic and treatment services that include physician nursing and other health services to inpatients and the specialized accommodation services required by inpatients Hospitals may also provide outpatient services as a secondary activity Some of the largest establishments in South Dakota belong to the Hospitals subsector The number of workers in 2020 increased by 41 to 26809 This subsectorrsquos average annual wage increased $5842 (99) to $64978
The Nursing and Residential Care Facilities subsector saw employment decline 28 to 12829 workers The average annual wage increased 92 to $31674 per worker This subsectorrsquos establishments provide residential care combined with either nursing supervisory or other types of care as required by the residents Examples are nursing homes and assisted and unassisted
continuing care retirement community facilities
Establishments in the Social Assistance subsector provide a wide variety of social assistance services directly to their clients Vocational rehabilitation services belong to this subsector Business activities include providing job counseling job training and employment for persons with disabilities Some of the 266 loss (32) of workers in this subsector during 2020 can be attributed to child day care services as many daycare services were limited due to COVID-19
Individual and family services and services for the elderly and disabled also had some worker loss
Page 44
Establishment Size
Establishment size data provides a comparison of the number of small and large businesses in South Dakota The average number of workers at the worksite location determines establishment size A worksite is generally defined as a single physical location at which predominantly one type
of economic activity is conducted
The graph at the left displays the number of South Dakota establishments by establishment size showing the predominance of small businesses in South Dakota During 2020 the 0-9 workers size class had the largest number of establishments accounting for 794 percent of all establishments
The distribution of employees by establishment size shows a different picture than the distribution of establishments Smaller businesses have a much smaller slice of the pie
The pie graph at the right indicates smaller businesses (with fewer than 10 workers) employed only 202 percent of the covered workers in South Dakota in 2020 The number of workers is evenly dispersed among the establishment size groups
The table on the next page provides detailed data on establishment size by industry supersector
Page 45
Number of Establishments Workers and Pay by Establishment Size and Supersector 2020
Supersector 0-9 10-19 20-49 50-99 100-249 250-499 500+Natural Resources and MiningEstablishments 981 94 48 14 3 0 0Workers 3138 1306 1359 857 477 0 0Annual Pay $40488 $44790 $47487 $53402 $61785 $0 $0ConstructionEstablishments 3612 337 192 42 19 0 0Workers 8786 4550 5561 2867 2647 0 0Annual Pay $42203 $52327 $60256 $67712 $68085 0 0ManufacturingEstablishments 617 160 158 84 56 21 11Workers 1999 2222 5009 5888 9691 6921 11399Annual Pay $39527 $46132 $51248 $52807 $53053 $56115 $56741Trade Transportation and UtilitiesEstablishments 6408 1222 630 150 75 25 0Workers 18403 16472 19051 9823 11040 8402 0Annual Pay $46604 $41916 $47857 $48026 $44345 $29994 $0InformationEstablishments 550 59 43 8 4 Workers 1023 810 1337 503 486 Annual Pay $64665 $45988 $52223 $56992 $63373 Financial ActivitiesEstablishments 3153 251 133 32 25 9 5Workers 7469 3275 3872 2122 3972 3225 3876Annual Pay $59592 $68441 $81295 $84651 $79653 $59164 $66470Professional and Business ServicesEstablishments 5823 375 234 40 30 4 3Workers 9982 5016 6955 2608 4628 1317 2268Annual Pay $64330 $53922 $57173 $54945 $67710 $46555 $114503Education and Health ServicesEstablishments 2122 434 293 136 76 19 10Workers 5805 5888 8912 8999 11182 6011 22192Annual Pay $42946 $41410 $44236 $44801 $48990 $57466 $78960Leisure and Hospitality ServicesEstablishments 2027 691 522 87 24 0 0Workers 7219 9658 15165 5644 3011 0 0Annual Pay $16870 $17514 $18899 $19960 $25245 $0 $0Other ServicesEstablishments 2226 177 52 8 7 0 0Workers 5672 2258 1533 574 1039 0 0Annual Pay $36060 $38798 $39556 $38408 $46118 $0 $0Total Private OwnershipEstablishments 27519 3800 2305 601 319 80 30 Workers 69497 51455 68754 39887 48173 26487 40345 Annual Pay $45520 $41239 $44968 $47936 $52845 $47706 $73329Source Quarterly Census of Employment and Wages Labor Market Information Center South Dakota Department of Labor and Regulation in cooperation with the US Bureau of Labor Statistics
Page 46
One of the greatest strengths of the QCEW program is the ldquocensusrdquo concept it is considered the most accurate and complete source of wage and salaried employment data One of the downsides of that
powerful data set is the inherent time lag involved with data availability
Because of the various processes and procedures to ensure QCEW data is accurate and appropriately reflects the recent labor market it generally takes a minimum of five months after the close of a quarterly reporting cycle until the new QCEW data can be published For example first quarter 2021 (January February and March) data became available at a summary level in July 2021 more detailed data by industry became available in mid-August 2021
The most current data available (for second quarter 2021) indicate South Dakotarsquos strong recovery from the pandemic is continuing in 2021 Employment has been rebounding steadily increasing to a preliminary employment high of 442089 in June 2021 which is 1050 of the level recorded in March 2020
COVID-19rsquos impact on the total number of establishments reporting employment and wages was not nearly as severe overall as on employment levels In fact the reported number of establishments reached a historical high of 36241 in the second quarter of 2021
2021 QCEW Data Show Pandemic Recovery Continues
QCEW data is another of the indicators analyzed in terms of the labor marketrsquos recovery from the COVID-19 pandemic For the most current monthly information available visit the Pandemic Picture page
Page 47
Personal Income
The Bureau of Economic Analysis (BEA) releases personal income data The personal income of an area is the income
received by or on behalf of all the individuals who live in a specific geographic area
Personal income includes income from all sources including not only salaries wages and bonuses received from employment or self-employment but income from sources such as investments and government social benefits (including unemployment benefits Medicare Medicaid Social Security and pandemic-related payments)
Dividing the total personal income of an area by the residents of that given area produces a widely used economic indicator called per capita personal income South Dakotarsquos per capita personal income has trended upward since 2000 except for a small setback in 2009 following the recession Between 2019 and 2020 South Dakotarsquos per capita personal income increased $3461 (64)
During that same time frame the United States and Plains Region grew at slightly
slower rates of 58 and 53 respectively South Dakota ranked 22nd out of the 50 states and the District of Columbia with a per capita personal income of $57273 in 2020
Looking further back South Dakotarsquos personal income grew steadily for several years prior to the recession In fact South Dakotarsquos growth in personal income for the 2000-2009 period surpassed the rate for the Plains Region (Iowa Kansas Missouri Nebraska North Dakota and South Dakota) and the nation South Dakotarsquos personal income grew by 468 from 2000 to 2009 compared to a rate of 324 for the Plains Region and 281 for the nation
Since the recession and during the economic recovery phase South Dakotarsquos personal income has grown comparably to the Plains Region and the nation From 2010 to 2020 the nationrsquos personal income increased 473 followed by the Plains Region at 421 and South Dakota at 391
$57273
Page 48
Page 49
Poverty
Poverty status is determined by comparing annual income to a set of dollar values called thresholds that vary by family
size number of children and the age of the householder If a familyrsquos before-tax money income is less than the dollar value of their threshold then that family and every individual in it is considered to be in poverty For people not living in families poverty status is determined the comparing the individualrsquos income to his or her threshold
The poverty thresholds are updated annually
to allow for changes in the
cost of living using the
Consumer Price Index (CPI-U) The
thresholds do not vary geographically
American Community Survey South Dakota and US
Comparative Poverty EstimatesPercentage of Families and People Whose Income in the Past 12 Months Is Below the Poverty Level
All Families 2013 2014 2015 2016 2017 2018 2019
United States 116 113 106 100 95 93 86
South Dakota 92 94 83 82 84 80 73
All People 2013 2014 2015 2016 2017 2018 2019
United States 158 155 147 140 134 131 123
South Dakota 142 142 137 133 130 131 119
Source US Census Bureau 2019 American Community Survey
The number of people living below the poverty level in South Dakota for the population in which poverty status was measured is approximately 101900 or 119 This is according to the 2019 American Community Survey (ACS) The races with the highest percentage of their population living below the poverty level is American Indian and Alaska Natives at 468 and Black or African Americans at 199
The percent of families in South Dakota with incomes below the poverty level decreased slightly by 07 from 2018 to 2019
The percentage of South Dakota families in poverty is consistently below the number of families living in poverty at the national level Nationally the percent of all families in poverty in 2019 decreased 07 to 86 which is 13 percentage points higher than South Dakota at 73
The percent of lsquoall peoplersquo in the US and South Dakota with incomes below the poverty threshold was 123 and 119 respectively in 2019
73 of South Dakota Families live in
Poverty
119 of South
Dakotans live in poverty
Females in South Dakota are slightly more likely to be living below the poverty level with 131 versus 108 of the male population
Children under the age of five are the most likely age demographic to be living below the poverty level The table on the following page shows poverty status by age demographic
Page 50
Population for Whom Poverty Status is Determined
PopulationPopulation Below
Poverty Level
Percent of Population Below
Poverty Level
Total 854648 101946 119
Under 5 years 57292 9887 173
5 to 17 years 152486 21538 141
18 to 64 years 497445 59134 119
65 years and over 147425 11387 77
Source US Census Bureau 2019 American Community Survey
Because of the close interrelationship between population demographics and workforce data Labor Market Information Center staff are well versed in demographic information available from the US Census Bureau They are also proficient using the Census Bureaursquos website and other online tools Contact LMIC at 6056262314 when you need demographic data
Page 51
Population Projections
Population projections for the 2010-2035 time period released by the South Dakota State Data Center show South Dakotarsquos total population will reach 922748 by the year 2025 This reflects an increase in the core potential workforce (age 16-64) of approximately 16600 (32)
Although most of the counties in South Dakota are expected to show population declines the Rapid City (Custer Meade and Pennington counties) and Sioux Falls (Lincoln McCook Minnehaha and Turner counties) Metropolitan Statistical Areas (MSAs) will be the fastest growing areas in the state
South Dakota Population ProjectionsMedium Series
Age 2010 2015 2020 2025 2030 2035
0-4 59621 57567 60089 60941 61413 62656
5-9 55531 60094 58068 60533 61386 61846
10-14 53960 56098 60651 58650 61067 61925
15-19 57628 54556 56625 61169 59196 61570
16-19 46102 43645 45300 48935 47357 49256
20-24 57596 58030 54948 56947 61468 59533
25-29 55570 57993 58423 55332 57268 61771
30-34 49859 55883 58336 58765 55672 57548
35-39 45766 50101 56111 58593 59024 55935
40-44 47346 45997 50260 56250 58759 59194
45-49 57519 47587 46109 50294 56253 58785
50-54 59399 57326 47491 45904 49988 55879
55-59 54231 58790 56783 47102 45429 49393
60-64 43573 52854 57344 55432 46037 44314
65-69 31944 41677 50577 54920 53134 44182
70-74 25683 29666 38624 46897 50971 49357
75-79 21724 22873 26368 34250 41616 45283
80-84 18004 18084 18985 21837 28282 34401
85+ 19226 27449 33655 38932 44922 54002
Total 814180 852624 889447 922748 951885 977574
Source South Dakota State Data Center South Dakota State University
Population growth in the statersquos metro areas is projected to continue outpacing the state as a whole
Page 52
Page 53
Employment Projections
Industry employment projections for 2018 to 2028 were completed and published by the Labor Market Information Center (LMIC) in July 2020 Long-term projections (for a 10-year period) are completed every other year and published on even-numbered years
State and national economic trends along with a historical time-series employment data set were incorporated in various statistical models to project employment levels The projections are not intended to be precise point estimates of employment for each industry or occupation It is unlikely the projections data will precisely predict actual employment developments due to unforeseen state national and international trends and policies However the basic trends should prove accurate and aid in successful decision making Users should view the projected worker estimates as indicators of relative magnitude and direction rather than estimates of absolute values and use the data as a starting point when studying expected occupational employment levels
A special note about the COVID-19 pandemic The projections methodology includes a general assumption no major catastrophic event or natural disaster will significantly affect economic activities during the projections period The COVID-19 pandemic is a perfect example It rocked the United States and the world in 2020 But even though projections would not and could not account for the ramification of this pandemic it is important to remember the pandemic had not yet struck by 2018 The long-term
2018-2028 employment projections round has a base year of 2018 in other words 2018 employment estimates were used when modeling employment to 2028
Only time will tell for sure whether or not future long-term projections series will be significantly impacted by the 2020 pandemic However based on South Dakotarsquos relatively rapid and strong recovery indicated by the various employment measures included elsewhere in this report it appears hopeful the pandemicrsquos long-term impact on South Dakotarsquos industry landscape will be minor
A look at which types of industries are growing and which are not over the long-term provides great insights on the economy Based on the 2018-2028 projections the outlook for South Dakota can be categorized by healthy job growth in the next 10 years Some factors playing a role in certain industriesrsquo growth or decline are an aging and growing population technological improvements tourism and an ever-increasing demand driven by consumers for information and goods via computer or mobile device
Industry Projections
Page 54
Industry employment projections for 2018 to 2028 were completed and published by the Labor Market Information Center (LMIC) in
July 2020 Long-term projections (for a 10-year period) are completed every other year and published on even-numbered years
State and national economic trends along with a historical time-series employment data set were incorporated in various statistical models to project employment levels The projections are not intended to be precise point estimates of employment
South Dakota Wage and Salaried Workers by Employment Category 2018-2028
Industry Title2018
Workers2028
WorkersActual
ChangePercent Growth
Total of All Industries 491588 526251 34663 71
Non-agricultural Self-employed and Unpaid Family Workers 23441 24711 1270 54
Agriculture Forestry Fishing and Hunting (Farm Employment) 31955 33077 1122 35
Nonfarm Total Wage and Salaried Workers (excludes Self-employed and Unpaid Family Workers) 436192 468463 32271 74
Notes Data is preliminary and subject to revisionSource Labor Market Information Center South Dakota Department of Labor and Regulation
for each industry or occupation It is unlikely the projections data will precisely predict actual employment developments due to unforeseen state national and international trends and policies However the basic trends should prove accurate and aid in successful decision making Users should view the projected worker estimates as indicators of relative magnitude and direction rather than estimates of absolute values and use the data as a starting point when studying expected occupational employment levels
Distribution of South Dakota Nonfarm Wage and Salaried Workforce by Employment Category
Source Labor Market Information Center South Dakota Department of Labor and Regulation
Page 55
Categories of EmploymentNonfarm Wage and Salaried WorkersThe Nonfarm Wage and Salaried Workers employment category consists of only those wage and salaried workers who are covered under the South Dakota Reemployment Assistance (unemployment insurance) program and those who work for non-profit organizations such as private colleges and religious organizations Overall nonfarm wage and salaried workers are the major element of South Dakotarsquos labor force making up 887 This group is also projected to have the highest growth with a 74 rise projected by 2028
Farm EmploymentAnother important element of South Dakotarsquos labor force is Agriculture Forestry Fishing and Hunting (sometimes referred to as farm employment) This category is expected to grow slightly in South Dakota from 31955 to 33077 by 2028 (35) The slow growth can be
attributed to the sluggish employment growth in the crop production industry mainly due to increased productivity South Dakota farms have been trending toward larger operations for years with consolidation of smaller farms and greater production expected to continue
Non-agricultural Self-employed and Unpaid Family WorkersThe final component of South Dakotarsquos labor force is the Non-agricultural Self-employed and Unpaid Family Workers category According to BLS and based on data from the Current Population Survey and the American Time Use Survey self-employed persons are individuals who work for profit or fees in their own business profession trade or farm The smallest portion (48) of South Dakotarsquos labor force is expected to have a growth rate of 54 (05 annually) in the coming decade On a national level this category is expected to have annual growth of 06
Among industries at the three-digit North American Industry Classification (NAICS) NAICS level those projected to grow the fastest to 2028 are shown in the table at the top of the following page
Museums Historical Sites and Similar Institution
The number of workers employed in South Dakotarsquos Museums Historical Sites and Similar Institutions subsector is projected to increase by 131 workers (or 206) Industries in this subsector engage in the preservation and exhibition of objects sites and natural wonders of historical cultural andor educational value Some examples of South Dakota entities in this industry are the Crazy Horse Memorial Childrenrsquos Museum of South Dakota Reptile Gardens and other zoos and museums around the state The demand in this subsector is driven by tourism and visitor spending
Visitor spending increased statewide by $27272 million (74) from 2014 to 2018 in South Dakota according to the South Dakota
Department of Tourism In particular the Black Hills and Badlands Region made up almost 40 of total statewide visitor spending increasing $10196 million or 7 since 2014 Sightseeing in the Black Hills and Badlands and the Sturgis Bike Rally and similar events generate visitor spending positively impacting this industry and driving the need for more workers on a seasonal basis
Management of Companies and Enterprises
The Management of Companies and Enterprises subsector is projected to add 815 workers in South Dakota (155 increase) over the projections cycle This subsector is comprised of establishments that administer oversee and manage the strategic or organizational planning and decision-making
Top Ten Fastest Growing Industries to 2028Top
10Industries
Page 56
South Dakota Industry Employment Projections 2018-2028 Top Ten in Employment Growth Rate
NAICS Code Industry Title
2018 Workers
2028 Workers
Actual Change
Percent Growth
712 Museums Historical Sites and Similar Institution 635 766 131 206551 Management of Companies and Enterprises 5265 6080 815 155492 Couriers and Messengers 1684 1944 260 154493 Warehousing and Storage 831 955 124 149562 Waste Management and Remediation Service 929 1062 133 143336 Transportation Equipment Manufacturing 3594 4099 505 141488 Support Activities for Transportation 988 1122 134 136541 Professional Scientific and Technical Services 14053 15894 1841 131621 Ambulatory Health Care Services 17468 19711 2243 128311 Food Manufacturing 10280 11593 1313 128
Notes Data is preliminary and subject to revisionData for industries with 2018 employment less than 200 not included Data presented for industries will not sum to totals due to non-publishable data for additional industries being included in totalsNAICS Codes and Industry Titles are based largely on the North American Industry Classification System (NAICS) Learn more about NAICS codesSource Labor Market Information Center South Dakota Department of Labor and Regulation
role of a company or enterprise South Dakota experienced a 232 increase in the number of companies in this subsector from 2008 to 2018 The favorable business and tax environment and central geographic location has played a role in attracting businesses to headquarter their corporate offices and establishments in South Dakota According to the South Dakota Governorrsquos Office of Economic Development South Dakotarsquos private business sector has seen 1366 growth in Gross Domestic Product since 2000 the sixth highest growth in the nation
Couriers and MessengersThe number of workers in South Dakotarsquos Couriers and Messengers subsector is projected to increase by 260 workers (or 154) over the next 10 years This subsector is comprised of entities that provide intercity local andor international delivery of parcels and documents (including express delivery services) without operating under a universal service obligation Since 2008 the number of workers has dramatically risen from 1287 to 1684 in 2018 The increasing demand from consumers shopping online has a direct
relationship with the increase in demand for workers to deliver those goods Retail is trending more toward online services rather than the brick and mortar stores of the past Shoppers tend to prefer the convenience of shopping online via mobile devices or computers rather than having to make a trip to a store to obtain goods
Warehousing and StorageEstablishments in this industry group are engaged in operating warehousing and storage facilities for general merchandise refrigerated goods and other warehouse products Warehousing and storage establishments may also provide a range of services often referred to as logistics related to the distribution of goods The number of workers employed in the Warehousing and Storage subsector is projected to rise by 124 workers (or 149) over the next 10 years in South Dakota As companies try to get their products to their final destinations in the most cost effective convenient and organized way the demand grows for workers to help accomplish this goal This subsector is not driven by the goods they are selling
Page 57
or retailing but rather by sales from other companies for which this subsector stores and arranges the distribution of those goods
Waste Management and Remediation Service
The Waste Management and Remediation Services subsector in South Dakota is expected to increase by 133 workers (or 143) by 2028 This subsector is engaged in the collection treatment and disposal of waste materials Waste collection and remediation are expected to be driving forces The US Census Bureau estimates South Dakotarsquos population rose from 816166 to 878698 from 2010 to 2018 an increase of 62532 (77) people An increasing population generates more waste and an increased need for workers to pick up and properly dispose of that waste
Transportation Equipment Manufacturing
The Transportation Equipment Manufacturing subsector is projected to add 505 workers in South Dakota (a 141 increase) over the next decade This subsector is comprised of businesses that produce equipment for transporting people and goods An entire subsector is devoted to this activity because of the significance of its economic size Driving the growth within this subsector are three four-digit NAICS industries expected to have double digit employment growth in the coming decade
yen Motor Vehicle Body and Trailer Manufacturing (NAICS 3362)
yen Motor Vehicle Manufacturing (NAICS 3361)
yen Motor Vehicle Parts Manufacturing (NAICS 3363)
The growth can be attributed to the needs of consumers purchasing the products this subsector manufactures as well as a growth in disposable income According to the US Bureau of Economic Analysis (BEA) South Dakotarsquos per capita disposable personal income increased from $37513 in 2008 to $47947 in 2018
Support Activities for Transportation
The Support Activities for Transportation subsector is projected to increase by 134 workers (or 136) over the next 10 years in South Dakota The Support Activities for Transportation industry group is comprised of entities that provide services which support transportation Services such as motor vehicle towing or railroad switching are examples of the support provided There is a direct relationship to the growth of manufacturing of transportation equipment sale and the services providing support for the end users of that equipment The continued need for workers to support the transportation subsector can be traced back to an increase in consumer demand for transportation equipment From 2008 to 2018 the number of companies in this subsector increased 259 and the number of workers employed in these companies increased 193 to keep up with the demand in South Dakota
Professional Scientific and Technical Services
The Professional Scientific and Technical Services subsector is projected to add 1841 workers (131 increase) over the next decade in the state This industry is one of the largest and most diverse industries in South Dakota and workers are selling knowledge and expertise rather than a good This subsector is comprised of establishments that make available the knowledge and skills of their employees often on an assignment basis where an individual or team is responsible for the delivery of services to the client
The individual industries of this subsector are defined by the particular expertise and training of the services provider At the four-digit NAICS level there are four industries projected to have substantial growth
yen Computer System Design and Related Services (NAICS 5415)
yen Management Scientific and Technical Consulting Services (NAICS 5416)
Page 58
yen Scientific Research and Development Services (NAICS 5417)
yen Architectural Engineering and Related Services (NAICS 5413)
The increasing demand in this subsector can be attributed to efficiencies gained by advancements in science and technology An establishment that manufactures a good could contact an expert in this subsector to automate a process or get technical advice to gain a competitive edge for example As long as businesses continue to strive for reduced costs through technology and greater productivity to produce the best products at the lowest prices the demand for experts and consultants in this industry will remain high
Ambulatory Health Care Services
The number of workers in South Dakotarsquos Ambulatory Health Care Services subsector is projected to increase by 2243 workers (or 128) over the next 10 years Based on employment size this subsector was the sixth largest of South Dakotarsquos three-digit subsectors in 2018 with 17468 workers This subsector is comprised of entities providing health care services directly or indirectly to ambulatory patients and which do not usually provide inpatient services The ongoing healthcare
needs and preferences of an aging population will continue to drive the need for employment in this industry in South Dakota
According to the US Census Bureau South Dakotarsquos population 65 years and older rose 252 from 2010 to 2018 At the four-digit NAICS level itrsquos expected six of the eight categories under Ambulatory Health Care Services will have double digit growth in the coming decade Leading the way is Home Health Care Services due to continually increasing demand for outpatient care rather than inpatient care Treatments such as physical therapy and certain medications can be administered by a healthcare professional at home rather than in a clinical environment According to BLS the aging of the population correlates with an expected rise in chronic conditions like diabetes helping increase the demand for all types of healthcare services and social services geared toward older people
Food ManufacturingThe Food Manufacturing subsector is projected to add 1313 workers in South Dakota (128 increase) over the next decade This subsector consists of entities that transform livestock and agricultural products into products for intermediate or final consumption The industry groups are distinguished by the raw materials (generally of animal or vegetable origin) processed into food products
Declining and Slowest Growth Industries to 2028
Several factors can contribute to the declining or slow growth of an industry not only in South Dakota but also nationally According to BLS the labor force and changing demographics of the population affect employment growth just as they affect Gross Domestic Product (GDP) and other macroeconomic measures
Since the base year (2018) occurs after a long economic expansion growth rates can be expected to be somewhat lower than in the previous projections cycles In addition an aging population leads to a declining labor force participation rate limiting the number of workers available for employment
Nationally the largest employment declines are expected to be in Manufacturing Agriculture and the Federal Government sectors to 2028 In South Dakota the only sector expected to decline overall is the Information sector
Two of the top 10 declining or slowest growing South Dakota subsectors at the three-digit NAICS level are within the Information sector
Bottom
10Industries
Page 59
South Dakota Industry Employment Projections 2018-2028 Declining or Slowest Growing Industries
NAICS Code Industry Title
2018 Workers
2028 Workers
Actual Change
Percent Growth
511 Publishing Industries (except Internet) 1212 1057 -155 -128
443 Electronics and Appliance Stores 1428 1335 -93 -65
323 Printing and Related Support Activities 1320 1237 -83 -63
515 Broadcasting (except Internet) 979 941 -38 -39
453 Miscellaneous Store Retailers 2567 2485 -82 -32
425 Wholesale Electronic Markets and Agents and Brokers 541 529 -12 -22
452 General Merchandise Stores 9323 9218 -105 -11
322 Paper Manufacturing 637 635 -2 -03
454 Nonstore Retailers 1089 1095 6 06
221 Utilities 1978 1990 12 06
Notes Data is preliminary and subject to revisionData for industries with 2018 employment less than 200 not included Data presented for industries will not sum to totals due to non-publishable data for additional industries being included in totalsNAICS Codes and Industry Titles are based largely on the North American Industry Classification System (NAICS) Learn more about NAICS codesSource Labor Market Information Center South Dakota Department of Labor and Regulation
The industry declines in South Dakota are projected to be very minimal at the subsector level Since many South Dakota industries are considered small even a small employment loss in the projected 2028 level can substantially impact a subsector Technological improvements content displayed via internet business classifications changes (NAICS code) and consumer shopping preferences are some of the factors which have played a role in the declines in some industries in South Dakota
Publishing Industries (except Internet)
The Publishing Industries (except Internet) subsector is projected to decrease by 155 workers (or 128) through 2028 in South Dakota This subsector is found in the Information sector mentioned above as South Dakotarsquos only sector expected to show an overall decline This subsector contains establishments engaged in the publishing of newspapers magazines periodicals and books as well directory and mailing lists and software publishing The availability of information
online has had a huge influence on this subsector Consumers favor the convenience of getting information such as news sports and other content in the convenience of their own home using computers or streaming television services or on their smart phones and other mobile devices while on the go wherever they are According to the US Census Bureau an estimated 868 of South Dakota households had a computer from 2014-2018 and an estimated 780 had a broadband internet subscription The pervasiveness of smart phones in todayrsquos society is evident
Electronics and Appliance Stores
The Electronics and Appliance Stores subsector in South Dakota is projected to decline 93 workers (65) by 2028 Industries in the Electronics and Appliance Stores subsector retail new electronics and appliances from point-of sale locations Establishments in this subsector often operate from locations with special provisions for floor displays requiring special electrical capacity to accommodate
Page 60
the proper demonstration of the products The growth of e-commerce and rapidly evolving technology have had a negative impact on this industry In South Dakota the number of companies in this subsector declined 126 over the last 10 years and employment has declined 118
Printing and Related Support Activities
The number of workers employed in the Printing and Related Support Activities subsector is expected to decrease by 83 (or 63) in South Dakota by 2028 The Printing and Related Support Activities industry is comprised of establishments that print products such as newspapers books labels business cards stationery business forms and other materials and perform support activities such as data imaging platemaking services and bookbinding Consumer preferences have changed over the last few decades and with information such as books magazines and newspapers available online the demand has decreased for physically printed information South Dakota worker levels in this subsector showed a double-digit percent decline from 2008 to2018
Broadcasting (except Internet)Worker levels in the Broadcasting (except Internet) subsector are projected to decrease 38 workers (or 39) by 2028 in South Dakota This subsector includes establishments that create content or acquire the right to distribute content and subsequently broadcast the content A decrease of 38 workers is small but it represents a larger impact in percent change due to very little employment within this industry statewide This subsector is contained within the Information Sector which as mentioned above is expected to have an overall decline in the next decade in South Dakota From 2008 to 2018 South Dakota noted decreases in both the number of companies and employment in this subsector at 172 and 156 respectively
Miscellaneous Store RetailersIn South Dakota the Miscellaneous Store Retailers subsector is projected to decrease
by 82 workers (or 32) over the next 10 years This retail trade subsector is a catch-all for retailers who sell specific products not otherwise categorized in a specified retail code Examples of these unique retailers are florists used merchandise stores gift stores office supply stores and pet and pet supply stores From 2008 to 2018 the number of companies and employment in this subsector in South Dakota showed double-digit percentage loss The losses can be attributed to several factors such as competition from large retailers the rise of online shopping and NAICS coding changes of particular establishments Large box store retailers usually offer the same types of goods and have less overhead therefore offering lower prices and taking demand away from specialty stores
Wholesale Electronic Markets and Agents and Brokers
The level of workers employed in the Wholesale Electronic Markets and Agents and Brokers subsector is projected to decrease by 12 (or 22) in South Dakota by 2028 Businesses in this subsector arrange for the sale of goods owned by others generally on a fee or commission basis They act on behalf of the buyers and sellers of goods This subsector contains agents and brokers as well as business-to-business electronic markets that facilitate wholesale trade The decline in this subsector can be traced primarily to a national industry coding change Most of the businesses once coded as Wholesale Electronic Markets and Agents and Brokers are now instead classified as Merchant Wholesalers for Durable or Nondurable Goods
General Merchandise StoresGeneral Merchandise Stores are expected to decrease by 105 workers (or 11) over the next 10 years Businesses contained in this subsector retail new general merchandise from fixed point-of-sale locations Establishments are unique in that they have the equipment and staff capable of retailing a large variety of goods from a single location This includes a variety of display equipment and staff trained to provide information on many lines of products From 2008 to 2018 the number of
Page 61
South Dakota companies increased however the employment level decreased by 59 The expected continued decrease in the number of workers is in correlation with the advancements in technology Large retailers are embracing technology and saving money by replacing workers with machines that can accomplish the same task but costing the retailer less overhead An illustrative example is the implementation of self-checkouts at larger retailers like Walmart and Target lowering the number of cashiers needed
Paper ManufacturingWorker levels in the Paper Manufacturing subsector are projected to decrease by two workers (or 03) This subsector includes establishments that make pulp paper or converted paper products The manufacturing of pulp involves separating the cellulose fibers from other impurities in wood or used paper The manufacturing of paper involves matting these fibers into a sheet Converted paper products are made from paper and other materials by various cutting and shaping techniques Several factors such as the transition from print to online information consumer demand and improved manufacturing and automation processes can be pointed to for declining employment in this industry Paper manufacturers have tried to reduce costs though automation processes and logistics reducing the need for workers to accomplish the same tasks
Nonstore RetailersWorker levels in South Dakotarsquos Nonstore Retailers subsector are projected to increase by just six workers (or 06) over the next decade These establishments retail merchandise
using methods such as the broadcasting of infomercials the broadcasting and publishing of direct-response advertising the publishing of paper and electronic catalogs door-to-door solicitation in-home demonstrations selling from portable stalls and distribution through vending machines The availability of goods and convenience of shopping online has had a negative impact on employment levels in this subsector Since 2008 in South Dakota this subsector has shown an overall employment decline as consumer preference has trended away from this industry
UtilitiesThe Utilities subsector is projected to slightly increase by 12 workers (or 06) over the next 10 years Industries in the Utilities subsector provide electric power natural gas steam supply water supply and sewage removal through a permanent infrastructure of lines mains and pipes Establishments are grouped together based on the utility service provided and the system or facilities required to perform the service In South Dakota over the last decade the Utilities industry saw a slight decline in employment levels as well as companies
The driving factor in modest projected growth can be seen at the four-digit NAICS level In the base year (2018) the Electric Power Generation Transmission and Distribution industry made up 777 of the Utilities subsector and is expected to generate a slight increase in the number of workers employed in the next ten years Technology has been a contributing factor in the stagnant trend in employment levels Energy companies used to employ more people however now jobs such as a meter reading and bill paying can be done online
Employment projections data for 2018 to 2028 is available for all three-digit NAICS industries in on the virtual labor market data system and on our website in Adobe PDF and Microsoft Excel format Please visit our Industry Employment Projections menu page for the latest options and data at any point in time
Page 62
Occupational Projections
Data by occupation provides a more focused picture of skills in demand than data by industry A look at the
occupations projected to grow the most rapidly in South Dakota in the future provides insight into the skills that may be most needed
South Dakotarsquos occupational growth is projected to be faster (at 71) than the nation (52) for the 2018-2028 decade LMIC released projections for 531 detailed occupations in July 2020 Employment for 480 occupations is projected to increase or remain the same while 51 occupations are projected to decline
LMIC completed 2018-2028 statewide projections using the nationally adopted projections methodology which allows for comparability of this data across states and to the nation This methodology incorporates historical time-series employment data as well as state and national economic trends and utilizes a variety of statistical models
It is important to note a general assumption is made no major catastrophic event or natural disaster will significantly affect the economic activities of the occupations during the projections period An example of a catastrophic event would be the COVID-19 pandemic which rocked the United States and the world in 2020 However even though projections would not and could not account for the ramification of this pandemic it is important to remember this event had not taken place by 2018 This employment projections round has a base year of 2018 in other words 2018 employment estimates were used when modeling employment to 2028
Whether or not the pandemic of 2020 will significantly impact future rounds of projections will depend on how long the downturn in the economy lasts and how well state and national labor markets recover from its affects Whether or not future projections
Page 63
series will be significantly impacted by the 2020 pandemic remains unclear at this time
Monthly employment estimates from data sets such as labor force and nonfarm wage and salaried worker series since the COVID-19 pandemic first struck South Dakota indicate a strong and relatively quick recovery They imply a hopefulness the pandemicrsquos long-term impact on South Dakotarsquos industry landscape will be minor
At a macro level two factors affect employment change in an occupation
yen Changes in industry employment This is easy to understand If an industryrsquos employment grows or contracts occupations within the industry will do the same
yen Changes in the mix of occupations (commonly known as staffing pattern) in an industry This factor is more complicated and requires more research and analysis Research includes examining historical staffing pattern data and analyzing factors which may affect occupations within the given industry
Some examples of micro level factors include but are not limited to demographics technology replacement of one product or service for another outsourcing and organizationalwork restructuring
Because occupational employment and demand projections are impacted by both industry employment trends and changes in staffing patterns it is especially difficult to predict the pandemicrsquos long-term impact
Many of the occupations on South Dakotarsquos top 10 fastest growing list are growing due to one or more of the micro-factors mentioned above
DemographicsDemoraphic data refers to data which is statistically socio-economic in nature such as age of the population race income education and employment The data vary by geographic location and often over time South Dakotarsquos
demographics play a definite role in the statersquos economic landscape
TechnologyChanges in technology such as new machines or software can affect the growth of an occupation Technology can increase productivity which usually leads to the need for fewer workers or in some cases even eliminate the need for workers all together However on the flip-side technology can bring with it the advent of new or emerging occupations which creates new jobs Very often technology can cause a decrease in one occupation while creating a demand for a different occupation within the same staffing pattern An industry may expand or contract or it may remain at the same employment level but because of technological changes in the industry the occupational composition can change significantly
Replacement of one service or product for another Changes in the need or preference for different services and products by consumers can also affect the growth of an occupation
OrganizationalWork RestructuringA change in job duties can result in the same output but increase or decrease the utilization of some occupations relative to others within the same industry These changes cause occupations to grow at different rates Many times organizationalwork restructuring results in the consolidation of job duties
South Dakotarsquos Major Occupational GroupsThere are 22 major occupational groups All of South Dakotarsquos major occupational groups are expected to add jobs over the projected decade Fourteen of these groups are projected to show growth faster than the state average
South Dakotarsquos computer and mathematical occupations (123) personal care and service occupations (116) and health care practitioners and technical occupations (113) are projected to be among some of the fastest growing occupational groups during the 2018-2028 projections decade
Page 64
When combined these three major groups account for half of the top 10 fastest growing occupations in South Dakota including the number one spot
Factors such as the increased need by individuals and businesses for information security and technology and an aging population longer life expectancies and growing rates of chronic conditions will continue to be driving forces in the demand for computer technology and health related occupations Another reason health care services in South Dakota will continue to see fast occupational growth is the influx of population
According to an article by United Van Lines regarding the top 10 places to move in 2018 South Dakota tied with North Carolina for 8th and 9th position (at just over 57) (For more information see the 2018 United Van Lines National Movers Study) According to Eily Cummings director of corporate communications at United Van Lines the 42nd annual United Van Lines study not only accurately reflects where Americans are moving to and from but also the reasons
why Unlike its neighboring states (which were either balanced or experienced medium outbound population during 2018) South Dakota experienced a medium inbound population The statistics indicate 57 of those moving into to South Dakota moved here for employment or to look for a job Other groups relocating to South Dakota were those looking to or had already retired (20) those looking to live closer to family (17) and those who moved here for the lifestyle (11)
According to an article by the American Association for Retired Persons (AARP) more retirees are calling smaller less-populated states like South Dakota home This article cites findings from the National Movers Study which is an annual report of migration patterns in the United States The article indicates while the larger warm-weather states still draw many retirees the smaller more sparsely populated states with a retirement-income-friendly tax environment are becoming more popular With South Dakotarsquos population growth occupations in health services will continue to grow to meet the demand for these services
Page 65
South Dakota Occupational Employment Projections 2018-2028 Top 10 in Employment Growth Rate
Ranking Occupation
2018 Estimated
Employment
2028 Projected
EmploymentNumeric Change
2018-2028 Percent Change
1 Information Security Analysts 253 342 89 352
2 Computer Numerically Controlled Machine Tool Programmers Metal and Plastic 77 102 25 325
3 Respiratory Therapists 336 430 94 280
4 Nursing Instructors and Teachers Postsecondary 245 312 67 273
5 Nurse Practitioners 549 697 148 270
6 Personal Care Aides 2981 3783 802 269
7 Physician Assistants 544 685 141 259
8 Software Developers Applications 1041 1300 259 249
9 Health Specialties Teachers Postsecondary 161 201 40 248
10 Occupational Therapy Assistants 119 147 28 235
NotesFor descriptions of the Standard Occupational Classification (SOC) occupations above please visit our websiteData is preliminatary and subject to revisionSource Labor Market Information Center South Dakota Department of Labor and Regulation
South Dakotarsquos 10 Fastest Growing Occupations for 2018-2028Occupational employment is expected to increase by 71 in South Dakota between 2018 and 2028 The table above features the 10 occupations projected to grow the fastest The following narrative explores the reasons for the predicted growth
Top
10Occupations
Information Security AnalystsInformation Security Analysts work in a variety of industries to plan and carry out security measures to protect an organizationrsquos computer networks and systems Their responsibilities are continually expanding as the number and types of cyberattacks and skills of hackers continue to increase
These analysts take the number one spot in South Dakotarsquos fastest growing occupations list This projected growth is outpacing the nationrsquos projected growth for this occupation South Dakota is projecting growth of 35 and nationally information security analysts are projected to grow by 32
Over the 2018-2028 decade demand for this occupation is expected to be very high As cyberattacks have grown in frequency the demand for managed security has increased These analysts will be depended upon for innovative solutions to prevent hackers from stealing critical information or creating problems for networks
Computer Numerically Controlled (CNC) Machine Tool Programmers Metal and Plastic
Metal and Plastic Computer Numerically Controlled (CNC) Machine Tool Programmers moved from its respectable fifth place in
Page 66
the 2016-2026 projections to second place in the 2018-2028 round with a growth rate of 32 This is a small occupation however because it is relatively new it is significant to the economic landscape of South Dakotarsquos production industry These workers develop computer programs which control the machining or processing of metal or plastic parts by automatic machine tools equipment or systems
Although CNC machine tool operators have been around for a while CNC machine tool programmers are fairly new to production South Dakota employers are finding value in staffing workers who are capable of writing CNC programs which are specific to the products their company produces Making changes on the fly is perhaps one of the biggest advantages companies who employ these workers have There is less down time because employers can modify products in a more efficient way and are therefore able to produce unique products for their clients
In addition in the production industry down time for machines not working as they should equates to lost money If the CNC machinersquos preloaded program fails having a programmer on staff is invaluable There is generally less down time because these programmers either know how to correct the issue or can troubleshoot the issues with programmers from the vendor company in an expediate fashion saving the company precious time
Finally some companies have found they can recoup part of the cost of these positions by subcontracting to develop plastic and metal parts for other producers Many producers some of which are too small to have a CNC programmer on staff or are doing a special one-time product run will subcontract with these companies to either have the their CNCs set up to do a special run or in some cases have the company produce the unique part
South Dakotarsquos production industry is restructuring to embrace new technologies which will require the skills of CNC programmers rather than machine setters operators and tenders Therefore demand for manual machine tool operators and
tenders is likely to be reduced by these new technologies and conversely demand for CNC machine programmers is expected to be strong in the 2018-2028 decade in South Dakota
Respiratory TherapistsHealth related occupations take up several of the top 10 fastest growing occupational slots in South Dakota The first of the health-related occupations is respiratory therapists number three on the list Respiratory therapists are expected to grow at four times the state rate for all occupations at 28 from 2018 to 2028 Respiratory therapists care for patients who have trouble breathing for a variety of reasons ranging from chronic respiratory disease such as asthma or emphysema to premature infants with under-developed lungs to patients suffering from heart attacks drowning or shock
South Dakota is following the national trend of much faster than the average growth in this occupation Continued growth of the middle-aged and elderly population is anticipated to lead to increased incidence of respiratory conditions such as chronic obstructive pulmonary disease (COPD) and pneumonia which are lifelong disorders and permanently damage lungs and restrict lung function
And finally growth in this occupation is occurring because these therapists are increasingly found in more types of establishments Just a few years ago most respiratory therapists worked in hospitals today it is becoming common to find these workers in nursing homes doctorsrsquo offices and clinics Not only is it more convenient for residents and patients it cuts down on hospital readmissions which lowers medical expenses for treatment
Nursing Instructors and Teachers Postsecondary
Although not found in the health care industry postsecondary nursing instructors and teachers have definite ties to the strong occupational growth occurring in health care This occupation is the fourth fastest-growing occupation at 27 Because of the high
Page 67
demand for health care workers and especially nursing occupations it should come as no surprise this occupation made the top 10 fastest growing occupations list
Remember although registered nurses did not make the list of fastest growing occupations it does not mean this occupation is not growing The registered nurse occupation is a large occupation in South Dakota so although this occupation is growing at a fast pace (13) because of the sheer number of workers in this occupation the percentage is not high enough to make the top 10 fastest growing occupations Because of the need to train new workers to enter nursing occupations postsecondary nursing instructors and teachers are projected to grow rapidly from 2018-2028
Nurse PractitionersRounding off the top five fastest growing list is the nurse practitioner occupation boasting a 27 change in employment Demographics certainly play a part in the fast-paced growth of this occupation Nationally the aging population is playing a huge role In South Dakota just as important as the aging of the population is the size of the population in South Dakota Because it is such a rural state nurse practitioners are pivotal to services provided
Many nurse practitioners work in small towns sometimes in remote locations These workers are the first-line of defense in staving off everyday aliments treating common injuries and broken bones They are often the eyes and ears which detect more serious sicknesses and disease These workers generally work at a satellite clinic or office for the larger regional medical centers in the state Using internet and satellite communications they serve their clients right where they are most of the time
Many patients who used to travel great distances for medical treatment can now do most of their doctoring even for serious illnesses right in their own hometown thanks in part to nurse practitioners Some of these workers even take their services right to their patients The elderly shut-ins and those recovering from serious illnesses injuries or
operations often have nobody to take them to appointments This is where the traveling nurse practitioners come in Some of these workers travel great distances to see and treat their patients
Practitioners who work in the statersquos larger andor more specialized clinics also provide vital services These workers allow both doctors and patients to make the most of their medical visits by handling the more run-of-the-mill appointments They also perform initial patient consultation and medical check-ups on patients recovering from surgery illnesses or injury This frees up time of physicians specialists and surgeon so they can deal with the more serious cases requiring their attention
Many nursing home and elderly care facilities also have nurse practitioners on staff By employing these workers they can save their residents trips to the doctor for common illnesses or injuries
Personal Care AidesPersonal care aides also called care givers or personal attendants generally provide non-medical services such as cleaning cooking shopping driving their clients to appointments and in general being companions to people with disabilities chronic illnesses or the elderly As the baby boom generation continues to age the need for these workers will increase Personal care aides are often the difference between individuals remaining in their home or having to go to nursing homes
Not only is it more economical to pay for the services of a personal care aid than to live in a nursing home but most generally people prefer to remain in their homes so it is not surprising the demand for these workers is strong Nationally personal care aides are growing at a faster pace (36) than South Dakota However this occupation came in as the sixth fastest growing occupations in South Dakota at (27)
Physician AssistantsPhysician assistants provide health care services typically performed by a physician under the supervision of a physician or a
Page 68
surgeon They conduct complete physicals provide treatment and counsel patients They may in some cases prescribe medication These workers must graduate from an accredited educational program for physician assistants The training they receive is the primary difference between physician assistants and nurse practitioners
Like nurse practitioners physician assistants fill gaps in medical services physicians andor surgeons are either too busy to complete or the demand for services is higher than the supply of physicians and surgeons Physician assistant employment is projected to grow fast increasing by 26 from 2018 to 2028 The reasons for the fast growth in employment are mirroring nurse practitioners in South Dakota
Software Developers Applications
Applications software developers are projected to grow 25 from 2018 to 2028 This growth nearly mirrors the nationrsquos growth for this occupation (26) Although at first this might not seem like an occupation prevalent in health care the health and medical insurance and reinsurance carrierrsquos industry will need the innovative software these programmers write to manage new health care policy enrollments and administer existing policies digitally
However unlike most of the occupations we have just looked at as well as those yet to come applications software developers work in a wide variety of industries not just one industry Therefore the fast pace at which this occupation is growing is caused by many different reasons
First and foremost this occupation is growing due to technological changes occurring in nearly every industry and aspect of our lives Conveniences ranging from personal assistants like Alexa or Google Nest to home security services to the latest streaming services being offered all run off electronic applications
Not only do the ways we use these applications continue to grow but so do the different types of platforms on which these applications must work Each of these various applications and platforms require the skill of someone who
can develop the apps that make them work In South Dakota many government and private employers hire these workers to develop software relevant to their business or the services they offer Some developers work on a contract basis and may enjoy living in South Dakota while programming for a client halfway around the world
Technology is here to stay and filtering into everyday life in ways few would have thought of just a few years ago Because this occupation can be found in so many industries (including workers who are self-employed and work on a contract basis) and virtually in any location this occupation is projected to see strong growth nationally and in South Dakota for a long time to come
Health Specialties Teachers Post-Secondary
With South Dakotarsquos health care industry booming post-secondary health specialties teachers are also growing much faster than the average at 25 These instructors teach courses in fields such as dentistry laboratory technology medicine pharmacy public health therapy and veterinary medicine
With the increased demand for these types of health workers South Dakotarsquos schools of higher education will be meeting these demands by offering more training opportunities from 2018-2028 This trend is again closely mirroring the national trend where post-secondary health specialties teachers are projected to grow 23 during the same time
Occupational Therapy Assistants
Rounding out the list of the 10 fastest growing occupations in South Dakota to 2028 is Occupational therapy assistants They work with patients and help them develop recover improve and maintain the skills needed for daily living after a traumatic event like an accident stroke heart attack or surgery
Some of the growth in this occupation will be due to the graying of South Dakotarsquos population however some of it because of
Page 69
the influx of people migrating into South Dakota Regardless of age a larger population equates to more health care needs In addition to an older and larger population some of the growth in this occupation is because of the availability of these workers to patients
As more insurance companies cover the expense of this therapy the demand for these
workers has increased Not too many years ago a broken hip would likely have resulted in a move to a nursing home However with medical advancements and treatments today after a successful surgery many people can return to their everyday lives with the help of these assistants to rehabilitate
Employment projections data for 2018 to 2028 is available for more than 500 detailed occupations in the virtual labor market data system and on our website in Adobe PDF and Microsoft Excel format Please visit our Occupational Employment Projections menu page for the latest options and data at any point in time
Occupational Demand Projections
The previous section on occupational employment projections focused on employment growth through 2028 specifically on those occupations projected to grow the fastest However growth is only one portion of the demand for workers in each occupation In fact when considering
future workforce needs employment growth is a relatively minor factor in the number of workers who will be needed The second component of demand is created when workers leave one occupation for a job in another occupation (this is known as transfer) or leave the workforce entirely (this is called exit)
The table at the top of the next page shows the occupations projected to have the greatest demand for workers in South Dakota each year on average through 2028 As you can see annual demand (for workers) due to employment growth accounts for a relatively small portion of the total annual demand for workers
The methodology used for employment projections at the national level and by all state agencies like ours in South Dakota is developed by the US Bureau of Labor Statistics (BLS) Use of the BLS methodology ensures not only statistically sound reliable and unbiased data but also allows for comparability of the data among geographic areas
BLS continuously strives to improve the methodology to ensure projections are accurately reflecting the dynamics of the current labor market This latest improvement to the BLS methodology which was released for the first time during the 2016-2026 statewide round of projections allows for a more comprehensive measure of the demand for workers National employment projections for 2018 to 2028 based on the new methodology were released in September 2019 state projections were rolled out in June 2020
Prior to the 2016-2026 occupational projections round the BLS methodology focused on replacement demand created by workers exiting the labor force completelymdashfor reasons such as retirement and death In todayrsquos workforce it is more common for workers to leave an occupation for reasons other than retirement such as changing careers being promoted into management or completing a training program to enter a different occupation
For this reason BLS established a new methodology which is known as separations The separations methodology was designed to better understand and project what will happen within the dynamic new economy in which workers will likely have multiple occupations in a lifetime This methodology
Page 70
South Dakota Occupational Projections 2018-2028 Top 10 in Demand
Occupational Title2018
Workers2028
Workers
Numeric Change 2018 to
2028
Annual Demand Due to
Employment Growth
Labor Force Exits
Occupational Transfers Total
Total All Occupations 491588 526251 34663 3466 23129 36069 62664
Retail Salespersons 16138 17072 934 93 954 1471 2518
Cashiers 12654 12868 214 21 1139 1268 2428
Combined Food Preparation and Serving Workers including Fast Food
8845 10432 1587 159 768 948 1875
Waiters and Waitresses 7511 7963 452 45 537 948 1530
Janitors and Cleaners except Maids and Housekeeping Cleaners 9650 10623 973 97 620 715 1432
Bookkeeping Accounting and Auditing Clerks 10986 11000 14 1 669 612 1282
Customer Service Representatives 8693 8702 9 1 418 742 1161
Heavy and Tractor-Trailer Truck Drivers 8645 9399 754 75 371 654 1100
Laborers and Freight Stock and Material Movers Hand 6517 7198 681 68 310 643 1021
Counter Attendants Cafeteria Food Concession and Coffee Shop 4066 4319 253 25 472 438 935
Source Labor Market Information Center SD Department of Labor and Regulation
incorporates past data patterns and trends to general employment projections and captures two types of separations
yen Workers who leave the labor force entirely (shown in the table above as ldquoAnnual Demand Due to Labor Force Exitsrdquo)
yen Workers who leave one major occupational group for another one (shown in the table above as ldquoAnnual Demand Due to Occupational Transfersrdquo)
Every personrsquos career journey varies but certain trends are common
yen Transfers between occupational groups are more common at younger ages as workers explore possible careers
yen Transfers between occupations also tend to be more common in occupations often considered ldquoentry levelrdquo where working conditions such as work schedules and employee benefits are less desirable
yen Movements out of the labor force known as exits happen at any age but are more common at older ages when workers typically retire
Page 71
How occupational transfers and exists impact projected outlookAs the pie graph above illustrates nearly all of South Dakotarsquos annual demand for workers during the 2018-2028 projections decade will be due to occupational transfers and labor force exits at 576 and 369 respectively Just 55 of the statersquos annual openings are projected to be new growth
South Dakota virtually mirrors the nation in these breakouts for the 2018-2028 projections period Nationally transfers (59) and exits (37) will make up the lionrsquos share of annual demand for occupations with just 4 being caused by growth
ExitsIn 2018 486 of South Dakotarsquos civilian noninstitutionalized population age 55 and over were in the statersquos labor force In 2016 503 of South Dakotarsquos civilian noninstitutionalized population age 55 and over were in the statersquos labor force This is a decrease of 17 in the labor force participation rate for this age cohort from 2016
to 2018 This indicates these workers exited the labor force at a faster clip in 2018 than 2016 It is anticipated as this population continues to age over the 10-year-projection period workers will continue to retire exiting the labor force
Retirement is not the only reason workers exit the labor force Many workers are in the labor force on a temporary basis People enter the labor force temporarily for a variety of reasons Once those reasons have been met they may exit the labor force causing a demand for the opening they have left behind
Reasons vary for entering an occupation for a limited amount of time For some it might be a necessity because family events mandate a lifestyle change Events such as a family member losing a job or becoming unable to work a divorce or perhaps the death of a loved one sometimes create the need for a temporary cash flow Therefore people not normally involved in the labor force will enter it for a while and then exit again once the situation is resolved
Page 72
In other cases individuals drop out of the labor force to stay home with their children until they start school or to home school them Other reasons for not participating in the labor force for a time include taking care of an aging or chronically ill relative or pursuing education
Annual Occupational TransfersAnother portion of occupational demand comes from occupational transfers This important component of occupational demand hinges on a workerrsquos attachment to or a lack thereof to an occupation Most workers have multiple jobs throughout their career When different jobs fall into completely separate occupations the result is an occupaitonal transfer
The South Dakota occupations with the highest projected demand due to occupational transfers are all large occupations with many workers Examples include Retail Salespersons Cashiers Combined Food Preparation and Serving Workers Including Fast Food Waiters and Waitresses Customer Service Representatives Janitors and Cleaners Heavy and Tractor-Trailer Truck Drivers and Laborers and Hand Material Movers
With a few exceptions most of the occupations with the greatest demand due to occupational transfers are transitory in nature By transitory we mean these occupations tend to work well as stepping stones for employees who plan to be in the occupation for a brief time want or need part-time work or simply need basic work experience before finding employment in another occupation
Young or new labor force entrants create many openings when they transfer from one occupation to another occupation in a different vocation These workers tend to accept employment in many of the occupations in the table above to gain work experience and begin creating a resume Most employers who hire these workers know it is unlikely they will retain them long-term but also realize they are helping develop the workforce When a special worker comes along if possible an employer makes room in the business to retain the skills the worker has acquired However usually in this situation the worker advances in the ranks moving into a different occupation with the same employer The result is still an opening created by an occupational transfer
Page 73
Hot Careers
When decision-makers are analyzing labor market data to make determinations of occupational training or educational programs to fund or provide assistance with the Department of Labor and Regulation encourages the use of both occupational demand and
wage estimates This helps ensure an adequate return on investmentmdashwith a greater likelihood of a trainee or graduate finding employment in an occupation related to the program and also being able to improve his or her earning potential
To that end and also to help individual career planners and job seekers identify occupations with the most favorable job outlook from a labor market perspective the Labor Market Information Center identifies high demand-high wage occupations or ldquoHot Careersrdquo
The current Hot Careers were identified in fall 2020 using the latest employment projections (2018-2028) and wage data (2019) available at the time With 2020 wage estimates becoming available since the criteria was updated accordingly To be on the Hot Careers list an occupation has to meet each of the three following criteria
yen Be projected to show employment growth to 2028
yen Have projected annual openings (a measure of demand for workers) greater than the average across all occupations (85) for 2018-2028
yen Have an averagemean wage greater than the median wage across all occupations in 2020 ($34754)
The 69 South Dakota occupations meeting the Hot Careers criteria are listed on the following pages
Page 74
Accountants and Auditors
Automotive Service Technicians and Mechanics
Bus and Truck Mechanics and Diesel Engine Specialists
Business Operations Specialists All Other
Buyers and Purchasing Agents
Carpenters
Cement Masons and Concrete Finishers
Chief Executives
Child Family and School Social Workers
Civil Engineers
Clergy
Clinical Laboratory Technologists and Technicians
Coaches and Scouts
Coating Painting and Spraying Machine Setters Operators and Tenders
Compliance Officers
Computer User Support Specialists
Correctional Officers and Jailers
Cost Estimators
Cutting and Slicing Machine Setters Operators and Tenders
Cutting Punching and Press Machine Setters Operators and Tenders Metal and Plastic
Dental Assistants
Educational Guidance School and Vocational Counselors
Electricians
Elementary School Teachers Except Special Education
Farm Equipment Mechanics and Service Technicians
First-Line Supervisors of Construction Trades and Extraction Worker
First-Line Supervisors of Housekeeping and Janitorial Workers
First-Line Supervisors of Mechanics Installers and Repairers
First-Line Supervisors of Non-Retail Sales Workers
First-Line Supervisors of Office and Administrative Support Workers
First-Line Supervisors of Production and Operating Workers
First-Line Supervisors of Non-Retail Sales Workers
Food Service Managers
General and Operations Managers
Graphic Designers
Heating Air Conditioning and Refrigeration Mechanics and Installers
Heavy and Tractor-Trailer Truck Drivers
Highway Maintenance Workers
Human Resources Specialists
Industrial Machinery Mechanics
Industrial Truck and Tractor Operators
Insurance Sales Agents
Licensed Practical and Licensed Vocational Nurses
Light Truck or Delivery Services Drivers
Loan Interviewers and Clerks
Loan Officers
Machinists
Maintenance and Repair Workers General
Management Analysts
Market Research Analysts and Marketing Specialists
Hot Careers
Accountants and Auditors
Automotive Service Technicians and Mechanics
Bus and Truck Mechanics and Diesel Engine Specialists
Business Operations Specialists All Other
Buyers and Purchasing Agents
Carpenters
Cement Masons and Concrete Finishers
Chief Executives
Child Family and School Social Workers
Civil Engineers
Clergy
Clinical Laboratory Technologists and Technicians
Coaches and Scouts
Coating Painting and Spraying Machine Setters Operators and Tenders
Compliance Officers
Computer User Support Specialists
Correctional Officers and Jailers
Cost Estimators
Cutting and Slicing Machine Setters Operators and Tenders
Cutting Punching and Press Machine Setters Operators and Tenders Metal and Plastic
Dental Assistants
Educational Guidance School and Vocational Counselors
Electricians
Elementary School Teachers except Special Education
Farm Equipment Mechanics and Service Technicians
First-Line Supervisors of Construction Trades and Extraction Worker
First-Line Supervisors of Housekeeping and Janitorial Workers
First-Line Supervisors of Mechanics Installers and Repairers
First-Line Supervisors of Non-Retail Sales Workers
First-Line Supervisors of Office and Administrative Support Workers
First-Line Supervisors of Production and Operating Workers
First-Line Supervisors of Retail Sales Workers
Food Service Managers
General and Operations Managers
Graphic Designers
Heating Air Conditioning and Refrigeration Mechanics and Installers
Heavy and Tractor-Trailer Truck Drivers
Highway Maintenance Workers
Human Resources Specialists
Industrial Machinery Mechanics
Industrial Truck and Tractor Operators
Insurance Sales Agents
Licensed Practical and Licensed Vocational Nurses
Light Truck or Delivery Services Drivers
Loan Interviewers and Clerks
Loan Officers
Machinists
Maintenance and Repair Workers General
Page 75
Additionally the Top 30 occupations were identified In addition to meeting the criteria for the Hot Careers South Dakotarsquos Top 30 Careers are those which additionally meet this criteria
yen Rank in the top 30 for projected annual openings (a measure of demand for workers)
For each of the Top 30 careers the table on the following pages shows the 2018-2028 projected employment and outlook information and the 2020 wage data Also on the following page is a legend explaining the row colors
Top 30 Careers
Management Analysts
Market Research Analysts and Marketing Specialists
Middle School Teachers except Special and CareerTechnical Education
Network and Computer Systems Administrators
Operating Engineers and Other Construction Equipment Operators
Painters Construction and Maintenance
Parts Salespersons
Pesticide Handlers Sprayers and Applicators Vegetation
Plumbers Pipefitters and Steamfitters
Police and Sheriffrsquos Patrol Officers
Property Real Estate and Community Association Managers
Registered Nurses
Sales Representatives Wholesale and Manufacturing except Technical and Scientific Products
Sales Representatives Wholesale and Manufacturing Technical and Scientific Products
Secondary School Teachers except Special and CareerTechnical Education
Software Developers Applications
Soil and Plant Scientists
Structural Iron and Steel Workers
Substance Abuse Behavioral Disorder and Mental Health Counselors
Water and Wastewater Treatment Plant and System Operators
Welders Cutters Solderers and Brazers
69 Hot
Careers
Page 76
South Dakota Top 30 Occupations 2018-2028 Employment and Demand Projections and 2020 Wage Estimates
Rank Occupational TitleAnnual
Openings2018
Employment2028
EmploymentNumeric Change
Percent Change
Average Wage
1 Heavy and Tractor-Trailer Truck Drivers 1100 8645 9399 754 87 $46232
2 Registered Nurses 907 12940 14643 1703 132 $60956
3 Carpenters 659 5696 6160 464 82 $38094
4Sales Representatives Wholesale and Manufacturing except Technical and Scientific Products
655 5449 6003 554 102 $65925
5 Accountants and Auditors 538 4998 5491 493 99 $69174
6 First-Line Supervisors of Retail Sales Workers 466 4059 4190 131 32 $49305
7 Light Truck or Delivery Services Drivers 447 3387 3777 390 115 $36996
8 Welders Cutters Solderers and Brazers 432 3321 3758 437 132 $40874
9 General and Operations Managers 404 4038 4412 374 93 $131895
10 Management Analysts 377 3334 3762 428 128 $75916
11 Elementary School Teachers except Special Education 349 4264 4516 252 59 $44793
12 Maintenance and Repair Workers General 334 3007 3294 287 95 $40319
13 Electricians 322 2464 2696 232 94 $47672
14 Insurance Sales Agents 296 2562 2882 320 125 $72640
15Secondary School Teachers except Special and CareerTechnical Education
275 3502 3718 216 62 $45810
16 Loan Interviewers and Clerks 245 2001 2282 281 140 $39104
17 Automotive Service Technicians and Mechanics 244 2321 2441 120 52 $42841
18 Cement Masons and Concrete Finishers 239 2010 2195 185 92 $37562
19 Clergy 225 1860 2008 148 80 $47240
20 Parts Salespersons 224 1616 1800 184 114 $39169
21 Plumbers Pipefitters and Steamfitters 219 1684 1896 212 126 $45333
22 Operating Engineers and Other Construction Equipment Operators 213 1702 1805 103 61 $46576
23 Highway Maintenance Workers 211 1796 1870 74 41 $37319
Page 77
Color Coding Key for
Level of Education Recommended in South Dakota
High school diploma or equivalent
Some postsecondary education
Associate degree
Bachelorrsquos degree
South Dakota Top 30 Occupations continued 2018-2028 Employment and Demand Projections and 2020 Wage Estimates
Rank Occupational TitleAnnual
Openings2018
Employment2028
EmploymentNumeric Change
Percent Change
Average Wage
24First-Line Supervisors of Office and Administrative Support Workers
198 1824 1875 51 28 $51636
25 Industrial Truck and Tractor Operators 197 1533 1693 160 104 $37187
26 Child Family and School Social Workers 195 1846 1947 101 55 $41940
27Sales Representatives Wholesale and Manufacturing Technical and Scientific Products
191 1600 1753 153 96 $104815
28 Coaches and Scouts 178 1081 1201 120 111 $39623
29Substance Abuse Behavioral Disorder and Mental Health Counselors
176 1352 1603 251 186 $44195
30 Loan Officers 175 1703 1930 227 133 $70141
Notes
For more information on average annual openings and other employment projections data used in the table above (2018 workers 2028 workers percent change 2018-2028) see our Employment Projections Technical Notes page
For more information on average annual wages please see our Occupational Wages Technical Notes page
Employment projections for additional occupations are available in the virtual labor market data system please see our Occupational Projections menu
Wage data is also available for additional occupations in the virtual labor market data system please see our Occupational Wages menu
Source Labor Market Information Center South Dakota Department of Labor and Regulation
Page 78
A number of resources on the Hot Careers and Top 30 Careers are available as listed below To learn more visit our Hot Careers web page or call the Labor Market Information Center at 6056262314
Current Job Openings in Hot Careers
Top 30 Hot Careers flier (Adobe PDF format also available in print upon request)
Learn even more about each Hot Career in the virtual labor market data system
Occupational Profiles
The Top 30 Careers and many of the 69 Hot Careers are also featured in the career awareness and exploration materials LMIC develops for K-12 students The materials are available in PDF format for downloading from the website and are also available in print upon request
Career Peeks (activity packet for students in kindergarten through second grade)
Career Aware (activity booklet for students in grades three through five)
Career Cluster Poster Series
Hot Career Resources
Published byLabor Market Information Center
South Dakota Department of Labor and RegulationSeptember 2021
Auxiliary aids and services are available upon request to individuals with disabilities State and federal laws require the Department of Labor and Regulation to provide services to all qualified persons without regard to race color creed religion age sex ancestry political affiliation or belief national origin or disability
This workforce product was funded by a grant awarded by the US Department of Laborrsquos Employment and Training Administration The product was created by the recipient and does not necessarily reflect the official po-sition of the US Department of Labor The Department of Labor makes no guarantees warranties or assurances of any kind express or implied with respect to such information including any information on linked sites and including but not limited to accuracy of the information or its completeness timeliness usefulness adequacy continued availability or ownership This product is copyrighted by the institution that created it Internal use by an organization andor personal use by an individual for non-commercial purposes is permissible All other uses require the prior authorization of the copyright owner
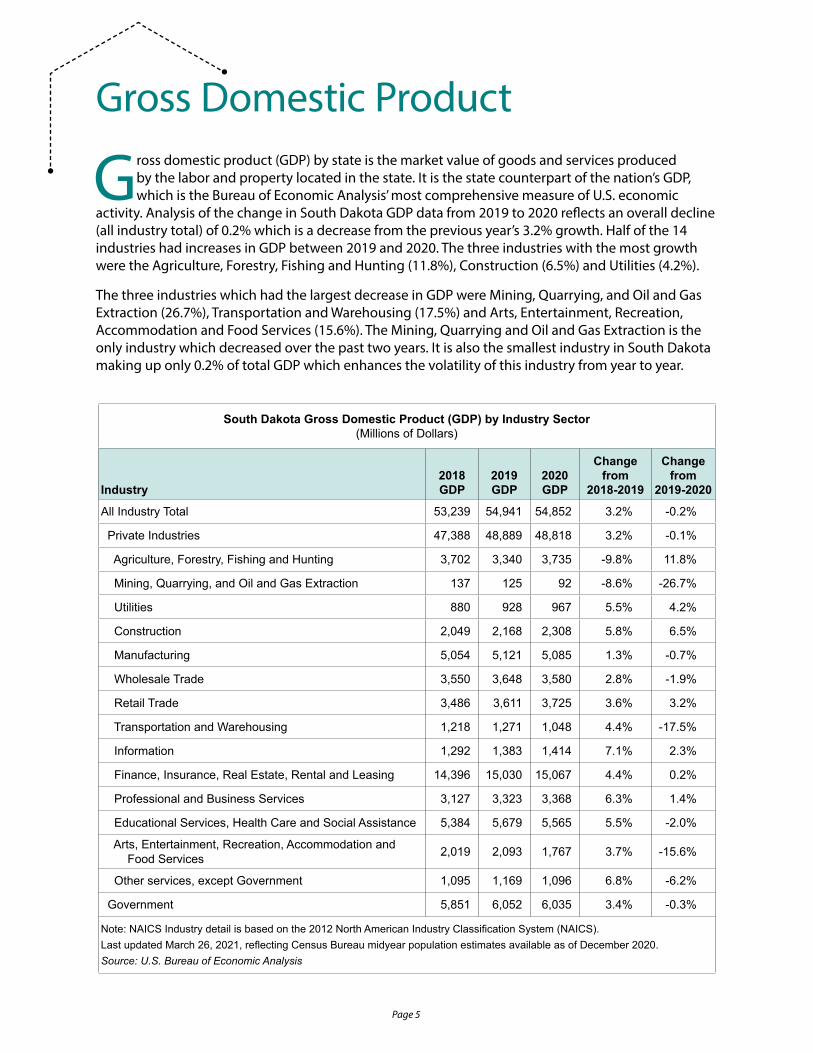