south africa’s education crisis - nic spaull · pdf filesouth africa’s education...
TRANSCRIPT
South Africa’s Education Crisis
The quality of education in South Africa 19942011
Nicholas Spaull
January 2013
Contents
1. Introduction ................................................................................................................................. 2
2. Background ................................................................................................................................. 2
3. Local studies of educational achievement................................................................................... 5
4. International comparisons of educational achievement .............................................................. 8
6. Matric performance: retention and subject-choice .................................................................... 24
7. Inequality of educational opportunity ....................................................................................... 27
8. Insurmountable learning deficits ............................................................................................... 31
9. Transitions from school to work and tertiary institutions ......................................................... 36
10. Policy suggestions ..................................................................................................................... 45
11. Conclusion ................................................................................................................................. 48
12. References ................................................................................................................................. 52

1. Introduction
The aim of this report is to provide an empirical overview of the quality of education in South Africa since 1994, and in so doing comment on the state of the country’s schooling system. It will become increasingly clear that the weight of evidence supports the conclusion that there is an ongoing crisis in South African education, and that the current schooling system is failing the majority of South Africa’s youth. By using a variety of independently conducted assessments of student achievement the report shows that - with the exception of a wealthy minority - most South African students cannot read, write and compute at grade-appropriate levels, with large proportions being functionally illiterate and innumerate. As far as educational outcomes go, South Africa has the worst education system of all middle-income countries that participate in cross-national assessments of educational achievement. What is more, we perform worse than many low-income African countries. The annually-reported matric statistics are particularly misleading since they do not take into account those students who never make it to matric. Of 100 students that start school, only 50 will make it to matric, 40 will pass, and only 12 will qualify for university. Those 18-24-year-olds who do not acquire some form of post-matric education are at a distinct economic disadvantage and not only struggle to find full-time employment, but also have one of the highest probabilities of being unemployed for sustained periods of time, if not permanently. While there have been some recent improvements in student outcomes, as well as some important policy innovations, the picture that emerges time and again is both dire and consistent: However one chooses to measure learner performance, and at whichever grade one chooses to test, the vast majority of South African students are significantly below where they should be in terms of the curriculum, and more generally, have not reached a host of normal numeracy and literacy milestones. As it stands, the South African education system is grossly inefficient, severely underperforming and egregiously unfair.
2. Background
The recent National Development Plan (NDP) published by the National Planning Commission (NPC) is quickly becoming a roadmap for South African progress, being acknowledged as authoritative by government, business, academia and the public at large. The document is both explicit and comprehensive, giving equal treatment to the reasons for the country’s underperformance and the proposed way forward. One area which receives considerable attention is that of education. The report stresses the links between education, opportunities and employment, with particular emphasis on the notion of building capabilities (NPC, 2012, p. 17). The capability-approach, developed by Amartya Sen, states that people should be afforded the freedom to achieve well-being and develop their capabilities, that is, “their real opportunities to do and be what they have reason to value” (Robeyns, 2011). It is now part of the received wisdom in all of the developmental social sciences that economic and social development is not possible without increased access to education, and an improvement in the quality thereof. Lewin (2007, p. 2) summarizes this concept as follows:
“Fairly universally poverty reduction is seen as unlikely unless knowledge, skill and capabilities are extended to those who are marginalised from value-added economic activity by illiteracy, lack of numeracy, and higher level reasoning that links causes and effects rationally. In most societies, and especially those that are developing rapidly, households and individuals value participation in education and invest substantially in pursuing the benefits it can confer. The rich have few doubts that the investments pay off; the poor generally share the belief and recognise that increasingly mobility out of poverty is education-related, albeit that their aspirations and expectations are less frequently realized” (Lewin, 2007, p. 2).

The NDP concurs with the above and acknowledges that “Improving the quality of education, skills development and innovation” is one of three1 priorities that stand out from the report. Thankfully, its assessment of the educational situation in South Africa lacks the usual euphemistic rhetoric of government documents:
“The quality of education for most black children is poor. This denies many learners access to employment. It also reduces the earnings potential and career mobility of those who do get jobs – and limits the potential dynamism of South African business” (NPC, 2012, p. 38).
The report highlights a number of institutional and systemic factors that prevent progress in South Africa’s schooling system (NPC, 2012, p. 38). The four most notable of these themes are listed below:
Improve the management of the education system – reduce unnecessary layers of bureaucracy; provide intervention tools that do not require high levels of capacity; supportive and corrective interventions should be inversely proportional to school performance; improve infrastructure in poor schools, especially in rural areas.
Increase the competence and capacity of school principals – provide support to principals based on areas of weakness; select principals purely on merit; allocate greater powers to principals for school management and hold principals accountable for their performance.
Moving towards results oriented mutual accountability – strengthen the accountability chain from top to bottom, eliminating a culture of blame-shifting; externally administer and mark the Annual National Assessment for at least one primary grade to ensure that there is a reliable, system-wide measure of quality for all primary schools; provide feedback to parents regarding the performance of their children.
Improve teacher performance and accountability – various proposals which cover training, remuneration, incentives, time on task, performance measurement, content and pedagogical support, and teacher professionalism.
The present document directly addresses the last two of these points by elaborating on the existing levels of performance, the current state of the Annual National Assessments and the most recent research on the existing levels of mathematics teacher content knowledge in South Africa. While the NPC report is impressive in its scope and depth, it does not provide an adequate treatment of the egregious inequalities of South Africa’s education system. Consequently two chapters of this report have been devoted to this, chapter seven on the inequality of opportunity, and chapter eight on insurmountable learning deficits.
In total, the report has seven chapters which deal with various aspects of education in South Africa. The first half deals with the performance of South African children on local and international tests (chapter two and three respectively) – with a separate section on matric results (chapter four). Thereafter the focus turns to two characteristic features of the schooling system, namely the inequality of educational opportunity in the country (chapter seven) and the insurmountable learning deficits children acquire in primary schooling (chapter eight). Lastly, the report focuses on the transitions from school to work and tertiary institutions (chapter nine). Following a discussion of the policy implications arising from the research (chapter ten), the report concludes (chapter eleven).
1 The other two priorities are “Raising employment through faster economic growth” and “Building the capability of the state to play a developmental, transformative role” (NPC, 2012, p. 17)
A note on “quality”
Defining “quality” in relation to education is notoriously difficult, with different definitions in concurrent use both in the literature2 and in common parlance. These definitions are not usually mutually exclusive but do place emphasis on different criteria, with some groups stressing the unquantifiable outcomes of education (political participation, social and democratic values, egalitarianism etc.), while others emphasize the measurable cognitive skills acquired at school, especially numeracy and literacy. Furthermore, quality can refer to both the inputs and the outputs of education, as Heyneveld and Craig (1996, p. 13) explain, quality is a “concept comprising both changes in the environment in which education takes place and detectable gains in learners’ knowledge, skills and values.” While it is acknowledged that education should develop the emotional and creative capacities of children, and not only their cognitive faculties (UNESCO, 2005, p. 30), it is the latter which we can easily measure and for which we have objectively verifiable scientific evidence. Consequently, this report focuses on the cognitive outcomes of students in South Africa – particularly the knowledge and skills associated with language, mathematics and science, the subjects for which there is trustworthy nationally representative data at more than one point in time. This was a pragmatic, rather than ideological, choice and does not deny the importance of other subjects, or the myriad of unquantifiable benefits associated with education.
2 For recent reviews on the concept of quality in education see UNESCO (2005), and for specific reference to South Africa see Hugo et al. (2010).

3. Local studies of educational achievement
In South Africa there have been numerous initiatives to monitor the quality of education in the country. By measuring what learners know, these tests enable researchers and policy makers to assess the level of achievement of different groups of learners. The discussion below provides a cursory overview of each study, as well as the most important findings emerging from the research.
Systemic Evaluations (2001 and 2007; grade 3)
The Systemic Evaluations tested a random sample of approximately 54 000 Grade 3 learners in more than 2000 primary schools in 2001 and 2007 (DoE, 2008a). The results3 of the 2007 Systemic Evaluation showed an average score of 36% for literacy (30% in 2001) and 35% for numeracy (30% in 2001) – showing that there was an increase of five percentage points since 2001 for numeracy and six percentage points for literacy. The largest increases were found in the Free State (16 percentage points for literacy, 13 percentage points for numeracy) and the Western Cape (15 percentage points for literacy, 17 percentage points for numeracy). The Department of Education concluded in 2008 that there was an “urgent need to improve performance in these critical foundation skills” (DoE, 2008a, p. 12) - a statement which mirrored the earlier call for an “urgent intervention to address the situation” which appeared five years earlier in the 2003 Systemic Evaluation report (DoE, 2003, p. 66).
Western Cape Learner Assessment Study (2003; grade 6)
The Western Cape Learner Assessment Study in 2003 tested every primary school in the Western Cape at the grade 6 level. Of the 34 596 learners tested, a dismally small proportion were performing at the appropriate grade 6 literacy level (35%), and an even smaller proportion were at the appropriate grade 6 numeracy level (15.6%) (Taylor, Fleisch, & Shindler, 2008, p. 43). Taylor et al go on to disaggregate these figures by ex-department and make the important point that four out of five grade 6 children were at the appropriate reading level in former white schools, compared to four children in a hundred in former Department of Education and Training (black) schools.
The National School Effectiveness Study (NSES; 2007-2009; grades 3-5)
The National School Effectiveness Study is the only panel dataset on educational achievement in South Africa4 where 266 schools were tested in numeracy and literacy in 2007 (Grade 3), 2008 (Grade 4) and 2009 (Grade 5) (Taylor , 2011). The same students wrote the same test in 2007, 2008 and 2009, with the test being calibrated at the grade three level. The mean scores for literacy in Grade 3 [Grade 4] were 19% [27%], and on the numeracy tests were 28% [35%] – all well below the levels that learners at these grades should be achieving. One of the most important findings relates to the learning deficits of most children in historically black schools, as Taylor (2011, p. 16) explains:
“It is alarming, however, that the distribution for grade 5 students in historically black schools was still a considerably weaker distribution than that of grade 3 students in historically white schools. One can therefore conclude that by the fifth grade the
3 A closer inspection of government reports shows that the 2008 report on the Systemic Evaluations indicates that the national average was 30% for literacy in 2001 (DoE, 2008a, p. 11), however the 2003 report on the 2001 Systemic Evaluation reports that the 2001 average for literacy was 54% (DoE, 2003, p. 32). It is unclear why there is such a large discrepancy between the two reports. For the purposes of this paper I use the figures from the more recent 2008 report. 4 Gauteng did not participate in the NSES study since other testing was being administered in that province at the same time.
educational backlog experienced in historically black schools is already equivalent to well over two years worth of learning”
Annual National Assessments (ANA; 2011 and 2012; grades 1-6 and 9)
The Annual National Assessments (ANAs) of 2011 and 2012 were a hallmark achievement for the Department of Basic Education. The ANAs are a set of nationally standardised assessments for numeracy and literacy in grades one to six and nine. They were carried out in February 2011 (testing 2010 content) and September 2012 (testing 2012 content). Since they tested every single student from grades one to six and nine, these two assessments represent the largest data-gathering exercise in the country apart from the two censuses.
Up until 2011 the only standardised national exams that existed were at the exit-level of the schooling system (matric). All other exams were either provincial (Systemic Evaluations in the Western Cape), limited to a nationally representative sample (Systemic Evaluations, TIMSS, PIRLS, SACMEQ), or more commonly, decided at the school or classroom level. Without a nationally comparable (standardised) exam at the primary school level, one could not compare schools across provinces, districts, or over time. Consequently it was not possible for policy makers or parents to determine if a primary school was underperforming or not, at least not with any measure of certainty. Furthermore, it was not possible to hold schools accountable for student learning or to target support to where it was needed most, since student learning was imperfectly measured and thus of limited comparative value.
The Department has released a report for both the ANA 2011 (DBE, 2011b) and the ANA 2012 (DBE, 2012) which outlines their rationale, methodology, procedures, and results.
In 2011 the HSRC verified a sample of 1800 schools by remarking 50 test scripts (25 for numeracy and 25 for literacy) for each of grades three and six (DBE, 2011b). In 2012 there was no external verification by an independent body, although the Department did conduct its own form of verification by centrally remarking a sample of scripts from grades three, six and nine (DBE, 2012, p. 17).
While this system of testing is still in its infancy, and thus a certain amount of problems are to be expected, there are a number of serious concerns with these tests, particularly relating to the comparison between ANA 2011 and 2012. The most serious of these are outlined below:
In both ANA 2011 and 2012, teachers marked tests themselves, and invigilated classes within their own schools. Although ANA is not a high-stakes exam, the very act of having to report the results from a national standardised exam may induce teachers and principals to act in strategic ways (guiding students during the exam or marking leniently for example). It is not clear that the existing verification procedures (either in 2011, but particularly in 2012) can detect, correct or prevent these irregularities.
The difficulty levels between 2011 and 2012 and across grades within a particular year do not appear to be the same, either across grades or years. In a Mail & Guardian interview this year, Van der Berg & Spaull (2012) provide a full explanation of why the ANAs of 2011 and 2012 are not at all comparable. The most salient points of that discussion are included below:
o It is unclear whether the correct procedures were followed to ensure that the tests were of equal difficulty in each grade and across the two years. Although there were anchor items for some grades between 2011 and 2012, it is unclear if these were used for equating purposes using Rasch analysis. Furthermore, for grades one, two, four and five there was no item-level data for 2011 (since the HSRC only verified grades

three and six) and thus difficulty levels could not possibly have been equated between 2011 and 2012 since there was no data on baseline anchor items. Nevertheless the Department report makes explicit comparisons between average scores for all grades (DBE, 2012).
o If the tests for the different grades were of equal difficulty, the results of 2012 are not internally consistent, i.e. changes between grades are too large or erratic to be plausible. For example, the grade one mathematics average in 2012 was 68% but the grade three average just two grades later is 41%, with the grade six average being 27%. The magnitude of these changes over only a few grades suggests that there are different levels of curriculum mastery at different grades. It is more likely that not all the tests were set at grade-appropriate levels.
o The year-on-year increase of 17 percentage points for grade three literacy, from 35% in 2011 to 52% in 2012 (a 49% increase), if true, would mean that South Africa has improved more in one or two years at the grade three level for literacy (0.7 standard deviations) than any other country has in a seven year period between PIRLS 2001 and 2006 (Russia - 0.54 standard deviations).
o A number of academics have called the 2012 results into question, including those on the ANA advisory committee, such as Dr Surette van Staden, who refers to the improvements as “highly unlikely” (John, 2012). Professor Mary Metcalfe, former higher education director general, reiterates this point when she cautions that “we need to be sceptical of these results” (John, 2012).
o Van der Berg and Spaull (2012) further explain that this lack of comparability can actually do harm to the system, “the fact that the ANA’s results from 2011 and 2012 are incomparable is highly unfortunate. This means that schools, teachers and parents are getting erroneous feedback. Thus the 2012 ANA results, compared to those of 2011, create an impression of a remarkable improvement in school performance which did not really occur. This would make it so much more difficult to really induce improvement in behaviour at the classroom level that is central to real advances in learning outcomes.”
o In her speech announcing the ANA 2012 results, the Minister of Basic Education makes explicit comparisons between ANA 2011 and ANA 2012 and subsequently concludes that “ANA learner performance in the Foundation Phase (Grades 1, 2 and 3) is pleasing” (Motshekga, 2012). Similarly, the Director General, using the ANA achievement levels of 2012 states that “Overall achievement is largely adequate to outstanding at the Foundation Phase level” (Soobrayan, 2012). Both of these statements are misleading and flout all of the available evidence that performance at the foundation phase (and the other phases) is anything but “pleasing” or “outstanding”, as this report explains.
o By comparing the results of ANA 2011 and ANA 2012 when they are not comparable, the Department has misrepresented the real changes in the system over this period. In doing so it has undermined its own technical credibility and that of the entire ANA process going forward.
In addition to the above major national and provincial evaluations, Fleisch (2008, p. 22) provides a summary of some smaller school improvement project evaluations. These include the Quality Learning Project (2001), the District Development Support Programme (2001), the Family Literacy Project (2000), the Early Reading Workshop, and various projects evaluated by Eric Schollar. Each of

these small-scale evaluations adds some nuance and detail to the overall picture of low and unequal performance in South Africa.
4. International comparisons of educational achievement
Trends in International Mathematics and Science Study (TIMSS; 1995, 1999, 2003, 2011; grades 8 and 9)
TIMSS is a cross-national study which tests the mathematics and science knowledge of grade 8 learners in a variety of countries. The International Association for the Evaluation of Educational Achievement (IEA) works with local educational research organizations to run TIMSS every four years, and, in addition to ensuring the quality of the TIMSS studies, also scales the results so that they are comparable across countries and over time (Mullis, Martin, Foy, & Arora, 2012). South Africa participated in 1995, 1999, 2002, and 20115. In the 2002 TIMSS South Africa tested grade 9 students in addition to grade 8 students, since earlier rounds of TIMSS indicated that the international grade 8 test was too difficult for South African students, and consequently too many students were performing at guessing level on the multiple choice questions (i.e. no better than random). This decreases the reliability and accuracy of the tests (Foy, Martin, & Mullis, 2010) and thus in 2011, only grade 9 South African students wrote the TIMSS grade 8 test.
Of all the studies reported in this paper, TIMSS provides the best opportunity to compare educational outcomes over the period 1995-2011.
Between TIMSS 1995, 1999 and 2002 there was no discernable improvement in either mathematics or science at the grade 8 level in South Africa. Although the average test scores for South Africa did change slightly over this period, none of these changes were statistically significant (i.e. one cannot rule out that they occurred by chance). However, between TIMSS 2002 and TIMSS 2011, the average performance for grade 9 students in both mathematics and science increased by 67 points and 64 points respectively. This amounts to one and a half grade levels of learning for each subject (Reddy, et al., 2012, p. 3). This is an unexpectedly large increase in performance, and provides a strong indication that learning outcomes for grade nine students in mathematics and science have improved over the 2002-2011 period. However, it must be noted that South Africa’s overall performance post-improvement is still the worst of all middle-income countries that took part in the TIMSS tests.
Figure 1 below shows the average performance of South African grade eight and grade nine students for the years that South Africa participated in TIMSS, including the error bars for the 95% confidence interval around the mean. From this graph we can see that although there was a large improvement between 2002 and 2011, South Africa still lags considerably behind the TIMSS middle-income country grade eight mean for both mathematics and science. If one uses the TIMSS benchmark of 40 points as equivalent to one grade-level of learning, the average South African grade nine student is two years worth of learning behind the average grade eight student from 21 other middle income countries in mathematics, and 2.8 years behind in science.
5 Although there was a 2007 TIMSS study, South Africa did not participate.
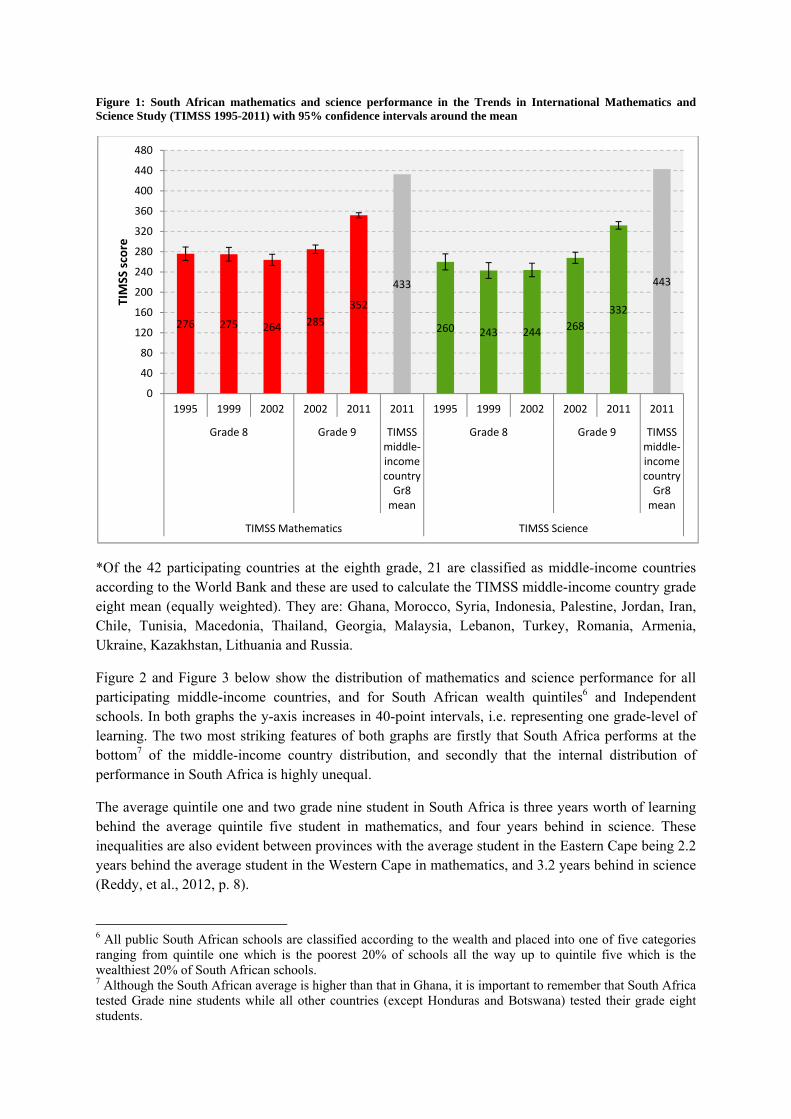
Figure 1: South African mathematics and science performance in the Trends in International Mathematics and Science Study (TIMSS 1995-2011) with 95% confidence intervals around the mean
*Of the 42 participating countries at the eighth grade, 21 are classified as middle-income countries according to the World Bank and these are used to calculate the TIMSS middle-income country grade eight mean (equally weighted). They are: Ghana, Morocco, Syria, Indonesia, Palestine, Jordan, Iran, Chile, Tunisia, Macedonia, Thailand, Georgia, Malaysia, Lebanon, Turkey, Romania, Armenia, Ukraine, Kazakhstan, Lithuania and Russia.
Figure 2 and Figure 3 below show the distribution of mathematics and science performance for all participating middle-income countries, and for South African wealth quintiles6 and Independent schools. In both graphs the y-axis increases in 40-point intervals, i.e. representing one grade-level of learning. The two most striking features of both graphs are firstly that South Africa performs at the bottom7 of the middle-income country distribution, and secondly that the internal distribution of performance in South Africa is highly unequal.
The average quintile one and two grade nine student in South Africa is three years worth of learning behind the average quintile five student in mathematics, and four years behind in science. These inequalities are also evident between provinces with the average student in the Eastern Cape being 2.2 years behind the average student in the Western Cape in mathematics, and 3.2 years behind in science (Reddy, et al., 2012, p. 8).
6 All public South African schools are classified according to the wealth and placed into one of five categories ranging from quintile one which is the poorest 20% of schools all the way up to quintile five which is the wealthiest 20% of South African schools. 7 Although the South African average is higher than that in Ghana, it is important to remember that South Africa tested Grade nine students while all other countries (except Honduras and Botswana) tested their grade eight students.
276 275 264 285
352
433
260 243 244268
332
443
0
40
80
120
160
200
240
280
320
360
400
440
480
1995 1999 2002 2002 2011 2011 1995 1999 2002 2002 2011 2011
Grade 8 Grade 9 TIMSS middle‐income country Gr8 mean
Grade 8 Grade 9 TIMSS middle‐income country Gr8 mean
TIMSS Mathematics TIMSS Science
TIMSS score

To provide some indication of the scale of within-country inequality in South Africa it is helpful to compare this to between country differences. The difference in achievement between quintile one and quintile five South African students in science is the same as the difference between Singapore (the best performing country) and Palestine (the 33rd best performing country).
Figure 2: Average grade 8 mathematics test scores for middle-income countries participating in TIMSS 2011 (+95% confidence intervals around the mean)
200
240
280
320
360
400
440
480
520
560
600
Russian Fed
eration
Lithuania
Kazakhstan
Ukraine
Arm
enia
Romania
Turkey
Lebanon
Malaysia
Geo
rgia
Thailand
Maced
onia, R
ep. of
Tunisia
Chile
Iran, Islam
ic Rep. of
Jordan
Palestinian Nat'l Auth.
Botswana (Gr9)
Indonesia
Syrian
Arab Rep
ublic
Morocco
South Africa (Gr9)
Honduras (Gr9)
Ghana
Quintile 1
Quintile 2
Quintile 3
Quintile 4
Quintile 5
Indep
enden
t
Middle‐income countries South Africa (Gr9)
TIMSS 2011 M
athematics score

Figure 3: Average grade 8 science test scores for middle-income countries participating in TIMSS 2011 (+95% confidence intervals around the mean)
Progress in International Reading and Literacy Study (PIRLS; 2006, 2011; grade 4 and 5)
The Progress in International Reading Literacy Study (PIRLS) is an international initiative aimed at testing the reading literacy of grade four and grade eight students in participating countries. There have been two waves of PIRLS, 2006 and 2011, and South Africa has only participated in the grade four tests. Unlike almost all other countries that participated in 2006, where only grade four was tested, in South Africa grade five was tested in addition to grade four so that one could compare grades four and five, and out of a concern that grade four is a transition phase (Howie, et al., 2008). In the 2006 PIRLS South African grade 5 students achieved the lowest score of the 45 countries that participated, including other middle-income countries including Morocco, Iran, Trinidad and Tobago, Indonesia, and Macedonia. In PIRLS 2006, only 13% of grade four and 22% of grade five South African learners reached the Low International Benchmark of 400. This is in stark contrast to the majority of other participating countries. In half of the participating countries, 94% of learners reached this Low International Benchmark. Trong (2010, p. 2) elucidates the practical value of this benchmark: “learners who were not able to demonstrate even the basic reading skills of the Low International Benchmark by the fourth grade were considered at serious risk of not learning how to read.” Using this framework, 87% of grade four and 78% of grade five learners in South Africa were deemed to be at serious risk of not learning to read.
In response to the incredibly weak performance of South African students in PIRLS 2006, in 2011, South Africa opted to take part in prePIRLS. In PIRLS, it is assumed that most fourth grade learners are transitioning from “learning to read” to “reading to learn”, by contrast, prePIRLS is “a less difficult assessment, intended to measure the reading comprehension skills of students who are still in the process of learning how to read” (Howie & van Staden, 2012). It was decided that only schools whose language of learning and teaching (LOLT) was English or Afrikaans from grade one would take part in PIRLS. Grade five students in these schools wrote the PIRLS 2011, which is set at an
200
240
280
320
360
400
440
480
520
560
600
Russian Fed
eration
Lithuania
Ukraine
Kazakhstan
Turkey
Iran, Islam
ic Rep. of
Romania
Chile
Thailand
Jordan
Tunisia
Arm
enia
Malaysia
Syrian
Arab Rep
ublic
Geo
rgia
Palestinian Nat'l Auth.
Maced
onia, R
ep. of
Indonesia
Lebanon
Botswana (Gr 9)
Morocco
Honduras (gr 9)
South Africa (Gr 9)
Ghana
Quintile 1
Quintile 2
Quintile 3
Quintile 4
Quintile 5
Indep
enden
t
Middle‐income countries South Africa (Gr9)
TIMSS 2011 Science score
international grade four level. prePIRLS, on the other hand, covers a nationally representative sample of grade four learners. However, because PIRLS and prePIRLS are not lcomparable, it is not possible to draw any meaningful conclusions about the reading proficiency of South African primary school children between 2006 and 2011 using this data. Although some form of comparison is possible between English and Afrikaans schools between the two assessments8, given that these schools are a very select sub-sample of South African schools, one cannot draw any legitimate inference on South African performance on the whole.
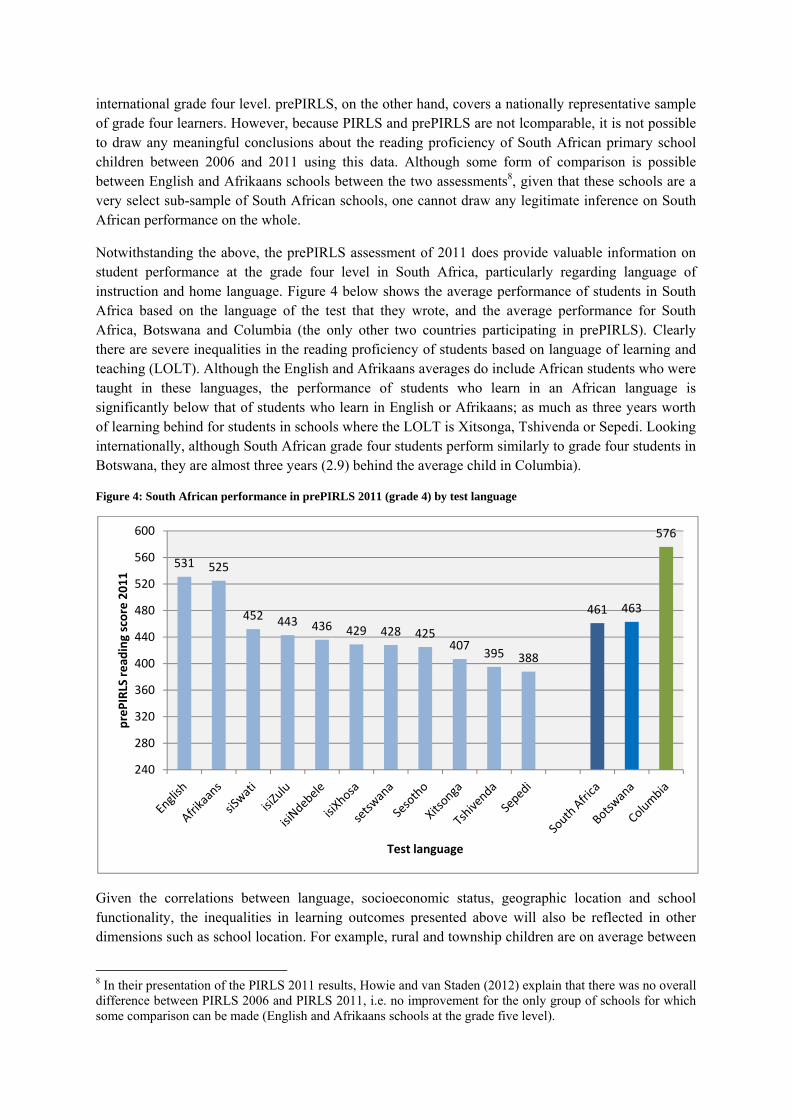
Notwithstanding the above, the prePIRLS assessment of 2011 does provide valuable information on student performance at the grade four level in South Africa, particularly regarding language of instruction and home language. Figure 4 below shows the average performance of students in South Africa based on the language of the test that they wrote, and the average performance for South Africa, Botswana and Columbia (the only other two countries participating in prePIRLS). Clearly there are severe inequalities in the reading proficiency of students based on language of learning and teaching (LOLT). Although the English and Afrikaans averages do include African students who were taught in these languages, the performance of students who learn in an African language is significantly below that of students who learn in English or Afrikaans; as much as three years worth of learning behind for students in schools where the LOLT is Xitsonga, Tshivenda or Sepedi. Looking internationally, although South African grade four students perform similarly to grade four students in Botswana, they are almost three years (2.9) behind the average child in Columbia).
Figure 4: South African performance in prePIRLS 2011 (grade 4) by test language
Given the correlations between language, socioeconomic status, geographic location and school functionality, the inequalities in learning outcomes presented above will also be reflected in other dimensions such as school location. For example, rural and township children are on average between
8 In their presentation of the PIRLS 2011 results, Howie and van Staden (2012) explain that there was no overall difference between PIRLS 2006 and PIRLS 2011, i.e. no improvement for the only group of schools for which some comparison can be made (English and Afrikaans schools at the grade five level).
531 525
452 443 436 429 428 425407
395 388
461 463
576
240
280
320
360
400
440
480
520
560
600
prePIRLS read
ing score 2011
Test language

two and two and a half years behind urban children in reading (Howie & van Staden, 2012). It is difficult to disentangle these effects and isolate a single factor as being the most important one.
Southern and East African Consortium for Monitoring Educational Quality (SACMEQ; 2000 and 2011; grade 6)
The Southern and East African Consortium for Monitoring Educational Quality (SACMEQ) study is a cross-national initiative consisting of 14 countries in southern and eastern Africa. SACMEQ tests the numeracy and literacy skills of grade 6 learners in each of the participating countries. South Africa participated in the second (2000) and third (2007) rounds of SACMEQ. Of the 14 countries that participated in SACMEQ II (2000), South Africa had the 9th highest mathematics score and the 8th highest reading score (Van der Berg, 2007) - behind lower-income countries such as Botswana, Swaziland and Kenya. In the more recent SACMEQ study (2007), of the 15 countries that participated, South Africa came 10th for reading and 8th for Mathematics, still behind poorer countries such as Kenya, Tanzania and Swaziland. More concerning than South Africa’s relative position in regional context is the national prevalence of functional illiteracy and functional innumeracy. Of the 9071 grade six learners that were tested, 27% were deemed to be functionally illiterate, while 40% were classified as functionally innumerate (Spaull, 2012). These figures differ substantially across the nine provinces. While half (49%) of all grade six learners in Limpopo are functionally illiterate, the comparable figure in the Western Cape is one in twenty (5%) (Spaull, 2011b). Similar differences can be seen based on the socioeconomic status of the school and the school’s location – urban or rural.
The most recent scholarship on SACMEQ has combined data on access to education and the quality of that education. For example, Spaull & Taylor (2012) create a composite statistic called “effective enrolment”, which is the proportion of the age appropriate population that has reached some basic threshold of numeracy and literacy proficiency. Put simply, it is enrolment that produces learning. The primary motivation behind creating the statistic was the suspicion that enrolment, and even attendance (access) did not always translate into learning (quality). As they explain:
“Many students in Africa sit through six years of formal full-time schooling yet do not acquire even the most basic numeracy and literacy skills. Such schooling is of dubious value. It does not impart foundational cognitive skills and thus it does not create the choices and freedoms that ignorance denies (Sen, 1999)...Thus, additional years of education do not necessarily increase human capital or expand the capabilities of students” (Spaull & Taylor, 2012, p. 4).
This research is especially pertinent to South Africa since it has one of the highest levels of primary school enrolment (98%) in Africa, yet one of the lowest in terms of primary school educational outcomes – particularly amongst poorer and rural students.
Table 1 below shows the effective enrolment rates for ten African countries by gender, location and wealth quintiles. Looking at South Africa one can see that only 71% of thirteen year old children are functionally literate (i.e. can read for meaning), compared to 87% in Kenya and 88% in Swaziland. More disconcerting though is the shockingly high proportion of functional illiteracy among 13 year olds in rural areas (58%) and in the poorest schools, as the authors note: “Learning deficits are far greater than access deficits in all ten countries. The most striking example of this is in South Africa where 97% of quintile one South African 12 year olds are enrolled, but only 56% of them are literate” (Spaull & Taylor, 2012, p. 15).
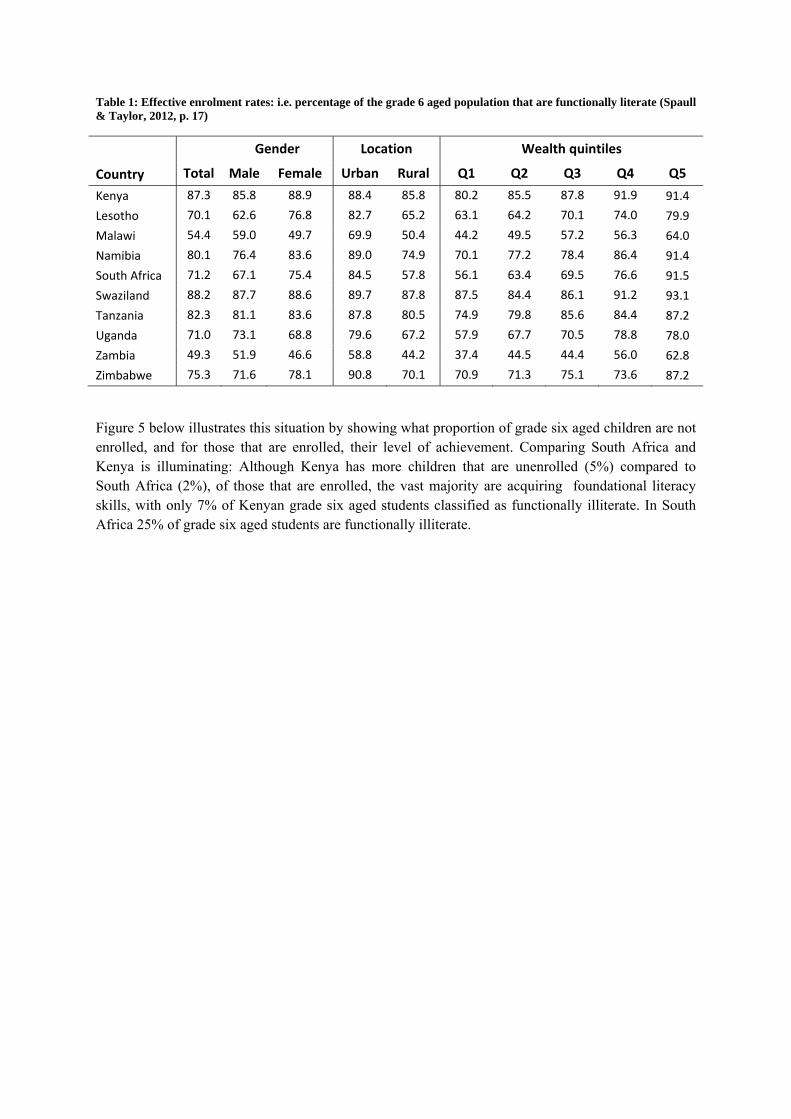
Table 1: Effective enrolment rates: i.e. percentage of the grade 6 aged population that are functionally literate (Spaull & Taylor, 2012, p. 17)
Gender Location Wealth quintiles
Country Total Male Female Urban Rural Q1 Q2 Q3 Q4 Q5
Kenya 87.3 85.8 88.9 88.4 85.8 80.2 85.5 87.8 91.9 91.4
Lesotho 70.1 62.6 76.8 82.7 65.2 63.1 64.2 70.1 74.0 79.9
Malawi 54.4 59.0 49.7 69.9 50.4 44.2 49.5 57.2 56.3 64.0
Namibia 80.1 76.4 83.6 89.0 74.9 70.1 77.2 78.4 86.4 91.4
South Africa 71.2 67.1 75.4 84.5 57.8 56.1 63.4 69.5 76.6 91.5
Swaziland 88.2 87.7 88.6 89.7 87.8 87.5 84.4 86.1 91.2 93.1
Tanzania 82.3 81.1 83.6 87.8 80.5 74.9 79.8 85.6 84.4 87.2
Uganda 71.0 73.1 68.8 79.6 67.2 57.9 67.7 70.5 78.8 78.0
Zambia 49.3 51.9 46.6 58.8 44.2 37.4 44.5 44.4 56.0 62.8
Zimbabwe 75.3 71.6 78.1 90.8 70.1 70.9 71.3 75.1 73.6 87.2
Figure 5 below illustrates this situation by showing what proportion of grade six aged children are not enrolled, and for those that are enrolled, their level of achievement. Comparing South Africa and Kenya is illuminating: Although Kenya has more children that are unenrolled (5%) compared to South Africa (2%), of those that are enrolled, the vast majority are acquiring foundational literacy skills, with only 7% of Kenyan grade six aged students classified as functionally illiterate. In South Africa 25% of grade six aged students are functionally illiterate.

Figure 5: Combining educational access and educational quality using SACMEQ III (2007, grade 6)
Source: Spaull & Taylor (2012: 18). SACMEQ III data is used for educational achievement and World Bank data for attendance rate (Filmer, 2010).
2%
25%
46%
27%
South Africa
5%7%
49%
39%
Kenya
7%
12%
60%
21%
Namibia
8%
17%
50%
25%
Zimbabwe
10%1%
55%
34%
Swaziland
11%
18%
58%
13%
Uganda
11%
19%
62%
8%
Lesotho
12%
39%43%
6%
Zambia
14%
31%53%
2%
Malawi
15% 2%
30%53%
Tanzania
16
5. Teacher content knowledge Teachers are, and have always been, the primary locus of schooling systems around the world. Being the single most important element of the education system, the quality of a country’s teachers is intimately related with the quality of its education system. While this is accepted at face value by most societies, there is also considerable research to support this claim. For example, a report by the OECD (2005, p. 2) concludes that, second only to student background factors (which are largely beyond the control of education policy), “factors to do with teachers and teaching are the most important influences on student learning. In particular, the broad consensus is that ’teacher quality’ is the single most important school variable influencing student achievement.” Similarly, a popular McKinsey & Company study finds that “The available evidence suggests that the main driver of the variation in student learning at school is the quality of the teachers” (Barber & Mourshed, 2007, p. 12), and thus that “the quality of an education system cannot exceed the quality of its teachers” (p. 41).
Defining teacher quality is a prickly endeavour, with any single definition bound to disappoint at least one group of people. For the purposes of this discussion a quality teacher is someone who possesses the following four attributes (in no particular order):
i. some requisite level of professionalism (values), ii. the inclination to teach (attitudes and desires),
iii. the ability to teach (knowledge, skills and pedagogy), and therefore, iv. the competence to teach (imparting and instilling the knowledge, skills and values students
should be acquiring at school).
Clearly someone must possess attributes one to three if they are to be a competent teacher. The importance and relative weighting of attributes one to three are open to interpretation. Given that this is an empirical enquiry into the quality of teaching, and that we do not have nationally representative data on the attitudes, desires and values of South African teachers, the focus here will be on teachers’ content knowledge. Fortunately South African Grade 6 teachers participated in the teacher testing component of SACMEQ III (2007) which tested reading and mathematics content knowledge of reading and mathematics teachers respectively. The sample is large (498 maths teachers and 498 reading teachers) and nationally representative at the Grade 6 level.
International literature and previous South African studies
Teacher content knowledge is a necessary but not sufficient condition for student learning. Simply because they can calculate the sum of two fractions does not imply that they will be able to impart this understanding to others. However, if they cannot calculate the sum of two fractions, one can be sure that they also cannot teach this yet-to-be-acquired skill to his students. Put simply, teachers cannot teach what they do not know.
This distinction between content knowledge and pedagogy has been explored extensively in the literature, starting with Shulman’s (1986) seminal paper introducing pedagogical content knowledge, and extending to the more recent discussions of “content knowledge for teaching” (Ball, Thames, & Phelps, 2008), both of which combine elements of content knowledge and pedagogy in interesting and important ways. However, most studies assume that teachers already have the basic content knowledge which they are expected to teach, and thus the real question is whether they can convey that knowledge to their students or how much more they need to know. For example, in Ball et al’s (2008, p. 4) discussion of mathematical-content-knowledge-for-teaching they explain that:

17
“By this phrase [mathematical content knowledge for teaching], we mean the mathematical knowledge that teachers need to carry out their work as teachers of mathematics. Obviously, teachers need to know the content they teach and that students are expected to master. Our question is whether they need to know more, and if so, what they need to know and in what ways they need to know this mathematics to use it in their teaching?” (emphasis added).
The extant literature on the content knowledge of South African teachers reveals that many have not mastered the curricula they are expected to teach (see Taylor & Moyane, 2004; and Fleisch, 2008, p. 123 for examples). Taylor & Vinjevold’s (1999, p. 230) conclusion in their book “Getting Learning Right” is particularly explicit:
“The most definite point of convergence across the [President’s Education Initiative] studies is the conclusion that teachers’ poor conceptual knowledge of the subjects they are teaching is a fundamental constraint on the quality of teaching and learning activities, and consequently on the quality of learning outcomes.”
To date, all studies looking at teacher content knowledge in South Africa have been small, isolated project-based inquiries into teacher content knowledge in a particular region. While these are highly instructive and together provide a clear indication that teacher content knowledge is seriously lacking (at least in certain parts of the school system), they are not nationally representative. The only exception to this appears to be the SACMEQ III study conducted in 2007. The SACMEQ III study in South Africa was a nationally representative survey which included 392 primary schools, as well as 498 grade six reading teachers and 498 grade six mathematics teachers. Not all teachers wrote the tests, and in the end we only have maths-teacher scores for 401 grade six maths teachers and reading-teacher scores for 415 grade six reading teachers.
Grade six mathematics teacher mathematics content knowledge in South Africa
The focus for the remainder of this section will be on grade six mathematics teacher content knowledge. This is primarily because preliminary analyses show that most South African grade six mathematics teachers do not possess desirable levels of mathematics content knowledge. Hungi et al (2011, p. 13) report that only 32% of South African Grade six mathematics teachers have desirable levels of mathematics content knowledge, with the SACMEQ average of 14 African countries being 42%. By contrast, 60% of South African grade six reading teachers have desirable levels of reading content knowledge, with the SACMEQ average being 58%. For a full discussion of both reading and mathematics teacher content knowledge in South Africa see Mckay & Spaull (2013).
The SACMEQ III mathematics teacher test consisted of 42 multiple choice questions, 16 of which were common items drawn from the SACMEQ III grade six student mathematics test. Using Rasch analysis. SACMEQ created a teacher test score on the same scale as the student test score such that direct comparisons can be made between student and teacher content knowledge (Ross, et al., 2005, p. 257). The difficulty levels of each item are reflected in the Rasch scores, which are used to calculate an overall score. Before turning to the overall mathematics-teacher scores, it is useful to calculate the proportion of test questions which the teachers answered correctly, irrespective of their difficulty level.
Table 2 below shows that the median South African teacher answered 60% of the 42 questions correctly. This figure hides the large inequalities between quintile one teachers (52% correct) and quintile five teachers (79% correct) as well as between urban (64% correct) and rural (55% correct) teachers. If one only looks at the 16 items that are common to the teacher and student tests, i.e. those

18
items that are set at the grade six level, a similar pattern of inequality is evident. Quintile one grade six mathematics teachers could only answer nine of the 16 items that were included in the grade 6 student test (56% correct), while quintile five grade six mathematics teachers could answer 13 of these 16 items (81%).
Table 2: Number of correct items on the SACMEQ III (2007) mathematics-teacher test for South Africa (McKay and Spaull, 2013)
Median number of items correct
on Grade 6 maths-teacher
test (max 42)
Median percentage
correct for full Grade 6 maths-teacher test (42
items)
Median number of items correct
on Grade 6 maths-teacher
test but only for 16 items
common with student test (max 16)
% correct for common-items
of Grade 6 maths-teacher test (16 items)
Number of Grade 6 maths teachers in the
SACMEQ sample who
wrote the maths test
Quintile 1 22 52% 9 56% 75 Quintile 2 24 57% 10 63% 78 Quintile 3 23 55% 10 63% 80 Quintile 4 26 62% 12 75% 79 Quintile 5 33 79% 13 81% 89 Urban 27 64% 12 75% 234 Rural 23 55% 9 56% 167
South Africa 25 60% 11 69% 401
To provide a practical example, question nine of the mathematics teacher test (which is the same as question 48 of the student test) asked the following question:
Question 9) If the height of a fence is raised from 60cm to 75cm, what is the percentage increase in height?
a) 15 percent, b) 20 percent, c) 25 percent and d) 30 percent.
This problem is an application of percentage calculations. The Revised National Curriculum Statement (RNCS) for grade six (the prevailing curriculum at the time of testing - 2007) specified that a grade six student is performing at the appropriate grade six level when he/she “estimates and calculates by selecting and using operations appropriate to solving problems that include...finding percentages of whole numbers” (DoE, Revised National Curriculum Statement Grades R-9 (Schools) Mathematics, 2002, p. 43). Notwithstanding the fact that this question is within the expectations of the grade six curriculum, only 23% of South African grade six mathematics teachers could answer this question – with the proportion answering correctly ranging from 13% for quintile one teachers to 46% for quintile five teachers. Most teachers chose the distracter option “a” (15 percent), simply subtracting 75cm from 60cm. Given this poor teacher content knowledge of percentage calculations, it is unsurprising that only 16% of South African grade six students could answer this question correctly. One need not belabour this point, except to reiterate that teachers cannot teach what they do

19
not know, or put differently, students cannot acquire a skill at school that their teachers do not possess.
South Africa in regional context
Another way of assessing the levels of mathematics content knowledge of South African teachers is to compare them to grade six teachers from other African countries. Figure 6 shows the mean maths-teacher mathematics score for each of the 14 SACMEQ education systems. In addition to the mean, the upper and lower limits of the 95% confidence interval are also shown. In layman’s terms, the 95% confidence interval around the mean provides an indication of the uncertainty that is introduced because this is a sample, rather than the population. We can be 95% certain that the true population estimate of maths-teacher content knowledge lies within the 95% confidence interval. Put differently, if we drew 100 different SACMEQ samples of a similar size, the sample mean from 95 of the 100 samples would lie within our confidence interval. Importantly, if the confidence intervals between two countries do not overlap, we can say that the mean scores of the two countries are statistically significantly different from each other.
Although the average South African grade six mathematics teacher has a similar level of mathematics content knowledge as grade six mathematics teachers in Malawi and Namibia (Figure 6 below), this indication of performance is deceptive. South African averages are uniquely misleading, and usually shroud large intra-national inequalities. If we instead split the South African sample into quintiles of school wealth (at the right of the graph) one can see that quintiles one, two and three perform 148 points below quintile five teachers. To put this in perspective, this difference amounts to 1.5 standard deviations of student mathematics scores which is roughly equivalent to three years worth of student learning.
Quintile five maths teachers in South Africa perform at the average level of teachers from the best performing countries in the sample, Kenya and Zimbabwe, while quintiles one, two and three maths teachers in South Africa perform at the average level of the worst performing countries in the sample, Lesotho, Zambia and Mozambique (Figure 6 below). Furthermore, the grade six mathematics teachers in the poorest 60% of South Africa’s schools have statistically significantly less mathematics content knowledge than the average grade six teachers in Swaziland, Tanzania and Uganda. And this, despite the fact that the average school in the poorest 60% of South African schools is considerably wealthier than the average school in Swaziland, Tanzania or Uganda, as measured by asset wealth of the student constituency (see Hungi, et al., 2010, p. 10 for box-plots of student socioeconomic status across countries).

20
Figure 6: SACMEQ III (2007) Mathematics-teacher mathematics test scores for SACMEQ countries and South African quintiles of school wealth (95% confidence interval included)
Source: McKay & Spaull, (2013)
As one might expect, the socioeconomic inequalities in South Africa are also reflected in school location (Figure 7 and Table 3 below). Grade six maths teachers in rural South African schools have similar levels of content knowledge to grade six teachers in rural schools in Zambia, Lesotho and Mozambique. Grade six mathematics teachers in urban schools have similar levels of mathematics content knowledge as grade six mathematics teachers in urban schools in Swaziland, Tanzania and Seychelles, although statistically significantly less knowledge than maths teachers in Kenya. It is also worth noting that South Africa is the only country where urban teachers have statistically significantly higher levels of mathematics content knowledge than rural teachers. In all other countries the differences are not statistically significant.
ZAN
LES ZAMMOZMAL SOU
NAMBOT
SWASEY TAN UGA
ZIM
KEN
Q1‐SOUQ2‐SOUQ3‐SOU
Q4‐SOU
Q5‐SOU
600
650
700
750
800
850
900
950
Maths‐teacher mathematics score
Mean Lower bound confidence interval (95%) Upper bound confidence interval (95%)

21
Figure 7: SACMEQ III (2007) Mathematics-teacher test score for SACMEQ countries by school location (urban and rural) including 95% confidence interval
Source: McKay & Spaull, (2013)
One of the most striking features of the inequality in South Africa is that the best performing grade 6 students know more than some grade six teachers, albeit not their own teachers. In SACMEQ III (2007), the top 5% of grade six students in South Africa (565 students) scored higher marks on the same mathematics test than the bottom 20% of grade six mathematics teachers in the sample (80 teachers). Notwithstanding the above, 71% of these 80 teachers reported that they had attended at least one short in-service training course in the last three years, with the median number of courses for these 80 teachers being two courses. Of those 80 who did attend a course, 75% reported they were “effective” or “very effective.” Thus, the focus should rather be the actual, rather than the perceived, effectiveness of these courses.
In addition to not being able to teach what they do not know, there is a strong case to be made that teachers who lack an elementary understanding of the subjects they teach can actually do harm to their students. A lack of basic content knowledge amongst teachers, particularly those in rural areas and poorer schools, is a problem which should be urgently addressed. Those teachers who lack sufficient conceptual understanding of their subject are more likely to employ inappropriately concrete techniques when teaching and use methods that undermine the long-term learning trajectories of students. Notwithstanding the above, the available evidence suggests that the underperforming teachers in South Africa (which make up the majority), are unaware of their own learning deficits and do not understand the full demands of the curriculum. Consequently, they overestimate how well their children are performing relative to the curriculum and also their own proficiency as teachers. For example, a 2010 study of 45 primary schools in the Western Cape found that the average grade three teacher felt that at the beginning of the year only 55% of their students were performing at the appropriate level for numeracy, but by the end of the year (after they had taught the students), they thought that 84% were now performing at the appropriate level. Yet, in
ZAN
SOULES ZAM MOZ
MAL NAM BOT
SWATAN SEY UGA
ZIM
KEN
600
650
700
750
800
850
900
950
1000
Maths‐teacher mathematics score
Rural lower bound confidence interval (95%) Rural upper bound confidence interval (95%)
Urban lower bound confidence interval (95%) Urban upper bound confidence interval (95%)

22
reality, only 22% of their students were actually achieving at the appropriate level relative to the curriculum, as measured by the Western Cape Systemic Evaluations (WCED, 2010, p. 10).
In the recent TIMSS 2011 study, 89% of South African grade nine teachers felt “very confident” in teaching mathematics9, in stark contrast to teachers in Finland (69% very confident), Singapore (59% very confident) and Japan (36% very confident), the best performing countries (Mullis, Martin, Foy, & Arora, 2012, p. 314). This is particularly at odds with Grade 9 student performance, where 32% of South African students perform worse than random guessing on the multiple choice questions. While it must be acknowledged that the confidence levels of teachers in most developing countries were higher than those in developed countries, the point remains that South African teachers overestimate their ability to impart the curriculum. This has important ramifications when considering the demand for teacher training, since teachers who believe that they possess adequate content knowledge or are sufficiently adept at teaching are far less likely to seek out professional development opportunities.
9 The “very confident” average category corresponds to a teacher being “very confident” in using three of the following five instructional strategies: 1) answer students’ questions about mathematics, 2) show students a variety of problem solving strategies, 3) provide challenging tasks for capable students, 4) adapt my teaching to engage students’ interest, 5) help students appreciate the value of learning mathematics. The possible responses were: very confident, somewhat confident, not confident. For further discussion see (Mullis, Martin, Foy, & Arora, 2012, p. 315).

23
Table 3: SACMEQ III (2007) grade six mathematics teacher mathematics test scores
Grade 6 mathematics teachers (SACMEQ III, 2007) National Rural Urban
Country
Number of Grade
6 teachers
in sample
Mean maths score
(student)
Maths score
standard deviation (student)
Maths score
standard deviation (teacher)
Mean maths‐teacher maths score
Linearized std error (maths teacher score)
Lower bound of 95%
confidence interval
Upper bound of 95%
confidence interval
Mean Linearized std error (maths)
Mean Linearized std error (maths)
Botswana 343 521 80 81 780 5.3 769 790 776 7.4 784 7.8
Kenya 268 557 86 97 906 8.4 889 922 901 9.0 916 16.9
Lesotho 220 477 67 69 739 6.0 727 750 739 6.7 738 12.1
Malawi 155 447 63 95 762 8.4 746 779 765 9.2 754 20.2
Mozambique 373 484 71 81 745 5.9 734 757 748 9.7 744 7.5
Namibia 309 471 75 91 771 6.1 759 783 766 7.4 778 10.3
Seychelles 48 551 97 65 824 9.1 806 842 843 15.1 816 11.2
South Africa 498 495 98 109 766 6.3 753 778 730 7.5 805 9.6
Swaziland 180 541 61 92 811 7.3 797 826 811 8.4 812 14.7
Tanzania 228 553 84 78 825 5.8 814 837 823 7.5 831 8.8
Uganda 272 482 75 101 832 7.2 818 847 830 8.4 837 13.9
Zambia 265 435 68 89 739 6.8 725 752 745 9.1 726 9.5
Zanzibar 251 486 64 69 685 5.5 674 695 682 7.0 689 8.6
Zimbabwe 274 520 98 97 852 7.5 837 867 860 9.5 834 12.0
Source: McKay & Spaull, (2013)

24
6. Matric performance: retention and subject-choice
The school-leaving (matriculation) exam is one of the most characteristic features of the South African education system. It would be rare to find a single South African citizen who did not know what the matric exam is, or be able to explain why people think it is important. The annual publication of individual-level matric results in South African newspapers further adds to the public awareness and concern around matric performance. Chief among the statistics reported is the matric pass rate; the proportion of grade 12 students that pass the matric exam. While many critics have pointed out that the matric pass requirements are sub-standard and encourage mediocrity (Jansen, 2012), arguably the more serious problem is widespread dropout pre-matric, and that over time more students seem to be choosing less demanding matric subjects.
The focus of this section will be on the trends in retention to matric, and on changes in the proportion of students taking and passing mathematics in the last four years. The analysis in this section draws heavily from the work of Stephen Taylor (2012), an expert on matric trend. All graphs and tables are drawn from his work or based on his figures.
Retention to matric
Given that the calculation of the matric pass rate does not take into account any information about enrolment or drop-out pre-matric, it is particularly open to abuse and manipulation. Furthermore, since a matric pass can be achieved with a variety of different subject combinations (some easier than others), it is also possible to increase the pass rate by encouraging students to select easier subjects. Commenting on the 1999-2003 period, Nick Taylor (2011) explains that this is exactly what happened:
“Because the pass rate is a ratio consisting of two numbers—numbers of passes as a fraction of numbers of candidates—it can be improved by changing either or both these quantities. In the period 1999 to 2003 the one that was changed was the number of candidates: fewer children were given the opportunity to write matric whereas the number of passes stayed about the same. The result was that the pass rate went up and the government claimed victory... Ironically, although the 1999 to 2003 period received public approval for its increased pass rate, this was a period of declining quality that was achieved in two ways: encouraging candidates to register at the easier standard-grade level and lowering standards by making the examination papers easier, focusing largely on cognitive skills of an elementary nature at the expense of the higher-order processes of analysis and interpretation. In short, improved efficiency can be achieved by restricting opportunity or by compromising quality, or both, and this is what happened at the time.”
A closer inspection of school administrative data shows that there is very little dropout between grades one and ten, but large dropout between grades ten and twelve. For example, using administrative data on grade two10 enrolments from 2000, 2001 and 2002, and comparing this to administrative data on grade ten enrolments ten years later (2009, 2010 and 2011) shows that there were, on average, 1086424 students enrolled in grade two (2000, 2001 and 2002), and 1069616 students enrolled in grade ten 10 years later (2009, 2010, 2011) showing very little dropout over the
10 Grade two enrolments are a better indication of the true cohort size since there is often a lot of early entry and repetition in grade one, leading to an over-estimation of the cohort size if one uses grade one.
25
first ten grades. While crude comparisons such as these do not take into account changing grade repetition patterns, they are still useful when considering pre-matric enrolments.
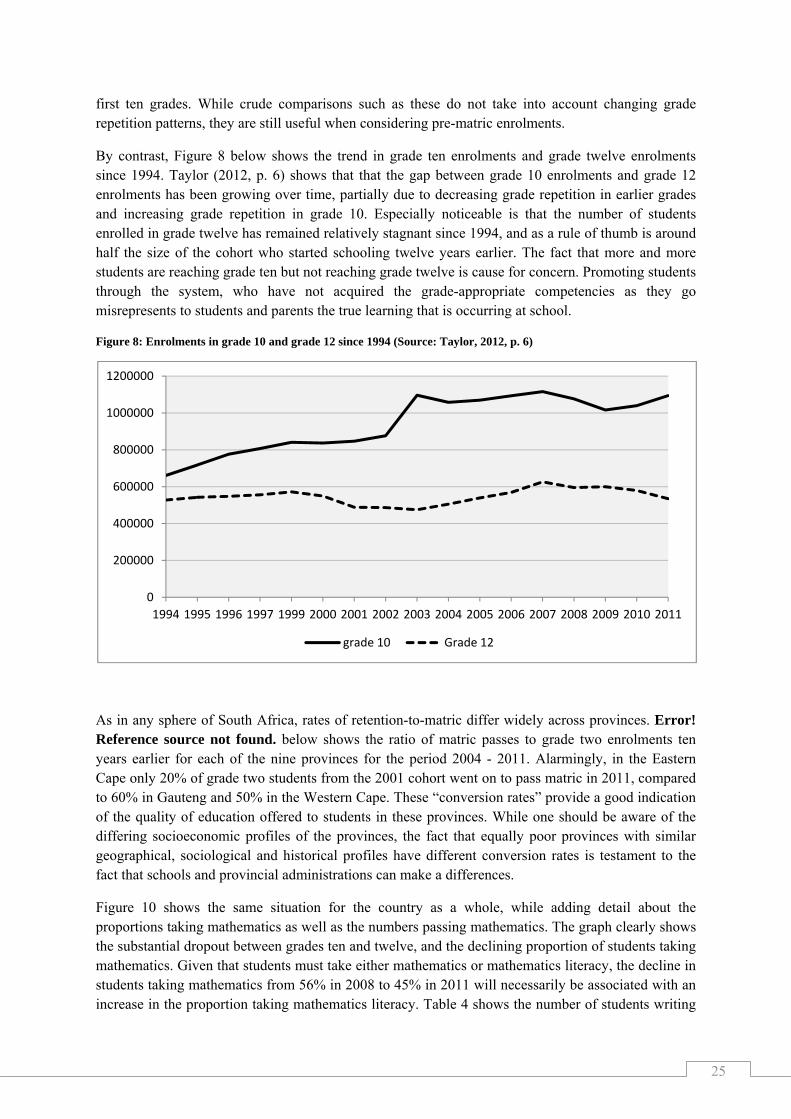
By contrast, Figure 8 below shows the trend in grade ten enrolments and grade twelve enrolments since 1994. Taylor (2012, p. 6) shows that that the gap between grade 10 enrolments and grade 12 enrolments has been growing over time, partially due to decreasing grade repetition in earlier grades and increasing grade repetition in grade 10. Especially noticeable is that the number of students enrolled in grade twelve has remained relatively stagnant since 1994, and as a rule of thumb is around half the size of the cohort who started schooling twelve years earlier. The fact that more and more students are reaching grade ten but not reaching grade twelve is cause for concern. Promoting students through the system, who have not acquired the grade-appropriate competencies as they go misrepresents to students and parents the true learning that is occurring at school.
Figure 8: Enrolments in grade 10 and grade 12 since 1994 (Source: Taylor, 2012, p. 6)
As in any sphere of South Africa, rates of retention-to-matric differ widely across provinces. Error! Reference source not found. below shows the ratio of matric passes to grade two enrolments ten years earlier for each of the nine provinces for the period 2004 - 2011. Alarmingly, in the Eastern Cape only 20% of grade two students from the 2001 cohort went on to pass matric in 2011, compared to 60% in Gauteng and 50% in the Western Cape. These “conversion rates” provide a good indication of the quality of education offered to students in these provinces. While one should be aware of the differing socioeconomic profiles of the provinces, the fact that equally poor provinces with similar geographical, sociological and historical profiles have different conversion rates is testament to the fact that schools and provincial administrations can make a differences.
Figure 10 shows the same situation for the country as a whole, while adding detail about the proportions taking mathematics as well as the numbers passing mathematics. The graph clearly shows the substantial dropout between grades ten and twelve, and the declining proportion of students taking mathematics. Given that students must take either mathematics or mathematics literacy, the decline in students taking mathematics from 56% in 2008 to 45% in 2011 will necessarily be associated with an increase in the proportion taking mathematics literacy. Table 4 shows the number of students writing
0
200000
400000
600000
800000
1000000
1200000
1994 1995 1996 1997 1999 2000 2001 2002 2003 2004 2005 2006 2007 2008 2009 2010 2011
grade 10 Grade 12

26
and passing mathematics since 2008, as well as the proportion of the matric cohort that takes mathematics and the proportion of the cohort that passes mathematics. Given that declining numbers of students are taking mathematics, it is unsurprising that the absolute number of students passing matric mathematics has declined from 136503 in 2008 to 104033 in 2011.
Figure 9: The ratio of grade 2 enrolments ten years prior to matric to matric passes by province (Source: Taylor, 2012, p.9)
Figure 10: Retention to matric, matric passes and mathematics participation and performance (Data sourced from Taylor, 2012)
0%
10%
20%
30%
40%
50%
60%
0
200000
400000
600000
800000
1000000
1200000
Matric 2008 (Gr 10 2006)
Matric 2009 (Gr 10 2007)
Matric 2010 (Gr 10 2008)
Matric 2011 (Gr 10 2009)
Proportion of matrics (%)
Number of students
Grade 10 (2 years earlier) Grade 12
Those who pass matric Pass matric with maths
Proportion of matrics taking mathematics

27
Table 4: Mathematics outputs since 2008 (Source: Taylor, 2012, p. 4)
Numbers wrote maths
Numbers passed maths
Maths pass rate Proportion
taking maths Proportion
passing maths
2008 298821 136503 45.7% 56.1% 25.6%
2009 290407 133505 46.0% 52.6% 24.2% 2010 263034 124749 47.4% 48.8% 23.2% 2011 224635 104033 46.3% 45.3% 21.0%
7. Inequality of educational opportunity
Any discussion of South African education would be patently incomplete without some reference to the high levels of inequality that plague the country and permeate every element of the schooling system. This is nowhere more noticeable than in educational outcomes, ranging from a very few schools which perform at internationally-comparable levels of achievement, all the way down to a majority of schools which cannot impart even the most basic numeracy and literacy skills to their students.
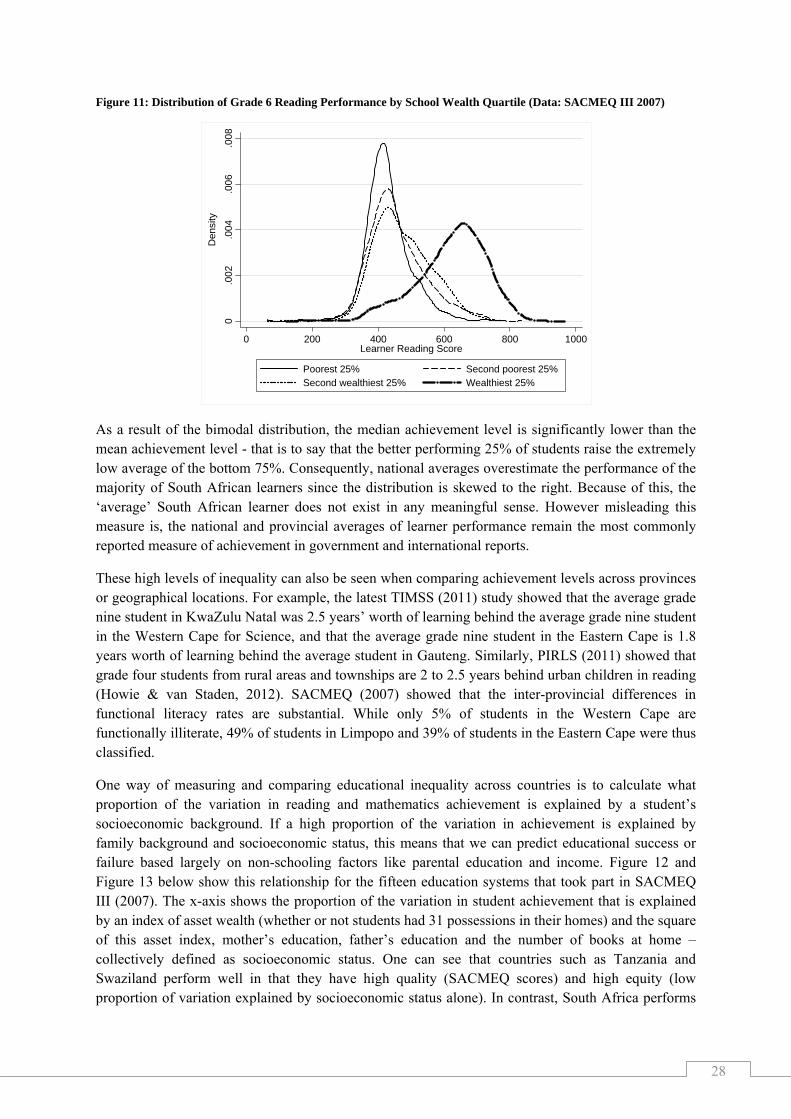
It is now commonly accepted that when looking at learner performance in South Africa there is a minority of learners (roughly 25%) who attend mostly functional schools and perform acceptably on local and international tests while the majority of learners (roughly 75%) perform extremely poorly on these tests (Van der Berg, 2007; Fleisch, 2008; Spaull, 2012). Thus, there is a bimodal distribution of achievement in the country. This bimodality can be seen when splitting the sample by wealth quartiles (Spaull, 2012 – see Figure 11 below), school language (Shepherd, 2011), and former-department (Taylor S., 2011). This is unsurprising, given the strong correlations between language, socioeconomic status, and school currently attended. The TIMSS 2011 study discussed earlier in this report places these socioeconomic inequalities in perspective, where the average quintile one and two grade nine student in South Africa was three years worth of learning behind the average quintile five grade nine student in mathematics, and four years worth of learning behind in science.
Importantly, the bimodality of South African student performance is not a product of data-mining but rather a feature of every nationally representative dataset that exists for South Africa. It is impervious to the grade or subject under assessment or the dataset under analysis. It can be seen as early as Grade 3 (Taylor, 2011a), and remains unabated until the national school leaving exam (Van der Berg, 2007).
28
Figure 11: Distribution of Grade 6 Reading Performance by School Wealth Quartile (Data: SACMEQ III 2007)
As a result of the bimodal distribution, the median achievement level is significantly lower than the mean achievement level - that is to say that the better performing 25% of students raise the extremely low average of the bottom 75%. Consequently, national averages overestimate the performance of the majority of South African learners since the distribution is skewed to the right. Because of this, the ‘average’ South African learner does not exist in any meaningful sense. However misleading this measure is, the national and provincial averages of learner performance remain the most commonly reported measure of achievement in government and international reports.
These high levels of inequality can also be seen when comparing achievement levels across provinces or geographical locations. For example, the latest TIMSS (2011) study showed that the average grade nine student in KwaZulu Natal was 2.5 years’ worth of learning behind the average grade nine student in the Western Cape for Science, and that the average grade nine student in the Eastern Cape is 1.8 years worth of learning behind the average student in Gauteng. Similarly, PIRLS (2011) showed that grade four students from rural areas and townships are 2 to 2.5 years behind urban children in reading (Howie & van Staden, 2012). SACMEQ (2007) showed that the inter-provincial differences in functional literacy rates are substantial. While only 5% of students in the Western Cape are functionally illiterate, 49% of students in Limpopo and 39% of students in the Eastern Cape were thus classified.
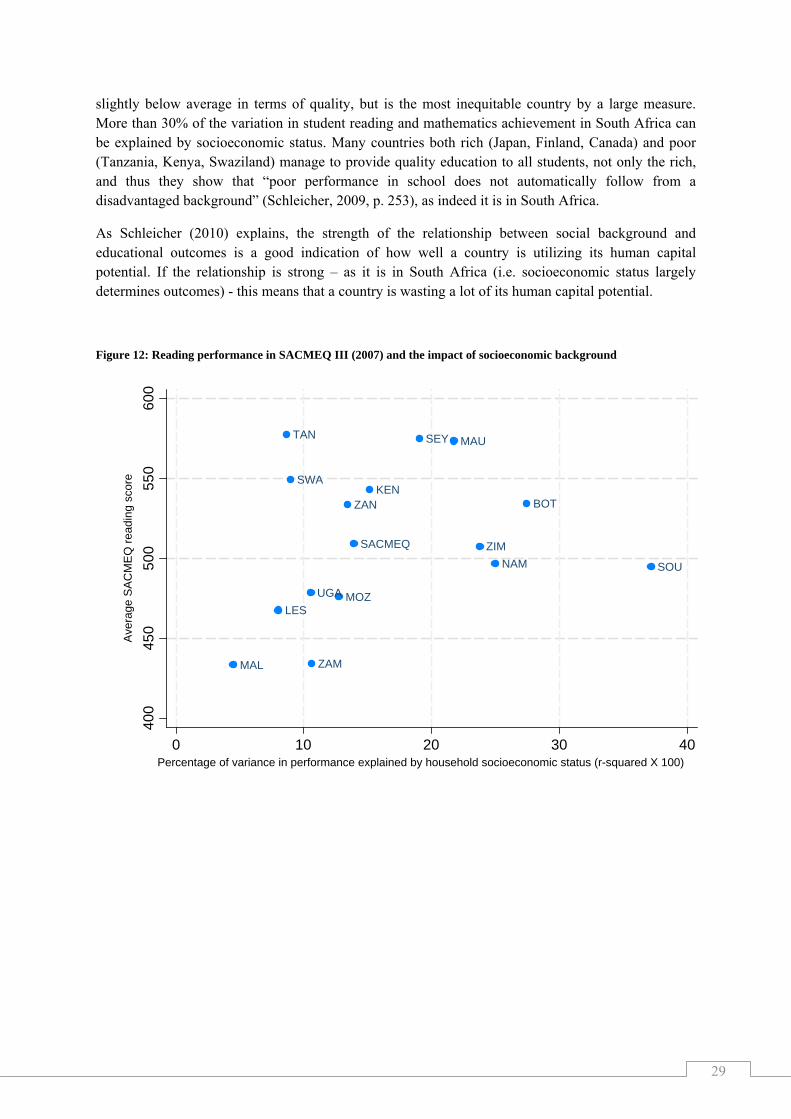
One way of measuring and comparing educational inequality across countries is to calculate what proportion of the variation in reading and mathematics achievement is explained by a student’s socioeconomic background. If a high proportion of the variation in achievement is explained by family background and socioeconomic status, this means that we can predict educational success or failure based largely on non-schooling factors like parental education and income. Figure 12 and Figure 13 below show this relationship for the fifteen education systems that took part in SACMEQ III (2007). The x-axis shows the proportion of the variation in student achievement that is explained by an index of asset wealth (whether or not students had 31 possessions in their homes) and the square of this asset index, mother’s education, father’s education and the number of books at home – collectively defined as socioeconomic status. One can see that countries such as Tanzania and Swaziland perform well in that they have high quality (SACMEQ scores) and high equity (low proportion of variation explained by socioeconomic status alone). In contrast, South Africa performs
0.0
02.0
04.0
06.0
08
Den
sity
0 200 400 600 800 1000Learner Reading Score
Poorest 25% Second poorest 25%Second wealthiest 25% Wealthiest 25%
29
slightly below average in terms of quality, but is the most inequitable country by a large measure. More than 30% of the variation in student reading and mathematics achievement in South Africa can be explained by socioeconomic status. Many countries both rich (Japan, Finland, Canada) and poor (Tanzania, Kenya, Swaziland) manage to provide quality education to all students, not only the rich, and thus they show that “poor performance in school does not automatically follow from a disadvantaged background” (Schleicher, 2009, p. 253), as indeed it is in South Africa.
As Schleicher (2010) explains, the strength of the relationship between social background and educational outcomes is a good indication of how well a country is utilizing its human capital potential. If the relationship is strong – as it is in South Africa (i.e. socioeconomic status largely determines outcomes) - this means that a country is wasting a lot of its human capital potential.
Figure 12: Reading performance in SACMEQ III (2007) and the impact of socioeconomic background
BOTKEN
LES
MAL
MAU
MOZ
NAM
SEY
SOU
SWA
TAN
UGA
ZAM
ZAN
ZIMSACMEQ
400
450
500
550
600
Ave
rage
SA
CM
EQ
rea
ding
sco
re
0 10 20 30 40Percentage of variance in performance explained by household socioeconomic status (r-squared X 100)

30
Figure 13: Mathematics performance in SACMEQ III (2007) and the impact of socioeconomic background
BOT
KEN
LES
MAL
MAU
MOZ
NAM
SEY
SOU
SWA
TAN
UGA
ZAM
ZAN
ZIM
SACMEQ
45
05
00
55
06
00
65
0
Ave
rage
SA
CM
EQ
mat
hem
atic
s sc
ore
0 10 20 30Percentage of variance in performance explained by household socioeconomic status (r-squared X 100)

31
8. Insurmountable learning deficits One of the characteristic features of the South African education system is its almost single-minded focus on the school-leaving matriculation exam (grade 12). There are a variety of reasons for this but the most important one is that it is the only nationally standardised, externally set, and independently moderated exam in the school system. As a result the matric exam is seen as a relatively trustworthy indication of actual achievement, and until recently, was used as the sole criterion for university entrance. Every year there is widespread debate about the quality of education in South Africa with the matric results usually taking centre stage. In response to the public’s emphasis on matric results, the Department of Basic Education as well as many NGO’s usually channel additional resources towards interventions at secondary school level, and specifically those that focus on matric outcomes. However, this focus on grade 12 and the few years preceding matric is especially short-sighted.
All of the available evidence suggests that many South African children are acquiring debilitating learning deficits early on in their schooling careers and that this is the root cause of underperformance in later years. Because they do not master the elementary numeracy and literacy skills in the foundation and intermediate phases, they are precluded from further learning and engaging fully with the grade-appropriate curriculum. Lewin (2007, p. 23) refers to these children as “silently excluded” since their achievement is so low that they cannot follow the curriculum. Taylor et al. (2003, p. 129) concur:
“At the end of the foundation phase, learners have only a rudimentary grasp of the principles of reading and writing... it is very hard for learners to make up this cumulative deficit in later years...particularly in those subjects that... [have] vertical demarcation requirements (especially mathematics and science), the sequence, pacing, progression and coverage requirements of the high school curriculum make it virtually impossible for learners who have been disadvantaged by their early schooling to ‘catch-up’ later sufficiently to do themselves justice at the high school exit level.”
The SACMEQ III survey, which was conducted in 2007, showed that 40% of grade six South African students were “non-numerate” since they had not moved beyond the mechanical skills related to basic calculation and simple shape recognition (Shabalala, 2005, p. 225; Spaull, 2011b, p. 40). These students could not translate graphical information into fractions or interpret simple common everday units of measurement (Hungi, et al., 2010). Given this state of affairs, it is unsurprising that three grades later, 76% of South African grade nine students did not reach the low international benchmark in TIMSS 2011. These students could not do basic computations or match tables to bar graphs or read a simple line graph. They had not acquired a basic understanding about whole numbers, decimals, operations or basic graphs (Mullis, Martin, Foy, & Arora, 2012, p. 121).
The results for literacy, while not as bad, are still dire. SACMEQ III (2007) showed that 27% of grade six students were functionally illiterate since they could not go beyond decoding text and matching words to pictures, i.e. they could not interpret meaning in a short and simple text (Shabalala, 2005, p. 222). It is important to remember that these are national averages which shroud significant regional and socioeconomic inequalities, as has been discussed earlier.
Two recent initiatives of the Department of Basic Education indicate that the national Department is beginning to focus on the primary grades. These are the Annual National Assessments (ANAs), and the national workbooks, both introduced in 2011. Similarly, the Western Cape Education Department has, for a number of years already, begun to focus on early grade numeracy and literacy.
32
The need to focus on the primary grades (and pre-primary grades) is not only driven by the fact that underperformance is so widespread in these phases, but also because remediation is most possible and most cost-effective when children are still young. This is primarily because the human brain is most plastic and malleable in early childhood and thus particularly susceptible to beneficiation or harm. Also, due to the cumulative negative effects of learning deficits (particularly for vertically-integrated subjects like mathematics), it is not usually possible to fully remediate students if the intervention is too late (i.e. in high school), as too many South African interventions are. The Nobel economist Professor James Heckman explains this concept particularly succinctly:
"Policies that seek to remedy deficits incurred in early years are much more costly than early investments wisely made, and do not restore lost capacities even when large costs are incurred. The later in life we attempt to repair early deficits, the costlier the remediation becomes" (Heckman, 2000, p. 5).
Notwithstanding the above, the notion that the biggest problem in South African education is actually at the primary level, rather than just the secondary level is still largely confined to research and policy-advising institutions.
In order to understand these cumulative deficits, and how insurmountable they become over time, it is instructive to provide tangible examples. Using three different surveys for grade three (NSES 2007), grade four (NSES 2008), grade five (NSES 2009), grade six (SACMEQ 2007), and grade nine (TIMSS 2011) I have calculated the likely trajectories of learning for the average student in the Eastern Cape (Figure 14), and the average student in the Western Cape (Figure 15) relative to some benchmark of desired achievement – the average quintile five student in South Africa. Adapting Lewin’s (2007, p. 8) conceptual framework, I calibrate the achievement levels of the average student in the Eastern Cape and the Western Cape relative to quintile five performance in each dataset in each grade. In order to provide some measure of comparison, I take the average achievement level of quintile five students in each survey and equate this to the grade-appropriate level of performance. This constitutes the “on-track” line and represents the trajectory needed to reach the desired goal - matric. In reality, the curriculum specifications for each grade will be higher than the average quintile five achievement since not all quintile five students reach the demands of the curriculum. Nevertheless, it is still useful as one benchmark of performance.
For each dataset I calculate the difference between the average provincial test score and the average quintile five test score and convert this into “years of learning”. To do so I assume that one grade-level of learning is equivalent to half a standard deviation of student test scores in that survey. This benchmark has been used elsewhere in the literature, for example Reddy et al. (2012, p. 3) explain that TIMSS treats 40 points as equivalent to one grade level of learning. This is roughly equal to half a standard deviation in South Africa. Similarly, PIRLS also treats 40 points as equivalent to one year of learning since Howie and van Staden (2012, p. 39) explain that, according to prePIRLS 2012, grade four children in rural areas are 2.5 years behind grade four children in urban areas, a 102 point difference.
Another useful sense-check for determining whether or not 0.5 standard deviations is equivalent to one year of mathematics learning is to use the National School Effectiveness Study (NSES). In the NSES, the same students were tested in grade three, four and five at the end of 2007, 2008 and 2009 respectively. Thus one can see the increase as a percentage of the previous years’ standard deviation. From grade three to four there was a 0.34 standard deviation increase in the national average (and a 0.5 standard deviation increase in the Western Cape) and from grade four to five there was a 0.52 standard deviation increase in the national average (and 0.58 standard deviation increase in the
33
Western Cape). Thus, while there is some variation in the increase in test score year on year, it would seem that using 0.5 standard deviations as roughly equivalent to one year of learning is a reasonable assumption11. It is worth noting that 0.5 standard deviations represents one year of learning for the benchmark student, i.e. the amount of learning that should take place in a single year. Figure 14 below shows the gradients of achievement in the Eastern Cape relative to a benchmark level of “adequate” performance – the national average of quintile five schools in this instance. By construction, the “on-track” line shows the necessary gradient of achievement that students must follow if they are to reach the desired goal – matric. This was calibrated to be the average performance of quintile five students in each survey. As early as grade three, one can see the large discrepancy between the average child in the Eastern Cape relative to the grade-appropriate benchmark (quintile 5). This learning deficit grows as the child gets older, and by the time they have reached grade nine, they are almost three full grades worth of learning (2.8 years) behind the benchmark (Table 2 below), well-below the on-track line. Most importantly, any performance below the “on-track” line creates an increasing gradient of expectation as the student moves into higher grades. As students’ learning deficits grow, the gradient of what needs to be achieved then progressively steepens to the point where it enters what Lewin (2007, p. 7) refers to as a “Zone of Improbable Progress.” For example, the improvement that is required to bring the average grade ten student in the Eastern Cape up to the required benchmark by matric is unrealistic. By contrast, the gradient of achievement required to bring the average grade three student up to the required benchmark by matric is manageable. Intervening early to correct and prevent learning deficits is the only sustainable approach to raising average achievement in underperforming regions.
Figure 15 replicates the above approach but now for the Western Cape. The average national quintile five performance is still the benchmark that is used as a proxy for grade-appropriate performance. The situation presented here is in stark contrast to that of the Eastern Cape. The trajectory of provincial progress in the Western Cape (the “off-track” line) is never very far below the “on-track” benchmarking line. Although the average student is performing slightly below the benchmark, this under-achievement is never more than one grade-level’s worth of learning.
Table 5 below provides the scores and standard deviations for each survey used in the analysis.
11 It must be noted that the NSES tests were set at the grade three level (students wrote the same test in each successive grade), and thus one would expect the gains made year on year to overestimate the true gains that would have been made if the tests were set at the grade-appropriate level. One should not place too much emphasis on the specific measure of 0.5 standard deviations as being equivalent to one year of learning, since it is a somewhat arbitrary measure. The primary reason for using it is to make the surveys comparable over time, and to convert raw scores which are difficult to interpret meaningfully, into years of learning – a measure that has considerable conceptual purchase. Furthermore, given that the analysis here uses two relative measures of performance within the same survey (both the standard deviation – which is relative by construction - and the relative performance between quintile five and the Eastern/Western Cape), any inter-survey characteristics (such as different difficulty levels, time of year etc) are cancelled out and make the comparisons valid. The only binding assumption that one needs to make is that the relative performance of provinces and quintiles remains constant over the five year period 2007-2011 of these surveys, or has changed very slowly over this period. Given the slow dynamics of education system change this assumption seems entirely plausible.

34
Figure 14: Gradients of achievement in the Eastern Cape and in Quintile 5 (National)
Figure 15: Gradients of achievement in the Western Cape and in Quintile 5 (National)
3
4
5
6
9
12
0
1
2
3
4
5
6
7
8
9
10
11
12
13
Gr1 Gr2 Gr3 Gr4 Gr5 Gr6 Gr7 Gr8 Gr9 Gr10 Gr11 Gr12
On‐track line
Off‐tra
ck line
Initial conditions
Desired goal
SACMEQ
III Eastern Cape
SACMEQ
III Q
uintile 5
TIMSS 2011 Quintile 5
TIMSS 2011 Eastern Cape
Zone of
impro
bable
progre
ss
Projected
matric perform
ance: Eastern Cape
Performance below “on‐track” line creates increasing gradient of expectation
C.f. Lewin (2007: 8)
NSES EC
NSES EC
NSES EC
NSES Quintile 5
NSES Quintile 5
NSES Quintile 5
Actual grade
Effective grade level
Projected
matric perform
ance: Q
uintile 5
3
4
5
6
9
12
0
1
2
3
4
5
6
7
8
9
10
11
12
13
Gr1 Gr2 Gr3 Gr4 Gr5 Gr6 Gr7 Gr8 Gr9 Gr10 Gr11 Gr12
On‐track line
Off‐trac
k line
Initial conditions
Desired goal
SACMEQ
III W
estern Cape
SACMEQ
III Q
uintile 5
TIMSS 2011 Quintile 5
TIMSS 2011 W
estern Cape
Projected
matric perform
ance: W
estern Cape
Performance below “on‐track” line creates increasing gradient of expectation
C.f. Lewin (2007: 8)
NSES WC
NSES WC
NSES WC
NSES Quintile 5
NSES Quintile 5
NSES Quintile 5
Projected
matric perform
ance: Q
uintile 5
Actual grade
Effective grade level

35
Table 5: Relative performance of the Eastern Cape, Western Cape and national Quintile 5 schools for grades 3, 4, 5, 6, and 9
Grade 3 (NSES 2007) Grade 4 (NSES 2008) Grade 5 (NSES 2009)
Score National std. dev
Years behind Q5
Score National std. dev
Years behind Q5
Score National std. dev
Years behind Q5
Eastern Cape 26.4
22
1.8 30.4
21
2.2 42.6
21
2.3
Western Cape 36.7 0.9 47.7 0.5 59.9 0.6
National Quintile 5 46.4 0 53.4 0 66.4 0
Grade 6 (SACMEQ III 2007) Grade 9 (TIMSS 2011)
Score National std. dev
Years behind Q5
Score National std. dev
Years behind Q5
Eastern Cape 469
98
2.3 316
86
2.8
Western Cape 566 0.4 404 0.8
National Quintile 5 584 0 438 0

36
9. Transitions from school to work and tertiary institutions
-Hendrik van Broekhuizen12
South Africa has one of the highest youth unemployment rates in the world (Biavaschi et al, 2012, p. 10). Approximately 50% of all 18–24-year-olds were unemployed by the end of 201113 and the youth currently accounts for about 30% of all the unemployed in the country, despite the fact that the cohort constitutes only 22% of the working-age population.14 These figures are all the more staggering given that the International Labour Organisation’s (ILO) estimates of the global and Sub-Saharan youth unemployment rates for 2011 are only 12.6% and 11.5%, respectively (ILO, 2012 p. 15). The bleak labour market prospects faced by many of the country’s young people is partly attributable to insufficient job creation in the economy since 1994 in conjunction with long and lengthening job queues – queues which are often already occupied by older, more experience job-seekers (NPC, 2011, p. 345). However, the severity of South Africa’s youth unemployment is largely the result of a pervasive lack of appropriate skills, competencies, and work-relevant capacities among young labour market entrants (Perold et al, p. 2).
The general lack of skills and employability among South Africa’s youth is one of the perverse consequences of the poor quality of education received - predominantly by Black and Coloured learners - in large segments of the country’s primary and secondary schooling systems (Smith, 2011, p.7; Cloete, 2009, p3; Sheppard and Cloete, 2009, p. 60). Moreover, due to the widespread failure of the sector education and training authorises (SETAs), the poor quality of many FET colleges, stringent entry requirements and capacity constraints at higher education institutions, and the “low participation-high attrition” nature of the tertiary education system as a whole, opportunities for remedial training or further formal skills acquisition after leaving secondary school in South Africa remains limited (Fisher and Scott, 2011, p. 1; Mayer et al, 2011, p. 42; Cloete, 2009, p. 10).
Collectively, the aforementioned factors imply that few South African youths manage to successfully transition into employment or tertiary education and training once they have left the secondary schooling system. This reality is reflected in the finding that South Africa had 3.2 million 18 – 24-year-olds who were not in education, employment or training (NEET) in 2010 – more than double the 1.25 million 18-24-year-olds who were enrolled at universities or FET colleges (Cloete and Butler-Adam, 2012, p. 3). In fact,
Figure 16 shows that, since 2002, more than 40% of 18-24-year-olds in South Africa have been NEET, with the percentage of youths enrolled in some form of education decreasing by 14 percentage points from 50% in 1995 to 36% in 2007. It is alarming to note that, with the exception of 1999 to 2002, the percentage of youths in employment has consistently been below 20% over the 1995 – 2011 period.
12 Hendrik van Broekhuizen authored this chapter on transitions. He is a researcher at Stellenbosch University and can be contacted on [email protected]. 13 Author’s own calculations based on the 2011Q4 Quarterly Labour Force Survey (QLFS). The broad unemployment rate (which includes discouraged work-seekers) for 18 – 24-year-olds at the end of 2011 was estimated at just over 60%. 14 Author’s estimates based on the 2011Q1 – 2011Q4 QLFS.

37
Figure 16 - Percentage of 18-24-year-olds than are employed, in education, or NEET
Source: Own calculations, OHS 1995 – 1999, LFS 2000a – 2007b, QLFS2008Q1 – QLFS2011Q4. Notes: Estimates are weighted and are calculated only for 18-24-year-olds. Because the QLFS surveys do not enable identification of the level of education in which an individual is enrolled, “In Education” refers to individuals enrolled in primary, secondary, or tertiary education.
Since 1995, the average number of years of educational attainment among 18-24-year-olds in the country has increased by about 0.83 years. However, while there has been a significant increase in the absolute number of youths enrolling at tertiary training institutions between 1995 and 2010, particularly for the Black population, these increases have generally been in line with the rise in the size of South Africa’s youth population over the period (Smith, 2011, p. 12). As Figure 17 therefore shows, the increase in the average level of educational attainment among the youth has largely been driven by the 9 percentage point increase in the proportion who complete matric as their highest level of education, up from 25% in 1995 to about 34% in 2011. At the same time, changes in the proportions of youths with some form of tertiary qualification have been statistically negligible, with the percentage of youths with post-secondary diplomas or certificates and those with bachelor’s degrees or higher remaining low at around 3% and 1% respectively.
0%
10%
20%
30%
40%
50%
60%
70%
80%
90%
100%
1995
1996
1997
1998
1999
2000
2001
2002
2003
2004
2005
2006
2007
2008
2009
2010
2011
Percentage of 18‐24‐year‐olds
In Employment In Education NEET

38
Figure 17 - Composition of 18 - 24-year-olds by highest level of education completed
Source: Own calculations, OHS 1995 – 1999, LFS 2000a – 2007b, QLFS2008Q1 – QLFS2011Q4. Notes: Estimates are weighted and are calculated only for 18-24-year-olds. “Less than Matric” includes all individuals with between 0 years of schooling and completed grade 11. “Diplomas” include all post-secondary certificate and diploma qualifications or their equivalents. “Degrees” include all Bachelor’s degrees or higher qualifications.
On the basis that numerous studies have shown that better-educated individuals also face better labour market prospects in terms of lower unemployment rates, shorter spells of unemployment, and higher probabilities of procuring full-time employment (Branson, Leibbrandt, and Zuze, 2009, p 45; Cloete, 2009, p. 5 - 6), the finding that the proportion of 18-24-year-olds who complete matric is increasing over time may lead one to expect that youth unemployment has also improved over time. However, Figure 18 reveals that the narrow unemployment rate for 18-24-year-olds has actually increased by 38% since 1995, from 36% in 1995 to 50% in 2011. The graph also reveals a number of other alarming features and trends. First, despite short-term fluctuations, it appears as though the youth unemployment rate across all education cohorts in the group is on a long-term upward trend. Second, while the youth unemployment rate has increased rapidly for all education cohorts since 2008, the increases appear to have been greatest for young people with tertiary qualifications.15 Third, the unemployment rates for 18-24-year-olds with post-secondary diplomas or certificates have consistently been much lower than those for youths with only completed matric or lower levels of attainment. However, since 1999, the unemployment rates for this group have also consistently been higher than the unemployment rate for the full working-age population. In fact, by 2011, even the unemployment rate for 18-24-year-olds with degrees had risen above the overall national unemployment rate of 25%. Finally, and perhaps most disconcertingly, Figure 18 shows that the unemployment rates for 18-24-year-olds with matric and those with less than matric – a group which is about 90% Black - appear to be almost equal. In truth, the estimates of the unemployment rates for matriculated youths is on average about 3 percentage points lower than the estimated unemployment rates for 18-24-year-olds with less than matric, but there are a number of years in which the
15 It is important to note that, because of the small relative size of the group of tertiary-qualified 18-24-year-olds and the consequent small sample size of tertiary-qualified 18-24-year-olds included in the labour force surveys on which these estimates are based, the confidence intervals within which point estimates of the tertiary-qualified youth unemployment rates lie are very large. As a result, it would be prudent not too draw overly strong conclusions based on the findings for this particular group.
0%
10%
20%
30%
40%
50%
60%
70%
80%
90%
100%
1995
1996
1997
1998
1999
2000
2001
2002
2003
2004
2005
2006
2007
2008
2009
2010
2011
Proportion of youth with Qualification
With Less Than Matric With Matric With Diploma With Degree

39
differences between the estimates of the two rates are not statistically significant. This finding contrasts sharply with the often-held belief that completing matric significantly reduces the chances of being unemployed in South Africa (Smith, 2011, p. 8).
Figure 18 - Narrow unemployment rates for 18-24-year-olds by highest level of education completed
Source: Own calculations, OHS 1995 – 1999, LFS 2000a – 2007b, QLFS2008Q1 – QLFS2011Q4. Notes: Estimates are weighted and, with the exception of the series for the working-age population, are calculated only for 18-24-year-olds. “Less than Matric” includes all individuals with between 0 years of schooling and completed grade 11. “Diplomas” include all post-secondary certificate and diploma qualifications or their equivalents. “Degrees” include all Bachelor’s degrees or higher qualifications.
In addition to a rise in unemployment rates among 18-24-year-olds between 1995 and 2011, increases in the average duration of unemployment spells experienced by the youth in recent years suggest that school-to-work transitions in South Africa may be becoming increasingly difficult.
0%
10%
20%
30%
40%
50%
60%
70%1995
1996
1997
1998
1999
2000
2001
2002
2003
2004
2005
2006
2007
2008
2009
2010
2011Narrow Unem
ploym
ent Rate for
18 ‐24 ‐year ‐olds
Working‐Age Population All Youth
Youth With Less Than Matric Youth With Matric
Youth With Diploma Youth With Degree

40
Figure 19 shows that by 2011, more than 70% of 18-24-year-olds in unemployment had never been employed before. Even for individuals with tertiary qualifications, there has been an almost 15 percentage point rise in the percentage of youths who had never worked before from about 35% in 2008 to almost 50% in 2011. Similarly, Figure 20 shows that there has been a decrease in the proportion of unemployed youths that have been unemployed for less than a year and an increase in the percentages that have been unemployed for between 1 and 5 years. In fact, the proportion of job-seeking youths that have been unemployed for more than 3 years has increased from around 42% in 2008 to 50% in 2011. These findings correspond with those from previous studies that have noted the high and/or increasing average durations of youth unemployment spells in South Africa since 1995 (Mayer, 2011, p.p. 21 – 22; Rankin et al, 2007).
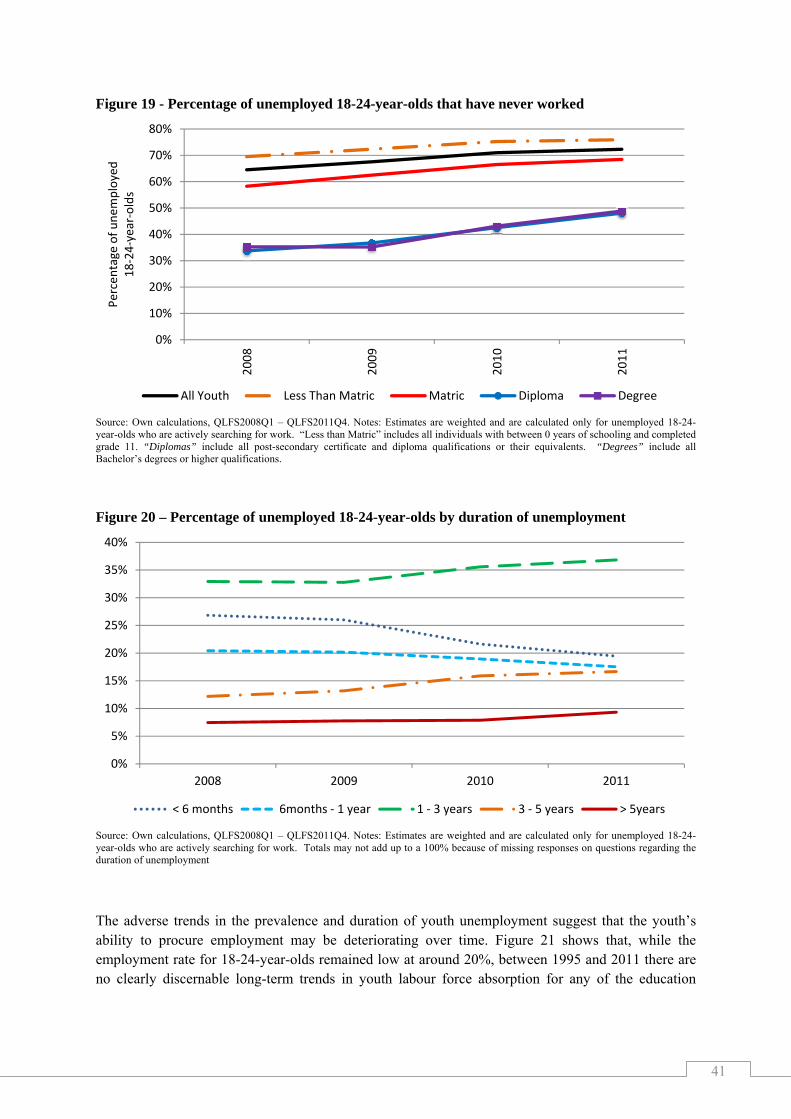
41
Figure 19 - Percentage of unemployed 18-24-year-olds that have never worked
Source: Own calculations, QLFS2008Q1 – QLFS2011Q4. Notes: Estimates are weighted and are calculated only for unemployed 18-24-year-olds who are actively searching for work. “Less than Matric” includes all individuals with between 0 years of schooling and completed grade 11. “Diplomas” include all post-secondary certificate and diploma qualifications or their equivalents. “Degrees” include all Bachelor’s degrees or higher qualifications.
Figure 20 – Percentage of unemployed 18-24-year-olds by duration of unemployment
Source: Own calculations, QLFS2008Q1 – QLFS2011Q4. Notes: Estimates are weighted and are calculated only for unemployed 18-24-year-olds who are actively searching for work. Totals may not add up to a 100% because of missing responses on questions regarding the duration of unemployment
The adverse trends in the prevalence and duration of youth unemployment suggest that the youth’s ability to procure employment may be deteriorating over time. Figure 21 shows that, while the employment rate for 18-24-year-olds remained low at around 20%, between 1995 and 2011 there are no clearly discernable long-term trends in youth labour force absorption for any of the education
0%
10%
20%
30%
40%
50%
60%
70%
80%
2008
2009
2010
2011
Percentage of unem
ployed
18‐24‐year‐olds
All Youth Less Than Matric Matric Diploma Degree
0%
5%
10%
15%
20%
25%
30%
35%
40%
2008 2009 2010 2011
< 6 months 6months ‐ 1 year 1 ‐ 3 years 3 ‐ 5 years > 5years

42
cohorts shown.16 In the more recent short run, however, there has been a clear downward trend in the percentage of young people in employment in the country, a trend which, again, appears to have been most pronounced for tertiary-educated 18-24-year-olds. In contrast to youth unemployment rates, the employment rate for matrics is 10 and 12 percentage points higher than the employment rate for youths with less than matric. This is largely driven by the fact that a greater proportion of 18-24-year-olds with matric participate in the labour force and, therefore, a greater proportion are employed. However, for those youths who are actively looking for work, completing matric without also continuing with tertiary education does not noticeably improve employment prospects relative to those with less than matric.
Figure 21 - Percentage of youth in employment by highest educational attainment
Source: Own calculations, OHS 1995 – 1999, LFS 2000a – 2007b, QLFS2008Q1 – QLFS2011Q4. Notes: Estimates are weighted and, with the exception of the series for the working-age population, are calculated only for 18-24-year-olds. “Less than Matric” includes all individuals with between 0 years of schooling and completed grade 11. “Diplomas” include all post-secondary certificate and diploma qualifications or their equivalents. “Degrees” include all Bachelor’s degrees or higher qualifications.
To contextualise the trends in youth labour market outcomes between 1995 and 2011, Figure 22 shows the average annual changes in the proportion of 18-24-year-olds in the labour force, employment, NEET, unemployment, and education between 1995 and 2011 alongside the corresponding changes for the working-age population. The graph reveals that, while the labour force participation rate among 18-24-year-olds increased by about 0.7%, on average, per annum, the change in the proportion of youths who manage to procure employment between 1995 and 2001 has been statistically negligible. Instead, the increase in youth labour force participation in combination with increasingly adverse labour market conditions has contributed to an annual 1% average increase in the proportion of youths that are unemployed and an annual 1.6% average increase in the proportion that are NEET. At the same time, there has also been a decrease in proportion of 18-24-year-olds enrolled in primary, secondary, or tertiary education. Burger, van der Berg, and von Fintel (2012) explain that these changes may at least partly be the result of restrictions on over-aged learners and grade-repetition that were implemented in schools during the 1990s, which not only resulted in a decrease in
16 The employment rate is also sometimes referred to as the labour force absorption rate and denotes the number of employed individuals as a percentage of the number of individuals in the population under consideration.
0%
10%
20%
30%
40%
50%
60%
70%
80%
1995
1996
1997
1998
1999
2000
2001
2002
2003
2004
2005
2006
2007
2008
2009
2010
2011
Employm
ent/LFA Rate for
18 ‐24 ‐year ‐olds
Working‐Age Population All Youth
Youth with Less than Matric With Matric
Youth With Diploma Youth With Degree
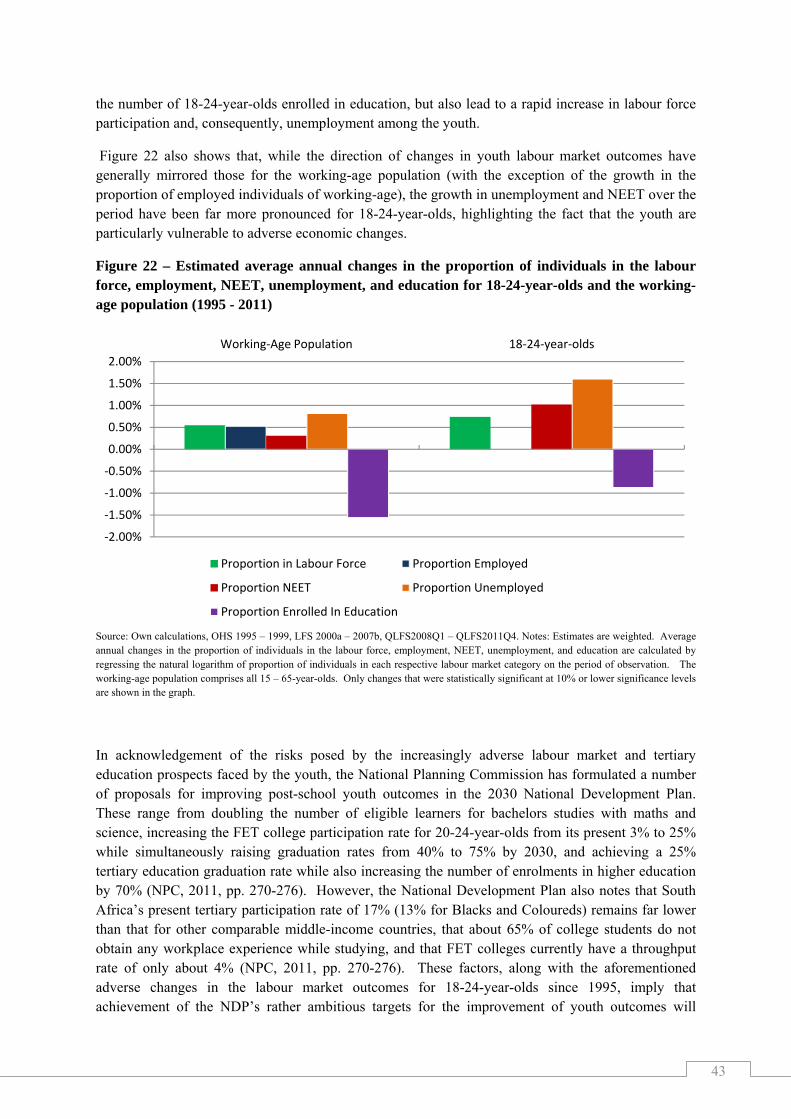
43
the number of 18-24-year-olds enrolled in education, but also lead to a rapid increase in labour force participation and, consequently, unemployment among the youth.
Figure 22 also shows that, while the direction of changes in youth labour market outcomes have generally mirrored those for the working-age population (with the exception of the growth in the proportion of employed individuals of working-age), the growth in unemployment and NEET over the period have been far more pronounced for 18-24-year-olds, highlighting the fact that the youth are particularly vulnerable to adverse economic changes.
Figure 22 – Estimated average annual changes in the proportion of individuals in the labour force, employment, NEET, unemployment, and education for 18-24-year-olds and the working-age population (1995 - 2011)
Source: Own calculations, OHS 1995 – 1999, LFS 2000a – 2007b, QLFS2008Q1 – QLFS2011Q4. Notes: Estimates are weighted. Average annual changes in the proportion of individuals in the labour force, employment, NEET, unemployment, and education are calculated by regressing the natural logarithm of proportion of individuals in each respective labour market category on the period of observation. The working-age population comprises all 15 – 65-year-olds. Only changes that were statistically significant at 10% or lower significance levels are shown in the graph.
In acknowledgement of the risks posed by the increasingly adverse labour market and tertiary education prospects faced by the youth, the National Planning Commission has formulated a number of proposals for improving post-school youth outcomes in the 2030 National Development Plan. These range from doubling the number of eligible learners for bachelors studies with maths and science, increasing the FET college participation rate for 20-24-year-olds from its present 3% to 25% while simultaneously raising graduation rates from 40% to 75% by 2030, and achieving a 25% tertiary education graduation rate while also increasing the number of enrolments in higher education by 70% (NPC, 2011, pp. 270-276). However, the National Development Plan also notes that South Africa’s present tertiary participation rate of 17% (13% for Blacks and Coloureds) remains far lower than that for other comparable middle-income countries, that about 65% of college students do not obtain any workplace experience while studying, and that FET colleges currently have a throughput rate of only about 4% (NPC, 2011, pp. 270-276). These factors, along with the aforementioned adverse changes in the labour market outcomes for 18-24-year-olds since 1995, imply that achievement of the NDP’s rather ambitious targets for the improvement of youth outcomes will
‐2.00%
‐1.50%
‐1.00%
‐0.50%
0.00%
0.50%
1.00%
1.50%
2.00%
Working‐Age Population 18‐24‐year‐olds
Proportion in Labour Force Proportion Employed
Proportion NEET Proportion Unemployed
Proportion Enrolled In Education
44
require concerted efforts towards not only improving the quality and capacity of the tertiary education system, but, perhaps more importantly, also improving the quality of South Africa’s primary and secondary schooling system.
In order to highlight the nature of the youth’s transition from school to work or education as discussed above, the key conclusions from this section can be summarised as follows:
Poor quality schooling at the primary and secondary level in South Africa severely limit the youth’s capacity to exploit further training opportunities. As a result, existing skills deficiencies among those who are the product of an underperforming school system (predominantly Blacks) are likely to persist.
South Africa’s narrow youth unemployment rate of 50% is staggeringly high, both in the context of far lower average global and Sub-Saharan youth unemployment rates and in terms of the country’s already high aggregate narrow unemployment rate of 25%.
The percentage of 18-24-year-olds who are not in education, employment or training (NEET) has increased from about 30% in 1995 to 45% in 2011 while the percentage enrolled in education has decreased from 50% to 36% and the percentage of youths in employment remained fairly constant at between 17% and 19%. As such, there appears to have been a shift away from participation in education in favour of either economic inactivity or unemployment among the youth.
Youth unemployment in the country is not only high, but has risen precipitously since 2008, following a national trend of worsening unemployment. Moreover, the nature of unemployment experienced by the youth appears to be becoming more severe in terms of an increase in the proportion of unemployed youths that have never worked and the proportion that have been looking for work for more than a year.
For the youth, completing matric does not provide sufficient assurance against becoming unemployed, nor does it markedly increase one’s chances of procuring employment relative to 18-24-year-olds that have lower than matric levels of educational attainment. Instead, the value of completing matric lies in opening up the opportunity to acquire some form of tertiary education qualification.
Though the unemployment rates for 18-24-year-olds with tertiary qualifications are much lower than those for youth’s with matric or less, they are nevertheless high in relation to South Africa’s overall unemployment rate.

45
10. Policy suggestions
I. Make ANA reliable
Introducing the annual national assessments in 2011was a landmark achievement for the country for which the Department should be commended. The benefits of these tests are likely to be large and disproportionately in favour of the poor. However, their current implementation leaves much to be desired, as has been made explicit in section 3 above. For the ANAs to fulfil the role for which they were created, they must be:
Trustworthy. Given the nature of nationally standardised exams, and the lessons learnt from international experience, it is imperative that there is an independent, external body which verifies the quality and monitors the implementation of the ANAs. This is a large, costly and complex process which must be planned well in advance. Given the logistical and financial constraints of monitoring all grades, only one (or at most two) grades should be externally verified every year – probably grades three and six. The Western Cape Education Department has conducted systemic evaluations in that province since 2002. The lessons learnt and expertise acquired should be shared with the national Department. It is imperative for the Department to realize that unless there is an external verification body which can independently assure the quality of the ANAs, the schooling system and the public more generally will not trust any reported changes as being authoritative and unbiased.
Reliable. If the ANAs are to provide credible feedback on performance and progress to parents, teachers, principals and Departmental officials, they need to be an accurate reflection of underlying learning. The tests should be well aligned with the curriculum and the difficulty levels of each grade (and subsequent years) calibrated such that they each grade-appropriate roughly equal difficulty. There should be careful reflection on the ANA 2012 tests in order to understand where the fault-lines were and how they can be avoided in subsequent ANAs. As it stands, no one who understands the dynamics of educational assessments believes that the increases in ANA between 2011 and 2012 reflect reality. Furthermore, providing erroneous feedback to teachers and principals is counter-productive and will make any future endeavours to improve performance all the more difficult.
Properly utilized. The ANAs provide a wealth of information on the distribution of performance across provinces, districts, circuits and schools. Stakeholders at various levels of the system would find the information generated from ANA tremendously helpful, provided that it is presented to them in a usable format. The Department should create a dashboard system for district officials which provides comparative information on school performance. Given that the ANAs are a primary means of identifying schools and children that need further support, the Department should organize a number of targeted remedial interventions that are highly structured and sequenced – similar to the workbooks. That is to say that the theory of improvement must be made explicit. Where ANA results indicate that a child or a class has not reached some basic threshold of performance, the teacher should have clear, simple guidelines of which of a limited number of interventions they should implement and understand exactly how it should be implemented. As Schleicher (2009, p. 262) exhorts,
“Educational systems must plan carefully how to manage and respond to public debate which follows the publication of school-level test results and give support to those schools with weak results, using the data to bring all schools up to a given level, rather than allowing the pressures of league tables to polarize school quality.”
46
II. Implement a nation-wide system of minimum-proficiency diagnostic teacher testing and capacitation for numeracy and literacy starting with the Foundation Phase.
The existing body of evidence suggests that a large proportion of South African teachers have below-basic content knowledge in the subjects that they teach – largely as a result of inadequate apartheid-era teacher training and the ineffectiveness of in-service teacher training initiatives. In light of this, and following the premise that teachers cannot teach what they do not know, it is a logical imperative that a system of identifying which teachers need what help is urgently required. Given the current state of teacher content knowledge in poor and rural schools, the Department cannot afford to be idealistic in its implementation of this system of teacher testing and training. Rather than ascribing to the aspirational planning approach that has become characteristic of South African policy - where one might set an impractically high benchmark for desirable teacher content knowledge - one should first aim to ensure that every teacher in the system has the basic content knowledge required to cover the curriculum that they currently teach. For example, rather than decreeing that every primary school mathematics teacher should be able to pass the matric mathematics exam, it would be far more realistic to take an incremental approach and set the minimum-proficiency benchmark at a 70% mark on the grade nine annual national assessment, combined with at least a 90% mark in the ANA of the grade which they are currently teaching. If a grade six mathematics teacher cannot achieve 70% on the grade nine ANA for mathematics, or achieve 90% for the grade six mathematics ANA, one can say that they do not currently possess the requisite content knowledge to teach grade six mathematics. As a matter of urgency, they should be required to undergo minimum-proficiency teacher training for the subjects which they teach and then re-assessed at the end of the training. Before trying to get every teacher to a desirable level, first ensure that all teachers have the basic content knowledge in the subjects that they teach.
Given the logistics involved with implementing a testing and training operation of this scale, it is advisable to pilot the system with one district and then to roll out the system nationally in a progressive way. For example the Department could start with Foundation Phase (FP) mathematics teachers in a particular district and require all FP maths teachers to register and write the minimum proficiency test within six months. Teachers who do not meet the minimum-proficiency benchmark for the subjects that they teach should be given six months to complete the minimum-proficiency training which should be free of charge and accessible. Importantly, the training provided should be dignified, highly practical, structured and sequenced, with formative testing built into each module to assess whether or not the teacher has acquired the necessary knowledge and skills.
In order to get teacher and union buy in, it will need to be made explicit that these tests are for diagnostic rather than punitive purposes. Through a variety of mechanisms (such as contracts and confidentiality clauses) it is possible to reassure all parties involved that these tests are truly developmental in nature. The ultimate aim of such a system should not be to vilify and demean teachers and the teaching profession, but to increase the capacity and dignity of teachers. Elmore (2004b, p. 93) provides a useful description of the interplay between accountability and capacitation:
“For every increment of performance I demand from you, I have an equal responsibility to provide you with the capacity to meet that expectation. Likewise, for every investment you make in my skill and knowledge, I have a reciprocal responsibility to demonstrate some new increment in performance.”
47
III. Increase the technical capacity and implementation ability of the Department
Before it is possible to reform a broken system, there needs to be a capable and competent bureaucracy which can (i) identify the binding constraints to progress, (ii) formulate policy based on objectively verifiable scientific evidence, (iii) implement those policies in an accountable, disciplined, coordinated and sustained manner, and (iv) document successes and failures and learn from them going forward. The comparability issues around ANA 2011 and 2012 highlight the need for additional technical and educational expertise in the national Department of Basic Education and the need for greater accountability. This points to the Department’s inability or unwillingness to appoint personnel based on expertise and technical competence, or conversely, to dismiss personnel who lack the competence to fulfil their job-descriptions – as has been reflected in recent events such as the Limpopo textbook crisis, and the ongoing stalemate in the Eastern Cape Department of Education. Commenting on these issues in more general terms Nick Taylor (2011b, p. 11), the current head of the National Education Evaluation and Development Unit (NEEDU), does not mince his words in his input-paper for the National Planning Commission’s National Development Plan:
“We would suggest that a commitment to expertise needs to replace the present culture of patronage which dominates large parts, not only of the school system, but of the entire civil service, leading to widespread malfunction in the delivery of services. This is obviously a political problem which needs to be addressed in the political sphere. Until this happens, individual schools may be led to improved performance through inspired principals, but system-wide reform of the largely dysfunctional school system cannot occur. Instituting a commitment to expertise in the civil service means employing and promoting all personnel within the public sector on the basis of merit, knowledge, and skills, rather than according to their political or union connections” (Taylor N. , 2011b, p. 11).
IV. Increase accountability at all levels of the system
One of the most pressing needs in South African education – and the civil service more generally – is a strong commitment to accountability and transparency. Without a clear articulation of who is responsible for ensuring student learning, and to whom, one cannot hold anyone accountable. Over and above the lack of a chain of accountability, even if one did identify who was responsible for non-performance, this does little good unless there are tangible consequences that follow non-performance. Beyond learning outcomes, the Department should also change its focus from mere compliance towards ongoing monitoring and evaluation. Thus, whether textbooks and workbooks are being used is as important as them being delivered; whether teachers are actually in class teaching is as important as them being present at the school, and so on.
The National Planning Commission highlight the systemic nature of the lack of accountability in the public sector in South Africa, and particularly in education:
“Accountability is essential to democracy. There are several weaknesses in the accountability chain, with a general culture of blame-shifting. The accountability chain has to be strengthened from top to bottom. To begin with, parliamentary accountability is weak, with Parliament failing to fulfil its most basic oversight role. Education outcomes cannot improve unless accountability is reinforced throughout the system, from learner results to the delivery of textbooks” (NPC, 2012, p. 45)
Similarly, a recently conducted public expenditure analysis by RESEP and Oxford Policy Management (2012, p37) concludes that:
48
“The system appears to suffer from both a lack of top-down oversight and a lack of bottom-up accountability, which means that there is little consequence for non-performance and therefore little emphasis on results and ensuring cost effectivness. Weak accountability also means that there is little motivation to procure and retain skilled individuals. An example is the lack of accountability for texbooks that are either not delivered or delivered incorrectly. The supply chain is complicated, interdependent and involves many actors, both public and private and there is no system to hold specific parties to account or to create consequences for non-performance” (RESEP and Oxford Policy Management, 2012, p.37)
V. Set realistic goals that focus on the universal acquisition of basic skills
The existing approach of Government with respect to educational goal-setting can only be described as aspirational planning. Many of the targets set by Presidency and the Department of Basic Education show no regard for the starting point, and little regard for what is actually feasible (using local and international experience as benchmarks). For example, Goal 2 of the “Action Plan to 2014” sets the 2014 target for the proportion of Grade 6 students with minimum mastery of language and mathematics competences at 60% for both subjects, despite the fact that the 2009 baseline was 37% for language, but only 19% for mathematics. (DBE, 2011, p. 4). Apart from these goals being entirely unrealistic (tripling the proportion of students acquiring basic mathematics competency in five years), they also do not seem to distinguish between the two subjects, in spite of the fact that South African students perform comparatively worse in mathematics than in language. As Lewin (2007, p. 7), commenting on the process of setting goals for developing countries, explains: “Generally targets and indicators are not contextualised or related to different starting points, realistic assessments of capacity, and recent rates of progress. This can result in increasingly unrealistic goals.” Similarly Elmore (2004a, p. 13) notes: “Just as teachers face students with multiple points of access to learning, so too do policymakers and administrators face schools, and school systems, with widely divergent points of departure."
Following an aspirational goal-setting approach leads to either declining educational standards (in order to meet the goals), or a continual re-adjustment of the elusive targets. It would seem that the gains made between ANA 2011 and ANA 2012 for example were primarily due to easier tests in 2012, rather than any real progress over the period, as has been explained in section 3 above. While the Action Plan to 2030 is a step in the right direction, the Department should further prioritise among the many goals listed in the document. The main emphasis should be on the universal acquisition of basic skills. Policy documents on educational benchmarks should be clear, concise, and understandable to the public at large.
11. Conclusion
The current report has provided an empirical overview of the levels and trends of educational outcomes in South Africa over the last two decades. According to the weight of available evidence, over the 1995-2002 period there was no improvement in the maths or science outcomes of South African children. Similarly, between 2000 and 2007 there was no observable improvement in numeracy or literacy outcomes amongst primary school children in the country. The only cross-national survey of educational achievement that has shown any improvement has been TIMSS 2011 where there was a one and a half grade-level improvement in mathematics and science over the 2002-2011 period at the grade nine level. While this shows that there has been some recent improvements,

49
it is difficult to celebrate when one considers how low the post-improvement level of performance really is. Three quarters (76%) of grade nine students in 2011 still had not acquired a basic understanding about whole numbers, decimals, operations or basic graphs, and this is at the improved level of performance. Part of the reason for the improvement is the fact that we started from an exceedingly low base in 2002. To place this in perpective, South Africa’s post-improvement level of performance is still the lowest of all participating countries, with the average South African grade nine child performing between two and three grade levels lower than the average grade eight child from middle-income countries.
The eight most important findings of the preceding research are as follows:
1. Irrespective of which subject or grade one chooses to test, most South African children are performing significantly below the curriculum, often failing to acquire functional numeracy and literacy skills. Apart from the 25% of schools that are mostly functional, South African schools as they currently stand do not, and arguably cannot, impart to students the foundational knowledge and skills they should be acquiring at school.
2. The severe inequalities of educational outcomes in South Africa can be seen along a number of correlated dimensions, most notably: wealth, school location, language and province. In each case the difference between the top and bottom categories is at least two grade-levels worth of learning and sometimes is as large as four grade-levels.
3. The learning deficits that children acquire in their primary school career grow over time to the extent that they become insurmountable and preclude students from following the curriculum at higher grades, especially in subjects that are vertically demarcated like mathematics and science. Intervening early to prevent, diagnose and correct these learning deficits is the only appropriate response.
4. While the matric pass rate has been increasing in recent years, this measure should not be seen as an accurate indication of the quality of education in the country. It is flawed because it only reflects the performance of the best-performing 50% of a cohort, i.e. those that make it to matric, and it does not take into account subject combinations and the fact that more students are opting for easier subjects like mathematics literacy, compared to more challenging subjects like mathematics.
5. There are large differences in the provincial rates of retention-to-matric. The ratio of grade two enrolments in 2001 to matric passes in 2011 was only 2 in 10 in the Eastern Cape, but 6 in 10 in Gauteng.
6. South Africa has some of the least-knowledgeable primary school mathematics teachers in sub-Saharan Africa. Many of these teachers, especially those that serve poor and rural communities, have below-basic levels of content knowledge. In many instances these teachers cannot answer questions their students are required to answer according to the curriculum.
7. Although the Annual National Assessments (ANAs) are one of the most important and needed policy innovations since the transition, given the way that these tests are currently implemented – including the formulation, marking, invigilation, moderation and invigilation procedures - they cannot be used as a reliable indicator of progress.
8. The sub-standard quality of education provided to most South African youth has severe economic consequences for those affected. Furthermore, the economic prospects of the youth appear to be detiorating over time. The percentage of 18-24 year olds who are not in education, employment or training (NEET) has increased from about 30% in 1995 to 45% in 2011 while the percentage enrolled in education has decreased from 50% to 36% over the same period. The unemployment rate for the youth has also increased from 36% in 1995 to

50
50% in 2011, standing at twice the national unemployment rate in 2011. Furthermore, of those unemployed in 2011, more than 70% had never been employed before. Perhaps most disconcertingly, for the youth completing matric does not markedly increase one’s chances of finding employment relative to 18-24 year olds with less than matric. Rather, the value of matric lies in opening up opportunities to acquire some form of tertiary education, an opportunity available to only a small minority.
While South Africa’s education system is in a dire state, there are a number of recent policies that indicate that the Department is beginning to address some of the root causes of underperformance. The recent workbook initiative, the Curriculum Assessment Policy Statement (CAPS), the Action Plan to 2030 and the implementation of the ANAs are all moves in the right direction. However, there are still a number of areas which must be addressed if we are to improve the forms of teaching and learning in most South African classrooms, including the following:
1. Increase the managerial, administrative and technical capacity of the national and provincial bureaucracies. Many well-intentioned policies are never implemented, or implemented badly, due to a lack of managerial and administrative capacity at all levels. Improving the administrative systems and managerial efficiency of government is likely to have large spill-over effects into all areas of operation.
2. Increase accountability by formulating coherent, clear and systematic implementation plans. For every policy created by the national or provincial Departments there should be a clear chain of accountability with verifiable and trackable goals and responsibilities assigned to specific individuals (RESEP & Oxford Policy Management, 2012, p.36). Consequences for non-performance should be explicit and acted upon without partiality or delay. The existing culture of blame-shifting, impunity, patronage, and obfuscation mean that ineptitude and incompetence are not penalised. This is unsustainable and is arguably a binding constraint to systemic progress. Additionally, new appointments should be selected primarily on competence and skill rather than union or political connections.
3. Implement a nation-wide system of diagnostic teacher testing and training. Teachers who do not have the basic level of content knowledge required to teach their subjects should be required to enter compulsory training within a specified time-frame, and subsequently pass a test of basic proficiency. If they cannot pass these tests after training or repeated training, they should be removed from the teaching corps. Implementing such policies are likely to be politically unpopular and may cost the government votes, but should be implemented for the benefit of those who cannot vote i.e. students.
4. Externally evaluate the ANAs at one primary school grade, perhaps grade six. For the ANAs to be a reliable indication of student learning-outcomes they should be externally administered and marked by an independent body. Unless these tests are quality-assured in the test-construction phase, as well as independently administered, marked and moderated, they cannot be regarded as reliable indicators. Due to the logistical and financial implications of such a large undertaking, it should only be externally evaluated at one grade per year.
5. Provide a clear articulation of who is responsible for ensuring student learning, and to whom, with clear consequences for non-performance. Without an explicit chain of accountability, student outcomes cannot improve on a national level. While it is indisputable that the government should provide every school with the basic infrastructure required (water, sanitation, buildings, textbooks etc.) and support teachers and principals, one cannot absolve schools of responsibility for dysmal performance because they do not have libraries or science laboratories. Under the right circumstances these do improve learning outcomes, and

51
ultimately they should be provided to all schools. However, libraries and laboratories are not a prerequisite for basic school functionality and adequate learning outcomes – as many excellent under-resourced schools prove. How is it possible that two equally poor schools with socioeconomically similar students perform at vastly different levels – one dysfunctional, the other excellent? Commenting on the impact of the influential “Coleman Report” in America, Coleman explains that one of the main impacts of the report was to shift the policy-consensus in the United States towards educational outcomes rather than educational inputs (see below) – something which is also needed in South Africa.
“The long range impact of the report will probably be to strengthen the move toward evaluating schools in terms of their results rather than their inputs...School superintendents and educators have been reluctant to measure schools by how well the students do. Whether or not they admit it, they feel that the primary variation in student performance is not what the schools are doing but what the child comes to school with” (Coleman, 1972, p. 13).
6. Use the externally evaluated ANAs to determine which schools are the most dysfunctional and thus require the most support. Identify these dysfunctional schools and place them on a probationary list. These schools should receive the most support and the closest monitoring. Schools should be given a clear, structured, sequenced program of improvement, outlining the steps necessary to get to a minimum level of proficiency.
Lastly, but perhaps most importantly, it is not possible to solve a crisis that does not officially exist. The speeches of Departmental officials and the Minister of Basic Education would lead an uninformed person to conclude that while education in South Africa has its problems, there is no crisis. To quote the Minister directly, “We still have challenges...but there is no crisis” (Motshekga, 2013). These statements are not simply about rhetorical technicalities or nomenclature, but rather provide an indication of the Department’s overall prognosis. The Department genuinely believes there is no ongoing crisis in the quality of education in South Africa. This is simply not true. A systematic reading of the available evidence, some of which has been reported in this document, would lead a reasonable observer to conclude that gross underperformance is ubiquitous, that inequality is systemic, and that there has been only marginal progress in educational outcomes since the transition. Without acknowledging the true severity of the problem, it is not possible to mobilize the resources and public support necessary to implement the uncomfortable and costly reforms that are necessary to make significant and sustained improvements in the quality of education.
While the low-level equilibrium that South Africa finds itself in has its roots in the apartheid regime of institutionalized inequality, this fact does not absolve the current administration from its responsibility to provide a quality education to every South African child, not only the rich. After 19 years of democratic rule most Black children continue to receive an education which condemns them to the underclass of South African society, where poverty and unemployment are the norm, not the exception. This substandard education does not develop their capabilities or expand their economic opportunities, but instead denies them dignified employment and undermines their own sense of self-worth. In short, poor school performance in South Africa reinforces social inequality and leads to a situation where children inherit the social station of their parents, irrespective of their motivation or ability. Until such a time as the Department and the ruling administration are willing to seriously address the underlying issues in South African education, at whatever political or economic cost, the existing patterns of underperformance and inequality will remain unabated.

52
12. References
Ball, D., Thames, M., & Phelps, G. (2008). Content knowledge for teaching: what makes it special? Journal of Teacher Education , 59 (5), 389.
Barber, M., & Mourshed, M. (2007). How the world's best-performing school systems come out on top. McKinsey & Company.
Biavaschi, C., Eichhorst, W., Giulietti, C., Kendzia, M. J., Muravyev, A., Pieter, J., Rodriguez-Planas,N., Schmidl, R. and Zimmerman, K. F. (2012). Youth unemployment and vocational training. Paper presented at the 7th IZA/World Bank Conference: Employment and Development, New Delhi, India, November 04 2012 – November 06, 2012.
Branson, N., Leibbrandt, M. and Zuze, T. L. (2009). What are the returns of tertiary education and who benefits?. In N. Cloete (Ed) Responding to the educational needs of post-school youth - Determining the scope of the problem and developing a capacity-building model, pp. 45 – 60. Centre for Higher Education Transformation (CHET).
Burger, R., Van der Berg, S. and Von Fintel, D. (2012). The unintended consequences of education policies on South African participation and unemployment. Stellenbosch Economic Working Paper 11/12, Department of Economics and the Bureau for Economic Research at the University of Stellenbosch.
Cloete, N. (2009). Synthesis. In N. Cloete (Ed) Responding to the educational needs of post-school youth - Determining the scope of the problem and developing a capacity-building model, pp. 1 – 18. Centre for Higher Education Transformation (CHET).
Cloete, N. and Butler-Adam, J. (2012). Introduction. In Perold, H., Cloete, N. and Papier, N. (Eds) Shaping the Future of South Africa’s Youth – Rethinking post-school education and skills training, pp. 1 – 6. Centre for Higher Education Transformation (CHET).
Coleman, J. (1972). Coleman on the Coleman Report. Educational Researcher , 1 (3), 13-14.
Coleman, J. (1975). What is Meant by 'an Equal Educational Opportunity'? Oxford Review of Education , 1 (1), 27-29.
DBE. (2011). Action Plan to 2014: Towards the Realization of Schooling 2025. Pretoria: Department of Basic Education.
DBE. (2011). Annual National Assessments 2011: A guideline for the interpretation and use of ANA results. Pretoria: Department of Basic Education.
DBE. (2012). Report on the Annual National Assessments 2012. Pretoria: Department of Basic Education.
DBE. (2011). Report on the Annual National Assessments of 2011. Pretoria: Department of Basic Education.
DBE. (2011b). Report on the Annual National Assessments of 2011. Pretoria: Department of Basic Education.

53
DBE. (2012). Report on the Qualitative Analysis of ANA 2011 Results. Pretoria: Department of Basic Education.
DoE. (2008a). Grade 3 Systemic Evaluation 2007 Leaflet. Pretoria: Department of Education.
DoE. (2002). Revised National Curriculum Statement Grades R-9 (Schools) Mathematics. Pretoria: Department of Education.
DoE. (2003). Systemic Evaluation: Foundation Phase (Mainstream). Pretoria: Department of Education.
Elmore, R. (2005). Accountable Leadership. The Educational Forum , 134-142.
Elmore, R. (2004a). Agency, Reciprocity, and Accountability in Democratic Education. Cambridge, MA: Consortium for Policy Research in Education.
Elmore, R. (2004b). School reform from the inside out: Policy, practice and performance. Cambridge, MA: Harvard Education Press.
Elmore, R. (2002). The price of accountability. Results , 6.
Fisher, G. and Scott, I. (2011). The role of Higher Education in Closing the Skills Gap in South Africa. Closing the Skills and Technology Gap in South Africa: Background Paper 3, World Bank Human Development Group, Africa Region.
Fleisch, B. (2008). Primary Education in Crisis: Why South African schoolchildren underachieve in reading and mathematics. Cape Town. : Juta & Co.
Foy, P., Martin, M., & Mullis, I. (2010). The limits of measurement: problems with estimating reading achievement in PIRLS 2006 for low-performing countries. Boston: TIMSS & PIRLS International Study Center.
Heckman, J. (2000). Policies to foster human capital. Research in Economics (54), 3-56.
Heyneveld, W., & Craig, H. (1996). Schools Count: World Bank Project Designs and the Quality of Primary Education in Sub-Saharan Africa. Washington, D.C.: World Bank.
Howie, S., & van Staden, S. (2012). South African Children;s Reading Literacy Achievement - PIRLS and prePIRLS 2011 Summary of the key results (Media briefing). Pretoria: Centre for Evaluation and Assessment.
Howie, S., Venter, E., Van Staden, S., Zimmerman, L., Long, C., Du Toit, C., et al. (2008). PIRLS 2006 Summary Report: South African Children's Reading Literacy Achievement. Pretoria: Center for Evaluation and Assessment.
Hugo, W., Jack, M., Wedekind, V., & Wilson, W. (2010). What makes education work? A literature review. Pietermaritzburg: Provincial Treasury KwaZulu-Natal.
Hungi, N., Makuwa, D., Ross, K., Saito, M., Dolata, S., van Capelle, F., et al. (2011). SACMEQ III Project Results: Levels and Trends in School Resources among SACMEQ School Systems. Paris: Southern and Eastern Africa Consortium for Monitoring Educational Quality.

54
Hungi, N., Makuwa, D., Ross, K., Saito, M., Dolata, S., van Capelle, F., et al. (2010). SACMEQ III Project Results: Pupil Achievement Levels in Reading and Mathematics. Paris: Southern and Eastern Africa Consortium for Monitoring Educational Quality.
ILO. (2012). Global Employment Trends for Youth 2012. Geneva: International Labour Office.
Jansen, J. (2012). I would seriously consider not sending my child to school in SA. Retrieved 2013 йил 9-January from Moneyweb: http://www.moneyweb.co.za/moneyweb-soapbox/i-would-seriously-consider-not-sending-my-child-to
Jansen, J., & Taylor, N. (2003). Educational Change in South Africa 1994-2003: case studies in large-scale education reform. Geneva: World Bank.
John, V. (2012). Improved annual national assessment results impossible, say academics. Johannesburg: Mail & Guardian, Dec 7-13; pg 14.
Kennedy, M. (1990). A survey of recent literature on teachers' subject matter knowledge. National Center for Research on Teacher Education.
Lewin, K. (2007). Improving Access, Equity and Transitions in Education: Creating a Research Agenda. Co. Sussex: Consortium for research on Educational Access, Transitions and Equity (CREATE).
Mayer, M. J., Gordhan, S., Manxeba, R., Hughes, C., Foley, P., Maroc, C., Lolwana, P. and Nell, M. (2011). Towards a youth employment strategy for South Africa. Development Planning Division Working Paper Series No. 28, Development Bank of Southern Africa.
McKay, V & Spaull, N. 2013. Teacher content knowledge in South Africa. Unpublished manuscript.
Motshekga, A. (2012). Statement on the release of the Annual National Assessment results for 2012. From Department of Basic Education: http://www.education.gov.za/Newsroom/Speeches/tabid/298/ctl/Details/mid/1929/ItemID/3569/Default.aspx
Motshekga, A. 2013. Motshekga: No crisis in education. Quoted in the Mail & Guardian 3 January. Online. Available: < http://mg.co.za/article/2013-01-03-motshekga-no-crisis-in-quality-of-education>
Mullis, I., Martin, M., Foy, P., & Arora, A. (2012). TIMSS 2011 International Results in Mathematics. Chestnut Hill, USA: TIMSS & PIRLS International Study Center and IEA.
NPC. (2012). National Development Plan 2030: Our Future - Make It Work. Pretoria: National Planning Commission, Presidency.
OECD. (2005). Teachers Matter: Attracting, Developing and Retaining Effective teachers. Paris: OECD Publications.
Rankin, N., Simkins, C., Rule, S., Trope, N. and Bernstein, A. (2007). Paths to employment. Challenges facing young people in accessing the job market. Centre for Development and Enterprise. [online] available from http://www.cde.org.za/attachment_view.php?aa_id=227
Reddy, V. (2006). Mathematics and Science Achievement at South African Schools in TIMSS 2003. Cape Town: HSRC Press.
55
Reddy, V., Prinsloo, C., Visser, M., Arends, F., Winnaar, L., Rogers, S., et al. (2012). Highlights from TIMSS 2011: The South African perspective. Pretoria: HSRC
RESEP & Oxford Policy Management. (2012). Consolidated Report: Public Expenditure Analysis for the Basic Education Sector in South Africa. Report for the Director of Basic Education. UNICEF.
Robeyns, Ingrid, "The Capability Approach", The Stanford Encyclopedia of Philosophy (Summer 2011 Edition), Edward N. Zalta (ed.), URL = <http://plato.stanford.edu/archives/sum2011/entries/capability-approach/>.
Ross, K., Saito, M., Dolata, S., Ikeda, M., Zuze, L., Murimba, S., et al. (2005). The Conduct of the SACMEQ III Project. In E. Onsomu, J. Nzomo, & C. Obiero, The SACMEQ II Project in Kenya: A Study of the Conditions of Schooling and the Quality of Education. Harare: SACMEQ.
Schleicher, A. (2009). Securing quality and equity in education: Lessons from PISA. Prospects (39), 251-263.
Schleicher, A. (2010). PISA 2009: Evaluating systems to improve education. Asia Society. [Online]. Available from: http://asiasociety.org/education/learning-world/pisa-chief-explains-data
Shabalala, J. (2005). The SACMEQ II Project in Swaziland: A Study of the Conditions of Schooling and the Quality of Education. Retrieved 2009, from Southern and Eastern Africa Consortium for Monitoring Educational Quality: http://www.sacmeq.org/education-swaziland.htm
Sheppard, C. and Cloete, N. (2009). Scoping the need for post-school education. In N. Cloete (Ed) Responding to the educational needs of post-school youth - Determining the scope of the problem and developing a capacity-building model, pp. 19 – 44. Centre for Higher Education Transformation (CHET).
Shepherd, D. (2011). Constraints to School Effectiveness: What prevents poor schools from delivering results? Stellenbosch Economic Working Papers 05/11 .
Shulman, L. (1986). Those who understand: knowledge growth in teaching. Educational Researcher , 15 (2), 4-14.
Smith, J. M. (2011). Connecting Young South Africans to Opportunity: Literature review and strategy. Cape Town: DG Murray Trust. [online] available from http://www.dmgt.co.za/files/2001/05/Literature-Review-Strategy.pdf
Soobrayan, P. (2012). Reflections on issues and the way forward for quality basic education. Leadership Dialogue 6 December. Johannesburg.
Spaull, N. (2011). A Preliminary Analysis of SACMEQ III South Africa. Stellenbosch Economic Working Papers .
Spaull, N. (2012). Poverty & Privilege: Primary school inequality in South Africa. International Journal of Educational Development , Available online: 8 November 2012.
Spaull, N. (2011b). Primary School Performance in Botswana, Mozambique, Namibia and South Africa. Paris: Southern and Eastern African Consortium for Monitoring Educational Quality (SACMEQ) Working Paper no.8.
Spaull, N. (2011). Primary School Performance in Botswana, Mozambique, Namibia and South Africa: A Comparative Analysis of SACMEQ III. SACMEQ Working Papers , 1-74.

56
Spaull, N., & Taylor, S. (2012). Effective enrolment - creating a composite measure of educational access and educational quality to accurately describe education system performance in sub-Saharan Africa. Stellenbosch Economic Working Papers 21/12 , 1-25.
Taylor, N. (2011). Matric: quality vs quantity. Retrieved 2013 йил 9-January from Mail & Guardian: http://mg.co.za/article/2011-03-11-matric-quality-vs-quantity
Taylor, N. (2011b). National School Effectiveness Study - Synthesis Report. Johannesburg: JET Education Services.
Taylor, N., & Moyane, J. (2004). Khanyisa Education Support Programme: Baseline Study Part 1: Communities, Schools and classrooms' Memorandum (April 2005) 38-41.
Taylor, N., & Vinjevold, P. (1999). Getting Learning Right. Johannesburg: Joint Education Trust (JET).
Taylor, N., Fleisch, B., & Shindler, J. (2008). Changes in Education since 1994. Pretoria: The Presidency: Input into the 15 year review process.
Taylor, N., Muller, J., & Vinjevold, P. (2003). Getting Schools Working. Cape Town: Pearson Education.
Taylor, S. (2012). A note on matric result trends. Unpublished manuscript .
Taylor, S. (2011). Uncovering indicators of effective school management in South Africa using the National School Effectiveness Study. Stellenbosch Economic Working Papers 10/11 , 1-51.
Trong, K. (2010). The Relative Risk-Percentage Equity Index: Measuring Equity in Reading Achievement Across PIRLS 2006 Countries. Hamburg: International Association for the Evaluation of Education.
UNESCO. (2005). Education For All Global Monitoring Report 2005. Paris: UNESCO Publishing.
Van der Berg, S. (2007). Apartheid's Enduring Legacy: Inequalities in Education. Journal of African Economies , 16 (5), 849-880.
Van der Berg, S. (2007). Apartheid's Enduring Legacy: Inequalities in Education. Journal of African Economies , 16 (5), 849-880.
Van der Berg, S., & Spaull, N. (2012). Interview with the Mail & Guardian regarding ANA 2012. Johannesburg: Mail & Guardian; pg 14, Dec 7-13, 2012.
WCED. (2010). Grade 3 Improvement Project: Main Report and Recommendations. Department of Economics, University of Stellenbosch. Stellenbosch: Western Cape Education Department.