integrated education program - nic spaull · pdf fileintegrated education program ... grade...
TRANSCRIPT
Integrated Education Program Impact Study of SMRS Using Early Grade Reading Assessment in Three Provinces in South Africa
July 2009 This publication was produced for review by the United States Agency for International Development. It was prepared by RTI International.

Integrated Education Program Impact Study of SMRS Using Early Grade Reading Assessment in Three Provinces in South Africa Contract 674-C-00-04-00032-00 Prepared for USAID/Southern Africa Prepared by Benjamin Piper RTI International 3040 Cornwallis Road Post Office Box 12194 Research Triangle Park, NC 27709-2194
The author’s views expressed in this publication do not necessarily reflect the views of the United States Agency for International Development or the United States Government.
Impact Study of SMRS Using Early Grade Reading Assessment in Three Provinces in South Africa iii
Table of Contents Page
List of Figures.........................................................................................................iv
List of Tables...........................................................................................................vi
I. Executive Summary .................................................................................... 1
II. Introduction.................................................................................................. 2 II.a Introduction to intervention ................................................................ 3 II.b Introduction to research design ......................................................... 3
III. Sampling...................................................................................................... 4
IV. Descriptive Statistics ................................................................................... 7
V. Statistical Tests .......................................................................................... 10 V.a Statistical Tests for Treatment ......................................................... 10 V.b Statistical Tests for Grade R............................................................ 12 V.c Statistical tests for gender ............................................................... 14
VI. Test Reliability............................................................................................ 16
VII. Assessment results ................................................................................... 19 VII.a Letter sound fluency results............................................................. 19 VII.b Word naming fluency results ........................................................... 23 VII.c Oral reading fluency results ............................................................. 26 VII.d Scatterplot analysis.......................................................................... 30
VIII. Analysis: Multiple Regression Results ...................................................... 31 VIII.a Differences-in-differences results .................................................... 33 VIII.b Threats to Validity: Provincial Effects .............................................. 37
IX. Discussion: Effect Sizes ............................................................................ 38 IX.a South Africa Benchmarks ................................................................ 39
X. Recommendations .................................................................................... 40
XI. Conclusion................................................................................................. 43
Appendix 1: Average Differences Between Baseline and Post-Assessment Scores by Treatment and Control Schools and Gender ................. 44
iv Impact Study of SMRS Using Early Grade Reading Assessment in Three Provinces in South Africa
List of Figures Page
Figure 1. Screeplot estimating the explained variance (eigenvalue) of the first principal component created from the various sub-tasks within the EGRA ............................................................................................................ 19
Figures 2 and 3. Histograms expressing the average gain in letter sounding fluency between baseline and post-assessment for the entire sample (left) and control and treatment (right). For Figure 3 (right), 0 is control and 1 is treatment..................................................................................... 20
Figures 3 and 4. Histograms portraying the percentage of learners scoring at certain levels on the gain in letter reading fluency score for gender (left) and Grade R (right) by treatment (control – left, treatment – right) ................................................................................................ 21
Figure 5. Histograms portraying the letter reading fluency gain scores for control boys (top left), control girls (top right), treatment boys (bottom left), treatment girls (bottom right)........................................................... 22
Figures 6 and 7. Boxplots portraying the average gain in letters correct per minute for the entire sample (left) and by treatment status (right). Control is 0 (left), treatment is 1 (right). .................................................... 22
Figure 8. DIBELS guidelines for letter sounding fluency in first grade.............. 23
Figure 9. Letter sounding fluency benchmark histograms using the post-assessment by treatment group. Control is 0 (left), treatment is 1 (right) ............................................................................................................ 23
Figures 10 and 11. Word per minute gains between pre and post-assessment expressed as histograms by percent for the whole sample (left) and by treatment status (right), where 0 is control and 1 is treatment. ............................................................................................ 24
Figures 12 and 13. Word per minute gains expressed as percents in histograms disaggregated by gender (left) and treatment and gender (right). Control, boys (0,0); Control, girls (0,1); treatment, boys (1,0), treatment, girls (1,1). ............................................................................................ 25
Figure 14. Boxplot for words per minute gain compared by treatment group (0 is control and 1 is treatment) ................................................................. 25
Figure 15. Word per minute gains expressed on boxplots by Grade R attendance, where 0 is no attendance and 1 is Grade R attendance.............. 26
Figure 16 and 17. Oral reading fluency boxplots organized for the whole sample (left) and by treatment (right), where 0 is control and 1 is treatment. .............................................................................................. 27
Figures 18 and 19. Oral reading fluency gain score disaggregated by Grade R attendance (left – where 0 is control and 1 is treatment) and
Impact Study of SMRS Using Early Grade Reading Assessment in Three Provinces in South Africa v
gender (right – where 0 is control and 1 is treatment). ........................................ 27
Figure 20. Oral reading fluency gain boxplots by treatment group (0 is control, 1 is treatment)...................................................................................... 28
Figure 21. Oral reading fluency benchmarks from US DIBELS measures ........................................................................................................ 29
Figure 22 and 23. Oral reading fluency histograms using US DIBELS benchmarks for the entire sample (left) and by treatment (right – where 0 is control and 1 is treatment)............................................................................. 29
Figure 24. Scatterplots of baseline letters per minute score against post-assessment letters per minute score by treatment group, where 0 is control and 1 is treatment ................................................................................. 30
Figure 25. Histogram for words correct per minute on baseline against post-assessment by treatment group, where 0 is control and 1 is treatment ........................................................................................................ 31
Figure 26. The impact of South African SMRS on Letters Read per Minute ........................................................................................................ 35
Figure 27. The impact of South African SMRS on Words Identified per Minute ........................................................................................................ 36
Figure 28. The impact of South African SMRS on Words Read in Connected Text per Minute .................................................................................. 37
Figure 29. South African benchmark graph with 90th percentile school, treatment and control scores ................................................................... 40

vi Impact Study of SMRS Using Early Grade Reading Assessment in Three Provinces in South Africa
List of Tables Page
Table 1. Achieved sample at baseline by treatment, province and gender .............................................................................................................. 4
Table 2. Achieved sample at baseline and post-assessment by province and treatment status................................................................................ 5
Table 3. Kindergarten attendance by province .................................................. 6
Table 4. Descriptive statistics for child age by treatment status and province .............................................................................................................. 6
Table 5. Basic descriptive statistics at baseline................................................. 7
Table 6. Descriptive statistics for 4 EGRA sub-tasks including and excluding 0 scores for post and gain scores.......................................................... 8
Table 7. Number of cases discontinued by treatment and gender .................. 10
Table 8. T-test examining whether treatment status has a statistically significant relationship with letter sounding fluency, T indicating T-score and Pr for probability ............................................................................................ 11
Table 9. T-test examining whether treatment status has a statistically significant relationship with word naming fluency ................................................ 11
Table 10. T-test examining whether treatment status has a statistically significant relationship with oral reading fluency in connected text ...................................................................................................... 12
Table 11. T-test examining whether treatment status has a statistically significant relationship with reading comprehension ........................................... 12
Table 12. Letter sounding fluency by kindergarten attendance ..................... 13
Table 13. Word naming fluency by kindergarten attendance......................... 13
Table 14. Oral reading fluency by kindergarten attendance .......................... 14
Table 15. Reading comprehension by kindergarten attendance ................... 14
Table 16. T-test for letter sounding fluency by gender ................................... 15
Table 17. T-test for word reading fluency by gender...................................... 15
Table 18. T-test for oral reading fluency by gender........................................ 15
Table 19. T-test for reading comprehension by gender ................................. 16
Table 20. Pearson correlations presenting the correlations between the sub-tasks in the EGR assessment in South Africa ........................................ 17
Table 21. Cronbach’s alpha scores for the sub-tasks related to the South African Early Grade Reading Assessment ................................................ 17
Impact Study of SMRS Using Early Grade Reading Assessment in Three Provinces in South Africa vii
Table 22. Principal component loadings and component uniqueness........... 18
Table 23. Multiple regression results for fitted models investigating the relationship between the SMRS treatment and several EGRA sub-tasks ........................................................................................................ 32
Table 24. Differences-in-differences causal estimates of the impact of the SMRS program on learner achievement in letter sounding fluency, word naming fluency and oral reading fluency ....................................... 34
Table 25. Multiple regression analysis matching the treatment dummy variable and province .............................................................................. 38
Table 26. Comparing effect sizes for outcome variables across t-tests, regression and difference-in-difference designs ........................................ 39


Impact Study of SMRS Using Early Grade Reading Assessment in Three Provinces in South Africa 1
I. Executive Summary In late January 2009, RTI International collaborated with the Department of Education, South Africa and the Molteno Institute of Language and Literacy (MILL) to collect a baseline early grade reading assessment (EGRA) in Limpopo, Mpumalanga and North West provinces. Ten treatment and five control schools were selected in each province, and at the learner level, ten or twenty learners were assessed depending on the number of Grade 1 teachers in each school, for a total of 650 learners. Learners were assessed in four tasks, including letter sound recognition, word recognition, reading a simple passage and answering comprehension questions about the passage. Between February and June 2009, approximately 21 out of 45 lessons in the Systematic Method for Reading Success (SMRS) program were implemented in a total of 291 treatment schools. A post-assessment using early grade reading protocols was implemented in June 2009, with a final sample of 546 learners. In all, a total of 1196 learner-level observations were collected.
The baseline assessment revealed that initial reading skills were very limited. This was unsurprising given that learners were assessed during the first month of Grade 1. The mean number of letter sounds identified was 1.75, and, notably 65.2% of the learners sampled were unable to identify a single letter sound at the baseline. Only 0.6% of learners reached the international benchmark for letter/sound recognition at the beginning of Grade 1, at 26 letter sounds.2 When asked to identify commonly used words, the mean number of words identified was 0.18, and 90.2% of learners did not identify any words at all, and none met the international benchmark for word identification. For the third task, reading a short passage, only two of the 650 learners attempted the task. For the fourth task, reading comprehension questions, only one child answered any of the questions and none successfully. There were no statistically significant differences in the reading skills between boys and girls; though the handful of higher-achieving learners on the letter sound recognition tasks were all girls. Finally, it appears that learners in treatment schools scored statistically significantly higher on the letter sound recognition task, but no differently on the word recognition task, than learners in control schools. In short, most learners showed little literacy skills at the beginning of Grade 1.
The baseline and post-intervention research design evaluating a sophisticated and intense literacy program allowed the estimation of the causal impact of the program on early learner reading skills. This two-phased longitudinal analysis allowed us to use a differences-in-differences analytic strategy to estimate the impact of the program on learner outcomes. We find that the SMRS program increased the average letters per minute gain between the baseline and post-assessment by 14.34 letters, a .80 standard deviation gain.3 Similarly, the program increased the average words per
1 One intervention school in Mpumalanga Province dropped out during the pilot. 2 This benchmark comes from the DIBELS early reading benchmarks and is for the first three months of Grade 1. 3 These effect sizes come from the differences-in-differences estimator, though the findings are quite similar for the other two estimating strategies (t-tests and regression).

2 Impact Study of SMRS Using Early Grade Reading Assessment in Three Provinces in South Africa
minute gain between the baseline and post-assessment by 4.56 words per minute (.79 standard deviations). Critically, the data shows that the program increased the average words read correctly in a connected text passage by 7.21 words (.80 standard deviations), and learners in treated schools scored 8.24 percent higher on reading comprehension (.79 SDs). Compared to the effect of being in a control school for six months, being a learner in an SMRS school was worth 2.6 times the effect of being in school for half a year on the letter sounding fluency task, 2.77 times the effect of being in school for half a year for the word fluency task, and 2.85 times the effect of a half year of school for the oral reading fluency task, and 2.6 times better on reading comprehension. These remarkably large results were robust to a variety of specifications of the regression models and the inclusion of a variety of other variables. In short, despite that less than half of the intervention lessons were completed at the time of the post-assessment, the SMRS program dramatically increased the learning outcomes for South African learners across Limpopo, Mpumalanga and North West provinces.
II. Introduction As a result of USAID and RTI International’s experience in South African education through the Integrated Education Program (IEP), South Africa was introduced to the relevance of the Early Grade Reading Assessment. In fact, the Ministry of Education has adapted a South African specific version of EGRA for diagnostic purposes. The baseline and evaluation assessments, therefore, were based on the local South African EGRA instrument, which has four major individual assessments embedded in it. First, learners were asked to identify the sounds of letters. Second, learners were asked to identify frequently used words. Third, the assessment provided learners the opportunity to read a short, locally relevant and created passage of a few sentences long. Fourth, and finally, the learners were asked some simple comprehension questions related to the passage they read.
MILL, a local non-governmental organization specializing in literacy support and development, was responsible for managing the collection of data for this EGRA, supported by MILL staff and Departmental of Education officers as data collectors, with technical assistance from RTI International. The data collectors were trained just prior to data collection and provided the opportunity to practice data collection using the EGRA instrument in role play settings as well as in a local Gauteng school. Baseline data was collected from treatment and control schools the last week of January 2009, which, given when South African schools are in session (January – December) meant that the learners were assessed at the very beginnings of their first grade experience. Post-intervention data was collected during early June 2009, which means that the impacts identified here represent a little bit less than one half of a school year, or approximately six months of school.
This report is organized in the following way. First, the reader is introduced to the intervention, research design and analytic methods. Then, the basic descriptive and reliability statistics are presented. Then, for the individual sub-tasks, we present

Impact Study of SMRS Using Early Grade Reading Assessment in Three Provinces in South Africa 3
specific analyses using t-tests, multiple regression analyses and differences-in-differences analyses in our attempt to explain the variation in early grade reading skills identified between learners in treatment and control schools. The report closes with a set of recommendations based on the findings of the study.
II.a Introduction to intervention This report is the impact evaluation for an experimental intervention on a set of early grade literacy practices in South Africa. Dr. Sandra Hollingsworth devised a system called the Systematic Method for Reading Success (SMRS) which has been proven to be successful in both Mali and Niger in West Africa. The SMRS program, usually implemented over 55 lessons, is quite intensive and heavily scripted. The basic thesis behind the program is that learners are systematically introduced to letter sounds, blending sounds into words, recognizing sight words, learning vocabulary and comprehension skills through teacher read-alouds, then reading words in decodable and predictable stories. Because of the systematic nature of the intervention, learners can be continuously successful, beginning with Story 1 on the first day of school.
In the South African context, the nature of the linguistic structures of the languages, required that only 45 lessons were needed to complete SMRS. Because of several issues explained below and in the appended report on SMRS Mastery Test Results, most teachers only finished 21 of the 45 lessons for this program. The program was implemented in treatment schools between February and early June 2009. Note that the program was adapted to local languages for each of the three provinces included in the intervention, North West, Limpopo and Mpumalanga provinces.
II.b Introduction to research design The design of the data collection was as follows. We sampled from North West, Limpopo and Mpumalanga provinces, stratifying our sampling at the district level by the subset of schools that get priority support from the Ministry of Education given their poverty and need. The language of instruction used in Grade 1 in these three provinces differs, so we ran separate analyses by province to determine whether our findings were sensitive to regional identification and language. In each province 10 treatment and 5 control schools in Grade 1 were sampled, with an effort to ensure gender equity. In schools with more than one Grade 1 teacher, 20 learners were sampled, often by sampling 10 learners from each of 2 classrooms. Our research design allowed us to estimate the average impact of the SMRS method on learner achievement by comparing scores on the baseline and post-intervention assessment. This simple experimental research design allowed us to identify causal impacts on learner achievement. We buttressed this class experimental design with the statistical method of differences-in-differences in order to increase our ability to estimate a convincing causal effect of the program on learner achievement.
4 Impact Study of SMRS Using Early Grade Reading Assessment in Three Provinces in South Africa
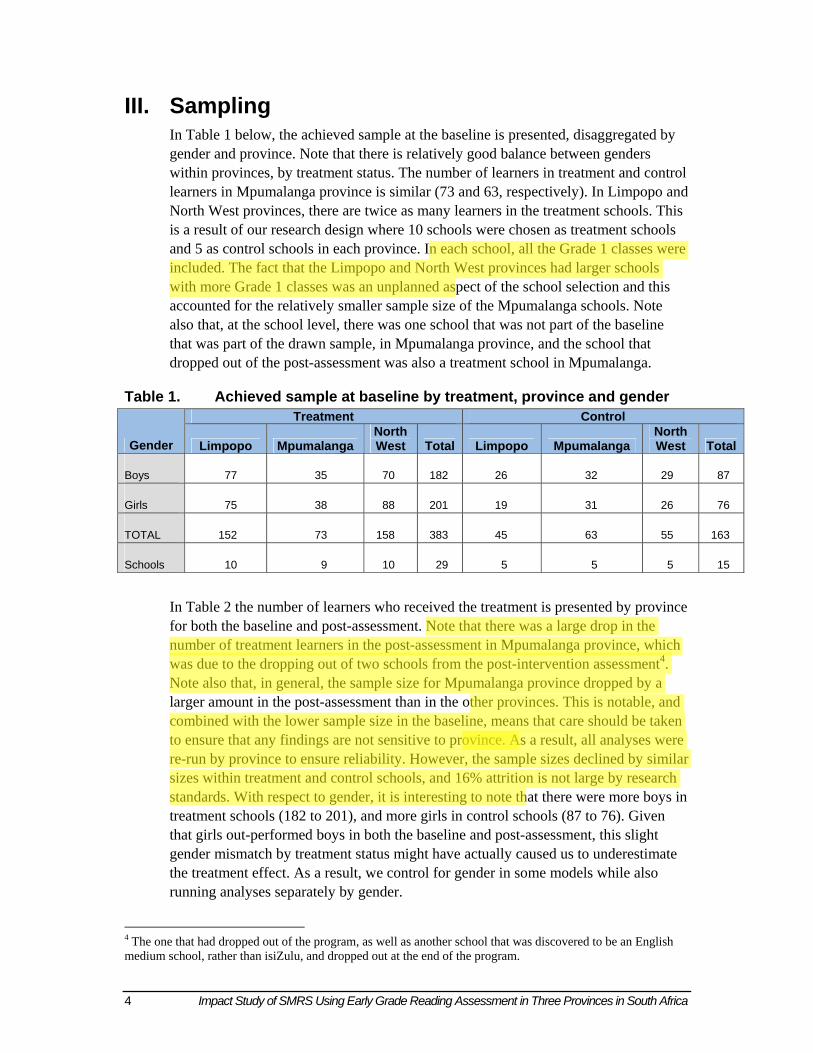
III. Sampling In Table 1 below, the achieved sample at the baseline is presented, disaggregated by gender and province. Note that there is relatively good balance between genders within provinces, by treatment status. The number of learners in treatment and control learners in Mpumalanga province is similar (73 and 63, respectively). In Limpopo and North West provinces, there are twice as many learners in the treatment schools. This is a result of our research design where 10 schools were chosen as treatment schools and 5 as control schools in each province. In each school, all the Grade 1 classes were included. The fact that the Limpopo and North West provinces had larger schools with more Grade 1 classes was an unplanned aspect of the school selection and this accounted for the relatively smaller sample size of the Mpumalanga schools. Note also that, at the school level, there was one school that was not part of the baseline that was part of the drawn sample, in Mpumalanga province, and the school that dropped out of the post-assessment was also a treatment school in Mpumalanga.
Table 1. Achieved sample at baseline by treatment, province and gender Treatment Control
Gender Limpopo Mpumalanga North West Total Limpopo Mpumalanga
North West Total
Boys 77 35 70 182 26 32 29 87
Girls 75 38 88 201 19 31 26 76
TOTAL 152 73 158 383 45 63 55 163
Schools 10 9 10 29 5 5 5 15
In Table 2 the number of learners who received the treatment is presented by province for both the baseline and post-assessment. Note that there was a large drop in the number of treatment learners in the post-assessment in Mpumalanga province, which was due to the dropping out of two schools from the post-intervention assessment4. Note also that, in general, the sample size for Mpumalanga province dropped by a larger amount in the post-assessment than in the other provinces. This is notable, and combined with the lower sample size in the baseline, means that care should be taken to ensure that any findings are not sensitive to province. As a result, all analyses were re-run by province to ensure reliability. However, the sample sizes declined by similar sizes within treatment and control schools, and 16% attrition is not large by research standards. With respect to gender, it is interesting to note that there were more boys in treatment schools (182 to 201), and more girls in control schools (87 to 76). Given that girls out-performed boys in both the baseline and post-assessment, this slight gender mismatch by treatment status might have actually caused us to underestimate the treatment effect. As a result, we control for gender in some models while also running analyses separately by gender.
4 The one that had dropped out of the program, as well as another school that was discovered to be an English medium school, rather than isiZulu, and dropped out at the end of the program.

Impact Study of SMRS Using Early Grade Reading Assessment in Three Provinces in South Africa 5
Table 2. Achieved sample at baseline and post-assessment by province and treatment status
Baseline Post Attrition Treatment Treatment Treatment
Province Yes No Total Yes No Total Yes No Total
Limpopo 160 50 210 152 45 197 8 5 13
Mpumalanga 110 80 190 73 63 136 37 17 54
North West 180 70 250 158 55 213 22 15 37
TOTAL 450 200 650 383 163 546 67 37 104
The following analysis examines whether provision (and attendance) in kindergarten differed across provinces. Note that learners were asked whether they had previously attended the Grade R, reception or kindergarten, prior to enrollment in Grade 1. Table 3 presents the very revealing results. Note that 65 of 99 (66%) of kindergarten non-attendees were found in Mpumalanga province. It is unclear from this data whether this non-attendance is a characteristic of Mpumalanga as a whole or whether it is simply representative of the particular subset of schools sampled from within Mpumalanga. The rates of attendance are much higher in Limpopo and North West province, at 89.3% and 93.9%, respectively. These findings suggest the need to review whether provincial effects are collinear with kindergarten effects, in other words, care must be paid to ensure that findings attributable to kindergarten attendance are not seen as dependent on province, and vice versa. Note that these data were only collected at the post-assessment data collection. The bottom rows show the rates of Grade R across treatment and province groups. Note that there does not seem to be much difference in kindergarten incidence across treatment and control for learners with and without Grade R in Mpumalanga province (52.1% of treatment learners had Grade R, 52.3% of control learners had Grade R). In Limpopo province, 91.4% of treated learners and 82.2% of control learners had Grade R. In North West province, 85.1% of treated learners and 74.2% of control learners had Grade R. It is notable that in both Limpopo and North West provinces the percentage of learners in Grade R was higher in treatment than in control schools. In neither province, however, were the differences large enough to suggest that test results would be biased, and that the relationships found would be likely to be driven by Grade R attendance. That said, kindergarten attendance remains an important predictor variable in future analyses given the potential collinearity with Mpumalanga province.

6 Impact Study of SMRS Using Early Grade Reading Assessment in Three Provinces in South Africa
Table 3. Kindergarten attendance by province Limpopo Mpumalanga North West Total
No Grade R 21 65 13 99
Grade R 176 71 200 447
Attendance rate 89.3% 52.2% 93.9% 81.9%
Treatment 13 35 9 57 No Grade R
Control 8 30 4 42
Treatment 139 38 149 326 Grade R
Control 37 33 51 121
The table below (Table 4) describes the relative ages of learners by province and treatment status. The purpose of creating this table is to determine whether there are systematic differences by child age that might skew the findings in the paper. Note that the oldest learners are found in Mpumalanga province, with an average age of 6.42 years, which is larger than the ages in Limpopo (5.98) and North West (6.06) provinces. There seem to be small differences, if any, in the ages of learners in treatment and control schools in each province. The smallest gap is in North West province, where treatment learners are 6.07 years on average and control learners are 6.06 years. The gap is widest in Limpopo province, with treatment learners being a bit older, at 6.07 years rather than 5.69 years. Nothing in this crosstabulation is different enough to suggest that any of the findings would be driven by systematic differences in child age across province and treatment status.
Table 4. Descriptive statistics for child age by treatment status and province
N Mean SD Min Minimum
Treatment 152 6.07 0.49 5 8
Control 45 5.69 0.63 4 7 Limpopo
Total 197 5.98 0.54 4 8
Treatment 73 6.36 0.90 5 9
Control 63 6.49 0.93 5 11 Mpumalanga
Total 136 6.42 0.92 5 11
Treatment 152 6.07 0.48 5 8
Control 49 6.06 0.66 5 9 North West
Total 201 6.06 0.53 5 9

Impact Study of SMRS Using Early Grade Reading Assessment in Three Provinces in South Africa 7
IV. Descriptive Statistics In this section descriptive statistics are presented that illuminate the basic achievement scores of South African learners on the four sub-tasks of the EGRA. For each of the sub-tasks we present the number of observations, means, standard deviations, and minimum and maximum observations. Table 5 below presents descriptive statistics for the baseline assessment. Note that learners struggled quite a bit on these tasks, with the average child identifying less than 2 letters in a minute (mean=1.75). In fact, deeper analysis shows that only 4 of the 650 learners in our sample, 0.6%, meet the DIBELS international benchmark for learners not at risk for reading difficulties. It is worth noting, moreover, that the DIBELS benchmark score for letter sound tasks shows that learners who score below 37 sounds and above 26 on this task are at some risk, while those scoring less than 26, like 99.4% of South African learners sampled, are at risk. This suggests that very few of the learners in our baseline sample had much, if any, introduction to basic phonemic awareness skills.
Of the 650 learners who attempted the letter sound task, only 524 undertook the common word identification task. Of those that did, the mean score was only .18, so for the average five learners, only one could correctly identify even one word. Further, given that the maximum words correct score was 10, this is far less than the international benchmark of 26. Finally, only 2 learners attempted to read the passage, and one of those was unable to correctly read any words. Only one child even attempted the comprehension questions associated with the passage reading. These descriptive statistics provide strong evidence that the reading skills of the learners in our baseline sample, both treatment and control schools, were quite low, and for most learners, largely nonexistent. It is important to reiterate that this is to be expected given the location and poverty levels of these schools as well as the fact that the data was collected at the very beginning of Grade 1, less than a month into the learners’ academic careers.
Table 5. Basic descriptive statistics at baseline
Item N Mean Standard deviation Minimum Maximum
Letter sounding fluency (Pre) 650 1.75 4.26 0 36
Word naming fluency (Pre) 524 0.19 0.81 0 10
Oral reading fluency (Pre) 2 5.5 7.78 0 11
In Table 6 below, descriptive statistics for the post-assessment are presented in combination with average gain scores. For the sake of comparison, gain scores (average score on post-assessment less average score on baseline) are presented as well. Note that the average score on the letter sounding fluency task increased to 20.7 letters per minute, a dramatic jump from 1.75 letters in the baseline. The average learner-level gain was 19 points, with some learners able to read nearly 100 letters in a minute (maximum=98). Regarding word naming fluency, it is interesting that South African learners could identify less than 6 words per minute (mean=5.92) on the post-

8 Impact Study of SMRS Using Early Grade Reading Assessment in Three Provinces in South Africa
assessment, but were able to read more words than that in the connected text passage (mean=8.98). The relatively low reading comprehension scores at the post-assessment (mean=0.11) means that few learners were able to read the passage successfully enough to understand. Notably, given the variation in lesson completion in schools, it is possible that there would be higher scores on comprehension if the program had been completed.
The expanded table below (Table 6) disaggregates achievement on these sub-tasks for the gain scores, which incorporate information from both baseline and post-assessments. This table is a simple way to examine whether the treatment had any impact, though no statistical significance can be inferred by differences in this table alone. For letter fluency average gain, note that boys and girls in treatment schools gained more than their counterparts in control schools (13.84 letters per minute and 13.85 letters per minute) though boys scored about 5 letters per minute less than girls in both treatment and control schools. Findings were similar for word naming fluency, with girls in treatment schools gaining 4.98 words per minute more than girls in control schools (8.20 – 3.22) and boys in treatment schools gaining 4.05 words per minute more than boys in control schools (5.98 – 1.93). Notably, this led to an even higher increase in words read in connected text (oral reading fluency) for girls in treatment than control schools (8.24 words) than for boys (6.10 words). Finally, this also led to a greater impact for girls between treatment and control schools in reading comprehension, with girls in treatment schools gaining 11% more questions correct and boys 8% more. Note that for all of these analyses, it should be reiterated that these are average differences in average gains between treatment and control schools. Appendix 1 presents the disaggregated achievement scores for boys and girls across baseline, post-assessment and gain scores.
Table 6. Descriptive statistics for 4 EGRA sub-tasks including and excluding 0 scores for post and gain scores
Item N Mean Standard deviation Minimum Maximum
Letter sounding fluency (Post) 546 20.71 19.31 0 98
Letter sounding fluency (Gain) 537 18.64 18.01 -5 98
Word naming fluency (Post) 546 5.92 7.68 0 40
Word naming fluency (Gain) 537 5.74 7.64 -3 40
Oral reading fluency (Post) 546 8.98 12.95 0 64.07
Oral reading fluency (Gain) 537 8.99 13.03 0 64.07
Reading comprehension (Post) 546 0.11 0.22 0 1
Including 0 scores
Reading comprehension (Gain)
537 0.10 0.22 0 1

Impact Study of SMRS Using Early Grade Reading Assessment in Three Provinces in South Africa 9
Item N Mean Standard deviation Minimum Maximum
Letter sounding fluency (Post) 492 22.98 19.01 1 98
Letter sounding fluency (Gain) 483 20.78 17.74 0 98
Word naming fluency (Post) 389 8.31 7.94 1 40
Word naming fluency (Gain) 380 8.15 7.91 0 40
Oral reading fluency (Post) 345 14.21 13.83 1 64.07
Oral reading fluency (Gain) 338 14.28 13.94 1 64.07
Reading comprehension (Post) 200 .29 .28 0 1
Excluding 0 scores
Reading comprehension (Gain)
193 .29 .29 0 1
Given the low achievement of learners on these tasks in general, Table 7 presents the number of learners for each task that were unable to continue the task. This is disaggregated by which type of assessment it was, treatment status, and gender. Note that on the baseline assessment, a full 65% of learners were unable to name a single letter, and 72.3% of learners were unable to identify a single word. By contrast, in treatment schools, only 4.8% of learners were discontinued in the post-assessment on letter sounding fluency. This is in contrast to 23.31% of learners who discontinued in letter sounding in control schools. This suggests that the SMRS program was able to increase the achievement of a group of nearly 20% of learners that otherwise would have remained non-readers. Similarly, for word naming fluency, 22.98% of learners in treatment schools were unable to identify a word, while 41.72% of control learners weren’t able to do so, again nearly 20% of learners. Of course, SMRS had an impact on other learners, but this shows that the program was helpful for a group of learners that would otherwise have benefited almost not at all from the typical educational experience. As if more evidence was needed, there were 21.49% fewer learners who discontinued the oral reading fluency task in treatment schools than in control schools. This is remarkable because it is likely that each of these groups of 20% are different, and that this assessment is picking up subsets of learners that are being affected by different parts of the SMRS program. With respect to gender, note that only 5.42% of girls were still discontinued in the letter sounding fluency task at the post-assessment. This means that nearly 60% of girls between the baseline and post-assessment entered into the “reading” field in some part. The number was just over 51% of boys. Comparing the genders, there is a difference of 16.95% between the number of boys that were discontinued on the word naming fluency task than girls, but this gap lessens to 7.24% for oral reading fluency. It is interesting to note at this point that while there is certainly a large gender gap, that the gender gap is smaller than the gap created by being in treatment schools, but a significant percentage.

10 Impact Study of SMRS Using Early Grade Reading Assessment in Three Provinces in South Africa
Table 7. Number of cases discontinued by treatment and gender Pre/Post Treatment Control Boy Girl Total
Pre 287 (63.78%) 137 (68.50%) 214 (65.64%) 210 (64.81%)
424 (65.23%)
Letter sounding fluency
Post 16 (4.18%) 38 (23.31%) 39 (14.50%) 15 (5.42%) 54 (9.89%)
Pre 301 (66.89%) 169 (84.50%) 247 (75.77%) 223 (68.83%)
470 (72.31%)
Word naming fluency
Post 88 (22.98%) 68 (41.72%) 100 (37.17%) 56 (20.22%) 156 (28.57%)
Pre 449 (99.78%) 200 (100.00%) 325 (99.69%) 324 (100.00%)
649 (99.85%)
Oral reading fluency
Post 108 (28.20%) 81 (49.69%) 103 (38.29%) 86 (31.05%) 189 (34.62%)
Pre 450 (100.00%) 200 (100.00%) 326 (100.00%) 324 (100.00%)
650 (100.00%)
Reading comprehension Post 367 (95.82%) 163 (100.00%) 263 (97.77%) 267
(96.39%) 530 (97.07%)
V. Statistical Tests In order to examine whether the differences identified above are a result of random fluctuations of the data or are representative of true differences between the outcomes related to variables of interest, we performed several statistical t-tests to examine the equivalence of means. These t-tests are organized by question variable, including treatment, gender and kindergarten attendance. The outcome variables on the t-tests are the set of four outcome variables on the South African EGRA, namely letter sounding fluency, word naming fluency, oral reading fluency and reading comprehension. Note that only statistically significant relationships are presented here for the sake of space.
V.a Statistical Tests for Treatment The tables that follow present the results of t-tests for several outcome variables tested to determine whether there were statistically significant differences between child’s scores on these literacy tasks and treatment status. Note that these scores are gain scores, which mean that we are examining whether the average change in score between pre and post-intervention differs by treatment. This can be seen as treatment effect, so these simple t-tests serve as an initial test of determining whether the SMRS program had a statistically significant impact on learner achievement in literacy. Remarkably, the four tables below (Tables 8-11) show statistically significant differences advantaging learners in the treatment group. In other words, learners in treatment schools score higher on letter sounding fluency (p<.001), word naming fluency (p<.001), oral reading fluency (p<.001) and reading comprehension (p<.001). Moreover, the effects are quite large. For example, for letter sounding fluency, the difference in average gain between learners in treatment and control groups was 14.14

Impact Study of SMRS Using Early Grade Reading Assessment in Three Provinces in South Africa 11
letters per minute, which is 0.79 standard deviations. Comparatively, the gains were 2.6 times larger for learners in treatment than control schools. A look at the confidence intervals reveals two intervals quite far apart (between 7 and 10.7 for control learners, and 21 and 24.8 for treatment learners). Table 8 confirms that a large difference exists between the average gain score for learners in treatment and control schools for the word fluency measure, at 4.61 words per minute, or 0.60 standard deviations. This effect size meant, substantively, that learners in treatment schools had a 2.82 times larger gain than learners in control schools. For the oral reading fluency measure, learners in treatment schools gained 7.31 words per minute more than learners in control schools, an effect size of 0.56 standard deviations. Substantively, this means that treated learners gained 2.86 times the amount of words per minute than control schools did. Finally, a similar effect was found for reading comprehension. Table 8 shows that learners in treatment schools gained 9 percentage points more on the reading comprehension measure than did control learners, which is a 0.59 standard deviation effect size. Nine percentage points sounds modest, except that 9% means that learners in treatment schools increased their reading comprehension 3.25 times more than learners in control schools did.
Table 8. T-test examining whether treatment status has a statistically significant relationship with letter sounding fluency, T indicating T-score and Pr for probability
95% confidence interval
Obs Mean Stan. Err. Stan. Dev. Lower Upper
Control 163 8.79 0.95 12.15 6.91 10.67
Treatment 374 22.93 0.96 18.48 21.05 24.80
TOTAL 537 18.64 0.78 18.01 17.11 20.16
T Pr
-8.96 <.001
Table 9. T-test examining whether treatment status has a statistically significant relationship with word naming fluency
95% confidence interval
Obs Mean Stan. Err. Stan. Dev. Lower Upper
Control 163 2.53 0.33 4.16 1.89 3.18
Treatment 374 7.14 0.43 8.36 6.29 7.99
TOTAL 537 5.74 0.33 7.64 5.10 6.39
T Pr
-6.69 <.001

12 Impact Study of SMRS Using Early Grade Reading Assessment in Three Provinces in South Africa
Table 10. T-test examining whether treatment status has a statistically significant relationship with oral reading fluency in connected text
95% confidence interval
Obs Mean Stan. Err. Stan. Dev. Lower Upper
Control 163 3.91 0.51 6.45 2.92 4.91
Treatment 374 11.20 0.75 14.48 9.72 12.67
TOTAL 537 8.99 0.56 13.03 7.88 10.09
T Pr
-6.16 <.001
Table 11. T-test examining whether treatment status has a statistically significant relationship with reading comprehension
95% confidence interval
Obs Mean Stan. Err. Stan. Dev. Lower Upper
Control 163 0.04 0.01 0.12 0.02 0.06
Treatment 374 0.13 0.01 0.25 0.11 0.16
TOTAL 537 0.10 0.01 0.22 0.09 0.12
T Pr
-4.77 <.001
Note that given the experimental research design implemented in this data analytic report, the simple t-test is enough to present the causal impact of the SMRS program on learner achievement. While the report presents much more thorough detail of how program effects differ for various groups and shows various ways of expressing the effect graphically, this section presented the basic story of this analysis. The SMRS program had a large effect on learner achievement in each of the four learner achievement measures, with effect sizes ranging from 0.59 and 0.79 standard deviations. Given the low starting points, learners in treatment schools gained between 2.6 times and 3.25 times more in treatment than in control schools. These are remarkably large effects in social science research.
V.b Statistical Tests for Grade R This section of the report presents the impact of kindergarten on learner outcomes. Unlike the treatment effect that was randomly assigned, kindergarten attendance is not randomly assigned, and so we will be unable to say that attendance in kindergarten “caused” the effects that we present here, but instead we are able to say that learners who attended kindergarten scored a certain amount higher than non-kindergarten attenders. These t-tests show that learners who attended kindergarten scored higher

Impact Study of SMRS Using Early Grade Reading Assessment in Three Provinces in South Africa 13
than those that did not on letter sounding fluency (p<.001), word naming fluency (p<.001), oral reading fluency (p<.001) and reading comprehension (p<.001). Learners gained 9.98 words more on average in letter sounding in treatment schools, 3.41 words more in word fluency, 6.65 words in oral reading fluency, and 5% more in reading comprehension. However, it should be noted that much of this effect is related to the prevalence of kindergarten in Limpopo and North West provinces and the lack of it in Mpumalanga province. This means that some of this effect is due to the differences in gain scores between provinces. We will examine this later in the report, but for now it is sufficient to note that more analysis must be done to investigate whether the effects are due to province or due to kindergarten attendance.
Table 12. Letter sounding fluency by kindergarten attendance 95% confidence
interval Obs Mean
Stan. Err. Stan. Dev. Lower Upper
No Grade R 95 10.42 1.30 12.71 7.83 13.01
Grade R 442 20.40 0.88 18.50 18.67 22.13
TOTAL 537 18.64 0.78 18.01 17.11 20.16
T Pr
-5.01 <.001
Table 13. Word naming fluency by kindergarten attendance 95% confidence
interval Obs Mean
Stan. Err. Stan. Dev. Lower Upper
No Grade R 95 2.94 0.38 3.72 2.18 3.69
Grade R 442 6.35 0.39 8.12 5.59 7.11
TOTAL 537 5.74 0.33 7.64 5.10 6.39
T Pr
-4.01 <.001

14 Impact Study of SMRS Using Early Grade Reading Assessment in Three Provinces in South Africa
Table 14. Oral reading fluency by kindergarten attendance 95% confidence
interval Obs Mean
Stan. Err. Stan. Dev. Lower Upper
No Grade R 95 3.51 0.65 6.33 2.22 4.79
Grade R 442 10.16 0.65 13.78 8.88 11.45
TOTAL 537 18.64 0.78 18.01 17.11 20.16
T Pr
-5.01 <.001
Table 15. Reading comprehension by kindergarten attendance 95% confidence
interval Obs Mean
Stan. Err. Stan. Dev. Lower Upper
No Grade R 95 0.06 0.02 0.16 0.02 0.09
Grade R 442 0.11 0.01 0.23 0.09 0.14
TOTAL 537 0.10 0.01 0.22 0.09 0.12
T Pr
-2.32 .02
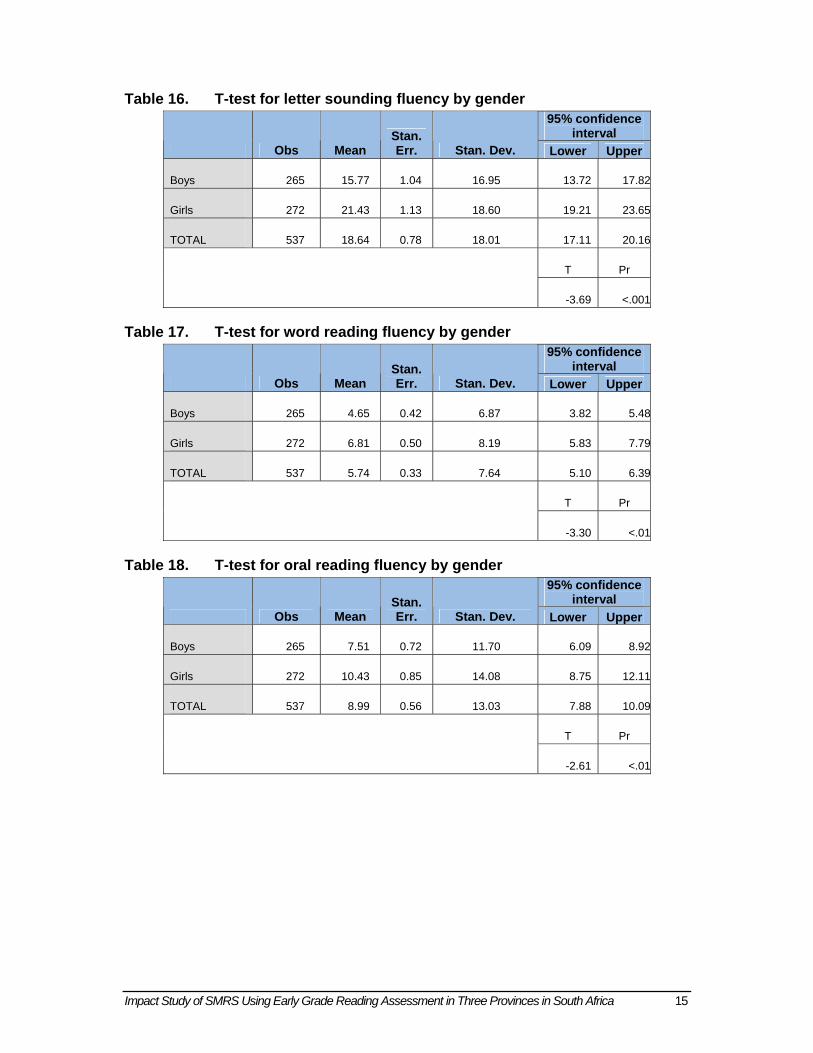
V.c Statistical tests for gender In the section that follows, results from t-tests are presented that present the relationship between gender and achievement on literacy measures. Note that, once again, gender is not randomly distributed after the baseline analysis, and so the relationships identified in this section are correlational rather than causal. That said, these t-tests show a definite advantage for girls over boys in gains in literacy skill measures, specifically, letter sounding fluency (p<.001), word naming fluency (p<.01), oral reading fluency (p<.01) and reading comprehension (p<.01). For letter sounding, girls increased their scores by 5.66 letters more than boys, for word naming, 2.16 words more than boys, 2.92 words in connected text more than boys, and 5% more on reading comprehension. The effect sizes are 0.31 SD, 0.29 SD, 0.22 SD and 0.23 SD respectively, all moderate effects quite notable in social science research. This suggests that in further analyses, care must be given to control for gender, and that it might be worth investigating whether program effects differ by learner gender.
Impact Study of SMRS Using Early Grade Reading Assessment in Three Provinces in South Africa 15
Table 16. T-test for letter sounding fluency by gender 95% confidence
interval Obs Mean
Stan. Err. Stan. Dev. Lower Upper
Boys 265 15.77 1.04 16.95 13.72 17.82
Girls 272 21.43 1.13 18.60 19.21 23.65
TOTAL 537 18.64 0.78 18.01 17.11 20.16
T Pr
-3.69 <.001
Table 17. T-test for word reading fluency by gender 95% confidence
interval Obs Mean
Stan. Err. Stan. Dev. Lower Upper
Boys 265 4.65 0.42 6.87 3.82 5.48
Girls 272 6.81 0.50 8.19 5.83 7.79
TOTAL 537 5.74 0.33 7.64 5.10 6.39
T Pr
-3.30 <.01
Table 18. T-test for oral reading fluency by gender 95% confidence
interval Obs Mean
Stan. Err. Stan. Dev. Lower Upper
Boys 265 7.51 0.72 11.70 6.09 8.92
Girls 272 10.43 0.85 14.08 8.75 12.11
TOTAL 537 8.99 0.56 13.03 7.88 10.09
T Pr
-2.61 <.01

16 Impact Study of SMRS Using Early Grade Reading Assessment in Three Provinces in South Africa
Table 19. T-test for reading comprehension by gender 95% confidence
interval Obs Mean
Stan. Err. Stan. Dev. Lower Upper
Boys 265 0.08 0.01 0.19 0.05 0.10
Girls 272 0.13 0.01 0.24 0.10 0.16
TOTAL 537 0.10 0.01 0.22 0.09 0.12
T Pr
-2.77 <.01
VI. Test Reliability In this section a set of reliability tests were performed in order to determine whether the various sub-tasks employed by the South African Department of Education, MILL and RTI International in this assessment are reliable. In addition, tests that determine whether the sub-tasks assess an underlying skill, hopefully early grade literacy, are presented here. In Table 20 below, simple bivariate Pearson correlation statistics are presented. This indicates that there is a great deal of correlation between the scores on the variety of sub-tasks in this assessment. Note that this particular analysis presented is for the post-assessment implemented in early June 2009. This is because the baseline assessment scores were so low for three of the sub-tasks that a reliability analysis was not possible. The asterisks indicate that all of the bivariate relationships are statistically significant at the <.001 level. Note that while all of the relationships are quite strong, the lowest correlation (0.73) is between reading comprehension and letter sounding fluency5 and the highest correlation (0.90) is between word naming fluency and oral reading fluency. Both of these relationships are logical, and are examples of the logical relationships between the various sub-tasks in this assessment.
5 The task for the South African EGRA was to give the “sounds” of the letters rather than the names. Since the names and the sounds are the same, however, letter “naming” and letter ”sounding” represent the same task.

Impact Study of SMRS Using Early Grade Reading Assessment in Three Provinces in South Africa 17
Table 20. Pearson correlations presenting the correlations between the sub-tasks in the EGR assessment in South Africa
Letter sounding Fluency
Word naming fluency
Oral reading fluency
Reading comprehension
Letter sounding fluency
1.00
Word naming fluency
0.84*** 1.00
Oral reading fluency
0.81*** 0.90*** 1.00
Reading Comprehension
0.73*** 0.83*** 0.83*** 1.00
The table below (Table 21) presents the results of a Cronbach’s alpha test to determine test reliability by sub-task. This table shows that the test is highly reliable, with individual alpha scores for each sub-task above 0.90 and the overall score of 0.95. This score is more than acceptable for low-stakes assessments like the EGRA, where the cut-off is 0.70. In addition, the reliability scores are acceptable even for a high-stakes assessment, which of course EGRA is not, since the Cronbach’s alpha score for the entire sub-task is above 0.90.
Table 21. Cronbach’s alpha scores for the sub-tasks related to the South African Early Grade Reading Assessment
Item Item-test
correlation Item-rest
Correlation
Average inter-item
correlation Alpha
Letter sounding fluency
0.91 0.83 0.85 0.94
Word naming fluency 0.96 0.92 0.79 0.92
Oral reading fluency 0.95 0.91 0.80 0.92
Reading comp 0.91 0.84 0.85 0.94
Overall test 0.82 0.95
Finally, a principal components analysis was performed to determine whether there is an underlying construct that is identified to varying degrees by the sub-tasks in the assessment. We would hope so in order to defend the creation and implementation of EGRA in the South African contest. Table 22 below shows that each of the sub-tasks loads on the new principal component at a rate of over 0.90, with word naming fluency loading highest at 0.96. The second column shows the loading scores for each of the components, and shows one of the weaknesses of this particular South African EGRA. While each component loads quite high, the scores for uniqueness are low for each component, which means that there is some overlap in the ability of the sub-

18 Impact Study of SMRS Using Early Grade Reading Assessment in Three Provinces in South Africa
tasks to contribute to our understanding of the underlying literacy construct. Letter sounding fluency and reading comprehension are the most unique, but still quite low in comparison to the uniqueness scores for items like listening comprehension and phonemic awareness tasks in other countries that chose to implement those sub-tasks in their local assessments.
Table 22. Principal component loadings and component uniqueness
Principal component 1 loading
Uniqueness of each component
Letter sounding fluency
0.91 Letter sounding fluency
0.18
Word naming fluency 0.96 Familiar words fluency
0.08
Oral reading fluency 0.95 Oral reading fluency 0.10
Reading comprehension
0.91 Reading comprehension
0.17
The screeplot that follows in Figure 1 below depicts the variation that is explained by the EGRA assessment as a whole. Since the eigenvalue of the EGRA underlying construct is so high, 3.47, this shows that more than four fifths of all of the variation in the South African EGRA explains scores on this one factor, which we will call early literacy skill. This high variation supports our claim that this set of sub-tasks is able to estimate accurately an underlying construct. In fact, the eigenvalue in the South African example is nearly as high as the eigenvalue for the construct in the Liberian analysis from 2008 (3.67) which had 8 sub-tasks (Piper, 2009).

Impact Study of SMRS Using Early Grade Reading Assessment in Three Provinces in South Africa 19
Figure 1. Screeplot estimating the explained variance (eigenvalue) of the first principal component created from the various sub-tasks within the EGRA
01
23
4Ei
genv
alue
s
1 2 3 4Number
Scree plot of eigenvalues after factor
VII. Assessment results In this section, scores from individual sub-tasks are examined. The idea is to delve deeply into the variation within each sub-task to determine whether any clues are available to understand the variation that we have identified in these scores in the sections above. This section depends heavily on graphical analysis using Stata. The various figures examine how particular predictors are related to particular outcomes, and in some cases, how the outcomes are related to each other.
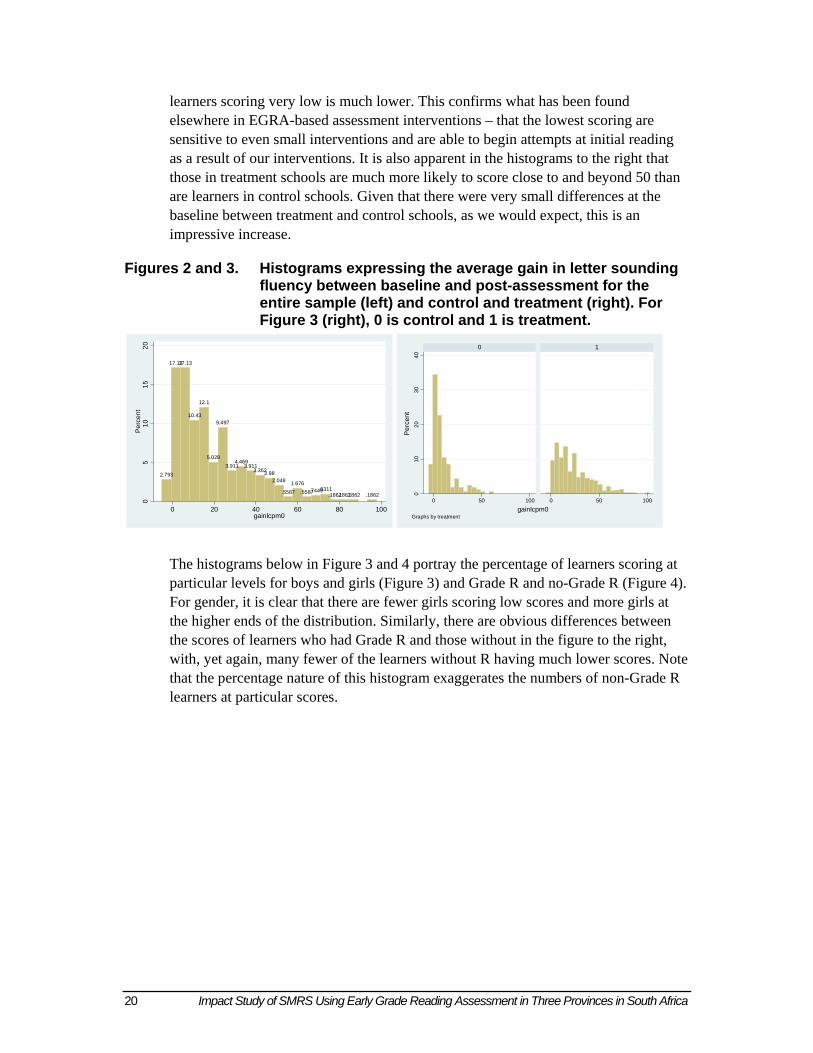
VII.a Letter sound fluency results In this section, several figures are presented to describe the achievement of learners on the letter sound fluency task. Note that this analysis primarily focuses on the scores on the post-assessment, since the baseline scores are so low that they are difficult to analyze. Figures 2 and 3 below shows that there is not a normal distribution of scores on the letter sound fluency task, and that is skewed to the left. The histogram on the left shows the scores for all learners. Note that the highest bars are on the left, quite close to 0, which shows that there remained a significant percentage of learners at the post-assessment that were unable to identify more than a couple of words. The histogram to the right splits by treatment school. The most obvious difference is that the sub-histogram to the right, for treatment learners has far fewer 0 and close to 0 scores. The variation is spread out in general, but in particular, the percentage of
20 Impact Study of SMRS Using Early Grade Reading Assessment in Three Provinces in South Africa
learners scoring very low is much lower. This confirms what has been found elsewhere in EGRA-based assessment interventions – that the lowest scoring are sensitive to even small interventions and are able to begin attempts at initial reading as a result of our interventions. It is also apparent in the histograms to the right that those in treatment schools are much more likely to score close to and beyond 50 than are learners in control schools. Given that there were very small differences at the baseline between treatment and control schools, as we would expect, this is an impressive increase.
Figures 2 and 3. Histograms expressing the average gain in letter sounding fluency between baseline and post-assessment for the entire sample (left) and control and treatment (right). For Figure 3 (right), 0 is control and 1 is treatment.
2.793
17.1317.13
10.43
12.1
5.028
9.497
3.9114.469
3.9113.3522.98
2.048
.55871.676
.5587.7449.9311.1862.1862.1862 .1862
05
1015
20P
erce
nt
0 20 40 60 80 100gainlcpm0
010
2030
40
0 50 100 0 50 100
0 1
Per
cent
gainlcpm0Graphs by treatment
The histograms below in Figure 3 and 4 portray the percentage of learners scoring at particular levels for boys and girls (Figure 3) and Grade R and no-Grade R (Figure 4). For gender, it is clear that there are fewer girls scoring low scores and more girls at the higher ends of the distribution. Similarly, there are obvious differences between the scores of learners who had Grade R and those without in the figure to the right, with, yet again, many fewer of the learners without R having much lower scores. Note that the percentage nature of this histogram exaggerates the numbers of non-Grade R learners at particular scores.

Impact Study of SMRS Using Early Grade Reading Assessment in Three Provinces in South Africa 21
Figures 3 and 4. Histograms portraying the percentage of learners scoring at certain levels on the gain in letter reading fluency score for gender (left) and Grade R (right) by treatment (control – left, treatment – right)
05
1015
20
0 50 100 0 50 100
0 1
Perc
ent
gainlcpm0Graphs by gender
010
2030
0 50 100 0 50 100
0 1
Per
cent
gainlcpm0Graphs by R
In the figure below, scores are compared for learners in control and treatment schools across gender. This allows us to determine whether the stronger achievement in both treatment schools and for girls is collinear. We find here that the control schools (the ones on the top) score lower than treatment (on the bottom). Similarly, girls (on the right) score higher than boys. In order to compare the scores of girls and the treatment, the top right figure is compared to the bottom left figure. This lets us look at the treated boys compared to untreated girls. The change in letters per minute is larger for treated boys than untreated girls, both with respect to the number of low scores and the general spread of the scores. This lends credence to the view that the gender effects that we identify above are related at least in part to the treatment effect. In short, this suggests that in multiple regression analyses, treatment will matter more than gender, and there might not be a statistically significant interaction between treatment and gender.

22 Impact Study of SMRS Using Early Grade Reading Assessment in Three Provinces in South Africa
Figure 5. Histograms portraying the letter reading fluency gain scores for control boys (top left), control girls (top right), treatment boys (bottom left), treatment girls (bottom right)
010
2030
400
1020
3040
0 50 100 0 50 100
0, 0 0, 1
1, 0 1, 1
Per
cent
gainlcpm0Graphs by treatment and gender
The boxplot on the left below is the overall gain in letters correct per minute. It shows that the average gain is a bit higher than 15 lcpm, but that the 25th percentile is much nearer to 0. The boxplot on the right compares the gain in lcpm between treatment and control schools. Note that the 25th percentile for treatment schools is higher than the median for control schools, and that the 75th percentile is higher than the 90th percentile for control schools. This shows that the scores are higher for every score level, which means that there is some evidence that SMRS helps learners throughout the distribution.
Figures 6 and 7. Boxplots portraying the average gain in letters correct per minute for the entire sample (left) and by treatment status (right). Control is 0 (left), treatment is 1 (right).
020
4060
8010
0ga
inlc
pm0
020
4060
8010
0
0 1
gain
lcpm
0
Graphs by treatment
In the histogram below, the scores of learners are presented against the benchmarks for letter sounding fluency using the DIBELS guideline, presented in Figure 8 below.

Impact Study of SMRS Using Early Grade Reading Assessment in Three Provinces in South Africa 23
Figure 8. DIBELS guidelines for letter sounding fluency in first grade
The histogram to the left is the percentage of learners meeting the three levels of the benchmarks in control schools. Note that these figures come from the post-assessment. A full 72% of learners are at risk in control schools, and only 4% are at some risk. When we compare this histogram for control schools with treatment schools, we can see that 24.29% fewer learners are considered at risk in treatment schools. Many of these learners move to low risk, but many more have moved to no risk, where 14.24% more treatment learners reside than in control schools.
Figure 9. Letter sounding fluency benchmark histograms using the post-assessment by treatment group. Control is 0 (left), treatment is 1 (right)
72
4
24
47.71
13.94
38.34
020
4060
80
0 Some risk 4 0 Some risk 4
0 1
Per
cent
Letter Naming Fluency BenchmarksGraphs by treatment
VII.b Word naming fluency results In this section, figures and graphs are presented to depict the relative impact of the SMRS program on words correct per minute gains. In order to do this, histograms are presented below first that present the overall achievement on the word reading fluency tasks in Figures 10 and 11. Note that, once again, a full 30% of learners had no gain between the baseline and post-assessment results, largely because in both

24 Impact Study of SMRS Using Early Grade Reading Assessment in Three Provinces in South Africa
administrations these learners scored 0. The histogram to the right compares the achievement of learners in treatment and control schools on the word naming fluency task. There are remarkable differences between the histograms for treatment and control schools. For example, the histogram on the right for control schools shows that more than 40% of learners had no gain between baseline and post-assessment, while around 20% fewer had no gain in treatment schools, a difference of 20%. Moreover, there appear to be another 23% in control schools who increase by only 1 word, and 17% who score only 2 words higher. In summary, around 80% of learners only increased their scores by less than 3 words. This is juxtaposed with the scores in the treatment schools, where learners increased much more. In fact, the 80th percentile of scores in treatment schools appears to be somewhere between 10 and 20 wcpm gain. In short, learners who are for all intents and purposes non-readers in control schools can identify more than 10 words in treatment schools.
Figures 10 and 11. Word per minute gains between pre and post-assessment expressed as histograms by percent for the whole sample (left) and by treatment status (right), where 0 is control and 1 is treatment.
.5587
29.98
15.64
13.59
8.1948.752
5.214
2.4213.166
2.4212.4211.117.7449.5587
1.304.1862.7449.5587.9311.3724.7449 .3724
010
2030
Perc
ent
0 10 20 30 40gainwcpm0
010
2030
40
0 10 20 30 40 0 10 20 30 40
0 1
Perc
ent
gainwcpm0Graphs by treatment
In the histograms, below, the impact of gender on words correct per minute is investigated. It appears that girls are scoring much higher than boys, particularly in the histogram to the left. Note that, once again, while nearly 40% of boys had no increase between baseline and post-assessment scores, the corresponding percentage is only 20% for girls. This is difficult to explain, since this difference persists in treatment schools as well, where there remain more boys who have difficulty beginning the very initial parts of reading simple words. When the top right histogram is compared with the one on the bottom right, there seems to be less of an obvious difference between the impact of gender and treatment on words correct per minute.
Impact Study of SMRS Using Early Grade Reading Assessment in Three Provinces in South Africa 25
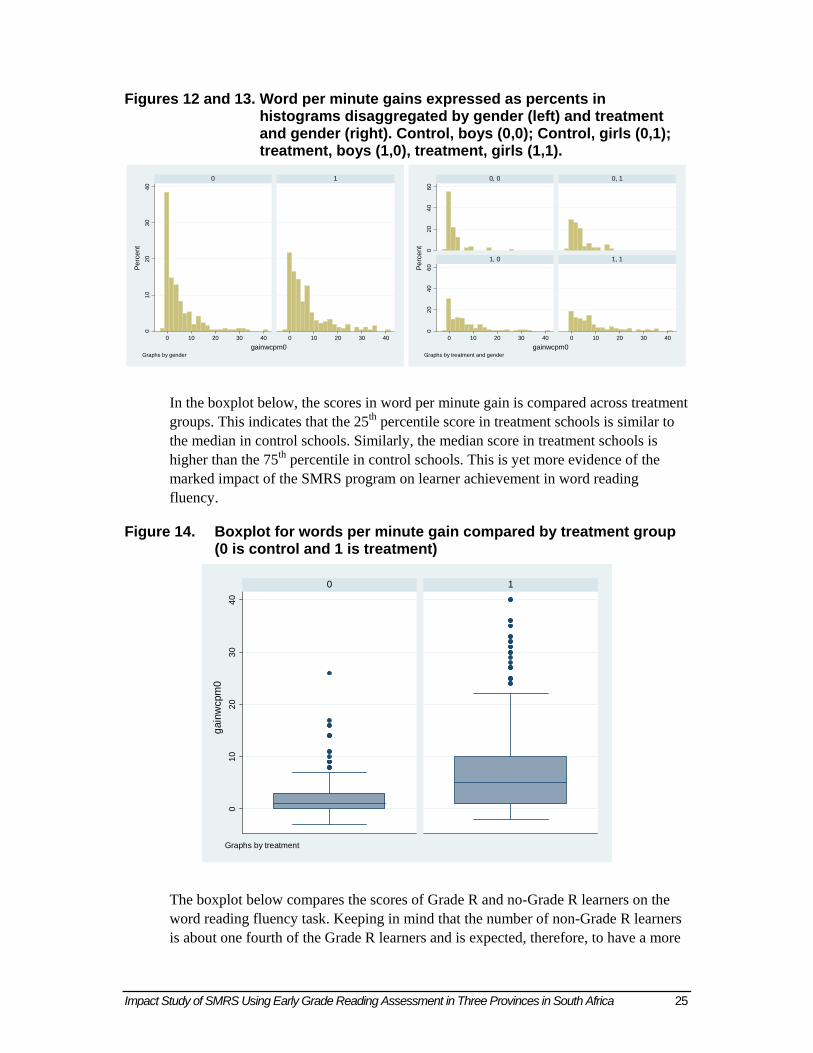
Figures 12 and 13. Word per minute gains expressed as percents in histograms disaggregated by gender (left) and treatment and gender (right). Control, boys (0,0); Control, girls (0,1); treatment, boys (1,0), treatment, girls (1,1).
010
2030
40
0 10 20 30 40 0 10 20 30 40
0 1
Perc
ent
gainwcpm0Graphs by gender
020
4060
020
4060
0 10 20 30 40 0 10 20 30 40
0, 0 0, 1
1, 0 1, 1
Perc
ent
gainwcpm0Graphs by treatment and gender
In the boxplot below, the scores in word per minute gain is compared across treatment groups. This indicates that the 25th percentile score in treatment schools is similar to the median in control schools. Similarly, the median score in treatment schools is higher than the 75th percentile in control schools. This is yet more evidence of the marked impact of the SMRS program on learner achievement in word reading fluency.
Figure 14. Boxplot for words per minute gain compared by treatment group (0 is control and 1 is treatment)
010
2030
40
0 1
gain
wcp
m0
Graphs by treatment
The boxplot below compares the scores of Grade R and no-Grade R learners on the word reading fluency task. Keeping in mind that the number of non-Grade R learners is about one fourth of the Grade R learners and is expected, therefore, to have a more

26 Impact Study of SMRS Using Early Grade Reading Assessment in Three Provinces in South Africa
limited spread, it is notable how much higher the achievement of Grade R learners is in this boxplot. In particular, the variation is far more spread out across the distribution of learners on the Y-axis.
Figure 15. Word per minute gains expressed on boxplots by Grade R attendance, where 0 is no attendance and 1 is Grade R attendance
010
2030
40
0 1
gain
wcp
m0
Graphs by R
VII.c Oral reading fluency results In this section, graphic figures depicting the relationship between oral reading fluency (ORF) scores and a variety of predictors are presented. In some ways, oral reading fluency is the most important outcome of the assessment, since it has greater predictive validity with expected outcomes in later stages of school than some of the other sub-tasks. As a result, it is useful to note what variables are most predictive of oral reading fluency success. The histograms below, in Figures 16 and 17, show that a full 40% of learners in the entire sample increase their oral reading fluency scores by 0 between the baseline and post assessment. The histogram on the right shows that when comparing treatment and control schools, we find that more than 60% of learners in control schools do not evidence any increase in oral reading fluency scores between baseline and post-assessment. On the other hand, around 30% of learners in treatment schools score 0 on gains in oral reading fluency between pre and post-assessment. This is more than the typical change we have seen in South Africa, of around 20% of non-readers becoming readers, since in this case it is around 30%. Moreover, comparing the treatment and control histograms it is apparent that there is a much higher percentage that score 10 or higher words per minute gain.6 In fact, there are also many more learners that score 40 words per minute or higher, which is towards the level of reading fluency necessary to understand connected text.
6 While this is accurately called a gain score, since most children scored 0 on the oral reading fluency task at baseline, there are few differences between post-assessment and gain scores in this analysis.

Impact Study of SMRS Using Early Grade Reading Assessment in Three Provinces in South Africa 27
Figure 16 and 17. Oral reading fluency boxplots organized for the whole sample (left) and by treatment (right), where 0 is control and 1 is treatment.
42.09
10.2412.1
9.497
5.5874.469
2.0482.6072.607.55871.117.3724.93111.49
.3724.1862.1862.3724.7449 .3724.18621.862
010
2030
40Pe
rcen
t
0 20 40 60gainORF0
020
4060
0 20 40 60 0 20 40 60
0 1
Per
cent
gainORF0Graphs by treatment
The histograms below examine whether and how achievement on ORF differs by kindergarten (Grade R) status and gender. Note that there are modest differences in ORF scores by gender, using the figure on the right, with fewer 0 scores for girls. The figure on the left, which differentiates by Grade R, shows that far fewer learners score 0 that went to kindergarten (by percentage) than learners who did not go. This is mimicked by the relative distribution of scores which are much wider for learners who attended kindergarten than those that did not. This might be related to the size of the groups, however.
Figures 18 and 19. Oral reading fluency gain score disaggregated by Grade R attendance (left – where 0 is control and 1 is treatment) and gender (right – where 0 is control and 1 is treatment).
020
4060
80
0 20 40 60 0 20 40 60
0 1
Per
cent
gainORF0Graphs by R
050
0 20 40 60 0 20 40 60
0 1
Per
cent
gainORF0Graphs by gender
The boxplot below allows us to compare the achievement of learners on ORF in treatment and control schools. It is clear, in the sub-graph on the left, that learners are “bottoming out” on this subtask. This is evident in that the median, 25th and 10th percentiles are combined at 0, and the relative spread is quite constricted even amongst those learners that scored higher than 0. On the other hand, while learners are also bottoming out in ORF in treatment schools, there is enough variation so that it is

28 Impact Study of SMRS Using Early Grade Reading Assessment in Three Provinces in South Africa
apparent that starting at the 50th percentile learners that there is a dramatic difference in achievement between treated and non-treated learners. Moreover, the relatively long tail of learners scoring above 40 wcpm on the ORF task shows that there even a small sub-set of learners who are achieving ORF scores at high levels regardless of the standard used to estimate that achievement.
Figure 20. Oral reading fluency gain boxplots by treatment group (0 is control, 1 is treatment)
020
4060
0 1
gain
OR
F0
Graphs by treatment
The histogram below shows that a full 50% of the sample is at risk using the US DIBELS benchmarks, and 71.4% total at some risk at least. The DIBELS benchmarks are below in Figure 21.
Impact Study of SMRS Using Early Grade Reading Assessment in Three Provinces in South Africa 29
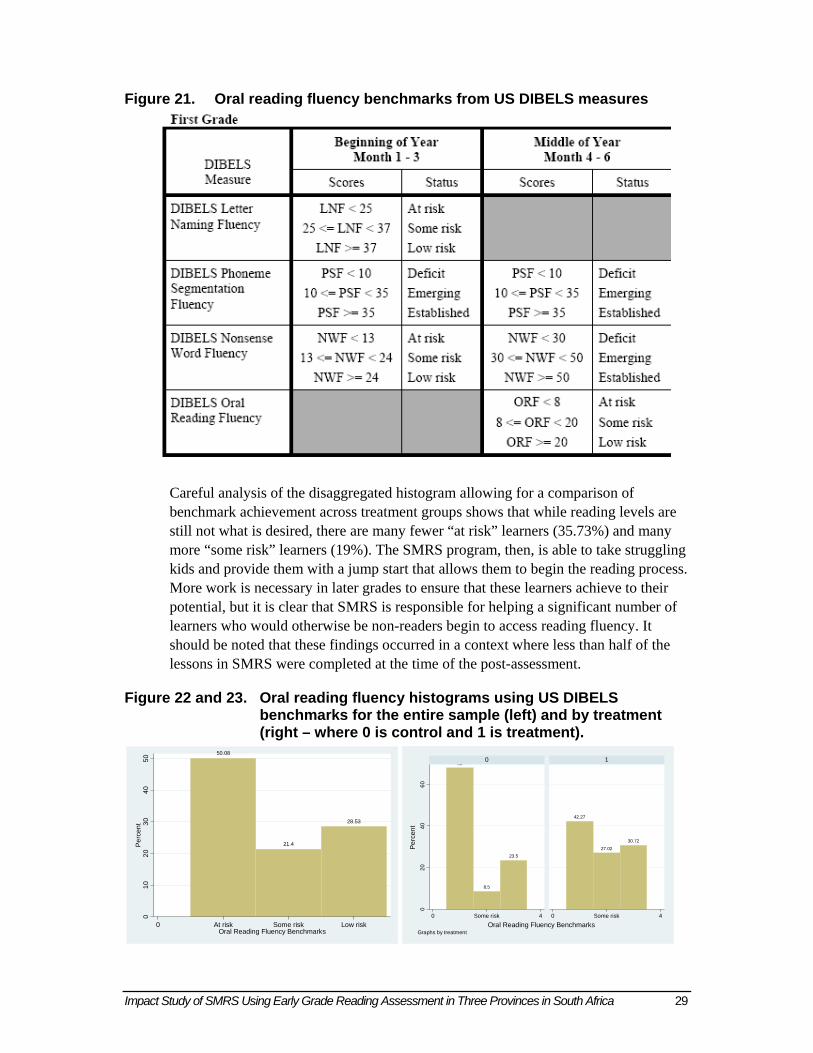
Figure 21. Oral reading fluency benchmarks from US DIBELS measures
Careful analysis of the disaggregated histogram allowing for a comparison of benchmark achievement across treatment groups shows that while reading levels are still not what is desired, there are many fewer “at risk” learners (35.73%) and many more “some risk” learners (19%). The SMRS program, then, is able to take struggling kids and provide them with a jump start that allows them to begin the reading process. More work is necessary in later grades to ensure that these learners achieve to their potential, but it is clear that SMRS is responsible for helping a significant number of learners who would otherwise be non-readers begin to access reading fluency. It should be noted that these findings occurred in a context where less than half of the lessons in SMRS were completed at the time of the post-assessment.
Figure 22 and 23. Oral reading fluency histograms using US DIBELS benchmarks for the entire sample (left) and by treatment (right – where 0 is control and 1 is treatment).
50.08
21.4
28.53
010
2030
4050
Perc
ent
0 At risk Some risk Low riskOral Reading Fluency Benchmarks
68
8.5
23.5
42.27
27.02
30.72
020
4060
0 Some risk 4 0 Some risk 4
0 1
Perc
ent
Oral Reading Fluency BenchmarksGraphs by treatment

30 Impact Study of SMRS Using Early Grade Reading Assessment in Three Provinces in South Africa
VII.d Scatterplot analysis While it is unfortunate that the relative low scores of the reading comprehension assessment (potentially due to the unfinished nature of the SMRS program) and its categorical nature does not allow for an easy analysis of graphical data, the pre and post nature of this research design allows a great deal of opportunities to examine the impact of SMRS on learner achievement in letters per minute and words per minute. The scatterplots below have on the X axis achievement on the baseline assessment in letter sounding fluency. The Y axis has achievement on the post-assessment in letter sounding fluency. Note that these scatterplots only include learners who scored at least one letter correct on the baseline assessment. When one examines the scatterplot on the left for control learners, on the X axis it is clear that in the baseline, most learners scored less than 10 letter sounds correct, but on the Y axis, they scored up to 50 sounds correct. This presents a sudden juxtaposition when compared with the treatment plot on the right, which had a few higher scores at baseline on the X axis, but then clustering of achievement on the Y axis at much higher levels, including around 20 letters per minute, and then dozens more beyond that and past 50 letters per minute. This scatterplot makes graphically clear the impact that SMRS made in expanding the relatively limited opportunities for reading growth in South Africa. It should be noted that the number of observations is not equal between control and treatment, so that might exaggerate the difference. However, it is the spread and range that is much more impressive in the right-side plot, particularly the range on the Y-axis.
Figure 24. Scatterplots of baseline letters per minute score against post-assessment letters per minute score by treatment group, where 0 is control and 1 is treatment
050
100
0 10 20 30 40 0 10 20 30 40
0 1
post
lcpm
prelcpmGraphs by treatment

Impact Study of SMRS Using Early Grade Reading Assessment in Three Provinces in South Africa 31
The scatterplot below, Figure 25, presents a complementary finding, though with slightly less compelling data. Note that the treatment plot on the right has a much more widely spread range of outcomes at the post assessment, though this time there is not a corresponding wider spread of scores on the X (baseline) axis. This is again graphic evidence for the ability of SMRS to provide learners with benefits in their ability to access reading materials and knowledge.
Figure 25. Histogram for words correct per minute on baseline against post-assessment by treatment group, where 0 is control and 1 is treatment
010
2030
40
0 5 10 0 5 10
0 1
post
wcp
m
prewcpmGraphs by treatment
VIII. Analysis: Multiple Regression Results Since policymakers are often interested in understanding how one might predict the achievement scores that learners obtained, this section of the paper investigates the relative scores of the learners on the various sub-tasks compared against predictors of interest. These predictors of interest come from the relatively limited set of items that the EGRA was administered along with, including asking the child what their gender is, whether they entered Grade R, and their age. Note that the t-test analyses in the sections above are sufficient for identifying causal program impacts. However, the additional advantage of multiple regression analyses is their ability to include multiple predictors in a single model. This allows us to determine whether the impacts are collinear and whether they change based on the other variables that are included in the analysis.

32 Impact Study of SMRS Using Early Grade Reading Assessment in Three Provinces in South Africa
Some of the models of interest in this table that are interesting include models 1-4, which estimate simple models of the causal impact of SMRS (treatment) on all four achievement scores. Note that the p-value on all four parameter estimates are statistically significant (p<.001).
The effects range in size, but all four are statistically significant. Specifically, the letter sounding fluency effect is 14.13 letters per minute (.76 SD), the word reading fluency effect is 4.61 words per minute (.80 SD), the oral reading fluency effect is 7.22 words per minute (.80 SD), and the reading comprehension effect is 8.24% (.79 SD). Similarly, in models 5-8, models were fit where the outcome variables were limited to observations where learners scored at least 1 on the sub-task. Once again, the parameter estimates are statistically significant once again. Note that the parameter estimates on the treatment effect are similar for letter sounding, word naming, and ORF, but the treatment impact is higher for the estimate for reading comprehension in model 8. This shows that the model had a higher impact for learners who got higher than a 0 on the baseline, but that was very few learners, so substantively it is not very meaningful. In models 9-12 with the original treatment variable estimation, we find that the parameter estimates for treatment are statistically significant, as are the main effects for gender. This shows that for all four sub-tasks, the treatment effect remains statistically significant even after accounting for the gender effect. Interestingly, when interaction effects were included to determine whether the impact of the treatment program differed for girls, those parameter estimates remained statistically insignificant. This means that the program effect does not differ by gender, and girls outperform boys in both control and treatment schools by a similar magnitude. In models 13-16, we find that models accounting for both the treatment effect and learner Grade R (kindergarten) attendance results in statistically significant effects for both the treatment effect and Grade R attendance in all of the models except reading comprehension, where the Grade R effect is not statistically significant at the .05 level (p=.09).
Table 23. Multiple regression results for fitted models investigating the relationship between the SMRS treatment and several EGRA sub-tasks
# Outcome Predictor Coeff. Std
Error T Sig. Lower
CI Upper
CI F Sig. R2 Treatment 14.13 1.58 8.96 <.001 11.03 17.23
1 Letter reading fluency with
zeros Constant 8.79 1.32 6.68 <.001 6.20 11.38 80.22 <.001 .13
Treatment 4.61 0.69 6.69 <.001 3.26 5.96 2
Word reading fluency with
zeros Constant 2.53 0.58 4.41 <.001 1.40 3.66 44.76 <.001 .08
Treatment 7.22 1.17 6.16 <.001 4.92 9.52 3
Oral reading fluency with
zeros Constant 3.91 0.98 3.99 <.001 1.99 5.84 37.98 <.001 .07
Treatment 8.24 1.71 4.83 <.001 4.89 11.59 4
Reading comprehension
zeros Constant 3 1.42 2.11 <.05 0.20 5.80 23.32 <.001 .03
Treatment 12.25 1.76 6.97 <.001 8.80 15.71 48.54 <.001 .09 5
Letter reading fluency no
zeros Constant 11.70 1.51 7.72 <.001 8.72 14.67
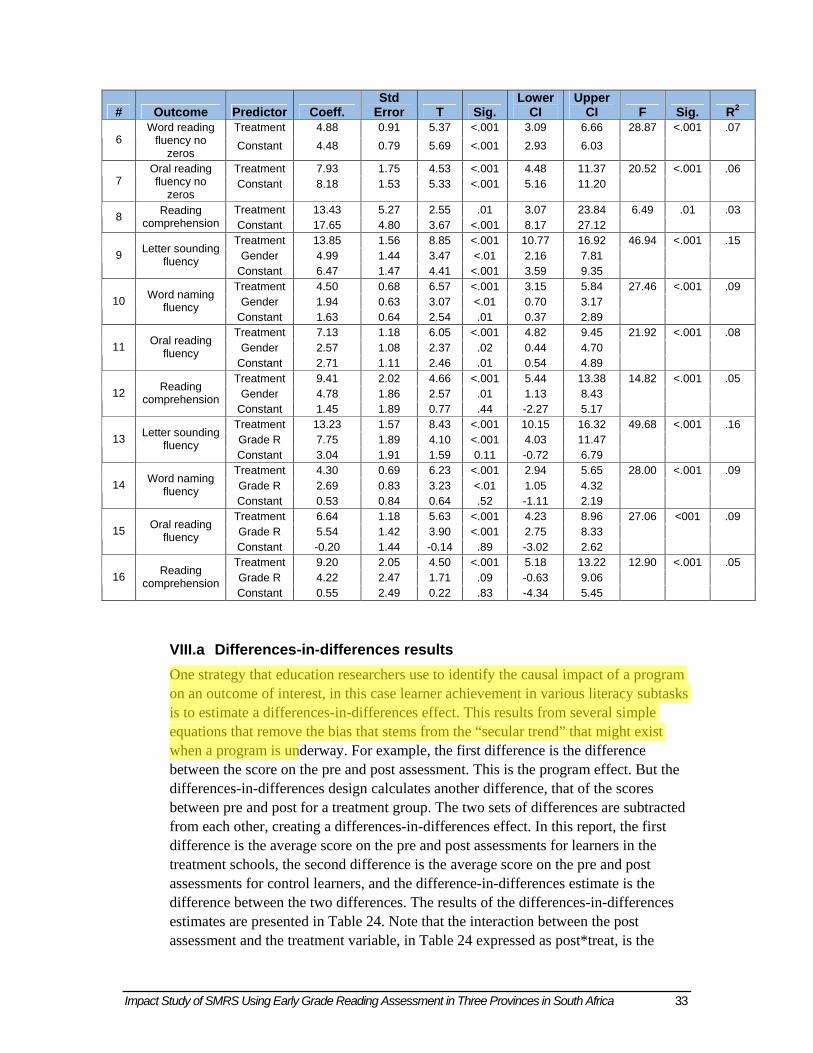
Impact Study of SMRS Using Early Grade Reading Assessment in Three Provinces in South Africa 33
# Outcome Predictor Coeff. Std
Error T Sig. Lower
CI Upper
CI F Sig. R2 Treatment 4.88 0.91 5.37 <.001 3.09 6.66 28.87 <.001 .07
6 Word reading
fluency no zeros
Constant 4.48 0.79 5.69 <.001 2.93 6.03
Treatment 7.93 1.75 4.53 <.001 4.48 11.37 20.52 <.001 .06 7
Oral reading fluency no
zeros Constant 8.18 1.53 5.33 <.001 5.16 11.20
Treatment 13.43 5.27 2.55 .01 3.07 23.84 6.49 .01 .03 8 Reading comprehension Constant 17.65 4.80 3.67 <.001 8.17 27.12
Treatment 13.85 1.56 8.85 <.001 10.77 16.92 46.94 <.001 .15 Gender 4.99 1.44 3.47 <.01 2.16 7.81 9 Letter sounding
fluency Constant 6.47 1.47 4.41 <.001 3.59 9.35 Treatment 4.50 0.68 6.57 <.001 3.15 5.84 27.46 <.001 .09
Gender 1.94 0.63 3.07 <.01 0.70 3.17 10 Word naming fluency
Constant 1.63 0.64 2.54 .01 0.37 2.89 Treatment 7.13 1.18 6.05 <.001 4.82 9.45 21.92 <.001 .08
Gender 2.57 1.08 2.37 .02 0.44 4.70 11 Oral reading fluency
Constant 2.71 1.11 2.46 .01 0.54 4.89 Treatment 9.41 2.02 4.66 <.001 5.44 13.38 14.82 <.001 .05
Gender 4.78 1.86 2.57 .01 1.13 8.43 12 Reading comprehension
Constant 1.45 1.89 0.77 .44 -2.27 5.17 Treatment 13.23 1.57 8.43 <.001 10.15 16.32 49.68 <.001 .16 Grade R 7.75 1.89 4.10 <.001 4.03 11.47 13 Letter sounding
fluency Constant 3.04 1.91 1.59 0.11 -0.72 6.79 Treatment 4.30 0.69 6.23 <.001 2.94 5.65 28.00 <.001 .09 Grade R 2.69 0.83 3.23 <.01 1.05 4.32 14 Word naming
fluency Constant 0.53 0.84 0.64 .52 -1.11 2.19 Treatment 6.64 1.18 5.63 <.001 4.23 8.96 27.06 <001 .09 Grade R 5.54 1.42 3.90 <.001 2.75 8.33 15 Oral reading
fluency Constant -0.20 1.44 -0.14 .89 -3.02 2.62 Treatment 9.20 2.05 4.50 <.001 5.18 13.22 12.90 <.001 .05 Grade R 4.22 2.47 1.71 .09 -0.63 9.06 16 Reading
comprehension Constant 0.55 2.49 0.22 .83 -4.34 5.45
VIII.a Differences-in-differences results One strategy that education researchers use to identify the causal impact of a program on an outcome of interest, in this case learner achievement in various literacy subtasks is to estimate a differences-in-differences effect. This results from several simple equations that remove the bias that stems from the “secular trend” that might exist when a program is underway. For example, the first difference is the difference between the score on the pre and post assessment. This is the program effect. But the differences-in-differences design calculates another difference, that of the scores between pre and post for a treatment group. The two sets of differences are subtracted from each other, creating a differences-in-differences effect. In this report, the first difference is the average score on the pre and post assessments for learners in the treatment schools, the second difference is the average score on the pre and post assessments for control learners, and the difference-in-differences estimate is the difference between the two differences. The results of the differences-in-differences estimates are presented in Table 24. Note that the interaction between the post assessment and the treatment variable, in Table 24 expressed as post*treat, is the

34 Impact Study of SMRS Using Early Grade Reading Assessment in Three Provinces in South Africa
differences-in-differences effect that is the causal impact of the program on treatment. In Table 24 it is interesting to note that the post*treat DID estimate was unaffected by the exclusion (Models 17-19) or inclusion (Models 20-22) of the gender coefficient. In other words, for letter sounding fluency, word naming fluency, or oral reading fluency, the effects were no different between models with and without gender, though gender was significantly correlated with achievement in models 20-22. As a result, several other models were fit with additional predictors to estimate whether the effect of the program differed by gender using this DID estimation, and in all cases, there was no statistically significant impact on learner achievement in any of the three models.
Table 24. Differences-in-differences causal estimates of the impact of the SMRS program on learner achievement in letter sounding fluency, word naming fluency and oral reading fluency
# Outcome
Predictor Coeff. Std
Error T Sig. Lower
CI Upper
CI F Sig. R2 Post 8.90 1.33 6.71 <.001 6.29 11.50 281.35 <.001 .42
Treatment 0.93 1.07 0.87 .39 -1.17 3.02 17 Letter
sounding fluency Post*Treat 14.32 1.59 9.02 <.001 11.21 17.44
Post 2.58 0.53 4.85 <.001 1.53 3.62 160.43 <.001 .29 Treatment -.06 .43 -.14 .89 -.90 .78 18 Word naming
fluency Post*Treat 4.56 .64 7.16 <.001 3.31 5.80
Post 3.91 .89 4.38 <.001 2.16 5.67 138.42 <.001 .26 Treatment .02 .72 .03 .97 -1.39 1.44 19 Oral reading
fluency Post*Treat 7.20 1.07 6.72 <.001 5.10 9.30
Post 8.87 1.32 6.72 <.001 6.28 11.45 216.67 <.001 .42 Treatment .76 1.06 .71 .48 -1.33 2.85 Post*Treat 14.34 1.58 9.07 <.001 11.24 17.44
20 Letter
sounding fluency
Gender 2.68 .72 3.70 <.001 1.26 4.10 Post 2.57 .53 4.85 <.001 1.53 3.61 123.58 <.001 .29
Treatment -.12 .43 -.27 .79 -.95 .72 Post*Treat 4.56 .63 7.19 <.001 3.32 5.80
21 Word naming fluency
Gender .90 .29 3.09 <.01 .33 Post 3.90 .89 4.37 <.001 2.15 5.65 105.44 <.001 .26
Treatment -.04 .72 -.06 .95 -1.46 1.37 Post*Treat 7.21 1.07 6.74 <.001 5.11 9.30
22 Oral reading fluency
Gender 1.11 .49 2.26 .02 .14 2.07
Using the results that were produced from the differences-in-differences estimates from the analyses above, particularly models 20-22, we were able to produce figures that express the impact of SMRS graphically. In Figure 26, below, we present the impact of SMRS on learner achievement in letters per minute correct. Note that this is a fitted model, so the effect size is not the “official” one. Using the differences-in-differences estimation, this figure shows the causal impact of SMRS. The blue block on the bottom is the estimate of the impact of being a girl on learner achievement in the post-assessment. Since the estimate is 2.68, the idea is that girls score 2.68 points on average. The purple box on top represents the additional benefit on letters per minute score for learners after being in four months of school (being in the post-treatment dataset). In short, almost half of a year of school is estimated to increase a child’s score on the letters per minute task by 8.87 letters. Finally, the white box on

Impact Study of SMRS Using Early Grade Reading Assessment in Three Provinces in South Africa 35
top is the additional impact of being in a treatment school. This means over and above being a girl (if they were) and being in school for 4 months, being in a treatment school would have increased their achievement by an additional 14.34 letters per minute. The size of this impact is large, certainly, but it is even more interesting how large the effect is in comparison to the gender and post-achievement effects, the effect is 5.3 times larger than the gender effect and 1.6 times larger than being in school for half of a year.
Figure 26. The impact of South African SMRS on Letters Read per Minute
2.68
8.87
14.34
0
5
10
15
20
25
30
Letters Read
Impact of South African SMRS on Letters Read Per Minute
SMRS effect
4 months of school
Being a girl
Figure 27 below presents a similar graphic measure for the impact of the SMRS program on learner achievement in the word identification fluency task. Note that the effect size is, once again, quite large. Being a girl increases one’s score by 1 point, being in school for 4 months by 2.57 points. Our effect, therefore, is the additional impact of 4.56 words on the average child’s score. This effect comes from the differences-in-differences causal estimator and relates to the additive effect of being in a treatment school. Again, note that the size of the effect is 5.1 times larger than the effect of gender, and 1.77 times larger than the effect of half a year of school. This, therefore, means that the average child in an SMRS school has nearly tripled the effect of that half a year in school.

36 Impact Study of SMRS Using Early Grade Reading Assessment in Three Provinces in South Africa
Figure 27. The impact of South African SMRS on Words Identified per Minute
0.9
2.57
4.56
0
1
2
3
4
5
6
7
8
9
Words Identified
Impact of South African SMRS on Words Identified Per Minute
SMRS effect
4 months of schoolBeing a girl
Finally, Figure 28 presents the additive impact of the SMRS program on learner achievement for the oral reading fluency task. The effect size in this figure is again very big. For oral reading fluency, being a girl increases one’s score by 1.11, being in half a year of school by 3.9 words, and by being in the SMRS program by 7.2 words per minute. Comparatively, this means that the effect of being in an SMRS program is 6.5 times the effect of being a girl and 1.85 times the effect of being in school for half of a year. Substantively, this means that being in an SMRS school nearly triples the effect of being in one half year of school.
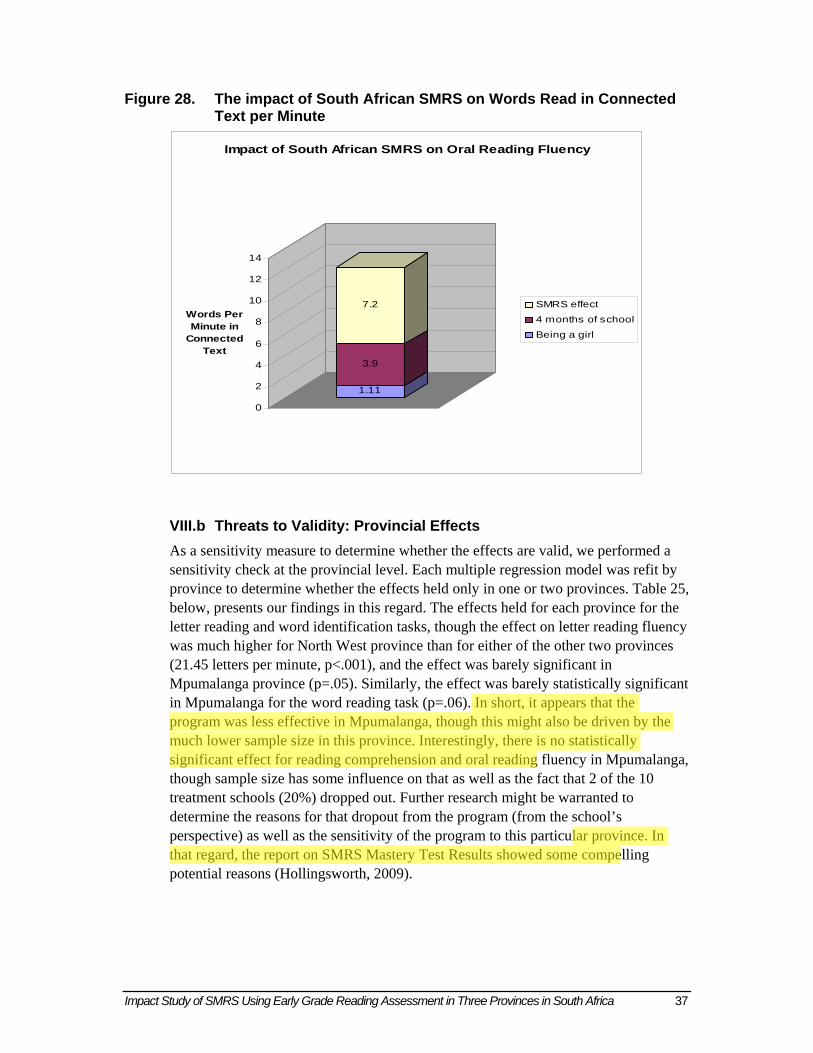
Impact Study of SMRS Using Early Grade Reading Assessment in Three Provinces in South Africa 37
Figure 28. The impact of South African SMRS on Words Read in Connected Text per Minute
1.11
3.9
7.2
0
2
4
6
8
10
12
14
Words Per Minute in
Connected Text
Impact of South African SMRS on Oral Reading Fluency
SMRS effect4 months of school
Being a girl
VIII.b Threats to Validity: Provincial Effects As a sensitivity measure to determine whether the effects are valid, we performed a sensitivity check at the provincial level. Each multiple regression model was refit by province to determine whether the effects held only in one or two provinces. Table 25, below, presents our findings in this regard. The effects held for each province for the letter reading and word identification tasks, though the effect on letter reading fluency was much higher for North West province than for either of the other two provinces (21.45 letters per minute, p<.001), and the effect was barely significant in Mpumalanga province (p=.05). Similarly, the effect was barely statistically significant in Mpumalanga for the word reading task (p=.06). In short, it appears that the program was less effective in Mpumalanga, though this might also be driven by the much lower sample size in this province. Interestingly, there is no statistically significant effect for reading comprehension and oral reading fluency in Mpumalanga, though sample size has some influence on that as well as the fact that 2 of the 10 treatment schools (20%) dropped out. Further research might be warranted to determine the reasons for that dropout from the program (from the school’s perspective) as well as the sensitivity of the program to this particular province. In that regard, the report on SMRS Mastery Test Results showed some compelling potential reasons (Hollingsworth, 2009).

38 Impact Study of SMRS Using Early Grade Reading Assessment in Three Provinces in South Africa
Table 25. Multiple regression analysis matching the treatment dummy variable and province
Province Outcome Predictor Coeff. Std
Error T Sig. Lower
CI Upper
CI F Sig. R2 Treatment 8.52 2.60 3.28 <.01 3.40 13.65 Letter reading
fluency Constant 14.49 2.28 6.35 <.001 9.99 18.99 10.76 <.01 .05
Treatment 2.36 1.18 2.00 .05 0.03 4.69 Word reading fluency Constant 3.62 1.04 3.49 <.01 1.57 5.67
3.98 0.47 .02
Treatment 2.38 1.67 1.43 .16 -0.91 5.67 Oral reading fluency Constant 6.91 1.47 4.72 <.001 4.02 9.80
2.03 .16 .01
Treatment 7.18 2.92 2.46 .02 1.42 12.95
Limpopo
Reading comprehension Constant 4 2.57 1.56 .12 -1.06 9.06
6.04 .01 .03
Treatment 2.96 1.47 2.02 .05 .06 5.87 4.08 .05 .03 Letter reading fluency Constant 6.38 1.04 6.13 <.001 4.32 8.44
Treatment 0.84 0.44 1.89 .06 -.04 1.71 3.59 .06 .03 Word reading fluency Constant 2.44 0.31 7.79 <.001 1.82 3.07
Treatment .04 .57 .08 .94 -1.08 1.16 .01 .94 .00 Oral reading fluency Constant 1.22 .40 3.04 <.01 .43 2.02
Treatment 0.54 2.94 0.18 .85 -5.28 6.36 .03 .85 .00
Mpumalanga
Reading comprehension Constant 5.40 2.09 2.59 .01 1.27 9.53
Treatment 21.45 3.02 7.10 <.001 15.50 27.40 50.45 <.001 .19 Letter reading fluency Constant 6.38 1.04 6.13 <.001 4.32 8.44
Treatment 8.08 1.37 5.89 <.001 5.38 10.79 34.67 <.001 .14 Word reading fluency Constant 1.75 1.18 1.48 .14 -.59 4.08
Treatment 12.51 2.45 5.10 <.001 7.68 17.34 26.05 <.001 .11 Oral reading fluency Constant 4.55 2.11 2.15 .03 .38 8.71
Treatment 17.03 4.16 4.09 <.001 8.82 25.23 16.74 <.001 .08
North West
Reading comprehension Constant 1.45 3.58 0.41 .69 -5.61 8.52
IX. Discussion: Effect Sizes In the table presented below (Table 26), estimates and effect sizes for the impact of the SMRS program on the four South African EGRA sub-tasks are expressed using three different methods: t-tests in an experimental design, multiple regression in an experimental design and differences-in-differences. While all of the results were statistically significant and large in magnitude, it is worth noting the consistency of the estimates across methods. For letter sounding, the estimate is somewhere between .785 and .786 standard deviations. It is higher for word naming, between .794 and .803 SDs. For ORF, the effect is between .802 and .813, and for reading comprehension between .790 and .929 standard deviations. The robustness of the findings in this paper are remarkable, then, and lend strong evidence to the idea that the SMRS is an highly effective program with respect to the measures that the EGRA evaluates by any measure.

Impact Study of SMRS Using Early Grade Reading Assessment in Three Provinces in South Africa 39
Table 26. Comparing effect sizes for outcome variables across t-tests, regression and difference-in-difference designs
Letter sounding Fluency
Word naming fluency
Oral reading fluency
Reading comprehension
Estimate (SD) Estimate (SD) Estimate (SD Estimate (SD)
T-tests (experimental design)
14.14 (.7851)
4.61 (.8031)
7.31 (.8131)
9.69 (.9291)
Regression (experimental design)
14.13 (.7846)
4.61 (.8031)
7.22 (.8031)
8.24 (.7900)
Differences-in-differences
14.34 (.7962)
4.56 (.7944)
7.21 (.8020)
n/a
IX.a South Africa Benchmarks In this section we present an attempt to focus policy makers attention to the reading skills within South Africa. Earlier we compared South African learners with benchmarks adapted from the United States. Remarkably, learners in treatment schools were able to narrow the gap between themselves and their US counterparts. However, we do not think that using US benchmarks is entirely appropriate and do so timidly, and only since only now have there been crude attempts to create comparable benchmarks within Sub-Saharan Africa in the area of early reading skills. This section presents another very crude attempt. The post-assessment data was examined to determine the scores, at the school average level, for the four South African sub-tasks at the schools at the 90th percentile. This became the outer limit for the benchmark figure below. Then, for learners in treatment and control schools, we took the median score on each of the four tasks. We used that median score to create a percentile score when comparing that average child in treatment and control schools against the average child in a high-performing (90th percentile) school in this sample. What Figure 29 shows is that the average child in a control school has not reached halfway to the scores in the excellent South African school. He’s closer to halfway in letter reading fluency (30.6%) but very far in reading comprehension (19.0%). On the other hand, the learners in the treatment schools are farther along. For example, in word identification (65.7%), ORF (63.3%) and reading comprehension (66.7%), the learners are nearly two-thirds of the way there. They are even closer in letter recognition fluency, at 77.5%. This suggests three things. First, that without intervention, there are wide gaps between the average child in the average school and excellent learning potential. Second, that even with a short-term 4 month burst of training, learners can make significant progress towards excellence, even if they themselves are not in an excellent school, per se. Third, an intervention of this magnitude and success remains insufficient to overcome all of the challenges that face South African learners in the early years, and more should be done to assist them.

40 Impact Study of SMRS Using Early Grade Reading Assessment in Three Provinces in South Africa
Figure 29. South African benchmark graph with 90th percentile school, treatment and control scores
Progress Towards South African Grade 1 Benchmarks
Letter Reading Fluency
Word Reading Fluency
Oral Reading Fluency
Reading ComprehensionTreatmentControl
X. Recommendations The combination of the experimental research design, the commitment of South African teachers to this program, its carefully crafted lesson plans, and the attention and interest of South African learners has combined to create a program that was extraordinarily successful, and produced consistent effects across provinces, districts, schools teachers, and within a variety of EGRA sub-tasks. The most obvious takeaway, clearly, is that this program should be replicated at a scale that the South African Ministry of Education feels comfortable with and can afford based on available resources. This program works, and it appears that it is worth exploring whether the remarkable success identified here can be replicated across the country, particularly because these results were identified when less than half of the lessons were completed. Additionally, the findings suggest a handful of other specific policy recommendations of interest to policymakers and other stakeholders.
RTI International expected that this program would be successful given pilot programs attempted in Niger and Mali. However, the much larger impact identified in this program means that careful attention should be paid to the conditions under which this program was implemented to determine whether they are replicable. One portion of the program is notable: it was implemented at the very beginning of the very first grade where pre-reading and reading skills were introduced. It might be that teachers at the earliest grades, with the least job security and often lowest levels of experience, are more likely to adjust their teaching methods to a new style of teaching. This is an unlikely explanation given the high levels of experience (23 years average) in the teachers in the sample. Or it might be that increases in pedagogical quality at the lowest grades reverberate throughout the Grade 1 system causing other changes to happen, including greater parental involvement and accountability. Most
Impact Study of SMRS Using Early Grade Reading Assessment in Three Provinces in South Africa 41
likely, however, is that Grade 1 is a particularly sensitive grade to intervention in the South African context due to the fact that it has been largely ignored by policy changes and its teachers are less educated than others, on average. It is possible that it is simply more sensitive to changes, and that small improvements in pedagogical quality, even over short periods of time, might have indelible impacts on learner achievement.
While this report showed that some of the variation that was attributed to attendance in Grade R, such that learners without it scored much lower, was actually a result of provincial differences, it is worth noting the size of the relationship between Grade R and learner achievement. While the program is certainly not yet perfect, it seems that learners who are denied the Grade R are quite different from those that benefit, and that the Department must do more to ensure participation by the most vulnerable learners and families.
While nearly all of the sub-tasks showed statistically significant increases due to SMRS in all three provinces, it is worth noting that oral reading fluency and reading comprehension scores were not statistically significantly higher in Mpumalanga province. A caveat should be made, since the province-level sample sizes were very small, and smallest in this province, and the direction of the effect was positive, but it is worth noting that more care should be paid to ensure that learners in Mpumalanga have more opportunities to engage with the building blocks of reading (letter and word work and exposure), but this must be accompanied by practice reading easily decodable books with patterns, as well as focus on strategies for increasing retention and comprehension. While the SMRS program provided just this sort of support, it appears that a heavier intervention is warranted in this particular province, better supported and hopefully embraced by the educational officials in the province. See the report on SMRS Mastery Test Results for more details (Hollingsworth, 2009).
In general, while the SMRS program increased comprehension by a .8-.9 SD effect size, it is worth noting that since the start place on the baseline assessment was so low, that reading comprehension scores were much better but not nearly high enough. It is clear that reading comprehension levels less than 20% correct remain unacceptable, even if that is an enormous percentage gain over learners in control schools. However, since many learners did not progress past SMRS Levels 1 and 2,7 lower levels of comprehension would are not surprising. Given that it would be a failure of programs like SMRS to lead to reading strategies that focused on words and letters and reading fluently, but ignored comprehension, it must be noted here that continued strategic development for teachers should be targeted in helping them help learners to develop meta-cognitive processes that allow them to examine themselves whether they understand the text, and if not, to review the words and ask themselves questions about the text as they read. Reading fluency without comprehension is
7 Level 1 Stories (1-2 short sentences per page; 1 paragraph); Level 2 Stories (3-4 sentences, 2 longer sentences; less than 3 paragraphs); Level 3 Stories (5-8 sentences, or 4 longer sentences; conceptually difficult; 3 or more paragraphs); Level 4 Stories (multiple sentences and paragraphs conceptually complex).
42 Impact Study of SMRS Using Early Grade Reading Assessment in Three Provinces in South Africa
still nothing, however, so our findings reiterate the importance of extending programs like SMRS to expand their focus on comprehension. This is particularly the case since some might argue that the findings of impact on EGRA simply emanate from the increased exposure learners would have had to this type of test (due to the formative evaluation within SMRS), but not on their thinking. This is why it is important that comprehension increased, to dissuade that particular argument, yet more could be done to focus on comprehension. It is notable, again, that the SMRS program was not completed at the time of the post-assessment, and if it had been, it is probable that higher impacts on comprehension would have been identified.
Our findings also lend credence to the continued and advanced use of experimental designs. With simple sampling strategies and pre and post-assessment strategies designed to decrease sample attrition and increase data quality, we were able to identify causal effects of the program quite convincingly. And since Ministries and governments are increasingly aware of the power of experimental and quasi-experimental studies to garner the attention of the international community, South Africa and other countries should pay heed to the potential power of experimental designs for research. This will require, of course, increased technical expertise and the balance to employ these methods without ignoring other types of research, but we are hopeful that the international community can continue to increase our body of knowledge framed in this way without ever thinking that this (experimental design) is the only way.
These findings also shed light on the ability of the Early Grade Reading Assessment tool to be used as a program evaluation tool. In this case, while RTI International designed the study and managed the data entry, data analysis and report writing, the South African Department of Education officers were heavily involved alongside MILL staff, therefore the results are based in South Africa. The ability of the various sub-tasks of even a simplified EGRA to work together as a coherent whole as evident by the Cronbach’s alpha test, is significant. A Cronbach’s alpha score of .95 for an assessment tool created in-country by local staff is quite notable, and lends credence to the ability of Sub-Saharan African countries to adapt EGRA for their own uses. That said, the fact that many of the sub-tasks appeared to assess a similar part of the underlying early grade literacy construct as the others lends some credence to the importance of the other sub-tasks, particularly phonemic awareness and listening comprehension, which would have been able to identify different portions of the underlying early grade reading construct.
It should also be noted that much of the program’s success begins from the ability to start with letters. The significant impact of the program on letter sounds means that much effort was spent on a topic that many might think below the scope of project or governmental interventions: ensuring that learners know the sounds that are associated with letters. On the contrary, the findings here show that this is a critical first step in creating long-term reading achievement, and therefore this needs to be addressed at the policy level. This is not to say that other portions of the SMRS program are not effective, but that the focus on letter sounds initially is a catalyst to the success of the rest of the program.

Impact Study of SMRS Using Early Grade Reading Assessment in Three Provinces in South Africa 43
Finally, the ability of the SMRS program to move 20-30% of learners who were scoring 0 at the baseline to at least some ability to read, decode and identify letters is remarkable. Many other interventions take middle-level learners and increase them even more. This one, however, successfully engaged the lowest, poorest learners in the lowest grades, and might have taken learners who were lost before they began, and given them a real chance to succeed in their future schooling endeavors. For those of us interested in equity and poverty eradication, this program’s ability to access the skills and abilities of the lowest-performing groups is impressive, and suggests that policymakers ought not to ignore the early grades, and note that particularly strong policy interventions have the ability to make an impact on achievement in the classroom.
XI. Conclusion The SMRS program had a particularly large impact on learner achievement in letter sounding fluency, word identification fluency, oral reading fluency and reading comprehension after only four months of implementation, providing learners in treatment schools the ability to take a great leap forward towards accessing print and the written word. It seems clear that the success of the program is compelling, and worthy of additional opportunities to improve the skills of young learners from poor backgrounds.

44 Impact Study of SMRS Using Early Grade Reading Assessment in Three Provinces in South Africa
Appendix 1: Average Differences Between Baseline
and Post-Assessment Scores by Treatment and Control Schools and Gender
Item Treatment Gender N Mean Standard deviation Minimum Maximum
Boys 178 20.31 17.66 0 98
Girls 196 25.30 18.92 0 87
Treatment
Total 374 22.93 18.48 0 98
Boys 87 6.47 10.49 -5 47
Girls 76 11.45 13.39 -5 58
Letter sounding fluency (Gain)
Control
Total 163 8.79 12.15 -5 58
Boys 178 5.98 7.51 0 40
Girls 196 8.20 8.94 -1 40
Treatment
Total 374 7.14 8.36 0 40
Boys 87 1.93 4.16 -2 26
Girls 76 3.22 4.08 -3 16
Word naming fluency (Gain)
Control
Total 163 2.53 4.16 -2 26
Boys 178 9.51 13.12 0 62
Girls 196 12.73 15.49 0 63.03
Treatment
Total 374 11.20 14.48 0 64.07
Boys 87 3.41 6.37 0 35
Girls 76 4.49 6.54 0 25
Oral reading fluency (Gain)
Control
Total 163 3.91 6.45 0 35
Boys 178 0.10 0.22 0 1
Girls 196 0.16 0.27 0 1
Treatment
Total 374 0.13 0.25 0 1
Boys 87 0.03 0.11 0 0.6
Girls 76 0.05 0.13 0 0.6
Reading comprehension (Gain Control
Total 163 0.04 0.12 0 0.6