masking level differences and binaural intelligibility level differences in
TRANSCRIPT

MASKING LEVEL DIFFERENCES AND BINAURAL INTELLIGIBILITY LEVEL
DIFFERENCES IN CHILDREN WITH DOWN SYNDROME
By
Heather L. Porter
Dissertation
Submitted to the Faculty of the
Graduate School of Vanderbilt University
in partial fulfillment of the requirements
for the degree of
DOCTOR OF PHILOSOPHY
in
Hearing and Speech Sciences
May, 2012
Nashville, Tennessee
Approved:
Anne Marie Tharpe
D. Wesley Grantham
Daniel H. Ashmead
Robert Hodapp

iii
ACKNOWLEDGEMENTS
This research project represents the culmination of an enriched academic experience that
was facilitated by the members of my dissertation committee. First, I would like to thank Dr.
Anne Marie Tharpe for providing her expertise in pediatric audiology and serving as the chair of
my dissertation committee. She has been an active source of encouragement throughout my
program and is an exemplary role model. I am also extraordinarily grateful to Dr. D. Wesley
Grantham for providing his expertise in psychophysiology and for the countless hours he
patiently volunteered to our programming sessions. I was fortunate to have had the opportunity
to work closely with him and learned at least as much about kindness as I did about
programming. I am grateful to Dr. Daniel H. Ashmead for proving ongoing methodological and
statistical insights. In addition, I am grateful to him as he posed a question on my qualifying
exam that prompted this examination of the binaural hearing abilities of children with Down
syndrome. Dr. Robert Hodapp was a steady source of insight regarding children with Down
syndrome and their families and I am fortunate to have had his participation on my committee.
His welcoming demeanor helped build a natural bridge to relationships with other researchers,
service providers, students, and families within the Down syndrome community.
It is also important to express my gratitude for the consistent encouragement and support
Dr. Fred Bess has provided since I arrived at Vanderbilt. I have been personally and
intellectually enriched by our frequent coffee talks and hope that I have learned half as much as I
know he tried to teach me.
I am grateful for the loving support of my family. My parents, Jim and Deb, always
encouraged us to get out on stage and my sisters, Jessica and Colleen, have been there since to
make me remember how funny the costumes looked. Together, they have taught me to provide

iv
my honest and full participation in life tempered by a healthy dose of humility. In addition, I am
lucky to have married my best friend. Raz has helped me grow since the day I met him and I
look forward to spending the rest of our lives together.
I would like to thank Special Olympics, Inc. and Vanderbilt Institute for Clinical and
Translational Research for their financial support of this project.

v
TABLE OF CONTENTS
Page
ACKNOWLEDGEMENTS ............................................................................................... iii
LIST OF TABLES ............................................................................................................ vii
LIST OF FIGURES ......................................................................................................... viii
Chapter
I. INTRODUCTION ...................................................................................................1
II. REVIEW OF THE LITERATURE .........................................................................3
Binaural Release from Masking...................................................................3
Mechanisms of Binaural Hearing ................................................................4
Measurement of Binaural Release from Masking .......................................6
Development of Binaural Release from Masking ........................................8
Purpose .......................................................................................................18
III. METHODOLOGY .............................................................................................19
Participants .................................................................................................19
Materials and Instrumentation ...................................................................20
Pre-Experimental Procedures.....................................................................24
Experimental Procedures ...........................................................................24
IV. RESULTS ...........................................................................................................31
Masking Level Difference .........................................................................31
Binaural Intelligibility Level Difference ...................................................35
Psychometric Functions .............................................................................52
V. DISCUSSION ......................................................................................................56
Sensory Influences .....................................................................................57
Non-Sensory Influences .............................................................................62
VI. CONCLUSION AND DIRECTIONS FOR FUTURE RESEARCH .................69
Appendix
A. OTOLOGIC CASE HISTORY ............................................................................72
B. MASKING LEVEL DIFFERENCE SCRIPT ......................................................73

vi
REFERENCES ..................................................................................................................74

vii
LIST OF TABLES
Table Page
1. Research Relative to Auditory Processing Capabilities for Children with
Down Syndrome ...................................................................................................11
2. Listening Conditions Derived from Free-Field Recordings ..................................27
3. Statistical Power for Analyses of Variance (ANOVAs) Comparing Mean
Scores for Children with and without Histories of Otitis Media ...........................30
4. Hearing Threshold for 500 Hz, N0S0, and N0S , and MLD ................................33
5. Bilateral PTA, and Hearing Threshold and BILD for Derived Free-Field
Conditions ..............................................................................................................38

viii
LIST OF FIGURES
Figure Page
1. Major Auditory Brainstem Nuclei Utilized for Binaural Hearing ...........................5
2. Sample ABR for Infants with Down Syndrome and Typically-Developing
Infants ....................................................................................................................16
3. Long Term Spectral Averages of Speech and Noise Stimuli ................................22
4. Sample of Recorded and Derived Noise Signals ...................................................23
5. N0S0 and N0S Threshold for Individuals with Down Syndrome and
Typically-Developing Individuals .........................................................................31
6. MLD as a Function of Chronological Age for Individuals with Down
Syndrome and Typically-Developing Individuals .................................................34
7. MLD as a Function of Receptive Language Age Equivalent for Children and
Adolescents with Down Syndrome ........................................................................35
8. FF0, FF45, and FF90 Threshold for Individuals with Down Syndrome and
Typically-Developing Individuals .........................................................................36
9. BILD for FF45 and FF90 as a Function of Chronological Age for Individuals
with Down Syndrome and Typically-Developing Individuals ..............................39
10. BILD for FF45 and FF90 as a Function of Receptive Language Age for
Children and Adolescents with Down Syndrome ..................................................40
11. MLD as a Function of BILD FF90 for Individuals with Down Syndrome and
Typically-Developing Individuals .........................................................................41
12. SNR Threshold for FF0, FF45, and FF90 as a Function of Chronological Age
for Individuals with Down Syndrome and Typically-Developing Individuals .....43
13. SNR Threshold for FF0, FF45, and FF90 as a Function of Receptive
Language Age for Children and Adolescents with Down Syndrome ....................45
14. SNR as a Function of Azimuth for Simulated Free-Field Conditions for
Individuals with Down Syndrome and Typically-Developing Individuals ...........46
15. SNR Threshold for FF0, SNR45, and SNR90 for Children and Adults with
Down Syndrome and Typically-Developing Individuals in Designated Age
Groups ....................................................................................................................48

ix
16. SNR Threshold as a Function of Azimuth for Simulated Free-Field and
Isolated Cue Conditions for Children and Adults with Down syndrome and
Typically-Developing Children and Adults ...........................................................50
17. Psychometric Functions for N0S0 and N0S for Children and Adults with
Down Syndrome and Typically-Developing Children and Adults ........................53
18. Psychometric Functions for FF0 and FF90 for Children and Adults with
Down Syndrome and Typically-Developing Children and Adults ........................54

1
CHAPTER I
INTRODUCTION
Binaural hearing results in a number of listening advantages relative to monaural hearing,
including enhanced hearing sensitivity, more accurate localization of auditory signals, and better
speech understanding in adverse listening conditions. These advantages are facilitated by the
ability to detect and utilize interaural cues. However, some listening advantages can be captured
monaurally, such as attending to the ear with the better signal-to-noise ratio (SNR). To assess
binaural abilities using interaural cues, one must first account for any monaural advantage due to
improved SNR within each ear. Some studies have used clever techniques to allow independent
manipulation of the various cues underlying speech recognition (i.e., by recording through a
manikin's ears and presenting the signals to subjects via headphones). Such techniques enable
the investigation of the relative influence of various listening cues for reducing the interference
of background noise on a signal of interest in the free-field (e.g., Bronkhorst & Plomp, 1988).
Listening cues that include monaural components have a greater relative influence on speech
understanding in noisy situations than binaural cues for adult listeners; however, this has not
been investigated for children (Bronkhorst & Plomp, 1988). Auditory perceptual abilities
develop throughout childhood; therefore, it is possible that the relative influence of various
listening cues differs for children and adults (Cameron et al., 2009; Hall, Buss, Grose, & Dev,
2004; Hall & Grose, 1990a; Van Deun et al., 2009).
The auditory perceptual abilities of children with developmental disabilities can also be
expected to develop throughout childhood, though it is reasonable to suspect that their auditory
perceptual development might vary from that of typically-developing children. For example, it

2
is well understood that infants and children with Down syndrome have unique auditory
structures resulting from congenital and acquired influences (e.g., Balkany, Mischke, Downs, &
Jafek, 1979; Becker, Armstrong, & Chan, 1986; Bilgin, Kasemsuwan, Schachern, Paparella, &
Le, 1996; Blaser et al., 2006). Binaural processing of auditory stimuli begins subcortically with
the most peripheral site of human binaural interaction being the superior olivary complex.
Aberrant subcortical anatomy, such as that seen in children with Down syndrome, might result in
atypical binaural processing. It is possible that these structural aberrations contribute to the
differences in the auditory perceptual capabilities of children with Down syndrome and their
typically-developing peers that have been discussed in speech perception studies (e.g., Cardoso-
Martins & Frith, 2001; Jarrold, Baddeley, & Phillips, 2002; Keller-Bell & Fox, 2007). The
following review of the literature will describe current knowledge regarding the binaural
capabilities of typically-developing children as well as provide a rationale for why the binaural
capabilities of children with Down syndrome might differ.

3
CHAPTER II
REVIEW OF THE LITERATURE
Binaural Release from Masking
Listening in noise is more difficult than listening in quiet, even for robust signals of
interest like speech. Even individuals with normal hearing experience difficulty attending to a
single speaker in a room when many sound sources are present. However, it has been
historically well documented that the effects of interfering background noise decrease when
listening with two ears rather than one (e.g., Carhart, 1965; Moncur & Dirks, 1967). The central
auditory system is able to utilize information from signals arriving at each ear to reduce the
interference of background noise on a signal of interest. This phenomenon is known as binaural
release from masking.
Various models have been proposed to describe binaural release from masking including
an Equalization-Cancellation model (EC; Durlach, 1972), a “vector” or lateralization model
(Hafter, 1971; Jeffress, Blodgett, Sandel, & Wood, 1956; Webster, 1951), and a cross-correlation
model (Colburn, 1973, 1977; Jeffress, 1948). Though these models vary slightly from one
another, they can each be described under a framework that includes a comparison of signals
within the central auditory system after processing by the peripheral auditory system (Stern &
Trahiotis, 1995). Whereas cross-correlation and lateralization models suggest that the central
auditory system compares timing information from responses of the fibers from the two ears as a
function of characteristic frequency, the EC model does not suggest specific neural mechanisms

4
underlying binaural processing. However, the mathematical equations proposed by Durlach
(1972) successfully describe many binaural phenomena.
Mechanisms of Binaural Hearing
Interaural Cue Detection
Sounds originating from a single location in space will arrive at each ear at a particular
time and intensity. The relative time and intensity that a sound arrives at each ear varies based
on the position of the sound source relative to head orientation. The central auditory system can
use these relative differences between ears for localization, spatial awareness, orientation to
sound, and minimization of the effects of background noise on a signal of interest. Differences
in sound between ears are described in terms of phase (for periodic signals), or interaural phase
differences (IPDs), time, or interaural time differences (ITDs), and level, or interaural level
differences (ILDs).
The ITD of a sound can vary from 0 ms for sound originating at 0° azimuth to
approximately 0.6 ms for sounds generated at 90° or 270° azimuth. Interaural time or phase cues
are most reliably detected for low frequency sounds as their relatively long wavelength reaches
each ear at a different phase. To contrast, the short wavelength of high frequency sounds is
susceptible to head shadow and as a result, interaural level cues are most reliably detected for
high frequency sounds. The maximum ILD for a 500 Hz tone is 4 dB compared to the maximum
ILD for a 6000 Hz tone, which is nearly 20 dB (for review see Grantham, 1995). The central
auditory system uses multiple cues (both interaural cues as described above and monaural
spectral cues) for localizing sound and minimizing the effects of noise on a signal of interest.

5
Cochlear Nucleus
Cochlea
Inferior Colliculus
Nucleus of the Lateral
Lemniscus
Inferior Colliculus
Nucleus of the Lateral
Lemniscus
Cochlear Nucleus
Cochlea
Midline
LEFT RIGHT To thalamus and cortex
Superior Olivary Complex Superior Olivary Complex
Anatomy and Physiology of Binaural Hearing
Multiple nuclei and pathways are involved in binaural hearing occurring at three primary
levels of the brainstem: the superior olivary complex, the nuclei of the lateral lemniscus, and the
inferior colliculus. Figure 1 illustrates major auditory brainstem nuclei and their projections.
Figure 1. Major auditory brainstem nuclei utilized for binaural hearing.
The anterior ventral cochlear nucleus projects to the ipsilateral and contralateral superior olivary
complex and the ipsilateral nucleus of the lateral lemniscus. In addition, some cochlear nucleus
axons also project to the contralateral nucleus of the lateral lemniscus and the inferior colliculus.
The superior olivary complex projects bilaterally to the nucleus of the lateral lemniscus and
ipsilaterally to the inferior colliculus. The nucleus of the lateral lemniscus projects bilaterally to

6
the inferior colliculus. The inferior colliculus is unique in that it is innervated by every nuclear
group within the auditory brainstem. Axons from the inferior colliculus project to the thalamus
and cortex.
There is evidence to support the involvement of brainstem structures including the
superior olivary complex and inferior colliculus in speech-in-noise discrimination and the
analysis of ITDs and ILDs (Litovsky, Fligor, & Tramo, 2002; Moore, 1991; Song, Skoe, Banai,
& Kraus, 2010). Brainstem encoding of the fundamental frequency (F0) is associated with
speech discrimination in background noise (Song, Skoe, Banai, & Kraus, 2011). In addition, the
superior olivary complex is predominately involved in analyzing ITDs and ILDs (For review see,
Moore, 1991). However, the inferior colliculus is also sensitive to ITDs and ILDs in addition to
mediating other aspects of binaural processing such as localization of sound in a hemifield and
echo suppression (Litovsky et al., 2002).
Measurement of Binaural Release from Masking
Pure Tone Stimuli
A typical measure of binaural release from masking is based on the detectability of pure
tone signals in the presence of noise maskers presented over headphones. For example, detection
threshold can first be measured in a reference condition in which the noise and the signal are
presented identically to the two ears (a condition referred to as N0S0). If the interaural
relationship of the noise or the masker is changed, there can be an improvement in threshold, or a
release from masking. The difference in threshold between the dichotic configuration and the
reference condition is commonly referred to as the masking level difference (MLD). The
maximum MLD – about 15 dB for a low frequency tone – is typically observed when the noise is

7
presented identically to the two ears while the signal tone is presented 180° out of phase in one
ear relative to the other (a condition referred to as N0S).
The MLD can be affected by many variables, such as signal frequency, signal interaural
phase, noise intensity, and noise bandwidth (for review see Green, 1976). For example, low
frequency signals yield greater improvements than high frequency signals. For the N0S
configuration, an MLD of 15 dB can be expected for adult listeners with normal hearing for a
low frequency pure tone signal, but the MLD decreases with increasing frequency to about 3 dB
at approximately 1500 Hz and higher (Hirsh, 1948). The largest N0S MLDs occur when the
noise is presented at a moderate to loud sensation level that is similar in intensity between ears
(Hirsh, 1948). Though some binaural benefits can be expected for noise intensity differences of
10 dB between ears, benefits diminish for larger differences (Blodgett, Jeffress, & Whitworth,
1962). Finally, the MLD for low frequency signals increases as noise bandwidth decreases, at
least for adults (e.g., Grose, Hall, & Dev, 1997). This result could be due to the inherent
amplitude fluctuations present in narrowband noise. Mature binaural auditory systems might be
able to take advantage of the relatively good signal-to-noise ratio in the minima (troughs) of
ongoing narrowband noise.
Speech Stimuli
Binaural release from masking for speech signals is often measured by comparing the
change in detection or intelligibility of speech signals in noise presented in varying binaural
configurations. This can be done in the free-field by spatially separating signal and noise sources
or under headphones by varying parameters such as ITD and ILD. In free-field situations it is
not possible to independently manipulate the ILD and ITD cues, because they vary together as a
sound source is moved. Also, it must be noted that moving a sound source away from midline,

8
in addition to producing ITD and ILD cues, results in changing SNRs at each ear. Thus, an
improvement in threshold may reflect the fact that the spatial configuration allows a listener to
attend to the ear with the better SNR, which requires only monaural abilities.
Several studies have demonstrated the positive effects of binaural release from masking
on listening to speech in adverse listening situations (Bronkhorst & Plomp, 1988; Carhart, 1965;
Harris, 1965; MacKeith & Coles, 1971; Moncur & Dirks, 1967). Advantages of 3 to 9 dB can be
expected for conditions similar to real-life binaural hearing situations in which ITD and ILD are
able to be utilized by listeners (e.g., Carhart, 1965; Levitt & Rabiner, 1967). By recording
sounds through a manikin’s ears, processing these recorded left ear and right ear signals, and
presenting them over headphones, Bronkhorst & Plomp (1988) were able to investigate the
separate contributions of ILDs and ITDs to spatial release from masking. They found that adults
with normal hearing have greater average binaural release from masking for speech with only
ILD cues (ITDs set to 0) than with only ITD cues (ILDs set to 0). These results suggest that
head shadow is a significant determinant of binaural advantage for speech intelligibility in free-
field conditions, at least for adults.
Development of Binaural Release from Masking
Pure Tone Stimuli
The ability to use interaural cues to detect signals in noise develops throughout
childhood. Infants and children have been shown to have smaller MLDs than adults for many
signal and noise configurations (Grose et al., 1997; Hall & Grose, 1990a; Nozza, 1987; Van
Deun et al., 2009). For example, typically-developing infants with normal hearing have smaller
MLDs than adults for 500 Hz pure tones presented in broadband noise (i.e., 600 Hz; Nozza,

9
1987). However, by about 5 to 10 years of age, typically-developing children have adult-like
MLDs for similar signal and noise configurations (e.g., 500 Hz pure tones presented in
broadband noise; Grose et al., 1997; Hall & Grose, 1990a; Moore, Cowan, Riley, Edmondson-
Jones, & Ferguson, 2011). Similar results have been observed for filtered click trains presented
in broadband noise (Van Deun et al., 2009).
Though the discussion above suggests that children have adult-like MLDs by school-age,
the bandwidth of the masking noise can affect MLDs in children. That is, children have smaller
MLDs than adults for signals presented in narrower bandwidths of noise, such as 20 Hz and 40
Hz (Grose et al., 1997; Hall & Grose, 1990b). Children seem to have difficulty optimizing
binaural temporal window placement, but the ability to take advantage of temporal minima in
masker noise to detect a signal improves with age (Hall, Buss, & Grose, 2007; Hall et al., 2004).
Speech Stimuli
Some developmental changes in binaural advantage for the perception of speech sounds
and sentences presented in noise have been demonstrated (Cameron & Dillon, 2007; Nozza,
Wagner, & Crandell, 1988). Infants have smaller MLDs than adults for the speech sound /ba/
presented in broadband masking noise; however, adult-like MLDs can be expected in this
condition for children between the ages of 3.5 and 4.5 years (Nozza et al., 1988). Increased
binaural advantage with age for understanding sentences presented in multi-talker noise can be
expected for children between the ages of 5 to 11 years (Cameron et al., 2009; Cameron &
Dillon, 2007). However, children as young as 2.5 years of age have demonstrated binaural
benefit similar to adults for understanding speech in noise in some circumstances (Garadat &
Litovsky, 2007). For example, preschool and school-aged children exhibit adult-like binaural

10
benefits for understanding closed-set spondees presented in competing speech stimuli (Garadat
& Litovsky, 2007; Litovsky, 2005).
Binaural Hearing in Children with Down Syndrome
With the exception of a few studies (e.g., Glenn, Cunningham, & Joyce, 1981; Werner,
Mancl, & Folsom, 1996), little work has been done to understand the auditory abilities of infants
and children with Down syndrome. However, some broad conclusions about the perceptual
auditory capabilities of infants and children with Down syndrome can be made from speech
perception studies. Results from speech perception studies suggest that infants and children with
Down syndrome have poorer auditory perceptual capabilities than their typically-developing
peers even when they are matched by equal reading ability, developmental age, and
chronological age (e.g., Cardoso-Martins & Frith, 2001; Glenn et al., 1981; Jarrold et al., 2002;
Keller-Bell & Fox, 2007; Roch & Jarrold, 2008; Yoder, Camarata, Camarata, & Williams, 2006).
Although one might suspect that the relatively poor speech perception abilities
characteristic of children with Down syndrome are the result of cognitive deficits, their ability to
listen in noise could be influenced by less-than-optimal binaural processing abilities. Though the
binaural processing capabilities of children with Down syndrome have not been explored
specifically, other auditory capabilities have been investigated, such as the development of
auditory sensitivity, phonological discrimination, and stimulus complexity discrimination. A
comprehensive summary of these studies is provided in Table 1.

11
Table 1
Research Relative to Auditory Processing Capabilities for Children with Down Syndrome
Task Performance References
Sensitivity
DS<TD detection
performance and
threshold; similar
developmental trajectory
(Werner et al., 1996)
Localization DS begin to perform VRA
at older ages than TD
(D. Greenberg, Wilson, Moore,
& Thompson, 1978; Wilson,
Folsom, & Widen, 1983)
Stimulus discrimination DS preference for
complex stimuli (Glenn et al., 1981)
Speech perception – word
stress DS<TD (Pettinato & Verhoeven, 2009)
Phoneme detection DS<TD
(Cardoso-Martins & Frith, 2001;
Cardoso-Martins, Michalick, &
Pollo, 2002; Roch & Jarrold,
2008; Snowling, Hulme, &
Mercer, 2002)
Initial phone detection for
simple words embedded in
noise
older DS = TD children (Jarrold, Thorn, & Stephens,
2009)
Phoneme deletion
(unspecified) DS<TD (Roch & Jarrold, 2008)
First syllable recognition DS<TD (Verucci, Menghini, & Vicari,
2006)
Rhyme detection DS<TD
(Boudreau, 2002; Cardoso-
Martins et al., 2002; Gombert,
2002; Roch & Jarrold, 2008;
Snowling et al., 2002; Verucci et
al., 2006)
Alliteration judgment DS<TD (Boudreau, 2002; Snowling et
al., 2002)
Speech discrimination : /i/ -
/u/ and /dab-i-ba/ - /dab-u-ba/ DS<TD (Keller-Bell & Fox, 2007)
Speech sound discrimination
(passive task)
Positive correlation for
DS for grammatical
comprehension and ERP
for speech stimuli
(Yoder et al., 2006)
Note. < = poorer performance; = = similar performance; DS = individuals with Down syndrome;
TD = typically-developing individuals, VRA = visual reinforcement audiometry; ERP = event-
related potential.

12
Auditory Sensitivity
The development of auditory sensitivity in infants with Down syndrome is similar to that
of typically-developing infants in that younger infants respond less consistently and louder
sounds are required to elicit responses compared to older infants (Werner et al., 1996). The
auditory sensitivity of infants with Down syndrome has been shown to be up to 10 to 25 dB
poorer than their typically-developing peers (Werner et al., 1996). However, it should be noted
that children with Down syndrome were less attentive than typically-developing infants enrolled
in that study. Levels of attentiveness can be modeled by examining an infant’s maximum
percentage of correct responses, or p(C)max. Typically-developing 6 to 9 month old infants are
expected to achieve maximum performance levels of 0.89, but younger (i.e., 2 to 3 months of
age) and older (i.e., 4 to 12 months of age) infants with Down syndrome in this study only
achieved p(C)max levels between 0.70 and 0.80, respectively (Werner et al., 1996). Thus, infants
with Down syndrome are less attentive than typically-developing infants and this non-sensory
factor could have contributed to these auditory sensitivity estimations.
Phonological Discrimination
The ability to perceive weak syllables (e.g., the second syllable in the word "hearing")
and discriminate between speech sounds is often compromised for children and adults with
Down syndrome compared to typically-developing peers (e.g., Keller-Bell & Fox, 2007;
Pettinato & Verhoeven, 2009). Though phonological discrimination can be influenced by
reading ability, mental age, cognitive characteristics, and chronological age, individuals with
Down syndrome continue to demonstrate poorer abilities than typically-developing individuals
even when groups are matched by these factors (For review see, Lemons & Fuchs, 2009).
Furthermore, physiologic measures of passive phoneme discrimination are related to speech

13
discrimination in children with Down syndrome providing more evidence for the influence of
perceptual auditory abilities on phoneme discrimination (Yoder et al., 2006).
Stimulus Complexity Discrimination
Stimulus complexity discrimination has been investigated in 12 month old infants with
Down syndrome using behavioral test paradigms that utilize toys producing sound in response to
physical manipulation (i.e., touching a switch; Glenn et al., 1981). Developmental age matched
infants with Down syndrome and typically-developing infants had some response similarities.
For example, both groups of infants responded with equal frequency to both simple stimuli (e.g.,
a single repeated piano tone) and complex stimuli (e.g., a song) suggesting similar motor skill
ability. In addition, both groups of infants demonstrated a preference for complex stimuli over
simple stimuli by triggering complex stimuli more often and for longer durations than simple
stimuli. Interestingly, research utilizing visual paradigms has shown that infants with Down
syndrome remained engaged longer and were less likely to habituate than typically-developing
infants (For review see, Wagner, Ganiban, & Cicchetti, 1990). However, for this complex versus
simple stimuli task, infants with Down syndrome remained engaged longer than their typically-
developing peers only when listening to complex stimuli. The exact relationship of stimulus
complexity and response tendency is unknown; however, it is possible that the enhanced
preference for complex over simple stimuli seen for infants with Down syndrome could be the
result of unique perceptual auditory capabilities.
Anatomy of Binaural Hearing for Children with Down Syndrome
It is well known that many infants with Down syndrome have stenotic ear canals and
congenital malformations of the ossicles, cochlea, and internal auditory canals (e.g., Balkany et

14
al., 1979; Bilgin et al., 1996; Blaser et al., 2006; Satwant, Subramaniam, Prepageran, Raman, &
Jalaludin, 2002; Strome, 1981). Alterations in peripheral auditory structure might influence
auditory input, such as spectral characteristics of signals, and confound auditory functions such
as localization and recognition of speech in noise. In addition, alterations in peripheral auditory
structures and, consequently, in the auditory input signal could influence the development of the
central auditory system (Wilmington, Gray, & Jahrsdorfer, 1994).
A large body of histologic, radiologic, and electrophysiologic evidence describes altered
anatomy and synaptic communication within the central auditory system for children with Down
syndrome (e.g., Banik, Davison, Palo, & Savolainen, 1975; Becker et al., 1986; Colon, 1972;
Crome, Cowie, & Slater, 1966; Kittler et al., 2009; Pinter, Brown et al., 2001; Pinter, Eliez,
Schmitt, Capone, & Reiss, 2001). Specifically, histologic and radiologic evidence shows that
individuals with Down syndrome have reduced cortical and subcortical structures and reduced
cortical white and gray matter in selected brain regions compared to individuals without Down
syndrome (Colon, 1972; Crome et al., 1966; Davidoff, 1928; Frangou et al., 1997; Haier,
Cheueh, Touchette, & Lott, 1995; Jernigan, Bellugi, Sowell, Doherty, & Hesselink, 1993; Pinter,
Brown et al., 2001; Pinter, Eliez et al., 2001; Takashima, Becker, Armstrong, & Chan, 1981;
Weis, Weber, Neuhold, & Rett, 1991; Wisniewski, 1990; Wisniewski, Laure-Kamionowska, &
Wisniewski, 1984). For example, one of the earliest studies of subcortical structures of infants,
children, and adults with Down syndrome noted reduced brain weight, small brainstem and
cerebellum size, embryologic simplicity, and cell poverty (Davidoff, 1928). More recent
research has also described smaller brain structures (e.g., ventral pons, hippocampal formations)
and overall smaller brain volumes for children, young adults, and adults with Down syndrome
compared to typically-developing peers (e.g., Pinter, Eliez et al., 2001; Raz et al., 1995;
Wisniewski, 1990). This altered anatomy within the central auditory system for children with

15
Down syndrome suggests that they could process binaural auditory information differently than
their typically-developing peers.
Differences in neural development between individuals with Down syndrome and their
typically-developing peers could appear early in life. Dendritic trends toward less expansion
often occurs earlier for infants with Down syndrome than their typically-developing peers
(Becker et al., 1986). Molecular research using mouse models for Down syndrome has shown
that the Minibrain (Mnb) gene on chromosome 21 is involved in neurogenesis and could be
involved in developmental alterations, such as relative decreases in the number of neurons seen
for individuals with Down syndrome (Hämmerle et al., 2003). Furthermore, adults with Down
syndrome have reduced myelin compared to their typically-developing peers (Banik et al., 1975).
Taken together, these results could explain findings of altered neural cell density and
cytoarchitecture for individuals with Down syndrome (Colon, 1972; Takashima et al., 1981;
Wisniewski, 1990; Wisniewski et al., 1984). It is clear that there are differences in the size and
cytostructure of cortical and subcortical structures between individuals with Down syndrome and
their typically-developing peers. It has been suggested that these differences might be influenced
by impairments in neurogenesis and early programmed cell death that typically-developing
individuals require for optimal neuronal development.
Electrophysiologic studies also converge on the notion that individuals with Down
syndrome have differing auditory capabilities from those of their typically-developing peers. In
general, auditory brainstem response (ABR) latencies are shorter for infants, older children, and
adults with Down syndrome compared to their age-matched, typically-developing peers (Arao &
Niwa, 1991; Folsom, Widen, & Wilson, 1983; Forti et al., 2008; Jiang, Wu, & Liu, 1990; Kittler
et al., 2009). Figure 2 illustrates a sample ABR evoked using moderately-high level stimuli for
infants with Down syndrome and typically-developing infants.

16
Figure 2. A sample auditory brainstem response (ABR) evoked using moderately high intensity
level stimuli for infants with Down syndrome and typically-developing infants. Image from
"Hearing Loss among Persons with Down Syndrome," by H. Porter and A.M. Tharpe, 2010,
International Review of Research in Mental Retardation, 39, p. 214. Copyright 2010 by Elsevier,
Inc.
Though anatomic contributions to decreased brainstem latencies for individuals with
Down syndrome have been suggested including decreased size of auditory structures (e.g.,
cochlea, central auditory pathway) and shorter neural conduction times, calibration techniques
have not been widely reported in the literature (Diaz & Zurron, 1995; Ferri, Gracco, Elia,
Musumeci, & Stefanini, 1995; Forti et al., 2008; Kakigi & Kuroda). Individuals with Down
syndrome often have stenotic ear canals, which can result in higher stimulus sound levels at the
tympanic membrane relative to normative data and decreased ABR latencies measures in the
abovementioned studies. However, assuming appropriate calibration, evidence of decreased

17
ABR latencies for individuals with Down syndrome suggests altered responses to auditory
stimuli measured at the brainstem, the first site of binaural interaction.
Though children with Down syndrome have shorter latencies than their typically-
developing peers for measures of early-latency evoked potentials, evoked potentials measured at
later latencies reflecting more central processing are often delayed for children and young adults
with Down syndrome. Seidl et al. (1997) reported longer N1, P2, N2, and P3 latencies for
children and young adults with Down syndrome compared to typically-developing peers. Delays
in these components could reflect a stimulus processing deficit as they are sensitive to changes in
stimuli such as frequency, amplitude, auditory motion, and speech (Stapells, 2002). Other
studies that have used electrophysiologic methods to examine passive neural responses to
auditory stimuli suggest impairments in preattentive auditory processing and lateralization of
speech and non-speech stimuli for individuals with Down syndrome (Groen, Alku, & Bishop,
2008; Pekkonen, Osipova, Sauna-Aho, & Arvio, 2007).
Structural and neurochemical deficits have been suggested as contributors to differences
in auditory processing between individuals with Down syndrome and age- and gender-matched
peers measured using electrophysiologic test methods (Groen et al., 2008; Pekkonen et al., 2007;
Seidl et al., 1997). Deficits of the cholinergic system, which is utilized for synaptic transmission,
and the histaminergic system, which regulates brain activity, have also been suggested as
contributors to differences in auditory processing abilities between individuals with Down
syndrome and their typically-developing peers (Pekkonen et al., 2007; Seidl et al., 1997). There
is clear evidence to suggest that differences in neural processing of auditory stimuli exist for
individuals with Down syndrome and their typically-developing peers though the specific
mechanism responsible for these differences remains undefined.

18
Purpose
Structural anomalies within the central auditory system and alterations in synaptic
communication could adversely affect various aspects of auditory processing for children with
Down syndrome, including binaural hearing. However, binaural hearing capabilities have not
been examined in these children. Therefore, this study sought to determine if the binaural
abilities of children with Down syndrome are compromised relative to those of typically-
developing children on two different tasks:
1.) a masking level difference (MLD) task using pure tone stimuli in 300 Hz wide
masking noise; and
2.) a binaural intelligibility level difference (BILD) task using speech stimuli in the
presence of broadband noise for natural (i.e., simulated free-field) and isolated cue (i.e.,
ILD and ITD) conditions.
Hypothesis: Children with Down syndrome will have poorer MLD and BILD scores than
typically-developing children for all experimental conditions.
This hypothesis was based on evidence of altered subcortical anatomy and deficits in
synaptic communication for children with Down syndrome (e.g., Colon, 1972; Kittler et al.,
2009; Pinter, Eliez et al., 2001). In addition, children with Down syndrome have poor speech
perception abilities (e.g., Keller-Bell & Fox, 2007; Pettinato & Verhoeven, 2009), which could
be the result of poor auditory perceptual abilities, including binaural hearing.

19
CHAPTER III
METHODOLOGY
Participants
Fifty-two typically-developing children and 14 children and adolescents with Down
syndrome were consented to participate in this study. However, six typically-developing
children and three children with Down syndrome were excluded based on results from pre-
experimental testing. As such, 46 typically-developing children ( X =8 years, 6 months; range=3
years, 4 months to 12 years, 11 months), nine children with Down syndrome ( X =10 years, 2
months; range=6 years, 6 months to 11 years, 11 months), and two adolescents with Down
syndrome ( X =16 years, 9 months; range= 16 years, 8 month to 16 years, 11 months) were
included in the data analysis. These age ranges were chosen to facilitate the identification of
developmental trends in binaural release from masking for both groups. Typically-developing
children from a younger chronological age range than children with Down syndrome were
included to facilitate comparisons based on estimates of developmental age (i.e., receptive
language age equivalent).
The majority of children and adolescents with Down syndrome included in this study had
Trisomy 21 identified by karyotype according to the medical record or parental report (81%).
However, one child was noted to have translocation of chromosome 21 to chromosome 14 and
one child's karyotype information was unavailable in the medical record. The average receptive
language age equivalent for children and adolescents with Down syndrome was 6 years, 7
months (SD=5 years, 9 months). A greater percentage of children and adolescents with Down

20
syndrome were reported by their parents to have a significant history of otitis media (64%) than
typically-developing children (22%).
Seven typically-developing adults ( X =27 years, 6 months; range=23 years, 1 month to
35 years, 9 months) and three adults with Down syndrome ( X =28 years, 1 month; range=22
years, 3 months to 38 years, 4 months) were consented to participate in the study to obtain an
estimate of adult performance for the experimental tasks. One typically-developing adult was
excluded based on use of a primary language other than English.
All study participants had bilateral pure tone threshold averages (PTAs) of ≤30 dB HL
measured at 500 Hz, 1000 Hz, 2000 Hz, and 4000 Hz and PTAs. Threshold at 500 Hz was
verified to be ≤30 dB HL bilaterally to ensure audibility of the stimuli used for the MLD task as
it is possible to have a PTA of ≤30 dB HL and hearing loss ≥30 dB HL at any one frequency.
As no gender effects in binaural abilities have been documented in children, gender was
not considered in the selection of participants. Children with additional significant disabilities
affecting gross motor control or a known receptive language age of less than 3 years were
excluded from recruitment for this study. All participants were recruited according to principles
and procedures approved by the Institutional Review Board at Vanderbilt University Medical
Center. All participants were recruited from the Down Syndrome Association of Middle
Tennessee, the Monroe Carell Jr. Children’s Hospital at Vanderbilt Down Syndrome Clinic, the
Vanderbilt Bill Wilkerson Center, and the Vanderbilt Kennedy Center.
Materials and Instrumentation
All auditory stimuli were presented through Sennheiser HD 265 linear headphones
(Sennheiser Electronic Corporation; Old Lyme, CT) using MATLAB 7.1 (The MathWorks, Inc.;

21
Natick, MA) to generate and control auditory stimuli and visual reinforcement when applicable.
Visual stimuli were routed from a main computer to a secondary computer monitor used for the
singular purpose of response reinforcement for paradigms in which visual reinforcement was
used (i.e., audiometric testing and MLD tasks).
Masking Level Difference (MLD)
Stimuli consisted of a 500 Hz pure tone presented either interaurally in phase (S0) or
180° out of phase (S ) based on data in the literature suggesting that MLD is greatest for these
signal configurations and low-frequency stimluli (e.g., Hirsh, 1948). The masker was a 300 Hz
wide Gaussian noise, centered at 500 Hz, presented interaurally in phase (N0), similar to other
research (e.g., Hall & Grose, 1993). The signal was approximately 400 ms in duration with a 50
ms rise/fall time, temporally centered within the 800 ms masker noise. Stimulus presentation
rate was adapted based on individual responses; that is, presentation of stimuli on each trial
began approximately 500 ms following participant response to the stimuli on the previous trial.
Binaural Intelligibility Level Difference (BILD)
Speech material consisted of recorded words from the Northwestern University-
Children’s Perception of Speech test (NU-CHIPS; Elliott & Katz, 1980). This test was designed
to be used with children whose language age 3 years or above. Speech stimuli were
approximately 500 ms to 800 ms in duration and noise remained constant for each condition.
Noise stimuli consisted of broadband noise that contained the same long-term spectral average of
the speech stimuli (Figure 3).

22
Figure 3. Long-term spectral averages of speech stimuli obtained from the Northwestern
University-Children’s Perception of Speech test (NU-CHIPS; Elliott & Katz, 1980) and
broadband noise stimuli created for use in the binaural intelligibility level difference (BILD) task
shown here as recorded from the left (L) and right (R) ears of a Knowles Electronic Manikin for
Acoustic Research (KEMAR).
Speech and noise stimuli were presented from a Tannoy Precision 6P loudspeaker
(Tannoy, Ltd.; North Lanarkshire, SCT) and recorded from two ER-11 microphones (Etymotic
Research, Inc.; Elk Grove Village, IL) placed in the ears of a Knowles Electronic Manikin for
Acoustic Research (KEMAR) that was positioned in an anechoic chamber at the Vanderbilt Bill
Wilkerson Center. Speech material was presented from 0° azimuth (i.e., directly in front of
KEMAR) at a distance of 1.5 m. Noise was presented from 0°, 45°, or 90° azimuth by rotating
the head and torso of KEMAR while keeping the position of the loudspeaker fixed. An
equalization filter was applied to recordings as described by Killion (1979). This was necessary
to account for the addition of the ear canal resonance of the listener when playing this type of
recording through headphones. Some research has described similar head-related transfer
functions (HRTFs) for children and adults by the age of 3 years (Kruger, 1987); therefore, no
additional filters were applied to stimuli for presentation to children.
0 1000 2000 3000 4000 5000 6000 7000-50
-45
-40
-35
-30
-25
-20
-15
-10
-5
0
Frequency (Hz)
Re
lative
Am
plitu
de
(d
B)
NU-CHIPS (R)
Noise (R)
NU-CHIPS (L)
Noise (L)

23
Using signal processing techniques described by Bronkhorst and Plomp (1988), three
conditions were derived from the free-field recordings to be presented through headphones: 1)
simulated free-field (i.e., unprocessed recordings, preserving the natural ILD and ITD cues), 2)
isolated ILD (i.e., recordings processed such that the ITD was equal to 0 µs for all presentations),
and 3) isolated ITD (i.e., recordings processed such that the ILD was equal to 0 dB for all
presentations). A sample of recorded signals and derived signals is shown in Figure 4.
Figure 4. Sample of recorded noise signals (left panels) and derived signals (right panels)
illustrating the effect of signal processing. The upper and lower traces in each panel correspond
to the recordings made ipsilateral and contralateral to the loudspeaker, respectively.
These conditions were chosen to examine the individual contributions of ILD and ITD to
free-field performance since performance in the isolated ILD condition relies mainly on
monaural or “best ear” performance as a result of head shadow, whereas performance in the
isolated ITD condition utilizes purely binaural interaction.
Time (25 ms/division)
Am
plitu
de
(d
B)
FF0 dL90
dT90FF90

24
Pre-Experimental Procedures
Audiometric Testing
Hearing thresholds were obtained for octave frequencies 500 Hz to 4000 Hz bilaterally
using the modified Hughson-Westlake method in 5 dB steps (Carhart & Jerger, 1959). Visual
reinforcement consisted of a series of pictures and animated scenarios that were revealed on a
computer screen as children correctly identified that they heard an auditory stimulus.
Audiometric testing lasted approximately 15 minutes.
Vineland Adaptive Behavior Scales
Parents of children with Down syndrome were asked to complete the Vineland Adaptive
Behavior Scales Parent/Caregiver Report Form (Second Edition; Sparrow, Cicchetti, & Balla,
2005), which is a measure of personal and social skills required for daily living (i.e., adaptive
behavior) appropriate for individuals aged 3 years, 0 months to 21 years, 11 months. Age
equivalent scores from the receptive communication subdomain were used as an estimate of
developmental ability as it pertains to the experimental tasks used for this study.
Otologic Case History
Recurrent otitis media has been shown to reduce MLD in children (Hall & Grose, 1993;
Hall, Grose, & Pillsbury, 1995). Chronic middle ear disease afflicts approximately 70% of
children with Down syndrome compared to about 40% of typically-developing children (e.g.,
Auinger, Lanphear, Kalkwarf, & Mansour, 2003; Mitchell, Call, & Kelly, 2003; Strome, 1981).
As such, it was anticipated that many children with Down syndrome recruited for this study

25
would have a history of otitis media. A brief survey was constructed to obtain demographic
information regarding each participant’s otologic health history (Appendix A).
This survey was completed by the parent on the day of testing. A significant history of
middle ear disease was defined as the occurrence of ≥ five episodes of middle ear disease before
the age of 5 years or the surgical placement of pressure equalization tubes. Although not used as
exclusionary criteria, otologic health history information was considered during data
interpretation.
Familiarization and Feasibility Testing
Procedures for feasibility testing and experimental testing were identical with the
exception that signal level was greater than noise level for both tasks to facilitate ease of signal
identification. Five trials were used for feasibility testing for each experimental procedure.
Feasibility testing for the MLD task was completed in the N0S condition and for the BILD task
in the FF0 condition. If behavior (e.g., wiggling, inattention, coughing) was observed by the
examiner to have influenced responses, another five stimuli were presented and included in the
calculation of accuracy. Participants must have demonstrated at least 80% accuracy to have been
included in the corresponding experimental task.
Experimental Procedures
Masking Level Difference (MLD)
Participants were told a story by the investigator about an owl (500 Hz signal) that lived
in a windy forest (masking noise). The story script is included in Appendix B. A computer
monitor was used to generate two identical forest images located on the left and right of the

26
screen. The images were highlighted individually to correspond to the presentation of noise to
demark temporal intervals. A series of owl and forest images were randomly presented to
increase visual interest for this task. Participants were asked to identify by pointing in which
forest the owl was hiding (i.e., left or right). The location of the owl (i.e., correct response) was
revealed following the participant's response.
Data were collected using a two-alternative forced-choice (2AFC) paradigm, two-down
one-up adaptive procedure to estimate the 70.7% point in the psychometric function (Levitt,
1971). Noise level was fixed at 85 dB SPL (i.e., 60 dB/Hz SPL). The first stimuli were
presented at 0 dB SNR. Signal level was adjusted in steps of 4 dB for the first two reversals,
then in steps of 2 dB for the remaining six reversals. The mean of the last six reversals was used
to estimate an MLD threshold for each trial. Two runs were administered for each condition for
most children and adults included in this study. In this case, threshold was determined for N0S0
and N0S conditions by averaging results from each run by condition. Threshold for N0S0 and
N0S conditions was determined as the result of one run for each condition for five children
with Down syndrome due to test fatigue. The test time for the MLD procedure was
approximately 20 minutes, not including breaks or instruction.
Binaural Intelligibility Level Difference (BILD)
Children heard monosyllabic words presented in noise and they were asked to identify
the word they heard by pointing to black and white picture plates that are included with the
standard NU-CHIPS test materials. Stimuli consisted of the speech and noise signals recorded
through KEMAR as described above. Speech stimuli recorded at 0° azimuth was presented in all
conditions. Broadband masking noise recorded from 0°, 45°, and 90° azimuth was presented for
the free-field condition and from 45° and 90° azimuth, for the isolated ITD and ILD conditions.

27
Note that isolated ITD and ILD noise conditions were not necessary at 0° as both cues are
expected to be zero at this position. Mean speech reception threshold (SRT) was determined for
a total of seven listening conditions (3+2+2=7). These conditions are listed in Table 2.
Table 2
Listening Conditions Derived from Free-Field Recordings
Noise Stimulus Presentation Azimuth (°)
Signal Noise Listening Condition
Simulated free-field 0 0 FF0
Simulated free-field 0 45 FF45
Simulated free-field 0 90 FF90
Isolated ILD 0 45 dL45
Isolated ILD 0 90 dL90
Isolated ITD 0 45 dT45
Isolated ITD 0 90 dT90
Data were collected using a single-interval 4AFC, two-down one-up adaptive procedure
to estimate the 70.7% point in the psychometric function (Levitt, 1971). Noise was fixed at 85
dB SPL. The spoken token on the first trial was presented at 0 dB SNR. Signal level was
adjusted in steps of 4 dB for the first two reversals, then in steps of 2 dB for the remaining six
reversals. The mean of the last six reversals was used to estimate SRT. One run was completed
per condition and total test time for the BILD lasted approximately 30 minutes, not including
breaks or instruction.

28
Statistical Analysis
Standard procedures were used to calculate MLD and spatial release from masking for
simulated free-field conditions at 45° and 90° azimuth (i.e., BILD FF45 and BILD FF90). That
is, MLD was calculated by subtracting N0S threshold from N0S0 threshold. Similarly, BILD
FF45 was calculated by subtracting FF45 threshold from FF0 threshold and BILD FF90 was
calculated by subtracting FF90 threshold from FF0 threshold. Analyses of variance (ANOVAs)
were used to examine overall group differences between conditions. Group differences were
examined for children with Down syndrome and typically-developing children as well as adults
with Down syndrome and typically-developing adults. Group analyses did not include
adolescents with Down syndrome. Levene's tests revealed the assumption of homogeneity of
variance was not violated for group comparisons (Levene, 1960).
The impact of chronological age on binaural abilities was examined using regression
curves to describe MLD, BILD for simulated free-field conditions (i.e., BILD FF45 and BILD
FF90), and SNR for simulated free-field conditions for typically-developing individuals and
individuals with Down syndrome. These analyses included the groups noted above as well as
adolescents with Down syndrome. The impact of developmental age for children and
adolescents with Down syndrome was examined using regression curves that considered age-
equivalent scores for the receptive language subdomain of the Vineland Adaptive Behavior
Scales. The proportion of variance accounted for, R2, was calculated as well as a p-value
indicating goodness of fit. In cases in which p ≥ 0.05, we attempted to apply a linear function.
In cases in which p ≤ 0.05 for more than one curve, R2 indices were compared between curves to
determine differences in their ability to describe the association between variables.
Psychometric functions were generated for children and adults with Down syndrome and
typically-developing children and adults. The computed slope of these functions provided

29
information about the relative influence of non-sensory factors (e.g., attention). Psychometric
functions were normalized by log transformation of SPL values relative to SPL values obtained
at threshold (i.e., 70.7%) using the following equation: log[SPL/ SPL(70.7%)]. The slope of the
psychometric function was defined in terms of the k-parameter in the following equation: f(x) =
1 + kxe
a/)(1
, where a is the maximum y-value, is the midpoint of the function, and k is the
slope parameter.
Results from one-way ANOVAs suggested that children with a history of otitis media
did not have scores that differed significantly from children without a history of otitis media
within their respective groups (i.e., children with Down syndrome and typically-developing
children) for any measure. Therefore, otitis media was not considered as a separate predictor of
performance on the experimental tasks. However, a post hoc power analysis revealed risk of a
Type II error (i.e., [1 – ] < .80) for all calculations indicating that additional children with and
without histories of otitis media would need to be included in this study to avoid the potential for
Type II error (Cohen, 1992; Table 3).

30
Table 3
Statistical Power for Analyses of Variance (ANOVAs) Comparing Mean Scores for Children with
and without Histories of Otitis Media
Children with DS TD Children
Condition Power (1 – )
N0S0 Threshold .09 .12
N0S Threshold .07 .12
MLD .16 .06
FF0 Threshold .18 .05
FF45 Threshold .10 .10
FF90 Threshold .25 .13
BILD FF45 .35 .41
BILD FF90 .10 .07
Note. TD = typically-developing; DS = Down syndrome.
Statistical analyses were performed using SigmaPlot® (San Jose, CA) and IBM® SPSS®
(Armonk, NY). All p values were two-sided and significance was at the 0.05 level. Cohen's d
was used as a measure of effect size and large effect sizes were defined as ≥0.40 (Cohen, 1992).
Fidelity of data entry was verified prior to data analysis by a trained undergraduate research
assistant.

31
CHAPTER IV
RESULTS
Masking Level Difference (MLD)
Individual thresholds for the N0S0 condition and the N0S condition are shown in Figure
5, plotted as a function of chronological age.
Figure 5. N0S0 and N0S threshold for typically-developing individuals and individuals with
Down syndrome.
60
70
80
90
100
110
Chronological Age (years)
0 10 20 30 40
Thre
shold
(dB
)
50
60
70
80
90
100
N0S
N0S0
Individuals with Down Syndrome
Typically-Developing Individuals
Typically-Developing Individuals
Individuals with Down Syndrome

32
When averaged across chronological age, children with Down syndrome had greater
average thresholds for the N0S0 condition and the N0S condition than typically-developing
children (F[1,54]=4.62, p≤0.05, d=1.70 and F[1,54]=15.32, p≤0.05, d=2.51, respectively).
Inverse 1st order curves were fit to the variables chronological age and absolute threshold for
both stimulus conditions for typically-developing individuals and the N0S condition for
individuals with Down syndrome (N0S0, R2=0.29, p≤0.05; N0S , R
2=0.38, p≤0.05; and N0S ,
R2=0.37, p≤0.05, respectively).
Children with Down syndrome had significantly poorer MLD scores averaged across
chronological age than typically-developing children (F[1,54]=18.90, p≤0.05, d=1.79). A subset
of data from typically-developing children aged 3 to 5 years (i.e., the youngest children recruited
to participate) were selected to represent the performance of typically-developing children within
a narrow age range. Though no statistically significant differences were seen between means for
children with Down syndrome ( X = 2.94, SD = 7.07) and typically-developing children aged 3
to 5 years ( X =10.38, SD=7.85), a large effect size was noted (F[1,19]=1.77, p=0.20, d=1.00)
and a post hoc power analysis revealed risk of Type II error for this comparison ([1 – ] = .55).
Average MLD scores for typically-developing adults and adults with Down syndrome did not
differ significantly, though a large effect size was also noted for this comparison (F[1,8]=2.17,
p=0.18, d=0.95). A post hoc power analysis was not completed for this comparison as MLDs
for adult participants in this study (i.e., with and without Down syndrome) reached expected
levels for typically-developing adults. Table 4 includes means and standard deviations for
absolute thresholds measured at 500 Hz, threshold for each masking condition (i.e., N0S0 and
N0S ), and MLD.

33
Table 4
Absolute Threshold for 500 Hz, Masked Thresholds in N0S0 and N0S Conditions, and MLDs
X (SD)
500 Hz N0S0 N0S MLD (SD)
TD Children -0.27 (4.87) 81.48 (6.63) 67.77 (8.96) 13.71 (4.94)
Children with DS 12.38 (10.07) 91.65 (5.37) 88.70 (7.74) 2.94 (7.07)
Adolescents with DS 7.50 (0.00) 82.00a 82.33
a -0.33
a
TD Adults -2.08 (3.38) 77.78 (6.56) 62.61 (5.62) 15.17 (3.26)
Adults with DS 2.50 (5.26) 83.72 (6.88) 64.06 (0.95) 19.67 (6.22)
Note. TD = typically-developing; DS = Down syndrome, MLD = masking level difference. aNo standard deviation is shown as only one adolescent with Down syndrome successfully
completed this task.
Individual MLD scores (i.e., the difference between the N0S0 and N0S thresholds) are
shown as a function of chronological age with the 95th
percentile range for typically-developing
adults (CI=15.17 ± 2.38) in Figure 6.

34
Figure 6. Masking level difference (MLD) as a function of chronological age for typically-
developing individuals and individuals with Down syndrome. The shaded area represents the 95th
percentile for typically-developing adults.
A logistic curve was fit to the variables chronological age and MLD for typically-
developing individuals and individuals with Down syndrome (R2=0.20, p≤0.05 and R
2=0.58,
p≤0.05, respectively). The MLD scores of 10% of children and adolescents with Down
syndrome and 65% of typically-developing children were within or above the 95th
percentile
range for typically-developing adults. All adults with Down syndrome were within or above the
95th
percentile range for typically-developing adults.
Figure 7 illustrates MLD scores as a function of receptive language age equivalent for
children and adolescents with Down syndrome with the 95th
percentile range for typically-
developing adults (described above). In this case, no logistic equation provided a reasonable fit,
so the best-fitting linear function is shown (R2=0.17, p=NS).
Chronological Age (years)
0 10 20 30 40
MLD
(dB
)
-10
-5
0
5
10
15
20
25
30
Typically-Developing Individuals
Individuals with Down Syndrome
Logistic Model (TD), R2=0.20, p<0.05
Logistic Model (DS), R2=0.58, p<0.05

35
Figure 7. Masking level difference (MLD) as a function of receptive language age equivalent for
children and adolescents with Down syndrome. The shaded area represents the 95th
percentile for
typically-developing adults.
Binaural Intelligibility Level Difference (BILD)
Spatial Release from Masking
Individual thresholds for simulated free-field conditions used for the BILD task (i.e., FF0,
FF45, and FF90) are shown in Figure 8, plotted as a function of chronological age.
Receptive Language Age Equivalent (years)
0 2 4 6 8 10 12 14 16 18 20
ML
D (
dB
)
-10
-5
0
5
10
15
20
Individuals with Down Syndrome

36
Figure 8. FF0, FF45, and FF90 threshold for typically-developing individuals and
individuals with Down syndrome.
60
70
80
90
100
Thre
shold
(dB
)
60
70
80
90
Chronological Age (years)
0 10 20 30 4050
60
70
80
90
FF0
FF90
FF45
Inverse 1st Order Model (DS), R2=0.29, p<0.05 Inverse 1st Order Model (TD), R2=0.54, p<0.05
Typically-Developing Individuals
Individuals with Down Syndrome
Typically-Developing Individuals
Individuals with Down Syndrome
Inverse 1st Order Model (TD), R2=0.34, p<0.05
Inverse 1st Order Model (TD), R2=0.58, p<0.05

37
When averaged across chronological age, individuals with Down syndrome had higher
average thresholds than typically-developing individuals for all conditions (FF0: F[1,64]=6.04,
p≤0.05, d=0.84, FF45: F[1,64]=6.73, p≤0.05, d=0.93, and FF90: F[1,64]=7.78, p≤0.05, d=1.00).
Inverse 1st order curves were fit to the variables chronological age and threshold for all BILD
conditions for typically-developing individuals and the FF0 condition for individuals with Down
syndrome (FF0, R2=0.54, p≤0.05; FF45, R
2=0.34, p≤0.05; FF90, R
2=0.58, p≤0.05; and FF0,
R2=0.29, p≤0.05, respectively). No linear or non-linear equations including chronological age
and FF45 or FF90 resulted in significant associations for individuals with Down syndrome. For
these cases, the best-fitting linear functions are shown (R2=0.21 , p=NS, R
2=0.16 , p=NS,
respectively).
BILD FF45 and BILD FF90 scores for children with Down syndrome and typically-
developing children averaged across chronological age did not differ by a statistically significant
amount. Furthermore, average BILD FF45 scores for adults with Down syndrome and typically-
developing adults did not differ by a statistically significant amount, though a large effect size
was observed for this comparison (F[1,8]=1.01, p=0.35, d=0.81). In addition, average BILD
FF90 scores for adults with Down syndrome were poorer than typically-developing adults
(F[1,8]=11.07, p≤0.05, d=3.73). Table 5 includes bilateral PTA, thresholds for free-field BILD
conditions (i.e., FF0, FF45, and FF90), and BILD for free-field conditions (i.e., BILD FF45 and
BILD FF90).

38
Table 5
Bilateral PTA, and Masked Thresholds for the Three Free-Field Conditions (FF0, FF45, and
FF90), and BILDs for the FF45 and FF90 Conditions
X (SD)
PTA FF0 FF45 FF90 BILD
FF45
BILD
FF90
TD Children 1.10
(3.45)
83.12
(5.11)
80.24
(4.97)
80.41
(5.83)
2.88
(4.17)
2.71
(4.28)
Children with DS 11.05
(6.08)
88.67
(3.43)
84.96
(3.56)
85.85
(5.19)
3.70
(4.47)
2.81
(6.98)
Adolescents with DS 7.25
(1.77)
87.17
(7.30)
83.50
(2.12)
83.00
(2.12)
3.67
(9.43)
4.17
(12.01)
TD Adults 7.83
(4.25)
70.39
(3.98)
66.83
(5.33)
64.89
(5.54)
3.55
(3.29)
5.50
(2.98)
Adults with DS 1.33
(2.04)
80.78
(2.84)
79.33
(3.76)
81.22
(2.67)
1.45
(1.89)
-0.44
(0.20)
Note. PTA = pure tone average; BILD = binaural intelligibility level difference, TD = typically-
developing; DS = Down syndrome.
Individual BILD FF45 and BILD FF90 scores (i.e., the differences between thresholds in
these conditions and in the reference FF0 condition) are shown as a function of chronological
age in Figure 9 with the 95th
percentile range for typically-developing adults (CI=3.55 ± 4.26 and
CI=5.50 ± 2.59, respectively). No logistic equation provided a reasonable fit for the variables
chronological age and BILD FF45 or chronological age and BILD FF90 for typically-developing
individuals or individuals with Down syndrome, so the best-fitting linear function is shown
(R2=0.00, p=NS, R
2=0.22 , p=NS, R
2=0.04 , p=NS, R
2=0.02 , p=NS, respectively).

39
Figure 9. Binaural intelligibility level difference (BILD) obtained for simulated free-field
conditions at 90° (BILD FF90) and 45° (BILD FF45) as a function of chronological age for
typically-developing individuals and individuals with Down syndrome.
The BILD FF45 scores of 67% of children and adolescents with Down syndrome and
72% of typically-developing children were within or above the 95th
percentile range for
typically-developing adults. Likewise, the BILD FF90 scores of 11% of children and
adolescents with Down syndrome and 46% of typically-developing children were within or
above the 95th
percentile range for typically-developing adults. Scores of 67% adults with Down
syndrome were within or above the 95th
percentile range for typically-developing adults for the
BILD FF90
BILD FF45
Chronological Age (years)
0 10 20 30 40
BIL
D r
e:
90°
(dB
)
-15
-10
-5
0
5
10
15
BIL
D r
e:
45°
(dB
)
-10
-5
0
5
10
15
20
Individuals with Down Syndrome
Typically-Developing Individuals
Typically-Developing Individuals
Individuals with Down Syndrome

40
BILD FF45 condition. However, no adults with Down syndrome had scores that were within or
above this range for the BILD FF90 condition.
Figure 10 illustrates BILD FF45 and BILD FF90 scores as a function of receptive
language age equivalent for children and adolescents with Down syndrome with the 95th
percentile range for typically-developing adults (described above). Non-linear equations
including the variables receptive language age equivalent and BILD FF45 or BILD FF90 did not
result in significant associations for children and adolescents with Down syndrome, so the best-
fitting linear function is shown (R2=0.05, p=NS, R
2=0.04 , p=NS, respectively).
Figure 10. Binaural intelligibility level difference (BILD) obtained for simulated free-field
conditions at 90° and 45° (i.e., BILD FF90 and BILD FF45, respectively) as a function of
receptive language age equivalent for children and adolescents with Down syndrome.
BIL
D r
e:
45
° (d
B)
-5
0
5
10
15
20
Receptive Language Age Equivalent (years)
0 2 4 6 8 10 12 14 16 18 20
BIL
D r
e:
90
° (d
B)
-10
-5
0
5
10
15
BILD FF90
BILD FF45
Individuals with Down Syndrome

41
Association between MLD and BILD
The association between MLD and BILD for simulated free-field conditions (i.e., BILD
FF45 and BILD FF90) was examined using Pearson correlations. Figure 11 shows a scatterplot
with MLD for individual participants plotted versus BILD FF90.
Figure 11. Scatterplot showing masking level difference (MLD) scores for individual
participants versus binaural intelligibility level difference obtained for the 90° simulated free-
field condition (BILD FF90).
Associations were not observed between MLD and BILD FF45 or between MLD and
BILD FF90 when data from all participants were included in a single correlation analysis
(R2=0.00, p=NS, R
2=0.00, p=NS, respectively), nor when within-group correlations were
performed for children with Down syndrome (R2=0.33, p=NS, R
2=-0.17, p=NS, respectively),
typically-developing children (R2=-0.16, p=NS, R
2=0.01, p=NS, respectively), adults with Down
BILD re: 90° (dB)
-15 -10 -5 0 5 10 15 20
MLD
(dB
)
-10
-5
0
5
10
15
20
25
30
Children with Down Syndrome
Adults with Down Syndrome
Typically-Developing Children
Typically-Developing Adults
Adolescent with Down Syndrome

42
syndrome (R2=-0.95, p=NS, R
2=0.44, p=NS, respectively), or typically-developing adults
(R2=0.54, p=NS, R
2=0.21, p=NS, respectively).
Signal-to-Noise Ratio (SNR)
Figure 12 illustrates SNR thresholds as a function of chronological age for all simulated
free-field conditions (i.e., FF0, FF45, and FF90).

43
Figure 12. Signal-to-noise-ratio (SNR) threshold for simulated free-field conditions FF0, FF45,
and FF90 as a function of chronological age for typically-developing individuals and individuals
with Down syndrome. TD = typically-developing; DS = Down syndrome.
An inverse 1st order curve was fit to the variables chronological age and SNR threshold
for all simulated free-field conditions for typically-developing individuals (i.e., FF0, FF45, and
FF
0 S
NR
(d
B)
-20
-10
0
10
20
Chronological Age (years)
0 10 20 30 40
FF
90
SN
R (
dB
)
-30
-20
-10
0
10
X Data
FF
45
SN
R (
dB
)
-20
-10
0
10
Inverse 1st Order Model (TD), R2=0.60, p<0.05
Inverse 1st Order Model (TD), R2=0.32, p<0.05
Linear Model (DS), R2=0.34, p<0.05
Typically-Developing Individuals
Individuals with Down Syndrome
Inverse 1st Order Model (TD), R2=0.53, p<0.05

44
FF90; R2=0.53, p≤0.05, R
2=0.32, p≤0.05, R
2=0.60, p≤0.05, respectively). A linear model was fit
to the variables chronological age and SNR threshold at FF0 for individuals with Down
syndrome (R2=0.34, p≤0.05). No linear or non-linear equations including chronological age and
SNR threshold for FF45 or FF90 resulted in significant associations for individuals with Down
syndrome, however the best-fitting linear functions are shown (R2=0.21 , p=NS, R
2=0.16 ,
p=NS, respectively).
Figure 13 illustrates SNR threshold as a function of receptive language age equivalent for
all simulated free-field conditions for children with Down syndrome.

45
Figure 13. Signal-to-noise-ratio (SNR) threshold for simulated free-field conditions FF0, FF45,
and FF90 as a function of receptive language age equivalent for children and adolescents with
Down syndrome.
Non-linear equations including receptive language age equivalent and SNR threshold at
FF0, FF45 or FF90 did not reveal significant associations for children with Down syndrome. As
such, the best-fitting linear functions are shown (R2=0.01, p=NS, R
2=0.04, p=NS, R
2=0.05,
p=NS, respectively).
FF
0 S
NR
-20
-10
0
10
20
Receptive Language Age Equivalent (years)
0 5 10 15 20
FF
90
SN
R
-30
-20
-10
0
10
FF
45
SN
R
-20
-10
0
10
Individuals with Down Syndrome

46
Figure 14 illustrates SNR thresholds as a function of azimuth for simulated free-field
conditions for each group.
Figure 14. Signal-to-noise-ratio (SNR) threshold referenced to SNR at 0° as a function of
azimuth for simulated free-field conditions for typically-developing children, children with
Down syndrome, typically-developing adults, and adults with Down syndrome.
Within-group differences in SNR thresholds across conditions were analyzed to
determine the effect of spatial separation of signal and noise on speech recognition. Differences
for SNR thresholds obtained at FF0 and FF45 were observed for typically-developing children
and typically-developing adults (F[1,45]=21.93, p≤0.05, d=0.66 and F[1,5]=6.97, p≤0.05,
d=0.57, respectively). In addition, differences were observed for SNR thresholds obtained at
FF0 and FF90 for typically-developing children and typically-developing adults (F[1,45]=18.42,
p≤0.05, d=0.56, and F[1,5]=20.34, p≤0.05, d=0.96, respectively). No differences between SNR
thresholds obtained at FF0 and FF45 were seen for children with Down syndrome or adults with
Azimuth (°)
0 45 90
SN
R r
e:
0°
(dB
)
-6
-4
-2
0
2
Typically-Developing Children
Children with Down Syndrome
Typically-Developing Adults
Adults with Down Syndrome

47
Down syndrome, though large effect sizes were noted (F[1,7]=4.18, p=0.08, d=0.82 and
F[1,2]=1.75, p=0.32, d=0.44). In addition, a post hoc power analysis revealed risk of Type II
error for comparisons of SNR FF0 and FF45 for children with Down syndrome and adults with
Down syndrome ([1 – ] = .26 and .04, respectively). Statistically significant differences in
SNR thresholds obtained at FF0 and FF90 were not observed for children with Down syndrome
or adults with Down syndrome.
Location-specific SNR thresholds were calculated to simplify characterization of
performance at a particular simulated source azimuth. That is, SNR threshold for FF45, dL45,
and dT45 were averaged to generate SNR 45, an estimate of ability at this azimuth. Likewise,
SNR thresholds for FF90, dL90, and dT90 were averaged to generate SNR 90. The performance
of individuals with Down syndrome relative to typically-developing individuals was of interest.
In this case, subsets of data from typically-developing children aged 3 to 5 years and 10 to 13
years (i.e., the youngest and oldest children recruited to participate) were selected to represent
performance of typically-developing children within a narrow age range and used to provide an
estimate of the relative performance of children and adults with Down syndrome.
Figure 15 shows SNR threshold for FF0, SNR 45, and SNR 90 for typically-developing
children aged 3 to 5 years, typically-developing children aged 10 to13 years, children with Down
syndrome, typically-developing adults, and adults with Down syndrome.

48
Figure 15. Signal-to-noise-ratio (SNR) threshold for FF0, SNR 45, and SNR 90 for typically-
developing children aged 3-5 years, typically-developing children aged 10-13 years, children
with Down syndrome, typically-developing adults, and adults with Down syndrome.
Adults with Down syndrome had poorer SNR thresholds than typically-developing adults
for FF0, SNR 45, and SNR 90 (F[1,8]=4.96, p≤0.05, d=1.80, F[1,8]=5.76, p≤0.05, d=2.05, and
F[1,8]=16.46, p≤0.05, d=3.46, respectively). However, no statistically significant differences
were observed between the performance of adults with Down syndrome and typically-
developing children aged 10 to13 years for FF0, SNR 45, and SNR 90, though a large effect size
was observed for SNR 90 (F[1,12]=2.82 , p=0.12, d=1.16).
Children with Down syndrome had poorer SNR thresholds than typically-developing
children aged 10 to 13 years for SNR FF0, SNR 45, and SNR 90 (F[1,17]=25.21, p≤0.05,
d=1.88, F[1,17]=24.61, p≤0.05, d=2.92, and F[1,17]=19.73, p≤0.05, d=2.94, respectively).
However, a statistically significant difference was not observed in the SNRs of children with
Azimuth (°)
0 45 90
SN
R (
dB
)
-20
-15
-10
-5
0
5
10
SNR 90
Children with Down Syndrome
Typically-Developing Adults
Adults with Down Syndrome
Typically-Developing Children 10-13 years of age
Typically-Developing Children 3-5 years of age
SNR 450

49
Down syndrome and typically-developing children aged 3 to 5 years for the same conditions
(i.e., FF0, SNR 45, and SNR 90).
Effect of Cue Isolation
Recall that in addition to creating signals to simulate free-field listening conditions, noise
signals recorded at 45°and 90° were processed to isolate ILD cues (i.e., ITD was equal to 0 μs
for all presentations) and ITD cues (i..e., ILD was equal to 0 dB for all presentations). As such,
four isolated cue conditions were created including isolated ILD cues for each azimuth (i.e.,
dL45 and dL90) and isolated ITD cues for each azimuth (i.e., dT45 and dT90). Figure 16
illustrates average SNR threshold for each group as a function of azimuth for simulated free-field
and isolated cue conditions.

50
Figure 16. Signal-to-noise-ratio (SNR) threshold referenced to SNR at 0° for each group as a
function of azimuth for simulated free-field and isolated cue conditions for (A) typically-
developing children, (B) children with Down syndrome, (C) typically-developing adults, and (D)
adults with Down syndrome.
Differences in SNR threshold were analyzed by condition for each group to determine the
relative influence of ITDs and ILDs.
Isolated Interaural Time Difference (ITD). As shown in Figure 16A, performance for
typically-developing children was poorer for the isolated ITD cue condition at 45° (i.e., dT45)
than performance when all cues were present in the signal at this azimuth (i.e., FF45;
-6
-4
-2
0
2
4
0 45 90
SN
R r
e:
0°
(dB
)
-4
-2
0
2
4
6
Azimuth (°)
0 45 90
A: Typically-Developing Children B: Children with Down Syndrome
C: Typically-Developing Adults D: Adults with Down Syndrome
Simulated Free-Field (FF)
Isolated Level Difference (dL)
Isolated Time Difference (dT)

51
F[1,45]=7.67, p≤0.05, d=0.44). Statistically significant differences were not observed between
SNR thresholds obtained at FF45 and dT45 for typically-developing adults (Figure 16C),
children with Down syndrome (Figure 16B), or adults with Down syndrome (Figure 16D),
though large effect sizes were noted for each group (F[1,5]=4.56, p=0.06, d=0.40, F[1,4]=3.68,
p=.13, d=0.52, and F[1,2]=0.60 , p=0.52 , d=0.77 , respectively). Performance for typically-
developing children and typically-developing adults (Figure 16C) was poorer for the isolated
ITD cue at 90° (i.e., dT90) than performance when all cues were present at this azimuth (i.e.,
FF90; F[1,45]=11.31, p≤0.05, d=0.49, and F[1,5]=7.24, p≤0.05, d=0.61, respectively).
Differences in SNR thresholds obtained at FF90 and dT90 were not observed for children with
Down syndrome or adults with Down syndrome, but a large effect size was noted for children
with Down syndrome (F[1,4]=2.04 , p=0.23 , d=0.72).
Isolated Interaural Level Difference (ILD). As seen in Figures 16A, 16B, and 16D,
statistically significant differences in SNR threshold were not observed for typically-developing
children, children with Down syndrome, or adults with Down syndrome between the isolated
ILD cue condition at 45° (i.e., dL45) and performance when all cues were present at this azimuth
(i.e., FF45), though a large effect size was noted for children with Down syndrome (F[1,4]=0.00,
p=0.98 , d=0.47). Typically-developing adults had poorer performance for dL45 compared to
FF45; (F[1,5]=6.27, p≤0.05, d=0.40; Figure 16C). Statistically significant differences were not
observed for the isolated ILD cue at 90° (i.e., dL90) compared to performance when all cues
were present at this azimuth (i.e., FF90) for any of the participant groups, though large effect
sizes were noted for all but the typically-developing children: typically-developing adults,
(F[1,5]=1.12 , p=0.34, d=0.46), children with Down syndrome (F[1,4]=0.49, p=0.53, d=0.47),
and adults with Down syndrome (F[1,2]=8.23, p=0.10, d=0.79).

52
The relative impact of ILD cues (i.e. head shadow) on speech recognition performance
was examined by calculating the difference between SNR for simulated free-field and isolated
ITD conditions. This provided an estimate of the relative influence of ILD cues on speech
recognition performance. Variables were created to represent the contribution of ILDs to free-
field performance at each azimuth. Specifically, the contribution of ILDs to free-field
performance was represented at 45° by subtracting dT45 from FF45. In addition, the
contribution of ILDs to free-field performance was represented at 90° by subtracting dT90 from
FF90. Differences in the relative influence of ILD cues were not observed between children with
Down syndrome or typically-developing children at 45° or 90°.
Psychometric Functions
The group psychometric functions for MLD conditions (i.e., N0S0 and N0S ) and
selected BILD simulated free-field conditions (i.e., FF0 and FF90) are shown in Figures 17 and
18, respectively.

53
Figure 17. Percent correct as a function of log[SPL/ SPL(70.7%)] for N0S0 and N0S
conditions for children and adults with Down syndrome and typically-developing children and
adults.
N0S
0 P
(C)
0.0
0.2
0.4
0.6
0.8
1.0
)/( SPLSPLLog
Children
0.0
0.2
0.4
0.6
0.8
1.0
N0S
P(C
)
0.0
0.2
0.4
0.6
0.8
1.0
-0.1 0.0 0.1 0.2
0.0
0.2
0.4
0.6
0.8
1.0
-0.1 0.0 0.1 0.2 0.3
Individuals with Down Syndrome
Typically-Developing Individuals
Adults

54
Figure 18. Percent correct as a function of log[SPL/ SPL(70.7%)] for FF0 and FF90 conditions
for children and adults with Down syndrome and typically-developing children and adults.
The individual slopes of psychometric functions of children with Down syndrome and
typically-developing children were similar for N0S0, N0S , FF0, and FF90 conditions
suggesting that that attentiveness and motivation contributed equally to the performance of both
groups of children for these tasks (F[1,35]=0.00, p=NS, F[1,32]=0.26, p=NS, F[1,33]=0.10,
FF
0 P
(C)
0.0
0.2
0.4
0.6
0.8
1.0
)/( SPLSPLLog
Children Adults
0.0
0.2
0.4
0.6
0.8
1.0
FF
90
P(C
)
0.0
0.2
0.4
0.6
0.8
1.0
-0.10 -0.05 0.00 0.05 0.10
0.0
0.2
0.4
0.6
0.8
1.0
-0.05 0.00 0.05 0.10 0.15
Individuals with Down Syndrome
Typically-Developing Individuals

55
p=NS, and F[1,37]=0.06, p=NS, respectively). Similarly, the individual slopes of the
psychometric functions of adults with Down syndrome and typically-developing adults did not
differ for N0S0, N0S , FF0, and FF90 conditions (F[1,4]=1.99, p=NS, F[1,5]=0.18, p=NS,
F[1,4]=0.60, p=NS, and F[1,7]=0.32, p=NS, respectively). It should be noted that no logistic
function was found to fit group data for the N0S0 condition for adults with Down syndrome. As
such, the best fitting linear function is shown for this condition.

56
CHAPTER V
DISCUSSION
Our results align well with past studies that have examined MLD for typically-developing
adults and children and BILD for typically-developing adults (e.g., Bronkhorst & Plomp, 1988;
Hall & Grose, 1990a; Hirsh, 1948; Moore et al., 2011). Specifically, average MLD for typically-
developing adults in our study was 15.17 dB, which is consistent with past results of MLDs of 15
dB for adult listeners with normal hearing for low frequency pure tone signals (Hirsh, 1948).
Also similar to past research, larger MLDs were seen with increasing age with an asymptote in
performance noted at about 5 to 6 years of age for typically-developing children in our study
(Grose et al., 1997; Hall & Grose, 1990a; Moore et al., 2011). Furthermore, average SNR
threshold for the BILD simulated free-field condition at 90° (i.e., FF90) was -17.28 dB for
typically-developing adults in our study, similar to the average SNR threshold of -16.6 dB
obtained by Bronkhorst and Plomp (1988) for this condition. Though Bronkhorst and Plomp did
not include a simulated free-field condition at 45°, the average of reported SNR thresholds for
30° and 60° was -14.3 dB, similar to our average SNR threshold result of -15.33 dB for this
condition. Similarities between results from our study and past results validate our research
paradigm. However, some differences were noted between results from our study and
Bronkhorst and Plomp (1988). For example, average SNR threshold for the simulated free-field
condition at 0° was -11.78 dB for the typically-developing adults in our study, which represents
better speech recognition in noise than the -6.4 dB reported for this condition by Bronkhorst and
Plomp (1988).

57
Results of the present study show a marked difference in the binaural abilities of
individuals with Down syndrome compared to their typically-developing peers. First, children
with Down syndrome included in this study had higher thresholds than typically-developing
children for all experimental conditions in both the detection task and the speech recognition task
(i.e., N0S0, N0S , FF0, FF45, and FF90; see Figures 5 and 8 and Tables 3 and 4). Similarly,
individuals with Down syndrome had higher thresholds than typically-developing individuals for
the speech recognition conditions FF0, FF45, and FF90. Despite normal hearing sensitivity,
individuals with Down syndrome in this study had higher thresholds for detection of signals in
noise than typically-developing individuals. Second, individuals with Down syndrome
experienced less binaural benefit than typically-developing individuals for both experimental
paradigms; both MLDs and BILDs were smaller for those with Down syndrome relative to
typically-developing individuals. This suggests that cues resulting in release from masking for
typically-developing individuals, such as ITD cues and spatial separation of signals and noise,
benefit individuals with Down syndrome to a lesser extent. These differences likely occur due to
sensory influences, such as auditory filter width and resultant frequency resolution capabilities,
and non-sensory influences, such as attention and motivation. The following discussion
elaborates on each of these issues.
Sensory Influences
Signal Detection in Noise
Frequency Resolution. It is possible that the higher absolute thresholds for the MLD task
conditions (i.e., N0S0 and N0S ) observed for children with Down syndrome in this study were
the result of poor frequency resolution capabilities. An individual's physiologic capability to

58
distinguish one frequency from another has direct implications for their ability to distinguish
signals from noise. Frequency resolution abilities measured from the cochlea and the brainstem
using physiologic techniques (e.g., otoacoustic emissions and ABR testing) and those measured
behaviorally have been shown to be mature in typically-developing infants by about 6 months of
age (Abdala & Folsom, 1995; Abdala & Sininger, 1996; Folsom & Wynne, 1987; Spetner &
Olsho, 1990). Immature frequency resolution in typically-developing infants has been attributed
to middle-ear, cochlear, and neural factors such as synaptic efficiency, myelination, and dendritic
architecture (Abdala & Folsom, 1995; Abdala, Keefe, & Oba, 2007). As previously discussed,
individuals with Down syndrome are affected by anatomic differences of the middle ear,
cochlea, and neuronal structure and function. As such, it is reasonable to suspect that their
frequency resolution capabilities may be compromised as a result. Our data suggest there is an
improvement in the ability to detect signals in noise for children with Down syndrome with
increasing age (Figure 5). This suggests immaturities in the frequency resolution of children
with Down syndrome relative to typically-developing children, not an absolute deficit that
persists into adulthood.
Temporal Resolution. Temporal resolution refers to the ability to hear changes in a sound
over time and is another likely contributor to the relatively elevated thresholds exhibited by
individuals with Down syndrome for signals presented in noise. It includes the ability to detect
gaps between stimuli as well as the ability to identify changes in signal amplitude and has long
been associated with speech understanding (S. Greenberg, 1996; Pisoni, 1977). Furthermore,
temporal resolution is thought to contribute to improved thresholds when listening in noise (Hall
et al., 2007; Peters, Moore, & Baer, 1998). Similar to frequency resolution, temporal resolution
develops in infancy and early childhood for typically-developing individuals (Hall & Grose,
1994; Whightman, Prudence, Dolan, Kistler, & Jamieson, 1989). Changes in temporal resolution

59
ability can be attributed to the development of physiologic aspects within the auditory system
(He, Hotson, & Trainor, 2007). As such, delayed physiologic development might contribute to
the differences observed between individuals with Down syndrome and their typically-
developing peers. Indeed, when thresholds in noise and SNR thresholds are plotted as a function
of chronological age for experimental conditions within the BILD task, we see an improvement
in the ability to detect signals in noise with age for individuals with Down syndrome for the FF0
condition and typically-developing individuals for all simulated free-field experimental
conditions (i.e., FF0, FF45, and FF90; Figure 12).
Binaural Release from Masking
Synaptic Transmission. Recall that binaural hearing is thought to be facilitated within the
central auditory system by comparison of timing information from the two ears as a function of
characteristic frequency after processing by the peripheral auditory system. Accurate coding of
temporal information within the peripheral auditory system and sensitivity to temporal
differences between ears within the central auditory system is essential for binaural hearing to
occur. This system relies on synaptic transmission. Electrophysiologic test paradigms, like ABR
testing, can be considered an indirect measure of collective neural synchrony and synaptic
transmission (Ponton, Moore, & Eggermont, 1996). As previously discussed, compared to
typically-developing individuals, individuals with Down syndrome have delayed late-latency
auditory evoked potentials (i.e., greater than approximately 50 ms) and accelerated early-latency
auditory evoked potentials (i.e., ABR waveforms). Known deficits in the structure and function
of myelin for individuals with Down syndrome likely impacts synaptic transmission and
electrophysiologic testing as a result.

60
Electrophysiologic test results (i.e., ABR) have been associated with MLDs for typically-
developing children and adults with neurologic impairments (Hall & Grose, 1993; Hannley,
Jerger, & Rivera, 1983; Noffsinger, Martinez, & Schaefer, 1982). For example, smaller MLDs
have been associated with poor integrity of ABR waves I, II, and III (Hannley et al., 1983;
Noffsinger et al., 1982). Furthermore, large interaural asymmetries of interpeak latencies I-III
and I-V have been associated with smaller MLDs (Hall & Grose, 1993). These results suggest
that smaller MLDs are related to anomalous brainstem processing. Considering differences
noted in previous research between ABR test results for individuals with Down syndrome and
typically-developing individuals, it is reasonable to suspect that the smaller MLDs observed for
children in this study could be the result of aberrant synaptic transmission and brainstem
processing of auditory signals.
Spatial Release from Masking
Isolated ILD Cue Use. Recall that we examined the relative impact of ILD cues (i.e.,
head shadow) by calculating the difference between SNR for simulated free-field and isolated
ITD conditions. We anticipated that children with Down syndrome would show greater reliance
on ILD cues than typically-developing children suggesting poor utilization of binaural cues (i.e.,
ITD cues). However, children with Down syndrome and typically-developing children had
similar performance when the relative impact of ILD cues was assessed. Though the similar
relative utilization of ILD cues observed for these groups could support that children with Down
syndrome have similar binaural abilities to typically-developing children, MLD results do not
corroborate this conclusion. Rather, this finding is likely influenced by our experimental
paradigm, which is discussed in a later section of this paper.

61
Signal-to-Noise Ratio (SNR). Additional support for developmental improvements in the
ability to detect signals in noise was apparent in our finding that SNR threshold for the FF0
condition showed a gradual decrease as a function of age for typically-developing individuals
and for individuals with Down syndrome (Figure 12). In fact, our results suggest developmental
improvements for speech recognition in noise for typically-developing individuals in a variety of
listening conditions and for individuals with Down syndrome when the signal and noise originate
from similar spatial locations. Spatial separation of signals and noise resulted in improved SNR
threshold for typically-developing adults and typically-developing children. Effect sizes for
children with Down syndrome and adults with Down syndrome were large and a post hoc power
analysis revealed risk of Type II error for comparisons of SNR at FF0 and FF45. As such, it is
likely that including more participants with Down syndrome in the analysis would indicate a
pattern of results consistent with changes in SNR with separation of signals and noise.
Relative Performance. Children with Down syndrome included in this study were aged 6
to 11 years, but their collective performance mirrored that of typically-developing children aged
3 to 5 years. That is, as a group, the ability of children with Down syndrome to take advantage
of spatial release from masking was similar to that of typically-developing children aged 3 to 5
years. Similar to typically-developing individuals, this ability likely improves over time for
individuals with Down syndrome. However, results from adults with Down syndrome included
in this study are similar to that of typically-developing children aged 10 to 13 years. Though the
performance of children with Down syndrome can be expected to improve with development, the
spatial release from masking experienced by adults with Down syndrome remained poorer than
that experienced by typically-developing adults.
Interestingly, this pattern of results was not observed for the MLD task. Differences in
MLD between children with Down syndrome and typically-developing children were observed,
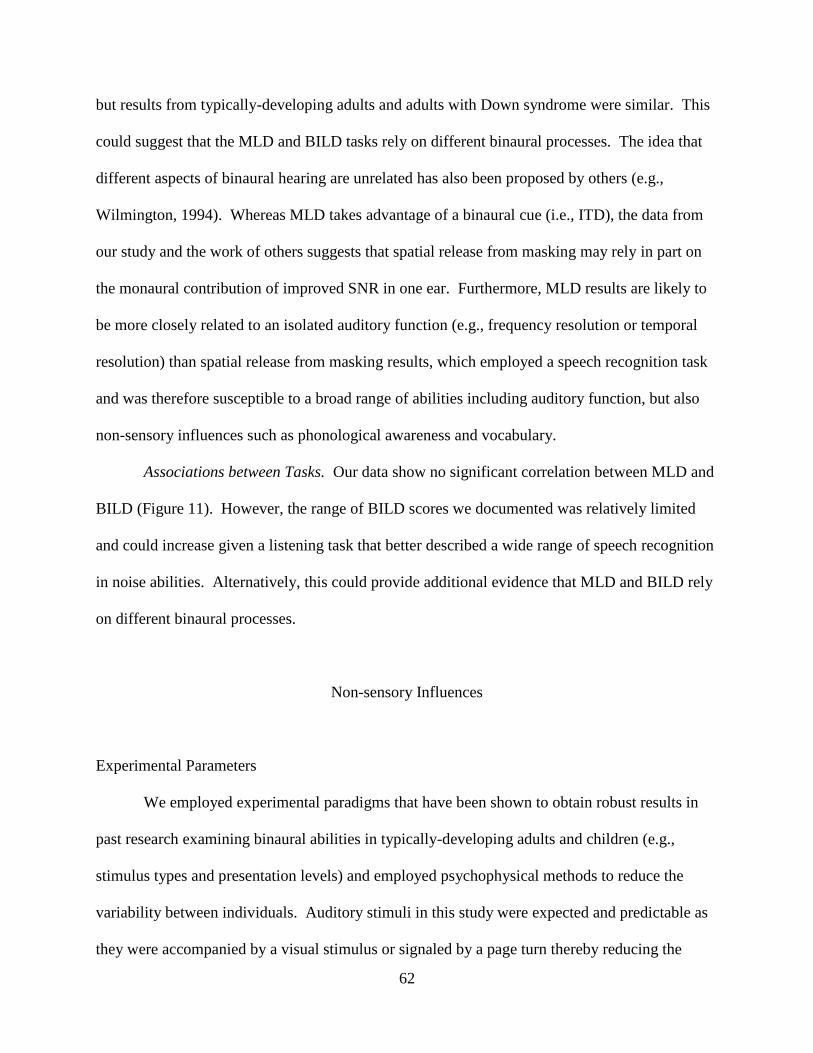
62
but results from typically-developing adults and adults with Down syndrome were similar. This
could suggest that the MLD and BILD tasks rely on different binaural processes. The idea that
different aspects of binaural hearing are unrelated has also been proposed by others (e.g.,
Wilmington, 1994). Whereas MLD takes advantage of a binaural cue (i.e., ITD), the data from
our study and the work of others suggests that spatial release from masking may rely in part on
the monaural contribution of improved SNR in one ear. Furthermore, MLD results are likely to
be more closely related to an isolated auditory function (e.g., frequency resolution or temporal
resolution) than spatial release from masking results, which employed a speech recognition task
and was therefore susceptible to a broad range of abilities including auditory function, but also
non-sensory influences such as phonological awareness and vocabulary.
Associations between Tasks. Our data show no significant correlation between MLD and
BILD (Figure 11). However, the range of BILD scores we documented was relatively limited
and could increase given a listening task that better described a wide range of speech recognition
in noise abilities. Alternatively, this could provide additional evidence that MLD and BILD rely
on different binaural processes.
Non-sensory Influences
Experimental Parameters
We employed experimental paradigms that have been shown to obtain robust results in
past research examining binaural abilities in typically-developing adults and children (e.g.,
stimulus types and presentation levels) and employed psychophysical methods to reduce the
variability between individuals. Auditory stimuli in this study were expected and predictable as
they were accompanied by a visual stimulus or signaled by a page turn thereby reducing the

63
likelihood of adverse effects due to temporal unexpectedness. Potential differences in threshold
criteria were accounted for by using a 2AFC paradigm, as listeners were required to determine in
which interval a sound was presented, not indicate the presence of a sound. Furthermore,
inclusion criteria included feasibility testing to rule out the possibility that scores could be
influenced by an inability to perform experimental tasks. Efforts to maintain attention and
motivation were employed throughout experimental testing by offering frequent verbal and
tangible rewards (e.g., stickers). Visual reminders of the task were offered (e.g., pointing to each
picture as sound played) and sometimes duplicated by the children. Disproportionate effects of
attention and motivation were not evident in the slopes of the psychometric functions for
typically-developing individuals and individuals with Down syndrome included in this study.
Internalization of Signals
The use of non-individualized head-related transfer functions (HRTFs) could have
resulted in most subjects hearing signals internalized, rather than externalized and this could
have influenced our spatial release from masking results. Individual HRTFs provide listeners
with spectral information similar to that which they receive in natural conditions whereas non-
individualized HRTFs rely on an approximation of spectral information based on measurements
made from a mannequin (e.g., KEMAR). It is not clear that individualized HRTFs would have
influenced our results to a measureable effect as past research has shown adequate performance
using estimated HTRFs and simulated free-field conditions, at least for typically-developing
adults and children (Bronkhorst & Plomp, 1988; Cameron & Dillon, 2007; Wenzel, Arruda,
Kistler, & Wightman, 1993). Nonetheless, the potential effect of non-individualized HRTFs for
individuals with Down syndrome should not be dismissed. However, the use of individual
HRTFs represents an ideal that was not feasible. Obtaining HRTFs requires that listeners remain

64
still for a period of time, which would have been difficult to sustain in young children and
children with Down syndrome. Moreover, generating individualized simulated free-field and
isolated cue conditions for each participant in this study would have added prohibitive time
demands.
Surprisingly, observations of Figure 15 indicated that adults and children with Down
syndrome had similar or poorer performance when the signal and noise were maximally
separated compared to conditions in which they originated from more similar locations. It is
possible that individuals with Down syndrome were affected to a greater degree by a maximally
spatially separated noise than noise that was perceptually closer to a signal. That is, a displaced
masker could be perceptually distracting for individuals with Down syndrome. It is not clear if
this pattern of results would persist if the signals were perceptually externalized affording a
closer approximation to natural environments. However, this might additionally account for
some of the difference observed for spatial release from masking between individuals with Down
syndrome and typically-developing individuals.
Developmental Ability
An attempt to quantify the developmental abilities of the children with Down syndrome
included in this study was made by using age-equivalent scores from the receptive language
subdomain of the Vineland Adaptive Behavior Scales (Sparrow et al., 2005). The receptive
language subdomain was thought to be the most closely related to our experimental tasks of all
subdomains on this measure, but it proved to be insensitive to a range of abilities. This was
partly due to the limited number of questions included in this subdomain. This subdomain is
comprised of 20 questions and results in a range of 0 to 40 total possible points. Furthermore, it
does not afford the opportunity to describe specific receptive language abilities, such as

65
vocabulary acquisition, rather it queries more general abilities, such as the ability to follow
instructions and listen to stories for specified amounts of time. Lastly, the translation of raw
scores to age equivalents was found to be insensitive to describing incremental changes in age-
equivalent scores as a small change in raw score corresponds to a large change in age equivalent
score. For example, whereas a maximum raw score (i.e., 40) corresponds to an age equivalent
score of 18:0, a raw score just one point lower (i.e., 39) corresponds to an age equivalent of 11:0.
The use of this tool limited our ability to adequately estimate the developmental age and
cognitive function of the individuals with Down syndrome included in this study.
Accurate estimates of developmental age notwithstanding, efforts to include typically-
developing children within the same chronological age range as projected estimates of the
developmental age range of children with Down syndrome included in this study were successful
and resulted in the inclusion of typically-developing children as young as 3 years of age. As
such, we were able to describe binaural abilities with development for typically-developing
children adding further support to our knowledge base suggesting adult-like MLD by about 5 to
6 years of age for some signal and noise configurations (Grose et al., 1997; Hall & Grose, 1990a;
Moore et al., 2011). Including children with Down syndrome aged 6 to 12 years did not offer a
broad enough range of abilities to define a developmental pattern considering chronological age
or receptive language age equivalent contrary to estimations at the outset of this study.
However, the inclusion of a subset of adolescents and adults with Down syndrome afforded us
the opportunity to begin to see how binaural abilities might change with development.
Vocabulary and Auditory Comprehension
A developmental change in spatial release from masking was not evidenced in our data
for any group, which was surprising. This result might have been influenced by the use of

66
vocabulary words that were easily recognized in the most difficult listening condition (i.e., FF0).
Recall that results from typically-developing adults included in our study correspond relatively
well to those found by Bronkhorst and Plomp (1988) for conditions in which the signal and noise
are separated. Relatively good speech recognition in the most difficult listening condition could
result in less relative improvement in speech recognition as listening conditions improve. Past
research supports this hypothesis demonstrating adult-like spatial release from masking for
young children for a paradigm that also utilized monosyllabic words in a closed-set task
(Litovsky, 2005).
Differences were not seen between children with Down syndrome and typically-
developing children on this task, yet they were observed for adults in these respective groups.
Conceivably, vocabulary could have influenced performance for adults with Down syndrome for
our speech recognition task and been the catalyst for poorer performance relative to typically-
developing adults. However, this is not thought to be the case as the words utilized for this study
were obtained from a test developed to be used with typically-developing children as young as 3
years of age. It is more likely that adults with Down syndrome have a lower ceiling for this task
than typically-developing adults based on SNR threshold, yet the words included in the task were
simple enough to obtain near ceiling results in the most difficult listening condition. The
performance for adults with Down syndrome was not affected by removal of level or time cues,
which might have also been influenced by ceiling effects. A more sensitive task, one that is able
to reveal a range of abilities, would likely produce a pattern of results for adults similar to those
reported by Bronkhorst and Plomp (1988).
Known deficits in the phonological awareness abilities of individuals with Down
syndrome could be partly responsible for the poorer spatial release from masking relative to
typically-developing individuals included in this study. Corruption of part of a word might not

67
influence the performance of one with high phonological awareness skills, but could render a
word indistinguishable for someone with less capability in this area. The possible influence of
phonological awareness ability on the performance of individuals with Down syndrome is likely
closely related to temporal resolution abilities, a concept discussed in a previous section of this
paper.
Selective Listening
The ability to detect signals in noise could be influenced by selective listening abilities.
Typically-developing adults selectively attend to relevant auditory filters when listening for
expected sounds whereas typically-developing infants employ a broad listening strategy
monitoring all auditory filters (Bargones & Werner, 1994). Though this affords typically-
developing infants the opportunity to attend to expected and unexpected signals with equal
success, it may reduce the improvement in threshold for expected signals experienced by
typically-developing children and adults. It is possible that individuals with Down syndrome do
not selectively attend to auditory filters associated with expected frequencies and therefore do
not benefit from such strategies.
Behavioral studies have not been done to determine selective attention and habituation
for auditory stimuli. However, electrophysiologic measures of these processes suggest delayed
cortical processing for stimulus detection and no habituation in response to repeated stimulation
(Pekkonen et al., 2007; Seidl et al., 1997). Furthermore, studies to examine visual selective
attention and habituation have suggested that infants with Down syndrome have longer sustained
levels of attention, slower habituation, and fewer shifts in gaze from preferred visual patterns (for
review, see Zelazo & Stack, 1997). In addition, individuals with Down syndrome experience
distraction from visual targets by distal stimuli to a greater degree and experience less benefit

68
when distracters are categorically similar than typically-developing individuals (Merrill &
O'dekirk, 1994). As such, it is likely that behavioral measures of auditory selective attention and
habituation would reveal similar patterns for individuals with Down syndrome as well.

69
CHAPTER VI
CONCLUSION AND DIRECTIONS FOR FUTURE RESEARCH
Children with Down syndrome are at greater risk for hearing loss and other auditory
perceptual difficulties as a result of anatomical differences within the peripheral and central
auditory systems (e.g., Bilgin et al., 1996; Blaser et al., 2006). However, with the exception of a
few studies (e.g., Glenn et al., 1981; Werner et al., 1996), little work has been done to understand
the auditory abilities of infants and children with Down syndrome beyond hearing sensitivity.
This study was designed to determine if the binaural abilities of children with Down syndrome
are compromised relative to those of typically-developing children.
Children with Down syndrome experienced less binaural benefit than typically-
developing children evidenced by results from the MLD task. This could be the result of
inefficient use of ITD cues for children with Down syndrome. Importantly, adults with Down
syndrome and typically-developing adults had similar MLDs. This suggests a delay in release
from masking abilities for children with Down syndrome rather than an absolute deficit in this
area.
Despite normal hearing sensitivity, individuals with Down syndrome had poorer
thresholds in noise than typically-developing individuals. However, improvements in SNR
threshold were observed for typically-developing individuals and individuals with Down
syndrome with increasing age. Currently, the frequency resolution and temporal resolution
abilities of individuals with Down syndrome are unknown. Studies to explore these auditory
capabilities should be undertaken to determine their influence on hearing thresholds in noise for
individuals with Down syndrome.

70
Separation of signal and noise stimuli improved speech recognition in some capacity for
all individuals included in this study, but the performance of individuals with Down syndrome
remained poorer than typically-developing individuals. This could be related to the temporal
resolution capabilities of individuals with Down syndrome and future studies should be
undertaken to address this issue. In addition, individuals with Down syndrome have known
difficulties with phonemic awareness (e.g., Cardoso-Martins et al., 2002; Snowling et al., 2002)
and this could have influenced estimations of spatial release from masking. Interestingly,
individuals with Down syndrome had the tendency to perform poorer for conditions in which the
signal and noise were maximally separated than those in which they were spatially adjacent. The
reasons for this are currently unclear. It would be useful to implement a study of spatial
separation of speech and noise in the free-field for individuals with Down syndrome to determine
the influence of internalized signals and the possibility of perceptual distraction.
Our observations suggest that children with Down syndrome have similar speech
recognition in noise as typically-developing children aged 3 to 5 years. It has long been
established that speech recognition in noise improves with age for typically-developing children
and that young children require more favorable SNRs than adults for optimal performance (e.g.,
Elliott et al., 1979; Mills, 1975). Results from this study suggest this is also true for individuals
with Down syndrome through adolescence.
Motivation and attention did not appear to influence results for individuals with Down
syndrome to a greater degree than typically-developing individuals as evidenced by group
psychometric functions. Future research should be done to obtain more specific information
regarding attention and selective listening for individuals with Down syndrome. Furthermore,
techniques that do not require behavioral responses from participants, such as ERP testing and

71
measures of the binaural interaction component (BIC), could determine if physiologic correlates
support our behavioral findings.
In conclusion, results from this study showed that children with Down syndrome had
higher masked thresholds for our experimental stimuli and exhibited less release from masking
than typically-developing children. The binaural advantages afforded to typically-developing
children, such as enhanced hearing sensitivity and better speech understanding in adverse
listening conditions, were not present for children with Down syndrome in this study. The
reduced binaural benefit experienced by children with Down syndrome suggests that they will
require more favorable SNRs than typically-developing children to achieve optimal performance
in adverse listening conditions. This has important implications for the planning of educational
and therapeutic interventions for individuals with Down syndrome.

72
APPENDIX A
OTOLOGIC CASE HISTORY
Parent Survey: Ear Infections
Participant Code: _________________
Date of Birth: _________________
Today’s Date: _________________
About how many ear infections has your child had since he/she was born?
______
About how many ear infections did your child have before his/her fifth birthday? ______
When was the last time your child had an ear infection? ____________
When was the last time your child took prescription medicine to treat an ear infection? ____________
Has your child ever had tubes surgically placed to help treat chronic ear infections? ______
If so, how many times did your child have this surgery? ______
When did the last surgery occur? ______
Do you think the tubes are still in place? ______
Thank you very much for your time!

73
APPENDIX B
MASKING LEVEL DIFFERENCE STORY SCRIPT
Experimenter Script Experimenter Actions
There are some owls hiding in a windy
forest. I want you to find them.
You are going to see two pictures and hear
the wind in each picture.
Point to blank computer screen.
There is an owl in one of the pictures. It is
your job to tell me which one.
Is he in the first or second picture? Point to approximate future position of
visual stimulus on blank computer screen.
Just point. Is the owl here or here? Point to approximate future position of
visual stimulus on blank computer screen.
I'll show you the answer after you guess.
Let's try a few!

74
REFERENCES
Abdala, C., & Folsom, R. (1995). The development of frequency resolution in humans as
revealed by the auditory brain stem response recorded with notched noise masking.
Journal of the Acoustical Society of America, 98, 921.
Abdala, C., Keefe, D., & Oba, S. (2007). Distortion product otoacoustic emission suppression
tuning and acoustic admittance in human infants: Birth through 6 months. Journal of the
Acoustical Society of America, 121(6), 3617-3627.
Abdala, C., & Sininger, Y. (1996). The development of cochlear frequency resolution in the
human auditory system. Ear and Hearing, 17(5), 374.
Arao, H., & Niwa, H. (1991). Auditory brain stem responses in Down's syndrome [Abstract].
Nippon Jibiinkoka Gakkai Kaiho, 94(11), 1673.
Auinger, P., Lanphear, B. P., Kalkwarf, H. J., & Mansour, M. E. (2003). Trends in otitis media
among children in the United States. Pediatrics, 112(3), 514.
Balkany, T., Mischke, R., Downs, M., & Jafek, B. (1979). Ossicular abnormalities in Down's
syndrome. Otolaryngology and Head and Neck Surgery, 87(3), 372.
Banik, N., Davison, A., Palo, J., & Savolainen, H. (1975). Biochemical studies on myelin
isolated from the brains of patients with Down's syndrome. Brain: A Journal of
Neurology, 98(2), 213.
Bargones, J. Y., & Werner, L. A. (1994). Adults listen selectively; infants do not. Psychological
Science, 5(3), 170-174.
Becker, L., Armstrong, D., & Chan, F. (1986). Dendritic atrophy in children with Down's
syndrome. Annals of Neurology, 20(4), 520-526.
Bilgin, H., Kasemsuwan, L., Schachern, P., Paparella, M., & Le, C. (1996). Temporal bone study
of Down's syndrome. Archives of Otolaryngology—Head & Neck Surgery, 122(3), 271.
Blaser, S., Propst, E., Martin, D., Feigenbaum, A., James, A., Shannon, P. et al. (2006). Inner ear
dysplasia is common in children with Down syndrome (trisomy 21). Laryngoscope,
116(12), 2113-2119.
Blodgett, H., Jeffress, L., & Whitworth, R. (1962). Effect of noise at one ear on the masked
threshold for tone at the other. Journal of the Acoustical Society of America, 34, 979.
Boudreau, D. (2002). Literacy skills in children and adolescents with Down syndrome. Reading
and Writing, 15(5), 497-525.

75
Bronkhorst, A., & Plomp, R. (1988). The effect of head induced interaural time and level
differences on speech intelligibility in noise. Journal of the Acoustical Society of
America, 83, 1508-1516.
Cameron, S., Brown, D., Keith, R., Martin, J., Watson, C., & Dillon, H. (2009). Development of
the North American Listening in Spatialized Noise-Sentences Test (NA LISN-S):
Sentence Equivalence, Normative Data, and Test-Retest Reliability Studies. Journal of
the American Academy of Audiology, 20(2), 128-146.
Cameron, S., & Dillon, H. (2007). Development of the Listening in Spatialized Noise-Sentences
Test (LISN-S). Ear and Hearing, 28(2), 196.
Cardoso-Martins, C., & Frith, U. (2001). Can individuals with Down syndrome acquire
alphabetic literacy skills in the absence of phoneme awareness? Reading and Writing,
14(3), 361-375.
Cardoso-Martins, C., Michalick, M., & Pollo, T. (2002). Is sensitivity to rhyme a developmental
precursor to sensitivity to phoneme?: Evidence from individuals with Down syndrome.
Reading and Writing, 15(5), 439-454.
Carhart, R. (1965). Monaural and binaural discrimination against competing sentences.
International Journal of Audiology, 4, 5–10.
Cohen, J. (1992). A Power Primer. Psychological Bulletin, 112(1), 155-159.
Colburn, H. (1973). Theory of binaural interaction based on auditory nerve data. I. General
strategy and preliminary results on interaural discrimination. Journal of the Acoustical
Society of America, 54, 1458.
Colburn, H. (1977). Theory of binaural interaction based on auditory nerve data. II. Detection of
tones in noise. Journal of the Acoustical Society of America, 61, 525.
Colon, E. (1972). The structure of the cerebral cortex in Down's syndrome: A quantitative
analysis. Neuropadiatrie, 3, 376.
Crome, L., Cowie, V., & Slater, E. (1966). A statistical note on cerebellar and brain-stem weight
in mongolism. Journal of Intellectual Disability Research, 10(1), 69-72.
Davidoff, L. (1928). The brain in mongolian idiocy: a report of ten cases. Archives of Neurology
& Psychiatry, 20(6), 1229.
Diaz, F., & Zurron, M. (1995). Auditory evoked potentials in Down's syndrome.
Electroencephalography and Clinical Neurophysiology/Evoked Potentials Section, 96(6),
526-537.
Durlach, N. (1972). Binaural signal detection- Equalization and cancellation theory. Foundations
of Modern Auditory Theory.

76
Elliott, L., Connors, S., Kille, E., Levin, S., Ball, K., & Katz, D. (1979). Children's understanding
of monosyllabic nouns in quiet and in noise. Journal of the Acoustical Society of
America, 66(1), 12-21.
Elliott, L., & Katz, D. (1980). Northwestern University children's perception of speech (NU-
CHIPS). St. Louis: Auditec.
Ferri, R., Gracco, S., Elia, M., Musumeci, S., & Stefanini, M. (1995). Age, sex and mental
retardation related changes of brainstem auditory evoked potentials in Down's syndrome.
The Italian Journal of Neurological Sciences, 16(5), 377-383.
Folsom, R., Widen, J., & Wilson, W. (1983). Auditory brain-stem responses in infants with
Down's syndrome. Archives of Otolaryngology—Head & Neck Surgery, 109(9), 607.
Folsom, R., & Wynne, M. (1987). Auditory brain stem responses from human adults and infants:
Wave V tuning curves. Journal of the Acoustical Society of America, 81, 412.
Forti, S., Amadeo, C., Fagnani, E., Filipponi, E., Pignataro, L., Cesarani, A. et al. (2008).
Auditory brainstem responses (ABR) in normal hearing adult subjects with Down's
syndrome. Brain Research, 1233, 58-62.
Frangou, S., Aylward, E., Warren, A., Sharma, T., Barta, P., & Pearlson, G. (1997). Small
planum temporale volume in Down's syndrome: A voumetric MRI study. The American
Journal of Psychiatry, 154, 1424-1429.
Garadat, S., & Litovsky, R. (2007). Speech intelligibility in free field: Spatial unmasking in
preschool children. Journal of the Acoustical Society of America, 121, 1047.
Glenn, S., Cunningham, C., & Joyce, P. (1981). A study of auditory preferences in
nonhandicapped infants and infants with Down's syndrome. Child Development, 52(4),
1303-1307.
Gombert, J. (2002). Children with Down syndrome use phonological knowledge in reading.
Reading and Writing, 15(5), 455-469.
Grantham, D. (1995). Spatial hearing and related phenomena. In B. Moore (Ed.), Handbook of
Perception and Cognition: Hearing (Second ed.). San Diego: Academic Press, Inc.
Green, D. (1976). An Introduction to Hearing. Hillsdale, NJ: Lawrence Erlbaum Associates.
Greenberg, D., Wilson, W., Moore, J., & Thompson, G. (1978). Visual reinforcement
audiometry (VRA) with young Down's syndrome children. Journal of Speech and
Hearing Disorders, 43(4), 448.
Greenberg, S. (1996). Understanding speech understanding: Towards a unified theory of speech
perception. Paper presented at the The ESCA Workshop on the Auditory Basis of Speech
Perception, Keele University.

77
Groen, M., Alku, P., & Bishop, D. (2008). Lateralisation of auditory processing in Down
syndrome: A study of T-complex peaks Ta and Tb. Biological Psychology, 79(2), 148-
157.
Grose, J., Hall, J., & Dev, M. (1997). MLD in children: Effects of signal and masker bandwidths.
Journal of Speech, Language, and Hearing Research, 40(4), 955.
Hafter, E. (1971). Quantitative evaluation of a lateralization model of masking level differences.
Journal of the Acoustical Society of America, 50, 1116.
Haier, R., Cheueh, D., Touchette, P., & Lott, I. (1995). Brain size and cerebral glucose metabolic
rate in nonspecific mental retardation and Down syndrome. Intelligence, 20, 191-210.
Hall, J., Buss, E., & Grose, J. (2007). The binaural temporal window in adults and children.
Journal of the Acoustical Society of America, 121, 401.
Hall, J., Buss, E., Grose, J., & Dev, M. (2004). Developmental effects in the masking-level
difference. Journal of Speech, Language, and Hearing Research, 47(1), 13.
Hall, J., & Grose, J. (1990a). The masking-level difference in children. Journal of the American
Academy of Audiology, 1(2), 81-88.
Hall, J., & Grose, J. (1990b). The masking-level difference in children. Journal of the American
Academy of Audiology, 1(2), 81.
Hall, J., & Grose, J. (1993). The effect of otitis media with effusion on the masking-level
difference and the auditory brainstem response. Journal of Speech, Language, and
Hearing Research, 36(1), 210.
Hall, J., & Grose, J. (1994). Development of temporal resolution in children as measured by the
temporal modulation transfer function. Journal of the Acoustical Society of America,
96(1), 150-154.
Hall, J., Grose, J., & Pillsbury, H. (1995). Long-term effects of chronic otitis media on binaural
hearing in children. Archives of Otolaryngology- Head and Neck Surgery, 121(8), 847.
Hämmerle, B., Carnicero, A., Elizalde, C., Ceron, J., Martinez, S., & Tejedor, F. (2003).
Expression patterns and subcellular localization of the Down syndrome candidate protein
MNB/DYRK1A suggest a role in late neuronal differentiation. European Journal of
Neuroscience, 17(11), 2277-2286.
Hannley, M., Jerger, J., & Rivera, V. (1983). Relationships among auditory brain stem
responses, masking level differences and the acoustic reflex in multiple sclerosis.
International Journal of Audiology, 22(1), 20-33.

78
Harris, J. (1965). Monaural and binaural speech intelligibility and the stereophonic effect based
upon temporal cues. The Laryngoscope, 75, 428.
He, C., Hotson, L., & Trainor, L. (2007). Mismatch responses to pitch changes inearly infancy.
Journal of Cognitive Neuroscience, 19(5), 878-892.
Hirsh, I. (1948). The influence of interaural phase on interaural summation and inhibition.
Journal of the Acoustical Society of America, 20, 536-544.
Jarrold, C., Baddeley, A., & Phillips, C. (2002). Verbal short-term memory in Down syndrome:
A problem of memory, audition, or speech? Journal of Speech, Language, and Hearing
Research, 45(3), 531.
Jarrold, C., Thorn, A., & Stephens, E. (2009). The relationships among verbal short-term
memory, phonological awareness, and new word learning: Evidence from typical
development and Down syndrome. Journal of Experimental Child Psychology, 102(2),
196-218.
Jeffress, L. (1948). A place theory of sound localization. Journal of Comparative and
Physiological Psychology, 41(1), 35-39.
Jeffress, L., Blodgett, H., Sandel, T., & Wood, C. (1956). Masking of tonal signals. Journal of
the Acoustical Society of America, 28, 416.
Jernigan, T., Bellugi, T., Sowell, E., Doherty, S., & Hesselink, J. (1993). Cerebral morphologic
distinctions between Williams and Down syndromes. Archives of Neurology, 50, 186-
191.
Jiang, Z., Wu, Y., & Liu, X. (1990). Early development of brainstem auditory evoked potentials
in Down's syndrome. Early Human Development, 23(1), 41.
Kakigi, R., & Kuroda, Y. Brain-stem auditory evoked potentials in adults with Down's
syndrome. Electroencephalography and Clinical Neurophysiology, 84(3), 293.
Keller-Bell, Y., & Fox, R. (2007). A Preliminary study of speech discrimination in youth with
Down syndrome. Clinical Linguistics & Phonetics, 21(4), 305-317.
Killion, M. (1979). Equalization filter for eardrum-pressure recording using a KEMAR manikin.
Journal of the Audio Engineering Society, 27(1-2), 13–16.
Kittler, P., Phan, H., Gardner, J., Miroshnichenko, I., Gordon, A., & Karmel, B. (2009). Auditory
brainstem evoked responses in newborns with Down syndrome. American Journal on
Intellectual and Developmental Disabilities, 114(6), 393-400.
Kruger, B. (1987). An update on the external ear resonance in infants and young children. Ear
and Hearing, 8(6), 333.

79
Lemons, C., & Fuchs, D. (2009). Phonological awareness of children with Down syndrome: Its
role in learning to read and the effectiveness of related interventions. Research in
Developmental Disabilities.
Levene, H. (1960). Robust Tests for Equality of Variances. In I. Olkin, S. Ghurye, W. Hoeffding,
W. Madow & H. Mann (Eds.), Contributions to Probability and Statistics: Essays in
Honor of Harold Hotelling. Stanford, CA: Stanford University Press.
Levitt, H. (1971). Transformed up-down methods in psychoacoustics. Journal of the Acoustical
Society of America, 49(2), 467–477.
Levitt, H., & Rabiner, L. (1967). Binaural release from masking for speech and gain in
intelligibility. Journal of the Acoustical Society of America, 42, 601.
Litovsky, R. (2005). Speech intelligibility and spatial release from masking in young children.
Journal of the Acoustical Society of America, 117, 3091.
Litovsky, R., Fligor, B., & Tramo, M. (2002). Functional role of the human inferior colliculus in
binaural hearing. Hearing Research, 165(1-2), 177-188.
MacKeith, N. W., & Coles, R. R. A. (1971). Binaural advantages in hearing of speech. The
Journal of Laryngology & Otology, 85(03), 213-232.
Merrill, E., & O'dekirk, J. (1994). Visual selective attention and mental retardation. Cognitive
Neurophyschology, 11(2), 117-132.
Mills, J. (1975). Noise and children: A review of the literature. Journal of the Acoustical Society
of America, 58, 769-779.
Mitchell, R., Call, E., & Kelly, J. (2003). Ear, Nose and Throat Disorders in Children with Down
Syndrome. Laryngoscope, 113, 259-263.
Moncur, J., & Dirks, D. (1967). Binaural and monaural speech intelligibility in reverberation.
Journal of Speech, Language and Hearing Research, 10(2), 186.
Moore, D. (1991). Anatomy and physiology of binaural hearing. International Journal of
Audiology, 30(3), 125-134.
Moore, D., Cowan, J. A., Riley, A., Edmondson-Jones, A. M., & Ferguson, M. A. (2011).
Development of Auditory Processing in 6- to 11-Yr-Old Children. Ear and Hearing,
32(3), 269-285 210.1097/AUD.1090b1013e318201c318468.
Noffsinger, D., Martinez, C., & Schaefer, A. (1982). Auditory brainstem responses and masking
level differences in persons with brainstem lesion. Scandanavian Audiology Supplement,
15, 81-93.

80
Nozza, R. (1987). The binaural masking level difference in infants and adults: Developmental
change in binaural hearing. Infant Behavior and Development, 10(1), 105-110.
Nozza, R., Wagner, E., & Crandell, M. (1988). Binaural release from masking for a speech
sound in infants, preschoolers, and adults. Journal of Speech, Language and Hearing
Research, 31(2), 212.
Pekkonen, E., Osipova, D., Sauna-Aho, O., & Arvio, M. (2007). Delayed auditory processing
underlying stimulus detection in Down syndrome. Neuroimage, 35(4), 1547-1550.
Peters, R., Moore, B., & Baer, T. (1998). Speech reception thresholds in noise with and without
spectral and temporal dips for hearing-impaired and normally hearing people. Journal of
the Acoustical Society of America, 103(1), 577-587.
Pettinato, M., & Verhoeven, J. (2009). Production and perception of word stress in children and
adolescents with Down syndrome. Down Syndrome Research and Practice, 1-13
Pinter, J., Brown, W., Eliez, S., Schmitt, J., Capone, G., & Reiss, A. (2001). Amygdata and
hippocampal volumes in children with Down syndrome: A high-resolution MRI study.
Neruology, 56, 972-974.
Pinter, J., Eliez, S., Schmitt, J., Capone, G., & Reiss, A. (2001). Neuroanatomy of Down's
syndrome: A high-resolution MRI study. American Journal of Psychiatry, 158(10), 1659.
Pisoni, D. (1977). Identification and discrimination of the relative onset time of two component
tones: Implications for voicing perception in stops. Journal of the Acoustical Society of
America, 61(5), 1352-1361.
Ponton, C. W., Moore, J. K., & Eggermont, J. J. (1996). Auditory Brain Stem Response
Generation by Parallel Pathways: Differential Maturation of Axonal Conduction Time
and Synaptic Transmission. Ear and Hearing, 17(5), 402-410.
Raz, N., Torres, I., Briggs, S., Spencer, W., Thornton, A., Loken, W. et al. (1995). Selective
neuroanatomic abnormalities in Down's syndrome and their cognitive correlates:
Evidence from MRI morphometry. Neurology, 45(2), 356-366.
Roch, M., & Jarrold, C. (2008). A comparison between word and nonword reading in Down
syndrome: The role of phonological awareness. Journal of Communication Disorders,
41(4), 305-318.
Satwant, S., Subramaniam, K. N., Prepageran, N., Raman, R., & Jalaludin, M. A. (2002).
Otological disorders in Down's syndrome. Medical Journal of Malaysia, 57(3), 278-282.
Seidl, R., Hauser, E., Bernert, G., Marx, M., Freilinger, M., & Lubec, G. (1997). Auditory
evoked potentials in young patients with Down syndrome. Event-related potentials (P3)
and histaminergic system. Cognitive Brain Research, 5(4), 301-309.

81
Snowling, M., Hulme, C., & Mercer, R. (2002). A deficit in rime awareness in children with
Down syndrome. Reading and Writing, 15(5), 471-495.
Song, J., Skoe, E., Banai, K., & Kraus, N. (2011). Perception of speech in noise: Neural
correlates. Journal of Cognitive Neuroscience, 23(9), 2268-2279.
Sparrow, S. S., Cicchetti, D. V., & Balla, D. A. (2005). Vineland Adaptive Behavior Scales:
Second Edition: American Guidance Service.
Spetner, N. B., & Olsho, L. W. (1990). Auditory Frequency Resolution in Human Infancy. Child
Development, 61(3), 632-652.
Stapells, D. (2002). Cortical event-related potentials to auditory stimuli. In J. Katz (Ed.),
Handbook of Clinical Audiology (Fifth ed., pp. 378-406). Baltimore, MD: Lippincott
Williams & Wilkins.
Stern, R., & Trahiotis, C. (1995). Models of binaural interaction. Handbook of Perception and
Cognition, 6, 347-386.
Strome, M. (1981). Down’s syndrome: A modern otorhinolaryngological perspective.
Laryngoscope, 91(10), 1581-1594.
Takashima, S., Becker, L., Armstrong, D., & Chan, F. (1981). Abnormal neuronal development
in the visual cortex of the human fetus and infant with Down's syndrome. A quantitative
and qualitative Golgi study. Brain Research, 225(1), 1-21.
Van Deun, L., Van Wieringen, A., Van den Bogaert, T., Scherf, F., Offeciers, F., Van de
Heyning, P. et al. (2009). Sound localization, sound lateralization, and binaural masking
level differences in young children with normal hearing. Ear and Hearing, 30(2), 178.
Verucci, L., Menghini, D., & Vicari, S. (2006). Reading skills and phonological awareness
acquisition in Down syndrome. Journal of Intellectual Disability Research, 50(7), 477-
491.
Wagner, S., Ganiban, J., & Cicchetti, D. (1990). Attention, memory, and perception in infants
with Down syndrome: A review and commentary. Children with Down syndrome: A
Developmental Perspective, 147-179.
Webster, F. (1951). The influence of interaural phase on masked thresholds I. The Role of
interaural time deviation. Journal of the Acoustical Society of America, 23, 452.
Weis, S., Weber, G., Neuhold, A., & Rett, A. (1991). Down syndrome: MR quantification of
brain structures and comparison with normal subjects. American Journal of
Neuroradiology, 12(6), 1207-1211.

82
Wenzel, E., Arruda, M., Kistler, D., & Wightman, F. (1993). Localization using
nonindividualized head-related transfer function. Journal of the Acoustical Society of
America, 94(1), 111-123.
Werner, L., Mancl, L., & Folsom, R. (1996). Preliminary observations on the development of
auditory sensitivity in infants with Down syndrome. Ear and Hearing, 17(6), 455.
Whightman, F., Prudence, A., Dolan, T., Kistler, D., & Jamieson, D. (1989). Temporal resolution
in children. Child Development, 60(3), 611-624.
Wilmington, D., Gray, L., & Jahrsdorfer, R. (1994). Binaural processing after corrected
congenital unilateral conductive hearing loss. Hearing Research, 74, 99-114.
Wilson, W., Folsom, R., & Widen, J. (1983). Hearing impairment in Down's syndrome children.
In G. Mencher & S. Gerber (Eds.), The Multiply Handicapped Hearing Impaired Child
(pp. 259-299). New York: Grune & Stratton.
Wisniewski, K. (1990). Down syndrome children often have brain with maturation delay,
retardation of growth, and cortical dysgenesis. American Journal of Medical Genetics, 7,
274-281.
Wisniewski, K., Laure-Kamionowska, M., & Wisniewski, H. (1984). Evidence of arrest of
neurogenesis and synaptogenesis in brains of patients with Down's syndrome. New
England Journal of Medicine, 311(18), 1187-1188.
Yoder, P., Camarata, S., Camarata, M., & Williams, S. (2006). Association between
differentiated processing of syllables and comprehension of grammatical morphology in
children with Down syndrome. American Journal on Mental Retardation, 111(2), 138-
152.
Zelazo, P., & Stack, D. (1997). Attention and information processing in infants with Down
syndrome. In J. Burack & J. Enns (Eds.), Attention, development, and psychopathology
(pp. 123-144). New York, NY: The Guilford Press.