sources of finance, sue snyman and paul eagles
TRANSCRIPT

Sources of finance
31 May 2017Block 7Facilitators: Dr Sue Snyman & Prof Paul Eagles
Image©stevepbviaPixabay

• Understanding financing• Portfolio of revenue streams
• Unique selling points (USPs)• Sound, financially viable business
Financing tourism concessions
Image©geraltviaPixabay
Investors questions
• Will the business be viable?
• Is the sponsor credible?
• What collateral is available?
• Is this project profitable enough for us to take the risk?
Image©3dman_euviaPixabay
Choosing the right investor
ü Identify appropriate investorsü Sources: internet, local contacts
in tourism and development, tourism information offices
ü Similar values and goals as the PA
ü Track record in sustainable tourism and commercial success
Image©3dman_euviaPixabay
Background• In wealthy countries, parks are often managed by
government agencies and rely on government funding.• In poorer countries, parks rely heavily on tourism fees
and charges to finance park management• In 2008, the average percentage of state park budgets
in the USA covered by user fees was 42%. • In 2011, California State Parks closed 70 of its 278
parks in order to deal with a $33 million reduction in government funds from the state.
• In 2018, Ontario Provincial Parks was 90% funded by tourism fees.
Park Finance• Most income for management comes
three sources: 1. Government tax revenue;2. Tourist fees and charges, either directly to the
park or through concessionaire payments; and,
3. Donations.

Insourcing Examples• In Ontario, several major agencies are funded
entirely or mostly by tourist fees and charges:– Niagara Parks Commission (Niagara Falls) (110%)– Ontario Conservation Authority Parks (Watershed
Management) (100%)– Ontario Provincial Parks (90%)
Balance of Taxes and Tourism
Taxes
Tourism

Background to Ontario Parks• The finance for park management in many
jurisdictions is moving from government grants to tourism fees and charges.
• In 1995, Ontario Parks received permission from government to move to tourism funding.
• This presentation describes the financial implications of this change.
• This is based on an analysis of the yearly income spreadsheets from 1995 to 2012.
Policy Changes• The policy changes in 1995 enabled
Ontario Parks to:– Retain all income in a special purpose
account.– Retain all income over the end of the fiscal
year.
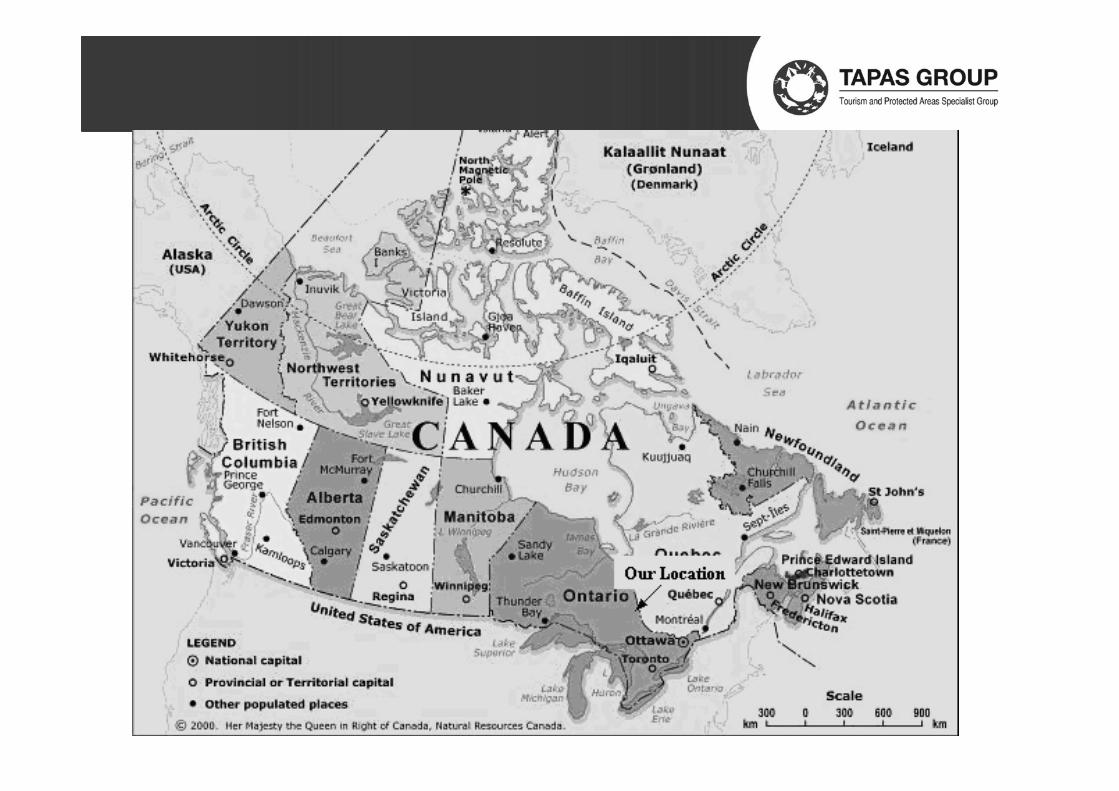

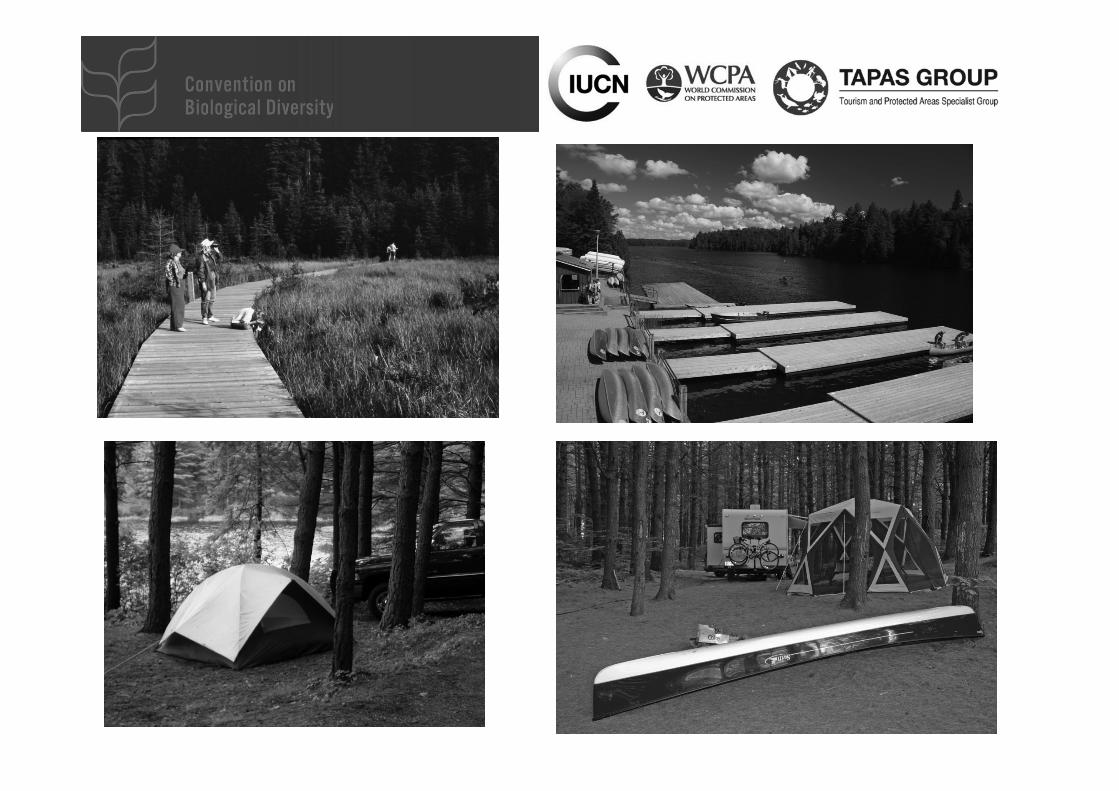
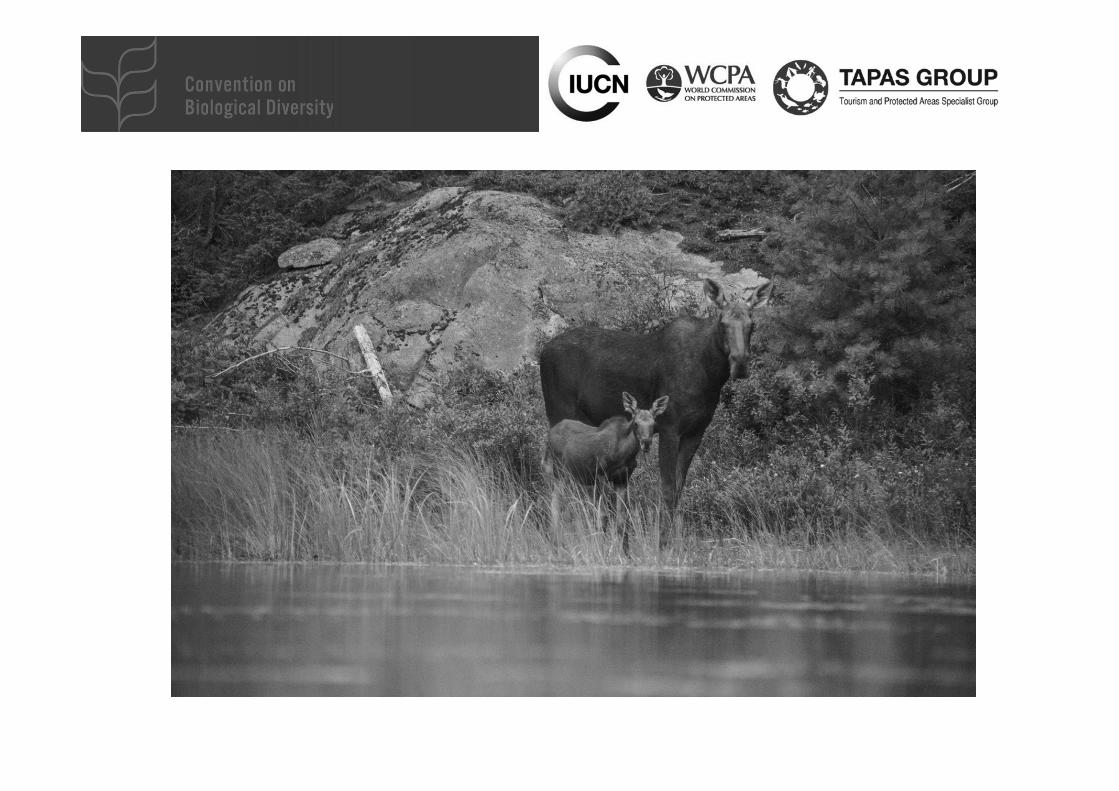
Ontario Parks• Ontario has the oldest and second-largest provincial
park system in Canada, starting with the establishment of Algonquin National Park in 1893.
• By 2011, the Ontario system contained 630 provincial of Algonquin National Park in 1893.
• By 2011, the Ontario system contained 630 provincial parks and conservation reserves covering an area of 9.5 million hectares, or about 9% of the province.• This area is larger than all US state parks combined.• 110 operating parks with recreation services.

Tourism Volumes 1985 to 2016
-
2,000,000
4,000,000
6,000,000
8,000,000
10,000,000
12,000,000
1 2 3 4 5 6 7 8 9 10 11 12 13 14 15 16 17 18 19 20 21 22 23 24 25 26 27 28 29 30 31 32
VisitorDays
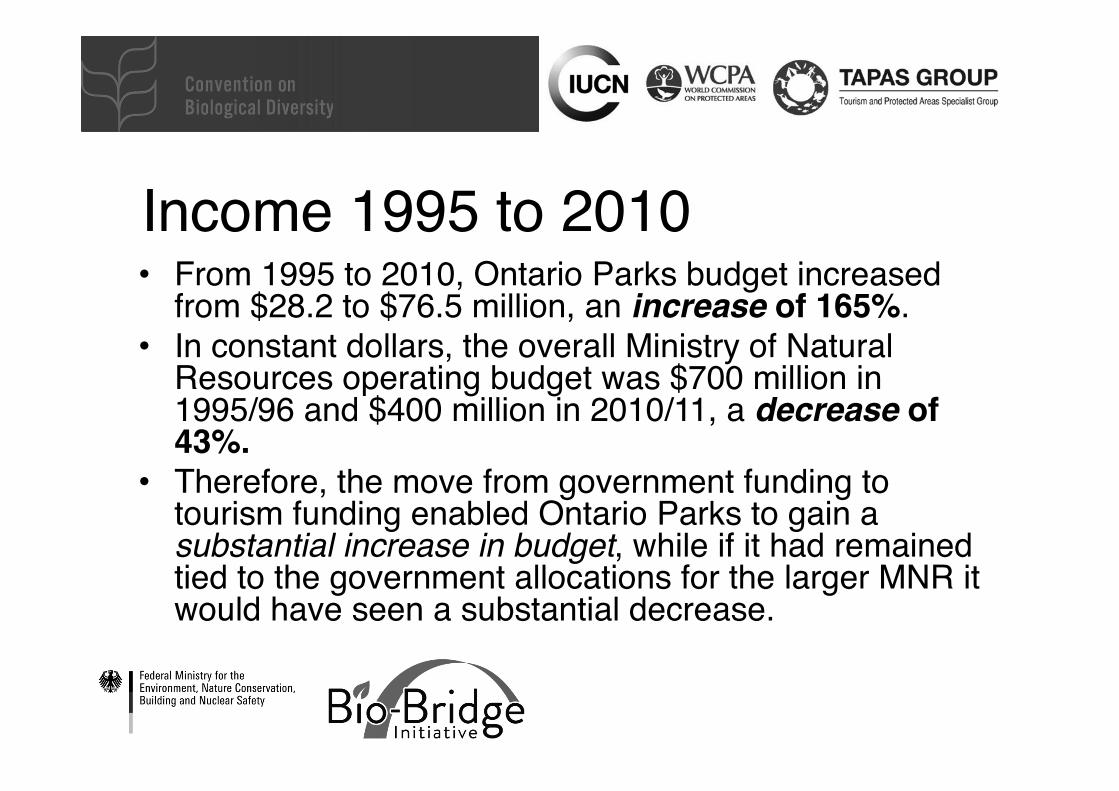
Income 1995 to 2010• From 1995 to 2010, Ontario Parks budget increased
from $28.2 to $76.5 million, an increase of 165%. • In constant dollars, the overall Ministry of Natural
Resources operating budget was $700 million in 1995/96 and $400 million in 2010/11, a decrease of 43%.
• Therefore, the move from government funding to tourism funding enabled Ontario Parks to gain a substantial increase in budget, while if it had remained tied to the government allocations for the larger MNR it would have seen a substantial decrease.

Tourism Income• In 1994, about 36% of the budget was earned by
park fees, but these were placed into central government coffers.
• In 2012, 88% of the budget was earned by park fees, and all of these were retained in the park agency special purpose account.
• In 2015, 90% cost recovery from tourism fees• Therefore, the income coming from tourism fees
and charges increased from 36% to 90% of the budget.

1 2 3 4 5 6 7 8 9 10 11 12 13 14 15 16 17Series1 1995 1996 1997 1998 1999 2000 2001 2002 2003 2004 2005 2006 2007 2008 2009 2010 2011
Series2 $18,181$20,686$26,141$31,502$40,413$37,355$43,224$45,198$46,244$47,742$57,158$53,521$62,456$64,856$64,793$64,793$64,979
Series3 8,607, 8,005, 8,339, 9,228,79,415,18,869,810,140,10,493,10,183,9,754,310,517,10,096,10,377,9,537,69,447,59,505,49,595,0
$18,181,527$20,686,061
$26,141,371
$31,502,377
$40,413,891$37,355,497
$43,224,735$45,198,955
$46,244,306
$47,742,199
$57,158,758$53,521,881
$62,456,115
$64,856,992
$64,793,877
$64,793,877
$64,979,103
$0.00
$10,000,000.00
$20,000,000.00
$30,000,000.00
$40,000,000.00
$50,000,000.00
$60,000,000.00
$70,000,000.00
Dollars
OntarioParks'TourismIncome

Ontario Parks’ Return per Visitor Day (1995 – 2011)
$2.11$2.58
$3.13$3.41
$4.29
$4.21
$4.26
$4.31$4.54
$4.89
$5.43
$5.30
$6.02
$6.80 $6.86 $6.82 $6.77
$0.00
$1.00
$2.00
$3.00
$4.00
$5.00
$6.00
$7.00
$8.00
1 2 3 4 5 6 7 8 9 10 11 12 13 14 15 16 17
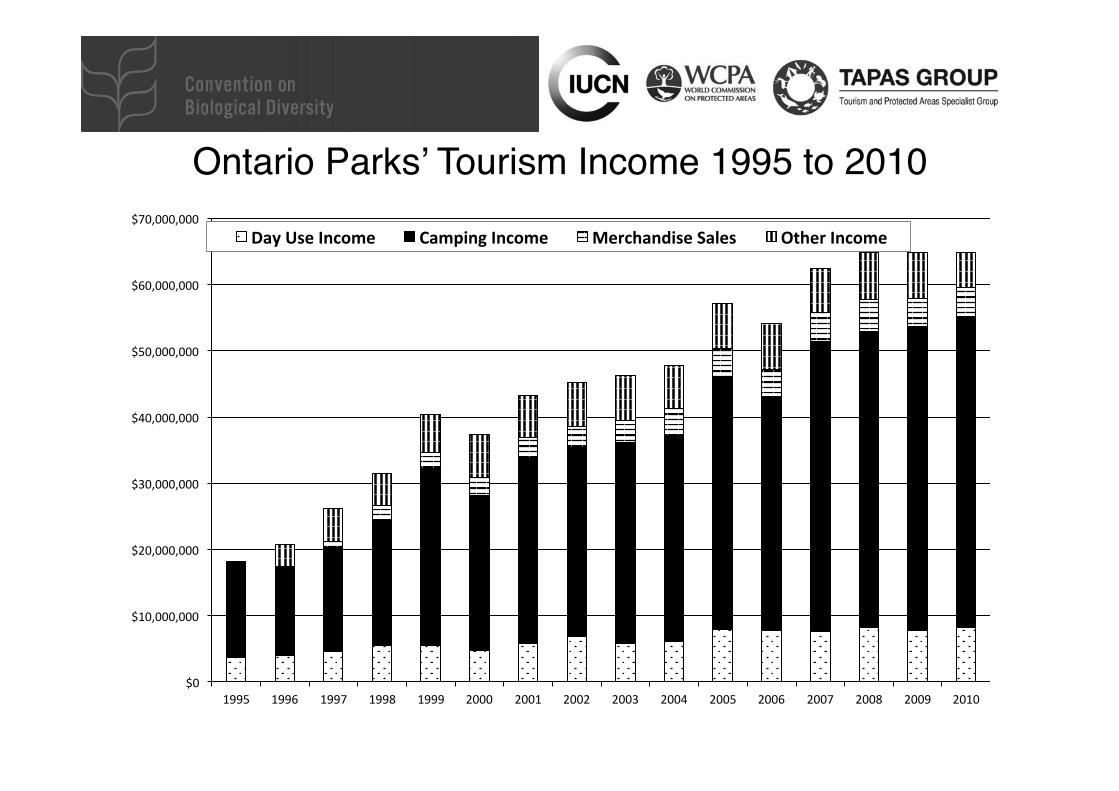
Ontario Parks’ Tourism Income 1995 to 2010
$0
$10,000,000
$20,000,000
$30,000,000
$40,000,000
$50,000,000
$60,000,000
$70,000,000
1995 1996 1997 1998 1999 2000 2001 2002 2003 2004 2005 2006 2007 2008 2009 2010
DayUseIncome CampingIncome MerchandiseSales OtherIncome
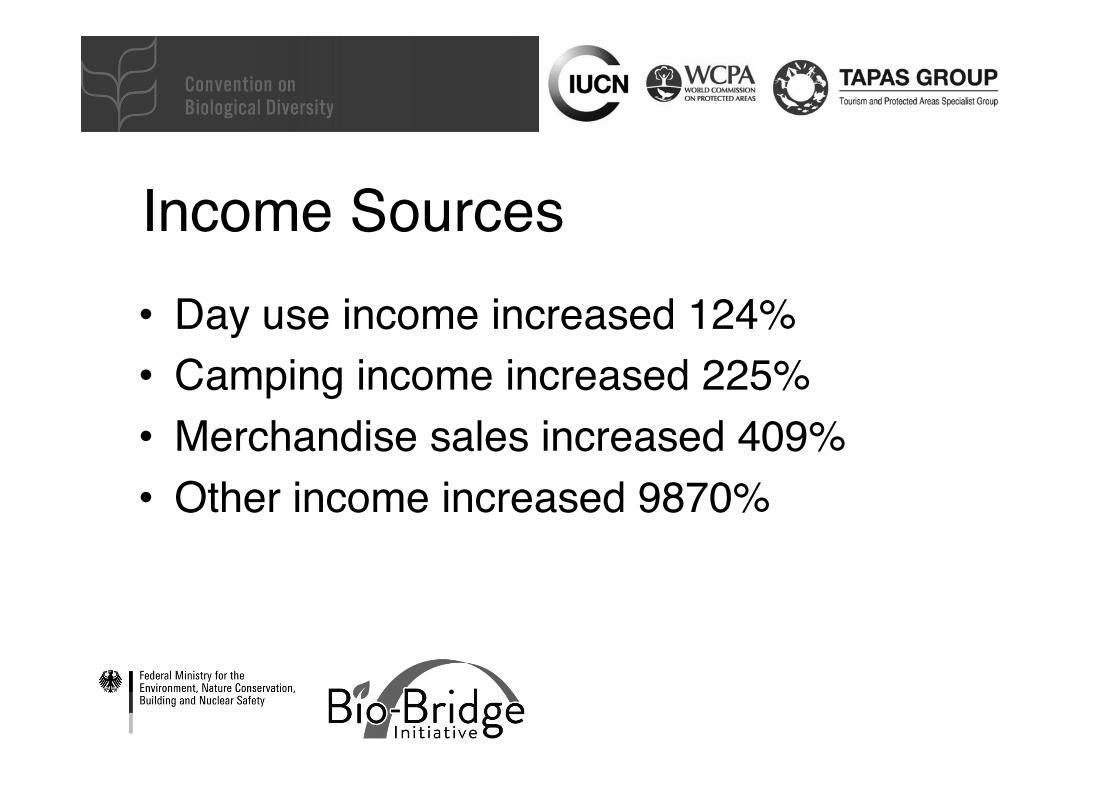
Income Sources• Day use income increased 124%• Camping income increased 225%• Merchandise sales increased 409% • Other income increased 9870%

Ontario Parks’ Fee Changes 1995 to 2010
$0.00
$20.00
$40.00
$60.00
$80.00
$100.00
$120.00
Campsitewithelectricity
CampsitewithoutelecKcity
DailyVehiclePermit
Minimum
DailyVehiclePermit
Maximum
CommericalBusPermit
1995 2010

Campsites• Campsites differentiated into three levels: premium, middle
and low.• Within each level there are subcategories according to:
– electricity on site, – seniors’ discounts, and – discounts for people with disabilities.
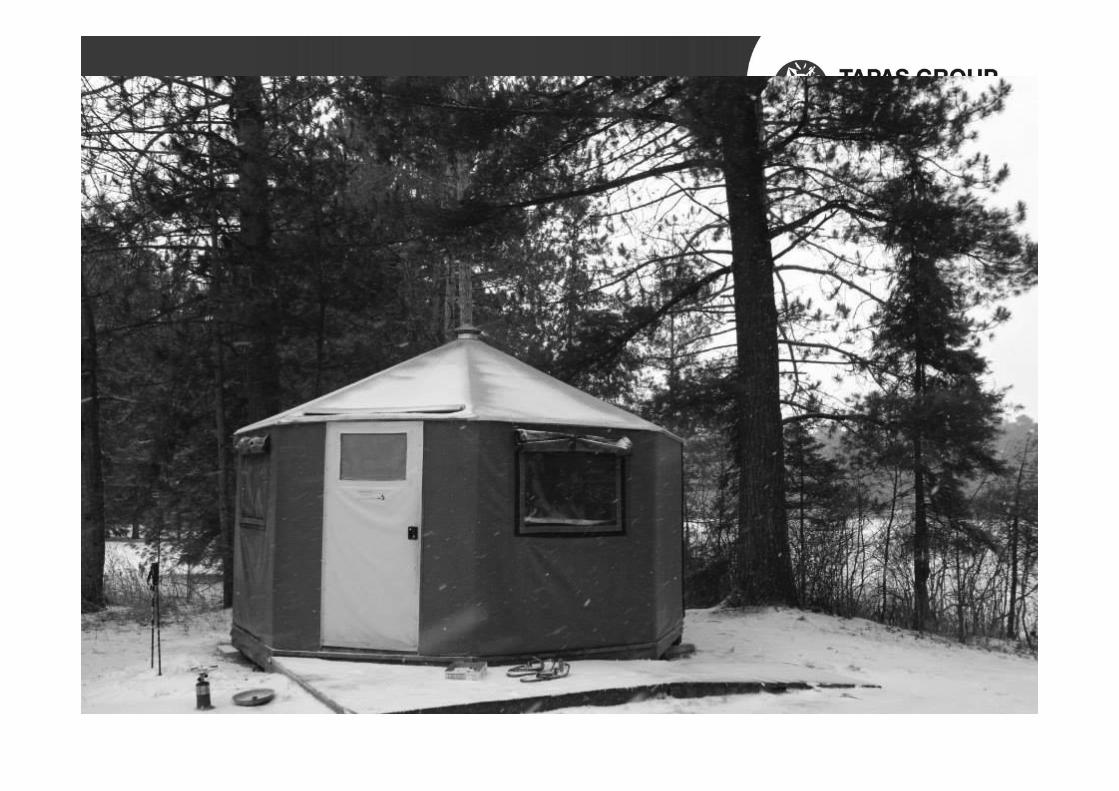
• Yurts (permanent tents) introduced into 11 parks.• Rustic cabins introduced in 4 parks, cottages in 4.• New campgrounds built in 4 parks.• Internet campsite booking introduced.
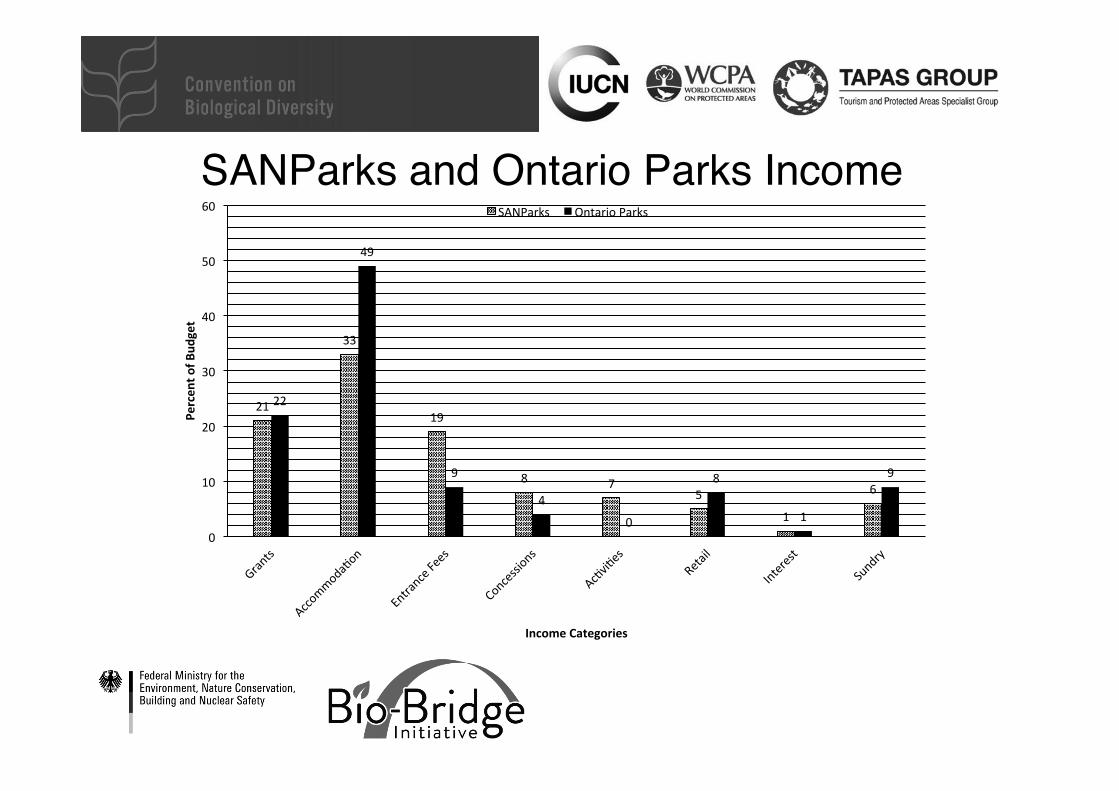
SANParks and Ontario Parks Income
21
33
19
8 75
1
6
22
49
9
4
0
8
1
9
0
10
20
30
40
50
60Pe
rcen
tofB
udget
IncomeCategories
SANParks OntarioParks
SANParks and Ontario Parks• A comparison with South Africa National
Parks, who underwent a similar transformation from government to tourism funding in a similar time period, revealed that the top three income sources for both park systems are, in order:– 1) accommodation; – 2) government grants; and, – 3) entrance fees.

Conclusions.1. Is the government grant level reduced when
tourism funding increases?Yes, the government grant was reduced from $28.8 million in 1994 to 10.6 million in 1995, a drop of 63%.
2. Do the park fees increase and how much?
• Campsite with electricity fees up 152%• Campsite without electricity fees up 166%• Daily use fees, up 79% in low use periods & 221% in
high use periods• Commercial bus permit increased 207%
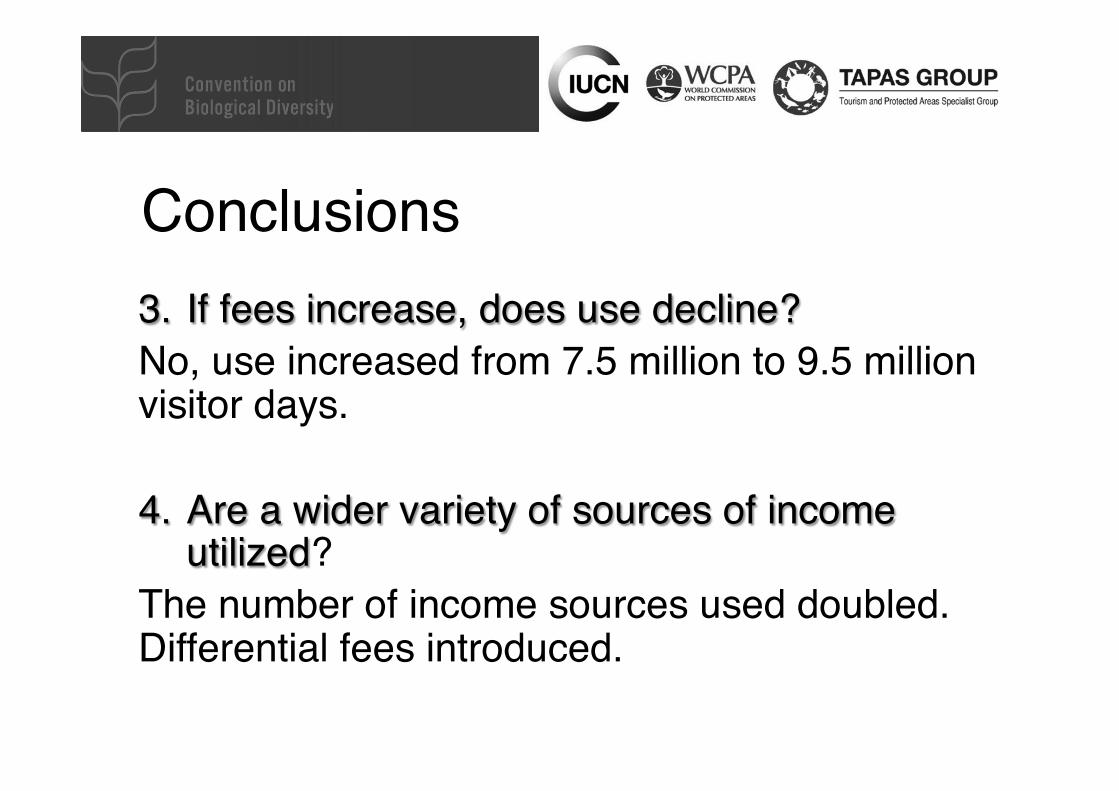
Conclusions3. If fees increase, does use decline?No, use increased from 7.5 million to 9.5 million visitor days.
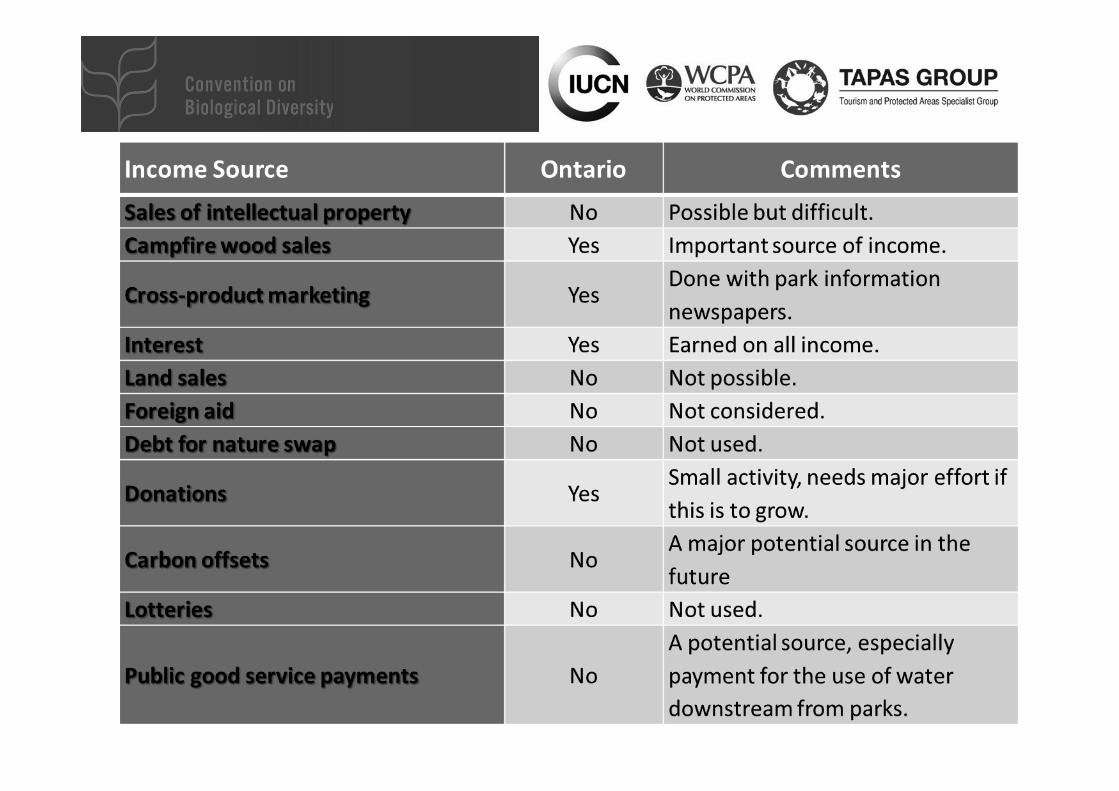
4. Are a wider variety of sources of income utilized?
The number of income sources used doubled. Differential fees introduced.
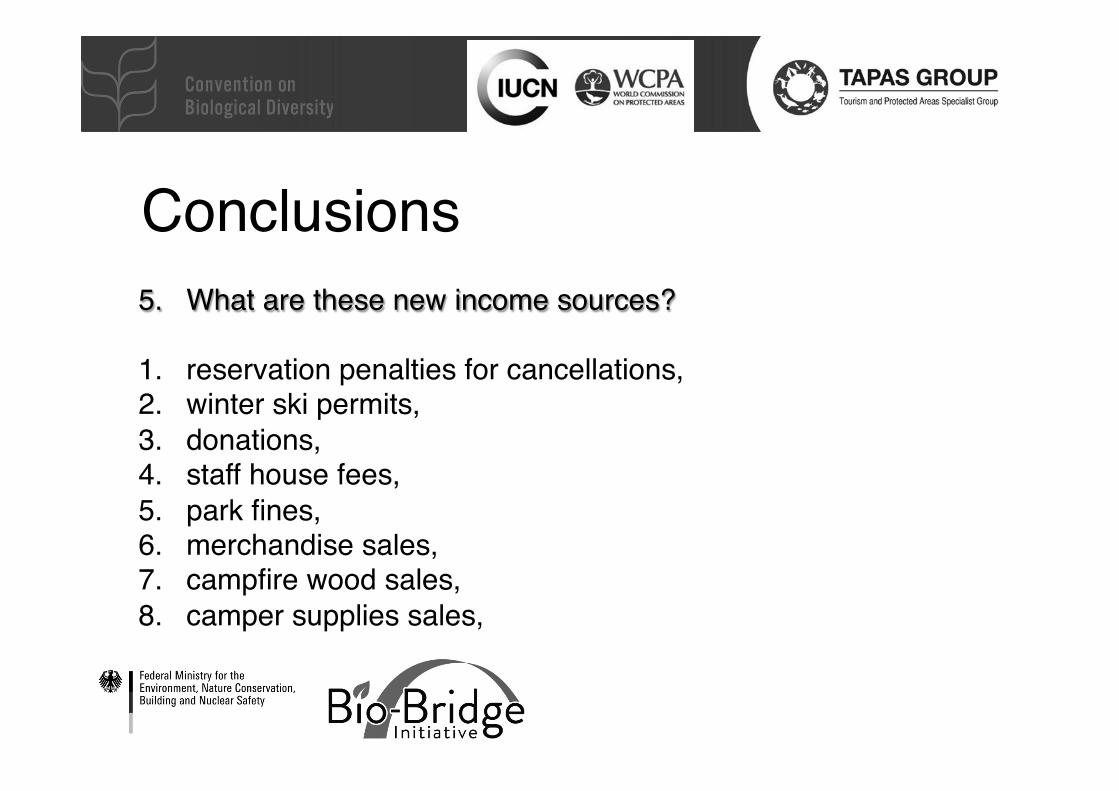
Conclusions5. What are these new income sources?
1. reservation penalties for cancellations, 2. winter ski permits, 3. donations, 4. staff house fees, 5. park fines, 6. merchandise sales, 7. campfire wood sales, 8. camper supplies sales,

Conclusions5. What are these new income sources?
9. recreation equipment rentals, 10. sales of cold beverages, 11. winter storage fees for recreation vehicles, 12. parking fees, 13. annual vehicle permits.
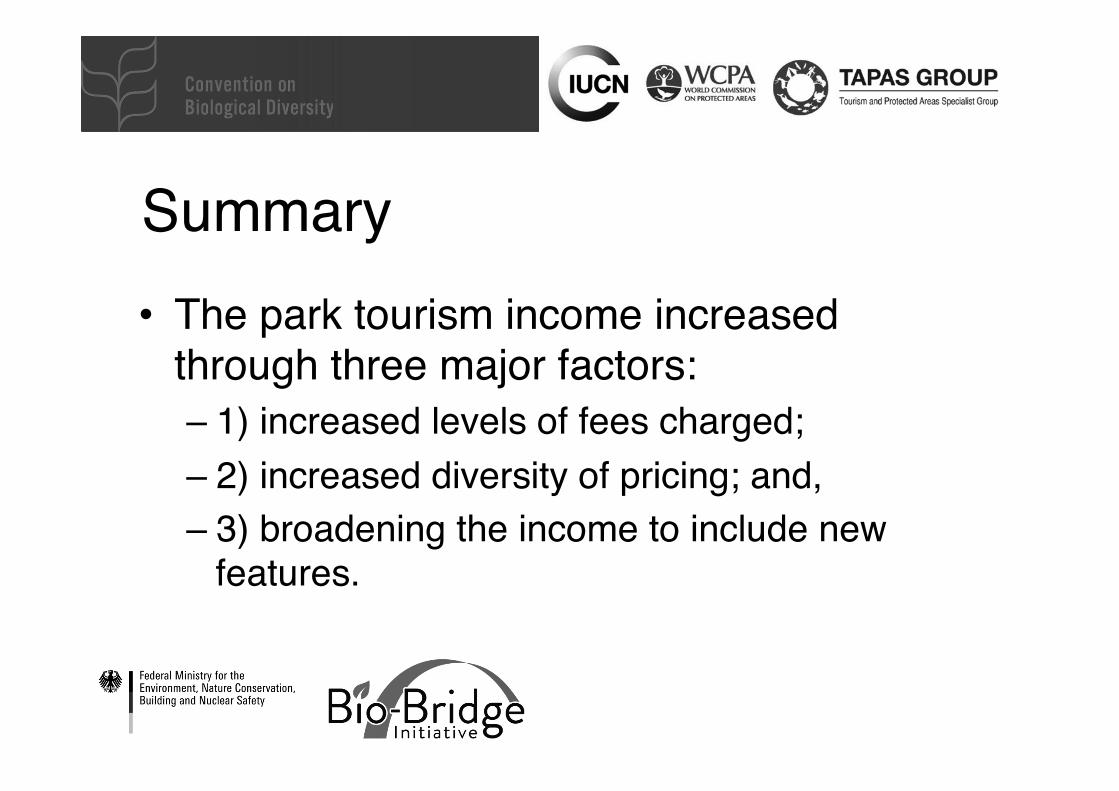
Summary• The park tourism income increased
through three major factors: – 1) increased levels of fees charged; – 2) increased diversity of pricing; and, – 3) broadening the income to include new
features.

Use of NGOs• Non-government bodies (Friends Groups)
became more prominent in delivering education, festivals, information delivery, recreation, and occasionally food delivery and transit.
• Several parks are entirely operated by NGOs.• Decreasing use of concessionaires, and
replacement by park staff and NGOs.
Reference and Reading• Eagles, Paul F. J. 2014. Fiscal Implications of
Moving to Tourism Finance for Parks: Ontario Provincial Parks. Managing Leisure 19(1): 16-27.
• Eagles, Paul F. J., Julia Coburn and Bobbie Swartman. 2014. Plan Quality and Plan Detail of Visitor and Tourism Policies in Ontario Park Management Plans. Journal of Outdoor Recreation and Tourism DOI: 10.1016/j.jort.2014.09.006

• Current sources of financing in your PAs
• Pros and cons of each source
Discussion session 1
Discussion session 2
Group One: Financing options for investorsGroup Two: Financing options for PAs
• Choosing the right investors• What is needed to attract investors
Summary of the financing process