source of the 6 february 2013 mw d8.0 santa cruz islands
TRANSCRIPT

Nat. Hazards Earth Syst. Sci., 15, 1371–1379, 2015
www.nat-hazards-earth-syst-sci.net/15/1371/2015/
doi:10.5194/nhess-15-1371-2015
© Author(s) 2015. CC Attribution 3.0 License.
Source of the 6 February 2013 Mw = 8.0
Santa Cruz Islands Tsunami
F. Romano1, I. Molinari1,2, S. Lorito1, and A. Piatanesi1
1Istituto Nazionale di Geofisica e Vulcanologia, Via di Vigna Murata 605, 00143 Rome, Italy2Institute of Geophysics – Swiss Federal Institute of Technology, ETH, Zurich, Switzerland
Correspondence to: F. Romano ([email protected])
Received: 27 February 2015 – Published in Nat. Hazards Earth Syst. Sci. Discuss.: 16 March 2015
Accepted: 06 June 2015 – Published: 26 June 2015
Abstract. On 6 February 2013 an Mw = 8.0 subduction
earthquake occurred close to Santa Cruz Islands at the transi-
tion between the Solomon and the New Hebrides Trench. The
ensuing tsunami caused significant inundation on the closest
Nendo Island. The seismic source was studied with teleseis-
mic broadband P-wave inversion optimized with tsunami for-
ward modelling at DART buoys (Lay et al., 2013) and with
inversion of teleseismic body and surface waves (Hayes et
al., 2014a). The two studies also use different hypocentres
and different planar fault models and found quite different
slip models. In particular, Hayes et al. (2014a) argued for
an aseismic slip patch SE from the hypocentre. We here de-
velop a 3-D model of the fault surface from seismicity anal-
ysis and retrieve the tsunami source by inverting DART and
tide-gauge data. Our tsunami source model features a main
slip patch (peak value of ∼ 11 m) SE of the hypocentre and
reaching the trench. The rake direction is consistent with
the progressively more oblique plate convergence towards
the Solomon trench. The tsunami source partially overlaps
the hypothesized aseismic slip area, which then might have
slipped coseismically.
1 Introduction
On 6 February 2013 an Mw= 8.0 earthquake occurred in the
Pacific Ocean nearby the archipelago of Santa Cruz Islands.
The hypocentre (165.138◦ E, 10.738◦ S, depth ∼ 29 km;
USGS, http://earthquake.usgs.gov/earthquakes/eqarchives/
poster/2013/20130205.php) is located at the subduction
interface between the Australia and the Pacific plates, 76 km
west of Lata, the main city of Nendo Island (Figs. 1 and 2).
This earthquake, the largest in 2013, occurred on a com-
plex section of the Australia–Pacific plate boundary at the
northern end of the New Hebrides Trench (Hayes et al.,
2012), near a short segment of dominantly strike-slip plate
motion that marks the transition between Vanuatu and the
Solomon Islands subduction zones. This segment is charac-
terized by a complex tectonic regime that becomes progres-
sively more oblique westward as revealed by the focal mech-
anisms of the local seismicity (Fig. 1). In this region the rel-
ative convergence velocity between the Australia and Pacific
plates is ∼ 9.4 cm yr−1 (DeMets et al., 2010).
The Santa Cruz Islands earthquake generated a tsunami
that struck Nendo Island, in particular the city of Lata, with
waves higher than 1 m. Several run-up and flow depth mea-
surements have been collected during a field survey con-
ducted on some islands of the archipelago a few days af-
ter the earthquake (Fritz et al., 2014), reporting maximum
tsunami wave heights of about 11 m in the western part of
Nendo Island. In addition, the tsunami propagated in the Pa-
cific Ocean, also reaching the coasts of Hawaii (Lay et al.,
2013).
Seismic and tsunami source of this earthquake have been
previously studied with different methodologies (Lay et al.,
2013; Hayes et al., 2014a), highlighting some differences be-
tween the resulting models in terms of both slip patch po-
sitions and slip amplitude. Hayes et al. (2014a) studied the
Santa Cruz Islands earthquake by inverting teleseismic body
and surface waves; Lay et al. (2013) performed a teleseis-
mic broadband P-wave inversion optimized with tsunami for-
ward modelling at DART buoys. These studies used different
hypocentres and different planar fault models; in particular,
Lay et al. (2013) adopted a shallower hypocentre and fault
Published by Copernicus Publications on behalf of the European Geosciences Union.

1372 F. Romano et al.: Source of the 6 February 2013 Mw= 8.0 Santa Cruz Islands Tsunami
160˚ 162˚ 164˚ 166˚ 168˚−14˚
−12˚
−10˚
−8˚
0 50 100
km
9.4 cm/yr9.4 cm/yr
Longitude
Latit
ud
e
Pacific Plate
Australia Plate
Solomon Trench
Ne
w H
eb
ride
s Tren
ch
−600
−500
−400
−300
−200
−100
0
SlabDepth (km)Mw 8.0
February 06, 2013
Figure 1. Location map of the 2013 Santa Cruz Islands earthquake.
Red star and red beach ball indicate epicentre and focal mechanism
of the mainshock respectively. Green and blue beach balls indicate
the focal mechanisms of the largest strike-slip (Mw= 7.0) and nor-
mal (Mw= 7.1) aftershocks occurred a few hours after the main-
shock. Orange beach balls indicate the regional historical seismic-
ity (from 1976 to present; GCMT catalogue, http://www.globalcmt.
org/CMTsearch.html) and the corresponding focal mechanisms for
earthquake magnitude 6+. White arrows indicate the convergence
direction of the Australia Plate.
plane than those used by Hayes et al. (2014a). The best-fitting
source model in Hayes et al. (2014a, hereinafter HA14) has
a main patch of slip centred around the hypocentre with a
maximum slip of about 4 m and a second smaller patch lo-
cated SE of Nendo Island and characterized by relatively low
slip (∼ 0.5 m). The source model in Lay et al. (2013, here-
inafter LA13) features two patches with slip larger than 10 m:
the first patch is located around the hypocentre, whereas the
second one is shallower and located SE of the hypocentre.
The surface projection of the slip in LA13 is roughly consis-
tent with the HA14 patches even though they are at different
depths (and featuring quite different slip values) because of
the different fault planes used. In addition, the LA13 source
model is more efficient in terms of tsunami wave excitation
than that of HA14 and predicts quite well the tsunami obser-
vations recorded at the DART buoys.
The usual pattern of the aftershocks distribution following
a great subduction earthquake should show a large number of
events occurring along the unbroken portion of the subduc-
tion interface, eventually also bordering the broken asperi-
ties (Aki, 1979). As already extensively discussed (Hayes
et al., 2014a; Lay et al., 2013), after the 6 February 2013
event very few events were located along the subduction in-
terface. Furthermore, most of early aftershocks in the epicen-
tral area (∼ 200 events within 48 h from the mainshock, http:
//earthquake.usgs.gov/earthquakes/?source=sitenav) showed
strike-slip and normal mechanism, including two earth-
quakes with Mw > 7 that occurred in the upper crust por-
tion of the Pacific plate and in the outer-rise trench region.
HA14 proposed a block-like motion behaviour of the Pacific
upper plate to explain these observations. In particular, they
argued that a large number of anomalous right-lateral strike-
slip events located south-east of Nendo Island were triggered
by significant aseismic slip along a portion of the megath-
rust south-eastward from the epicentral area. However, LA13
model features significant coseismic slip on this portion of
the fault; these differences may be due to the different data
used and/or to the different fault models adopted in the inver-
sions.
Here we study the coseismic tsunami source of the Santa
Cruz Islands earthquake by inverting the available tsunami
waveforms. We compute Green’s functions at the DART
buoys and tide gauges using a 3-D fault model that honours
the complex geometry of the subduction interface. After re-
trieving the tsunami source model, we discuss it in compari-
son with LA13 and HA14 source models.
2 Tsunami data and fault model
The tsunami generated by the Santa Cruz Islands earthquake
propagated both in the North and South Pacific oceans and
was observed in the open sea at several DART buoys and
at some tide gauges located along the coasts of Solomon
and Fiji islands. We select five DART buoys (52403, 52406,
51425, 55012, and 55023; http://www.ndbc.noaa.gov/dart.
shtml) and three tide gauges (Lata Wharf, Honiara, and Lau-
toka, http://www.ioc-sealevelmonitoring.org) that distinctly
recorded a tsunami signal and that allow a good azimuthal
coverage (Fig. 2, further details in the Supplement). Before
using the tsunami data in the inversion, we remove the tide
from the original signals by using a robust LOWESS proce-
dure (Barbosa et al., 2004).
The fault model geometry can greatly influence the results
of source inversion. Adopting a fault geometry that honours
the complexities of the subduction interface then may help to
reduce the epistemic uncertainties associated with forward
modelling (Romano et al., 2014). This is particularly true for
earthquakes of this size occurring in subduction zones char-
acterized by strong variations of strike and/or dip (e.g. Hayes
et al., 2014b), even more so in complex tectonic environ-
ments like the Santa Cruz Islands region.
Thus, by analysing the aftershocks distribution after the
6 February mainshock, the local seismicity, and the rup-
ture area expected for a M8 event, we built a 3-D non-
planar fault model with variable strike and dip angles in or-
der to account for such geometrical complexities of the sub-
duction interface on both the New Hebrides and Solomon
trenches (Bird, 2003). In particular, we selected from the
EHB global relocation earthquake catalogue (http://www.isc.
ac.uk/ehbbulletin/; Engdahl et al., 1998) the events that oc-
curred in the area covered by the aftershocks of the Santa
Cruz Islands earthquake and having M > 4.5. After removing
those relatively distant from the trench (distance > 200 km),
we drew sections perpendicular to the trench at a distance
of ∼ 20 km each (measured along the trench), projecting on
Nat. Hazards Earth Syst. Sci., 15, 1371–1379, 2015 www.nat-hazards-earth-syst-sci.net/15/1371/2015/

F. Romano et al.: Source of the 6 February 2013 Mw= 8.0 Santa Cruz Islands Tsunami 1373
163˚ 164˚ 165˚ 166˚ 167˚
150˚ 160˚ 170˚ 180˚
−20˚
−10˚
0˚
0 500
km
Longitude
Latit
ud
eD52403
D55012D55023
Lata Wharf
Lautoka
Honiara
−11˚
−10˚
Nendo
Longitude
Solomon Trench
D52406
D51425
Figure 2. Data and fault model. Green triangles indicate DART buoys and tide gauges used in this study. The top-right panel is a close-up
view of the fault model adopted. Red star indicates the Santa Cruz Islands earthquake epicentre.
them all the events in a neighbourhood of 30 km. We ob-
tained several 2-D profiles by fitting the data of each section.
The resulting suite of 2-D profiles was then further interpo-
lated using CUBIT software (http://cubit.sandia.gov) in or-
der to obtain a 3-D fault model, meshed into 45 quadrangular
patches (9 along strike and 5 along dip; Figs. 2, S1, and S2 in
the Supplement) with an average size of about 20× 20 km.
Our final fault model is consistent with the northern inter-
face of Vanuatu slab model in Slab1.0 (Hayes et al., 2012,
http://earthquake.usgs.gov/data/slab/) and extends both up to
the trench and in the north-west direction for ∼ 40–60 km.
The dimensions of the resulting fault are ∼ 180 km along
strike and ∼ 90 km along dip (see Figs. 2, S1, and S2).
3 Green’s functions and inversion scheme
The tsunami Green’s functions are computed by means of
NEOWAVE, a nonlinear dispersive model for tsunami waves
propagation (Yamazaki et al., 2009, 2011). The initial condi-
tions for tsunami propagation are analytically computed (fur-
ther details in Meade, 2007; Romano et al., 2012) and they
also include the contribution of the coseismic horizontal de-
formation in the region of steep bathymetric slopes (Tanioka
and Satake, 1996).
For tsunami modelling at the DART buoys we use a bathy-
metric grid with a spatial resolution of 1 arcmin, whereas
the Green’s functions at the tide gauges are computed on
a grid of 30 arcsec in order to better model the nearshore
tsunami propagation. The bathymetric data set used for
tsunami simulations is SRTM30+ (http://topex.ucsd.edu/
WWWhtml/srtm30_plus.html), which is resampled for the
grid of 1 arcmin.
We solve the inverse problem by using the heat-bath al-
gorithm, which is a particular implementation of the sim-
ulated annealing technique (Rothman, 1986). For tsunami
waveforms we use a cost function that is sensitive both to
amplitude and phase matching (Spudich and Miller, 1990).
This approach and the a posteriori analysis of the explored
ensemble of models have been extensively tested and used
in previous works (detailed description of the method can be
found for example in Piatanesi and Lorito (2007), Lorito et
al. (2011), Romano et al. (2014), and references therein).
We make some a priori assumptions on ranges for slip and
rake: for each subfault the slip can vary from 0 to 15 m at
0.5 m steps, whereas the rake can vary from 40 to 100◦ at
5◦ steps on three large blocks (see Fig. S1). Furthermore, we
assume a circular rupture front that propagates with a rupture
velocity of 1.5 km s−1 (Lay et al., 2013).
In each inversion we retrieve the best fitting slip distribu-
tion model, the average model obtained by the ensemble of
models that fits the data fairly well, and the standard devia-
tions for each inferred model parameter (Table S3).
3.1 Checkerboard resolution test
We evaluate the resolving power of the inversion setup
(i.e. fault parameterization and instrumental azimuthal cover-
age) by means of a synthetic test. In particular, we attempt to
reproduce a slip distribution assuming a target checkerboard
pattern with slip values of 0 and 10 m on alternating sub-
faults (Fig. 3a). In addition, we set the target rake angle on
www.nat-hazards-earth-syst-sci.net/15/1371/2015/ Nat. Hazards Earth Syst. Sci., 15, 1371–1379, 2015
1374 F. Romano et al.: Source of the 6 February 2013 Mw= 8.0 Santa Cruz Islands Tsunami
164˚ 165˚ 166˚
−12˚
−11˚
−10˚
0 50
km
Longitude
Latit
ud
e
Target
a)
0
2
4
6
8
10
12Slip (m)
164˚ 165˚ 166˚
−12˚
−11˚
−10˚
0 50
km
Longitude
Inversion
b)
0
2
4
6
8
10
12Slip (m)
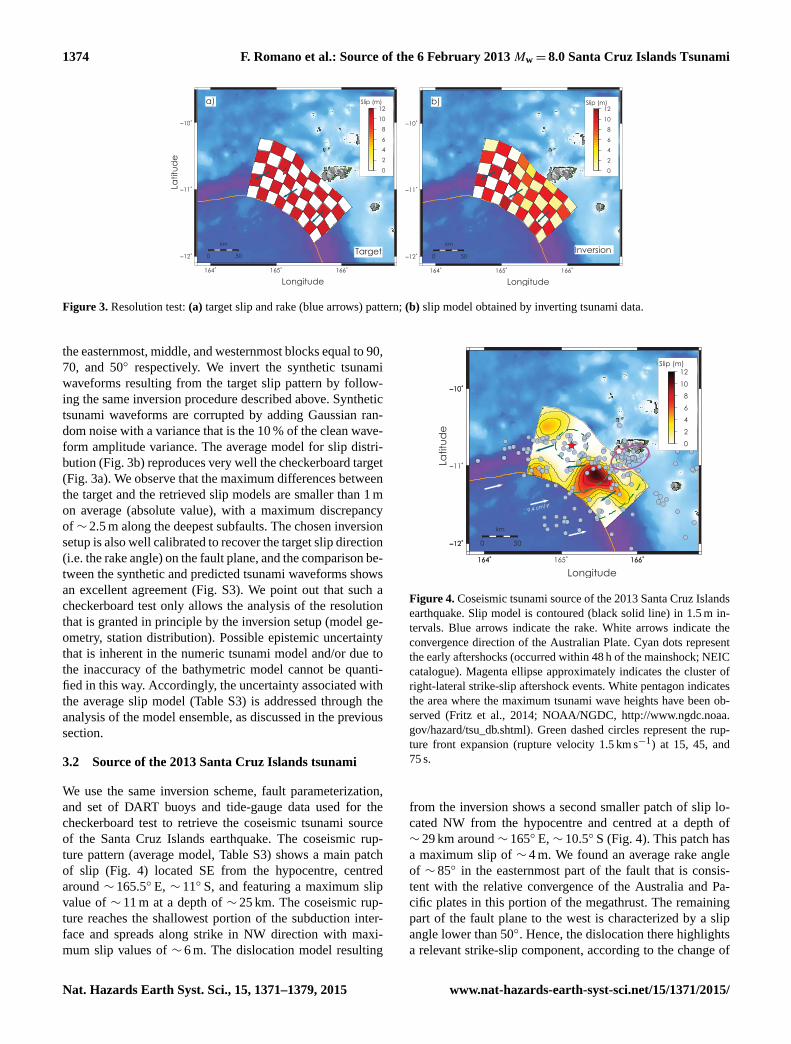
Figure 3. Resolution test: (a) target slip and rake (blue arrows) pattern; (b) slip model obtained by inverting tsunami data.
the easternmost, middle, and westernmost blocks equal to 90,
70, and 50◦ respectively. We invert the synthetic tsunami
waveforms resulting from the target slip pattern by follow-
ing the same inversion procedure described above. Synthetic
tsunami waveforms are corrupted by adding Gaussian ran-
dom noise with a variance that is the 10 % of the clean wave-
form amplitude variance. The average model for slip distri-
bution (Fig. 3b) reproduces very well the checkerboard target
(Fig. 3a). We observe that the maximum differences between
the target and the retrieved slip models are smaller than 1 m
on average (absolute value), with a maximum discrepancy
of ∼ 2.5 m along the deepest subfaults. The chosen inversion
setup is also well calibrated to recover the target slip direction
(i.e. the rake angle) on the fault plane, and the comparison be-
tween the synthetic and predicted tsunami waveforms shows
an excellent agreement (Fig. S3). We point out that such a
checkerboard test only allows the analysis of the resolution
that is granted in principle by the inversion setup (model ge-
ometry, station distribution). Possible epistemic uncertainty
that is inherent in the numeric tsunami model and/or due to
the inaccuracy of the bathymetric model cannot be quanti-
fied in this way. Accordingly, the uncertainty associated with
the average slip model (Table S3) is addressed through the
analysis of the model ensemble, as discussed in the previous
section.
3.2 Source of the 2013 Santa Cruz Islands tsunami
We use the same inversion scheme, fault parameterization,
and set of DART buoys and tide-gauge data used for the
checkerboard test to retrieve the coseismic tsunami source
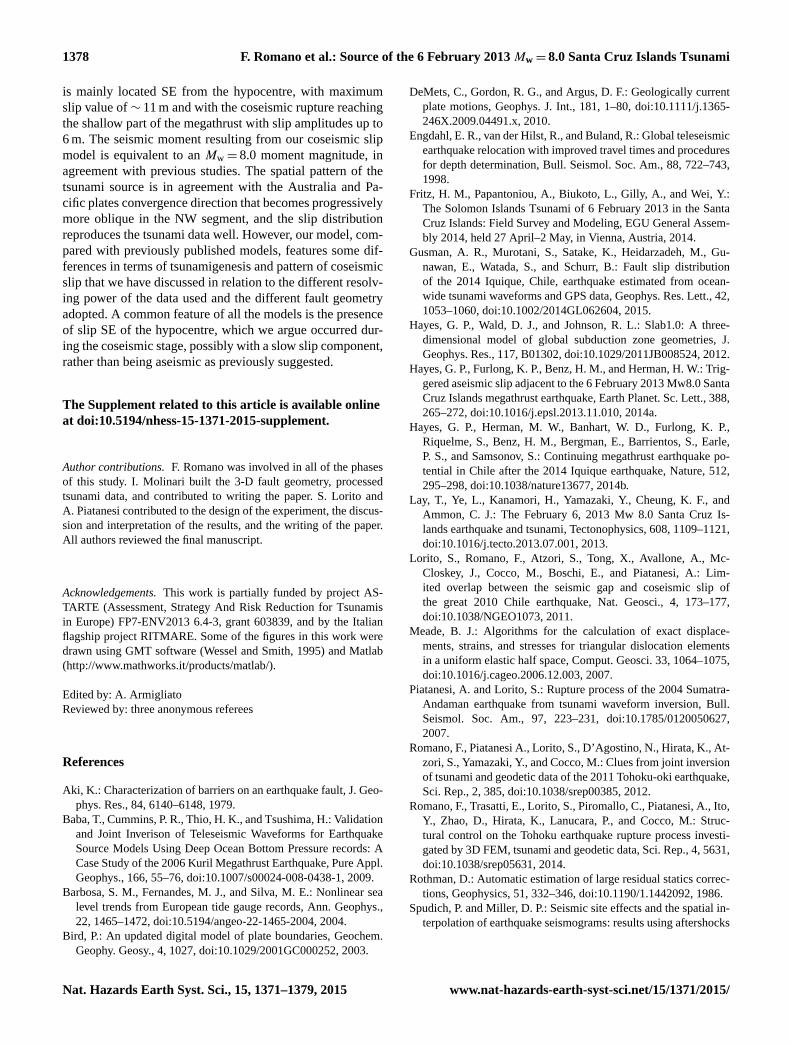
of the Santa Cruz Islands earthquake. The coseismic rup-
ture pattern (average model, Table S3) shows a main patch
of slip (Fig. 4) located SE from the hypocentre, centred
around ∼ 165.5◦ E, ∼ 11◦ S, and featuring a maximum slip
value of ∼ 11 m at a depth of ∼ 25 km. The coseismic rup-
ture reaches the shallowest portion of the subduction inter-
face and spreads along strike in NW direction with maxi-
mum slip values of ∼ 6 m. The dislocation model resulting
164˚ 166˚
−12˚
−10˚
164˚ 165˚ 166˚
−12˚
−11˚
−10˚
0 50
km
9.4 cm/yr
Longitude
Latit
ud
e0
2
4
6
8
10
12Slip (m)
Figure 4. Coseismic tsunami source of the 2013 Santa Cruz Islands
earthquake. Slip model is contoured (black solid line) in 1.5 m in-
tervals. Blue arrows indicate the rake. White arrows indicate the
convergence direction of the Australian Plate. Cyan dots represent
the early aftershocks (occurred within 48 h of the mainshock; NEIC
catalogue). Magenta ellipse approximately indicates the cluster of
right-lateral strike-slip aftershock events. White pentagon indicates
the area where the maximum tsunami wave heights have been ob-
served (Fritz et al., 2014; NOAA/NGDC, http://www.ngdc.noaa.
gov/hazard/tsu_db.shtml). Green dashed circles represent the rup-
ture front expansion (rupture velocity 1.5 km s−1) at 15, 45, and
75 s.
from the inversion shows a second smaller patch of slip lo-
cated NW from the hypocentre and centred at a depth of
∼ 29 km around ∼ 165◦ E, ∼ 10.5◦ S (Fig. 4). This patch has
a maximum slip of ∼ 4 m. We found an average rake angle
of ∼ 85◦ in the easternmost part of the fault that is consis-
tent with the relative convergence of the Australia and Pa-
cific plates in this portion of the megathrust. The remaining
part of the fault plane to the west is characterized by a slip
angle lower than 50◦. Hence, the dislocation there highlights
a relevant strike-slip component, according to the change of
Nat. Hazards Earth Syst. Sci., 15, 1371–1379, 2015 www.nat-hazards-earth-syst-sci.net/15/1371/2015/

F. Romano et al.: Source of the 6 February 2013 Mw= 8.0 Santa Cruz Islands Tsunami 1375
150 170 190 210 230 250−0.04
−0.02
0.00
0.02
0.04
D51425240 260 280 300 320 340
−0.02
−0.01
0.00
0.01
0.02
D5240330 50 70 90 110 130
−0.10
−0.05
0.00
0.05
0.10
D52406
60 80 100 120 140 160−0.30
−0.20
−0.10
0.00
0.10
0.20
0.30
D5501290 110 130 150 170 190
−0.08
−0.04
0.00
0.04
0.08
D5502350 70 90 110 130 150
−0.15
−0.10
−0.05
0.00
0.05
0.10
0.15
HONIARA
0 20 40 60 80 100−2.00−1.50−1.00−0.500.000.501.001.502.00
LATA WHARF160 180 200 220 240 260
−0.10
−0.05
0.00
0.05
0.10
LAUTOKA
Minutes after the Earthquake OT
Wa
ter H
eig
ht
(m)
Observed
Predicted
Figure 5. Data fit: comparison between observed (black) and predicted (red) tsunami data.
the tectonic regime in this region, from purely thrust to left-
lateral, as also shown by the regional seismicity. Figure 5
shows an overall good agreement between observed and pre-
dicted tsunami waveforms. During the inversion we applied
a time shift (+2 min) to Green’s functions of Lata Wharf
tide gauge due to the systematic anticipation of the predicted
tsunami waveform with respect to the observed signal. This
systematic difference between observed and predicted data
is likely due to the relatively low accuracy of the nearshore
bathymetry around this station. We also proved the validity
of the linearity assumption at the coastal tide gauges. The
tsunami signals predicted with the time-shifted and linearly
combined Green’s functions are compared to the tsunami sig-
nals produced with a single forward run forced by the aver-
age slip model (Fig. S4). This is in fair agreement with recent
results of Yue et al. (2015).
The total seismic moment associated with the slip distri-
bution resulting from the inversion, using a shear modulus
equal to 30 GPa, is M0= 1.033× 10²¹ Nm, that is equivalent
to a moment magnitude Mw= 8.0 and in agreement with the
estimations obtained from previous studies.
4 Discussion
4.1 Comparison with previous Santa Cruz Islands
earthquake source models
In principle, teleseismic data constrain the earthquake seis-
mic moment and the seismic rupture history well, and, com-
pared to tsunami data, they are less sensitive to the spatial
details of the slip distribution (e.g. Yue, 2014; Gusman et
al., 2015). Moreover, adopting different fault geometries (and
hypocentres) may result in different earthquake slip distribu-
tions (e.g. Baba et al., 2009; Hayes et al., 2014b).
The comparison among the present model, LA13, and
HA14 shows some differences in terms of tsunami source
that may be ascribed to the different data and fault model
used in the inversions.
The slip model in this study, LA13, and HA14 models
have been obtained using three different fault geometries
(Fig. 6). Indeed, both LA13 and HA14 use a planar fault,
whereas we adopt a 3-D fault surface honouring the sub-
duction zone interface. In addition, the fault in LA13 is
overall shallower with respect to that in HA14, and LA13
also assumes a shallower hypocentre (∼ 13 km, whereas it is
∼ 29 km in HA14; compare Fig. 6b and d).
As shown in Lay et al. (2013), the slip distributions of the
Santa Cruz Islands earthquake obtained by using only tele-
www.nat-hazards-earth-syst-sci.net/15/1371/2015/ Nat. Hazards Earth Syst. Sci., 15, 1371–1379, 2015

1376 F. Romano et al.: Source of the 6 February 2013 Mw= 8.0 Santa Cruz Islands Tsunami
−11.4 −11.2 −11 −10.8 −10.6 −10.4 −10.2 −10−60
−50
−40
−30
−20
−10
0
Lat
De
pth
(km
)
Hayes et al., 2014This study
−11.4 −11.3 −11.2 −11.1 −11 −10.9 −10.8 −10.7 −10.6 −10.5 −10.4−60
−50
−40
−30
−20
−10
0
Lat
De
pth
(km
)
Lay et al., 2013This study
−11.8 −11.6 −11.4 −11.2 −11 −10.8 −10.6−60
−50
−40
−30
−20
−10
0
Lat
De
pth
(km
)
Hayes et al., 2014Lay et al., 2013This study
b)
d)
e)
A1 B1 B2 A2
E1 F1 E2 F2
C1 D1 G1 D2 G2 C2
−12˚
−11˚
−10˚
0 50
km
Latit
ud
e
a)
B1
B2
A1
A2
C1
C2
HA14
02468
101214
Slip (m)
164˚ 165˚ 166˚
−12˚
−11˚
−10˚
0 50
km
Longitude
Latit
ud
e
c)
E1
E2
F1
F2
G1
G2
D1
D2
LA13
02468
101214
Slip (m)
D1
D2
Figure 6. Comparison with other source models. (a) HA14 model (coloured solid lines at 0.5 m intervals); magenta ellipse approximately
represents the aseismic slip area hypothesized in HA14; black solid lines as in Fig. 4; green solid lines represent the surface projections of the
depth profiles along the HA14 fault model and the one adopted in this study. (b) Depth profiles along the HA14 fault model (red) and the one
adopted in this study (black), crossing the hypocentre used in HA14 (red star) and in this study (black star); notice the the two hypocentres
are almost coincident. (c) LA13 model (coloured solid lines at 2.8 m intervals); black solid lines as in Fig. 4; green solid lines represent the
surface projections of the depth profiles along the LA13 fault model and the one adopted in this study. (d) Depth profiles along the LA13
fault model (green) and the one adopted in this study (black), crossing the hypocentre used in LA13 (green star). (e) Depth profiles along the
LA13 and HA14 fault models and the one adopted in this study, crossing the aseismic slip area hypothesized in HA14.
seismic data, a hypocentre deeper than 15 km, and an overall
deeper fault plane result in an underprediction of tsunami ob-
servations at DART buoys. For this reason, Lay et al. (2013)
prefer, among teleseismic solutions, the one obtained by im-
posing a shallower hypocentre. Since the model in this study
and LA13 explain tsunami data to a similar extent, the main
differences between the two may be ascribed either to dif-
ferences in the adopted fault geometry or to poor resolving
power of tsunami data themselves, which would lead to non-
uniqueness of the solution. According to our synthetic test,
the latter does not seem to be the case at least in regard to
the most tsunamigenic part of the source, that is the one with
a dominant dip slip component in the LA13 model. Besides
this, we also may argue that the HA14 source, which shows a
deeper slip centroid than LA13 (and lower peak slip of about
4 m; Fig. 6a), should be less tsunamigenic with respect to
LA13 (peak slip > 10 m, Fig. 6c) and then likely underesti-
mate tsunami observations.
Nat. Hazards Earth Syst. Sci., 15, 1371–1379, 2015 www.nat-hazards-earth-syst-sci.net/15/1371/2015/

F. Romano et al.: Source of the 6 February 2013 Mw= 8.0 Santa Cruz Islands Tsunami 1377
The centroid of the main asperity individuated in the
present study is shifted SE with respect to the main one of
HA14 and it features quite a larger slip (Fig. 6a). Conversely,
it features comparable peak slip values to the shallower patch
in LA13 (Fig. 6c), but it is nearer to Nendo Island, as the two
are only partially overlapped.
We also observe that the rake angle associated with our
model is pretty consistent with the relative convergence di-
rection between the Australia and Pacific plates. In partic-
ular, the slip direction has behaviour close to a thrust-like
motion (rake ∼ 85◦) in the SE part of the fault just near the
northern end of Vanuatu subduction zone; then the slip di-
rection becomes progressively more oblique, highlighting a
significant left-lateral component that is in agreement with
the kinematics (DeMets et al., 2010) and the seismicity of
the NW segment of the subduction (Fig. 1). We observe
an opposite behaviour of the rake angle in LA13; indeed,
the south-eastern shallower patch in LA13 has a slip direc-
tion with a strong oblique component, whereas the northern
deeper patch shows a thrust-like fault motion. Thus, the main
tsunamigenic patch in LA13 is located around the hypocen-
tre, whereas in the present study it is located in front of
Nendo Island, very close to the area where the maximum
tsunami wave heights have been observed (Fig. 1; Fritz et
al., 2014; NOAA/NGDC, http://www.ngdc.noaa.gov/hazard/
tsudb.shtml). Hence, as a likely less tsunamigenic patch is
involved, these differences may be due to a combination of
the effects of different resolving power of the data used and
of different fault geometry.
In a further analysis, we observe that ∼ 97 % of the total
seismic moment in our model is released within 75 s of the
nucleation. In particular, ∼ 60 % of the moment release oc-
curs between 15 and 45 s, as this time window includes most
of the main asperity and the peak slip area (Fig. 4). Thus, at
least qualitatively, the moment rate we derive by combining
the retrieved slip distribution and the imposed rupture veloc-
ity is in agreement with the moment rate function resulting
from teleseismic inversions.
4.2 Seismic rupture propagation SE from the
hypocentre
The distribution of the early aftershocks (in the first 48h
after the mainshock; http://earthquake.usgs.gov/earthquakes/
?source=sitenav), shows a lack of significant seismic events
occurring at the subduction interface, a feature that might
be indicative of a complete stress drop associated with the
main 6 February event. A large number of seismic events
have been observed mainly in the upper crust of the Pa-
cific plate and in the eastern edge of the Australia plate
oceanic crust (Fig. 4). In particular, the largest one in the Pa-
cific plate (Mw= 7+) occurred north of Nendo Island with
a strike-slip right-lateral mechanism (Fig. 1) that is consis-
tent with the kinematics of the coseismic slip (HA14). In
addition, a cluster of shallow right-lateral aftershocks oc-
curred SE from the mainshock epicentre (magenta ellipse
in Fig. 4). In their study, HA14 propose that occurrence
of these strike-slip earthquakes is caused by the block-like
motion behaviour of the Pacific upper plate. However, they
also argue that the Coulomb stress change distribution re-
sulting from the HA14 coseismic model would promote
events with left-lateral behaviour, whereas significant ad-
ditional slip located SE from the hypocentre would pro-
mote the observed right-lateral aftershocks. They conclude
that such slip (see magenta shaded ellipse in Fig. 6a), as
not observed in HA14, then should be aseismic, should oc-
cur at the megathrust interface, and, in agreement with the
Coulomb stress transfer estimation, should release a seis-
mic moment of M0= 3.1× 10²⁰ Nm. Thus, the total (coseis-
mic+ aseismic) seismic moment released along the south-
eastern portion of the fault is M0= 3.9× 10²⁰ Nm. Notewor-
thy, our slip model is partially overlapped with the aseismic
slip area argued by HA14; in particular, we observe larger
slip values, up to 9 m confined in a smaller area, versus an
average of 2 m of slip on a larger portion of the megathrust
(Fig. 6a). The seismic moment associated with this portion of
slip distribution in our model is M0= 4.08× 10²⁰ Nm, which
is quite compatible with the estimation by HA14.
The location of the coseismic tsunami source that we
found here is not in contradiction with the images of the
rupture propagation resulting from back-projection anal-
yses (IRIS, http://ds.iris.edu/spud/backprojection/1065729).
Indeed, all of these analyses, while showing different fea-
tures depending on the seismic network employed, high-
light a possible rupture propagation south-eastward from the
hypocentre, shown as well by the slip models obtained us-
ing tsunami data (this study and LA13). Furthermore, on the
one hand, in the back-projection analyses the surface projec-
tion of the radiated energy shows coherent high-frequency
radiation along a portion of the megathrust corresponding to
the seismogenic layer; on the other hand, the coherence of
seismic high-frequency radiation appears to degrade south-
eastward at shallower depths. This feature, along with the
slip propagation up to the trench (a zone likely rich in sed-
iments) and the relatively low rupture velocity (1.5 km s−1,
LA13), suggests that part of the seismic rupture SE of Nendo
Island may have been characterized by slow slip as indicated
by LA13. Therefore, we cannot rule out that this portion of
the megathrust may, at least partially, have slipped coseismi-
cally, triggering the right-lateral strike-slip aftershocks.
5 Conclusions
We retrieved the coseismic tsunami source of the 2013 Santa
Cruz Islands earthquake by inverting tsunami observations
recorded in the Pacific Ocean by several DART buoys and
tide gauges. We also computed Green’s functions using a 3-
D fault model honouring the geometrical complexities of the
subduction interface. The retrieved coseismic tsunami source
www.nat-hazards-earth-syst-sci.net/15/1371/2015/ Nat. Hazards Earth Syst. Sci., 15, 1371–1379, 2015
1378 F. Romano et al.: Source of the 6 February 2013 Mw= 8.0 Santa Cruz Islands Tsunami
is mainly located SE from the hypocentre, with maximum
slip value of ∼ 11 m and with the coseismic rupture reaching
the shallow part of the megathrust with slip amplitudes up to
6 m. The seismic moment resulting from our coseismic slip
model is equivalent to an Mw= 8.0 moment magnitude, in
agreement with previous studies. The spatial pattern of the
tsunami source is in agreement with the Australia and Pa-
cific plates convergence direction that becomes progressively
more oblique in the NW segment, and the slip distribution
reproduces the tsunami data well. However, our model, com-
pared with previously published models, features some dif-
ferences in terms of tsunamigenesis and pattern of coseismic
slip that we have discussed in relation to the different resolv-
ing power of the data used and the different fault geometry
adopted. A common feature of all the models is the presence
of slip SE of the hypocentre, which we argue occurred dur-
ing the coseismic stage, possibly with a slow slip component,
rather than being aseismic as previously suggested.
The Supplement related to this article is available online
at doi:10.5194/nhess-15-1371-2015-supplement.
Author contributions. F. Romano was involved in all of the phases
of this study. I. Molinari built the 3-D fault geometry, processed
tsunami data, and contributed to writing the paper. S. Lorito and
A. Piatanesi contributed to the design of the experiment, the discus-
sion and interpretation of the results, and the writing of the paper.
All authors reviewed the final manuscript.
Acknowledgements. This work is partially funded by project AS-
TARTE (Assessment, Strategy And Risk Reduction for Tsunamis
in Europe) FP7-ENV2013 6.4-3, grant 603839, and by the Italian
flagship project RITMARE. Some of the figures in this work were
drawn using GMT software (Wessel and Smith, 1995) and Matlab
(http://www.mathworks.it/products/matlab/).
Edited by: A. Armigliato
Reviewed by: three anonymous referees
References
Aki, K.: Characterization of barriers on an earthquake fault, J. Geo-
phys. Res., 84, 6140–6148, 1979.
Baba, T., Cummins, P. R., Thio, H. K., and Tsushima, H.: Validation
and Joint Inverison of Teleseismic Waveforms for Earthquake
Source Models Using Deep Ocean Bottom Pressure records: A
Case Study of the 2006 Kuril Megathrust Earthquake, Pure Appl.
Geophys., 166, 55–76, doi:10.1007/s00024-008-0438-1, 2009.
Barbosa, S. M., Fernandes, M. J., and Silva, M. E.: Nonlinear sea
level trends from European tide gauge records, Ann. Geophys.,
22, 1465–1472, doi:10.5194/angeo-22-1465-2004, 2004.
Bird, P.: An updated digital model of plate boundaries, Geochem.
Geophy. Geosy., 4, 1027, doi:10.1029/2001GC000252, 2003.
DeMets, C., Gordon, R. G., and Argus, D. F.: Geologically current
plate motions, Geophys. J. Int., 181, 1–80, doi:10.1111/j.1365-
246X.2009.04491.x, 2010.
Engdahl, E. R., van der Hilst, R., and Buland, R.: Global teleseismic
earthquake relocation with improved travel times and procedures
for depth determination, Bull. Seismol. Soc. Am., 88, 722–743,
1998.
Fritz, H. M., Papantoniou, A., Biukoto, L., Gilly, A., and Wei, Y.:
The Solomon Islands Tsunami of 6 February 2013 in the Santa
Cruz Islands: Field Survey and Modeling, EGU General Assem-
bly 2014, held 27 April–2 May, in Vienna, Austria, 2014.
Gusman, A. R., Murotani, S., Satake, K., Heidarzadeh, M., Gu-
nawan, E., Watada, S., and Schurr, B.: Fault slip distribution
of the 2014 Iquique, Chile, earthquake estimated from ocean-
wide tsunami waveforms and GPS data, Geophys. Res. Lett., 42,
1053–1060, doi:10.1002/2014GL062604, 2015.
Hayes, G. P., Wald, D. J., and Johnson, R. L.: Slab1.0: A three-
dimensional model of global subduction zone geometries, J.
Geophys. Res., 117, B01302, doi:10.1029/2011JB008524, 2012.
Hayes, G. P., Furlong, K. P., Benz, H. M., and Herman, H. W.: Trig-
gered aseismic slip adjacent to the 6 February 2013 Mw8.0 Santa
Cruz Islands megathrust earthquake, Earth Planet. Sc. Lett., 388,
265–272, doi:10.1016/j.epsl.2013.11.010, 2014a.
Hayes, G. P., Herman, M. W., Banhart, W. D., Furlong, K. P.,
Riquelme, S., Benz, H. M., Bergman, E., Barrientos, S., Earle,
P. S., and Samsonov, S.: Continuing megathrust earthquake po-
tential in Chile after the 2014 Iquique earthquake, Nature, 512,
295–298, doi:10.1038/nature13677, 2014b.
Lay, T., Ye, L., Kanamori, H., Yamazaki, Y., Cheung, K. F., and
Ammon, C. J.: The February 6, 2013 Mw 8.0 Santa Cruz Is-
lands earthquake and tsunami, Tectonophysics, 608, 1109–1121,
doi:10.1016/j.tecto.2013.07.001, 2013.
Lorito, S., Romano, F., Atzori, S., Tong, X., Avallone, A., Mc-
Closkey, J., Cocco, M., Boschi, E., and Piatanesi, A.: Lim-
ited overlap between the seismic gap and coseismic slip of
the great 2010 Chile earthquake, Nat. Geosci., 4, 173–177,
doi:10.1038/NGEO1073, 2011.
Meade, B. J.: Algorithms for the calculation of exact displace-
ments, strains, and stresses for triangular dislocation elements
in a uniform elastic half space, Comput. Geosci. 33, 1064–1075,
doi:10.1016/j.cageo.2006.12.003, 2007.
Piatanesi, A. and Lorito, S.: Rupture process of the 2004 Sumatra-
Andaman earthquake from tsunami waveform inversion, Bull.
Seismol. Soc. Am., 97, 223–231, doi:10.1785/0120050627,
2007.
Romano, F., Piatanesi A., Lorito, S., D’Agostino, N., Hirata, K., At-
zori, S., Yamazaki, Y., and Cocco, M.: Clues from joint inversion
of tsunami and geodetic data of the 2011 Tohoku-oki earthquake,
Sci. Rep., 2, 385, doi:10.1038/srep00385, 2012.
Romano, F., Trasatti, E., Lorito, S., Piromallo, C., Piatanesi, A., Ito,
Y., Zhao, D., Hirata, K., Lanucara, P., and Cocco, M.: Struc-
tural control on the Tohoku earthquake rupture process investi-
gated by 3D FEM, tsunami and geodetic data, Sci. Rep., 4, 5631,
doi:10.1038/srep05631, 2014.
Rothman, D.: Automatic estimation of large residual statics correc-
tions, Geophysics, 51, 332–346, doi:10.1190/1.1442092, 1986.
Spudich, P. and Miller, D. P.: Seismic site effects and the spatial in-
terpolation of earthquake seismograms: results using aftershocks
Nat. Hazards Earth Syst. Sci., 15, 1371–1379, 2015 www.nat-hazards-earth-syst-sci.net/15/1371/2015/

F. Romano et al.: Source of the 6 February 2013 Mw= 8.0 Santa Cruz Islands Tsunami 1379
of the 1986 North Palm Springs, California, earthquake, Bull.
Seismol. Soc. Am., 80, 1504–1532, 1990.
Tanioka, Y. and Satake, K.: Tsunami generation by horizontal dis-
placement of ocean bottom, Geophys. Res. Lett., 23, 861–864,
doi:10.1029/96GL00736, 1996.
Wessel, P. and Smith, W. H. F.: New version of the Generic
Mapping Tools released, Eos Trans. AGU, 76, 329,
doi:10.1029/95EO00198, 1995.
Yamazaki, Y., Kowalik, Z., and Cheung, K. F.: Depth-integrated,
non-hydrostatic model for wave breaking, Int. J. Numer. Meth.
Fluids, 61, 473–497, doi:10.1002/fld.1952, 2009.
Yamazaki, Y., Cheung, K. F., and Kowalik, Z.: Depth-integrated,
non-hydrostatic model with grid nesting for tsunami generation,
propagation, and run-up, Int. J. Numer. Meth. Fluids, 67, 2081–
2107, doi:10.1002/fld.2485, 2011.
Yue, H: Toward resolving stable high-resolution kinematic rupture
models of large earthquakes by joint inversion of seismic, geode-
tic and tsunami observations, PhD Thesis, UC Santa Cruz Elec-
tronic Theses and Dissertations, University of California, Santa
Cruz, 2014.
Yue, H., Lay, T., Li, L., Yamazaki, Y., Cheung, K. F., Rivera,
L., Hill, E. M., Sieh, K., Kongko, W., and Muhari, A.: Valida-
tion of linearity assumptions for using tsunami waveforms in
joint inversion of kinematic rupture models: Application to the
2010 Mentawai Mw 7.8 tsunami earthquake, J. Geophys. Res.-
Solid, 120, 1728–1747, doi:10.1002/2014JB011721, 2015.
www.nat-hazards-earth-syst-sci.net/15/1371/2015/ Nat. Hazards Earth Syst. Sci., 15, 1371–1379, 2015