sounding rocket observations of active region soft x-ray ... · sxr observations of ars 3569 in the...
TRANSCRIPT

Solar Phys (2016) 291:3567–3582DOI 10.1007/s11207-016-0999-6
Sounding Rocket Observations of Active Region SoftX-Ray Spectra Between 0.5 and 2.5 nm Using a ModifiedSDO/EVE Instrument
Seth Wieman1 · Leonid Didkovsky1 · Thomas Woods2 ·Andrew Jones2 · Christopher Moore2
Received: 22 June 2016 / Accepted: 26 September 2016 / Published online: 21 October 2016© The Author(s) 2016. This article is published with open access at Springerlink.com
Abstract Spectrally resolved measurements of individual solar active regions (ARs) in thesoft X-ray (SXR) range are important for studying dynamic processes in the solar coronaand their associated effects on the Earth’s upper atmosphere. They are also a means of eval-uating atomic data and elemental abundances used in physics-based solar spectral models.However, very few such measurements are available. We present spectral measurementsof two individual ARs in the 0.5 to 2.5 nm range obtained on the NASA 36.290 sound-ing rocket flight of 21 October 2013 (at about 18:30 UT) using the Solar Aspect Monitor(SAM), a channel of the Extreme Ultaviolet Variability Experiment (EVE) payload designedfor underflight calibrations of the orbital EVE on the Solar Dynamics Observatory (SDO).The EVE rocket instrument is a duplicate of the EVE on SDO, except the SAM channel onthe rocket version was modified in 2012 to include a freestanding transmission grating toprovide spectrally resolved images of the solar disk with the best signal to noise ratio forthe brightest features, such as ARs. Calibrations of the EVE sounding rocket instrument atthe National Institute of Standards and Technology Synchrotron Ultraviolet Radiation Fa-cility (NIST/SURF) have provided a measurement of the SAM absolute spectral responsefunction and a mapping of wavelength separation in the grating diffraction pattern. We dis-cuss techniques (incorporating the NIST/SURF data) for determining SXR spectra from the
B L. [email protected]
1 Space Sciences Center, University of Southern California, 835 Bloom Walk, Los Angeles,CA 90089-1341, USA
2 Laboratory for Atmospheric and Space Physics, University of Colorado, 1234 Innovation Drive,Boulder, CO 80303-7814, USA

3568 S. Wieman et al.
dispersed AR images as well as the resulting spectra for NOAA ARs 11877 and 11875 ob-served on the 2013 rocket flight. In comparisons with physics-based spectral models usingthe CHIANTI v8 atomic database we find that both AR spectra are in good agreement withisothermal spectra (4 MK), as well as spectra based on an AR differential emission measure(DEM) included with the CHIANTI distribution, with the exception of the relative intensi-ties of strong Fe xvii lines associated with 2p6–2p53s and 2p6–2p53d transitions at about1.7 nm and 1.5 nm, respectively. The ratio of the Fe xvii lines suggests that the AR 11877 ishotter than the AR 11875. This result is confirmed with analysis of the active regions imagedby X-ray Telescope (XRT) onboard Hinode.
Keywords Corona, structures · Active regions · Spectrum, X-ray
1. Introduction
Solar soft X-ray (SXR) (0.1 – 10 nm) emissions originate from high-temperature plasma inthe solar corona and vary dramatically with solar activity both in terms of band-integratedintensity and spectral distribution (Neupert, 2006). Spectrally resolved measurements in thiswavelength range are of significant scientific value and practical utility. They provide valu-able diagnostics of the plasma-temperature distribution and elemental abundances in thecorona (Del Zanna and Mason, 2014). Such plasma diagnostics are crucial for constrain-ing the various models (Winebarger et al., 2011; Raftery et al., 2013; Asgari-Targhi et al.,2013; Cargill, 2014) describing coronal heating. Understanding these heating mechanismsis currently among the most important problems in solar physics, e.g. Klimchuk (2006) andreferences therein. Also, solar SXR radiation is absorbed in the Earth’s mesosphere andlower thermosphere (altitudes between about 80 and 150 km) primarily through photoion-ization of the major neutral species, O, O2, and N2, and as a result, is a primary driver ofelectron density in the E-region ionosphere. Photoionization cross-sections of these neutralspecies vary dramatically with wavelength within the SXR band and thus reliable models ofE-region peak height, peak density, as well as profile shape require accurate, well-resolvedSXR spectra (Sojka et al., 2013). In spite of the importance of solar SXR measurements, rel-atively few spectrally resolved measurements of quiescent (non-flaring) ARs are availablein this wavelength range. Some past measurements include high resolution spectra short-ward of 2.5 nm from rocket-borne crystal spectrometers with sufficiently narrow fields ofview to isolate individual ARs (Parkinson, 1975; Hutcheon, Pye, and Evans, 1976; Bureket al., 1981). AR SXR spectra from 0.6 to 1.9 nm were also obtained on many occasionsthroughout the Solar Maximum Mission (SMM) from 1980 to 1989 with the onboard FlatCrystal Spectrometer (FCS) (Phillips et al., 1982, 1997). Quiescent Sun full-disk irradiancespectra were observed in the 0.25 to 2.5 nm range with a commercial off-the-shelf X-123avalanche photodiode spectrometer onboard two sounding rocket flights (Caspi, Woods, andWarren, 2015) included on the same flight as the Solar Aspect Monitor (SAM) spectra re-ported in this article. These spectra will soon be available from an identical instrument onthe Miniature X-ray Solar Spectrometer (MInXSS) cubesat mission (Mason et al., 2016).Additionally, spectrally resolved SXR measurements are available from a number of currentor recent missions but only for wavelengths shorter than 0.5 nm, e.g. for Yohkoh (Kato, Fuji-wara, and Hanaoka, 1998), and the Reuven Ramaty High Energy Solar Spectroscope Imager(RHESSI: Smith et al., 2002), or longer than 6 nm on the Extreme Ultraviolet VariabilityExperiment (EVE: Woods et al., 2012).

SXR Observations of ARs 3569
In the extreme ultraviolet (EUV) spectral range there is a rich history of experimentsthat have provided spectrally resolved images of the solar corona. Some examples includethe Skylab S082A slitless spectrograph for 17.1 to 63.0 nm (Tousey et al., 1977), the SolarEUV Rocket Telescope and Spectrograph for 23.5 to 45.0 nm (Neupert et al., 1992), and theMulti-Order Solar EUV Spectrograph sounding rocket instrument for 30.4 nm (Kankelborgand Thomas, 2001; Fox, Kankelborg, and Thomas, 2010). Related theoretical work includesefforts for optimizing the design and performance of imaging spectrographs (Oktem, Kamal-abadi, and Davila, 2013; Davila, 2012). Spectral information has also been extracted fromdiffraction artifacts (originating from instrument filter support meshes) in images of the solarcorona from the Transition Region and Coronal Explorer experiment (Lin, Nightingale, andTarbell, 2001) and the Atmospheric Imaging Assembly (Raftery, Krucker, and Lin, 2011).
Broadband measurements in the 0.1 – 7 nm range from the XUV Photometer System(XPS) channels (Woods et al., 2008) on the Thermosphere, Ionosphere, Mesosphere, Ener-getics and Dynamics (TIMED) and the Solar Radiation and Climate Experiment (SORCE)and from the EUV Spectrophotometer (ESP) channel (Didkovsky et al., 2012) on SDOcover this gap, but determining accurate irradiance values from these measurements requiresknowledge of the spectral distribution (solar spectrum) within the band in order to apply theappropriate spectral weighting to the instrument response function – while the XPS and ESPirradiance values are in good agreement under quiet-Sun conditions, they vary by a factor ofmore than two during active periods, most likely due to the lack of reliable reference spectrafor converting raw data to irradiances.
Physics-based theoretical models of solar and stellar plasmas (Del Zanna et al., 2015;Landi et al., 2013; Dere et al., 1997; Warren, Mariska, and Lean, 2001) are widely used forstudying solar spectra. These models typically rely on large sets of atomic transition data. Inturn, comparisons with solar and stellar observations are used to verify or improve knowl-edge of such atomic data (Brickhouse, Raymond, and Smith, 1995; Del Zanna, Berrington,and Mason, 2004; Del Zanna, 2006, 2011). The literature concerning ions emitting in theSXR range shows vast disagreement between spectral line intensities from (the limited num-ber of) solar, stellar, and laboratory plasma observations, and those modeled based on avail-able atomic data are often reported (Brown et al., 1998; Laming et al., 2000; Del Zanna,2011). Such discrepancies are particularly common for the Fe xvii ion with emissions thatare dominant in the solar measurements reported in this work.
This article reports solar SXR spectral measurements of two individual active regions(ARs), NOAA numbers 11877 and 11875, observed on a 2013 sounding rocket flight withthe EVE/SAM pinhole camera which, for the sounding rocket version of the instrument,includes a freestanding transmission grating that allows spectra to be determined for brightfeatures on the disk with sufficient spatial separation, such as ARs. We describe the analysesrequired to determine spectra from the wavelength-diffracted images and compare resultingspectra to CHIANTI spectral models and to AR temperature and emission measure mapsdetermined from concurrent X-ray Telescope (XRT) measurements. We discuss the potentialsignificance where differences in these comparisons occur.
2. Instrumentation
The SAM channel discussed in detail in Woods et al. (2012), Hock et al. (2012), and Linet al. (2016) of the EVE on SDO is a pinhole camera with thin-film filters that includeTi, C, and Al layers which limit its sensitivity to wavelengths shorter than about 7.0 nm.The SDO/EVE/SAM instrument provided solar SXR images (Figure 1) from its April 2010
3570 S. Wieman et al.
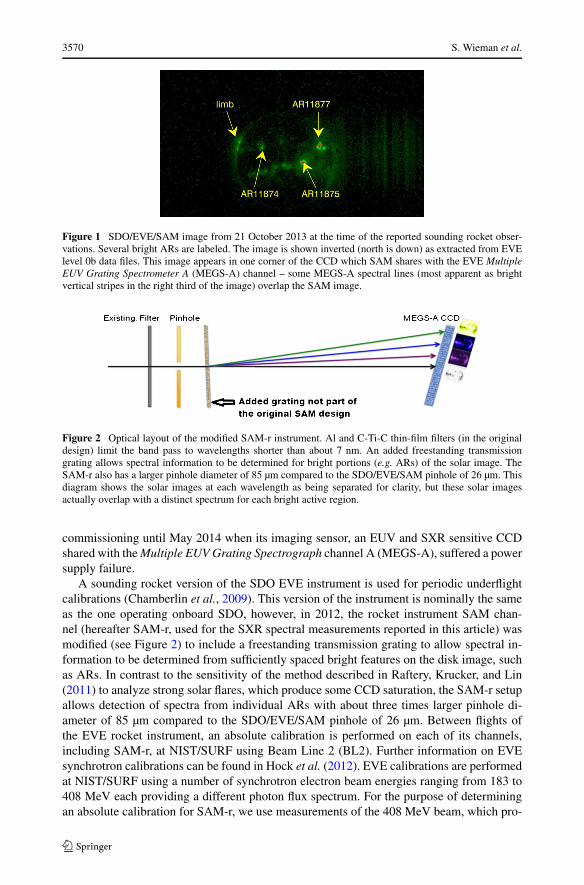
Figure 1 SDO/EVE/SAM image from 21 October 2013 at the time of the reported sounding rocket obser-vations. Several bright ARs are labeled. The image is shown inverted (north is down) as extracted from EVElevel 0b data files. This image appears in one corner of the CCD which SAM shares with the EVE MultipleEUV Grating Spectrometer A (MEGS-A) channel – some MEGS-A spectral lines (most apparent as brightvertical stripes in the right third of the image) overlap the SAM image.
Figure 2 Optical layout of the modified SAM-r instrument. Al and C-Ti-C thin-film filters (in the originaldesign) limit the band pass to wavelengths shorter than about 7 nm. An added freestanding transmissiongrating allows spectral information to be determined for bright portions (e.g. ARs) of the solar image. TheSAM-r also has a larger pinhole diameter of 85 µm compared to the SDO/EVE/SAM pinhole of 26 µm. Thisdiagram shows the solar images at each wavelength as being separated for clarity, but these solar imagesactually overlap with a distinct spectrum for each bright active region.
commissioning until May 2014 when its imaging sensor, an EUV and SXR sensitive CCDshared with the Multiple EUV Grating Spectrograph channel A (MEGS-A), suffered a powersupply failure.
A sounding rocket version of the SDO EVE instrument is used for periodic underflightcalibrations (Chamberlin et al., 2009). This version of the instrument is nominally the sameas the one operating onboard SDO, however, in 2012, the rocket instrument SAM chan-nel (hereafter SAM-r, used for the SXR spectral measurements reported in this article) wasmodified (see Figure 2) to include a freestanding transmission grating to allow spectral in-formation to be determined from sufficiently spaced bright features on the disk image, suchas ARs. In contrast to the sensitivity of the method described in Raftery, Krucker, and Lin(2011) to analyze strong solar flares, which produce some CCD saturation, the SAM-r setupallows detection of spectra from individual ARs with about three times larger pinhole di-ameter of 85 µm compared to the SDO/EVE/SAM pinhole of 26 µm. Between flights ofthe EVE rocket instrument, an absolute calibration is performed on each of its channels,including SAM-r, at NIST/SURF using Beam Line 2 (BL2). Further information on EVEsynchrotron calibrations can be found in Hock et al. (2012). EVE calibrations are performedat NIST/SURF using a number of synchrotron electron beam energies ranging from 183 to408 MeV each providing a different photon flux spectrum. For the purpose of determiningan absolute calibration for SAM-r, we use measurements of the 408 MeV beam, which pro-

SXR Observations of ARs 3571
Figure 3 SAM-r image from calibration measurements obtained at the NIST/SURF synchrotron facility us-ing a 408 MeV synchrotron beam. Added annotations include: orange brackets identifying the minus one,zeroth (orange arrow), and plus one grating diffraction orders, a yellow wavelength scale mapping first-ordergrating wavelength dispersion to position on the CCD image, a red curve showing the relative intensity (en-ergy units) of the 408 MeV synchrotron beam, and a blue curve showing the approximate relative transmissionof the combined C-Ti-C and Al thin-film filter layers. The transmission grating supporting mesh also acts asa lower density grating, so there is spectral spreading perpendicular to the primary spectral dispersion in afan-like shape.
vides the greatest photon fluxes and highest signal-to-noise ratio at the short wavelengths towhich SAM-r is sensitive.
A mapping of wavelength dispersion to position on the SAM-r CCD is determined basedon NIST/SURF measurements. Figure 3 shows the diffraction pattern observed with SAM-rwhen illuminated by the highly collimated synchrotron beam with a storage ring electronenergy of 408 MeV. The grating dispersion direction is parallel to the horizontal CCD rowsto within about 0.25◦. In addition to the primary horizontal dispersion from the gratingrulings, slight vertical dispersion related to the larger-period grating support mesh is alsoevident resulting in bands that extend diagonally from the zeroth-order central spot; highermesh orders correspond to dimmer bands with steeper slopes. Alternating light and darkregions in the plus one- and minus one-order portions of the diffraction pattern are due tothe 408 MeV beam spectral shape – shown as a red curve with yellow wavelength scalein Figure 3, with peak photon flux around 3.5 nm – filtered by the SAM C-Ti-C thin-film(an approximate relative filter transmission curve is shown in blue in Figure 3). The yellowwavelength scale is established based on the location of the known Ti filter absorption edgeat about 2.75 nm and provides a measure of wavelength dispersion used in the analyses ofSAM-r solar images in Section 3.
The synchrotron measurements also provide the SAM-r absolute spectral response func-tion. In the left panel of Figure 4 the SAM-r response in the digital numbers (DN) (DN-darkaveraged over multiple rows within the plus first-order portion of the diffraction pattern)is compared to the well-characterized absolute photon flux spectrum of the NIST/SURF408 MeV beam; uncertainty in the synchrotron beam irradiance is estimated to be about10 % in the SAM-r wavelength range. The SURF beam flux spectrum (binned to matchthe wavelength scale of 0.0125 nm/pixel shown in Figure 3) is divided into the measuredSAM-r DN profile to provide the spectral response function shown in the right panel ofFigure 4, which is used in Section 3 to determine spectral irradiances from the SAM-r solarmeasurements. The determined response function depends somewhat on the number of rowsaveraged to form the DN profile (black curve in Figure 4, left panel) as the rows includeddetermine the degree to which the dimmer higher orders related to the grating support mesh(in rows farther from the central peak) affect the average. The response function shown is
3572 S. Wieman et al.
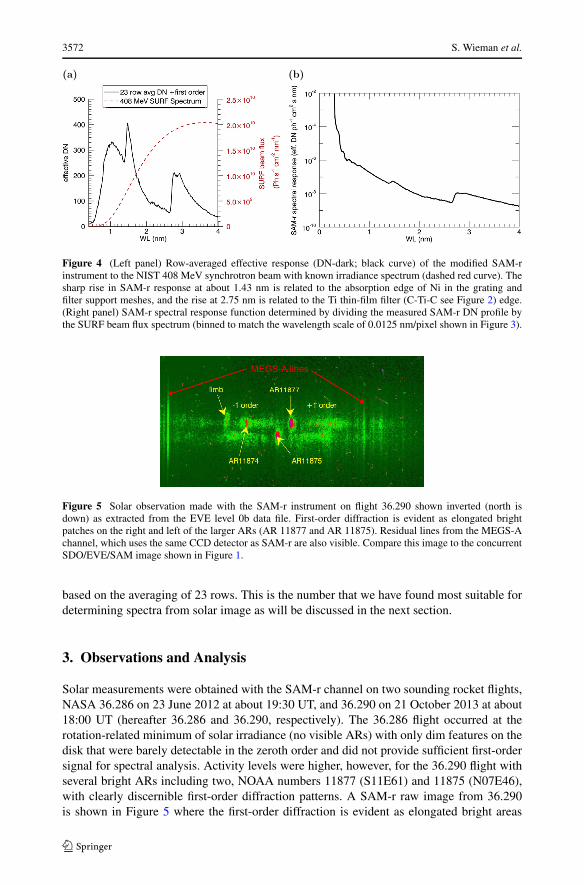
Figure 4 (Left panel) Row-averaged effective response (DN-dark; black curve) of the modified SAM-rinstrument to the NIST 408 MeV synchrotron beam with known irradiance spectrum (dashed red curve). Thesharp rise in SAM-r response at about 1.43 nm is related to the absorption edge of Ni in the grating andfilter support meshes, and the rise at 2.75 nm is related to the Ti thin-film filter (C-Ti-C see Figure 2) edge.(Right panel) SAM-r spectral response function determined by dividing the measured SAM-r DN profile bythe SURF beam flux spectrum (binned to match the wavelength scale of 0.0125 nm/pixel shown in Figure 3).
Figure 5 Solar observation made with the SAM-r instrument on flight 36.290 shown inverted (north isdown) as extracted from the EVE level 0b data file. First-order diffraction is evident as elongated brightpatches on the right and left of the larger ARs (AR 11877 and AR 11875). Residual lines from the MEGS-Achannel, which uses the same CCD detector as SAM-r are also visible. Compare this image to the concurrentSDO/EVE/SAM image shown in Figure 1.
based on the averaging of 23 rows. This is the number that we have found most suitable fordetermining spectra from solar image as will be discussed in the next section.
3. Observations and Analysis
Solar measurements were obtained with the SAM-r channel on two sounding rocket flights,NASA 36.286 on 23 June 2012 at about 19:30 UT, and 36.290 on 21 October 2013 at about18:00 UT (hereafter 36.286 and 36.290, respectively). The 36.286 flight occurred at therotation-related minimum of solar irradiance (no visible ARs) with only dim features on thedisk that were barely detectable in the zeroth order and did not provide sufficient first-ordersignal for spectral analysis. Activity levels were higher, however, for the 36.290 flight withseveral bright ARs including two, NOAA numbers 11877 (S11E61) and 11875 (N07E46),with clearly discernible first-order diffraction patterns. A SAM-r raw image from 36.290is shown in Figure 5 where the first-order diffraction is evident as elongated bright areas

SXR Observations of ARs 3573
Figure 6 A clean version of theSAM-r 36.290 image from whichMEGS-A lines have beensignificantly reduced (seediscussion in the text). Red andblue rectangles indicate the pixelrows used to analyze the spectraof ARs 11875 and 11877,respectively.
to the left and right of each of these ARs (for contrast, see the concurrent image from theSDO/EVE/SAM in Figure 1 in which these first-order patterns are absent).
Determining spectra from the SAM-r image is complicated by the aforementioned pres-ence of residual vertical lines from the MEGS-A channel, as such lines can potentially in-troduce false peaks in the first-order diffraction pattern. In an effort to remove these lines,a SAM-r image from the 36.286 flight (with a linear scaling applied to match the back-ground level and the level of the brightest MEGS-A peaks to those of the 36.290 image) issubtracted from the 36.290 raw image. The 36.286 image is suitable for this purpose as itincludes the MEGS-A lines while solar features imaged through the SAM pinhole are verydim due to quiet solar conditions during the 2012 flight. MEGS-A lines are far less evidentin Figure 6 showing a SAM-r 36.290 image to which this approach has been applied; the im-age shown is the average of 25 ten-second exposures obtained over the two-minute intervalaround flight apogee.
Spectral profiles for AR 11877 and 11875 are determined by averaging over the pixelrows highlighted in Figure 6 by the blue and red rectangles, respectively. As alluded to in thediscussion as regards the response function in Section 2 and Figure 4, each rectangle consistsof 23 rows, a number determined to be optimum in terms of providing the best countingstatistics (which improve by including more rows) without expanding the averaging windowto include bright features that are unrelated to first-order diffraction of the analyzed AR,and thus distort the extracted spectrum. The objective function for this optimization was aminimization of the asymmetry between plus one and minus one orders based on residualdifferences in the heights of major plus and minus first-order peaks.
Zeroth-order bright points from other features on the solar disk can effectively contributean additional non-uniform background to the first-order diffraction pattern for a given AR.For example, it is evident from Figure 6 that AR 11874 falls within the first-order dispersedimage of AR 11877. To reduce this background, we subtract from the SAM-r 36.290 imagean image obtained at the same time from the SDO/EVE/SAM instrument that has no gratingor associated first-order diffraction features. The SDO/EVE/SAM image is scaled to matchthe intensity of its AR central spot to that of the SAM-r image. Figure 7 illustrates the effectof this subtraction, the gray curve shows the average SAM-r row profile through AR 11877(i.e. the average of the rows within the blue box of Figure 6), the red curve shows theaverage profile for corresponding pixels of the SDO/EVE/SAM image (Figure 1), and theirdifference represents the portion of the SAM-r profile related to first-order diffraction.
The first-order spectral profile for AR 11877 (AR 11875), with zeroth-order backgroundsubtracted in the above manner, is plotted (black curve) in Figure 8 (Figure 9) using thewavelength scale established from the NIST/SURF calibrations. The zeroth-order centralpeak of the AR (part of the removed zeroth-order background) has been reinserted as agreen curve in the plot. The SAM-r profile does not directly represent a calibrated irradi-ance spectrum as peak heights are dependent on the SAM-r spectral response. Furthermore,

3574 S. Wieman et al.
Figure 7 Subtracting theSDO/EVE/SAM image from thetime of the 36.290 rocket flightfrom the SAM-r image helps toisolate the portion of the SAM-rprofile associated with first-orderdiffraction. Prior to subtraction,the SDO/EVE/SAM image isscaled by a constant to match itscentral AR peak to that of theSAM-r image (the SAM-r profileis mostly obscured by theSDO/EVE/SAM profile for thecentral peak and for the limbbright peak centered near pixel−175).
Figure 8 The SAM-r first-order profile (black curve), obtained by averaging rows highlighted in the bluebox of Figure 6 and subtracting the background signal related to residual MEGS-A lines and the zeroth-orderbright points from other features on the disk, is compared to AR 11877 spectrum modeled with CHIANTI v8(blue curve) using a file named active_region.dem. The modeled spectrum is fit to the measured profile byfolding it with the SAM-r spectral response function and convolving it with the SAM-r zeroth-order ARprofile (green curve). Good agreement between the measurement and the model is found for most of thepeaks with the exception of the peak near 1.7 nm associated primarily with the 2s22p6–2s22p53s Fe xviiline multiplet. The gray band surrounding the profile represents peak height uncertainty equal to the standarddeviation of pixel DN values among the 25 ten-second exposures used to determine the average profile.
the resolution of the profile is limited due to convolution of the spectrum related to the spa-tial extent of the observed AR (i.e., the dispersed AR images associated with emission linesof similar wavelength tend to overlap) thus most of the profile peaks represent blends ofseveral lines or more. Nonetheless, peaks associated with some known intense spectral linesin this wavelength range (several are listed in Table 1) are discernible and these ions arelabeled over the plus first-order portion of the profile on the right side of Figure 8. The grayband surrounding the profile represents peak height uncertainty equal to the standard devia-tion of pixel DN values among the 25 ten-second exposures used to determine the averageprofile. To determine the irradiance spectra and estimate the AR temperature distributionwe compare the SAM-r spectral profiles with forward-modeled photon spectra using the

SXR Observations of ARs 3575
Table 1 Wavelengths andtransitions of several of thestrong lines contributing tospectral peaks observed withSAM-r on 36.290.
Ion Transition WL [Å]
Si xiii 1s21s − 1s2p1P1 6.648
Mg xi 1s21S0 − 1s2s3S1 9.316
Fe xvii 2s22p61S0 − 2s22p54d3D1 12.264
Ne ix 1s21S0 − 1s2p1P1 13.447
Ne ix 1s21S0 − 1s2s3S1 13.699
Fe xvii 2s22p61S0 − 2s22p53d1P1 15.013
Fe xvii 2s22p61S0 − 2s22p53d3D1 15.262
Fe xvii 2s22p61S0 − 2s22p53d3P1 15.453
O viii 1s2S1/2 − 3p2P3/2 16.006
Fe xviii 2s22p52P3/2 − 2s22p4(3P)3s4P5/2 16.072
Fe xvii 2s22p61S0 − 2s22p53s3P1 16.776
Fe xvii 2s22p61S0 − 2s22p53s1P1 17.051
Fe xvii 2s22p61S0 − 2s22p53s3P2 17.096
O viii 1s2S1/2 − 2p2P3/2 18.967
O viii 1s2S1/2 − 2p2P1/2 18.973
O vii 1s21S0 − 1s2s3S1 22.101
CHIANTI v8 atomic database. For example, in Figure 8, the AR 11877 spectral profile iscompared to an AR spectrum as a blue curve (a red curve for AR 11875 in Figure 9) modeledusing the “active-region-dem” profile provided with the CHIANTI distribution (scaled by aconstant to provide an irradiance spectrum fitting the SAM-r response). For this comparisonthe CHIANTI spectrum was folded with the SAM response function from NIST/SURF (Fig-ure 4, right), and reduced to the SAM resolution by convolving it with the AR 11877 andAR 11875 zeroth-order profile (green curve in Figures 8 and 9). The observed and modeledspectra agree quite well in general, with most of the model peak heights being within 20 %of the observed peaks, which is well within the error band. One notable exception, how-ever, is the significant difference for the peak around 1.7 nm related primarily to a blend ofthree Fe xvii lines associated with the 2s22p6–2s22p53s transition. Comparing the SAM-rspectral profile for AR 11875 (see Figure 9) to a model spectrum based on the same DEMdistribution but with a different constant scaling factor also shows the observed peak heightsto be in reasonably good agreement with the model (within the uncertainty band). Whilethe difference in the relative intensity of the Fe xvii peaks at 1.7 nm and 1.5 nm seen in theAR 11877 comparison is also evident for AR 11875, it is not as pronounced.
The Fe xvii peaks at 1.5 nm and 1.7 nm are, even with the degree of convolution of theSAM-r profiles, sufficiently unblended with other elements that their relative heights are notaffected by the choice of abundance ratios. Applying different low first ionization potential(FIP) ratios in the CHIANTI model, or even determining the spectrum for the Fe xvii iononly, does not result in a significant difference in the relative heights of the modeled peaks.
It is conceivable, however, that a different representation of the AR temperature structurethan the CHIANTI “active-region-dem” distribution might resolve the differences in themodeled relative heights of the Fe xvii peaks compared to the AR 11875 and AR 11877observations at temperatures of logT = 6.4 and higher. In contrast, temperature maps forthe time of the 36.290 flight (see Figure 10) generated based on XRT filter ratio data show

3576 S. Wieman et al.
Figure 9 A comparison similarto that in Figure 8, but forAR 11875 with a spectral profiledetermined from rows within thered box of Figure 6 (theCHIANTI modeled AR spectrumis plotted as a red curve using afile named active_region.dem).
little evidence of plasma above about logT = 6.35 for several analyses adopting differentabundances and filter combinations.
The XRT Be-thin, Al-mesh, and Al-poly filter images in this analysis were taken near thetime of the sounding rocket launch, from 18:03 to 18:04 UT. The analysis was performedon level-1 (using the XRT prep routine) composite images of each filter type with short,medium, and long exposures to increase the dynamic range. Temperature and emission mea-sure maps were created via filter ratios of Be-thin/Ti-poly and Be-thin/Al-mesh, using anisothermal approximation in the CHIANTI v8 atomic database and elemental abundancestaken from the literature for coronal (Feldman, 1992), hybrid (Schmelz et al., 2012), andphotospheric (Caffau et al., 2011) values. The full-Sun synoptic images allow for a directcomparison between ARs 11875 and 11877 inferred physical properties, as any systematiceffects in the images will affect both ARs vs. narrow field of view XRT images. The XRTresults for these two active regions are similar to the peak temperature near logT = 6.3, butAR 11877 is more compact than AR 11875 (see the top panel with the black backgroundin Figure 10), and AR 11877 has more hot pixels than AR 11875 (see bottom panel ofFigure 10 with blue curves shifted to the right as compared to the red curves).
Full-disk X-ray spectra reported in Caspi, Woods, and Warren (2015) were obtained us-ing an Amptek X-123 Silicon Drift Diode X-ray spectrometer included with the EVE sound-ing rocket payload on flights 36.286 and 36.290. However, the spectral resolution of the X-123 is too low in the wavelength range of the 1.5 nm and 1.7 nm Fe xvii lines to give a directmeasurement of their relative intensity. Additionally, a two temperature emission measureanalysis of the X-ray spectrum from flight 36.290 presented in the Caspi, Woods, and War-ren (2015) study suggests a disk-integrated dominant temperature of 2.7 MK (logT = 6.43at log EM = 49.6, with the EM measured in cm−3) with an additional high-temperaturecomponent at 8.7 MK (logT = 6.94 at log EM = 47.5), so the X-123 measurements do notdecisively resolve the question of AR temperature either.
On the other hand, the literature concerning Fe xvii X-ray emission lines is extensive andoften shows model predictions of the intensity of the 2p6–3s lines, around 1.7 nm, rela-tive to the bright 2p6–3d lines, around 1.5 nm, to be significantly different (by factors oftwo or more) from what is observed in laboratory or solar plasmas; see e.g., Del Zanna(2011), Laming et al. (2000), and Brown et al. (1998). The intensity ratio (based on photonunits) for the three lines originating from 2p5–3s to those from 2p5–3d is about 1.9 forthe CHIANTI v8 AR spectrum, but would need to be about 1.0 to match the AR 11877

SXR Observations of ARs 3577
Figure 10 Temperature and emission measure of ARs 11875 and 11877 for the time of the 36.290 flightdetermined from XRT filter ratio images. Temperature and emission measure maps were created via filter ra-tios of Be-thin/Ti-poly and Be-thin/Al-mesh, using an isothermal approximation in the CHIANTI v8 atomicdatabase and elemental abundances taken from the literature for coronal (Feldman, 1992), hybrid (Schmelzet al., 2012), and photospheric (Caffau et al., 2011) values. In particular, the top panel (on the black back-ground) shows the maps for ARs 11875 and 11877 using the Be-thin/Al-mesh ratio and the coronal elementalabundances from Feldman (1992). The bottom panel presents histograms for the temperature for both ARs(AR 11875 in red color and AR 11877 in blue color) computed from the XRT filter ratios, as shown in thetop labels, and the elemental abundances taken from the published values as indicated in the inset at the top.

3578 S. Wieman et al.
Figure 11 CHIANTI v8 predicted 3s/3d intensity ratios (photons) vs. temperature. Horizontal lines com-pare CHIANTI v8 ratio values based on flare and “active-region-dem” profiles to ratios matching the SAM-robservations for AR 11877 and AR 11875 (these horizontal lines are intended to show discrete ratio valueswithout regard to the abscissa LogT scale). Because the AR 11877 and AR 11875 ratio values are belowthose predicted by CHIANTI v8 over the range of temperatures (LogT ≈ 6.3 – 7.2) for which Fe xvii ioniza-tion fractions are significant, adjusting the modeled temperature structure cannot resolve the aforementioneddiscrepancies between modeled and observed peak heights near 1.7 nm.
spectral profile, and about 1.40 to match the AR 11875 profile. This 3s/3d line intensityratio is insensitive to electron density, but sensitive to temperature, and based on the CHI-ANTI v8 “temperature-ratio” diagnostic, over the temperature range logT ≈ 6.3 to 7.2 forwhich the Fe xvii ion fraction is significant, this ratio only varies from about 2.7 to about 1.4(Figure 11), so in this regard a CHIANTI model spectrum based on a different temperaturestructure cannot fully resolve these differences (e.g. for a spectrum modeled in CHIANTIwith the “flare.dem” profile, the 3s/3d ratio is only as low as 1.58). However, in the earlierstudies (e.g. Laming et al., 2000; Raymond and Smith, 1986; Parkinson, 1973) that haveincluded comparisons between model predictions and observations of the Fe xvii 3s/3d in-tensity ratio, a broader range of observed values has been reported. For example, in Laminget al. (2000), a compilation of 3s/3d intensity ratios observed in solar and stellar plasmas(as well as a laboratory Electron Beam Ion Trap source) spans the range from about 0.8to about 2.1. While the values for this intensity ratio obtained in our analysis of the SAMrocket data differ from what is predicted by CHIANTI, they are not outside this range ofvalues observed in the past.
Del Zanna (2011) demonstrated that atomic data for the Fe xvii ion presented in Liangand Badnell (2010) (and currently used in CHIANTI v8) reliably predict Fe xvii line inten-sities for a set of carefully selected solar observations, an important development beyondprevious studies, which commonly found predictions based on earlier available atomic datato disagree with solar and stellar observations and explained the differences based on otherfactors affecting the observed intensities, such as opacity (Saba et al., 1999). Interestingly,some of the earlier atomic data benchmarked in the Del Zanna (2011) study predict 3s/3d
intensity ratios that closely match our SAM-r observations. For example, Figures 12 and 13show comparisons of SAM-r spectral profiles (for ARs 11877 and 11875, respectively, asin Figures 8 and 9) with a CHIANTI modeled 4 MK (logT = 6.6) isothermal plasma forwhich the 3s/3d ratios are adjusted to match those predicted (for a 4 MK plasma) based on

SXR Observations of ARs 3579
Figure 12 Comparison of SAM-r spectral profile for AR 11877 to an AR spectral model for a 4 MK isother-mal plasma with Fe xvii 3s/3d line ratios adjusted to match those based on the atomic data of Bhatia andDoschek (1992). Good agreement between the model and observation is evident throughout the spectralrange analyzed, with much better agreement compared to CHIANTI v8 based on Fe xvii data of Liang andBadnell (2010) for the peak around 1.7 nm associated with Fe xvii 2p6–2p5–3s emissions. The gray bandsurrounding the profile represents peak height uncertainty equal to the standard deviation of pixel DN valuesamong the 25 ten-second exposures used to determine the average profile.
Fe xvii atomic data from Bhatia and Doschek (1992). These Bhatia and Doschek (1992) datawere widely used prior to the Liang and Badnell (2010) data, including in an earlier version(4.2) of CHIANTI (Young et al., 2003). For both ARs the modeled spectrum is in goodagreement with the SAM-r profiles throughout the wavelength range analyzed – includingthe peaks around 1.7 nm associated with the Fe xvii 3s lines.
For the comparisons shown in Figures 12 and 13, the modeled spectra are folded withthe SAM-r spectral response and convolved to match the SAM-r resolution. These spectraare shown (without SAM-r response weighting or convolution) in spectral irradiance units,modeled with 0.01 nm resolution in Figure 14 for ARs 11877 and 11875. Integrating the twospectra over the band from 0.5 to 2.5 nm and summing both ARs results in an irradiance of0.27 mW/m2. As these two ARs contribute a major portion of the Sun’s irradiance for thetime of the 36.290 flight it is reasonable to compare this value to the concurrent irradiancefrom the XPS on the Solar EUV Experiment (SEE) onboard TIMED level 4 full-disk spectra(Woods et al., 2008) integrated over the same band that gives a value of 0.23 mW/m2. Thisagreement, within 17 %, is acceptable considering TIMED/SEE irradiances are based onbroad band filtered-diode measurements and must assume a modeled reference spectrum,which can significantly affect their accuracy.
4. Summary and Conclusions
We present calibrated, spectrally resolved SXR measurements of individual ARs obtainedon a sounding rocket flight of the EVE calibration payload. These measurements with themodified version of the EVE/SAM instrument demonstrate novel instrumentation and asso-ciated analysis technique. In spite of their scientific value and practical utility for studyingsolar SXR dynamics and its geoeffectiveness, very few such measurements are available.

3580 S. Wieman et al.
Figure 13 Comparison of SAM-r spectral profile for AR 11875 to an AR spectral model for a 4 MK isother-mal plasma with Fe xvii 3s/3d line ratios adjusted to match those based on the atomic data of Bhatia andDoschek (1992). Good agreement between the model and observation is evident throughout the spectralrange analyzed, with much better agreement compared to CHIANTI v8 based on Fe xvii data of Liang andBadnell (2010) for the peak around 1.7 nm associated with Fe xvii 2p6–2p5–3s emissions. The gray bandsurrounding the profile represents peak height uncertainty equal to the standard deviation of pixel DN valuesamong the 25 ten-second exposures used to determine the average profile.
Figure 14 Spectra determinedfor ARs 11877 (blue curve) and11875 (red curve) with 0.01 nmresolution based on theforward-fitting model approachdescribed in Section 3.
Furthermore, neither current nor near-future planned satellite missions are expected to fillthis gap at a spectral resolution comparable to the data discussed in this article.
Over most of the 0.5- to 2.5-nm spectral range they cover, our measurements are fitwell by a CHIANTI v8 model based on the “active-region-dem” profile (included withthe CHIANTI distribution). However, a distinct discrepancy is evident in the intensity ofFe xvii emissions associated with the 2p6–2p5–3s transitions near 1.7 nm. Isothermal 4 MKmodel spectra with Fe xvii line intensity ratios consistent with atomic data from Bhatia andDoschek (1992) provide a better match for our data, particularly with regard to the inten-sity of the 1.7 nm lines. The ratio of the Fe xvii lines suggests that the AR 11877 is hotterthan the AR 11875. This result is confirmed with analysis of the active regions imaged byXRT. The agreement for this pairing of observations and atomic data, however, is differentfrom that found in the comparisons of Del Zanna (2011) for which Fe xvii line intensity

SXR Observations of ARs 3581
ratios from the atomic data of Liang and Badnell (2010) were in good agreement with ra-tios observed in a carefully selected set of solar measurements using crystal spectrometers.Del Zanna’s study indicated that past differences between predicted Fe xvii line ratios andthose observed on the Sun could be resolved based on the use of the updated atomic dataand that (except for during the peak of large solar flares) other effects, such as opacity, werenot needed to explain such reported discrepancies. Our differing results suggest that otherprocesses affecting observed intensities may yet need to be considered, and highlight theneed for further spectrally resolved solar measurements in this wavelength range.
Reflights of the EVE sounding rocket could provide further measurements of the typepresented here. The Marshall Grazing Incidence X-ray Spectrograph (MaGIXS), as reportedby Kobayashi et al. (2011), sounding rocket will provide complementary narrow field ofview (8 arcminute-long slit) spectrally resolved measurements from 0.6 to 2.3 nm, a con-tinuous dataset from a space based observatory over an extended mission including SXRspectra, for which these Fe lines resolved including a range of activity levels could answerthis question more conclusively. The adaptability of the SAM-r grating and pinhole camerainstrument design to a variety of spacecraft, including small platforms such as CubeSats,and the demonstrated effectiveness of this approach make it a promising candidate for sucha mission.
Acknowledgements This work was supported in part by NASA/University of Colorado subcontract 153-5979.
Disclosure of Potential Conflicts of Interest The authors declare that they have no conflicts of interest.
Open Access This article is distributed under the terms of the Creative Commons Attribution 4.0 Inter-national License (http://creativecommons.org/licenses/by/4.0/), which permits unrestricted use, distribution,and reproduction in any medium, provided you give appropriate credit to the original author(s) and the source,provide a link to the Creative Commons license, and indicate if changes were made.
References
Asgari-Targhi, M., Van Ballegooijen, A.A., Cranmer, S.R., DeLuca, E.E.: 2013, Astrophys. J. 773(2), 111.DOI.
Bhatia, A.K., Doschek, G.A.: 1992, At. Data Nucl. Data Tables 52(1), 1. DOI.Brickhouse, N.S., Raymond, J.C., Smith, B.W.: 1995, Astrophys. J. 97, 551. DOI.Brown, G.V., Beiersdorfer, P., Liedahl, D.A., Widmann, K., Kahn, S.M.: 1998, Astrophys. J. 502(2), 1015.
DOI.Burek, A.J., Barrus, D.M., Blake, R.L., Fenimore, E.E.: 1981, Astrophys. J. 243, 660.Caffau, E., Ludwig, H.G., Steffen, M., Freytag, B., Bonifacio, P.: 2011, Solar Phys. 268(2), 255. DOI.Cargill, P.J.: 2014, Astrophys. J. 784(1), 49. DOI.Caspi, A., Woods, T.N., Warren, H.: 2015, Astrophys. J. Lett. 802, L2. DOI.Chamberlin, P.C., Woods, T.N., Crotser, D.A., Eparvier, F.G., Hock, R.A., Woodraska, D.L.: 2009, Geophys.
Res. Lett. 36(5), L05102. DOI.Davila, J.M.: 2012, In: AAS Slitless Spectroscopy Meeting Abstracts, 220.Del Zanna, G.: 2006, Astron. Astrophys. 459(1), 307. DOI.Del Zanna, G.: 2011, Astron. Astrophys. 536, A59. DOI.Del Zanna, G., Mason, H.E.: 2014, Astron. Astrophys. 565, A14. DOI.Del Zanna, G., Berrington, K.A., Mason, H.E.: 2004, Astron. Astrophys. 422(2), 731. DOI.Del Zanna, G., Dere, K.P., Young, P.R., Landi, E., Mason, H.E.: 2015, Astron. Astrophys. 582, A56. DOI.Dere, K.P., Landi, E., Mason, H.E., Monsignori Fossi, B.C., Young, P.R.: 1997, Astron. Astrophys. Suppl.
125(1), 149. DOI.Didkovsky, L., Judge, D., Wieman, S., Woods, T.N., Jones, A.: 2012, Solar Phys. 275, 179. DOI.Feldman, U.: 1992, Phys. Scr. 46(3), 202. DOI.Fox, J.L., Kankelborg, C.C., Thomas, R.J.: 2010, Astrophys. J. 719(2), 1132. DOI.

3582 S. Wieman et al.
Hock, R.A., Chamberlin, P.C., Woods, T.N., Crotser, D., Eparvier, F.G., Woodraska, D.L., Woods, E.C.: 2012,Solar Phys. 275, 145. DOI.
Hutcheon, R.J., Pye, J.P., Evans, K.D.: 1976, Mon. Not. Roy. Astron. Soc. 175(3), 489.Kankelborg, C.C., Thomas, R.J.: 2001, In: SPIE 4498, 16.Kato, T., Fujiwara, T., Hanaoka, Y.: 1998, Astrophys. J. 492(2), 822. DOI.Klimchuk, J.A.: 2006, Solar Phys. 234(1), 41. DOI.Kobayashi, K., Cirtain, J., Golub, L., Winebarger, A., Hertz, E., Cheimets, P., Caldwell, D., Korreck, K.,
Robinson, B., Reardon, P., Kester, T.: 2011, In: SPIE Optical Engineering and Applications Conf. Ser.81471M.
Laming, J.M., Kink, I., Takacs, E., Porto, J.V., Gillaspy, J.D., Silver, E.H., Schnopper, H.W., Bandler, S.R.,Brickhouse, N.S., Murray, S.S., Barbera, M.: 2000, Astrophys. J. Lett. 545(2), L161. DOI.
Landi, E., Young, P.R., Dere, K.P., Del Zanna, G., Mason, H.E.: 2013, Astrophys. J. 763, 86. DOI.Liang, G.Y., Badnell, N.R.: 2010, Astron. Astrophys. 518, A64. DOI.Lin, A.C., Nightingale, R.W., Tarbell, T.D.: 2001, Solar Phys. 198(2), 385. DOI.Lin, C.Y., Bailey, S.M., Jones, A., Woodraska, D., Caspi, A., Woods, T.N., Eparvier, F.G., Wieman, S.R.,
Didkovsky, L.V.: 2016, J. Geophys. Res. 121, 1. DOI.Mason, J.P., Woods, T.N., Caspi, A., Chamberlin, P.C., Moore, C., Jones, A., Kohnert, R., Li, X., Palo, S.,
Solomon, S.: 2016, J. Spacecr. Rockets 53(2), 328. DOI.Neupert, W.M., Epstein, G.L., Thomas, R.J., Thompson, W.T.: 1992, Solar Phys. 137(1), 87. DOI.Neupert, W.M.: 2006, Adv. Space Res. 37(2), 238. DOI.Oktem, F.S., Kamalabadi, F., Davila, J.M.: 2013, In: IEEE International Conference on Acoustics, Speech
and Signal Processing 2169.Parkinson, J.H.: 1973, Astron. Astrophys. 24, 215. http://adsabs.harvard.edu/abs/1973A.Parkinson, J.H.: 1975, Solar Phys. 42(1), 183. DOI.Phillips, K.J.H., Fawcett, B.C., Kent, B.J., Gabriel, A.H., Leibacher, J.W., Wolfson, C.J., Acton, L.W., Parkin-
son, J.H., Culhane, J.L., Mason, H.E.: 1982, Astrophys. J. 256, 774.Phillips, K.J.H., Greer, C.J., Bhatia, A.K., Coffey, I.H., Barnsley, R., Keenan, F.P.: 1997, Astron. Astrophys.
324, 381.Raftery, C.L., Krucker, S., Lin, R.P.: 2011, Astrophys. J. Lett. 743, L27. DOI.Raftery, C.L., Bloomfield, D.S., Gallagher, P.T., Seaton, D.B., Berghmans, D., De Groof, A.: 2013, Solar
Phys. 286(1), 111. DOI.Raymond, J.C., Smith, B.W.: 1986, Astrophys. J. 306, 762.Saba, J.L.R., Schmelz, J.T., Bhatia, A.K., Strong, K.T.: 1999, Astrophys. J. 510(2), 1064. DOI.Schmelz, J.T., Reames, D.V., von Steiger, R., Basu, S.: 2012, Astrophys. J. 755(1), 7. DOI.Smith, D.M., Lin, R.P., Turin, P., Curtis, D.W., Primbsch, J.H., Campbell, R.D., Abiad, R., Schroeder, P.,
Cork, C.P., Hull, E.L., Landis, D.A., Madden, N.W., Malone, D., Pehl, R.H., Raudorf, T., Sangsingkeow,P., Boyle, R., Banks, I.S., Shirey, K., Schwartz, R.: 2002, Solar Phys. 210(1), 33. DOI.
Sojka, J.J., Jensen, J., David, M., Schunk, R.W., Woods, T., Eparvier, F.: 2013, J. Geophys. Res. 118(8), 5379.DOI.
Tousey, R., Bartoe, J.D., Brueckner, G.E., Purcell, J.D.: 1977, Appl. Opt. 16(4), 870.Warren, H.P., Mariska, J.T., Lean, J.: 2001, J. Geophys. Res. 106(A8), 15745. DOI.Winebarger, A.R., Schmelz, J.T., Warren, H.P., Saar, S.H., Kashyap, V.L.: 2011, Astrophys. J. 740(1), 2. DOI.Woods, T.N., Chamberlin, P.C., Peterson, W.K., Meier, R.R., Richards, P.G., et al.: 2008, Solar Phys. 250(2),
235. DOI.Woods, T.N., Eparvier, F.G., Hock, R., Jones, A.R., Woodraska, D., Judge, D., Didkovsky, L., Lean, J.,
Mariska, J., Warren, H., et al.: 2012, Solar Phys. 275, 115. DOI.Young, P.R., Del Zanna, G., Landi, E., Dere, K.P., Mason, H.E., Landini, M.: 2003, Astrophys. J. 144(1), 135.
DOI.