sophos group plc interim results presentation
TRANSCRIPT

Half-Year Financial Report 2016

Our BusinessSophos has an enviable 30 year track record of innovation and growth, with an experienced leadership team, an installed base of over 240,000 customers, and a global network of over 26,000 partners.
Our MissionTo be the best in the world at delivering complete IT security to mid-market enterprises and the channel that serves them.
Our WorldIT security market of $38 billion growing at 7%.
A Proven Global Leader in Delivering Complete IT Security to the Mid-Market
The Sophos Group is a leading global provider of cloud-enabled enduser and network security solutions, offering organisations end-to-end protection against known and unknown IT security threats through products that are easy to install, configure, update and maintain. The Group has over 30 years of experience in enterprise security and has built a portfolio of products that protects over 240,000 organisations and over 100 million endusers in 150 countries across a variety of industries.
For further information please visit: www.sophos.com.

ContentsHighlights 01
Chief Executive Officer’s Review 04
Financial Review 06
Financial Statements 14
Independent Review Report 31
Company Information 32
In the first half of the financial year, Sophos continued to build upon the success of the Group’s highly differentiated strategy to deliver a superior security platform for a massive addressable market of over 60 million small and mid-market enterprises worldwide.
For the year-ending 31 March 2017, the Board continues to expect to deliver mid-teens percentage billings growth on a like-for-like basis whilst also delivering modest cash EBITDA margin expansion, reflecting the operational leverage in the business. Revenue growth is expected to be mid-teens. Unlevered free cash flow is expected to approximately double in FY17.
Highlights
+15.1%Like-for-like
billings growth
$63.3MNet cash flow
from operating activities
$62.2MUnlevered free
cash flow
+9.7%Revenuegrowth
($24.6M)Operating loss
$50.9MCash EBITDA
(H1, FY16: $4.6M)
(H1, FY16: $19.9M)
(H1, FY16: ($13.4M))
(H1, FY16: $45.5M)
HALF-YEAR FINANCIAL REPORT 01

HighlightsSTRONG H1 PERFORMANCE; FULL-YEAR OUTLOOK REAFFIRMED
Financial and operational highlights• H1, FY17 like-for-like5 billings up 15.1 percent year-on-year (“YOY”) to $282.3 million
(15.6 percent reported)
− New customer billings6 up 19.9 percent YOY, driven by Unified Threat Management (“UTM”) and Sophos Central platform (c. +150 percent YOY)
− Like-for-like subscription billings increased by 19.4 percent YOY (19.7 percent reported)
− Cross-sell of UTM and Endpoint improved to 8.4 percent (H1, FY16: 6.4 percent)
− Renewal rate, including upsell, improved to 104.1 percent (H1, FY16: 100.5 percent)
• Reported revenue grew 9.7 percent YOY and 10.4 percent on a constant currency basis, driven by subscription revenue which increased 12.7 percent YOY
• Deferred revenue balance increased to $511.3 million (FY16: $498.7 million) driven by strong billings growth
• Cash EBITDA margin 18.2 percent (H1, FY16: 18.8 percent), reflecting further investment in R&D; the company continues to expect modest YOY margin improvement for FY17
• Operating loss increased as a consequence of increased R&D investment, a higher share-based payment expense and for the period a higher deferral of revenue from a shift in the mix of billings to recurring subscription contracts
H1, FY17$M
(Reported)
H1, FY16$M
(Reported)
Growth%
(Reported)
Non-GAAP measures:
Billings1 279.8 242.0 15.6
Cash EBITDA2 50.9 45.5 11.9
Unlevered free cash flow3 62.2 19.9 212.6
GAAP measures:
Revenue4 256.9 234.2 9.7
Operating loss (24.6) (13.4) n.m.
Net cash flow from operating activities 63.3 4.6 n.m.
02

• Unlevered free cash flow of $62.2 million, a significant increase YOY due to improvements in operating performance and cash management and in part aided by first/second half phasing
• Significant innovation during the period, with release of new next-generation endpoint protection product, Sophos Intercept X, further extension of Sophos Central cloud-based management platform, and the industry’s first synchronized encryption product, Sophos SafeGuard
• Proposed interim dividend of 1.3 US Cents per share (+86 percent YOY)
1. Billings represents the value of products and services invoiced to customers after receiving a purchase order from the customer and delivering products and services to them, or for which there is no right to a refund for undelivered items. Billings does not equate to statutory revenue.
2. Cash earnings before interest, taxation, depreciation and amortisation (“Cash EBITDA”) is defined as the Group’s operating (loss)/ profit adjusted for depreciation and amortisation charges, any gain or loss on the sale of tangible and intangible assets, share option charges, unrealised foreign exchange differences and exceptional items, with billings replacing recognised revenue.
3. Unlevered free cash flow represents Cash EBITDA less purchases of property, plant and equipment and intangibles, plus cash flows in relation to changes in working capital and taxation.
4. The majority of billings are for licence subscriptions which are recognised as revenue over the period of the contract. Revenue growth is primarily a function of prior period billings and hence will not yet reflect the improved billings performance of the current period.
5. Like-for-like billings represent billings on a constant currency basis excluding disposals and including acquisitions from the point of acquisition plus the pre-acquisition billings of any acquired companies on a reported basis. Like-for-like billings are presented to enhance comparability.
6. Excludes the acquired businesses of Cyberoam, Reflexion and SurfRight on a constant currency billings basis.
“ We are pleased with our first half results which were in-line with our outlook, and especially pleased with our cash flow performance which was ahead of our outlook. We continued to outgrow the IT security market, supported by a strong demand environment in our target market, industry-leading technology, the quality and reach of our extensive partner channel, the consistency of our operational execution, and the strength of our financial model, where we benefit from high levels of recurring subscription business.
As we enter the second half of the fiscal year we expect continued strong growth, in particular as we benefit from key new product releases in next-generation endpoint and next-generation firewall, and the continued momentum of our Sophos Central cloud management platform.”
Kris Hagerman, Chief Executive Officer
HALF-YEAR FINANCIAL REPORT 03

Operational reviewOur commitment to offering a complete and advanced security portfolio that is integrated and managed through a single, easy-to-use cloud-based platform, sold and supported through a 100 percent channel sales model, continues to resonate with our customers and partners, and sets us apart from other vendors.
Our results for the first half of the year reflected strong demand for our industry-leading technology in both enduser and network security, the quality and reach of our extensive partner channel, the consistency of our operational execution and the strength of our financial model, where we benefit from high levels of recurring subscription business. Our customer numbers grew to over 240,000 from approximately 220,000 at the prior year-end. Our differentiated strategy is working, and is translating into progress across our key financial and operating metrics. We generated like-for-like billings growth of over 15 percent, and strong cash flow generation. We enhanced our cross-sell and up-sell within our existing customer base, we continued to grow our new customers, and we also grew our partner ecosystem.
During the first half of the year our operating loss increased from $13.4 million to $24.6 million, reflecting increased R&D investment, additional share-based payments and for the period a shift in the mix of billings to recurring subscription contracts where revenue is deferred and recognised over the contract length.
The performance from Sophos Central, our integrated cloud-managed security platform was a highlight, growing to over 30,000 customers and contributing more than 10 percent of subscription billings for the first time – more than doubling both billings and revenue in the period compared to a year ago. In H1, over 50 percent of new customer billings for endpoint were on Sophos Central. Sophos Central is not only a highly differentiated offering, but also is a catalyst driving multiple other opportunities, including improved cross-sell and up-sell, and enhanced relationships, margin opportunity, and customer penetration with our reseller partners.
We further strengthened our management team during the first half. Tony Young joined in the role of Chief Information Officer (CIO) responsible for the strategy, security and management of the global IT organisation at Sophos. In early October we also announced the appointment of Eleanor Lacey as Senior Vice President and General Counsel.
Continued focus on innovationSophos is committed to delivering advanced, innovative, enterprise-grade security to our customers in a way that is easy to deploy, manage, and use. We believe that by building a complete portfolio of effective and highly-rated individual IT security offerings, and then meaningfully integrating them to actively communicate with each other, all managed in a single cloud-based platform, we can deliver better and easier to use protection than competitors’ standalone offerings.
In the first half of the financial year, Sophos continued to build upon the success of our highly differentiated strategy to deliver a superior security platform for a massive addressable market of over 60 million small and mid-market enterprises worldwide.
Chief Executive Officer’s Review
04

In the period we delivered a number of next-generation enhancements to our flagship Endpoint Protection product and introduced an exciting, signature-less anti-exploit, anti-ransomware, and root cause analytics product called Intercept X. Intercept X is a new product that runs alongside any endpoint protection product from any vendor (including our Sophos Central cloud endpoint offering) to enhance protection against zero-day threats and previously unknown ransomware. Its high detection rates, ease of installation, cloud-based management, and powerful analytics are opening new opportunities for our partners worldwide, and the interest we have seen from customers for this product has been dramatic since its launch in late September. In the five weeks from the launch of Intercept X through the end of October, we hosted over 12,000 customers in more than 50 online webinars to learn more about Intercept X.
Intercept X also represents a powerful new core component of Sophos’ synchronized security strategy, as it is fully enabled with the Sophos Security Heartbeat™ to share threat intelligence with Sophos’ next-generation XG Firewall and SafeGuard Encryption solutions for a coordinated and automated response to attacks.
In a further enhancement of our synchronized security strategy, we launched Synchronized Encryption, the next version of SafeGuard Encryption that protects data against theft from malware, attackers or accidental leaks. Previously, enterprise-grade encryption has been considered too difficult and too complex for most mid-sized organisations to adopt. Synchronized Encryption brings the best practice of “always-on” file-level encryption to protect data accessed from mobile devices, laptops, desktops, on-premise networks and cloud-based file sharing applications. Sophos is the first vendor to deliver this persistent, transparent and proactive encryption that protects files across Windows, Mac, iOS or Android platforms by default.
Expansion of our cloud-based management platform, Sophos Central, has continued during the period. We enhanced numerous existing components in Sophos Central, including endpoint security, server security, mobile security, and MSP and partner-centric features. We also introduced a host of new offerings to Sophos Central, including email, encryption, wireless, and web security. Sophos Central is a differentiated platform that delivers enhanced protection, improved manageability, and synchronization across multiple security components; it is resonating with our customers and partners, and has become a key growth driver for the company.
Shortly after the period, on October 4, we delivered our XG Firewall v16.0 next-generation firewall. This represents a significant advance in our leading firewall offering, with over 100 new features, numerous enhancements to the user experience to improve navigation, policy management, and logging, and additional synchronized security features to improve protection, enforcement, and reporting. To address the growing opportunity in the IaaS market, Sophos also made the next-generation XG Firewall available through the Microsoft Azure marketplace, in addition to our existing AWS offerings, where Sophos is one of the leaders in the emerging space of security for cloud-based infrastructures.
Channel progress and industry recognitionThe quality and reach of our unique 100 percent channel sales model continued to gain momentum. We grew our overall number of partners to 26,000, and increased our blue chip partners (those generating at least 5 transactions in the prior 6 months) from 4,700 at the prior year-end to 5,400.
Sophos continued to be recognised as an industry leader by leading industry publications. At the 2016 SC Magazine awards in Europe, Sophos was once again voted the UTM category winner by a panel of independent judges. In August of 2016, the readers of Computer Reseller News (“CRN”), the leading channel publication in the US, voted Sophos the overall winner in two security-related categories, Data Security and Network Security, and for Product Innovation in the Endpoint Security category at the Annual Report Card (“ARC”) awards. In the UK CRN named Sophos the winner in both the Technology Innovation and Best Website categories at their annual awards. Sophos also continued to receive positive recognition and endorsement from industry analysts. Gartner again recognised Sophos as a “Leader” in the 2016 UTM Magic Quadrant, for the fifth consecutive year. And in October, Sophos was positioned as a “Leader” in Forrester’s new Wave report for Endpoint Security Suites, and received the highest scores in the strategy category.
I’d like to thank our employees and partners for all their contributions in this successful first half and for delivering on our vision of complete and intelligent security made simple, to protect our growing group of customers of all sizes, all over the world.
Kris HagermanChief Executive Officer
HALF-YEAR FINANCIAL REPORT 05
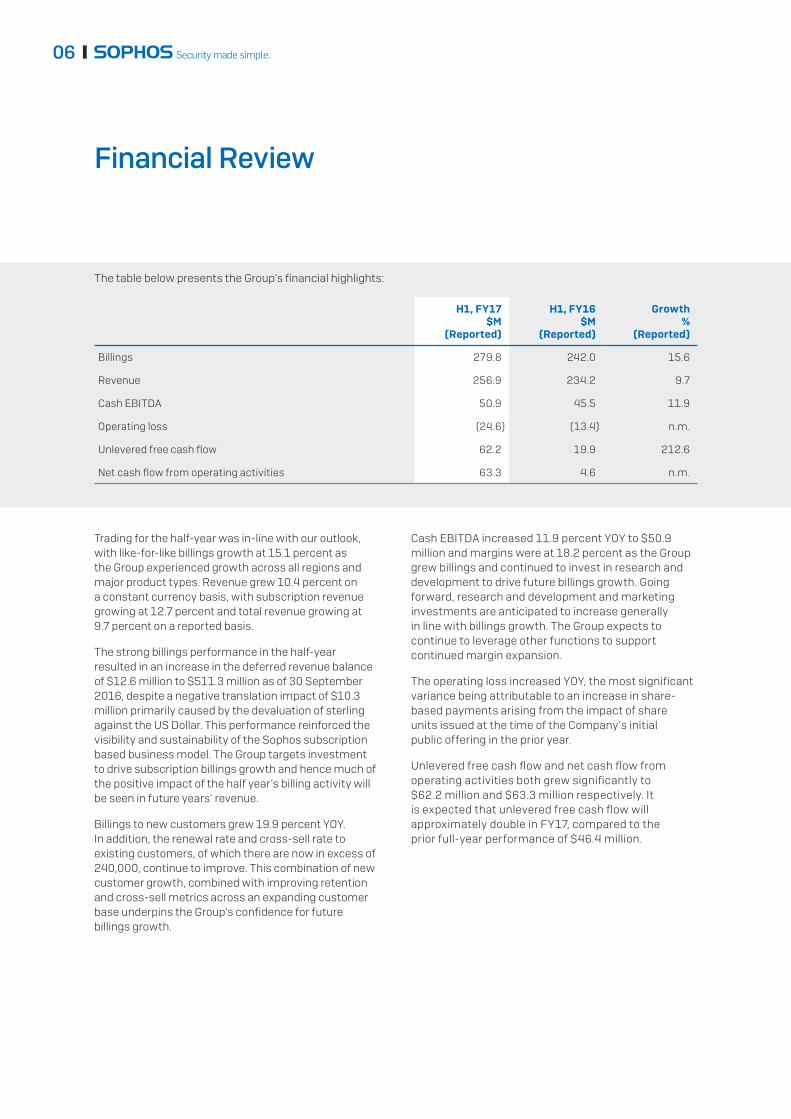
Trading for the half-year was in-line with our outlook, with like-for-like billings growth at 15.1 percent as the Group experienced growth across all regions and major product types. Revenue grew 10.4 percent on a constant currency basis, with subscription revenue growing at 12.7 percent and total revenue growing at 9.7 percent on a reported basis.
The strong billings performance in the half-year resulted in an increase in the deferred revenue balance of $12.6 million to $511.3 million as of 30 September 2016, despite a negative translation impact of $10.3 million primarily caused by the devaluation of sterling against the US Dollar. This performance reinforced the visibility and sustainability of the Sophos subscription based business model. The Group targets investment to drive subscription billings growth and hence much of the positive impact of the half year’s billing activity will be seen in future years’ revenue.
Billings to new customers grew 19.9 percent YOY. In addition, the renewal rate and cross-sell rate to existing customers, of which there are now in excess of 240,000, continue to improve. This combination of new customer growth, combined with improving retention and cross-sell metrics across an expanding customer base underpins the Group’s confidence for future billings growth.
Cash EBITDA increased 11.9 percent YOY to $50.9 million and margins were at 18.2 percent as the Group grew billings and continued to invest in research and development to drive future billings growth. Going forward, research and development and marketing investments are anticipated to increase generally in line with billings growth. The Group expects to continue to leverage other functions to support continued margin expansion.
The operating loss increased YOY, the most significant variance being attributable to an increase in share-based payments arising from the impact of share units issued at the time of the Company’s initial public offering in the prior year.
Unlevered free cash flow and net cash flow from operating activities both grew significantly to $62.2 million and $63.3 million respectively. It is expected that unlevered free cash flow will approximately double in FY17, compared to the prior full-year performance of $46.4 million.
Financial Review
The table below presents the Group’s financial highlights:
H1, FY17$M
(Reported)
H1, FY16$M
(Reported)
Growth%
(Reported)
Billings 279.8 242.0 15.6
Revenue 256.9 234.2 9.7
Cash EBITDA 50.9 45.5 11.9
Operating loss (24.6) (13.4) n.m.
Unlevered free cash flow 62.2 19.9 212.6
Net cash flow from operating activities 63.3 4.6 n.m.
06
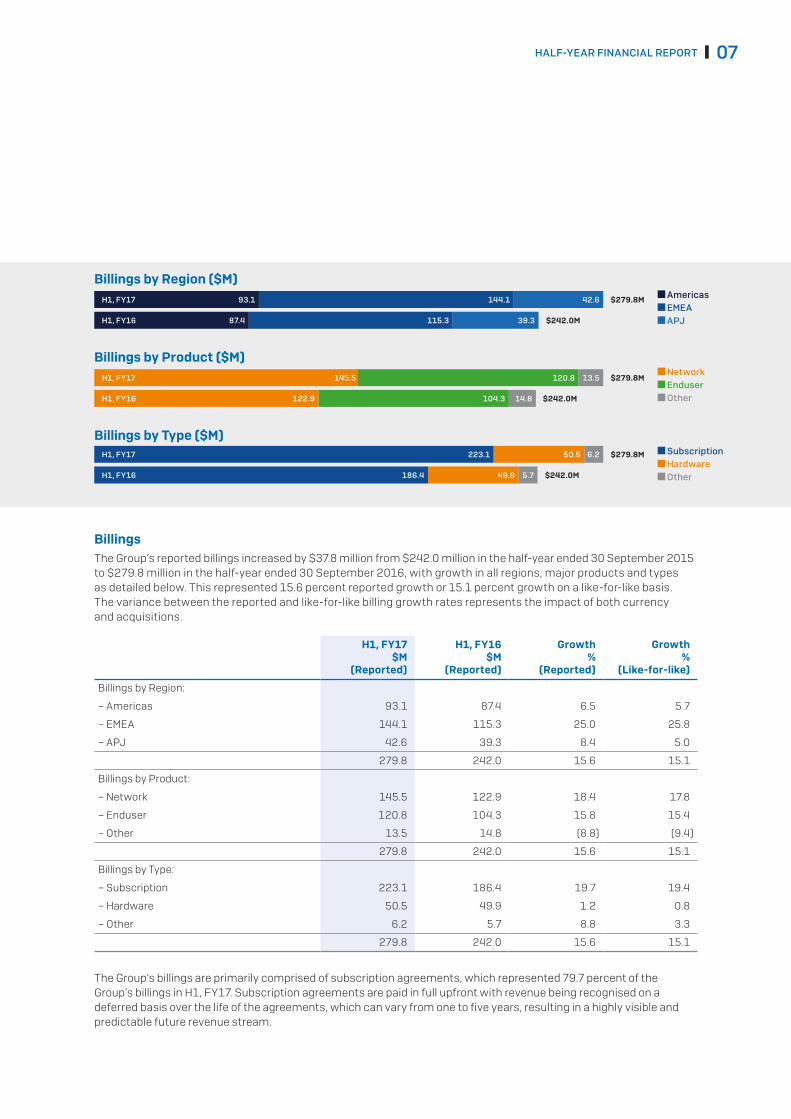
BillingsThe Group’s reported billings increased by $37.8 million from $242.0 million in the half-year ended 30 September 2015 to $279.8 million in the half-year ended 30 September 2016, with growth in all regions, major products and types as detailed below. This represented 15.6 percent reported growth or 15.1 percent growth on a like-for-like basis. The variance between the reported and like-for-like billing growth rates represents the impact of both currency and acquisitions.
H1, FY17$M
(Reported)
H1, FY16$M
(Reported)
Growth%
(Reported)
Growth%
(Like-for-like)
Billings by Region:
– Americas 93.1 87.4 6.5 5.7
– EMEA 144.1 115.3 25.0 25.8
– APJ 42.6 39.3 8.4 5.0
279.8 242.0 15.6 15.1
Billings by Product:
– Network 145.5 122.9 18.4 17.8
– Enduser 120.8 104.3 15.8 15.4
– Other 13.5 14.8 (8.8) (9.4)
279.8 242.0 15.6 15.1
Billings by Type:
– Subscription 223.1 186.4 19.7 19.4
– Hardware 50.5 49.9 1.2 0.8
– Other 6.2 5.7 8.8 3.3
279.8 242.0 15.6 15.1
The Group’s billings are primarily comprised of subscription agreements, which represented 79.7 percent of the Group’s billings in H1, FY17. Subscription agreements are paid in full upfront with revenue being recognised on a deferred basis over the life of the agreements, which can vary from one to five years, resulting in a highly visible and predictable future revenue stream.
Billings by Region ($M)
Billings by Product ($M)
Billings by Type ($M)
H1, FY17 93.1
H1, FY17 145.5
H1, FY17 223.1
H1, FY16 87.4
H1, FY16 122.9
H1, FY16 186.4
144.1
120.8
50.5
115.3
104.3
49.9
42.6
13.5
6.2
39.3
14.8
5.7
$279.8M
$279.8M
$242.0M
$279.8M
$242.0M
$242.0M
Americas EMEA APJ
Network Enduser Other
Subscription Hardware Other
HALF-YEAR FINANCIAL REPORT 07

Financial Review continued
Billings continued
Billings by region AmericasBillings attributable to the Americas increased by $5.7 million to $93.1 million in the half-year ended 30 September 2016, representing 6.5 percent growth on a reported basis and 5.7 percent on a like-for-like basis. The YOY increase was driven by Network growth and continued adoption of the Sophos Central platform. Reported growth includes the impact of billings from Reflexion, a cloud-based Email security company acquired in June 2015. The first half-year growth rate was influenced by the timing of renewals.
EMEABillings attributable to EMEA increased by $28.8 million to $144.1 million in the half-year ended 30 September 2016, representing 25.0 percent growth on a reported basis and 25.8 percent growth on a like-for-like basis. This increase was due to Network growth across new and existing customer business and Enduser growth supported by a substantial increase in the adoption of the Sophos Central platform, which has gained momentum a few quarters behind the Americas, and the contribution from a material contract with an existing customer in the UK.
APJBillings attributable to APJ increased by $3.3 million to $42.6 million in the half-year ended 30 September 2016, representing 8.4 percent growth on a reported basis and 5.0 percent growth on a like-for-like basis primarily driven by the impact of currency. Growth in the region was driven by Enduser billings; as Network billings in the prior year were assisted by a very strong performance in Japan.
Billings by product Network productsThe Group’s billings attributable to Network products increased by $22.6 million to $145.5 million in the half-year ended 30 September 2016, representing 18.4 percent growth on a reported basis and 17.8 percent growth on a like-for-like basis. This was due to 17.0 percent like-for-like growth in UTM sales and an improved performance from the Email and Web products.
Enduser productsThe Group’s billings attributable to Enduser products increased by $16.5 million to $120.8 million in the half-year ended 30 September 2016, representing 15.8 percent growth on a reported basis and 15.4 percent growth on a like-for-like basis. Enduser YOY billings growth was driven by the Sophos Central platform which has continued to gain traction since its launch and the contribution from a material contract with an existing customer in the UK.
Billings by typeSubscription billings increased by $36.7 million to $223.1 million in the half-year ended 30 September 2016, representing 19.7 percent growth on a reported basis and 19.4 percent growth on a like-for-like basis. Hardware billings increased by 1.2 percent to $50.5 million primarily due to a tough comparative including strong hardware sales in Japan; partially offset by a small increase in the proportion of Network billings, which increased from 50.8 percent of billings to 52.0 percent.
Key billings metricsBillings from new customersBillings from new customers remained consistent at 25 percent of total billings.
Retention ratesThe Group’s results are largely driven by revenue generated from subscriptions for its products and services, including professional services and enhanced support services. The Group’s net retention rates include the impact of cross-selling and upselling, which helps the Group evaluate its success in fully leveraging its broad product portfolio throughout its installed customer base. The Group’s net retention rate, excluding Cyberoam, improved in the period from 100.5 percent in the half-year ended 30 September 2015 to 104.1 percent in the half-year ended 30 September 2016.
Billings by sizeSophos’ products are designed for the Group’s target market, mid-market enterprises (defined as enterprises with between 100 and 5,000 employees), but are frequently also bought by both smaller and larger enterprises. In H1, FY17, the proportion of billings to small and medium sized enterprises remained consistent YOY.
08
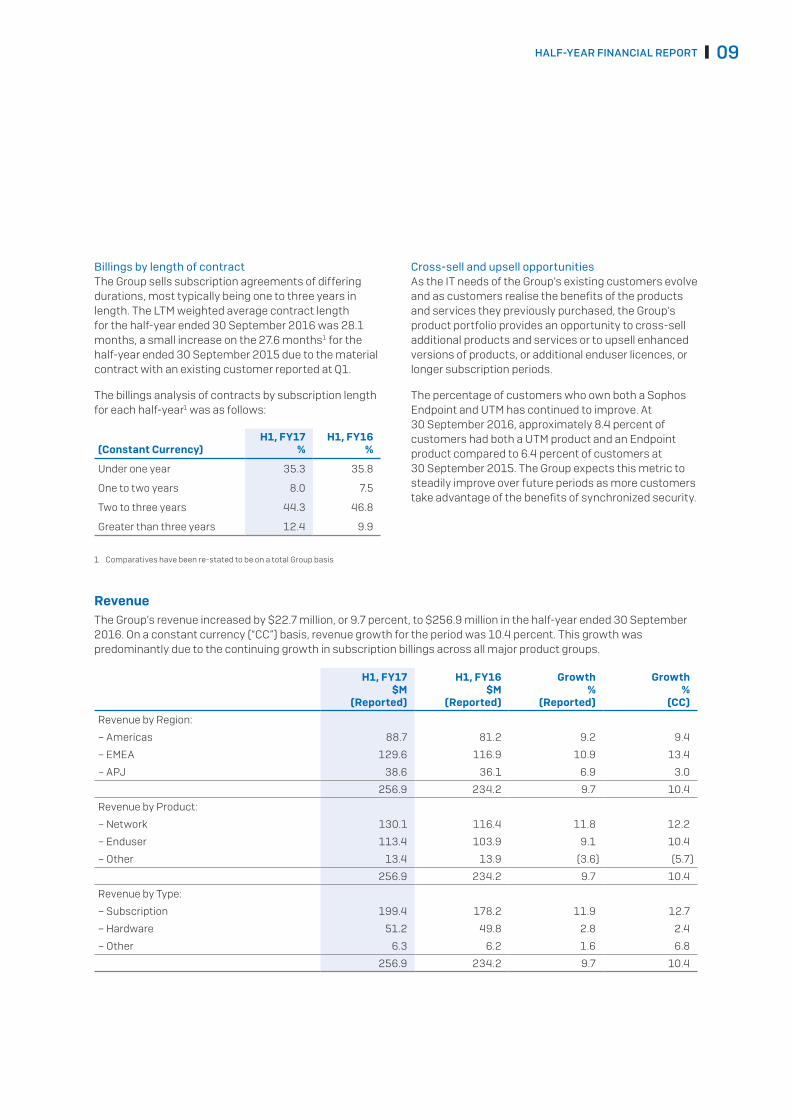
Billings by length of contractThe Group sells subscription agreements of differing durations, most typically being one to three years in length. The LTM weighted average contract length for the half-year ended 30 September 2016 was 28.1 months, a small increase on the 27.6 months1 for the half-year ended 30 September 2015 due to the material contract with an existing customer reported at Q1.
The billings analysis of contracts by subscription length for each half-year1 was as follows:
(Constant Currency)H1, FY17
%H1, FY16
%
Under one year 35.3 35.8
One to two years 8.0 7.5
Two to three years 44.3 46.8
Greater than three years 12.4 9.9
1 Comparatives have been re-stated to be on a total Group basis
Cross-sell and upsell opportunitiesAs the IT needs of the Group’s existing customers evolve and as customers realise the benefits of the products and services they previously purchased, the Group’s product portfolio provides an opportunity to cross-sell additional products and services or to upsell enhanced versions of products, or additional enduser licences, or longer subscription periods.
The percentage of customers who own both a Sophos Endpoint and UTM has continued to improve. At 30 September 2016, approximately 8.4 percent of customers had both a UTM product and an Endpoint product compared to 6.4 percent of customers at 30 September 2015. The Group expects this metric to steadily improve over future periods as more customers take advantage of the benefits of synchronized security.
RevenueThe Group’s revenue increased by $22.7 million, or 9.7 percent, to $256.9 million in the half-year ended 30 September 2016. On a constant currency (“CC”) basis, revenue growth for the period was 10.4 percent. This growth was predominantly due to the continuing growth in subscription billings across all major product groups.
H1, FY17$M
(Reported)
H1, FY16$M
(Reported)
Growth%
(Reported)
Growth%
(CC)
Revenue by Region:
– Americas 88.7 81.2 9.2 9.4
– EMEA 129.6 116.9 10.9 13.4
– APJ 38.6 36.1 6.9 3.0
256.9 234.2 9.7 10.4
Revenue by Product:
– Network 130.1 116.4 11.8 12.2
– Enduser 113.4 103.9 9.1 10.4
– Other 13.4 13.9 (3.6) (5.7)
256.9 234.2 9.7 10.4
Revenue by Type:
– Subscription 199.4 178.2 11.9 12.7
– Hardware 51.2 49.8 2.8 2.4
– Other 6.3 6.2 1.6 6.8
256.9 234.2 9.7 10.4
HALF-YEAR FINANCIAL REPORT 09

Revenue continuedAs the majority of the Group’s billings relate to subscriptions (H1, FY17: 79.7 percent; H1, FY16: 77.0 percent), the benefit from increased billings is spread over a number of years on the subsequent recognition of deferred revenue. Reported revenue in the half-year of $256.9 million comprised $164.0 million from recognition of prior period deferred revenues and $92.9 million from new billings. The deferred revenue balance at the end of September of $511.3 million increased $12.6 million from the end of the prior year, an increase of 2.5 percent despite a negative translation impact of $10.3 million resulting from the devaluation of sterling against the US Dollar.
Revenue in the Americas increased by 9.2 percent to $88.7 million in the half-year ended 30 September 2016 due to growth in both Network and Enduser sales.
EMEA revenue increased by 10.9 percent to $129.6 million in the half-year ended 30 September 2016, primarily due to growth in UTM billings.
APJ revenue increased by 6.9 percent to $38.6 million in the half-year ended 30 September 2016, predominantly due to strong growth in Enduser billings, despite a tough compare for Network revenue in Japan.
Cost of salesThe Group’s cost of sales increased by $7.9 million to $58.4 million in the half-year ended 30 September 2016, primarily due to the continued growth of Network product billings, which have a larger hardware component.
Sales and marketingThe Group’s sales and marketing expenses increased by $12.7 million or 14.3 percent, to $101.4 million in the half-year ended 30 September 2016. Marketing expenses are increasing to broadly match the investment with billings growth and sales productivity improved as the Group continued to leverage the channel.
Research and development The Group’s research and development expenses increased by $10.3 million, or 22.6 percent, to $55.9 million in the half-year ended 30 September 2016. This reflected the continued investment in the development of new products and enhancements of existing products and the phasing of costs to higher YOY growth in the first half of the year compared to the second half.
General finance and administrationThe Group’s general finance and administration expenses, excluding exceptional items, foreign exchange and the amortisation of intangible assets, increased by $15.7 million, or 82.2 percent, to $34.8 million in the half-year ended 30 September 2016. The increase was almost entirely attributable to the share-based payment expense, which increased by $14.0 million following the issue of new equity awards at the time of the Initial Public Offering of the Company’s shares in the prior period. Excluding share-based payments, exceptional items and the amortisation of intangible assets, underlying general finance and administration expenses represented 6.6 percent of billings (H1, FY16: 7.0 percent) as the Group continued to leverage its strong back office function.
The Group’s exceptional items, included within general finance and administration expenses, decreased by $6.4 million to $19.8 million in the half-year ended 30 September 2016. Prior period exceptional items included $17.6 million incurred during the Initial Public Offering of the Company’s shares, as well as acquisition costs and expenses incurred in relation to the defence or settlement of claims brought against a number of our employees by their former employer and certain intellectual property litigation cases. Current period exceptional items relate to expenses incurred in relation to the defence of certain claims brought against the Group in relation to the previously announced intellectual property litigation case brought by Finjan Inc and includes a $15.0 million provision for a one-time damages award in a jury verdict to Finjan Inc. This verdict represents the next step in an ongoing legal process and the Group is considering all options including an appeal of the verdict.
Amortisation of intangible assetsThe Group’s amortisation of intangible assets decreased by $4.8 million, or 30.8 percent, to $10.8 million in the half-year ended 30 September 2016. This decrease was due to the reduction in amortisation charges associated with acquisitions in prior years as there were no acquisitions in the current period and the Group’s policy of amortising acquired intangibles on a reducing balance basis.
Financial Review continued
10

Currency movements and impactThe Group’s foreign exchange loss was $0.4 million in the half-year ended 30 September 2016, compared with a loss of $1.9 million in the half-year ended 30 September 2015. This relatively small net expense is a consequence of the Group’s largely naturally hedged position.
Cash EBITDA Whilst subscription billings are recognised in the profit and loss account as revenue over the length of the contract, substantially all of the costs in connection with the contract are incurred and recognised in the profit and loss account upfront. The Directors believe that cash EBITDA (billings less expenses) is a useful supplemental measure of earnings that provides visibility on actual cash earned in the period and is a better reflection of the profitability of the contract signed, as it matches cash inflows with nearly all of the cash costs of delivering the relevant service to the customer.
On a reported basis, cash EBITDA increased by 11.9 percent to $50.9 million in the half-year ended 30 September 2016. On a constant currency basis, cash EBITDA growth was 7.0 percent as a result of the continued improvement in billings partially offset by further investment in research and development as the Group continues to innovate and release new products. Cash EBITDA margins decreased year-over-year to 18.2 percent from 18.8 percent as a result of the continued investment for growth, referred to above.
Operating lossThe Group’s operating loss was $24.6 million in the half-year ended 30 September 2016 compared to a loss of $13.4 million in the prior year largely as a consequence of an increased share-based payment expense, following the issue of equity instruments at the time of the Initial Public Offering and higher research and development expenses.
Net finance costsThe Group’s net finance costs decreased by $25.7 million to $3.8 million in the half-year due to the impact of the Initial Public Offering of the Company’s shares in the prior year, the proceeds of which enabled the repayment of both the amounts due to the previous parent company and $87.7 million of bank debt.
Income taxThe Group’s tax charge for the half year was $5.7 million (H1, FY16: $4.2 million) with an effective tax rate of -20.1 percent (H1, FY16: -9.8 percent). As in the prior year, the tax charge arises against a reported loss for the period as a consequence of local subsidiary taxable profits.
Loss for the periodThe Group’s loss for the period decreased by $13.0 million, from a loss of $47.1 million in the half-year ended 30 September 2015 to a loss of $34.1 million in the half-year ended 30 September 2016 predominantly reflecting the reduction in exceptional expense items and a decrease in finance expenses.
Cash flowUnlevered free cash flow represents cash EBITDA less purchases of property, plant and equipment and intangibles, plus cash flows in relation to changes in working capital and taxation. Unlevered free cash flow is presented to enhance understanding of the Group’s cash generation capability.
H1, FY17 $M
H1, FY16 $M
Adjusted EBITDA 28.0 37.7
Billings deferral 22.9 7.8
Cash EBITDA 50.9 45.5
Net capital expenditure (5.9) (10.9)
Operating cash flow 45.0 34.6
Change in working capital1 22.2 (1.1)
Corporation tax paid (5.0) (13.6)
Unlevered free cash flow 62.2 19.9
1 Excludes the non-cash movement on the provision for the claim brought against the Group in relation to an intellectual property litigation case
Unlevered free cash flow increased to $62.2 million. The improvement was boosted by: lower YOY net capital expenditure; reduced YOY cash tax payments; a significant improvement in working capital and, in part, aided by first/second half phasing.
HALF-YEAR FINANCIAL REPORT 11

Cash flow continuedUnlevered free cash flow can be reconciled to the statutory measure of net cash from operating activities as follows:
H1, FY17 $M
H1, FY16 $M
Net cash flow from operating activities 63.3 4.6
Exceptional items1 4.8 26.2
Net capital expenditure (5.9) (10.9)
Unlevered free cash flow 62.2 19.9
1 Excludes the non-cash movement on the provision for the claim brought against the Group in relation to an intellectual property litigation case
Net cash flow from operating activities significantly increased YOY to $63.3 million from $4.6 million in the prior period, nearly all attributable to the significant improvement in working capital.
Changes in working capitalPositive working capital changes YOY were largely due to the normalisation of creditor balances and an improvement in debtors’ days outstanding to 43 days (FY16: 44 days). Prior year working capital changes including outflows for significant accrued and payable amounts expensed in FY15.
Capital expenditureThe Group’s capital expenditure primarily comprises property, plant and equipment as well as intangible assets. In the half-year ended 30 September 2016, net cash capital expenditure decreased by $5.0 million YOY, as expenditure in the current year is weighted more to the second half.
Cash taxationCorporation tax paid in the period is lower than in the comparative period due to the comparative period including settlements for prior years and in part due to timing of payments with most of the cash tax due for payment in H2 of the current year.
FinancingIn connection with the Initial Public Offering of the Company’s shares that was completed in July 2015, the Group refinanced its external borrowings. In the first half of FY17 the Group repaid the associated revolving credit facility which had been drawn to partially finance the acquisition of SurfRight in December FY16.
Dividends The Directors continue to adopt a progressive dividend policy, reflecting the cash generative nature and long-term earnings potential of the Group. The Directors recommend that the half-year and final dividend be paid in the approximate proportions of one third and two thirds respectively of the total expected annual dividend. Accordingly, the Directors have recommended that the Company will pay an interim dividend in respect of the year-ending 31 March 2017 amounting to 1.3 US Cents per share, an 86 percent increase over the prior half year dividend of 0.7 US Cents per share. The interim dividend will be paid on 16 December 2016 to all shareholders on the register on 18 November 2016.
Nick BrayChief Financial Officer
Financial Review continued
12

Principal Risks and Uncertainties
Directors’ Responsibility Statement
The principal risks and uncertainties which could have a material impact on the Group’s long-term performance set out in the last annual report and financial statements, dated 25 May 2016, remain valid at the date of this report. These risks and uncertainties (in no specific order) are:
• Recruitment and retention of key personnel
• Defects or vulnerabilities in products or services
• False detection of threats
• IT security and cyber risk
• Product portfolio management
• Disruption to day-to-day Group operations
Following the recent decision by the UK population to exit, in due course, from the European Union (“Brexit”), the Directors have considered whether or not this will manifest itself as an additional risk to the Group. On the basis that only 12 percent of the Group’s revenue is sourced from the UK, reflecting the global diversity of the Group’s operations, and as the recent devaluation of the sterling exchange rates has a minor benefit to the Group, given more sterling denominated costs than revenues in a US Dollar denominated functional currency Group, Brexit is not considered to be a principal risk for the Group.
We confirm that to the best of our knowledge:
• The condensed set of financial statements has been prepared in accordance with IAS 34 Interim Financial Reporting as adopted by the EU
• The interim management report includes a fair review of the information required by:
(a) DTR 4.2.7R of the Disclosure and Transparency Rules, being an indication of important events that have occurred during the first six months of the financial year and their impact on the condensed set of financial statements; and a description of the principal risks and uncertainties for the remaining six months of the year; and
(b) DTR 4.2.8R of the Disclosure and Transparency Rules, being related party transactions that have taken place in the first six months of the current financial year and that have materially affected the financial position or performance of the entity during that period; and any changes in the related party transactions described in the last annual report that could do so
By order of the Board
Kris Hagerman Nick BrayChief Executive Officer Chief Financial Officer8 November 2016
HALF-YEAR FINANCIAL REPORT 13

Condensed Consolidated Income Statement
Note
Six-months ended30 September 2016
Unaudited$M
Six-months ended30 September 2015
Unaudited$M
Year- ended31 March 2016
Audited$M
Revenue 3 256.9 234.2 478.2
Cost of sales (58.4) (50.5) (104.4)
Gross profit 198.5 183.7 373.8
Sales and marketing (101.4) (88.7) (184.0)
Research and development (55.9) (45.6) (99.6)
General finance and administration: (65.8) (62.8) (122.9)
– Underlying (18.6) (16.9) (35.7)
– Share-based payments 5 (16.2) (2.2) (16.3)
– Exceptional items 6 (19.8) (26.2) (41.9)
– Amortisation of intangible assets (10.8) (15.6) (29.2)
– Foreign exchange (loss)/gain (0.4) (1.9) 0.2
Operating loss (24.6) (13.4) (32.7)
Finance income – 0.4 0.7
Finance expense 7 (3.8) (29.9) (36.4)
Loss before taxation (28.4) (42.9) (68.4)
Income tax charge 8 (5.7) (4.2) (3.5)
Loss for the period (34.1) (47.1) (71.9)
Earnings per Share ($ cents) 9
Basic and diluted EPS (7.6) (11.0) (16.4)
Adjusted EPS 11.3 10.6 27.5
For the six-months ended 30 September 2016
14
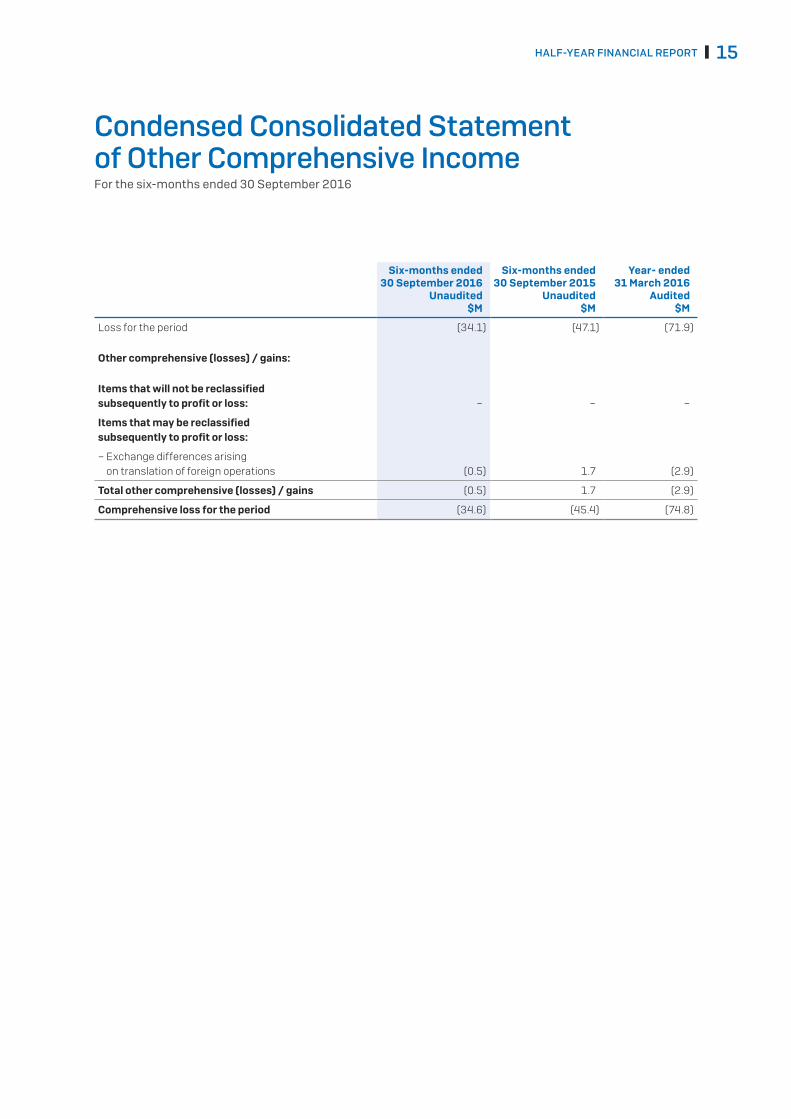
Condensed Consolidated Statement of Other Comprehensive Income
Six-months ended30 September 2016
Unaudited$M
Six-months ended30 September 2015
Unaudited$M
Year- ended31 March 2016
Audited$M
Loss for the period (34.1) (47.1) (71.9)
Other comprehensive (losses) / gains:
Items that will not be reclassified subsequently to profit or loss: – – –
Items that may be reclassified subsequently to profit or loss:
– Exchange differences arising on translation of foreign operations (0.5) 1.7 (2.9)
Total other comprehensive (losses) / gains (0.5) 1.7 (2.9)
Comprehensive loss for the period (34.6) (45.4) (74.8)
For the six-months ended 30 September 2016
HALF-YEAR FINANCIAL REPORT 15

Condensed Consolidated Statement of Financial Position
Registered number 09608658
Note
30 September 2016Unaudited
$M
30 September 2015Unaudited
$M
31 March 2016Audited
$M
Non-current assets
Intangible assets 11 744.3 728.7 756.6
Property, plant and equipment 12 22.0 27.6 24.9
Deferred tax asset 78.5 52.9 73.9
Other receivables 0.6 0.8 0.8
845.4 810.0 856.2
Current assets
Inventories 19.5 12.9 18.7
Trade and other receivables 99.9 95.3 129.8
Cash and cash equivalents 90.0 68.2 66.8
209.4 176.4 215.3
Total assets 1,054.8 986.4 1,071.5
Current liabilities
Trade and other payables 73.8 68.2 76.4
Deferred revenue 14 293.9 259.7 286.5
Income tax payable 18.6 9.0 11.2
Financial liabilities 15 1.2 0.1 26.2
Provisions 0.3 0.2 0.3
387.8 337.2 400.6
Non-current liabilities
Trade and other payables 0.9 0.7 0.8
Deferred revenue 14 217.4 185.7 212.2
Financial liabilities 15 299.3 298.4 300.9
Provisions 16.0 0.3 1.0
Deferred tax liabilities 8.5 9.6 10.1
542.1 494.7 525.0
Total liabilities 929.9 831.9 925.6
Net assets 124.9 154.5 145.9
Represented by:
Share capital 21.5 21.3 21.3
Share premium 116.5 114.9 115.9
Merger reserve (200.9) (200.9) (200.9)
Other reserves (0.1) (0.2) (0.1)
Retained earnings 166.6 233.4 205.7
Share-based payment reserve 54.0 13.6 36.2
Translation reserve (32.7) (27.6) (32.2)
Total equity 124.9 154.5 145.9
At 30 September 2016
16

Condensed Consolidated Statement of Changes in Equity
Share capital
$M
Share premium
$M
Merger reserve
$M
Other reserves
$M
Retained earnings
$M
Share-based
payment reserve
$M
Translation reserve
$M
Total Unaudited
$M
At 1 April 2015 adjusted1 552.6 – (200.9) 10.4 (750.0) 11.4 (29.3) (405.8)
Loss for the period: – – – – (47.1) – – (47.1)
Other comprehensive profit or loss: – – – – – – 1.7 1.7
Total comprehensive loss – – – – (47.1) – 1.7 (45.4)
Reserve transfer – – – (10.4) 10.4 – – –
Shares issued – 485.3 – – – – – 485.3
Capital reduction (533.0) (485.4) – – 1,020.1 – – 1.7
EBT treasury shares – – – (0.2) – – – (0.2)
Primary proceeds 1.7 123.3 – – – – – 125.0
Share issue expense – (9.0) – – – – – (9.0)
Share options exercised – 0.7 – – – – – 0.7
Share-based payments expense – – – – – 2.2 – 2.2
At 30 September 2015 21.3 114.9 (200.9) (0.2) 233.4 13.6 (27.6) 154.5
At 1 April 2016 21.3 115.9 (200.9) (0.1) 205.7 36.2 (32.2) 145.9
Loss for the period: – – – – (34.1) – – (34.1)
Other comprehensive profit or loss: – – – – – – (0.5) (0.5)
Total comprehensive loss – – – – (34.1) – (0.5) (34.6)
EBT treasury shares – – – – – – – –
Share options exercised 0.2 0.6 – – – – – 0.8
Share-based payments expense – – – – – 15.5 – 15.5
Share-based payments deferred tax – – – – – 2.3 – 2.3
Cash dividend – – – – (5.0) – – (5.0)
At 30 September 2016 21.5 116.5 (200.9) (0.1) 166.6 54.0 (32.7) 124.9
1 Sophos Group plc listed its shares on the London Stock Exchange on 1 July 2015. The Group has applied the principles of reverse acquisition accounting under IFRS 3 – Business Combinations in preparing the consolidated financial statements. By applying the principles of reverse acquisition accounting, the Group is presented as if Sophos Group plc has always owned Shield Midco Limited, the largest company for which consolidated financial statements were previously produced under IFRS. Accordingly, the comparative balances at 1 April 2015 have been adjusted to reflect this when compared to the 1 April balance in the Half-Year Financial Report for 2015.
For the six-months ended 30 September 2016
HALF-YEAR FINANCIAL REPORT 17

Condensed Consolidated Statement of Cash FlowsFor the six-months ended 30 September 2016
Note
Six-months ended30 September 2016
Unaudited$M
Six-months ended30 September 2015
Unaudited$M
Year- ended31 March 2016
Audited$M
Loss for the year (34.1) (47.1) (71.9)
Adjusted for:
Depreciation 4.4 4.0 8.4
Amortisation of intangible assets 10.8 15.6 29.2
Amortisation of fair value adjustment on deferred income (0.8) (0.8) (1.8)
Foreign exchange 2.1 3.1 2.4
Share-based payments 5 15.5 2.2 15.0
Finance income – (0.4) (0.7)
Finance costs 3.8 29.9 36.4
Income tax charge 5.7 4.2 3.5
7.4 10.7 20.5
Increase in inventories (1.9) (0.3) (6.7)
Decrease / (increase) in trade and other receivables 26.5 17.1 (16.1)
Decrease in trade and other payables (3.2) (17.8) (10.9)
Increase in deferred revenue 24.5 9.0 59.4
Increase / (decrease) in provisions 15.0 (0.5) 0.3
Cash generated from continuing operations 68.3 18.2 46.5
Income taxes paid (5.0) (13.6) (25.2)
Net cash flow from operating activities 63.3 4.6 21.3
Investing activities
Purchase of property, plant and equipment (4.2) (5.7) (8.5)
Acquisition of subsidiary net of cash acquired (1.2) (15.0) (46.0)
Purchase of intangible assets - software (1.7) (5.2) (8.3)
Finance income – 0.4 0.7
Net cash flow from investing activities (7.1) (25.5) (62.1)
Financing activities
Proceeds from issue of shares 0.7 125.7 126.2
Transaction costs related to the issue of shares – (9.0) (8.6)
Dividends paid – – (3.1)
Proceeds from borrowings 16 – 301.9 326.9
Repayment of borrowings 16 (25.0) (389.6) (389.6)
Transaction costs related to borrowings 16 – (3.9) (4.4)
Finance lease payments (0.1) (0.1) (0.1)
Finance costs (4.9) (8.6) (12.9)
Net cash flow from financing activities (29.3) 16.4 34.4
Increase / (decrease) in cash and cash equivalents 16 26.9 (4.5) (6.4)
Net foreign exchange differences 16 (3.7) 0.1 0.6
Cash and cash equivalents at the start of period 16 66.8 72.6 72.6
Cash and cash equivalents at the end of period 16 90.0 68.2 66.8
18
Notes to the Condensed Consolidated Financial StatementsFor the six-months ended 30 September 2016
1. General informationSophos Group plc is incorporated and domiciled in the UK. The Company’s registered address is: Sophos Group plc, The Pentagon, Abingdon Science Park, Abingdon, Oxfordshire, OX14 3YP, United Kingdom.
The Interim Financial Statements were approved by the Board on 8 November 2016 for issue on 9 November 2016.
These Interim Financial Statements do not comprise statutory accounts within the meaning of section 434 of the Companies Act 2006. Statutory accounts for the year-ended 31 March 2016 were approved by the Board of Directors on 25 May 2016 and delivered to the Registrar of Companies. The report of the auditors on those accounts was unmodified, did not contain an emphasis of matter paragraph and did not contain any statement on other matters prescribed by the Companies Act 2006.
The Interim Financial Statements have been reviewed but not audited.
2. Basis of preparationThe Interim Financial Statements have been prepared in accordance with IAS 34 “Interim Financial Reporting” as adopted by the European Union and the Disclosure and Transparency Rules of the Financial Conduct Authority. The Interim Financial Statements should be read in conjunction with the Annual Report and Consolidated Financial Statements for the year-ended 31 March 2016, which have been prepared in accordance with international financial reporting standards as adopted by the European Union.
The Interim Financial Statements have been prepared under the historical cost convention and are presented in US dollars. All values are rounded to the nearest 0.1 million ($’m) unless otherwise indicated.
Accounting PoliciesThe accounting policies adopted in preparation of the Interim Financial Statements are consistent with those used to prepare the Group’s consolidated financial statements for the year-ended 31 March 2016.
3. Segment informationFor management reporting purposes, the primary segment reporting format is determined to be geographic segments, as the Group’s risks and rates of return are affected predominantly by the different economic environments in which the Group operates. The Group has only one secondary business segment, on the basis that the products and services offered to external customers are very similar and therefore do not result in different risks and rates of return for the Group. The Group’s geographical segments are based on the location of the Group’s operations consisting of EMEA (Europe, Middle East and Africa), The Americas and APJ (Asia Pacific and Japan).
Billings is the value of products and services invoiced to customers after receiving a purchase order from the customer and delivering products and services to them, or for which there is no right to a refund for undelivered items. Billings does not equate to statutory revenue. Billings are classified by the geographic location of direct customers, OEMs and the distributors which purchase our products. The geographic location of OEMs or distributors may be different from that of the end customers.
The accounting policies of the reportable segments are the same as the Group’s accounting policies. Segment profits represent the profit earned by each segment without allocation of central administration costs including Directors’ salaries, finance costs and income tax expense. This is the measure reported to the Chief Operating Decision Maker, the Chief Executive Officer, and Senior Management Team for the purposes of resource allocation and assessment of segment performance.
HALF-YEAR FINANCIAL REPORT 19

Notes to the Condensed Consolidated Financial Statements continuedFor the six-months ended 30 September 2016
3 Segment information continuedThe following tables present Billings and expenditure regarding the Group’s geographical segments for the six-months ended 30 September 2016 and 30 September 2015.
Six-months ended 30 September 2016 Americas
$MEMEA
$MAPJ
$M
TotalUnaudited
$M
Billings 93.1 144.1 42.6 279.8
Regional cost of sales (7.6) (17.5) (7.3) (32.4)
Regional gross margin 85.5 126.6 35.3 247.4
Regional sales and marketing expense (30.7) (33.6) (14.7) (79.0)
Regional operating profit 54.8 93.0 20.6 168.4
Revenue deferral (22.9)
Central costs (154.9)
Amortisation (10.8)
Depreciation (4.4)
Operating loss (24.6)
Six-months ended 30 September 2015Americas
$MEMEA
$MAPJ
$M
TotalUnaudited
$M
Billings 87.4 115.3 39.3 242.0
Regional cost of sales (6.5) (16.3) (7.9) (30.7)
Regional gross margin 80.9 99.0 31.4 211.3
Regional sales and marketing expense (26.3) (28.0) (14.3) (68.6)
Regional operating profit 54.6 71.0 17.1 142.7
Revenue deferral (7.8)
Central costs (128.7)
Amortisation (15.6)
Depreciation (4.0)
Operating loss (13.4)
20

Revenue from external customers by country
Six-months ended30 September 2016
Unaudited$M
Six-months ended30 September 2015
Unaudited$M
UK 29.6 29.2
USA 80.3 74.1
Germany 50.3 43.6
Other countries 96.7 87.3
Total revenue 256.9 234.2
Revenue from external customers by type
Six-months ended30 September 2016
Unaudited$M
Six-months ended30 September 2015
Unaudited$M
Subscription 199.4 178.2
Hardware 51.2 49.8
Other 6.3 6.2
Total revenue 256.9 234.2
4 Reconciliation of operating loss to Cash EBITDACash EBITDA is defined as the Group’s operating loss adjusted for depreciation and amortisation charges, any gains or losses on the sale of tangible and intangible assets, share option charges, unrealised foreign exchange differences and exceptional items with billings replacing revenue.
The Directors believe this measure is a more appropriate earnings and cash flow measure than EBITDA.
Six-months ended30 September 2016
Unaudited$M
Six-months ended30 September 2015
Unaudited$M
Year-ended31 March 2016
Audited$M
Operating loss (24.6) (13.4) (32.7)
Depreciation 4.4 4.0 8.4
Amortisation of intangible purchased assets 10.8 15.6 29.2
Share-based payments expense 15.5 2.2 15.0
Exceptional items 19.8 26.2 41.9
Foreign exchange loss 2.1 3.1 2.4
Adjusted EBITDA 28.0 37.7 64.2
Net deferral of revenue 22.9 7.8 56.7
Cash EBITDA 50.9 45.5 120.9
Billings 279.8 242.0 534.9
Net deferral of revenue (22.9) (7.8) (56.7)
Revenue 256.9 234.2 478.2
HALF-YEAR FINANCIAL REPORT 21

Notes to the Condensed Consolidated Financial Statements continuedFor the six-months ended 30 September 2016
5 Share-based payment expenseFor the six-months ended 30 September 2016 the Group has recognised equity and cash-settled share-based payment expenses as follows:
Six-months ended30 September 2016
Unaudited$M
Six-months ended30 September 2015
Unaudited$M
Year-ended31 March 2016
Audited$M
Cash-settled transactions 0.7 – 1.3
Equity-settled transactions 15.5 2.2 15.0
Total share-based payment expense 16.2 2.2 16.3
The Group has made awards under its share-based payment plans with a weighted average share price (“WASP”) on the grant date as follows:
Six-months ended 30 September 2016
Unaudited
Six-months ended30 September 2015
Unaudited
Year-ended31 March 2016
Audited
Number000’s
WASP£ pence
Number000’s
WASP£ pence
Number000’s
WASP£ pence
RSU’s 9,066 182.74 9,280 265.00 9,630 264.75
PSU’s 3,900 183.36 2,879 265.00 2,879 265.00
SAYE – Options 1,882 201.65 – – – –
Total awards 14,848 185.52 12,159 265.00 12,509 264.81
6 Exceptional itemsExceptional items are those that in the Directors’ judgment need to be disclosed by virtue of their size, nature or incidence, in order to draw the attention of the reader and to show the underlying business performance of the Group more accurately. Such items are included within the income statement caption to which they relate and are separately disclosed on the face of the consolidated income statement within general finance and administration expenses.
During the six months to 30 September 2016, legal costs of $19.8M (H1, FY16: $5.8M) were incurred in relation to the defence of certain intellectual property litigation. The costs include a $15.0M provision for a one-time damages award in a jury verdict to Finjan Inc. related to claims of patent infringement by Sophos, Inc. This verdict represents the next step in an ongoing legal process and the Group is considering all options including an appeal of the verdict. The reduction in the Group’s tax charge on these items amounted to $4.0M (H1, FY16: $2.6M).
In addition, in the prior year, during the six-months to 30 September 2015, Initial Public Offering (“IPO”) costs of $17.6M, acquisition-related expenses of $1.6M, and restructuring and integration costs of $1.2M resulted in total Exceptional items of $26.2M. The reduction in the Group’s tax charge on these items amounted to $3.1M.
22

7 Finance expense
Six-months ended30 September 2016
Unaudited$M
Six-months ended30 September 2015
Unaudited$M
Year-ended31 March 2016
Audited$M
Interest expense on loans and borrowings 4.0 6.8 11.0
Other interest, bank charges and swap settlements 0.2 0.3 0.5
4.2 7.1 11.5
Accretion on Subordinated Preference Certificates – 13.5 13.5
Accretion on contingent consideration 0.1 – 0.2
Foreign exchange (gain) / loss on borrowings (0.9) 3.1 4.4
Amortisation of facility fees 0.4 0.5 0.9
Facility fees expensed on settlement of debt – 5.7 5.9
Total finance expense 3.8 29.9 36.4
Subordinated Preference Certificates with a value of $485.3M were capitalised on 26 June 2015 as part of the Group reorganisation leading up to the Initial Public Offering of the Company’s shares. Accordingly, the accretion expense of $13.5M for the six-month period to September reflects the accretion from 1 April 2015 to 26 June 2015. Prior to capitalisation, the Subordinated Preference Certificates were disclosed within Trade and other payables.
8 TaxationThe Group calculates the period income tax expense using the tax rate that would be applicable to the expected total annual earnings. The income tax expense for the six-month period ended 30 September 2016 was $5.7m (H1, FY16: $4.2M) representing an effective tax rate of (20.1%) (H1, F16: (9.8%)).
HALF-YEAR FINANCIAL REPORT 23

Notes to the Condensed Consolidated Financial Statements continuedFor the six-months ended 30 September 2016
9 Earnings per shareBasic earnings per share (“EPS”) is calculated by dividing the profit for the period attributable to equity holders of the parent by the weighted average number of ordinary shares outstanding during the period.
Diluted EPS is calculated by dividing the profit for the period attributable to equity holders of the parent by the weighted average number of ordinary shares outstanding during the period plus the weighted average number of shares that would be issued if all dilutive potential ordinary shares were converted into ordinary shares. In accordance with IAS 33, the dilutive earnings per share are without reference to adjustments in respect of outstanding shares when the impact would be anti-dilutive.
Adjusted EPS is calculated by dividing the Cash EBITDA for the period attributable to equity holders of the parent by the weighted average number of ordinary shares outstanding during the period.
In each case, the weighted average number of shares take into account the weighted average number of own shares held during the period.
The following reflects the income and share data used in calculating EPS:
Six-months ended30 September 2016
Unaudited$M
Six-months ended30 September 2015
Unaudited$M
Year-ended31 March 2016
Audited$M
Loss for the period attributable to the equity holders of the Company (34.1) (47.1) (71.9)
Cash EBITDA for the period attributable to the equity holders of the Company – (see note 4) 50.9 45.5 120.9
Six-months ended30 September 2016
Unaudited
Six-months ended30 September 2015
Unaudited
Year-ended31 March 2016
Audited
Weighted average number of shares (000’s): 450,239 429,034 438,640
Six-months ended30 September 2016
$ Cents
Six-months ended30 September 2015
$ Cents
Year-ended31 March 2016
$ Cents
Basic and diluted EPS (7.6) (11.0) (16.4)
Adjusted EPS 11.3 10.6 27.5
24

10 Distributions made and proposed
Cash dividends on ordinary shares declared and paid
30 September 2016Unaudited
$M
30 September 2015Unaudited
$M
31 March 2016Audited
$M
Interim dividend for year-ending 31 March at 0.7 US Cents per share – – 3.1
Total cash dividends paid – – 3.1
The Directors recommended a final dividend for the year-ended 31 March 2016 of 1.1 US Cents. This was approved at the Annual General Meeting held on 14 September 2016. Accordingly a final dividend of 1.1 US Cents per ordinary share was paid on 14 October to those members whose names were on the register of members on 16 September 2016.
The Directors approved an interim dividend for the year-ending 31 March 2017 of 1.3 US Cents (H1, FY16: 0.7 US Cents) per ordinary share on 8 November 2016. The interim dividend is not recognised as a liability at 30 September 2016.
11 Intangible assetsThe Group spent $1.7M on intangible assets in the six-months ended 30 September 2016. The net book value of the Group’s intangible assets at the end of the period are analysed as follows:
Net Book ValueGoodwill
$M
Intellectual Property
$MSoftware
$MOthers
$M
Total Unaudited
$M
At 1 April 2016 716.1 12.6 15.3 12.6 756.6
Additions – – 1.7 – 1.7
Charge for the period – (4.0) (3.6) (3.2) (10.8)
Exchange movement (1.9) – (1.2) (0.1) (3.2)
At 30 September 2016 714.2 8.6 12.2 9.3 744.3
Net Book ValueGoodwill
$M
Intellectual Property
$MSoftware
$MOthers
$M
Total Unaudited
$M
At 1 April 2015 669.6 19.4 13.5 16.8 719.3
Additions – – 5.2 – 5.2
Acquired through business combinations 10.6 1.9 – 5.8 18.3
Charge for the period – (7.1) (2.7) (5.8) (15.6)
Exchange movement 1.3 (0.1) 0.2 0.1 1.5
At 30 September 2015 681.5 14.1 16.2 16.9 728.7
HALF-YEAR FINANCIAL REPORT 25

Notes to the Condensed Consolidated Financial Statements continuedFor the six-months ended 30 September 2016
12 Property plant and equipmentThe Group spent $4.2M on property, plant and equipment in the six-months ended 30 September 2016. The net book value of the Group’s assets at the end of the period are analysed as follows:
Net Book Value
Land and Buildings
$M
Plant and Machinery
$M
Fixtures and Fittings
$M
Total Unaudited
$M
At 1 April 2016 11.7 10.5 2.7 24.9
Additions 0.4 3.2 0.6 4.2
Charge for the period (1.3) (2.7) (0.4) (4.4)
Exchange movement (2.3) (0.3) (0.1) (2.7)
At 30 September 2016 8.5 10.7 2.8 22.0
Net Book Value
Land and Buildings
$M
Plant and Machinery
$M
Fixtures and Fittings
$M
Total Unaudited
$M
At 1 April 2015 13.4 9.2 2.5 25.1
Additions 0.7 4.6 0.4 5.7
Charge for the period (1.2) (2.4) (0.4) (4.0)
Exchange movement 0.4 0.4 – 0.8
At 30 September 2015 13.3 11.8 2.5 27.6
26

13 Business combinationsThere were no acquisitions in the six-months ended 30 September 2016.
In the prior period, on 5 June 2015, Sophos Inc. acquired 100% of the share capital of Reflexion Networks Inc., a leader in e-mail security, archiving and encryption. Reflexion Networks Inc. was acquired to further enhance the Group’s Cloud product offering.
Acquisition-related expenses of $0.8M have been excluded from the consideration transferred and have been recognised as an expense within General finance and administration – exceptional items.
Assets acquired and liabilities assumed on the day of acquisition were as follows:
Book value
$’MAdjustment
$’MFair value
$’M
Non-current assets:
Intangible assets
Intellectual Property – 1.9 1.9
Customer relationships – 5.8 5.8
Other non-current assets 0.4 – 0.4
Current Assets:
Trade and other receivables 0.5 – 0.5
Non-Current Liabilities:
Deferred tax liability – 3.1 3.1
Current liabilities:
Deferred revenues 0.2 – 0.2
Trade and other payables 0.7 – 0.7
Lease obligations 0.2 – 0.2
Net assets recognised at the date of acquisition (0.2) 4.6 4.4
Cash paid 15.0
Goodwill arising on acquisition – Reflexion Networks Inc. 10.6
Prior to the acquisition, Reflexion Networks Inc. operated in a complimentary market sector to the Group and, accordingly, the results of Reflexion Networks Inc. are incremental to those of the Group. Revenue of $234.1M for the six-months to September 30, 2015 includes $2.0M in respect of Reflexion Networks Inc. The impact of Reflexion Networks Inc. on the operating loss of the Group for the period is insignificant. Had Reflexion Networks Inc. been owned since 1 April 2015, revenue for the six-months to 30 September 2015 would have increased over the reported revenue by approximately $1.0M. The impact on the operating loss of the Group would have been insignificant.
HALF-YEAR FINANCIAL REPORT 27

Notes to the Condensed Consolidated Financial Statements continuedFor the six-months ended 30 September 2016
14 Deferred revenueThe movement in the Group’s deferred revenue balance was as follows:
30 September 2016Unaudited
$M
30 September 2015Unaudited
$M
31 March 2016Audited
$M
Current 286.5 251.4 251.4
Non-current 212.2 181.9 181.9
At 1 April 498.7 433.3 433.3
Billings 279.8 242.0 534.9
Revenues (256.9) (234.2) (478.2)
Translation and other adjustments (10.3) 4.3 8.7
Current 293.9 259.7 286.5
Non-current 217.4 185.7 212.2
At end of period 511.3 445.4 498.7
15 Financial liabilitiesTotal financial liabilities at the end of the reporting period, measured at amortised cost, are as follows:
30 September 2016Unaudited
$M
30 September 2015Unaudited
$M
31 March 2016Audited
$M
Current instalments due on finance leases 0.1 0.1 0.1
Current instalments due on bank loans – – 25.0
Contingent consideration 1.1 – 1.1
Total current financial liabilities 1.2 0.1 26.2
Non-current instalments due on finance leases within 5 years 0.1 0.1 0.1
Non-current instalments due on bank loans 302.4 302.0 303.4
Contingent consideration – – 1.0
Unamortised facility fees (3.2) (3.7) (3.6)
Total non-current financial liabilities 299.3 298.4 300.9
Total financial liabilities 300.5 298.5 327.1
28

The fair value of the Group’s bank loans equal their carrying amount, and are repayable as follows:
30 September 2016Unaudited
$M
30 September 2015Unaudited
$M
31 March 2016Audited
$M
Due within one year – – 25.0
Due between two and five years 302.4 302.0 303.4
Total bank loans 302.4 302.0 328.4
The following terms apply to the bank loans outstanding at 30 September 2016:
Facility Interest MarginPrincipal
MPrincipal
$ M
Facility A Libor 2.00% $235.0 235.0
Facility B Euribor 2.00% €60.0 67.4
302.4
Both Facility A and Facility B are repayable in full at the end of the 60-month term on 1 July 2020. The margin payable on both facilities is dependent upon the ratio of the Group’s net debt to Cash EBITDA as defined in the facility agreement.
The bank loans are secured by fixed and floating charges over the trade and assets of certain Group companies.
HALF-YEAR FINANCIAL REPORT 29

Notes to the Condensed Consolidated Financial Statements continuedFor the six-months ended 30 September 2016
16 Notes to the consolidated statement of cash flowsAcquisition of subsidiary net of cash acquired:
Six-months ended30 September 2016
Unaudited$M
Six-months ended30 September 2015
Unaudited$M
Year-ended31 March 2016
Audited$M
Consideration paid, satisfied in cash
– Surfright B.V. and Threatstar Holdings B.V. – – 31.8
– Reflexion Networks Inc. 1.2 15.0 15.0
Net cash purchased – – (0.8)
Acquisition of subsidiaries net of cash 1.2 15.0 46.0
During the six-months ended 30 September 2016, the Group paid $1.2M to the previous owners of Reflexion Networks Inc. in accordance with the purchase agreement. The consideration has been calculated based on the billings of the Reflexion Inc. product range for the year-ended 31 December 2015.
Reconciliation of movement in net debt:
31 March 2016Audited
$MCash flow
$M
Non-cashmovements
$M
Effect of movements in
exchange rates$M
30 September 2016Unaudited
$M
Cash and cash equivalents (66.8) (26.9) – 3.7 (90.0)
Obligations under finance leases 0.2 (0.1) – – 0.1
Bank loans 324.7 (25.0) 0.4 (0.9) 299.2
Gross debt 324.9 (25.1) 0.4 (0.9) 299.3
Net debt 258.1 (52.0) 0.4 2.8 209.3
31 March 2015Audited
$MCash flow
$M
Non-cashmovements
$M
Effect of movements in
exchange rates$M
30 September 2015Unaudited
$M
Cash and cash equivalents (72.6) 4.5 – (0.1) (68.2)
Obligations under finance leases 0.1 (0.1) 0.2 – 0.2
Bank loans 380.6 (91.5) 6.2 3.0 298.3
Gross debt 380.7 (91.6) 6.4 3.0 298.5
Net debt 308.1 (87.1) 6.4 2.9 230.3
17 Events after the reporting periodOn 20 October 2016, Sophos Limited acquired 100% of the share capital of Barricade Security Systems Limited (“Barricade”), a company incorporated in Ireland, for a cash consideration of $1.9M. Barricade is a start-up cloud security company.
The acquisition is subject to final adjustments for working capital and cash so the Group is unable to provide full business combination disclosure at this time.
30

IntroductionWe have been engaged by the Company to review the condensed set of financial statements in the half-yearly financial report for the six-months ended 30 September 2016 which comprises the condensed consolidated income statement, the condensed consolidated statement of comprehensive income, the condensed consolidated balance sheet, the condensed consolidated cash flow statement, the condensed consolidated statement of changes in equity and the related explanatory notes. We have read the other information contained in the half-yearly financial report and considered whether it contains any apparent misstatements or material inconsistencies with the information in the condensed set of financial statements.
This report is made solely to the Company in accordance with the terms of our engagement to assist the Company in meeting the requirements of the Disclosure and Transparency Rules (“the DTR”) of the UK’s Financial Conduct Authority (“the UK FCA”). Our review has been undertaken so that we might state to the Company those matters we are required to state to it in this report and for no other purpose. To the fullest extent permitted by law, we do not accept or assume responsibility to anyone other than the Company for our review work, for this report, or for the conclusions we have reached.
Directors’ responsibilities The half-yearly financial report is the responsibility of, and has been approved by, the Directors. The Directors are responsible for preparing the half-yearly financial report in accordance with the DTR of the UK FCA.
As disclosed in note 2, the annual financial statements of the Group are prepared in accordance with IFRSs as adopted by the EU. The condensed set of financial statements included in this half-yearly financial report has been prepared in accordance with IAS 34 Interim Financial Reporting as adopted by the EU.
Our responsibility Our responsibility is to express to the Company a conclusion on the condensed set of financial statements in the half-yearly financial report based on our review.
Scope of review We conducted our review in accordance with International Standard on Review Engagements (UK and Ireland) 2410 Review of Interim Financial Information Performed by the Independent Auditor of the Entity issued by the Auditing Practices Board for use in the UK. A review of interim financial information consists of making enquiries, primarily of persons responsible for financial and accounting matters, and applying analytical and other review procedures. A review is substantially less in scope than an audit conducted in accordance with International Standards on Auditing (UK and Ireland) and consequently does not enable us to obtain assurance that we would become aware of all significant matters that might be identified in an audit. Accordingly, we do not express an audit opinion.
Conclusion Based on our review, nothing has come to our attention that causes us to believe that the condensed set of financial statements in the half-yearly financial report for the six-months ended 30 September 2016 is not prepared, in all material respects, in accordance with IAS 34 as adopted by the EU and the DTR of the UK FCA.
Tudor Aw (Senior Statutory Auditor)For and on behalf of KPMG LLPChartered Accountants, London8 November 2016
For the six-months ended 30 September 2016
Independent Review Report to Sophos Group plc
HALF-YEAR FINANCIAL REPORT 31

Company Information
DirectorsPeter Gyenes
Kris Hagerman
Nick Bray
Sandra Bergeron
Edwin Gillis
Salim Nathoo
Roy Mackenzie
Steve Munford
Paul Walker
Registered OfficeSophos Group plc The Pentagon, Abingdon Science Park Abingdon OX14 3YP
Registered number: 09608658
www.sophos.com
Registrar ServicesCapita Asset Services The Registry 34 Beckenham Road Beckenham BR3 4TU
Public RelationsBrunswick Group 16 Lincoln’s Inn Field London WC2A 3ED
Investor Relationsinvestors.sophos.com
AuditorKPMG LLP 15 Canada Square London E14 5GL
32

Forward-looking statementsCertain statements in this announcement constitute “forward-looking statements”. These forward-looking statements involve risks, uncertainties and other factors that may cause the Group’s actual results, performance or achievements, or industry results, to be materially different from those projected in the forward-looking statements. These factors include: general economic and business conditions; changes in technology; timing or delay in signing, commencement, implementation and performance or programmes, or the delivery of products or services under them; structural change in the security industry; relationships with customers; competition; and ability to attract personnel. You are cautioned not to rely on these forward-looking statements, which speak only as of the date of this announcement. The Group undertakes no obligation to update or revise any forward-looking statement to reflect any change in expectations or any change in events, conditions or circumstances.
HALF-YEAR FINANCIAL REPORT 33
