raisio plc interim report q1/2017
TRANSCRIPT

Raisio’s Interim ReportJanuary-March 2017CEO Jarmo PuputtiRaisio plc10 May 2017

3
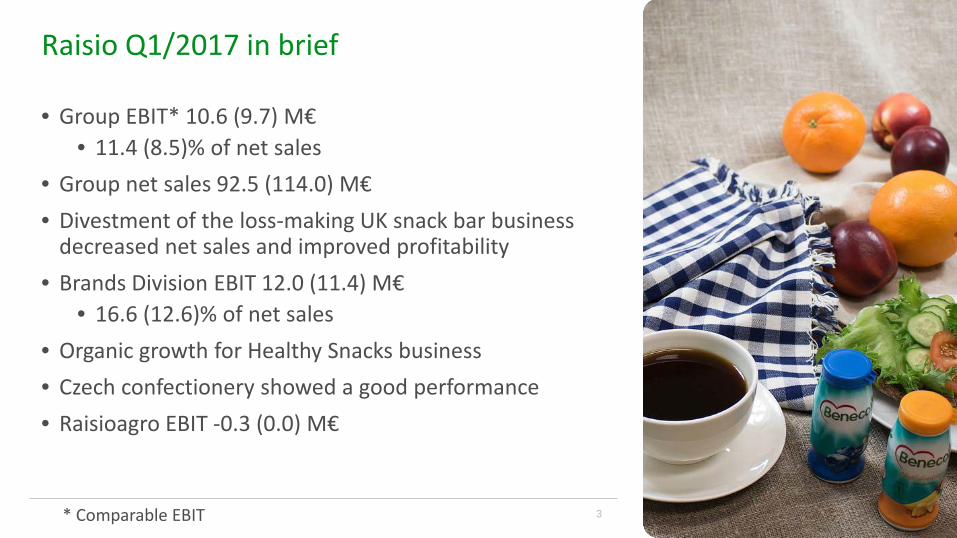
Raisio Q1/2017 in brief
• Group EBIT* 10.6 (9.7) M€• 11.4 (8.5)% of net sales
• Group net sales 92.5 (114.0) M€ • Divestment of the loss-making UK snack bar business
decreased net sales and improved profitability• Brands Division EBIT 12.0 (11.4) M€
• 16.6 (12.6)% of net sales• Organic growth for Healthy Snacks business• Czech confectionery showed a good performance• Raisioagro EBIT -0.3 (0.0) M€
* Comparable EBIT

4
Highlights Q1/2017
• The weaker pound decreased net sales and EBIT in the UK’s Benecol and confectionery businesses
• Benecol’s price increases in the UK retail trade did not fully compensate the negative effects of the currency and raw material price increases
• Profitability of the UK confectionery business weakened due to declined sales in Raisio’s branded products and delivery difficulties
• Raisio is taking resolute action to remedy and improve the situation.

0
5
10
15
20
25
30
35
40
45
50
55
5
Group EBIT 2008-Q1/2017
Comparable EBIT, rolling 12 months
M€
2008 2009 2010 2011 2012 2013 2014 2015 2016 Q1/2017
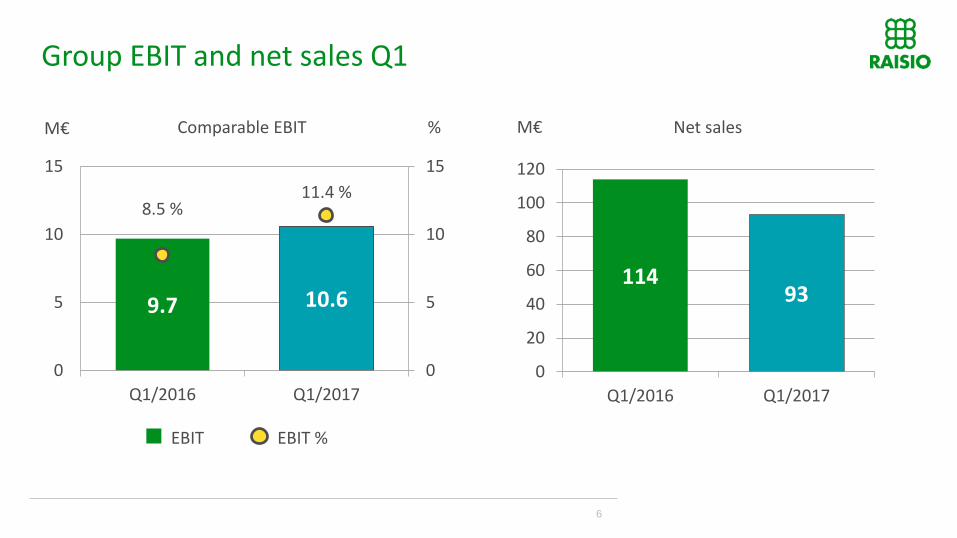
Group EBIT and net sales Q1
6
9.7 10.6
8.5 %11.4 %
0
5
10
15
0
5
10
15
Q1/2016 Q1/2017
%Comparable EBITM€
11493
0
20
40
60
80
100
120
Q1/2016 Q1/2017
M€ Net sales
EBIT EBIT %
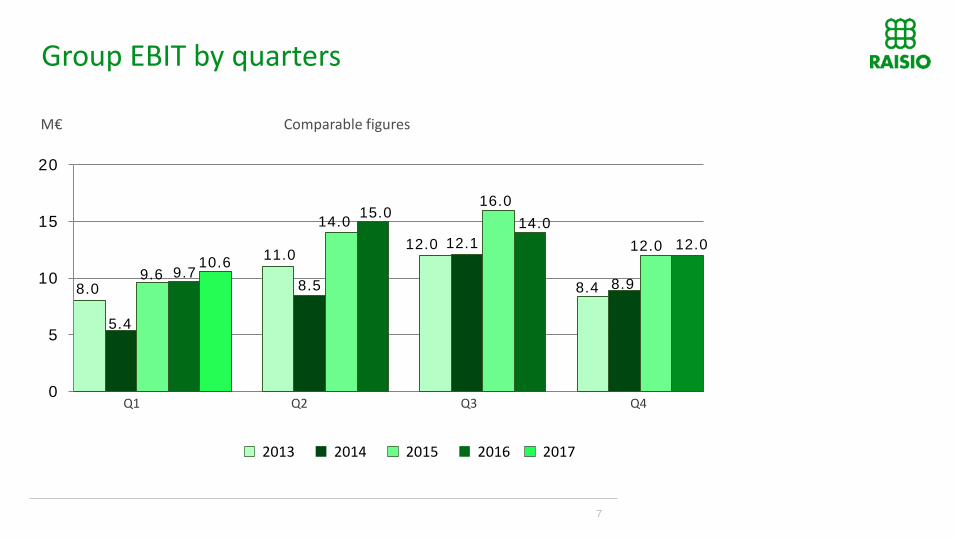
Group EBIT by quarters
7
8.0
5.4
9.6 9.710.6 11.0
8.5
14.0 15.0
12.0 12.1
16.014.0
8.4 8.9
12.0 12.0
0
5
10
15
20
Comparable figures
Q1 Q2 Q3 Q4
M€
20172014 201620152013

8
128117 123
11493
149133
142
124
150
127 135
103
131118 123
95
0
50
100
150
200
Q1 Q2 Q3 Q4
M€
Group net sales by quarters
20172014 201620152013

Key figures, comparable income statement
Q1/2017
Q1/2016 2016
Net sales M€ 92.5 114.0 436.3
Change in net sales % -18.9 -6.9 -16.3
EBIT M€ 10.6 9.7 50.7
EBIT % 11.4 8.5 11.6
Depreciation and impairment M€ -2.6 -3.1 -11.3
EBITDA M€ 13.1 12.7 62.0
Financial items M€ 0.0 -0.9 -2.2
Earnings per share (EPS) € 0.05 0.05 0.25
9
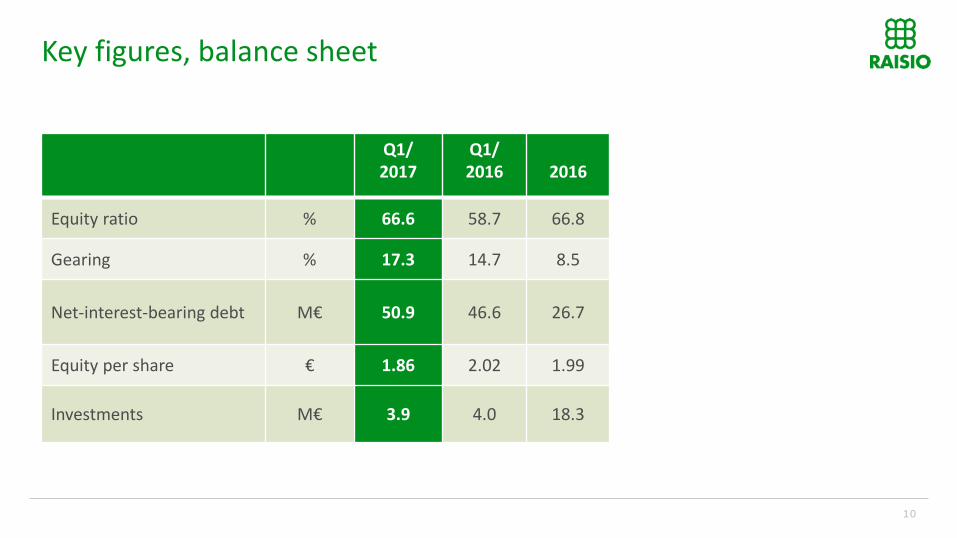
Key figures, balance sheet
Q1/2017
Q1/2016 2016
Equity ratio % 66.6 58.7 66.8
Gearing % 17.3 14.7 8.5
Net-interest-bearing debt M€ 50.9 46.6 26.7
Equity per share € 1.86 2.02 1.99
Investments M€ 3.9 4.0 18.3
10
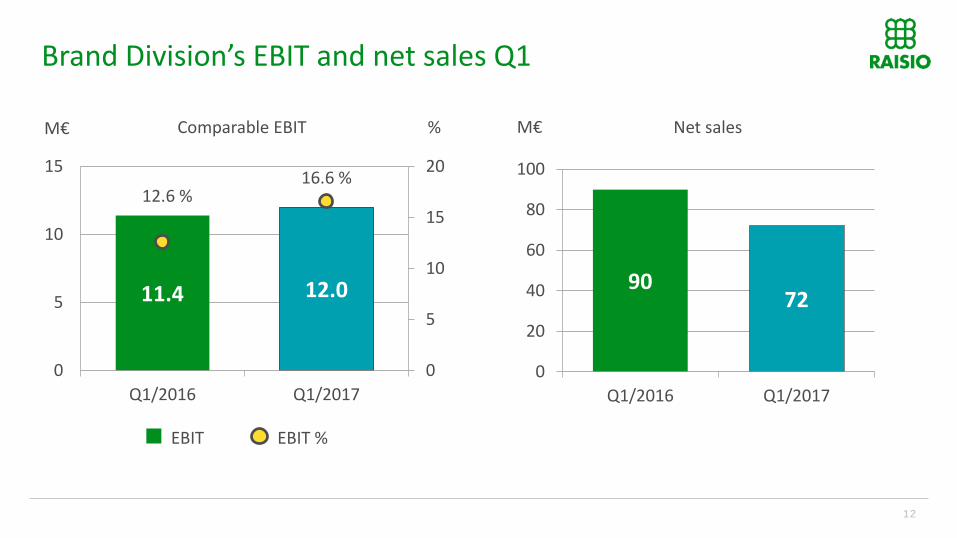
Brand Division’s EBIT and net sales Q1
12
11.4 12.0
12.6 %16.6 %
0
5
10
15
20
0
5
10
15
Q1/2016 Q1/2017
%Comparable EBITM€
9072
0
20
40
60
80
100
Q1/2016 Q1/2017
M€ Net sales
EBIT EBIT %

13
Brand Division’s EBIT by quarters
9.4
6.4
11.3 11.412.0
11.1
8.2
14.3 14.2
10.8 10.8
15.8
11.110.010.6
13.9 13.8
0
5
10
15
20
M€ Comparable figures
Q1 Q2 Q3 Q4
20172014 201620152013

14
75 72
9490
72 78 74
9888
73 76
96
6878 85
98
73
0
50
100
150
Q1 Q2 Q3 Q4
M€
Brand Division’s net sales by quarters
20172014 201620152013

15
Benecol
• In the UK, Benecol® improved its market position in minidrinks. Sales volume in spreads decreased as the entire category declined
• Net sales reduction due to lower plant stanol ester deliveries, the declined sales volume for spreads in the UK and the currency
• Benecol maintained its market leader position in minidrinks in Ireland as well as in spreads in Poland
• In Finland, sales volume for Benecol products increased by over 10%
• Benecol partners showed increased sales in Asia
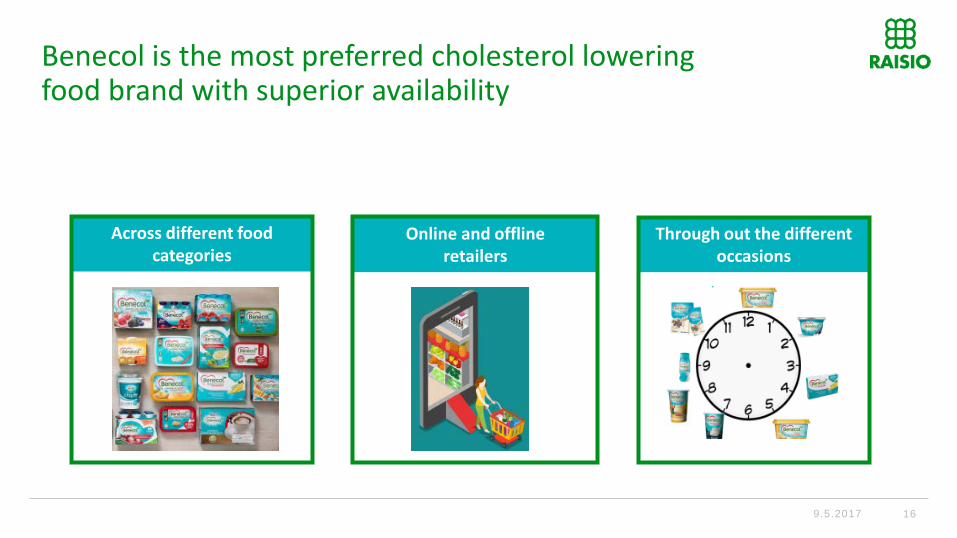
Through out the different occasions
Benecol is the most preferred cholesterol lowering food brand with superior availability
9.5.2017 16
Across different food categories
Online and offlineretailers

Healthy Snacks
17
• Net sales up by almost 10%• Good sales development for Elovena products
continued, +15%• Increased rye and wheat flour deliveries to the bakery
industry• Sales volume for Nordic flakes increased in Russia• New Provena products launched in Russia

Elovena expanding into new product categories
18
Sales in Elovena productshave tripled in ten years

19
Elovena ice cream snack
• Lactose-free• Rich in fibre• Oaty snack biscuit• Biscuit-like snack ice cream combines
a snack biscuit with full-flavoured, lactose-free ice cream
• Flavours: vanilla and wild berries
20
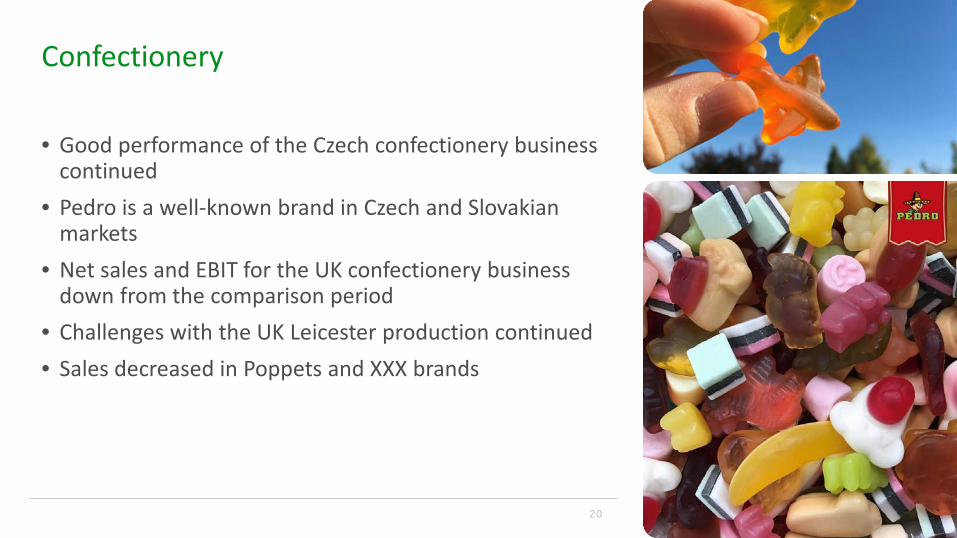
Confectionery
• Good performance of the Czech confectionery business continued
• Pedro is a well-known brand in Czech and Slovakian markets
• Net sales and EBIT for the UK confectionery business down from the comparison period
• Challenges with the UK Leicester production continued• Sales decreased in Poppets and XXX brands

Pedro’s sales growth continued
21
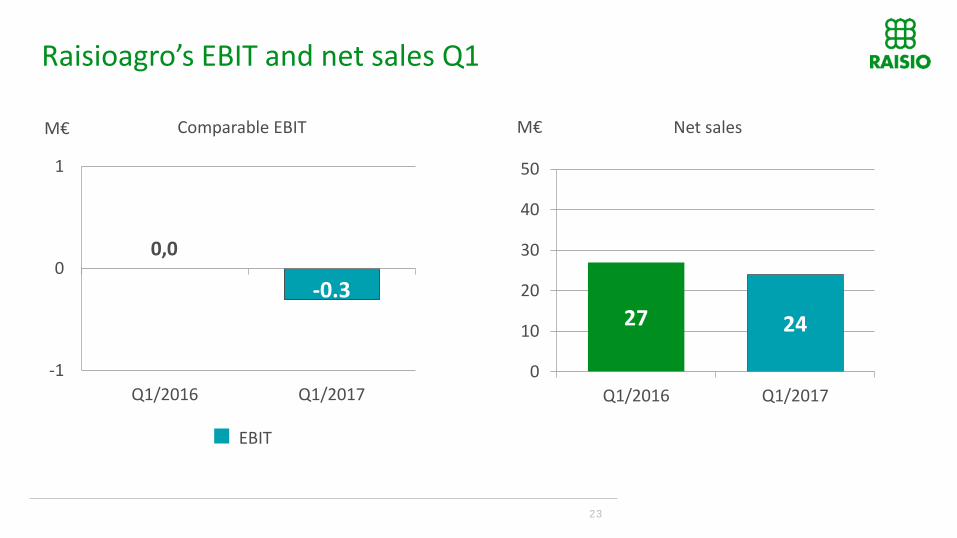
Raisioagro’s EBIT and net sales Q1
23
0.0
-0.3
-1
0
1
Q1/2016 Q1/2017
Comparable EBITM€
27 24
0
10
20
30
40
50
Q1/2016 Q1/2017
M€ Net sales
EBIT
0,0
24
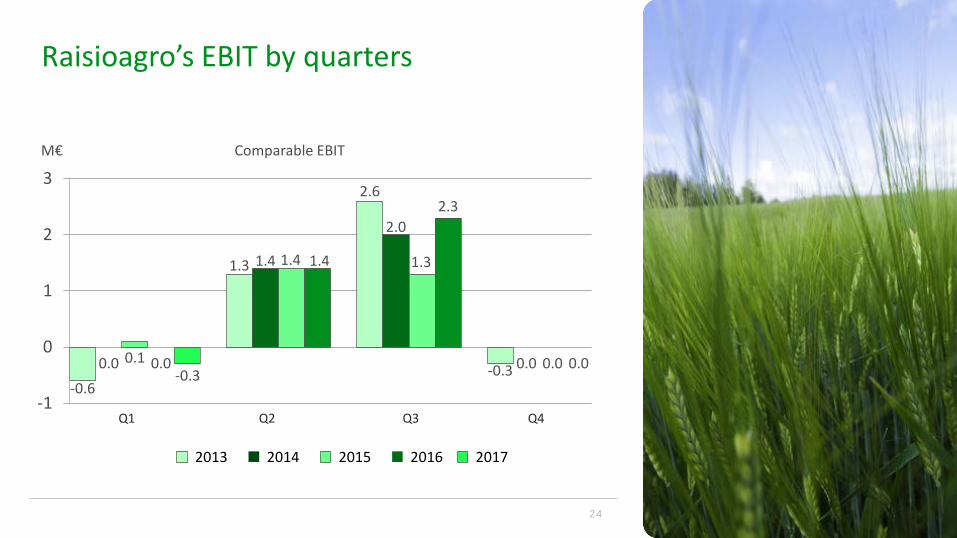
Raisioagro’s EBIT by quarters
-0.60.0 0.1 0.0
-0.3
1.3 1.4 1.4 1.4
2.6
2.0
1.3
2.3
-0.3 0.0 0.0 0.0
-1
0
1
2
3M€ Comparable EBIT
Q1 Q2 Q3 Q4
20172014 201620152013
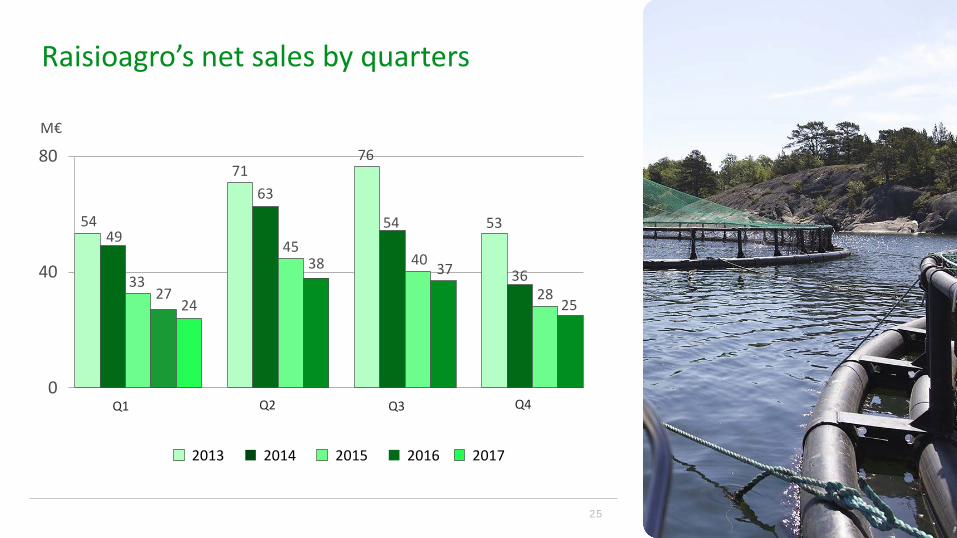
25
5449
3327
24
7163
4538
76
54
40 37
53
3628
25
0
40
80
Q1 Q2 Q3 Q4
M€
Raisioagro’s net sales by quarters
20172014 201620152013
26
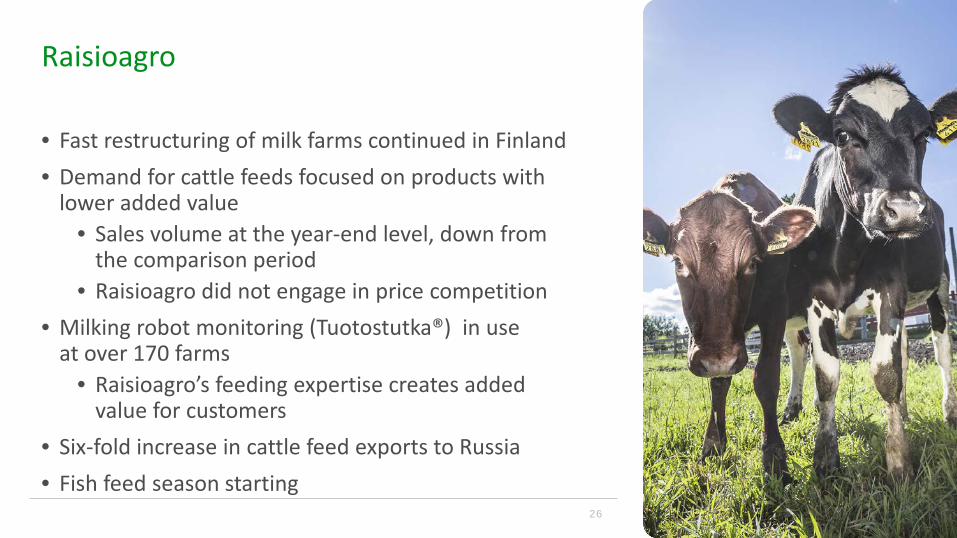
Raisioagro
• Fast restructuring of milk farms continued in Finland• Demand for cattle feeds focused on products with
lower added value• Sales volume at the year-end level, down from
the comparison period• Raisioagro did not engage in price competition
• Milking robot monitoring (Tuotostutka®) in use at over 170 farms
• Raisioagro’s feeding expertise creates added value for customers
• Six-fold increase in cattle feed exports to Russia• Fish feed season starting

27
Norra horse feeds
• High-quality horse feeds for the Finnish conditions• Health and welfare of horses and the prevention of
diseases at the heart of Norra feeds• Norra Sankari – a Finnhorse feed was launched to
honour the Finnhorse’s 110th anniversary• Part of the feed proceeds will be donated to
the Finnhorse’s genetic resources programme• Norra product line expanding during 2017

▶ In 2010, fish accounted for 6.5% of protein for the population globally and the proportion is growing all the time. Growth is based on aquaculture.
▶ Global aquaculture production estimated to grow 35% by 2022 (now 182 million tonnes).
▶ EU is the world’s largest fish importer. More than half of the 24.5kg consumption/ person comes from outside the EU, mainly from Norway.
▶ EU targets self-sufficiency and growth goal for aquaculture is 5% a year (now 1.26 million tonnes).
28
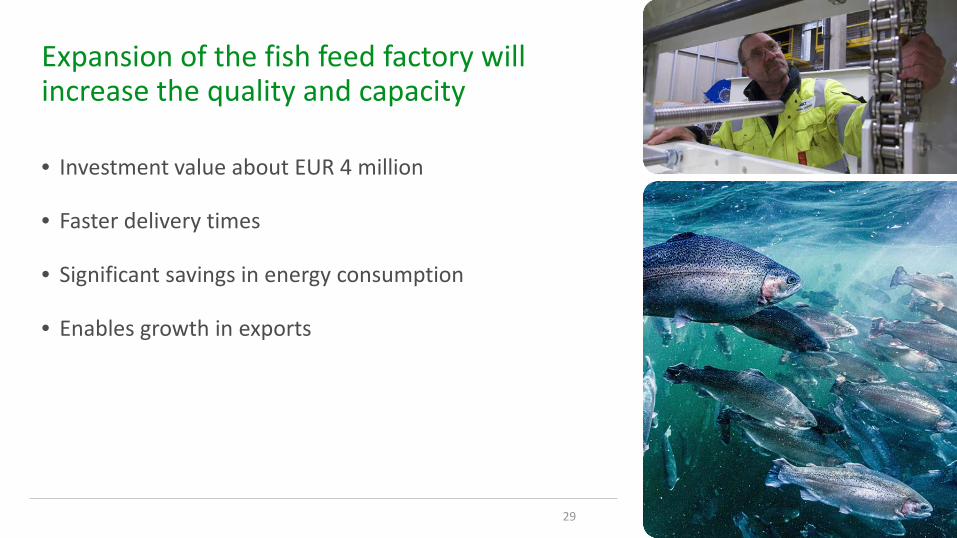
Expansion of the fish feed factory will increase the quality and capacity
• Investment value about EUR 4 million
• Faster delivery times
• Significant savings in energy consumption
• Enables growth in exports
2929
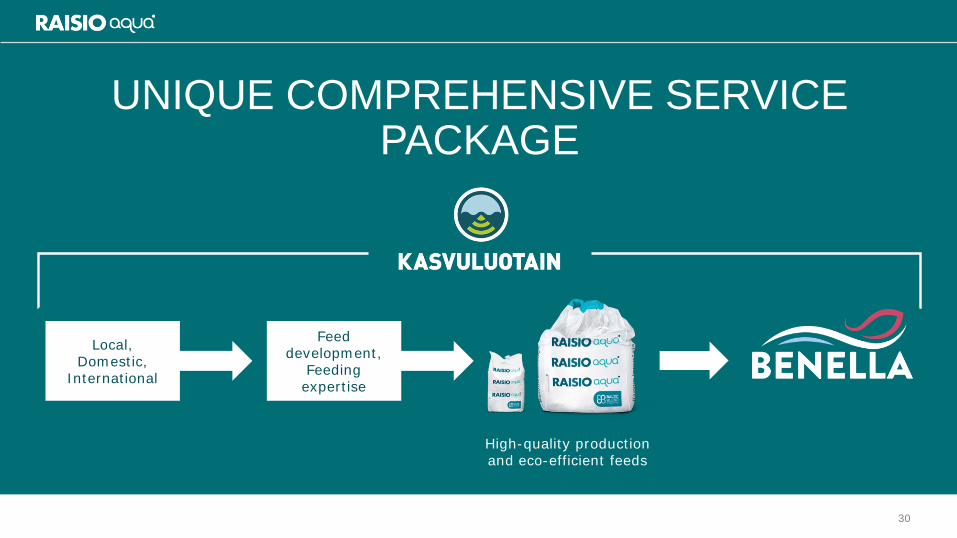
UNIQUE COMPREHENSIVE SERVICEPACKAGE
Local,Domestic,
International
Feed development,
Feedingexpertise
High-quality productionand eco-efficient feeds
30

Guidance 2017
31
In 2017, Raisio will invest in brands, product concepts, sales and marketing and in the enhancement of its operations.
This will pave the way for future growth and success. Raisio estimates its comparable EBIT for 2017
to fall slightly short of comparable EBIT for 2016. Exchange rates will continue to significantly affect Raisio’s EBIT.

Wellbeing for lifeRaisio’s renewing business strategy 2017 – 2022
Great place to workCompetence,
wellbeing & motivation
Investments in brands• Developing the brands with consumer insight• Operational excellence
Digital solutions• Wellbeing• E-commerce• Internet of Farming
New markets• Benecol and Nordic brands to Central Europe • Oat ingredients export globally• Feeds to Russia and the Baltics
New categories• Plant-based meals and meal components• Snacks and easy cholesterol lowering• Special feeds
Enhancing wellbeing withthe most desired brands.
Sustainable growth for a better world.
33
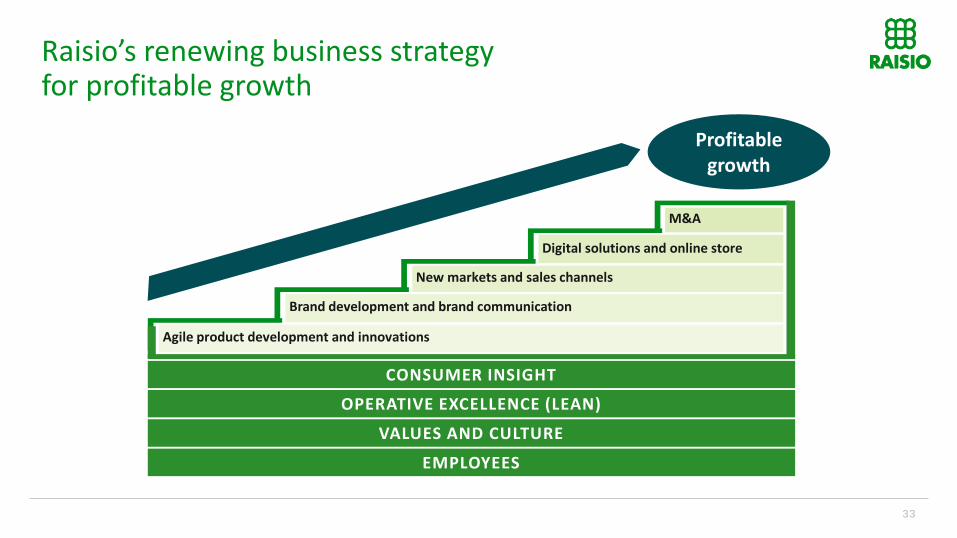
Raisio’s renewing business strategyfor profitable growth
OPERATIVE EXCELLENCE (LEAN)
VALUES AND CULTURE
EMPLOYEES
CONSUMER INSIGHT
Profitablegrowth
Agile product development and innovations
Brand development and brand communication
New markets and sales channels
Digital solutions and online store
M&A

THANK YOU!