some new applications of supercapacitors in … · some new applications of supercapacitors in...
TRANSCRIPT

SOME NEW APPLICATIONS OF SUPERCAPACITORS IN POWER
ELECTRONIC SYSTEMS
A Thesis
by
LEONARDO MANUEL PALMA FANJUL
Submitted to the Office of Graduate Studies of Texas A&M University
in partial fulfillment of the requirements for the degree of
MASTER OF SCIENCE
August 2003
Major Subject: Electrical Engineering
iv
SOME NEW APPLICATIONS OF SUPERCAPACITORS IN POWER
ELECTRONIC SYSTEMS
A Thesis
by
LEONARDO MANUEL PALMA FANJUL
Submitted to Texas A&M University
in partial fulfillment of the requirements for the degree of
MASTER OF SCIENCE
Approved as to style and content by:
Prasad Enjeti (Chair of Committee)
Hamid Toliyat (Member)
Jo Howze (Member)
Emil Straube (Member)
Chanan Singh (Head of Department)
August 2003
Major Subject: Electrical Engineering

iii
ABSTRACT
Some New Applications of Supercapacitors in Power Electronic Systems.
(August 2003)
Leonardo Manuel Palma Fanjul, B.S., Universidad de Concepción, Concepción, Chile
Chair of Advisory Committee: Dr. Prasad Enjeti
This thesis explores some new applications in power electronics for
supercapacitors. This involves the design and development of dc-dc converters to
interface the supercapacitor banks with the rest of the power electronic system. Two
applications for supercapacitors are proposed and analyzed. The first application is
aimed at high power applications such as motor drives. The proposed approach
compensates the effect of voltage sags in the dc link of typical adjustable speed drives,
thus reducing speed fluctuations in the motor and eliminating the possibility of nuisance
tripping on the drive control board. The second approach presented in this thesis
explores the use of supercapacitors to extend run-time for mobile devices such as laptop
computers and hand held devices. Three possible approaches are explored: a)
Supercapacitors connected directly across the battery; b) Battery-inductor-supercapacitor
connection; and c) Supercapacitor, and battery connected via a DC-DC converter.
Analytical models, simulation and experimental results on a typical laptop computer are
presented.

iv
TABLE OF CONTENTS
Page
ABSTRACT. ......................................................................................................................iii
TABLE OF CONTENTS ................................................................................................... iv
LIST OF FIGURES............................................................................................................vi
LIST OF TABLES ..............................................................................................................x
I INTRODUCTION ..................................................................................................1
1.1. Introduction ...........................................................................................1 1.2. Energy storage requirement in power converters..................................3 1.3. Energy storage in electrical systems .....................................................5 1.4. Energy storage devices..........................................................................6 1.5. Trends in energy storage devices development ....................................7 1.6. Effect of voltage sags in adjustable speed drives..................................8 1.7. Run-time in battery powered systems .................................................11 1.8. Previous work......................................................................................12 1.9. Research objective ..............................................................................14 1.10. Thesis outline ......................................................................................15
II REVIEW OF ENERGY STORAGE DEVICES FOR POWER ELECTRONICS
APPLICATIONS ..................................................................................................17
2.1. Introduction .........................................................................................17 2.2. Battery technology ..............................................................................18 2.3. Supercapacitor technology ..................................................................19 2.4. Flywheel technology ...........................................................................22 2.5. Comparison between energy storage technologies .............................25 2.6. Conclusion...........................................................................................29
III REVIEW OF DC/DC CONVERTERS FOR SUPERCAPACITOR
INTERFACING ....................................................................................................31
3.1 Introduction ..........................................................................................31 3.2. Boost converter ....................................................................................31 3.3. Isolated boost converter .......................................................................34 3.4. Push-pull converter ..............................................................................35
CHAPTER
v
CHAPTER
3.5. Current feed push-pull..........................................................................37 3.6. Buck-boost converter ...........................................................................38 3.7. Comparison between topologies ..........................................................40 3.8. Conclusion............................................................................................42
IV USE OF SUPERCAPACITORS AS BACKUP ENERGY TO PROVIDE RIDE
THROUGH ...........................................................................................................43
4.1. Introduction .........................................................................................43 4.2. Advantage of using supercapacitors as backup energy storage ..........46 4.3. Proposed ride through topology using supercapacitors ......................47 4.4. Design example...................................................................................50 4.5. Simulation results................................................................................50 4.6. Experimental results............................................................................54 4.7. Conclusions .........................................................................................58
V USE OF SUPERCAPACITORS TO EXTEND BATTERY RUN-TIME IN
MOBILE DEVICES..............................................................................................59
5.1. Introduction .........................................................................................59 5.2. Battery / supercapacitor technology & circuit model development....61
5.2.1. Equivalent circuit of the battery-supercapacitor combination ..62 5.2.2. Equivalent circuit of the battery- supercapacitor-inductor
combination................................................................................66 5.3. Approach to improve battery run-time in mobile applications ...........68
5.3.1 Direct battery supercapacitor connection...................................69 5.3.2. Battery-inductor capacitor connection ......................................74
5.4. Simulation results................................................................................78 5.5. Experimental results............................................................................81 5.6. Conclusions .........................................................................................86
VI CONCLUSIONS..................................................................................................88
REFERENCES..................................................................................................................91
APPENDIX A ...................................................................................................................93 APPENDIX B ...................................................................................................................98 VITA………. ..................................................................................................................103
Page

vi
LIST OF FIGURES
1 Typical power processor ......................................................................................4
2 Typical off-line power processor .........................................................................4
3 Electrical energy storage methods………………………………………………6
4 Power density vs. energy density for different energy storage devices…………8
5 50% voltage sag .................................................................................................10
6 DC link voltage under a 50% voltage sag ..........................................................10
7 Microprocessor power consumption history and future trend ...........................12
8 Battery energy densities .....................................................................................12
9 Double layer supercapacitor cell ........................................................................21
10 Flywheel system schematic ................................................................................23
11 Boost converter topology ...................................................................................32
12 Boost converter operation ..................................................................................32
13 Voltage gain for a boost converter .....................................................................33
14 Isolated boost converter topology……………………………………………………..34
15 Push-pull converter topology .............................................................................35
16 Current feed push-pull topology ........................................................................37
17 Buck-boost topology ..........................................................................................39
Page FIGURE

vii
18 Single phase 50% voltage sag ............................................................................44
19 DC link voltage under a single phase 50% voltage sag .....................................45
20 Proposed compensator topology ........................................................................45
21 Control circuit block diagram ............................................................................49
22 Compensator circuit for deep sags and momentary voltage interruptions .........49
23 DC link voltage during a 48 % voltage sag without compensation ...................51
24 DC link voltage for a 48 % voltage sag with the proposed module...................52
25 DC link voltage for a momentary voltage interruption without the compensating module.........................................................................................53
26 DC link voltage for a 100ms voltage interruption with the module...................53
27 DC link voltage during a 3 phase 50% sag without the converter ....................55
28 DC link voltage during a 3 phase 50% voltage sag with the converter .............55
29 Current supplied by the supercapacitor during the duration of the voltage sag..........................................................................................................56 30 DC link voltage for a 0.5 sec 3 phase voltage interruption without the compensator .......................................................................................................56 31 DC link voltage for a 0.5 sec 3 phase voltage interruption with the compensator .......................................................................................................57 32 Current supplied by the supercapacitor to the dc-dc converter during the short voltage interruption .............................................................................57 33 Equivalent circuit of the battery supercapacitor combination...........................62
34 System currents .................................................................................................63
35 Equivalent circuit of the battery supercapacitor combination...........................66
36 Direct connection of the supercapacitor............................................................68
Page FIGURE
viii
37 Supercapacitor connection using a dc-dc converter ............................................68
38 Direct capacitor connection.................................................................................69
39 Variation of p_enhance (y-axis) of battery supercapacitor hybrid as a function of frequency f and duty cycle D………………………………….…..70
40 Relative system loss reduction in the battery-supercapacitor connection..........71
41 Number of capacitors required as function of relative run-time extension........72
42 Run-time extension vs. frequency and number of capacitors ............................72
43 Run-time extension vs. capacitor ESR and number of branches in parallel ......73
44 Peak power enhancement vs. inductor value and number of capacitors in parallel ................................................................................................................74 45 Battery-inductor-capacitor losses .......................................................................75
46 Relative time extension vs. frequency and number of capacitors for a 100mH inductor.................................................................................................76
47 Discharge characteristics typical battery............................................................77
48 Battery current with and without a supercapacitor connected to its terminals...79
49 Voltage drop during conduction with and without the supercapacitor connected to the battery terminals.....................................................................79
50 Battery current with and without a supercapacitor and inductor connected
to its terminals ...................................................................................................80 51 Battery current with and without a supercapacitor connected to its terminals when using a dc/dc converter .............................................................................81 52 Battery and supercapacitor currents for two supercapacitor branches
connected in parallel..........................................................................................82 53 Battery and supercapacitor currents for four branches connected in parallel ....83
Page FIGURE

ix
54 Battery and supercapacitor currents for four branches in parallel and
inductor in series ...............................................................................................84 55 Battery and supercapacitor currents for one branch when using
a dc-dc converter ...............................................................................................85 56 Battery voltage as function of time without and with a supercapacitor .............86
Page FIGURE

x
LIST OF TABLES
1 Comparison between different energy storage devices.......................................28
2 Comparison between supercapacitors and battery ESR......................................28
3 Switch utilization comparison.............................................................................41
4 Comparison between different energy storage devices........................................61
Page TABLE
1
CHAPTER I
INTRODUCTION
1.1. Introduction
Modern power electronics began with the advent of the first power
semiconductor devices in the 1950’s. Since then many inventions of devices, converter
circuits, controls, and applications have enriched the field. Since the early 1980’s power
electronics has emerged as an important discipline in electrical engineering due to the
introduction of new switching devices and increasing popularity. Its use is growing
extensively and power electronics systems can be found in practically any industrial,
commercial, residential, aerospace, and military application. Moreover, recently power
electronics has gain a special significance due to energy conservation concerns and the
more efficient energy use made by power electronics. The core of a power electronics
apparatus consists of a converter built on an array of power semiconductor switching
devices that work under the guidance of control electronics.
Power electronics systems or power processors almost in every topology, with
the exception of very special cases such as matrix converters, have the need of energy
storage devices to provide energy backup and decoupling between different power
conversion stages.
This thesis follows the style of IEEE Transactions on Industry Applications.
2
Traditionally due to their low cost the most commonly used storage devices are
electrolytic capacitors and batteries, but they have some drawbacks such as size,
performance and life. There are several new energy storage technologies available today
such as flywheels and supercapacitors that appear to be very promising options to the
traditional energy storage devices. Among these new energy storage devices
supercapacitors appear to be a good option for applications that require high power
densities and fast transient response, and all this in a reduced volume.
Supercapacitors are polarized devices, as are conventional electrolytic
capacitors, but they differ in that supercapacitors have capacitance values ranging from 1
Farad to 2700 Farads and their equivalent series resistance is typically 10 times lower
than conventional capacitors. There are two major drawbacks in the use of
supercapacitors; the first one is their low terminal voltage. Current supercapacitor
technology allows for a maximum voltage of 2.7 Volts; therefore to achieve the voltage
levels normally used in power conversion several supercapacitor cells have to be stacked
in series or an additional step-up power converter has to be included to the system. The
second major drawback of supercapacitors is cost; since this is a relatively new
technology the cost of supercapacitors is still high when compared to other energy
storage technologies such as lead acid batteries. Currently the estimated cost per 1 Farad
is around one dollar, but it is expected that in the near future this is going to fall
drastically to around one cent per Farad. This will make supercapacitors a serious
contender against traditional energy storage technologies.

3
An application of supercapacitors in power electronics systems is as backup
energy storage for systems subjected to a reduction to their input voltage. This transient
disturbance is commonly known and referred to as voltage sags. Power quality surveys
on industrial level rank these voltage anomalies as the most common electrical
disturbance on distribution systems [1]. Furthermore these disturbances are to blame for
92% of all disturbances in electric distribution systems. Especially the effect that this
phenomenon has on adjustable speed drives is analyzed.
The number of battery powered applications has been multiplying as their size is
becoming smaller, and therefore more portable. This size reduction has been
accompanied by an increase of the number in features provided by the devices, with the
consequence of higher energy requirements having a big impact on the autonomy of the
devices powered by batteries. This battery autonomy is commonly referred to as run-
time and is the time that the device can run from the battery until it is completely
depleted. It is known that the way that batteries are discharged drastically impacts their
run-time, i.e. a load with pulsating characteristics is more likely to produce a shorter run-
time than a constant load. For this type of application supercapacitors can provide the
transient power required by the load, and therefore soften the load requirements, whit a
consequence of improved run-time.
1.2. Energy storage requirement in power converters
Power converters or power processors require energy storage devices to provide
continuity of operation when the main energy source, which normally is the utility, fails

4
to provide the energy required to the load, and also provide decoupling between the
input and output converters. The usual power converter topology is shown in figure 1
where the system is constituted by two converters connected by a energy storage
element.
Figure 1 Typical power processor Figure 2 Typical off-line power processor
The other practical power processor topology is shown in figure 2 and it is used
when the system is to work offline, and only rely on the energy stored in the energy
storage element.
Traditionally these storage devices consist of batteries or bulky electrolytic
capacitors which have drawbacks such as low transient response and relative high
equivalent serial resistances for the case of the batteries, and low energy storage
capability for the case of conventional capacitors. Recently new energy storage devices
have emerged, and these new devices present several advantages to the traditional
energy storage devices, such as reduced losses, and improved power densities. Also

5
these new devices present additional advantages because they do not contain hazardous
materials harmful to the environment as do traditional batteries.
1.3. Energy storage in electrical systems
It is well known electrical energy cannot be stored in its ac form; it only can be
stored in the dc form. Therefore in power electronic systems the energy storage devices
are concentrated on the dc link of the converters. Although this is commonly true, over
the years various indirect energy storage methods have been developed such as storing
the energy as compressed air, heat, hydrogen or in rotating flywheels. Most of these
storage methods are not very efficient and much of the energy is lost in the process of
converting the energy from its electrical form to a different one. Among the indirect
energy storage devices the flywheel appears as the most convenient and efficient.
Direct energy storage devices are those where the energy is stored without
transforming the energy to a different type. These devices can be divided in two,
electrical and magnetic. In the case of storing the energy electrically super capacitors are
used and the energy is stored separating the electrical charge and storing it on separated
electrodes. For the magnetic storage the energy is stored on the magnetic field generated
by a superconducting coil. The main problem of this last storage method is that the
current state of super conducting materials requires extremely low temperatures. This
has the problem of working with cryogenic systems which adds complexity and size to
the storage system. Also because of the extra complexity magnetic storage devices or
Superconducting Magnetic Energy Storage (SEMS), as they are known have a high cost.

6
The different energy storage methods available are shown in figure 3, where they are
grouped by direct and indirect storage, and by their specific storage reservoir.
Figure 3 Electrical energy storage methods
1.4. Energy storage devices
The storage devices mentioned in the previous point are supercapacitors and
flywheels. Although Flywheels have been around a long time, only recently they have
evolved in to a more efficient and compact technology that can be used in power
electronics systems to store energy. This is due to the development of new composite
materials, which allow smaller sizes and higher rotational speeds. Such improvements
result in devices capable of storing high amounts of energy on a reduced space. On the
other hand the development of double layer capacitors, better known as supercapacitors
or ultracapacitors, allows higher energy storage capability than traditional electrolytic

7
capacitors and with lower equivalent series resistance. This last feature makes this kind
of capacitor a very good device for transient applications.
Because of their nature these new energy storage devices require the addition of
dc-dc converters to connect them to the rest of the system. In the case of the
supercapacitors the converter is required due the low terminal voltage reached by the
current technology, which ranges from 2.4 to 2.7 V. When a flywheel is used as an
energy storage device, the converter needed to interface to the rest of the system has to
adjust the output voltage as the speed of the flywheel diminishes.
In general two factors characterize the application of an energy storage
technology. One is the amount of energy that can be stored in the device. This is a
characteristic of the storage device itself. Second is the rate at which energy can be
transferred into or out of the storage device. This depends mainly on the peak power
rating of the power conversion unit, but it is also impacted by the response rate of the
storage device itself.
1.5. Trends in energy storage devices development
Energy storage devices, such as supercapacitors, flywheels, and also electro
chemical batteries, are still under development. This means that in the near future their
power densities and energy density capabilities are going to be improved. An estimation
of the expected power/energy capabilities for these devices in the near future is shown in
figure 4 [2]. From this figure is easy to see that supercapacitors will considerably
increase their energy density from their actual values, which are around 5 Wh/kg to

8
approximately 100 Wh/kg. This makes supercapacitors a very promising energy storage
technology considering that the most widely used batteries, lead acid batteries, energy
density normally is about 60 Wh/kg. Integration of these energy storage technologies
with power converters can provide useful applications in the area of the power quality to
provide ride through power and backup energy for critical loads. Also, combining
different technologies will allow for keeping the individual characteristics of each device
to gain a hybrid with higher power/energy performance.
Figure 4 Power density vs. energy density for different energy storage devices
1.6. Effect of voltage sags in adjustable speed drives
Voltage sags are defined by the Institute of Electrical and Electronics Engineers,
IEEE, as a decrease between 0.1 and 0.9 per unit in rms voltage at the power frequency
for durations of 0.5 cycles to 1 minute. Generally voltage sags are caused by transient

9
events such as connecting of large loads to the system, motor starting, fast reclosing of
circuit breakers, short circuits, lightning strokes on overhead lines, etc. Voltage sags
normally do not cause damage to the equipment but they can disrupt the operation of
sensitive electronic loads such as the control boards of adjustable speed drives, having
the effect of making their protections trip. A severe sag occurrence can be defined as one
where the voltage magnitude falls below the 85% of its rated value. According to power
quality surveys, voltage sags are the main cause of disturbances. Also these surveys
report that 68% of the disturbances are voltage sags and they are the only cause of
production loss. These loses are caused by voltage sags of 13% of the rated voltage, with
a duration of more than 8.3 msec. (half a cycle). In textile and paper mills brief voltage
sags may potentially cause an ASD to introduce speed fluctuations which can damage
the final product. Furthermore short voltage sags can produce a momentary dc-link
voltage drop which can trigger the protection circuitry. That kind of nuisance tripping of
an ASD used on a continuous process can cause a major disturbance in the final product.

10
Figure 5 50% voltage sag
Figure 6 DC link voltage under a 50% voltage sag .
In Figure 5 a typical single phase voltage sag can be seen. In this case the voltage
drop is 50 % and it lasts for 100 µsec. The effect of this disturbance can be seen in figure

11
6. This reduction in the dc link voltage can cause the dc link under voltage protection to
trip. To compensate the voltage sag effects in the dc link of the ASD a new
compensation scheme is proposed combining a fly buck converter and a super capacitor.
This scheme is capable of compensating deep voltage sags as well as short voltage
interruptions.
1.7. Run-time in battery powered systems
The run-time in a battery powered portable system, such as laptops and other
mobile applications, defines the span of time that the device can be under operation
before the energy reserve is depleted. Mobile devices and wireless communication
equipment are increasing in number and features constantly, this is driven by the
anytime, anywhere computing and communications needs of today’s world. All this
requires batteries to deliver more performance in terms of power and energy. This can be
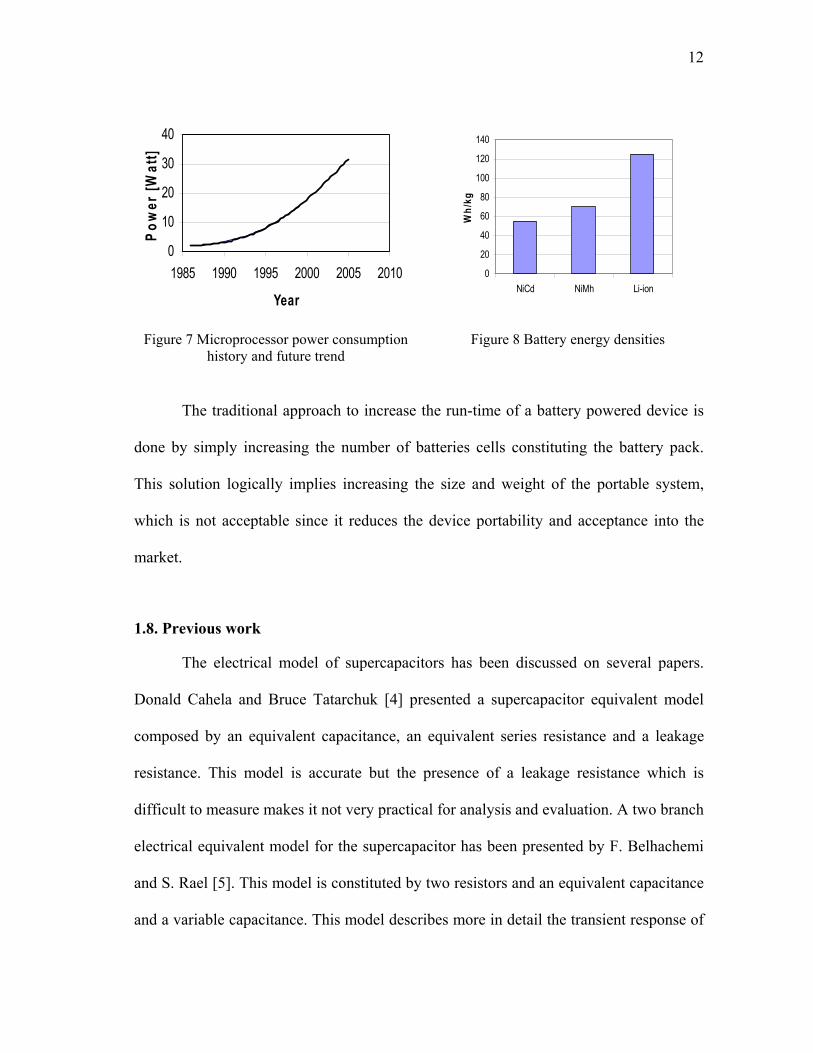
observed from figure 7 [3], which show the steady increase in the power requirement of
computer processors since 1986. Unfortunately battery manufacturers have not been able
to catch-up with the increasing needs of the new devices. This is due to the dynamics
and characteristics of the chemical reactions taking place in the batteries. Current
battery technologies have energy densities ranging from 50 to 125 W/kg depending on
the battery type as shown in figure 8. For example this means that a typical Li-Ion laptop
battery normally weighting 0.4 kg can only supply the computer load, i.e. 25 Wh, for
about 2 hours. Which is far from a whole office day and it does not even provide enough
autonomy for running the computer during a typical airplane flight.
12
0
10
20
30
40
1985 1990 1995 2000 2005 2010
Year
Pow
er [W
att]
0
20
40
60
80
100
120
140
NiCd NiMh Li-ion
Wh/
kg
Figure 7 Microprocessor power consumption history and future trend
Figure 8 Battery energy densities
The traditional approach to increase the run-time of a battery powered device is
done by simply increasing the number of batteries cells constituting the battery pack.
This solution logically implies increasing the size and weight of the portable system,
which is not acceptable since it reduces the device portability and acceptance into the
market.
1.8. Previous work
The electrical model of supercapacitors has been discussed on several papers.
Donald Cahela and Bruce Tatarchuk [4] presented a supercapacitor equivalent model
composed by an equivalent capacitance, an equivalent series resistance and a leakage
resistance. This model is accurate but the presence of a leakage resistance which is
difficult to measure makes it not very practical for analysis and evaluation. A two branch
electrical equivalent model for the supercapacitor has been presented by F. Belhachemi
and S. Rael [5]. This model is constituted by two resistors and an equivalent capacitance
and a variable capacitance. This model describes more in detail the transient response of

13
the capacitor but is to complex to be practical, and the model parameters are not easily
measured. The simplest and most accurate model is presented by T. Smith and J. Mars
[6]. This model is composed only by an equivalent capacitance and a series equivalent
resistance. This simplified model is accurate and its two parameters are easy to measure.
Selecting the appropriate dc-dc topology to be used to interface the energy
storage device and the load depends on the type of load and the required transient
response, as said before. But in the case of supercapacitors it also requires bi-directional
power flow in order to charge the devices once their stored energy has been delivered.
Suitable topologies are discussed in the references by Jingquan Chen, Dragan
Maksimovic [7], Alexander Rabello [8,10], Marcio Co [8,10] ,Wilson de Argano [8,9] ,
Ivo Barbi [8,9,10], Deepak Divan [11] and William Brumsickle [11]. The topologies
presented on these references apply to specific applications and some of them do not
provide bi-directional power flow. This last problem is especially important in where
supercapacitors are used, because they need to be recharged after their stored energy
falls bellow a certain level.
Several topologies have been proposed to provide ride through capabilities to
adjustable speed drives. Jose Luis Duran and Prasad Enjeti [1] proposed a low cost
approach to provide ride through for voltage sags adding three additional diodes and a
boost converter to the dc-link of adjustable speed drives. The only disadvantage of this
solution is that during the duration of the sag additional current is drawn from the
healthy phases and that it is not able to compensate for deep sags and short interruptions.
14
M. Corley and J. Locker [12] proposed an approach to provide ride through using
supercapacitors and a combination of a boost and buck converters connected in parallel.
Although this topology is able to provide compensation for deep sags and short
interruptions its main problem is that high voltage supercapacitors are needed. This
because a practical boost converter is not able to generate voltages higher than twice its
input voltage, and high voltage supercapacitors imply the connection of multiple
capacitors cells in series increasing the cost and size of the system.
The issue of battery performance improvement is treated by T.A. Smith, J.P.
Mars and G.A. Tuner [6]. Their research is focused mainly on batteries and
supercapacitors used in low voltage memory backup systems, and they do not present a
detailed theoretical analysis of the topic.
1.9. Research objective
The objective of this thesis is to develop some new applications in power
electronics for supercapacitors. This involves the design and development of dc-dc
converters to interface the supercapacitor banks with the rest of the power electronic
processor. Also the characteristics of the supercapacitor impedance in frequency domain
will be studied to understand its behavior when subjected to pulsating currents common
in some dc-dc converter topologies.
An application of supercapacitors as backup energy storage for compensating
voltage sags and short voltage interruptions for loads adjustable speed drives is
presented. The proposed compensator is designed and roughly tested by means of

15
simulations. Later an experimental prototype is build and tested under various operating
conditions to verify the effectiveness of the sag compensator.
Also the use of supercapacitors to extend battery run-time is explored. The
approach used is the connection of supercapacitors and a battery in parallel, either by
direct connection or by using a dc-dc converter to interface the low voltage
supercapacitor cells and batteries. The frequency response of the battery-supercapacitor
hybrid will be studied both analytically and experimentally. Experimental results on the
battery-supercapacitor hybrid combination are obtained to verify the extension on the
run-time of the system. Also experimental results on the battery-supercapacitor
connection using low voltage supercapacitor cells and a dc-dc converter to interface the
battery and the supercapacitor are obtained and the run-time extension will be measured.
1.10. Thesis outline
Chapter I present the need for energy storage devices in power converters and the
requirements that these devices have to fulfill. Also in this chapter the possible methods
that can be used to store energy in power electronic converters is discussed, and a short
description of the characteristics of each device is given. Later in this chapter the
expected horizons for the most promising energy storage devices are disused and
analyzed. Finally the research objective of this work is presented.
In chapter II each of the most promising energy storage technologies are
described and their most important characteristics discussed. A comparison between the
different energy storage technologies is made.
16
Chapter III suitable topologies to be used to interface supercapacitors and power
electronic systems are discussed and compared. Five converter topologies are presented
and analyzed. From this analysis a comparison between the different converter
topologies is made and conclusions are drawn.
Chapter IV discusses the application of supercapacitors as a backup energy
source for adjustable speed drives when subjected to voltage sags. A simple capacitor
sizing procedure for this application is developed and the required dc-dc converter to
interface the supercapacitor and the adjustable speed drive is designed and tested. In the
last part of this chapter conclusions are made respect to the performance of this approach
to provide ride through.
Chapter V explores an approach to extend battery run-time by using a
supercapacitor connected directly in parallel with the battery and by using a dc-dc
converter to interface low voltage supercapacitors with batteries. The development of
this converter and the testing of the two alternatives is done. In the last part of this
chapter conclusions are made.
Chapter VI ends this thesis presenting the general conclusions of this work.

17
CHAPTER II
REVIEW OF ENERGY STORAGE DEVICES FOR POWER
ELECTRONICS APPLICATIONS
2.1. Introduction
Power electronics applications require energy storage devices mainly for two
reasons; the first is to use these devices as the primary energy source for power
conversion, an example is portable power supplies where the energy is provided by a
battery pack. The second reason is to provide an energy backup when the primary energy
source, normally the utility company, fails to fulfill the load requirements, an example of
this type of application are UPS systems.
These two application types for energy storage devices differ mainly from each
other in the amounts of energy that the devices have to provide and in the transient
dynamic response characteristics that the devices must be able to deliver. Other less
important differences between these two applications involve the physical characteristics
of the storage devices. This because if the energy storage device is to be used for a
energy backup application the amount of space that the device can use is limited.
Energy storage devices are available in different technologies, and therefore they
have also different features and characteristics that make some of them more suitable for
one application than others. Differences between these technologies result in changes in

18
basic characteristics such as size and weight of the devices and in other more important
from the electrical point of view such as dynamic response, current rating and energy
and power density.
In this chapter three energy storage technologies are presented and their more
important characteristics are discussed. The energy storage technologies described in this
segment are the widely used and known electro-chemical batteries, the promising new
technology of double layer supercapacitors and the ever improving technology of the
mechanical flywheel.
2.2. Battery technology
Batteries are one of the most cost effective energy storage technologies available,
where the energy is stored electrochemically. All battery systems are made up of a set of
low voltage/power cells connected in series to achieve the desired terminal voltage, and
in parallel to provide the desired power rating. Batteries can be charged and discharged a
certain number of times given by the cycling capability of the electrodes and the
chemical used as electrolyte. Currently there are various battery technologies. Where the
lithium ion is becoming more popular every day, but still lead acid batteries are the most
widely used due to cost issues. Key factors of batteries as energy storage devices are
they high energy density, high energy capability, life span and initial cost.
As said before lead acid batteries still the most used battery technology today,
mainly because of their lower initial cost. Despite these advantages this technology has
19
some important drawbacks such as limited cycle life, higher maintenance costs and
considerably weight and size.
Other battery technologies appear promising for energy storage in power
electronics applications, offering higher energy densities and improved cycle life than
conventional lead acid batteries. The main problem of these other battery technologies
is that the cost makes them unpractical for the typical applications in power electronics.
Among these other battery technologies the most promising appear to be the nickel –
cadmium, nickel – metal, and lithium – ion technologies.
Due to the chemical kinetics involved, batteries cannot handle high power levels
for long time periods, and in addition rapid discharge cycles may shorten the battery life
leading to early replacement. Also there are some environmental concerns related to the
use of batteries due the hazardous materials contained on them, and the toxic gases
generated during the charge discharge cycles. The disposal of the hazardous materials
contained in the batteries implies additional costs due to strengthen environmental
regulations.
2.3. Supercapacitor technology
Capacitors store electrical energy by accumulating charge on two parallel
electrodes separated by a dielectric material. The capacity represents the relationship
between the electric charge stored in the capacitor and the voltage between the two
electrodes of the capacitor. This relationship is described by equation (1), where q
represents the charge stored in the capacitor, C the capacitor value in Farads and V the

20
capacitor voltage. The capacitance value of a capacitor is given by the dielectric
permittivity ε, the distance d separating the capacitor electrodes and the effective area of
the electrodes constituting the device A; and it can be calculated using (2). The energy
stored in a capacitor is a function of the capacitance value of the device and its terminal
voltage; it can be calculated using (3). Where E is the energy stored in the capacitor, C is
the capacitor capacitance value, and V is the capacitor terminal voltage. As can be seen
from (3) the amount of energy stored in a capacitor two things can be done. One is to
increase the value of the stored voltage. This value is limited by the voltage withstand
strength of the dielectric material between the electrodes.
CVq = (1)
dAC ε
= (2)
2CV21E = (3)
The other way to increase the energy stored in a capacitor is increasing its
capacitance. This can be done increasing the effective area of the electrodes, increasing
the permittivity of the dielectric separating the electrodes, or decreasing the distance
between the two electrodes. Another important factor about capacitor technology is the
equivalent series resistance or ESR. This parameter has an important effect on the
turnaround efficiency when charging discharging the capacitor and on the transient
response of the device.
Conventional dc capacitors have long been used as energy storage devices in
power electronics converters. Common uses for these devices are applications where
21
pulsating bursts of energy are required and for provide limited backup energy for
applications such as adjustable speed drives.
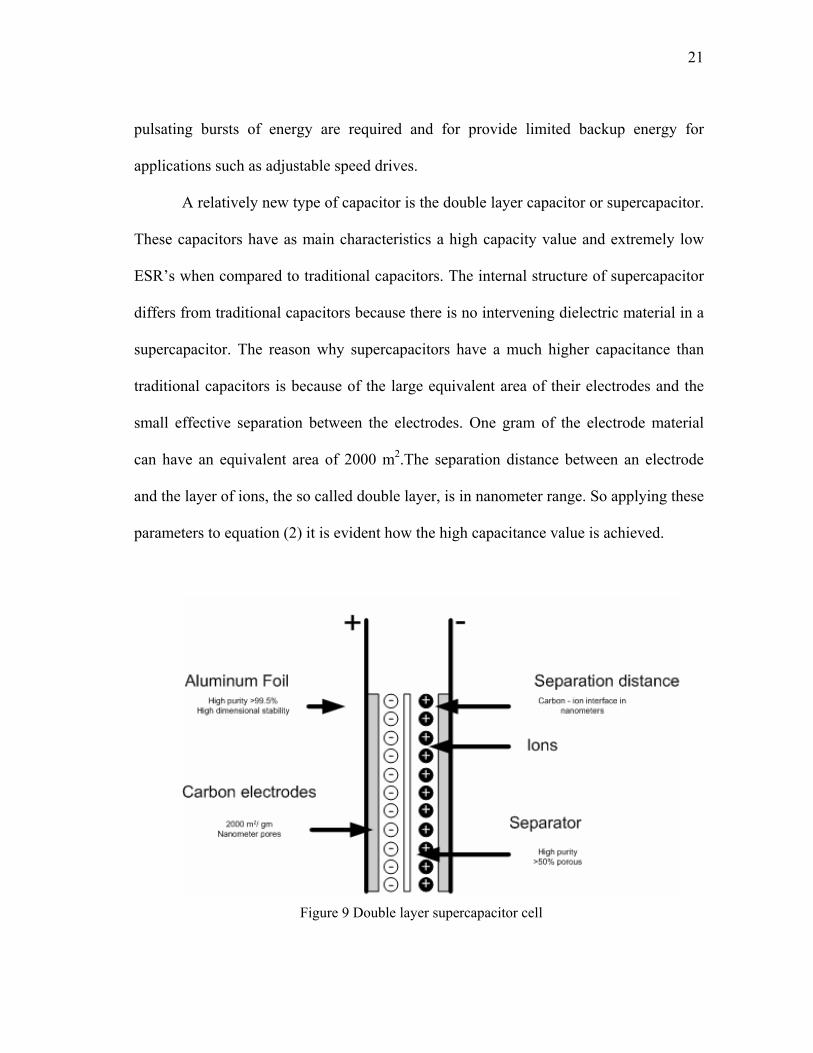
A relatively new type of capacitor is the double layer capacitor or supercapacitor.
These capacitors have as main characteristics a high capacity value and extremely low
ESR’s when compared to traditional capacitors. The internal structure of supercapacitor
differs from traditional capacitors because there is no intervening dielectric material in a
supercapacitor. The reason why supercapacitors have a much higher capacitance than
traditional capacitors is because of the large equivalent area of their electrodes and the
small effective separation between the electrodes. One gram of the electrode material
can have an equivalent area of 2000 m2.The separation distance between an electrode
and the layer of ions, the so called double layer, is in nanometer range. So applying these
parameters to equation (2) it is evident how the high capacitance value is achieved.
Figure 9 Double layer supercapacitor cell

22
In figure 9 the typical carbon double layer supercapacitor cell construction can be
seen. In some way the supercapacitor construction is similar to that of a battery with two
electrodes immersed in a electrolyte with a separator in between. However, unlike
batteries in the case of the supercapacitor there is no chemical energy storage. There are
effectively two capacitors in series within each supercapacitor cell. Each of them has a
set of electrodes consisting of carbon and an adjacent electrolyte with a layer of ions.
The electrical charges are not bounded to the electrolyte, they are free to move
anywhere in the electrolyte which also penetrates the pores of the carbon electrodes. The
separator insulates the two electrodes whilst allowing the ions to pass through it. The
electrolyte is in form of an aqueous substance which allows a maximum voltage of 1 V
per cell. If an organic electrolyte is used the maximum allowable voltage is 2.5 V. The
presence of impurities on the electrolyte generates chemical reactions that tend to
increase the ESR and gives a finite lifetime to the supercapacitor.
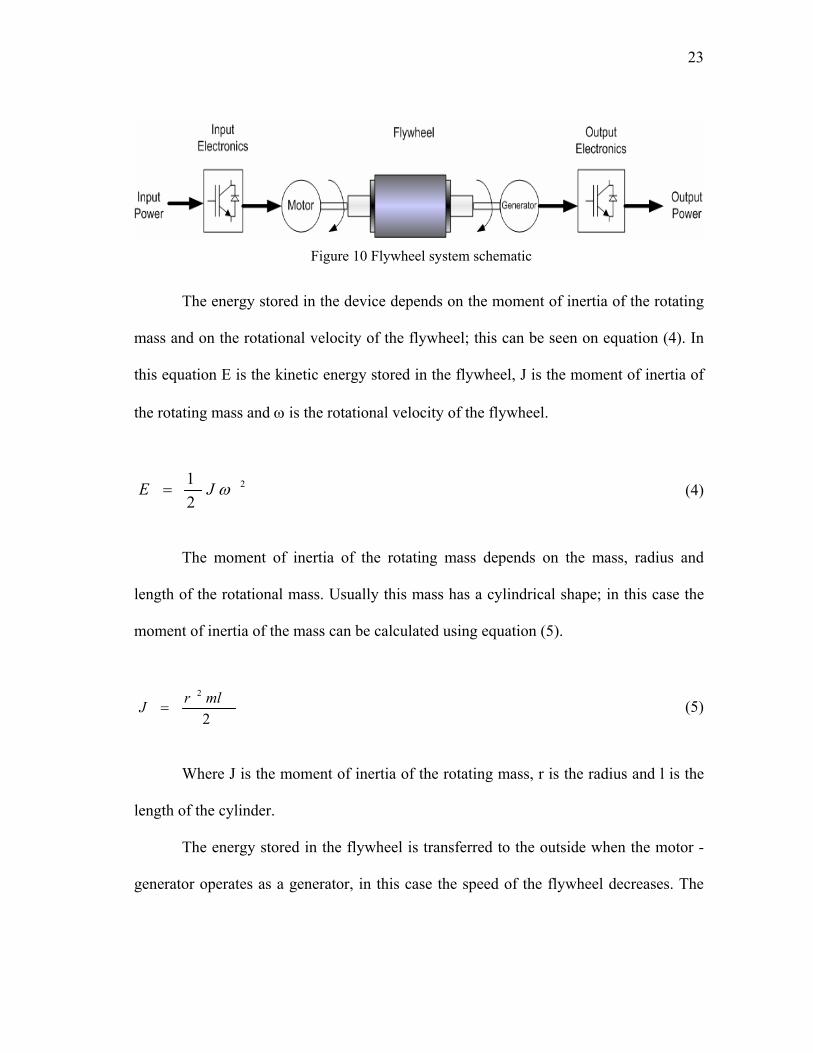
2.4. Flywheel technology
Flywheels have been around for a long time, but new improvements on its
technology and the need of more environmental friendly devices is giving this energy
storage devices a renewed impulse. Flywheels store energy as kinetic energy on a
rotating mass. This mass coupled to a motor – generator set through a shaft. In the big
majority of the flywheel applications this motor-generator set is connected to a power
electronic converter to provide a wide operating range. A schematic of the flywheel
components is shown on figure 10.
23
Figure 10 Flywheel system schematic
The energy stored in the device depends on the moment of inertia of the rotating
mass and on the rotational velocity of the flywheel; this can be seen on equation (4). In
this equation E is the kinetic energy stored in the flywheel, J is the moment of inertia of
the rotating mass and ω is the rotational velocity of the flywheel.
2
21 ωJE = (4)
The moment of inertia of the rotating mass depends on the mass, radius and
length of the rotational mass. Usually this mass has a cylindrical shape; in this case the
moment of inertia of the mass can be calculated using equation (5).
2
2 mlrJ = (5)
Where J is the moment of inertia of the rotating mass, r is the radius and l is the
length of the cylinder.
The energy stored in the flywheel is transferred to the outside when the motor -
generator operates as a generator, in this case the speed of the flywheel decreases. The

24
flywheel is charged when the motor – generator works as a motor increasing the rotating
velocity of the flywheel.
As can be observed from equation (4) the energy storage capability of the
flywheel can be improved either by increasing its moment of inertia, making spin its
mass at a higher rotating velocity, or both at the same time. Two strategies than have
been used to develop high power flywheels are increasing the moment of inertia by
increasing the radius of the spinning mass and using materials such as iron or steel for its
construction. In this case the rotational velocities used have a maximum of 10000 rpm.
This kind of approach if commonly used commercially, because of the easy
implementation using standard electric motors, mechanical components and power
electronics. The other approach utilized is using a smaller radius and composite
materials which result in a smaller moment of inertia, but allow rotational velocities as
high as 100 000 rpm. This type of approach results on lighter and smaller flywheels that
can store the same amount or even more energy that the previously discussed flywheel
technology. Rotational loses are very important in flywheel technology, because they
produce the self discharge effect. This loses are mainly produced by air drag and bearing
loses, and their importance increases with the rotational velocity. Therefore high speed
flywheels are mounted on evacuated containers, where the pressure is reduced to values
as low as 0.1 Pa for 100 000 rpm flywheels. To reduce the bearing loses the flywheels
are mounted on magnetic bearings, such as superconducting magnetic bearings. With the
near eliminated rotational loses provided by the methods previously discussed flywheels

25
have a high charge/discharge efficiency. The peak values of the power transfer depend
only on the design of the motor - generator and the power electronic converter.
The high speed operation of the flywheels require of containment units due to security
concerns, because of the inherent danger of the rotational mass tearing apart due to the
high centrifugal forces produced by the rotational velocity. This adds extra weight to the
system which reduces their energy density [W/kg].
2.5. Comparison between energy storage technologies
As stated on the previous points in this chapter the various energy storage
devices available differ in their energy densities, power densities and other important
parameters such as equivalent series resistance and dynamic response time. Therefore is
important to compare the different technologies in order to achieve the highest
performance depending on the application on which they are going to be used.
For example, in some applications the load characteristic requires constant current, and
therefore this requirement makes some technologies like batteries more suitable than the
others. On the other hand when the load requirements demand a pulsating current
waveform, technologies like supercapacitors are in a better position to provide energy
efficiently. The differences in the energy density refer to the amount of energy stored in
the device in terms of the time that it can be used. As can be observed from Table 1,
currently there is a big difference between the three storage devices being discussed.
Batteries appear as the best option according to energy densities 10 times higher than
supercapacitors and between the same and twice times as much as flywheels. Another

26
important parameter when comparing energy storage devices is the power density, which
measures the energy stored in the device by kg of weight. From Table 1 it is clear that
supercapacitors offer higher power densities than the other two energy storage devices.
In fact they provide 100 times higher power densities than batteries and about 50 times
higher than flywheels.
Also important to consider in this comparison between energy storage devices is
the equivalent series resistance value. A high value implies higher internal losses and
bigger voltage drops at the moment when the load demands current. Consequently a
lower equivalent series resistance has the benefit of lower loses and a smother voltage
profile. When comparing this parameter the super capacitor appears to be the most
convenient, having an ESR 10 times lower than batteries and comparable with
flywheels. The different ESR values for supercapacitors, batteries and flywheels are
listed on Table 2. Volume and weigh are also important parameters to consider when
comparing energy storage devices, due to the size constraints present on modern power
electronic converters. From this point of view also the supercapacitors offer a better
alternative having a smaller volume and less weigh than the other alternatives. Flywheels
also have less weigh then batteries due to the use of composite materials, but their
volume is bigger because of the need of the protecting confinement vessel. Cost is
always an important parameter to be considered when comparing devices. From this
point of view traditional batteries such as lead acid batteries appear as having the lowest
initial cost; that is without considering the maintenance costs. Their cost per Wh is less
than one dollar. In the case of supercapacitors initial the cost per watt hour is around 80

27
dollars. Despite of having a higher initial cost, supercapacitors and flywheels have the
advantage of being practically maintenance free during all their life span. This last
parameter is also important to consider. The average lifespan of batteries is of five years
as a maximum for batteries who are not subjected to extreme condition as low/ high
temperatures and pulsating current loads. For these applications the life span of batteries
is estimated to be around tree years. In the case of supercapacitors the life span is about
10 years, but this value depends on the actual charge discharge cycles that the capacitor
has to withstand. Normally the number of charge discharge cycles of a supercapacitor is
around 100000. Important is that this number of charge-discharge cycles do not vary
because of usage under extreme environmental conditions such as very low or high
temperatures or because of pulsating current loads. The life span of flywheels is also
independent of the environmental conditions to which it is subjected. Also flywheel
performance is independent of the type of load that is connected to its terminals. Their
life span is estimated to be 20 years for advanced systems constructed using magnetic
bearings and composite materials.

28
Table 1 Comparison between different energy storage devices
Energy Source Energy kJ
Energy density [W/h]
Power Density [W/kg]
Price [US$]
Volume [cm3]
Weight [kg]
US$/Wh
Supercapacitors
by Maxwell [13] 8,437 2.34 5000 188 593.8 0.725 80.7
Supercapacitors
by Montena [14] 8,125 2.26 4300 170 486.32 0.525 75.22
Supercapacitors
by Kolban [15] 20,000 5.55 500 2870.31 5 90.09
33 Ah Lead Acid
Battery 1,425 360 <1000 100 3941.34 12 0.28
Table 2 Comparison between supercapacitors and battery ESR
Energy Source ESR
[mΩ]
Supercapacitor
brand “A” 1.0
Supercapacitor
brand “B” 0.7
Lead Acid Battery 7.0
Important to mention is that having an accurate knowledge of the state of charge
of batteries is a very difficult task to accomplish. But in the case of supercapacitors or
flywheels this task is much simpler. As can be seen from equation (4), to determine the
amount of energy stored on a fly wheel only the rotational velocity is needed. Also from
equation (3) to determine the amount of energy left on a supercapacitor only the
capacitor terminal voltage has to be known.

29
Also important to consider is that supercapacitors and flywheels are not mature
technologies, and therefore they are on continuous improvement reducing their costs and
getting closer to batteries in terms of energy densities. On the other hand batteries are a
proven technology widely used on power electronics applications for many years, but
few improvements have been done to make their power densities higher or to reduce
their size and weight. Also because of the chemical composition fewer advances can be
made to reduce their ESR’s or to improve their transient response.
From the previous comparison supercapacitors appear to be suitable to be used
on power electronic converters as standalone energy storage devices for applications
requiring pulsating burst of power or as a combination with batteries to combine the
advantages of the two devices in terms of power density, energy density and equivalent
ESR.
2.6. Conclusion
The three most common energy storage device technologies have been discussed
in this chapter. Battery technology is a well established and widely used on numerous
applications, but disadvantages like weight, size, poor power density and high equivalent
series resistance make these devices not suitable for some transient applications or where
volume and size are an important issue. Also due to the chemical dynamics batteries do
not perform efficiently for pulsating loads.
On the other hand flywheels offer a good transient response, which depends only
on the power electronic converter. Although the flywheel technology is been around for
some time now, new advances on composite materials and bearing systems have reduced

30
their size and volume. This reduction makes flywheels a good option for energy storage
in power electronic systems. Because of their energy density flywheels can compete is
many applications with batteries, but they are mostly used on applications where weight
is the greatest concern. This is because of cost restrictions since batteries still the most
economical solution from the initial investment point of view.
Supercapacitors despite of their low energy density present a good advantage
over the other two energy storage devices. This advantage is due their high power
density which makes them especially suitable for loads demanding pulsating currents.
Also this energy storage technology present a good advantage from the internal looses
point of view because of their very low equivalent series resistance. Supercapacitors are
also small in size and have less weight than the other energy storage devices.
31
CHAPTER III
REVIEW OF DC/DC CONVERTERS FOR SUPERCAPACITOR
INTERFACING
3.1 Introduction
Due to today’s technology restrictions supercapacitors have voltages between 2.5
and 2.7 V. Although for low voltage applications such as microprocessors they can be
connected directly to the load. The use of dc-dc converters is required to interface these
energy storage devices with the vast majority of systems like adjustable speed drives or
uninterruptible power supplies systems. There are several suitable topologies to boost
the supercapacitor terminal voltage to required voltage levels. These topologies differ in
performance, and component count. Therefore it is very important to select the right
converter in order to achieve the maximum utilization of the supercapacitor energy thus
minimizing loses. A discussion of the main advantages and disadvantages of the
suitable topologies is presented in the following points.
3.2. Boost converter
This type of converter is a very well known step-up converter topology and
widely used for low power switching power supplies. This topology schematic diagram
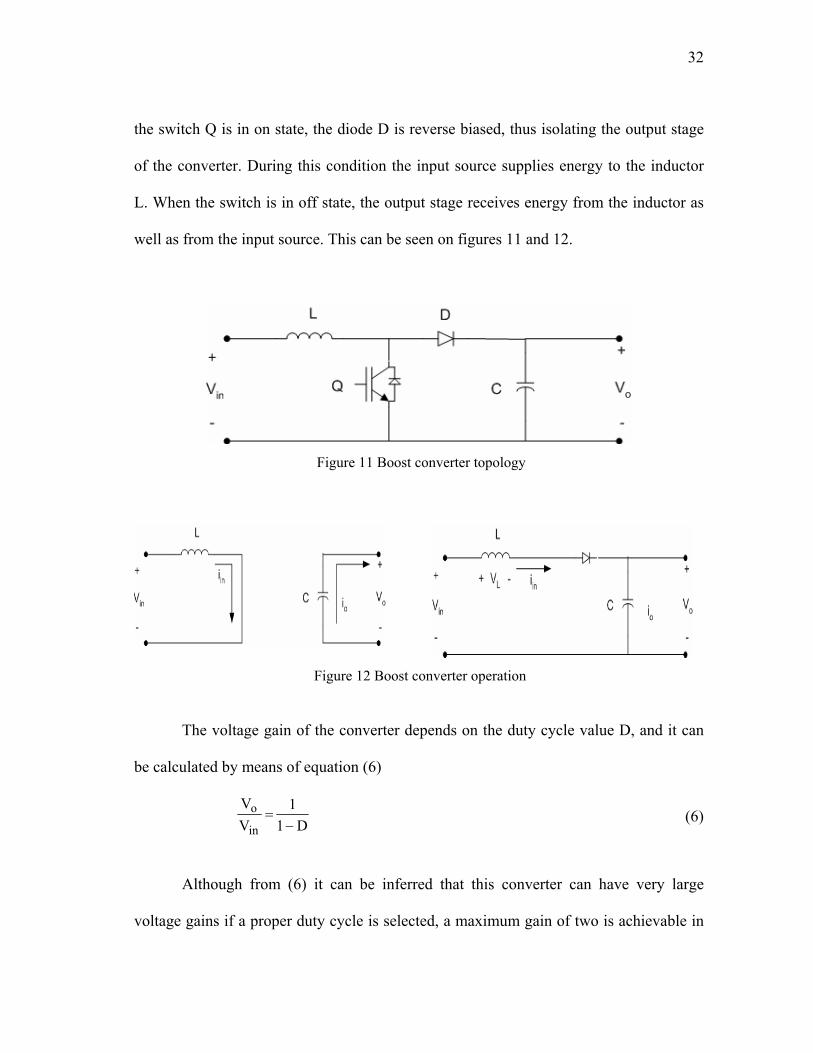
is shown on figure 11. The operation of this converter can be described as follows, when
32
the switch Q is in on state, the diode D is reverse biased, thus isolating the output stage
of the converter. During this condition the input source supplies energy to the inductor
L. When the switch is in off state, the output stage receives energy from the inductor as
well as from the input source. This can be seen on figures 11 and 12.
Figure 11 Boost converter topology
Figure 12 Boost converter operation
The voltage gain of the converter depends on the duty cycle value D, and it can
be calculated by means of equation (6)
D11
VV
in
o−
= (6)
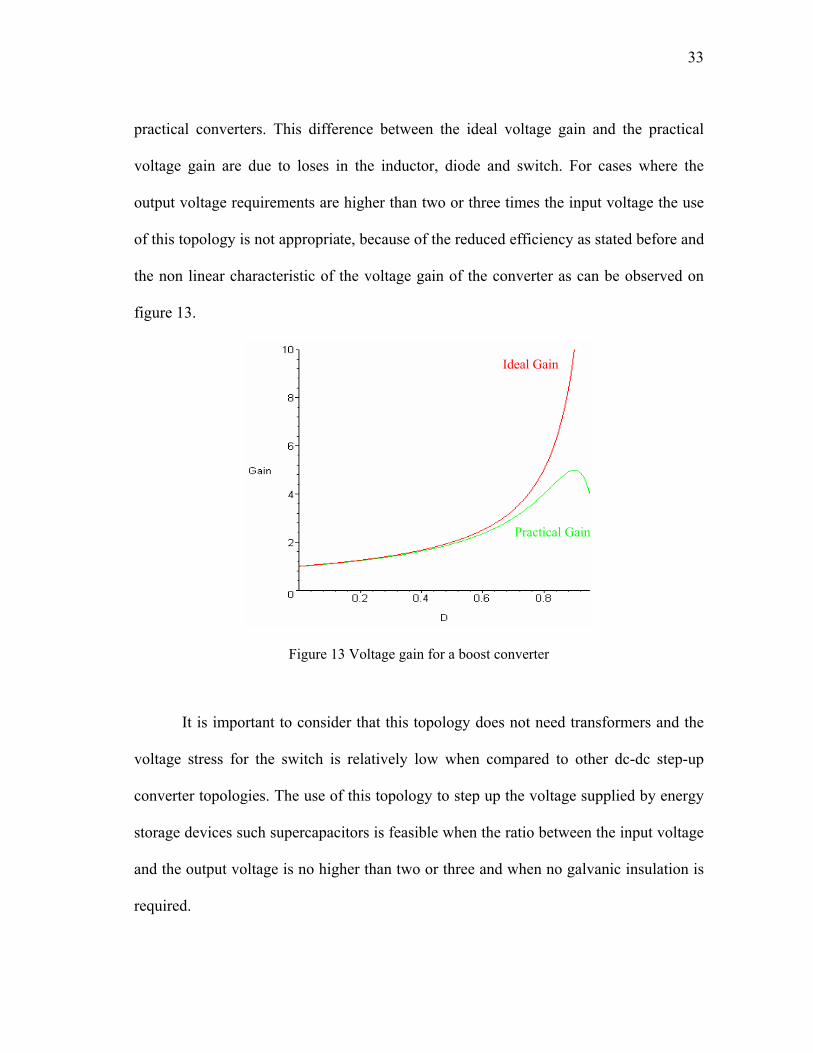
Although from (6) it can be inferred that this converter can have very large
voltage gains if a proper duty cycle is selected, a maximum gain of two is achievable in
33
practical converters. This difference between the ideal voltage gain and the practical
voltage gain are due to loses in the inductor, diode and switch. For cases where the
output voltage requirements are higher than two or three times the input voltage the use
of this topology is not appropriate, because of the reduced efficiency as stated before and
the non linear characteristic of the voltage gain of the converter as can be observed on
figure 13.
Figure 13 Voltage gain for a boost converter
It is important to consider that this topology does not need transformers and the
voltage stress for the switch is relatively low when compared to other dc-dc step-up
converter topologies. The use of this topology to step up the voltage supplied by energy
storage devices such supercapacitors is feasible when the ratio between the input voltage
and the output voltage is no higher than two or three and when no galvanic insulation is
required.
Ideal Gain
Practical Gain
34
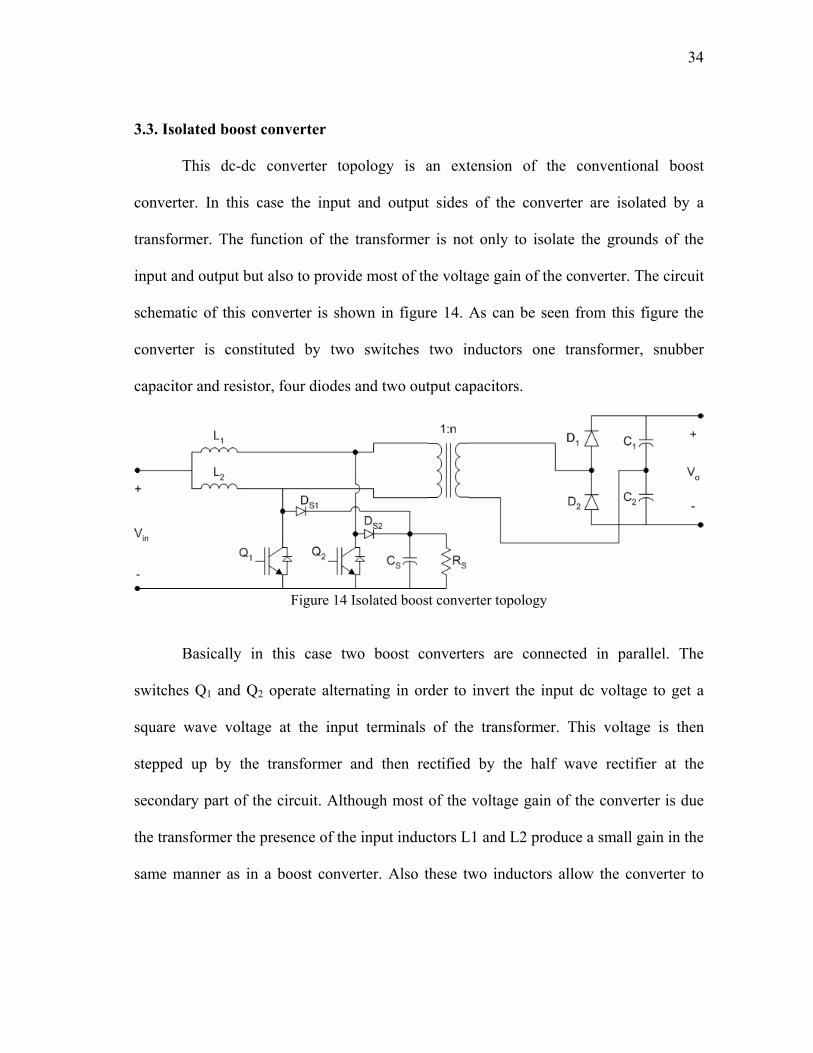
3.3. Isolated boost converter
This dc-dc converter topology is an extension of the conventional boost
converter. In this case the input and output sides of the converter are isolated by a
transformer. The function of the transformer is not only to isolate the grounds of the
input and output but also to provide most of the voltage gain of the converter. The circuit
schematic of this converter is shown in figure 14. As can be seen from this figure the
converter is constituted by two switches two inductors one transformer, snubber
capacitor and resistor, four diodes and two output capacitors.
Figure 14 Isolated boost converter topology
Basically in this case two boost converters are connected in parallel. The
switches Q1 and Q2 operate alternating in order to invert the input dc voltage to get a
square wave voltage at the input terminals of the transformer. This voltage is then
stepped up by the transformer and then rectified by the half wave rectifier at the
secondary part of the circuit. Although most of the voltage gain of the converter is due
the transformer the presence of the input inductors L1 and L2 produce a small gain in the
same manner as in a boost converter. Also these two inductors allow the converter to
35
work in continuous conduction, which reduces the input current peak value. This makes
this converter suitable for high power applications.
It is obvious that this topology has a much higher component count that the
previous one, but has the advantage of being suitable for high power applications and the
voltage gain characteristic is better for high gain values than the boost converter. The
main problem of this topology is the high switch stress which can be about 4 times the in
put voltage of the converter.
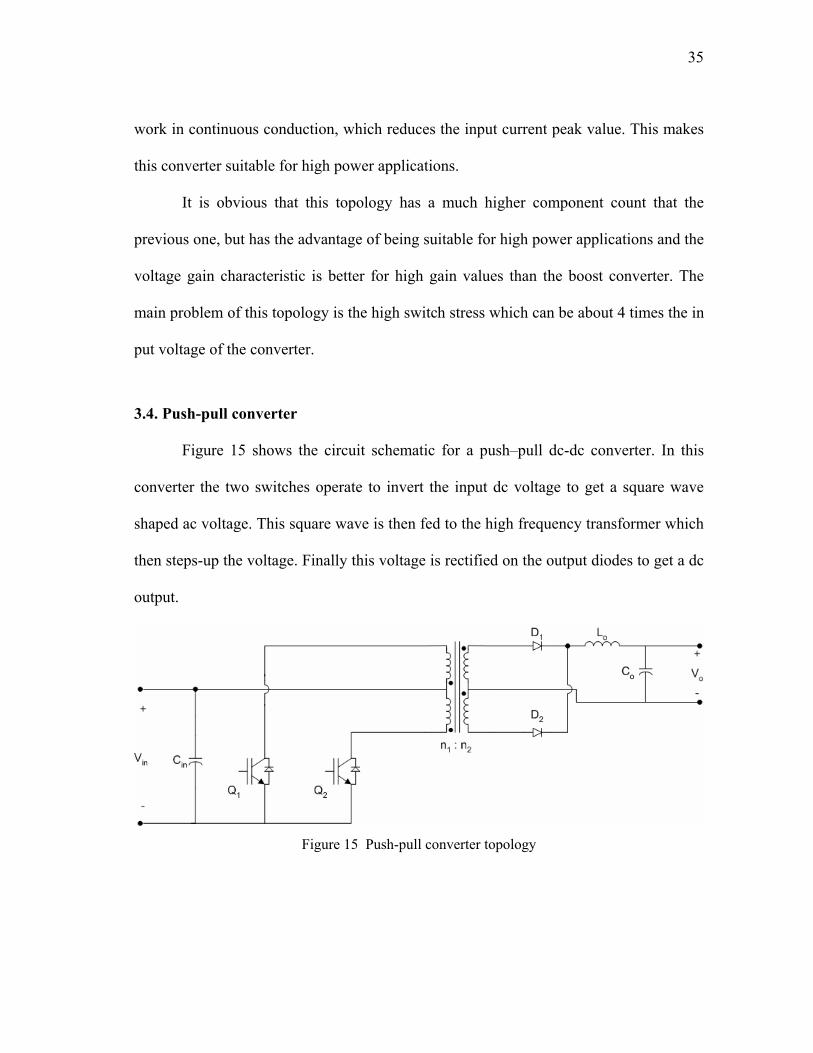
3.4. Push-pull converter
Figure 15 shows the circuit schematic for a push–pull dc-dc converter. In this
converter the two switches operate to invert the input dc voltage to get a square wave
shaped ac voltage. This square wave is then fed to the high frequency transformer which
then steps-up the voltage. Finally this voltage is rectified on the output diodes to get a dc
output.
Figure 15 Push-pull converter topology
36
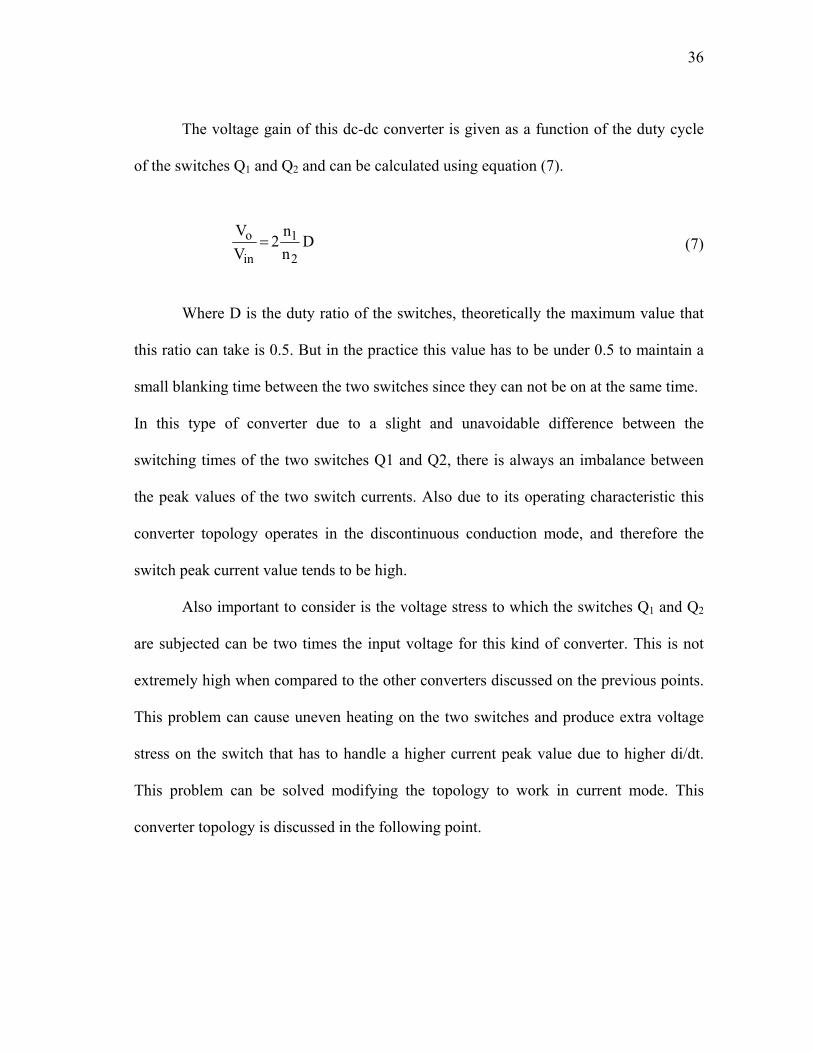
The voltage gain of this dc-dc converter is given as a function of the duty cycle
of the switches Q1 and Q2 and can be calculated using equation (7).
Dnn
2VV
2
1
in
o = (7)
Where D is the duty ratio of the switches, theoretically the maximum value that
this ratio can take is 0.5. But in the practice this value has to be under 0.5 to maintain a
small blanking time between the two switches since they can not be on at the same time.
In this type of converter due to a slight and unavoidable difference between the
switching times of the two switches Q1 and Q2, there is always an imbalance between
the peak values of the two switch currents. Also due to its operating characteristic this
converter topology operates in the discontinuous conduction mode, and therefore the
switch peak current value tends to be high.
Also important to consider is the voltage stress to which the switches Q1 and Q2
are subjected can be two times the input voltage for this kind of converter. This is not
extremely high when compared to the other converters discussed on the previous points.
This problem can cause uneven heating on the two switches and produce extra voltage
stress on the switch that has to handle a higher current peak value due to higher di/dt.
This problem can be solved modifying the topology to work in current mode. This
converter topology is discussed in the following point.

37
3.5. Current feed push-pull
The current feed push-pull topology is basically the same topology as the voltage
feed topology discussed on the previous point. It only differs on the inductor placed on
the input side of the converter as can be seen on figure 16. By including this inductor in
the topology is possible to operate at duty cycles higher than 50%. When operating at
duty cycles higher than 50% the converter operates in continuous conduction mode
reducing the peak value of the switches. This because operating at high duty cycle values
implies that the two switches are conducting at the same time for some time periods and
therefore the current is not cut at any moment.
Figure 16 Current feed push-pull topology
When the two switches are on the voltage on the primary half winding of the
transformer becomes zero. The input current builds up linearly and energy is stored in
the input inductor. When only one of the two switches is conducting, the input voltage
and the stored energy in the input inductor supply the output stage of the converter.
Therefore this converter operates in a manner similar to a boost converter.

38
During the continuous current conduction, i.e. duty cycle bigger than 0.5, the voltage
gain of the converter can be calculated using (8).
)d1(21
nn
VV
1
2
in
o−
= (8)
This kind of converter has the disadvantage of having a low power to weight
ratio when compared to the converters presented above. Also the voltage stress to the
switches is higher tan two times the input voltage when the converter is working below a
0.5 duty cycle. But it has the advantage of reducing the peak value of the switch current
for high loads because it works on the continuous conduction mode. This makes this dc-
dc converter topology a good option for high power applications.
3.6. Buck-boost converter
This converter topology is slightly more complex than the boost converter since
includes one additional switch. But it has the advantage of allowing bidirectional power
flow, which means energy can flow from the energy source to the load and back from
the load to the energy source. This feature is very convenient for energy storage devices
like batteries and supercapacitors, because it allows to recharge the device after each
time their energy is used. The operation of this converter is described in the following
lines and its schematic is shown in figure 17.
This converter stores energy supplied by the source in the inductor L during the
on time of the switch Q2. When the switch is of the energy of the inductor and the source
deliver energy to the load trough the anti parallel diode of the switch Q1. When an
inversion on the power flow direction is required switch Q1 is set on “on” state and
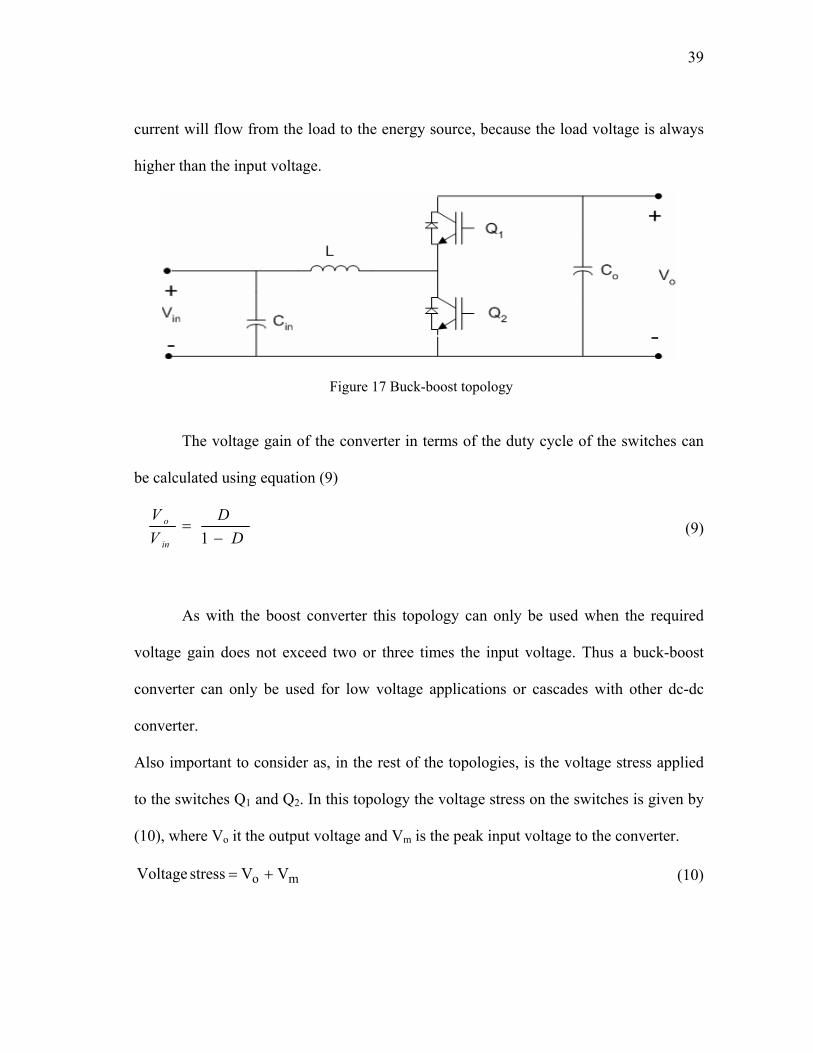
39
current will flow from the load to the energy source, because the load voltage is always
higher than the input voltage.
Figure 17 Buck-boost topology
The voltage gain of the converter in terms of the duty cycle of the switches can
be calculated using equation (9)
DD
VV
in
o
−=
1 (9)
As with the boost converter this topology can only be used when the required
voltage gain does not exceed two or three times the input voltage. Thus a buck-boost
converter can only be used for low voltage applications or cascades with other dc-dc
converter.
Also important to consider as, in the rest of the topologies, is the voltage stress applied
to the switches Q1 and Q2. In this topology the voltage stress on the switches is given by
(10), where Vo it the output voltage and Vm is the peak input voltage to the converter.
mo VVstress Voltage += (10)
40
3.7. Comparison between topologies
Often, the largest cost in a converter is the cost of the semiconductor devices.
Also, the conduction and switching losses associated with the semiconductor devices
often dominate the total converter losses. Thereby evaluating semiconductor switch
utilization is a good tool to compare different converter topologies. So it is useful to
compare the totals active stress and active switch utilization of different converter
topologies. If a converter topology contains k active semiconductor devices, the total
switch stress S can be defined by (11).
j
k
jj IVS ∑=
=1 (11)
Where Vj is the peak voltage applied to the jth semiconductor device, and Ij is the
rms current applied to the jth switch. If the converter output power is PLoad, then the
active switch utilization U can be defined by:
SPU Load= (12)
The switch utilization is less than one for transformer isolated converters, and is
a quantity depending on the duty cycle. A comparison between the converter topologies
discussed in previous points is shown in Table 3 below.

41
Table 3 Switch utilization comparison
Converter U(D) Max U(D) D for max U(D)
Boost DD)1( + ∞ 0
Isolated boost D
D+
+12
)1( 0.5 0
Push-pull
22D 0.353 1
Current fed push-pull D
D+
+12
)1( 0.5 0
Buck-boost DD)1( + 0.385 31
From Table 3 it can be seen that the boost converter switch utilization is greater
than one for duty cycles bigger than 0.382, and approaches to infinity as D tends to zero.
The reason for this is that, at D=0, the switch is always at its OFF state and hence its rms
current is zero. But at D=0 the output voltage is equal to the input voltage, therefore the
converter output power is nonzero.
Also from Table 3 it is possible to see that the incorporation of an isolation
transformer results in a reduced switch utilization. Therefore this type of converters
should be designed to operate preferably at a duty cycle as high as possible.
Finally from the previous table it is possible to see that the buck-boost topology has
lower switch utilization than the boost converter; however, isolation can be obtained
with no additional penalty in switch stress.

42
3.8. Conclusion
There is no ultimate converter perfectly suited for all applications perfectly suited
for all possible applications. For a given application, with given specifications, trade
studies should be performed to select a converter topology. Several approaches that meet
the specifications should be considered, and for each approach important quantities such
as worst case semiconductor device rms current, size, component count, etc. should be
computed. This type of quantitative comparison can lead to selection of the best
approach.
43
CHAPTER IV
USE OF SUPERCAPACITORS AS BACKUP ENERGY TO
PROVIDE RIDE THROUGH 4.1. Introduction
Voltage sags are the reduction of the voltage magnitude at the customer
terminals, which can have a duration ranging between one cycle and few seconds. This
phenomenon is caused by events such as motor starting, fast reclosing of circuit
breakers, short circuits, etc. Voltage sags normally do not cause damage to the
equipment but they can disrupt the operation of sensitive electronic loads such as the
control boards of adjustable speed drives, having the effect of making their protections
trip. A sever sag occurrence can be defined as one where the voltage magnitude falls
below 85% of its rated value. According to national power quality surveys, voltage sags
are the main cause of disturbances in electric distribution systems. These surveys also
report that 68% of the disturbances are voltage sags and they are the only cause of
production loss. These loses are caused by voltage sags of 13% of the rated voltage and
with a duration of more than 8.3 msec. (half a cycle). In textile and paper mills brief
voltage sags may potentially cause an ASD to introduce speed fluctuations which can
damage the final product. Furthermore short voltage sags can produce a momentary dc-
link voltage drop which can trigger the protection circuitry. This kind of nuisance
tripping of an adjustable speed drive used on a continuous process can be costly.
44
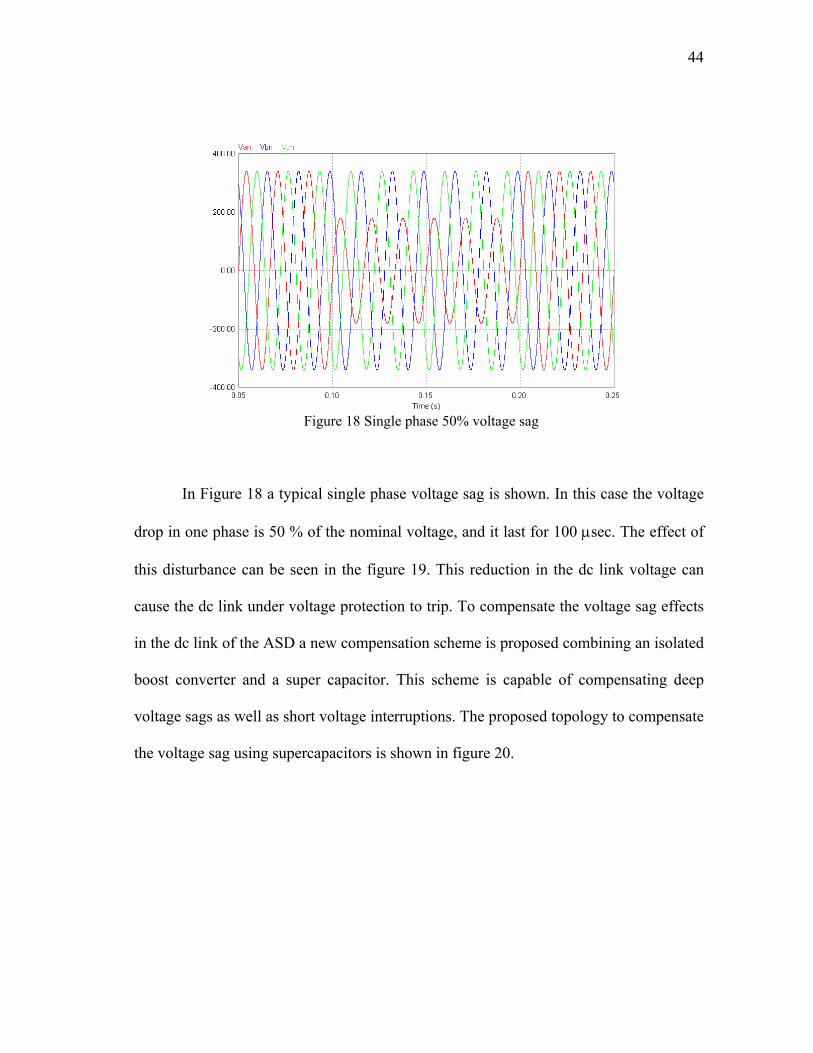
Figure 18 Single phase 50% voltage sag
In Figure 18 a typical single phase voltage sag is shown. In this case the voltage
drop in one phase is 50 % of the nominal voltage, and it last for 100 µsec. The effect of
this disturbance can be seen in the figure 19. This reduction in the dc link voltage can
cause the dc link under voltage protection to trip. To compensate the voltage sag effects
in the dc link of the ASD a new compensation scheme is proposed combining an isolated
boost converter and a super capacitor. This scheme is capable of compensating deep
voltage sags as well as short voltage interruptions. The proposed topology to compensate
the voltage sag using supercapacitors is shown in figure 20.

45
Figure 19 DC link voltage under a single phase 50% voltage sag
Figure 20 Proposed compensator topology

46
4.2. Advantage of using supercapacitors as backup energy storage
Power quality applications require instantaneous reliable ride-through power.
Using traditional lead-acid batteries for such rapid, deep-cycle electric power demands is
harmful to batteries. Also due to the higher ESR of the traditional batteries their use in
this kind of application produces higher voltage drops on their terminal voltage and extra
losses due to the pulsating characteristic of the load current. In order to ensure constant
readiness, using batteries this application will require significant maintenance and high
replacement costs. On the other hand, the use of super-capacitors offers significant
advantages over the use of batteries. The initial cost per kwh of the super-capacitors
commercially available today is higher than conventional batteries, but since they offer
higher charge-discharge cycles, and therefore they have a longer life span, and lower
maintenance costs they still a good alternative. As discussed in Chapter II the power
density of the super-capacitors is much higher than that from the traditional lead acid
batteries. This means that Supercapacitors are more suitable for short term applications
such as the proposed in this paper.
Recalling from Chapter II the main advantages of the super-capacitors when
compared to traditional batteries used in power quality applications can be resumed as
listed in the following points:
47
Energy densities 100 times greater than conventional capacitors.
Power densities 10 times greater than batteries.
Specific energy range of 1.12-2.48 Wh/kg.
Charge and discharge times of fractions of a second to several
minutes
Rated capacitance value ranging from 0.043-2700 F.
Nominal voltage ranging from 2.3 – 300 V.
Rated current ranging from 3 – 600 A.
Power ranges 5 – 100 kW.
Cycle life greater than 100000 charge/discharge cycles
Operating temperature ranging -20 oC to 55 oC.
Modular and stackable.
The above shown set of characteristics makes of the super-capacitors a good
option to be used in power quality applications. In ride-through applications, super-
capacitors are capable of a quick discharge, due its extremely low ESR’s, hence suitable
for transient compensation of voltage sags and short voltage interruptions.
4.3. Proposed ride through topology using supercapacitors
The proposed compensator scheme using Supercapacitors is shown in figure 20.
It is constituted by a supercapacitor and an isolated boost converter. The operation of the
sag compensator scheme is enabled when the magnitude of the voltage sag is bigger than

48
the threshold value set in the control block of the compensator, normally 10% sag, or
when there is a short term voltage interruption. Under this condition the voltage
provided by the super-capacitor is then boosted by the dc-dc converter to the dc link
voltage level of the ASD system. A block diagram of the control circuit is shown on
Figure 21. The time that the module can compensate the voltage disruption depends on
the amount of energy stored in the super capacitor and the load being supplied by the
ASD. From chapter II the amount of energy stored in the super capacitor is given by the
following equation
221 CVE = (13)
Where C is the capacitance of the super-capacitor and V is the capacitor terminal
voltage. The time that the super capacitor can provide compensation can be calculated
using equation (14) which can be derived from equation (13).
2)(21
fo VVWCt −= (14)
Where t is the total time that the module can compensate, C is the super-capacitor
capacitance, Vo and Vf are the initial and final terminal voltage of the capacitor, and W
is the required load to be compensated. For example using a 130F capacitor charged at
50 V and considering that the capacitor is discharged when its terminal voltage is 70% of
the nominal voltage. Assuming that a momentary voltage interruption on the supply
voltage of an ASD is feeding a 20kW load, the total time that the module can
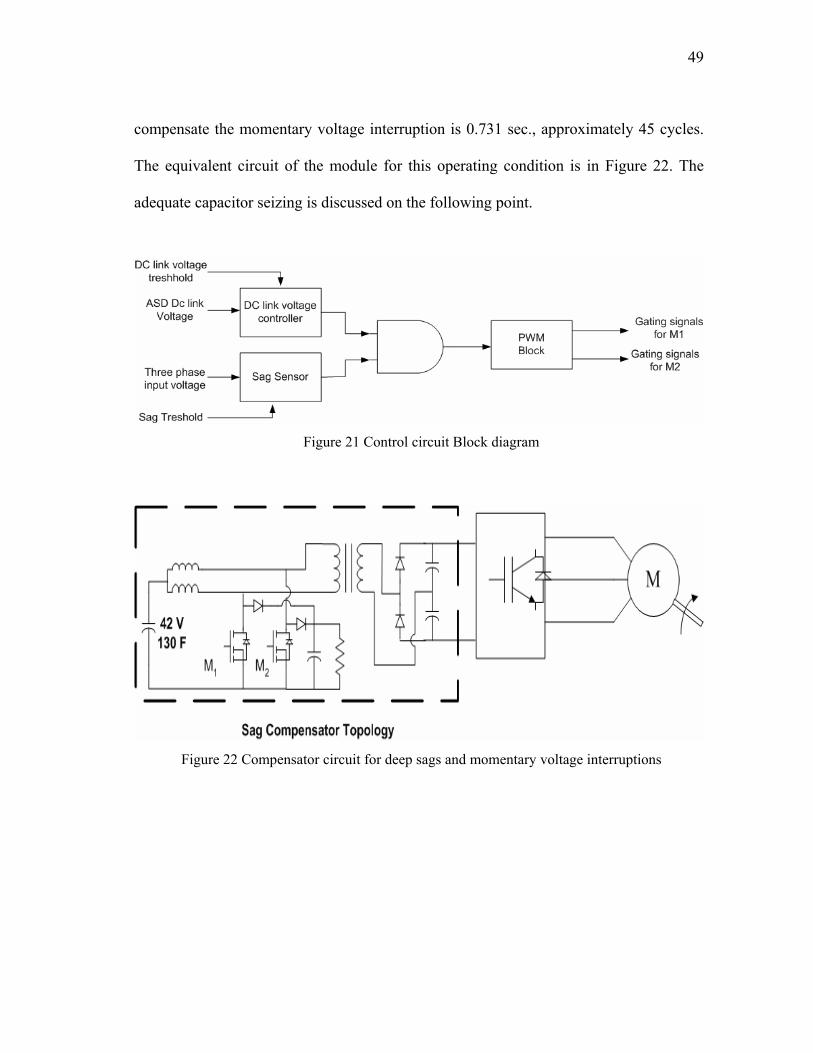
49
compensate the momentary voltage interruption is 0.731 sec., approximately 45 cycles.
The equivalent circuit of the module for this operating condition is in Figure 22. The
adequate capacitor seizing is discussed on the following point.
Figure 21 Control circuit Block diagram
Figure 22 Compensator circuit for deep sags and momentary voltage interruptions
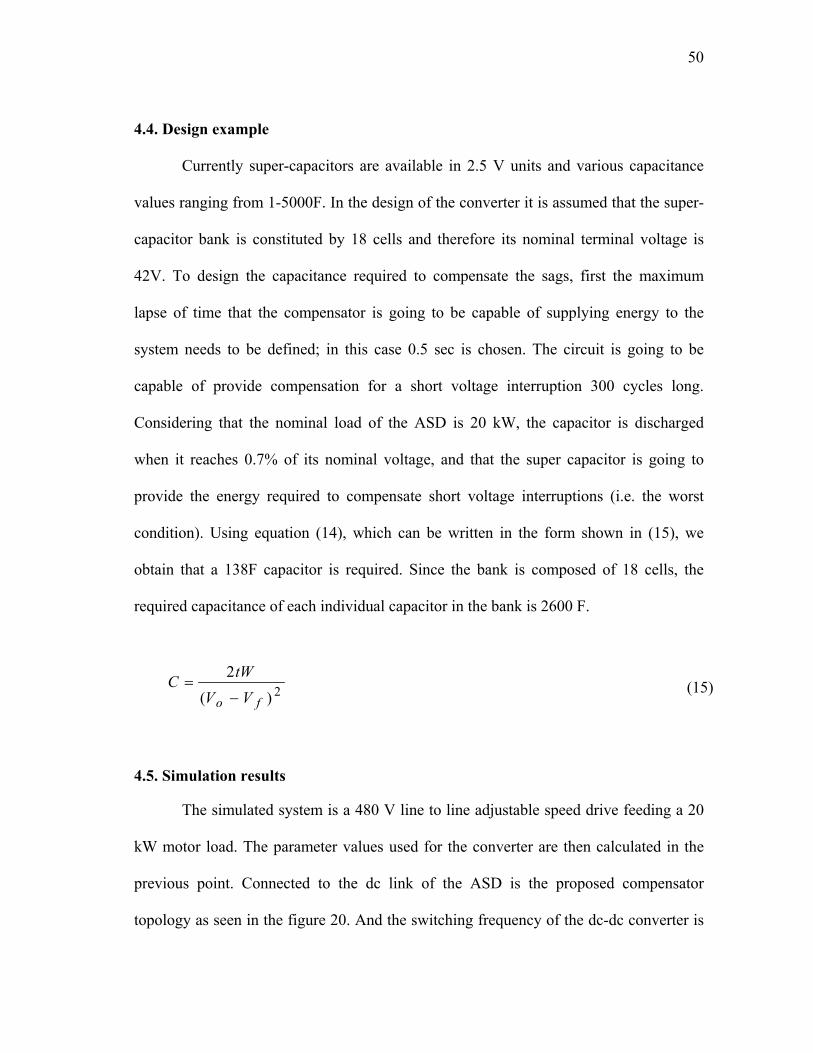
50
4.4. Design example
Currently super-capacitors are available in 2.5 V units and various capacitance
values ranging from 1-5000F. In the design of the converter it is assumed that the super-
capacitor bank is constituted by 18 cells and therefore its nominal terminal voltage is
42V. To design the capacitance required to compensate the sags, first the maximum
lapse of time that the compensator is going to be capable of supplying energy to the
system needs to be defined; in this case 0.5 sec is chosen. The circuit is going to be
capable of provide compensation for a short voltage interruption 300 cycles long.
Considering that the nominal load of the ASD is 20 kW, the capacitor is discharged
when it reaches 0.7% of its nominal voltage, and that the super capacitor is going to
provide the energy required to compensate short voltage interruptions (i.e. the worst
condition). Using equation (14), which can be written in the form shown in (15), we
obtain that a 138F capacitor is required. Since the bank is composed of 18 cells, the
required capacitance of each individual capacitor in the bank is 2600 F.
2)(2
fo VVtWC
−= (15)
4.5. Simulation results
The simulated system is a 480 V line to line adjustable speed drive feeding a 20
kW motor load. The parameter values used for the converter are then calculated in the
previous point. Connected to the dc link of the ASD is the proposed compensator
topology as seen in the figure 20. And the switching frequency of the dc-dc converter is

51
100 kHz. The first simulated condition corresponds to the ASD system feeding the
motor load subjected to a 48% single phase voltage sag. This can be seen in figure 23.
The DC link voltage drops more than 50 V during the duration of the voltage sag.
Figure 23 dc link voltage during a 48 % voltage sag without compensation
Figure 24 shows the dc link voltage when the ASD system is subjected to the
same conditions and the compensator module is working. The voltage is maintained
constant during the transient as seen below.
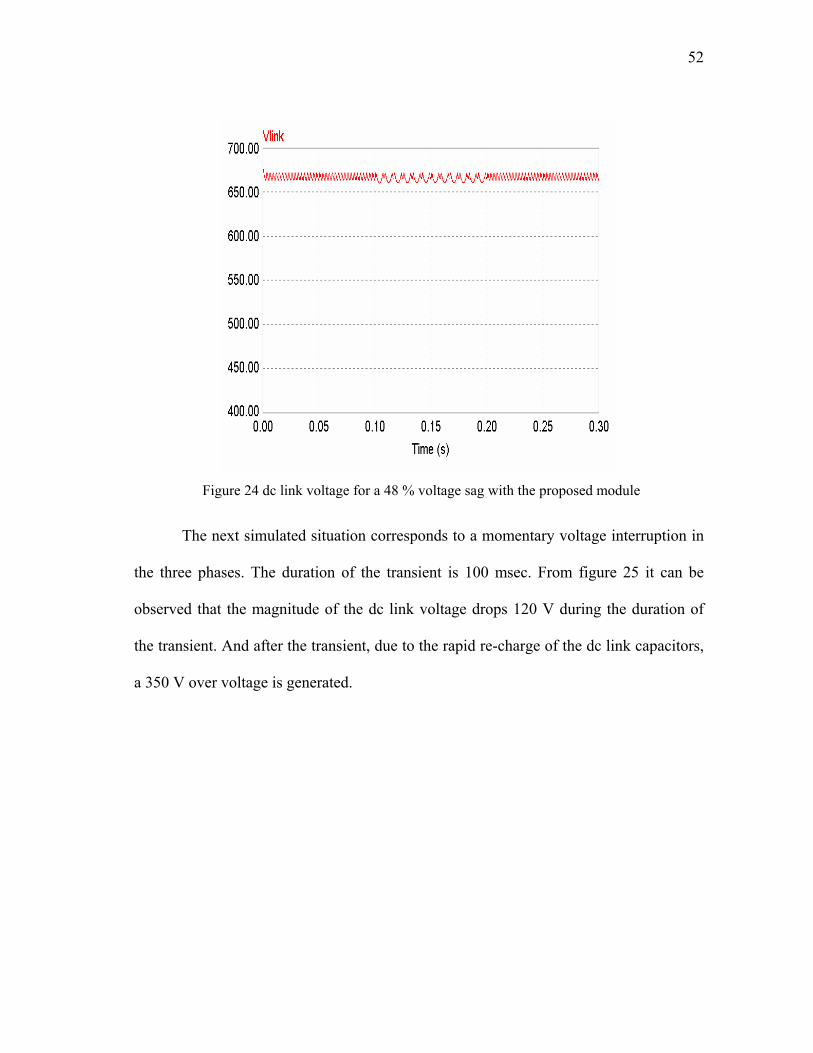
52
Figure 24 dc link voltage for a 48 % voltage sag with the proposed module
The next simulated situation corresponds to a momentary voltage interruption in
the three phases. The duration of the transient is 100 msec. From figure 25 it can be
observed that the magnitude of the dc link voltage drops 120 V during the duration of
the transient. And after the transient, due to the rapid re-charge of the dc link capacitors,
a 350 V over voltage is generated.

53
Figure 25 dc link voltage for a momentary voltage interruption without the compensating
module
The result for the same condition using the proposed compensator module is
shown in figure 26 below. The dc link voltage is kept constant during the transient,
avoiding the voltage drop during the interruption and the over voltage generated after the
transient ended.
Figure 26 dc link voltage for a 100ms voltage interruption with the module
54
4.6. Experimental results
The proposed compensator topology was implemented in an experimental
prototype, and subjected to single phase and three phase voltage sags, where the voltage
drops ranged from 70% to 40%. The response of the compensator is shown in the
following figures.
Figure 27 shows the line to line input voltages of the ASD system and the dc link
voltage when the system is subjected to a 0.5 sec 3 phase 40% sag, and the compensator
system is not connected. As it can be observed in this figure the dc link voltage drops
from 130V to 70V during the duration of the sag. The result when the compensator is
connected is shown in figure 28. In this case the converter is capable of supplying the
energy required to maintain the dc link voltage constant during the duration of the sag.
The current supplied by the converter during the sag is shown in figure 29 (5A/div). The
transient response of the supercapacitor is fast enough to supply the current required by
the ASD during the sag as seen in the figure 29.

55
Figure 27 dc link voltage during a 3 phase 50% sag without the converter
Figure 28 dc link voltage during a 3 phase 50% voltage sag with the converter

56
Figure 29 Current supplied by the supercapacitor during the duration of the voltage sag
Figures 30 to 32 show the results for the system subjected to a 0.5 sec three phase
short term voltage interruption. In figure 30 the dc link voltage descends to almost 0
volts during the voltage interruption. When the compensator converter is connected the
dc link voltage is kept constant by the energy supplied by the supercapacitor as seen in
figure 31. Figure 32 shows the current supplied by the supercapacitor during the
compensation time (5A/div).
Figure 30 dc link voltage for a 0.5 sec 3 phase voltage interruption without the compensator
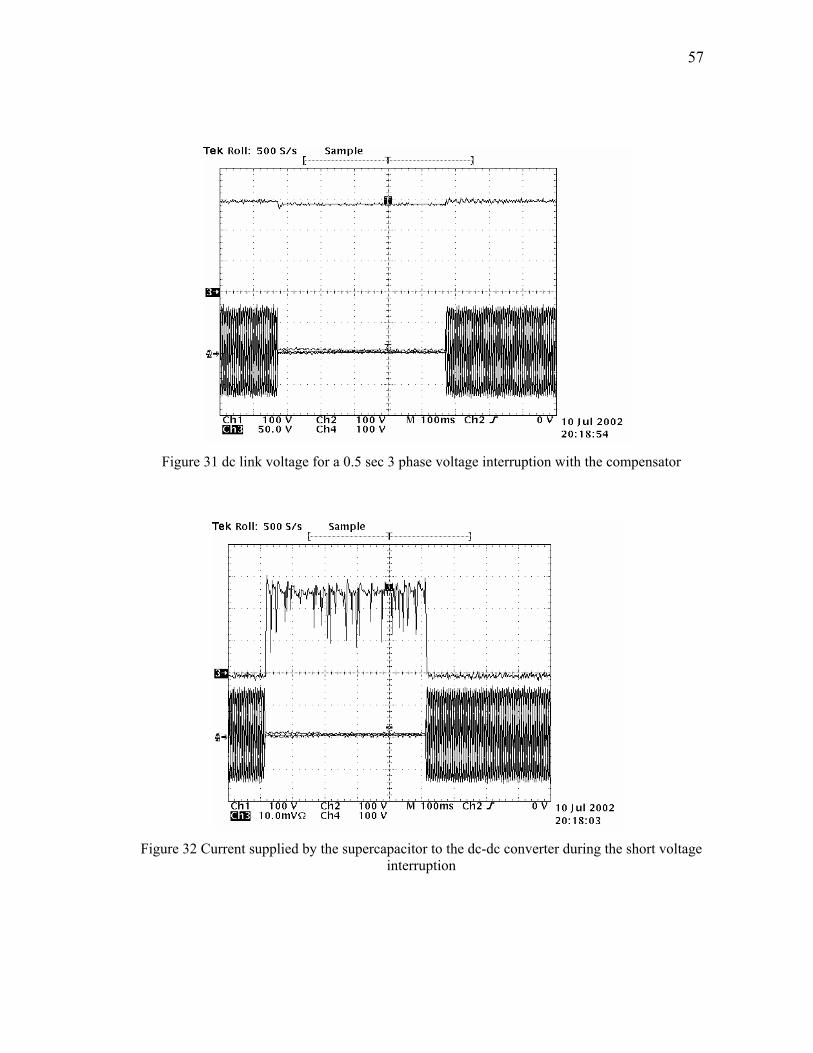
57
Figure 31 dc link voltage for a 0.5 sec 3 phase voltage interruption with the compensator
Figure 32 Current supplied by the supercapacitor to the dc-dc converter during the short voltage
interruption

58
4.7. Conclusions
In this chapter the advantages between the use of Supercapacitors and traditional
lead-acid batteries to provide ride through were presented and discussed. From this
discussion it is clear that Super-capacitors, due to high power density and low ESR, are a
very convenient energy storage component to be used in power quality applications. A
sag compensator topology using supercapacitors is developed and tested in this chapter.
This compensator topology is capable of providing ride through for deep voltage
sags as well as short voltage interruptions. All this, while maintaining the dc link voltage
level constant during the duration of the transient disturbance. The available
compensation time of the compensator depends on the amount of energy stored in the
supercapacitor and the current being drawn by the load. Therefore is important to
calculate the roper capacitor size depending on these parameters. For this reason a
simple design procedure for the capacitor size is presented. The effectiveness of the
proposed ride through topology is shown by means of simulations and experimental
results obtained on a laboratory prototype. From these results is clear that the
supercapacitor dynamic response is fast enough to respond to the load transient
requirements and avoid the effects of the voltage sags on the adjustable speed drive.

59
CHAPTER V
USE OF SUPERCAPACITORS TO EXTEND BATTERY RUN-TIME
IN MOBILE DEVICES
5.1. Introduction
Battery run-time in a mobile device defines the span of time that the device can
run from the energy stored in its batteries. In an ideal world, mobile PCs would run all
day, allowing them to cut the AC power cord, thus freeing the user to access information
wherever they choose without scrambling for electrical outlets. An increase in the run-
time can be obtained by having multiple batteries or increasing their rated capacity; with
the obvious draw back of increasing the size, weight and maintenance costs of the
system. A typical laptop battery is composed by Li-Ion cells with a rated capacity of 4
Ah. Although considerable advances in the Li-Ion battery technology are not keeping up
with emerging notebook usage models including digital entertainment, multimedia and
wireless connectivity. The expanded usage demands higher power and currents with
higher slew rate. The utilization of Supercapacitors to increase the run-time is examined
in detail in this paper. Supercapacitors with low equivalent series resistance (ESR) are an
emerging technology [6, 16, and 17]. These types of capacitors do not possess the energy
density of a conventional battery, however, their power density is several times higher
(Table 4) than that of the conventional battery. These features make Supercapacitors a
good candidate for improving the performance of battery based applications, where the
60
battery supplies the energy and the Supercapacitor delivers short-term power. Benefits of
this combination include: Enhanced peak power performance, run-time extension, and
reduction in internal losses.
Present day Supercapacitors are available with capacitance values ranging from
1F to 5000F, power densities of 4300 W/kg and maximum energy storage of 8125 J [13-
15]. Supercapacitor ESR values range from 0.3 mΩ to 130mΩ, five times smaller than a
conventional battery ESR. Therefore combining batteries and Supercapacitors is
definitely advantageous in supplying pulsating loads. In this paper three approaches for
combining the battery and Supercapacitors are proposed. In the first approach, a direct
connection of the Supercapacitors to the battery terminals is explored (Figure. 38). This
requires the voltage rating of the Supercapacitors to match the battery, thus several
supercapacitor cells connected in series are needed. In the second approach, an inductor
connected in series with the battery and a supercapacitor in parallel are used to improve
the current distribution between capacitor and the battery (Figure. 36). The third
approach uses a DC-DC converter along with Supercapacitors to interface with the
battery (Figure. 37). This scheme has the advantage of utilizing lower voltage
Supercapacitors which are interfaced to standard battery packs by a dc-dc converter. The
performance of these schemes are evaluated and discussed in this paper for a battery
powered mobile device.
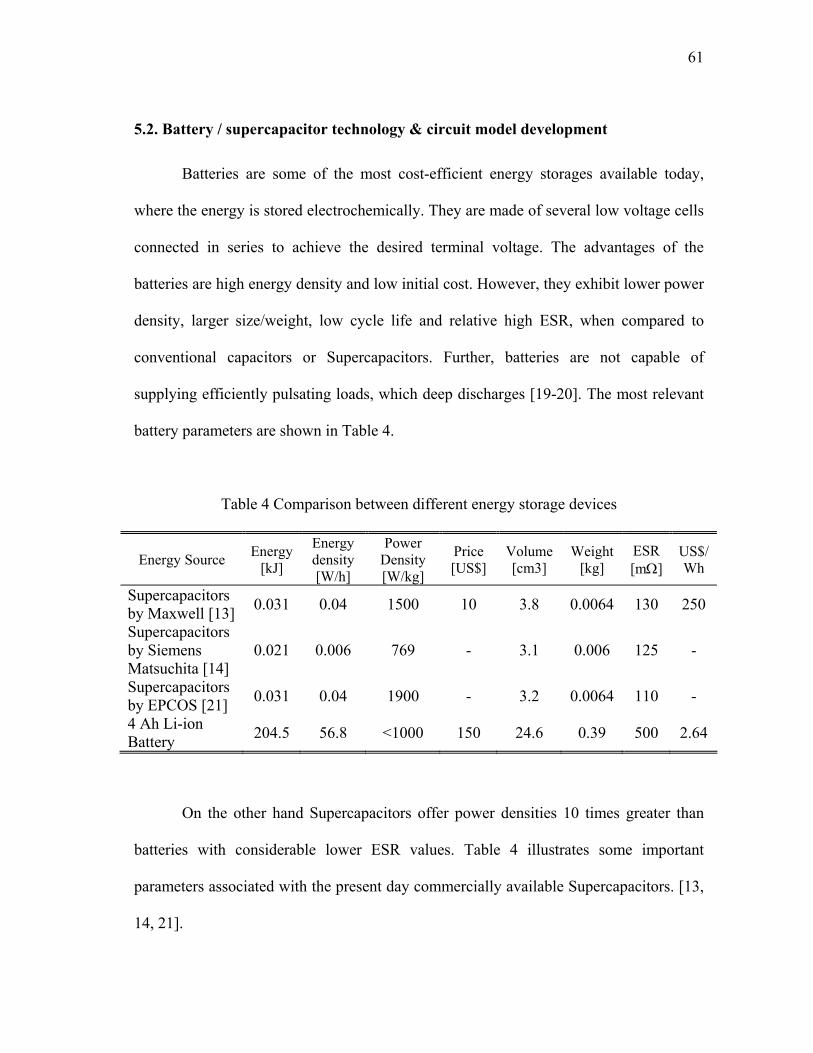
61
5.2. Battery / supercapacitor technology & circuit model development
Batteries are some of the most cost-efficient energy storages available today,
where the energy is stored electrochemically. They are made of several low voltage cells
connected in series to achieve the desired terminal voltage. The advantages of the
batteries are high energy density and low initial cost. However, they exhibit lower power
density, larger size/weight, low cycle life and relative high ESR, when compared to
conventional capacitors or Supercapacitors. Further, batteries are not capable of
supplying efficiently pulsating loads, which deep discharges [19-20]. The most relevant
battery parameters are shown in Table 4.
Table 4 Comparison between different energy storage devices
Energy Source Energy [kJ]
Energy density [W/h]
Power Density [W/kg]
Price [US$]
Volume [cm3]
Weight [kg]
ESR [mΩ]
US$/Wh
Supercapacitors by Maxwell [13] 0.031 0.04 1500 10 3.8 0.0064 130 250
Supercapacitors by Siemens Matsuchita [14]
0.021 0.006 769 - 3.1 0.006 125 -
Supercapacitors by EPCOS [21] 0.031 0.04 1900 - 3.2 0.0064 110 -
4 Ah Li-ion Battery 204.5 56.8 <1000 150 24.6 0.39 500 2.64
On the other hand Supercapacitors offer power densities 10 times greater than
batteries with considerable lower ESR values. Table 4 illustrates some important
parameters associated with the present day commercially available Supercapacitors. [13,
14, 21].

62
5.2.1. Equivalent circuit of the battery-supercapacitor combination
Figure 33 shows a simplified equivalent circuit model of a supercapacitor
connected in parallel with a battery. Where Vb is the open circuit voltage and Rb is the
equivalent resistance. The supercapacitor model is assumed to be an ideal capacitor in
series with its equivalent series resistance Rc. These parameters can be obtained from the
manufacturer data sheets or via experimental measurements. The Thevenin equivalent
circuit of the battery and the capacitor combination in parallel is given by equations (16)
and (17) and is shown in Figure 33.
Figure 33 Equivalent circuit of the battery supercapacitor combination
CsRR
CR
sRRsZ
CB
bCB
TH 1)()(
++
+=
(16)
1)2()(1)(
1
)( 222
22
++++
++
++
+=
CsRRsCRRRCsRsCRRV
CsRR
CsR
VsVCBCCB
BCBC
CB
CBTH (17)
The above equivalent circuit model can be considered to be accurate for 0-1kHz
range [17]. From (16) it can be seen that the equivalent impedance of the system is
reduced, allowing it to supply higher currents with less voltage ripple.

63
Figure 34 System currents
Figure 34 shows the waveforms for the current supplied by the
battery/supercapacitor for a pulsating load of magnitude Io and frequency f. It is clear
from Figure 34 that the battery peak current is reduced due to the presence of the
supercapacitor in parallel (whit lower ESR). From Figure 33 we have
oththo iZVV *−= (18)
Where io is given by ,
∑= )sin(4 tnn
Ii oo ϖπ (19)
Also,
b
obb R
VVi −= (20)
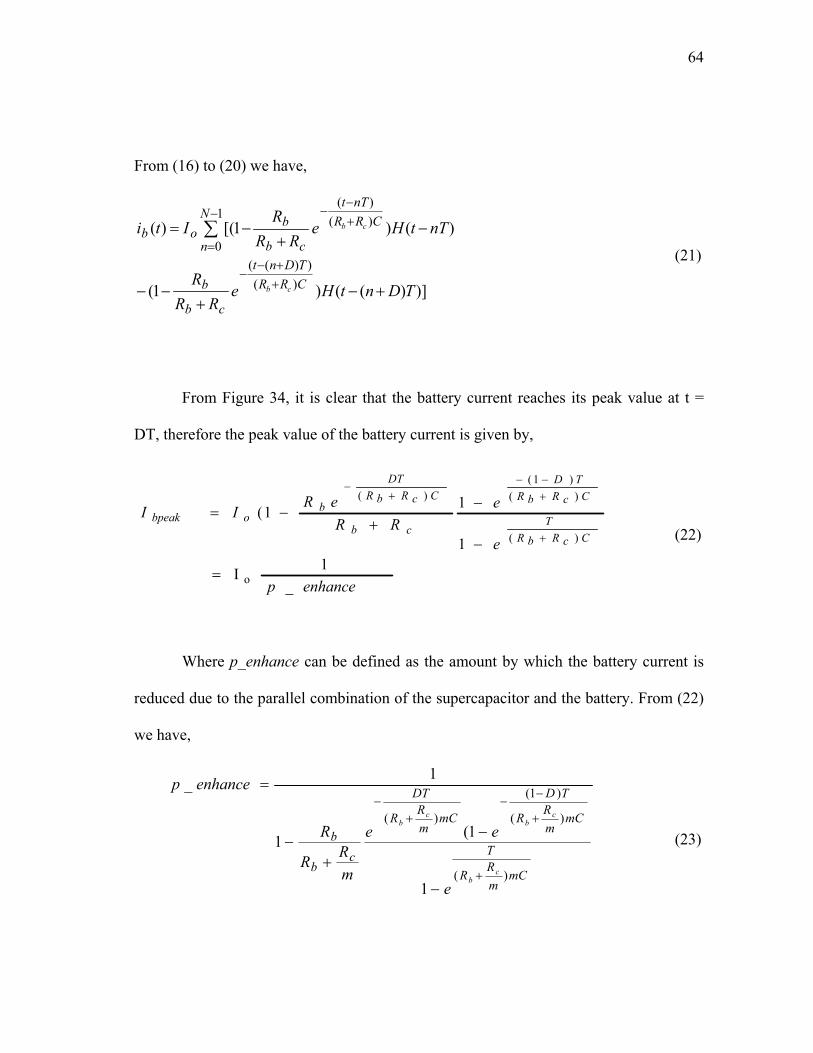
64
From (16) to (20) we have,
)])(()1(
)()1[()(
)())((
1
0
)()(
TDntHeRR
R
nTtHeRR
RIti
CRRTDnt
cb
b
N
n
CRRnTt
cb
bob
cb
cb
+−+
−−
−+
−=
++−
−
−
=
+−
−
∑
(21)
From Figure 34, it is clear that the battery current reaches its peak value at t =
DT, therefore the peak value of the battery current is given by,
enhancep
e
eRR
eRII
CcRbRT
CcRbRTD
cb
CcRbRDT
bobpeak
_1I
1
11(
o
)(
)()1(
)(
=
−
−+
−=
+
+−−
+−
(22)
Where p_enhance can be defined as the amount by which the battery current is
reduced due to the parallel combination of the supercapacitor and the battery. From (22)
we have,
mCmRR
T
mCmRR
TD
mCmRR
DT
cb
b
cb
cb
cb
e
ee
mRR
R
enhancep
)(
)(
)1(
)(
1
1(1
1_
+
+
−−
+−
−
−
+−
=
(23)

65
From Figure 33 the internal losses due to the hybrid connection of the battery &
supercapacitor (PLoss-bc) is given by,
2,
2,, rmsccrmsbbbcLoss IRIRP += (24)
Where Ib and Ic are the rms values of the battery and supercapacitor respectively
(Figure 34). Further, the losses in the battery when the supercapacitors are not connected
in parallel can be calculated by,
DIRP obbLoss =− (25)
It is clear from Figure. 34 and (23),(24) that there is a reduction in the loses
within the battery due to the usage of supercapacitors. The reduction in power loss ∆P is
bcLossbLoss PPP ,, −=∆ (26)
And the normalized power loss can be calculated by,
bLossn P
PP,
∆=∆ (27)
The net reduction in the loses in the battery can now be assumed to be available
to the load and the resulting run-time extension can be calculated as,
oPPt ∆
=∆ (28)
Where Po is the output power supplied to the load as is given by,
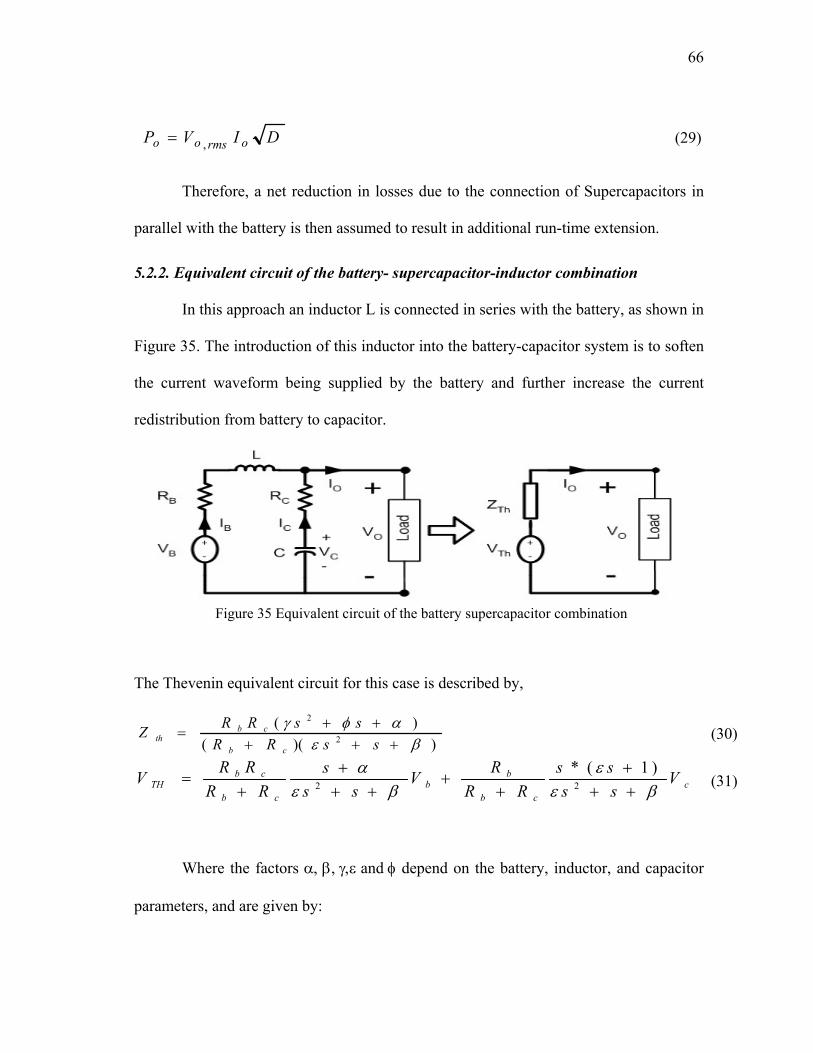
66
DIVP ormsoo ,= (29)
Therefore, a net reduction in losses due to the connection of Supercapacitors in
parallel with the battery is then assumed to result in additional run-time extension.
5.2.2. Equivalent circuit of the battery- supercapacitor-inductor combination
In this approach an inductor L is connected in series with the battery, as shown in
Figure 35. The introduction of this inductor into the battery-capacitor system is to soften
the current waveform being supplied by the battery and further increase the current
redistribution from battery to capacitor.
Figure 35 Equivalent circuit of the battery supercapacitor combination
The Thevenin equivalent circuit for this case is described by,
))(()(
2
2
βεαφγ+++
++=
ssRRssRRZ
cb
cbth (30)
ccb
bb
cb
cbTH V
ssss
RRRV
sss
RRRRV
βεε
βεα
+++
++
+++
+= 22
)1(*(31)
Where the factors α, β, γ,ε and φ depend on the battery, inductor, and capacitor
parameters, and are given by:

67
CRR
CR
cb
c
)(1
1
+=
=
β
α
cb
b
RRL
RcRbL
RL
++=
+=
=
1φ
ε
γ
(32)
Using the same approach detailed in 5.2.1, we have that the peak power
enhancement can be calculated using the equivalent circuit of Figure 35 and its Thevenin
representation. This factor can be calculated by (33). From this equation, and as in the
previous case, the peak current supplied by the battery is reduced. This has the effect of
reducing the internal loses in the battery. Loses in the system can be calculated by (26)
and similarly as in the previous condition the normalized power saving is given by (27).
The run-time extension produced by the internal loss reduction can again be calculated
based on the power saved using equations (28) and (29).
)414
)1)(241(
414)1)(412(
))2
41cosh(
41
)2
41sinh(((
1_
2)411(
241
2
εβεγφεεβγ
εβεγεβγφε
αε
εβ
εβε
εβ
βα
εεβ
εεβ
ε
−−+−−+
−−−−+
+
+−
−
−
−
−+
=
−+−
−−
−
DT
DT
DT
cb
c
e
e
DT
DTe
RRR
enhp
(33)
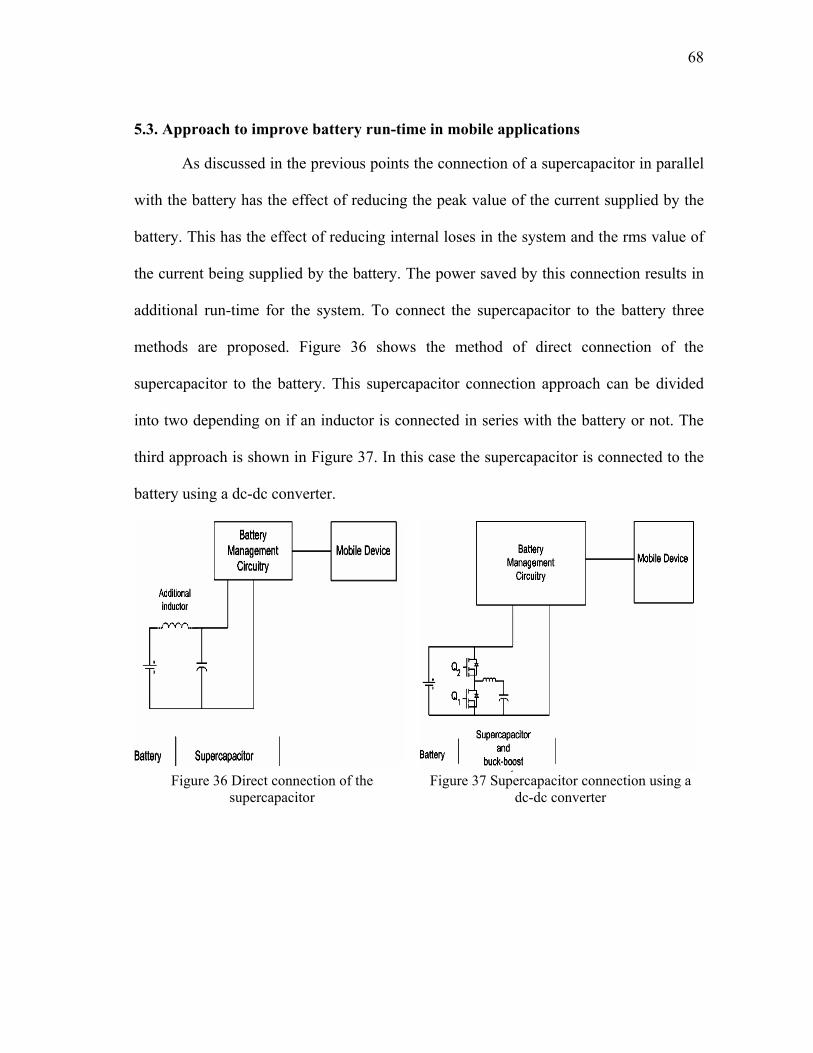
68
5.3. Approach to improve battery run-time in mobile applications
As discussed in the previous points the connection of a supercapacitor in parallel
with the battery has the effect of reducing the peak value of the current supplied by the
battery. This has the effect of reducing internal loses in the system and the rms value of
the current being supplied by the battery. The power saved by this connection results in
additional run-time for the system. To connect the supercapacitor to the battery three
methods are proposed. Figure 36 shows the method of direct connection of the
supercapacitor to the battery. This supercapacitor connection approach can be divided
into two depending on if an inductor is connected in series with the battery or not. The
third approach is shown in Figure 37. In this case the supercapacitor is connected to the
battery using a dc-dc converter.
Figure 36 Direct connection of the
supercapacitor Figure 37 Supercapacitor connection using a
dc-dc converter

69
5.3.1 Direct battery supercapacitor connection
This approach requires the supercapacitor voltage to match the battery voltage.
Since the nominal voltage of the supercapacitor cells available today is 2.5 V several
capacitors connected in series are needed. For example to connect to a typical notebook
battery which has a voltage of 14.2 V it is necessary to connect 6 supercapacitors in
series (Figure 38), thus increasing the ESR and cost of the equivalent capacitor.
Figure 38 Direct capacitor connection
To analyze the performance of this connection the equations derived in the
previous point along with the battery and supercapacitor parameters of Table 4 are used.
To match the battery voltage six capacitors are connected in series to form an equivalent
supercapacitor of 3F. Figure 39 shows the relative power enhancement as function of
frequency and duty cycle. From this figure it can be observed that for pulses of short
duration the enhancement in the power delivering capability is higher, and that for
frequencies above 2 Hz the power enhancement is independent of the frequency and

70
depends only on the duty cycle of the pulsating load. This because for high frequency
operation the voltage drop due to the discharge of the capacitor is negligible.
Figure 39 Variation of p_enhance (y-axis) of battery supercapacitor hybrid as a function of
frequency f and duty cycle D
Figures 40a and 40b show the relative power loss reduction in the battery-
supercapacitor system calculated from the equations derived in 5.2.1 and using the
parameters given in Table 4. From Figure 40a it can be observed that the loss reduction
also depends on the duty cycle D of the load. Also the number of capacitor branches
connected in parallel with the battery has an effect in the internal loss reduction. The
effect of adding multiple capacitor branches in parallel contributes to a reduction in the
equivalent ESR and simultaneous reduction in losses. However, adding more than 3
capacitor branches does not seem to yield much loss reduction.

71
a
b
Figure 40 Relative System loss reduction in the battery-supercapacitor connection
Further from Figure. 40b it can be deduced that reduction in Ploss-bc is negligible
at very low frequencies and it is almost constant for frequencies above 1 Hz. Based on
the internal loss reduction and equations (26) and (27) it is possible to compute the
number of capacitor branches needed for a specified run-time extension (∆t). The
number of branches M is given by,
:= M −dt Rc
Rb ( ) − + − + dt dt dl D dt dl D( )/3 2
dl D dl D( )/3 2
(34)
Figure 41 shows the number of capacitor branches in parallel needed for different
run-time extensions. From this figure it can be seen that from the internal loses reduction
point of view a maximum run-time extension of 6.2 % is possible. Additional run-time
extension is possible due to the reduction in the battery rms current value. This extra
time gained depends of the battery chemical characteristics and can be determined from
it discharge characteristics. A typical battery discharge characteristic is shown in Figure
1 branch
2 branches
3 branches
0.0256 Hz
2.56 Hz
25.6 Hz
0.00256 Hz

72
42. As can be seen from this figure reducing the rms current supplied by the battery from
its nominal value to 0.9 times its nominal value has a considerable effect in run-time.
Figure 41 Number of capacitors required as function of relative run-time extension
Figure 42 Run-time extension vs. frequency and number of capacitors
D=10%
D=20%
D=30%
D=40%
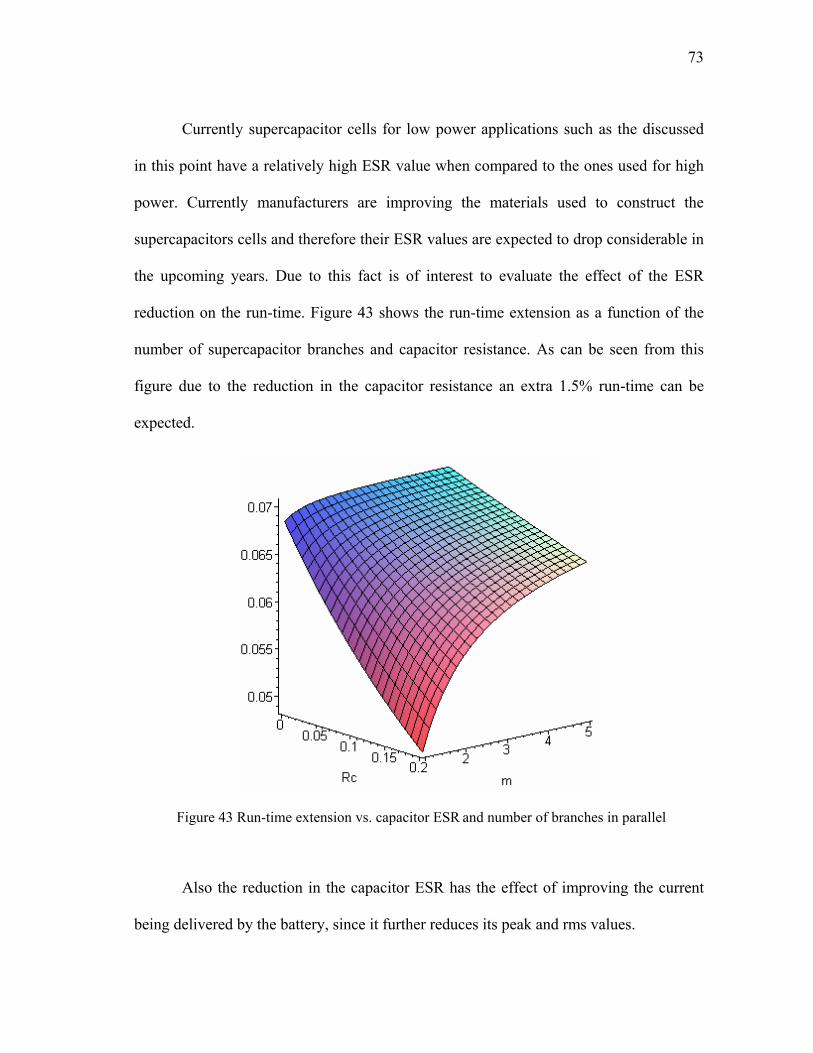
73
Currently supercapacitor cells for low power applications such as the discussed
in this point have a relatively high ESR value when compared to the ones used for high
power. Currently manufacturers are improving the materials used to construct the
supercapacitors cells and therefore their ESR values are expected to drop considerable in
the upcoming years. Due to this fact is of interest to evaluate the effect of the ESR
reduction on the run-time. Figure 43 shows the run-time extension as a function of the
number of supercapacitor branches and capacitor resistance. As can be seen from this
figure due to the reduction in the capacitor resistance an extra 1.5% run-time can be
expected.
Figure 43 Run-time extension vs. capacitor ESR and number of branches in parallel
Also the reduction in the capacitor ESR has the effect of improving the current
being delivered by the battery, since it further reduces its peak and rms values.
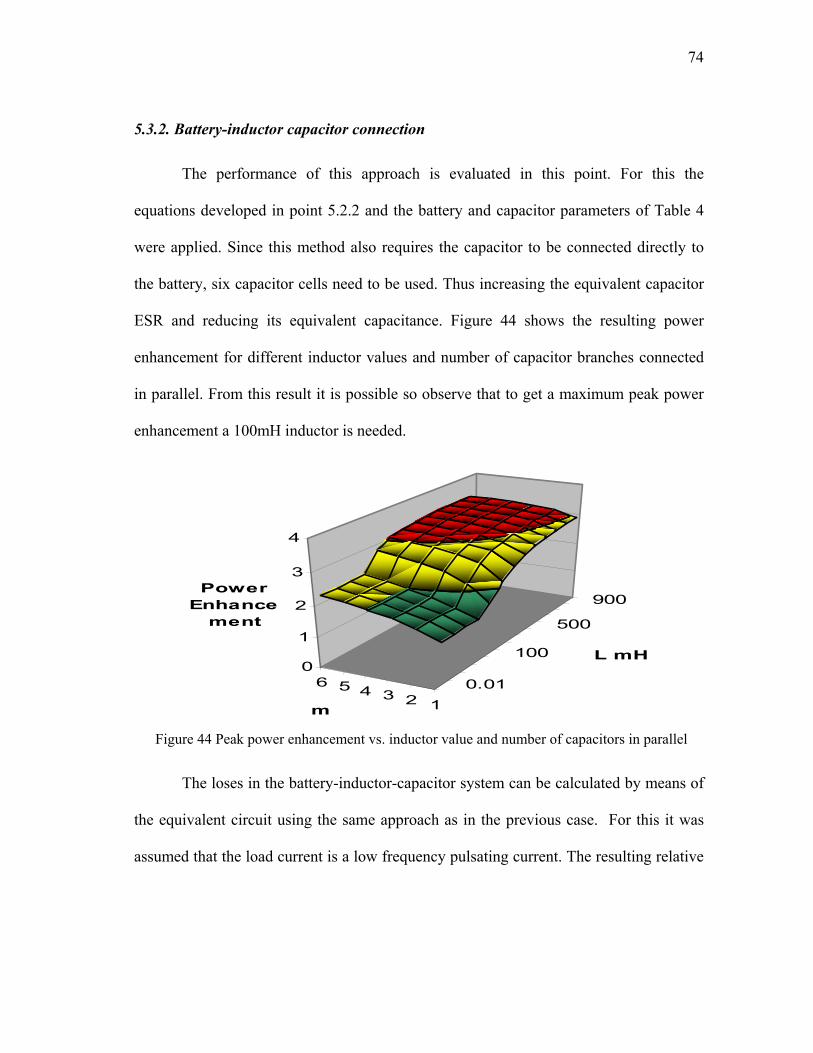
74
5.3.2. Battery-inductor capacitor connection
The performance of this approach is evaluated in this point. For this the
equations developed in point 5.2.2 and the battery and capacitor parameters of Table 4
were applied. Since this method also requires the capacitor to be connected directly to
the battery, six capacitor cells need to be used. Thus increasing the equivalent capacitor
ESR and reducing its equivalent capacitance. Figure 44 shows the resulting power
enhancement for different inductor values and number of capacitor branches connected
in parallel. From this result it is possible so observe that to get a maximum peak power
enhancement a 100mH inductor is needed.
0.01
100
500
900
1234560
1
2
3
4
Power Enhance
ment
L mH
m
Figure 44 Peak power enhancement vs. inductor value and number of capacitors in parallel
The loses in the battery-inductor-capacitor system can be calculated by means of
the equivalent circuit using the same approach as in the previous case. For this it was
assumed that the load current is a low frequency pulsating current. The resulting relative

75
power loss using a 100mH inductor for different frequencies and duty cycles is shown in
figure 45.
15
1020
3040
5060
7080
900.0256
2.56
00.10.20.30.40.50.60.70.80.9
frequency [Hz]
Duty Cycle [%]
Power loss enhancement
System Losses
Figure 45 Battery-inductor-capacitor losses
It is possible to see that by adding the inductor and capacitor to the system the
losses can be reduced. The loss reduction fluctuates in a range 1-8% depending on the
duty cycle of the pulsating current. From the figure is important to note that the highest
power loss reduction is achieved for a 30% duty cycle. The extra energy gained by the
reduction in the internal loses derives into additional run-time.

76
0.02
56 2.56 25
6
2
4
6
810
00.10.20.30.40.50.60.7
Relative run tume
extension
FrequencyNumber of branches
Figure 46 Relative time extension vs. frequency and number of capacitors for a 100mH inductor
Figure 46 shows the run-time extension achieved by the connection of a 100 mH
inductor with a pulsating load current with a 30% duty cycle and different number of
capacitors in parallel. This figure was obtained calculating loses in the battery
supercapacitor system and comparing them with the loses when only a battery is used.
From this figure it is possible to see that the maximum run-time extension that can be
achieved from system loses point of view is 6.5%.
5.3.3. Use of dc-dc converter
The third supercapacitor connection approach is shown in Figure 37. In this case
a supercapacitor bank of lower voltage than the battery nominal voltage is connected via
a buck-boost converter. The operation of this topology can be braked down in two
stages. The first one is during the charge mode, when switch Q2 is on. This operation
stage can be divided in to two sub states depending on if the load is taking current or not.
If the load is not taking current the super capacitor is charged by the battery. In the
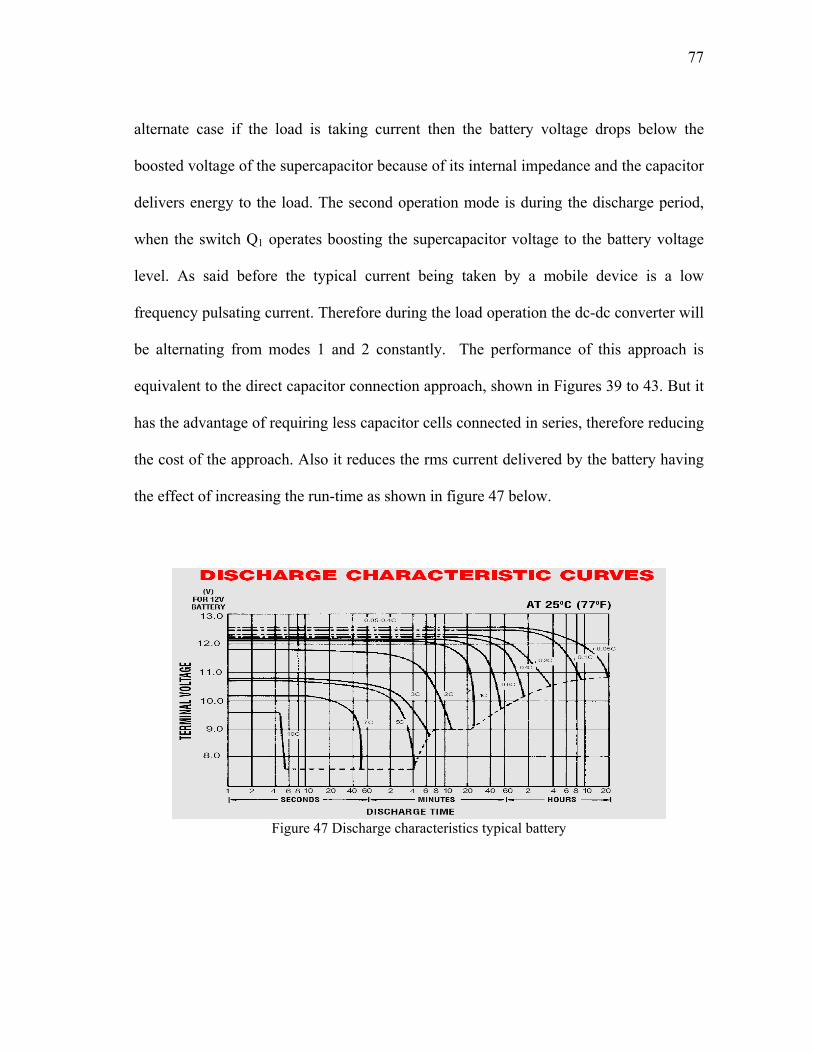
77
alternate case if the load is taking current then the battery voltage drops below the
boosted voltage of the supercapacitor because of its internal impedance and the capacitor
delivers energy to the load. The second operation mode is during the discharge period,
when the switch Q1 operates boosting the supercapacitor voltage to the battery voltage
level. As said before the typical current being taken by a mobile device is a low
frequency pulsating current. Therefore during the load operation the dc-dc converter will
be alternating from modes 1 and 2 constantly. The performance of this approach is
equivalent to the direct capacitor connection approach, shown in Figures 39 to 43. But it
has the advantage of requiring less capacitor cells connected in series, therefore reducing
the cost of the approach. Also it reduces the rms current delivered by the battery having
the effect of increasing the run-time as shown in figure 47 below.
Figure 47 Discharge characteristics typical battery
78
5.4. Simulation results
A battery powered mobile device was simulated using the equivalent circuits
discussed above. The system consists of a 14.2 V battery having an internal resistance of
500 mΩ and a super capacitor bank consisting of an equivalent 3.3 F supercapacitor with
an ESR of 390 mΩ. The load connected to the system is drawing 2.4 A peak at 1Hz and
40% duty cycle. The system temperature was assumed to be constant at 25oC. The
simulation result can be observed in the next figure. From figure 48 the RMS current
being supplied by the battery without the supercapacitor connected to its terminals is 1.5
A and has a peak value of 2.4 A. In the case of the battery and supercapacitor
combination the RMS current supplied by the battery is 1.2 A and its peak value is 1.6
A. That means a reduction of a 24% in the RMS current delivered by the battery. This
current is much better from the battery point of view and will change the discharge curve
of the battery, were the curve that has to be used to predict the battery run-time is 0.76C
instead of 1C. In the case of the voltage ripple caused by the voltage drop in the ESR of
the battery, the connection of the supercapacitor across the battery terminals reduces this
drop by reducing the value of the peak current. This can be seen in figure 49.

79
Figure 48 Battery current with and without a supercapacitor connected to its
terminals
Figure 49 Voltage drop during conduction with and without a supercapacitor
connected to the battery terminals
Now for the case of the second proposed approach to extend the battery run-time,
the system was simulated using the same battery and supercapacitor bank than in the
previous situation, but a 15mH inductor has been connected in series with the battery. In
this case the resulting battery and supercapacitor currents are shown in figure 50. As can
be observed from this result the rms current supplied by the battery is 1.33 A and its
peak value is 1.8 A. Comparing these values with the battery current at stand alone
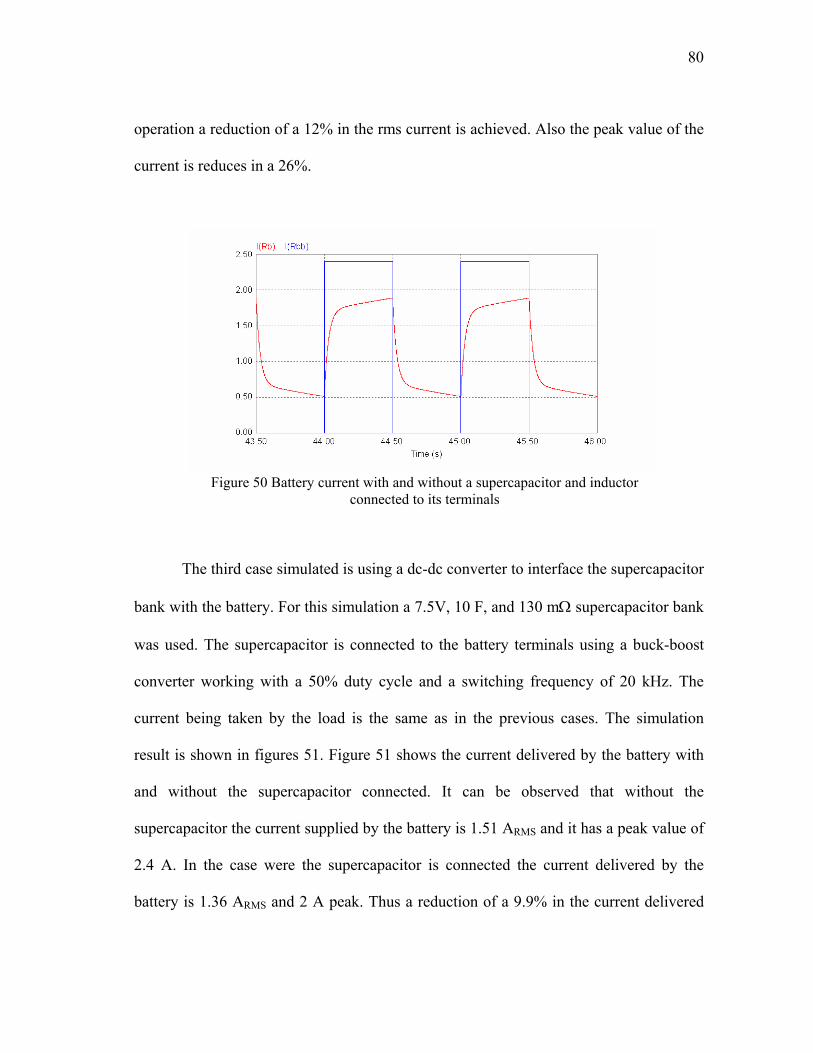
80
operation a reduction of a 12% in the rms current is achieved. Also the peak value of the
current is reduces in a 26%.
Figure 50 Battery current with and without a supercapacitor and inductor
connected to its terminals
The third case simulated is using a dc-dc converter to interface the supercapacitor
bank with the battery. For this simulation a 7.5V, 10 F, and 130 mΩ supercapacitor bank
was used. The supercapacitor is connected to the battery terminals using a buck-boost
converter working with a 50% duty cycle and a switching frequency of 20 kHz. The
current being taken by the load is the same as in the previous cases. The simulation
result is shown in figures 51. Figure 51 shows the current delivered by the battery with
and without the supercapacitor connected. It can be observed that without the
supercapacitor the current supplied by the battery is 1.51 ARMS and it has a peak value of
2.4 A. In the case were the supercapacitor is connected the current delivered by the
battery is 1.36 ARMS and 2 A peak. Thus a reduction of a 9.9% in the current delivered

81
by the battery is achieved. This has an important effect in the extension of the battery
run-time as can be seen in figure 47. In this case the battery discharge curve that has to
be used corresponds to 0.9C instead of 1C.
Figure 51 Battery current with and without a supercapacitor connected to its
terminals when using a dc-dc converter
5.5. Experimental results
To validate the results obtained by means of simulation experimental
measurements were taken in the laboratory. The first case under study is the normal
battery performance. In this case the discharge characteristics of a laptop battery
supplying energy to a typical mobile device current profile without and with a
supercapacitor connected in parallel is studied. From the first test a run-time of 231
minutes was obtained. The second test conducted is the addition of 2 and 4
supercapacitor branches in parallel with the battery. To match the battery voltage every
branch is composed by six 10 F 2.5 V supercapacitors connected in series. The
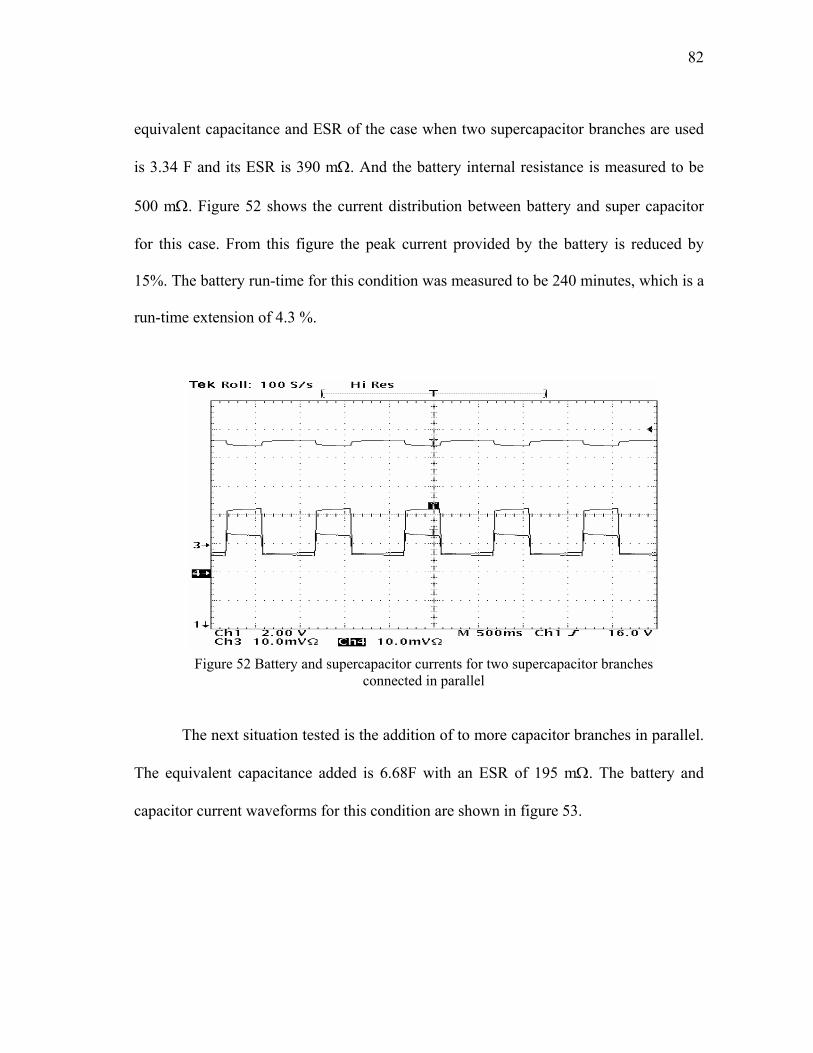
82
equivalent capacitance and ESR of the case when two supercapacitor branches are used
is 3.34 F and its ESR is 390 mΩ. And the battery internal resistance is measured to be
500 mΩ. Figure 52 shows the current distribution between battery and super capacitor
for this case. From this figure the peak current provided by the battery is reduced by
15%. The battery run-time for this condition was measured to be 240 minutes, which is a
run-time extension of 4.3 %.
Figure 52 Battery and supercapacitor currents for two supercapacitor branches connected in parallel
The next situation tested is the addition of to more capacitor branches in parallel.
The equivalent capacitance added is 6.68F with an ESR of 195 mΩ. The battery and
capacitor current waveforms for this condition are shown in figure 53.
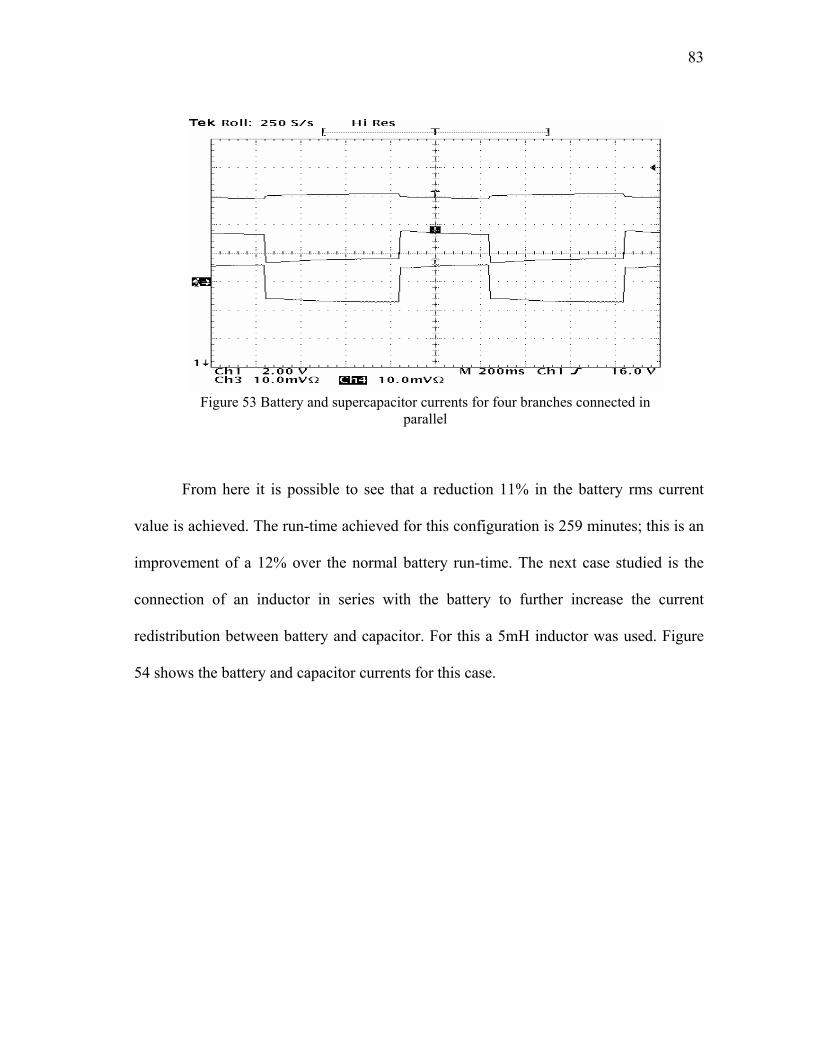
83
Figure 53 Battery and supercapacitor currents for four branches connected in parallel
From here it is possible to see that a reduction 11% in the battery rms current
value is achieved. The run-time achieved for this configuration is 259 minutes; this is an
improvement of a 12% over the normal battery run-time. The next case studied is the
connection of an inductor in series with the battery to further increase the current
redistribution between battery and capacitor. For this a 5mH inductor was used. Figure
54 shows the battery and capacitor currents for this case.
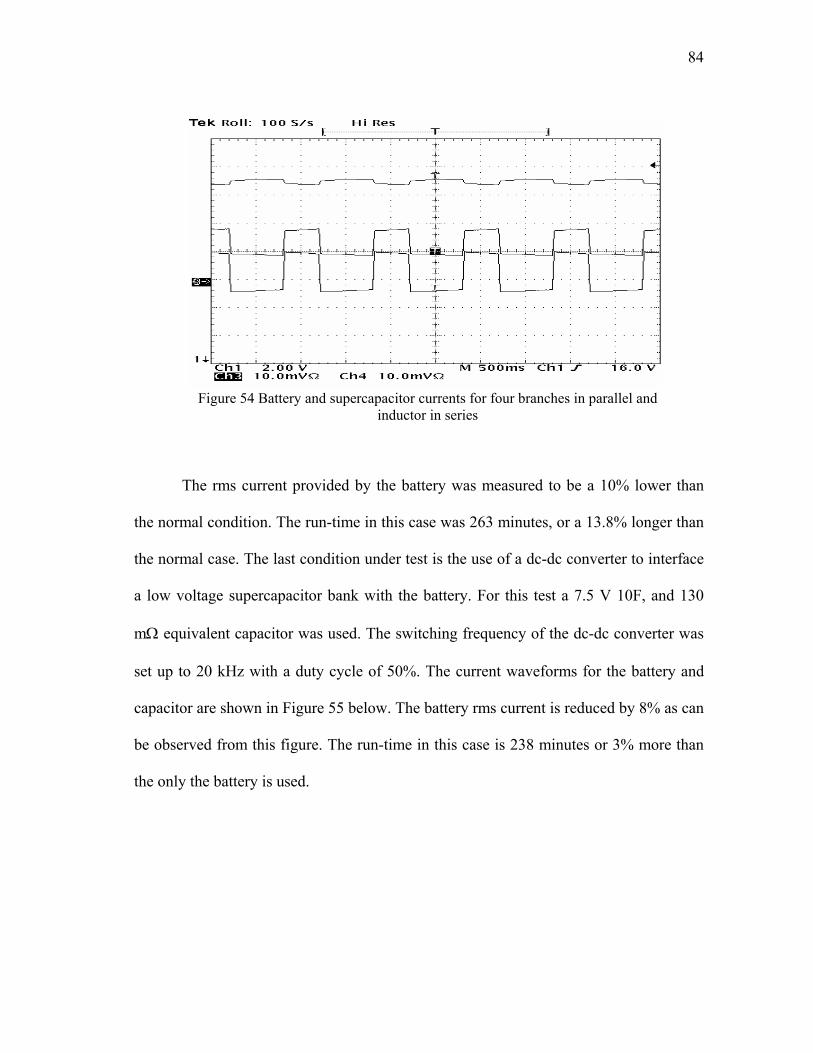
84
Figure 54 Battery and supercapacitor currents for four branches in parallel and
inductor in series
The rms current provided by the battery was measured to be a 10% lower than
the normal condition. The run-time in this case was 263 minutes, or a 13.8% longer than
the normal case. The last condition under test is the use of a dc-dc converter to interface
a low voltage supercapacitor bank with the battery. For this test a 7.5 V 10F, and 130
mΩ equivalent capacitor was used. The switching frequency of the dc-dc converter was
set up to 20 kHz with a duty cycle of 50%. The current waveforms for the battery and
capacitor are shown in Figure 55 below. The battery rms current is reduced by 8% as can
be observed from this figure. The run-time in this case is 238 minutes or 3% more than
the only the battery is used.
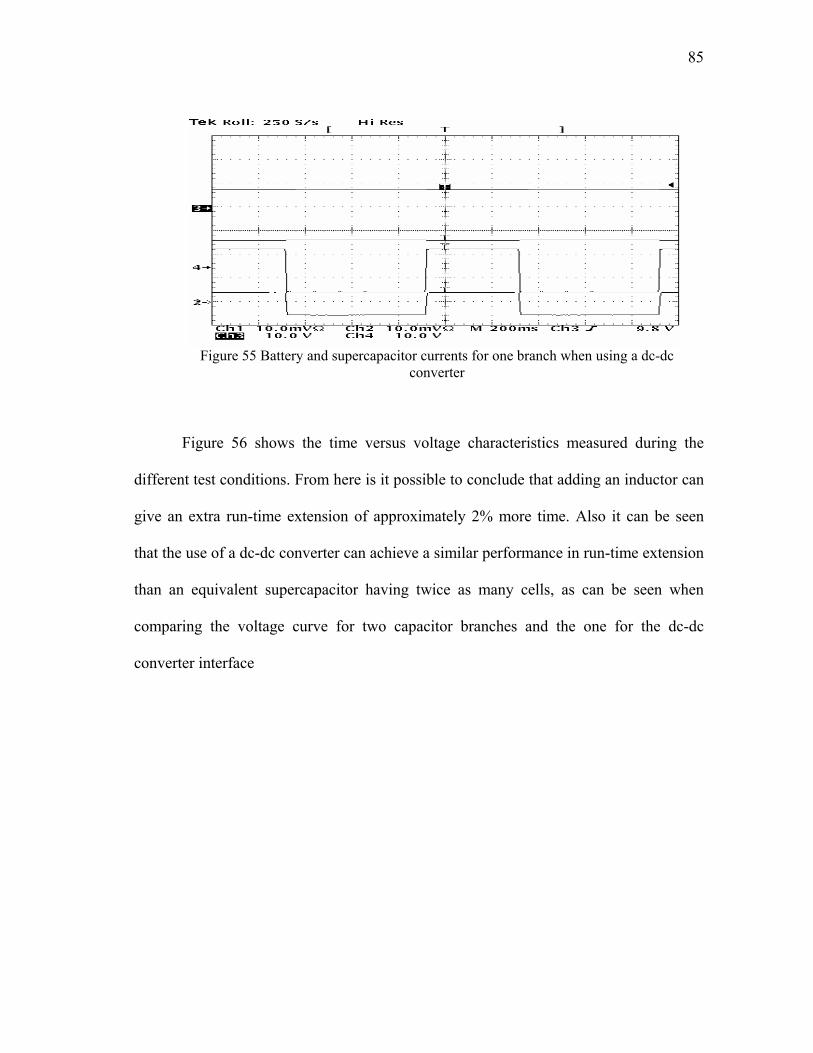
85
Figure 55 Battery and supercapacitor currents for one branch when using a dc-dc
converter
Figure 56 shows the time versus voltage characteristics measured during the
different test conditions. From here is it possible to conclude that adding an inductor can
give an extra run-time extension of approximately 2% more time. Also it can be seen
that the use of a dc-dc converter can achieve a similar performance in run-time extension
than an equivalent supercapacitor having twice as many cells, as can be seen when
comparing the voltage curve for two capacitor branches and the one for the dc-dc
converter interface

86
10
11
12
13
14
15
16
17
18
0 20 40 60 80 100 120 140 160 180 200 220 240 260 280
Time [min]
Vol
tage
[V]
Figure 56 Battery voltage as function of time without and with a supercapacitor
5.6. Conclusions
In this Chapter the problem of the battery run-time extension has been addressed.
The use of Supercapacitors to extend the run-time of a mobile device has been analyzed
for three different approaches. The method of connecting directly the Supercapacitors to
the battery terminals was analyzed and tested in a laboratory prototype. From the
analysis it has been shown that the run-time extension obtained from the addition of
capacitors in parallel depends on the number of capacitors being added. Also from this
analysis it is possible to conclude that adding more than 5 supercapacitor branches in
parallel has a marginal effect on the run-time extension. The analysis also shows that a
reduction on the supercapacitor ESR can improve the run-time extension effect by
further reducing internal loses and improving the battery current waveform.
Normal
Dc-dc
2 branches
4 branches
4 branches and inductor
87
From experimental tests performed in the laboratory extensions of 4% and 12%
percent have been achieved The addition of an inductor in series with the battery
increases the run-time of the system by an extra 2% when compared to a battery
capacitor connection. This extra time is gained by the reduction in the peak value of the
battery current. The use of a dc-dc converter to interface the supercapacitor bank and the
battery results in a reduction of 50% of the capacitors needed to achieve the same run-
time extension. This reduction is achieved mainly because of the smaller number of cells
is needed to match the battery terminal voltage. Thus increasing the equivalent
capacitance and reducing the equivalent ESR of the capacitor bank. Therefore increasing
the power delivering capability of the system and reducing its internal loses.

88
CHAPTER VI
CONCLUSIONS
Several energy storage technologies are available today for use in power
electronics, such as flywheels, high capacity batteries and supercapacitors. Among these
three energy storage devices supercapacitors show some important advantages due to
their high power density, low ESR, reduced size and weight. Supercapacitors, when
compared to a more traditional energy storage device such as lead acid batteries have a
power density 10 times higher. Also supercapacitors out perform batteries having an
extended operational life with no degradation due deep discharge cycles.
The most important disadvantages being exhibit by supercapacitors are their low
terminal voltage, which is 2.5 Volts per cell, and their low energy density. Having such
a low cell voltage forces to stack them in connected in series to match the load voltage.
This has the negative effect of increasing the equivalent ESR and reducing the
capacitance of the resulting supercapacitor. Also the fact that supercapacitors have a low
energy density makes this energy storage technology not suitable for long term energy
backup.
Due to the low supercapacitor terminal voltage dc-dc converters are required to
interface with higher voltage loads. Several dc-dc topologies are available to perform
this function. For selecting the appropriate interfacing topology the most important
89
considerations are bidirectional power flow capability to maintain the supercapacitor
state of charge, and the application specific load requirements. An other important point
during the dc-dc converter topology selection process is the converter performance. For
this evaluation the switch utilization index proves to be a useful tool.
The use of a supercapacitor bank to provide ride through in adjustable speed
drives was tested in a laboratory prototype. The system performance proved to be good
to compensate deep voltage sags as well as short voltage interruptions, while
maintaining the dc link voltage level invariant during the duration of the transient
disturbance. From the results shown in Chapter IV is clear that the supercapacitor
dynamic response is fast enough to respond to the load transient requirements and avoid
the effects of the voltage sags on the adjustable speed drive.
The use of a battery – supercapacitor hybrid connection proved to be beneficial
for run-time extension in mobile applications. The run-time extension is achieved due to
the reduction in the battery internal loses. This loss reduction is generated by the lower
impedance resulting from the battery-supercapacitor connection. This loss reduction
effect is accompanied by an improvement in the power delivering capability of the
battery-supercapacitor system improving its performance for pulsating loads such as
microprocessors. Three battery-supercapacitor connection methods were proposed and
evaluated. It was shown that by the parallel connection of battery and supercapacitor a
run-time extension of a 12% is achievable. Also it was found that he addition of an
inductor connected in series with the battery in the previous case increases the run-time
of the system by an extra 2% when compared to a parallel battery capacitor connection.

90
Further it was shown that the use of low voltage supercapacitor cells interfaced via a dc-
dc converter allows the reduction of the number of supercapacitor cells required to
extend the system run-time. Thus this has the effect of reducing the cost and size of the
run-time extension approach.
Future improvements in the supercapacitor equivalent series resistance value will
result in an extra run-time extension capability. This is due to a larger reduction in
internal losses, and by improving the battery current shape. This is by reducing the peak
and rms values of the battery current.
91
REFERENCES
[1] H.G. Sarmiento, E Estrada, “A voltage sag study in industry with adjustable speed drives”, IEEE Industry Applications Magazine, vol. 2, no. 1, pp. 16-19 January /February 1996.
[2] N. Mohan, T. M. Underland and W.P. Robbins, Power Electronics, Converters,
Applications and Design, New York: John Wiley & Sons, 1995.
[3] M. H. J. Bollen, “Voltage sags effects, mitigation and prediction”, Power Engineering Journal, vol. 10, no. 3, pp. 129 -135, June 1996.
[4] D. Cahela, B. Tatarchuk, “Overview of electrochemical double layer capacitors”, in
Conf. Rec. IEEE-IECON’ 97, 1997, pp. 1068 -1073
[5] F. Belhachemi, S Rael, B. Davat, “A physical based model of power electric double-layer supercapacitors”, in Conf. Rec IEEE-IAS’2000, 2000, pp. 3069-3076.
[6] T.A. Smith, J.P. Mars, G.A. Turner, “Using supercapacitors to improve battery
performance”, in Conf. Rec. IEEE-PESC’02, 2002, pp. 124-128.
[7] F. Nome, I. Barbi, “ A ZVS Clamping mode-current-fed push-pull dc-dc converter”, in Conf. Rec. IEEE-IAS’00, 2000, pp. 3069-3076.
[8] A. Rabello, M. Co, D. Simonetti, J. Vieira, “ An isolated dc-dc boost converter using
two cascade control loops”, in Conf. Rec. IEEE-ISIE '97, 1997, pp. 452 -456.
[9] W. de Argano, I. Barbi, “A comparison between two current-fed push-pull dc-dc converters – Analysis, design and experimentation”, in Conf. Rec. IEEE -INTELEC '96, 1996, pp. 313 -320.
[10] A. Rabello, M. Co, G. Sousa, J. Vieira, “A fully protected push-pull current-fed dc-
dc converter”, in Conf. Rec. IEEE-IECON 97, 1997, pp. 587 -592.
[11] D. Divan, W. Brumsickle, “Powering the next millennium with power electronics”, in Conf. Rec. IEEE-PEDS '99, 1999, pp. 7 -10.
[12] N.S. Tunaboylu, E. R. Collins Jr. and S. W. Midlekauff, “Ride-through issues for the
motor drives during voltage sags”, in Conf. Rec. IEEE Southeastcon ’95, 1995, pp. 26-29.
[13] Maxwell Technologies, (Accessed May 2002) “Power Cache ultracapacitors data
sheet” [Online]. Available: http://www.maxwell.com
92
[14] Montena Components, (Accessed June 2002) “BOOSTCAP series data sheet” [Online]. Available: http://www.montena.com.
[15] Koldban Capacitors, (Accessed June 2002) “KBi power data sheet” [Online].
Available: http://www.koldban.com.
[16] P.H. Mellor, N. Schofield, D. Howe, “ Flywheel and supercapacitor peak power buffer technologies”, in Conf. Rec. IEEE Electric, Hybrid and Fuel Cell Vehicles, 2000, pp. 8/1 -8/5.
[17] Paulo Ribeiro, Brian Johonson, Mariesa Crow, Aysen Arsoy, Yilu Liu, “ Energy
storage systems for advanced power applications”, Proceedings of the IEEE , vol. 89 no. 12 , pp. 1744 -1756, Dec. 2001.
[18] D. Panigraphi, C. Chiasserini, S. Dey, R. Rao, A. Raghunthan and K. Lahiri,
“Battery life estimation of mobile embedded systems”, in Conf. Rec. 14th Annual Conference in VLSI Design, 2001, pp. 57 -63.
[19] L. Benini, G. Castelli, A. Macci, E. Macci, M. Poncino, R. Scarsi, “ A discrete-time
model for high-level power estimation”, in Conf. Rec. 7th Asia and South Pacific and the 15th International Conference on VLSI Design ASP-DAC’02, 2002, pp. 261 -267.
[20] H.L. Chan, D. Sutanto, “A new battery model for use with battery energy storage
systems and electric vehicles power systems”, in Conf. Rec. IEEE Power Engineering Society Winter Meeting, 2000, pp. 470 -475.
[21] EPCOS Components, (Accessed February 2003) “Ultra cap series data sheet”
[Online]. Available: http://www.epcos.com.

93
APPENDIX A
SMALL CELL SUPERCAPACITOR DATASHEETS

94
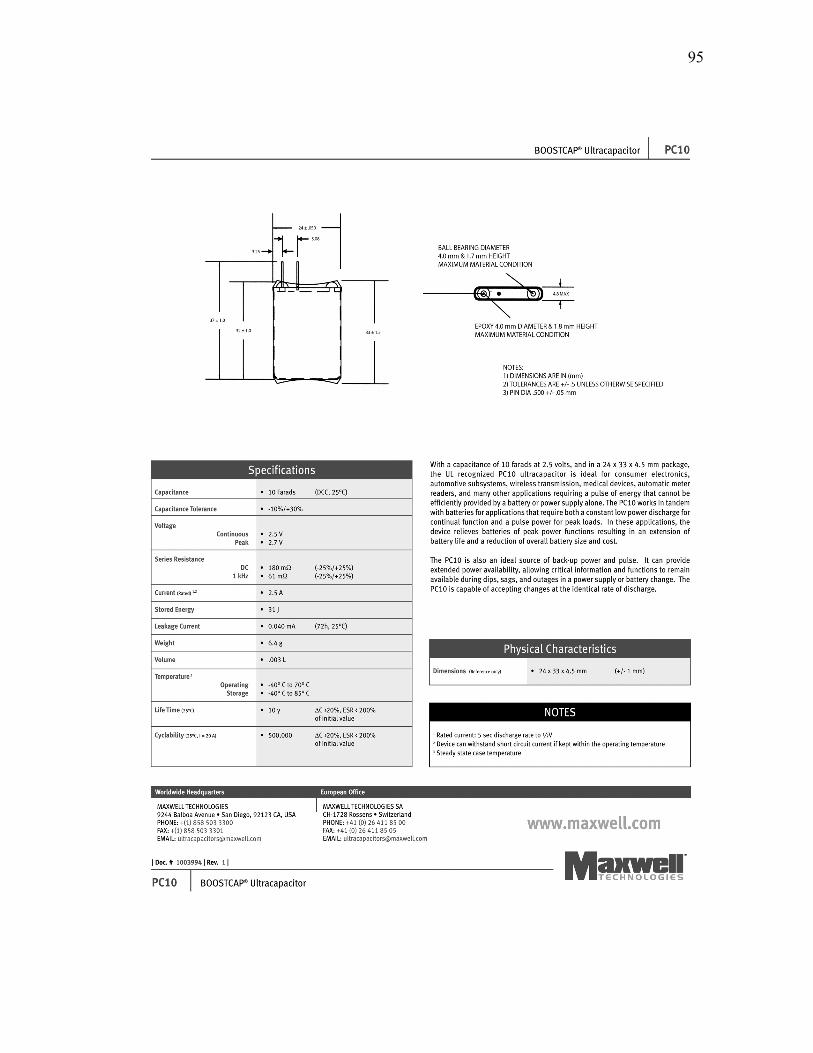
95
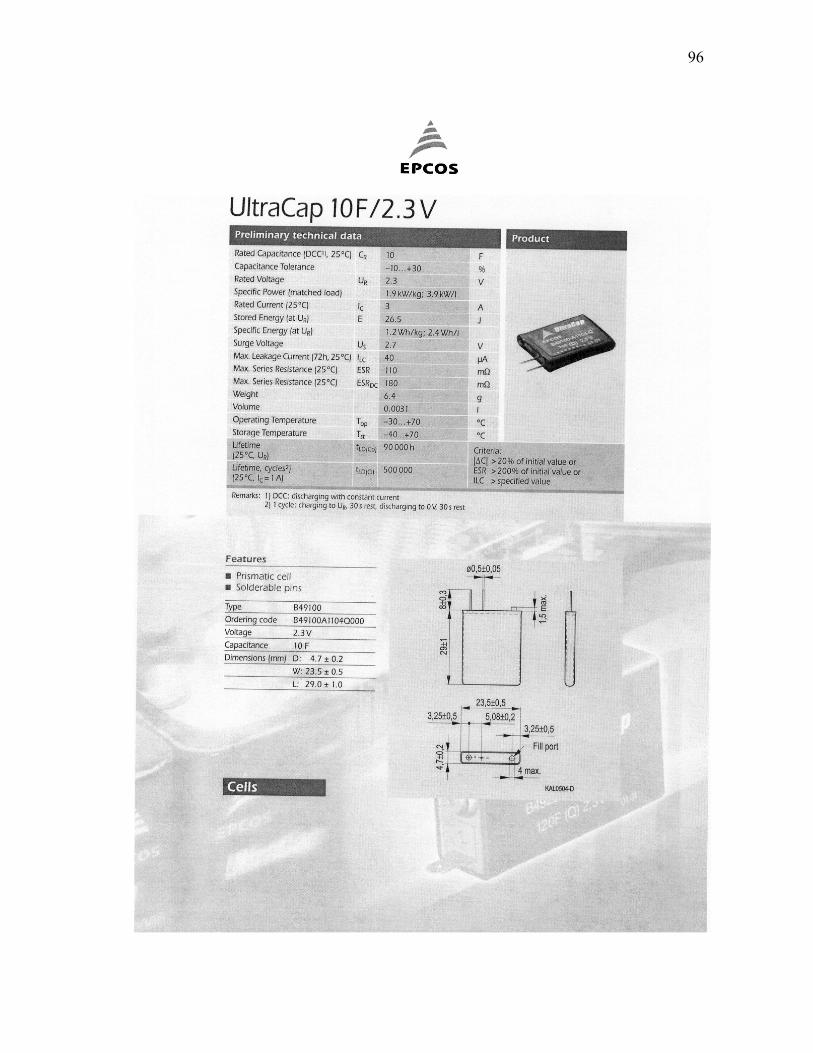
96
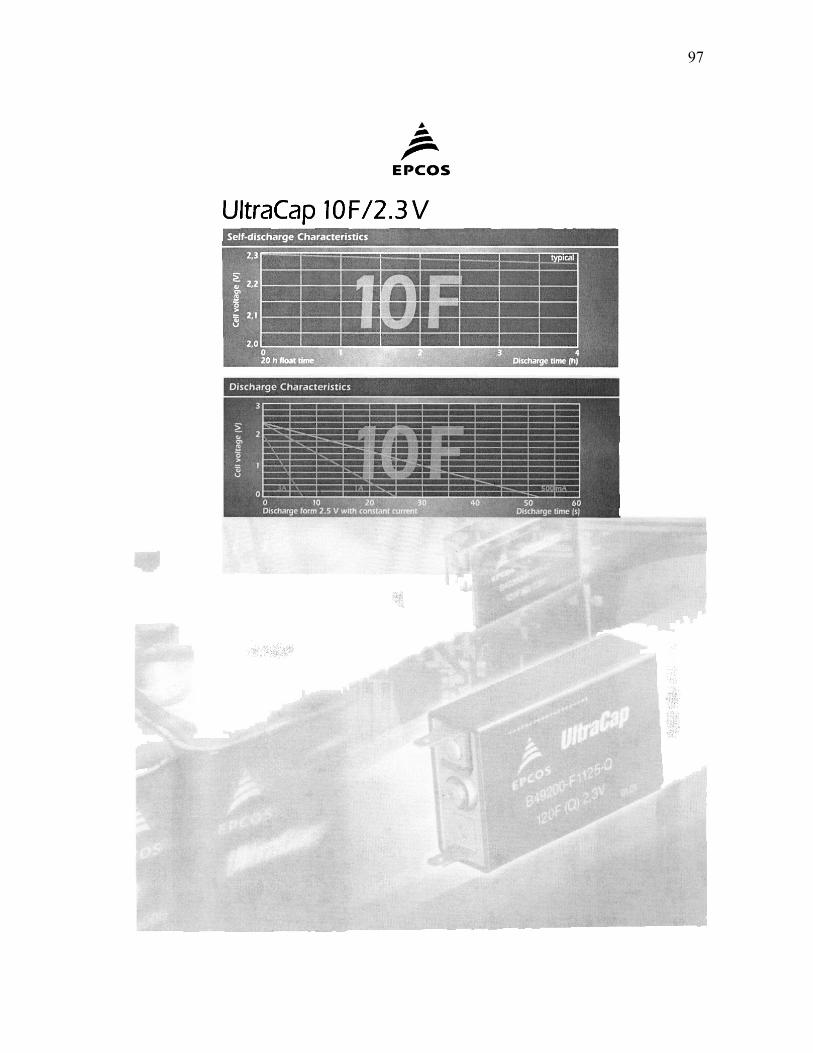
97

98
APPENDIX B
BIG CELL SUPERCAPACITOR DATASHEETS

99

100

101

102

103
VITA
Leonardo Manuel Palma Fanjul graduated with a Bachelor of Engineering from
Universidad de Concepción, Concepción, Chile in 1999. During the year 2000 he
worked as a part-time engineer doing consulting. He joined the master’s program in
Electrical Engineering at Texas A&M University in January 2001, and received his
Master of Science degree in August 2003.
His interests include power electronics, motor drives, energy storage devices,
control systems and alternative energy applications.
He can be reached at [email protected] or through the Department of Electrical
Engineering, Texas A&M University, College Station, TX 77843, mail stop 77843-3128.