some effects of thermae history on the largemouth
TRANSCRIPT

SOME EFFECTS OF THERMAE HISTORY ON THE LARGEMOUTH
BLACK BASS, MICROPTER'JS SALMOIDES (LACEPEDE),
OF TWO CENTRAL TEXAS RESERVOIRS RECEIVING
POWER PLANT EFFLUENTS
A Thesis Submitted to the Faculty of
Baylor University
in Partial. Fulfillment of the
Requirements for the Degree
of
Master of Science
By
Barney James Venables
Waco, T'-r.as
December 1972
ABSTRACT
Mean annual growth of the first three age classes of
largemouth black bass from Tradinghouse Reservoir was near
the average growth reported in the literature for southern
waters. Largemouth black bass collected from the discharge
canals of Tradinghouse Reservoir (which has received power
plant effluent for only 2 years) and Lake Creek Reservoir
(which has received power plant effluent for 20 years) showed
no difference in male or female gonadal development, con
dition factor, or thyroid activity; however, the largemouth
black bass collected from the Tradinghouse Reservoir dis
charge canal showed signs of decreased physiological activity
with respect to the Lake Creek sample. No significant detri
mental effects of the power plant effluents were detected.
11
TABLE OF CONTENTS
PageLIST OF TABLES...................................................... iv
LIST OF ILLUSTRATIONS...................................... . v
INTRODUCTION...................................................... 1
METHODS AND MATERIALS ......................................... 5
Physical and Chemical Age and GrowthOrgan Weight, G.S.I., Egg Number, and
Thyroid Acitivity
TEMPERATURE ADJUSTMENT......................................... 12
Definitions The Organismic Level The Systemic Level The Molecular Level
RESULTS...........................................................2 5
Physical and Chemical Age and Growth Organ Weights G.S.I. and Egg Number Thyroid Acitivity ''K" Value
DISCUSSION........................................................ 46
Physical and Chemical Characteristics GrowthG.S.I. and Egg Number Organ Weight Analysis Thyroid Analysis
CONCLUSION........................................................... 59
APPENDIX..............................................................64
LITERATURE CITED................................................... 66
111
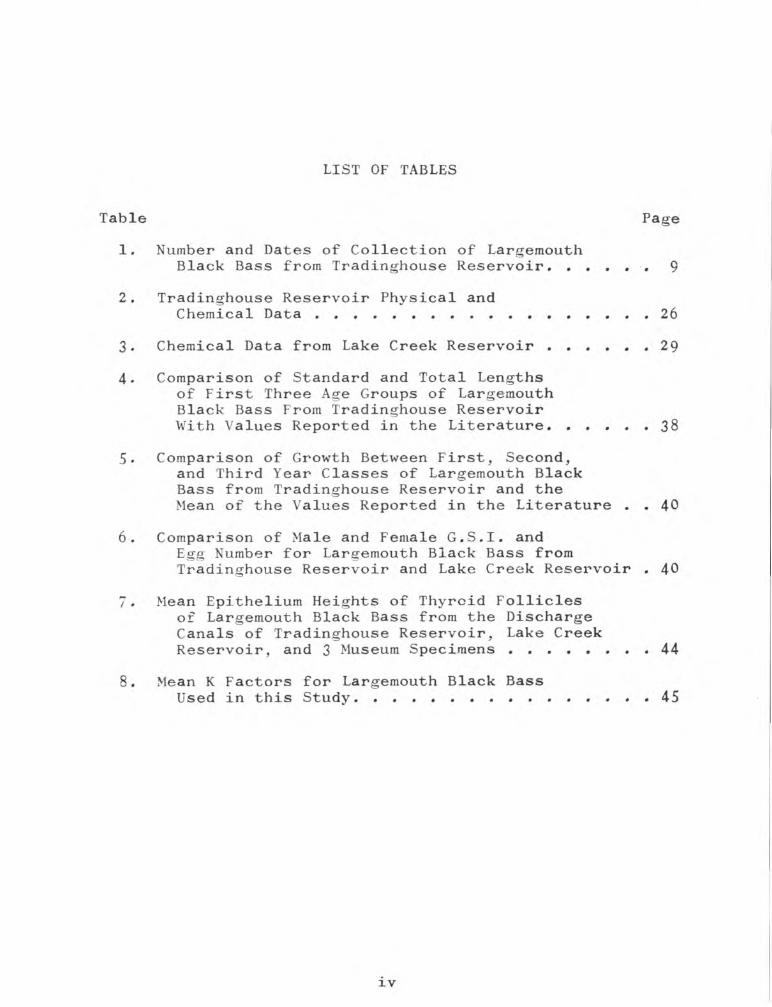
LIST OF TABLES
Table Page
1. Number and Dates of Collection of LargemouthBlack Bass from Tradinghouse Reservoir............. 9
2. Tradinghouse Reservoir Physical andChemical Data............................................. 26
3. Chemical Data from Lake Creek Reservoir................29
4. Comparison of Standard and Total Lengthsof First Three Age Groups of LargemouthBlack Bass From Tradinghouse ReservoirWith Values Reported in the Literature.............38
5. Comparison of Growth Between First, Second,and Third Year Classes of Largemouth BlackBass from Tradinghouse Reservoir and theMean of the Values Reported in the Literature . . 40
6. Comparison of Male and Female G.S.I. andEgg Number for Largemouth Black Bass from Tradinghouse Reservoir and Lake Creek Reservoir . 40
7. Mean Epithelium Heights of Thyroid Folliclesof Largemouth Black Bass from the Discharge Canals of Tradinghouse Reservoir, Lake CreekReservoir, and 3 Museum Specimens .................. 44
8. Mean K Factors for Largemouth Black BassUsed in this Study...................................... 45
xv

LIST OF ILLUSTRATIONS
Figure Page
1. Map of Tradinghouse Reservoir ShowingSampling Sites for Physical andChemical Data............................ 6
2. Schematic Representation of the Electrofishing Rig Used for Capture ofLargemouth Black Bass in TradinghouseReservoir................................................... 8
3. Hypothetical Zone of Tolerance......................... 14
4. Annual Temperature Fluctuations in PowerPlant Intake and Discharge Waters onTradinghouse Reservoir ............................... 28
5. Water Temperatures of the Discharge Canalsof Tradinghouse Reservoir and Lake Creek Reservoir for the Month of February, 1972. . . . 30
6. Length-frequency Histogram for Samples1 and 2.....................................................31
7. Probability Scale Length-frequency Plot forSamples 1 and 2.......................................... 32
8. Length-frequency Plot for Individual SizeClasses for Samples 1 and 2........................... 34
9. Length-frequency Histogram for Samples5 and 6.....................................................35
10. Probability Scale Length-frequency Plotfor Samples 5 and 6..................................... 36
11. Length-frequency Plot for Individual SizeClasses of Samples 5 and 6........................... 37
12. Relationship Between Total Weight and KidneyWeight for Largemouth Black Bass from Trading- house Pveservoir and Lake Creek Reservoir . . . • 41
13. Relationship Between Total Weight and LiverWeight for Largemouth Black Bass from Trading- house Reservoir and Lake Creek Reservoir .... 42
v

PageFigure
14. Relationship Between Total Weight andSpleen Weight for Largemouth Black Bass from Tradinghouse Reservoirand Lake Creek Reservoir............................ 43
15. Zone of Tolerance for LargemouthBlack Bass............................................. 61
vi
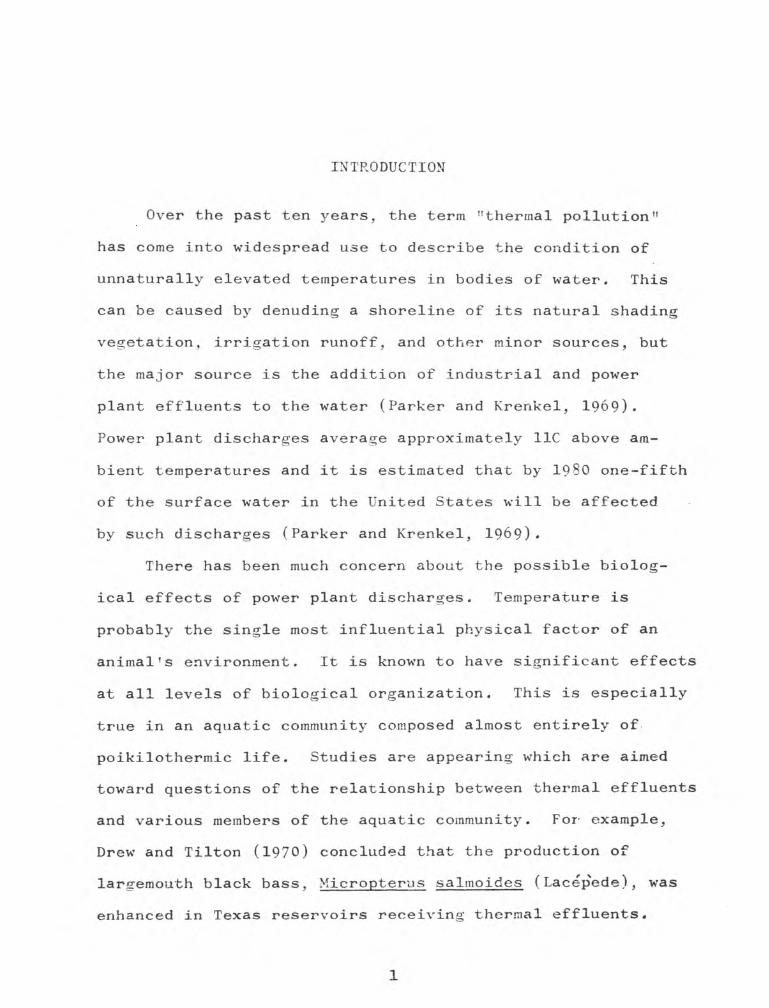
INTRODUCTION
Over the past ten years, the term "thermal pollution"
has come into widespread use to describe the condition of
unnaturally elevated temperatures in bodies of water. This
can be caused by denuding a shoreline of its natural shading
vegetation, irrigation runoff, and other minor sources, but
the major source is the addition of industrial and power
plant effluents to the water (Parker and Krenkel, 1969).
Power plant discharges average approximately 11C above am
bient temperatures and it is estimated that by 1980 one-fifth
of the surface water in the United States will be affected
by such discharges (Parker and Krenkel, 1969).
There has been much concern about the possible biolog
ical effects of power plant discharges. Temperature is
probably the single most influential physical factor of an
animal's environment. It is known to have significant effects
at all levels of biological organization. This is especially
true in an aquatic community composed almost entirely of
poikilothermic life. Studies are appearing which are aimed
toward questions of the relationship between thermal effluents
and various members of the aquatic community. For example.
Drew and Tilton (1970) concluded that the production of
largemouth black bass, Micropterus salinoides (Lacepede), was
enhanced in Texas reservoirs receiving thermal effluents.
1

2
The well being of the fishes of the aquatic community is
of special interest because of the trophic dependence of
fishes upon the other members of the community. Thus the
health of fish populations can be used as an indication of
the health of the entire aquatic community.
There are many possible indicators of temperature effects
that could be used in the evaluation of the effect of thermal
history on fish. The following indicators were considered
in this study.
Numerous studies have related fish growth to ambient
temperature. Kramer and Smith (i960) found the growth of
largemouth black bass to be correlated with the temperature
experienced up to the end of the growing season. A thermally
influenced reservoir might produce a prolonged growing season
and result in increased annual growth.
Temperature can also affect gonad maturation rate and
spawning time. Wiebe (1968) found increased spermatogenesis
with increased temperature in the sea perch, Cymatogater
aggregata (Gibbons). Serenbeim (1970) demonstrated a corre
lation between mean annual temperature and spawning time in
some marine fishes. A reservoir receiving a heated discharge
might produce fish with accelerated rates of gonad maturation
leading to early spawning.
The relationship between temperature and metabolic rate
has been a subject of much interest. Paloheimo and Dickie
(1966) concluded that temperature affects primarily the level

3
of metabolism. That is, a change in temperature tends to
translate (rather than rotate) a curve describing the rela
tionship between body weight and metabolism. All other things
being equal, an increase in ambient temperature would theo
retically cause an increase in total metabolism.
Albrecht (1969) demonstrated an inverse relationship
between organ weights and metabolic acitivity in carp,
Cyprinus carpio (Linnaeus). This was primarily due to the
shunting of blood from the viscera to the musculature. It
might be expected that fish with different thermal histories
would exhibit different organ weights as a reflection of
differing levels of metabolic activity.
The role of thyroid activity in temperature acclimation
has been controversial and is still undefined; however, the
relationship between thyroid activity and ambient temperature
is generally agreed upon. Drury and Eales (1968), in a com
parison of histological and radio-chemical techniques of
thyroid activity assay in brook trout Salvelinus fontinalis.
(Mitchill) , concluded that thyroxin secretion is positively
correlated with temperature. Thyroid activity too, then
might be expected to reflect thermal history.
The purpose of this study was to evaluate the effect of
thermal history on the largemoutn black bass of two Texas
reservoirs receiving power plant discharges using several
indicators of temperature adjustment. Age and growth of
largemouth black bass from Tradinghouse Reservoir (which

4
received thermal discharge for approximately two years prior
to the study) were to be compared with literature values for
other southern waters. Largemouth black bass from the dis
charge canals of Tradinghouse Reservoir and Lake Creek
Reservoir (which received thermal discharge for approximately
twenty years prior to the study) were to be compared on the
basis of: (l) physiological activity as indicated by the
relationship of organ weights (spleen, kidney, and liver) to
total weights (2) the relative state of development of gonads
as indicated by the gonosomatic index (G.S.I.) and egg number
(3) thyroid activity as indicated by follicular epithelium
height.
This study was funded by Office of Water Resources
Research Grant B-091-TEX. I am indebted to Drs. Owen Lind,
Harley Reno, and Thomas Franklin for their assistance
throughout the study and their thoughtfull reviews of the
manuscript. Mr. Mark Wysong, Mr. David Lukins, Mr. E. Norbert
Smith, and Dr. David Eldridge kindly contributed much of
their time and effort on my behalf. Special thanks go to Mr.
Dwane Smith and Mr. Breed of the Texas Parks and Wildlife
Commission for their patient cooperation, and to the Texas
Power and Light personnel who made my job so much easier.

METHODS AND MATERIALS
Physical and Chemical
Tradinghouse Reservoir is located east of Waco, Texas in
McLennan County (31°34'N, 96°57'W). Routine chemical and
physical data were taken from Tradinghouse Reservoir at monthly
intervals from 8 March 1971, through 9 March 1972 at the four
stations indicated in Figure 1. Dissolved oxygen and air and
water temperature were measured in the field with a Weston
and Stack Model 300 oxygen analyzer with a motorized sampler
Model A15. Dissolved oxygen was determined in the laboratory
by the Winkler method on two sampling dates (17 May 1972 and
9 March 1972).
Water samples, taken with a Kemmerer sampler, were iced
down and returned to the laboratory for analysis. The pH was
determined by a Coleman pH meter and specific conductance by
a Helige conductance meter. Alkalinity, total hardness,
calcium, magnesium, and silica concentrations were all deter
mined by standard methods (American Public Health Association,
I965). Sulfate concentration was determined by the Hach
turbidometric technique.
Lake Creek Reservoir is located southeast of Waco, Texas
in McLennan County (31°27'N, 96°58'W). The chemical data for
Lake Creek Reservoir and temperature data for February 1972,
for the discharge canals of both reservoirs were obtained from
5

6
Figure 1. Map of Trading house Reservoir showing sampling sites for physical and chemical data. Surface area=7»96 km^*
mean depth=5.7m. X=Electrofishing sites.

7
the records of Texas Power and Light Company.
Age and Growth
From 10 June 1971, to 13 December 1971, 263 largemouth
black bass were collected in 6 samples (Table 1) from Trading-
house Reservoir by alternating current (A.C.) electrofishing.
A direct current (D.C.) variable voltage pulsator was designed
and constructed in our laboratory (Smith, Venables, and Lind,
1973). The pulsator had an upper current limit of 10 amps
and consequently could not be efficiently used due to the high
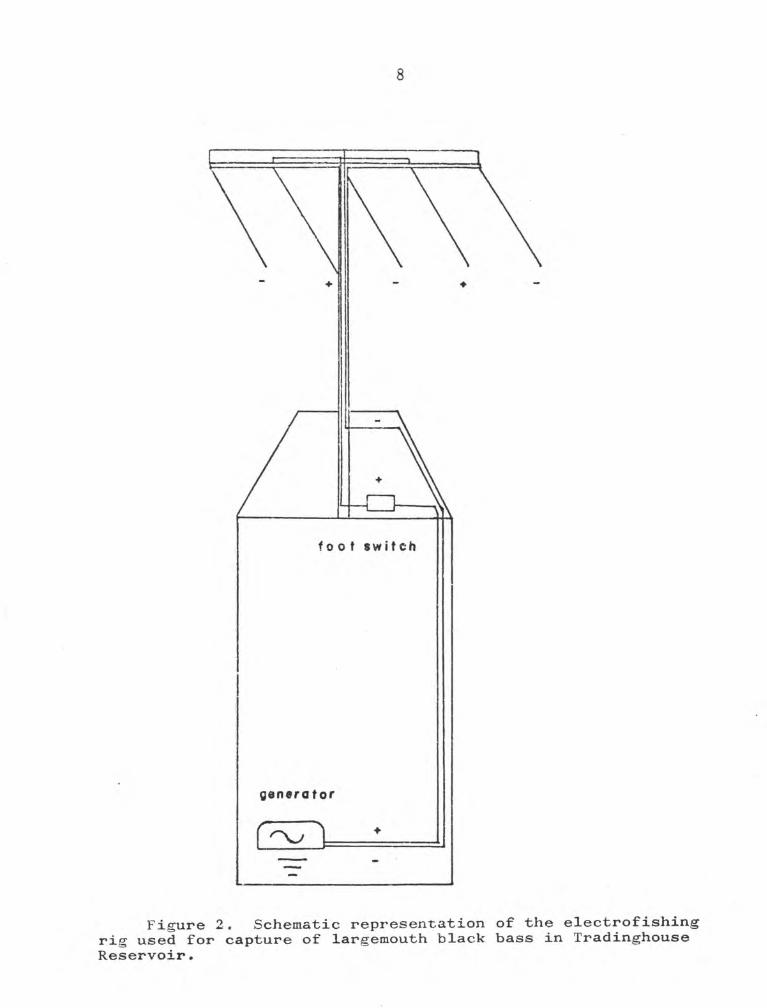
conductivity of the reservoir water. The electrofishing rig
consisted of a 16 ft. aluminum boat with a 3000 watt generator
connected through a deadman switch to five metal spring elec
trodes suspended from a "T" shaped boom which extended 5 feet
in front of the bow (Fig. 2). Electrofishing was done along
the north and south shores at night with crews of three to six
men. Collected fish were weighed to the nearest gram, mea
sured for standard length (SL) (tip of the lower jaw to the
end of the hvpural plate) and total length (TL) to the nearest
mm, and released. A mean condition factor or "K" value (weight/
length^) was computed for the 263 fish.
The 263 fish lengths were grouped into size classes ac
cording to the Peterson method (Simpson, Roe, and Lewontin,
i960). Samples 1 and 2 were combined to give sufficient
numbers for an early summer length-frequency analysis. Sim
ilarly samples 5 and 6 were combined for a late fall analysis
which was assumed to represent the extent of the 1971 growth.
8
Figure 2. Schematic representation of the electrofishing rig used for capture of largemouth black bass in Tradinghouse Reservoir.

9
TABLE I
NUMBER AND DATES OF COLLECTION OF LARGEMOUTH BLACK BASS FROM TRADINGHOUSE RESERVOIR
CollectionNumber
NumberCollected
Date
1 18 10 June 19712 77 14 June 19713 41 7 Sept. 19714 16 15 Sept. 19715 64 8 Nov. 19716 47 13 Dec. 1971
Total 263
Size classes were distinguished using the probability paper
analysis of size frequency distribution described by Cassie
(1954). Samples 3 and 4 had insufficient number for analysis,
resulting in a probability plot too indistinct for the deter
mination of inflection points.
The mean standard lengths of the size classes were as
sumed to represent the mean standard lengths of age classes
I, II, III, and IV for 1971, representing fish having com
pleted 1-4 years of life respectively.
The determination of annual growth by the scale method
proved to be impractical due to the lack of distinct annulus
formation.
Organ Weight, Gonosomatic Index, Egg
Number, and Thyroid Activity
On 27 and 28 February 1972, 34 largemouth black bass
10
from Tradinghouse Reservoir and 43 from Lake Creek Reservoir
were collected by angling from the discharge canals of the
two reservoirs. They ranged from 145-315mm, SL. Water
temperature in the canals was 31C and 22C for Tradinghouse
Reservoir and Lake Creek Reservoir respectively. The fish
were immediately preserved in 10% buffered formalin. Slits
in the region of the throat thyroid and peritoneal cavity
allowed rapid fixation. The SL, TL, and weight of the fish
were determined as previously described. A mean "K" value
was computed for the fish from each canal. The liver, kidney,
spleen, gonad, and thyroid were excised and weighed wet to
the nearest milligram. The regressions between body weight
and each of the three organ weights (kidney, liver, and spleen)
were plotted for the fish from each reservoir. The slope and
Pearson coefficient of regression were calculated for each
regression. A "t" test for the significance of difference
between regression coefficients (Simpson, et. al., I960) was
used to test for differences between the fish samples from
the two canals.
The G.S.I. was calculated from the quotient of total
weight and gonad weight. Eggs were counted by Simpson's
(1959) dry method. The mean G.S.I. for each sex, and the
mean egg number per gram of fish were compared between canals
by the "t" test (pc0.05)«
Twenty fish (5 males and 5 females from each canal)
were used in the thyroid activity analysis. The fish ranged

11
from 150-220mm SL. The thyroid region was decalcified
7-10 days in picric acid, serially sectioned at 10/U be
tween the first and second aortic arch and stained with
Harrison's hematoxylin and eosin. Follicle epithelium
height of 20-50 follicles per fish was measured with an
ocular micrometer. The mean thyroid follicle epithelium
heights of the two samples were compared by "t" test (p<
0.05). As a basis of comparison, three additional large-
mouth black bass collected from nonthermally affected central
Texas water in March, June, and August of previous years,
were obtained from the Baylor University Ichthyology Museum
(B.U.I.M. 923, 895 b 860) and analyzed for thyroid activity
as described above.

TEMPERATURE ADJUSTMENT
In order to evaluate results of this study it is
necessary to begin with a brief synopsis of what is known
concerning the adjustment of poikilotherms to temperature.
A description of some of the pertinent terminology is
followed by specific examples of temperature adjustment.
Definitions
There has been confusion over the terms describing
various forms of biological adjustment induced by temperature
change. Fry (1957) listed three main levels of adjustment
for poikilotherms. Acclimation he defined as "day to day
changes in systemic or cellular organization in direct
response to temperature." These changes are reflected by
shifts in temperature preference, metabolic rates, and lethal
temperature limits. The shifts are generally in the direc
tion which places the biokinetic range more in accord with
the acclimation temperature.
Fry next considered "long term responses operating
throughtout the life of the individual" and termed this level
of adjustment acclimatization♦ This included the composite
effects of all environmental factors (such as photoperiod,
salinity, etc.,) including temperature. Thus a direct re
sponse to temperature (acclimation) can be reinforced or
opposed by long term response to photoperiod (acclimatization).
12

13
The final level of adjustment is that of adaptation.
This is "on the phylogenetic level at which the mechanisms
both for the production of direct responses to temperature
and the mechanisms for anticipation of seasonal changes
have been fixed in the heritage of the species." Extreme
cases of this type of temperature adjustment are seen in
the highly adapted thermophilic species inhabiting hot
springs, i.e., Crenicthvs baileyi (Gilbert).
Although there is overlap and interplay among the three
terms listed above. Fry's definitions serve as a good basis
for the discussion of temperature adjustment and will be
used throughout this paper. In addition to the confusion
that has arisen from the various terms used to describe the
general functional character of biological responses to
temperature, there has been equal confusion over the limits
and definition of indicator responses used for assessment
of the degree of temperature adjustment. The following terms
will be used in this paper.
Lethal temperature determinations are probably the
single most used thermal characteristic of an organism.
This is determined most simply by determining the lethal
(L.D.50) temperature. A more complete description of lethal
temperature is given by Brett's (1956) zone of tolerance
(Fig. 3)* Lethal temperatures (upper and lower) are plotted
as a function of acclimation temperature and the size of the
area bounded by the polygon plot is an indicator of the

14
0 20 40ACCLIMATION TEMPERATURE (C)
Figure 3- Hypothetical zone of tolerance. Upper and lower parallel lines described upper and lower lethal temperatures within limits set by the vertical lines.

15
eurythermieity of the organism (expressed as square centi-
grade degrees or C ). As can be seen in Figure 3, acclimation
temperature has a significant effect on the lethal temper
ature. Thus Fry (1964) has defined the incipient lethal
temperature as that temperature at which infinite acclimation
results in the death of 50% of the animals. This point lies
at the upper right hand corner of Brett's zone of tolerance
polygon (Fig. 3)* Further extension of the zone could only
come about through a change in some environmental factor
other than temperature (such as photoperiod—an acclimati
zation change) or a genetic change that would allow for
further acclimation (an adaptive change).
In addition to the effects of temperature adjustments
on lethal temperatures, there are several indicators of
temperature adjustments used at sublethal levels. Temperature
preference is generally positively correlated with the
acclimation temperature. Fry (1950) defined final preferendum
as that temperature at which acclimation temperature and
preferred temperature are the same.
The influence of temperature acclimation on various
biological rate functions (i..e», heart rate, O2 consumption,
CO2 evolution, etc.) has been widely studied. Precht (1958)
has described seven patterns of temperature-rate response.
The most prevalent response is Precht's type The type 3
response is exemplified by the typical respiratory response
of a poikilotherm to an increase in temperature from T^ to T2.
As the temperature increases to T2, oxygen consumption rapidly

16
increases to a point; then, as the organism acclimates to
T2, oxygen consumption decreases to a rate intermediate to
the initial rate at T-^ and the initial rate at T£. This
pattern is typical of most rate acclimation responses in
fishes (Fry, 1964).
17
The Organismic Level
Fishes often have the opportunity to choose a pre
ferred temperature. Lakes may be thermally stratified,
have cool stream inputs, warm shallows, or shaded banks.
As noted earlier, preferred temperature usually increases
with increased acclimation temperature. An exception to
this usual relationship was reported by Garside and Tait
(1958) for rainbow trout, Salmo gaj.rdnerii (Gibbons). They
reported a decrease in preferred temperature with increased
acclimation temperature. Javaid and Anderson (1967), however,
repeated the experiment and found the usual relationship for
rainbow trout. The latter authors attributed the difference
between the two studies to the types of temperature gradients
used. The positive correlation between acclimation tempera
ture and preferred temperature seems to be applicalbe to most
fishes.
Fishes have the ability to discriminate amazingly small
changes in temperature. Bull (1936), working with several
species of fishes, demonstrated their ability to distinguish
temperature differences ranging from 0.03 to 0.05C. Bardach
and Bjorklund (1957), working with rainbow trout, goldfish
[^Carassius auratus (Linnaeus ]TJ , creek chubs jjgemoti lus
atromaculatus (Mitchillf] , bullheads
and pumpkinseed sunfiifish [^Lepomis gibbosus
(Linnaeus)J found these fishes could discriminate temperature
variations as small as 0.05C and that acuity of temperature

18
perception increased with learning.
The mechanism of this fine temperature discrimination
has been puzzling, but recently some light has been shed on
the subject. Hammel, Stromme, and Mhyre (1969) found that
the rostral part of the brain that is important in the
"escape" response (avoidance of lethal temperatures) of
arctic sculpins, Mvxocephalus scorpioides (Fabricius).
Greer and Gardner (1970) have isolated seven positively
temperature responding and five negatively temperature re
sponding neurons in the brain of the brook trout. Fishes,
then, have the ability (under special laboratory conditions)
to perceive temperature variations of 0.05C or less and can
distinguish between rising and falling temperatures.
Brett (1956) reported that despite the innate capa
bility of fish to respond to such small temperature changes,
they seldom do so in nature. Temperature preference in
nature is blurred by the effects of light, social behavior,
and feeding behavior. Natural temperature fluctuations
often exceed the 0.05C level described above and such fluc
tuations are ignored under most conditions. However, Brett
added gradient perception may become important in special
situations such as migration or a condition of temperature
stress (Brett, 1956).
In addition to seeking out preferred temperatures, fish
can regulate their activity levels in an effort to attain the
most metabolically efficient mix of food intake, growth and

19
muscular energy output. For example, spontaneous activity
and performance (maximum sustained forced swimming speed)
have been shown to be highest in the area of the preferred
temperature (Brett, 1956; Beamish, 1964). Activity decreases
above and below this temperature.
The Systemic Level
It has been hypothesized that temperature adjustments
observed at the organismal level might also be seen at the
systemic level (Prosser, 1962). The nervous system is espe
cially likely to exhibit such adjustments due to its regulatory
role. Roots and Prosser (1962) demonstrated that the tem
perature of cold blockage of reflex responses (movement
responses to electrical and physical stimulation) decreases
with decreasing acclimation temperature in goldfish and blue-
gill. The cold blockage of a conditioned response (a learned
temporary cessation in opercular movement in response to
light stimulation) showed the same pattern as the reflex
response with respect to decreasing acclimation temperature,
but cold blockage of the conditioned response always occurred
at temperatures 5-10C higher than the reflex response for a
given acclimation temperature. They concluded that primary
cold blockage occurred within the central nervous system.
Konishi and Hickman (1964) measured a midbrain spike poten
tial (evoked by electrical stimulation of the retina) of
rainbow trout under acclimation to a new temperature. Trans
fer of fish acclimated at IOC to 4C resulted in an average

20
lengthening of the responses spike (slowing down) of 39$.
This lengthening decreased with acclimation time up to 21
days when it was down to 18$ above the 10C controls. Trans
fer of the IOC acclimated fish to 16C resulted in a shortening
of the spike, but no compensatory lengthening with acclimation
time was observed. They concluded that acclimation exhibits
itself as a compensatory increase in biophysical properties
of nervous tissue at low temperatures rather than a com
pensatory decrease at higher temperatures. They acknowledged
the discrepancy between their findings and those based on
metabolic rate which reflect a compensatory decrease in oxy
gen consumption upon warm acclimation (Evans, Pardue, and
Hickman, 1962). Their results indicate independent nervous
and metabolic acclimation compensation.
Both cold and heat death in fishes have been attributed
to osmoregulatory failure. Doudoroff (1945) and Brett (1952)
found evidence of osmoregulatory failure in the cold death
of the killifish Fundulus parvipinnis (Girard) and the sockeye
salmon, Oncorhvnchus nerka (Walbaum). Heinicke and Houston
(1965a) found a marked decrease in plasma chloride and an
increase in tissue hydration accompanied heat death in the
goldfish.
Within the normal temperature tolerance zones of fishes
there is some disagreement over the relationship between tem
perature and the various aspects of osmoregulation. Hoar and
Cottle (1952) reported a direct relationship between tissue

21
water content and acclimation temperatures from 5 - 35C in
the goldfish. Heinicke and Houston (1965b) reported a slight
decrease (4-3%) in plasma chloride, and an increase (36.1%)
in plasma potassium in goldfish upon acclimation at 30C from
an initial temperature of 20C. They found no difference in
plasma sodium, tissue potassium, tissue chloride or tissue
water content. The lack of change in tissue water content
demonstrated in study is in disagreement with the previously
cited work of Hoar and Cottle (1952). Heinicke and Houston
(1965b) attributed the disagreement to incomplete acclimation
in the fish of Hoar and Cottle (1952). The time required for
complete osmoregulatory acclimation was approximately 10-12
days (except tissue water content which took approximately
three weeks to stabilize), according to Heinicke and Houston
(1965b). These authors concluded that though a change in
acclimation temperature induces initial changes in osmo
regulatory ability, upon completion of acclimation, compen
satory changes in osmoregulatory activities result in a
steady state condition virtually the same as the original
ionic status.
Parvatheswararao (1967), working with Etropus maculatus.
(Gill), reported several osmoregulatory changes upon a change
in acclimation temperature from 10 to 35C* Tissue water
content in the brain, liver, and muscle increased by 4, 6,
8, and 3% respectively. Plasma Mg and Ca increased (8
and 10% respectively), while Na^, K , and Cl decreased

22
(16, 8, and 40% repectively). Based on the effects of these
ions on cellular metabolism (Boyer, 1953; Kaye and Mommaerts,
I960; Walser, I960; Pampathi Rao, 1963) Parvatheswararao con
cluded that the observed ionic changes would tend to retard
nerve and muscle activity at the higher acclimation temperature.
This would be the expected effect of ionic changes if they
were assumed to enhance the Precht type three acclimation pre
viously discussed.
Among systemic responses to temperature, oxygen affinity
of the blood has been one of the greatest areas of interest.
Anthony (1961) reported that though high temperature accli
mation increased erythrocyte number, a compensatory decrease
in erythrocyte size gave a net result of no change in 0£ af
finity. More recent studies (Slicher and Pickford, 1968:
Houston and DeWilde, 1968; Grigg, 1969) indicated an increase
in oxygen affinity as well as erythrocyte number upon high
temperature.
Fishes are very efficient in the utilization of blood
oxygen. Itazawa (1970) demonstrated 60-80% utilization in
fish tissue as opposed to 24-34% in mammals. This is
evidenced by their ability to tolerate low oxygen concen
trations. Hubbs, Clark, and Hettler (1964) reported the
presence of Crenichthvs bailevi (Gilbert) in thermal springs
at a temperature of 37.3C and oxygen concentration of 0.9ppm.
C. bailevi showed no signs of stress and were obviously highly
adapted to their environment. However, even fishes adapted

23
to a much less stressful environment have been shown to be
tolerant of a wide range of temperature-oxygen concentration
combinations. Spitzer, Marvin and Heath (1969) found bluegill
oxygen consumption to be independent of oxygen concentration
over a wide range of concentrations at temperatures up to
25C. At 30C the oxygen consumption showed oxygen concentration
dependence as evidenced by a rapid decline in oxygen at the
lower oxygen concentrations (below 3ppm).
The Molecular Level
It has been hypothesized that enzyme systems must reflect
typical Precnt acclimation curves (Read, 1964)- This con
ceivably could be accomplished by quantitative changes in
enzymic reaction rates or by qualitative shifts in enzyme
pathways or a combination of both. Ekberg (1958) demonstrated
a qualitative enzymic change. Upon cold acclimation there
was a shift from the usual Embden Meyerhoff pathway to the
hexose monophosphate shunt in the gills of goldfish. Similar
results for che goldfish were reported by Hochachka and Hayes
(1962). Freed (1965) demonstrated a quantitative change.
Cold acclimation caused a translation to the left in the cy
tochrome oxidase rate curve but no roatation (no change in
acutely measured Q^q)* Similar results were reported by Dean
and Vernberg (1965) for carbohydrate metabolism in several
crab species.
The mechanism of such enzymic changes has been attributed
to various things. The thermostability of certain enzyme

24
systems has been shown to be positively correlated with
environmental temperature (Mutchmor and Richards, 1961;
Ushakov, Vinogradov, and Kusakina, 1962; Kusakina, 1963).
However, Ushakov and Kusakina (1962) and Freed (1964) demon
strated no correlation between acclimation temperature and
enzyme thermostability. At any rate, in all these studies
the range of enzyme thermostability far exceeded the lethal
limits for the whole organism and it is unlikely that changes
in enzyme thermostability have any direct effects in the
acclimation process.
Somero (I969) demonstrated that in some enzyme systems,
the enzyme-substrate affinity is reduced with an increase in
temperature. This would tend to decrease the reaction rate
in the compensatory fashion of Precht type three acclimation.
From the preceeding discussion it is evident that all
levels of biological organization show at least some char
acteristics of the compensatory nature of temperature
adjustment.

RESULTS
Physical and Chemical
Tradinghouse Reservoir was well mixed throughout the
year and had no chemical or thermal stratification (Table 2).
The difference between inflow and outflow temperatures
(stations 1 and 3) averaged about 9C for the year (Fig. 4).
The temperature of the main body of the reservoir was
rarely influenced by the thermal plume and was never raised
more than one or two degrees. The high conductivity of the
17 May 1972 sample was due to Brazos River water pumped in
near station 2 (Fig. 1). Conductivity was lower on 9 March
1972, due to lack of pumping and dilution from rainfall.
Alkalinity, hardness, silica, and sulfate concentrations were
typical for this area. No factors known to be detrimental
to fishes were observed.
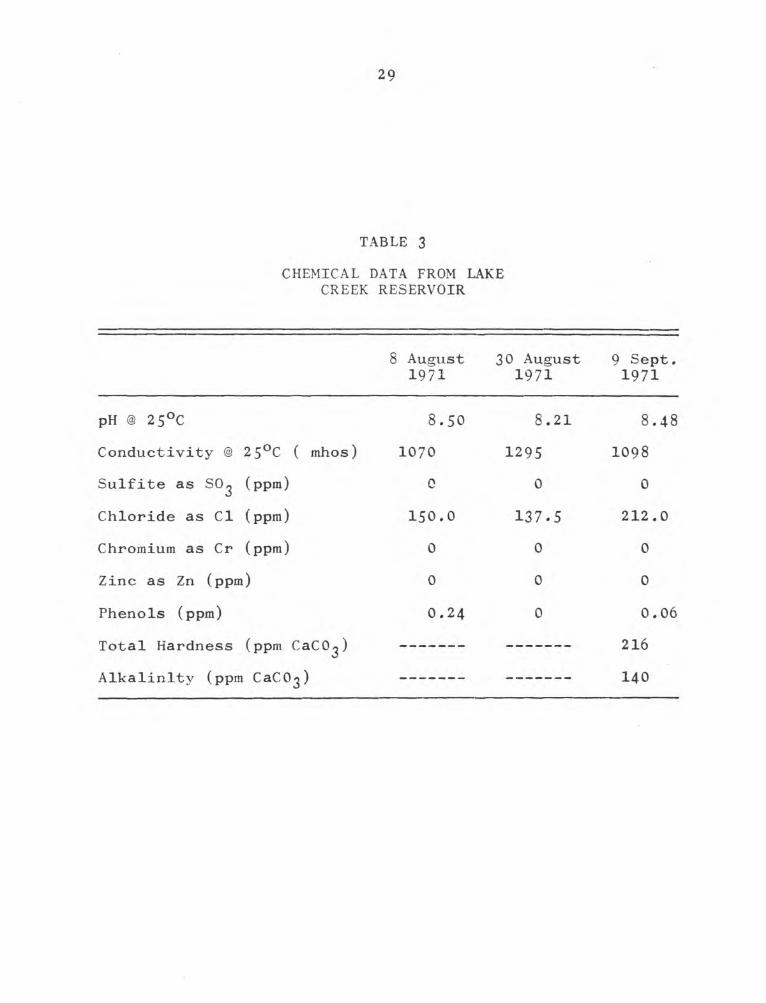
From the scant data available on Lake Creek Reservoir,
it appeared to be very similar to Tradinghouse Reservoir
(Table 3)* The temperature profiles of the discharge canals
of the two reservoirs indicated Tradinghouse P.eservoir was
at a higher temperature by about 8C throughout February 1972
(Fig. 5).
Age and Growth
The histogram and probability plot of the largemouth
black bass from samples 1 and 2 appear in Figures 6 and 1.
25

26
TABLE 2
TRADINGHOUSE RESERVOIR PHYSICAL AND CHEMICAL DATA,
B-BOTTOM; S=SURFACE
Sta Temp. Dissolved Conduc pHtion (°c) Oxygen
(ppm)tivity (itmhos )
B S B S B S B S
8 March 1971 1 11.0 11.0 11.5 12.0 — — 8.5 8.52 11.0 12.0 12.0 10.0 — — 8.7 8.73 11.0 11.0 10.0 10.0 — — 8.7 8.74 11.0 11.0 10.0 10.0 — — 8.6 8.6
12 April 1971 1 16.0 16.0 8.8 9.0 ___ ___ 8.5 8.52 17.0 18.0 9.4 9.5 — — 8.6 8.63 21.0 21.0 8.4 8.4 — — 8.6 8.54 27.0 27.0 9.0 9.0 — — 8.6 8.7
17 May 1971 1 21.5 22.5 6.8 7.4 990 990 7.4 7.42 23.5 24.0 8.8 8.7 990 920 7.6 7.63 29.0 29.0 — 8.3 — 910 — 7.84 32.5 32.5 8.5 8.3 960 980 7.8 7.8
18 Sept. 1971 1 29.0 29.0 10.0 10.0 — ... 8.6 8.52 29.0 29.0 5.8 10.0 — — 8.0 8.43 29.0 29.0 10.0 10.0 — — 8.2 8.44 33.0 33.0 9.4 9.2 — — 8.4 8.4
6 Nov. 1971 1 21.0 21.0 7.0 7.02 20.0 20.0 7.2 7.23 22.0 23.0 7.5 7.54 — 29.0 — 6.6
8 Dec. 1971 1 13.0 13.0 9.8 9.8 ... — 7.5 7.52 13.0 13.0 10.1 10.1 — — 7.5 6.3
3 14.0 14.0 10.2 10.2 — — — 7.04 — 23.0 — 9.4 — — — 7.0
27 Jan. 1972 1 — 12.3 — 10.02 — 12.5 10.0 9.8
3 ---- 14.0 — 9.8
4 — 22.0 — 9.6
9 March 1972 1 17.0 17.0 9.3 9.3 600 600 8.2 8.3
2 17.0 17.0 9.3 9.4 650 625 8.0 8.2
3 —--- 17.0 — 9.3 — 600 — 8.2
4 32.0 — 9.3 — 720 — 8.3

27
TABLE 2 (continued)
Date Sta- Alkalin- Total Si02 SO,tion ity Hardness ppm ppm
ppm CaCOo ppm CaCOo
B S B S B S B S
8 March 1971 1 140 141 224 220 1.0 1.0 — —
2 140 140 220 220 0.8 0.8 — —
3 138 140 220 224 0.3 0.3 — —
4 138 138 220 216 0.3 0.5 — —
12 April 1971 1 144 141 232 230 none 90 902 139 139 224 224 detec- 84 843 132 134 224 226 table 84 904 138 140 232 228 84 86
17 May 1971 1 134 131 224 216 1.7 1.5 97 962 126 125 216 216 1.5 1.5 98 1013 — 130 — 216 — 1.5 — 1034 125 126 224 240 1.5 1.5 103 101
18 Sept. 1971 1 106 1052 109 1073 107 1054 107 104
6 Nov. 1971 1 ___ ___ 187 181 2.5 2.3 76 642 — — 181 182 2.3 2.4 64 703 — — — 184 — 2.4 — 764 — — — 184 — 2.2 — 83
8 Dec. 1971 1 117 105 182 183 2.4 2.4 50 512 115 115 184 183 2.0 2.4 53 64
3 — 115 — 179 --- 2.1 — 554 — 115 — 182 — 2.4 — 61
27 Jan. 1972 1 ___ 110 ___ 176 — 3.0 — 592 115 110 173 172 3.0 2.7 65 453 — 100 — 174 — 2.9 — 65
4 — 115 — 173 — 3.0 — 50
9 March 1972 1 125 124 175 176 3.0 2.9 95 912 125 124 177 177 2.8 3.0 90 66
3 — 125 — 178 — 3.0 — 75
4 — 125 — 175 — 2.9 — 92

28
{*0) 3&H JLV5J3dW3±
Figure 4.
Annual temperature fluctuations in power plant intake and
discharge waters on Tradinghouse Reservoir.
29
TABLE 3
CHEMICAL DATA FROM LAKE CREEK RESERVOIR
8 August 1971
30 August1971
9 Sept. 1971
pH @ 25°C
0•
OO 8.21 8.48
Conductivity @ 2 5°C ( mhos) 1070 1295 1098
Sulfite as SO2 (ppm) 0 0 0
Chloride as Cl (ppm) 150.0 137.5 212.0
Chromium as Cr (ppm) 0 0 0
Zinc as Zn (ppm) 0 0 0
Phenols (ppm) 0.24 0 0.06
Total Hardness (ppm CaCO^) 216
Alkalinity (ppm CaCO^) 140

30
uo) 3anivy3dW3±
Figure 5*
Water temperatures of the discharge canals of
Tradinghouse Reservoir and Lake Creek Reservoir for the month of
February, 1972.

31
Figure 6. Length-frequency histogram for samples
and 2. N=95•
1
32
STANDARD LENGTH (MM)
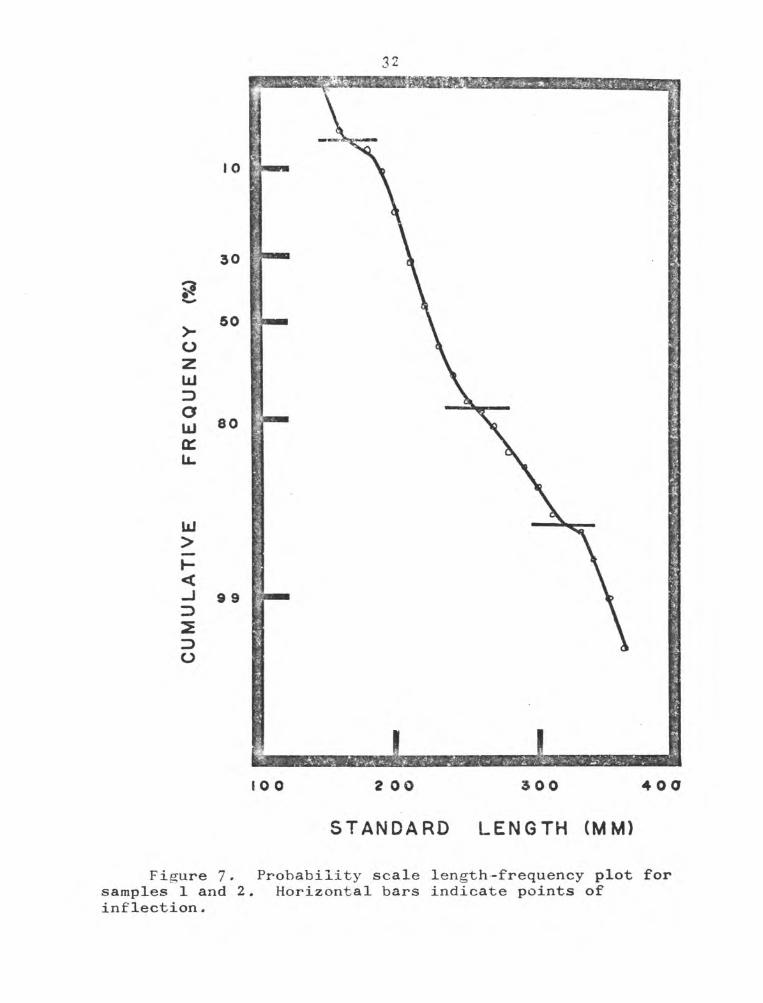
Figure 7. Probability scale length-frequency plot for samples 1 and 2. Horizontal bars indicate points of inflection.

33
Inflection points in Figure 5 are indicated by the
vertical bars. Individual size classes are replotted on an
expanded scale (Fig. 8). Mean SL for each age group are
given (■*■ 1 standard deviation). Samples 5 and 6 are treated
similarly and are shown in Figures 9, 10, and 11. On 20 May
1969, 100,000 largemouth black bass fry were stocked in
Tradinghouse Reservoir by Texas Parks and Wildlife. These
fish are represented by age group III. Age group IV did
not show up in samples 6 and 7 due to insufficient numbers
of the larger fish. The growth from early summer through
late fall (as indicated from differences in mean standard
lengths) was 35, 67, and 80mm for age groups I, II, and III
respectively.
Since samples 5 and 6 were taken in late fall, when
presumably the 1971 growth was complete, it is assumed that
the standard lengths obtained from those samples are compa
rable with back-calculated annual lengths based on scale
annulus formation. For comparison with other southern waters,
my data are converted to inches in both standard and total
lengths. The sites listed above Tradinghouse Reservoir in
Table 4 attained greater calulated lengths. The third group
contains sites varying in length among age groups with respect
to Tradinghouse Reservoir. Means for all data listed, ex
cluding Tradinghouse Reservoir, are given at the bottom.
There is no difference between each mean and that of Trading-
house Reservoir ("t" test, p< 0.05). There is no difference

34
>-OzUJ3oUJorL_
UJ>h-
<-J32
3O
IOC 200 3 00 4 0 0
STANDARD LENGTH (MM)
Figure 8. Lengtn-frequency plot for individual size classes for samples 1 and 2. The length corresponding to the 50% point is the mean length of the size class. Means are given i 1 S.D.

35
150 200 250 300 350
STANDARD LENGTH (MM)
Figure 9. Length-frequency histogram for samples 5 and 6. N=101.

36
i o o 2 0 0 300 400
STANDARD LENGTH (MM)
Figure 10. samples 5 and 6.
Probability scale length-frequency plot for Horizontal bars indicate points of inflection.

CU
MU
LATI
VE FR
EQU
ENC
Y (%
)
37
200' 300 4 00
STANDARD LENGTH (MM)
Figure 11. Length-frequency plot for individual size classes for samples 5 and 6. The length corresponding to the 50% point is the mean length of the size class. Means are given i 1 S.D.

38
TABLE 4
COMPARISON OF STANDARD SL AND TOTAL TL LENGTHS OF FIRST THREE AGE GROUPS OF LARGEMOUTH
BLACK BASS FROM TRADINGHOUSE RESERVOIR WITH VALUES REPORTED IN
THE LITERATURE (UNITS ARE INCHES)
Water State ISL TL
IISL TL
IIISL TL
L. Texoma^ Okla. 8.7 12.4 15.3L. Auburn2 Ala. 7.0 — 10.6 — 13.1 --- —
L. Auburn Ala. 6.6 — 10.3 — 13.2 —Lousiana^ La. — 7.6 — 11.3 — 14.5Grand L.4 Okla. — — — 9.9 — 13.8
Tradinghouse Tex. 5-9 7.3 7.8 9.8 10.1 12.3
L. Shawneef Okla. —__ 5.0 ____ 8.0 ____ 11.1*L. Ozarks „ Mo. — 4.8 — 7.7 — 10.5Illinois R.' Okla. — 4.6 — 7.8 — 10.4Silver L.^ „ Ala. 3.2 — 7.1 — 8.8 —
L. Claremore Okla. — 3.7 — 7.8 — 10.4**L. Ozarks® Mo. — 2.3 — 4.1 — 5.8
Chickamauga R.9 Tenn. ___ 6.9 ____ 10.5 ______ ____Silver L.^ Ala. 5-1 — 9.1 — 11.5 —Norris Res. ° Tenn. — 6.9 — 12.2 — 14.7
Mean 5.5 5.6 9.3 9.2 11.2 11.8
See appendix for numbered footnotes. *1933-1935; **1936-1938.

39
in growth increment (difference in length between size classes)
between the Tradinghouse Reservoir values and the literature
means ("t" test, p<0.05) (Table 5).
Organ Weights
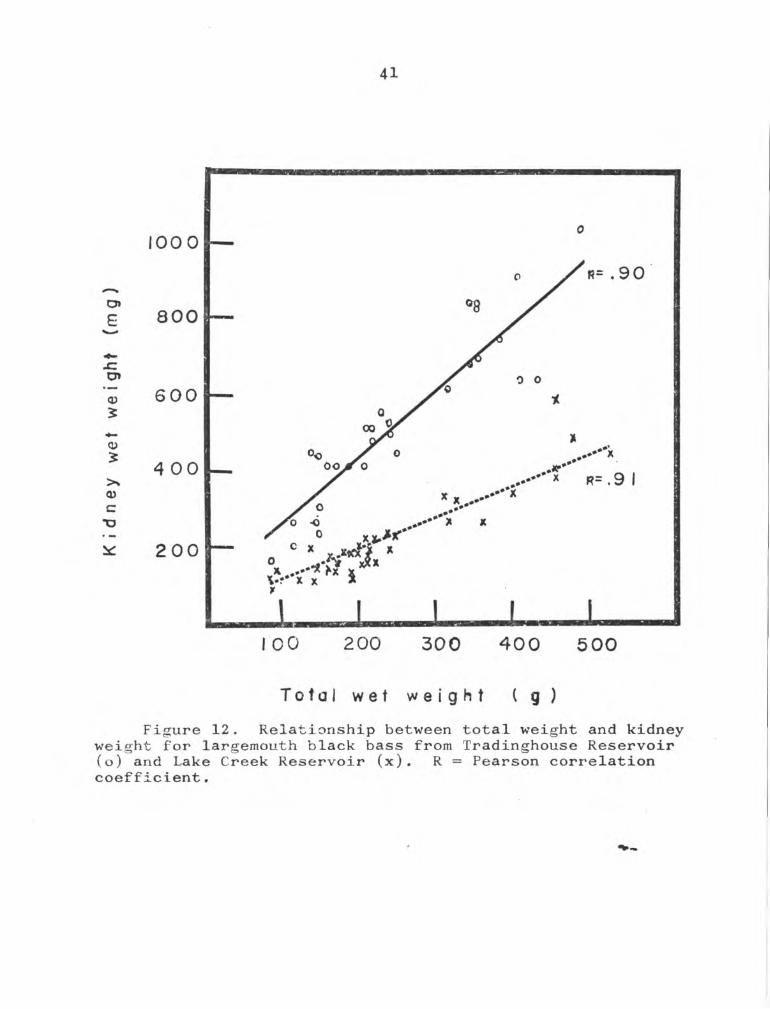
Liver, kidney, and spleen weights were each signifi
cantly smaller with respect to total weight in Lake Creek
Reservoir than in Tradinghouse Reservoir ("t" test, p<0.05)
(Figs. 12-14). These results suggest that the largemouth
black bass of Lake Creek Reservoir were in a state of in
creased physiological activity compared with the largemouth
black bass of Tradinghouse Reservoir. Kidney weights were
closely related to bod}' weight whereas spleen weight had con
siderable scatter. The reason for this difference is unknown.
Gonosomatic Index and Egg Number
Gonad comparisons between largemouth black bass from
Lake Creek Reservoir and Tradinghouse Reservoir discharge
canals indicate there was no difference between either male
or female G.S.I. means or between mean egg numbers per gram
of fish for the two reservoirs (Table 6). Thus there was no
indication of differing gonad maturation rates in the large
mouth black bass of Tradinghouse Reservoir and Lake Creek
Reservoir.
Thyroid Activity
There was no difference among the mean thyroid epi
thelium heights of bass from Tradinghouse Reservoir, Lake

40
TABLE 5
COMPARISON OF GROWTH BETWEEN FIRST, SECOND, AND THIRD YEAR CLASSES OF LARGEMOUTH BLACK BASS FROM TRADINGHOUSE RESERVOIR AND
THE MEAN OF THE VALUES REPORTED IN THE LITERATURE
Water I —— II II --- Ill
#SL TL SL TL
Tradinghouse 3.4 4.0 3.3 3.6
Mean co
% oo 3.6 1.9 2.6
-"-SL = standard length, TL = total length in inches.
TABLE 6
COMPARISON OF MALE AND FEMALE G.S.I. AND EGG NUMBER FOR LARGEMOUTH BLACK BASS FROM
TRADINGHOUSE RESERVOIR AND LAKE CREEK RESERVOIR
Male -"-G
(%).S.I. Female G.S.I.
(%)-"--‘Egg Number Per Gram XIO^
Tradinghouse .127 - .031 .569 t .221 .108 i .090
Lake Creek .139 t .051 .380 + .147 .122 ± .103
-"-G.S.I. (gonosomatic index) = gonad weight (g)total weight (g) *
-"-"-Egg number = total number of eggstotal weight (g) 1 SD
• d n ey wet we i ght (m g )
41
Total wet weight l g)
Figure 12. Relationship between total weight and kidney weight for largemouth black bass from Tradinghouse Reservoir (o) and Lake Creek Reservoir (x). R = Pearson correlation
coefficient.

LIVE
R WE
T WEI
GH
T (G)42
TOTAL WET WEIGHT (G)
Figure 13. Relationship between total weight and liver weight for largemouch black bass from Tradinghouse Reservoir (o) and Lake Creek Reservoir (x). R = Pearson correlation
coefficient.

SPLE
EN WET
WEIG
HT (M
G)
43
TOTAL WET WEIGHT (G)
Figure 14- Relationship between total weight and spleen weight for largemouth black bass from Tradinghouse Reservoir (o) and Lake Creek Reservoir (x). R = Pearson correlation coefficient.

44
TABLE 7
MEAN EPITHELIUM HEIGHTS OF THYROID FOLLICLES OF LARGEMOUTH BLACK BASS FROM THE DISCHARGE CANALS OF TRADINGHOUSE RESERVOIR AND
LAKE CREEK RESERVOIR AND 3 MUSEUM SPECIMENS. N = NUMBER OF FISH
EXAMINED IN EACH CASE
Source CollectionDate
N Mean (± 1 S.D.)
Epithelial Height (M)
Tradinghouse 28 Feb. 1972 20 1.2 t 0.4
Lake Creek 27 Feb. 1972 20 1.4 t 0.6
Museum March 1972 1 1.2 t 0.7
Museum July 1968 1 0.8 + 0.7
Museum Aug. 1970 1 0.7 ± 0.6

45
Creek Reservoir, or the three museum specimens (Table 7).
All tissue examined had anatomical evidence of low thyroid
activity. The epithelium was low cuboidal and the follicles
were spherical. The June and August museum specimens ex
hibited complete hypertrophy, as evidenced by a lack of
follicular colloid and near squamous follicular epithelium.
K Value
There was no significant difference among the mean
("t" test, p<0.05) K values for the fish taken from the dis
charge canals of the Tradinghouse Reservoir and Lake Creek
Reservoir and from the main body of Tradinghouse Reservoir
(Table 8).
TABLE 8
MEAN K FACTORS (COEFFICIENT OF CONDITION)FOR LARGEMOUTH
USED INBLACK BASS GROUPS THIS STUDY
K
Tradinghouse Canal 0.252
L. Creek Canal 0.248
Tradinghouse Lake 0.266

DISCUSSION
Physical and Chemical Characteristics
of Tradinghouse Reservoir
One of the important physical characteristics of Trading-
house Reservoir is the absence of both summer and winter
thermal stratification. However, this is not unique to
Tradinghouse Reservoir among other central Texas reservoirs.
ICimmel (1968) reported a similar condition in Lake Waco. He
attributed the condition to shallowness and the lack of wind
protection. Drew and Tilton (1968) suggested that continuous
mixing is characteristic of Texas reservoirs receiving power
plant effluents. They further suggested that the increased
nutrient availability caused by such continuous mixing was
responsible for retarding the characteristic decline in sport
fishing that is seen in non-thermally influenced water. This
does not appear to be all that is involved in view of the fact
that good largemouth black bass fishing failed to ever develop
in continuously mixing Lake Waco (Chen, 1969)*
Though the total ion concentration, as measured by con
ductivity in Tradinghouse Reservoir, is somewhat high (990
pmhos) at times, this probably plays a relatively minor role
in the growth of largemouth black bass. Indirectly, however,
these ions may contribute to largemouth black bass growth by
stimulating primary production which can lead to a generally
more productive ecosystem.
46

47
Growth
The growth of largemouth black bass in Tradinghou.se
Reservoir is average compared with the literature reviewed
for other southern waters. The estimated condition factor
("K") of 0.266 is somewhat higher than the 0.245 (average for
first three age groups) values reported by Stroud (1948) for
the largemouth black bass of Norris Reservoir (Tennessee).
Growth of bass in Norris Reservoir and Tradinghouse Reservoir
(somewhat higher in one age class and lower in two age classes-
see Table 4) were very similar. Cooper, Hidu, and Anderson
(1963) demonstrated a correlation between growth rate and the
"K" factor in largemouth black bass. If this were true for
Tradinghouse and Norris Reservoirs, it further indicates that
Tradinghouse Reservoir lies near the center of the range of
growth reported in the literature.
The complex interrelationships between growth and tem
perature have been recently reviewed by Paloheimo and Dickie
(1966). By reworking the data of many investigations and
fitting them to a common equation, they found good agreement
(for values relating total metabolism, weight, and ingestion)
between studies based on food consumption and those based on
the measurement of total metabolism. An increase in tempera
ture will cause an increased metabolism for a given size fish
without changing the slope of a line describing the relation
ship between weight and metabolism. An increased metabolism
might cause an increase in feeding rate which in turn could

48
lead to greater growth.
There have been many field studies relating environ
mental temperatures to growth in fishes. For example, mean
annual temperature has been positively correlated with growth
in smallmouth bass dolomieui
1959; Latta, 1963). Kramer and Smith (i960) found the annual
growth in largemouth black bass to be correlated with the
temperature experienced up to the first day of August (when
growth ceased in Minnesota). Coble (1967) found conflicting
results on the relation of annual temperatures to growth in
smallmouth bass, but it seemed that the growth of the older
fish was the least affected by environmental temperature.
Kramer and Smith (i960) found the growth rates of largemouth
black bass embryos, fry, and fingerlings to be positively
correlated with temperature. Strawn (1961), also working with
largemouth black bass fingerlings, found increased growth with
temperature increases up to 30C, but a decrease at 32.5C.
Largemouth black bass of Tradinghouse Reservoir could
conceivably move in and out of the thermally affected portions
of the reservoir and thus increase their mean annual temper
ature. Drew and Tilton (1970) noted that the largemouth black
bass in thermally affected Texas reservoirs migrate into
warmer waters in the winter months and leave during the hot
summer months. This type of migration was confirmed in this
study through a number of conversations with local fishermen.
The extent of this type of migration throughout Tradinghouse

49
Reservoir is unknown. Radio-tagging and tracing of fish
movement with relationship to the thermally affected portion
of the reservoir would help establish the significance of the
thermal effluent with respect to the mean annual temperature
experienced by the "average fish."
Though temperature obviously plays an important role in
the control of bass growth, especially in the young, there are
many other factors involved as well. Pardue and Hester (1961),
working with experimental largemouth black bass populations
under a variety of conditions, demonstrated a range of varia
tion in the first year's growth of 1.9X-20.3X (factor relating
smallest fish to largest fish). The variation was positively
correlated with population density and negatively correlated
with rate of growth.
Since Tradinghouse Reservoir is a relatively young res
ervoir, it is doubtful that it has developed a high density
largemouth black bass population; thus an average or above
growth rate would be expected. This was demonstrated in the
comparison of bass growth in Tradinghouse Reservoir and other
southern waters.
One unusual aspect of the growth data presented in this
study is the increasing growth increment with increasing age
groups (Tables 4 & 5)- This can only be explained by the
presence of conditions which favored the growth of the larger
fish of this study. Such a situation might be brought about
by an unusual condition of food availability. When

50
Tradinghouse Reservoir was first stocked (the age group II
fish of this study), there were probably good feeding con
ditions for young largemouth black bass. Young largemouth
black bass eat primarily nauplii, rotifers, cladocerans, and
occassionally algae. At about 30mm they shift to large
cladocerans, immature and adult insects, and some small fish
(Kramer and Smith, I960). These kinds of organisms would be
expected to abound in water over fertile, newly inundated,
land. As the lake has grown older these food items may have
decreased in density under heavy grazing. Gill net surveys
indicate Tradinghouse Reservoir presently has an unusually
abundant (as high as 22% by weight of total catch) shad
population (Lind and Venables, unpubl. data). This large
food source is unavailable to the smaller fish of this study.
Thus, under the preceeding conditions, there is a situation
which is highly favorable for the older (age groups II and
III) fish of this study.
Similar situations are presented in Table 4» Lake
Shawnee (Oklahoma) has growth increment of 3.0 and 3.1 be
tween age groups I-II and II-III, respectively. The two
studies on the Lake of the Ozarks (Missouri) show almost
identical growth increments between age I-II and II-III
(2.9-2.8 and 1.8-1.7).
Despite the evidence for the influence of temperature
on growth related rate functions, temperature effects in
Tradinghouse Reservoir are probably masked by density
51
dependent factors (especially availability of food). The
growth of largemouth black bass in Tradinghouse Reservoir is
apparently within the limits of variation expected from
such density dependent factors.
Gonosomatic Index and Egg Number
There are numerous studies relating gonad maturation
to environmental temperature. This might be expected from
the general increase in rate functions that accompany in
creased temperature as previously discussed. However,
photoperiod effects and hormonal involvement complicate the
temperature relationship with gonad maturation rate.
Bullough (1939) reported that both temperature and
photoperiod regimes had to be right for spawning in
Nortropus cornutus (Agassiz). Courier (1922) reported that
the correct temperature alone was necessary for spawning in
the threespine stickleback, Gasterosteus aculeatus (linnaeus).
Berenbeim (1968 and 1970) demonstrated a high correlation
between mean annual temperature and the onset of spawrning
in several marine fishes. Billard (1968) found that in
creasing temperatures from 20-30 C caused an increase in
spermatogenesis in the guppy, Poeci11a reticulata. Wiebe
(1968), on the other hand, found increasing both temperature
and photoperiod were necessary to increase spermatogenesis
and oogenesis in the sea perch. Schneider (1969) found that
increased temperature accelerated gametogenesis in both male
and female threespine sticklebacks, when exposed to long
BAYLOR UNIVERSITY LIBRARY

52
photoperiods. Exposure to short photoperiods at the same
temperature resulted in a cessation of gametogenesis. Low
temperatures decreased gametogenesis regardless of the photo
period regime. It appears from the preceding that while
increasing temperature can increase the rate of gametogenesis,
photoperiod ultimately sets the limits on the time period
over which gametogenesis occurrs.
The results of this study indicate that there was no
difference in gonad maturation rates of the largemouth black
bass from the two canals. This is in spite of the fact that
the fish from the Tradinghouse Reservoir canal had been ex
posed to temperatures averaging 8-10C higher for a month
prior to the study. This supports the primacy of photoperiod
in governing gonad maturation rate, in that the photoperiod
regime was common to both canals.
Though there was no difference in the gonad maturation
rates of the fish from the two canals, the maturation rate of
the canal fish may have been different from the rate of bass
from waters unaffected by thermal effluent. Thus it is pos
sible that, though the temperature difference between the two
canals had effects too subtle to detect, the increased temper
ature of both canals may have significantly altered the gonad
maturation from the rate at "normal” temperatures for this
area. Unfortunately, I was unable to find any data to test
this hypothesis.

53
Organ Weight. Analysis
The results of the organ weight analysis in this
study indicated a higher rate of physiological activity in
the largemouth black bass from Lake Creek Reservoir discharge
canal than in the Tradinghouse Reservoir discharge canal.
This is based on the assumption that the relationship between
organ weight and physiological activity demonstrated for other
fishes (Albrecht, 1969; Peak, 1970; DeWaide, 1970) is valid
for largemouth black bass. The basis for the relationship
lies in the fact that increased temperature generally results
in increased activity as previously discussed. The increased
activity causes a shunting of blood from the viscera to the
musculature to provide the extra energy needed. This causes
a decrease in organ weights. It seems, then, that this re
lationship would hold for any fish within temperature limits
that allow for increasing activity with increased temperature.
While other factors (diet, salinity, etc.) could affect the
relationship between organ weights and total weight, it is
unlikely that any factor other than a general loss of blood
(through shunting) would effect all three organ weights as
was demonstrated in this study. Assuming the validity of the
above relationship for largemouth black bass, this study dem
onstrated that though the fish of the Tradinghouse Reservoir
canal were at a higher temperature (and had been so for at
least a month prior to capture), they exhibited a rate of
physiological activity lower than that exhibited by the fish
54
from the cooler Lake Creek Reservoir discharge canal. This
can be interpreted a number of ways.
The largemouth black bass from Tradinghouse Reservoir
canal might be better acclimated to warm temperatures than
those of the Lake Creek Reservoir canal. If this were the
case, they might be exhibiting typical Precht type 3 compensa
tion (see section on Temperature Adjustment) allowing a de
crease in physiological activity even at the higher temperature.
However, this seems unlikely due to the fact that there is
no reason for Tradinghouse Reservoir fish to be any better
acclimated to their warmer water temperature than for Lake
Creek Reservoir fish to be acclimated to their somewhat cooler
temperature. In fact, it might be expected that the Lake
Creek Reservoir fish would be better adapted for warm water
acclimation due to their longer history of exposure to the
power plant effluent.
If the fish from Lake Creek Reservoir are assumed to be
better acclimated to warm water temperatures, then their in
creased physiological activity (over that of the fish of
Tradinghouse Reservoir) would logically be viewed as an ex
ample of inverse compensation (Precht type 5 acclimation).
This type of compensation is typified by an increase in ac
tivity upon an increase in temperature (after the initial
rate increase upon the temperature change) as the animal
acclimates.
Inverse temperature compensation seems to be an excep
tion rather than the rule in poikilotherms. Fry (I964)

55
noted that tissues generally show expected temperature
compensation (Precht type 3) but whole animals may not due
to various behavioral effects. These behavioral effects
include swimming activity and thus could be responsible for
the results obtained in this study. However, the scarcity
of reports of inverse compensation make this explanation
doubtful.
There is a third explanation of the results. As stated
earlier, one of the prerequisites for the validity of a re
lationship between organ weights and temperature, is that the
animal must be within temperature limits that allow for in
creased activity with increasing temperature. It seems
likely that the largemouth black bass of Tradinghouse Reservoir
canal were beyond the upper end of such limits. Charlton (I960)
reported that the scope of activity (difference between active
and basal metabolic rates) for largemouth black bass increased
from 10-20C and leveled off from 20-30C (30C was highest tem
perature tested). He reported the maximum cruising speed
was at 25C. Beamish (1970) reported increase maximum sustained
swimming speed increased with temperature increases up to
30 C, then decreased at 34C. From the preceeding it seems
likely that largemouth black bass from Tradinghouse Reservoir
canal, which experienced temperatures above 30C for much of
the month preceeding capture, were in a temperature zone of
decreasing activity. Since the fish from the Lake Creek Res
ervoir discharge canal had been exposed to much lower

56
temperatures and were probably not in such a zone of de
creasing activity, this would adequately explain the larger
organ weights of the Tradinghou.se Reservoir discharge canal
fish sample.
This last explanation seems to best explain the results.
It is likely that rather than demonstrating a greater degree
of thermal acclimation in either of the two fish groups, the
study demonstrates that the largemouth black bass of Trading-
house Reservoir canal are in a temperature zone which
disallows the greatest activity.
Thyroid Analysis
The results of the thyroid analysis indicated that there
was no difference in thyroid activity between the fish col
lected from Tradinghouse Reservoir canal and those collected
from the Lake Creek canal. This indicates that the thyroid
activity of the largemouth black bass is independent of water
temperature. Further, it indicates that thyroxin (TH) probably
plays no role in temperature acclimation. There are, however,
other ways to interpret the results.
The basis for the anlysis of thyroid activity in this
study was the measurement of follicular epithelium height.
V7ith the advent of radio-iodine techniques, there has been
concern over disagreement between the two techniques.
Drury and Eales (1968) reported 3 groups of studies
showing positive, negative and no correlation of thyroid
57
activity (as based on epithelial height of the follicle) to
temperature; however, they concluded that thyroid activity,
as measured by the uptake and release of radio-iodine, in
creases with increased temperature. Eales (1964) suggested
that thyroid epithelial height is regulated primarily by
levels of thyroid stimulating hormone (TSH), mediated through
the pituitary. The uptake and release of radio-iodine is
independent of the pituitary and can lower the TSH-TH ratio
in a situation with rising TH (due to increased temperature)
and decreasing TSH. The consequence would be high thyroid
activity with low follicular epithelium.
If the preceeding is a valid mechanism, the fish used
in this study could have had active thyroid secretion, at
levels the same or different from each other. Accordingly,
the August museum specimen, though also captured in warm
water (undoubtedly it was collected at a temperature in the
range represented by the canals), showed very low follicular
epithelium and other signs of atrophy due to photoperiod
changes. The March museum sample, even though collected in
water much cooler than the canal temperatures, had follicular
epithelium very similar to the canal samples, again indicating
the influence of photoperiod on epithelium height.
It seems likely that photcperiod acts through the brain-
pituitary axis to regulate follicular epithelium height. The
combined effects of temperature and photoperiod operate in the

58
manner described above by Eales (l‘^64j with TH secretion rate
being governed by temperature within the limits of follicular
capability as established by the photoperiod.

CONCLUSION
From the preceeding discussion it is evident that the
addition of thermal effluent from power plants on Tradinghouse
Reservoir and Lake Creek Reservoir has had no outstanding
effects on the bass populations of the reservoirs. This is
due primarily to two characteristics of largemouth black bass.
The first characteristic is the mobility of the largemouth
black bass populations. As stated earlier, the largemouth
black bass tend to move in and out of the thermally affected
areas of the reservoir seasonally. Within the limits of the
availability of food, they are at liberty to choose preferred
temperatures or to avoid detrimental temperatures. One of
the most important questions yet to be answered is, how much
time does what percentage of the reservoir's largemouth black
bass population experience abnormally high temperatures? This
physical link between the hot water and the object of study
must be established with much more precision. Only then can
the mean annual temperature of the 11 argemouth black bass (not
the discharge canal or the open water or some other arbirtrarv
location) be determined and begin to have significance with
relation to growth. Bennett (1971) has taken an important
step in this direction. He took body temperatures of large
mouth black bass in an artificially heated reservoir and tried
to correlate the body temperatures to the coefficient of
59

60
condition. Though he found no such correlation, he was
measuring the only biologically significant temperature.
The second characteristic is the eurythermicity of
largemouth black bass. As discussed earlier, increased tem
perature may result in changes in enzyme-substrate affinity,
enzyme pathways, ionic regulation, blood affinity for oxygen,
neural and muscular activity. All the preceeding in turn
contribute to the sum of effects on total metabolism which in
turn affects food conversion efficiency and thus growth.
Thus fish subjected to an increase in temperature would
be expected to show an initial general increase in activity.
As the animal acclimates, this increase might be eventually
partially compensated for by all the various compensatory
mechanism previously discussed. Decreased enzyme-substrate
affinity in conjunction with quantitative and/or qualitative
changes in enzymatic rates and pathways would be expected.
The increased oxygen demands brought about by increased ac
tivity would be met with increases in erythrocyte number and
oxygen affinity of the blood. Neural and muscular activity
rates would gradually decrease as impeding ionic shifts occurred.
While this compensation is never complete, it greatly extends
the temperature zone in which the animal can live and grow.
Largemouth black bass have the ability to withstand a
wide range of environmental temperatures. Their eurythermicity
is demonstrated by the zone of tolerance shown in Figure 15*
The tolerance value of 965C^ is the 19th highest in a list of

LETH
AL TEMPE
RA
TUR
E (C)
61
ACCLIMATION TEMPERATURE (C)
Figure 15- Zone of tolerance for largemouth black bass. Dotted lines indicate interpolations; data from Brett (1956).

62
23 fishes given by Brett- (1956). The upper incipient lethal
temperature of 36.4C is well above the hottest temperatures
encountered in Tradinghouse Reservoir. Drew and Tilton (1970)
reported survival of largemouth black bass after temporary
exposure to temperatures as high as 39C. Even preferred tem
peratures for largemouth black bass can be relatively high.
Dendy (1948) reported temperature preference in Norris Reser
voir (Tennessee) to be 26.6-27.7C, but Fry (1950) gave a final
preferedum value of 30-32C.
The highest temperatures encountered by largemouth
black bass in Tradinghouse Reservoir during the course of
this study are not close to lethal levels and are even in the
range of preferred temperature according to Fry's preferendum.
It is not surprising then that the indicators used in this
study showed few signs of stressful thermal influence in view
of the various compensatory mechanisms discussed which are
operable within thermal zone of tolerance. Though one inter
pretation of the organ weight analysis suggested that the
fish in Tradinghouse Reservoir discharge canal were in a tem
perature zone of decreasing physiological activity, it seems
unlikely from the preceeding discussion that the temperatures
experienced were greatly stressful.
One of the greatest possible threats of artificially
heated reservoirs comes not from the upper end of the temper
ature scale, but from the lower. As can be seen from the
zone of tolerance polygon for largemouth black bass, the lower
63
lethal temperature increases considerably with increasing
acclimation temperature. Power plants often abruptly drop
the temperature of the discharge canal when they shut down
for repairs or are under low load conditions. As Brett (1956)
pointed out, while acclimation to warm temperature is re
latively rapid (hours), acclimation to low temperatures can
take weeks. Thus, it is possible to conceive of a situation
where winter bass acclimated to summer temperatures might
suddenly be exposed to lethaly cold winter temperatures.
As cited repeatedly there is much not yet understood
about the relationship of temperature to the various levels
of biological organization. Only through continued mon
itoring of such systems can we hope to gain insight into
their internal functional relationships, and thereby wisely
manage the addition of thermal effluents to our natural
waters

APPENDIX
1. Snead, K. E. and W. H. Thompson. 1950* The age
growth of white crappie and largemouth black bass
in Lake Texoma, Oklahoma. Fisheries Mgt. Rep.
No. 19, Oklahoma Fisheries Experiment Station:
32(Mimeo).
2. Padfield, J. H. 1951* Age and growth differentiation
between the sexes of the largemouth black bass,
Micropterus salmoides (Lacepede). J. Term. Acad.
Sci. 26:42-54.
3. Bennett, G. 1937. The growth of the largemouthed
black bass. Huro salmoides (Lacepede), in the
waters of Wisconsin. Copeia, 2:104-118.
4. Thompson, W. H. 1950. Investigations of the fisheries
resources of Grand Lake. Fisheries Mgt. Rep. No.
18, Oklahoma Fisheries Experiment Station: 46(Mimeo).
5. Thompson, W. H. 1949. Fisheries investigation of
Lake Shawnee. Fisheries Mgt. Rep. No. 13, Okla
homa Fisheries Experiment Station: 13(Mimeo).
6. Weyer, A. E. 1940. The Lake of the Ozarks: a problem
in fishery management. Prog. Fish Cult., U. S.
Fish and Wildlife Service Memo, 51:1-131*
7. Leonard, E. M. and R. M. Jenkins. 1954* Growth of
basses of the Illinois River, Oklahoma. Proc.
64

65
Okla. Acad. Sci. 53:21-29.
8. Jenkins, R. M. 1951- A fish population study of
Clarmore City Lake. Proc. Okla. Acad. Sci.
31:84-93.
9. Eschmeyer, R. W., R. H. Stroud, and A. M. Jones. 1944-
Studies of the fish population on the Shoal area
of a TVA main-stream reservoir, J. Tenn. Acad.
Sci. 19(1):70-122.
10. Stroud, R. H. 1948. Growth of the basses and black
crappie in Norris Reservoir, Tennessee. J. Tenn.
Acad. Sci. 23:31-91.

LITERATURE CITED
Albrecht, M. 1969. Spleen and kidney mass—a measure of
physiological activity of the carp. Z. Fisherei; NF
Band 17 Heft 1-4:70-100.
Anthony, E. H. 1961. Oxygen capacity of goldfish (Carassius
auratus) in relation to thermal environment. J. Exp.
Biol. 38:93-107.
Bardach, J. E. and R. G. Bjorklund. 1957. The temper
ature sensitivity of some American freshwater fishes.
Amer. Natur. 91(859):233-2Si-
Beamish, F. W. H. 1964. Respiration of fishes with special
emphasis on standard oxygen consumption, II. Influ
ence of weight and temperature on respiration of
several species. Can. J. Zool. 42:177-188.
Beamish, F. W. H. 1970. Oxygen consumption of largemouth
bass, Micropterus salmoides, in relation to swimming
speed and temperature. Can. J. Zool. 48:177-188.
Bennett, D. H. 1971* Preliminary examination of body
temperature of largemouth bass, Micropterus salmoides,
in artificially heated reservoirs. Arch. Hydro. Biol.
68(3):376-381.
Berenbeim, D. Ya. 1968. Effects of water temperature on
the swimming seasons of marine fishes within the
limits of their habitat. Second Inti. Oceanogr. Congres
Summ. of Repts. (U.S.S.R.) 35- Biol. Abs., 49:60288.

67
Berenbeim, D. Y. 1970. The effect of water temperature on
the spawning time of the Atlantic and Pacific mackerel.
Tr. Kaliningrad. Tckh. Inst. Ryb. Prom. Khoz. (U.S.S.R.).
Biol. Abs., 51:53070.
Billard, R. 1968. Influence of temperature on the duration
and efficacy of the spermatogenesis of the guppy,
Poecilla reticulata. C. R. Hebd. Seances Acad. Sci.
Ser. D. Sci. Natur. (France), 266,2287 Biol. Abs.,
50:125073.
Boyer, P. D. 1953- The role of potassium and related cations
in the action of pyruvic phosphoferase and other enzymes.
J. Lancet. 195-196.
Brett, J. R. 1956. Some principles in the thermal require
ments of fish. Quart. Rev. Biol. 31(2):731-1741.
Brett, J. R. 1967. Swimming performance of sockeye sal
mon (Oncorhvnchus nerka) in relation to fatigue time
and temperature. J. Fish. Res. Board Can. 24(8):1731-
1741.
Bull, H. D. 1936. Studies in conditioned responses of fish.
VII. Temperature perception in Teleosts. J. Mar. Biol.
Ass. U. K. 21:1-27.
Buliough, W. S. 1939. A study of the reproductive cycle in
the minnow in relation to its environment. Proc. Zool.
Soc. (London). 109:79-102.
Cassie, R. M. 1954. Some uses of probability paper in the
analysis of size frequency distributions. Australian
68
J. Mar. and Freshwater Res. 5(3):513-522.
Chen, T. H. 1969 • Age and growth of the white crappie,
Po moxis annularis. in Lake Waco, Texas. M.S. Thesis.
Baylor Univ. 64 P.
Coble, D. W. 1967. Relationship of temperature to total
annual growth in adult smallmouth bass. J. Fish. R.es.
Board Can. 24(1):87-99 -
Cooper, E. L., H. Hidu, and J. K. Anderson. 1963. Growth
and production of largemouth bass in a small pond.
Trans. Amer. Fish. Soc. 92:391-400.
Courier, R. 1922. Sur 1'indepandce do la glande seminale
et des caracteres sexveles seconaires chez les
poissons. C. R. Acad. Sci. (Paris.) 174-70.
Dean, J. M. and F. J. Vernberg. 1965- Effects of tem
perature acclimation on some aspects of carbohydrate
metabolism in decapod Crustacea. Biol. Bull. 129(1):
87-94.
DeWaide, J. H. 1970. Species differences in hepatic drug
oxidation in mammals and fishes in relation to thermal
acclimation. Comp. Gen. Pharm. 1(3)•375-385.
Doudoroff, P. 1945. The resistance and acclimitization of
marine fishes to temperature changes. II. Experiments
with fundulus and atherinops. Biol. Bull. 88(2):194-
206 .Drew, H. R. and J. E. Tilton. 1970. Thermal requirements
to protect aquatic life in Texas Reservoirs. J. Water
Pollut. Contr. Fed. 43(4):562-572.

69
Drury, D. E. and J. G. Eales. 1968. Influence of temper
ature on histological and radiochemical measurements
of thyroid activity in the eastern brook trout,
Salvilinus fontinalis M. Can. J. Zool. 46(l):l-9.
Eales, F. G. 1964- The influence of temperature on thyroid
histology and radio-iodine metabolism of yearling
steelhead trout, Salmo gairdneri. Can. J. Zool. 42:
829-841.
Ekberg, D. R. 1958. Respiration in tissues of goldfish
adapted to high and low temperatures. Biol. Bull.
114(3):308-316.
Evans, R. M., F. C. Pardue, and C. P. R. Hichman, Jr.
1962. The effect of temperature and photoperiod on
the respiratory metabolism of rainbow trout (Salmo
gairdnerrii). Can. J. Zool. 40:107-188.
Freed, J. 1965* Changes in activity of cytochrome oxidase
during adaptation of goldfish to different temperatures.
Comp. Biochem. Physiol. 14:651-659*
Fry, F. E. J. 1950a. Effects of the environment on animal
activity. Univ. Toronto Stud. Biol. Ser. 55:1-62.
--------- . 1950b. Temperature preference and cruising speed
of largemouth and smallmouth bass in relation to accli
mation temperature. Graphs in Ontario Fisheries Research
Laboratory Library, Toronto; no date.
--------- . 1957. Temperature compensation. Ann. Rev. Physiol.
20:207-224.

7o
--------- . 1964» Animals in aquatic environments: Fish.
715-728. In: D. B. Dill, Handbook of physiology. Amer.
Physiol. Soc. Was., D. C.
Garside, E. T. and J. S. Tait. 1958. Preferred temperature
of rainbow trout and its unusual relationship to accli
mation temperature. Can. J. Zool. 36:563-567*
Greer, G. L. and D. R. Gardner. 1970. Temperature sensitive
heurons in the brain of the brook trout. Science 169:
1220-1222.
Grigg, G. C. 1969. Temperature induced changes in the oxygen
equilibrium curve of the blood of the brown bullhead,
Ictalurus nebulosus. Com. Biochem. Physiol. 28:1203.
Hammel, H. T., S. B. Stroinme, and K. Myhre. 1969. Fore
brain temperature activates behavioral thermoregulatory
response in arctic sculpins. Science 165:83.
Heineke, E. A, and A. H. Houston. 1965a. A note on water
balance in the goldfish, Carassius auratus L., during
lethal heat shock. Can. J. Zool. 30:49-54.
------ —. 1965b. Effect of thermal acclimation and sub-
lethal heat shock upon ionic regulation in the goldfish,
Carassius auratus L. J. Fish. Res. Board Can. 22(6):
1455-1470.
Hoar, W. S. and M. K. Cottle. 1952. Some effects of tem
perature acclimatization on the chemical constitution
of goldfish tissues. Can. J. Zool. 30:49-54.
Hochachka, P. W. and I. R. Hayes. 19o2. The effect of

71
temperature acclimation on pathways of glucose metab
olism in trout. Can, J. Zool. 40(2):261-270.
Houston, A. H. and M. A. DeWilde. 1968. Thermoacclimatory
variation in the haematology of the common carp,
Cyprinus carpio. J. Exp. Biol. 49:71.
Hubbs, C. and W. F. Hettler. 1964. Observation on tolerance
of high temperatures and low dissolved oxygen in natural
waters by Crenichthys baileyi. Southwest. Natur. 9(4):
245-248.
Itazaw, Yaso. 1970. Characteristics of respiration of fish
considered from the arterio-phenus difference of oxygen
content. Bull. Jap. Soc. Sci. Fish. 36(6):571-577•
Javaid, M. V. and J. M. Anderson. 1967. Thermal acclimation
and temperature selection in Atlantic salmon, Salmo
salar, and rainbow trout, S. gairdneri. J. Fish. Res.
Board Can. 24(7):1501-1503.
Johnson, M. G. and W. H. Charlton, i960. Some effects
of temperature on the metabolism and activity of the
largemouth bass, Micropterus salrnoldes. (Lacepede).
Prog. Fish-Culturist. 22(4):155-163 -
Kaye, L. and W. F. H. M. Momaerts. i960. The role of calcium
ions in the acceleration of the resting gycosis by ex
tracellular potassium. J. Gen. Physiol. 44:405-413*
Kimmel, B. L. 1969. Phytoplankton production in a central
Texas reservoir. M.S. Thesis. Baylor Univ. 113p.
Konishi, J. and C. P. Hickman. 1964• Temperature acclimation

72
in the central nervous sytem of rainbow trout. Comp.
Biochem. Phj^siol. 13:433-442 .
Kramer, R. H. and L. L. Smith. I960. First year growth of
largemouth bass, Micropterus salmoides, and some related
ecological factors. Trans. Amer. Fish. Soc. 89:222-233.
Kusakina, A. A. 1963* Relation of muscle and cholinesterase
thermostability in certain fishes to specific environ
mental temperature conditions. Fed. Proc. 22:T123-T126.
Latta, W. C. 1963. The life history of the smallmouth bass,
Micropterus d. dolomieui, at Waugoshance Point, Lake
Michigan. Michigan Dept. Conserv. Bull. Inst. Fish.
Res. 5:56.
Mutchmor, J. A. and A. G. Richards. 1961. Low temperature
tolerance of insects in relation to the influence of
temperature on muscle apyrase activity. J. Ins. Physiol.
7:141-158.
Paloheimo, J. E. and L. M. Dickie. 1966. Food and growth
of fishes. II. Effects of food and temperature on the
relation between metabolism and body weight. J. Fish.
Res. Board Can. 23(6):869-908
Fampathi, R, 1963. Physiology of low temperature accli
mation in tropical poikilotherms. Indiana Acad. Sci.
Proc. B. 57:290-295*
Pardue, G. B. and F. E. Hester. 1967. Variation in the
growth rate of known-age largemouth bass (Micropterus
salmoides) under experimental conditions. Proc. 20th

73
Ann. Conf. Southeast Ass. Game Comm. 300-310.
Parker, F. L. and P. A. Krenkel. 1969. Thermal pollution:
Status of the art. Vanderbilt Univ., Dep. Environ
mental and Water Resources. Rep No. 3.
Parvatheswarararao, V. 1967. Some mechanisms underlying
thermal acclimation in freshwater fish, Etroplus
maculatus. Comp. Biochem. Physiol. 21(3):619-626.
Peak, M. J., N. R. Fuller, and J. G. Peak. 1969. Temper
ature acclimation in Tilapia sparmanii: Some effects
of thiourea. Zool. Afr. (S. Africia), 3:95. Biol.
Abst., 50:30993.
Precht, H. 1958. Concepts of temperature adaptation of the
unchanging reaction systems of cold-blooded animals.
In: Physiological Adaptation. (C. L. Prosser, Ed.) Amer.
Physiol. Soc. Wash., U. C.
Frosser, C. L. 1958. The nature of physiological adap
tation. In Physiological Adaptation (C. L. Prosser,
Ed.). Amer. Physiol. Soc. 167-180.
-------- . 1962. Acclimation of poikilothermic vertebrates
to low temperatures. In: Comparative Physiology of
Temperature Regulation (J. P. Hannon and E. Vierbeck,
Ed.). Arctic Aeromedical Laboratory 1-34.
Read, K. R. H. 1964. Comparative biochemistry of adap
tations of poikiiotherms to the thermal environment.
In: Experimental Marine Ecology. Occ. Pub. No. 2
Graduate School Oceanography, University of Rhode
Island. 39-47.

74
Roots, B. I. and C. L. Prosser. 1962. Temperature accli
mation and the nervous system in fish. J. Exp. Biol.
39:617-629.
Schneider, L. 1969. Experimental investigation on the in
fluence of day length and temperature on gonad devel
opment in the three-spinned stickleback, Gasterosteus
aculeatus. Oceologia (Germany). 3:249.
Simpson, A. C. 1959. Method used for seperating and
counting the eggs in fecundity studies on the plaice
(Pleuronectes platessa) and herring (Clupea harengus).
Occ. Pap. F. A. 0. Indo-Pacific Fisheries Council.
No. 59/12.
Simpson, G. G. and A. Roe, and R. Lewontin, i960. Quan
titative Zoology. Harcourt Brace and Co., New York
229-230.
Slicher, A. M. and G. E. Pickford. 1968. Temperature con
trolled stimulation of hempoiiesis in a hypophysecionized
cyprinodent fish: Fundulus heteroclitus♦ Physiol. Zool.
41:293.
Smith, E. N., B. J. Venables, and 0. T. Lind. 1973- A
versatile and inexpensive variable voltage pulsator
for electrofishing. Trans. Amer Fish. Soc. 102(2).
Somero, G. N. 1969. Enzymic mechanisms of temperature com
pensation: Immediate and evolutionary effects of tem
perature on enzymes of aquatic, poikilotherms. Amer.
Natur. 130:51*

75
Spitzer, K. W., D. E. Marvin, and A. G. Heath. 1969. The
effect of temperature on the respiratory and cardiac
response of the bluegill sunfish to hypoxia. Comp.
Biochem. Physiol. 30:83-90.
Standard Methods for the Examination of Water and Waste
Water. 1905. New York (1st edition).
Strawn, K. 1961. Growth of largemouth bass fry at various
temperatures. Trans. Amer. Fish. Soc. 90(3):334-335•
Stroud, R. H. 1948. Growth of the basses and black crappie
in Norris Reservoir, Tennessee. J. Tenn. Acad. Sci.
23:31-91.
Ushakov, B. P. and A. A. Kusakina. 1962. Liability and
conservation of adaptation in animal cells at the pro
tein level. Biol. Abstr., 37:4145*
Ushakov, B. P., A. N. Vinogradov, and A. A. Kusakina. 1962.
Cytophysical analysis of intraspecies differentiation in
the whitefish and grayling of Lake Baikal. Biol. Abstr.,
40:4229.
Walser, M. I960. Ion association. I. The effects of multi
valent ions on the protein-bound and complexed calcium
in serum. J. Cell. Comp. Physiol. 55:245-250.
Watt, K. E. F. 1959* Studies on population productivity.
II. Factors governing productivity in a population of
smallmouth bass. Ecol. Monographs 29:367-392.
Wiebe, J. P. 1968. The effects of temperature and day
length on the reproductive physiology of the viviparous

76
sea perch, Cymatogater agregata.Gibbons. Can. J,
Zool. 48:221.
Winberg, G. G. i960. Rate of metabolism and food require
ments of fishes. Fish. Res. Board Can., Trans. Ser.
194:1-202.