solvent-free additive manufacturing of electrodes for li
TRANSCRIPT

Scholars' Mine Scholars' Mine
Doctoral Dissertations Student Theses and Dissertations
Spring 2019
Solvent-free additive manufacturing of electrodes for Li-ion Solvent-free additive manufacturing of electrodes for Li-ion
batteries batteries
Brandon Joshua Ludwig
Follow this and additional works at: https://scholarsmine.mst.edu/doctoral_dissertations
Part of the Mechanical Engineering Commons
Department: Mechanical and Aerospace Engineering Department: Mechanical and Aerospace Engineering
Recommended Citation Recommended Citation Ludwig, Brandon Joshua, "Solvent-free additive manufacturing of electrodes for Li-ion batteries" (2019). Doctoral Dissertations. 2785. https://scholarsmine.mst.edu/doctoral_dissertations/2785
This thesis is brought to you by Scholars' Mine, a service of the Missouri S&T Library and Learning Resources. This work is protected by U. S. Copyright Law. Unauthorized use including reproduction for redistribution requires the permission of the copyright holder. For more information, please contact [email protected].

SOLVENT-FREE ADDITIVE MANUFACTURING OF ELECTRODES FOR LI-ION
BATTERIES
by
BRANDON JOSHUA LUDWIG
A DISSERTATION
Presented to the Faculty of the Graduate School of the
MISSOURI UNIVERSITY OF SCIENCE AND TECHNOLOGY
In Partial Fulfillment of the Requirements for the Degree
DOCTOR OF PHILOSOPHY
in
MECHANICAL ENGINEERING
2019
Approved by:
Heng Pan, Advisor
Ming C. Leu
Frank Liou
Joseph W. Newkirk
Jonghyun Park

iii
PUBLICATION DISSERTATION OPTION
This dissertation consists of the following four articles, formatted in the style used
by the Missouri University of Science and Technology:
Paper I, “Solvent-Free Manufacturing of Electrodes for Lithium-ion Batteries,”
was published in Scientific Reports journal and can be found on pages 7-46.
Paper II, “Understanding Interfacial-Energy-Driven Dry Powder Mixing for
Solvent-Free Additive Manufacturing of Li-ion Battery Electrodes,” was published in
Advanced Materials Interfaces journal and can be found on pages 47-86.
Paper III, “Simulation of Micro/Nanopowder Mixing Characteristics for Dry
Spray Additive Manufacturing of Li-Ion Battery Electrodes,” was published in ASME
Journal of Micro- and Nano-Manufacturing journal and can be found on pages 87-113.
Paper IV, “Scalable Dry Printing Manufacturing to Enable Long-Life and High
Energy Lithium-Ion Batteries,” was published in Advanced Materials Technologies
journal and can be found on pages 114-148.

iv
ABSTRACT
A new Li-ion battery electrode manufacturing process using a solvent free
additive manufacturing method has been developed. Li-ion battery electrodes consist of
active material particles, a binder additive, and a conductive additive. Traditionally, Li-
ion battery electrodes are manufacturing using the “slurry casting” technique. In this
method, the electrode materials are mixed with a solvent to create a slurry. Electrodes
fabricated in this method are readily implemented for small platforms, such as portable
electronics. However, this method isn’t as economically viable in large platforms due to
high material and manufacturing costs. High material and manufacturing costs are mostly
attributed to the use of organic solvents, typically N-methyl-pyrrolidone, to dissolve the
binder additive. A drying line is needed to evaporate the solvent from the electrode layer
and an expensive recovery system is needed to collect the evaporated solvent. In total, the
use of NMP attributes ~14.5% to the overall Li-ion battery cell costs. The solvent-free
manufacturing method has been developed to eliminate these problems. In this method,
the electrode materials are dry mixed and directly deposited on to the current collector.
Therefore, uniform distribution of the electrode particles during the mixing process is the
driving factor for the solvent-free additive manufactured batteries. The distribution of dry
electrode materials was studied through experimental mixing studies, mixing models, and
mixing simulations to better understand how the electrode material’s surface properties
effect the final distribution of electrode particles. Afterwards, Li-ion batteries were
assembled with solvent-free manufactured electrodes and compared to slurry-cast
electrodes with similar specifications.

v
ACKNOWLEDGMENTS
First, I would like to thank my advisor, Dr. Heng Pan, for allowing me to join his
research group when he came to Missouri S&T. His enthusiasm for research and progress
were essential for completing the work presented in this dissertation.
I would like to extend my appreciation to our collaborators at the Worcester
Polytechnic Institute. Dr. Yan Wang has always provided useful inputs on what was
needed to improve the electrochemical performance of our samples. It was a pleasure
working with Dr. Jin Liu. Our long discussions on the sample designs were always
helpful. I also want to thank Dr. Zhangfeng Zheng for providing the electrochemical data
at the beginning of the project.
I would like to acknowledge my committee members, Dr. Ming Leu, Dr. Frank
Liou, Dr. Joseph Newkirk, and Dr. Jonghyun Park. Their advice and questions were
invaluable, and the courses taken with Dr. Newkirk and Dr. Park were essential.
I am thankful for the research funding support from the National Science
Foundation and the Materials Research Center and Intelligent Systems Center at Missouri
S&T. I am especially grateful to have received the Chancellor’s Fellowship and GAANN
Fellowship to fund my Ph.D. studies, which made it easier to focus on research.
I want to thank my lab partners, especially, Dr. Wan Shou, Joshua Staggs,
Xiaowei Yu, Chinmoy Podder, I-Meng Chen, Mahati Guntupalli, Bikram Mahajan,
Xiangtao Gong, and Gopi Dendukuru for their support and friendship over the years.
Finally, I would like to thank and dedicate this work to my family and friends,
especially my parents, for always supporting me while I was at Missouri S&T.

vi
TABLE OF CONTENTS
Page
PUBLICATION DISSERTATION OPTION ................................................................... iii
ABSTRACT ....................................................................................................................... iv
ACKNOWLEDGMENTS ...................................................................................................v
LIST OF ILLUSTRATIONS ...............................................................................................x
LIST OF TABLES ........................................................................................................... xiii
SECTION
1. INTRODUCTION ...................................................................................................... 1
1.1. BACKGROUND ................................................................................................ 1
1.2. LI-ION BATTERY ELECTRODES .................................................................. 1
1.3. SLURRY-CASTING .......................................................................................... 2
1.4. ORGANIZATION OF DISSERTATION .......................................................... 5
PAPER
I. SOLVENT-FREE ADDITIVE MANUFACTURING OF ELECTRODES FOR
LI-ION BATTERIES ................................................................................................. 7
ABSTRACT ................................................................................................................... 7
1. INTRODUCTION ...................................................................................................... 8
2. RESULTS ................................................................................................................. 12
2.1. MECHANICAL BONDING CHARACTERIZATION ................................... 12
2.2. ELECTROCHEMICAL CHARACTERIZATION .......................................... 17
3. DISCUSSION .......................................................................................................... 20
4. CONCLUSION ........................................................................................................ 25

vii
5. METHODS ............................................................................................................... 27
5.1. CATHODE POWDER PREPARATION ......................................................... 27
5.2. MATERIAL DEPOSITION ............................................................................. 27
5.3. POROSITY MEASUREMENT ....................................................................... 27
5.4. MECHANICAL BONDING MEASUREMENTS ........................................... 28
5.5. ELECTROCHEMICAL MEASUREMENTS .................................................. 29
ACKNOWLEDGEMENTS ..........................................................................................29
REFERENCES ..............................................................................................................30
SUPPLEMENTARY INFORMATION ........................................................................32
II. UNDERSTANDING INTERFACIAL-ENERGY-DRIVEN DRY POWDER
MIXING FOR SOLVENT-FREE ADDITIVE MANUFACTURING OF LI-
ION BATTERY ELECTRODES ............................................................................ 47
ABSTRACT ................................................................................................................. 47
1. INTRODUCTION .................................................................................................... 48
2. RESULTS AND DISCUSSION .............................................................................. 52
2.1. MECHANICAL BONDING MEASUREMENTS ........................................... 52
2.2. SURFACE ENERGY MEASUREMENTS ..................................................... 53
2.3. THEORETICAL MODEL FOR MIXING PARTICLES WITH LARGE
SIZE DIFFERENCE AND MODEL VALIDATION ..................................... 60
2.4. THEORETICAL MODEL FOR MIXING PARTICLES WITH SIMILAR
SIZES AND MODEL VALIDATION............................................................. 65
2.5. ELECTROCHEMICAL CHARACTERIZATION .......................................... 66
3. CONCLUSION ........................................................................................................ 70
4. EXPERIMENTAL SECTION ................................................................................. 71
4.1. ADDITIVE MANUFACTURING PROCESS ................................................. 71

viii
4.2. POWDER PREPARATION ............................................................................. 71
4.3. MECHANICAL BONDING MEASUREMENTS ........................................... 72
4.4. SURFACE ENERGIES MEASUREMENT ..................................................... 72
4.5. ELECTROCHEMICAL MEASUREMENTS .................................................. 73
ACKOWLEDGEMENTS .............................................................................................74
REFERENCES ..............................................................................................................74
SUPPLEMENTARY MATERIALS .............................................................................77
III. SIMULATION OF MICRO/NANOPOWDER MIXING CHARACTERISTICS
FOR DRY SPRAY ADDITIVE MANUFACTURING OF LI-ION BATTERY
ELECTRODES ..................................................................................................... 87
ABSTRACT ................................................................................................................. 87
1. INTRODUCTION .................................................................................................... 88
2. DISCRETE ELEMENT SIMULATION MODELING ........................................... 91
3. RESULTS ................................................................................................................. 95
3.1. ACTIVE MATERIAL-BINDER PARTICLE ADDITIVE .............................. 96
3.2. ACTIVE MATERIAL-CONDUCTIVE PARTICLE ADDITIVE................... 98
3.3. BINDER ADDITIVE-CONDUCTIVE ADDITIVE ...................................... 102
3.4. ACTIVE MATERIAL-BINDER ADDITIVE-CONDUCTIVE
ADDITIVE ..................................................................................................... 104
4. EXPERIMENTAL VERIFICATION .................................................................... 106
5. CONCLUSION ...................................................................................................... 109
ACKNOWLEDGMENTS ...........................................................................................109
REFERENCES ............................................................................................................110
IV. SCALABLE DRY PRINTING MANUFACTURING TO ENABLE LONG-
LIFE AND HIGH ENERGY LITHIUM-ION BATTERIES .............................. 114

ix
ABSTRACT ............................................................................................................... 114
1. INTRODUCTION .................................................................................................. 115
2. RESULTS AND DISCUSSION ............................................................................ 118
3. CONCLUSION ...................................................................................................... 134
4. EXPERIMENTAL SECTION ............................................................................... 135
4.1. ELECTRODES PREPARATION .................................................................. 135
4.2. ELECTROCHEMICAL MEASUREMENTS ................................................ 136
4.3. POROSITY MEASUREMENTS ................................................................... 137
4.4. MORPHOLOGY CHARACTERIZATION ................................................... 138
4.5. MODELING ................................................................................................... 138
ACKNOWLEDGMENTS ...........................................................................................139
REFERENCES ............................................................................................................140
SUPPLEMENTARY INFORMATION ......................................................................142
SECTION
2. CONCLUSION ...................................................................................................... 149
BIBLIOGRAPHY ............................................................................................................152
VITA ................................................................................................................................154

x
LIST OF ILLUSTRATIONS
SECTION Page
Figure 1.1. Li-ion battery materials and structure............................................................... 2
Figure 1.2. Schedmatic of slurry-coating process. .............................................................. 3
PAPER I
Figure 1. Dry Painted Battery Concept. ............................................................................ 10
Figure 2. Mechanical Bonding Characterization. ............................................................. 15
Figure 3. Electrochemical Characterization. ..................................................................... 18
Figure 4. Material Surface Energy Characterization.. ...................................................... 23
Figure 5. Electrode Cross-section Charecterization. ......................................................... 26
PAPER II
Figure 1. Additive manufacturing system for electrodes created by dry powder
process. ............................................................................................................... 51
Figure 2. a) PVDF assembly on LCO surface. b) Melted PVDF wetting the surface
of LCO. c) PVDF and C65 distributed amongst each other after mixing with
LCO. d) Melted PVDF creating contacts between LCO surfaces with C65
assembled on the PVDF surface. (scale bars in a-d represent 500 nm) e)
Mechanical pull-off test results. ........................................................................ 54
Figure 3. a) Diagram showing particles i and j touching with the interface and contact
area of the particles after collision (b). c) Formation of a j-particle
agglomerate with an isolated i-particle. d) Formation of a j-particle
monolayer on the surface of an i-particle. ......................................................... 61

xi
Figure 4. a) LCO-PVDF modeling showing the preferred PVDF assembly with
varying LCO surface energy values (red arrow next to annealed LCO
signifies that the measured polar surface energy component is a minimum
value)(blue area denotes aggregation). b) LCO-C65 modeling results
showing preferred mixing of C65 with LCO dispersive and polar surface
energy set to 40 mN m-1 and 100 mN m-1, respectively (yellow denotes C65
coverage on LCO). Red dots in (a) and (b) denote as measured values,
yellow dots denote value from literature. c) LCO-C65 modeling showing
preferred mixing of C65 with LCO dispersive and polar surface energy set
to 40 mN m-1 and 2 mN m-1, respectively (yellow denotes C65 coverage on
LCO). Histogram comparison for C65 coverage on LCO for as-received
LCO mixed with as-received C65 (d), annealed LCO with as-received C65
(e), and annealed LCO with treated C65(f). ...................................................... 63
Figure 5. a) Diagram showing formation of an i-j aggregate. b) Diagram showing
formation of i-j intermixed particles. c) PVDF-C65 contour plot showing
preferred mixing of PVDF when C65 surface energy values are varied (blue
denotes aggregation). ........................................................................................ 67
Figure 6. Electrochemical performance of sample with lowered binder/conductive
additive loading (98 wt% LCO, 1 wt% PVDF, 1 wt% C65). ........................... 69
PAPER III
Figure 1. Solvent Free Manufacturing Process. ................................................................ 90
Figure 2. Contact Mechanics of Colliding Particles. ........................................................ 93
Figure 3. Active Material-Binder Particle Additive Mixing. ............................................ 97
Figure 4. Active Material-Conductive Particle Additive Mixing. .................................. 100
Figure 5. Binder Particle Additive-Conductive Particle Additive Mixing. .................... 104
Figure 6. Active Material-Binder Particle Additive-Conductive Particle Additive
Mixing. ............................................................................................................ 106
Figure 7. Experimental Mixing Comparison. ................................................................. 108
PAPER IV
Figure 1. Schematic diagram of “solvent-free” dry printing electrode fabrication. ....... 120
Figure 2. Electrode cycling performance of the dry printed electrode (80% after 500
cycles) and the commercial slurry cast electrode at the rate of 0.5 C ............. 122

xii
Figure 3. SEM surface morphology comparison. ........................................................... 126
Figure 4. TXM morphology. ........................................................................................... 128
Figure 5. SEM cross-section morphology showing the precision on controlling the
thickness and components homogeneity. ........................................................ 130
Figure 6. Electrochemical performance of dry‐molded thick electrodes with the
reference of thin “regular” dry printed electrodes (56 µm thickness) ............. 132
Figure 7. a) Rate performance of thick electrodes from the porous electrode
simulation. b) Simulated Li concentration profiles in electrolyte at the
beginning of discharge (time = 120 s) and the end of discharge (time =
613 s) in an electrode discharged at 3 C at the thickness of 200 µm, and
Li‐ion concentration in the electrolyte along the thickness direction, c)
average (cs) and surface (csf) Li concentration in secondary particles along
the thickness direction, normalized to the maximum Li concentration in
NCM. ............................................................................................................... 133

xiii
LIST OF TABLES
PAPER I Page
Table 1. Cost analysis of conventional slurry process with our proposed dry process. ... 11
PAPER II
Table 1. Surface tension properties of probing liquids used in contact angle
measurements. .................................................................................................... 56
Table 2. Surface energy measurement comparisons for graphite and carbon blacks. ...... 59
PAPER III
Table 1. Material input parameters for DEM simulations. ............................................... 94
PAPER IV
Table 1. List of parameters for galvanostatic discharge simulation. .............................. 139

SECTION
1. INTRODUCTION
1.1. BACKGROUND
Over the last two decades, Li-ion batteries have established themselves as the go-
to energy storage device for consumer electronics. However, Li-ion batteries are not as
readily implemented in large platforms, such as electric vehicles (EVs) and unmanned
aerial vehicles (UAVs), due to low energy density from manufacturing constraints. Even
so, global sales increased from 10,000 in 2010 to 774,000 in 2016 and sales are expected
to increase more in the coming years [1]. This increase in sales, even with the limitations
in performance for large platforms, is driven by increased restrictions on CO2 and NOx
emissions. Therefore, considerable efforts are being made to improve the performance of
Li-ion batteries for these large platforms.
1.2. LI-ION BATTERY ELECTRODES
Li-ion batteries consist of a positive (cathode) and negative (anode) electrode
along with an electrolyte. The Li-ion battery electrodes, shown in Figure 1.1., consist of
three main materials: electrochemically active materials (for example LiCoO2, LiMn2O4,
LiNixMnyCozO2 for cathodes and graphite for anodes), a polymer binder, and conductive
additive (carbon). The three materials are mixed together to obtain a uniform distribution
of binder and conductive additives throughout the active materials. Once a uniform
electrode mixture is achieved it is deposited on to the current collector substrate
(aluminum foil for cathodes and copper foil for anodes). Uniform distribution of the

2
binder additive insures strong mechanical bonding within the electrode layer and at the
electrode layer/current collector interface. The conductive additives are needed to
increase the conductivity of the electrode layer.
Figure 1.1. Li-ion battery materials and structure.
1.3. SLURRY-CASTING
Commercial lithium-ion battery electrodes are manufactured using a “slurry-
casting” process, which is shown in Figure 1.2. The slurry is made by uniformly mixing a
solvent with the three electrode materials. The type of solvent used is dependent on the
binder type so that the binder can be dissolved and uniformly dispersed within the
solvent. Electrode performance is heavily influenced by this mixing step as it helps to
ensure conductivity and mechanical strength [2-3]. Once mixed, the slurry is coated onto
the current collector via a slot-die coater in a roll-to-roll manufacturing system. Low

3
speeds of 0.5-5 m/min are used in R&D to pilot-scale lines and high speeds of 20-60
m/min are used in commercial production [4]. In its final form, the electrode layer needs
to be dry and porous. Therefore, a line of ovens is used to evaporate the solvent. Minimal
drying times of 1-2 minutes are sought after, but this still requires oven lines of 60 m
when coating at the higher speeds [5-7]. Higher coating speeds are desired, but the
process variables increase considerably, and increased costs associated with a longer
dryer line must be considered as well.
Figure 1.2. Schedmatic of slurry-coating process.
The solvent types currently used in commercial slurry-casting can be broken into
two types: organic solvent based and aqueous based. Organic solvent based slurries
typically use N-methyl-2-pyrrolidone (NMP) as the solvent and polyvinylidene fluoride
(PVDF) as the binder. Due to the toxic nature of NMP, global and local emissions
standards call for a solvent recovery system to be used to recapture evaporated NMP
when it is exhausted from the drying line [8]. This recovery system also allows for the
recaptured NMP to be used for potential reuse. This becomes a necessity when
considering the high material costs of the NMP solvent. In total, the use of NMP
contributes 14.5% to the overall Li-ion battery cell cost [9].

4
More economical and environmentally friendly slurry-casting methods are
possible using aqueous based slurries. Costs are reduced due to lower material costs and
the removal of solvent recovery systems. Performance wise, electrodes fabricated with
aqueous based slurries are comparable to electrodes fabricated with organic solvent based
slurries [10-12]. While promising, aqueous slurries present their own set of problems
which need to be addressed during the electrode fabrication process. For aqueous slurries,
the rheological properties require the need for additional additives to obtain the
uniformity found in solvent-based systems. Strong hydrogen bonds found in water cause
powder agglomeration, particularly the conductive additives, which have a detrimental
impact on the electrical conductivity of the finished electrode [13]. To combat this,
additives are needed to obtain a uniform suspension which further complicates the
processing parameters [14].
Additives are also needed to account for the problems associated with high
surface tension of aqueous based systems. High surface tension of water reduces the
wettability of the aqueous slurry when being coated onto the current collector. Adding
co-solvents has been used to reduce the surface tension of the slurry but this could bring
the need of solvent recovery systems back into the manufacturing process. Alteration of
the current collector surface by increasing the surface energy with corona discharge and
plasma treatments can also help with wettability issues but this requires additional
equipment to be added to the roll-to-roll system [15].
While aqueous electrodes do not need solvent recovery systems during the drying
process, there are a few concerns that must be addressed due to the switch to water. In Li-
ion batteries, the voltage is higher than the voltage needed to electrolyze water.

5
Therefore, there are stringent moisture requirements of the finished electrodes to ensure
the water content is below 10-20 ppm [16]. Drying of aqueous slurries is further
complicated by the high surface tension of water causing the electrode to crack while
drying. Again, the use of co-solvents can help reduce the surface tension of the slurry and
alleviate the cracking issue [17].
Moving away from the slurry-based electrode coating process represents a
promising direction for reducing Li-ion battery costs. This would remove the high
material costs of solvent-based slurries, the equipment needs of the drying process (dryer
line and solvent recovery system for organic solvent-based slurries), and the processing
requirements for successful use of aqueous based slurries
1.4. ORGANIZATION OF DISSERTATION
This dissertation is organized based on four journal publications. The first paper,
“Solvent-Free Manufacturing of Electrodes for Lithium-ion Batteries”, introduces the
solvent-free additive manufacturing process for Li-ion battery electrodes. The sprayer
system parameters are discussed along with the effects of the hot calendaring process on
the final electrode strength. The effect of particle surface energy on the mixing
characteristics of the electrodes is also introduced. Cathodes using LiCoO2 (LCO) and
LiNi1/3Mn1/3Co1/3O2 (NMC) as the active materials were manufactured and show superior
mechanical and electrochemical performance to those made using the slurry coating
process.
The second paper, “Understanding Interfacial-Energy-Driven Dry Powder Mixing
for Solvent-Free Additive Manufacturing of Li-ion Battery Electrodes”, presents in-depth
6
modeling of the material surface energy effect on the final dry electrode powder mixture.
Experimental results show similar mixing outcomes when compared to the expectation
from the model. LCO cathodes with reduced binder and conductive additives (1 wt%
each) were fabricated based on the results of the modeling and experimental results.
The third paper, “Simulation of Micro/Nanopowder Mixing Characteristics for
Dry Spray Additive Manufacturing of Li-Ion Battery Electrodes”, presents a model used
for simulating the final electrode powder mixture. Surface energy components for the
active material, binder additive, and conductive additive were changed to study the
mixing characteristics.
The fourth paper, “Scalable Dry Printing Manufacturing to Enable Long-Life and
High Energy Lithium-Ion Batteries”, introduces solvent-free additive manufactured
electrodes with increased energy density. This paper studies the effects increased
electrode thickness has on the rate performance capability and cycling capability of
fabricated samples.
The last section of this dissertation contains the major conclusions of the
presented journal publications.

7
PAPER
I. SOLVENT-FREE ADDITIVE MANUFACTURING OF ELECTRODES FOR
LI-ION BATTERIES
ABSTRACT
Lithium ion battery electrodes were manufactured using a new, completely dry
powder painting process. The solvents used for conventional slurry-cast electrodes have
been completely removed. Thermal activation time has been greatly reduced due to the
time and resource demanding solvent evaporation process needed with slurry-cast
electrode manufacturing being replaced by a hot rolling process. It has been found that
thermal activation time to induce mechanical bonding of the thermoplastic polymer to the
remaining active electrode particles is only a few seconds. Removing the solvent and
drying process allows large-scale Li-ion battery production to be more economically
viable in markets such as automotive energy storage systems. By understanding the
surface energies of various powders which govern the powder mixing and binder
distribution, bonding tests of the dry-deposited particles onto the current collector show
that the bonding strength is greater than slurry-cast electrodes, 148.8 kPa as compared to
84.3 kPa. Electrochemical tests show that the new electrodes outperform conventional
slurry processed electrodes, which is due to different binder distribution.

8
1. INTRODUCTION
Li-ion battery electrodes are manufactured by casting a slurry onto a metallic
current collector. The slurry contains active material, conductive carbon, and binder in a
solvent. The binder, most commonly polyvinylidene fluoride (PVDF), are pre-dissolved
in the solvent, most commonly N-Methyl-2-pyrrolidone (NMP). During mixing, the
polymer binder flows around and coat the active material and carbon particles.[1-9] After
uniformly mixing, the resulting slurry is cast onto the current collector and must be dried.
Evaporating the solvent to create a dry porous electrode is needed to fabricate the battery.
Drying can take a wide range of time with some electrodes taking 12-24 hours at 120ºC
to completely dry.[5,10] In commercial applications, an NMP recovery system must be in
place during the drying process to recover evaporated NMP due to the high cost and
potential pollution of NMP.[11,12] While the recovery system makes the entire process
more economical it does require a large capital investment. Less expensive and
environmentally friendly solvents, such as aqueous based slurries, could eliminate the
large capital cost of the recovery system but the electrode would still require a time and
energy demanding drying step.[9,10,13-16], Uncoventional manufacturing methods have also
been used to create battery electrodes. Solvent based electrostatic spray deposition has
been used to coat current collectors with electrode material.[17-19] This is achieved by
adding high voltage to the deposition nozzle and grounding the current collector, which
causes the deposition material to become atomized at the nozzle and drawn to the current
collector. Electrodes constructed with this method exhibit similar characteristics as slurry-
cast electrodes and have similar disadvantages in that they also require a time and energy
9
intesive drying process (2 hours at 400ºC).[19] Lithium ion batteries have also been
manufactured using spray painting techniques by using NMP based paints to spray each
electrode component onto the desired surface.[20] While this allows for battery fabrication
on a variety of surfaces it still requires the solvent to be evoporated.
Electrodes manufactured with dry particles coated on current collectors represent
the ideal manufacturing process, thereby eliminating solvents and the disadvantages that
come with using them. Dry electrode manufacturing has been achieved through a variety
of methods such as pulsed laser and sputtering deposition.[21-27] Pulsed-laser deposition is
achieved by focusing a laser onto a target body containing the to-be-deposited material.
Once the laser hits the target, the material is vaporized and deposited onto the collecting
substrate. Although solvent is not used, the deposited film has to be subjected to very
high temperatures (650-800ºC) to anneal the film.[21,24] Deposition via magnetron
sputtering can lower the required annealing temperature to 350ºC.[27] While these
methods are representatives of dry battery electrode manufacturing, they both suffer from
very slow deposition rates and high temperature needs for annealing.[19]
A solution has been realized by using an electrostatic spraying system (Figure 1a)
to deposit completely dry electrode particles to the current collector (Figure 1b). The
process is commonly known as dry painting or electrostatic spraying. It consists of a
powder pick-up and dispensing unit (such as Venturi pump) and an electrostatic spraying
gun. A spraying gun is used to charge the fluidized dry particles. After being charged, the
dry particles will be drawn to the ground current collector and deposited. A hot roller is
used to control the electrode thickness and density (Figure 1c-d) in place of the doctor
blade typically used to control the thickness of a slurry-cast electrode.[3,4,8,14] Thermal

10
activation of the binding material is quickly achieved using the hot roller, which takes the
place of the oven needed to evaporate solvent in a slurry-cast electrode.[1,3,5,16] Dry
painted electrodes exhibit good flexibility as well as the cability to coat very large areas
(Figure 1e).
Figure 1. Dry Painted Battery Concept. a) Manufacturing system for electrodes created
by dry particle painting process. b) 3D representation of a dry painted electrode before
thermal activation. c) 3D representation of a dry painted electrode after hot rolling and
thermal activation. d) Hot roller configuration. e) Dry painted electrodes on Al foils.
Based on the cost analysis shown in Table 1, adopting the dry painting process
can potentially save ~15% on labors, capital equipment and plant area in battery
manufacturing. This is due to the removal of large capital investments such as solvent
recovery systems and the removal of time and energy consuming drying processes
needed for the conventional method of manufacturing. This analysis was based on the

11
Argonne battery performance and cost (BatPaC) model.[28] In the BatPaC model, 7
different designs (different electrode sizes) with Manganese-spinel/Graphite chemistry
were used to conduct the cost analysis. All designs show similar results, and we present
the comparison between conventional slurry process with our proposed dry process for
two designs (Design 1 and Design 4) here.
Table 1. Cost analysis of conventional slurry process with our proposed dry process.
Battery Design 1 Battery Design 4
Direct
Labor,
hours/year
Capital
equipment,
Millions
Plant area,
Square
meters
Direct Labor, hours/year
Capital
equipment,
Millions
Plant
area,
Square
meters
Conventional
process 511,871 109.85 12,569 595,918 139.10 15,958
Dry process 441,021 94.28 10,918 499,600 112.61 13,326
Saving
percentage 21.6% 14.2% 13.1% 16.2% 19.0% 16.5%
In addition, the dry painting process provides a possibility that the electrodes
manufactured by this new method will have different microstructures than that of the
conventional slurry-cast electrodes. With this consideration, in this work, electrodes
manufactured using the new dry painting and slurry-cast process will be made with the
same material composition (by weight percentage) and thickness. However, due to the
distinct polymer binder dispersion processes involved, the electrodes fabricated by these
two methods could exhibit different electrochemical properties, such as rate and cycling
performance.

12
2. RESULTS
2.1. MECHANICAL BONDING CHARACTERIZATION
Strong particle adhesion to the current collector is necessary when manufacturing
battery electrodes, and ensuring a uniform distribution of binding material throughout the
active and conductive particles is essential when trying to satisfy this requirement.
Slurry-cast electrodes achieve even distribution of binding material by using solvent to
dissolve the binding material, then mixing is performed to coat the remaining active and
conductive particles. It could be assumed that the use of a solvent would allow the now
liquefied binder to readily coat the remaining particles and diminish the need of an
extensive mixing step, but this assumption would be incorrect. Extensive research has
been conducted on the effects of the slurry mixing process on battery performance, with
mixing anywhere from an hour to up to 3 days.[1,16] The mixing process is also crucial
in achieving a high-strength electrode manufactured with the dry painting process.
The first tested dry painted electrodes were made by mixing as-shipped active (90
wt%), conductive (5 wt%), and binding material (5 wt%) together for 60 minutes in a
high-energy mixer. LiCoO2 (LCO) was used as the active material, Super C65 Carbon
(C65) as the conductive material, and PVDF for the binding material. After mixing, the
powders were deposited onto the ground current collector (Al foil) using a high voltage
electrostatic spraying gun. As-deposited electrodes were thermally activated on a hot
plate set to 250°C for 1 hour. A pull-off test was performed at the center of the coated
area to evaluate the bonding strength of the particles to the current collector. The test
results readily showed that the electrode had extremely low bonding strength (1.2 kPa) to

13
the current collector as compared to a slurry-cast electrode (84.3 kPa) of similar
composition.
A dry painted electrode made of 85% (by weight) LCO and 15% (by weight)
PVDF (without C65) was tested to see if the bonding strength improved when only active
and binding material is present. After thermal activation on a hot plate the sample was
mechanically tested and found to have substantially higher bonding strength (117.1 kPa).
It was concluded C65 had a detrimental effect on the bonding strength. An SEM
micrograph (Figure 2a) of the LCO/PVDF sample before thermal activation showed that
LCO had a monolayer of PVDF particles covering it. After thermal activation the PVDF
melts and wets the surface of LCO particles, creating contact points between surrounding
LCO particles (Figure 2b). This is a good indicator of strong bonding between particles
and the bonding tests of this sample prove the strong bonding capability of dry painted
electrodes.
An SEM micrograph of the first electrode (Figure 2c) shows bare LCO particles
and what could be assumed to be C65 agglomerations (Figure 2d). Upon further
inspection, it was discovered that the PVDF particles that once formed a uniform
monolayer over LCO particles (Figure 2a) have been completely stripped off LCO
particles by C65 particles. The PVDF particles were subsequently covered with C65
particles. This was determined after examining what was thought to be C65
agglomerations more closely. It was found that the assumed to be C65 agglomerations
(Figure 2d) had a spherical shape comparable in size to raw PVDF particles.
Furthermore, all SEM micrographs of this sample showed few uncovered PVDF particles
even though 5% of the electrode was made of PVDF. Therefore, it was concluded that the
14
PVDF particles have been largely coated with C65 particles. Clear evidence can be seen
by few instances where PVDF is only partially covered by C65 (Figure 2e). During
thermal activation, the melted PVDF will be contained within the surrounding C65
particles. This will cause the LCO particles to remain loose without direct PVDF contact
points. Thus, the electrode made with C65 had almost no bonding while the sample
without C65 exhibited stronger bonding than the slurry-cast electrode.
A hot rolling step was introduced to the manufacturing process to simultaneously
melt the PVDF particles and to press the neighboring particles together. Hot rolled
electrodes exhibited a sharp increase in bonding performance (148.8 kPa) as compared to
the original dry painted electrodes (1.2 kPa) and to the conventional slurry-cast process
(84.3 kPa). It can be seen that the hot rolled electrodes are denser (Figure 2f) than the
original dry painted electrodes (Figure 2c). The thermal budget (determined by feed rate
and roller temperature) during the hot rolling process was enough to thermally activate
the PVDF particles and create contact points between particles (Figure 2g). A comparison
of each of the tested manufacturing processes can be seen in Figure 2h which shows the
dry painted electrodes with the hot rolling step having the best bonding performance.
Further hot rolling tests were performed to study the effects the hot rolling
temperature and hot rolling feed rates on the bonding performance of dry painted
electrodes. The feed rate was set to three different values (12, 48, and 90 in/min) while
the top roller was set between 100°C and 175°C. The bottom roller was maintained
constant at 190°C to ensure at least one roller was set to a temperature about the PVDF
melting temperature (177°C). As expected, increasing the feed rate and reducing top
roller temperature led to lower bonding strength due to a decreasing thermal budget

15
Figure 2. Mechanical Bonding Characterization. a) SEM micrograph showing LCO
covered with PVDF before thermal activation (scale bar is 5 µm). b) SEM micrograph
showing PVDF will completely wet the surface of LCO after thermal activation (scale
bar is 5 µm). c) SEM micrograph showing C65 Carbon will strip PVDF particles off
LCO particles and subsequently form a layer around the PVDF particles (scale bar is 5
µm). d) SEM micrograph showing what looks to be C65 agglomerations formed while
mixing electrode materials for the dry painting process (scale bar is 5 µm). e) SEM
micrograph showing C65 is actually coating PVDF particles which is also the case for the
previous image (d) (scale bar is 1 µm). f) SEM micrograph a very flat top electrode
surface due to the hot rolling process completed after deposition of the electrode material
(scale bar is 5 µm). g) SEM micrograph showing melted PVDF formed during the hot
rolling process (scale bar is 1 µm). h) Bonding strength (kPa) comparison of dry painted
electrodes vs. slurry-cast electrodes. i) Effects of top roller temperature and feed rate on
mechanical strength of the electrodes. j) SEM micrographs comparing the structure
difference between dry and slurry-cast electrodes at the electrode – current collector
interfaces (scale bar is 10 µm). Insets are top-view images of current collector after
electrode failure.

16
(Figure 2i). With top roller temperature at 150˚C or above, high feed rates (>48 in/min)
were allowed to produce electrodes with mechanical strength higher than conventional
ones. It should be noted that all the pull-off tests fail at the electrode/current collector
interface except for those with top roller temperature at 175˚C,which exhibited superior
adhesion/cohesion strength of the electrode and fail due to current collector tearing. With
lower top roller temperatures (120˚C or lower), the dependence of mechanical strength on
temperature was not clear. In this temperature range, feed rate needs to be below 30
in/min to ensure bonding strength comparable (or higher) than conventional ones.
It should also be noted that the conventional slurry-cast electrodes also failed at
the electrode - current collector interface. The dry painted electrodes show stronger
bonding (top roller temperature 100˚C and feed rate 12 in/min) compared with
conventional electrodes. Electrode - current collector interface tends to be the weaker due
to the 2D planar contact nature. SEM micrographs (Figure 2j) reveal pocket structures
formed on current collectors resulting due to themechanical pressing used in the dry
process This provides additional contact area compared with slurry process and renders
additional adhesion strength for dry processed electrodes. Since all electrodes fail at the
current collector interfaces in this study, it is unclear if dry electrodes yield higher
cohesive strength within the electrode than conventional electrodes, which is subject to
future studies.
The effect of compression ratio on mechanical strength was also performed.
Electrodes with varying initial thickness were hot rolled to a final thickness of 50 µm and
then mechanically tested (Figure S1, in Supplementary Information). Bonding strength
was practically non-existant for thinnest electrodes, but increased rapidly until a

17
satisfactory strength (greater than or equal to the slurry tested electrodes) was reached
with thicker electrodes (148.8 kPa).
2.2. ELECTROCHEMICAL CHARACTERIZATION
A direct comparison of electrochemical characteristics between dry painted
electrodes and conventional slurry-casted electrodes has been performed. Both types of
electrodes consist of 90 wt% LCO, 5 wt% carbon additive, and 5 wt% PVDF. The
composition was selected to maximize the energy density while maintaining sufficient
electron conductivity and mechanical integrity. The dry painted (after hot rolling)
electrode has a free-standing porosity around 30%, while the conventional cast electrode
porosity is about 50%. The conventional electrode was also pressed to around 30% for
direct comparison with dry electrodes. The porosity measurement is described in
Methods. Figure 3a shows the rate performance of the dry painted LCO electrodes at
various discharge currents ranging from 0.1 C to 3C along with conventional slurry-cast
electrodes. For the dry painted electrodes, the cell delivers a specific capacity of 121
mAhg-1 at 0.1C, 89% of theoretical capacity (the theoretical capacity is 137 mAhg-1 for
LCO over the voltage range 4.2-2.5V vs. Li/Li+ because at the charge cut-off, 4.2V, LCO
is partially delithiated to Li0.5CoO2). At 0.2C, 0.5C, 1C, 2C, and 3C, the capacity
lowered to 117 mAhg-1, 110 mAhg-1, 101 mAhg-1, 95 mAhg-1, and 87 mAhg-1, which
are 86%, 80%, and 74%, 70%, and 64% of the theoretical capacity, respectively. Overall,
the dry printed electrode has higher capacity than the conventional slurry-cast electrodes
(Figure 3a).

18
Figure 3. Electrochemical Characterization. a) C-rate performance of the dry painted and
conventional LiCoO2 (LCO) electrodes, (b) cycling performance comparison between the
dry painted and conventional LCO electrodes; (c) Cyclic Voltammetry of conventional
LCO electrodes; (d) Cyclic Voltammetry of dry painted LCO electrodes; (e) Comparison
of electrochemical impedance spectra between dry and conventional LCO electrodes; (f)
Cycling performance of the painted and conventional LiNi1/3Mn1/3Co1/3O2 (NMC)
electrodes.
The cycling performance of the dry painted and conventional LCO electrode is
shown in Figure 3b. For the painted electrode, the discharge capacity versus
corresponding cycle number decays from 114 mAhg-1 in the initial cycle to 80 mAhg-1
after 50 charge/discharge cycles, 70% capacity retention at 0.5C after 50 cycles. For the
conventional electrode, after 50 cycles, only 58% capacity is retained. The painted
electrode has higher cycling stability than the conventional electrodes (Figure 3b).
To understand the mechanism that allows the dry painted electrodes to outperform
the conventional electrodes, both electrodes were examined by Cyclic Voltammetry (CV)
and electrochemical impedance spectra (EIS). Figure 3c&d compare Cyclic

19
Voltammograms of the painted and conventional LCO electrodes. At a scan rate of
0.025mV/s, a single pair of oxidation and reduction peaks, the reduction peak at ∼3.8 V
and the oxidation peak at∼4V corresponding to a Co3+/ Co4+ redox couple, is observed
for both electrodes, indicating the good reversibility of lithium insertion into and
extraction from LCO. With the increased scan rate, the painted electrodes largely
maintain the symmetrical shape of the cathodic peaks and the anodic peaks in their CV
curves, whereas the shapes of the cathodic peaks and the anodic peaks change
significantly for the conventional electrodes. Moreover, the potential difference between
the cathodic peak and the anodic peak at a certain scan rate in the painted electrode is
smaller than that in the conventional one, indicating that the painted electrode has lower
electrochemical polarization and better rate capability.
Nyquist plots of the painted and conventional LCO electrode/Li cell at fully
discharged state are shown in Figure 3e. Impedance is a collective response of kinetic
processes with different time regimes. All the plots consist of an intercept with the Re(Z)
axis, a high-frequency semicircle and a low-frequency tail. The intercept with the Re(Z)
axis at high frequency referes to the total amount of Ohmic resistance, including
electrolyte resistance and electric contact resistance. This resistance is much smaller than
the other contributions of resistance. The semicircle can be attributed to the electrode-
electrolyte interfacial impedance, while the tail attributed to the diffusion-controlled
Warburg impedance. Both electrodes show slightly decrease in interfacial impedance
with cycles. The width of the semicircle of the painted electrode is smaller than that of
the conventional one, indicating that the dry painted electrode has slightly lower
interfacial resistance.

20
To prove its versatility of the dry manufacturing process, LiNi1/3Mn1/3Co1/3O2
(NMC) electrodes were also manufactured. The cycling performance of the painted and
conventional NMC electrodes is shown in Figure 3f. For the painted electrodes, the
discharge capacity versus corresponding cycle number decays from 138 mAhg-1 in the
initial cycle to 121 mAhg-1 after 50 charge/discharge cycles in the voltage of 2.8–4.3V,
meaning that there is 87% capacity retention at 0.5C after 50 cycles. For the conventional
electrodes, after 50 cycles, 84% capacity is retained. The painted electrodes have slightly
better cyclability than the conventional ones. Other electrochemical characterizations,
including the C-rate performance and CV comparisons, indicate dry painted NMC
electrodes slightly outperform the conventional ones (Figure S2, Supplementary
Information).
3. DISCUSSION
SEM images (Figure 2a) showed a tendency for PVDF to attach and coat LCO
particles without C65. When C65 is mixed in, the PVDF is stripped off of the LCO
particles and readily coated by C65 particles (Figure 2c). To understand this mixing
behavior, surface energy measurements were conducted for LCO, C65, and PVDF to help
explain the results of the mixing process and to help predict the mixing characteristics of
various electrode materials.
The sessile drop contact angle method (Figure S3-S5, Supplementary
Information) was used to determine the polar and dispersive surface energy components
for each of the materials used (Figure 4a). LCO shows a strong polar component (37.57

21
mN/m) and a low relatively low dispersive component (12.75 mN/m). C65 shows
opposite surface energy characteristics with it having a very large dispersive component
(48.41 mN/m) and an almost non-existent polar component (1.4 mN/m). Polar and
dispersive surface energy components for PVDF have values located between the
respective values of LCO and C65.
With LCO and C65 having extreme polar and dispersive components, they were
found to heavily impact the distribution of PVDF throughout the composite. Using
measured surface energy, the work of adhesion (cohesion) between two (single) materials
can be calculated by Fowkes equation,
𝑊12 = 2(𝛾1𝑑𝛾2
𝑑)0.5 + 2(𝛾1𝑝𝛾2
𝑝)0.5 (1)
where γ1d and γ2
d are the dispersive surface energies of material 1 and 2 while γ1p and γ2
p
are the polar surface energies of material 1 and 2.[29] The work of adhesion calculated for
PVDF to LCO and C65 show that they are higher than the work of cohesion for PVDF-
PVDF contacts (Figure 4b). This result shows that PVDF will more readily attach to LCO
or C65 when either is present than to form PVDF agglomerations. The preferential
adhesion of PVDF to LCO is desirable and will facilitate more even distribution
throughout LCO particles and help increase the bonding performance. It should be noted
that the work of adhesion between PVDF and C65 is stronger than that of PVDF and
LCO. This helps to explain the observations in SEM micrographs (Figure 2) where PVDF
was shown to readily coat LCO particles but were subsequently stripped off and covered
when C65 was introduced to the mixture.
Work of adhesion calculations for C65 to LCO and PVDF show that C65 will
preferably attach to C65 itself and form agglomerates, Figure4c. Since adhesion between

22
C65-PVDF is comparable to C65-C65, PVDF will be intermingled with C65 and form
agglomerates, which will be referred to as “conductive binders agglomerates”, as shown
in insert of Figure4c. Due to the weaker interactions of either C65 or PVDF with LCO,
the “conductive binder” largely maintains its agglomeration form and merely distributes
around LCO particles, as illustrated in Figure 4c. This unique distribution, as reasoned
from surface energy analysis, has also been verified by SEM micrographs which show
the distributions of C65/binder agglomerates when mixed with LCO (Figure 2c&d).
Furthermore, the measured surface energies can provide insight into the wetting
behavior of melted PVDF particles. Using the Fowkes equation[29],
(𝛾𝑠𝑑𝛾𝑙
𝑑)0.5 + (𝛾𝑠𝑝𝛾𝑙
𝑝)0.5 = 0.5𝛾𝑙(1 + cos(𝜃) (2)
where subscript s and l represent LCO and PVDF, superscripts d and p represent
dispersive and polar components, and Θ is the contact angle. Using the surface energy
components previously found for LCO and PVDF, the calculation shows that PVDF will
completely wet LCO surface upon melting. Therefore, full coverage of PVDF on LCO
can be expected which agrees with SEM images (Figure 2e). Certainly, with the presence
of C65, the wetting of PVDF on LCO will be hindered.
The different manufacturing processes will result in different binder distributions
and hence electromechanical properties of electrodes. In the porous electrode composite,
ions move through the liquid electrolyte that fills the pores of the composite. Electrons
are conducted via chains of carbon particles through the composite to the current
collector. PVDF holds together the active material particles and carbon additive particles
into a cohesive, electronically conductive film, and provide the adhesion between the film
and the current collector. It is well known that when it is in contact with the surface of

23
Figure 4. Material Surface Energy Characterization. a) Dispersive, polar, and total
surface energy values calculated using the Sessile drop contact angle method. b) Work of
cohesion for PVDF and also the work of adhesion for PVDF-C65 and LCO-PVDF, which
suggest PVDF will preferably form on C65. c) Work of cohesion for C65 and also the
work of adhesion for LCO-C65 and C65-PVDF, which suggests C65 particles will
preferably stick to one another.

24
particles, a polymer tends to chemically bond or physically absorb to form a bound
polymer layer on the surface of the particles of active material and carbon additive [7, 8],
and polymer chains tend to align with the surface. This bound polymer layer can interact
with adjacent polymer layer to form the immobilized polymer layers due to reduced
mobility. Bound and immobilized layers together are considered as fixed polymer layers
[9]. Following the formation of fixed polymer layers on particle surfaces, free polymer
domains start to appear [8]. The free binder polymers are crucial to the mechanical
strength of the electrodes. Due to the substantially large surface area of active material
and carbon additive present in electrodes, almost all of binder polymers are in the fixed
state, and very limited polymers are free [9]. Therefore, for a given electrode
manufacturing method, the electrode composition and binder distribution has a
significant effect on electrochemical properties.
It is believed that the lower interfacial resistance in dry painted electrodes likely
results from the difference in binder distributions induced by different manufacturing
methods. In conventional method, PVDF is dissolved in NMP solvent followed by
prolonged drying process. Dissolved binders form thin carbon/binder layer extensively
covering LCO particles after solvent evaporation (Figure5a). As a semicrystalline
polymer, PVDF tends to form crystallite region upon drying [10] leading to the formation
of fixed polymer layers. In dry process, on the contrary, binders and carbon are mixed to
form the “conductive binder agglomerates” around LCO particles. Due to the presence of
carbon, the extended wetting and spreading of binder on LCO surface are greatly
hindered. Only near the necking area between two neighboring LCO particles, binders in
the “conductive binder agglomerates” can be forced to wet and bond to LCO surface

25
during the hot rolling process. On the locations away from the necking area, binders only
loosely bond to LCO surface (Figure5b). As a result, cross-sectional SEM images show
more “un-covered” LCO particles in dry electrodes (Figure5d), while conventional
electrodes exhibit mostly covered LCO particles (Figure5c). Moreover, the Energy-
Dispersive X-ray spectra (EDS) in selected areas of both electrodes reveal the covering
layer primarily consists of carbon (carbons and/or binders). Detailed SEM/EDS analysis
confirming the binder coverage in the two types of electrodes can be found in
Supplementary Information (Figure S6). Thus, it is concluded that the dry process results
in less fixed polymer layers on LCO surfaces, which contributes to lower interfacial
impedance. Lithium ions will easily diffuse into/out of the LCO particles without PVDF
coverage for the dry painted electrodes. It should be emphasized that the “conductive
binder agglomerates” largely fill the space between LCO particles, as can be verified by
the SEM images (with inserted EDS maps of carbon) in Figure5e&f showing conductive
paths formed at the gaps between LCO particles throughout the entire electrode.
4. CONCLUSION
The results prove that Li-ion battery cathodes can be manufactured using a
completely dry material coating process, which paves the way for a more efficient and
fast battery manufacturing method. The new dry manufacturing method integrates
electrostatic spray and hot rolling processes to realize materials dispensing and binder
activation. The dry manufacturing method can be easily implemented on existing roll-to-
roll battery production line. The mechanical strength and electrochemical performance of

26
dry manufactured electrodes slightly outperform conventional ones due to unique binder
distribution observed in dry manufacturing process. Both dry painted LCO and NMC
electrodes have been fabricated, which clearly shows the versatility of the dry painting
technology.
Figure 5. Electrode Cross-section Charecterization. Schematic illustrations of
characteristic binders/carbons distribution in dry painted electrodes (a) and conventional
electrodes (b). SEM micrograph showing the representative LCO particles in cross-
sectioned dry painted electrodes (c) and conventional electrodes (d). SEM showing cross-
section of a 90% LCO, 5% C65, 5% PVDF dry painted electrode and conventional
electrodes (f) (scale bar is 50 µm). Insets in (e) and (f) are EDS (Energy-dispersive X-ray
spectroscopy) mapping of carbon elements (colored red) on the entire electrodes.

27
5. METHODS
5.1. CATHODE POWDER PREPARATION
Dry cathode materials, LCO (MTI), Super C65 Carbon Black (Timcal), and
PVDF (MTI), were mixed with zirconia beads in a BeadBug Microtube Homogenizer
(Benchmark Scientific) for 60 minutes at 2800 RPM. For cathodes made with NMC
(Umicore), the same mixing parameters were used. The details on the mixing and mixing
time effects can be found in Figure S7 Supplementary Information.
5.2. MATERIAL DEPOSITION
After mixing, the powders were added to fluidized bed spraying chamber. The
fluidzed bed chamber was fed into the spraying system with the electrostatic voltage set
to 25 kV while the carrier gas inlet pressure was set to 20 psi. Distance from the
deposition head to the grounded aluminum current collector was kept constant at 1.5 in.
while the coating time was kept constant at 10 seconds. Surface morphology of the
deposited material was investigated using a Helios NanoLab DualBeam operating with an
emission current of 11 pA and 5 kV accelerating voltage. The details in spraying setup
configuration, thickness control and material composition on spraying behaviors can be
found in Figure S8-10 Supplementary Information.
5.3. POROSITY MEASUREMENT
Porosity of the sprayed (or cast) electrode was determined by taking into account
of the theoretical density of the mix (active material, carbon black, and binder) according
to the following equation [33].

28
Porosity = [T –S ((W1/D1) + (W2/D2) + (W3/D3))]/T (3)
where T is the thickness of the electrode laminate (without Al foil current collector), S is
the weight of the laminate per area, W1, W2, and W3 are the weight percentage of active
material, PVDF binder and C65 within the electrode laminate, while D1, D2, and D3 are
the true density for LCO (or Li[Ni1/3Co1/3Mn1/3]O2), PVDF and C65, respectively. The
theoretical densities for LCO (or NMC) active material, PVDF and C65 are 5.1 (or 4.68),
1.78, and 2.25 g cm−3, respectively. All the porosities were calculated by assuming that
the weight fractions and density of each material were not changed by the fabrication
process. In general, electrodes with porosity about 30% have good electrochemical
performance.
5.4. MECHANICAL BONDING MEASUREMENTS
For early mechanical bonding test, the coated current collectors were placed onto
a hot plate for 1 hour at 250ºC. A hot roller was used for thermal activation and
increasing the density of the electrode material. The bottom roller temperature was set to
190°C and the top roller temperature was set to 100°C. A feeding rate of 24 in./minute
was used. A Mark-10 Series 4 force gauge was paired with a Mark-10 ES10 manual hand
wheel test stand to determine the bonding strength of the coated electrode material. To
test the stength, the coated current collector was mounted onto the test stand base with the
center of the coated region directly below the force gauge. A 0.5 in. diameter flat head
(Mark-10) was attached to the force gauge with a piece of double sided tape (7 mm by 12
mm) attached to the flat head. The force gauge was lowered until the flat head touched
the substrate and compressed to 50 N. After compression, the force gauge was raised at a

29
rate of 1 rotation over 20 seconds until the tape attached to the flat head decoupled from
the coated area. The maximum tensile force was recorded and converted to the maximum
strength by incorporating the known contact area of the tape.
5.5. ELECTROCHEMICAL MEASUREMENTS
Dry sprayed electrodes were electrochemically tested against Li foil in a
Swagelok cell with stainless-steel current collectors. A collector was covered with a piece
of Li foil and two pieces of Celgard 2500 microporous separator were placed over the Li
foil. A piece of the cathode material was then centered over the separator and the cell was
sealed to ensure good contact between the cathode and the other collector. 1M LiPF6 in
ethylene carbonate (EC), diethyl carbonate (DEC), and dimethyl carbonate (DMC)
(1:1:1) was used to as electrolyte to fabricate the cells. Each cell was tested with a
galvanostat/potentiostat/impedence analyzer (Bio-logic VMP3). For rate performance,
cells were charged to 4.2 V and discharged to 2.5 V at various rates such as 0.1C, 0.2C,
0.5C, 1C, 2C, 3C, and 5C. For cycling performance, cells, were charged to 4.2 V and
discharged to 2.5 V at 0.5C. Constant current charging and discharging were used for all
tests. Electrochemical impedance spectroscopy measurements were carried out from 0.1
Hz to 200 KHz using a 10 mV AC signal.
ACKNOWLEDGEMENTS
This work is financially supported by NSF CMMI-1462343 and CMMI-1462321.
This work is also partially supported by seeding funds from Intelligent System Center

30
(ISC) and Material Research Center (MRC) at Missouri University of Science and
Technology.
REFERENCES
[1] Liu, D. et al. An effective mixing for lithium ion battery slurries. Adv. Chem. Eng.
Sci. 4, 515-528 (2014)
[2] Ruffo. R., Wessells, C., Huggins, R.A. & Cui, Y. Electrochemical behavior of
LiCoO2 as aqueous lithium-ion battery electrodes. Electrochem. Commun. 11,
247-249 (2008)
[3] Lee, G.-W., Ryu, J.-H., Han, W., Ahn, K.H. & Oh, S.M. Effect of slurry
preparation process on electrochemical performances of LiCoO2 composite
electrode. J. Power Sources 195, 6049-6054 (2010)
[4] Ponrouch, A. & Palacin, M.R. On the impact of the slurry mixing procedure in the
electrochemical performance of composite electrodes for Li-ion batteries: A case
study for mesocarbon microbeads (MCMB) graphite and Co3O4. J. Power
Sources 196, 9682-9688 (2011)
[5] Cetinkaya, T., Akbulut, A., Guler, M.O. & Akbulut, H. A different method for
producing a flexible LiMn2O4/MWCNT. J. Appl. Electrochem. 44, 209-214
(2014)
[6] Wei, Z. et al. Study of sulfonated polyether ether ketone with pendant lithiated
fluorinated groups as ion conductive binder in lithium-ion batteries. J. Power
Sources 256, 28-31 (2014)
[7] Liu, G. et al. Effects of various conductive additive and polymeric binder contents
on the performance of a li-ion composite cathode. J. Electrochem. Soc. 155,
A887-A892 (2008)
[8] Barsykov, V. & Khomenko, V. The influence of polymer binders on the
performance of cathodes for lithium-ion batteries. Sci. Proc. Riga Tech. Univ.,
Ser. 1. 21, 67-71 (2010)
[9] Spreafico, M.A., Cojocaru, P., Magagnin, L. Triulzi, F. & Apostolo, M. PVDF
latex as a binder for positive electrodes in lithium-ion batteries. Ind. Eng. Chem.
Res. 53, 9094-9100 (2014)

31
[10] Guerfi, A., Kaneko, M., Petitclerc, M., Mor, M. & Zaghib, K. LiFePO4 water-
soluble binder electrode for Li-ion batteries. J. Power Sources 163, 1047-1052
(2007)
[11] Miyata, K., Kawada, T. & Katou, K. NMP distilling apparatus. European Patent
Application No. 10815325.5
[12] Li, J., Rulison, C., Kiggans, J., Daniel, C. & Wood, D.L. Superior performance of
LiFePO4 aqueous dispersions via corona treatment and surface energy
optimization. J. Electrochem. Soc. 159, A1152-A1157 (2012)
[13] Son, B. et al. Measurement and analysis of adhesion property of lithium-ion
battery electrodes with SAICAS. ACS Appl. Mater. Interfaces 6, 526-531 (2013)
[14] Bitsch, B. et al. A novel slurry concept for the fabrication of lithium-ion battery
electrodes with beneficial properties. J. Power Sources 265, 81-90 (2014)
[15] Doberdo, I. et al. Enabling aqueous binders for lithium battery cathodes – Carbon
coating of aluminum current collector. J. Power Sources 248, 1000-1006 (2014)
[16] Li, C.-C. & Wang, Y.-W. Importance of binder composition to the dispersion and
electrochemical properties of water-based LiCoO2 cathodes. J. Power Sources
227, 204-210 (2013)
[17] Yoon, W.-S. et al. Electrochemical characterization of layered LiCoO2 films
prepared by electrostatic spray deposition. J. Power Sources 97-98, 282-286
(2001)
[18] Chen, C.H., Kelder, E.M., Jak, M.J.G. & Schoonman, J. Electrostatic spray
deposition of thin layers of cathode materials for lithium battery. Solid State
Ionics 86-88, 1301-1306 (1996)
[19] Koike, Shinji & Tatsumi, K. Preparation and performances of highly porous
layered LiCoO2 films for lithium batteries. J. Power Sources 174, 976-980 (2007)
[20] Singh, N. et al. Paintable battery. Sci. Rep. 2, 481 (2012)
[21] Shiraki, S. et al. Fabrication of all-solid-state battery using epitaxial LiCoO2 thin
films. J. Power Sources 267¸881-887 (2014)
[22] Julien, C., Camacho-Lopez, M.A., Escobar-Alarcon, L. & Haro-Poniatowski, E.
Fabrication of LiCoO2 thin-film cathodes for rechargeable lithium microbatteries.
Mater. Chem. Phys. 68, 210-216 (2001)
[23] Yan, B., Liu, J., Song, B., Xiao, P. & Lu, L. Li-rich Thin Film Cathode Prepared
by Pulsed Laser Deposition. Sci. Rep. 3, 3332 (2013)

32
[24] Kuwata, N., Kawamura, J., Toribami, K., Hattori, T. & Sata, N. Thin-film
lithium-ion battery with amorphous solid electrolyte fabricated by pulsed laser
deposition. Electrochem. Commun. 6, 417-421 (2004)
[25] Tintignac, S., Baddour-Hadjean, R., Pereira-Ramos, J.P. & Salot, R.
Electrochemical properties of high rate bias sputtered LiCoO2 thin films in liquid
electrolyte. J. Power Sources 245, 76-82 (2014)
[26] Baggeto, L., Unocic, R.R., Dudney, N.J. & Veith, G.M. Fabrication and
characterization of Li-Mn-Ni-O sputtered thin film high voltage cathodes for Li-
ion batteries. J. Power Sources 211¸108-118 (2012)
[27] Chiu, K.-F. Lithium cobalt oxide thin films deposited at low temperature by
ionized magnetron sputtering. Thin Solid Films 515¸4614-4618 (2007)
[28] Nelson, P.A., Gallagher, K.G., Bloom, I. BatPaC (Battery Performance and Cost)
Software (2011). Available from: www.cse.anl.gov/BatPaC/.
[29] Zenkiewicz, M. Methods for the calculation of surface free energy of solids. J.
Achiev. Mater. Manuf. Eng. 24, 137-145 (2007)
SUPPLEMENTARY INFORMATION
Effect of Compression Ratio on Mechanical Strength
The mechanical (bonding) strength of the electrode is critically determined by the
roll pressure applied during hot rolling process. Roll pressure can be related to
compression ratio, (ratio of intial thickness to final thickness) by
𝑝𝑟 =𝐹𝑟𝑣
𝑤𝑙 (1)
where Frv is the radial load, and wl is the product of the electrode width and projected
length of the contact area1. The width is kept constant for all electrodes while the
projected length of the contact area is dependent on the compression ratio given by
𝑙 ≈ [𝑅 (ℎ1
ℎ2− 1)]0.5 (2)

33
where R is the radius of the rollers, h1 is the initial electrode thickness, and h2 is the final
electrode thickness. The effect of the compression ratio on the bonding strength
capabilities of dry-painted electrodes was found by mechanically testing electrode
samples with varying initial thicknesses. Each of the electrodes were hot rolled with a set
roller gap. It is found that the bonding strength increases drastically when the initial
thickness increases is 1.5 to 2.5 times that of the final electrode thickness. A maximum
mechanical strength of 153.09 kPa was found when the compression ratio was 6.5 but a
marginally lower strength of 134.29 kPa was found when the compression ratio was 2.75
(Figure S1). Large compression ratio were found due to the extremely porous nature of
the unpressed electrodes but large initial thickness values will evetually lead to an
undesired final thickness due to the inability of the roller system to further press the
powders.
Supplementary Figure 1. Effect of Pressing Ratio on Mechanical Strength.
0
20
40
60
80
100
120
140
160
1 2 3 4 5 6 7
Bo
nd
ing
Stre
ngt
h (
kPa)
Pressing Ratio (Initial/Final Thickness)
34
Electrochemical Characterization of NMC Electrodes
To prove its versatility, LiNi1/3Mn1/3Co1/3O2 (NMC) NMC electrodes were also
manufactured by the dry process. The effect of C-rate on the electrode performance was
investigated by discharging at different rates, from 0.1C to 3C. For comparison, a
conventional NMC electrode was also included. The effect is shown in Figure S2(a). It is
clear that the painted NMC electrode has better rate performance than the conventional
one. Figure S2(b) shows cyclic voltammograms (CV) at a scan rate of 0.05mV/s. Both
electrodes have only one anodic peak and one cathodic one, which can be possibly
identified as Ni2+/Ni4+ redox couple. The single anodic peak indicates that Ni2+/Ni4+
oxidization is direct, not via Ni3+. Indirect oxidation would exhibit two anodic peaks in
the CV curves, denoted as Ni2+/Ni3+ and Ni3+/Ni4+ processes. This could be due to the
Jahn-Teller distortion of Ni3+ (d7) in NiO6 octahedra resulting in the direct oxidation of
Ni2+ to Ni4+ 2,3. It is evident that the potential difference between the cathodic peak and
anodic peak in the painted NMC electrode is also smaller than that in the conventional
one, as observed in LCO electrodes.
Surface Energy Measurement and Discussions
In this work, the surface energy of the used electrode powders is needed. The
Sessile Drop Technique was used as the characterization method. The Sessile Drop
Technique is a contact angle method used to measure the contact angle of a selected
liquid dropped on to a flat solid material. Typically, this method is used to measure the
surface energy characteristics of an unknown material by relating the known surface
energy components of the liquid to the measured contact angle of the droplet formed on

35
the unknown surface. In most cases this method is used for solid bulk materials where the
problems associated with the used liquid soaking into the substrate are not relevant.
Supplementary Figure 2. Electrochemical Characterization of NMC Electrodes. a) C-rate
performance of the dry painted and conventional NMC electrodes, (b) Cyclic
Voltammetry of dry painted and conventional NMC electrodes.
An OCA15EC/B Contact Angle Measuring Device by DataPhysics was used to
capture the contact angles and to calculate polar, dispersive, and total surface energies of
the battery electrode materials. As previously mentioned, the Sessile Drop Technique is
typically performed on a flat bulk solid material; therefore, packing each electrode
powder as densly as possible is required. This will allow the densely packed particles to
be analyzed as a single, solid material4. If the powders are not packed well the probling
liquid will readily soak through the pores between the particles. LiCoO2 (LCO),
polyvinylidene fluoride (PVDF), and Super C65 Carbon Black (C65) were the three
materials tested and each required their own set of packing requirements.
A B

36
LCO was characterized with an LCO sputtering target from Kurt J. Lesker Company. The
target provides a highly pure (99.7%) and dense material to perform the surface energy
characterization. Four probing liquids were used for characterizing LCO, which include
dimethyl sulfoxide (DMSO), formamide, thiodiglycol (TDG), deionized water. The
results show that the droplets form contact angles of 35.65° for DMSO (Figure S3(a)),
49.55° for formamide (Figure S3(b)), 39.83° for TDG (Figure S3(c)), and 48.13° for
water (Figure S3(d)).
Each of the contact angles were entered into the software provided by
DataPhysics to determine the polar, dispersive, and total surface energy components for
LCO. The Owens, Wendt, Rabel, and Kaelble (OWRK) method for calculated surface
free energy was used characterize LCO. It was found that the surface energy due to polar
interactions was 37.57 mN/m while the surface energy due to dispersive interactions was
12.75 mN/m. A line fitted to the plotted points for each of the probing liquids used in the
OWRK method gave an error value of 0.9938 and it can be seen that the fitted line
represents a very close fit to the plotted points (Figure S3(e)). The surface energy values
obtained from this approach were used for future analysis involving LCO.
The PVDF sample used for surface energy characterization was made in the
laboratory. As-shipped PVDF was pressed into a 12.5 mm diameter disc-shaped pellet by
adding PVDF powder into a pressing die and pressing. A pressing pressure of 263 MPa
was used and the pressing process was completed using a Carver Bench Top Press. Three
fluids were used to characterize the PVDF: ethylene glycol (EG), formamide, and TDG.
The EG droplet formed a contact angle of 57.12° (Figure S4(a)) while formamide and

37
TDG droplets formed contact angles of 64.40° (Figure S4(b)) and 59.97° (Figure S4(c)),
respectively.
Supplementary Figure 3. LCO Surface Energy Characterization. Droplets formed by a)
DMSO, b) formamide, c) TDG, and d) water on LCO to determine the contact angles
needed for surface energy characterization for LCO. e) Surface energy plot for each of
the probing liquids used to estimate the surface free energy components of LCO.
Similarly to LCO, the contact angles for each of the probing liquids were entered
into the surface energy software and the polar, dispersive and total surface energy
components for PVDF were calculated. The OWRK method was used for the calculation
and returned a polar surface energy component of 6.18 mN/m and dispersive surface
energy component of 24.33 mN/m. Again, a fitted line to the plotted points (Figure

38
S4(d)) shows a very close fit (error value of 0.9999). Given the very close fit the obtained
surface energy components were used for future analysis involving PVDF.
Supplementary Figure 4. PVDF Surface Energy Characterization. Droplets formed by a)
EG, b) formamide, and c) TDG on PVDF to determine the contact angles needed for
surface energy characterization for PVDF. d) Surface energy plot for each of the probing
liquids used to estimate the surface free energy components of PVDF.
Polar and dispersive surface energy measurements using the Sessile Drop
Technique proved to be most difficult for C65. For C65, the small particle size leads to
many pores throughout the packed material. When the probing liquid was dropped onto
the surface it was quickly absorbed by the packed material, making the measurement of
the contact angle extremely difficult4. As a result, conductive graphite powder (MTI
Corp.) was used due to its planar structure allowing it to be more easily pressed. A

39
graphite pellet was pressed similarly to the PVDF pellet previously discussed. EG,
formamide, and TDG were used as the probing liquids to characterize graphite. The EG
droplet formed a contact angle of 60.06° (Figure S5(a)) while formamide and TDG
droplets formed contact angles of 79.82° (Figure S5(b)) and 75.05° (Figure S5(c)),
respectively.
Upon entering the respective contact angles for each of the probing liquids into
the surface energy software, the polar, dispersive, and total surface energy components
for graphite were found. The OWRK method shows a polar component of 0.54 mN/m
and dispersive component of 56.27 mN/m. A fitted line to the plotted probing liquid
points again show a very good fit (Figure S5(d)); therefore, the surface energy values
obtained were used for future analysis involving C65.
As previously mentioned, the surface energy values for LCO, PVDF, and graphite using
the OWRK method were used to characterize the mixing interactions examined in the
main article. A different surface energy calculation method was used for each of the
electrode materials (LCO, PVDF, and graphite) to determine if the calculation method
had a significant effect on the polar, dispersive, and total surface energy values. If there is
a significant difference then the conclusions made in the main paper could be effected
due to a possible change in the work of adhesion and work of cohesion calculations.
Based on the Wu method, the polar, dispersive, and total surface energy values for each
of the materials have very minor changes. The difference between the methods (OWRK
and Wu) were small enough such that the conclusions made based on the work of
adhesion and work of cohesion calculations would not have any change.

40
Supplementary Figure 5. Graphite Surface Energy Characterization. Droplets formed by
a) EG, b) formamide, and c) TDG on graphite to determine the contact angles needed for
surface energy characterization for graphite. d) Surface energy plot for each of the
probing liquids used to estimate the surface free energy components of graphite.
Binder Distribution Difference between Dry Painted and Slurry-casted Electrodes
Conventional and dry electrodes were cleaved and the cross section were
examined by SEM. SEM micrographs were taken at different sections (top, middle and
bottom part of the cross section, with the bottom section closest to the current collector).
Within each section, SEM images were randomly taken at four locations to provide more
data sampling. Representative micrographsare shown in Figure 6S. It can be seen that
slurry-cast electrodes featurmore coverage on LCO particles while more exposed LCO
particles are commonly seen in dry painted electrodes. As discussed in the main text, dry
painted electrodes will have more LCO particles that are covered by loosely bonded

41
binders which can be easily removed during sample cleavage. EDS spectra on selected
LCO particles revealed more binders/carbons on individual LCO particle surface for
slurry-casted electrodes. It is interesting to notice that in slurry-casted electrode, there are
more binder/carbon coverage near the top section of the electrode, this phenomena will
be studied more thoroughly in the future.
Effect of Mixing Time
Samples of 90% LiCoO2 and 10% PVDF was mixed with different mixing times to see
the effect mixing time had on the distribution of PVDF throughout LiCoO2. 1 gram of the
mixture was shaken vigorously by hand for 1 minute and sprayed. Subsequent mixing
was performed with a BeadBug Microtube Homogenizer. For each mixing cycle with the
homogenizer, 1 gram of material was mixed at a constant speed of 2,800 RPM. Mixing
times with the homogenizer included 30 seconds, 3 minutes, and 90 minutes. Each of the
four mixture types were sprayed with inlet pressure equal to 25 psi and a 1.5 in. gap
distance between the current collector and electrode tip. The deposition characteristics
were comparable for each of the samples but SEM micrographs were taken to determine
the uniformity of PVDF particles throughout the surrounding LiCoO2 particles. Each of
the samples showed a monolayer of PVDF forming on LiCoO2 particles. Supplementary
Figure 5 shows an SEM micrograph for a sample made after 3 minutes of mixing and for
a sample made after 90 minutes of mixing. Therefore, it was determined that prolonged
mixing of multiple materials yielded a negligible change in post-mixing material
characteristics.

42
Supplementary Figure 6. SEM and EDS Characterizations of Binder/Carbon Coverage on
LCO Particles. SEM images of LCO particles in conventional processed electrode taken
at the bottom a), middle c) and top e) section of the electrode. SEM images of LCO
particles in dry processed electrode taken at the bottom b), middle d) and top e) section of
the electrode. EDS spectra were taken at selected areas shown as red rectangles. The
carbon weight percentages measured from EDS spectra are shown in each figure.
A B
C D
E F
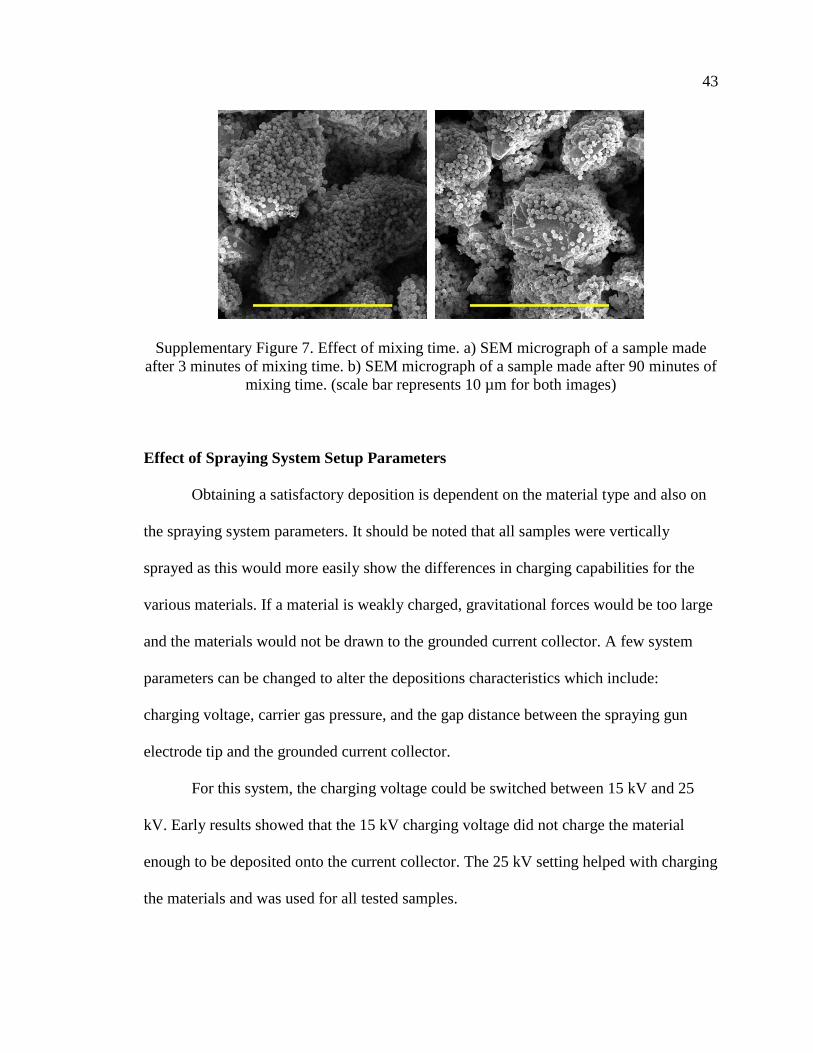
43
Supplementary Figure 7. Effect of mixing time. a) SEM micrograph of a sample made
after 3 minutes of mixing time. b) SEM micrograph of a sample made after 90 minutes of
mixing time. (scale bar represents 10 µm for both images)
Effect of Spraying System Setup Parameters
Obtaining a satisfactory deposition is dependent on the material type and also on
the spraying system parameters. It should be noted that all samples were vertically
sprayed as this would more easily show the differences in charging capabilities for the
various materials. If a material is weakly charged, gravitational forces would be too large
and the materials would not be drawn to the grounded current collector. A few system
parameters can be changed to alter the depositions characteristics which include:
charging voltage, carrier gas pressure, and the gap distance between the spraying gun
electrode tip and the grounded current collector.
For this system, the charging voltage could be switched between 15 kV and 25
kV. Early results showed that the 15 kV charging voltage did not charge the material
enough to be deposited onto the current collector. The 25 kV setting helped with charging
the materials and was used for all tested samples.

44
Carrier gas pressure could range from almost 0 to a maximum of 25 psi.
Generally, 25 psi gave the best deposition results but for some materials it was not ideal.
A high carrier gas pressure did not work well for materials that did not charge and
deposite very well. Since the particles did not charge, they were not drawn to the
grounded current collector, therefore, the carrier gas would just blow the uncharged
particles off of the current collector since there wasn’t any attraction between the
particles and the current collector. For these materials the carrier gas pressure was
reduced to 15 psi. Reducing the pressure even further would start to reduce the deposition
quality again as the low pressure would not be enough to fluidize the particles well
enough to make it to the spraying gun electrode to be charged, and then drawn to the
current collector.
The gap distance between the spraying gun electrode tip was mostly held constant
at 1.5 in. but in some cases needed to be changed depending on the material. Again, the
gap had to be changed for materials that did not charge and deposit well at the standard
1.5 in. gap distance. For these weakly charged materials a 1.5 in. gap distance was too far
of a distance to travel and deposit onto the current collector. The weakly charged
particles was overcome by the stronger gravitational forces and failed to deposit onto the
current collector. A shorter gap distance helped with this as it reduced the distance the
particles needed to travel for deposition. But just like lowering the carrier gas by too
much, if the gap distance is short it will start to give an unsatisfactory deposition. The
short gap distance will cause the coated area to be too small as the material doesn’t have
enough distance to spread out and create a large enough coating for mechanical or
electrochemical tests.

45
Control of Electrode Thickness
A mixture of 80% LiCoO2 , 10% C65, and 10% PVDF was used to determine
how the amount of material loaded to the spraying bottle changed the electrode thickness.
Material amounts ranged from 0.5 g, 1.0 g, 2.0 g, and 7.5 g. Each of the four material
amounts were sprayed with inlet pressure equal to 25 psi and a 1.5 in. gap distance
between the current collector and electrode tip. Before and after spraying, the current
collector was weighed so that the amount of material deposited would be known. With
the amount of material and density of each of the materials known, the thickness of the
coated electrode could be estimated after measuring the area of the coated electrode. It
can be seen in Supplementary Figure 6 that the thickness gradually increases when the
amount of material loaded into the spray bottle increases. Based on the results, 1.0 g of
material was used for subsequent depositions as this amount of material doens’t require
much time to mix and it will still allow for an electrode thickness of 55-60 µm. It should
be noted that 1.0 g of each material used for Co-Spray 2 tests instead of 1.0 total grams
between the two materials.
Supplementary Figure 8. Amount of material loaded before deposition vs. thickness of
the sprayed electrode.

46
References
[1] Dixit, U.S., Narayayanan, R.G., in Metal Forming: Technology and Process
Modelling, Ch. 1 (McGraw Hill Education Private Limited, New Delhi, 2013)
[2] Park, S.H, et al., Synthesis and structural characterization of layered
Li[Ni1/3Co1/3Mn1/3]O2 cathode materials by ultrasonic spray pyrolysis method. Electrochim. Acta 49, 557-563 (2004).
[3] Choi, J., Manthiram, A., Investigation of the Irreversible Capacity Loss in the
Layered LiNi1/3Mn1/3Co1/3O2 Cathodes. Electrochem. Solid-State Lett. 8 C102-
C105 (2005).
[4] Nowak, E.; Combes, G., Stitt, E.H. & Pacek, A.W. A comparison of contact angle
measurement techniques applied to highly porous catalyst supports. Powder
Technol. 233, 52-64 (2013)

47
II. UNDERSTANDING INTERFACIAL-ENERGY-DRIVEN DRY POWDER
MIXING FOR SOLVENT-FREE ADDITIVE MANUFACTURING OF LI-ION
BATTERY ELECTRODES
ABSTRACT
Lithium-ion battery electrodes were manufactured using a new additive
manufacturing process based on dry powders. By using dry powder based processing, the
solvent and its associated drying processes in conventional battery process can be
removed, allowing for large-scale Li-ion battery production to be more economically
viable in markets such as automotive energy storage systems. Processing time after
electrode coating has been greatly reduced due to the time and resource demanding
solvent evaporation process needed with slurry-cast electrode manufacturing being
replaced by a hot rolling process. Uniform mixing distribution of the additive materials
throughout the active material is the driving factor for manufacturing dry powder based
Li-ion batteries. Therefore, this article focuses on developing a physical model based on
interfacial energies to understand the mixing characteristics of the dry mixed particulate
materials. The mixing studies showed that functional electrodes can be manufactured
using dry processing with binder and conductive additive materials as low as 1 wt% due
to the uniformly distributed particles. Mechanical bonding of the reduced binder (1 wt%)
dry manufactured electrodes (93.8 kPa) was found to be slightly better than the bonding
strength of conventional slurry-cast electrodes (83.4 kPa). Electrochemical performance
of the dry manufactured electrodes with reduced conductive additive (1 wt%) and
LiCoO2 as the active material was also promising as the cells retained 77% capacity after
48
100 cycles. While not representative of the best possible electrochemical performance of
Li-ion batteries, the achieved electrochemical performance of the reduced conductive
additive electrodes with LiCoO2 as the active material confirms the well distributed
nature of the conductive particles throughout the electrode matrix.
1. INTRODUCTION
Cost-effective replacements for carbon-based fuels have long been an area of
interest, and lithium-ion batteries represent one of the possible replacements. While
common in portable devices, the use of Li-ion batteries in larger platforms such as
electric vehicles isn’t as practical due to manufacturing and material costs.[1] Li-ion
batteries are made of four basic components; two electrodes (anode and cathode),
separator and electrolyte. Commercial Li-ion electrodes are manufactured by coating a
metallic substrate (current collector) with a slurry. An electrode slurry is made of active
material particles, conductive particle additives (CPA), binder particle additives (BPA),
and a solvent. Slurry preparation is an essential part of the manufacturing process as it
directly influences the morphology of the electrodes, and subsequently, the battery
performance.[2,3] The preparation of the slurry is strongly dependent on the mixing
conditions. Previous mixing studies can include as many as four mixing steps and can
take up to 48 hours to complete.[4] The slurry mixing process can also change due to the
type of solvent used in the slurry. Slurry types are typically classified into two types:
aqueous based and organic solvent based.[4-8]
49
N-methyl-2-pyrrolidone (NMP) is the most commonly used organic solvent and is
mixed with polyvinylidene fluoride (PVDF) to create a homogenous binder suspension
while CPA, typically carbon black, are added to the slurry to improve electrical
conductivity. Care must be taken when using NMP as it is flammable and toxic,
necessitating the use of recovery systems to reduce the environmental hazards.[7-11] The
use of water as the solvent can eliminate these disadvantages with the advantage of being
less expensive than organic solvents.[6,11] Carboxymethyl cellulose (CMC) is used in
place of PVDF when an aqueous system is incorporated and also represents a less
expensive option as opposed to PVDF.[5,7,10,12] However, aqueous based slurries require
additional care due to strong hydrogen bonding causing the particles to agglomerate.[11]
High surface tension of the slurry can also cause issues with the wettability of the slurry
on to the current collector, but this can be counteracted by adding a co-solvent to reduce
the surface tension.[11] High surface tension of aqueous slurries can also lead to electrode
cracking problems upon drying.[13,14]
Electrodes made by either type of slurries must eventually be dry and porous to
enable electrolyte uptake. Aqueous based slurries are more stringent on the removal of
moisture, as compared to organic solvent based slurries, where the water amount must be
below 10-20 ppm.[15] This restriction on moisture content caused the industry to prioritize
organic solvent based slurries. In both slurry types, a high temperature oven is needed to
dry out the electrodes, further increasing manufacturing costs due to the time and energy
needed to fully dry. Drying time can take up to 24 hours with the temperature ranging
from 80-120°C depending on the slurry type.[16,17] Higher solids loading can be a way of

50
reducing drying time but this can lead to difficulties in coating the current collector due
to higher viscosities.[18]
Eliminating the solvent completely represents an ideal scenario as doing so would
remove any recovery equipment and remove the high energy drying process. Previous
studies using pulsed laser and sputtering deposition have shown that dry particle
deposition can produce working batteries. However, they are not suitable for commercial
applications due to prolonged manufacturing time.[19-23] Our previous work has shown
that dry electrodes manufactured using a new dry electrostatic spraying technique (Figure
1) is a promising new manufacturing method.[24]
From a manufacturing standpoint, our solvent-free dry spray manufacturing
process represents a promising alternative for reducing the costs of Li-ion battery
production by ~15%.[24] Here, the effect of particle interfacial energy on the morphology
of electrodes fabricated with the new additive manufacturing process for lithium ion
battery electrodes is presented. The use of dry powders in this new method makes the
electrode morphology dependent on mixing uniformity. The main objective of this article
is to understand the dry mixing characteristics of the battery materials. An interfacial
energy based model was used to reveal sub-micron level mixing is possible even with
minimum amount of BPA and CPA. To this conclusion, it is shown BPA and CPA are
well dispersed throughout the active material which allows for a reduction in BPA and
CPA to 1 wt% while maintaining mechanical and electrochemical performance
comparable to slurry casted electrodes. The mechanical strength of the fabricated
cathodes with reduced BPA material displayed higher strength (93.8 kPa) than slurry-cast
cathodes (83.4 kPa) while also delivering strong electrochemical performance.[24] For this

51
Figure 1. Additive manufacturing system for electrodes created by dry powder process.
interfacial-driven-mixing study, LiCoO2 (LCO) was used as the active material due to its
well-known electrochemical properties. For the dry printed electrodes at lowered
concentrations of additive components, the electrochemical results show good rate
performance from 134 mAh g−1 with a current rate of 0.1 C (98.1% of the theoretical

52
capacity) to 75 mAh g−1 with a current rate of 3 C (54.7% of the theoretical capacity),
and a well-reserved capacity retention during cycling (77% after 100 cycles).
2. RESULTS AND DISCUSSION
2.1. MECHANICAL BONDING MEASUREMENTS
As-received LCO and PVDF were mixed together as the active and binder
materials at 99 wt% and 1 wt%, respectively, to observe the mixing behavior of the
binder throughout the active material. Uniform BPA distribution is needed for ensuring
strong mechanical properties, thus limiting binder particle agglomeration is essential
when attempting to more efficiently use the binder content in the cathode mixture. A
scanning electron microscope (SEM) image (Figure 2a) shows PVDF particles decorating
the surface of LCO with minimal occurrences of PVDF binder agglomerates. The same
powder was deposited onto an aluminum current collector and heated to 250°C to
observe the melting behavior of PVDF on LCO. It is essential for PVDF to wet the
surface of LCO upon melting to increase the viability of producing cathodes without the
assistance of a solvent to coat the active materials with liquified binder as is the case with
conventional slurry-cast processing. An SEM micrograph (Figure 2b) shows PVDF
wetted the surface of LCO upon melting, showing that PVDF and LCO are compatible
materials. Super C65 Carbon (C65) was added to LCO and PVDF at 98 wt% LCO, 1
wt% PVDF, and 1 wt% C65 to observe the change in morphology after C65 is added.
Exposed PVDF in the presence of C65 along with C65 chains are needed for enhancing
mechanical strength through melted PVDF contact points and enhancing cathode
53
conductivity through connected C65. Evidence of both can be seen in Figure 2c which
leads to the next step of thermally activating the PVDF to observe binder contacts points.
A current collector was coated by dry spraying the cathode powder and then hot
rolled. Bonding tests were performed on the thermally activated LCO/PVDF samples
with low strength being observed (5.82 kPa). Previous results indicate a hot rolling and
pressing step is needed to thermally activate the binder and compact the cathode powder
into a high strength layer.[24] An SEM micrograph (Figure 2d) was taken after the cathode
underwent hot rolling and shows exposed PVDF melted and created contact points
between LCO particles, evidence of exposed C65 were also present. Bonding tests were
performed on the cathode samples to quantify the mechanical strength and compare with
previous studies. Previously, the mechanical strength of cathodes manufactured using dry
spray technique (148.8 kPa) with 5 wt% PVDF and 5 wt% C65 were shown to eclipse the
mechanical strength of slurry-cast cathodes (84.3 kPa) with similar composition.[24]
Cathodes fabricated with 1 wt% PVDF and 1 wt% C65 display mechanical strength of
93.8 kPa. While the dry sprayed 1 wt% additive cathodes show a noticeable decrease in
mechanical strength when compared to dry sprayed 5 wt% additive cathodes, it is
important to note that it displays higher strength than cathodes manufactured with the
conventional slurry-casting method (Figure 2e).
2.2. SURFACE ENERGY MEASUREMENTS
Surface energy measurements using the Sessile Drop technique were performed
on the three materials to better understand the interfacial interactions causing the binder
and conductive particle distribution. A dense LCO sputtering target (Kurt J. Lesker

54
Figure 2. a) PVDF assembly on LCO surface. b) Melted PVDF wetting the surface of
LCO. c) PVDF and C65 distributed amongst each other after mixing with LCO. d)
Melted PVDF creating contacts between LCO surfaces with C65 assembled on the PVDF
surface. (scale bars in a-d represent 500 nm) e) Mechanical pull-off test results.

55
Company) was used for LCO characterization to eliminate the possibility of deposited
droplets soaking through the material. Three probing liquids were used for characterizing
LCO, which include diiodomethane, dimethyl sulfoxide (DMSO), and thiodiglycol
(TDG). Table 1 shows the polar and dispersive surface energy components for all probing
fluids used for surface energy characterization.[25-28] The results show that the droplets
form contact angles of 44.6° for diiodomethane (Figure S1a), 62.0° for DMSO (Figure
S1b), and 74.8° for TDG (Figure S1c). Each of the contact angles were entered into the
software to determine the polar, dispersive, and total surface energy components for
LCO. The Owens, Wendt, Rabel, and Kaelble (OWRK) method for calculating surface
free energy was used for characterization. Surface energy due to polar interactions was
1.35 mN m-1 while the surface energy due to dispersive interactions was 37.0 mN m-1.
The low polar component was unexpected considering previous surface energy results for
lithium active material show significantly larger polar energy.[6] Low polar energy can
readily be observed by the contact angle measurements as TDG and DMSO have similar
dispersive energy (34.7-39.2 mN m-1) but differing polar energies (8.68 mN m-1 for
DMSO, and 14.8 mN m-1 for TDG). Since the dispersive energy is similar for the two
liquids any change in contact angle should be related to the changing polar components.
TDG with the higher polar component displayed the larger contact angle.
The low surface energy of LCO, particularly the polar component, is expected to
be due to the addition of moisture and carbon contents on the LCO surface. This
phenomenon was studied by Kim et al where it was found that moisture and carbon
content accumulates on the surface when exposed to air.[29] In their study, washing and
annealing the LCO surface was found to decrease the surface contents. Therefore, the

56
Table 1. Surface tension properties of probing liquids used in contact angle
measurements.
Liquid σl [mN m-1]
σlD
[mN m-1]
σlP
[mN m-1]
Ref.
Thiodiglycol 54 39.2 14.8 25
Dimethyl Sulfoxide
43.54 34.86 8.68 26
Diiodomethane 50.8 50.8 0 27
Ethylene Glycol 47.7 26.3 21.4 28
Formamide 58.2 39 19.2 28
Water 72.8 21.8 51 27
LCO target was heated to 500°C to create an annealed LCO surface for further surface
energy measurements. The same probing liquids were tested with TDG and DMSO
droplets completely wetting the surface while the diiodomethane measured 33.1° (Figure
S2a). It was possible to calculate the dispersive surface energy component of the
annealed LCO due to its lack of a polar surface energy component by using the Young
(Equation 1) and Owens and Wendt (Equation 2) equations for surface energy.[30,31]
𝜎𝑠𝑙 = 𝜎𝑠 − 𝜎𝑙cos(𝜃) (1)
𝜎𝑠𝑙 = 𝜎𝑠 + 𝜎𝑙 − 2(√𝜎𝑠𝐷𝜎𝑙𝐷 +√𝜎𝑠𝑃𝜎𝑙
𝑃) (2)
where σsl, σs, σl, and θ represent the solid-liquid interfacial energy, solid surface energy,
liquid surface energy, and contact angle, respectively. D and P are used to denote the use
of dispersive and polar surface energy components. Annealed LCO dispersive energy was
calculated as 42.5 mN m-1 using this approach. Water was used as a probing liquid due to
its large polar component of surface energy (50.8 mN m-1) and contact angle
measurement found the droplets completely wetting the annealed LCO surface (Figure
S2b). By comparison, a water droplet contact angle of 70.7° was observed on as-received

57
LCO (Figure 2Sc). It is possible to estimate the minimum polar surface energy
component by using the known water surface energy, solid dispersive surface energy, and
using a value of 0° as the contact angle. It is found that for water to completely wet LCO,
the polar surface energy of LCO would at least need to be 35.0 mN m-1 using Equation 3.
𝜎𝑠𝑃 =
(√𝜎𝑠𝐷𝜎𝑙
𝐷−𝜎𝑙)2
𝜎𝑙𝑃 (3)
A PVDF measurement surface was made in the laboratory by pressing as-received
PVDF powder into a 12.5 mm diameter disc-shaped green body. Three fluids were used
to characterize the PVDF: ethylene glycol (EG), formamide, and TDG. The EG droplet
formed a contact angle of 57.12° (Figure S3a) while formamide and TDG droplets
formed contact angles of 64.40° (Figure S3b) and 59.97° (Figure S3c), respectively. Like
LCO, the contact angles for each of the probing liquids were entered into the surface
energy software and the polar, dispersive and total surface energy components for PVDF
were calculated. The OWRK method was used for the calculation and returned a polar
surface energy component of 6.18 mN m-1 and dispersive surface energy component of
24.33 mN m-1. Previous results for PVDF surface energy show similar component surface
energies; therefore, the obtained surface energy components were used for future analysis
involving PVDF.[32,33]
Surface energy measurements using the Sessile Drop Technique proved to be the
most difficult for C65. Initial C65 results were performed on pressed samples with the
same method as PVDF. For C65, the small particle size leads to many pores throughout
the packed material which lead to the probing liquid being quickly absorbed once
dropped onto the surface of the packed material. As a result, conductive graphite powder

58
(MTI Corp.) was used due to its planar structure allowing it to achieve more closed
structure. A graphite green body was pressed similarly to the PVDF green body. EG,
formamide, and TDG were used as the probing liquids to characterize graphite. The EG
droplet formed a contact angle of 60.06° (Figure S4a) while formamide and TDG
droplets formed contact angles of 79.82° (Figure S4b) and 75.05° (Figure S4c),
respectively. The OWRK method shows a polar component of 0.54 mN m-1 and
dispersive component of 56.27 mN m-1. This is in agreement with a previous study using
a similar surface energy characterization technique for graphite powders.[34] For
comparison, surface energy measurements from previous studies on carbon black and
graphite were collected and summarized in Table 2.[34-39]
Due to the minimal polar component of graphite, it is expected that a water
contact angle would show a hydrophobic surface. This behavior was confirmed when a
water droplet on the graphite surface formed with a contact angle of 98.5° (Figure S5a).
While previous liquids soaked through C65, it is speculated the as-received C65 will have
similar surface energy as graphite. To verify the hydrophobic nature of C65 a water
droplet was tested on surface of packed C65 particles. The water droplet failed to deposit
onto the C65 surface, signifying a hydrophobic surface (Figure S5b). To study the carbon
polar component in mixing, surface treatments can be applied to increase the polar
surface energy which leads to a possible change in mixing characteristics. C65 was
modified by the acid/base treatment as specified by Park et al, to observe any possible
polar surface energy increase.[37] A water droplet was used to compare the C65 before
and after surface treatment. While a water droplet failed to interact with the untreated

59
Table 2. Surface energy measurement comparisons for graphite and carbon blacks.
Material σs [mN m-1]
σsD
[mN m-1]
σsP
[mN m-1]
Ref.
Graphite 56.81 56.27 0.54 Herein
Graphite (Natural)
62.43 50.71 11.71 34
Graphite (Artificial)
51.4 50.8 0.60 34
Carbon Black
33.23 18.43 14.80 35
Carbon Black (Oven-
dried)
20.55 18.43 2.12 35
Carbon Black
42.46 35.17 7.29 36
Carbon Black
61.4 31 30.4 37
Carbon Black
64.2 31.1 33.1 38
BP2000 96.2 96.2 0 39
C65, a water droplet on treated C65 readily detached and absorbed into the lightly
pressed powder (Figure S5c), signifying a change from hydrophobicity (contact angle
>90°) to hydrophilicity (contact angle <90°). By using a contact angle of 90° and the
known water surface energy components, an estimation of the treatment effect on the
carbon polar component can be made using Equation 4. When inserting a range of
dispersive energy components (15-60 mN m-1) the minimum polar energy needed to
become hydrophilic ranges from 6.58-0.001 mN m-1.
𝜎𝑠𝑃 =
(2√𝜎𝑠𝐷𝜎𝑙
𝐷−𝜎𝑙)2
4𝜎𝑙𝑃 (4)

60
2.3. THEORETICAL MODEL FOR MIXING PARTICLES WITH LARGE SIZE
DIFFERENCE AND MODEL VALIDATION
Consider particle i and particle j in contact (Figure 3a), a planar interface between
two particles will be created (Figure 3b). The interfacial (contact) area, a0, can be found
by using radius of the contact area based on JKR theory,[40]
𝑎0 = (9𝜋𝑤𝑖𝑗𝑅
2
2𝐸)1/3
(5)
where R and E are the effective particle radius and elastic moduli of the two particles in
contact, and wij is the adhesion work. R and E are defined by
1
𝑅=
1
𝑅𝑖+
1
𝑅𝑗 (6)
1
𝐸=
1−𝑣𝑖2
𝐸𝑖+
1−𝑣𝑗2
𝐸𝑗 (7)
where v is the Poisson ratio. The work of adhesion wij between two particles can be
calculated by Fowkes equation,[41]
𝑤𝑖𝑗 = 2(𝛾𝑖𝑑𝛾𝑗
𝑑)0.5 + 2(𝛾𝑖𝑝𝛾𝑗
𝑝)0.5 (8)
where γid and γj
d are the dispersive surface energies of material i and j while γip and γj
p are
the polar surface energies of material i and j. The contact area is then defined as
𝐴𝑖𝑗 = 𝜋𝑎02.
It can be shown that the total surface energy of two particles in contact can be
written as,
𝐸𝑖𝑗 = 𝐴𝑖𝛾𝑖 + 𝐴𝑗𝛾𝑗 − 𝐴𝑖𝑗𝑤𝑖𝑗 (9)
where Ai and Aj are the surface area of particle i and j respectively, and the last term
accounts for the area in contact. Equation 9 can be extended to a system with multiple
particles. Consider a system with one particle i and Np particles j, the total surface

61
energies E can be written for two situations described as aggregate formation and
intermixed (Figure 3c and Figure 3d). For aggregated situation,
𝐸𝑎𝑔𝑔𝑟𝑒𝑔𝑎𝑡𝑒 = 𝐴𝑖𝛾𝑖 +𝑁𝑝𝐴𝑗𝛾𝑗 − 𝑁𝑝𝐶𝑁3𝐷
2𝐴𝑗𝑗𝛾𝑗 (10)
Figure 3. a) Diagram showing particles i and j touching with the interface and contact
area of the particles after collision (b). c) Formation of a j-particle agglomerate with an
isolated i-particle. d) Formation of a j-particle monolayer on the surface of an i-particle.
It is assumed that the small particles j are uniform in size and their agglomerate is
a 3-dimensional assembly and the number of contacts within the assembly is 𝑁𝑝𝐶𝑁3𝐷
2,
where CN3D is coordination number in 3D assembly.[42] For intermixed situation,
𝐸𝑖𝑛𝑡𝑒𝑟𝑚𝑖𝑥𝑒𝑑 = 𝐴𝑖𝛾𝑖 + 𝑁𝑝𝐴𝑗𝛾𝑗 − 𝑁𝑝𝐶𝑁2𝐷
2𝐴𝑗𝑗𝛾𝑗 − 𝑁𝑝𝐴𝑖𝑗𝑤𝑖𝑗 (11)
In this case, j particles form a monolayer, which is considered as a 2-dimensional
assembly, on the particle i surface. The number of contact points among particles j is
𝑁𝑝𝐶𝑁2𝐷
2, where CN2D is the 2D coordination number. The mixing outcome can be
evaluated by simply calculating,
∆𝐸 = 𝐸𝑎𝑔𝑔𝑟𝑒𝑔𝑎𝑡𝑒 − 𝐸𝑖𝑛𝑡𝑒𝑟𝑚𝑖𝑥𝑒𝑑 = {𝐴𝑖𝑗𝑤𝑖𝑗 + 𝐴𝑗𝑗𝛾𝑗(𝐶𝑁2𝐷−𝐶𝑁3𝐷
2)}𝑁𝑝 (12)

62
with a positive ΔE value indicating intermixing, and negative value indicating aggregate
formation. Using CN3D = 12, and CN2D = 6, ΔE/Np can be simplified as,[43]
∆𝐸/𝑁𝑝 = 𝐴𝑖𝑗𝑤𝑖𝑗 − 3𝐴𝑗𝑗𝛾𝑗 (13)
This model is used for materials with large differences in particle size as is the
case when LCO (5-10 μm) is mixed with PVDF (~250 nm) or C65 (~50 nm). The ΔE/Np
is first calculated for LCO (i) and PVDF (j) particles. Measured surface energy
components of PVDF (dispersive: 24.33 mN m-1, polar: 6.18 mN m-1) are used with LCO
allowed to vary. The contour plot of ΔE/Np is shown in Figure 4a where a combination of
low polar (0-20 mN m-1) and low dispersive (0-5 mN m-1) surface energy components
(blue region, aggregate) for LCO will correlate to negligible PVDF assembly on the LCO
surface. This behavior was also verified by an independent Discrete Element Simulation
study.[44] A transition area (blue - yellow) was observed where the PVDF agglomerate
was attached to LCO but the work of adhesion between LCO and PVDF was not strong
enough to overcome the work of cohesion between PVDF particles to fully break apart
the PVDF particle agglomerate. The yellow region (intermixed) is associated with PVDF
monolayer assembly. The surface energy components of as-received LCO and annealed
LCO (indicated by red) are found to be in yellow region. Experimental mixing results of
as-received LCO with PVDF (Figure 2a) and annealed LCO with PVDF (Figure S6)
show the distribution of PVDF throughout the LCO particles are in agreement with the
predicted mixing behavior.
The ΔE/Np is computed for LCO (i) and C65 (j) and a contour plot was developed
with the dispersive and polar LCO surface energy set to 40 mN m-1 and 100 mN m-1,
respectively, for the case representing LCO with a large polar component (e.t. annealed

63
Figure 4. a) LCO-PVDF modeling showing the preferred PVDF assembly with varying
LCO surface energy values (red arrow next to annealed LCO signifies that the measured
polar surface energy component is a minimum value)(blue area denotes aggregation). b)
LCO-C65 modeling results showing preferred mixing of C65 with LCO dispersive and
polar surface energy set to 40 mN m-1 and 100 mN m-1, respectively (yellow denotes C65
coverage on LCO). Red dots in (a) and (b) denote as measured values, yellow dots denote
value from literature. c) LCO-C65 modeling showing preferred mixing of C65 with LCO
dispersive and polar surface energy set to 40 mN m-1 and 2 mN m-1, respectively (yellow
denotes C65 coverage on LCO). Histogram comparison for C65 coverage on LCO for as-
received LCO mixed with as-received C65 (d), annealed LCO with as-received C65 (e),
and annealed LCO with treated C65(f).
LCO). Figure 4b shows a large range of polar (0-100 mN m-1) and dispersive (0-70 mN
m-1) values of C65 will cause assembly on the LCO surface. In the LCO and C65 study,

64
the transition from intermixed (assembly) region to aggregate region shows a C65
agglomerate attached to LCO. The work of adhesion between C65 and LCO is large
enough such that the C65 agglomerate will attach to the surface of LCO. In this case, the
work of cohesion of the C65 prevents the C65 agglomerate from breaking apart. A
second LCO-C65 contour plot (Figure 4c) was developed to observe the LCO-C65
mixing characteristics when the LCO polar surface energy was lowered to 2 mN m-1.
This configuration represents the surface energy case for the measured as-received LCO.
In this configuration, the area representing C65 assembly on LCO is greatly reduced to
lower-left corner with polar and dispersive energy combinations between 0-15 mN m-1
and 0-40 mN m-1, respectively. As can be seen from modeling, polar component of the
LCO has major impact in carbon distribution.
An experimental comparison was made with three different LCO and C65
powders to observe any changes in C65 distribution, the mixing combinations were as-
received LCO with as-received C65, annealed LCO with as-received C65, and annealed
LCO with treated C65. Firstly, it is found minimal untreated C65 particle coverage was
observed on as-received LCO. By increasing the polar surface energy component of LCO
(annealed LCO), untreated C65 was found to more readily assemble on the LCO surface.
This behavior was confirmed with electron-dispersive X-ray (EDX) quantification studies
performed on the surface of individual LCO particles. Histograms (Figure 4d, 4e, 4f)
show that the as-received LCO particles contained lower amounts of C65 than the
annealed LCO particles. This agrees with the modeling results where C65 showed
minimal assembly on the low polar surface energy surface of as-received LCO (Figure
4e). Furthermore, experimental mixing results for untreated vs. treated C65 mixed with

65
annealed LCO were shown to display similar C65 coverage on the LCO surface. This can
be explained by the treated and untreated C65 surface energy values lying in the same
region denoting assembly on a high polar LCO surface (Figure 4b) despite higher polar
components in treated C65.
2.4. THEORETICAL MODEL FOR MIXING PARTICLES WITH SIMILAR
SIZES AND MODEL VALIDATION
A separate model was developed where two materials, i and j, are similar in size.
This model also has two surface energy situations where the two materials are intermixed
amongst each other and where the two materials exhibit minimal mixing forming an
aggregate (same type of particles tend to agglomerate with minimal intermixing of
different particle types) (Figure 5). The aggregate situation shows strong bonding
amongst similar particles, preventing different particle types to break apart and intermix.
In this model, there will be Np number of j particles and nNp number of i particles. For
aggregate situation,
𝐸𝑎𝑔𝑔𝑟𝑒𝑔𝑎𝑡𝑒 = 𝑁𝑝𝐴𝑖𝛾𝑖 − 𝑁𝑝𝐶𝑁3𝐷
2𝐴𝑖𝑖𝛾𝑖 +𝑛𝑁𝑝𝐴𝑗𝛾𝑗 − 𝑛𝑁𝑝
𝐶𝑁3𝐷
2𝐴𝑗𝑗𝛾𝑗 (14)
In the aggregate situation, it is assumed that i particles form a 3-dimensional
assembly in contact with a j particle 3-dimensional assembly (Figure 5a). In the
intermixed situation, it is assumed an i particle is surrounded and intermixed amongst j
particles in a 3-dimensional assembly (Figure 5b). For intermixed situation,
𝐸𝑖𝑛𝑡𝑒𝑟𝑚𝑖𝑥𝑒𝑑 = 𝑁𝑝𝐴𝑖𝛾𝑖 + 𝑛𝑁𝑝𝐴𝑗𝛾𝑗 − (𝑛𝑁𝑝 − 𝑁𝑝)𝐶𝑁3𝐷
2𝐴𝑗𝑗𝛾𝑗 − 𝑁𝑝
𝐶𝑁3𝐷
2𝐴𝑖𝑗𝑤𝑖𝑗 (15)
The mixing outcome for this model was evaluated by,
∆𝐸 = 𝐸𝑎𝑔𝑔𝑟𝑒𝑔𝑎𝑡𝑒 − 𝐸𝑖𝑛𝑡𝑒𝑟𝑚𝑖𝑥𝑒𝑑 = (𝐴𝑖𝑗𝑤𝑖𝑗 − 𝐴𝑖𝑖𝛾𝑖 − 𝐴𝑗𝑗𝛾𝑗)𝑁𝑝𝐶𝑁3𝐷
2 (16)

66
with a positive ΔE value indicating intermixing, and negative value indicating an
aggregate is formed.
This model for similar sized particle was applied to predict the mixing of PVDF
and C65 due to their comparable sizes. PVDF (i) surface energy was kept constant at the
measured surface energy values previously discussed and C65 (j) was allowed to vary. A
contour plot (Figure 5c) shows a combination of polar surface energy values from 0-20
mN m-1 and dispersive surface energy values from 10-45 mN m-1 will result in intermixed
PVDF/C65 particles. Measured carbon black surface energy values are located within the
intermixing area which is in agreement with the intermixed nature found in SEM images
(Figure 2c) when C65 and PVDF are mixed together. The contour plot shows the
remaining carbon black and graphite surface energy values are located just outside of the
intermixed zone. The graphite used for surface energy measurements was mixed with
PVDF and it was found that PVDF will decorate the graphite surface (Figure S7). The
behavior of graphite and PVDF is expected to be due to the measured graphite surface
energy being in a transitional area where PVDF and carbon materials will begin to
display lesser mixing uniformity.
2.5. ELECTROCHEMICAL CHARACTERIZATION
There exist specific concentration requirements for BPA and CPA in the industry
of Li-ion batteries to enable all active material to be functionalized properly. Limited to
the mixing characteristics of the conventional slurry casting method, aggregates of BPA
and CPA are unnecessarily formed during the manufacturing procedure and thereby these

67
Figure 5. a) Diagram showing formation of an i-j aggregate. b) Diagram showing
formation of i-j intermixed particles. c) PVDF-C65 contour plot showing preferred
mixing of PVDF when C65 surface energy values are varied (blue denotes aggregation).

68
“dead materials” would increase the concentration requirements of them. However, more
efficient usage of the additives can be possible by making use of the information gained
in the previous mixing studies to obtain uniform BPA and CPA distribution throughout
the active material. PVDF particles were found to be uniformly distributed among LCO
regardless of the surface condition (as-received vs. annealed), and strength tests show a
reduction to 1 wt% yields sufficient bonding. There was a change in C65 distribution
depending on the surface condition of LCO with the annealed surface displaying an
increase in C65 uniformity. It was shown surface treatment of C65 influenced the surface
energy, however, the effect on mixing uniformity among LCO was minimal.
Therefore, electrochemical tests were performed with annealed LCO, as-received PVDF,
and as-received C65. The reduction in CPA was performed to show that the fabricated
cathodes still exhibit reasonable electrochemical performance due to the CPA particles
being uniformly distributed amongst the active material and BPA. Figure 6a shows the
rate performance of the dry printed cathode electrodes with lowered additives loading (98
wt% LCO, 1 wt% PVDF, 1 wt% C65) over the voltage range 4.2-2.5V vs Li/Li+. The cell
achieved a specific discharge capacity of 134 mAh g−1 at 0.1 C, which is 98% of
theoretical capacity. At the rates of 0.2 C, 0.5 C, 1 C, 2 C and 3 C, these rate
performances were lowered to 132 mAh g−1, 127 mAh g−1, 120 mAh g−1, 100 mAh g−1,
and 75 mAh g−1, respectively, which exhibit a consistently stable rate capability of the
samples. Up to the current rate of 3C, these dry printed samples can still supply 55%
theoretical capacity of the active material, which provides good evidence of the uniform
mixing behavior of this new electrode manufacturing process. Cycling data (Figure 6b)
shows the cell’s capacity steadily decayed from 127.8 mAh g−1 to 98.5 mAh g−1 at the

69
current rate of 0.5C after 100 cycles 77% capacity retention. Electrochemical Impedance
Spectroscopy (EIS) tests were also performed during cycling (provided in the
supplemental information).
Figure 6. Electrochemical performance of sample with lowered binder/conductive
additive loading (98 wt% LCO, 1 wt% PVDF, 1 wt% C65): a) Rate Performance. b)
Cycling performance for 100 cycles.

70
3. CONCLUSION
A largely decreased loading of BPA and CPA means lowered bonding effects and
electro-conductivity of the electrode during cycling, which both would lead to a decline
of the electrochemical performance. Even so, the experimental results show favorable
mechanical strength capacity retention during cycling, which support our analysis on the
beneficial dispersion homogeneity of our dry printing method through optimal material
mixing. LCO was used as the active material in this mixing study but other materials,
such as LiNiMnCoO2, LiMn2O4, and LiFePO4, can also be characterized as the presented
mixing models can be extended to any range of surface energy values. Based on the
mixing results, annealed LCO was used for electrochemical testing as C65 was found to
be more uniformly mixed, allowing for a functional battery to be fabricated with CPA
concentration as low as 1%. BPA concentration was also reduced due to the uniform
dispersion of PVDF throughout LCO, regardless of the surface condition of LCO. In
addition, the fabricated samples showed stable physical characteristics while being built
into the test coin cells. The surface of samples is strongly bonded and no particles were
observed to detach from the electrode layer matrix. In summary, there appear no major
technical barriers by using dry powder in achieving submicron level mixing. It is
anticipated that the mechanical and electrochemical performance of dry manufactured
electrodes can be comparable to slurry casted ones by optimizing BPA and CPA
concentrations due to excellent mixing efficiency, driven by the interfacial energies.

71
4. EXPERIMENTAL SECTION
4.1. ADDITIVE MANUFACTURING PROCESS
Figure 1 shows an electrostatic spraying system to deposit completely dry
electrode particles to the current collector. It consists of a powder mixing and feeding
unit and an electrostatic spraying gun. A spraying gun is used to charge the fluidized dry
particles which are then drawn to the ground current collector and deposited. A hot roller
is used in place of the traditional slot die or doctor blade to control thickness and porosity
by pressing the deposited electrode powders. Thermal activation is also achieved during
the hot rolling step.
4.2. POWDER PREPARATION
Dry cathode materials, LCO (MTI), Super C65 carbon black (Timcal), and PVDF
(MTI), were mixed with zirconia beads in a BeadBug Microtube Homogenizer
(Benchmark Scientific) at 2800 RPM. For heated LCO the powder was washed with
acetone, ethanol, and isopropyl alcohol. The washed LCO powder was then rinsed with
water and heated to 500°C for one hour. Surface treatment of C65 as specified by Park et
al, was completed by immersing the C65 powder in a 0.1 N NaOH solution and then
rinsing with deionized water and dried.[37] Surface morphology of the mixed powders
were investigated using a Hitachi S-4700 field-emission scanning electron microscope
operating with an emission current of 10 µA and 10 kV accelerating voltage.

72
4.3. MECHANICAL BONDING MEASUREMENTS
Mechanical bonding tests were performed on hot rolled samples to quantify the
binder performance. A hot roller was used for thermal activation of the binder, and to
increase the density of the deposited electrode powders. The top and bottom rollers were
to 180 °C. A Mark-10 Series 4 force gauge was paired with a Mark-10 ES10 manual
hand wheel test stand. To perform the test, the electrode sample was mounted onto the
test stand base with the center of the coated region directly below the force gauge. A 0.5
in. diameter flat head (Mark-10) with double sided tape (7 mm by 12 mm) attached to the
flat bottom surface was connected to the force gauge to obtain a flat pressing surface. The
force gauge was lowered until the taped surface touched the sample and then further
compressed to 50 N. After compression, the force gauge was decompressed at a rate of 1
rotation over 20 seconds until the tape attached to the flat head was brought into tension
and decoupled from the coated area. The maximum tensile force was recorded and
converted to the maximum strength by incorporating the known contact area of the tape.
4.4. SURFACE ENERGIES MEASUREMENT
The Sessile Drop Technique was used as the characterization method for surface
energy. An OCA15EC/B Contact Angle Measuring Device by DataPhysics was used to
capture the contact angles and subsequently calculate polar, dispersive, and total surface
energies of the battery electrode materials. The Sessile Drop Technique is typically
performed on a flat bulk solid material; therefore, packing each electrode powder as
densely as possible is required. This will allow the densely packed particles to be
analyzed as a single solid material. If the powders are not packed well the probing liquid

73
will readily soak through the pores between the particles. LiCoO2 (LCO), polyvinylidene
fluoride (PVDF), and Super C65 carbon black (C65) were the three materials tested and
each required their own set of packing requirements. LCO was characterized with an
LCO sputtering target from Kurt J. Lesker Company due to the difficulty of pressing the
LCO powder to the porosity needed to obtain closed pores. The target provides a highly
pure (99.7%) and dense material to perform the surface energy characterization. In the
cases for PVDF and C65 powders, samples needed to be laboratory made by compressing
the powders into dense green bodies. This method was proven to be successful in a
previous study for measuring sessile drop contact angles on powders.[34] The green
components were fabricated by loading the powders into a pressing die and compressed
with a pressure of 263 MPa. A Carver Bench Top Press was used for the pressing
process. PVDF samples were successfully made with this procedure while graphite (MTI)
needed to be used in place of C65 for the surface energy calculations of carbon.
4.5. ELECTROCHEMICAL MEASUREMENTS
Dry sprayed electrodes were electrochemically tested against graphite anode for
cycling test and against Li foil for rate performance test (as reference and counter
electrode). For coin cells, cathode and anode electrodes were punched into disks of 12
mm diameter and dried at 60 °C under vacuum overnight before assembling. All
electrodes were built in 2032 coin cells, and were tested with an Arbin BT2043 tester. Li
foils are from MTI and two pieces of Celgard 2500 microporous separator was placed
between electrodes. The electrolyte is at the composition of 15.2 wt% LiPF6, 25.4 wt%
ethylene Carbonate, 59.4 wt% ethyl methyl carbonate (from TOMIYAMA). Cells For

74
rate performance, cells were charged to 4.2 V and discharged to 2.5 V at various rates
such as 0.05C, 0.1 C, 0.2 C, 0.5 C, 1 C, 2 C, and 3 C. For cycling performance, cells were
charged to 4.2 V and discharged to 2.5 V at 0.5 C. Constant current charging and
discharging were used for all tests.
ACKOWLEDGEMENTS
B. Ludwig and J. Liu contributed equally to this work. This work is financially
supported by NSF CMMI-1462343 and CMMI-1462321. This work is also partially
supported by seeding funds from Intelligent System Center (ISC) and Material Research
Center (MRC) at Missouri University of Science and Technology.
REFERENCES
[1] J.-M. Tarascon, M. Armand, Nature 2001, 414, 359.
[2] A. Kraytsberg, Y. Ein-Eli, Adv. Energy Mat. 2016, 6, 1600655.
[3] G.-W. Lee, J.-H. Ryu, W. Han, K. H. Ahn, S. M. Oh, J. Power Sources 2010,
195, 6049.
[4] D. Liu, L.-C. Chen, T.-J. Liu, T. Fan, E.-Y. Tsou, C. Tiu, Adv. Chem. Eng. Sci.
2014, 4, 515.
[5] C.-C. Li, Y.-W. Wang, J. Power Sources 2013, 227, 204.
[6] J. Li, C. Rulison, J. Kiggans, C. Daniel, D. L. Wood, J. Electrochem. Soc. 2012,
159, A1152.
[7] A. Guerfi, M. Kaneko, M. Petitclerc, M. Mori, K. Zaghib, J. Power Sources,
2007, 163, 1047.

75
[8] M. A. Spreafico, P. Cojocaru, L. Magagnin, F. Triulzi, M. Apostolo, Ind. Eng.
Chem. Res. 2014, 53, 9094.
[9] C. Daniel, JOM 2008, 60, 43.
[10] I. Doberdo, N. Loffler, N. Laszczynski, D. Cericola, N. Penazzi, S. Bodoardo, G.-
T. Kim, S. Passerini, J. Power Sources 2014, 248, 1000.
[11] J. Li, B. L. Armstrong, J. Kiggans, C. Daniel, D. L. Wood, Langmuir 2012, 28,
3783.
[12] B. Bitsch, J. Dittmann, M. Schmitt, P. Scharfer, W. Schabel, N. Willenbacher, J.
Power Sources 2014, 265, 81.
[13] Z. Du, K. M. Rollag, J. Li, S. J. An, M. Wood, Y. Sheng, P. P. Mukherjee, C.
Daniel, D. L. Wood, J. Power Sources 2017, 1.
[14] N. Loeffler, J. von Zamory, N. Laszczynski, I. Doberdo, G.-T. Kim, S. Passerini,
J. Power Sources 2014, 248, 915.
[15] J. Li, C. Daniel, D. Wood, J. Power Sources 2011, 196, 2452.
[16] T. Cetinkaya, A. Akbulut, M. O. Guler, H. Akbulut, J. Apple. Electrochem. 2014,
44, 209.
[17] Z. Wei, L. Xue, F. Nie, J. Sheng, Q. Shi, X. Zhao, J. Power Sources 2014, 256,
28.
[18] C.-M. Chan, S. Venkatraman, Coating Rheology, in Coatings Technology:
Fundamentals, Testing, and Processing Techniques, 3rd Ed., ed. A. A. Tracton,
Taylor & Francis Group, Boca Raton, FL 2007.
[19] S. Koike, K. Tatsumi, J. Power Sources 2007, 174, 976.
[20] N. Kuwata, J. Kawamura, K. Toribami, T. Hattori, N. Sata, Electrochem.
Commun. 2004, 6, 417.
[21] B. Yan, J. Liu, B. Song, P. Xiao, L. Lu, Sci. Rep. 2013, 3, 3332.
[22] L. Baggetto, R. R. Unocic, N. J. Dudney, G. M. Veith, J. Power Sources 2012,
211, 108.
[23] K.-F. Chiu, Thin Solid Films 2007, 515, 4614.
[24] B. Ludwig, Z. Zheng, W. Shou, Y. Wang, H. Pan, Sci. Rep. 2016, 6, 23150.
76
[25] J.-R. Chen, T. Wakida, J. Appl. Polym. Sci. 1997, 63, 1733.
[26] F. M. Fowkes, S. Maruchi, Coatins and Plastics Preprints 1977, 37, 605.
[27] G. Ström, M. Fredriksson, P. Stenius, J. Colloid Interface Sci. 1987, 119, 352.
[28] P.-J. Sell, D. Renzow, Prog. Org. Coat. 1975, 3, 323.
[29] J. Kim, Y. Hong, K. S. Ryu, M. G. Kim, J. Cho, Electrochem. Solid-State Lett.
2006, 9, A19.
[30] T. Young, Philos. Trans. R. Soc. London 1805, 95, 65.
[31] D. K. Owens, R. C. Wendt, J. Appl. Polym. Sci. 1969, 13, 1741.
[32] S. Wu, J. Polym. Sci. C 1971, 34, 19.
[33] M. Morra, E. Occhiello, R. Marola, F. Garbassi, P. Humphrey, D. Johnson, J.
Colloid Interface Sci. 1990, 137, 11.
[34] J. Lee, B. Lee, Carbon Lett. 2017, 21, 107.
[35] M. Mezgebe, Q. Shen, J.-Y. Zhang, Y.-W. Zhao, Colloids Surf. A 2012, 403, 25.
[36] H. F. Wang, T. Troxler, A. G. Yeh, H. L. Dai, J. Phys. Chem. C 2007, 111, 8708.
[37] S. J. Park, M. K. Seo, C. Nah, J. Colloid Interface Sci. 2005, 291, 229.
[38] A. S. Arico, V. Antonucci, M. Minutoly, N. Giordano, Carbon 1989, 27, 37.
[39] A. Siebold, A. Walliser, M. Nardin, M. Oppliger, J. Schultz, J. Colloid Interface
Sci. 1997, 186, 60.
[40] K. L. Johnson, K. Kendall, A. D. Roberts, Proc. R. Soc. London A 1971, 324, 301.
[41] F. M. Fowkes, J. Colloid Interface Sci. 1968, 28, 493.
[42] A. Upadhyaya, G. S. Upadhyaya, Powder Metallurgy: Science, Technology, and
Materials, Universities Press (India) Private Limited, Hyderabad, India 2011.
[43] X. D. Wen, T. J. Cahill, R. Hoffmann, Chem. – Eur. J. 2010, 16, 6555.
[44] B. Ludwig, J. Liu, Z. Zhang, Y. Wang, H. Pan, ASME J. Micro Nano-Manuf.
2017, in preparation.

77
SUPPLEMENTARY MATERIALS
Surface Energy Measurement and Discussions
To understand the mixing behavior of the electrode powders the surface energy
needed to be measured. The sessile drop contact angle technique was used as the
characterization method. In this technique, know probing liquids are deposited on a
surface. Based on the contact angle and known surface energy components of the probing
liquid an estimation of the unknown solid surface energy can be made. Ideally, this
method is used for solid bulk materials where liquid absorption into the solid material is
avoided due to closed porosity.
An OCA15EC/B Contact Angle Measuring Device by DataPhysics was used to
capture the contact angles and to calculate polar, dispersive, and total surface energies of
the battery electrode materials. As previously mentioned, the Sessile Drop Technique is
typically performed on a flat bulk solid material; therefore, packing each electrode
powder as densely as possible is required. This will allow the densely packed particles to
be analyzed as a single, solid material.[1] If the powders are not packed well the probing
liquid will readily soak through the pores between the particles. LiCoO2 (LCO),
polyvinylidene fluoride (PVDF), Super C65 carbon black (C65), and graphite were
analyzed with this method.
LCO was characterized with an LCO sputtering target from Kurt J. Lesker
Company. The target provides a highly pure (99.7%) and dense material to perform the
surface energy characterization. Diiodomethane, dimethyl sulfoxide (DMSO), and
thiodiglycol (TDG) were used for LCO characterization. The results show that the

78
droplets form contact angles of 44.6° for diiodomethane (Figure S1a), 62.0° for DMSO
(Figure S1b), and 74.8° for TDG (Figure S1c).
Each of the contact angles were entered into the software provided by
DataPhysics to determine the polar, dispersive, and total surface energy components for
LCO. The Owens, Wendt, Rabel, and Kaelble (OWRK) method for calculated surface
free energy was used characterize LCO. It was found that the surface energy due to polar
interactions was 1.35 mN m-1 while the surface energy due to dispersive interactions was
37.0 mN m-1. A line fitted to the plotted points for each of the probing liquids used in the
OWRK method gave an error value of 0.997 and the fitted line represents a very close fit
to the plotted points (Figure S1d).
Figure S1 | LCO Surface Energy Characterization. Droplets formed by (a)
diiodomethane, (b) DMSO, and (c) TDG on LCO to determine the contact angles needed
for surface energy characterization for LCO. d) Surface energy plot for each of the
probing liquids using the WORK method to estimate the surface free energy components
of LCO.

79
A previous paper measuring the surface energy of a lithium active material
(LiFePO4) showed a similar dispersive energy component to LCO but with a significantly
higher polar energy component.[2] The LCO target was washed with acetone, ethanol, and
isopropyl alcohol and then rinsed with deionized water to eliminate any surface
contamination. Afterwards, the LCO target was heated to 500°C to eliminate any
moisture left from washing and rinsing. The probing liquids were deposited onto the
surface after the target cooled to room temperature. DMSO and TDG completely wetted
the surface while diiodomethane was reduced to 33.1°. As mentioned in the main text,
diiodomethane could be used to calculate the dispersive energy component of the heated
LCO surface (42.5 mN m-1). Water was used to estimate the polar surface energy due to
its large polar energy component (51 mN m-1). Water completely wetted the heated LCO
surface (Figure S2b) and formed a contact angle of 70.7° on the as-received LCO surface
(Figure S2c). The minimum polar component associated with the heated LCO surface
was calculated to be 35.0 mN m-1 by using the known water surface energy components,
dispersive energy of the heated LCO, and a contact angle of 0°.
Figure S2. (a) Diiodomethane contact angle on heated LCO showing a 20° decrease as
compared to as-received LCO. Comparison of water droplet contact angles on (b) heated
LCO surface and (c) as-received LCO surface.

80
The PVDF sample used for surface energy characterization was made in the
laboratory. An as-received PVDF green component with closed porosity was made by
pressing the PVDF powder into a 12.5 mm diameter disc-shape using a pressing die. A
pressing pressure of 263 MPa was used and the pressing process was completed using a
Carver Bench Top Press. Three fluids were used to characterize the PVDF: ethylene
glycol (EG), formamide, and TDG. The EG droplet formed a contact angle of 57.12°
(Figure S3a) while formamide and TDG droplets formed contact angles of 64.40° (Figure
S4b) and 59.97° (Figure S4c), respectively. A polar surface energy component of 6.18
mN m-1 and dispersive surface energy component of 24.3 mN m-1 were found using the
OWRK method. A fitted line to the plotted points (Figure S3d) shows a very close fit
(error value of 0.999). The calculated surface energy for PVDF is in agreement with
previous studies on PVDF surface energy and was used in further testing.[3,4]
Polar and dispersive surface energy measurements using the Sessile Drop
Technique proved to be most difficult for C65. A C65 green component was made
similar to that of the PVDF green component, but the small particle size leads to many
pores throughout the packed material. The probing liquids was readily soaked into the
packed C65 once dropped onto the surface. As a result, conductive graphite powder (MTI
Corp.) was used due to its planar structure allowing it to be achieve a closed porosity
surface more readily. A graphite green body was pressed and EG, formamide, and TDG
were used as the probing liquids for characterization. The EG droplet formed a contact
angle of 60.06° (Figure S4a) while formamide and TDG droplets formed contact angles
of 79.82° (Figure S4b) and 75.05° (Figure S4c), respectively. Again, the OWRK method
was used and a polar component of 0.54 mN m-1 and dispersive component of 56.27 mN

81
m-1 were found. A fitted line to the plotted probing liquid points again show a very good
fit (Figure S4d).
Figure S3 | PVDF Surface Energy Characterization. Droplets formed by a) EG, b)
formamide, and c) TDG on PVDF to determine the contact angles needed for surface
energy characterization for PVDF. d) Surface energy plot for each of the probing liquids
used to estimate the surface free energy components of PVDF.
While graphite and C65 are both carbon materials, more studies were conducted
on C65 since the surface energy measurements for graphite may not be representative of
C65. Surface energy measurements of carbon black, as well as graphite, from previous
studies were gathered as can be seen in Table 2.[5-10] It was found that the graphite surface
energy measurement in previous studies also show low dispersive energy.[5] This can
readily be observed by the hydrophobic (contact angle of 98.5°) nature of the graphite

82
Figure S4 | Graphite Surface Energy Characterization. Droplets formed by a) EG, b)
formamide, and c) TDG on graphite to determine the contact angles needed for surface
energy characterization for graphite. d) Surface energy plot for each of the probing
liquids used to estimate the surface free energy components of graphite.
when depositing a water droplet on the surface (Figure S5a). Previous studies also show
that an increased polar component can be achieved by performing an acid/base treatment
on the carbon black. Surface treatment was performed on C65 by following the procedure
specified by Park et al.[8] Water droplets were tested on as-received C65 and treated C65
to observe any differences made by the surface treatment. The as-received C65 displayed
a hydrophobic nature as can be seen in Figure S5b where the water droplet failed to
detach from the probing syringe and deposit on the surface. However, a water droplet
deposited on the treated C65 surface readily detached from the probing syringe and
soaked through.

83
Figure S5. (a) Water droplet on the hydrophobic graphite surface. (b) Water droplet
showing the hydrophobicity of as-received C65. (c) Water droplet soaking through
treated C65, showing a change to hydrophilicity.
Binder Distribution on As-Received LCO and Annealed LCO
Changes in LCO surface energy were observed when the LCO was washed and
heated. A minimal increase in dispersive energy was observed while the polar energy
increased from 1.35 mN m-1 to >35.0 mN m-1. PVDF was mixed with both types of LCO
since PVDF distribution is essential for created a strongly bonded electrode. SEM
micrographs in Figure S6 show similar PVDF behavior where the PVDF particles
decorate the surface of LCO. This behavior matches modeling results where surface
energy components for both types of LCO are contained in the contour plot area
signifying PVDF assembly on the LCO surface.
Figure S6. PVDF particle assembly on (a) as-received LCO and (b) annealed LCO.
(Scale bar represents 5 μm)

84
Graphite/PVDF Mixing Result
Graphite and PVDF were mixed with zirconia beads in a BeadBug Microtube
Homogenizer (Benchmark Scientific) at 2800 RPM to understand the mixing behavior of
particles when the surface energies are next to the zone transitioning from particle
separation and particle intermixing. Figure S7 shows that PVDF particles are attached on
the surface of graphite particles.
Figure S7. PVDF particles attaching to the surface of graphite. (Scale bar represents 5
μm)
EIS Measurement
Impedance is a collective response of kinetic processes with different time
regimes. Electrochemical Impedance Spectroscopy tests were performed with a
galvanostat/potentiostat/impedance analyzer (Bio-logic VMP3), and was carried out from
0.05 Hz to 200 KHz using a 10 mV AC signal. The Nyquist plots of the printed

85
LCO/Graphite cell at fully discharged state are shown in Figure S7. The printed
electrodes were designed and fabricated with the lowered concentration of binder/CA
material. The Nyquist plots of the dry printed LCO/Graphite electrode showed an
increased chemical reaction impedance during the cycle test, and the impedance was
becoming larger while testing for more cycles. This phenomenon can be attributed to the
cracks and shape deformation which occurred during the intercalation/ deintercalation of
Li+ process.
Figure S8. EIS measurements of the cell during at the fully discharged state after the 10th
cycle, the 60th cycle and the 100th cycle.
References
[1] E. Nowak, G. Combes, E. H. Stitt, A. W. Pacek, Powder Technol. 2013, 233, 52.
[2] J. Li, C. Rulison, J. Kiggans, C. Daniel, D. L. Wood, J. Electrochem. Soc. 2012, 159,
A1152.
86
[3] S. Wu, J. Polym. Sci. C 1971, 34, 19.
[4] M. Morra, E. Occhiello, R. Marola, F. Garbassi, P. Humphrey, D. Johnson, J. Colloid
Interface Sci. 1990, 137, 11.
[5] J. Lee, B. Lee, Carbon Lett. 2017, 21, 107.
[6] M. Mezgebe, Q. Shen, J.-Y. Zhang, Y.-W. Zhao, Colloids Surf. A 2012, 403, 25.
[7] H. F. Wang, T. Troxler, A. G. Yeh, H. L. Dai, J. Phys. Chem. C 2007, 111, 8708.
[8] S. J. Park, M. K. Seo, C. Nah, J. Colloid Interface Sci. 2005, 291, 229.
[9] A. S. Arico, V. Antonucci, M. Minutoly, N. Giordano, Carbon 1989, 27, 37.
[10] A. Siebold, A. Walliser, M. Nardin, M. Oppliger, J. Schultz, J. Colloid Interface Sci.
1997, 186, 60.

87
III. SIMULATION OF MICRO/NANOPOWDER MIXING CHARACTERISTICS
FOR DRY SPRAY ADDITIVE MANUFACTURING OF LI-ION BATTERY
ELECTRODES
ABSTRACT
A new dry spraying additive manufacturing method for Li-ion batteries has been
developed to replace the conventional slurry-casting technique for manufacturing Li-ion
battery electrodes. A dry spray manufacturing process can allow for the elimination of the
time- and energy-intensive slurry drying process needed due to the use solvents to make
the electrodes. Previous studies into the new manufacturing method have shown
successful fabrication of electrodes which have strong electrochemical and mechanical
performance. Li-ion battery electrodes typically consist of three basic materials: active
material (AM), binder particle additives (BPA), and conductive particle additives (CPA).
In this paper, a discrete element method (DEM) simulation was developed and used to
study the mixing characteristics of dry electrode powder materials. Due to the size of the
particles being in the submicron to micron size range, the mixing characteristics are
heavily dependent on van der Waals adhesive forces between the particles. Therefore, the
effect the Li-ion battery electrode material surface energy has on the mixing
characteristics was studied. Contour plots based on the DEM simulation results where the
surface energy components of selected material types are changed were used to predict
the mixing characteristics of different particle systems. For the cases studied, it is found
that experimental mixing results are representative of the results of the DEM simulations.

88
1. INTRODUCTION
Li-ion battery electrodes consist of four basic components: two electrodes
(cathode and anode), a separator, and an electrolyte. The electrode components are made
with three essential materials: the active material (AM), binder particle additive (BPA),
and conductive particle additive (CPA). The AM is needed to provide the energy for the
battery while the CPA is dispersed among the AM to improve the electroconductivity of
the electrode. Binder particle additives are needed to secure the electrode material to the
current collecting substrate (typically aluminum for the cathode and copper for the
anode). Commercial Li-ion battery electrodes are manufactured using the slurry-casting
technique. In this manufacturing method, the electrode materials are mixed with a solvent
to dissolve the BPA. This allows the BPA to readily coat the remaining particles (AM
and CPA). The binder, most commonly polyvinylidene fluoride (PVDF), is matched with
a suitable solvent, most commonly N-methyl-2-pyrrolidone (NMP), to allow for optimal
mixing and coating.
Due to the direct influence of CPA and BPA distribution on the electrochemical
properties, extensive mixing studies have been performed to understand the slurry
preparation process on the electrode morphology [1,2]. The effect of multiple mixing
steps and the length of mixing (some up to 48 h) have been studied [3]. Once mixed, the
slurry is cast onto the current collector and must be dried to create a dry porous electrode
for further battery fabrication. The drying process can take a significant amount of time
and energy (up to 24 h at 80–120 °C), which increases the manufacturing cost of the
battery electrodes [4,5]. In commercial applications, an expensive NMP recovery system
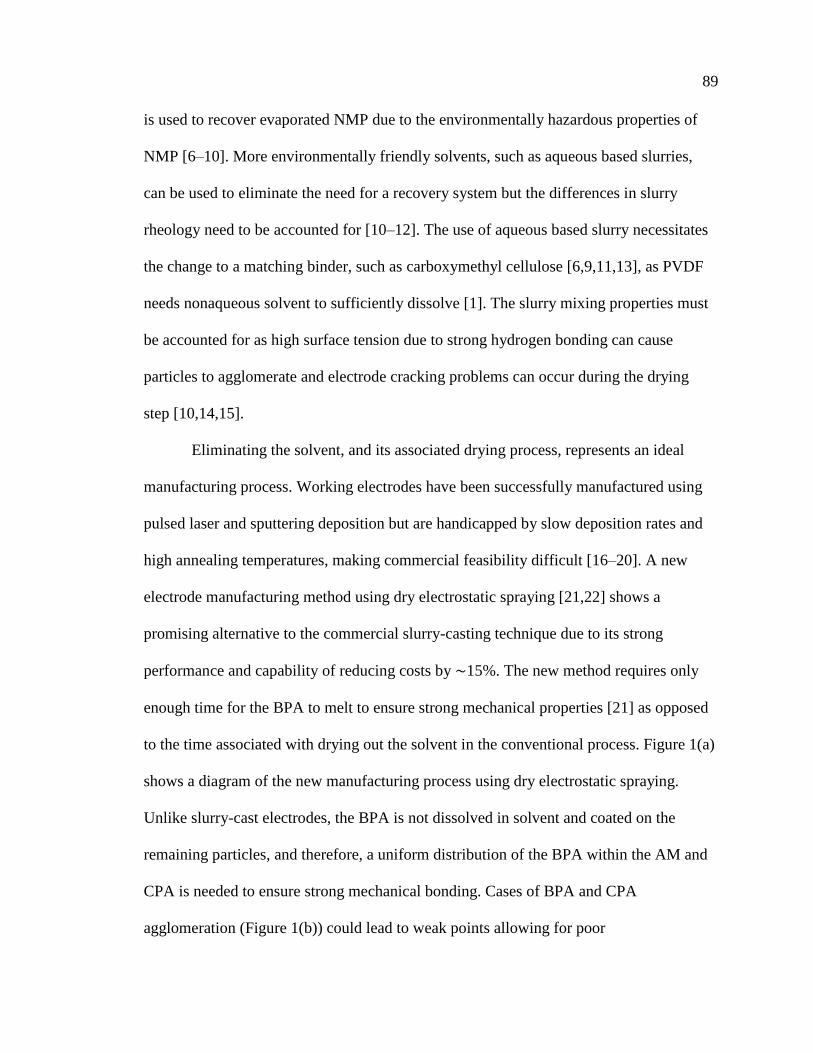
89
is used to recover evaporated NMP due to the environmentally hazardous properties of
NMP [6–10]. More environmentally friendly solvents, such as aqueous based slurries,
can be used to eliminate the need for a recovery system but the differences in slurry
rheology need to be accounted for [10–12]. The use of aqueous based slurry necessitates
the change to a matching binder, such as carboxymethyl cellulose [6,9,11,13], as PVDF
needs nonaqueous solvent to sufficiently dissolve [1]. The slurry mixing properties must
be accounted for as high surface tension due to strong hydrogen bonding can cause
particles to agglomerate and electrode cracking problems can occur during the drying
step [10,14,15].
Eliminating the solvent, and its associated drying process, represents an ideal
manufacturing process. Working electrodes have been successfully manufactured using
pulsed laser and sputtering deposition but are handicapped by slow deposition rates and
high annealing temperatures, making commercial feasibility difficult [16–20]. A new
electrode manufacturing method using dry electrostatic spraying [21,22] shows a
promising alternative to the commercial slurry-casting technique due to its strong
performance and capability of reducing costs by ∼15%. The new method requires only
enough time for the BPA to melt to ensure strong mechanical properties [21] as opposed
to the time associated with drying out the solvent in the conventional process. Figure 1(a)
shows a diagram of the new manufacturing process using dry electrostatic spraying.
Unlike slurry-cast electrodes, the BPA is not dissolved in solvent and coated on the
remaining particles, and therefore, a uniform distribution of the BPA within the AM and
CPA is needed to ensure strong mechanical bonding. Cases of BPA and CPA
agglomeration (Figure 1(b)) could lead to weak points allowing for poor

90
electroconductivity and mechanically weak locations. Uniform mixing of the additive
materials will display minimal agglomerates (Figure 1(c)) leading to more efficient use of
the additive materials. Previous studies [21,22] show that the electrodes fabricated using
the new solvent-free process are stronger than those of the conventional method while
also displaying similar electrochemical performance to that of the conventional process.
While this new method has produced electrodes with strong electrode performance, the
mixing properties of dry battery electrode materials is not well known.
Figure 1. Solvent Free Manufacturing Process. (a) Schematic of dry electrostatic spraying
system. (b) Representation of poorly mixed Li-ion battery electrode powders with
agglomerations of additive particles. (c) Representation of well mixed Li-ion battery
electrode powders with uniform distribution of additive particles.

91
In this paper, the mixing characteristics of dry electrode powders used in the new
dry manufacturing process will be studied. Previous studies pertaining to mixing the
electrode materials used in the slurry-cast technique are not relevant to the new
manufacturing technique, and thus, this paper focuses on understanding the dry powder
mixing process to help predict BPA and CPA distribution within a given AM. To study
the mixing behavior of Li-ion battery electrode materials, a discrete element method
(DEM) simulation has been developed to understand the effect material properties have
on the mixing uniformity of Li-ion battery electrode particles. The developed DEM
simulation is based on a soft-sphere model where it is assumed the colliding particles will
form small deformations upon impact. The resulting deformation will cause a contact
area between the two particles, which is then subject to adhesive forces. Due to the
micron and submicron size of Li-ion battery electrode materials, the particle mixing is
strongly dependent on adhesive interactions once the particles collide [23,24]. The DEM
simulation results can then be used for future studies and Li-ion battery electrode
materials to better estimate the mixing properties.
2. DISCRETE ELEMENT SIMULATION MODELING
To understand the mixing of micro/nano-sized powders which represent the AM,
BPA, and CPA powders, a DEM model for adhesive fine particles has been developed.
Due to the particle sizes being in the nanometer to micrometer size range, the proposed
simulation model is heavily dependent on the surface adhesive force interactions between

92
the particles.[23,24] This adhesive force is related to the interfacial energies of the Li-ion
electrode materials.
Motion of the individual particles can be described by Newton’s second law of
motion and the governing equation for the translational motion of the particles can be
defined by
𝑚𝑖𝑑2𝑟𝑖
𝑑𝑡2= �⃑�𝑖
𝑎𝑑ℎ + �⃑�𝑖𝑔𝑟𝑎𝑣
(1)
where mi and ri are the mass and position vector a particle i, respectively. Fadh and Fgrav
represent the adhesive contact forces due to particle collisions and gravitational forces,
respectively.
Since van der Waals adhesive forces act in a non-linear fashion with the other
forces acting on particles, such as sliding resistance and elastic repulsion, they cannot be
simply added to them.[23] The sum of the adhesive and collision forces, Fadh, on a
particle is given by
�⃑�𝑖𝑎𝑑ℎ = 𝐹𝑛 �⃑⃑� (2)
where n is the unit normal along the line passing through the particle centroids. Fn and Fs
are the normal force and sliding force magnitude, respectively. Fn is composed of the
elastic term Fne and the damping term Fnd.
For this study, only the normal force is considered. In order to calculate normal
force, contact area between two particles are modeled based on a soft-sphere model
where two separate particles will experience deformation upon collision, forming a
contact area (Figure 2(a)). Chokshi et al. [25] modified the contact theory proposed by
Johnson, Kendall, and Roberts (JKR)[26] to simplify the contact radius, a0, to

93
𝑎0 = (9𝜋𝑤𝑖𝑗𝑅
2
2𝐸)1/3
(3)
where R and E are the effective particle radius and elastic moduli, respectively. Here, R
and E are defined as
1
𝑅=
1
𝑅𝑖+
1
𝑅𝑗 (4)
1
𝐸=
1−𝑣𝑖2
𝐸𝑖+
1−𝑣𝑗2
𝐸𝑗 (5)
where two particles are considered with radii Ri and Rj, elastic moduli Ei and Ej, Poisson
ratios vi and vj. Table 1 shows the material property values needed for the DEM
simulations. The work of adhesion, wij, between the two particles can be defined by using
the Fowkes equation [27],
𝑤𝑖𝑗 = 2(𝛾𝑖𝑑𝛾𝑗
𝑑)0.5 + 2(𝛾𝑖𝑝𝛾𝑗
𝑝)0.5 (6)
where γid and γj
d are the dispersive surface energy component values for material i and j,
respectively, and γip and γj
p are the polar surface energy component values for material i
and j, respectively. The contact area at the work of adhesion interface can be defined as
𝐴𝑖𝑗 = 𝜋𝑎02.
Figure 2. Contact Mechanics of Colliding Particles. (a) Contact interface and radius
representation due to the collision of i and j particles. (b) Representation of the i-j particle
overlap due to collision.

94
Table 1. Material input parameters for DEM simulations.
Material Radius, R
[μm]
Density, ρ
[g cm-3]
Young’s Modulus, E
[GPa]
Poisson
ratio, v
Active Material 5 4.90 38 0.18
Binder Particle
Additive
0.25 1.78 4.3 0.34
Conductive
Particle Additive
0.125 2.20 5.0 0.23
Chokshi et al. [25] proposed that the normal force, Fne, could be rearranged in terms of
the contact radius to
𝐹𝑛𝑒 = 𝐹𝐶 [4(𝑎
𝑎0)3 − 4(
𝑎
𝑎0)3/2] (7)
where FC is the critical force given by 𝐹𝐶 = 3𝜋𝑤𝑖𝑗𝑅/2 and a/a0 can be found by solving
𝛿𝑁 = 61/3𝛿𝐶 [2(𝑎
𝑎0)2 −
4
3(𝑎
𝑎0)1/2] (8)
where δN is the normal particle overlap defined in Eq. (9) and δC is the particle overlap
when at the critical force FC. When a separation force is applied and the spheres begin to
stretch, forming a neck between the two spheres, the critical particle overlap δC is equal
to δN when separation finally occurs. In relation to the equilibrium radius a0 the critical
particle overlap δc is given by Eq. (10).
𝛿𝑁 = 𝑅𝑖 + 𝑅𝑗 − |𝑥𝑖 − 𝑥𝑗| (9)
𝛿𝐶 =𝑎02
2(6)1/3𝑅 (10)
where xi and xj denote the centroid positions of the two particles. In this case, the normal
particle overlap δN does not actually overlap but represent the amount of overlap that
would occur if the spheres had not deformed and flattened (Figure 2(b)).

95
A damping normal force Fnd makes up the second part of the normal force Fn and
is defined as
𝐹𝑛𝑑 = −𝜂𝑁�⃑�𝑟 ∙ �⃑⃑� (11)
where the ηN is the normal dissipation coefficient (chosen to be 0.05 for this study) and vR
is the relative particle velocity. The normal dissipation coefficient ηN is assumed to have
the form
𝜂𝑁 = 𝛼(𝑚𝑘𝑁)1/2 (12)
where α is a function of the restitution coefficient (chosen to be 1).[28] The normal
stiffness coefficient, kn, is estimated by Fn/δN.
Software used for performing the DEM simulations was developed from in-house
code. The size of the mixing volume was set such that the particles can interact with one
another without being limited by space. The boundary conditions were set to simulate a
mixing container and therefore the walls were set to be reflective. One hour of
computation time yields ~12 microseconds of mixing time in cases involving a larger
number of particles (~200) but lower particle numbers will allow for more mixing time.
3. RESULTS
The DEM results can be used to study the surface energy effects on mixing for
any particulate system, but for this study the effect of battery electrode materials was
considered. Different mixing cases were considered to show how AM surface energy
affects the BPA distribution and also how CPA surface energy component values affect
the distribution of CPA when mixed with AMs with different surface energy values. The

96
mixing behavior of BPAs and CPAs was also considered as the mixing morphology of
these materials directly influences the electrode mechanical strength and
electroconductivity. Finally, the mixing behavior of all three material types is
characterized.
3.1. ACTIVE MATERIAL-BINDER PARTICLE ADDITIVE
Due to Li-ion battery AM displaying various surface energy component values,
the effect of the AM surface energy components on the BPA distribution was studied.
From previous studies [12,22], the dispersive component for cathode AM can range from
37.0 to 42.5 mN m−1 while the polar components could be from 1.35 to 177 mN m−1. This
extreme range of polar components could lead to a vast difference in mixing uniformity
of the BPA within the AM. A DEM simulation consisting of a single 10 μm particle,
acting as the AM particle, and thirty 0.5 μm particles, acting as the BPA particles, was
used to characterize the AM-BPA mixing. Surface energy components of the BPA were
set according to previously measured PVDF values (dispersive and polar surface energy
components were calculated to be 24.33 mN m−1 and 6.18 mN m−1, respectively [21]) as
PVDF is a common BPA in Li-ion battery electrodes. The PVDF surface energy values
are also consistent with previous studies [29,30] where PVDF surface energy is
measured. The BPA particles were set to be monosized due to experimental studies using
PVDF particles show a particle standard deviation within 8% of the average. The BPA
underwent a premixing process to form an agglomerate of BPA (Figure 3(a)). After
premixing, the BPA agglomerate is allowed to interact with the AM particle. In the case
of aggregation, it is expected that the BPA agglomerate will experience minimal changes

97
after interacting with the AM particle (Figure 3(b)). In the case of intermixing, it is
expected that the BPA agglomerate will begin to break apart and attach to the AM
particle, forming a layer (Figure 3(c)). In the DEM simulations, the output can be used to
count the number of BPA in contact with the AM particle.
Figure 3. Active Material-Binder Particle Additive Mixing. DEM simulation snapshots of
active material-binder particle additive mixing showing (a) pre-mixing, (b) aggregation,
and (c) intermixing. Analytical (d) and DEM (e) contour plots showing similar mixing
behavior. (f) Comparison of mixing time found in DEM cases where intermixing and
aggregation occurs.

98
A contour plot (Figure 3(d)) of the contact points over a range of surface energy
components shows that low dispersive energy values (0–10 mN m−1) and polar energy
values from 0 to 35 mN m−1 of active material results in the BPA agglomerate
experiencing minimal break-up when interacting with the active material particle (Figure
3(b) shows a DEM simulation result where aggregation was found). In this range, the
BPA agglomerate would either weakly attach to the AM particle surface or bounce on
and off of the AM particle due to very weak work of adhesion between the AM-BPA
surfaces. Outside of the range, the DEM simulation results show BPA beginning to form
a monolayer on the AM surface (Figure 3(c) shows a DEM simulation result where
intermixing was found). For both cases, intermixed and aggregation, the mixing time and
the evolution of the contact points can be compared in Figure 3(e). In the intermixed
case, the time to achieve all BPA contacts on the AM particle was ∼2.4 ms. It can be seen
that the number of contacts in the intermixed case gradually increased while the
aggregation case exhibited sporadic BPA contact with the AM particle, further showing
the weak attraction between the two materials. Known AM surface energy components
were added to the DEM contour plot results to show how BPA is expected to mix with
the AM (Figure 3(d)).
3.2. ACTIVE MATERIAL-CONDUCTIVE PARTICLE ADDITIVE
In this case, the surface energy components of the CPA were allowed to vary
while the dispersive and polar surface energy components of the AM particle were kept
constant at 40 mN m−1 and 2 mN m−1, respectively. The surface energy component values
for the AM were selected to represent a case where negligible polar surface energy

99
component is experienced as is the case of the previously measured as-received LiCoO2
(LCO) [22]. Similar to the AM-BPA case, the AM-CPA DEM simulations involved a
single 10 μm AM particle while the CPA were represented by 0.25 μm particles (200 in
total). The particles representing CPA were set to be monosized due to experimental
measurements using Super C65 carbon showing a standard deviation of ∼11% of the
average size. Initially, a premixing step was incorporated into the DEM simulations to
form an agglomerate of CPA (Figure 4(a)). For intermixing to occur, the CPA should
begin to assemble on the AM surface (Figure 4(b)) while minimal CPA assembly should
happen when aggregation occurs (Figure 4(c)). A series of DEM simulations were used to
plot the number of CPA contacts on the AM surface (Figure 4(d)). The DEM contour
plots show that the location of peak intermixing is at 20 mN m−1 dispersive component
and 0 mN m−1 polar component. Figure 4(b) shows the DEM mixing results from a
simulation using 20 mN m−1 dispersive energy and 0 mN m−1 polar energy and it can be
seen that the CPA agglomerate has broken apart and formed on the surface of the AM
particle. In the contour plot (Figure 4(d)), the intermixing to aggregation trend is found to
radiate from the peak intermixing location. The crossover location denoting a change
between intermixing and aggregation is near the 25-50 contact point area location in the
DEM contour plot. This area in the DEM contour plot shows the location where the CPA
agglomerate attaches to the AM particle and slowly begins to form around the AM
surface. The 0-25 contact point area in the DEM results denotes where very few CPA are
in contact with the AM particle (Figure 4(c)). In this case, the CPA comes into contact
with the AM but does not alter its shape to conform to the AM surface.

100
Figure 4. Active Material-Conductive Particle Additive Mixing. DEM simulation
snapshots of active material-conductive particle additive mixing showing (a) pre-mixing,
(b) intermixing, and (c) aggregation. (d) DEM contour plot showing the number of CPA
in contact with the AM surface when the active material polar component is 2 mN m-1.
(e) DEM contour plot showing the number of CPA in contact with the AM surface when
the active material polar component is 100 mN m-1. (f) Conductive particle additives
showing increased contact with higher polar surface energy active material as compared
to low polar surface energy. (g) Comparison of mixing time found in DEM cases where
intermixing and aggregation occurs.
Active material-conductive particle additive mixing behavior was further studied
by increasing the polar surface energy component of the AM particle to 100 mN m−1
while keeping the dispersive component to the same as before. This case was used to
represent an AM material with a high polar surface energy component as shown in
previous studies [12,22]. It is expected that DEM results will show higher CPA contact
points as compared to Figure 4(d) due to the higher interfacial energy between the AM
and CPA surface. This expectation was confirmed by the plotting the CPA contact points
(Figure 4(e)) from the resulting DEM simulations where the AM had higher polar surface

101
energy. The contour plot using a low polar component displayed a large 0-25 contact
point area denoting aggregate formation; in the new contour plot using a larger polar
component, this area is mostly replaced by 25-50 contact point areas. While these areas
denote relatively few contact points when compared to the number of contacts associated
with peak intermixing, it does signify the CPA agglomerate is attached to the AM and
slowly conforming to the surface (Figure 4(f)). The same CPA agglomerate from the 0-10
contact point area when the AM particle has a small polar surface energy component
shows a lower degree of conformation (Figure 4(f)).
The dots located on the DEM simulation contour plots (Figs. 4(d) and 4(f)) denote
previously measured [21,31–36] surface energy values of carbon materials. They are used
to show the expected mixing behavior of common carbon-based CPA materials. Surface
energy measurements of graphite powders had a minimal polar component (0.54 mN
m−1) while the dispersive component was around 56.27 mN m−1 [21,31]. Graphite surface
energy measurements can be used to gain insight into the surface energy characteristics
of carbon, but it may not be representative of the more commonly used CPA material
(Carbon Black) due to its significantly larger size (∼10 μm). Previous studies [32–34]
measuring Carbon Black surface energy show a similar low polar component when
compared to graphite, but the dispersive component is typically measured at smaller
values in the range of 18–35 mN m−1. An increase in the Carbon Black polar surface
energy component can be achieved through surface modification by way of acid–base
treatments as detailed by Park et al. [35] where the treatments can be used to obtain a
polar surface energy component up to 33.1 mN m−1 [36].
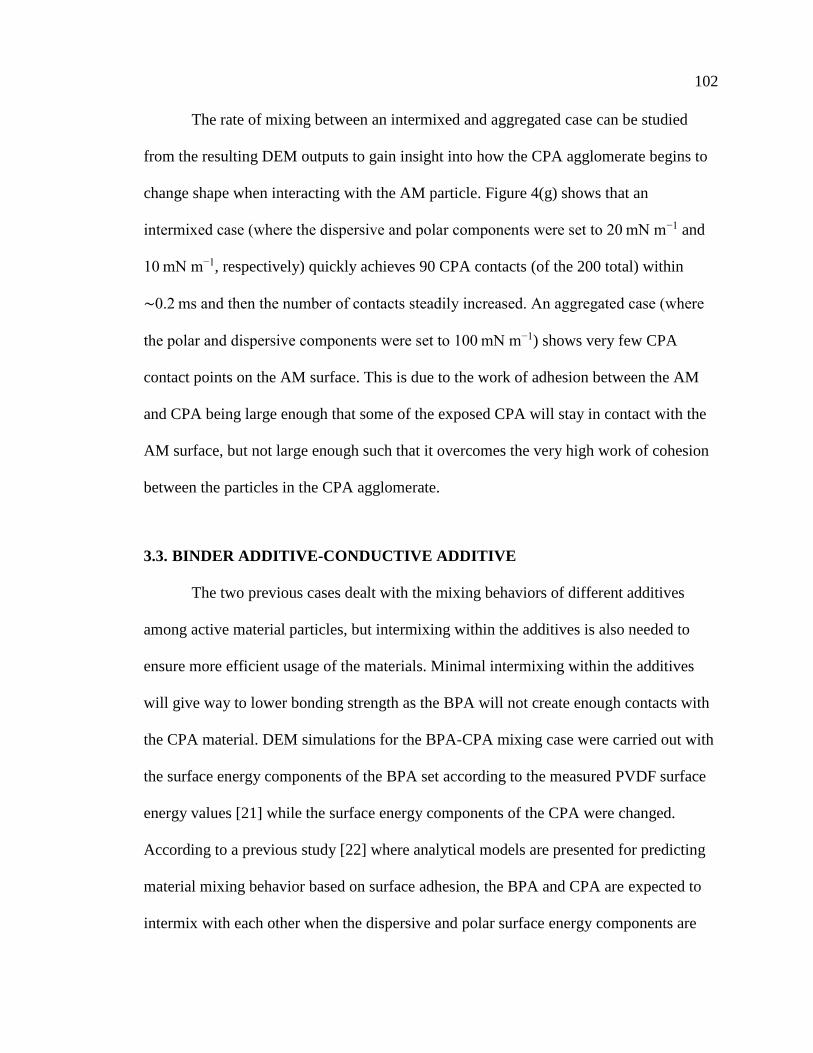
102
The rate of mixing between an intermixed and aggregated case can be studied
from the resulting DEM outputs to gain insight into how the CPA agglomerate begins to
change shape when interacting with the AM particle. Figure 4(g) shows that an
intermixed case (where the dispersive and polar components were set to 20 mN m−1 and
10 mN m−1, respectively) quickly achieves 90 CPA contacts (of the 200 total) within
∼0.2 ms and then the number of contacts steadily increased. An aggregated case (where
the polar and dispersive components were set to 100 mN m−1) shows very few CPA
contact points on the AM surface. This is due to the work of adhesion between the AM
and CPA being large enough that some of the exposed CPA will stay in contact with the
AM surface, but not large enough such that it overcomes the very high work of cohesion
between the particles in the CPA agglomerate.
3.3. BINDER ADDITIVE-CONDUCTIVE ADDITIVE
The two previous cases dealt with the mixing behaviors of different additives
among active material particles, but intermixing within the additives is also needed to
ensure more efficient usage of the materials. Minimal intermixing within the additives
will give way to lower bonding strength as the BPA will not create enough contacts with
the CPA material. DEM simulations for the BPA-CPA mixing case were carried out with
the surface energy components of the BPA set according to the measured PVDF surface
energy values [21] while the surface energy components of the CPA were changed.
According to a previous study [22] where analytical models are presented for predicting
material mixing behavior based on surface adhesion, the BPA and CPA are expected to
intermix with each other when the dispersive and polar surface energy components are

103
between 10 and 40 mN m−1 and 0 and 20 mN m−1, respectively. Outside of this region, it
is more likely that the CPAs and BPAs will exhibit minimal interaction with each other.
Discrete element method simulations were used to check this expectation with 0.5 μm
spheres representing BPA (20 total) and 0.25 μm spheres representing CPA (400 total).
The surface energy components of CPA were set to 20 mN m−1 and 10 mN m−1,
respectively. These values were selected as they are the values associated with peak
intermixing based on the previously presented analytical model [22]. If the model is
correct, then the DEM simulation should show a high degree of BPA and CPA
intermixing. In the simulation, it was found that individual BPA were embedded within
an agglomerate of CPA (Figure 5(a)). An enhanced view more readily shows this
behavior where a monolayer of CPA is formed around BPA. Another simulation was
used to confirm the opposite case where BPA and CPA should not intermix as well,
forming an aggregate. For this simulation, both the dispersive and polar surface energy
components for CPA were set to 100 mN m−1. The results of this case confirm the
predicted mixing behavior where CPA form a large agglomerate (Figure 5(b)) with BPA
only attached to the surface of the CPA agglomerate. Unlike the intermixed case where
individual BPA are surrounded by CPA, the CPA in this case have a work of cohesion
too large to enable the BPA to break apart the attached CPA surfaces. Note that BPA
only attach to the surface of CPA agglomerate with embedding into CPA, which is
clearly different from the intermixing case.

104
Figure 5. Binder Particle Additive-Conductive Particle Additive Mixing. Confirmation of
analytical modeling results where a predicted intermixed case is confirmed by a DEM
simulation (a) and where a predicted aggregation case is confirmed by another DEM
simulation (b).
3.4. ACTIVE MATERIAL-BINDER ADDITIVE-CONDUCTIVE ADDITIVE
The previous DEM mixing cases considered only mixing two materials, but in the
actual case all three materials will need to be mixed together. Two DEM simulations
were considered to represent cases of Li-ion battery electrode material mixing. A single
AM particle 10 μm particle was mixed among 0.5 μm particles representing the BPA (20
total) and 0.25 μm particles representing the CPA (400 total). For both DEM simulations,
the surface energy for the BPA was based on the previously discussed PVDF results and
the surface energy for the CPA was set with the same values as the intermixed case from
Sec. 3.3 (dispersive and polar surface energy components were 20 mN m−1 and 10 mN

105
m−1, respectively). The surface energy values of CPA are also representative of previous
measurements of Carbon Black [32]. The first DEM simulation had the AM surface
energy measurements based on low polar AM, representative of as-received LCO from a
previous study [22]. Figure 6(a) shows the outcome of the DEM simulation where the
BPA and CPA were dispersed on the AM surface. BPA is shown to be intermixed among
the CPA particles with minimal agglomerations of BPA. For the other case, the polar
surface energy component was increased to 100 mN m−1 to represent higher polar AM
measurements from previous studies [12,22]. The resulting DEM simulation shows
similar results (Figure 6(b)) to the previous case. BPA and CPA are dispersed on the AM
surface while the BPA particles show no signs of aggregation. The behavior of the BPA
on the two AM surfaces is expected based on the DEM simulation results when only AM
and BPA are mixed as the two AM surface energies in this case lie within the area related
to intermixing (Figure 3(d)). For CPA, the DEM simulation results with only the AM and
CPA are mixed largely predict that CPA will have more contact with the higher polarity
AM surface than the low polar AM. In the case where all three material types are mixed,
the CPA has a similar degree of contact regardless of the polarity of the AM material.
However, it should be noted that the set CPA surface energy for these two cases show
similar CPA contact with the AM surfaces when only the CPA and AM are mixed (the
CPA surface energy used in this case lie within the 80-100 contact point area associated
with high AM-CPA contact in both Figs. 4(d) and 4(e)). Using different CPA surface
energy values could lead to different distributions of CPA on AM surfaces.

106
Figure 6. Active Material-Binder Particle Additive-Conductive Particle Additive Mixing.
(a) DEM simulation showing mixing behavior of all three materials when the AM polar
surface energy is 2 mN m-1. (b) DEM simulation showing the mixing behavior of all three
materials when the AM polar surface energy is increased to 100 mN m-1.
4. EXPERIMENTAL VERIFICATION
To verify the DEM results, Li-ion battery electrode materials were mixed and
SEM micrographs were taken. For the case of AM-BPA mixing, as-received LCO
powder was mixed with PVDF powder in a high-energy mixer. The contour plot
developed from the DEM simulations point to intermixing occurring (Figure 3(d)). An
SEM micrograph of the mixed materials shows the expected intermixing behavior

107
(Figure 7(a)). A view of the DEM simulation using the same parameters shows (Figure
7(b)) similar results where the BPA (PVDF) is attached to the AM (LCO). According to
previous studies [22] where LCO was annealed to obtain a larger polar surface energy
component, the mixing of annealed LCO with PVDF showed the BPA forming on the
surface of the AM and intermixing. The DEM simulations in this study show similar
behavior when the same surface energy components are used as the material properties.
For the case of AM-CPA mixing, a previous study [22] mixed LCO and Super
C65 carbon with differing surface properties. It was found that annealed LCO, where the
dispersive and polar surface energy components were 42.5 mN m−1 and > 35.0 mN m−1,
respectively, contained more Super 65 carbon particles on the LCO surface when
compared to as-received LCO where the dispersive and polar surface energy components
were measured as 37.0 mN m−1 and 1.35 mN m−1, respectively. This behavior was
confirmed by the DEM simulations (Figure 4). It can be seen a large range of CPA
surface energies has a higher degree of contact with the high polar AM surface (Figure
4(e)) than with the low polar AM surface (Figure 4(d)).
For BPA-CPA DEM comparisons, PVDF and Super C65 carbon were mixed in a
high-energy mixer. SEM micrographs of the mixed powder (Figure 7(c)) show individual
PVDF particles embedded within the Super C65 particles.
A DEM simulation using similar surface energy properties of the materials shows
similar intermixing behavior (Figure 7(d)). The BPA particles exhibit minimal contact
with one another as the BPA particles are individually embedded with the CPA particles.

108
Figure 7. Experimental Mixing Comparison. (a) SEM micrograph showing PVDF
(representing BPA) particles attached to the surface of LCO (representing AM). (b) DEM
confirmation of the experimental mixing result of AM-BPA with BPA particles attached
to the AM surface. (c) SEM micrograph showing PVDF particles embedded within Super
C65 carbon (representing CPA). (d) DEM confirmation of the experimental mixing result
of CPA-BPA with BPA particles embedded within the CPA.

109
5. CONCLUSION
In this paper, the effect particle surface energy had on the mixing characteristics
of micro/nanosized Li-ion battery electrodes powders was studied. A DEM model based
on the adhesive interactions of the Li-ion battery electrode particles was developed to
simulate various mixing cases. DEM simulations were carried out using surface energy
measurements assembled from previous studies and then compared with experimental
mixing results. AM-BPA results show that only a small range of AM surface energy
values will result in aggregation while AM-CPA mixing will be affected by different AM
polar surface energy component values. BPA-CPA results show that BPA will be
intermixed among CPA particles when the CPA surface energy values represent common
values found in literature. For cases where all three material types are mixed (as is the
case in production), the DEM simulations could accurately predict the mixing behavior of
the accompanying experimental studies. This study shows that mixing behavior of other
Li-ion battery electrode materials can be estimated when the surface energy component
values are known.
ACKNOWLEDGMENTS
This work is financially supported by NSF CMMI-1462343 and CMMI-1462321.
This work is also partially supported by seeding funds from Intelligent System Center
(ISC) and Material Research Center (MRC) at Missouri University of Science and
Technology.
110
REFERENCES
[1] Kraytsberg, A., and Ein-Eli, Y., 2016, “Conveying Advanced Li-ion Battery
Materials into Practice The Impact of Electrode Slurry Preparation Skills,” Adv.
Energy Mat., 6(21), pp. 1-23(1600655).
[2] Lee, G.-W., Ryu, J.-H., Han, W., Ahn, K. H., and Oh, S. M., 2010, “Effect of
Slurry Preparation Process on Electrochemical Performances of LiCoO2,” J.
Power Sources, 195(18), pp. 6049-6054.
[3] Liu, D., Chen, L.-C., Liu, T.-J., Fan, T., Tsou, E.-Y., and Tiu, C., 2014, “An
Effective Mixing for Lithium Ion Battery Slurries,” Adv. Chem. Eng. Sci., 4, pp.
515-528.
[4] Cetinkaya, T., Akbulut, A., Guler, M. O., and Akbulut, H., 2014, “A Different
Method for Producing a Flexible LiMn2O4/MWCNT,” J. Appl. Electrochem.,
44(2), pp. 209-214.
[5] Wei, Z., Xue, L., Nie, F., Sheng, J., Shi, Q., and Zhao, X., 2014, “Study of
Sulfonated Polyether Ether Ketone with Pendant Lithiated Fluorinated Groups as
Ion Conductive Binder in Lithium-ion Batteries,” J. Power Sources, 256, pp. 28-
31.
[6] Guerfi, A., Kaneko, M., Petitclerc, M., Mori, M., and Zaghib, K., 2007, “LiFePO4
Water-soluble Binder Electrode for Li-ion Batteries,” J. Power Sources, 163(2),
pp. 1047-1052.
[7] Spreafico, M. A., Cojocaru, P., Magagnin, Triulzi, F., and Apostolo, M., 2014,
“PVDF Latex as a Binder for Positive Electrodes in Lithium-ion Batteries,” Ind.
Eng. Chem. Res., 53(22), pp. 9094-9100.
[8] Daniel, C., 2008, “Materials and Processing for Lithium-ion Batteries,” JOM,
60(9), pp. 43-48.
[9] Doberdo, I., Loffler, N., Laszczynski, N., Cericola, D., Penazzi, N., Bodoardo, S.,
Kim, G.-T., and Passerini, S., 2014, “Enabling Aqueous Binders for Lithium
Battery Cathodes – Carbon Coating of Aluminum Current Collector,” J. Power
Sources, 248, pp. 1000-1006.
[10] Li, J., Armstrong, B. L., Kiggans, J., Daniel, C., and Wood, D. L., 2012,
“Optimization of LiFePO4 Nanoparticle Suspensions with Polyethyleneimine for
Aqueous Processing,” Langmuir, 28(8), pp. 3783-3790.

111
[11] Li, C.-C., and Wang, Y.-W., 2013, “Importance of Binder Composition to the
Dispersion and Electrochemical Properties of Water-based LiCoO2 Cathodes,” J.
Power Sources, 227, pp. 204-210.
[12] Bitsch, B., Dittmann, J., Schmitt, M., Scharfer, P., Schabel, W., and
Willenbacher, N., 2014, “A Novel Slurry Concept for the Fabrication of Lithium-
ion Battery Electrodes with Beneficial Properties,” J. Power Sources, 265, pp. 81-
90.
[13] Li, J., Rulison, C., Kiggans, J., Daniel, C., and Wood, D. L., 2012, “Superior
Performance of LiFePO4 Aqueous Dispersions via Corona Treatment and Surface
Energy Optimization,” J. Electrochem. Soc., 159(8), pp. A1152-A1157.
[14] Du, Z., Rollag, K. M., Li, J., An, S. J., Wood, M., Sheng, Y., Mukherjee, P. P.,
Daniel, C., and Wood, D. L., 2017, “Enabling Aqueous Processing for Crack-free
Thick Electrodes,” J. Power Sources, 354, pp. 200-206.
[15] Loeffler, N., von Zamory, J., Laszczynski, N., Doberdo, I., Kim, G.-T., and
Passerini, S., 2014, “Performance of LiNi1/3Mn1/3Co1/3O2/graphite Batteries Based
on Aqueous Binder,” J. Power Sources, 248, pp. 915-922.
[16] Koike, S., and Tatsumi, K., 2007, “Preparation and Performances of Highly
Porous Layered LiCoO2 Films for Lithium Batteries,” J. Power Sources, 174(2),
pp. 976-980.
[17] Kuwata, N., Kawamura, J., Toribami, K., Hattori, T., and Sata, N., 2004, “Thin-
film Lithium-ion Battery with Amorphous Solid Electrolyte Fabricated by Pulsed
Laser Deposition,” Electrochem. Commun., 6(4), pp. 417-421.
[18] Yan, B., Liu, J., Song, B., Xiao, P., and Lu, L., 2013, “Li-rich Thin Film Cathode
Prepared by Pulsed Laser Deposition,” Sci. Rep., 3, pp. 1-5(3332).
[19] Baggetto, L., Unocic, R. R., Dudney, N. J., and Veith, G. M., 2012, “Fabrication
and Characterization of Li-Mn-Ni-O Sputtered Thin Film High Voltage Cathodes
for Li-ion Batteries,” J. Power Sources, 211, pp. 108-118.
[20] Chiu, K.-F., 2007, “Lithium Cobalt Oxide Thin Films Deposited at Low
Temperature by Ionized Magnetron Sputtering,” Thin Solid Films, 515(11), pp.
4614-4618.
[21] Ludwig, B., Zheng, Z., Shou, W., Wang, Y., and Pan, H., 2016, “Solvent-Free
Manufacturing of Electrodes for Lithium-ion Batteries,” Sci. Rep., 6, pp. 1-
10(23150).

112
[22] Ludwig, B., Liu, J., Chen, I.-M., Liu, Y., Shou, W., Wang, Y., and Pan, H., 2017,
“Understanding Interfacial-energy-driven Dry Powder Mixing for Solvent-Free
Additive Manufacturing of Li-ion Battery Electrodes,” Adv. Mater. Interfaces.
[23] Li., S., Marshall, J. S., Liu, G., and Yao, Q., 2011, “Adhesive Particulate Flow:
The Discrete-Element Method and its Application in Energy and Environmental
Engineering,” Prog. Energy Combust. Sci., 37(6), pp. 633-668.
[24] Deng, X., Scicolone, J. V., and Dave, R. N., 2013, “Discrete Element Method
Simulation of Cohesive Particles Mixing Under Magnetically Assisted
Impaction,” Powder Technol., 243, pp. 96-109.
[25] Chokshi, A., Tielens, A. G. G. M., and Hollenbach, D., 1993, “Dust Coagulation,”
Astrophys. J., 407(2), pp. 806-819.
[26] Johnson, K. L., Kendall, K., and Roberts, A. D., 1971, “Surface Energy and the
Contact of Elastic Solids,” Proc. R. Soc. London A, 324(1558), pp. 301-313.
[27] Fowkes, F. M., 1968, “Calculation of Work of Adhesion by Pair Potential
Summation,” J. Colloid Interface Sci., 28(3/4), pp. 493-505.
[28] Tsuji, Y., Tanaka, T., and Ishida, T., 1992, “Lagrangian Numerical Simulation of
Plug Flow of Cohesionless Particles in a Horizontal Pipe,” Powder Technol.,
71(3), pp. 239-250.
[29] Wu, S., 1971, “Calculation of Interfacial Tension in Polymer Systems,” J. Polym.
Sci. C, 34(1), pp. 19-30.
[30] Morra, M., Occhiello, E., Marola, R., Garbassi, F., Humphrey, P., and Johnson,
D., 1990, “On the Aging of Oxygen Plasma-Treated Polydimethylsiloxane
Surfaces,” J. Colloid Interface Sci., 137(1), pp. 11-24.
[31] Lee, J., and Lee, B., 2017, “A Simple Method to Determine the Surface Energy of
Graphite,” Carbon Lett., 21(1), pp. 107-110.
[32] Mezgebe, M., Shen, Q., Zhang, J.-Y., and Zhao, Y.-W., 2012, “Liquid Adsorption
Behavior and Surface Properties of Carbon Black,” Colloids Surf. A, 403, pp. 25-
28.
[33] Wang, H. F., Troxler, T., Yeh, A. G., and Dai, H. L., 2007, “Adsorption at a
Carbon Black Microparticle Surface in Aqueous Colloids Probed by Optical
Second-Harmonic Generation,” J. Phys. Chem. C, 111(25), pp. 8708-8715.
[34] Siebold, A., Walliser, A., Nardin, M., Oppliger, M., and Schultz, J., 1997,
“Capillary Rise for Thermodynamic Characterization of Solid Particle Surface,” J.
Colloid Interface Sci., 186(1), pp. 60-70.

113
[35] Park, S.-J., Seo, M.-K., and Nah, C., 2005, “Influence of Surface Characteristics
of Carbon Blacks on Cure and Mechanical Behaviors of Rubber Matrix
Compoundings,” J. Colloid Interface Sci., 291(1), pp. 229-235.
[36] Arico, A. S., Antonucci, V., Minutoly, M., and Giordano, N., 1989, “The
Influence of Functional Groups on the Surface Acid-base Characteristics of
Carbon Blacks,” Carbon, 27(3), pp. 337-347.

114
IV. SCALABLE DRY PRINTING MANUFACTURING TO ENABLE LONG-LIFE
AND HIGH ENERGY LITHIUM-ION BATTERIES
ABSTRACT
Slurry casting method dominates the electrode manufacture of lithium‐ion
batteries. The entire procedure is similar to the newspaper printing that includes
premixing of cast materials into solvents homogeneously, and continuously transferring
and drying the slurry mixture onto the current collector. As a market approaching US $80
billion by 2024, the optimization of manufacture process is crucial and attractive.
However, the organic solvent remains irreplaceable in the wet method for making
slurries, even though it is capital‐intensive and toxic. Here, an advanced powder printing
technique is demonstrated that is completely solvent‐free and dry. Through removing the
solvent and related procedures, this method is anticipated to statistically save 20% of the
cost at a remarkably shortened production cycle (from hours to minutes). The dry printed
electrodes outperform commercial slurry cast ones in 650 cycles (80% capacity retention
in 500 cycles), and thick electrodes are successfully fabricated to increase the energy
density. Furthermore, microscopy techniques are utilized to characterize the difference of
electrode microstructure between dry and wet methods, and distinguish dry printing's
advantages on controlling the microstructure. In summary, this study proves a practical
fabrication method for lithium‐ion electrodes with lowered cost and favorable
performance, and allows more advanced electrode designs potentially.

115
1. INTRODUCTION
Lithium‐ion batteries (LIBs) have established a leading role for powering
electronics and the electrification of vehicles in the past decades. In order to meet the
requirements of customers, the manufacture of LIBs has been finely optimized to balance
cost, performance, and safety.[1] Commercial LIBs electrodes are mainly produced
through a slurry casting technique: mixing powder components into the solvent to make a
slurry, pasting the slurry mixture onto the metal substrate, evaporating and recycling the
solvent, and then calendaring the electrode layer after drying (roll‐mill pressing) to
finalize product parameters. The organic solvent, mostly as the N‐methyl‐2‐pyrrolidone
(NMP), is utilized extensively in preparing electrode slurries, especially for cathode
electrodes. The NMP solvent functions as the carrier of the electrode components, and
fluidizes this mixture of raw materials to enable a fast gluing of electrode material onto
the current collector. However, due to the internal weakness of NMP material as high
cost and toxicity, the academia has dedicated a lot of works to look for alternative
manufacture methods, such as using economical solvents and direct depositing
techniques. These findings in the area of manufacturing have brought the sight for
cheaper production of lithium‐ion batteries, with higher battery capacity and cycle‐
ability.[2-5] As a market growing for billions of US dollars every year, any
improvements of the manufacturing procedure would have repercussions far beyond the
frontiers of the industry of lithium‐ion batteries. Industries including electronics,
electricity autos, and the electricity grids are directly involved into effects as well. A

116
lowered price of energy storage units will continue to make important contributions to
these industries that belong to the supply chain, and result in the new product innovation.
Meanwhile, the progress achieved in material science requires the renewal of
manufacture method as well, while more and more promising material candidates are
taken into consideration. Prior to the effects of manufacturing procedure on the product
parameters of the battery, the achievable target of performance had been determined by
the quality of electrode materials (active materials (AM), conductive additives (CA), and
binders).[6-9] Therefore, new electrode materials are developing toward superior
physical and electrochemical properties. Nano‐size AM materials were studied for their
advantageous properties on high rates and lowered laminate percolation threshold.[10,11]
Layered cathode AMs, as Li[Ni1−x−yCoxMy]O2 (M = Al (NCA) or M = Mn (NCM)), have
been identified as practical candidates with high energy density and reliability to meet
industry requirements. Considering the inherent chemical instability of NCM and NCA,
which represents the ongoing commercialization of cathode materials, compositionally
graded cathode structure was successfully combined in forming AM particle aggregates
with a favorable configuration.[12-15] In addition, the microstructure of the electrode
composite layer catches more attention than ever. Low‐tortuosity materials were studied
and applied in batteries for their unique structure with high areal energy density.[16] The
appearance of the magnetic field in electrodes helped to create directional tunnel
structure, which accesses a quick charge transport and thus a several‐fold higher area
capacity.[17,18] Overall, it is thereby critical to find an affordable method to allow these
advanced materials to be utilized in batteries.

117
In this trend, we have previously proposed a method of solvent‐free electrode
fabrication for lithium‐ion battery.[19] The dry printed LiCoO2 and NCM cathode
electrodes have shown better electrochemical performance than the slurry casting ones,
which demonstrate the feasibility of this technology. Compared with the traditional slurry
casting method, this technique was analyzed to save up to a 20% percentage of the
investment (16–22% on labors, 14–19% of the capital equipment, and 13–17% of plant
area) based on the Argonne battery performance and cost (BatPaC) model. Besides
accomplishing the initial ambition on lowering the fabrication cost, the microstructure of
electrodes was found to be controllable under this reformative dry printing manufacture
method. This surprising phenomenon stimulates the technology of dry printing
fabrication to participate in developing advanced electrode microstructures.
In the study of layer structured AMs, the physical degradation of the AM particle during
cycling (microcracks happening among primary particles, and electrically isolated grains
existing within secondary particles) has been recognized to partly induce the capacity
drop of battery.[20-22] A fraction of AM grains would gradually lose the contact with the
conductive matrix of the electrode, and stop participating the cell reactions.[23-25]
Therefore, it is an effective strategy to construct a preferable microstructure of electrode
that adapts to the inherent deficiencies of AMs, and therefore minimizing their adverse
influence on battery capability. Likewise, a good control of electrode morphology would
allow electrode morphology properties as a low tortuosity, an appropriate porosity, and a
maximum surface uniformity.
Here, a regular dry printed electrode was cycled for 650 cycles in a coin cell with
a graphite anode. In addition, thick electrodes with high areal energy density were

118
fabricated to prove the capability of dry printing technology on sophisticated electrode
designs. These electrochemical performances are reported here and analyzed with
simulation results. Transmission X‐ray microscopy (TXM) and scanning electron
microscopy (SEM) were chosen to examine the components distribution and to reveal the
morphology conditions of the dry printed electrodes.
2. RESULTS AND DISCUSSION
In Figure 1, here we show the design scheme of our dry‐printing electrode
fabrication. In this technique (in Figure 1a), a 3D printing strategy enables us to
manufacture the electrodes within two steps: (1) Spraying the material mixture (active
material, conductive additive (C65), binder (Polyvinylidene Fluoride (PVDF))) onto the
substrate; (2) hot‐rolling the loaded material to finalize the product bonding, thickness,
and porosity through thermally activating the dispersed binder material. An electrostatic
spraying system aligned above the substrate is used to deposit the dry electrode mixture
onto the current collector. In this deposition method, the electrode mixture particles are
fed to the electrostatic spraying head. As the electrode particle flow through the spraying
head, they will become charged due to high voltage. The current collector is electrically
grounded so that the charged battery electrode mixture will be attracted and subsequently
deposit onto the current collector surface. After the current collector is coated, the
deposited electrode mixture needs to be pressed to its final thickness and heated such that
the binder is melted. Two hot‐rollers are settled in parallel at the necessary gap thickness
and heated to the thermal activation temperature at 180 °C (the melting point of PVDF is

119
177 °C). As shown in Figure 1b, the current collector loaded with the battery electrode
mixture is inserted between the rollers to be heated and pressed to the final thickness.
More details could be found in the Experimental Section and in our previous paper.[19]
Other than avoiding the usage of solvent and corresponding steps, this technology retains
most of the original procedures, which potentiate the modification based on the existing
equipment. In Figure 1c, here we show the updates of the printing system to print dry
thick electrodes continuously. A continuous molding method was selected to replace the
spray guns to deposit materials at higher loading rate. Moreover, since dry mixtures
would not flow over the substrate bed easily like liquid, the molded texture can leave
extra space for powders to spread when the areal loading is improved. With this texture
layout, powders would spread and overlap each other during the following hot rolling
procedure. For our current study on thick electrodes, Figure 1d details the steps to prepare
dry printed samples. Molds were machined with different dimensions to load mixtures at
certain thicknesses. The steps (3) and (4) in Figure 1d show the spreading effect
schematically, which illustrates our consideration on this phenomenon.
In our previous study, bonding characteristics of printed electrodes are found to
be better (75% higher bonding strength) than the ones of slurry cast electrode at the same
composition, especially on the bottom layer attaching to the substrate.[19] For dry printed
electrodes, the bonding strength mainly comes from the “green body” effect between
particles while the roller goes over the electrode layer and keeps lowering the thickness.
Under the pressing process, the electrode powder is compressed into a dense component,
similar to a “green” body or “green” component in powder metallurgy. Moreover, the
functionality of binder material (PVDF) is enhanced to strengthen the electrode matrix

120
and surface in the dry manufacturing. While evenly dispersed inside and on the surface of
electrodes, PVDF performs as “nails” to fasten particles inside the electrode matrix after
thermally activated. During the hot‐rolling procedure, melt PVDF would wet the surface
of AM particles at first, and then separate from the shell of them to build a conductive
network beside AM materials while cooling down. With this procedure, the top and
bottom planes of electrodes are reinforced to the greatest extent where directly contact to
hot‐rollers. Unless the double‐stage pressing (pasting and calendaring) in the
conventional fabrication, the electrode forming is synchronously finished through the
hot‐rolling procedure.
Figure 1. Schematic diagram of “solvent-free” dry printing electrode fabrication.
In Figure 2, we show the electrochemical performance of our regular dry‐printed
cathode (NCM) electrodes in coin cells, and the performance of commercial electrodes,

121
which provides further evidence of the dry manufacturing. The feasibility of dry printing
NCM cathode electrodes have been proposed and compared with laboratory‐fabricated
slurry cast electrodes at the same design parameters.[19] Here in this report, we selected
the shown commercial “conventional NMC electrode” (well‐prepared commercial ones,
which performs the best among all NCM electrodes that we received) to set up a
performance target for our dry printed electrodes. This profile helps us to further optimize
the quality of dry printed electrodes, which is necessary to scale‐up the technique from
the lab to the industry. The dry printed electrode cycling at 0.5 C (full cell test with a
graphite anode electrode) reaches up to 80% of capacity retention after 500 cycles.
Compared with the target performance, the dry printed electrode still show a competitive
capability. Rate performance at different charging/discharging (C) rates from 0.1 to 3 C,
is also inseted into the figure. Compared with the target performance, dry printed NCM
electrodes perform consistently at different rates of testing. Here, we chose the most
reliable and simple loading recipe (90 wt% AM, 5 wt% C65, 5 wt% PVDF, 29–30%
porosity, 55–56 µm as the final thickness).
In addition to saving the cost on recycling solvents, this technique holds another
three noticeable advantages: a quick and simple manufacture procedure (skipping steps
for preparing and recycling the solvent), a well‐balanced versatility of electrode material
selection (not limited to a single or a few electrode materials), and a good control of
product microstructure on a particle scale (dry depositing step that enables more
strategies to modify the electrode morphology). Particularly due to the last one, the
designed material distribution could be “in‐situ” obtained in the final product when the
deposition becomes under‐controlled. Under this circumstance, not only the dispersion

122
efficiency of the premixing procedure can be well reserved in product and contribute to
the performance but also more electrode microstructure layout would be introduced into
the manufacture of LIB electrodes possibly. In this way, improvements of cutting‐edge
materials would be possible to better reflect on the performance of battery system than
before.
Figure 2. Electrode cycling performance of the dry printed electrode (80% after 500
cycles) and the commercial slurry cast electrode at the rate of 0.5 C. Cycling performance
is tested on full cells built with graphite anode electrodes. Rate performance is tested on
half‐cells built with lithium foil. Electrodes and cell parts information can be found in the
Experimental Section.
Microstructure conditions, including the homogeneity of material dispersion and
imperfection ratio, greatly affect the electrode performance. However, the control of both
are limited by the “drying and calendaring” procedures of the slurry casting manufacture.
The homogeneity of the slurry can hardly be fully inherited when the electrodes are

123
gradually undergone the drying procedure, even though huge efforts have been devoted
to the slurry preparing step.[1] As a mixture of various solid components, these materials
would precipitate from the slurry at diverse kinetic behaviors, which may induce
subsidence, segregation, and immoderate agglomeration. First, precipitates tend to grow
into large aggregates instead of finely dispersed ones, which could be enabled by the
long‐time drying procedure. Second, precipitates of the slurry may move at the
solidification interface and thereby locate “randomly” in the final product. As a result,
either some isolated AM particles may lose the contact with the conductive network, or
CA\binder material would grow up to an unnecessary size, which would add dead
material volume and weight to the electrodes. In addition, similar to the metal casting,
imperfections would happen to the slurry casting electrodes during solidification. The
thermal‐dynamic conditions of the materials on the slurry top surface are enormously
different from those of materials within the slurry, and so are those of the materials on the
bottom layer which attach to the metal substrate. In this circumstance, some “pioneer”
precipitates on the “outer shell” of slurry would suffer from over‐heat and related
expansion effects, while the rest of materials in the slurry still lack heat during the drying
process. Because of their diverse physical properties (contraction coefficient, heat
transfer coefficient etc.), the volume change of the different components also varies
widely, which leads to the residue stress. Therefore, imperfections become unpredictable
and generated accidentally during drying, which would cause the deterioration of
batteries in their service life. Moreover, the calendaring processing is utilized to minimize
thickness variance and regional concentration difference, while this step would also add
more stress to the structure of electrode when deforming the established particle–particle
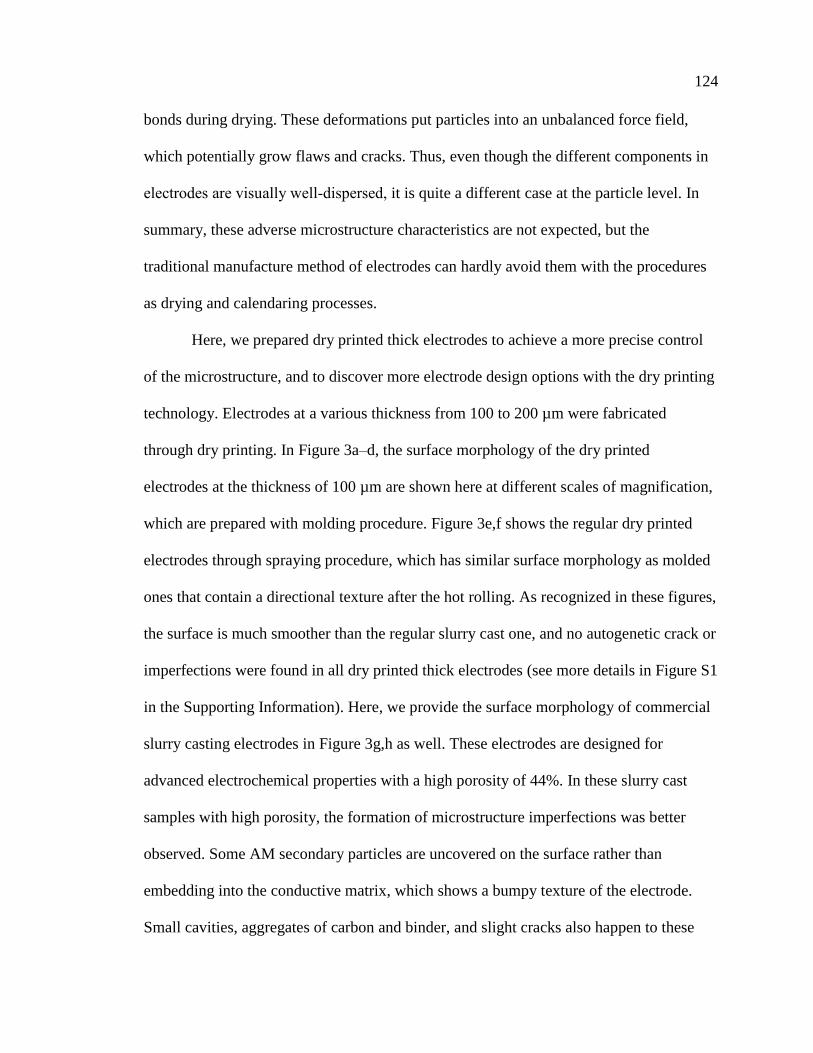
124
bonds during drying. These deformations put particles into an unbalanced force field,
which potentially grow flaws and cracks. Thus, even though the different components in
electrodes are visually well‐dispersed, it is quite a different case at the particle level. In
summary, these adverse microstructure characteristics are not expected, but the
traditional manufacture method of electrodes can hardly avoid them with the procedures
as drying and calendaring processes.
Here, we prepared dry printed thick electrodes to achieve a more precise control
of the microstructure, and to discover more electrode design options with the dry printing
technology. Electrodes at a various thickness from 100 to 200 µm were fabricated
through dry printing. In Figure 3a–d, the surface morphology of the dry printed
electrodes at the thickness of 100 µm are shown here at different scales of magnification,
which are prepared with molding procedure. Figure 3e,f shows the regular dry printed
electrodes through spraying procedure, which has similar surface morphology as molded
ones that contain a directional texture after the hot rolling. As recognized in these figures,
the surface is much smoother than the regular slurry cast one, and no autogenetic crack or
imperfections were found in all dry printed thick electrodes (see more details in Figure S1
in the Supporting Information). Here, we provide the surface morphology of commercial
slurry casting electrodes in Figure 3g,h as well. These electrodes are designed for
advanced electrochemical properties with a high porosity of 44%. In these slurry cast
samples with high porosity, the formation of microstructure imperfections was better
observed. Some AM secondary particles are uncovered on the surface rather than
embedding into the conductive matrix, which shows a bumpy texture of the electrode.
Small cavities, aggregates of carbon and binder, and slight cracks also happen to these

125
samples (more evidence with cross‐section view in Figure S2 of the Supporting
Information), which is consistent with the discussion above for the conventional
fabrication method. Larger magnification views of dry printed electrode are provided in
Figure 3c,d, and Energy Dispersive X‐Ray Spectroscopy (EDS) mapping of elements are
shown in Figure 3i. AM particles are well covered, and gaps at the nanoscale are left on
the surface to enable the ion diffusion. These pores are big enough for Li+ ions to
transport, but would simultaneously limit the movement of electrode materials at a larger
particle size. In the elements mapping images, the NCM particles locate evenly in the
surface area, and binder/CA materials are shown to be well dispersed and to form a
conductive matrix through the 2D level. The element of F represents the distribution of
PVDF, and the element of C represents the distribution of CA as C65. These NCM
particles are embedded into the conductive network built by binder/CA. This
homogeneity would lead to a profitable steady reaction interface along the electrode,
which may explain the lowered overpotential we observed in our previous study and may
contribute to the improved cycling performance.[19]
TXM is a full‐field nondestructive in situ 3D X‐ray nanotomography method that
provides unique information that is difficult/impossible to be obtained by other
methods.[26] In the study of battery materials, it can be applied to in‐situ monitor and
quantitatively analyze the 3D microstructural changes of the electrode during cycling,
including chemical states and the phase transformations. It successfully correlates the
morphological changes with the electrochemical reactions, and has intuitively presented
the reaction process of the lithiation–delithiation and sodiation–desodiation at high‐

126
Figure 3. SEM surface morphology comparison. Thick dry printed electrode (at the scale
of a) 500, b) 4000, c) 10000, and d) 40000), regular dry printed electrode (at the scale of
e) 500 and f) 4000) and slurry cast electrode (at the scale of g) 500 and h) 4000). i) SEM-
EDS mapping of printed electrode at the thickness of 100 µm (shows elements of F, C,
Mn, Co, Ni, O)
quality.[27,28] TXM technology was also utilized in our research to examine the
structural layout of AM particles in 3D. Under the hard X‐ray, only the elements of Co,
Mn, and Ni could be obviously observed, which may provide a great opportunity to
concentrate on recognizing the distribution of NCM particles. Therefore, all clear‐visible
particles are the NCM ones, and the vacant room around them includes the rest as the
binder, the CA and the pore space. As shown in Figure 4a, there are three views of a 3D
model of our dry printed electrode at the thickness of 50 µm, which was collected and
built by the TXM technique (see Video S1 in the Supporting Information for this 3D
model). More TXM information of electrodes is provided in Figure S3 of the Supporting

127
Information. In Figure 4b, a thick electrode sample at the thickness of 100 µm in 2D is
present as a mosaic picture through combining a sequence of single images (at the
monitor window of 50 µm × 50 µm). Figure 4c shows 8 enlarged views of the cubic
room, which were taken while rotating every 45° of the sample. By collecting pictures of
the cubic room at continuous rotation angles, a 3D model can be built in this way. In
these pictures, spherical secondary NCM particles at the diameter of around 10 µm are
evenly dispersed in the space, and some primary NCM particles at the nanoscale are
finely stuffed and enveloped in the PVDF‐carbon conductive matrix.
An improved areal capacity of electrodes always means a higher percentage of
AM using in battery devices, which would result in a decreased manufacture cost with
fewer procedures but an outstanding energy storage capability. In the conventional
fabrication, a thick electrode design takes more treatments than usual and has a higher
possibility of forming internal defects and imperfections. In this case, a fraction of AM
may not be accessible for Li+ ion, and a part of CA and binder would not work as they
should, which both counteract the benefits from high areal loading. In addition, high
tortuosity and large impedance limit the thickness of the conventional electrode to be as
low as 100 µm. To overcome these constraints on charge transport, obtaining a low‐
tortuosity microstructure with proper electron transport pathways would require either a
specific selection of materials (AMs and CAs) or a concise morphology modification,
which is barely accessible with the traditional fabrication method. However, thick
electrodes are feasible with our dry printing technique. Figure 5a–c shows the cross‐
section images of the three electrodes, which are at the thickness of 200, 150, and 100
µm. The thickness is consistent through the electrode layer at all location in the sample of

128
Figure 4. TXM morphology. a) A 3D model of thin dry printed electrode. b) TXM
surface morphology of a thick dry printed electrode. c) Views at different angles of the
cubic detected room of sample.
200 µm as shown in Figure 5d. Figure 5e shows an enlarged area of Figure 5d, and there
are no obvious cracks as well. In comparison, the thick electrodes (around 200 µm) were
slurry cast in our lab, and shrinkage cracks are detected as shown in Figure S4 of the
Supporting Information. Corresponding SEM‐EDS mapping data reveals a clear view of
all components dispersed in the area. More EDS data are available for the material in two
white square area in Figure 5e, which locate at the surface and bottom of the thick
electrodes (see details in the Figure S5 of the Supporting Information). The boundary
between substrate and electrode material layer is clear, and the bonding is strong without
separation, which corresponds to the analysis in our previous study.19 Additional

129
morphology and detailed EDS mapping data are available in Figures S6–S8 of the
Supporting Information to show the electrode morphology at different thickness,
including the SEM morphology and elements mapping. The high‐level flatness of the
electrodes surface would provide a well‐defined contact area throughout the reaction
layer, which would lower the possibility of dendrite formation. In this way, diffusion
distance is consistent at the entire reaction interface basically, and similar reaction route
is obtained to prevent the problems of material diffusion and contamination.
In Figure 6, we present the electrochemical properties of thick electrodes
fabricated by the dry printing method, and thin dry electrodes are added as a reference
profile. Porosity is controlled at 20–25%, which is designed and confirmed with the
porosity test. Here, we show the rate performance for different thickness in Figure 6a.
Compared dry printed electrode at regular thickness, these thick electrodes start to drop a
lot on higher rate of testing. While the thickness is increased, the performance at a high
rate is lowered, which is due to the longer diffusion distance. All the samples match this
trend, including comparing with the thin dry printed electrodes as a reference. However,
at the rate of 0.1 C, the sample of 200 µm (144 mA h g−1) shows a higher specific
capacity than the sample of 150 µm (130 mA h g−1). We believe that this may come from
the variance of porosities during fabrication. For a thicker electrode with higher porosity,
it is possible to perform better at low rate than a thinner electrode with a lower porosity.
For the rest of thick electrodes that we tested, this phenomenon was not repeated. The
areal capacity comparison between the thin dry printed electrode and thick dry printed
electrodes at 0.1 C is also provided in Figure 6b. When the thickness of electrodes is
increased, the areal capacity loading is improved from 2.45 to 9.11 mA h cm−2. This

130
Figure 5. SEM cross-section morphology showing the precision on controlling the
thickness and components homogeneity: at the thickness of a) 200 µm, b) 150 µm, and c)
100 µm, d) molded electrode thickness consistency (the thickness of sample is 200 µm),
e) SEM-EDS mapping of the cross-section of the same 200 µm sample. The elements of
F, C, O, Co, Ni, Mn are included.
improvement would be beneficial for using lithium‐ion batteries at a larger scale of
energy storage, such as emergency back‐up stations and transformer substations. Cycling
performance for thick electrodes is provided in Figure 6c as well. Limited by obtaining a
counter graphite electrode with high areal capacity, these cycling performance tests were
also based on lithium foil at half‐cell configuration. The cycling performance drops
quickly compared with regular thin electrodes. In addition, the thicker the electrodes, the
faster they decay. Higher porosity and lower tortuosity should benefit the performance on
both rate and cycling, because extra diffusion and transfer room would enable a better
reaction atmosphere. In this way, we prove the control of electrode product morphology
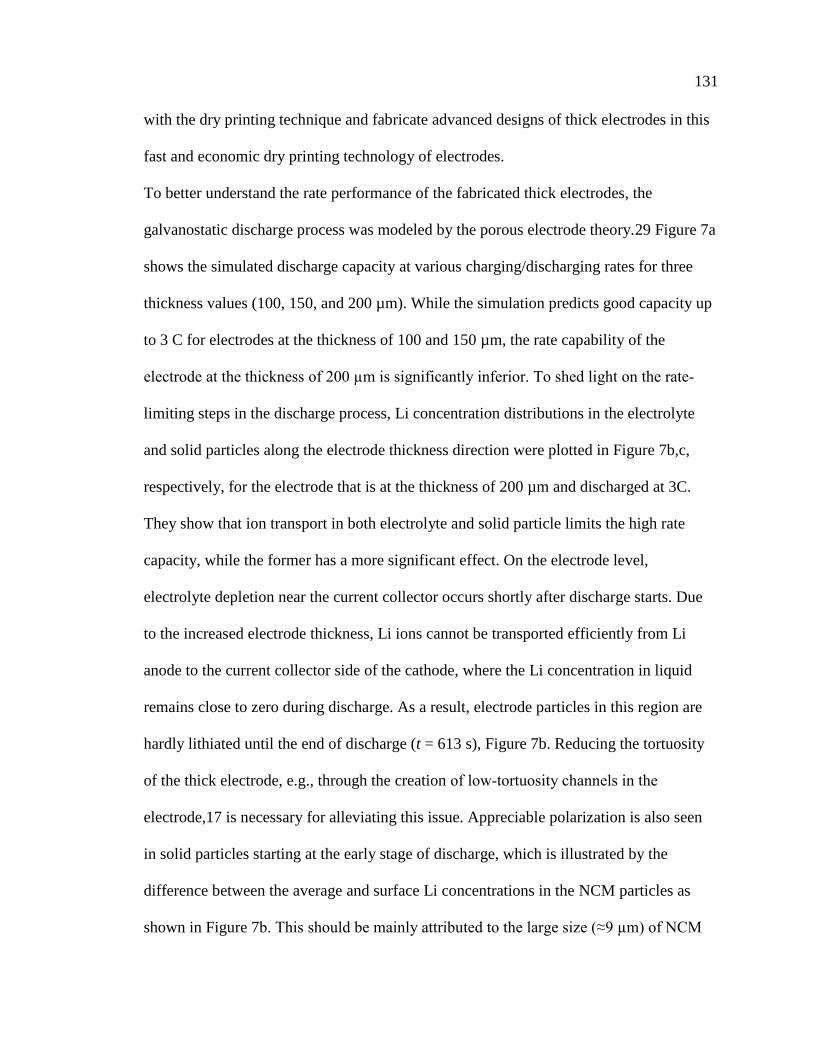
131
with the dry printing technique and fabricate advanced designs of thick electrodes in this
fast and economic dry printing technology of electrodes.
To better understand the rate performance of the fabricated thick electrodes, the
galvanostatic discharge process was modeled by the porous electrode theory.29 Figure 7a
shows the simulated discharge capacity at various charging/discharging rates for three
thickness values (100, 150, and 200 µm). While the simulation predicts good capacity up
to 3 C for electrodes at the thickness of 100 and 150 µm, the rate capability of the
electrode at the thickness of 200 µm is significantly inferior. To shed light on the rate‐
limiting steps in the discharge process, Li concentration distributions in the electrolyte
and solid particles along the electrode thickness direction were plotted in Figure 7b,c,
respectively, for the electrode that is at the thickness of 200 µm and discharged at 3C.
They show that ion transport in both electrolyte and solid particle limits the high rate
capacity, while the former has a more significant effect. On the electrode level,
electrolyte depletion near the current collector occurs shortly after discharge starts. Due
to the increased electrode thickness, Li ions cannot be transported efficiently from Li
anode to the current collector side of the cathode, where the Li concentration in liquid
remains close to zero during discharge. As a result, electrode particles in this region are
hardly lithiated until the end of discharge (t = 613 s), Figure 7b. Reducing the tortuosity
of the thick electrode, e.g., through the creation of low‐tortuosity channels in the
electrode,17 is necessary for alleviating this issue. Appreciable polarization is also seen
in solid particles starting at the early stage of discharge, which is illustrated by the
difference between the average and surface Li concentrations in the NCM particles as
shown in Figure 7b. This should be mainly attributed to the large size (≈9 µm) of NCM

132
secondary particles, which are assumed to have no internal porosity. Creating
interconnected microporous channels inside the secondary particles may thus be an
effective approach to improve the rate performance.
Figure 6. Electrochemical performance of dry‐molded thick electrodes with the reference
of thin “regular” dry printed electrodes (56 µm thickness): a) rate performance (half‐cell
built with lithium foil for all the thickness of electrodes), b) areal capacity at the rate of
0.1 C, c) cycling performance at the rate of 0.2 C (half‐cell built with lithium foil for all
the thick electrodes, and full cell built with graphite anode electrode for the regular
thickness electrode).

133
Figure 7. a) Rate performance of thick electrodes from the porous electrode simulation.
b) Simulated Li concentration profiles in electrolyte at the beginning of discharge (time =
120 s) and the end of discharge (time = 613 s) in an electrode discharged at 3 C at the
thickness of 200 µm, and Li‐ion concentration in the electrolyte along the thickness
direction, c) average (cs) and surface (csf) Li concentration in secondary particles along
the thickness direction, normalized to the maximum Li concentration in NCM.
Compared with the simulation, the electrodes experimentally display more rapid
capacity decay with increasing rate for all three electrode thickness (Figure 6a). Possible
reasons for the discrepancy include: the electrode tortuosity is significantly larger than
the value estimated in the model based on the Bruggeman relation; Li diffusion in solid is
impeded by undetected defects (e.g., cracks) in the dry printed electrodes; there exist
other rate‐limiting steps in the discharge process than considered in the model, (e.g.,
electronic conduction in the solid). In addition, the preliminary low‐porosity setting of
dry printed thick electrode should be taken into consideration as well. The lowered
porosity would contribute to a smaller specific surface area and thereby fewer reaction
interface than improved porosity. These physical conditions of electrodes may limit the
reaction happening in deeper sites along the thickness direction. NCM particles that
locate close to the electrode surface may react at a higher rate and form a layer of the
reaction product, which would impede the reaction of materials that locates further from
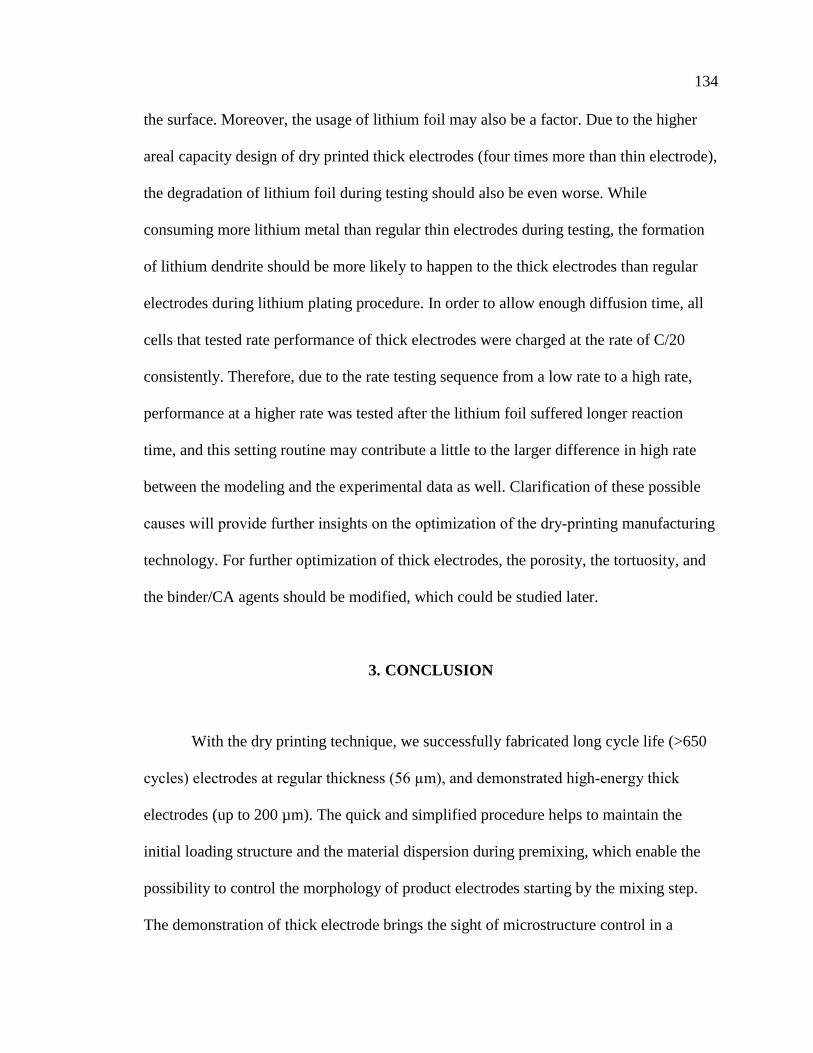
134
the surface. Moreover, the usage of lithium foil may also be a factor. Due to the higher
areal capacity design of dry printed thick electrodes (four times more than thin electrode),
the degradation of lithium foil during testing should also be even worse. While
consuming more lithium metal than regular thin electrodes during testing, the formation
of lithium dendrite should be more likely to happen to the thick electrodes than regular
electrodes during lithium plating procedure. In order to allow enough diffusion time, all
cells that tested rate performance of thick electrodes were charged at the rate of C/20
consistently. Therefore, due to the rate testing sequence from a low rate to a high rate,
performance at a higher rate was tested after the lithium foil suffered longer reaction
time, and this setting routine may contribute a little to the larger difference in high rate
between the modeling and the experimental data as well. Clarification of these possible
causes will provide further insights on the optimization of the dry‐printing manufacturing
technology. For further optimization of thick electrodes, the porosity, the tortuosity, and
the binder/CA agents should be modified, which could be studied later.
3. CONCLUSION
With the dry printing technique, we successfully fabricated long cycle life (>650
cycles) electrodes at regular thickness (56 µm), and demonstrated high‐energy thick
electrodes (up to 200 µm). The quick and simplified procedure helps to maintain the
initial loading structure and the material dispersion during premixing, which enable the
possibility to control the morphology of product electrodes starting by the mixing step.
The demonstration of thick electrode brings the sight of microstructure control in a

135
practicable way. The dry printing technology is possible to allow more potential electrode
designs, which cannot be achieved by the slurry casting technique.
4. EXPERIMENTAL SECTION
4.1. ELECTRODES PREPARATION
All the dry printed cathode electrode were prepared with 90 wt% NCM
(Umicore), 5 wt% Super C65 Carbon Black (Timcal), and 5 wt% PVDF (MTI). They
were premixed with zirconia beads in a BeadBug Microtube Homogenizer (Benchmark
Scientific) for 60 min at 2800 rpm. For thin ones, the premixed powders were added to
fluidized bed spraying chamber. The fluidized bed chamber was fed into the spraying
system with the electrostatic voltage set to 25 kV while the carrier gas inlet pressure was
set to 20 psi. Distance from the deposition head to the grounded aluminum current
collector was kept constant at 1.5 in. while the coating time was kept constant at 10 s.
Surface morphology of the deposited material was investigated using a Helios NanoLab
DualBeam operating with an emission current of 11 pA and 5 kV accelerating voltage.
The details in spraying setup configuration, thickness control and material composition
on spraying behaviors can be found in our previous paper.[19] For thick ones, the
premixed powders were filled into the molds to load on the substrate manually, which
were designed to test the manufacture of thick electrode with dry printing techniques. The
mold diameter were set based on the required sample size. After the hot‐rolling
procedure, the porosities of all thin dry printed electrodes were maintained at the range

136
from 29 to 30%. Similarly, the porosities of all thick dry printed electrodes were
maintained at the range from 20 to 25%.
The slurry casting thick electrode was fabricated in the lab with the same material
composition. The cathode slurry was stirred manually for ≈1.5 h and then cast on
aluminum foil (thickness: 20 µm) with the Automatic Thick Film Coater (MSK‐AFA‐
III). The doctor blade height was used to control the thickness. The coated electrodes
were dried in the film coaster at 90 °C for 6 h and in the vacuumed oven at 80 °C for 8 h.
The mass loading of this thick slurry cast cathode electrode was designed as 63 mg cm−2
at the thicknesses of 200 µm (exclusive of current collector foil). The porosity was set as
30% after calendaring.
The reference slurry cast cathode electrodes were manufactured with 84 wt%
NCM, 8 wt% Super P Li Carbon Black, and 8 wt% binder (Kureha). The porosity is set
as 44% after calendaring. The reference slurry cast anode electrodes were manufactured
with 91.8 wt% graphite, 2 wt% C45 Carbon Black, and 6 wt% binder (Kureha). The
porosity is set as 38% after calendaring.
4.2. ELECTROCHEMICAL MEASUREMENTS
Dry sprayed electrodes were electrochemically tested against graphite anode (as
reference and counter electrode). Molded thick electrodes were tested against Li foil as
reference and counter electrode. For coin cells, cathode and anode electrodes were
punched into disks of 12 mm diameter and dried at 60 °C under vacuum overnight. All
tests are built in 2032 coin cells. Li foils are from MTI and one piece of Celgard 2500
microporous separator was placed between electrodes. The electrolyte is designed for

137
NCM electrode (15.2 wt% LiPF6, 25.4 wt% ethylene carbonate, 59.4 wt% ethyl methyl
carbonate) from TOMIYAMA. All the cells were tested with an Arbin BT2043 tester.
For the rate performance, cells were charged to 4.3 V and discharged to 2.8 V at various
rates such as 0.05, 1, 0.2, 0.5, 1, 2, and 3C. The same current rates were set for thin
sprayed electrode at charging and discharging. The constant current charging rate is set at
C/20 for thick electrodes, and the current rates at discharging were the same as the
sprayed electrodes. For cycling performance, cells were charged to 4.3 V (NCM) and
discharged to 2.8 V (NCM) at 0.5 C for thin electrodes and 0.2 C for thick electrodes.
4.3. POROSITY MEASUREMENTS
Porosity of the sprayed (or cast) electrode was determined by taking into account
of the theoretical density of the mix (active material, carbon black, and binder) according
to the following equation. Porosity = [T − S ((W1/D1) + (W2/D2) + (W3/D3))]/T, where T is
the thickness of the electrode laminate (without Al foil current collector), S is the weight
of the laminate per area, W1, W2, and W3 are the weight percentage of active material,
PVDF binder, and C65 within the electrode laminate, while D1, D2, and D3 are the true
density for Li[Ni1/3Co1/3Mn1/3]O2, PVDF, and C65, respectively. The theoretical densities
for Li[Ni1/3Co1/3Mn1/3]O2 active material, PVDF, and C65 are 4.68, 1.78, and 2.25 g
cm−3, respectively. All the porosities were calculated by assuming that the weight
fractions and density of each material were not changed by the fabrication process.

138
4.4. MORPHOLOGY CHARACTERIZATION
The cross‐section and surface morphology were observed by SEM (JEOL JSM‐
7000F electron microscope). EDS mapping was applied. The TXM experiments were
performed at 8BM beamline, advanced photon source (APS) through a transition program
of National Synchrotron Light Source II (NSLS II). The nanotomography datasets were
collected with 8.336 keV, using 721 projections over an angular range of 180° with a
field of view of 40 × 40 µm2 (with a 2 k × 2 k CCD (charge‐coupled device) camera
binning 2 × 2 camera pixels into one output pixel). Each image was collected with 10 s
exposure time. Two samples with different thicknesses (50 and 100 µm) were used in this
work.
4.5. MODELING
The galvanostatic discharge simulation employs the standard 1D porous electrode
model.[29] The model parameters used in the simulation are listed in Table 1. The
Bruggeman relation τ = ε−1/2, where τ and ε are tortuosity and porosity, respectively, is
used to estimate the effective diffusivity of electrolyte in electrode and separator. The
electrode particles are assumed to electronically well wired and so that the electrostatic
potential is uniform in solid across the electrode thickness. Solid diffusion in electrode
particles is solved using a parabolic approximation.[30] The equilibrium potential of
NCM is taken from ref. [31].

139
Table 1. List of parameters for galvanostatic discharge simulation.
Parameter Value
Ambipolar diffusivity in electrolyte 3.38×10⁻¹⁰ m2 s-1
Li-ion transference number in electrolyte 0.3
Ionic conductivity in electrolyte 3.04 S m-1
Initial electrolyte concentration 1 mol L-1
Kinetic rate constant for electrode surface flux 3×10-11 mol [m2s(mol m-3)1.5]-1
Li diffusivity in NCM 10-14 m2 s-1
Electrode porosity 20%
Separator thickness 25 μm
Separator porosity 55%
NCM particle size 9 μm
Initial Li concentration in NCM 10503 mol m-3
Maximum Li concentration in NCM 23339 mol m-3
ACKNOWLEDGMENTS
J.L. and B.L. contributed equally to this work. This work was financially
supported by the NSFCMMI‐1462343, CMMI‐1462321, and IIP‐1640647. It was also
supported by U.S. Department of Energy, Office of Basic Energy Sciences Physical
Behavior of Materials Program under Contract No. DE‐SC0014435. This research uses
HPC resources supported in part by the Big‐Data Private‐Cloud Research
Cyberinfrastructure MRI‐award funded by NSF under Grant No. CNS‐1338099 and by
Rice University. This research also uses resources of the Advanced Photon Source, a U.S.
Department of Energy (DOE) Office of Science User Facility operated for the DOE
Office of Science by Argonne National Laboratory under Contract No. DE‐AC02‐

140
06CH11357. Use of beamline 8BM at APS was partially supported by the National
Synchrotron Light Source II, Brookhaven National Laboratory, under DOE Contract No.
DE‐SC0012704.
REFERENCES
[1] A. Kraytsberg, Y. Ein-Eli, Advanced Energy Materials 2016, 6, 23; J. Li, C.
Daniel, D. Wood, J. Power Sources 2011, 196, 2452.
[2] H. Y. Tran, C. Täubert, M. Wohlfahrt-Mehrens, Progress in Solid State Chemistry
2014, 42, 118.
[3] Z. Liu, P. P. Mukherjee, Journal of The Electrochemical Society 2014, 161,
E3248.
[4] D. Liu, L.-C. Chen, T.-J. Liu, T. Fan, E.-Y. Tsou, C. Tiu, Advances in Chemical
Engineering and Science 2014, 4, 515.
[5] Z. Liu, V. Battaglia, P. P. Mukherjee, Langmuir 2014, 30, 15102.
[6] C. Fongy, S. Jouanneau, D. Guyomard, J. Badot, B. Lestriez, Journal of The
Electrochemical Society 2010, 157, A1347; M. Gaberscek, J. Jamnik, Solid State
Ionics 2006, 177, 2647.
[7] H. Zheng, R. Yang, G. Liu, X. Song, V. S. Battaglia, The Journal of Physical
Chemistry C 2012, 116, 4875.
[8] S. J. Harris, P. Lu, The Journal of Physical Chemistry C 2013, 117, 6481.
[9] J. Maier, Faraday Discuss. 2015, 176, 17.
[10] M. Cerbelaud, B. Lestriez, R. Ferrando, A. Videcoq, M. Richard-Plouet, M.
Teresa Caldes, D. Guyomard, Langmuir 2014, 30, 2660.
[11] Q. Xue, European Polymer Journal 2004, 40, 323.
[12] U. H. Kim, E. J. Lee, C. S. Yoon, S. T. Myung, Y. K. Sun, Advanced Energy
Materials 2016, 6, 8.

141
[13] Y. K. Sun, Z. H. Chen, H. J. Noh, D. J. Lee, H. G. Jung, Y. Ren, S. Wang, C. S.
Yoon, S. T. Myung, K. Amine, Nat Mater 2012, 11, 942.
[14] Y. K. Sun, S. T. Myung, B. C. Park, J. Prakash, I. Belharouak, K. Amine, Nat
Mater 2009, 8, 320.
[15] Y. K. Sun, S. T. Myung, M. H. Kim, J. Prakash, K. Amine, J Am Chem Soc 2005,
127, 13411.
[16] F. Shen, W. Luo, J. Dai, Y. Yao, M. Zhu, E. Hitz, Y. Tang, Y. Chen, V. L.
Sprenkle, X. Li, Advanced Energy Materials 2016, 6.
[17] J. Sander, R. Erb, L. Li, A. Gurijala, Y.-M. Chiang, Nature Energy 2016, 1,
16099.
[18] J. Billaud, F. Bouville, T. Magrini, C. Villevieille, A. R. Studart, Nature Energy
2016, 1, 16097.
[19] B. Ludwig, Z. Zheng, W. Shou, Y. Wang, H. Pan, Scientific Reports 2016, 6,
23150.
[20] S. Watanabe, M. Kinoshita, T. Hosokawa, K. Morigaki, K. Nakura, J. Power
Sources 2014, 260, 50.
[21] D. J. Miller, C. Proff, J. Wen, D. P. Abraham, J. Bareño, Advanced Energy
Materials 2013, 3, 1098.
[22] H.-J. Noh, Z. Chen, C. S. Yoon, J. Lu, K. Amine, Y.-K. Sun, Chem. Mat. 2013,
25, 2109.
[23] S. Watanabe, M. Kinoshita, T. Hosokawa, K. Morigaki, K. Nakura, J. Power
Sources 2014, 258, 210.
[24] S. Watanabe, M. Kinoshita, K. Nakura, J. Power Sources 2011, 196, 6906.
[25] S. Zheng, R. Huang, Y. Makimura, Y. Ukyo, C. A. Fisher, T. Hirayama, Y.
Ikuhara, Journal of The Electrochemical Society 2011, 158, A357.
[26] J. Wang, Y. C. K. Chen, Q. X. Yuan, A. Tkachuk, C. Erdonmez, B. Hornberger,
M. Feser, Applied Physics Letters 2012, 100.
[27] J. J. Wang, Y. C. K. Chen-Wiegart, J. Wang, Angew Chem Int Edit 2014, 53,
4460.
[28] J. J. Wang, C. Eng, Y. C. K. Chen-Wiegart, J. Wang, Nature Communications
2015, 6.

142
[29] M. Doyle, T. F. Fuller, J. Newman, Journal of the Electrochemical Society 1993,
140, 1526; K. E. Thomas, J. Newman, R. M. Darling, in Advances in Lithium-Ion
Batteries, (Eds: W. van Schalkwijk, B. Scrosati), Kluwer Academic/Plenum
Publishers, New York 2002, 48.
[30] C. Y. Wang, W. B. Gu, B. Y. Liaw, Journal of the Electrochemical Society 1998,
145, 3407; Q. Zhang, R. E. White, Journal of Power Sources 2007, 165, 880.
[31] S. Lueth, U. S. Sauter, W. G. Bessler, Journal of the Electrochemical Society
2015, 163, A210.
[32] A. Nyman, M. Behm, G. Lindbergh, Electrochim. Acta 2008, 53, 6356.
SUPPLEMENTARY INFORMATION
Figure S1. SEM surface morphology of dry printed thin electrode: a) at the scale of 500
magnification; b) at the scale of 4000 magnification; c) at the scale of 40000
magnification.

143
Figure S2. SEM surface morphology of slurry cast thin commercial electrodes: a) surface
view at the scale of 200 magnification; b) surface view at the scale of 500 magnification;
c) cross-section view at the scale of 950 magnification; b) cross-section view at the scale
of 2000 magnification.

144
Figure S3. TXM of dry printed electrode: a) and b) samples of electrodes. Limited to our
preliminary study on TXM, Focused Ion Beam (FIB) technique was not selected to
prepare samples, which cause sample particles to peel off the substrate during cutting. c)
selected from the square area of sample b, we took 720 pictures of the cubic room while
rotating the sample at a constant speed and built a 3D model based on them. The model in
video format is attached in the supplemental information file as well. More in-situ
monitoring of the reaction of electrodes is accessible for TXM, and is interested to us for
later study, which could include chemistry analysis in motion and un-destructive probing
of the sample during cycling. More 3D models were built by the TXM in our study, but
were not clearly enough to present here due to the thickness of our sample at 100 um,
which would have an overlapping pattern of NMC particles in certain directions of view
while X-ray detects the sample in the rotation. (Detection window is set as a cubic at the
dimensions of 50um x 50 um x 50 um)

145
Figure S4. Slurry cast thick electrode at the thickness of 200 um: a) overview of the
product; b) enlarged view.
Figure S5. Cross-section areas of the thick dry printed electrode at the thickness of 200
um: a) bottom area EDS mapping; b) surface area EDS mapping.

146
Figure S6. SEM morphology and EDS mapping of dry printed thick electrode at the
thickness of 100 um: a) Surface EDS mapping; b) cross-section view at the scale of 50,
400, 750 magnification, respectively; c) surface view at the scale of 500, 4000, 40000
magnification, respectively.

147
Figure S7. SEM morphology and EDS mapping of dry printed thick electrode at the
thickness of 150 um: a) cross-section view at the scale of 50, 400, 750 magnification, and
surface view at the scale of 500, 2000, 10000 magnification, respectively; b) EDS
mapping of the surface; c) EDS mapping of the cross-section.
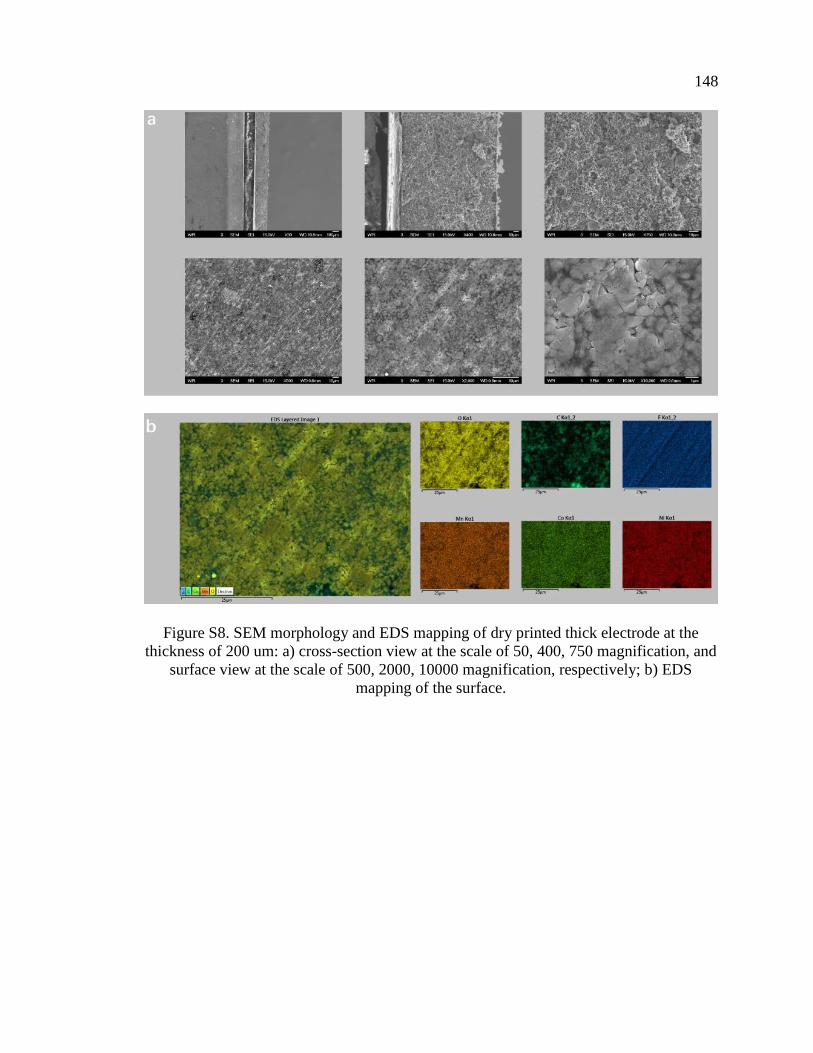
148
Figure S8. SEM morphology and EDS mapping of dry printed thick electrode at the
thickness of 200 um: a) cross-section view at the scale of 50, 400, 750 magnification, and
surface view at the scale of 500, 2000, 10000 magnification, respectively; b) EDS
mapping of the surface.

149
SECTION
2. CONCLUSION
A new method for manufacturing Li-ion battery electrodes was investigated in
this dissertation. The first paper introduced the new process and detailed the steps needed
to manufacture solvent-free additive manufactured electrodes. Electrodes were prepared
with LCO as the active material, PVDF as the binder additive, and C65 as the conductive
additive. Due to surface energy interactions, it was found that the conductive additive
was stripping the binder additive off the active material particles. This caused poor
mechanical bonding within the electrode layer and at the electrode layer/current collector
interface. A hot rolling step was introduced to rectify this issue and the mechanical
performance increased substantially. The solvent-free manufactured electrodes displayed
a mechanical strength of 148.8 kPa. This was noticeably higher than electrodes
manufactured using the slurry-casting method, which displayed a mechanical strength of
84.3 kPa. The solvent-free electrodes also displayed similar electrochemical performance
when compared to electrodes manufactured with the same specifications using the slurry-
casting method. NMC electrodes were also fabricated to show the solvent-free process
can be readily applied with other active materials.
The second paper focused on understanding the effect a material’s surface energy
has on the final mixing outcome. In the first paper, it was found that the binder additive
was being coated with the conductive additive when the two were present during mixing.
In the second paper, the properties of the active material (LCO in this case) and the

150
conductive additive (C65) were altered to see if a change in mixing was noticed. Surface
energy values for the experimental materials were determined through sessile drop
contact angle studies. A mathematical model was developed to better predict the
experimental mixing outcomes. The mathematical model predictions were then compared
with experimental studies and were found to be in agreement. These results were used to
fabricate Li-ion battery electrodes with reduced binder and conductive additives (1 wt%
each). The mechanical and electrochemical performance of the reduced additive
electrodes was promising and helped to confirm uniform distribution of additives was
essential when manufacturing solvent-free electrodes.
The third paper was also focused on understanding the effect an electrode
material’s surface energy has on the final distribution of additives when using a dry
mixing process. In this paper, a DEM simulation was developed and used to study dry
mixing characteristics. Since Li-ion battery electrode particles are in the submicron to
micron size range, the mixing results are mostly dependent on van der Waals adhesive
forces between particles. DEM simulation data was compiled, and contour plots were
generated. These results and contour plots were found to be very similar to the contour
plot results of the mathematical model presented in the second paper. The surface energy
values used in the simulations were the same values found through sessile drop contact
angle measurements in the second paper. In both papers, it was predicted that binder
additives would assemble on an active material particle except for cases in which the
active material surface energy was especially low. However, conductive additives were
more likely to form aggregates than to assemble on active material particle. This behavior
was confirmed with experimental mixing studies. In the first paper, it was found that

151
conductive additives would attach to the surface of the binder additives, causing poor
mechanical strength. This behavior was confirmed with DEM simulations.
The electrodes fabricated in the previous papers were ~50 μm thick and represent
the scale of typical Li-ion battery electrodes used in portable electronics. However,
electrodes with increased energy density are sought after to make them more feasible in
large platforms, such as EVs. Therefore, the last paper was focused on increasing the
energy density of electrodes fabricated with the solvent-free additive manufacturing
process. Electrodes were fabricated with thicknesses ranging from 50-200 μm with no
manufacturing issues. This was not the case for thick electrodes fabricated with the
conventional manufacturing method. These electrodes were susceptible to cracking
during the drying step and this behavior has been seen in previous studies as well [17]. It
was noticed that the electrochemical performance weakened as the electrode layer
thickness increased. This has also been shown in previous studies and is attributed to
increased tortuosity of the electrode layer [18-20].

152
BIBLIOGRAPHY
[1] Cano, Z. P., Banham, D., Ye, S., Hintennach, A., Lu, J., Fowler, M. & Chen, Z.
Batteries and fuel cells for emerging electric vehicle markets. Nature Energy 3,
279-289 (2018).
[2] Ruffo. R., Wessells, C., Huggins, R.A. & Cui, Y. Electrochemical behavior of
LiCoO2 as aqueous lithium-ion battery electrodes. Electrochem. Commun. 11, 247-
249 (2008).
[3] Li, C.-C. & Wang, Y.-W. Importance of binder composition to the dispersion and
electrochemical properties of water-based LiCoO2 cathodes. J. Power Sources 227,
204-210 (2013).
[4] Advanced Battery Electrode Manufacturing: Complete line integration for electrode
coating, drying, and solvent recovery. Babcock & Wilcox MEGTEC (2016).
[5] Liu, Z. & Mukherjee, P. P. Microstructure evolution in lithium-ion battery electrode
processing. J. Electrochem. Soc. 161, E3248–E3258 (2014).
[6] Westphal, B. G., Bockholt, H., Günther, T., Haselrieder, W. & Kwade, A. Influence
of convective drying parameters on electrode performance and physical electrode
properties. ECS Transactions 64, 57–68 (2015).
[7] Jaiser, S., Friske, A., Baunach, M., Scharfer, P. & Schabel, W. Development of a
three-stage drying profile based on characteristic drying stages for lithium-ion
battery anodes. Dry. Technol. 35, 1266–1275 (2017).
[8] Miyata, K., Kawada, T. & Katou, K. NMP distilling apparatus. European Patent
Application No. 10815325.5.
[9] Wood, D. L., Li, J. & Daniel, C. Prospects for reducing the processing cost of
lithium ion batteries. J. Power Sources 275, 234-242 (2015).
[10] Ruffo, R., Wessells, C., Huggins, R. A. & Cui, Y. Electrochemical behavior of
LiCoO2 as aqueous lithium-ion battery electrodes." Electrochemistry
Communications 11(2), 247-249 (2009).
[11] Bitsch, B., Dittmann, J., Schmitt, M., Scharfer, P., Schabel, W. & Willenbacher N.
A novel slurry concept for the fabrication of lithium-ion battery electrodes with
beneficial properties. J. Power Sources 265, 81-90 (2014).

153
[12] Doberdo, I., Loffler, N., Laszczynski, N., Cericola, D., Penazzi, N., Bodoardo, S.,
Kim, G.-T. & Passerini, S. Enabling aqueous binders for lithium battery cathodes -
Carbon coating of aluminum current collector. J. Power Sources 248, 1000-1006
(2014).
[13] Miyata, K., Kawada, T. & Katou, K. NMP distilling apparatus. European Patent
Application No. 10815325.5.
[14] Li, J., Daniel, C., & Wood, D. Materials processing for lithium-ion batteries. J.
Power Sources 196, 2452-2460 (2011).
[15] Li, J., Rulison, C., Kiggans, J., Daniel, C. & Wood, D. L. Superior performance of
LiFePO4 aqueous dispersions via corona treatment and surface energy
optimization. J. Electrochem. Soc. 159, A1152-A1157 (2012).
[16] Kuwata, N., Kawamura, J., Toribami, K., Hattori, T., & Sata, N. Electrochem.
Commun. 6, 417- (2004).
[17] Du, Z., Rollag, K. M., Li, J., An, S. J., Wood, M., Sheng, Y., Mukherjee, P. P.,
Daniel, C. & Wood, D. L. Enabling Aqueous processing for crack-free thick
electrodes. J. Power Sources 354, 200-206 (2017).
[18] Zheng, H., Li, J., Song, X., Liu, G., & Battaglia, V. S. A comprehensive
understanding of electrode thickness effects on the electrochemical performances of
Li-ion battery cathodes. Electrochimica Acta 71, 258-265 (2012).
[19] Singh, M., Kaiser, J., & Hahn, H., Thick Electrodes for High Energy Lithium Ion
Batteries, J. Electrochem. Soc. 162, A1196-A1201 (2015).
[20] Sander, J. S., Erb, R. M., Li, L., Gurijala, A., & Chiang, Y.-M. High-performance
battery electrodes via magnetic templating. Nature Energy 1, 16099 (2016).
154
VITA
Brandon Joshua Ludwig graduated from Monroe City R-1 High School in 2007
and then enrolled at Missouri University of Science & Technology (then University of
Missouri-Rolla). He worked for the Mechanical and Aerospace Department as a work-
study student for two years during his time as an undergraduate student. In Spring 2012,
he graduated Cum Laude with a B.S. in Mechanical Engineering.
Brandon started his Ph.D. in Mechanical Engineering in Fall 2012. In Fall 2013,
Brandon started doing research for Dr. Heng Pan. Brandon’s first research focus was on
building an aerosol printing system. This system was eventually capable of printing a
variety of materials on non-conformal surfaces and led to a journal publication (Science
China Information Sciences) focused on printing zinc nanoparticles for bioresorbable
electronics. Brandon was also an author for an Advanced Materials article focused on
low-cost manufacturing of bioresorbable electronics.
Brandon started to focus on additive manufacturing of electrodes for Li-ion
batteries in 2014, which was the focus of his dissertation. This work was supported by
two National Science Foundation awards and has led to a utility patent and four journal
publications. The research articles were published in Nature: Scientific Reports,
Advanced Materials Interfaces, Advanced Materials Technologies, and ASME Journal of
Micro and Nano-Manufacturing. Brandon received his Ph.D. in Mechanical Engineering
from the Missouri University of Science and Technology in May 2019.