solteq småbolagsdag 1.9.2016
TRANSCRIPT
Repe Harmanen, CEO1st Sep, 2016Stockholm
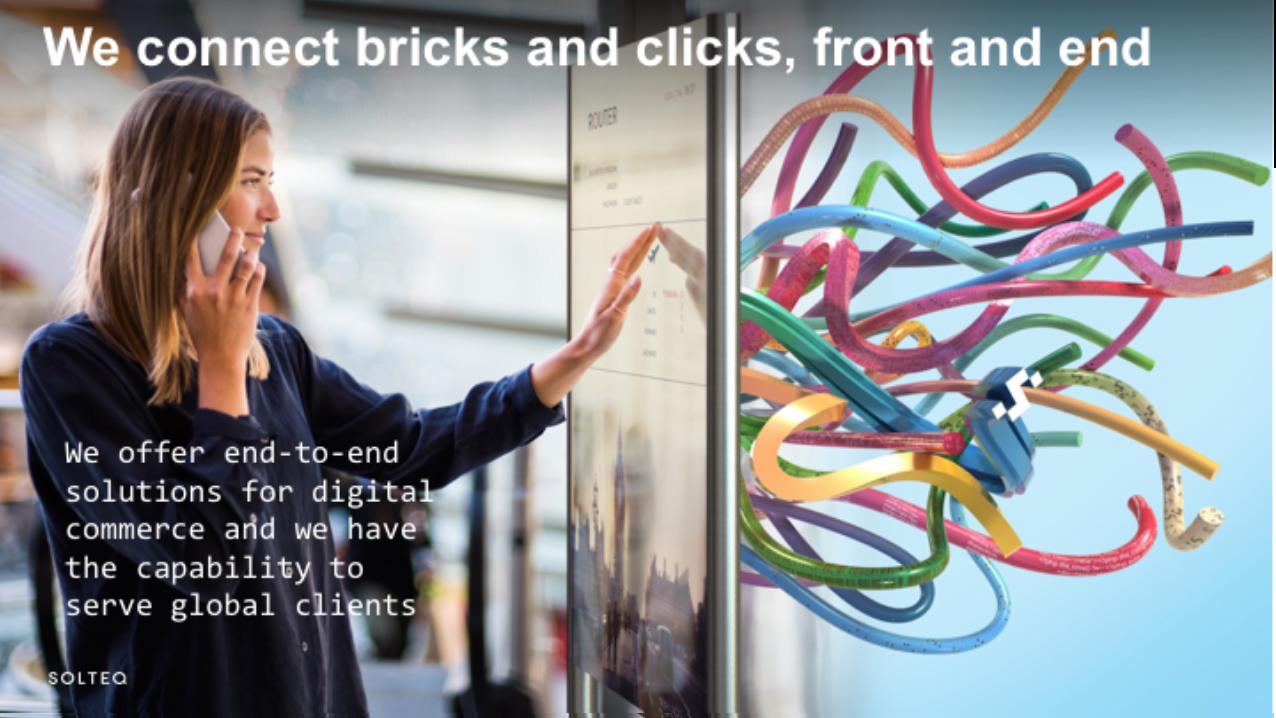
We connect bricks and clicks, front and end
We offer end-to-end solutions for digital commerce and we have the capability to serve global clients
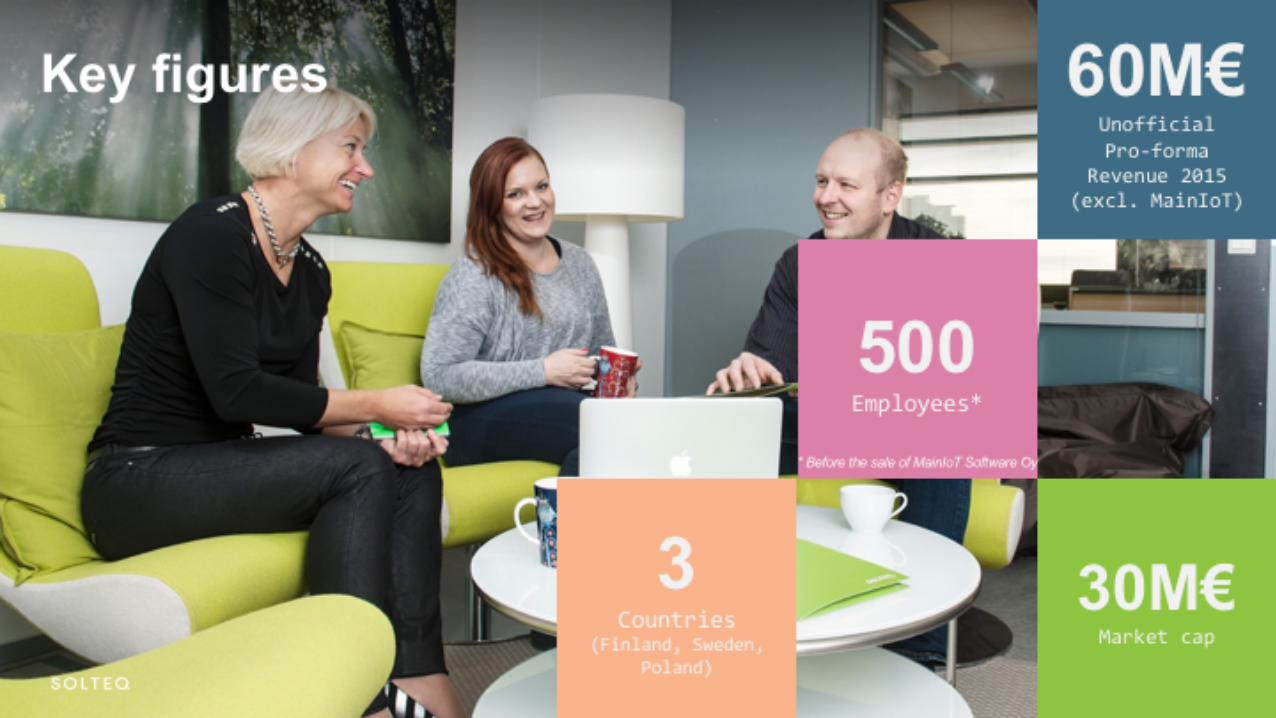
Key figures
30M€Market cap
60M€Unofficial Pro-forma
Revenue 2015(excl. MainIoT)
500Employees*
3Countries
(Finland, Sweden, Poland)
* Before the sale of MainIoT Software Oy
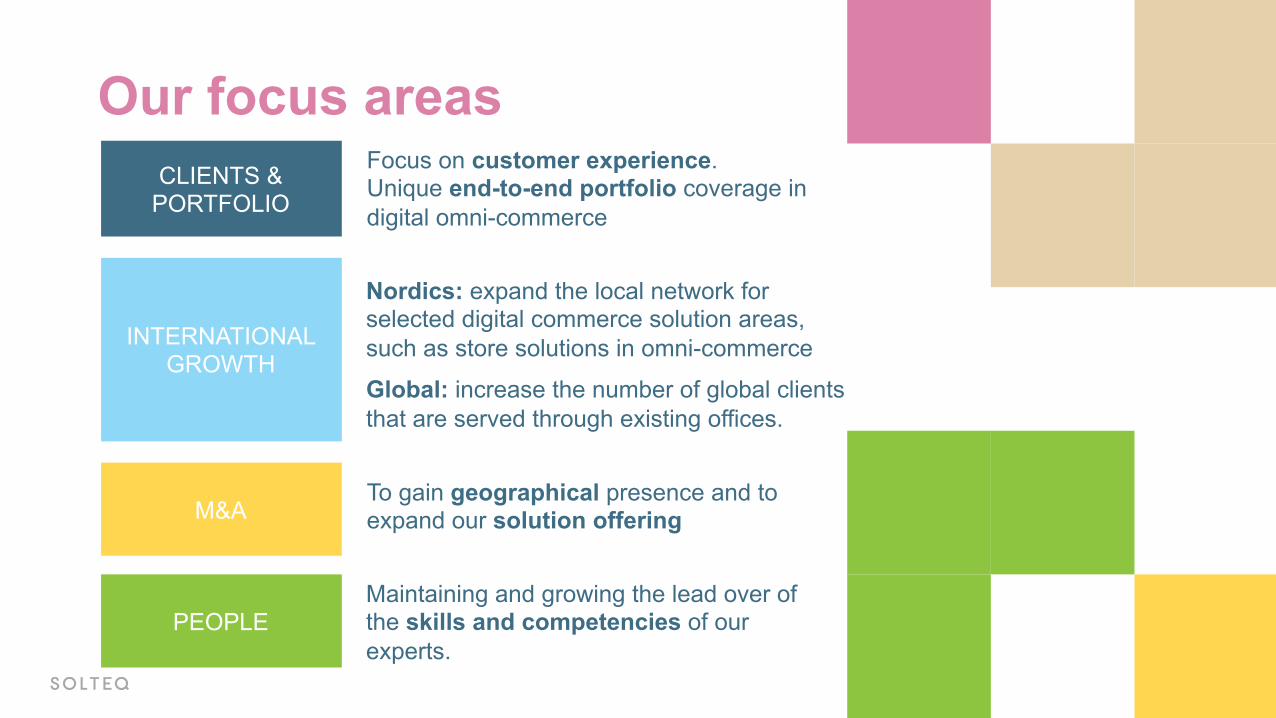
Our focus areas
M&A
CLIENTS & PORTFOLIO
PEOPLE
INTERNATIONAL GROWTH
To gain geographical presence and to expand our solution offering
Focus on customer experience.Unique end-to-end portfolio coverage in digital omni-commerce
Maintaining and growing the lead over of the skills and competencies of our experts.
Nordics: expand the local network for selected digital commerce solution areas, such as store solutions in omni-commerce
Global: increase the number of global clients that are served through existing offices.
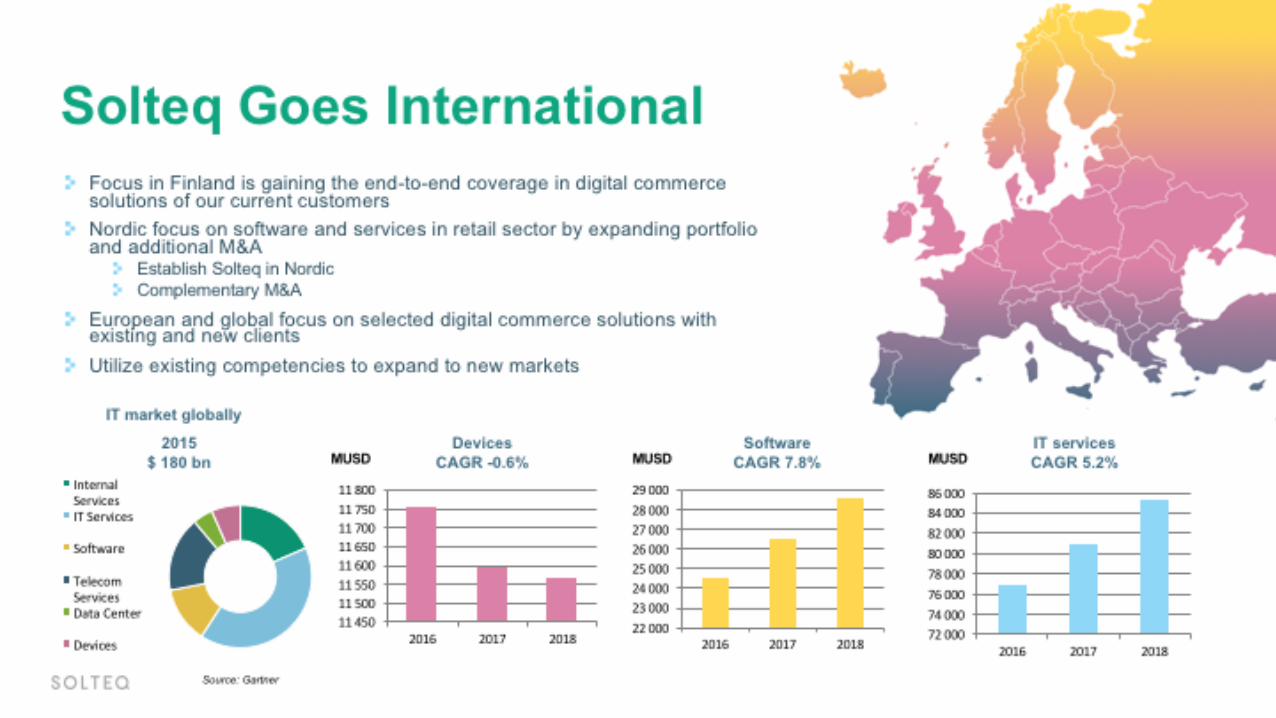
2015$ 180 bn
DevicesCAGR -0.6%
SoftwareCAGR 7.8%
IT servicesCAGR 5.2%
IT market globally
Solteq Goes InternationalFocus in Finland is gaining the end-to-end coverage in digital commerce solutions of our current customersNordic focus on software and services in retail sector by expanding portfolio and additional M&A
Establish Solteq in NordicComplementary M&A
European and global focus on selected digital commerce solutions with existing and new clientsUtilize existing competencies to expand to new markets
11 45011 50011 55011 60011 65011 70011 75011 800
2016 2017 201822 00023 00024 00025 00026 00027 00028 00029 000
2016 2017 201872 00074 00076 00078 00080 00082 00084 00086 000
2016 2017 2018
InternalServicesITServices
Software
TelecomServicesDataCenter
Devices
MUSD MUSD MUSD
Source: Gartner
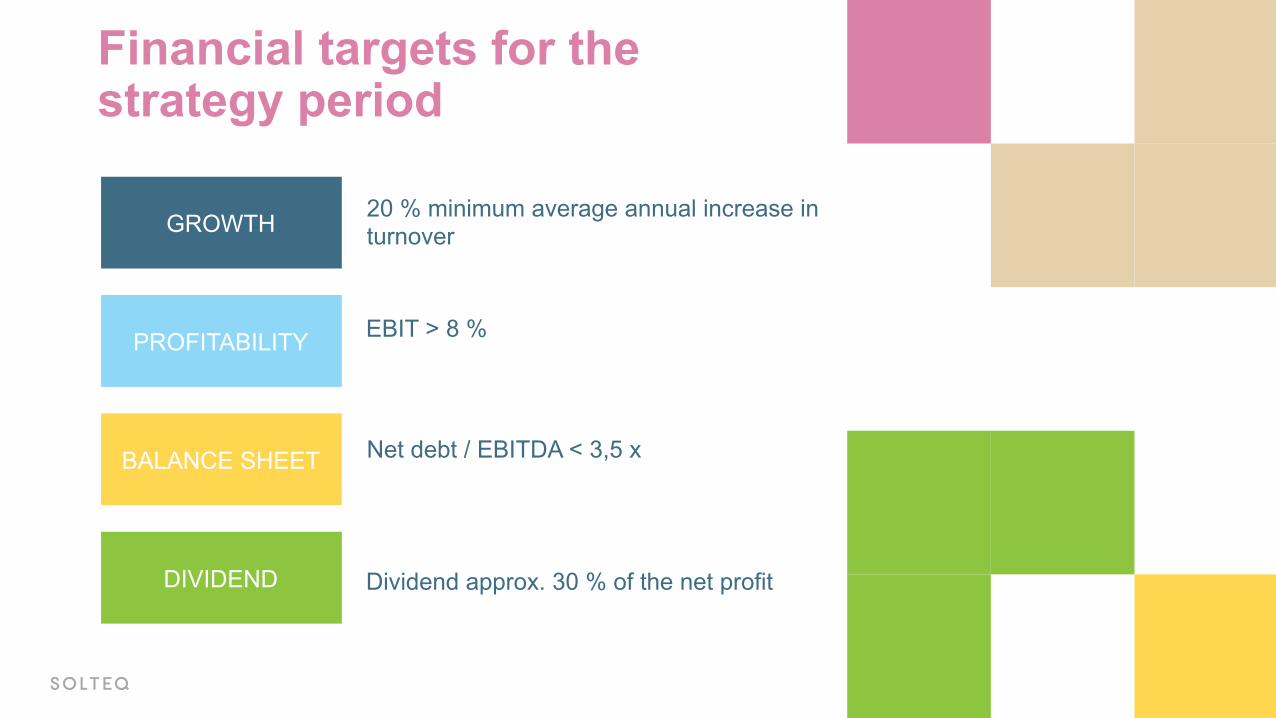
Financial targets for thestrategy period
BALANCE SHEET
GROWTH
DIVIDEND
PROFITABILITY
Net debt / EBITDA < 3,5 x
20 % minimum average annual increase in turnover
Dividend approx. 30 % of the net profit
EBIT > 8 %
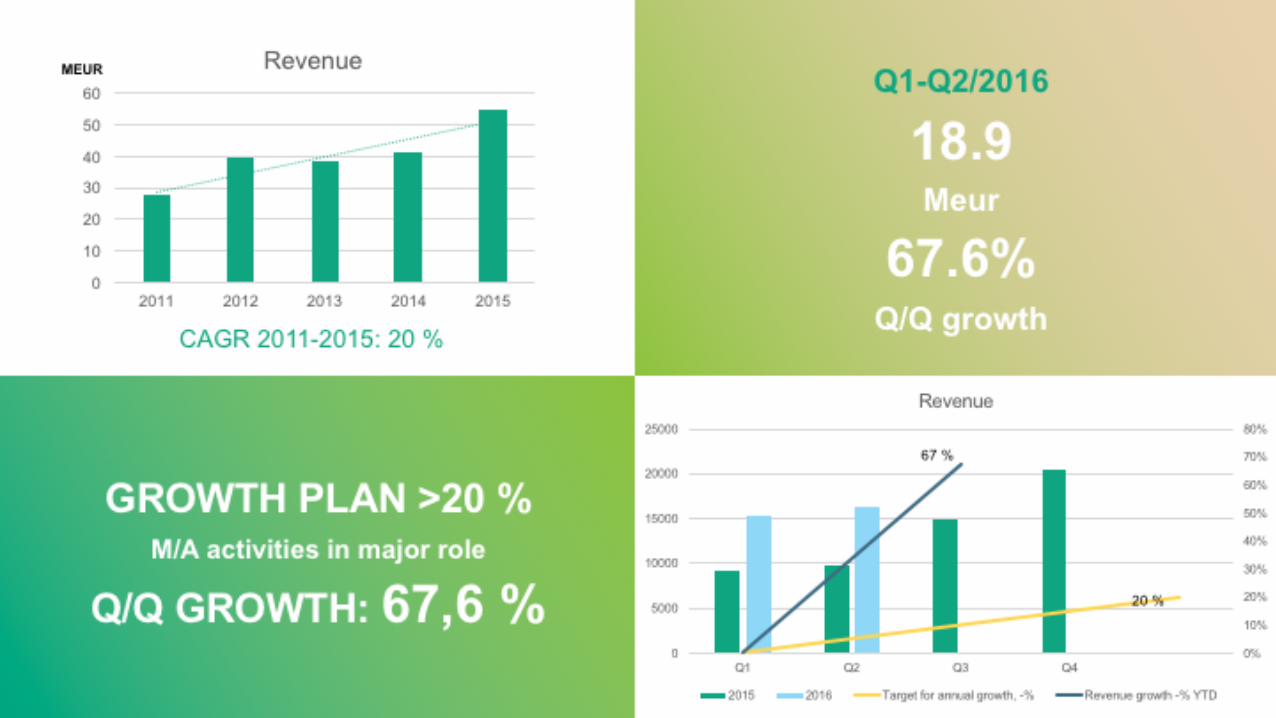
GROWTH PLAN >20 %M/A activities in major role
Q/Q GROWTH: 67,6 %
Q1-Q2/2016
18.9 Meur
67.6%Q/Q growth
0
10
20
30
40
50
60
2011 2012 2013 2014 2015
RevenueMEUR
0%
10%
20%
30%
40%
50%
60%
70%
80%
0
5000
10000
15000
20000
25000
Q1 Q2 Q3 Q4
Revenue
2015 2016 Target for annual growth, -% Revenue growth -% YTD
20 %
67 %
CAGR 2011-2015: 20 %
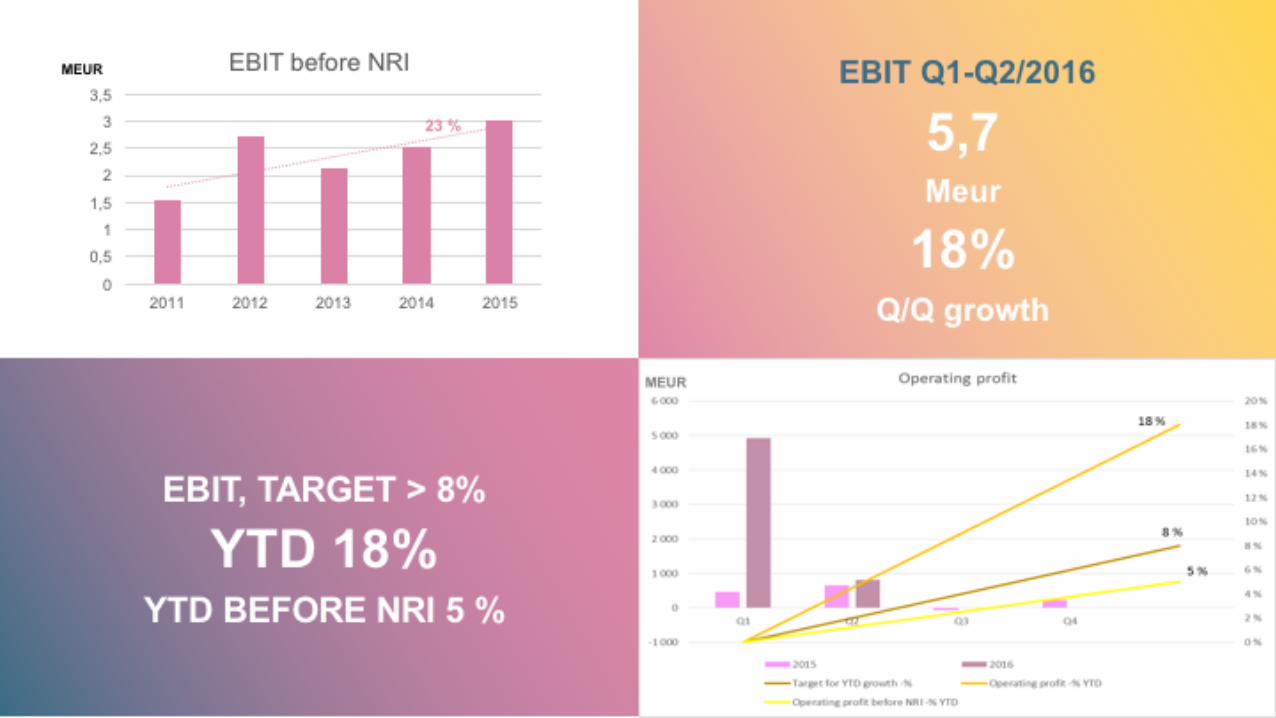
EBIT, TARGET > 8%
YTD 18%YTD BEFORE NRI 5 %
EBIT Q1-Q2/2016
5,7 Meur
18%Q/Q growth
00,5
11,5
22,5
33,5
2011 2012 2013 2014 2015
EBIT before NRIMEUR
MEUR
23 %
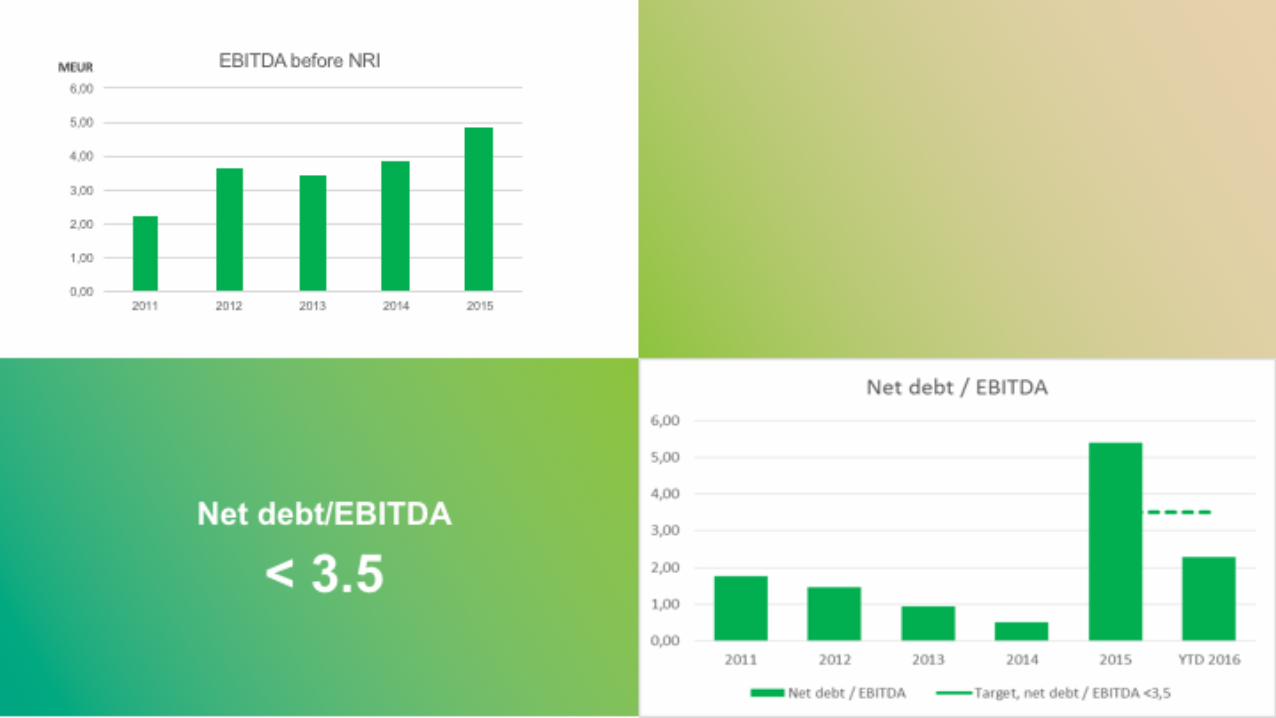
Net debt/EBITDA
< 3.5
MEUR
0,00
1,00
2,00
3,00
4,00
5,00
6,00
2011 2012 2013 2014 2015
EBITDA before NRI
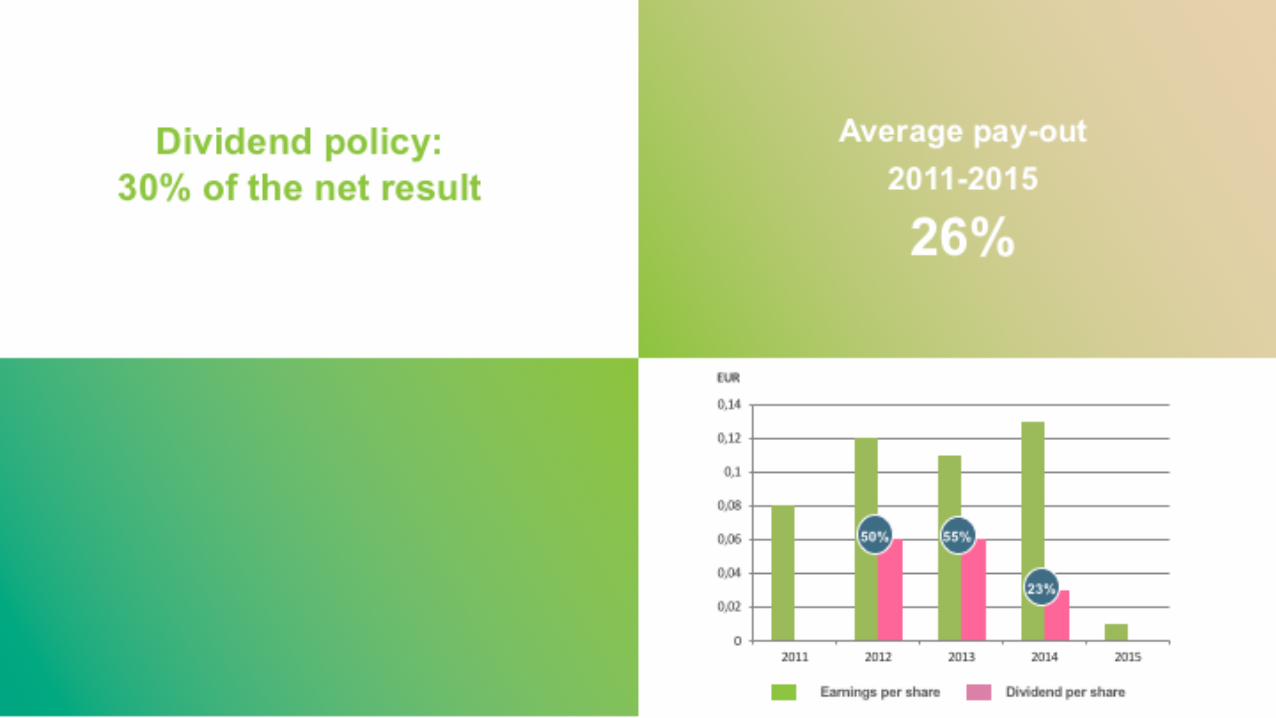
Average pay-out2011-2015
26%
0
0,02
0,04
0,06
0,08
0,1
0,12
0,14
2011 2012 2013 2014 2015
Earnings per share Dividend per share
50% 55%
23%
Dividend policy:30% of the net result
EUR
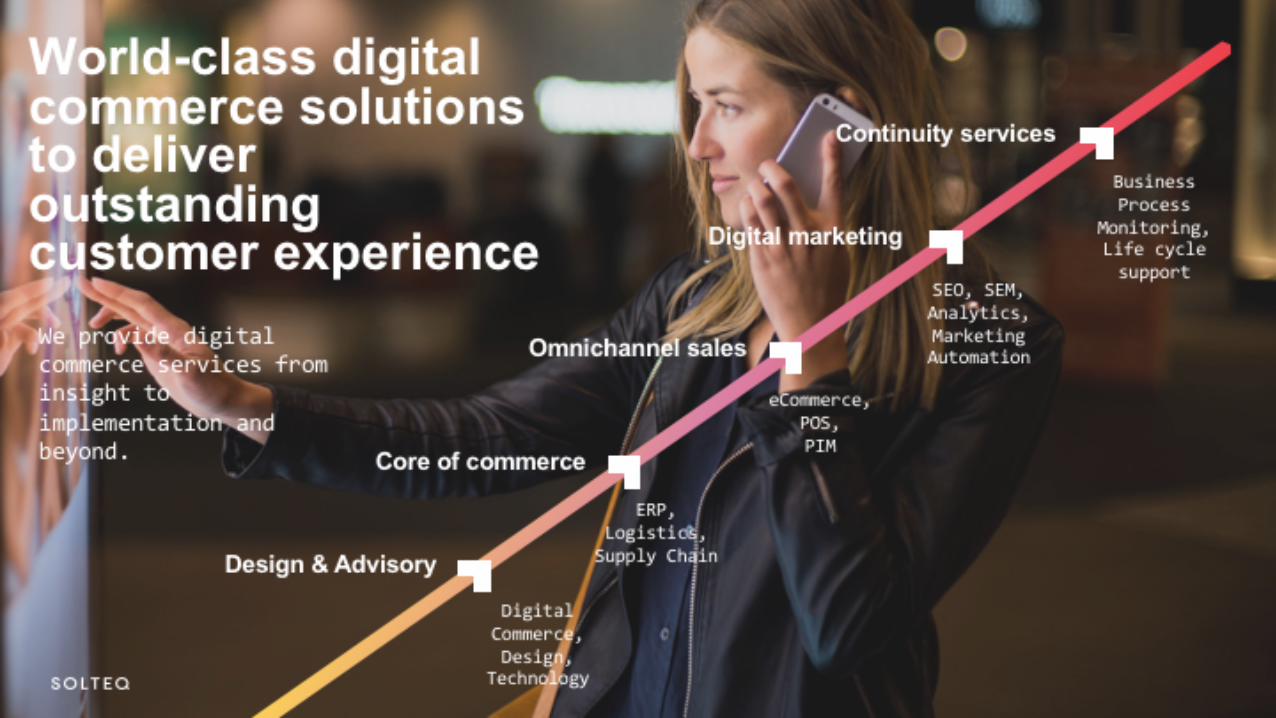
We provide digital commerce services from insight to implementation and beyond.
World-class digital commerce solutions to deliver outstanding customer experience
Digital Commerce,Design,
Technology
ERP,Logistics,
Supply Chain
eCommerce,POS,PIM
SEO, SEM,Analytics,Marketing Automation
Business Process
Monitoring,Life cyclesupport
Continuity services
Digital marketing
Core of commerce
Omnichannel sales
Design & Advisory

Why invest in Solteq?
Digitalisationrevolutionisescommerce and creates growing
demand for digital services
We are recognisedfor our competencies
and we are well positioned to capture
the potential
Our aim is to grow faster than the
market – organically and through
acquisitions in Nordics and wider
Our aim is growing into the world’s smallest globaldigital commerce service provider

Thank You!