solid-liquid mass transfer in trickle bed reactors rita joubert
TRANSCRIPT
Solid-Liquid Mass Transfer in
Trickle Bed Reactors
Rita Joubert
©© UUnniivveerrssiittyy ooff PPrreettoorriiaa

i
Solid-Liquid Mass Transfer in
Trickle Bed Reactors
by
Rita Joubert
A dissertation submitted in partial fulfilment of the requirements for the degree
Master of Engineering (Chemical Engineering)
in the
Chemical Engineering Faculty of Engineering, the Build Environment and Information
Technology
University of Pretoria Pretoria
13 February 2009

ii
Solid-Liquid Mass Transfer in Trickle Bed Reactors
Author: Rita Joubert
Supervisor: W. Nicol
Department: Department of Chemical Engineering
University of Pretoria
Degree: Master of Engineering (Chemical Engineering)
Abstract
Hydrodynamic multiplicity in the trickle flow, or low interaction, regime is a well
documented phenomenon. Multiple hydrodynamic states are often presented in
the form of hysteresis loops where the hydrodynamic parameter studied are
shown as a function of the operating history of the bed, i.e. liquid and gas flow
rates. In extreme cases the lower leg, representing an increase in liquid flow rate
on a pre-wetted and drained bed, is commonly referred to as the Levec mode.
The upper extreme, referred to as the Kan-liquid mode, represents a decrease in
liquid flow rate after operation in the high interaction regime.
The many reported studies investigating liquid-solid mass transfer in trickle beds
have generally used either the dissolution or electrochemical techniques.
Numerous researchers have used their data to develop correlations predicting
solid-liquid mass transfer coefficients. Most of these studies do not specify the
multiplicity mode of operation. Only two studies (Sims et al. (1993) and Van der
Merwe, Nicol & Al-Dahhan (2008)) use both the Levec and Kan-liquid operating
modes. Both of these studies suggest that solid-liquid mass transfer also exhibit
multiplicity behaviour although the trends suggested or speculated differ from
each other. Sims et al. (1993) found that a Kan-liquid operated bed will
outperform a Levec operated bed; however in contrast to this Van der Merwe et
al. (2008) speculated that a Levec operated bed is better suited for liquid limited
reactions due to enhanced liquid-solid mass transfer in the Levec mode as a
result of faster interstitial velocity.

iii
This study showed that solid-liquid mass transfer coefficients, measured with
both the dissolution and electrochemical technique, show multiplicity behaviour.
Two distinct operating regions were found, which corresponds to the Levec and
Kan-liquid modes. Measurements taken using the electrochemical technique
yielded solid-liquid mass transfer coefficients larger than those measured using
the dissolution method. The experimental results agree with the trend found by
Sims et al. (1993) but the mass transfer coefficients in this study were
significantly lower. Additionally it was shown that the difference in mass transfer
coefficients, in the two modes, cannot be explained by merely compensating for
the differences in wetting efficiency and interstitial velocity, suggesting that the
Levec mode has a larger percentage of stagnant or poorly irrigated zones. It was
also shown that mass transfer coefficients measured at the top of the column is
higher than those measured at the bottom, suggesting that the flow structure is
changing as a function of axial length.
Lastly, with regards to electrochemical measurements of liquid-solid mass
transfer, it was shown that measurements using a single particle electrode
compared well to that of a multiple packing electrode.
Keywords: wetting efficiency, multiplicity, pre-wetting, solid-liquid mass transfer
coefficient

iv
Contents
Abstract ii
Nomenclature v
Chapter 1. Introduction 1
Chapter 2. Literature Survey 3
2.1 Measuring techniques for solid-liquid mass transfer in trickle bed reactors 3
2.2 Prominent studies on solid-liquid mass transfer in packed bed reactors 8
2.3 Comparison of results from prominent solid-liquid mass transfer studies 17
2.4 Solid-liquid mass transfer multiplicity 18
Chapter 3. Experimental 22
3.1 Trickle flow experimental unit 22
3.2 Electrochemical solid-liquid mass transfer measurements 27
3.3 Dissolution solid-liquid mass transfer measurements 31
3.4 Experimental repeatability 32
Chapter 4. Analysis of Measuring Techniques 34
4.1 Comparing single electrode and multiple packing electrode measurement 34
4.2 Comparing electrochemical and dissolution measurements 36
Chapter 5. Hydrodynamic Results and Interpretation 39
5.1 Multiplicity results 39
5.2 Solid liquid mass transfer as a function of bed height 42
Chapter 6. Conclusions 44
References 45
Appendix A 50
Appendix B 51
Appendix C 53

v
Nomenclature
a - Effective area for mass transfer (cm2/cm3)
at - Total external surface area of particles per unit volume of empty tube
(cm2/cm3)
as - Wetted active area of bed per unit bed volume (m-1)
av - Geometrical area per unit of bed volume (m-1) ( )pdε−16
A - Surface area of single particle (m2)
Ac - Column cross sectional area (m2)
Ae - Electrode area (cm2)
c - Concentration (gmol/cm3)
c* - Concentration at particle surface (gmol/cm3)
c0 - Equilibrium concentration of hydrogen in alpha-methyl styrene (mol/cm3)
Cp - Saturated dissolved oxygen concentration (gmol/cm3)
cS - Solubility of benzoic acid (g/ℓ)
D - Diffusivity (m2/s)
Deff - Effective diffusion coefficient in porous catalyst (cm2/s)
dp - Catalyst particle diameter (cm)
El - Liquid power dissipation parameter (W/kg liquid hold-up)
F - Faraday constant (C/mol)
g - Gravitational acceleration (kg/ms2)
G - Gas flux (kg/m2s)
h - Packing height (m)
H - Dynamic liquid hold-up (m3/m3)
Ilim - Limiting current (A)
jD - Mass transfer factor
k - Mass transfer coefficient (m/s)
klg - Gas-liquid mass transfer coefficient (m/s)
kls - Solid-liquid mass transfer coefficient (m/s)
L - Liquid mass flux (kg/m2s)
n - Number of active particles

vi
ne - Number of electrons involved in stoichiometric equation
N - Molar flux
Pw - Partial pressure of water vapour (Pa)
r - Rate of reaction (gmol/s.cm3 of reactor volume)
S - Cross sectional area of empty tube (cm2)
t - Temperature (°C)
T - Temperature (K)
U - Volumetric flow rate (m3/s)
uintrinsic - Intrinsic liquid flow rate (mm/s)
V - Superficial velocity (m/s)
Dimensionless numbers
Ga - Galileo number (-) 2
32
l
pl gd
µ
ρ
Ga” - Modified Galileo number (-) 2
3
l
llpz
Pgd
µ
ρρ
∆+
Ko - Kolmogroff number (-) 3
33
l
lpl dE
µ
ρ
Rel - Liquid Reynolds number (-) l
pl Vd
µρ
Sh - Sherwood number (-) D
dk pls
Sc - Schmidt number (-) D
υ

vii
Greek letters
ε - Void fraction in catalyst bed
φ - Fractional wetting of packing or electrode
η - Effectiveness factor
µ - Dynamic viscosity (Pa.s)
θ - Correlating variable (-)
ρ - Density (kg/m3)
υ - Kinematic viscosity (m2/s)
Subscripts
e - Effluent from bed
f - Feed to bed
g - Gas
l - Liquid
s - Solid

1
Chapter 1. Introduction
Trickle bed reactors are packed beds with co-current down flow of the gaseous
and liquid reagents and are widely encountered in the petrochemical and
associated industries. Designing these reactors requires knowledge of the
resistance to absorption of the gaseous component into the liquid phase and the
transfer of the reacting species through the liquid-solid film to the catalyst.
It has been shown that hydrodynamics in the trickle flow, or low interaction,
regime is not uniquely determined by the operating conditions. The existence of
multiple hydrodynamic states complicates the prediction of trickle bed reactor
performance. Multiple states are presented in the form of hysteresis loops where
the hydrodynamic parameter studied is shown as a function of the operating
history of the bed, i.e. the liquid and gas flow rates (Levec, Grosser & Carbonell,
1988; Loudon, Van der Merwe & Nicol, 2006). In extreme cases the lower leg
represents parameters in the Levec operating mode, an increasing flow rate, and
the upper leg represents parameters in the Kan-liquid operating mode,
decreasing flow rate after operating in the pulsing or high interaction regime.
These modes can also be reached by simply pre-wetting the bed with the
applicable pre-wetting procedure.
There are many reported studies investigating liquid-solid mass transfer (LSMT)
in trickle beds (examples are: Rao & Drinkenburg, 1985; Satterfield, Van Eek &
Bliss, 1978; Al-Dahhan, High-Fill & Tee Ong, 2000). These studies have
generally used one of two methods, dissolution or electrochemical, although
various other techniques such as chemical reaction and absorption have been
proposed. Numerous studies have been done to find correlations predicting solid-
liquid mass transfer coefficients. These correlations are based on studies with a
large variation in experimental data and cannot be compared to one another as
most researchers do not state which preconditioning methods they used thus
resulting in different hydrodynamic states.

2
The only studies investigating both of these operating modes are that of Sims,
Schultz & Luss (1993) and Van der Merwe et al. (2008). Sims et al. (1993) used
an electrochemical method and found that the mass transfer in a Kan-liquid
operated bed is higher than that measured in a Levec operated bed. Opposed to
this Van der Merwe et al. (2008), using a chemical reaction method (the
hydrogenation of alpha-methyl-styrene) explained his reaction measurements by
speculating that a Levec operated bed is better suited for liquid limited reactions.
He attributes this counter-intuitive behaviour to higher interstitial velocities
observed in the Levec mode.
The aim of this study was to quantify the differences in solid-liquid mass transfer
in the Levec and Kan-liquid operating modes. This was done through the use of
three techniques, two electrochemical and one dissolution technique. The effect
of using a single or multiple packing electrode was evaluated using a well studied
electrochemical method. These results were further compared to results obtained
with the dissolution technique. The influence of column height, hold-up and
wetting efficiency on solid-liquid mass transfer coefficients were also
investigated.

3
Chapter 2. Literature Study
2.1 Measuring techniques for liquid-solid mass transfer in
trickle bed reactors
A Variety of studies have been done to determine solid-liquid mass transfer
coefficients. The majority of the studies focused on the electrochemical and
dissolution techniques; however other methods such as chemical reaction (Morita
& Smith, 1976) and activated carbon absorption (Tan & Smith, 1982) have also
been used.
Local instantaneous mass transfer coefficients and local mass transfer coefficient
fluctuations can be inferred from measuring the current in an electrochemical
system. Overall mass transfer coefficients can be measured using absorption,
chemical reaction or a dissolution technique.
In this section a brief overview of the experimental techniques are given. Even
though previous studies are mentioned in the table above only a select number of
references are summarised in below in section 2.2.
2.1.1 Electrochemical technique
This method is employed to measure the local instantaneous solid-liquid mass
transfer coefficient at a certain position within the bed. The gas and liquid phases
are fed co-currently up or down the reactor. The liquid phase consists of a
solvent, an electrolyte and a supporting electrolyte, which is added to reduce the
migration current.
A cathode, with the same size and geometry as the inert packing, is placed at a
certain radial and axial position within the bed. An anode, with surface area
greater than the cathode, is placed down stream of the cathode or at the outlet of
the reactor. A negative voltage is applied to the cathode which drives the reaction
at the electrode surface. The current produced by the transfer of electrons flows

4
0
100
200
300
400
500
600
700
0 500 1000 1500 2000
Applied Voltage
Cu
rren
t M
easu
rem
en
t
through the electrochemical cell. The applied voltage is controlled so that the
reaction at the electrode is liquid diffusion limited.
Figure 1 shows a plot of cell current as a function of applied voltage for two
systems. Position B shows the plateau representing the operating condition
under which the electrode is polarized. Since an increase in applied voltage does
not lead to an increase in current the overall reaction rate is dominated by solid-
liquid mass transfer. The portion of the curve represented by A indicates
conditions where the kinetics is slower than the mass transfer, and the reaction is
said to be kinetically limited. Operating conditions in portion C is typically due to
additional reaction, such as the hydrolysis of water.
If the onset of additional reactions occurs at a low enough voltage the electrode
may not polarize. In this case the kinetics is so slow or the solid-liquid mass
transfer so fast that a polarization plateau may not exist, this is illustrated by the
dashed line D.
Figure 1: Electrode polarization (taken from Hanratty & Campbell, 1983)
The current produced by the electrochemical reaction is measured and can be
related to the mass transfer coefficient by equation 1 or to the molar flux using
equation 2 (Hanratty & Campbell, 1983).
D C
B
A

5
cAFkI els=lim
(eq 1)
NFAnI ee=lim
(eq 2)
The majority of investigations, taking into account the solvent and electrolyte
selection criteria suggested by Latifi, Laurent & Storck (1988) and Hanratty &
Campbell (1983), are based on the potassium ferricyanide (K3Fe(CN)6) –
potassium ferrocyanide (K4Fe(CN)6) system using a single packed electrode.
However Delaunay et al. (1982) and Latifi et al. (1988) used an electrode
consisting of multiple active spheres (composite packed electrode) to determine
the overall mass transfer coefficient.
2.1.2 Dissolution technique
This method has predominantly been used at atmospheric conditions to measure
the overall solid-liquid mass transfer coefficient in a packed bed with two phase
flow. Active particles are made by casting particles or by coating kernel particle
with a sparingly soluble solid; this prevents large changes in bed characteristics.
Different types of solid material have been used, such as benzoic acid, a mixture
of benzoic acid and a fluorescent dye (Rhodamine B), naphthalene and β-
napthal. (Al-Dahhan, High-Fill & Tee Ong, 2000)
Investigators have either used short beds of active particles or longer beds with a
section of active particles to avoid saturation of the liquid effluent. The active
particles can also be dispersed throughout the bed in an amount equal to a short
section. The saturation level of the effluent should not exceed 70% as this limits
the experimental accuracy.
A variety of measuring techniques have been employed to measure the
concentration of dissolved material in the liquid effluent. Depending on the
dissolving material, researchers have suggested the use of a fluorometer, UV
spectrometer or titration with NaOH. Using a plug flow assumption Goto et al.
(1975) stated that the inlet and outlet concentrations can be related by equation
3.

6
−
−=
eS
fS
S
L
lscc
cc
ha
Uak ln (eq 3)
2.1.3 Chemical reaction
Hydration and hydrogenation reactions are commonly used as the rate controlling
step can be altered, by changing the superficial liquid velocity, so that the overall
reaction rate is controlled by the rate of diffusion of the liquid reagent through the
liquid boundary layer to the catalyst surface.
Gas and liquid reagents flow through a bed of catalyst particles. The reagents are
converted to products at slightly elevated temperatures (up to 50°C). This
ensures a vapour pressure low enough to keep the products in the liquid phase.
The solid-liquid mass transfer coefficient can be determined by measuring the
concentration of the reaction products in the liquid effluent.
Satterfield et al. (1969) proposed that the magnitude of the resistance in the
liquid film can be determined by equating the flux through the liquid film to the
reaction rate. Both the flux and the reaction rate are taken per unit of outside
surface area of catalyst. The correlation used for this computation is given here
as equation 4.
( )
−=−
φφ
φ 1
tanh
12*
*0
p
eff
lsd
cDcck (eq 4)
2.1.4 Absorption
The gas and liquid phase, an aqueous solution usually containing benzaldehyde,
flows co-currently through a bed of granular activated carbon particles. The
dynamic absorption is inferred by measuring the concentration of benzaldehyde
in the liquid effluent. Intraparticle diffusion effects, which may affect the effluent
concentration, can be eliminated by extrapolating the absorption data to zero
time.

7
2.1.5 Advantages and disadvantages of measuring techniques
The electrochemical method is one of the most widely used techniques for the
determination of solid-liquid mass transfer coefficients as it is the only method
where the state of the transfer unit remains unchanged. This technique is also
the only technique that measures local mass transfer coefficients and can
therefore be used, when operating in the high interaction regime, to compare the
mass transfer in a liquid rich slug to that in a gas rich slug. However a reduction
in liquid conductibility as a result of degradation of electrolyte due to prolonged
light exposure, can lead to local and temporal variation in mass transfer
coefficients
Overall mass transfer coefficients are measured when the dissolution, chemical
reaction or absorption techniques are used. These techniques are said to give
more repeatable results when operating in the LIR as wetting efficiencies of the
particles are averaged. When using the electrochemical technique, with a single
packing electrode, the wetting efficiency of the electrode may not be equal to that
of the previous run and either lower or higher coefficients may be recorded.
When using the dissolution technique, some researchers, prefer using coated
particles, even though they risk dissolving all the material before the end of an
experiment, as oppose to using cast particles which can lead to changes in bed
characteristics.
The use of chemical reactions and absorption techniques make it possible to
operate the packed bed as a differential reactor. Experimental errors is reduced
as the surface area per catalyst weight is provided by the manufacturer and not
calculated. Possible catalyst poisoning and deactivation will not necessarily be
observed and can lead to wrong interpretation of the experimental results.

8
2.2 Prominent studies on solid-liquid mass transfer in packed
bed reactors
Liquid-solid mass transfer coefficients are one of the most important parameters
for the design, scale-up and performance characterization of packed beds.
Various studies have been done to determine the mass transfer in a bed and
many correlations have been suggested to predict solid-liquid mass transfer
coefficients for different systems. Most of these studies, with exception to the
research groups in Nance, Washington University and the University of Twente,
were done under atmospheric conditions (Al-Dahhan et al., 1997).
The table below show some of the previous studies on this subject. Techniques
used and operating regimes (flooded, trickle, transition, pulse, dispersed bubble
flow) are indicated; other significant findings (i.e. where height and radial position
of electrode were studied or where experiments were performed at elevated
temperature and/or pressure) are also included. The forth column indicates
whether the researchers suggested a predictive correlation. The preconditioning
methods used are not given as numerous researchers did not report their mode
of operation.
Table 1: Solid-liquid mass transfer studies
Reference Technique used Operating regime Correlation suggested Other findings
Al-Dahhan et al. (2000)
Dissolution of naphthalene none specified N -
Bartelmus (1989) Electrochemical flooded, trickle & pulse Y -
Barthole (1982) Electrochemical flooded Y -
Boelhouwer (2001) Electrochemical trickle & pulse Y -
Burghardt et al. (1995) Electrochemical pulse Y -
Chou et al. (1979) Electrochemical trickle & pulse Y -
Delaunay et al. (1982) Electrochemical trickle & pulse Y -
Dharwadkar & Sylvester (1977) -
gas continuous, transition, pulse and dispersed bubble Y
correlating previously published data
Goto et al. (1975) Dissolution of naphthalene trickle N -

9
Herskowitz et al. (1979)
Hydrogenation of alpha-methylstyrene flooded & trickle Y -
Hirose et al. (1976) Dissolution of benzoic acid
dispersed bubble & pulse Y -
Jolls & Hanratty (1969) Electrochemical trickle & pulse Y -
Lakota & Levec (1990)
Dissolution of naphthalene trickle & pulse Y -
Latifi et al. (1988) Electrochemical flooded & trickle Y -
Lemay et al. (1975) Dissolution of benzoic acid pulse Y -
Mochizuki et al. (1976)
Hydrogenation of phenylacetate and styrene none specified Y
differential reactor
Morita & Smith (1978)
Hydrogenation of alpha-methylstyrene flooded & trickle Y -
Rao & Drinkenburg (1985) Electrochemical trickle & pulse Y -
Reuther et al. (1980)
Dissolution of benzoic acid
gas continuous, transition, pulse and dispersed bubble Y -
Satterfield et al. (1978)
Dissolution of benzoic acid trickle & pulse Y -
Sims et al. (1993) Electrochemical trickle & pulse Y multiplicity in trickle flow
Specchia et al. (1978)
Dissolution of benzoic acid flooded & trickle Y -
Sylvester & Pitayagilsarn (1975)
Dissolution of benzoic acid
gas continuous, transition, pulse Y -
Tan & Smith (1980) Dissolution of benzaldehyde trickle Y -
Trivizidakis & Karabelas (2006) Electrochemical
flooded, trickle & pulse Y
effect of bed depth
Van der Merwe (2008)
Hydrogenation of alpha-methylstyrene trickle N
multiplicity in trickle flow
Van Krevelen & Krekels (1948) Electrochemical trickle Y -
Wilson & Geakoplis (1966)
Dissolution of benzoic acid and naphthol trickle & pulse Y -
Various researchers have published their mass transfer data obtained using the
techniques discussed in section 2.1. A short overview of widely referenced
studies is given below in chronological order. It should be noted that most of the
researchers found that the Sherwood number has a dependence on the liquid
Reynolds number close to the power of 0.5 suggested by the boundary layer
theory.

10
Jolls & Hanratty (1969)
The bed, used for electrochemical experiments, consisted of a 60 inch length of
12 inch diameter glass pipe, packed with 1 inch glass spheres. A test sphere,
located 7 to 8 inches from the top of the column acted as the cathode and a
section of nickel-coated pipe, located outside the column, was used for the
anode.
The electrolyte, aqueous solution of equimolar concentrations (10-2M) of
K4Fe(CN)6 and K3Fe(CN)6 and 1M sodium hydroxide (NaOH), was pumped from
the bottom of the reactor which ensured complete wetting of the electrode.
They found that their results, for a given packing arrangement, were reproducible
and showed little to no scattering for Re >35. They correlated their data for
different ranges of Re using equation 5. Average values of the variables for the
different ranges are given in table 2. The effect of Reynolds number on the mass
transfer coefficient to a sphere in a packed bed of inert spheres or in a bed of
active spheres indicated a slightly larger power of the Reynolds number than the
0.5 predicted by the boundary layer theory.
nAShSc Re
3/1 =− (eq 5)
Table 2: Variables for substitution in equation 5 at different ranges of Re
Reynolds number A N
Re<35 1.64 0.60
35<Re<140 1.44 0.58
140<Re<1120 1.59 0.56
Re>1120 6.4 0.50
11
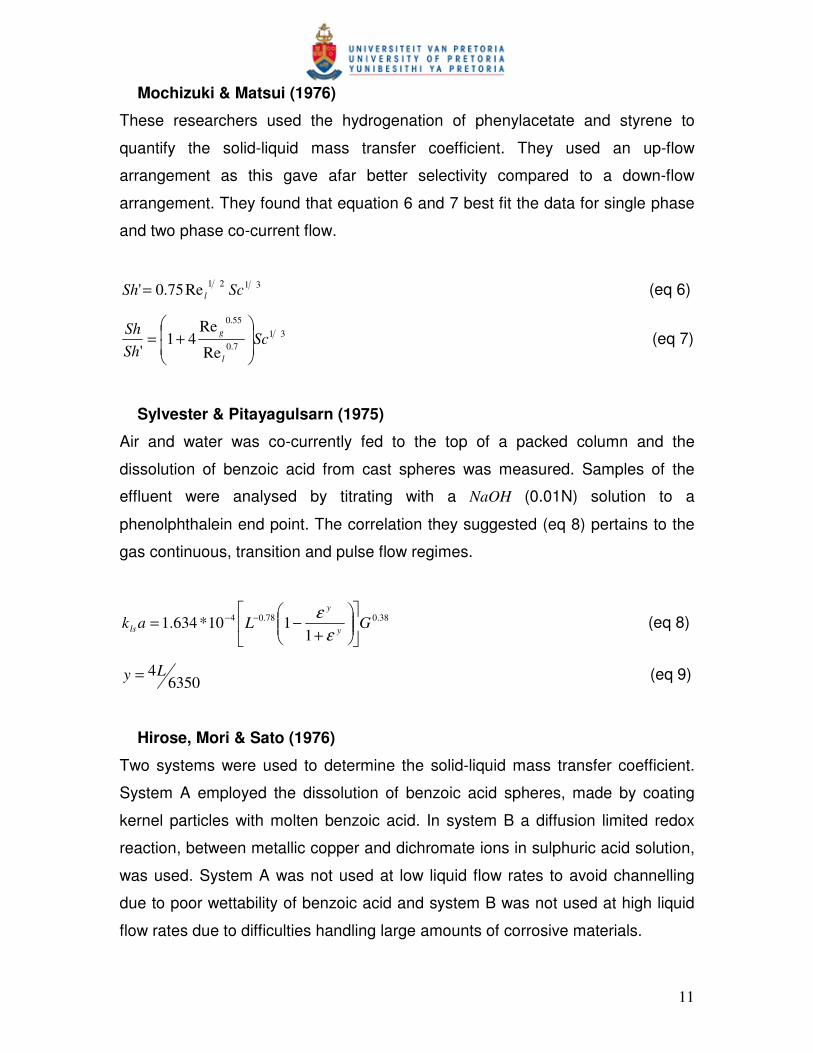
Mochizuki & Matsui (1976)
These researchers used the hydrogenation of phenylacetate and styrene to
quantify the solid-liquid mass transfer coefficient. They used an up-flow
arrangement as this gave afar better selectivity compared to a down-flow
arrangement. They found that equation 6 and 7 best fit the data for single phase
and two phase co-current flow.
3121
Re75.0' ScSh l= (eq 6)
31
7.0
55.0
Re
Re41
'Sc
Sh
Sh
l
g
+= (eq 7)
Sylvester & Pitayagulsarn (1975)
Air and water was co-currently fed to the top of a packed column and the
dissolution of benzoic acid from cast spheres was measured. Samples of the
effluent were analysed by titrating with a NaOH (0.01N) solution to a
phenolphthalein end point. The correlation they suggested (eq 8) pertains to the
gas continuous, transition and pulse flow regimes.
38.078.04
1110*634.1 GLak
y
y
ls
+−= −−
ε
ε (eq 8)
63504Ly = (eq 9)
Hirose, Mori & Sato (1976)
Two systems were used to determine the solid-liquid mass transfer coefficient.
System A employed the dissolution of benzoic acid spheres, made by coating
kernel particles with molten benzoic acid. In system B a diffusion limited redox
reaction, between metallic copper and dichromate ions in sulphuric acid solution,
was used. System A was not used at low liquid flow rates to avoid channelling
due to poor wettability of benzoic acid and system B was not used at high liquid
flow rates due to difficulties handling large amounts of corrosive materials.

12
They found that the different techniques yield similar mass transfer coefficients
for measurements taken when operating in the transition regime. They reported a
smooth transition between the regimes. Results in the trickle flow regime was
correlated with equation 10, equation 8 suggested by Sylvester & Pitayagulsarn
(1975) was used to model the results obtained in the pulse flow regime.
3121
Re56.1 ScSh l=φ (eq 10)
Satterfield, Van Eek & Bliss (1978)
In this work mass transfer coefficients were determined by measuring the rate of
dissolution of cylindrical benzoic acid particles into distilled water. A wide range
of flow conditions were covered, from single phase liquid flow to pulsing gas-
liquid flow.
In the trickle flow regime, characterised by incomplete wetting, the results
showed an average absolute percentage deviation of 10.8%. The data obtained
in the pulse flow regime, generally accepted as a perfectly wetted condition,
showed an average absolute percentage deviation of 7.2%. The correlations
suggested for use in the different flow regimes are given below.
31822.0
Re815.0 ScSh l=φ (eq 11)
31202.0334.0 ScKoSh =φ (eq 12)
Specchia, Baldi & Gianetto (1978)
The volumetric solid-liquid mass transfer coefficients in co-current downward and
upward two-phase flow were determined by dissolution of benzoic acid cylinders.
Results obtained in the liquid full regime (up-flow of liquid) showed a mean
relative quadratic error of 4.7% and is well described by equation 13. Trickle flow,
with single phase downward liquid flow and two phase flow with a gas flow rate
up to 1.56m/s, data gave a mean relative quadratic error of 17.9% and 7.6%
respectively. The experimental data can be correlated with equations 14 and 15.

13
( ) 315.0
990.0Re14.2' ScSh l += (eq 13)
( )( ) 315.0
Re18.10' ScSh lε−= (eq 14)
30.010Re
Reln30.010
Re
Reln48.0
'ln
2
22 −
−
=
l
g
l
g
Sh
Sh (eq 15)
Chou, Worley & Luss (1979)
A single nickel cathode in a bed of alumina spheres were used in these
electrochemical experiments. The electrolytic solution contained equimolar
amounts (0.008M) of K4Fe(CN)6 and K3Fe(CN)6 and roughly 0.78M NaOH.
In the gas continuous regime a large scatter of data was obtained with electrodes
at different position within the bed, however time averaged data obtained in the
pulse regime was independent of the electrode position. As a result of the large
scatter in data they did not suggest a correlation for data in the gas-continuous
regime, however they suggested that mass transfer coefficients, for 40<Reg<300
and 50<Rel<140, can be predicted by equation 16. The average deviation of the
experimental data from the suggested correlation was 4.7%.
εφ
3116.054.0
ReRe72.0 ScSh
gl= (eq 16)
Reuther, Yang & Hayduk (1980)
The packed bed used for dissolution experiments was divided into three sections,
two inert sections and an active section in a central horizontal portion of the bed.
The active section consisted of berl saddles coated with a 1% (in weight) mixture
of rhodamine B and benzoic acid. The addition of a dye made it possible to use a
fluorometer for continuous measurement of the effluent concentration.
The gas and liquid superficial velocities ensured operation in all four the major
flow regimes. The mass transfer rates were reproducible within 8% in all the flow
regimes except for the gas continuous regime for which the reproducibility was
14
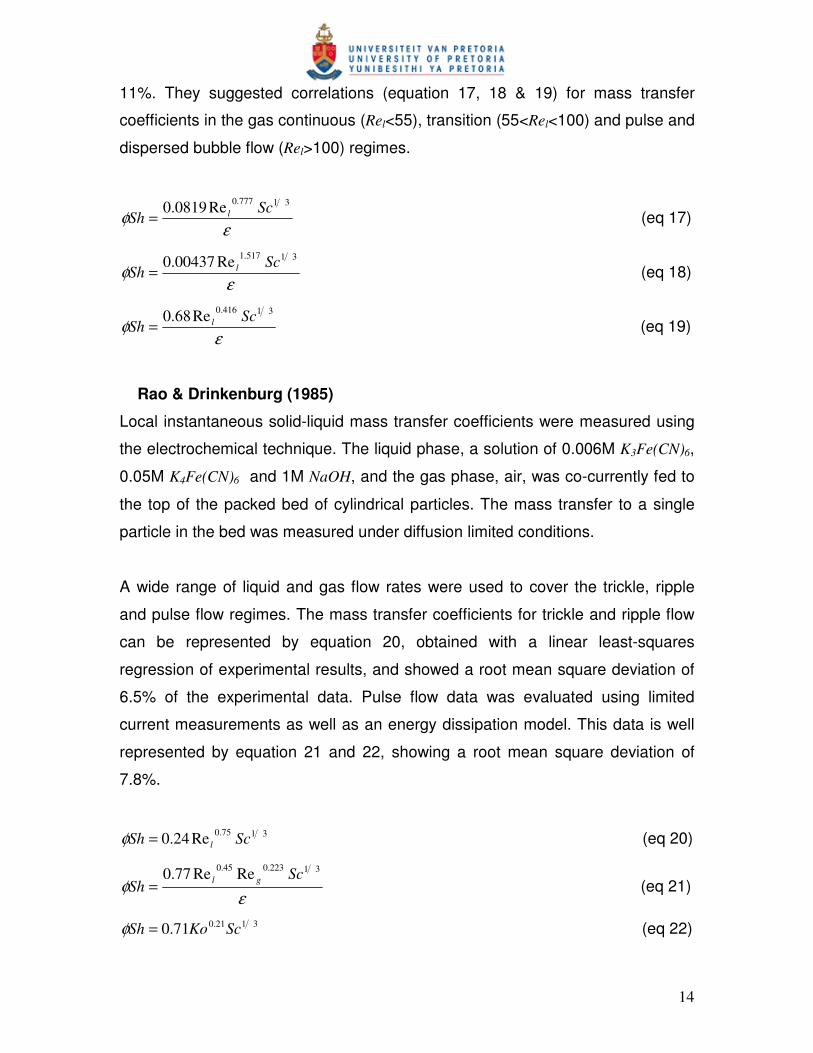
11%. They suggested correlations (equation 17, 18 & 19) for mass transfer
coefficients in the gas continuous (Rel<55), transition (55<Rel<100) and pulse and
dispersed bubble flow (Rel>100) regimes.
εφ
31777.0
Re0819.0 ScSh l= (eq 17)
εφ
31517.1
Re00437.0 ScSh l= (eq 18)
εφ
31416.0
Re68.0 ScSh l= (eq 19)
Rao & Drinkenburg (1985)
Local instantaneous solid-liquid mass transfer coefficients were measured using
the electrochemical technique. The liquid phase, a solution of 0.006M K3Fe(CN)6,
0.05M K4Fe(CN)6 and 1M NaOH, and the gas phase, air, was co-currently fed to
the top of the packed bed of cylindrical particles. The mass transfer to a single
particle in the bed was measured under diffusion limited conditions.
A wide range of liquid and gas flow rates were used to cover the trickle, ripple
and pulse flow regimes. The mass transfer coefficients for trickle and ripple flow
can be represented by equation 20, obtained with a linear least-squares
regression of experimental results, and showed a root mean square deviation of
6.5% of the experimental data. Pulse flow data was evaluated using limited
current measurements as well as an energy dissipation model. This data is well
represented by equation 21 and 22, showing a root mean square deviation of
7.8%.
3175.0
Re24.0 ScSh l=φ (eq 20)
εφ
31223.045.0
ReRe77.0 ScSh
gl= (eq 21)
3121.071.0 ScKoSh =φ (eq 22)

15
Latifi, Laurent & Storck (1988)
An electrochemical reaction, the reduction of DMSO (dimethylsulphoxide), at the
cathode (a 7.5cm section of the reactor packed with platinum coated spheres)
was used to quantify solid-liquid mass transfer coefficients.
The overall mass transfer coefficient between the flowing liquid and the packing
particles, the cathode, was deduced from the limiting current intensity
measurements. The mass transfer factor calculated from the data obtained in the
liquid-full operating mode is well represented by the correlation suggested by
Satterfield & Resnick (1954), given as equation 23 below.
34.0
Re667.0−
= lDj (eq 23)
Lakota & Levec (1990)
These researchers measured the dissolution of naphthalene into water. They
manufactured their packing particles by pressing a mixture of naphthalene,
stearate and talc into cylindrical particles. The bed was preconditioned using the
Kan-liquid pre-wetting procedure. After pre=treatment the gas and liquid were co-
currently passed through the bed. Gas flow was kept constant while the liquid
flow rate was incrementally increased over a range of operating points which
span the low interaction and high interaction regimes. They correlated the data,
for the entire range of operating conditions, by equation 24 which showed a
mean relative deviation of 7.2% from the experimental results.
31495.0
Re487.0 ScSh l= (eq 24)
Sims, Schultz & Luss (1993)
The electrolytic solution of 0.01M K3Fe(CN)6, 0.0125M K4Fe(CN)6 and 1M NaOH,
was used in their electrochemical experiments. Cathode pellets were made from
solid nickel rod and placed at one axial position, at different radial positions,
within a bed packed with cylindrical solid fluoropolymer extrudates. Gas and
liquid were co-currently fed to the top of the column. Gas flow was kept constant

16
0
50
100
150
200
250
1 2 3 4 5 6 7
L (kg/m2s)
φφ φφS
h
while the liquid flow rate was first increased from the LIR to the HIR and then
decreased from the HIR back to the LIR.
The data clearly indicated that the solid-liquid mass transfer coefficient exhibited
hysteretic behaviour in the low interaction regime (shown in figure 2 below). The
experimental data obtained in the pulsing regime can be correlated using the
equation below.
3144.0
Re4.5 ScSh l=φ (eq 25)
Figure 2: Hysteretic behaviour of the Sherwood number with a change in liquid flow rate
(taken from Sims et al., 1993)
Trivizidakis & Karabelas (2006)
These researchers used the well known potassium ferri- ferrocyanide system in
their electrochemical study. Ten uniform spherical and fourteen cylindrical nickel
particles were used as cathodes. These electrodes were placed at various axial
and radial positions throughout the bed.
The data obtained with cylindrical extrudates under steady trickling flow were
significantly lower, by a factor of 3, than the predictions from the correlations by
Satterfield et al. (1978) and by Rao & Drinkenburg (1985). Experimental results
obtained in the pulsing regime, for spherical particles, were relatively close to the
prediction by Rao & Drinkenburg (1985) and in even closer agreement with the

17
data of Sylvester & Pitayagulsarn (1975). The present global-average values for
induced pulsing can be correlated by equation 26.
316.0Re35.0 ScSh l= (eq 26)
2.3 Comparison of results from prominent solid-liquid mass
transfer studies
Figure 3 shows previously suggested correlations, which simplify the comparison
of data obtained with the use of different techniques. These correlations are
shown at the liquid Reynolds numbers where they were developed. The gas
Reynolds numbers are not included as it is generally accepted that its affect on
Sherwood numbers are minimal for operation in the LIR. It is clear that the
electrochemical technique tend to result in higher Sherwood numbers. An
exception to this is the work done by Trivizidakis (2006) that resulted in mass
transfer values similar to that measured using the dissolution technique. It is
interesting to note that the both the data by Levec & Lakota (1990) and
Trivizidakis (2006) was obtained in a Kan-liquid operated bed.

18
Figure 3: Comparison of suggested correlations (dp=0.003m, Vg=0.03m/s)
2.4 Solid-liquid mass transfer multiplicity
Hydrodynamic parameters (such as pressure drop, liquid hold-up and mass
transfer) are related to solid-liquid-gas contacting effectiveness and the
operational efficiency of the reactor. These parameters are path variables, which
greatly complicate the mathematical description and performance evaluation of
trickle-bed reactors. The existence of multiple hydrodynamic states is often
referred to as hydrodynamic multiplicity (Van der Merwe, 2008).
A major concept in previous experimental studies is hysteresis loops. These
loops involve the increase and then decrease of some operating variable (for
example gas – or liquid flow rate). Maiti et al. (2006) recently reviewed and

19
summarised earlier work done on hysteresis loops. Van der Merwe (2008) used
figure 4 and the description below as an example of how pressure drop
hysteresis loops are obtained.
Starting from a low (or zero) liquid velocity, the liquid flow rate is incrementally
increased. The pressure drop increases accordingly (following the blue line) and
reaches points A, B and C at liquid velocities uL,1, uL,2 and uL,pulse respectively.
Further increasing the velocity beyond the trickle-to-pulse flow boundary also
increases the pressure drop (following the grey line). When the velocity is
decreased, the pressure drop decreases following the same path (grey) as
before until uL,pulse is reached. A further decrease in uL will mean a reduction in
the pressure drop along the black line (which may be several times higher than
the corresponding values on the increasing blue leg). At uL,1 the pressure drop
reaches point D. Note that all the operating conditions at this point are identical to
those at point A – the only difference between the upper and lower legs is the
operating history of the bed.
If the liquid velocity is increased from zero to uL,2 (which is lower than uL,pulse) and
then decreased, the pressure drop follows the dashed line and reaches a point E
at uL,1. This means that at uL,1, any pressure drop between that of points A and D
can be attained depending on the highest liquid flow velocity reached.
Alternatively Levec pre-wetting (see table 2) can be used to achieve operating
points on the lower leg and Kan-liquid pre-wetting can be used to achieve
operating points on the top leg.

20
Table 3: Limiting cases of hydrodynamic multiplicity (taken from Van der Merwe, 2008)
Name Description
Levec- pre-wetted-mode Dry particles are loaded into a dry bed. The reactors is
completely flooded for several hours and then drained under
gravity until only the residual liquid hold-up remains. The liquid
and the gas flow rates are increased from zero to the operating
values.
Kan-Liquid-pre-wetted-mode Dry particles are loaded into a dry bed. The reactor is flooded for
several hours and then drained. The gas flow is introduced at the
operating velocity and kept constant while the liquid velocity is
increased from zero to a value greater than the pulsing velocity.
The pulsing regime is maintained for several seconds, the liquid
flow rate is then reduced to the operating velocity.
Figure 4: A schematic hysteresis loop (Van der Merwe, 2008)

21
Two previous studies (Sims et al. (1993) and Van der Merwe et al. (2008))
showed that solid-liquid mass transfer coefficients also exhibit hysteretic
behaviour. However the results of these studies are quite different. Sims et al.
(1993) found, using the electrochemical method, that a Kan-liquid pre-wetted bed
outperforms a Levec pre-wetted bed. Van der Merwe et al. (2008) used the
hydrogen of alpha-methyl-styrene and inferred solid-liquid mass transfer, this led
to the conclusion that a Levec pre-wetted bed outperforms a Kan-liquid wetted
bed under liquid limited conditions.

22
Chapter 3. Experimental
3.1 Trickle flow experimental unit
The experimental setup was designed to enable dynamic monitoring of the
pressure drop and the gas-liquid mass transfer coefficients. All experiments were
performed at atmospheric temperature and pressure which allowed for
comparison of the experimental results with published data. A schematic drawing
of the setup is shown in figure 5.
Figure 5: Experimental Setup
The reactor was a 1m long glass column with internal diameter of 63mm. The
column was designed with a pressure release valve (V-2), which provides an
outlet for gas when the column is flooded. The feed tank (TK-1) was filled with
the required liquid and pre-saturated with oxygen by mixing the liquid with air. A

23
weir and submersible pump (SP-1) was used to ensure a constant pressure
head.
The liquid flow rate was measured by an Electromagnetic Flow Measuring
System (the PROline promag10H from Endress + Hauser), which has an
accuracy of 1.5% of the rate when the flow is between 0.2 and 1ℓ/min and an
accuracy of 0.5% of the rate when the flow is above 1ℓ/min. The flow was
adjusted with the use of two parallel valves. A needle valve (V-1) was used to
control the bulk flow rate and a meter valve (V-3) was used for fine tuning. A
three way valve (V-4) was used to recycle the liquid while the column was
drained. The gas flow rate was controlled with a Brooks Smart Mass Flow Model
5851S. The range of this flow meter is 0 – 100ℓ/min, it is calibrated for nitrogen
and has an accuracy of 0.7% of the range.
Gas and liquid were fed into the column through a distributor. A schematic
drawing of the distributor used in all the experiments is shown in figure 6. The
holes in the distributor are 0.5mm in diameter and are spaced 8mm apart in a
square pitch arrangement, with a drip-point density of 16000points/m2. This drip
point density conforms to the minimum density of 5000points/m2 suggested by
Burghardt et al. (1995). The cap contains three 0.25” stainless steel tubes
through which the gas is fed into the column. This arrangement ensured that
liquid distribution stayed uniform even at high gas flow rates.

24
Figure 6: Schematic diagram of the gas-liquid distributor used
The packing particles used was 3mm glass beads, which according to
Tsochatzidis et al. (2002) and Gianetto et al. (1978) result in more uniform
distribution than other types of packing or spherical packing with a larger
diameter. A metal sieve (the holes are 2.5mm) adequately supported the packing
and did not result in the build-up of a liquid head, which may alter pressure drop
readings. The column was packed to a height of 85cm.
A load cell (WT-1), a Rosemount Model 3051CD Pressure Transmitter (DPT-1)
and a Dissolved Oxygen Sensor, 499ADO from Rosemount Analytical (AN-1),
enabled the measuring of the bed porosity, pressure drop and gas–liquid mass
transfer coefficients. The packed bed was loaded and mounted on the load cell
stand and the mass of the packing was recorded. From this the bed porosity was
calculated, as shown in equation 27. The average porosity for all the experiments
were approximately 0.4.

25
volumebedbeadsglassofdensity
beadsofMass
×−= 1ε (eq 27)
The air supply was opened and the liquid in the feed tank was saturated with
oxygen. The column was pre-wetted, using either the Levec or Kan-liquid wetting
procedure. Liquid and gas flow rates were selected to cover most of the trickle
flow regime as this is where most industrial reactors operate. The data obtained
in the experiments can be compared to most previous studies as these were
done in the same operating range. Dissolution experiments were done using
liquid velocities of 2, 3, 4, 5 and 8mm/s and a gas flow rate of 30mm/s. The
electrochemical method was employed at superficial liquid velocities of 2, 3, 4
and 5mm/s were chosen and a gas flow rate of 30mm/s. The density of the
electrolyte made experimenting at a liquid velocity of 8mm/s impractical as this
flow rate is at the trickle-pulse flow transition boundary. One experiment was
done, using each of the methods, for a gas flow rate of 60mm/s to investigate
whether or not this greatly influences the solid-liquid mass transfer coefficients.
In Levec pre-wetting the gas flow rate is set at the desired value of 30mm/s, once
the liquid is set at the desired flow rate the pressure release valve (V-2) is
opened and the bottom of the column is sealed. The column is flooded from the
bottom, this ensures that no air bubbles are trapped inside the column and that
all the particles are completely wetted. Once the column is completely flooded
the liquid flow is switched off, the pressure release valve is closed and the seal at
the bottom of the column is removed thereby allowing the liquid to drain from the
column. Liquid flow is only reintroduced once the mass in the column (residual
liquid hold-up) remained constant for approximately five minutes. Pressure drop,
dissolved oxygen concentration in the effluent and solid-liquid mass transfer
measurements were either taken 5min, for electrochemical technique, or 10min,
for the dissolution technique, after the desired liquid flow rate was reached.
In Kan-liquid pre-wetting the gas flow rate is again set at the desired flow rate of
30mm/s and is allowed time to stabilise. The liquid flow rate is increased, from a
26
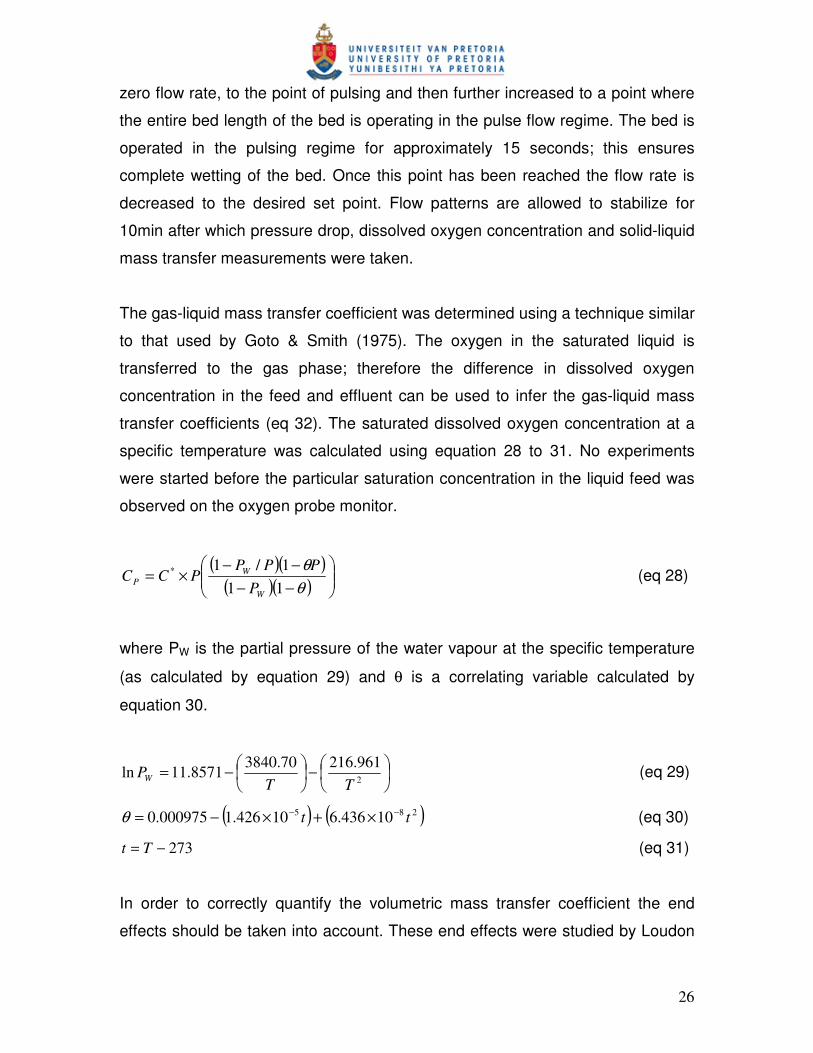
zero flow rate, to the point of pulsing and then further increased to a point where
the entire bed length of the bed is operating in the pulse flow regime. The bed is
operated in the pulsing regime for approximately 15 seconds; this ensures
complete wetting of the bed. Once this point has been reached the flow rate is
decreased to the desired set point. Flow patterns are allowed to stabilize for
10min after which pressure drop, dissolved oxygen concentration and solid-liquid
mass transfer measurements were taken.
The gas-liquid mass transfer coefficient was determined using a technique similar
to that used by Goto & Smith (1975). The oxygen in the saturated liquid is
transferred to the gas phase; therefore the difference in dissolved oxygen
concentration in the feed and effluent can be used to infer the gas-liquid mass
transfer coefficients (eq 32). The saturated dissolved oxygen concentration at a
specific temperature was calculated using equation 28 to 31. No experiments
were started before the particular saturation concentration in the liquid feed was
observed on the oxygen probe monitor.
( )( )( )( )
−−
−−×=
θ
θ
11
1/1*
W
W
PP
PPPPCC (eq 28)
where PW is the partial pressure of the water vapour at the specific temperature
(as calculated by equation 29) and θ is a correlating variable calculated by
equation 30.
−
−=
2
961.21670.38408571.11ln
TTPW (eq 29)
( ) ( )28510436.610426.1000975.0 tt −− ×+×−=θ (eq 30)
273−= Tt (eq 31)
In order to correctly quantify the volumetric mass transfer coefficient the end
effects should be taken into account. These end effects were studied by Loudon

27
(2006), using the same equipment and set-up used in this study, therefore his
data was used here.
Pressure drop and gas-liquid mass transfer data were used compared to the data
published by Loudon, Van der Merwe & Nicol (2006) and verified that
measurements were taken after flow pattern stabilisation. These results are
shown in appendix A.
3.2 Electrochemical solid-liquid mass transfer measurements
The solvent, electrolyte and current carrier used in this study was chosen
according to the criteria set out by Latifi (1988) and Hanratty & Campbell (1983).
Distilled water was used as solvent and a mixture of potassium ferricyanide and
potassium ferrocyanide were used as electrolyte. Sodium hydroxide was used as
current carrier. This system has been used in numerous previous studies which
simplified comparison of experimental data with suggested correlations.
The electrolytic reaction at the cathode was the reduction of ferricyanide ions to
ferrocyanide ions, described by reaction 1 (rxn 1), it should be noted that the
reverse reaction occurred at the anode.
( ) ( ) −−−→+
4
6
3
6CNFeeCNFe (rxn 1)
Two systems were employed to measure the mass transfer coefficient. In system
A three cathodes were placed at different axial positions, with the same radial
position, in the bed. The role of the cathode was played by a nickel sphere with
the same diameter as the inert glass packing. A wire was soldered into the whole
drilled through the middle of the nickel particle. System B consisted of a multiple
packing electrode. A 4cm section of the column packing was replaced with
(approximately 6000) nickel spheres of diameter equal to that of the inert
packing. The anode, for both of system A and B, was made by soldering an

28
electrical wire to the sieve, supporting the packing particles. The two
electrochemical systems as well as the dissolution system are diagrammatically
shown in figure 7.
Figure 7: Electrode and active particle placement within the reactor: A) Single particle
electrodes used in the electrochemical method, B) Multiple packing electrode for
electrochemical method, C) Section of active particles for dissolution method
The diffusion plateau was determined in a randomly packed column. Glass
spheres were loaded into the column inserting the cathode, either a single
electrode or a multiple packing electrode, at the desired axial position. Single
electrodes were placed 30, 50 and 65cm and the multiple packing electrode was
placed 38cm from the supporting sieve. The distributor cap was mounted onto
the top of the column and sealed. The column was then positioned on the stand
(WT-1), the height and the mass of the packing was recorded for the
determination of the bed density. Sutey & Knudsen (1976) noted that chemical
polarisation of the electrode may occur therefore the column was reloaded after
each experiment and a new cathode was used.

29
The feed tank was filled with a solution of 0.02M potassium ferrocyanide
(K4Fe(CN)6), 0.003M potassium ferricyanide (K3Fe(CN)6) and 1M of sodium
hydroxide (NaOH), the physical properties of this liquid is shown in table 4. This
concentration of current carrier resulted in a diffusion plateau at a voltage
independent of the concentration of the electrolyte. The liquid in the feed tank
was pre-saturated with oxygen and the concentration of the dissolved oxygen
noted. The temperature difference in the liquid feed was kept to a minimum
(±2°C) so that saturation concentration of the dissolved oxygen was not affected.
Once the feed was saturated the bed was wetted using the desired pre-wetting
procedure. All experiments were done operating in the Levec and Kan-liquid
modes.
Table 4: Physical properties of the electrolyte
Property Value Units
Density 1200 kg/m3
Viscosity 1.02E-03 Poise
Diffusion coefficient 5.50E-09 m2/s
The cathode was connected to the negative pole and the anode to the positive
pole of a voltage source. The liquid flow rate was set at the desired set point and
the voltage source switched on at 600mV, the current flow at this voltage was
recorded. The voltage was incrementally increased to 1800mV, the current at
these voltages were also recorded. This procedure was repeated for three liquid
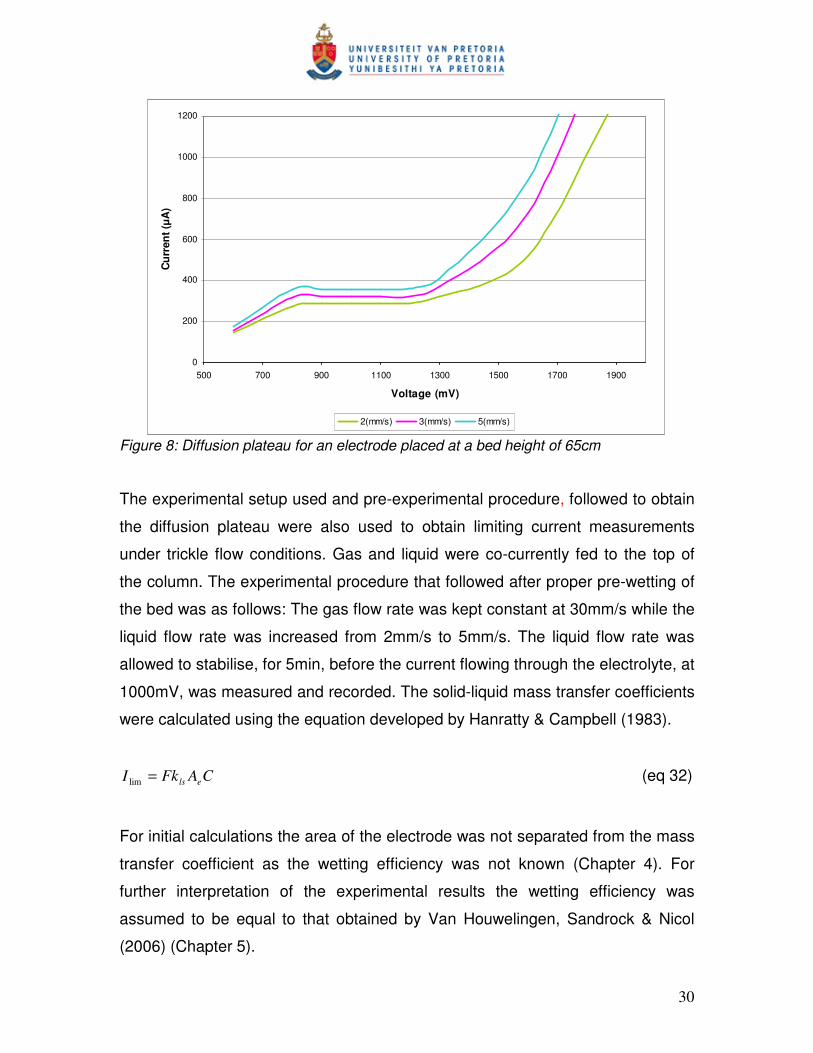
flow rates. Figure 8 shows the diffusion plateau reached for a single electrode at
a bed height of 65cm. From this it is clear that a voltage of 1000mV will result in a
diffusion limited reaction and therefore all the mass transfer coefficients were
determined from limiting currents measured at 1000mV.
30
0
200
400
600
800
1000
1200
500 700 900 1100 1300 1500 1700 1900
Voltage (mV)
Cu
rren
t (µ
A)
2(mm/s) 3(mm/s) 5(mm/s)
Figure 8: Diffusion plateau for an electrode placed at a bed height of 65cm
The experimental setup used and pre-experimental procedure, followed to obtain
the diffusion plateau were also used to obtain limiting current measurements
under trickle flow conditions. Gas and liquid were co-currently fed to the top of
the column. The experimental procedure that followed after proper pre-wetting of
the bed was as follows: The gas flow rate was kept constant at 30mm/s while the
liquid flow rate was increased from 2mm/s to 5mm/s. The liquid flow rate was
allowed to stabilise, for 5min, before the current flowing through the electrolyte, at
1000mV, was measured and recorded. The solid-liquid mass transfer coefficients
were calculated using the equation developed by Hanratty & Campbell (1983).
CAFkI els=lim
(eq 32)
For initial calculations the area of the electrode was not separated from the mass
transfer coefficient as the wetting efficiency was not known (Chapter 4). For
further interpretation of the experimental results the wetting efficiency was
assumed to be equal to that obtained by Van Houwelingen, Sandrock & Nicol
(2006) (Chapter 5).

31
3.3 Dissolution solid-liquid mass transfer measurements
Two systems previously used in dissolution studies, benzoic acid and
naphthalene, were considered for these experiments. Previous researchers
reported difficulties in measuring the concentration of naphthalene in the effluent
as some of the dissolved material was transferred to the gas phase. Another
drawback reported in previous studies was the use of particles only made from
the dissolving material. This complicated the hydrodynamics as the geometry of
the particles and the bed height changes with time as the material dissolves. It
was subsequently decided that benzoic acid was the best chemical to use as this
will stay dissolved in the liquid and provide more accurate experimental results.
Kernel spheres, 3mm glass beads, were coated with molten benzoic acid to
ensure that the bed height and geometry stayed constant.
For this method the column was divided into three subsections. The first was a
30cm section at the bottom of the column packed with 3mm glass spheres. The
second was a 10cm section filled with active particles, 3mm glass spheres
coated with benzoic acid. The column was then filled, up to 85cm, with another
section of glass beads. Once the column was loaded the distributor cap was
mounted onto the top and the column was sealed. It was then positioned on the
load cell (WT-1) and the height and the mass of the packing recorded for the
determination of the bed density. The column was repacked, with freshly coated
kernel spheres, after each experimental run.
The feed tank was filled with distilled water and saturated with oxygen. The
packing was wetted using the desired pre-wetting procedure. Experiments were
done using the Levec and Kan-liquid wetting procedures. Gas and liquid were co-
currently fed to the top of the packed bed. The gas flow rate was kept constant at
30mm/s while the liquid flow rate was varied from 2mm/s to 8mm/s. The flow
rates investigated are shown in table 6 below. The liquid flow rate was allowed to
stabilise, for 15min, after which a sample of the effluent was taken. The effluent is
titrated using a 0.0026M solution of NaOH. The concentration of benzoic acid was

32
calculated using equation 33. Using this concentration the solid-liquid mass
transfer coefficient was determined by substitution in equation 3, repeated here
for clarity. The properties of the effluent are given in table 5.
( )( )titratedeffluentoffVolume
solutiontitratingofionConcentratsolutiontitratingofVolumece = (eq 33)
−
−=
eS
fS
S
L
lscc
cc
ha
Uak ln (eq 3)
Table 5: Properties of the effluent
Property Value Units
Density 1000 kg/m3
Viscosity 1.9 E-03 Poise
Diffusion coefficient 1.0E-09 m2/s
3.4 Experimental repeatability
Previous studies reported that experimental repeatability in packed beds is hard
or almost impossible to achieve. It was for this reason that all experiments were
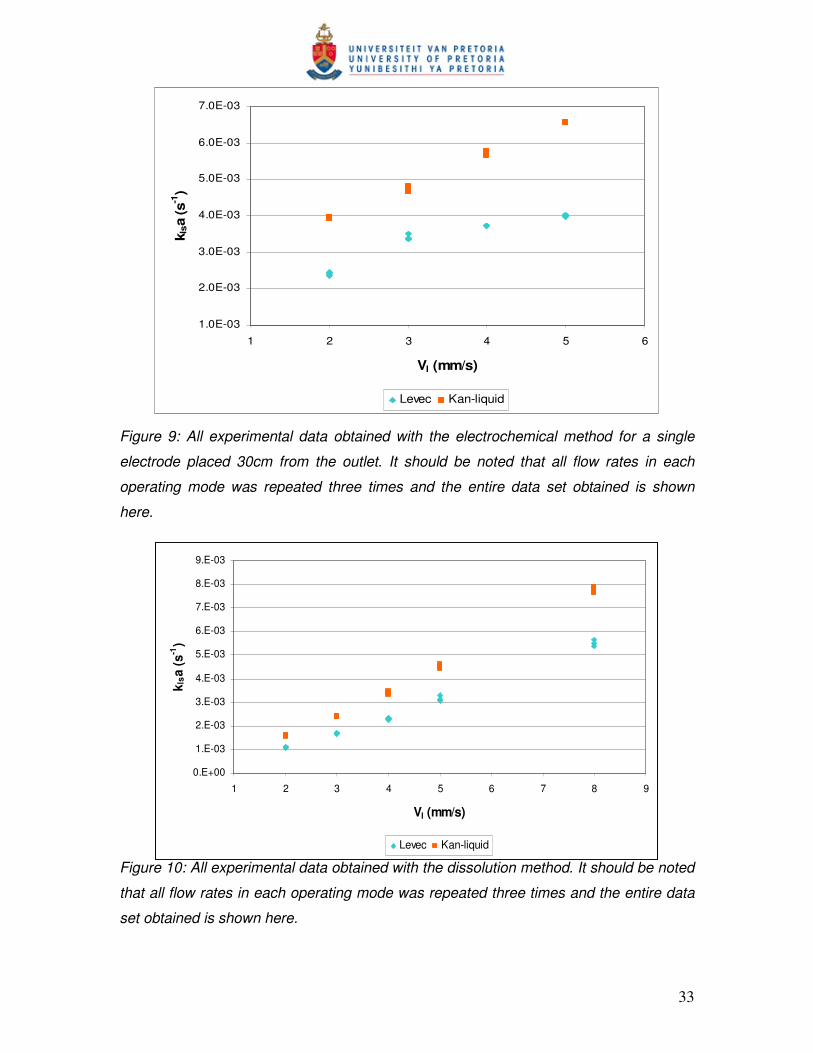
repeated three times for each flow rate and each electrode position. Figure 9 and
10 show the experimental repeatability achieved. The standard relative error of
the electrochemical experimental data was 2.3% for operation in the Levec mode
and 2.6% for operation in the Kan-liquid mode. The standard relative error for the
experimental data obtained with the dissolution technique was 2.2% for operation
in the Levec mode and 1.9% for Kan-liquid operation.
33
0.E+00
1.E-03
2.E-03
3.E-03
4.E-03
5.E-03
6.E-03
7.E-03
8.E-03
9.E-03
1 2 3 4 5 6 7 8 9
Vl (mm/s)
kls
a (
s-1
)
Levec Kan-liquid
1.0E-03
2.0E-03
3.0E-03
4.0E-03
5.0E-03
6.0E-03
7.0E-03
1 2 3 4 5 6
Vl (mm/s)
klsa (s
-1)
Levec Kan-liquid
Figure 9: All experimental data obtained with the electrochemical method for a single
electrode placed 30cm from the outlet. It should be noted that all flow rates in each
operating mode was repeated three times and the entire data set obtained is shown
here.
Figure 10: All experimental data obtained with the dissolution method. It should be noted
that all flow rates in each operating mode was repeated three times and the entire data
set obtained is shown here.

34
Chapter 4. Analysis of Measuring Techniques
Five data sets (one set dissolution, three single electrodes placed at different
axial positions, and one set multiple packing electrode) each consisting of ten
measurements (taken at five different liquid velocities in the Kan-liquid and Levec
operating modes) were obtained. As expected the solid-liquid mass transfer
coefficients measured at the top of the column was greater than that measured in
the middle and the bottom of the column (discussed in section 5.2); therefore
only the three data sets obtained from measurements in the middle of the column
(dissolution, one single electrode, and a multiple packing electrode) were
compared to one another. The experimental data of these three sets were also
compared to previously suggested correlations.
4.1 Comparing single electrode and multiple packing electrode
measurements
The significance of spatial variability of local mass transfer rates due to voidage
non-uniformity and unstable liquid flow in the trickle flow regime has been widely
recognised. Trivizadakis and Karabelas (2006) attributed the large spread in local
Sherwood numbers, covering almost two orders of magnitude for a fixed pair of
gas and liquid flow rates, to the aforementioned local packing variability and non-
uniform liquid distribution. It is for this reason that one would expect a great
variance of the mass transfer coefficients measured using a single electrode
when compared to that measured with the multiple packing electrode, which
should give a smaller spread of data and a better representation of mass transfer
at the specific axial position.
Figure 11 shows the experimental data obtained with a single electrode, placed
at a height of 30cm from the outlet, and a multiple packing electrode, at a height
of 40cm from the outlet. It should be mentioned that all the data points and not

35
just average values were plotted. The average variance for measurements in the
Levec mode was 3.3% and 7.8% for measurements in the Kan-liquid mode.
1.0E-03
2.0E-03
3.0E-03
4.0E-03
5.0E-03
6.0E-03
7.0E-03
1 2 3 4 5 6
Vl (mm/s)
kls
a (
s-1
)
Single electrode Levec Single electrode Kan-liquid
Multiple packing electrode Levec Multiple packing electrode Kan-liquid
Figure 11: Solid-liquid mass transfer coefficients measured in the Levec and Kan-Liquid
operating modes (Single electrode measurements at 30cm from outlet and multiple
packing electrode at 40cm from the outlet)
Since the experimental data in figure 11 were obtained at different axial positions,
mass transfer measurements for a single and a multiple packing electrode at the
same axial position were taken and are shown in the parity plot below (figure 12).
From these two figures it is clear that a single electrode gives an adequate
representation of the overall mass transfer coefficient.

36
Figure 12: Mass transfer coefficients measured using a single electrode and a multiple
packing electrode at the same bed height of 33cm from the outlet in a Levec pre-wetting
mode
4.2 Comparing electrochemical and dissolution measurements
Figure 13 shows a comparison of the mass transfer coefficient data obtained with
the electrochemical and dissolution techniques. For this comparison only the data
obtained with the multiple packing electrode was used as it was in good
agreement with that measured using a single electrode.
2.00E-03
2.50E-03
3.00E-03
3.50E-03
4.00E-03
4.50E-03
2.00E-03 2.50E-03 3.00E-03 3.50E-03 4.00E-03 4.50E-03
klsa single electrode (s-1
)
kls
a m
ult
iple
pa
ck
ing
ele
ctr
od
e (s
-1)
-5%
+5%

37
0.0E+00
1.0E-03
2.0E-03
3.0E-03
4.0E-03
5.0E-03
6.0E-03
7.0E-03
1 2 3 4 5 6
Vl (mm/s)
kls
a (
s-1
)
Electrsochamical Levec Electrochamical Kan-liquid
Dissolution Levec Dissolution Kan-liquid
Figure 13: Comparison of experimental data obtained with a multiple packing electrode
at 40cm from the outlet and the dissolution technique
The density and viscosity of the liquids used in the different techniques differ
therefore figure 14 shows a comparison of the coefficients measured at the liquid
Reynolds numbers. The correlation suggested by Lakota & Levec (1990), using a
Kan-liquid pre-wetted bed and the dissolution of naphthalene particles, is higher
than the dissolution data obtained in this study. The electrochemical data, based
on the Kan-liquid mode of operation with a relatively low gas flow of 30mm/s, is in
good agreement with the correlation suggested by Mochizuki (1974) even though
this correlation was based on zero gas flow. When this is compared to previous
studies shown in figure 3 (shown in Appendix C) it can be seen that the
experimental data is on the lower end of the range of Sherwood numbers
predicted by suggested correlation. A comparison of data obtained with the
dissolution method and the electrochemical method using single electrodes are
shown in Appendix B.

38
0
10
20
30
40
50
60
70
5 7 9 11 13 15
Rel
φφ φφS
h
Electrochemical Levec Electrochamical Kan-liquid
Dissolution Levec Dissolution Kan-Liquid
Lakota (1990) Mochizuki (1974)
Figure 14: Mass transfer coefficients measured using a single electrode placed 50cm
from the outlet and the dissolution method
Previously published data suggest that mass transfer coefficients measured
using different techniques can lead to a large difference in the observed transfer
coefficients. Two of these studies are Lakota & Levec (199) and Chou et al.
(1979) where the Sherwood number predicted by the latter is 6.4 times higher.
Such a variance in data was not observed in this study. This can be ascribed to
the use of a single set of equipment, a multiple packing electrode, coating of a
kernel sphere and the repacking of the column after each run. Measurements
were also only taken once the liquid and gas flow stabilised.
39
Chapter 5. Hydrodynamic Results and Interpretation
5.1 Multiplicity results
Figure 15 shows the mass transfer coefficients obtained, with a single electrode
placed 50cm above the outlet, with different liquid flow rates and using different
pre-wetting procedures. The experimental data obtained in the Kan-liquid
operating mode were as much as 1.6 times higher than the data in a Levec
operated bed. Repeated experiments showed a variance of 2.4% in the Levec
mode and 4.3% in the Kan-liquid mode. This is comparable to the variance for
gas-liquid mass transfer coefficients (Appendix A) which have been shown to be
repeatable for repacked beds.
It is evident that experimental data do not correlate with the proposal by Van der
Merwe (2008) and that the Kan-liquid mode of operation out-performed the Levec
mode in all the experiments. It does however coincide with the trend found by
Sims et al. (1993) but differs in magnitude by a factor of 5.7. From the previous
chapter it is clear that the dissolution data followed the same trend as the
electrochemical data.

40
2.E-03
3.E-03
4.E-03
5.E-03
6.E-03
7.E-03
8.E-03
1 2 3 4 5 6
Vl (mm/s)
kls
a (
s-1
)
Electrochamical Levec Electrochamical Kan-liquid
Figure 15: Average solid-liquid mass transfer coefficients measured 50cm from the outlet
Since LSMT is a function of hold-up and wetting efficiency, both which exhibit
multiplicity, it was of interest to know how a change in these parameters affect
the solid-liquid mass transfer coefficient and if it accounts for the multiplicity seen
in figure 15. The liquid hold-up in the bed affects the average velocity
experienced by the packing particles. This average flow over a particle is given
by the intrinsic rate of liquid flow calculated using equation 34. As the Levec and
Kan-liquid modes have different liquid hold-ups the interstitial velocity also differs.
The hold-up and wetting efficiency used are shown in table 6.
H
Vu l
rinsic =int
(eq 34)
41
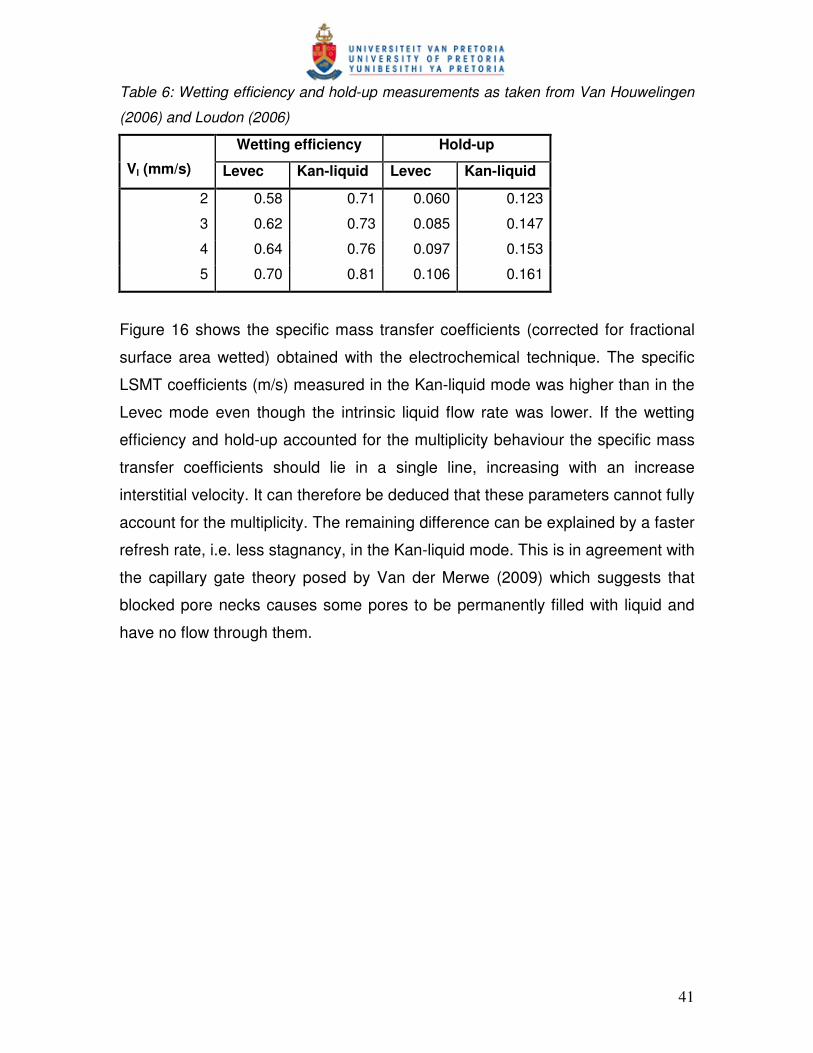
Table 6: Wetting efficiency and hold-up measurements as taken from Van Houwelingen
(2006) and Loudon (2006)
Wetting efficiency Hold-up
Vl (mm/s) Levec Kan-liquid Levec Kan-liquid
2 0.58 0.71 0.060 0.123
3 0.62 0.73 0.085 0.147
4 0.64 0.76 0.097 0.153
5 0.70 0.81 0.106 0.161
Figure 16 shows the specific mass transfer coefficients (corrected for fractional
surface area wetted) obtained with the electrochemical technique. The specific
LSMT coefficients (m/s) measured in the Kan-liquid mode was higher than in the
Levec mode even though the intrinsic liquid flow rate was lower. If the wetting
efficiency and hold-up accounted for the multiplicity behaviour the specific mass
transfer coefficients should lie in a single line, increasing with an increase
interstitial velocity. It can therefore be deduced that these parameters cannot fully
account for the multiplicity. The remaining difference can be explained by a faster
refresh rate, i.e. less stagnancy, in the Kan-liquid mode. This is in agreement with
the capillary gate theory posed by Van der Merwe (2009) which suggests that
blocked pore necks causes some pores to be permanently filled with liquid and
have no flow through them.

42
6.0E-06
7.0E-06
8.0E-06
9.0E-06
1.0E-05
1.1E-05
1.2E-05
1.3E-05
10 15 20 25 30 35 40 45 50
uintrinsic (mm/s)
kls
(m
/s)
Electrochamical Levec Electrochamical Kan-liquid
Figure 16: Solid-liquid mass transfer coefficient measured using the electrochemical
method with an electrode placed 30cm from the outlet. Analysis of data for electrodes at
different axial positions is shown in Appendix C.
5.2 Solid-liquid mass transfer as a function of bed height
The mass transfer coefficient measured at different bed heights are shown in
figure 17 and 18. From this it is clear that the experimental data coincide with the
findings by Trivizidakis & Karabelas (2006) that the mass transfer coefficient is
smaller further down the bed. The measurements taken close to top of the
column (65cm from the outlet) were up to 1.4 times higher that measured in the
bottom in the bed (30cm from the outlet). If the data is examined closely it can be
seen that the mass transfer coefficient measured at the top of the bed in the
Levec mode is slightly lower than that measured at the bottom of the bed in the
Kan-liquid operating mode. The exact mechanism as to what cause the drop in
mass transfer is unclear. This is most probably due to a gradual alteration in the
flow structure, but more research is needed to quantify this proposal.

43
1.E-03
2.E-03
3.E-03
4.E-03
5.E-03
6.E-03
1 2 3 4 5 6
Vl (mm/s)
kls
a (
s-1
)
3.E-03
4.E-03
5.E-03
6.E-03
7.E-03
8.E-03
1 2 3 4 5 6
Vl (mm/s)
klsa (s
-1)
Figure 17: Solid liquid mass transfer coefficients at different bed heights for a Levec pre-
wetted bed
Figure 18: Solid liquid mass transfer coefficients at different bed heights for a Kan-liquid
pre-wetted bed

44
Chapter 6. Conclusions
From this study it can be concluded that the volumetric solid liquid mass transfer
coefficient exhibit significant multiplicity behaviour. The different pre-wetting
procedures resulted in two distinct operating regions corresponding to the Levec
and Kan-liquid operating modes. Mass transfer coefficients measured in the Kan-
liquid operating mode were in the order of 1.6 times higher than those measured
in the Levec operating mode. This agrees with the trend predicted by Sims et al.
(1993) however the measurements are significantly lower than his experimental
data. The speculation by Van der Merwe (2008) that a higher intrinsic liquid flow
will lead to a higher mass transfer coefficient, in the Levec mode, was not
observed. The difference in volumetric LSMT coefficients, in the Kan-liquid and
Levec mode, cannot be explained by merely adjusting for the difference in
wetting efficiency and hold-up. This is most likely due to a higher percentage of
stagnant or poorly irrigated zones in the Levec mode, which is in agreement with
the capillary gate theory (Van der Merwe, 2009) that suggests that blocked pores
are filled with liquid and have no flow through them.
The two electrochemical methods, single electrode and multiple packing
electrode, rendered similar mass transfer coefficients when measured at the
same bed height. This implies that LSMT coefficients measured with a single
electrode gives an adequate representation of a group of particles. Both the
electrochemical and dissolution liquid-solid mass transfer measurements show a
similar dependence on liquid flow rate. Measurements taken with the
electrochemical method were on average 55% higher than those obtained with
the dissolution method.
Lastly it was shown that mass transfer coefficients measured at the top of the
column (65cm from the outlet) in a Levec operated bed were up to 1.4 times
higher than that measured in the bottom of the column (30cm from the outlet) and
1.3 times higher in the Kan-liquid operating mode. This suggests that liquid flow
structure changes with height.

45
References
Al-Dahhan, M. H., Larachi, F., Dudukovic, M. P., Laurent, A. (1997) “High-
pressure trickle-bed reactors: A review” Industrial Engineering Chemistry
Research, 36, 3292-3314
Al-Dahhan, M., High-Fill, W., Tee Ong, B. (2000) “Drawbacks of the dissolution
method for measurement of the liquid-solid mass-transfer coefficient in two-
phase flow packed bed reactors operated at low and high pressures” Ind. Eng.
Sci. Res., 39, 3102-3107
Bartelmus, G. (1989) “Local liquid-solid mass transfer coefficients in a three-
phase fixed bed reactor” Chem. Eng. Process, 26, 111-120
Barthole, G. (1982) PhD thesis ,INPL. Nancy
Burghardt, A., Bartelmus, G., Jaroszynski, M., Kolodziej, A. (1995)
“Hydrodynamics and mass transfer in a three phase fixed-bed reactor with co-
current gas-liquid down-flow” the Chem. Eng. J., 58, 83-99
Boelhouwer, J.G. (2001) “Nonsteady operation of trickle bed reactors:
Hydrodynamics, mass and heat transfer” PhD thesis, Technical University
Eindhoven
Chou, T. S., Worley, F. L., Luss, D. (1979) “local particle-liquid mass transfer
fluctuations in mixed phase co-current down-flow through a fixed bed in the
pulsing regime” Ind. Eng. Chem. Fundam., 18 (3), 279-283
Colombo, A.J., Baldi, G., Sicardi, S. (1976) “Solid-liquid contacting effectiveness
in trickle bed reactors” Chem. Eng. Sci., 31, 1101-1108
Delaunay, C. B., Storck, A., Laurent, A., Charpentier, J. C. (1982)
“Electrochemical determination of liquid-solid mass transfer in a fixed-bed
irrigated gas-liquid reactor with downward co-current flow” Int. Chem Eng., 22 (2),
244-251

46
Dharwadkar, A., Sylvester, N. D. (1977) “Solid-liquid mass transfer in packed
beds” AIChE Journal, 23 (3), 376-378
Gianetto, A., Baldi, G., Specchia, V., Sicardi, S. (1978) “Hydrodynamics and
solid-liquid contacting effectiveness in trickle-bed reactors” AIChE Journal, 24 (6),
1087-1104
Goto, S., Smith, J. M. (1975) “Trickle-bed reactor performance. Part I. Hold-up
and mass transfer effects” AIChE J., 21, 706-713
Goto, S., Levec, J., Smith, J. M. (1975) “Mass transfer in packed beds with two-
phase flow” Ind. Eng. Chem., Process Des. Dev., 14 (4), 473-478
Hanratty, T. J., Campbell, J. A. “Measurement of wall shear stress” in Goldstein,
R. J., (1983) Fluid Mechanics Measurements, Hemisphere Publishing
Corporation
Herskowitz, M., Carbonell, R.G., Smith, J.M. (1979) “Effectiveness factor and
mass transfer on trickle bed reactors” AIChE Journal, 25 (2), 272-283
Hirose, T., Mori, Y., Sato, Y. (1976) “Liquid to particle mass transfer in fixed-bed
reactors with co-current gas-liquid down-flow” J. Chem. Eng. Japan, 9, 220-225
Jolls, K. R., Hanratty, T. J. (1969) “Use of electrochemical techniques to study
mass transfer rates and local skin friction to a sphere in a dumped bed” AIChE
Journal, 15 (2), 199-205
Lakota, A., Levec, J. (1990) ““Solid-liquid mass transfer in packed beds with co-
current downward two-phase flow” AIChE Journal, 36 (9), 1444-1448
Latifi, M. A., Laurent, A., Storck, A. (1988) “Liquid-solid mass transfer in packed
beds with downward co-current gas-liquid flow: An organic liquid phase with high
Schmidt number” The Chem. Eng. J., 38, 47-58

47
Latifi, M. A., Naderifar, A., Midoux, N. (1997) “Experimental Investigation of the
Liquid/Solid Mass Transfer at the Wall of a Trickle-Bed Reactor—Influence of
Schmidt Number” Chem Eng Sci, 52 (21,22), 4005-4011
Lemay, Y., Pineault, G., Ruether, J. A. (1975) “Particle-liquid mass transfer in a
three-phase fixed bed reactor with co-current flow in the pulsing regime” Ind.
Eng. Chem., Process. Des. Dev., 14 (3), 280-285
Levec, J. Grosser, K., Carbonall, R.G. (1988) “The hysteretic behaviour of
pressure drop and liquid hold-up in trickle bed reactors” AIChE journal, 34 (6),
1027-1030
Loudon, D. (2006) “The effect of pre-wetting on pressure drop, liquid hold-up and
gas-liquid mass transfer in trickle bed reactors” Masters dissertation, University of
Pretoria
Loudon, D., Van der Merwe, W., Nicol, W. (2006) “Multiple hydrodynamic states
in trickle flow: Quantifying the extent of pressure drop, liquid holdup and gas–
liquid mass transfer variation” Chem. Eng. Sci., 26, 7551-7562
Maiti, R., Khanna, R., Nigam, K.D.P. (2006) “Hysteresis in trickle bed reactors: A
review” Ind. Eng. Chem. Res., 45 (15), 5185-5198
Mochizuki, S., Matsui, T. (1974) “Liquid-solid mass transfer rate in liquid-gas
upward co-current flow in packed beds” Chem. Eng. Sci., 29, 1328
Mochizuki, S., Matsui, T. (1976) “Selective hydrogenation and mass transfer in a
fixed bed catalytic reactor with gas-liquid co-current up-flow” AIChE Journal, 22
(5), 904-909
Morita, S., Smith, J. M. (1978) “Mass transfer and contacting efficiency in a trickle
bed reactor” Ind. Eng. Chem. Fundam., 17 (2), 113-120
Rao, V. G., Drinkenburg, A. A. H. (1985) “Solid-liquid mass transfer in packed
beds with co-current gas-liquid down flow” AIChE Journal, 31 (7), 1059-1068

48
Ruether, J. A., Yang, C., Hayduk, W. (1980) “Particle mass transfer during co-
current downward gas-liquid flow in packed beds” Ind. Eng. Chem. Proc. Des.
Dev., 19, 103-107
Satterfield, C. N., Resnick, N. (1954) ”Simultaneous heat and mass transfer in a
diffusion-controlled chemical reaction. Part II. Studies in a packed bed.” Chem.
Eng. Prog., 50, 504-510
Satterfield, C. N., Pelossof, A. A., Sherwood, T. K. (1969) “Mass transfer
limitations in a trickle bed reactor” AIChE Journal, 15 (2), 226-234
Satterfield, C. N. (1975) “Trickle bed reactors” AIChE Journal, 21 (2), 209-228
Satterfield, C. N., Van Eek, M. W., Bliss, G. S. (1978) “Liquid-solid mass transfer
in packed beds with downward co-current gas-liquid flow” AIChE Journal, 24 (4),
709-717
Sims, W., Schultz, F. G., Luss, D. (1993) “Solid-liquid mass transfer to hollow
pellets in a trickle bed” Ind. Eng. Chem. Res., 32, 1895-1903
Specchia, V., Baldi, G., Gianetto, A. (1978) “Solid-liquid mass transfer in co-
current two-phase flow through packed beds” Ind. Chem. Eng. Process Des.
Dev., 17, 362
Sutey, A.M., Knudsen, J.G. (1976) “Effect of dissolved oxygen on the redox
method for measurement of mass transfer coefficients” I&EC Fundamentals, 6
(1), 132-139
Sylvester, N. D., Pitayagulsarn, P. (1975) “Mass transfer for two-phase co-current
down flow in a packed bed” Ind. Eng. Chem. Proc. Des. Dev., 14 (3), 421-426
Tan, C. S., Smith, J. M. (1982) “A dynamic method for liquid-particle mass
transfer in trickle beds” AIChE Journal, 28 (2), 190-195

49
Tsochatzidis, N.A., Karabelas, A.J., Giakoumakis, D., Huff, G.A. (2002) “An
investigation of liquid maldistribution in trickle beds” Chem. Eng. Sci., 57, 3543-
3555
Trivizadakis, M. E., Karabelas, A. J. (2006) “A study of local liquid/solid mass
transfer in packed beds under trickling and induced pulsing flow” Chem. Eng.
Sci., 61, 7684-7696
Van der Merwe, W. (2004) “The morphology of trickle flow liquid hold-up” Masters
dissertation, University of Pretoria
Van der Merwe, W., Nicol, W., Al-Dahhan, M.H. (2008) “Effect of hydrodynamic
multiplicity on trickle bed reactor performance” AIChE journal, 54(1), 249-257
Van der Merwe, W. (2008) “Trickle flow hydrodynamic multiplicity” PhD thesis,
University of Pretoria
Van Houwelingen, A. (2006) “The morphology of solid-liquid contacting efficiency
in trickle flow” Masters dissertation, University of Pretoria
Van Houwelingen, A., Sandrock, C., Nicol, W. (2006) “Particle wetting distribution
in trickle bed reactors” AIChE, 52 (10), 3532-3542
Van Krevelen, D. W., Krekels, J. T. C. (1948) Recl. Trav. Chim., 67, 512 quoted
by Goto, S., Levec, J., Smith, J. M. (1975) “Mass transfer in packed beds with
two-phase flow” Ind. Eng. Chem., Process Des. Dev., 14 (4), 473-478
Wilson, E.J., Geankoplis, C.J. (1966) “Liquid mass transfer at very low Reynolds
numbers in packed beds” I&EC fundamentals, 5(1), 9-14

50
0
1
2
3
4
5
6
7
8
1 2 3 4 5 6
Vl (mm/s)
dP
/z
Electrochemical (a) Electrochamical (b) Dissolution (a) Dissolution (b)
0.0E+00
2.0E-02
4.0E-02
6.0E-02
8.0E-02
1.0E-01
1.2E-01
1.4E-01
1.6E-01
1.8E-01
1 2 3 4 5 6 7 8 9
Vl (mm/s)
klg
a (
s-1
)
Levec (a) Kan-Liquid (a) Levec (b) Kan-Liquid (b)
Appendix A
Figure 19: Pressure drop a)Levec pre-wetted bed b)Kan-Liquid pre-wetted bed
(constant gas flow rate 30mm/s)
Figure 20: Hysteretic behaviour of the solid-liquid mass transfer coefficient (gas flow rate
was kept constant at 30mm/s) a)Electrochemical method and b)Dissolution method

51
0
10
20
30
40
50
60
70
5 7 9 11 13 15
Rel
φφ φφS
h
Electrochemical Levec Electrochamical Kan-liquid
Dissolution Levec Dissolution Kan-Liquid
Lakota (1990) Mochizuki (1974)
0
10
20
30
40
50
60
70
5 7 9 11 13 15
Rel
φφ φφS
h
Electrochemical Levec Electrochamical Kan-liquid
Dissolution Levec Dissolution Kan-Liquid
Lakota (1990) Mochizuki (1974)
Appendix B
Figure 21: Mass transfer coefficients measured using the dissolution and the
electrochemical method using a single electrode placed 30cm from the outlet
Figure 22: Mass transfer coefficients measured using the dissolution and the
electrochemical method using a multiple packing electrode placed 40cm from the outlet

52
0
10
20
30
40
50
60
70
5 7 9 11 13 15
Rel
φφ φφS
h
Electrochemical Levec Electrochamical Kan-liquid
Dissolution Levec Dissolution Kan-Liquid
Lakota (1990) Mochizuki (1974)
Figure 23: Mass transfer coefficients measured using the dissolution and the
electrochemical method using a single electrode placed 65cm from the outlet

53
1
10
100
1000
1 10 100
Rel
φφ φφS
h
Dissolution Electrochemical
Reaction Experimental Electrochemical
Experimental Dissolution
Trivizadakis (2006) Latifi (1997)
Mochizuki zero gas flow (1974)
Specchia (1978) Sims Levec (1993) Sylvester (1975)
Lakota (1990)
Hirose (1976) Mochizuki (1976)
Sims Kan-Liquid (1993)
Appendix C
Figure 24: Comparison of experimental data with generally accepted solid-liquid mass
transfer correlations
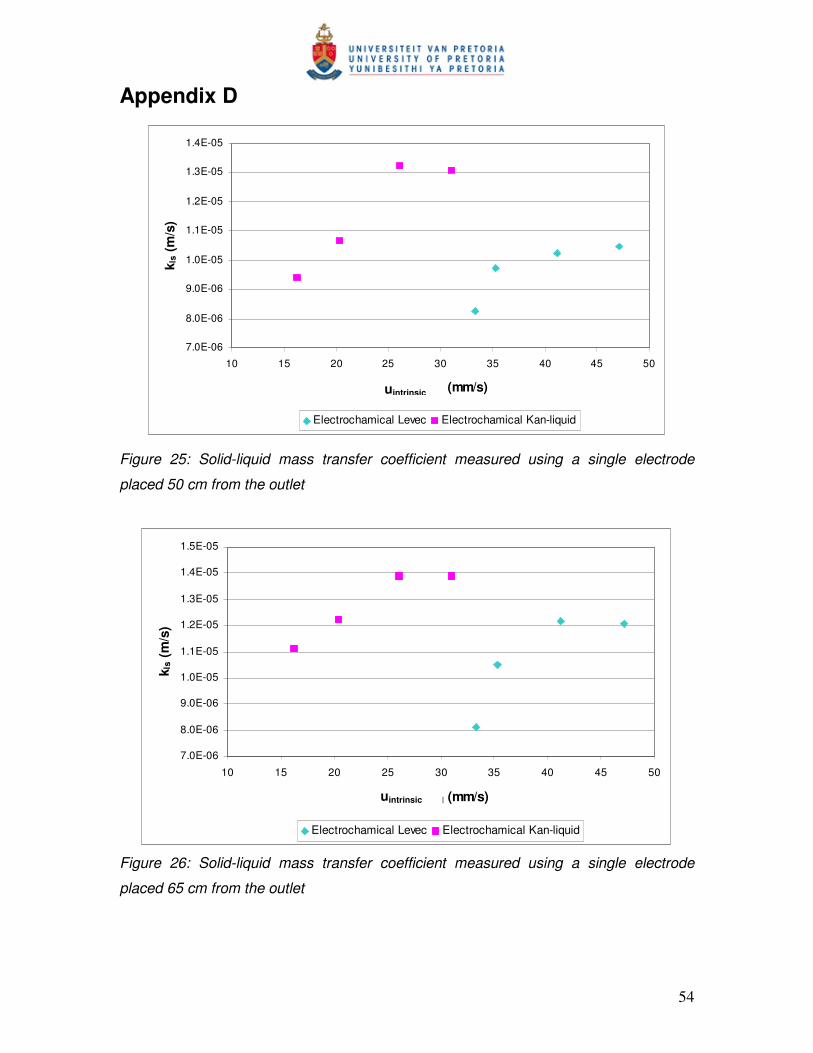
54
Appendix D
Figure 25: Solid-liquid mass transfer coefficient measured using a single electrode
placed 50 cm from the outlet
Figure 26: Solid-liquid mass transfer coefficient measured using a single electrode
placed 65 cm from the outlet
7.0E-06
8.0E-06
9.0E-06
1.0E-05
1.1E-05
1.2E-05
1.3E-05
1.4E-05
10 15 20 25 30 35 40 45 50
uinterstitial (mm/s)
kls
(m
/s)
Electrochamical Levec Electrochamical Kan-liquid
uintrinsic
7.0E-06
8.0E-06
9.0E-06
1.0E-05
1.1E-05
1.2E-05
1.3E-05
1.4E-05
1.5E-05
10 15 20 25 30 35 40 45 50
uinterstitial (mm/s)
kls
(m
/s)
Electrochamical Levec Electrochamical Kan-liquid
uintrinsic
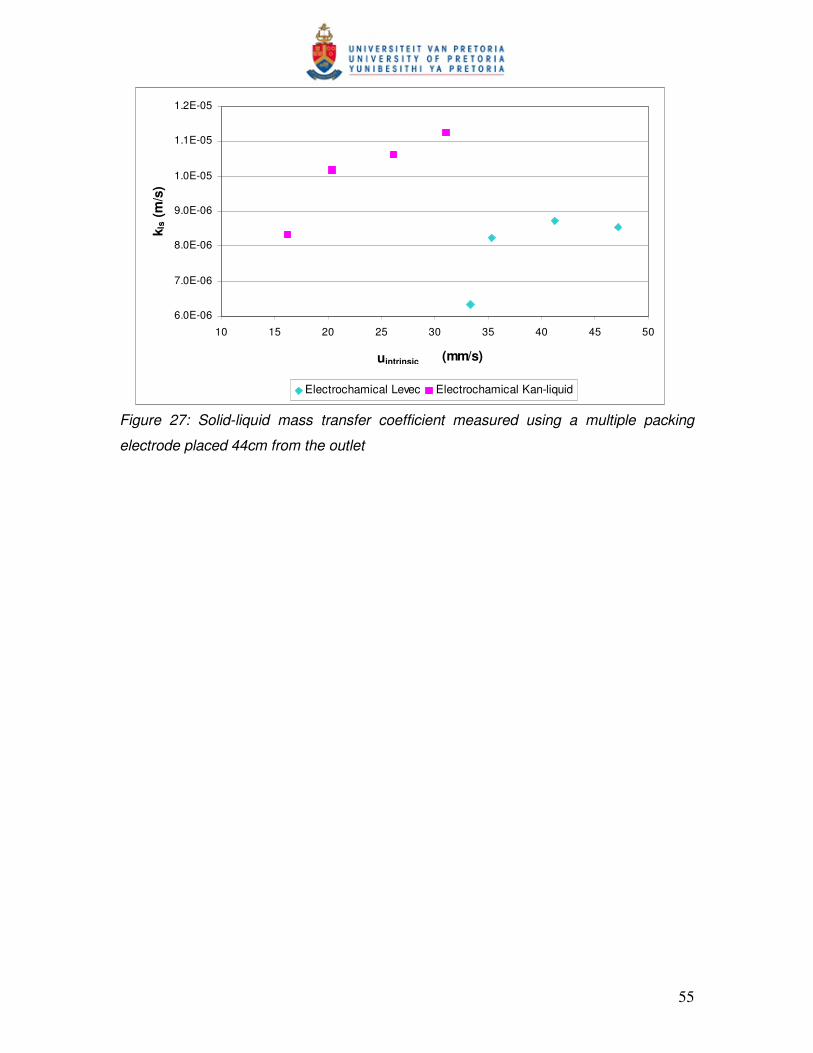
55
Figure 27: Solid-liquid mass transfer coefficient measured using a multiple packing
electrode placed 44cm from the outlet
6.0E-06
7.0E-06
8.0E-06
9.0E-06
1.0E-05
1.1E-05
1.2E-05
10 15 20 25 30 35 40 45 50
uinterstitial (mm/s)
kls
(m
/s)
Electrochamical Levec Electrochamical Kan-liquid
uintrinsic