solar system sizing
TRANSCRIPT
8/10/2019 Solar System Sizing
http://slidepdf.com/reader/full/solar-system-sizing 1/10
Solar System Sizinghttp://www.openelectrical.org/wiki/index.php?title=Solar_System_Sizing
Introduction
Figure 1. Solar PV array
This calculation outlines the sizing of a standalone solar photovoltaic (PV) power
system. Standalone PV systems are commonly used to supply power to small remote
installations (e.g. telecoms) where it isn!t practical or cost"efficient to run a transmission
line or have alternative generation such as diesel gensets.
#lthough this calculation is $iased towards standalone solar PV systems it can also $e
used for hy$rid systems that draw power from mi%ed sources (e.g. commercial PV
hy$rid wind"PV systems etc). &oads must $e ad'usted according to the desired amount
that the solar PV system will supply.
This calculation is $ased on crystalline silicon PV technology. The results may not hold
for other types of solar PV technologies and the manufacturer!s recommendations will
need to $e consulted.
Why do the calculation?
This calculation should $e done whenever a solar PV power system is reuired so that
the system is a$le to adeuately cater for the necessary loads. The results can $e used to
determine the ratings of the system components (e.g. PV array $atteries etc).
When to do the calculation?
8/10/2019 Solar System Sizing
http://slidepdf.com/reader/full/solar-system-sizing 2/10
The following pre"reuisite information is reuired $efore performing the calculation
• &oads reuired to $e supported $y the solar PV system
• #utonomy time or minimum tolera$le downtime (i.e. if there is no sun
how long can the system $e out of service*)
• +PS coordinates of the site (or measurements of the solar insolation at
the site)
• ,utput voltage (#- or -)
Calculation Methodology
The calculation is loosely $ased on #S/0S 2345.6 (6446) 7Standalone power systems
" System design guidelines7. The methodology has the following si% steps
• Step 1 8stimate the solar irradiation availa$le at the site ($ased on +PScoordinates or measurement)
• Step 6 -ollect the loads that will $e supported $y the system
• Step 9 -onstruct a load profile and calculate design load and design
energy
• Step 2 -alculate the reuired $attery capacity $ased on the design loads
• Step 3 8stimate the output of a single PV module at the proposed site
location
• Step : -alculate size of the PV array
Step 1: Estimate Solar Irradiation at the Site
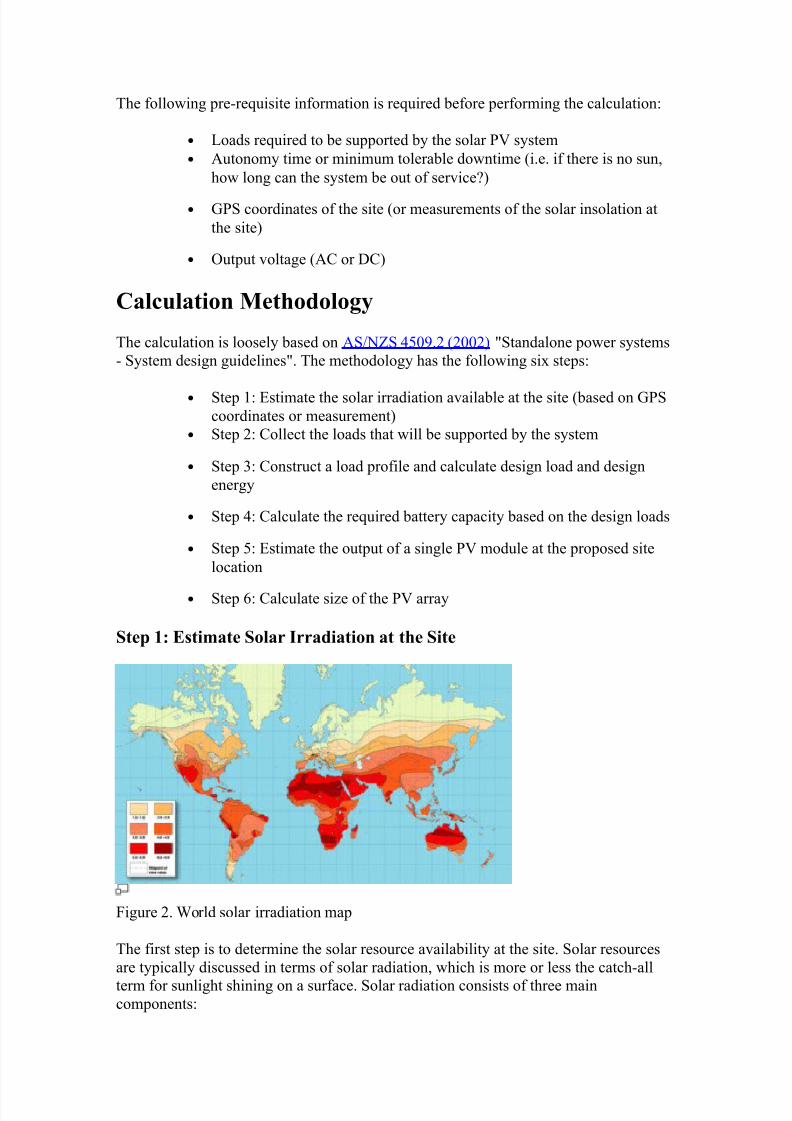
Figure 6. ;orld solar irradiation map
The first step is to determine the solar resource availa$ility at the site. Solar resources
are typically discussed in terms of solar radiation which is more or less the catch"all
term for sunlight shining on a surface. Solar radiation consists of three maincomponents
8/10/2019 Solar System Sizing
http://slidepdf.com/reader/full/solar-system-sizing 3/10
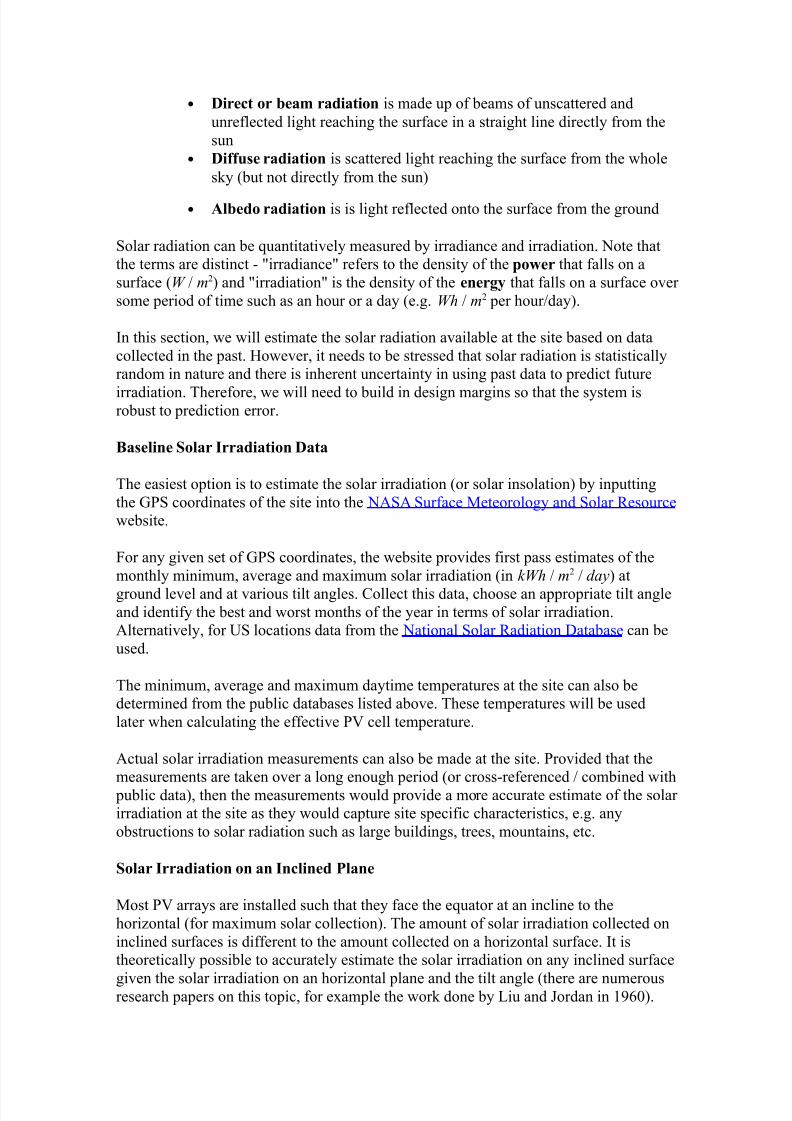
• Direct or beam radiation is made up of $eams of unscattered and
unreflected light reaching the surface in a straight line directly from the
sun
• Diffuse radiation is scattered light reaching the surface from the whole
s<y ($ut not directly from the sun)
• lbedo radiation is is light reflected onto the surface from the ground
Solar radiation can $e uantitatively measured $y irradiance and irradiation. 0ote that
the terms are distinct " 7irradiance7 refers to the density of the po!er that falls on a
surface (W / m6) and 7irradiation7 is the density of the energy that falls on a surface over
some period of time such as an hour or a day (e.g. Wh / m6 per hour/day).
=n this section we will estimate the solar radiation availa$le at the site $ased on data
collected in the past. >owever it needs to $e stressed that solar radiation is statistically
random in nature and there is inherent uncertainty in using past data to predict future
irradiation. Therefore we will need to $uild in design margins so that the system isro$ust to prediction error.
"aseline Solar Irradiation Data
The easiest option is to estimate the solar irradiation (or solar insolation) $y inputting
the +PS coordinates of the site into the 0#S# Surface ?eteorology and Solar @esource
we$site.
For any given set of +PS coordinates the we$site provides first pass estimates of the
monthly minimum average and ma%imum solar irradiation (in kWh / m6 / day) at
ground level and at various tilt angles. -ollect this data choose an appropriate tilt angleand identify the $est and worst months of the year in terms of solar irradiation.
#lternatively for AS locations data from the 0ational Solar @adiation ata$ase can $e
used.
The minimum average and ma%imum daytime temperatures at the site can also $e
determined from the pu$lic data$ases listed a$ove. These temperatures will $e used
later when calculating the effective PV cell temperature.
#ctual solar irradiation measurements can also $e made at the site. Provided that the
measurements are ta<en over a long enough period (or cross"referenced / com$ined with
pu$lic data) then the measurements would provide a more accurate estimate of the solar
irradiation at the site as they would capture site specific characteristics e.g. any
o$structions to solar radiation such as large $uildings trees mountains etc.
Solar Irradiation on an Inclined #lane
?ost PV arrays are installed such that they face the euator at an incline to the
horizontal (for ma%imum solar collection). The amount of solar irradiation collected on
inclined surfaces is different to the amount collected on a horizontal surface. =t is
theoretically possi$le to accurately estimate the solar irradiation on any inclined surface
given the solar irradiation on an horizontal plane and the tilt angle (there are numerousresearch papers on this topic for e%ample the wor< done $y &iu and Bordan in 15:4).
8/10/2019 Solar System Sizing
http://slidepdf.com/reader/full/solar-system-sizing 4/10
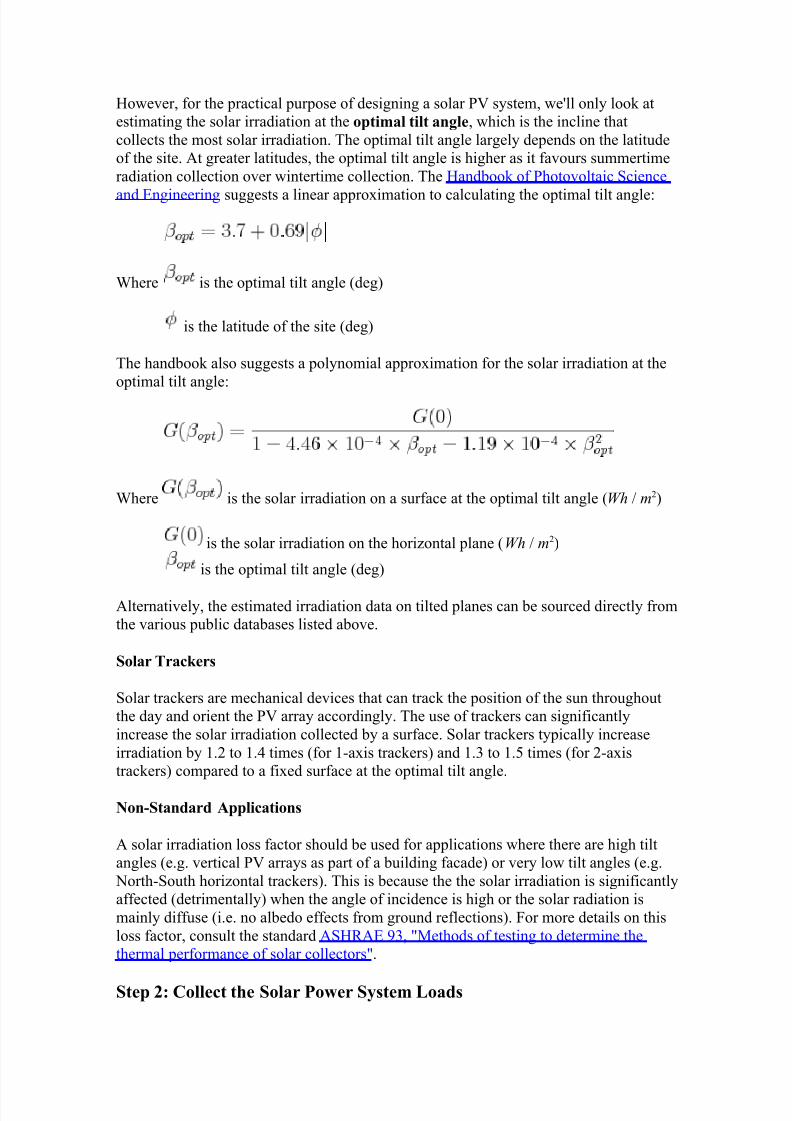
>owever for the practical purpose of designing a solar PV system we!ll only loo< at
estimating the solar irradiation at the optimal tilt angle which is the incline that
collects the most solar irradiation. The optimal tilt angle largely depends on the latitude
of the site. #t greater latitudes the optimal tilt angle is higher as it favours summertime
radiation collection over wintertime collection. The >and$oo< of Photovoltaic Science
and 8ngineering suggests a linear appro%imation to calculating the optimal tilt angle
;here is the optimal tilt angle (deg)
is the latitude of the site (deg)
The hand$oo< also suggests a polynomial appro%imation for the solar irradiation at the
optimal tilt angle
;here is the solar irradiation on a surface at the optimal tilt angle (Wh / m6)
is the solar irradiation on the horizontal plane (Wh / m6)
is the optimal tilt angle (deg)
#lternatively the estimated irradiation data on tilted planes can $e sourced directly from
the various pu$lic data$ases listed a$ove.
Solar $rac%ers
Solar trac<ers are mechanical devices that can trac< the position of the sun throughout
the day and orient the PV array accordingly. The use of trac<ers can significantly
increase the solar irradiation collected $y a surface. Solar trac<ers typically increase
irradiation $y 1.6 to 1.2 times (for 1"a%is trac<ers) and 1.9 to 1.3 times (for 6"a%is
trac<ers) compared to a fi%ed surface at the optimal tilt angle.
&on'Standard pplications
# solar irradiation loss factor should $e used for applications where there are high tilt
angles (e.g. vertical PV arrays as part of a $uilding facade) or very low tilt angles (e.g.
0orth"South horizontal trac<ers). This is $ecause the the solar irradiation is significantly
affected (detrimentally) when the angle of incidence is high or the solar radiation is
mainly diffuse (i.e. no al$edo effects from ground reflections). For more details on this
loss factor consult the standard #S>@#8 59 7?ethods of testing to determine the
thermal performance of solar collectors7.
Step (: Collect the Solar #o!er System )oads
8/10/2019 Solar System Sizing
http://slidepdf.com/reader/full/solar-system-sizing 5/10
The ne%t step is to determine the type and uantity of loads that the solar power system
needs to support. For remote industrial applications such as metering stations the loads
are normally for control systems and instrumentation euipment. For commercial
applications such as telecommunications the loads are the telecoms hardware and
possi$ly some small area lighting for maintenance. For rural electrification and
residential applications the loads are typically domestic lighting and low"poweredapppliances e.g. computers radios small tv!s etc.
Step *: Construct a )oad #rofile
@efer to the &oad Profile -alculation for details on how to construct a load profile and
calculate the design load ( ) and design energy ( ). Typically the 762 >our
Profile7 method for constructing a load profile is used for Solar Power Systems.
Step +: "attery Capacity Sizing
=n a solar PV power system the $attery is used to provide $ac<up energy storage and
also to maintain output voltage sta$ility. @efer to the Cattery Sizing -alculation for
details on how to size the $attery for the solar power system.
Step ,: Estimate a Single #- Module.s /utput
=t is assumed that a specific PV module type (e.g Suntech STP4D4S"16C$) has $een
selected and the following parameters collected
• Pea< module power (;"p)
• 0ominal voltage (Vdc)
• ,pen circuit voltage (Vdc)
• ,ptimum operating voltage (Vdc)
• Short circuit current (#)
• ,ptimum operating current (#)
• Pea< power temperature coefficient (E per deg -)
• ?anufacturer!s power output tolerance (E)
?anufacturers usually uote these PV module parameters $ased on Standard Test
-onditions (ST-) an irradiance of 1444 W / m6 the standard reference spectral
irradiance with #ir ?ass 1.3 (see the 0@8& site for more details) and a cell temperature
of 63 deg -. Standard test conditions rarely prevail on site and when the PV module are
installed in the field the output must $e de"rated accordingly.
Effecti0e #- Cell $emperature
8/10/2019 Solar System Sizing
http://slidepdf.com/reader/full/solar-system-sizing 6/10
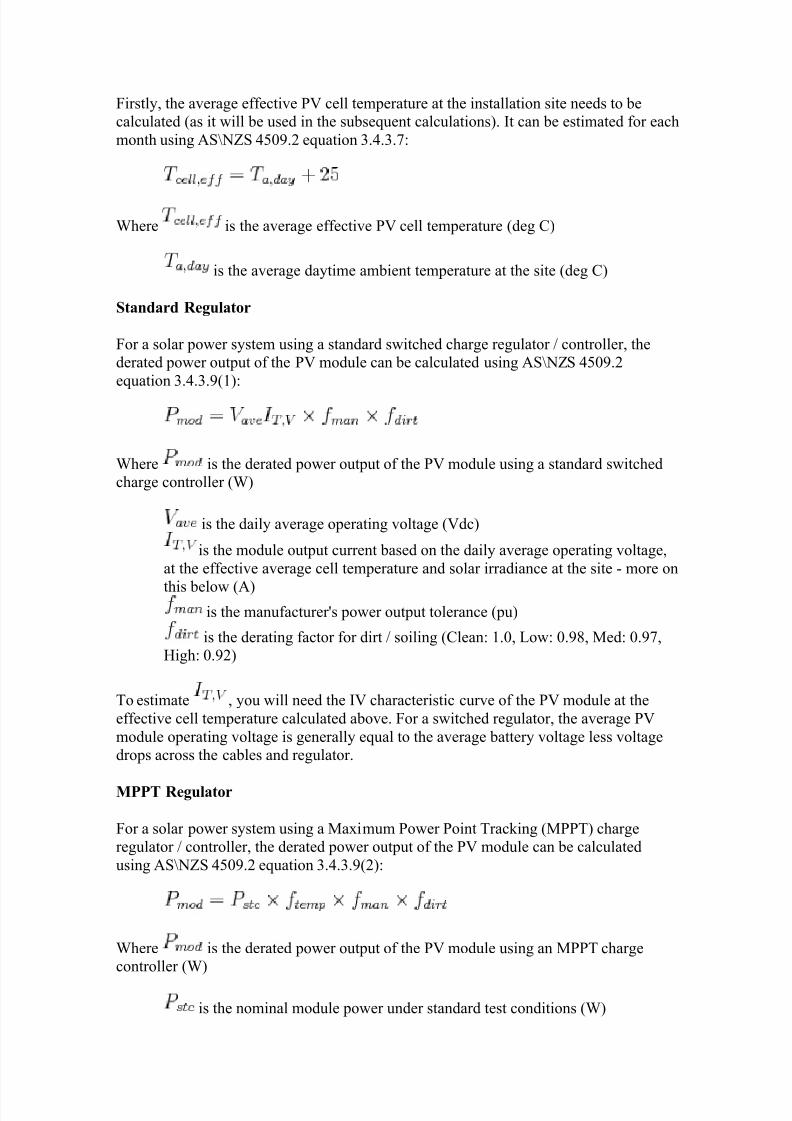
Firstly the average effective PV cell temperature at the installation site needs to $e
calculated (as it will $e used in the su$seuent calculations). =t can $e estimated for each
month using #S0S 2345.6 euation 9.2.9.D
;here is the average effective PV cell temperature (deg -)
is the average daytime am$ient temperature at the site (deg -)
Standard egulator
For a solar power system using a standard switched charge regulator / controller the
derated power output of the PV module can $e calculated using #S0S 2345.6
euation 9.2.9.5(1)
;here is the derated power output of the PV module using a standard switched
charge controller (;)
is the daily average operating voltage (Vdc)
is the module output current $ased on the daily average operating voltage
at the effective average cell temperature and solar irradiance at the site " more on
this $elow (#)is the manufacturer!s power output tolerance (pu)
is the derating factor for dirt / soiling (-lean 1.4 &ow 4.5G ?ed 4.5D
>igh 4.56)
To estimate you will need the =V characteristic curve of the PV module at the
effective cell temperature calculated a$ove. For a switched regulator the average PV
module operating voltage is generally eual to the average $attery voltage less voltage
drops across the ca$les and regulator.
M##$ egulator
For a solar power system using a ?a%imum Power Point Trac<ing (?PPT) charge
regulator / controller the derated power output of the PV module can $e calculated
using #S0S 2345.6 euation 9.2.9.5(6)
;here is the derated power output of the PV module using an ?PPT charge
controller (;)
is the nominal module power under standard test conditions (;)
8/10/2019 Solar System Sizing
http://slidepdf.com/reader/full/solar-system-sizing 7/10
is the manufacturer!s power output tolerance (pu)
is the derating factor for dirt / soiling (-lean 1.4 &ow 4.5G ?ed 4.5D
>igh 4.56)
is the temperature derating factor " see $elow (pu)
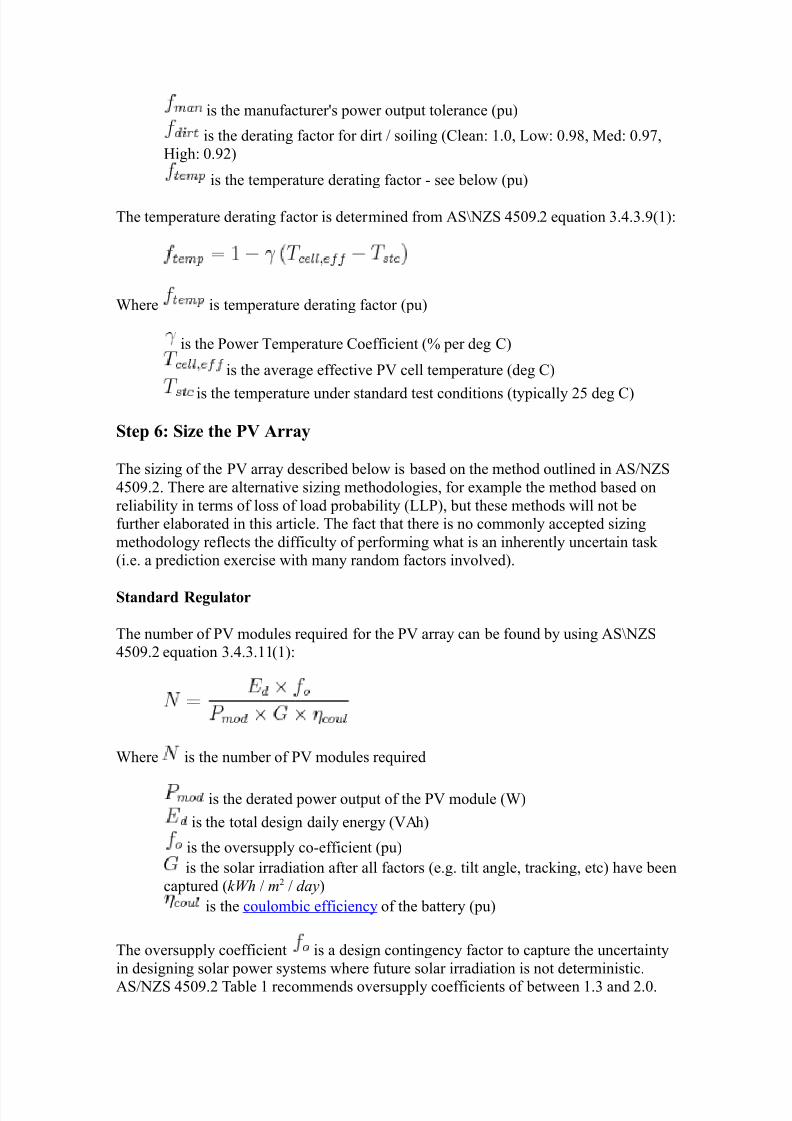
The temperature derating factor is determined from #S0S 2345.6 euation 9.2.9.5(1)
;here is temperature derating factor (pu)
is the Power Temperature -oefficient (E per deg -)
is the average effective PV cell temperature (deg -)
is the temperature under standard test conditions (typically 63 deg -)
Step 2: Size the #- rray
The sizing of the PV array descri$ed $elow is $ased on the method outlined in #S/0S
2345.6. There are alternative sizing methodologies for e%ample the method $ased on
relia$ility in terms of loss of load pro$a$ility (&&P) $ut these methods will not $e
further ela$orated in this article. The fact that there is no commonly accepted sizing
methodology reflects the difficulty of performing what is an inherently uncertain tas<
(i.e. a prediction e%ercise with many random factors involved).
Standard egulator
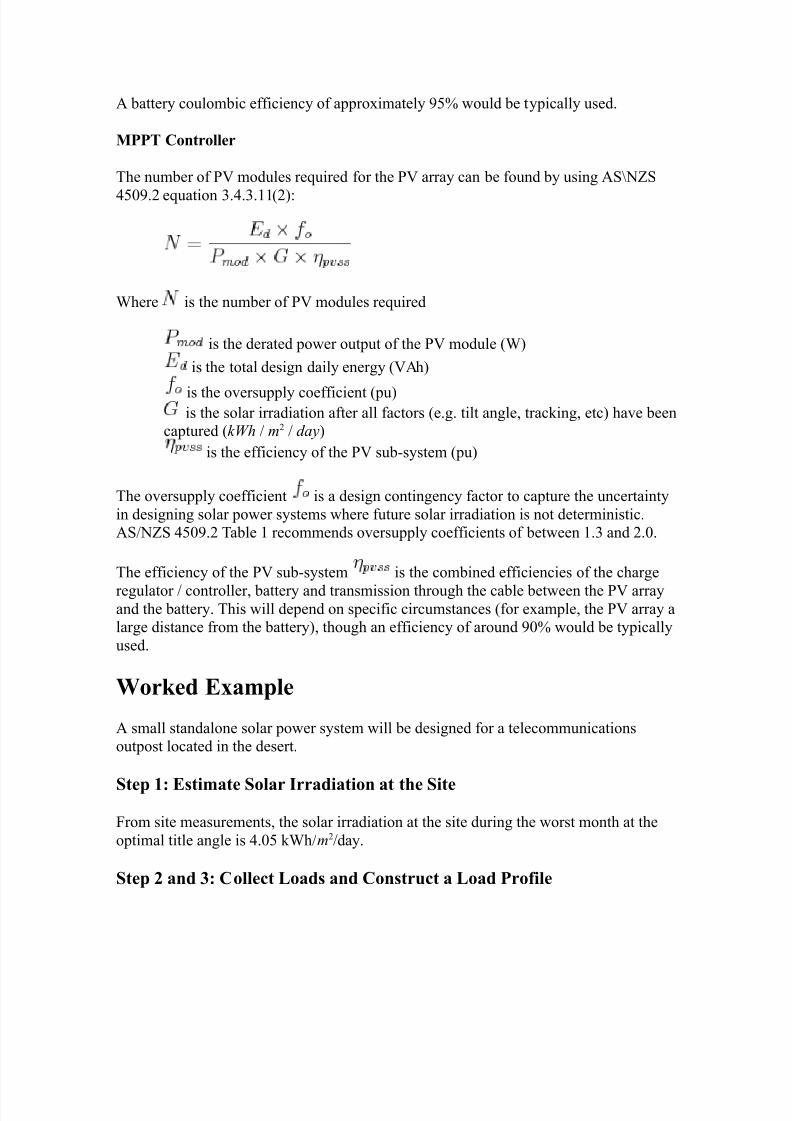
The num$er of PV modules reuired for the PV array can $e found $y using #S0S
2345.6 euation 9.2.9.11(1)
;here is the num$er of PV modules reuired
is the derated power output of the PV module (;)
is the total design daily energy (V#h)
is the oversupply co"efficient (pu)
is the solar irradiation after all factors (e.g. tilt angle trac<ing etc) have $een
captured (kWh / m6 / day)
is the coulom$ic efficiency of the $attery (pu)
The oversupply coefficient is a design contingency factor to capture the uncertainty
in designing solar power systems where future solar irradiation is not deterministic.
#S/0S 2345.6 Ta$le 1 recommends oversupply coefficients of $etween 1.9 and 6.4.
8/10/2019 Solar System Sizing
http://slidepdf.com/reader/full/solar-system-sizing 8/10
# $attery coulom$ic efficiency of appro%imately 53E would $e typically used.
M##$ Controller
The num$er of PV modules reuired for the PV array can $e found $y using #S0S
2345.6 euation 9.2.9.11(6)
;here is the num$er of PV modules reuired
is the derated power output of the PV module (;)
is the total design daily energy (V#h)
is the oversupply coefficient (pu)is the solar irradiation after all factors (e.g. tilt angle trac<ing etc) have $een
captured (kWh / m6 / day)
is the efficiency of the PV su$"system (pu)
The oversupply coefficient is a design contingency factor to capture the uncertainty
in designing solar power systems where future solar irradiation is not deterministic.
#S/0S 2345.6 Ta$le 1 recommends oversupply coefficients of $etween 1.9 and 6.4.
The efficiency of the PV su$"system is the com$ined efficiencies of the charge
regulator / controller $attery and transmission through the ca$le $etween the PV arrayand the $attery. This will depend on specific circumstances (for e%ample the PV array a
large distance from the $attery) though an efficiency of around 54E would $e typically
used.
Wor%ed E3ample
# small standalone solar power system will $e designed for a telecommunications
outpost located in the desert.
Step 1: Estimate Solar Irradiation at the Site
From site measurements the solar irradiation at the site during the worst month at the
optimal title angle is 2.43 <;h/m6/day.
Step ( and *: Collect )oads and Construct a )oad #rofile
8/10/2019 Solar System Sizing
http://slidepdf.com/reader/full/solar-system-sizing 9/10
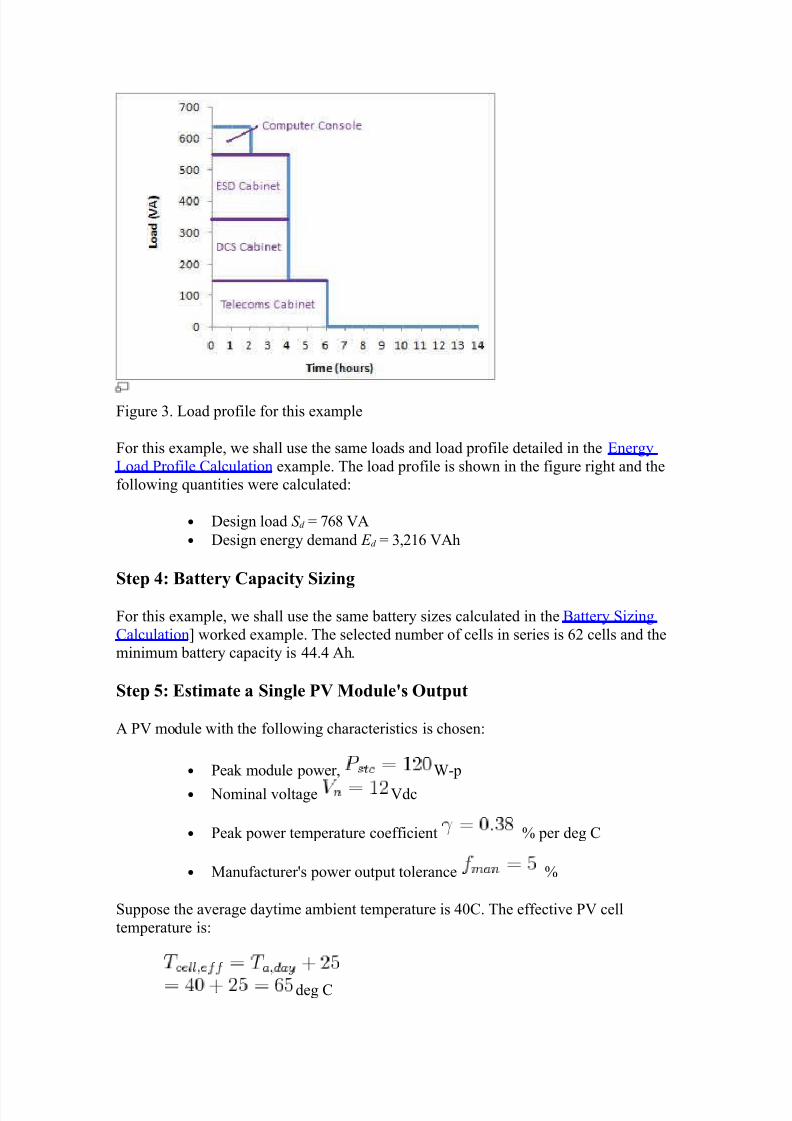
Figure 9. &oad profile for this e%ample
For this e%ample we shall use the same loads and load profile detailed in the 8nergy
&oad Profile -alculation e%ample. The load profile is shown in the figure right and the
following uantities were calculated
• esign load S d H D:G V#
• esign energy demand E d H 961: V#h
Step +: "attery Capacity Sizing
For this e%ample we shall use the same $attery sizes calculated in the Cattery Sizing
-alculationI wor<ed e%ample. The selected num$er of cells in series is :6 cells and the
minimum $attery capacity is 22.2 #h.
Step ,: Estimate a Single #- Module.s /utput
# PV module with the following characteristics is chosen
• Pea< module power ;"p
• 0ominal voltage Vdc
• Pea< power temperature coefficient E per deg -
• ?anufacturer!s power output tolerance E
Suppose the average daytime am$ient temperature is 24-. The effective PV cell
temperature is
deg -
8/10/2019 Solar System Sizing
http://slidepdf.com/reader/full/solar-system-sizing 10/10
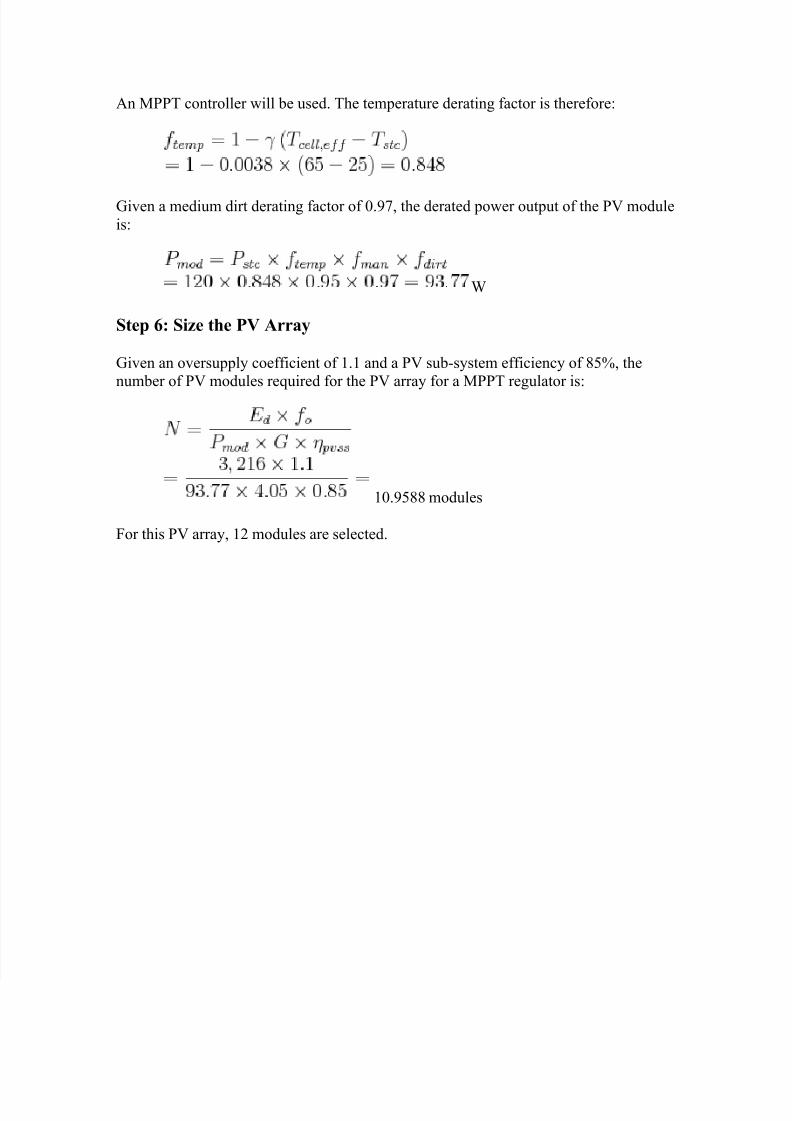
#n ?PPT controller will $e used. The temperature derating factor is therefore
+iven a medium dirt derating factor of 4.5D the derated power output of the PV module
is
;
Step 2: Size the #- rray
+iven an oversupply coefficient of 1.1 and a PV su$"system efficiency of G3E the
num$er of PV modules reuired for the PV array for a ?PPT regulator is
14.53GG modules
For this PV array 16 modules are selected.