solar sector - semi.org | · · 2015-12-19solar sector sector outlook and liquidity risk ......
TRANSCRIPT

Solar SectorSector outlook and liquidity risk
May 2012yPranab Kumar Sarmah, CFA
Tel: (852) 2848 4441Tel: (852) 2848 4441E-mail: [email protected]
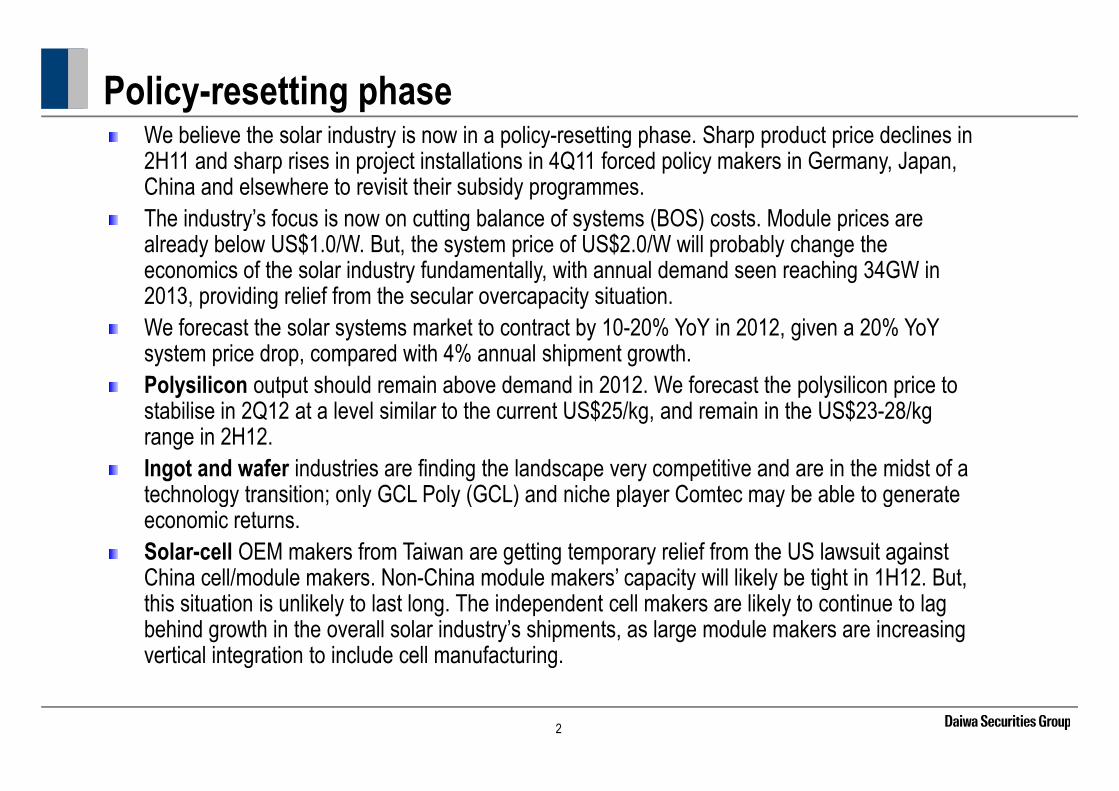
Policy-resetting phaseW b li th l i d t i i li tti h Sh d t i d li i We believe the solar industry is now in a policy-resetting phase. Sharp product price declines in 2H11 and sharp rises in project installations in 4Q11 forced policy makers in Germany, Japan, China and elsewhere to revisit their subsidy programmes. The industry’s focus is now on cutting balance of systems (BOS) costs Module prices are The industry s focus is now on cutting balance of systems (BOS) costs. Module prices are already below US$1.0/W. But, the system price of US$2.0/W will probably change the economics of the solar industry fundamentally, with annual demand seen reaching 34GW in 2013, providing relief from the secular overcapacity situation. , p g p yWe forecast the solar systems market to contract by 10-20% YoY in 2012, given a 20% YoY system price drop, compared with 4% annual shipment growth. Polysilicon output should remain above demand in 2012. We forecast the polysilicon price to y p p y pstabilise in 2Q12 at a level similar to the current US$25/kg, and remain in the US$23-28/kg range in 2H12. Ingot and wafer industries are finding the landscape very competitive and are in the midst of a t h l t iti l GCL P l (GCL) d i h l C t b bl t t technology transition; only GCL Poly (GCL) and niche player Comtec may be able to generate economic returns.Solar-cell OEM makers from Taiwan are getting temporary relief from the US lawsuit against China cell/module makers Non China module makers’ capacity will likely be tight in 1H12 But China cell/module makers. Non-China module makers capacity will likely be tight in 1H12. But, this situation is unlikely to last long. The independent cell makers are likely to continue to lag behind growth in the overall solar industry’s shipments, as large module makers are increasing vertical integration to include cell manufacturing.
2
g g

What we recommendWh i lik l b fi i b US$1/W d l i ld?Who is likely to benefit in a sub-US$1/W module-price world?
Most players in the supply chain likely won’t generate economic returns with module prices at less than US$1.0/W. Low-cost producers could see their market shares expand, but only those with the financial flexibility to expand capacity and fund working-capital requirements will be the ultimate winners, in our view.Cost variations are highest among polysilicon makers, followed by wafer and module makers. Therefore the polysilicon industry is likely to undergo significant consolidationTherefore, the polysilicon industry is likely to undergo significant consolidation.
Potential share-price catalysts to monitor: Potential production/capacity consolidation among the large players in 2012 could see the low-cost
d ’ h i t dproducers’ share prices re-rated.Government-funded acquisition.Achieving grid parity in many leading economies by late-2012 could generate sufficient demand to
b b itabsorb excess capacity.
3

Why is a sub-US$2.0/W system price so important? Solar power-generation cost (US$/KWh) World map showing solar insolation
1,800 1,500Annual sun hours
System cost (US$/W) 2,000 1,200 1,0000.15 0.190.12 0.150.09 0.10.05 0.061 0.05 0.08 0.09
2 0.08 0.13 0.153 0.11 0.19 0.224 0.14 0.23 0.28
Source: Daiwa
Note: >50% land area gets >1,200 sun-hours per annumS EPIA
utility grid parity retail grid parity
Source: EPIA
Industry is in a price-discovery phase due to significant over-capacity.Modules priced at below US$1.0/W (system price of sub-US$2.0/W) will change the p $ ( y p $ ) geconomics of the solar industry fundamentally (subsidy to non-subsidy era).Project finance will be key demand driver where solar is a viable solution without government subsidy. subsidy. Price elasticity for solar product demand to kick in; annual demand would have to reach 40GW, up from 27GW in 2011, to absorb excess capacity.
Commercial/corporate demand first followed by demand from utility suppliers (subject to the
4
Commercial/corporate demand first, followed by demand from utility suppliers (subject to the existence of smart grids).

Product price trend and cost structureSpot prices of solar products Typical cost structure of solar systems
2 0(US$/W) 7% Polysilicon
3% Ingot growth2% S i20% Solar 13% Solar
f
1 01.21.41.61.82.0 2% Sawing
1% Others
7%10%
Others + LaborOthers
Packaging materials
37%Solar
Module
20% SolarCell wafer
7%
0 00.20.40.60.81.0
33%Solar
System Installation
0.0
14-A
pr-1
0
2-A
ug-1
0
20-N
ov-1
0
10-M
ar-1
1
28-J
un-1
1
16-O
ct-1
1
3-F
eb-1
2
23-M
ay-1
2
6" Multi wafer Polysilicon Cell c Si module
10%
20%
Inverter
EPC development + Others
Source: PV-insights, Daiwa Source: Daiwa estimates
6" Multi wafer Polysilicon Cell c-Si module
Polysilicon/module price reductions will likely have a limited impact on electricity generation cost vis-à-vis reaching utility grid parity.
5
BOS cost reduction will be the key.

Smart grid/energy storageWe estimate that the value of the global energy storage market was US$44bn in 2010 and forecast it to reach US$100bn by 2020, with a CAGR of 9% from 2010-20. Drivers are:
Renewable – energy management and power conditioning for the gridRenewable energy management and power conditioning for the gridAutomotive – ultimate zero-emissions goalMobility – for consumer-electronics products
Lithium-related products have the potential to take market share to varying degrees.
Source: Daiwa
6

Use of energy storage system
Power conditioning Load levelling
50,000 (MW)
Hydro
Solar PV Gas Turbine
Load curve
30,000
40,000 Hydro
WindWind
Energy supplyEnergy supply
10 000
20,000
Steam coal
Energy storage
0
10,000
Day 1 Day 2 Day 3 Day 4 Day 5 Day 6 Day 7
Nuclear
Stea coa
0 5 10 15 20 25 30 35 40 45 50Hours of the day
Night Time
Day 1 Day 2
Source: Daiwa Source: Daiwa
7

Market analysis: non-traditional solar market!Demand forecasts by market
(MWp) 2007 2008 2009 2010 2011 2012E 2013E 2014EGermany 1,328 1,860 3,806 7,260 7,450 6,200 3,500 3,800Ital 60 340 770 4 740 6 210 2 800 3 000 3 500Italy 60 340 770 4,740 6,210 2,800 3,000 3,500China 20 45 290 532 2,700 5,000 6,500 7,500US 220 360 485 949 2,001 3,500 4,500 5,800France 45 70 220 720 1,780 950 700 700J 230 230 484 969 1 245 2 500 3 500 5 000Japan 230 230 484 969 1,245 2,500 3,500 5,000India 20 38 32 54 630 1,000 1,500 2,200Australia 20 50 90 350 750 800 850 1,000Canada 22 40 182 370 600 750 900L A i 30 183 780 1 200 1 800L America 30 183 780 1,200 1,800Czech 50 397 1,420 51 80 80 100Spain 640 2,460 129 496 483 400 500 700Greece 2 45 100 153 265 200 200 300Korea 50 280 250 133 136 240 280 350Other 191 240 527 760 2,846 3,250 7,126 9,254Total 2,826 6,090 7,620 18,748 27,100 28,300 34,186 42,904YoY (%) 62 115 25 146 45 4 21 26
Source: Solarbuzz, Daiwa forecastsSaudi Arabia, MENA
Serbia, Bulgaria, Romania, MacedoniaSouth Africa
Dominican Republic, Puerto Rico, Chile
8
What will be maximum annual demand — 50GW….100GW… ..200GW?

Impact analysis of US anti-dumping/countervailing rulingTotal levies of about 35% (AD and CVD) will likely prompt China-based module producers to outsource US orders to EMS/solar companies in Southeast Asia, Taiwan and Korea
4Q11 cell processing cost
0.22 0.23 0.25
(US$/W)Major-3 Taiwanese averageKorea.
Solar-material makers with capacity outside China should see incremental profit; cell makers to continue facing losses despite volume increase
0.16 0.17 0.17 0.17
0.19 0.20 0.20 0.20 0.20
0.10
0.15
0.20 average
Major-3 Chinese average
22%
losses despite volume increase.Leading China module makers' 1Q12/2Q12 earnings will likely be affected by provisions.A trade war between China and US would be a lose-lose
0.00
0.05
a So
lar
gli S
olar
ko S
olar
eneS
ola
h Po
wer
A So
lar
olar
One
n So
lar
r Pow
er
Mot
ech
Gin
tech
A trade war between China and US would be a lose lose proposition. We see a possibility of China companies filing for anti-dumping lawsuits against US/Korea polysilicon makers and US equipment makers. Source: Companies, Daiwa estimates
Trin
Ying Jink Re
Sunt
ech JA
Hanw
ha S
o
Cana
dia
Neo
Sola
r G
India to focus on increasing local content — opportunity for Asian cell/module makers to tie up with/establish Indian operations.K i ill h EU i i il l i Key question: will the EU impose similar levies on Asian exports?
9

Market analysis: China 12th Five-Year Plan/Japan FIT China – focus: high-purity polysilicon, silicon ingot/silicon chips, crystal silicon cells, film cells, high-efficiency concentration solar cells, BIPV components, special equipment for photovoltaic-system production, auxiliary materials, grid-connection, ESS, and a public service platform.Industry consolidation – room for only 10 companies: 12th Five-Year Plan targets China’s leading polysilicon companies to exceed 50,000tpa capacity, and the leading solar cell/module makers to achieve a 5GW-level scale by 2015. China aims to have one photovoltaic company with more than Rmb100bn in ann al sales 3 5 ith more than Rmb50bn in ann al sales and 3 4 more than Rmb100bn in annual sales, 3-5 with more than Rmb50bn in annual sales, and 3-4 photovoltaic special-equipment enterprises with more than Rmb1bn in annual sales. By 2015, conversion efficiency of mono-cell should reach 21%, multi-cell 19% and Si thin-film cell 12% according to the Plan12%, according to the Plan.By 2015, localisation rate of production equipment and auxiliary material of photovoltaic cell should be 80%.Key technology of PV grid connection production of power storage equipment and system Key technology of PV grid connection, production of power storage equipment and system integration should be accessible. By 2015, the cost of PV systems and power generation should be Rmb13/W and Rmb0.8/KWh, respectively. p yJapan: most prefectures have already fixed capacity-installation targets for FY12 (ending March 2013), but are yet to finalise feed-in tariffs (FIT). Decision on FIT has been delayed from January 2012 to May this year amid falling system prices.
10
y y y y g y pThe market’s initial FIT expectation of ¥40-42/KWh is likely to be reduced.

Market forecasts2007 2008 2009 2010 2011 2012E 2013E 2014E 2015E CAGR (11-15)
System Market (US$bil) 17.2 39.7 38.9 79.8 84.5 68.9 66.9 75.5 81.9 -1%YOY 62% 131% -2% 105% 6% -18% -3% 13% 8%System ASP ((US$/Wp)) 6.1 6.5 5.1 4.3 3.1 2.4 2.0 1.8 1.6 -16%Annual shipment (GWp) 2.8 6.1 7.6 18.7 27.1 28.3 34.2 42.9 51.7 18%Annual shipment (GWp) 2.8 6.1 7.6 18.7 27.1 28.3 34.2 42.9 51.7 18%Cumulative installed capacity (GWp) 8.6 14.7 22.3 41.0 68.1 96.4 130.6 173.5 225.2Solar grade silicon market (US$bil) 2.9 6.8 4.1 6.7 6.8 4.4 4.8 5.1 5.7 -4%YOY 115% 136% -40% 65% 1% -34% 8% 6% 11%Silicon ASP (US$/Wp) 1.18 1.30 0.65 0.41 0.28 0.18 0.16 0.13 0.12 -19%Silicon Consumption (g/Wp) 8.5 7.8 7.2 6.6 6.1 5.8 5.5 5.2 5.1 -5%Solar grade silicon market (000 ton) 20.6 40.6 45.0 107.9 147.9 147.3 170.7 205.3 240.1 13%YOY 32% 97% 11% 140% 37% 0% 16% 20% 17%Solar wafer market (US$bil) 5.4 12.0 7.5 14.9 12.8 9.3 10.4 12.2 13.7 2%YOY 63% 122% -37% 98% -14% -28% 12% 17% 13%Wafer ASP (US$/Wp) 2.2 2.30 1.20 0.91 0.53 0.37 0.34 0.31 0.29 -14%PV Cell Market (US$bil) 8 5 18 9 13 0 24 6 21 1 15 7 17 6 21 0 23 8 3%PV Cell Market (US$bil) 8.5 18.9 13.0 24.6 21.1 15.7 17.6 21.0 23.8 3%YOY 65% 122% -32% 90% -14% -26% 12% 19% 13%Annual shipment (Silicon) (GWp) 2.4 5.2 6.2 16.3 24.2 25.4 31.0 39.3 47.3 18%Annual shipment (thin film) (GWp) 0.4 0.9 1.4 2.4 2.9 2.9 3.2 3.6 4.4 11%Total (GWp) 2.8 6.1 7.6 18.7 27.1 28.3 34.2 42.9 51.7 18%YOY 62% 115% 25% 146% 45% 4% 21% 26% 21%Cell ASP (US$/Wp) 3.02 3.11 1.70 1.31 0.78 0.56 0.52 0.49 0.46 -12%Module Market (US$bil) 12.1 27.0 17.9 33.9 33.0 25.1 27.6 32.3 36.4 3%YOY 64% 122% -34% 89% -3% -24% 10% 17% 13%Module ASP (US$/Wp) 4.3 4.4 2.35 1.81 1.22 0.89 0.81 0.75 0.70 -13%Inverter Market (US$bil) 1.8 5.1 5.7 11.2 10.8 8.5 6.8 7.3 7.5 -9%Oth S t US$bil 3 3 7 6 15 2 34 7 40 7 35 4 32 5 34 6 37 6 2%
Source: Solarbuzz, Daiwa forecasts
Pricing pressure will be high for BOS and the segment many not increase revenue until 2015.
Other System (US$bil) 3.3 7.6 15.2 34.7 40.7 35.4 32.5 34.6 37.6 -2%Price of Inverter (US$/Wp) 0.6 0.8 0.8 0.6 0.4 0.3 0.2 0.2 0.1 -22%Price of Other Systems (US$/Wp) 1.2 1.3 2.0 1.9 1.5 1.3 1.0 0.8 0.7 -17%
11
g p g g yFollowing industry consolidation, wafer/cell/module makers should record marginal revenue growth.

Industry ROIC simulation 2009 2010 2011 2012E 2013E 2014E 2015E2009 2010 2011 2012E 2013E 2014E 2015E
Demand (c-Si based) GW 6.2 16.3 24.2 25.4 31.0 39.3 47.3
Polysilicon installed capacity for solar Ton 131 219 301 376 393 411 422Excess installed capacity for poly 200% 103% 103% 155% 130% 100% 75%Total capex $bn 6.1 6.5 5.7 3.8 0.8 0.7 0.5Acumulated investment (10Y depreciation) $bn 9.6 16.1 21.7 25.5 26.3 27.0 27.4Ingot to module capacity GW 11.6 23.7 38.6 47.2 45.2 49.4 61.5Excess capacity for ingot-module 86% 45% 59% 86% 46% 26% 30%Total capex $bn 2 51 8 07 8 41 4 30 1 10 1 72 4 61Total capex $bn 2.51 8.07 8.41 4.30 1.10 1.72 4.61Acumulated investment (6Y depreciation) $bn 5.0 13.1 21.5 24.8 24.9 24.1 26.2
Module ASP $ 2.15 1.83 1.22 0.84 0.78 0.73 0.70Revenue $bn 13.4 29.9 29.6 21.3 24.2 28.7 33.1YoY 123% -1% -28% 13% 18% 16%Material costPolysilicon $/kg 71 62 46 27 25 24 23Non poly cost $/W 0.90 0.82 0.68 0.65 0.55 0.47 0.42Cost/W $/W 1.41 1.33 0.96 0.81 0.69 0.59 0.54Cost/W $/W 1.41 1.33 0.96 0.81 0.69 0.59 0.54Gross profit margin 34% 27% 21% 4% 12% 19% 23%Gross profit 4.6 8.2 6.3 0.9 2.9 5.4 7.7Net profit 1.5 5.8 3.9 -0.9 1.0 3.1 5.0Working capital $bn 3.4 7.5 7.4 5.3 6.0 7.2 8.3T t l i t d it l $b 18 0 36 7 50 7 55 7 57 2 58 3 61 9
Source: Solarbuzz, Daiwa forecasts
Due to past over-investment and module-price drops, we believe the industry ROIC will continue to
Total invested capital $bn 18.0 36.7 50.7 55.7 57.2 58.3 61.9Industry ROIC 8.6% 15.8% 7.8% -1.5% 1.7% 5.2% 8.2%
12
decline in 2012.

Market analysis: reaching grid parityRetail electricity prices by country
25(US¢/kWh)
Power-generation costs
30
35(US¢/kWh)
10
15
20
10
15
20
25
30
Source: Daiwa
0
5
Solar Biomass Wind Hydro Geothermal Gas Oil Nuclear Coal
0
5
Source: Daiwa
Source: EPIA, Daiwa
40US$2/W US$4/W US$6/W
Payback periods
About 18 countries had reached retail
Source: EIA, EEP, BFE, SSB, NREL, JRC European Commission, Daiwa
152025303540
perio
d (Y
ears
) grid parity by end-2011.
05
1015
0.20 0.25 0.30 0.35 0.40 0.45 0.50
Pay
bac
k
13
Electricity cost (US$/KWHr)
Source: Daiwa

Demand-supplyDemand-supply situation in the supply chain (MW)
50 000
Solar-grade silicon supply and demand
(MW)
30,000
40,000
50,000
35 000
40,000
45,000
50,000(MW)
Marketshare gain from low cost makers
Fight among low cost makers
10,000
20,000
30,000
20,000
25,000
30,000
35,000
Low cost supply to catch with
02007 2008 2009 2010 2011E 2012E 2013E
Silicon available Average wafer processing capacity 0
5,000
10,000
15,000
2005 2006 2007 2008 2009 2010 2011 2012E 2013E
demand after 2012
Average cell processing capacity Demand
Source: Solarbuzz, companies, Daiwa
2005 2006 2007 2008 2009 2010 2011 2012E 2013EDemand Total supply Low cost supply
Source: Companies, Daiwa forecasts
14

Supply chain: excess capacity likely to continue through 2012Silicon based solar energy system supply chain
More than 2,000 companies globally are involved in the PV industry supply chain
Silicon-based solar-energy-system supply chain
supply chain. We believe that capacity at the end of 2011 for wafers and cell makers exceeded our original 2012 demand exceeded our original 2012 demand forecast by 50%.
A ti fit iAverage operating-profit margins
(%)
(40)(30)(20)(10)
0102030
(80)(70)(60)(50)(40)
1Q10 2Q10 3Q10 4Q10 1Q11 2Q11 3Q11 4Q11 1Q12E
Polysilicon Ingot/wafer Cell/module
15
Source: DaiwaSource: Companies, compiled by Daiwa

What do recent data points tell us?Global demand (volume). 4Q11: up 8% QoQ; 1Q12E: down 4% QoQ. Demand from Germany is ahead of our expectations; China, the US, Japan and India are in an expansionary phase, while Europe is in contraction mode.Sector revenue. 4Q11: down 17% QoQ, 1Q12E: down 9% QoQ. Steepest revenue and profitability declines seen for module and wafer makers, respectively.
Daiwa’s Solar Spectrum
declines seen for module and wafer makers, respectively.1Q12E shipments. Polysilicon: down 4% QoQ, wafer: up 42% QoQ, module: down 9% QoQ.4Q11 inventory. Overall: 65D (-13D), polysilicon: 67D (-21D), wafer: 113D (+6D), module: 54D (-8D). We believe wafer channel inventory rose in 1Q12 and are concerned about Chinese module makers’ inventory at their US subsidiaries.4Q11/1Q12 prices (QoQ). Polyslicon: down 34%/down 14% , wafer: down 33%/up 5% and module Q / Q p ces (QoQ) o ys co do 3 %/do % , a e do 33%/up 5% a d odu edown 20%/down 3%. We do not expect polysilicon prices to fall f from the current US$25/kg level, as a 20% cut in prices would only lead to a 1% cost reduction in system prices and have a limited impact on demand. Pricing pressure is higher for BOS (mountings, cables, inverters, labour, etc). 4Q11 write-downs. Inventory and receivables write-downs continued in 4Q11 due to a sharp decline in polysilicon prices. Write-downs amounted to about 2% of the 10 leading companies’ combined revenue.
Solar sector: QoQ revenue growth
Capex. We forecast a 37% YoY decline in capex for 2012, mainly for facility maintenance and upgrades.Technology. Only 150-200MW quasi-mono wafers were shipped globally in 4Q11; N-type products still lack standardisation. Diamond wire is gaining traction and high-efficiency cell/modules should become mainstream in 2H12.
Solar sector: inventory daysSolar sector: quarterly gross margin Source: Daiwa
86 70 69
61 66 77 88
67
175
141 141
85 108 118 107 113
80100120140160180200
(Days)
Solar sector: QoQ revenue growth Solar sector: inventory daysSolar sector: quarterly gross margin
152025303540(%)
010203040
(% )4Q11E based on available
company guidance
61 67
66 61 59 75
62 55 62 54
020406080
1Q10 2Q10 3Q10 4Q10 1Q11 2Q11 3Q11 4Q11
Polysilicon weighted average Ingot/wafer weighted average
Cell/module weighted average
(15)(10)
(5)05
10
1Q10 2Q10 3Q10 4Q10 1Q11 2Q11 3Q11 4Q11 1Q12E
Polysilicon Ingot/wafer Cell/module
(40)(30)(20)(10)
0
1Q10 2Q10 3Q10 4Q10 1Q11 2Q11 3Q11 4Q11E
Polysilicon total Ingot/wafer total Cell/module total Cell/module weighted average
16
Source: Companies, DaiwaSource: Companies, Bloomberg, DaiwaSource: Companies, Bloomberg, Daiwa
Polysilicon Ingot/wafer Cell/modulePolysilicon total Ingot/wafer total Cell/module total

Polysilicon industry: entering a dark ageWhy we like low-cost polysilicon makers:
High entry barriers to becoming a low-cost polysilicon producer.Faster price drops are better for low cost polysilicon makersFaster price drops are better for low-cost polysilicon makers.
Running polysilicon capex/kg capacity Polysilicon production cost( based on latest available data)( based on latest available data)
(US$/kg)
120
140
33 5
43.0
404550
(US$kg)
60
80
100
120
19.7 24.3 26.0 26.0 27.5 28.0 28.0
33.0 33.5
1520253035
0
20
40
eSola
Poly OC
I
mloc
k
cker
EMC
FBR)
LDK
yama
05
10
GCL
OCI
Heml
ock*
Wac
ker
LDK*
DAQO RE
C
Rene
Sola
MEMC
kuya
ma*
Source: Companies, Daiwa estimatesNote: *denotes 4Q11 figures, otherwise based on 1Q12 figures Source: Daiwa estimates
Rene
GCL
Hem
Wac ME
REC(
F
Toku
yH R To
17
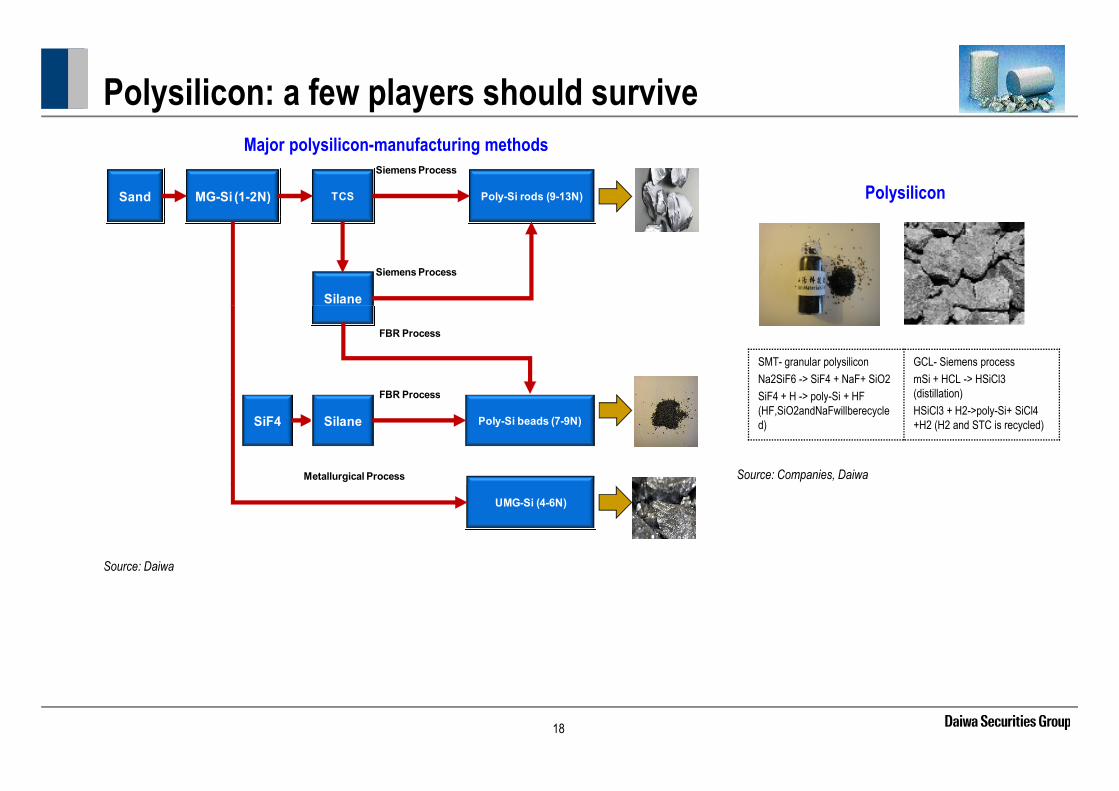
Polysilicon: a few players should survive
Polysilicon
Major polysilicon-manufacturing methods
Sand MG-Si (1-2N) TCS Poly-Si rods (9-13N)
Siemens Process
Silane
Siemens Process
SMT- granular polysiliconNa2SiF6 -> SiF4 + NaF+ SiO2SiF4 + H > poly Si + HF
GCL- Siemens processmSi + HCL -> HSiCl3 (distillation)
FBR Process
FBR Process
Source: Companies, Daiwa
SiF4 + H -> poly-Si + HF (HF,SiO2andNaFwillberecycled)
(distillation)HSiCl3 + H2->poly-Si+ SiCl4 +H2 (H2 and STC is recycled) SiF4 Poly-Si beads (7-9N)Silane
FBR Process
Metallurgical Process
Source: Daiwa
UMG-Si (4-6N)
18
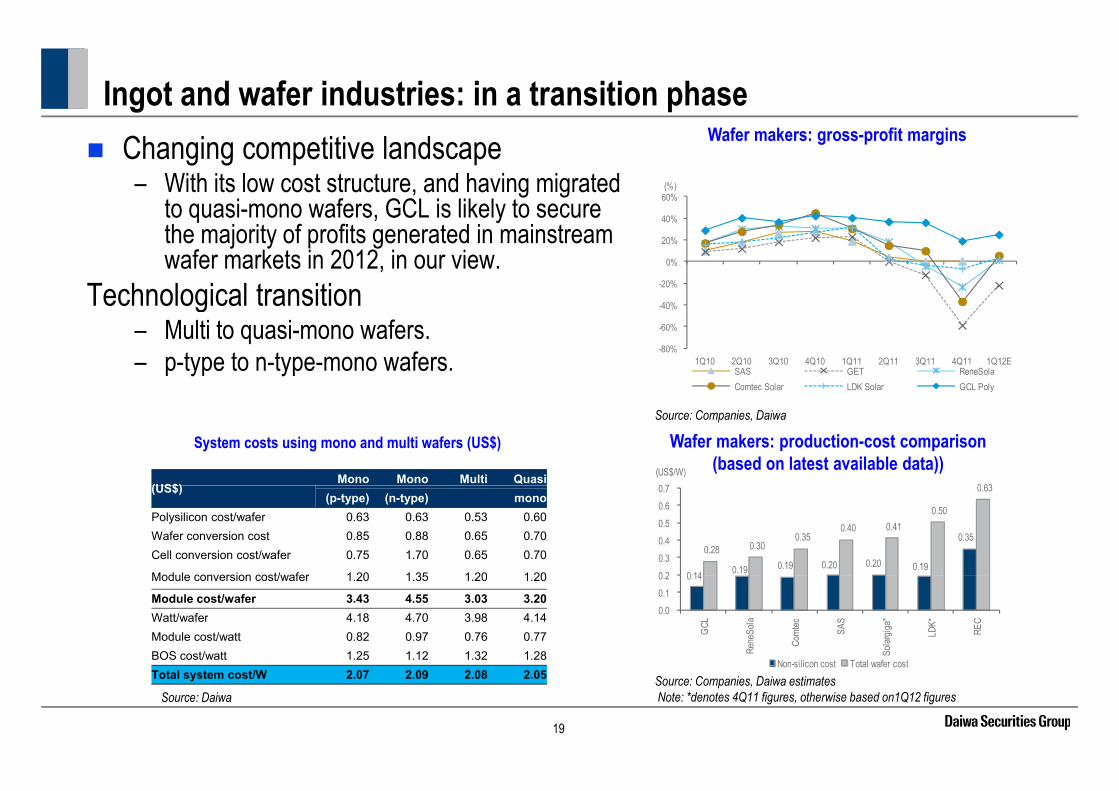
Ingot and wafer industries: in a transition phase
40%
60%(%)
Changing competitive landscape – With its low cost structure, and having migrated
to quasi-mono wafers, GCL is likely to secure
Wafer makers: gross-profit margins
40%
-20%
0%
20%
40%to quasi mono wafers, GCL is likely to secure the majority of profits generated in mainstream wafer markets in 2012, in our view.
Technological transition -80%
-60%
-40%
1Q10 2Q10 3Q10 4Q10 1Q11 2Q11 3Q11 4Q11 1Q12ESAS GET ReneSolaComtec Solar LDK Solar GCL Poly
ec o og ca t a s t o– Multi to quasi-mono wafers.– p-type to n-type-mono wafers.
0 63 0 7 (US$/W)
Source: Companies, Daiwa
Wafer makers: production-cost comparison(based on latest available data))
System costs using mono and multi wafers (US$)
(US$)Mono Mono Multi Quasi
0 14 0.19 0.19 0.20 0.20 0.19
0.35 0.28 0.30
0.35 0.40 0.41
0.50
0.63
0 2 0.3 0.4 0.5 0.6 0.7 (US$)
(p-type) (n-type) monoPolysilicon cost/wafer 0.63 0.63 0.53 0.60Wafer conversion cost 0.85 0.88 0.65 0.70Cell conversion cost/wafer 0.75 1.70 0.65 0.70
Module conversion cost/wafer 1 20 1 35 1 20 1 20 0.14
0.0 0.1 0.2
GCL
Rene
Sola
Comt
ec
SAS
Solar
giga*
LDK*
REC
Non-silicon cost Total wafer cost
Module conversion cost/wafer 1.20 1.35 1.20 1.20
Module cost/wafer 3.43 4.55 3.03 3.20Watt/wafer 4.18 4.70 3.98 4.14Module cost/watt 0.82 0.97 0.76 0.77BOS cost/watt 1.25 1.12 1.32 1.28
Non-silicon cost Total wafer cost
19
Source: DaiwaSource: Companies, Daiwa estimatesNote: *denotes 4Q11 figures, otherwise based on1Q12 figures
Total system cost/W 2.07 2.09 2.08 2.05

Ingot and wafer industries: in a transition phase Technological transition:
– Steel to diamond wire Lower entry barriers compared with polysilicon
Wafer sliced from quasi-mono ingot
Lower entry barriers compared with polysilicon industry.
Capacity expansion has stopped amid no profitability.Source: JA Solar; DaiwaSource: JA Solar; Daiwa
Steel wire vs. diamond wire
Diamond wire Steel wire
Diamond wire Steel wire
Cost of ownership High LowProductivity Higher LowerCut times Twice as fast as slurry SlowerCutting precision Higher LowerR f i Y NRe-use of wire Yes NoEnergy consumption Lower HigherPlant complexity Lower HigherMaintenance cost Lower HigherT h l i k Hi h L
20
Technology risk Higher LowerSource: Meyer Burger, MDWEC, DSKSource: Daiwa
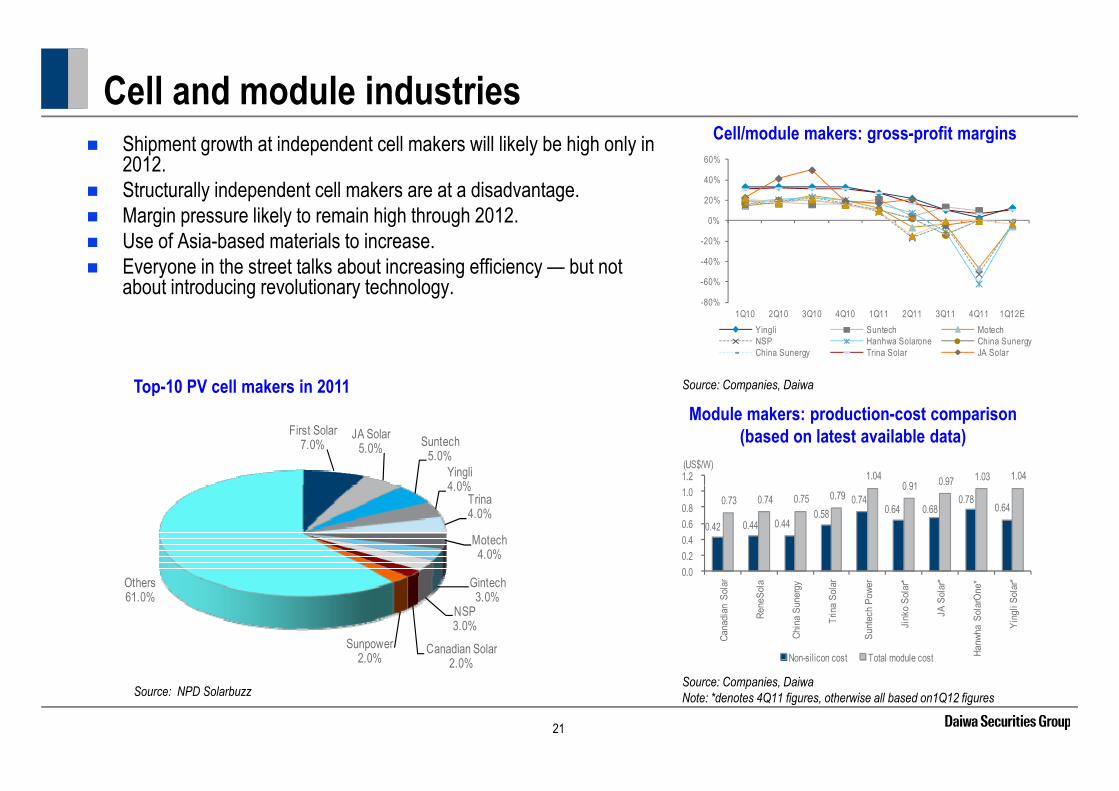
Cell and module industriesC ll/ d l k fi i
Shipment growth at independent cell makers will likely be high only in 2012.
Structurally independent cell makers are at a disadvantage. Margin pressure likely to remain high through 2012
Cell/module makers: gross-profit margins
20%
40%
60%
Margin pressure likely to remain high through 2012. Use of Asia-based materials to increase. Everyone in the street talks about increasing efficiency — but not
about introducing revolutionary technology.-80%
-60%
-40%
-20%
0%
Source: Companies, DaiwaTop-10 PV cell makers in 2011
1Q10 2Q10 3Q10 4Q10 1Q11 2Q11 3Q11 4Q11 1Q12EYingli Suntech MotechNSP Hanhwa Solarone China SunergyChina Sunergy Trina Solar JA Solar
p
First Solar7.0%
JA Solar5.0% Suntech
5.0%Yingli4 0%
Module makers: production-cost comparison(based on latest available data)
1.04 0 91 0.97 1.03 1.04 1.2
(US$/W)
4.0%Trina4.0%
Motech4.0%
0.42 0.44 0.44 0.58
0.74 0.64 0.68
0.78 0.64 0.73 0.74 0.75 0.79
0.91
0.0 0.2 0.4 0.6 0.8 1.0
Gintech3.0%
NSP3.0%
Canadian Solar2 0%
Sunpower2.0%
Others61.0%
0.0
Cana
dian
Sol
ar
Rene
Sola
Chin
a Su
nerg
y
Trin
a So
lar
Sunt
ech
Powe
r
Jink
o So
lar*
JA S
olar
*
Hanw
ha S
olar
One
*
Ying
li So
lar*
Non-silicon cost Total module cost
21
Source: Companies, DaiwaNote: *denotes 4Q11 figures, otherwise all based on1Q12 figuresSource: NPD Solarbuzz
2.0%
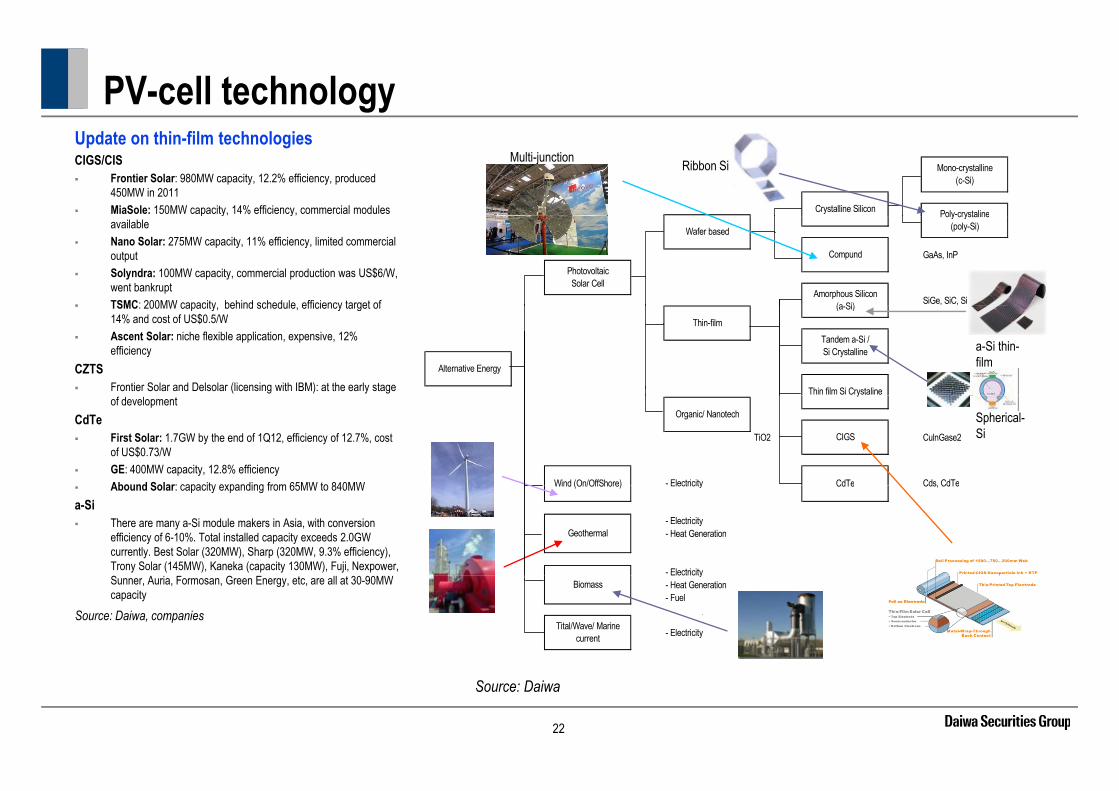
PV-cell technologyMono-crystalline
(c-Si)
Crystalline Silicon Poly-crystaline
Multi-junction cell Ribbon Si
Update on thin-film technologiesCIGS/CIS Frontier Solar: 980MW capacity, 12.2% efficiency, produced
450MW in 2011 MiaSole: 150MW capacity, 14% efficiency, commercial modules
GaAs, InP
SiGe, SiC, Si
Poly crystaline(poly-Si)Wafer based
Compund PhotovoltaicSolar Cell
Amorphous Silicon (a Si)
p y yavailable
Nano Solar: 275MW capacity, 11% efficiency, limited commercial output
Solyndra: 100MW capacity, commercial production was US$6/W, went bankrupt
TSMC: 200MW capacity behind schedule efficiency target of
Alternative Energy
(a-Si)Thin-film
Tandem a-Si /Si Crystalline
Thin film Si Crystaline
a-Si thin-film
TSMC: 200MW capacity, behind schedule, efficiency target of 14% and cost of US$0.5/W
Ascent Solar: niche flexible application, expensive, 12% efficiency
CZTS Frontier Solar and Delsolar (licensing with IBM): at the early stage
TiO2 CulnGase2
- Electricity Cds, CdTe
Organic/ Nanotech
CdTe
y
Wind (On/OffShore)
CIGS
Spherical-Si
of developmentCdTe First Solar: 1.7GW by the end of 1Q12, efficiency of 12.7%, cost
of US$0.73/W GE: 400MW capacity, 12.8% efficiency
Abound Solar: capacity expanding from 65MW to 840MW Electricity Cds, CdTe
- Electricity- Heat Generation
- Electricity
CdTeWind (On/OffShore)
Geothermal
Abound Solar: capacity expanding from 65MW to 840MWa-Si There are many a-Si module makers in Asia, with conversion
efficiency of 6-10%. Total installed capacity exceeds 2.0GW currently. Best Solar (320MW), Sharp (320MW, 9.3% efficiency), Trony Solar (145MW), Kaneka (capacity 130MW), Fuji, Nexpower, Electricity
- Heat Generation- Fuel
- ElectricityTital/Wave/ Marine current
Biomass
Printable CIGS
Sunner, Auria, Formosan, Green Energy, etc, are all at 30-90MW capacity
Source: Daiwa, companies
22
Source: Daiwa

PV-cell technology comparison
Source: Daiwa
23

Volume ≠ profit in a sub-US$1.0/W world — liquidity risk
n
To generate economic returns, companies must meet these criteria:
f33.0 33.5
43.0
35404550
(US$kg)
Cost comparison(based on latest available data)
Polys
iliconLow-cost producers with flexible cost
structures.Financially-healthy companies (low debt-to
19.7 24.3 26.0 26.0 27.5 28.0 28.0
33.0
5101520253035
equity ratios and cash on hand). Niche product segments.
05
GCL
OCI
Heml
ock*
Wac
ker
LDK*
DAQO RE
C
Rene
Sola
MEMC
Toku
yama
*
Source: Companies, Daiwa estimatesNote: *denotes 4Q11 figures, otherwise based on 1Q12 figures
Al Z
3.3 3 0 3.5
246 8 300 1,200(%)(US$m)
Financial health comparison(based on latest available data)
g , gAltman Z-scores
(based on latest available data)
0.5 0.6 1.1 1.3 1.4
1.7 2.1 2.2
0.5 1.0 1.5 2.0 2.5 3.0
5.7 104.9
24.6
246.8
102.1 17.6 36.1
238.4
49.5 100
150
200
250
400
600
800
1,000
ysilic
on
olys
ilicon
(0.3)(0.5)0.0
LDK
Sola
r
REC
MEM
C
shi M
ater
ials
DAQ
O
GCL
Pol
y
Toku
yam
a
CSG
Hol
ding
acke
r Che
mie OCI
0
50
0
200
Wac
ker
GCL
*
Toku
yam
a
MEM
C
Rene
Sola
OCI
*
REC
LDK*
Daqo
Cash and near cash (LHS) Net D/E (RHS)
Poly P
Mits
ubi C
Wa ( ) ( )
24
Source: BloombergSource: Companies, Daiwa estimatesNote: *denotes 4Q11 figures, otherwise based on 1Q12 figures

Liquidity riskFinancial health comparison
(based on latest available data)
afer
sCost comparison
(based on latest available data)
s0.63 0.7 (US$/W)
104 9 300 1 000(%)(US$m)
gots
and
wa
s and
waf
ers
0.14 0.19 0.19 0.20 0.20 0.19
0.35 0.28 0.30
0.35 0.40 0.41
0.50
0.2 0.3 0.4 0.5 0.6 0.7 104.9
120.8
102.1 36.1
238.4
55.9 48.6 4.1
102.5
50
100
150
200
250
300
200300400500600700800900
1,000
Ing
Ingo
ts
0.0 0.1
GCL
Rene
Sola
Comt
ec
SAS
Solar
giga*
LDK*
REC
Non-silicon cost Total wafer cost
4.1
0
50
0100200
GCL
*
Sola
rWor
ld
Rene
Sola
REC
LDK*
SAS
Sola
rgig
a*
Com
tec
GET
Cash and near cash (LHS) Net D/E (RHS)
Altman Z-scores
s
May-2012Sep-20112.5
Source: Companies, BloombergSource: Companies, Daiwa estimatesNote: *denotes 4Q11 figures, otherwise based on 1Q12 figures
s and
waf
ers
0 7 1.1 1.3 1.6 1.82.3 2.5
3.3
5.9
2.03.04.05.06.07.0
0.3 0.5 0.7 0.6
0.8 1.2
1.7 1.9
0.5
1.0
1.5
2.0
Ingo
ts 0.7
0.01.0
LDK
Solar
Sumc
o
REC
Rene
sola
Solar
world
GET
Solar
giga
SAS
Comt
ecSo
lar (0.3)(0.5)
0.0
LDK
Solar
Rene
sola
REC
GET
Sumc
o
Sola
rwor
ld
Sola
rgiga
Com
tec S
olar
SAS
25
C
Source: Bloomberg Source: Bloomberg, Daiwa

Liquidity riskFinancial health comparison
(based on latest available data)Cost comparison
(based on latest available data)
eses 1.04 0 91 0.97 1.03 1.04 1.2
(US$/W)45.4 142.4 27.7
222.8 234.0 250 800(%)(US$m)
Cell/M
odul
e
Cell/M
odul
e
0.42 0.44 0.44 0.58
0.74 0.64 0.68
0.78 0.64 0.73 0.74 0.75 0.79
0.91 0.97
0.2 0.4 0.6 0.8 1.0
27.7
122.5 55.6 9.6
Net cash47.1
129.6
(50)0 50 100 150 200
0
200
400
600
CC 0.0
Cana
dian
Sol
ar
Rene
Sola
Chin
a Su
nerg
y
Trin
a So
lar
Sunt
ech
Powe
r
Jink
o So
lar*
JA S
olar
*
anwh
a So
larO
ne*
Ying
li So
lar*
(50)0
Trin
a So
lar
Ying
li So
lar*
JA S
olar
*
Sunt
ech
Powe
r
Cana
dian
Sol
ar
anwh
a So
larO
ne*
Mot
ech
Chin
a Su
nerg
y
NSP
Gin
tech
Jink
o So
lar*
3.99 4.5 Altman Z-scores May-2012Sep-2011
HaNon-silicon cost Total module cost Ha
Cash and near cash (LHS) Net D/E (RHS)
Source: Companies, Daiwa estimatesNote: *denotes 4Q11 figures, otherwise based on 1Q12 figures
Source: Companies, Bloomberg
0 13 0 20 0.53 0.55 0.61 0.88 0.91 1.10 1.17 1.17 1.30 1.32
1.72 1.73
1.0 1.5 2.0 2.5 3.0 3.5 4.0
5
odul
es
1.3 1.6 1.8 1.9 2.0 2.12.6
3.0 3.2 3.5 3.6 3.9 4.1 4.4 4.6
2.0
3.0
4.0
5.0
0.13 0.20 0.0 0.5
China
Sun
ergy*
Sunte
ch*
anwh
a So
laron
e
Ying
li
NSP
Sunp
ower
Cana
dian
Solar
*
Ginte
ch
Trina
Sola
r*
Sunw
ays
Jinko
Sola
r
JA S
olar
Motec
h
Sharp
Kyoc
era
Cell/M
o
0.51.3
0.0
1.0
Q-Ce
lls
Sunte
ch
Ying
li
Sunp
ower
Shar
pCa
nadia
nSo
larCh
inaSu
nerg
ySu
nway
sHa
nwha
Solar
one
JA S
olar
Trina
Solar
Motec
h
NSP
Jinko
Solar
Kyoc
era
Ginte
ch
Ha C
26
Source: Bloomberg, DaiwaNote: *denotes 1Q12 figuresSource: Bloomberg
S

Sector price performanceThe Bloomberg Solar Index is down 18% YTD. Equity-market conditions are not supportive.
Many leading stocks in the sector are trading at less than 1.0x book.The sector saw a considerable number of downward earnings-forecast revisions by the market in 2H11. g y
Limited interest from investors in corporate bonds. But, many CBs are trading at deep discount to face value and speculative bond investors look at those CBs rather than equities. In 2010, cash-rich Taiwan/Korean corporations invested in solar companies. In 2011, few global energy companies (buyers of end-product) invested in solar names.What about 2012?
Solar index VS polysilicon priceSolar/LED Index
350400450500
300
350
100
120(US$/kg)
100150200250300350
100
150
200
250
40
60
80
050
Oct-0
8
Feb-
09
May
-09
Sep-
09
Dec-
09
Apr-1
0
Jul-1
0
Nov-
10
Feb-
11
Jun-
11
Oct-1
1
Jan-
12
May
-12
LED Index BI GL Solar Energy Index Global Energy Index Nasdaq
0
50
0
20
Oct-08 Feb-09 May-09 Sep-09 Dec-09 Apr-10 Jul-10 Nov-10 Feb-11 Jun-11 Oct-11 Jan-12 May-12
Polysilicon spot (LHS) Solar index (RHS)
27
Source: BloombergSource: Bloomberg, Daiwa

Survival tactics S l f b i $1 i $4 d b $ h h d M f i $1 i $1 Solar farm business: $1 equity + $4 debt = $5 cash on hand. Manufacturing: $1 equity +$1 debt = $2 cash on hand.
Bank support is essentialWho will be the ultimate investors in solar farms?
Cost is key — permanent shutdown of inefficient capacity/preserve cash.Look for rich benefactor needed to provide unique value proposition (‘me too’ strategy Look for rich benefactor — needed to provide unique value proposition ( me too strategy won’t work).Form strategic alliances (cross shareholdings) in the value chain, with one or two cost-competitive companies in each part of value chain competitive companies in each part of value chain. Keep lobbying for government grants.And many more….
28
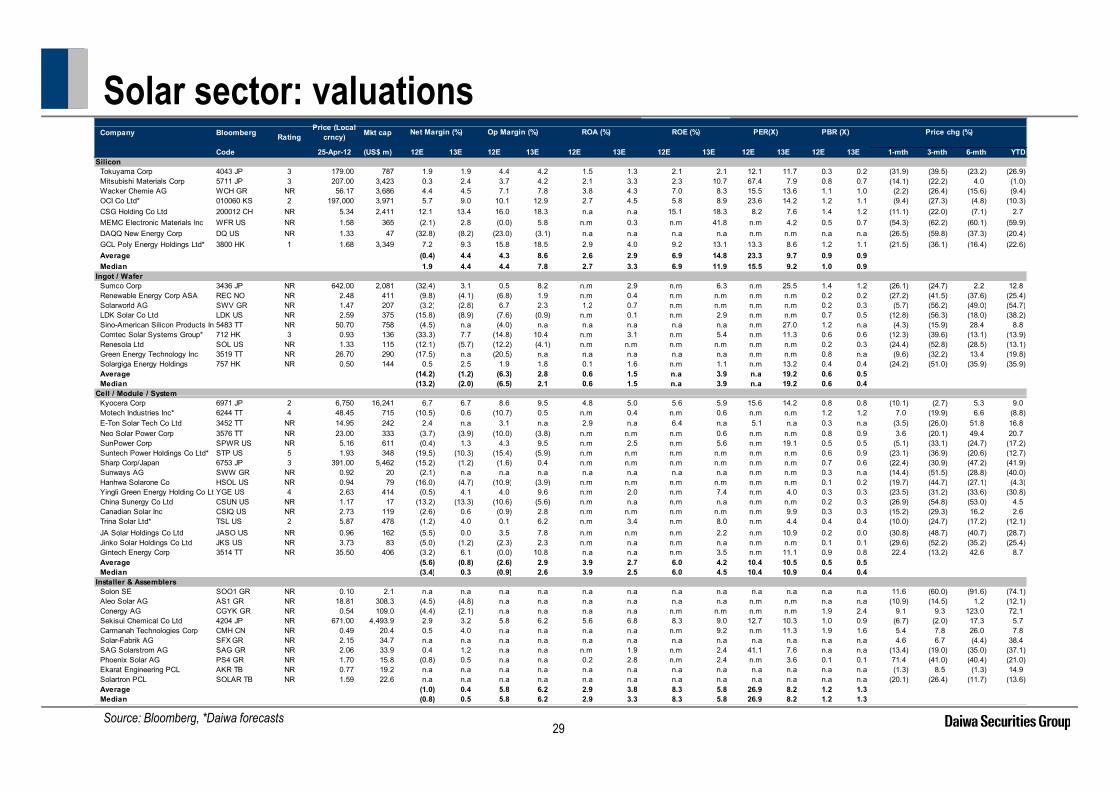
Solar sector: valuationsPrice (Local
Company BloombergPrice (Local
crncy) Mkt cap
Code 25-Apr-12 (US$ m) 12E 13E 12E 13E 12E 13E 12E 13E 12E 13E 12E 13E 1-mth 3-mth 6-mth YTDSilicon
Tokuyama Corp 4043 JP 3 179.00 787 1.9 1.9 4.4 4.2 1.5 1.3 2.1 2.1 12.1 11.7 0.3 0.2 (31.9) (39.5) (23.2) (26.9) Mitsubishi Materials Corp 5711 JP 3 207.00 3,423 0.3 2.4 3.7 4.2 2.1 3.3 2.3 10.7 67.4 7.9 0.8 0.7 (14.1) (22.2) 4.0 (1.0) Wacker Chemie AG WCH GR NR 56.17 3,686 4.4 4.5 7.1 7.8 3.8 4.3 7.0 8.3 15.5 13.6 1.1 1.0 (2.2) (26.4) (15.6) (9.4) OCI Co Ltd* 010060 KS 2 197,000 3,971 5.7 9.0 10.1 12.9 2.7 4.5 5.8 8.9 23.6 14.2 1.2 1.1 (9.4) (27.3) (4.8) (10.3) CSG Holding Co Ltd 200012 CH NR 5.34 2,411 12.1 13.4 16.0 18.3 n.a n.a 15.1 18.3 8.2 7.6 1.4 1.2 (11.1) (22.0) (7.1) 2.7
PBR (X) Price chg (%)Rating
Net Margin (%) Op Margin (%) ROA (%) ROE (%) PER(X)
MEMC Electronic Materials Inc WFR US NR 1.58 365 (2.1) 2.8 (0.0) 5.8 n.m 0.3 n.m 41.8 n.m 4.2 0.5 0.7 (54.3) (62.2) (60.1) (59.9) DAQQ New Energy Corp DQ US NR 1.33 47 (32.8) (8.2) (23.0) (3.1) n.a n.a n.a n.a n.m n.m n.a n.a (26.5) (59.8) (37.3) (20.4) GCL Poly Energy Holdings Ltd* 3800 HK 1 1.68 3,349 7.2 9.3 15.8 18.5 2.9 4.0 9.2 13.1 13.3 8.6 1.2 1.1 (21.5) (36.1) (16.4) (22.6) Average (0.4) 4.4 4.3 8.6 2.6 2.9 6.9 14.8 23.3 9.7 0.9 0.9 Median 1.9 4.4 4.4 7.8 2.7 3.3 6.9 11.9 15.5 9.2 1.0 0.9
Ingot / WaferSumco Corp 3436 JP NR 642.00 2,081 (32.4) 3.1 0.5 8.2 n.m 2.9 n.m 6.3 n.m 25.5 1.4 1.2 (26.1) (24.7) 2.2 12.8 Renewable Energy Corp ASA REC NO NR 2.48 411 (9.8) (4.1) (6.8) 1.9 n.m 0.4 n.m n.m n.m n.m 0.2 0.2 (27.2) (41.5) (37.6) (25.4) Solarworld AG SWV GR NR 1 47 207 (3 2) (2 8) 6 7 2 3 1 2 0 7 n m n m n m n m 0 2 0 3 (5 7) (56 2) (49 0) (54 7)Solarworld AG SWV GR NR 1.47 207 (3.2) (2.8) 6.7 2.3 1.2 0.7 n.m n.m n.m n.m 0.2 0.3 (5.7) (56.2) (49.0) (54.7) LDK Solar Co Ltd LDK US NR 2.59 375 (15.8) (8.9) (7.6) (0.9) n.m 0.1 n.m 2.9 n.m n.m 0.7 0.5 (12.8) (56.3) (18.0) (38.2) Sino-American Silicon Products Inc5483 TT NR 50.70 758 (4.5) n.a (4.0) n.a n.a n.a n.a n.a n.m 27.0 1.2 n.a (4.3) (15.9) 28.4 8.8 Comtec Solar Systems Group* 712 HK 3 0.93 136 (33.3) 7.7 (14.8) 10.4 n.m 3.1 n.m 5.4 n.m 11.3 0.6 0.6 (12.3) (39.6) (13.1) (13.9) Renesola Ltd SOL US NR 1.33 115 (12.1) (5.7) (12.2) (4.1) n.m n.m n.m n.m n.m n.m 0.2 0.3 (24.4) (52.8) (28.5) (13.1) Green Energy Technology Inc 3519 TT NR 26.70 290 (17.5) n.a (20.5) n.a n.a n.a n.a n.a n.m n.m 0.8 n.a (9.6) (32.2) 13.4 (19.8) Solargiga Energy Holdings 757 HK NR 0.50 144 0.5 2.5 1.9 1.8 0.1 1.6 n.m 1.1 n.m 13.2 0.4 0.4 (24.2) (51.0) (35.9) (35.9) Average (14.2) (1.2) (6.3) 2.8 0.6 1.5 n.a 3.9 n.a 19.2 0.6 0.5 Median (13.2) (2.0) (6.5) 2.1 0.6 1.5 n.a 3.9 n.a 19.2 0.6 0.4
Cell / Module / SystemCell / Module / System Kyocera Corp 6971 JP 2 6,750 16,241 6.7 6.7 8.6 9.5 4.8 5.0 5.6 5.9 15.6 14.2 0.8 0.8 (10.1) (2.7) 5.3 9.0 Motech Industries Inc* 6244 TT 4 48.45 715 (10.5) 0.6 (10.7) 0.5 n.m 0.4 n.m 0.6 n.m n.m 1.2 1.2 7.0 (19.9) 6.6 (8.8) E-Ton Solar Tech Co Ltd 3452 TT NR 14.95 242 2.4 n.a 3.1 n.a 2.9 n.a 6.4 n.a 5.1 n.a 0.3 n.a (3.5) (26.0) 51.8 16.8 Neo Solar Power Corp 3576 TT NR 23.00 333 (3.7) (3.9) (10.0) (3.8) n.m n.m n.m 0.6 n.m n.m 0.8 0.9 3.6 (20.1) 49.4 20.7 SunPower Corp SPWR US NR 5.16 611 (0.4) 1.3 4.3 9.5 n.m 2.5 n.m 5.6 n.m 19.1 0.5 0.5 (5.1) (33.1) (24.7) (17.2) Suntech Power Holdings Co Ltd* STP US 5 1.93 348 (19.5) (10.3) (15.4) (5.9) n.m n.m n.m n.m n.m n.m 0.6 0.9 (23.1) (36.9) (20.6) (12.7) Sharp Corp/Japan 6753 JP 3 391.00 5,462 (15.2) (1.2) (1.6) 0.4 n.m n.m n.m n.m n.m n.m 0.7 0.6 (22.4) (30.9) (47.2) (41.9) Sunways AG SWW GR NR 0.92 20 (2.1) n.a n.a n.a n.a n.a n.a n.a n.m n.m 0.3 n.a (14.4) (51.5) (28.8) (40.0) Hanhwa Solarone Co HSOL US NR 0.94 79 (16.0) (4.7) (10.9) (3.9) n.m n.m n.m n.m n.m n.m 0.1 0.2 (19.7) (44.7) (27.1) (4.3) ( ) ( ) ( ) ( ) ( ) ( ) ( ) ( )Yingli Green Energy Holding Co LtdYGE US 4 2.63 414 (0.5) 4.1 4.0 9.6 n.m 2.0 n.m 7.4 n.m 4.0 0.3 0.3 (23.5) (31.2) (33.6) (30.8) China Sunergy Co Ltd CSUN US NR 1.17 17 (13.2) (13.3) (10.6) (5.6) n.m n.a n.m n.a n.m n.m 0.2 0.3 (26.9) (54.8) (53.0) 4.5 Canadian Solar Inc CSIQ US NR 2.73 119 (2.6) 0.6 (0.9) 2.8 n.m n.m n.m n.m n.m 9.9 0.3 0.3 (15.2) (29.3) 16.2 2.6 Trina Solar Ltd* TSL US 2 5.87 478 (1.2) 4.0 0.1 6.2 n.m 3.4 n.m 8.0 n.m 4.4 0.4 0.4 (10.0) (24.7) (17.2) (12.1) JA Solar Holdings Co Ltd JASO US NR 0.96 162 (5.5) 0.0 3.5 7.8 n.m n.m n.m 2.2 n.m 10.9 0.2 0.0 (30.8) (48.7) (40.7) (28.7) Jinko Solar Holdings Co Ltd JKS US NR 3.73 83 (5.0) (1.2) (2.3) 2.3 n.m n.a n.m n.a n.m n.m 0.1 0.1 (29.6) (52.2) (35.2) (25.4) Gintech Energy Corp 3514 TT NR 35.50 406 (3.2) 6.1 (0.0) 10.8 n.a n.a n.m 3.5 n.m 11.1 0.9 0.8 22.4 (13.2) 42.6 8.7 Average (5.6) (0.8) (2.6) 2.9 3.9 2.7 6.0 4.2 10.4 10.5 0.5 0.5 Median (3.4) 0.3 (0.9) 2.6 3.9 2.5 6.0 4.5 10.4 10.9 0.4 0.4 ( ) ( )
Installer & AssemblersSolon SE SOO1 GR NR 0.10 2.1 n.a n.a n.a n.a n.a n.a n.a n.a n.a n.a n.a n.a 11.6 (60.0) (91.6) (74.1) Aleo Solar AG AS1 GR NR 18.81 308.3 (4.5) (4.8) n.a n.a n.a n.a n.a n.a n.m n.m n.a n.a (10.9) (14.5) 1.2 (12.1) Conergy AG CGYK GR NR 0.54 109.0 (4.4) (2.1) n.a n.a n.a n.a n.m n.m n.m n.m 1.9 2.4 9.1 9.3 123.0 72.1 Sekisui Chemical Co Ltd 4204 JP NR 671.00 4,493.9 2.9 3.2 5.8 6.2 5.6 6.8 8.3 9.0 12.7 10.3 1.0 0.9 (6.7) (2.0) 17.3 5.7 Carmanah Technologies Corp CMH CN NR 0.49 20.4 0.5 4.0 n.a n.a n.a n.a n.m 9.2 n.m 11.3 1.9 1.6 5.4 7.8 26.0 7.8 Solar-Fabrik AG SFX GR NR 2.15 34.7 n.a n.a n.a n.a n.a n.a n.a n.a n.a n.a n.a n.a 4.6 6.7 (4.4) 38.4 SAG Solarstrom AG SAG GR NR 2.06 33.9 0.4 1.2 n.a n.a n.m 1.9 n.m 2.4 41.1 7.6 n.a n.a (13.4) (19.0) (35.0) (37.1) Phoenix Solar AG PS4 GR NR 1.70 15.8 (0.8) 0.5 n.a n.a 0.2 2.8 n.m 2.4 n.m 3.6 0.1 0.1 71.4 (41.0) (40.4) (21.0)
29Source: Bloomberg, *Daiwa forecasts
Ekarat Engineering PCL AKR TB NR 0.77 19.2 n.a n.a n.a n.a n.a n.a n.a n.a n.a n.a n.a n.a (1.3) 8.5 (1.3) 14.9 Solartron PCL SOLAR TB NR 1.59 22.6 n.a n.a n.a n.a n.a n.a n.a n.a n.a n.a n.a n.a (20.1) (26.4) (11.7) (13.6) Average (1.0) 0.4 5.8 6.2 2.9 3.8 8.3 5.8 26.9 8.2 1.2 1.3 Median (0.8) 0.5 5.8 6.2 2.9 3.3 8.3 5.8 26.9 8.2 1.2 1.3

Solar sector: valuations
30Source: Bloomberg, *Daiwa forecasts
DISCLAIMERThis publication is produced by Daiwa Securities Group Inc. and/or its non-U.S. affiliates, and distributed by Daiwa Securities Group Inc. and/or its non-U.S. affiliates, except to the extent expressly provided herein. This publication and the contents hereof are intended for information purposes only, and may be subject to change without further notice. Any use, disclosure, distribution, dissemination, copying, printing or reliance on this publication for any other purpose without our prior consent or approval is strictly prohibited. Neither Daiwa Securities Group Inc. nor any of its respective parent, holding, subsidiaries or affiliates, nor any of its respective directors, officers, servants and employees, represent nor warrant the accuracy or completeness of the information contained herein or as to the existence of other facts which might be significant, and will not accept any responsibility or liability whatsoever for any use of or reliance upon this publication or any of the contents hereof. Neither this publication, nor any content hereof, constitute, or are to be construed as, an offer or solicitation of an offer to buy or sell any of the securities or investments mentioned herein in any country or jurisdiction nor, unless expressly provided, any recommendation or investment opinion or advice. Any view, recommendation, opinion or advice expressed in this publication may not necessarily reflect those of Daiwa Securities Capital Markets Co. Ltd., and/or its affiliates nor any of its respective directors, officers, servants and employees except where the publication states otherwise. This research report is not to be relied upon by any person in making any investment decision or otherwise advising with respect to, or dealing in, the securities mentioned, as it does not take into account the specific investment objectives, financial situation and particular needs of any person.e ed upo by a y pe so a g a y est e t dec s o o ot e se ad s g t espect to, o dea g , t e secu t es e t o ed, as t does ot ta e to accou t t e spec c est e t object es, a c a s tuat o a d pa t cu a eeds o a y pe so
Daiwa Securities Group Inc., its subsidiaries or affiliates, or its or their respective directors, officers and employees from time to time have trades as principals, or have positions in, or have other interests in the securities of the company under research including derivatives in respect of such securities or may have also performed investment banking and other services for the issuer of such securities. The following are additional disclosures.
JapanDaiwa Securities Co. Ltd. and Daiwa Securities Group Inc. Daiwa Securities Co. Ltd. is a subsidiary of Daiwa Securities Group Inc.Investment Banking RelationshipWithin the preceding 12 months, The subsidiaries and/or affiliates of Daiwa Securities Group Inc. * has lead-managed public offerings and/or secondary offerings (excluding straight bonds) of the securities of the following companies: SBI Holdings Inc. (6488 HK); Shunfeng Photovoltaic International Ltd. (1165 HK); RexlotHoldings Limited (555 HK); China Outfitters Holdings Limited (1146 HK); Beijing Jingneng Clean Energy Co. Limited (579 HK); Infraware Inc. (041020 KS).*Subsidiaries of Daiwa Securities Group Inc. for the purposes of this section shall mean any one or more of:• Daiwa Capital Markets Hong Kong Limited• Daiwa Capital Markets Singapore Limited• Daiwa Capital Markets Australia Limited• Daiwa Capital Markets India Private Limited• Daiwa-Cathay Capital Markets Co., Ltd.• Daiwa Securities Capital Markets Korea Co., Ltd.
Hong Kong Hong Kong This research is distributed in Hong Kong by Daiwa Capital Markets Hong Kong Limited (“DHK”) which is regulated by the Hong Kong Securities and Futures Commission. Recipients of this research in Hong Kong may contact DHK in respect of any matter arising from or in connection with this research.Ownership of SecuritiesFor “Ownership of Securities” information, please visit BlueMatrix disclosure Link at https://daiwa3.bluematrix.com/sellside/Disclosures.action.Investment Banking RelationshipFor “Investment Banking Relationship”, please visit BlueMatrix disclosure Link at https://daiwa3.bluematrix.com/sellside/Disclosures.action.Relevant Relationship (DHK)DHK may from time to time have an individual employed by or associated with it serves as an officer of any of the companies under its research coverage.DHK market makingDHK may from time to time make a market in securities covered by this research.y y
SingaporeThis research is distributed in Singapore by Daiwa Capital Markets Singapore Limited and it may only be distributed in Singapore to accredited investors, expert investors and institutional investors as defined in the Financial Advisers Regulations and the Securities and Futures Act (Chapter 289), as amended from time to time. By virtue of distribution to these category of investors, Daiwa Capital Markets Singapore Limited and its representatives are not required to comply with Section 36 of the Financial Advisers Act (Chapter 110) (Section 36 relates to disclosure of Daiwa Capital Markets Singapore Limited’s interest and/or its representative’s interest in securities). Recipients of this research in Singapore may contact Daiwa Capital Markets Singapore Limited in respect of any matter arising from or in connection with the research.
AustraliaThis research is distributed in Australia by Daiwa Capital Markets Stockbroking Limited and it may only be distributed in Australia to wholesale investors within the meaning of the Corporations Act. Recipients of this research in Australia may contact Daiwa Capital Markets Stockbroking Limited in respect of any matter arising from or in connection with the research.O hi f S itiOwnership of SecuritiesFor “Ownership of Securities” information, please visit BlueMatrix disclosure Link at https://daiwa3.bluematrix.com/sellside/Disclosures.action.
IndiaThis research is distributed by Daiwa Capital Markets India Private Limited (DAIWA) which is an intermediary registered with Securities & Exchange Board of India. This report is not to be considered as an offer or solicitation for any dealings in securities. While the information in this report has been compiled by DAIWA in good faith from sources believed to be reliable, no representation or warranty, express of implied, is made or given as to its accuracy, completeness or correctness. DAIWA its officers, employees, representatives and agents accept no liability whatsoever for any loss or damage whether direct, indirect, consequential or otherwise howsoever arising (whether in negligence or otherwise) out of or in connection with or from any use of or reliance on the contents of and/or omissions from this document. Consequently DAIWA expressly disclaims any and all liability for, or based on or relating to any such information contained in or errors in or omissions in this report. Accordingly, you are recommended to seek your own legal, tax or other advice and should rely solely on your own judgment, review and analysis, in evaluating the information in this document. The data contained in this document is subject to change without any prior notice DAIWA reserves its right to modify this report as maybe required from time to time. DAIWA is committed to providing independent recommendations to its Clients and would be happy to provide any information in response to any query from its Clients. This report is strictly confidential and is being furnished to you solely for your information. The information contained in this document should not be reproduced (in whole or in part) or redistributed in any form to any other person We and our group companies affiliates officers directors and employees may from time to time have long or short positions in and buy sell the securities thereof of company(ies) information contained in this document should not be reproduced (in whole or in part) or redistributed in any form to any other person. We and our group companies, affiliates, officers, directors and employees may from time to time, have long or short positions, in and buy sell the securities thereof, of company(ies) mentioned herein or be engaged in any other transactions involving such securities and earn brokerage or other compensation or act as advisor or have the potential conflict of interest with respect to any recommendation and related information or opinion. DAIWA prohibits its analyst and their family members from maintaining a financial interest in the securities or derivatives of any companies that the analyst cover. This report is not intended or directed for distribution to, or use by any person, citizen or entity which is resident or located in any state or country or jurisdiction where such publication, distribution or use would be contrary to any statutory legislation, or regulation which would require DAIWA and its affiliates/ group companies to any registration or licensing requirements. The views expressed in the report accurately reflect the analyst’s personal views about the securities and issuers that are subject of the Report, and that no part of the analyst’s compensation was, is or will be directly or indirectly, related to the recommendations or views expressed in the Report. This report does not recommend to US recipients the use of Daiwa Capital Markets India Private Limited or any of its non – US affiliates to effect trades in any securities and is not supplied with any understanding that US recipients will direct commission business to Daiwa Capital Markets India Private Limited.
TaiwanThis research is distributed in Taiwan by Daiwa-Cathay Capital Markets Co., Ltd and it may only be distributed in Taiwan to institutional investors or specific investors who have signed recommendation contracts with Daiwa-Cathay Capital Markets Co., Ltd in accordance with the Operational Regulations Governing Securities Firms Recommending Trades in Securities to Customers. Recipients of this research in Taiwan may contact Daiwa-Cathay Capital Markets Co., Ltd in respect of any matter arising from or in connection with the research.
PhilippinesThis research is distributed in the Philippines by DBP-Daiwa Capital Markets Philippines, Inc. which is regulated by the Philippines Securities and Exchange Commission and the Philippines Stock Exchange, Inc. Recipients of this research in the Philippines may contact DBP-Daiwa Capital Markets Philippines, Inc. in respect of any matter arising from or in connection with the research. DBP-Daiwa Capital Markets Philippines, Inc. recommends that investors independently assess, with a professional advisor, the specific financial risks as well as the legal, regulatory, tax, accounting, and other consequences of a proposed transaction. DBP-Daiwa Capital Markets Philippines, Inc. may have positions or may be materially interested in the securities in any of the markets mentioned in the publication or may have performed other services for the issuers of such securities.For relevant securities and trading rules please visit SEC and PSE Link at http://www.sec.gov.ph/irr/AmendedIRRfinalversion.pdf and http://www.pse.com.ph/ respectively.

DISCLAIMER (Cont’d)United KingdomThis research report is produced by Daiwa Securities Capital Markets Co., Ltd and/or its affiliates and is distributed by Daiwa Capital Markets Europe Limited in the European Union, Iceland, Liechtenstein, Norway and Switzerland. Daiwa Capital Markets Europe Limited is authorised and regulated by The Financial Services Authority (“FSA”) and is a member of the London Stock Exchange, Chi-X, Eurex and NYSE Liffe. Daiwa Capital Markets Europe Limited and its affiliates may, from time to time, to the extent permitted by law, participate or invest in other financing transactions with the issuers of the securities referred to herein (the “Securities”), perform services for or solicit business from such issuers, and/or have a position or effect transactions in the Securities or options thereof and/or may have acted as an underwriter during the past twelve months for the issuer of such securities. In addition, employees of Daiwa Capital Markets Europe Limited and its affiliates may have positions and effect transactions in such securities or options and may serve as Directors of such issuers. Daiwa Capital Markets Europe Limited may, to the extent permitted by applicable UK law and other applicable law or regulation, effect transactions in the Securities before this material is published to recipients.
This publication is intended for investors who are not Retail Clients in the United Kingdom within the meaning of the Rules of the FSA and should not therefore be distributed to such Retail Clients in the United Kingdom. Should you enter into investment business with Daiwa Capital Markets Europe’s affiliates outside the United Kingdom, we are obliged to advise that the protection afforded by the United Kingdom regulatory system may not apply; in particular, the benefits of the Financial Services Compensation Scheme may not be available.
Daiwa Capital Markets Europe Limited has in place organisational arrangements for the prevention and avoidance of conflicts of interest. Our conflict management policy is available at http://www.uk.daiwacm.com/about-us/corporate-governance-and-regulatory. Regulatory disclosures of investment banking relationships are available at https://daiwa3.bluematrix.com/sellside/Disclosures.action.
United StatesThis report is distributed in the U S by Daiwa Capital Markets America Inc (DCMA) It may not be accurate or complete and should not be relied upon as such It reflects the preparer’s views at the time of its preparation but may not reflect events occurring after its preparation; nor does it reflect DCMA’s views at any time This report is distributed in the U.S. by Daiwa Capital Markets America Inc. (DCMA). It may not be accurate or complete and should not be relied upon as such. It reflects the preparer s views at the time of its preparation, but may not reflect events occurring after its preparation; nor does it reflect DCMA s views at any time. Neither DCMA nor the preparer has any obligation to update this report or to continue to prepare research on this subject. This report is not an offer to sell or the solicitation of any offer to buy securities. Unless this report says otherwise, any recommendation it makes is risky and appropriate only for sophisticated speculative investors able to incur significant losses. Readers should consult their financial advisors to determine whether any such recommendation is consistent with their own investment objectives, financial situation and needs. This report does not recommend to U.S. recipients the use of any of DCMA’s non-U.S. affiliates to effect trades in any security and is not supplied with any understanding that U.S. recipients of this report will direct commission business to such non-U.S. entities. Unless applicable law permits otherwise, non-U.S. customers wishing to effect a transaction in any securities referenced in this material should contact a Daiwa entity in their local jurisdiction. Most countries throughout the world have their own laws regulating the types of securities and other investment products which may be offered to their residents, as well as a process for doing so. As a result, the securities discussed in this report may not be eligible for sales in some jurisdictions. Customers wishing to obtain further information about this report should contact DCMA: Daiwa Capital Markets America Inc., Financial Square, 32 Old Slip, New York, New York 10005 (telephone 212-612-7000).Ownership of SecuritiesFor “Ownership of Securities” information please visit BlueMatrix disclosure Link at https://daiwa3.bluematrix.com/sellside/Disclosures.action. Investment Banking RelationshipsFor “Investment Banking Relationships” please visit BlueMatrix disclosure link at https://daiwa3.bluematrix.com/sellside/Disclosures.action. g p p pDCMA Market MakingFor “DCMA Market Making” please visit BlueMatrix disclosure link at https://daiwa3.bluematrix.com/sellside/Disclosures.action.Research Analyst ConflictsFor updates on “Research Analyst Conflicts” please visit BlueMatrix disclosure link at https://daiwa3.bluematrix.com/sellside/Disclosures.action. The principal research analysts who prepared this report have no financial interest in securities of the issuers covered in the report, are not (nor are any members of their household) an officer, director or advisory board member of the issuer(s) covered in the report, and are not aware of any material relevant conflict of interest involving the analyst or DCMA, and did not receive any compensation from the issuer during the past 12 months except as noted: no exceptions.
Research Analyst CertificationFor updates on “Research Analyst Certification” and “Rating System” please visit BlueMatrix disclosure link at https://daiwa3.bluematrix.com/sellside/Disclosures.action. The views about any and all of the subject securities and issuers expressed in this Research Report accurately reflect the personal views of the research analyst(s) primarily responsible for this report (or the views of the firm producing the report if no individual analysts[s] is named on the report); and no part of the compensation of such analyst(s) (or no part of the compensation of the firm if no individual analyst[s)] is named on the report) was, is, or will be directly or indirectly
l t d t th ifi d ti i t i d i thi R h R trelated to the specific recommendations or views contained in this Research Report.
The following explains the rating system in the report as compared to relevant local indices, based on the beliefs of the author of the report. "1": the security could outperform the local index by more than 15% over the next six months."2": the security is expected to outperform the local index by 5-15% over the next six months."3": the security is expected to perform within 5% of the local index (better or worse) over the next six months."4": the security is expected to underperform the local index by 5-15% over the next six months."5": the security could underperform the local index by more than 15% over the next six months.Additional information may be available upon request.
Japan - additional notification items pursuant to Article 37 of the Financial Instruments and Exchange Law(This Notification is only applicable where report is distributed by Daiwa Securities Co. Ltd.)
If you decide to enter into a business arrangement with us based on the information described in materials presented along with this document, we ask you to pay close attention to the following items. In addition to the purchase price of a financial instrument, we will collect a trading commission* for each transaction as agreed beforehand with you. Since commissions may be included in the purchase price or may not be charged for certain transactions, we recommend that you confirm the commission for each transaction. In some cases, we may also charge a maximum of ¥ 2 million (including tax) per year as a standing proxy fee for our deposit of your securities, if you are a non-resident of Japan. For derivative and margin transactions etc., we may require collateral or margin requirements in accordance with an agreement made beforehand with you. Ordinarily in such cases, the amount of the transaction will be in excess of the required collateral or margin requirements. There is a risk that you will incur losses on your transactions due to changes in the market price of financial instruments based on fluctuations in interest rates, exchange rates, stock prices, real estate prices, commodity prices, and others. In addition, depending on the content of the transaction, the loss could exceed the amount of the collateral or margin requirements. There may be a difference between bid price etc. and ask price etc. of OTC derivatives handled by us. Before engaging in any trading, please thoroughly confirm accounting and tax treatments regarding your trading in financial instruments with such experts as certified public accountants. *The amount of the trading commission cannot be stated here in advance because it will be determined between our company and you based on current market conditions and the content of each transaction etc.
When making an actual transaction, please be sure to carefully read the materials presented to you prior to the execution of agreement, and to take responsibility for your own decisions regarding the signing of the agreement with us.
Corporate Name: Daiwa Securities Co. Ltd. Financial instruments firm: chief of Kanto Local Finance Bureau (Kin-sho) No.108
Memberships: Japan Securities Dealers Association, Financial Futures Association of JapanJapan Securities Investment Advisers AssociationJapan Securities Investment Advisers AssociationType II Financial Instruments Firms Association