solar park integration project - zitholelezitholele.co.za/projects/12726 - eia for solar...
TRANSCRIPT

Solar Park Integration Project
Bird Impact Assessment Study
Preliminary Desk Top Report
OCTOBER 2012
Chris van Rooyen
Albert Froneman
Solar Park Integration Project: Bird Impact Assessment Study, Preliminary Report
2 of 30
EXECUTIVE SUMMARY
Eskom is planning to construct a 100 MW Concentrating Solar Power (CSP) plant near
Upington in the Northern Cape. The electricity generated at the Upington Solar Park (by IPP’s
and Eskom) will need to be integrated into the National Grid. The purpose of the Solar Park
Integration Project is to address the major infrastructural investments that Eskom will need to
make in order to tie the Upington Solar Park into the National Grid. The proposed Solar Park
Integration Project entails the construction of a substation at the Upington Solar Park, 400kV
transmission lines to the east and south of Upington to feed the electricity into Eskom’s
National Grid as well as the construction of a number of 132kV power lines inter-linking the IPP
solar plants with the Eskom Grid and distributing the power generated to Upington. This desk
top report deals with the potential impact on birds of the following proposed infrastructure:
Solar Park Substation (132kV and 400kV);
2 x (±) 125km 400kV lines from Solar Park to Aries substation (southwest of
Kenhardt);
1 x (±) 70km 400kV line from Solar Park to Nieuwehoop substation (northeast of
Kenhardt);
1 x (±) 200km 400kV line from Solar Park to Ferrum substation (Kathu);
3 x 132kV lines for the Eskom CSP Site;
3 x 132kV lines for the IPP in Solar Park;
5 x 132kV lines for the DoE Solar Park; and
2x (±) 25km 132kV lines to Gordonia Substation (Upington).
The following potential impacts on avifauna were identified:
Collisions with the earthwire of the proposed transmission lines
Displacement due to habitat destruction
Displacement due to disturbance
COLLISIONS
The most obvious candidates for collision mortality on the proposed power lines are Ludwig’s
Bustards followed by Kori Bustards. For Ludwig’s Bustard, this risk is particularly relevant in
Nama-Karoo, as that is the preferred habitat for the species. Kori Bustards are also likely
candidates for collisions, particularly in the Kalahari Duneveld and Eastern Kalahari Bushveld,
where the species are likely to be most numerous. Secretarybirds might also be at risk, with
the highest risk in the Kalahari Duneveld and Eastern Kalahari Bushveld. The highest risk for
Black Stork will be where the alignments cross rivers, particularly the Orange River. Flamingos
might be at risk near water bodies, particularly salt pans. Overall, the impact of collisions was
rated as high.
DISPLACEMENT DUE TO HABITAT DESTRUCTION
In the present instance, the biggest risk of displacement of Red Data species due to habitat
destruction is likely to be in the Eastern Kalahari Bushveld, as the construction of the line in
that habitat may require the removal of large trees, which are important breeding and roosting
substrate for large raptors and vultures. This could result in temporary or permanent local
displacement of these species. All three proposed Solar Park Substation sites are situated in
low karroid shrubland which forms part of the Bushmanland bioregion, and does not contain
unique features that will make it critically important for power line sensitive Red Data species.
It is not envisaged that any Red Data species will be permanently displaced by the habitat
transformation that will take place. The proposed construction of the new substation should
therefore have a low displacement impact on Red Data species, irrespective of which of the
alternative sites is used. Overall, the impact of displacement due to habitat destruction was
rated low.
Solar Park Integration Project: Bird Impact Assessment Study, Preliminary Report
3 of 30
DISPLACEMENT DUE TO DISTURBANCE
As far as the natural habitat is concerned, the biggest potential disturbance impact is likely to
be on large raptors and vultures in the Eastern Kalahari Bushveld, as breeding populations of
these species are most numerous in that habitat due to the presence of large trees which is
utilised for roosting and breeding. Transmission lines are much favoured by large raptors as
breeding substrate. Should any new lines be constructed next to existing lines, the
construction activities could lead to temporary displacement of breeding eagles, resulting in
breeding failure in a particular season, or even permanent abandonment of a breeding
territory. Overall, the impact of displacement due to disturbance was rated low.
PREFERRED ALTERNATIVE
Each of the transmission line alternatives were assessed for potential bird impacts. The
following alternatives emerged as the preferred alternatives:
Aries Solar 3
Nieuwehoop Solar 2
Ferrum Solar 3 Alternative
MITIGATION
It is not the objective of this desk top report to attempt to demarcate all sections of potential
power line for all the alternative corridors that would need to be mitigated for potential
collisions. This can only be done once the final alignment has been finalized through the EIA
process, through a combination of physical inspection and analysis of satellite imagery. At that
stage, specific spans are demarcated for the fitting of anti-collision devices, based on a variety
of factors (mentioned earlier), and at that stage minor deviations can still be effected. This is
also the stage when site specific measures are suggested to prevent displacement due to
habitat destruction or disturbance for example what areas access roads should avoid e.g. to
avoid sensitive raptor breeding areas. At this stage of the process, the most important
recommendation flowing from this study is a rating of the different alternatives from a bird
impact perspective, to inform the final selection of an alignment.
CONCLUSIONS
The conclusions reached in this desk top report is subject to further investigations on the
ground, and may change should new information come to light during field investigations.

Solar Park Integration Project: Bird Impact Assessment Study, Preliminary Report
4 of 30
1 Introduction
ESKOM has appointed Zitholele Consulting to undertake an Environmental Impact Assessment
(EIA) for the proposed in Solar Park Integration Project. Zitholele Consulting has appointed
Chris van Rooyen Consulting as specialist to investigate the potential bird related impacts
associated with the proposed new transmission lines. The infrastructure which forms the
subject of this report is tabled below:
Table 1: Scope of work
EA APPLICATION
PROCESS DESCRIPTION OF THE PROPOSED ACTIVITIES
S&EIR No 1
Solar Park substation (400kV and 132kV);
2 x (±) 125km 400kV lines from Solar Park to Aries substation (southwest of Kenhardt) and associated feeder bays;
1 x (±) 70km 400kV line from Solar Park to Nieuwehoop substation (northeast of Kenhardt) and associated feeder bays
S&EIR No 2 1 x (±) 200km 400kV line from Solar Park to Ferrum substation (Kathu) and associated
feeder bays.
BA No 1 3 x 132kV lines for the Eskom CSP Site and 2 x 20MVA Transformers at Solar Park site.
BA No 2 3 x 132kV lines for the IPP in Solar Park.
BA No 3 5 x 132kV lines for the DoE Solar Park; and
2x (±) 25km 132kV lines to Gordonia Substation (Upington).
A full project description of the proposed infrastructure is provided in Chapter 3 of the Final
Scoping Reports (Zitholele 2012a and 2012b).
2 Background and brief
The terms of reference for this preliminary desk top specialist study are as follows:
Describe the affected environment.
Indicate how birdlife will be affected.
Discuss gaps in baseline data.
List and describe the expected impacts.
Assess the expected impacts.
Evaluate the proposed alignments and indicate a preferred alignment from a bird impact
perspective.
Provide proposals for mitigation of identified impacts.
3 Study Approach
3.1 Sources of information
The study made use of the following data sources:
Bird distribution data of the Southern African Bird Atlas Project1 (SABAP1) and 2 (SABAP
2) was obtained (http://sabap2.adu.org.za/), in order to ascertain which species occur in
the study area. A separate data set was obtained for each quarter degree grid cell (QDGC)
which overlapped with the proposed corridors. QDGCs are grid cells that cover 15 minutes
of latitude by 15 minutes of longitude (15. × 15.), which correspond to the area shown on
a 1:50 000 map. SABAP1 covers the late 1980s to early 1990s.The SABAP2 data covers
the period 2007 to present.

Solar Park Integration Project: Bird Impact Assessment Study, Preliminary Report
5 of 30
The Important Bird Areas project data was consulted to get an overview of important bird
areas and species diversity in the study area (Barnes 1998).
The power line bird mortality incident database of the Endangered Wildlife Trust (1996 to
2007) was consulted to determine which of the species occurring in the study area are
typically impacted upon by power lines (Jenkins et al 2010).
Land cover data for the study area was obtained from the National land Cover Project
(NLCP) (updated version 2009), obtained from the South African National Biodiversity
Institute.
Data on biomes, bioregions, vegetation types and rivers in the study area was obtained
from the Vegetation Map of South Africa (Mucina & Rutherford 2006).
Data on the alignment of existing high voltage lines were obtained from Eskom.
The conservation status of all species considered likely to occur in the area was
determined as per the most recent iteration of the southern African Red Data list for birds
(Barnes 2000), and the most recent and comprehensive summary of southern African bird
biology (Hockey et al. 2005).
The author has travelled and worked extensively in the Northern Cape Province since
1996. Personal observations have therefore also been used to supplement the data that is
available from SABAP, and has been used extensively in forming a professional opinion of
likely bird/habitat associations.
3.2 Limitations & assumptions
This study made the assumption that the above sources of information are reliable. However,
the following factors may potentially detract from the accuracy of the predicted results:
Although the NLCP data was updated in 2009, the land cover situation on the ground may
have changed in places since then.
Different levels of survey effort for QDGCs in both the SABAP1 and SABAP2 coverage
means that the reporting rates of species may not be an accurate reflection of relative
densities in QDGCs that were sparsely covered to date. The reporting rates were therefore
not treated as a realistic reflection of the actual densities, but merely as a guideline for the
potential presence of a specific species. Strong reliance was placed on professional
judgment (see 3.1 above).
Predictions in this study are based on experience of these and similar species in different
parts of South Africa. Bird behaviour can never be entirely reduced to formulas that will
hold true under all circumstances; therefore professional judgment played an important
role in this assessment. It should also be noted that the impact of power lines on birds has
been well researched with a robust body of published research stretching over thirty years.
It is important to note that, although the predicted impacts are mostly concerned with Red
Data species, the power line sensitive non-Red Data species will also benefit from the
proposed mitigation measures as they share the same habitat and face the same potential
impacts as the Red Data species.
This is a desk top report. The findings of this report are preliminary and will be adapted
where needed by incorporating additional data that will become available through field
investigations on the ground.

Solar Park Integration Project: Bird Impact Assessment Study, Preliminary Report
6 of 30
4 Study area
The study area extends from from Kathu to Upington, and from Upington to north-east and
south-west of Kenhardt in the Northern Cape Province (see Figure 1 below). The study area
does not overlap with any Important Bird Areas, the closest IBA is the Augrabies Falls National
Park (SA029), which is situated approximately 30km north-west at its closest point to any of
the alignments. The next closest IBA, Mattheus Gat Conservation Area (SA034), is situated
approximately 86km west at its closest point (Barnes 1998).

Figure 1: EIA corridor alternatives (Zitholele 2012a and 2012b)

4.1 Description of vegetation types
The study area extends over two biomes, namely Savanna and Nama Karoo, with small
sections falling within Azonal Vegetation (Mucina & Rutherford 2006), mostly along the Orange
River and at salt pans. The study area further falls within three bioregions, namely Eastern
Kalahari Bushveld, Kalahari Duneveld and Bushmanland (see Figures 2 and 3 below). Table 1
below provides a break-down of the biomes, bioregions and vegetation types that are present
within the combined surface area that is taken up by a 1km corridor along all the different
transmission line alignments (Mucina & Rutherford 2006).
Table 2: Biomes, bioregions and vegetation types present in the various corridors
Biomes, bioregions and vegetation types Mucina & Rutherford 2006 Surface area (ha)
Azonal Vegetation 6311
Alluvial Vegetation 5933
Lower Gariep Alluvial Vegetation 5933
Inland Saline Vegetation 378
Bushmanland Vloere 1
Southern Kalahari Salt Pans 377
Nama-Karoo Biome 212357
Bushmanland Bioregion 212357
Bushmanland Arid Grassland 138440
Bushmanland Basin Shrubland 6861
Kalahari Karroid Shrubland 58290
Lower Gariep Broken Veld 8766
Savanna Biome 199744
Eastern Kalahari Bushveld Bioregion 127270
Gordonia Plains Shrubland 63408
Kathu Bushveld 24062
Koranna-Langeberg Mountain Bushveld 8023
Olifantshoek Plains Thornveld 31777
Kalahari Duneveld Bioregion 72474
Gordonia Duneveld 72474
Grand Total 418411

Figure 2: Biomes in the study area (Mucina & Rutherford 2006)
Savanna
Nama-Karoo
Azonal

Solar Park Integration Project: Bird Impact Assessment Study, Preliminary Report
10 of 30
Figure 3: Bioregions in the study area (Mucina & Rutherford 2006)
Eastern Kalahari Bushveld
Kalahari Duneveld
Bushmanland

Solar Park Integration Project: Bird Impact Assessment Study, Preliminary Report
11 of 30
Figure 4: Satellite image of the proposed Solar Park CSP sites and associated substation alternatives (sites 1, 5 and 6) and 132kV power line
alternatives.

Vegetation structure, rather than the actual plant species, is more significant for bird species
distribution and abundance (in Harrison et al 1997). Therefore, the vegetation description
below does not focus on lists of plant species, but rather on factors which are relevant to bird
distribution. The description of the vegetation types occurring in the study area largely follows
the classification system presented in the Atlas of southern African birds (Harrison et al 1997).
The criteria used to amalgamate botanically defined vegetation units, or to keep them separate
were (1) the existence of clear differences in vegetation structure, likely to be relevant to
birds, and (2) the results of published community studies on bird/vegetation associations. It is
important to note that no new vegetation unit boundaries were created, with use being made
only of previously published data. The description of vegetation presented in this study
therefore concentrates on factors relevant to the bird species present, and is not an exhaustive
list of plant species present.
Savanna (or woodland) is defined as having a grassy under-storey and a distinct woody
upper-storey of trees and tall shrubs. Soil types are varied but are generally nutrient poor.
The savanna biome contains a large variety of bird species (it is the most species-rich
community in southern Africa) but very few bird species are restricted to this biome. In the
study area, the savanna biome contains two bioregions, namely Eastern Kalahari Bushveld and
Kalahari Duneveld. Eastern Kalahari Bushveld (which forms part of the Central Kalahari
vegetation type in Harrison et al 1997) is characterised by sparse to dense shrubland or
parkland woodland dominated by semi-deciduous Acacia, Boscia albitrunca, Terminalia sericea
and Lonchocarpus nelsii trees and Acacia and Grewia shrubs on deep Kalahari sands. Tall trees
are fairly numerous, mostly Acacia erioloba (Camelthorn). Grass cover is variable dependent
on rain, grazing and fires. There are no watercourses, but there are fossil river valleys and
many pans on calcrete, which irregularly hold water. The climate is characterised by hot
summer and cold winter seasons; rainfall takes place in summer (average 450-550mm), but
variable between years. Kalahari Duneveld (which forms part of the Southern Kalahari
vegetation type in Harrison et al 1997), is on deep Kalahari sands with rolling dunes, and
consists of open shrubland with ridges of grassland and semi-deciduous Acacia and Boscia
albitrunca trees along intermittent fossil watercourses and interdunal valleys. Tall trees are
generally absent, except along some fossil rivers. Grass cover is very variable dependent on
rain and grazing. Summers are hot, winters cold, rainfall very variable averaging <250mm and
mostly in summer.
The Nama-Karoo vegetation largely comprises low shrubs and grasses; peak rainfall occurs in
summer – in the extremely arid region of the study area this is usually less than 130mm per
annum. Trees e.g. Acacia karroo and alien species such as Mesquite Prosopis glandulosa are
mainly restricted to watercourses where fairly luxurious stands can develop, especially along
the Orange River. In the study area, the Nama-Karoo contains one bioregion, namely
Bushmanland. The vegetation structure consists mainly of extensive to irregular plains
sparely vegetated by grassland dominated by white grasses (Stipagrostis species) giving the
landscape the character of semi-desert “steppe”, with a few low shrubs in places. In some
sections, mostly near the Orange River, koppies and low mountains are present with sparse
vegetation dominated by shrubs and dwarf shrubs, with groups of widely scattered low trees
e.g. Aloe dichotoma and Acacia mellifera. Large trees are generally absent.
4.2 Description of bird habitat classes
Whilst much of the distribution and abundance of the bird species in the study area can be
explained by the description of the biomes, bioregions and vegetation types above, it is as
important to examine the modifications which have changed the natural landscape, and which
may have an effect on the distribution of power line sensitive species. These are sometimes
evident at a much smaller spatial scale than the biome types, and are determined by a host of
factors such as vegetation type, topography, land use and man-made infrastructure. For
purposes of the analysis in this report, bird habitat classes were defined from an avifaunal Red
Data power line sensitive perspective:

Solar Park Integration Project: Bird Impact Assessment Study, Preliminary Report
13 of 30
4.2.1 Eastern Kalahari Bushveld
This habitat class is described above under 4.1 and is of importance for a variety of Red Data
power line sensitive species. The Eastern Kalahari Bushveld is particularly rich in large raptors,
and in the study area it forms the stronghold of Red Data species such as White-backed
Vulture Gyps africanus, Martial Eagle Polemaetus bellicosus, Tawny Eagle Aquila rapax,
Bateleur Terathopius ecaudatus and Lappet-faced Vulture Torgos tracheliotis. All these species
require large trees for breeding and roosting, and the multitude of large Acacia erioloba trees
is ideal for that purpose. Cape Vulture Gyps coprotheres may also occur sparsely, although
they do not breed in the area. Apart from Red Data species, it also supports several non-Red
Data large raptor species, such as the Brown Snake Eagle Circaetus cinereus, Black-chested
Snake Eagle Circaetus pectoralis, and in mountainous habitat (such as the Langeberg near
Olifantshoek), Verreaux’s Eagle Aquila verreauxii. A multitude of smaller raptor species also
occur in Eastern Kalahari Bushveld, as well as the large terrestrial Red Data Secretarybird
Sagittarius serpentarius and Kori Bustard Ardeotis kori. Potential impacts that could result due
to the power line in this habitat are collisions with the earthwire (Secretarybird and Kori
Bustard) and displacement of breeding raptors and vultures due to habitat destruction.
4.2.2 Kalahari Duneveld
This habitat class is described above under 4.1 and is also of importance for the same suite of
power line sensitive species described under 4.2.1. However, the scarcity of large trees means
that large breeding raptors and vultures are more sparsely distributed. The habitat is very
suitable for Secretarybird, as the species generally breeds in small trees and forages in open
duneveld. Kori Bustard is also common in this habitat, while Ludwig’s Bustard Neotis ludwigii
occurs sporadically. Black Harrier Circus maurus occurs sparsely as a non-breeding migrant.
The major expected impact in this habitat is collisions with the earthwire (Secretarybird, Kori
Bustard and Ludwig’s Bustard), and to a lesser extent displacement due to disturbance and
habitat destruction.
4.2.3 Bushmanland
This habitat class is described above under 4.1. The Karoo vegetation types support a
particularly high diversity of bird species endemic to Southern Africa, particularly in the family
Alaudidae (Larks)(Harrison et al 1997). Its avifauna typically comprises ground-dwelling
species of open habitats. Many typical karroid species are nomads, able to use resources that
are patchy in time and space, especially enhanced conditions associated with rainfall (Barnes
1998). Power line sensitive Red Data species associated with Bushmanland are mainly large
terrestrial species, in particular the nomadic Ludwig’s Bustard, which may occur in flocks
following rainfall events, and to a lesser extent Kori Bustard. Martial Eagle and Black-chested
Snake-Eagle occurs sparsely. Koppies and inselbergs provide breeding habitat for Lanner
Falcon Falco biarmicus, Peregrine Falcon Falco peregrinus, Verreauxs Eagle Aquila verrauxii
and Black Stork Ciconia nigra. Black Harrier Circus maurus occurs sparsely as a non-breeding
migrant. The major envisaged impact is collisions with the earthwire (mainly large terrestrial
species).
4.2.4 Waterbodies and rivers
Waterbodies and rivers are of specific importance to a variety of Red Data power line sensitive
species in this arid study area. The perennial Orange River flows through the study area, and
the river channel, pools of water and riverine islands with riparian thickets, reed beds, flooded
grasslands and sandbanks provide habitat for a multitude of waterbirds, including the Red Data
Black Stork Ciconia nigra. The non-Red Data African Fish-Eagle Haliaeetus vocifer occurs
commonly along the river. An important feature of the arid landscape where the proposed
power lines are located is the presence of pans. Pans are endorheic wetlands having closed
drainage systems; water usually flows in from small catchments but with no outflow from the
pan basins themselves. They are characteristic of poorly drained, relatively flat and dry

Solar Park Integration Project: Bird Impact Assessment Study, Preliminary Report
14 of 30
regions. Water loss is mainly through evaporation, sometimes resulting in saline conditions,
especially in the most arid regions. Water depth is shallow (<3m), and flooding
characteristically ephemeral (Harrison et al. 1997). Pans are important for a variety of non-Red
Data waterbirds, and in the study area specifically for the Red Data Greater Flamingo
Phoenicopterus roseus and Lesser Flamingo Phoenicopterus minor. Pans, dams and pools of
water with exposed sandbanks are also used by large raptors for drinking and bathing.
Ephemeral drainage lines are also corridors for woodland, which Kori Bustard often associate
with, and occasionally, after good rains when pools form in the channels, it act as a draw card
for waterbirds. During such times, small birds are attracted to the water, which in turn may
attract Lanner Falcons and other raptors. The major envisaged impact is collisions with the
earthwire (waterbirds and to a lesser extent raptors).
4.2.5 Transmission lines
Transmission lines are an important roosting and breeding substrate for large raptors in the
study area. Existing transmission lines are used extensively by large raptors e.g. in 2005 the
author did an aerial survey of the Ferrum – Garona 275kV line together with Eskom, and found
a total of 19 Martial Eagle and 7 Tawny Eagle nests on transmission line towers (Van Rooyen
2007). Transmission lines therefore hold a special importance for large raptors. Should any
new lines be constructed next to existing lines, the construction activities could lead to
temporary displacement of breeding eagles, resulting in breeding failure in a particular season,
or even permanent abandonment of a breeding territory.
4.2.6 Low impact areas
The proposed corridors run through several types of habitat which would generally not attract
power line sensitive Red Data species. For purposes of the analysis, these have all been
grouped together under low impact areas. These are degraded areas, mines, urban/industrial
areas, agricultural areas along the Orange River (mostly irrigated vineyards) and major roads.
No significant impacts on power line sensitive Red Data species are expected in these areas.
4.2 Power line sensitive species occurring in the study area
A total of 18 Red Data have to date been recorded by SABAP1 and SABAP2 in the QDGCs that
are bisected by the various alignments (see Table 3). Vagrants are indicated with an asterisk.
For each species, the potential for occurring in a specific habitat class was indicated, as well as
the potential impact most likely associated with this specific species.

Table 3: Red Data species recorded by SABAP1 and SABAP2 in the study area
NT=Near threatened V=Vulnerable
Name Scientific name Status Eastern Kalahari Bushveld
Kalahari Duneveld
Bushmanland Waterbodies
and rivers Transmission
lines Low impact
areas Collisions
Displacement through
disturbance
Displacement through habitat
destruction
Bateleur Terathopius
ecaudatus V x x
x x x
Black Harrier Circus maurus V
x x
x
Black Stork Ciconia nigra NT
x
x
Blue Crane* Anthropoides
paradiseus V x
x
x
Cape Vulture Gyps coprotheres V x
x
x x
Corn Crake* Crex crex V x
x
Greater Painted-snipe* Rostratula
benghalensis NT
x
x x
Kori Bustard Ardeatis kori V x x x
x
Lanner Falcon Falco biarmicus NT x x x
x
x x
Lappet-faced Vulture Torgos tracheliotis V x x
x
x x x
Lesser Kestrel Falco naumanni V x x x
Ludwig's Bustard Neotos ludwigii V
x x
x
Martial Eagle Polemaetus
bellicosus V x x x
x x x
Peregrine Falcon Falco peregrinus NT
x
x x
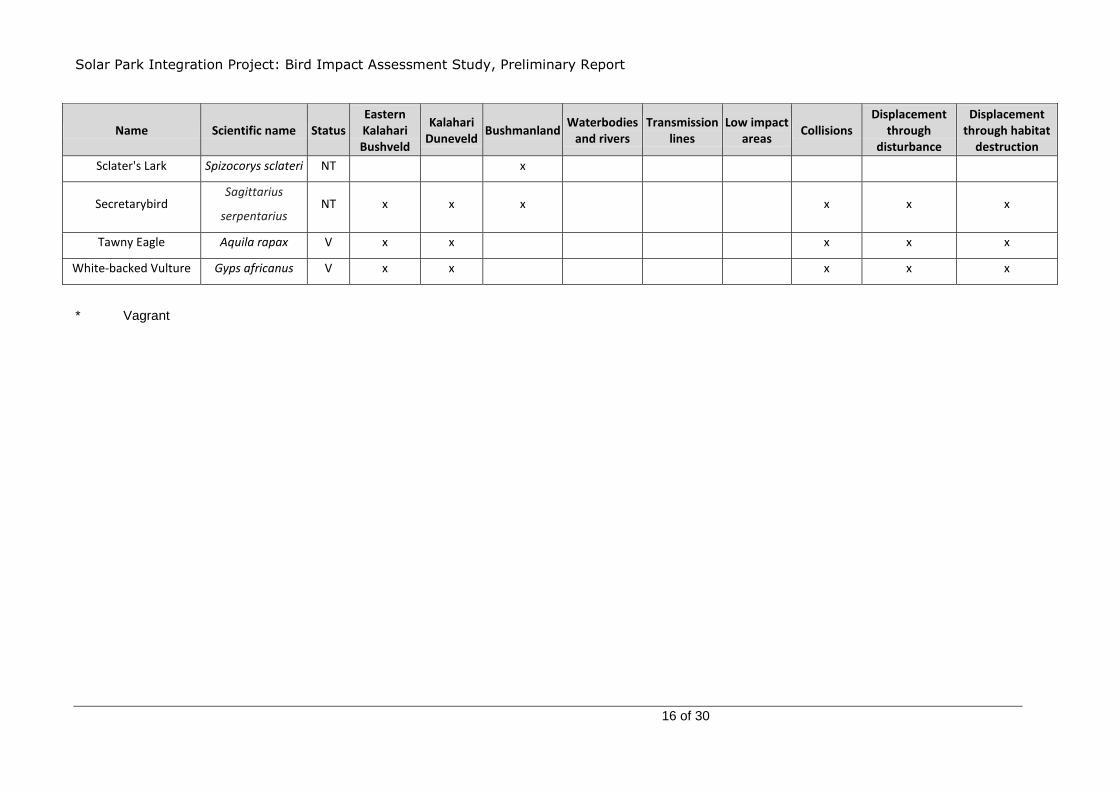
Solar Park Integration Project: Bird Impact Assessment Study, Preliminary Report
16 of 30
Name Scientific name Status Eastern Kalahari Bushveld
Kalahari Duneveld
Bushmanland Waterbodies
and rivers Transmission
lines Low impact
areas Collisions
Displacement through
disturbance
Displacement through habitat
destruction
Sclater's Lark Spizocorys sclateri NT
x
Secretarybird Sagittarius
serpentarius NT x x x
x x x
Tawny Eagle Aquila rapax V x x
x x x
White-backed Vulture Gyps africanus V x x
x x x
* Vagrant

5 Selecting a preferred corridor for the transmission lines
One of the main objectives of this study is to arrive at a preferred corridor for the proposed
transmission power lines, from an avifaunal interaction perspective. Chapter 4 of the Final
Scoping Reports (Zitholele 2012a and 2012b) provides a description of the various
transmission line corridor alternatives that were considered for this study (see also Figure 1
above). The methodology that was followed to select a preferred corridor alternative is outlined
below.
5.1 Methodology
The potential for interaction with the proposed power line was assessed for each of the Red
Data species listed in Table 3. This was done by assessing the probability of each potential
impact (collisions, displacement through disturbance and displacement through habitat
destruction) occurring, for each species, within each of the described habitat classes. The
following probability scale was used: 1 = low, 2 = medium, 3 = high. Each habitat class
therefore received a risk score for each species. The total risk score for a habitat class was
calculated as the sum of the various individual species scores for that habitat class. Table 4
below gives the risk scores for each of the habitat classes:
Table 4: Risk scores for each habitat class
Habitat class Risk score
Eastern Kalahari Bushveld 62
Kalahari Duneveld 51
Bushmanland 25
Waterbodies & rivers 5
Transmission lines 30
Low impact 0
The risk scores in Table 4 were incorporated into a formula to arrive at a risk rating for each
1km wide corridor alternative. The surface area of a corridor that intersected with a habitat
class was calculated. Buffers were designed as follows for the following habitat classes:
Waterbodies and rivers: A buffer of 250m was drawn around waterbodies, which were
identified from the National Land Cover Project (2009). Rivers (including alluvial
vegetation) were identified from the Vegetation Map of South Africa (Mucina & Rutherford
2006), and also buffered by 250m. The perennial Orange River was buffered, as well as
two large ephemeral rivers, namely the Ga-Mogara River near Kathu and the Hartbees
River in the extreme south-west of the study area, on the assumption that the latter two
rivers may at times hold water after rains.
Existing transmission lines: A buffer of 200m was drawn around existing transmission
lines.
Low impact areas: Degraded areas, mines, urban/industrial areas, agricultural areas along
the Orange River (mostly irrigated vineyards) and major roads were identified from the
National Land Cover Project (2009). A buffer of 100m was drawn around major roads.
The risk rating for a power line corridor alternative was calculated by multiplying the
surface area of each habitat class that overlaps with the 1km wide corridor with the risk score
for that habitat class. The risk ratings of the respective corridors are listed in Table 5 below.
The corridors that have emerged with the lowest risk scores are highlighted in green.

Solar Park Integration Project: Bird Impact Assessment Study, Preliminary Report
18 of 30
Table 5: Risk ratings of the alternative corridors
Corridor Risk Rating
Aries Solar 1 122
Aries Solar 2 109
Aries Solar 3 105
Ferum Solar 1 462
Ferum Solar 2 482
Ferum Solar 3 491
Ferum Solar 3 alt 455
Nieuwehoop Solar 1 66
Nieuwehoop Solar 2 56
Nieuwehoop Solar 3 59
Figure 5: A map indicating the corridors that have emerged with the lowest ratings from a bird
impact assessment perspective.
6 Description of expected impacts
Because of their size and prominence, electrical infrastructures constitute an important
interface between wildlife and man. Negative interactions between wildlife and electricity
structures take many forms, but two common problems in southern Africa are electrocution of
birds (and other animals) and birds colliding with power lines. (Ledger and Annegarn 1981;
Ledger 1983; Ledger 1984; Hobbs and Ledger 1986a; Hobbs and Ledger 1986b; Ledger,
Hobbs and Smith, 1992; Verdoorn 1996; Kruger and Van Rooyen 1998; Van Rooyen 1998;
Kruger 1999; Van Rooyen 1999; Van Rooyen 2000).
Solar Park Integration Project: Bird Impact Assessment Study, Preliminary Report
19 of 30
6.1 Electrocutions
Electrocution refers to the scenario where a bird is perched or attempts to perch on the
electrical structure and causes an electrical short circuit by physically bridging the air gap
between live components and/or live and earthed components (van Rooyen 2004). The
electrocution risk is largely determined by the pole/tower design. Several tower design
alternatives have been proposed for this project, which are illustrated and discussed in the
Final Scoping Reports (Zitholele 2012a and 2012b). Potential tower types that could be utilised
are self-supporting towers, cross-rope suspension towers and guyed-V towers. The topography
will largely dictate the type of tower that will be used. Due to the large size of the
clearances on overhead lines of 400kV, electrocutions are ruled out as even the
largest birds cannot physically bridge the gap between energised and/or energised
and earthed components.
A mono-pole steel pole will be used for the new 132kV lines that will link the new 400kV
transmission lines into the grid from the new Solar Park Substation. Clearance between phases
on the same side of the pole structure is approximately 2.2m for this type of design, and the
clearance on strain structures is 1.8m. This clearance should be sufficient to prevent phase –
phase electrocutions of birds on the towers. The length of the stand-off insulators is
approximately 1.5m. If very large species attempts to perch on the stand-off insulators, they
are potentially able to touch both the conductor and the earthed pole simultaneously
potentially resulting in a phase – earth electrocution. This is particularly likely when more than
one bird attempts to sit on the same pole, which is an unlikely occurrence, except with
vultures. However, the likelihood of vultures occurring at the CSP site is remote and
the risk is therefore regarded as negligible.
In summary it can be stated that the risk of electrocution posed to Red Data species by the
new power line infrastructure is likely to be negligible. This issue will again be investigated
when the field work is conducted, but no impacts of any significance are envisaged at this
stage.
6.2 Collisions
Collisions are probably the biggest single threat posed by transmission lines to birds in
southern Africa (van Rooyen 2004). Most heavily impacted upon are bustards, storks, cranes
and various species of waterbirds. These species are mostly heavy-bodied birds with limited
manoeuvrability, which makes it difficult for them to take the necessary evasive action to avoid
colliding with power lines (van Rooyen 2004, Anderson 2001).
Anderson (2001) summarizes collisions as a source of avian mortality as follows:
“The collision of large terrestrial birds with the wires of utility structures, and especially power
lines, has been determined to be one of the most important mortality factors for this group of
birds in South Africa (Herholdt 1988; Johnsgard 1991; Allan 1997). It is possible that the
populations of two southern African endemic bird species, the Ludwig’s Bustard Neotis ludwigii
and Blue Crane Anthropoides paradiseus, may be in decline because of this single mortality
factor (Anderson 2000; McCann 2000). The Ludwig’s Bustard (Anderson 2000) and Blue Crane
(McCann 2000) are both listed as “vulnerable” in The Eskom Red Data Book of Birds of South
Africa, Lesotho & Swaziland (Barnes 2000) and it has been suggested that power line collisions
is one of the factors which is responsible for these birds’ present precarious conservation
status.
Collisions with power lines and especially overhead earth-wires have been documented as a
source of mortality for a large number of avian species (e.g. Beaulaurier et al, 1982;
Bevanger 1994, 1998). In southern Africa, this problem has until recently received only
limited attention. Several studies however have identified bird collisions with power lines as a
potentially important mortality factor (for example, Brown & Lawson 1989; Longridge 1989).

Solar Park Integration Project: Bird Impact Assessment Study, Preliminary Report
20 of 30
Ledger et al, (1993), Ledger (1994) and Van Rooyen & Ledger (1999) have provided overviews
of bird interactions with power lines in South Africa. Bird collisions in this country have been
mainly limited to Greater and Lesser Flamingos, various species of waterbirds (ducks, geese,
and waders), Stanley’s (Denham’s) Neotis denhami and Ludwig’s Bustards, White Storks
Ciconia ciconia, and Wattled Grus carunculatus, Grey Crowned Balearica regulorum and Blue
Cranes (for example, Jarvis 1974; Johnson 1984; Hobbs 1987; Longridge 1989; Van Rooyen &
Ledger (1999)). Certain groups of birds are more susceptible to collisions, namely the species
which are slow fliers and which have limited maneuverability (as a result of high wing loading)
(Bevanger 1994). Birds which regularly fly between roosting and feeding grounds, undertake
regular migratory or nomadic movements, fly in flocks, or fly during low-light conditions are
also vulnerable. Other factors which can influence collision frequency include the age of the
bird (younger birds are less experienced fliers), weather factors (decreased visibility, strong
winds, etc.), terrain characteristics and power line placement (lines that cross the flight paths
of birds), power line configuration (the larger structures are more hazardous [for collisions,
with electrocutions the opposite is the case]), human activity (which may cause birds to panic
and fly into the overhead lines), and familiarity of the birds with the area (therefore nomadic
Ludwig’s Bustards would be more susceptible) (Anderson 1978; APLIC 1994).
Although collision mortality rarely affects healthy populations with good reproductive success,
collisions can be biologically significant to local populations (Beer & Ogilvie 1972) and
endangered species (Thompson 1978; Faanes 1987). The loss of hundreds of Northern Black
Korhaans Eupodotis afraoides due to power line collisions would probably not affect the
success of the total population of this species and would probably not be biologically
significant, but if one Wattled Crane was killed due to a collision, that event could have an
effect on the population that would be considered biologically significant. Biological
significance is an important factor that should be considered when prioritising mitigation
measures. Biological significance is the effect of collision mortality upon a bird population’s
ability to sustain or increase its numbers locally and throughout the range of the species.”
A significant impact that is foreseen is collisions with the earth wire of the proposed line.
Quantifying this impact in terms of the likely number of birds that will be impacted, is very
difficult because such a huge number of variables play a role in determining the risk, for
example weather, rainfall, wind, age, flocking behaviour, power line height, light conditions,
topography, population density and so forth. However, from incidental record keeping by the
Endangered Wildlife Trust, it is possible to give a measure of what species are likely to be
impacted upon (see Figure 6 below - Jenkins et al 2010). This only gives a measure of the
general susceptibility of the species to power line collisions, and not an absolute measurement
for any specific line.
Solar Park Integration Project: Bird Impact Assessment Study, Preliminary Report
21 of 30
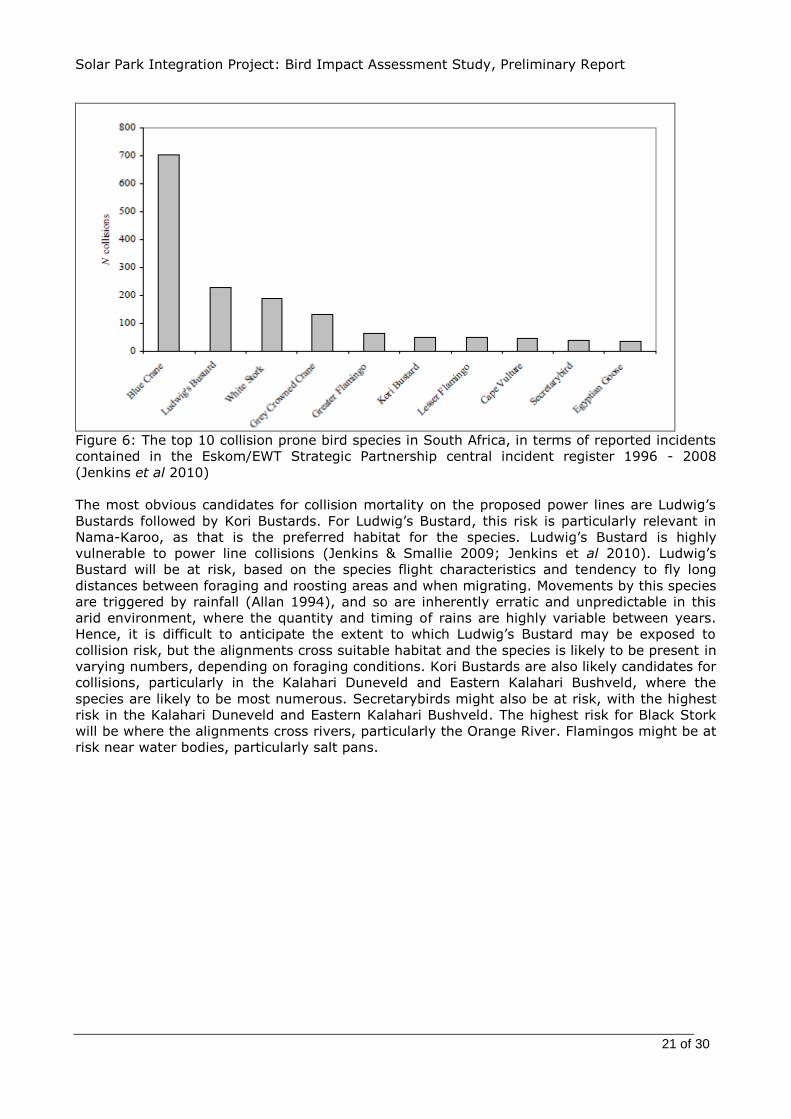
Figure 6: The top 10 collision prone bird species in South Africa, in terms of reported incidents
contained in the Eskom/EWT Strategic Partnership central incident register 1996 - 2008
(Jenkins et al 2010)
The most obvious candidates for collision mortality on the proposed power lines are Ludwig’s
Bustards followed by Kori Bustards. For Ludwig’s Bustard, this risk is particularly relevant in
Nama-Karoo, as that is the preferred habitat for the species. Ludwig’s Bustard is highly
vulnerable to power line collisions (Jenkins & Smallie 2009; Jenkins et al 2010). Ludwig’s
Bustard will be at risk, based on the species flight characteristics and tendency to fly long
distances between foraging and roosting areas and when migrating. Movements by this species
are triggered by rainfall (Allan 1994), and so are inherently erratic and unpredictable in this
arid environment, where the quantity and timing of rains are highly variable between years.
Hence, it is difficult to anticipate the extent to which Ludwig’s Bustard may be exposed to
collision risk, but the alignments cross suitable habitat and the species is likely to be present in
varying numbers, depending on foraging conditions. Kori Bustards are also likely candidates for
collisions, particularly in the Kalahari Duneveld and Eastern Kalahari Bushveld, where the
species are likely to be most numerous. Secretarybirds might also be at risk, with the highest
risk in the Kalahari Duneveld and Eastern Kalahari Bushveld. The highest risk for Black Stork
will be where the alignments cross rivers, particularly the Orange River. Flamingos might be at
risk near water bodies, particularly salt pans.

Solar Park Integration Project: Bird Impact Assessment Study, Preliminary Report
22 of 30
6.3 Displacement due to habitat destruction and disturbance
During the construction phase and maintenance of power lines and substations, some habitat
destruction and transformation inevitably takes place. This happens with the construction of
access roads, the clearing of servitudes and the levelling of substation yards. Servitudes have
to be cleared of excess vegetation at regular intervals in order to allow access to the line for
maintenance, to prevent vegetation from intruding into the legally prescribed clearance gap
between the ground and the conductors and to minimize the risk of fire under the line, which
can result in electrical flashovers. These activities have an impact on birds breeding, foraging
and roosting in or in close proximity of the servitude through transformation of habitat, which
could result in temporary or permanent displacement. In the present instance, the biggest risk
of displacement of Red Data species due to habitat destruction is likely to be in the Eastern
Kalahari Bushveld, as the construction of the line in that habitat may require the removal of
large trees, which are important breeding and roosting substrate for large raptors and
vultures. This could result in temporary or permanent local displacement of these species.
All three proposed Solar Park Substation sites are situated in low karroid shrubland which
forms part of the Bushmanland bioregion, and does not contain unique features that will make
it critically important for power line sensitive Red Data species (see Figure 4). It is not
envisaged that any Red Data species will be permanently displaced by the habitat
transformation that will take place. The proposed construction of the new substation should
therefore have a low displacement impact on Red Data species, irrespective of which of the
alternative sites is used.
Apart from direct habitat destruction, the above mentioned construction and maintenance
activities also impact on birds through disturbance, particularly during breeding activities.
This could lead to breeding failure if the disturbance happens during a critical part of the
breeding cycle. As far as the natural habitat is concerned, the biggest potential disturbance
impact is likely to be on large raptors and vultures in the Eastern Kalahari Bushveld, as
breeding populations of these species are most numerous in that habitat due to the presence
of large trees which is utilised for roosting and breeding.
As far as disturbance is concerned, a specific situation may arise if the line is constructed near
an existing transmission line. As mentioned earlier in this report, transmission lines are highly
sought after by large raptors, particularly Martial Eagles and Tawny Eagles, for roosting and
breeding purposes, and vultures often form semi-permanent roosts on transmission towers
(pers. obs). Construction activities in close proximity could be a source of disturbance and
could lead to temporary breeding failure or even permanent abandonment of nests.
7 Assessment of impacts
The impact assessment methodology makes provision for the assessment of impacts against
the following criteria:
Significance;
Spatial scale;
Temporal scale;
Probability; and
Degree of certainty.
7.1 Significance Assessment
A detailed description of the impact significance rating scale is given in Error! Not a valid
bookmark self-reference.6 below.
Table 6: Description of the significance rating scale

Solar Park Integration Project: Bird Impact Assessment Study, Preliminary Report
23 of 30
Rating Description
5 VERY HIGH Of the highest order possible within the bounds of impacts which could occur. In the case of adverse impacts: there is no possible mitigation and/or remedial activity which could offset the impact. In the case of beneficial impacts, there is no real alternative to achieving this benefit.
4 HIGH Impact is of substantial order within the bounds of impacts, which could occur. In the case of adverse impacts: mitigation and/or remedial activity is feasible but difficult, expensive, time-consuming or some combination of these. In the case of beneficial impacts, other means of achieving this benefit are feasible but they are more difficult, expensive, time-consuming or some combination of these.
3 MODERATE Impact is real but not substantial in relation to other impacts, which might take effect within the bounds of those which could occur. In the case of adverse impacts: mitigation and/or remedial activity are both feasible and fairly easily possible. In the case of beneficial impacts: other means of achieving this benefit are about equal in time, cost, effort, etc.
2 LOW Impact is of a low order and therefore likely to have little real effect. In the case of adverse impacts: mitigation and/or remedial activity is either easily achieved or little will be required, or both. In the case of beneficial impacts, alternative means for achieving this benefit are likely to be easier, cheaper, more effective, less time consuming, or some combination of these.
1 VERY LOW Impact is negligible within the bounds of impacts which could occur. In the case of adverse impacts, almost no mitigation and/or remedial activity is needed, and any minor steps which might be needed are easy, cheap, and simple. In the case of beneficial impacts, alternative means are almost all likely to be better, in one or a number of ways, than this means of achieving the benefit. Three additional categories must also be used where relevant. They are in addition to the category represented on the scale, and if used, will replace the scale.
0 NO IMPACT There is no impact at all - not even a very low impact on a party or system.
7.2 Spatial scale
The spatial scale refers to the extent of the impact i.e. will the impact be felt at the local,
regional, or global scale. The spatial assessment scale is described in more detail in Table 7.
Table 7: Description of the spatial rating scale.
Rating Description
5 Global/National The maximum extent of any impact.
4 Regional/Provincial The spatial scale is moderate within the bounds of impacts possible, and will be felt at a regional scale (District Municipality to Provincial Level).
3 Local The impact will affect an area up to 5 km from the proposed route corridor.
2 Study Area The impact will affect a route corridor not exceeding the boundary of the corridor.
1 Isolated Sites / proposed site
The impact will affect an area no bigger than the route site.

Solar Park Integration Project: Bird Impact Assessment Study, Preliminary Report
24 of 30
7.3 Temporal scale
In order to accurately describe the impact it is necessary to understand the duration and
persistence of an impact in the environment. The temporal scale is rated according to criteria
set out in Table 8.
Table 8: Description of the temporal rating scale.
Rating Description
1 Incidental The impact will be limited to isolated incidences that are expected to occur very sporadically.
2 Short-term The environmental impact identified will operate for the duration of the construction phase or a period of less than 5 years, whichever is the greater.
3 Medium term The environmental impact identified will operate for the duration of life of the line.
4 Long term The environmental impact identified will operate beyond the life of operation.
5 Permanent The environmental impact will be permanent.
7.4 Degree of Probability
The probability or likelihood of an impact occurring will be described as shown in
Table 9 below.
Table 9: Description of the degree of probability of an impact accruing.
Rating Description
1 Practically impossible
2 Unlikely
3 Could happen
4 Very Likely
5 It’s going to happen / has occurred
7.5 Quantitative Description of Impacts
To allow for impacts to be described in a quantitative manner in addition to the qualitative
description given above, a rating scale of between 1 and 5 was used for each of the
assessment criteria. Thus the total value of the impact is described as the function of
significance, spatial and temporal scale as described below:
Impact Risk = [(SIGNIFICANCE + Spatial + Temporal)÷3] X [Probability ÷ 5]
The impact risk is classified according to 5 classes as described in table 10 below.
Table 10: Impact risk classes.
Rating Impact class Description
0.1 – 1.0 1 Very Low
1.1 – 2.0 2 Low
2.1 – 3.0 3 Moderate
3.1 – 4.0 4 High
4.1 – 5.0 5 Very High

Solar Park Integration Project: Bird Impact Assessment Study, Preliminary Report
25 of 30
Table 11 below provides a summary of the impacts describing the impact, significance, spatial
scale, temporal scale, probability and rating.
Solar Park Integration Project: Bird Impact Assessment Study, Preliminary Report
26 of 30
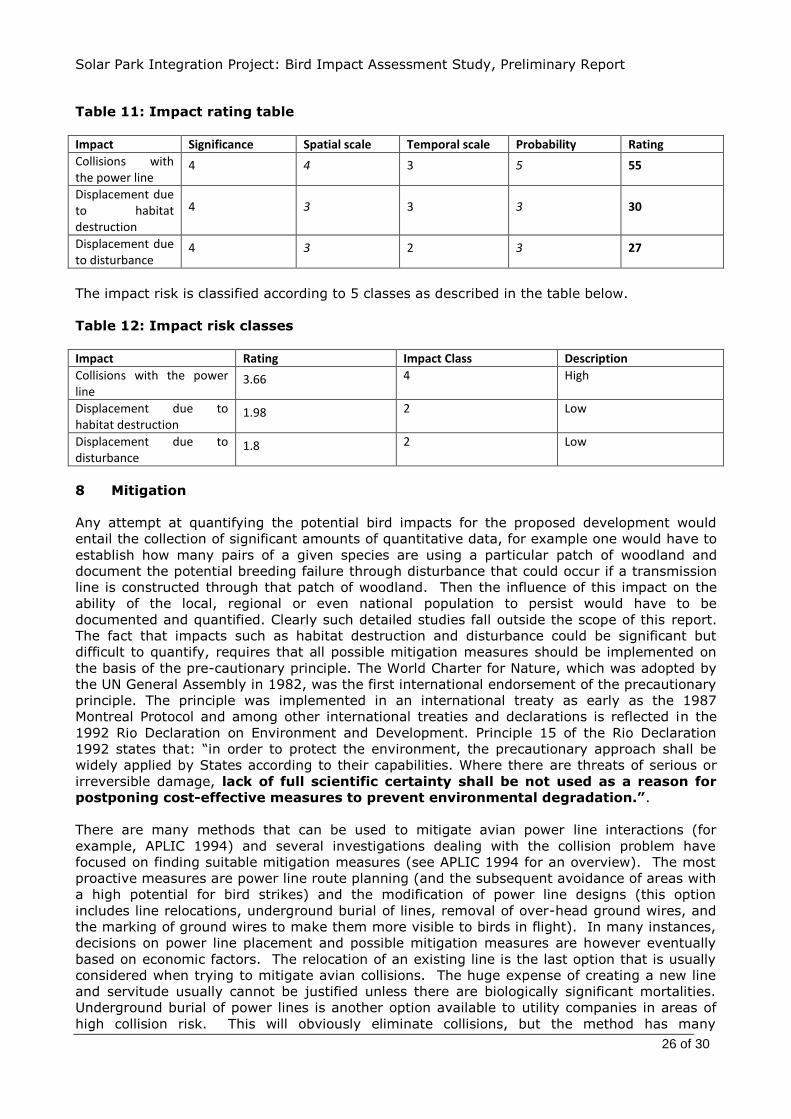
Table 11: Impact rating table
Impact Significance Spatial scale Temporal scale Probability Rating
Collisions with the power line
4 4 3 5 55
Displacement due to habitat destruction
4 3 3 3 30
Displacement due to disturbance
4 3 2 3 27
The impact risk is classified according to 5 classes as described in the table below.
Table 12: Impact risk classes
Impact Rating Impact Class Description
Collisions with the power line
3.66 4 High
Displacement due to habitat destruction
1.98 2 Low
Displacement due to disturbance
1.8 2 Low
8 Mitigation
Any attempt at quantifying the potential bird impacts for the proposed development would
entail the collection of significant amounts of quantitative data, for example one would have to
establish how many pairs of a given species are using a particular patch of woodland and
document the potential breeding failure through disturbance that could occur if a transmission
line is constructed through that patch of woodland. Then the influence of this impact on the
ability of the local, regional or even national population to persist would have to be
documented and quantified. Clearly such detailed studies fall outside the scope of this report.
The fact that impacts such as habitat destruction and disturbance could be significant but
difficult to quantify, requires that all possible mitigation measures should be implemented on
the basis of the pre-cautionary principle. The World Charter for Nature, which was adopted by
the UN General Assembly in 1982, was the first international endorsement of the precautionary
principle. The principle was implemented in an international treaty as early as the 1987
Montreal Protocol and among other international treaties and declarations is reflected in the
1992 Rio Declaration on Environment and Development. Principle 15 of the Rio Declaration
1992 states that: “in order to protect the environment, the precautionary approach shall be
widely applied by States according to their capabilities. Where there are threats of serious or
irreversible damage, lack of full scientific certainty shall be not used as a reason for
postponing cost-effective measures to prevent environmental degradation.”.
There are many methods that can be used to mitigate avian power line interactions (for
example, APLIC 1994) and several investigations dealing with the collision problem have
focused on finding suitable mitigation measures (see APLIC 1994 for an overview). The most
proactive measures are power line route planning (and the subsequent avoidance of areas with
a high potential for bird strikes) and the modification of power line designs (this option
includes line relocations, underground burial of lines, removal of over-head ground wires, and
the marking of ground wires to make them more visible to birds in flight). In many instances,
decisions on power line placement and possible mitigation measures are however eventually
based on economic factors. The relocation of an existing line is the last option that is usually
considered when trying to mitigate avian collisions. The huge expense of creating a new line
and servitude usually cannot be justified unless there are biologically significant mortalities.
Underground burial of power lines is another option available to utility companies in areas of
high collision risk. This will obviously eliminate collisions, but the method has many

Solar Park Integration Project: Bird Impact Assessment Study, Preliminary Report
27 of 30
drawbacks. The costs of burying lines can be from 20 – 30 times (or more) higher than
constructing overhead lines, and such costs are related to the line voltage, type and length of
cable, cable insulation, soil conditions, local regulations, reliability requirements, and
requirement of termination areas. Limitations of cable burial include: no economically feasible
methods of burying extra high voltage lines have been developed, there is a potential to
contaminate underground water supplies if leakage of oil used in insulating the lines occurs,
and extended outage risks due to the difficulty in locating cable failures (APLIC 1994). Since
most strikes involve earth-wires (more than 80% of observed bird collisions), the removal of
these wires would decrease the number of collisions. It is assumed that the large number of
earth-wire collisions is because birds react to the more visible conductors by flaring and
climbing and then collide with the thinner earth-wires (Anderson 2001). Earth-wire removal is,
however, not a simple matter. Due to the need for lightning protection and other types of
electricity overload, it is only possible on lower-voltage power lines (where polymer lightning
arresters can be used). The marking of overhead earth-wires to increase their visibility is
usually considered to be the most economical mitigation option for reducing collision mortality
(APLIC 1994). This is particular so for the thousands of kilometres of established power lines
through areas of high potential for avian interaction which cannot be rerouted.
Several factors are thought to influence avian collisions, including the manoeuvrability of the
bird, topography, weather conditions and power line configuration. An important additional
factor that previously has received little attention is the visual capacity of birds; i.e. whether
they are able to see obstacles such as power lines, and whether they are they looking ahead to
see obstacles with enough time to avoid a collision. In addition to helping explain the
susceptibility of some species to collision, this factor is key to planning effective mitigation
measures (Martin et al 2010). Recent research conducted by Eskom and the Endangered
Wildlife Trust provides the first evidence that birds can render themselves blind in the direction
of travel during flight through voluntary head movements. Due to the variation in visual fields
among species, there is unlikely to be a single solution for mitigating all collisions. Line
marking alone is likely to be effective for storks, but for birds such as bustards, additional
mitigation may be necessary, as these birds may not see obstacles at all when in flight.
Distracting such birds away from obstacles or encouraging them to land nearby may help to
prevent collisions, as they would be more aware of their surroundings and of marked power
lines when taking off again (Martin et al 2010). In certain situations birds such as bustards,
cranes and raptors are unlikely to see ahead of them, no matter what mitigation measures are
placed upon the actual obstacle. This is because the visual field configuration, coupled with
possible head movements associated with searching below, prevents it being detected. For
these species it may be better to distract birds away from, or encourage them to land nearby
to power lines. Placing markers on the ground might have this effect. Bird silhouettes, painted
drums or flags could prove effective, and it is recommended that such methods be used in
combination with line marking. Unfortunately, no research is available on the effectiveness of
ground marking.
Despite the indications that line marking might not be effective in certain situations for certain
species, there are many studies that provide evidence that marking a line with PVC spiral type
Bird Flight Diverters (BFDs) can reduce the mortality rates by at least 60% (Alonso & Alonso
1999; Koops & De Jong 1982). Beaulaurier (1981) summarised the results of 17 studies that
involved the marking of earth wires and found an average reduction in mortality of 45%.
Koops and De Jong (1982) found that the spacing of the BFDs were critical in reducing the
mortality rates - mortality rates are reduced up to 86% with a spacing of 5 metres, whereas
using the same devices at 10 metre intervals only reduces the mortality by 57%. Jenkins et al
(2010) reviewed 15 studies and found line marking to reduce mortality rates by 50-60%,
although the efficacy for bustards may be lower than that. Barrios et al (2011) analysed 11
studies and found an average reduction of 78% in mortality on marked lines. Line markers
should be as large as possible, and highly contrasting with the background. Colour is probably
less important as during the day the background will be brighter than the obstacle with the
reverse true at lower light levels (e.g. at twilight, or during overcast conditions). Black and
Solar Park Integration Project: Bird Impact Assessment Study, Preliminary Report
28 of 30
white interspersed patterns are likely to maximise the probability of detection (Martin et al
2010).
The mitigation of bird impacts caused by power lines is to a large extent determined by the
microhabitat within a zone of a hundred metres to about 1km on both sides of the line. This is
particularly relevant as far as mitigation for bird collisions are concerned. It is not the objective
of this desk top report to attempt to demarcate all sections of potential power line for all the
alternative corridors that would need to be mitigated for potential collisions. This can only be
done once the final alignment has been finalized through the EIA process, through a
combination of physical inspection and analysis of satellite imagery. It is standard procedure
for Eskom Transmission to perform this procedure with the assistance of a suitably
experienced ornithological consultant once the line has been surveyed and pegged. At that
stage, specific spans are demarcated for the fitting of anti-collision devices, based on a variety
of factors (mentioned earlier), and at that stage minor deviations can still be effected. This is
also the stage when site specific measures are suggested to prevent habitat destruction for
example what areas access roads should avoid e.g. to avoid sensitive raptor breeding areas. At
this stage of the process, the most important recommendation flowing from this study is a
rating of the different alternatives from a bird impact perspective, to inform the final selection
of an alignment.
9 References
Allan, D.G. 1994. The abundance and movements of Ludwig’s Bustard Neotis ludwigii. Ostrich
65: 95-105.
Alonso, J.A. & Alonso, C.A. 1999. Mitigation of bird collisions with transmission lines through
groundwire marking. In: Birds and Power Lines Eds: M. Ferrer & G. F. E. Janss, Quercus,
Madrid.
Avian Power Line Interaction Committee (APLIC). 1994. Mitigating Bird Collisions with Power
Lines: The State of the Art in 1994. Edison Electric Institute. Washington D.C.
Anderson, M.D. 2001. The effectiveness of two different marking devices to reduce large
terrestrial bird collisions with overhead electricity cables in the eastern Karoo, South Africa.
Draft report to Eskom Resources and Strategy Division. Johannesburg. South Africa.
Barrientos, R., Alonso J.C., Ponce, C. & Palacin, C. 2011.Meta-Analysis Of The Effectiveness Of
Marked Wire In Reducing Avian Collisions With Power Lines. Conservation Biology. Volume 24
Issue 5.
Barnes, K.N. (ed.) 1998. The Important Bird Areas of southern Africa. BirdLife South Africa:
Johannesburg.
Barnes, K.N. (ed.) 2000. The Eskom Red Data Book of Birds of South Africa, Lesotho and
Swaziland. BirdLife South Africa: Johannesburg.
Beaulaurier, D.L. 1981. Mitigation of bird collisions with transmission lines. Bonneville Power
Administration. U.S. Dept. of Energy.
Harrison, J.A., Allan, D.G., Underhill, L.G., Herremans, M., Tree, A.J., Parker, V and Brown,
C.J. (eds). 1997. The atlas of southern African birds. Vol. 1&2. BirdLife South Africa:
Johannesburg.
Hobbs, J.C.A. and Ledger J.A. 1986a. The Environmental Impact of Linear Developments;
Power lines and Avifauna. (Third International Conference on Environmental Quality and
Ecosystem Stability. Israel, June 1986).

Solar Park Integration Project: Bird Impact Assessment Study, Preliminary Report
29 of 30
Hobbs, J.C.A. and Ledger J.A. 1986b. “Power lines, Birdlife and the Golden Mean.” Fauna and
Flora, 44, pp 23-27.
Hockey P.A.R., Dean W.R.J., And Ryan P.G. (2005). Robert’s Birds of Southern Africa, seventh
edition. Trustees of the John Voelcker Bird Book Fund, Cape Town.
Jenkins, A. & Smallie, J. 2009. Terminal velocity: the end of the line for Ludwig’s Bustard?
Africa Birds and Birding. Vol 14, No 2.
Jenkins, A.R., Smallie, J.J. & Diamond, M. 2010. Avian collisions with power lines: a global
review of causes and mitigation with a South African perspective. Bird Conservation
International 20: 263-278.
Koops, F.B.J. & De Jong, J. 1982. Vermindering van draadslachtoffers door markering van
hoogspanningsleidingen in de omgeving van Heerenveen. Electrotechniek 60 (12): 641 – 646.
Kruger, R. and Van Rooyen, C.S. 1998. Evaluating the risk that existing power lines pose to
large raptors by using risk assessment methodology: the Molopo Case Study. (5th World
Conference on Birds of Prey and Owls: 4 - 8 August 1998. Midrand, South Africa.)
Kruger, R. 1999. Towards solving raptor electrocutions on Eskom Distribution Structures in
South Africa. M. Phil. Mini-thesis. University of the Orange Free State. Bloemfontein. South
Africa.
Ledger, J. 1983. Guidelines for Dealing with Bird Problems of Transmission Lines and Towers.
Escom Test and Research Division Technical Note TRR/N83/005.
Ledger, J.A. and Annegarn H.J. 1981. “Electrocution Hazards to the Cape Vulture (Gyps
coprotheres) in South Africa”. Biological Conservation, 20, pp15-24.
Ledger, J.A. 1984. “Engineering Solutions to the problem of Vulture Electrocutions on
Electricity Towers.” The Certificated Engineer, 57, pp 92-95.
Ledger, J.A., J.C.A. Hobbs and Smith T.V. 1992. Avian Interactions with Utility Structures:
Southern African Experiences. (Proceedings of the International Workshop on Avian
Interactions with Utility Structures, Miami, Florida, 13-15 September 1992. Electric Power
Research Institute.)
Martin, G., Shaw, J., Smallie J. & Diamond, M. 2010. Bird’s eye view – How birds see is key to avoiding power line collisions. Eskom Research Report. Report Nr: RES/RR/09/31613.
Mucina. L. & Rutherford, M.C. (Eds) 2006. The vegetation of South Africa, Lesotho and
Swaziland. Strelitzia 19. South African National Biodiversity Institute, Pretoria.
National Land Cover Project. 2009. www.bgis.sanbi.org.
Southern African Bird Atlas Project 2 (SABAP2). http://sabap2.adu.org.za. Accessed 12
October 2012.
Van Rooyen, C.S. and Ledger, J.A. 1999. “Birds and utility structures: Developments in
southern Africa” in Ferrer, M. & G..F.M. Janns. (eds.) Birds and Power lines. Quercus: Madrid,
Spain, pp 205-230
Van Rooyen, C.S. 1998. Raptor mortality on power lines in South Africa. (5th World Conference
on Birds of Prey and Owls: 4 - 8 August 1998. Midrand, South Africa.)

Solar Park Integration Project: Bird Impact Assessment Study, Preliminary Report
30 of 30
Van Rooyen, C.S. 1999. An overview of the Eskom - EWT Strategic Partnership in South Africa.
(EPRI Workshop on Avian Interactions with Utility Structures 2-3 December 1999, Charleston,
South Carolina.)
Van Rooyen, C.S. 2000. “An overview of Vulture Electrocutions in South Africa.” Vulture News,
43, pp 5-22. Vulture Study Group: Johannesburg, South Africa.
Van Rooyen, C.S. 2003. Mitigation programme for Avian Collisions with Eskom Transmission
Lines. Unpublished Progress Report, September 2003. Endangered Wildlife Trust,
Johannesburg, South Africa.
Van Rooyen, C.S. 2004. The Management of Wildlife Interactions with overhead lines. In The
fundamentals and practice of Overhead Line Maintenance (132kV and above), pp217-245.
Eskom Technology, Services International, Johannesburg.
Van Rooyen, C.S. 2007. Bird Impact Assessment Study. Ferrum-Garona 400kV. Endangered
Wildlife Trust.
Verdoorn, G.H. 1996. Mortality of Cape Griffons Gyps coprotheres and African Whitebacked
Vultures Pseudogyps africanus on 88kV and 132kV power lines in Western Transvaal, South
Africa, and mitigation measures to prevent future problems. (2nd International Conference on
Raptors: 2-5 October 1996. Urbino, Italy.)
Zitholele Consulting. 2012a. EIA, WULA and EMP for the proposed solar CSP Integration
Project: Project 1 – Solar substation, 2 x 400 kV power lines from Aries to the Solar Sub and
400 kV power lines from Nieuwehoop to the Solar Sub. Final Scoping Report. DEA Reference
Number: 12/12/20/2606.
Zitholele Consulting. 2012b. EIA, WULA and EMP for the proposed solar CSP Integration
Project: Project 2 – 400 kV power lines from Ferrum to the Solar Sub. Final Scoping Report.
DEA Reference Number: 12/12/20/2607.