software publishers association sales data programs: methodologies, coverage and assumptions
TRANSCRIPT

Software Publishers Association Sales Data Programs: Methodologies,
Coverage and Assumptions
Anne Griffith
The Software Publishers Association Research Department focuses its sales research efforts on tracking sales of packaged application software written for the desktop personal computer industry. Quarterly summaries of the data we collect are issued to the public in the form of sales press releases. Our goal in this article is to clarify the types of information we collect, the sources used, and the adjustments per- formed on the data available to the public. At the end of this article we discuss the software piracy loss estimation methodology.
Introduction
F ounded in 1984, the Software Publishers Association is the principal trade association of the desktop software industry, representing the leading pub-
lishers, as well as many start-up firms, in the business, consumer and educa- tion markets. Its 1,200 members account for 90 percent of the sales of the U.S. packaged software industry. SPA is an international organization with offices both in the United States and Europe.
Much of the confusion regarding the variety of numbers bandied about for the size of the software industry stems from an imprecision in defining exactly what is being measured. SPA data encompass only PACKAGED PC APPLI- CATIONS, excluding operating system sales, mainframe packaged software such as databases, all custom-writ ten applications and all serv ice /maintenance contracts. Estimates including some or all of these other segments range from $16 billion to $50 billion, and may all be correct.
SPA Software Sales Data Programs
Three different types of sales press releases are issued each quarter: a North American sales release, a series of International sales releases, and a CD Soft- ware sales release. Growth rates over previous year periods are provided in all three types of sales releases.
�9 The North American sales release tracks revenues for sixteen major
Anne Griffith is a senior research analyst at the Software Publishers Association, 1730 M. Street NW Suite 700, Washington, DC 20036-4510.

22 Publishing Research Quarterly / Summer 1996
software categories in the United States and Canada. Revenues are adjusted to reflect retail value and full market representation.
The International Data releases track publisher revenues by U.S. soft- ware publishers in the major markets across the globe: Europe, Asia and Latin America. Total sales figures are shown for each country we track in the region.
Finally, the CD software sales release covers publisher global rev- enues of CD-ROM software as a separate market. From mid-1993 until December 1995, this separate program reported publishers' rev- enue and units for CD shipments, including bundled versus retail sales.
This data will be changed significantly beginning in January 1996 when it will be folded in as part of the Worldwide data program. The categories will then map directly to the other data, and CD share of total shipments figures will be possible for the first time. The SPA collects software sales data directly from its participating member publishers. Each reporting period, participating firms send their data in complete confidence to a Big-six accounting firm work- ing under contract for the SPA. The firm aggregates the individual company data and delivers the industry-wide sales report for distribution back to the data program participants. This data is collected in thirty-five categories by platform, in units and revenues for new and upgrade sales in North American, Rest-of-World and Total Sales. A sample grid for one category is reproduced in "Fable 1. Each month respondents complete this type of grid for as many applications categories as needed.
You will notice that we have begun to collect shipment information on Win- dows 32-bit applications sales (Windows 95 & Windows NT). By the time this article appears in print, we may have started reporting those out, but at the moment, we simply collect the information in preparation for time series re- porting later. Data are reported for the combined 16 & 32 bit categories until there are sufficient companies in the market to break out sales by the new platform. We followed the same procedure when Windows was first emerging from the DOS platform. Initially, we report only the total sales for the platform and detail will gradually emerge as it is possible to report it.
Confidentiality and Other Reporting Rules
Our confidentiality rule stipulates that no category cell can be reported out unless there are at least three participants. We will report N /A for a platform rather than divulge the data of fewer than three firms. We do not, however, suppress a category total. Thus, data for at least the category total is presented, even if all other detail must be suppressed to protect individual firms.
The other reporting rules that may be of interest to those who follow this

Griffith 23
TABLE 1 Worldwide Data Program Monthly Reporting Form Sample
DOMESTIC SALES US & CANADA
PC/MS-DOS u~ts dollars
New Sales Upgrade
PC/MS-DOS
OS/2 units dollars
MS Windows 32-bit units dol lars
MS Windows 16 bit units dollars
Unix units dollars
Macintosh & Power Mac units dol lars
Other (please identify) units dol lars
TOTAL DOMESTIC UNITS = m
TOTAL DOMESTIC DOLLARS TOTAL WORLDWIDE UNITS TOTAL WORLDWIDE DOLLARS
units dollars
TOTAL DOMESTIC DOLLARS
INTERNATIONAL SALES
OS/2 units dollars
MS Windows 32-bit units dol lars
MS Windows 16 bit units dollars
Unix units dollars
Macintosh & Power Mac units dollars
Other (please identify) units dollars
TOTAL DOMESTIC UNITS

24 Publishing Research Quarterly / Summer 1996
data concern suites sales and CD-ROM sales. In the major desktop business categories, individual title sales have been swept aside by sales of office suites such as Microsoft Office, Novell PerfectOffice and Lotus SmartSuite. In order to accurately report category sales, we have the publishers break out the indi- vidual product types into their respective categories. For example, a sale of MS Office would be reported as 1 word processor, 1 spreadsheet, 1 presentation graphics and I e-mail.
The Worldwide and International Data Programs include sales of software in all formats---diskette, CD-ROM and on-line. Software sold through a site li- cense is counted at the maximum number of seats allowed under the license. CD-ROMs sold in cross-platform formats are split between the applicable for- mats according to the share of the installed user base, as estimated by the publisher.
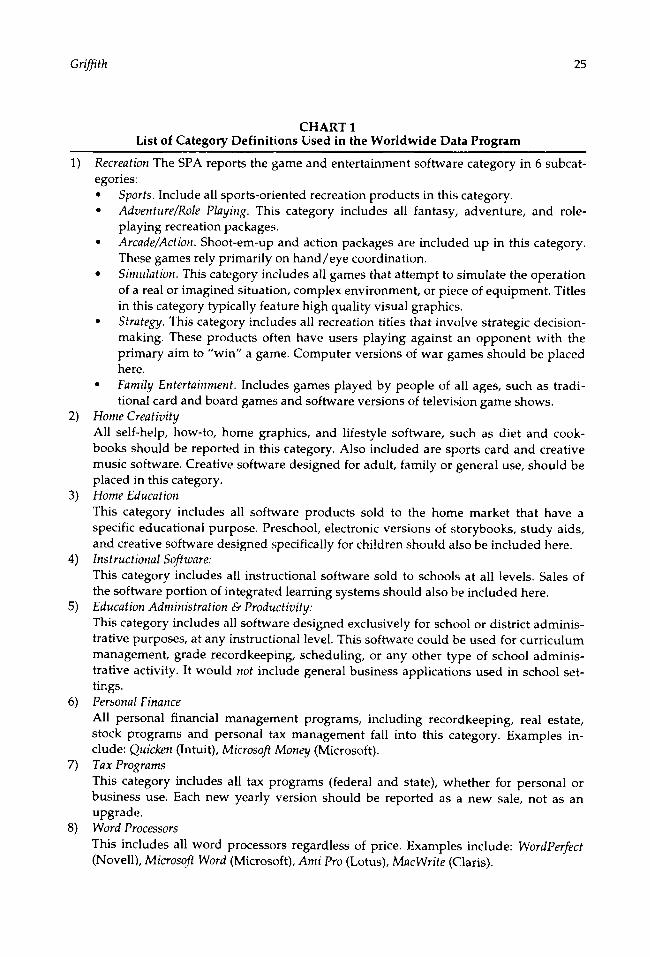
Classification
Product classification is an always-thorny issue. Publishers receive detailed rules each January with category descriptions, and then self-classify products using their best judgment. They may, of course, consult with SPA or the con- tractor on difficult items. A classification list is prepared semi-annually by the contractor listing the 35 categories and the titles reported in each. Publishers report additions or deletions to their catalog monthly along with their data submissions.
Chart 1 is a listing of the classification categories used to collect sales data from the publishers. The order listing is that used in the program, and is not alphabetical or ranked in any way.
In addition to the form for the Worldwide Data Program detailed above, publishers also report international sales by country to our International Data Program. Publishers send in reports for each country they ship to, but only countries having the minimum number of respondents are published. For 1995, we reported on 29 in full detail (including all category and platform informa- tion). Countries included in the SPA International Data Program are listed in Table 2.
Eight additional countries do not have sufficient participation for full detail and are reported as "B List" countries. These areas are shown monthly with truncated information including new and upgrade units and revenues for DOS, Windows and Macintosh platforms. However, no category breakouts are given. B-List countries for 1995 were China, the Czech & Slovak Republics, Hungary, India & Pakistan, Malaysia, Poland, Russia & CIS, and Thailand. What these areas have in common are emerging markets for U.S. software, fast-paced computerization rates and growing economies. We will obviously report addi- tional detail as it becomes available for these markets.
Griffith 25
CHART 1 List of Category Definitions Used in the Worldwide Data Program
1) Recreation The SPA reports the game and entertainment software category in 6 subcat- egories: �9 Sports. Include all sports-oriented recreation products in this category. �9 Adventure~Role Playing. This category includes all fantasy, adventure, and role-
playing recreation packages. �9 Arcade~Action. Shoot-em-up and action packages are included up in this category.
These games rely primarily on hand /eye coordination. �9 Simulation. This category includes all games that attempt to simulate the operation
of a real or imagined situation, complex environment, or piece of equipment. Titles in this category typically feature high quality visual graphics.
�9 Strategy. This category includes all recreation titles that inw~lve strategic decision- making. These products often have users playing against an opponent with the primary aim to "win" a game. Computer versions of war games should be placed here.
�9 Family Entertainment. Includes games played by people of all ages, such as tradi- tional card and board games and software versions of television game shows.
2) Home Creativity All self-help, how-to, home graphics, and lifestyle software, such as diet and cook- books should be reported in this category. Also included are sports card and creative music software. Creative software designed for adult, family or general use, should be placed in this category.
3) Home Education This category includes all software products sold to the home market that have a specific educational purpose. Preschool, electronic versions of storybooks, study aids, and creative software designed specifically for children should also be included here.
4) Instructional Software: This category includes all instructional software sold to schools at all levels. Sales of the software portion of integrated learning systems should also be included here.
5) Education Administration & Productivity: This category includes all software designed exclusively for school or district adminis- trative purposes, at any instructional level. This software could be used for curriculum management, grade recordkeeping, scheduling, or any other type of school adminis- trative activity. It would not include general business applications used in school set- tings.
6) Personal Finance All personal financial management programs, including recordkeeping, real estate, stock programs and personal tax management fall into this category. Examples in- clude: Quicken (Intuit), Microsoft Money (Microsoft).
7) Tax Programs This category includes all tax programs (federal and state), whether for personal or business use. Each new yearly version should be reported as a new sale, not as an upgrade.
8) Word Processors This includes all word processors regardless of price. Examples include: WordPerfect (Novell), Microsoft Word (Microsoft), Ami Pro (Lotus), MacWrite (Claris).

26 Publishing Research Quarterly/Summer 1996
CHART 1 (Continued)
9) Spreadsheets This includes all spreadsheets, regardless of price. Examples include: Lotus 1-2-3 (Lo- tus), Quattro Pro (Novell), and Excel (Microsoft).
10) Databases Includes both flat-file and relational databases.
11) System Utilities Software designed to enhance or improve hardware components and operating sys- tems. Windows applications utilities are System Utilities. Includes all keyboard macro generators, printer enhancements and calculators, screen savers. LAN management software, and sound and voice generators for multiple applications should also be included in this category.
12) Applications Utilities Utilities designed to enhance or improve specific software programs. Applications Utilities include printer utilities used from WITHIN applications. If you cannot iden- tify the specific software application for which the program is a utility, it does not fit in this category.
13) E-Mail Includes all multi-user environment software whose primary function is E-Mail. In order to track the average revenue per client seat, report each client seat as a unit and report all revenue received, including all accessories, gateways and other peripherals.
14) Integrated This category includes software that combines several different applications (that are not available separately) into one software program or product. It excludes bundled products placed in one box or wrapped together, such as a suite.
15) Presentation Graphics This category includes software designed for professional presentations, and decision support. Flow chart and organization chart software should also be included in this category.
16) Professional Drawing and Painting Includes software whose primary function is to allow the user to create professional freehand artwork. Please note that home drawing and painting programs should be included in the "Home Creativity" category, and that CAD software should be in- cluded in the "General Business" category.
17) Clips This category includes all art work, sound, video, photos, music and other graphic images which are generally exported to, and used in, other documents. All products formerly classified as "Clip Art" should be included in this category. Excluded from this category, however, are screen savers and sound and voice generators.
18) Fonts Include all fonts in this category. This category also includes system font managers and font managers for word processors (even if the font manager works with only one program and not the whole system).
19) Forms All electronic forms and document templates should be placed in this category. Fill-in- the-blank legal software also included.
20) Desktop Publishing This category includes all page /document design or layout programs.

Grif~'th 27
CHART 1 (Continued)
21) Communications This software category includes software products whose main purpose is to enable PCs to communicate with other computers. Fax packages and software designed to aid remote LAN access should be classified as Communication packages. This category also includes the sales of on-line service memberships, but not monthly billings.
22) Project Management This category includes all products designed to manage a project or job.
23) Personal and Business Productivity This category includes productivity products used in business or home, such as re- sume writers, stand-alone calendars, business plans, expense records, office design, willmakers, family tree makers and other home or office organizers. Label-makers and mailing lists which are not add-ons for specific applications should also be included here.
24) Training This category includes software that trains users of a particular software product, operating system or skill (such as accounting, typing). Software that teaches a skill but is designed specially for sale to schools, should be included in the appropriate Educa- tion category.
25) Accounting This category includes products that maintain or integrate with general ledger ac- counting systems, including accounts payable, order processing and job costing.
26) C Languages This category includes the C and variants of C programming languages.
27) Other Languages This category includes programming languages such as APL, COBOL, FORTRAN, Pascal, Assembler, and all visual programming and hypercard languages.
28) Programming Tools This category includes all software designed to aid the programmer in software devel- opment.
29) Other Time Managers and PIMs This category includes sales of all Personal Information Managers (PIMs), contact man- agers, and group schedulers that are sold through OEM or stand-alone retail arrange- ments. License pack sales of all group schedulers are also included. EXCLUDED from this category are all dedicated address book, to-do list, and calendar packages that do not incorporate full group or PIM functionality (please continue to report these prod- ucts in the Personal & Business Productivity category).
30) Reference This category includes all reference works and guides designed to function around a high-speed retrieval system. Covered by this category are encyclopedias, atlases, stand- alone dictionaries, fact books, and all medical, travel, sports, business, religious and music guides.
31) General Business Uncategorized business software, including text search and retrieval products, scien- tific and engineering applications, all computer aided design (CAD) and mathematical software should be reported here. Workgroup software should be reported here except for titles whose primary purpose is project management or personal information man- agement (PIM).

28 Publishing Research Qz,arterly Summer 1996
TABLE 2 SPA International Data Program
Western Europe Asia/Pacific Other Regions
Austria Belgium/Luxembourg Denmark France Finland Germany Greece Italy Netherlands Norway/Iceland Portugal Spain Sweden Switzerland UK/Ireland
Australia Hong Kong Japan Korea New Zealand Singapore Taiwan
Brazil Mexico Other Latin America Canada Israel Other Mid East South Africa
Publ ic ly A v a i l a b l e I n f o r m a t i o n
Monthly Data Reports in the full detail illustrated in Chart 1 are available only to participating SPA member firms. All other members, press, and the general public may receive the press release-level information on a quarter ly basis. These may be obtained from the SPA World Wide Web home page at www.spa.org, from our free fax-on-demand service at 1-800-637-6283, or by calling the SPA Public Relations depar tment at 202-452-1600.
For the North American press releases, we provide information on sixteen categories of application software by platform. Each year we include the cat- egory definitions used in press releases in the first quarter 's release. These are, for the most part, combinations of categories collected in the data program. Some categories, however, are used "as is" because they are major revenue producers or the subject of great interest. Categories used in the SPA North American Software sales press releases are as follows:
�9 E n t e r t a i n m e n t - - A U types of personal computer-based games. Excludes cartridge video games.
�9 H o m e E d u c a t i o n - - I n c l u d i n g all education products whose pr imary tar- get is the home market, and reference software.
�9 F i n a n c e - - P e r s o n a l finance, tax and accounting packages.
�9 W o r d Processors.
�9 Spreadsheets .
�9 D a t a b a s e s - - R e l a t i o n a l and flat-file personal computer-based databases.

Griffith 29
�9 Integrated--Includes products that combine several different applica- tions in one. Includes "Works" products, but excludes product suites.
�9 Utilities--Includes products designed to enhance or improve operat- ing systems, such as antivirus, file recovery, screen savers and back-up packages, as well as application utilities to enhance specific programs.
�9 Presentation Graphics--Includes software designed to create professional presentations on slides or transparencies.
�9 Drawing &Painting--Includes software whose primary function is to create professional freehand artwork.
�9 Desktop Publishing--Includes all document/page layout and design programs.
�9 Other Graphics--Includes all other graphics applications, such as forms packages, clip art, video and sound collections, and home-oriented graphics software (home creativity).
�9 Languages & Tools--Includes all C, APL, Pascal and other languages as well as all tools designed to aid software development.
�9 Project Management
�9 Personal Information Managers (PIMs)--Includes all PIM packages which have integrated scheduling, note-taking and contact management func- tions.
�9 Other Productivity--All other types of personal computer software not included in the above categories, including electronic mail packages, school curricular software, CAD, scientific and engineering software, personal and business productivity software, training software, and communications packages.
Data for the North American press releases are adjusted in two ways before release.
. Each cell, for example DOS word processors sales, is expanded for full market coverage. SPA annually surveys data program participants and other market analysts for input on the share that respondents hold of each category. Each cell is adjusted individually and then aggregated into the smaller number of categories that are included in the press releases.
. Next, we apply a markup factor to expand the publisher revenue to retail-equivalent dollars. This adjustment is revised annually, and is again individualized for each type of software. We receive informa- tion from one of the private retail title-tracking services that provide average retail sales price for categories that were designed to map to

30 Publishing Research Quarterly / Summer I996
our category definitions. These "average retail prices" are compared to the average publisher revenue and the data program revenues that had been expanded in step I are marked up to retail-equivalent value.
A sample of the SPA North American Software Sales press release is pr inted as Table 3. It contains information for the 1995 year-to-date third quarter soft- ware sales, and was released on December 5, 1995. Press releases usual ly fol- low the release of data to participants by about one week. Cells wi th (*) indi- cate less than $1 million in sales or too few respondents to report.
Press release level data are available back to 1990, since earlier revisions to adjustment factors make the previous data inconsistent with current data. These can be accessed from the SPA's fax-on-demand service at 1-880-637-6823, docu- ment #434. The original data program reports are archived at SPA's offsite storage back to 1985. We have all of the quarterly reports (that include each month in the quarter) and all of the annual reports, but do not necessarily have a complete set of individual months.
In general, we believe that we understate, rather than overstate, total soft- ware sales volume for the following reasons. Our adjustments to marke t cov- erage and pricing are made on an annual basis while the market moves more quickly than that. We do not capture vertical market software that assists management of firms in specific industr ies--for example restaurant manage- ment, construction, health care administration. These programs represent a very large market that is difficult to quantify since its participants identify themselves as part of the managed industry rather than as software publish- ers.
SPA Piracy Loss Estimation Methodology
SPA produces piracy loss estimates for over thirty countries each year as part of the Copyright Protection Council 's international anti-piracy efforts. Estimates are also made by the Business Software Alliance a smaller trade group made up of some of the largest business software publishers. Both groups use the same approach, but use different pricing structures to arrive at the final estimates. SPA's are more conservative, and yield lower dollar losses for nearly the same unit losses.
The piracy loss methodology is based on comparing the number of personal computers sold in a year with the number of applications sold. Knowing the number of personal computers purchased in a year, and the average n u m b e r of applications used on a PC will give the number of applications being used. Compar ing that with the number of applications purchased will give the num- ber pirated.
SPA made one change in its methodology in 1995, extending it to consider the use of business applications on personal computers in the home. Within the analysis, separate estimates are made for the amount of business software

Griffith 31
TABLE 3 Estimated North American PC Software Sales
($Millions at Retail) 1st Three Quarters of 1995
PClMS-DOS Windows Macintosh
Entertainment $167.5 $178.4 $59.1
Home Education $24.3 $250.6 $67.1
Finance $52.3 $196.4 $31.2
Word Processors $21.6 $824.3 $47.7
Spreadsheets $11.0 $659.9 $34.1
Databases $5.5 $238.3 $16.5
Integrated $1.6 $70.5 $35.0
Utilities $63.7 $244.6 $34.8
Presentation Graphics $1.3 $261.7 $21.8
Drawing & Paintin8 ** $113.6 $124.8
Desktop Publishin8 ** $84.9 $53.5
Other Graphics $14.0 $198.9 $51.8
Project Management $5.8 $127.8 $13.6
P[Ms *" $167.2 $20.3
Lan~;ua~es & Tools $2.9 $148.3 $6.1
Other Productivity $120.7 $486.6 $94.4
Total * $493.2 $4,251.8 $712.1
Other Total
** $405.1
$1.6 $343.6
** $280.0
$7.8 $901.4
$2.4 $707.4
** $2.60.7
** $107.1
$21.5 $364.6
** $285.5
$5.9 $244.4
** $138.3
** $264.8
** $147.2
** $188.5
** $157.8
$14.2 $716.0
$55.3 $5,512.4
used in the home and business settings. The estimates are then totaled and compared with the amount of software sold.
Four sets of data are used in the estimates:
1) Personal computer hardware sales for each country or area, separated into personal and business use markets (tracked by International Data Corporation)
2) Personal computer business software sales, by year (from the SPA International Data Program). The SPA analysis includes all varieties of business applications everything from word processors, spread- sheets, databases and presentation graphics to e-mail clients, program- ruing languages and tools, graphics and desktop publishing packages,

32 Publishing Research Quarterly / Summer 1996
3)
4)
and utilities such as screen savers, and anti-virus packages. In all, the SPA analysis includes sales from twenty-five types of business appli- cations.
Arithmetic average cost per business personal computer software ap- plication (SPA International Data Program)
Average number of applications used per personal computer, by mar- ket (SPA and member research and industry sources)
One assumption crucial to these calculations is that none of the applications sold are sold to the installed base. That assumption is obviously made to simplify the estimate rather than because it reflects reality. It must be made because of the fact that the installed base in many foreign countries is simply unknown especially in the emerging economies that are sources of a great deal of piracy and counterfeiting. The result of the assumption is to reduce the number of computers among which the purchased software is allocated, thus reducing the apparent piracy rate.
The estimation process follows these steps:
1. First we estimate the number of business applications used in homes (as opposed to the number purchased) by multiplying home PC sales by the number of business applications estimated to be used per home PC in each country. Then, we perform the same estimation for busi- ness use by multiplying the number of business applications esti- mated to be used in businesses by PC sales to business. These are summed to reach a total number of applications in use.
2. Next, we estimate the number of applications pirated by subtracting the number of applications sold to the country from the estimated number of applications in use in that country.
3. The piracy dollar loss is calculated by multiplying the number of pi- rated units by the average (mean) cost per application in that country. Those costs are derived from the publishers' revenue data supplied to SPA. We use publishers' revenue, rather than retail price, because we are concerned with losses to the publishers. Retail price would elevate the dollar figures, but the additional revenue would not go to pub- lishers but to other parts of the trade channel.
4. The piracy rate is a simple division of the number of applications pirated by the total number of applications used.
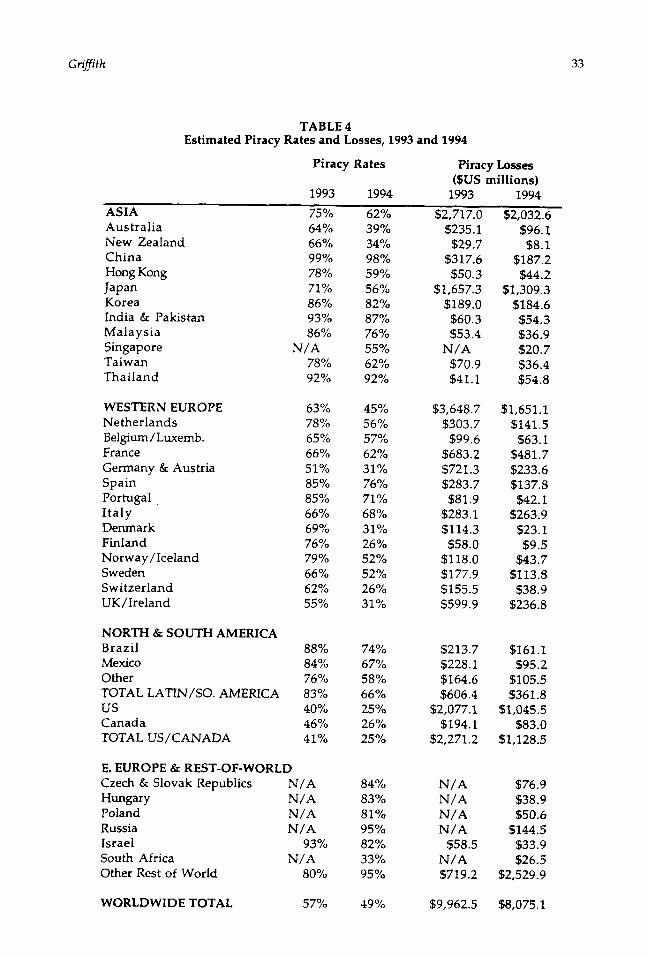
The 1994 software piracy loss table is included as follows in Table 4. These data are publicly available, and are released annually, general ly in mid-February. They are released to the SPA Web page, the Fax-On-Demand service, and in press releases to the trade and general press.
Griffith 33
TABLE 4 Estimated Piracy Rates and Losses, 1993 and 1994
Piracy Rates Piracy Losses ($US mill ions)
1993 1994 1993 1994
ASIA Australia New Zealand China Hong Kong Japan Korea India & Pakistan Malaysia Singapore Taiwan Thailand
75% 62% $2,717.0 $2,032.6 64% 39% $235.1 $96.1 66% 34% $29.7 $8.1 99% 98% $317.6 $187.2 78% 59% $50.3 $44.2 71% 56% $1,657.3 $1,309.3 86% 82% $189.0 $184.6 93% 87% $60.3 $54.3 86% 76% $53.4 $36.9
N/A 55% N/A $20.7 78% 62% $70.9 $36.4 92% 92% $41.1 $54.8
WESTERN EUROPE Netherlands Belgium/Luxemb. France Germany & Austria Spain Portugal I taly Denmark Finland Norway/Iceland Sweden Switzerland UK/Ireland
63% 45% $3,648.7 $1,651.1 78% 56% $303.7 $141.5 65% 57% $99.6 $63.1 66% 62% $683.2 $481.7 51% 31% $721.3 $233.6 85% 76% $283.7 $137.8 85% 71% $81.9 $42.1 66% 68% $283.1 $263.9 69% 31% $114.3 $23.1 76% 26% $58.0 $9.5 79% 52% $118.0 $43.7 66% 52% $177.9 $I13.8 62% 26% $155.5 $38.9 55% 31% $599.9 $236.8
NORTH & SOUTH AMERICA Brazil 88% Mexico 84% Other 76% TOTAL LATIN/SO. AMERICA 83% US 40% Canada 46% TOTAL US/CANADA 41%
E. EUROPE & REST-OF-WORLD
74% $213.7 $161.1 67% $228.1 $95.2 58% $164.6 $105.5 66% $606.4 $361.8 25% $2,077.1 $1,045.5 26% $194.1 $83.0 25% $2,271.2 $1,128.5
Czech & Slovak Republics N/A 84% N/A $76.9 Hungary N/A 83% N/A $38.9 Poland N/A 81% N / A $50.6 Russia N/A 95% N/A $144.5 Israel 93% 82% $58.5 $33.9 South Africa N/A 33% N/A $26.5 Other Rest of World 80% 95% $719.2 $2,529.9
WORLDWIDE TOTAL 57% 49o/o $9,962.5 $8,075.1