softmax pro software user guide
TRANSCRIPT

5014177 F August 2012
SoftMax® Pro Microplate Data Acquisition andAnalysis Software
Version 6
User Guide

2 5014177 F
This document is provided to customers who have purchased Molecular Devices, LLC (“MolecularDevices”) equipment, software, reagents, and consumables to use in the operation of such MolecularDevices equipment, software, reagents, and consumables. This document is copyright protected andany reproduction of this document, in whole or any part, is strictly prohibited, except as MolecularDevices may authorize in writing.
Software that may be described in this document is furnished under a license agreement. It is againstthe law to copy, modify, or distribute the software on any medium, except as specifically allowed in thelicense agreement. Furthermore, the license agreement may prohibit the software from beingdisassembled, reverse engineered, or decompiled for any purpose.
Portions of this document may make reference to other manufacturers and/or their products, whichmay contain parts whose names are registered as trademarks and/or function as trademarks of theirrespective owners. Any such usage is intended only to designate those manufacturers’ products assupplied by Molecular Devices for incorporation into its equipment and does not imply any right and/orlicense to use or permit others to use such manufacturers’ and/or their product names as trademarks.
Molecular Devices makes no warranties or representations as to the fitness of this equipment for anyparticular purpose and assumes no responsibility or contingent liability, including indirect orconsequential damages, for any use to which the purchaser may put the equipment described herein,or for any adverse circumstances arising therefrom.
For research use only. Not for use in diagnostic procedures.
The trademarks mentioned herein are the property of Molecular Devices, LLC or their respective owners. These trademarks may notbe used in any type of promotion or advertising without the prior written permission of Molecular Devices, LLC.
Patents: http://www.moleculardevices.com/productpatents
Product manufactured by Molecular Devices, LLC.1311 Orleans Drive, Sunnyvale, California, United States of America 94089.Molecular Devices, LLC is ISO 9001 registered.© 2012 Molecular Devices, LLC.All rights reserved.

5014177 F 3
Contents
Chapter 1: Installation and Setup 7
Computer System Requirements 8
Installing SoftMax Pro Software 9
Uninstalling SoftMax Pro Software 9
Starting the Software 10
Registering the Software 10
Selecting and Connecting to an Instrument 11
Setting Instrument Calibration Options 12
Troubleshooting Instrument Connections 13
Unlocking the SpectraMax Paradigm Multi-Mode Detection PlatformDrawers 13
Getting Help 14
Chapter 2: User Interface Overview 17
Workflow Overview 17
Main Window 20
Navigation Tree 21
Workspace Views 21
Ribbon Toolbar 24
Application Menu 39
Quick-Access Toolbar 40
Integrated Web Browser 41
Using Automation Mode 42
Chapter 3: File and Application Management 43
File Types 43
Creating a New Data File 45
Opening a Data File 46
Saving Data Files 47
Copying and Pasting Data 47
Managing Protocol Files 48
Creating a New Protocol File 53
Opening a Protocol File 54
Saving Protocol Files 55

4 5014177 F
Setting Auto Save Options 56
Printing 60
Saving Data in a PDF File 65
Exporting Plate Data 68
Setting Application Options 69
Chapter 4: Workspace Sections 71
Using a Notes Section 72
Using a Plate Section 82
Using a Cuvette Set Section 90
Using a Group Section 100
Using a Graph Section 110
Chapter 5: Instrument and Detection Settings 111
Supported Read Types 111
Supported Read Modes 112
Supported Instruments 119
Instrument Settings 142
Chapter 6: Collecting Data 159
Creating a Protocol 159
Configuring a Microplate Template 162
Creating an Absorbance Mode Protocol 174
Creating a Fluorescence Intensity Mode Protocol 176
Creating a Luminescence Mode Protocol 184
Creating a Time-Resolved Fluorescence Mode Protocol 186
Creating a Fluorescence Polarization Mode Protocol 188
Creating an AlphaScreen Mode Protocol 190
Creating a FRET Mode Protocol 192
Saving the Settings to a Protocol File 193
Collecting Data from a Microplate 194
Collecting Data From a Cuvette 203
Chapter 7: Analyzing Data 207
Calculations and Numerical Precision 208
Setting the Data Display Options 210
Performing Data Reduction 214
Viewing Data in a Three-Dimensional Graph 226
SoftMax Pro Software User Guide
5014177 F 5
Graphing Data 233
Chapter 8: Maintaining and Calibrating an Instrument 259
Calibrating the Reader 259
Configuring the Filters for Emax and Vmax ELISA Microplate Readers 260
Using the Instrument Information Dialog 260
Viewing Instrument Software Support 268
Chapter 9: Using SoftMax Pro GxP Software Features 269
Setting Up User Accounts for SoftMax Pro GxP Software 270
Connecting a User Account File 270
Logging onto SoftMax Pro GxP Software 272
Viewing the User Information 273
Changing the User Password 274
Working with GxP Statements 275
Viewing the GxP Audit Trail 281
Locking and Unlocking Sections 283
Glossary 285
Index 297

6 5014177 F
5014177 F 7
Chapter 1: Installation and Setup
SoftMax® Pro Microplate Data Acquisition and Analysis Software controlsMolecular Devices spectrophotometers, absorbance, luminescence, andfluorescence microplate readers, and the SpectraMax® Paradigm® Multi-ModeDetection Platform. For a complete list of the instruments supported by this releaseof the SoftMax Pro Software, see Supported Instruments on page 119.
The software provides extensive data calculation and analysis capabilities under aGood Manufacturing Practices (GMP), Good Laboratory Practices (GLP) workenvironment for pharmaceutical, biotechnology, academic, hospital, andgovernment customers.
Over 120 assay protocols are included in the software to speed life scienceresearch and drug discovery assay development and screening. Researchers cancustomize experiment protocols, analyze and display data, and create meaningfulreports. The straightforward yet powerful programming capabilities of the SoftMaxPro Software can further enhance any specialized data collection and analysisneeds through custom assay development.
This software package is widely integrated with industry-leading robotics systems.
This guide describes features available in SoftMax Pro Software version 6 andlater. SoftMax Pro Software 6 is available for a PC-compatible computer using theWindows 7 or Windows XP operating system.
This section contains the following topics:
Computer System Requirements on page 8
Installing SoftMax Pro Software on page 9
Uninstalling SoftMax Pro Software on page 9
Starting the Software on page 10
Registering the Software on page 10
Selecting and Connecting to an Instrument on page 11
Setting Instrument Calibration Options on page 12
Troubleshooting Instrument Connections on page 13
Unlocking the SpectraMax Paradigm Multi-Mode Detection Platform Drawers onpage 13
Getting Help on page 14

Chapter 1: Installation and Setup
8 5014177 F
Computer System RequirementsSoftMax Pro Software version 6 can be installed on a computer with the followingsystem specifications.
Minimum and Recommended Requirements
Software
Windows XP, 32-bit (x86), with Service Pack 3
Recommended:Windows 7, 32-bit or 64-bit (x86 or x64)
.NET Framework 4.01
Internet connection or external USB drive
Recommended: Internet connection
Hardware
Computer that has a 2 GHz or faster processor
Recommended: Quad core or faster CPU2
RS-232 serial port or USB 2.0 port with a Keyspan USB-to-serial adapter3
Recommended: RS-232 serial port
2 GB RAM
Recommended: 4 GB RAM2
200 MB of available hard disk space
Recommended: 500 MB of available hard disk space
1024 x 768 or higher-resolution display
Recommended: 1280 x 1024 or higher-resolution display
CD-ROM Drive
1 .NET Framework 4.0 is installed automatically by the SoftMax Pro Software installer if necessary.
2 If running in a virtual machine, Molecular Devices recommends a quad-core or faster processorwith at least 6 GB RAM.
3 Keyspan USB-to-serial adapters have been field tested and approved by Molecular Devices.
SoftMax Pro Software User Guide
5014177 F 9
Installing SoftMax Pro Software
Note: Molecular Devices recommends that you disable your anti-virusprogram before installing SoftMax Pro Software, as it might interfere withthe installation process.
To install SoftMax Pro Software:
1. Insert the SoftMax Pro Software CD into the CD-ROM drive. The installationprogram starts automatically.
2. If the installation program does not start, navigate to your CD-ROM drive anddouble-click SoftMaxPro6.2.2Setup.exe.
To install the GxP version, double-click SoftMaxPro6.2.2GxPSetup.exe.
3. Follow the on-screen instructions.
4. Optionally, re-enable anti-virus programs.
Note: If you have anti-virus programs installed, Molecular Devicesrecommends that you add the SafeNet HASP License Manager Service(hasplms.exe) to the list of trusted applications in your anti-virus programs.
Uninstalling SoftMax Pro SoftwareBefore uninstalling the program, make sure to backup your data and any savedfiles to a folder outside of the SoftMax Pro Software folder.
1. Click Start > Control Panel.
2. Click Programs and Features.
In Windows XP, double-click Add or Remove Programs.
3. In the list that appears, click SoftMax Pro 6.2.2 and then click Uninstall orRemove.
To uninstall the GxP version, click SoftMax Pro 6.2.2 GxP.
Note: This is the recommended method of removing SoftMax Pro Softwarefrom a Windows-based computer since it also removes related informationfrom the Windows Registry.
Chapter 1: Installation and Setup
10 5014177 F
Starting the SoftwareTo start the software under normal conditions, wait for the connected instrument tocomplete its start-up sequence, and then double-click the SoftMax Pro 6.2.2 iconon your desktop to start the program. To start the program from the Windows Startmenu, click Start > All Programs > Molecular Devices > SoftMaxPro 6.2.2 > SoftMax Pro 6.2.2.
For the GxP version, double-click the SoftMax Pro 6.2.2 GxP icon or click Start> All Programs > Molecular Devices > SoftMax Pro 6.2.2 GxP > SoftMaxPro 6.2.2 GxP.
If you are using the SoftMax Pro GxP Software, you are asked to log on before youcan continue. Type your administrator-assigned user ID and your password, andthen click Log On. See Logging onto SoftMax Pro GxP Software on page 272.
Note: You can start the SoftMax Pro Software with or without an attachedinstrument. When no instrument is attached you cannot acquire data. Toperform operations that require data you must be able to open an existingdata file.
Registering the SoftwareThe software product key can be found on an insert in the SoftMax Pro Software CDpackage. The instrument serial number is located on a label affixed to the back ofthe instrument.
Activating Your Software License
To activate your SoftMax Pro Software license:
1. Start the SoftMax Pro Software application.
2. Click the Help tab in the ribbon.
3. Click Software License .
4. If you have internet connectivity, type the Product Key in the field and clickActivate Online, and then follow the on-screen instructions.
5. If you do not have internet connectivity, click Activate Offline and follow theon-screen instructions.
To activate offline, you need your Product Key, a computer with internetconnectivity, and a USB drive for transferring files between the computers.
On the Internet-enabled computer, go to:https://smplicensing.moleculardevices.com

SoftMax Pro Software User Guide
5014177 F 11
Selecting and Connecting to an InstrumentTo select a reader instrument:
1. Click on the Instrument icon on the Home tab. The Instrument Connectiondialog opens.
2. In the Available Instruments list, select the communication port to which theinstrument is connected or select Offline.
Note: It is not necessary to be physically connected to an instrument tocreate a protocol. If you are not connected to an instrument, selectOffline and you can select a reader to work with.
3. When you are working offline, select Offline and then select the reader youwant to connect to from the Reader menu.
4. Optionally, to work in simulation mode, select Offline, select the reader fromthe Reader menu, and then click Simulator On.
5. Click OK. An icon for the selected instrument appears on the Home tab.
Note: The Information button on the lower-left of the dialog is provided fortroubleshooting purposes only.
SoftMax Pro Software supports the following instruments:
VersaMax ELISA Microplate Reader, see page 120
SpectraMax Plus 384 Absorbance Microplate Reader, see page 120
SpectraMax M2 and M2e Multi-Mode Microplate Readers, see page 121

Chapter 1: Installation and Setup
12 5014177 F
SpectraMax M3 Multi-Mode Microplate Reader, see page 122
SpectraMax M4 Multi-Mode Microplate Reader, see page 123
SpectraMax M5 and M5e Multi-Mode Microplate Readers, see page 124
SpectraMax 340PC 384 Absorbance Microplate Reader, see page 124
SpectraMax 190 Absorbance Microplate Reader, see page 125
Gemini XPS Fluorescence Microplate Reader, see page 125
Gemini EM Fluorescence Microplate Reader, see page 126
FilterMax F5 Multi-Mode Microplate Reader, see page 127
FilterMax F3 Multi-Mode Microplate Reader, see page 128
DTX 800 and DTX 880 Multi-Mode Microplate Readers, see page 128
Vmax Kinetic ELISA Microplate Reader, see page 129
Emax Endpoint ELISA Microplate Reader, see page 129
SpectraMax Paradigm Multi-Mode Detection Platform, see page 130
StakMax Microplate Handling System, see page 141
When connected to a SpectraMax Paradigm instrument, see Selecting theSpectraMax Paradigm Detection Cartridge on page 161.
Setting Instrument Calibration OptionsTo calibrate the reader:
1. Click Calibration on the Operations tab in the ribbon.
The Calibration dialog opens.
2. To calibrate a plate, select Plate and click Calibrate Now.
3. To calibrate a cuvette, select Cuvette and click Calibrate Now.
4. When the calibration indicator shows that the calibration is complete, clickClose.
The calibration values determined using this operation are stored in the firmwareof the instrument.
Note: If the Calibration button is not active in the Operations tab, theneither the instrument is not connected to the computer or the connectedinstrument does not support the calibration process.
SoftMax Pro Software User Guide
5014177 F 13
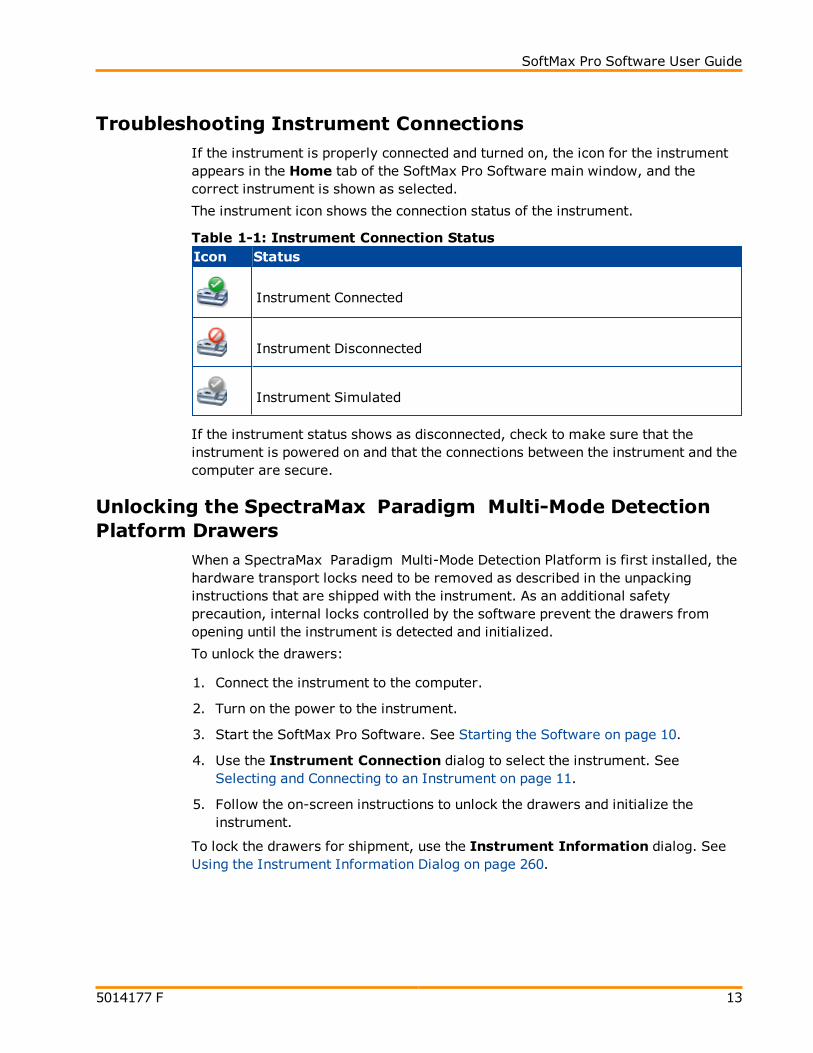
Troubleshooting Instrument ConnectionsIf the instrument is properly connected and turned on, the icon for the instrumentappears in the Home tab of the SoftMax Pro Software main window, and thecorrect instrument is shown as selected.
The instrument icon shows the connection status of the instrument.
Icon Status
Instrument Connected
Instrument Disconnected
Instrument Simulated
Table 1-1: Instrument Connection Status
If the instrument status shows as disconnected, check to make sure that theinstrument is powered on and that the connections between the instrument and thecomputer are secure.
Unlocking the SpectraMax Paradigm Multi-Mode DetectionPlatform Drawers
When a SpectraMax Paradigm Multi-Mode Detection Platform is first installed, thehardware transport locks need to be removed as described in the unpackinginstructions that are shipped with the instrument. As an additional safetyprecaution, internal locks controlled by the software prevent the drawers fromopening until the instrument is detected and initialized.
To unlock the drawers:
1. Connect the instrument to the computer.
2. Turn on the power to the instrument.
3. Start the SoftMax Pro Software. See Starting the Software on page 10.
4. Use the Instrument Connection dialog to select the instrument. SeeSelecting and Connecting to an Instrument on page 11.
5. Follow the on-screen instructions to unlock the drawers and initialize theinstrument.
To lock the drawers for shipment, use the Instrument Information dialog. SeeUsing the Instrument Information Dialog on page 260.

Chapter 1: Installation and Setup
14 5014177 F
Getting HelpSoftMax Pro Software has a comprehensive help library. You can open theapplication help documents from the Help tab in the ribbon.
Click SoftMax Pro Help to view the SoftMax Pro Application Help. Thishelp contains task-oriented information about how to use SoftMax ProSoftware. You can find topics through the table of contents and by using thesearch function. This document also features a linked index and glossary.
Click Formula Reference to view the SoftMax Pro Formula ReferenceGuide. This document is broken into four main sections:
The first section provides a general introduction to SoftMax Pro Softwareformulas.
Operators describes the different types of operators that can be used tobuild formulas.
Functions describes the different types of built-in functions that can beused to build formulas.
Accessors describes the special functions that provide access to otherspecific information.
You can find topics through the table of contents and by using the searchfunction. This document also features a linked index.
Click Release Notes to view the SoftMax Pro Software Release Notes forthis release of the software. This document is in PDF format and can be viewedusing a PDF viewer like Adobe Reader.
Click Contact Us to display the SoftMax Pro Software What's New page,view the Molecular Devices home page, access the knowledge base, or requesttechnical support.
The knowledge base contains documentation supporting Molecular Devicesproducts. You can use the customer login tools and featured links to help youget the information you need.
Click Software License and follow the instructions in the SoftwareLicense Activation dialog to activate your SoftMax Pro Software license.
Click SoftMax Pro in the About section to see release information aboutthis release of the SoftMax Pro Software application.

SoftMax Pro Software User Guide
5014177 F 15
Context-sensitive help is available for the dialogs that have a help button.
Additional documentation in PDF format can be found in the Windows Start menu.
To view the SoftMax Pro User Guide, the Formula Reference Guide, or theSoftware Release Notes, click Start > All Programs > Molecular Devices> SoftMax Pro 6.2.2 and then click the document you want to view.
To view user guides for the supported instruments, click Start >All Programs > Molecular Devices > SoftMax Pro 6.2.2 >Hardware User Guides and then click the document you want to view.
These documents are in PDF format and can be viewed using a PDF viewer likeAdobe Reader.

Chapter 1: Installation and Setup
16 5014177 F
5014177 F 17
Chapter 2: User Interface Overview
If you are familiar with earlier versions of SoftMax Pro Software, adapting to thenew SoftMax Pro Software 6 user interface is quick and easy. The SoftMax ProSoftware 6 user interface provides advanced features and state-of-the-artnavigation, analysis, and data display tools, plus it also supports a version of theclassic SoftMax Pro Software interface.
SoftMax Pro Software 6 improves the basic functionality of earlier versions of thesoftware, and it adds new features that further contribute to the usability ofSoftMax Pro Software's powerful computing engine.
Workflow OverviewSoftMax Pro Software allows you to set up and run a complete protocol for thesupported instruments. Instrument settings can be saved as a protocol (template)file and used repeatedly for reading different microplates or cuvettes. Allstandalone instrument functions can be controlled using the software.
1. Select an instrument. See Selecting and Connecting to an Instrument on page11.
You can add as many plate or cuvette sections as your experiment needs.
2. Click a plate or cuvette section to make it active in the workspace.
The Home tab changes to reflect the tools available for the active plate orcuvette section.
After selecting a Plate section, you can use the Plate Setup Helper to helpyou set up a microplate experiment. See Using the Plate Setup Helper on page19.
3. Create a protocol. Click the Settings button to set the instrument options.See Selecting Instrument Settings on page 160.
As you create the protocol, you might need to click the Template buttonto add a plate template which can include defining groups, blank cells, and asample series. See Configuring a Microplate Template on page 162.
Click OK to save the settings.
Chapter 2: User Interface Overview
18 5014177 F
4. Click the Read button to run the protocol and have SoftMax Pro Softwarecollect and store all raw data received from the instrument. See Collecting Datafrom a Microplate on page 194 or Collecting Data From a Cuvette on page 203.
As information is read, the SoftMax Pro Software display updates showing the
new data. During the read, the read button changes to . You can click thisbutton to stop the read operation. Data is displayed in a grid format thatcorresponds to the wells in a microplate or individual cuvettes.
SoftMax Pro Software can collect data from one or more microplates orcuvettes and store it in a single data file, using the same or different instrumentsettings for different microplates or cuvettes. For example, microplatescontaining different samples can be read using the same or different modes, allwithin the same experiment.
5. View and analyze the data. See Setting the Data Display Options on page 210,Performing Data Reduction on page 214, and Graphing Data on page 233.
You can manipulate or reduce the raw data using dozens of built-in formulas ordefine your own analysis structure to quickly and easily summarize the rawdata. More than one reduction can be shown, and results from differentmicroplates and cuvettes can be compared within the same experiment.
Note: After you have defined instrument settings, and have customized aSoftMax Pro Software data file with assay information, reduction settings,custom columns in Group sections, and summary objects, you can save thefile as a Protocol file type to create an assay template. This template canthen be used and distributed throughout a department or company for highlyrepeatable data collection and analysis.

SoftMax Pro Software User Guide
5014177 F 19
Using the Plate Setup Helper
When you open a new SoftMax Pro Software file, the Plate Setup Helper opens tohelp you set up a microplate experiment. You can also open the Plate Setup
Helper by clicking Plate Setup Helper in the toolbar at the top of the activePlate section.
The wizard-like Plate Setup Helper visually guides you through the tasksavailable in the software to setup a microplate to acquire data. To complete a task,click its button. After you complete a task, the settings for the task are saved, andyou return to the helper to select another task. The tasks do not need to beperformed in the order they are presented in the helper. However, you must selectthe instrument before defining your acquisition settings, since the settings arespecific to the instrument.
Configure tells you the name of the active Plate section. Acquisition settings areapplied to the entire Plate section. If you have a plate clone selected, then thelayout, analysis, and display settings are applied to the selected clone. Forinformation about Plate sections, see Using a Plate Section on page 82.
Current Instrument tells you the name of the currently selected instrument. Theimage in the button below it shows you the instrument and its connection status.You must select the instrument before defining your acquisition settings, since thesettings are specific to the instrument. To choose a different instrument or changeits status, click the button. See Selecting an Instrument on page 26.

Chapter 2: User Interface Overview
20 5014177 F
To complete a task, click its button.
To configure your acquisition settings, click . See Instrument Settings onpage 142.
To configure your plate layout, click . See Configuring a MicroplateTemplate on page 162.
To choose data analysis settings, click . See Performing Data Reduction onpage 214.
To choose your display settings, click . See Setting the Data DisplayOptions on page 210.
To prevent the Plate Setup Helper from automatically starting each time youopen a new protocol, select the Do not open this Helper with new protocolscheck box. You can enable this option again in the SoftMax Pro Options dialog.See Setting Application Options on page 69.
To close the Plate Setup Helper, click Done.
Main WindowThe SoftMax Pro Software window has three main areas: the navigation tree on theleft, the workspace area on the right, and the ribbon toolbar along the top. Inaddition, the application menu and quick-access toolbar in the upper-left cornergive you easy access to file and application management features.
SoftMax Pro Software User Guide
5014177 F 21
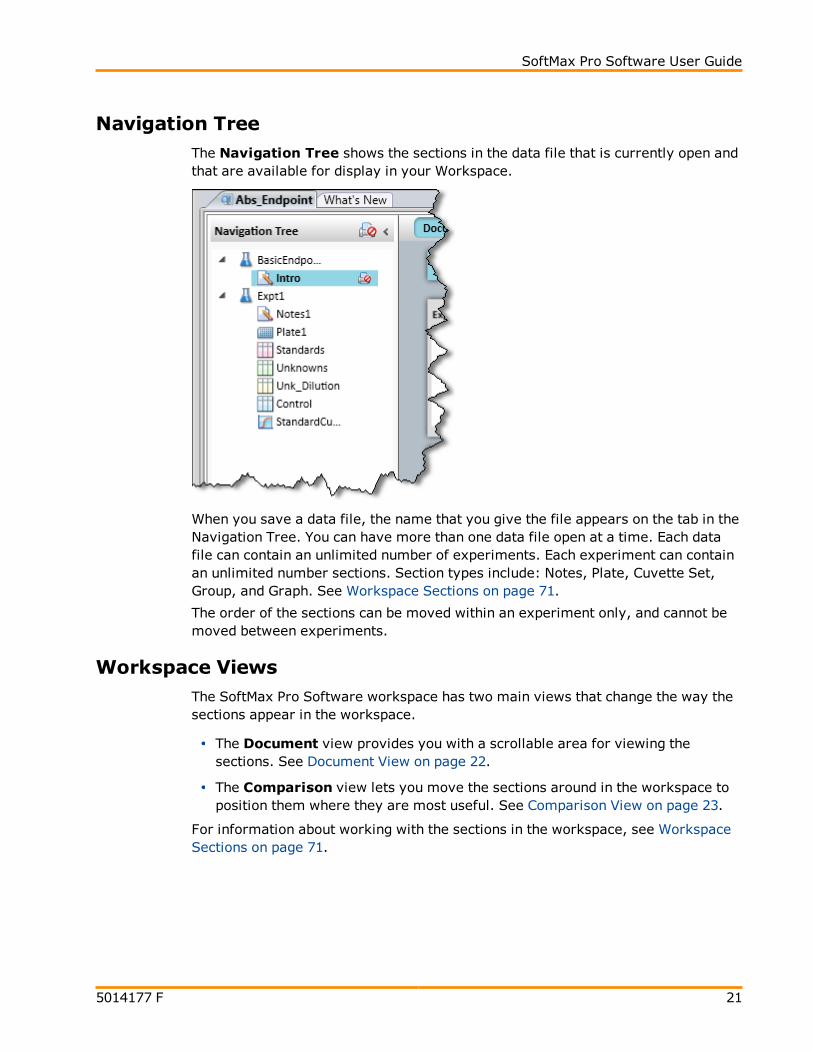
Navigation TreeThe Navigation Tree shows the sections in the data file that is currently open andthat are available for display in your Workspace.
When you save a data file, the name that you give the file appears on the tab in theNavigation Tree. You can have more than one data file open at a time. Each datafile can contain an unlimited number of experiments. Each experiment can containan unlimited number sections. Section types include: Notes, Plate, Cuvette Set,Group, and Graph. See Workspace Sections on page 71.
The order of the sections can be moved within an experiment only, and cannot bemoved between experiments.
Workspace ViewsThe SoftMax Pro Software workspace has two main views that change the way thesections appear in the workspace.
The Document view provides you with a scrollable area for viewing thesections. See Document View on page 22.
The Comparison view lets you move the sections around in the workspace toposition them where they are most useful. See Comparison View on page 23.
For information about working with the sections in the workspace, see WorkspaceSections on page 71.

Chapter 2: User Interface Overview
22 5014177 F
Document View
Document view displays information in a manner that is similar to previousSoftMax Pro Software releases. The Document view provides you with a scrollablearea for viewing the sections. To view a section either click on it in the navigationtree or use the scroll bar until the desired section comes into view.
For information about working with the sections in the workspace, see WorkspaceSections on page 71.

SoftMax Pro Software User Guide
5014177 F 23
Comparison View
To change to the Comparison view, click the Comparison button.
The Comparison view provides you with advanced display options. In Comparisonview you can move the sections around in the workspace to position them wherethey are most useful.
You can drag sections from the navigation tree and position them in theworkspace.
Sections can overlap.
Double clicking a section in the navigation tree adds that section to the bottomof the workspace.
For information about working with the sections in the workspace, see WorkspaceSections on page 71.

Chapter 2: User Interface Overview
24 5014177 F
Ribbon ToolbarThe application ribbon contains tabs with the tools needed to work with SoftMax ProSoftware.
Home TabThe Home tab always contains the following sections:
Instrument
Controls and Read Status
Sections
See Using Instrument Controls in the Home Tab on page 26 and Using SectionControls in the Home Tab on page 29.
The contents of the Home tab change depending on the section type that is activein the workspace.
Notes Section Tools
When a Notes section is active the Home tab contains:
Notes Controls
Formatting Tools
See Using a Notes Section on page 72.
Plate Section Tools
When a Plate section is active, the Home tab contains:
Plate Tools
Template Tools
See Using Plate Tools on page 83.
Cuvette Section Tools
When a Cuvette Set section is active, the Home tab contains:
Cuvette Tools
Template Tool
See Using Cuvette Tools on page 91.
Group Section Tools
When a Group section is active, the Home tab contains:
Column Tools
Summary Tools
Formatting Tools
See Using Column Tools on page 104.

SoftMax Pro Software User Guide
5014177 F 25
Graph Section Tools
When a Graph section is active, the Home tab contains:
Graph Tools
See Working with Graphs on page 234.
Protocols TabThe Protocols tab contains the following:
Protocol Manager
Community
See Using the Protocols Tab to Manage Protocols on page 32.
View TabThe View tab contains the following:
Show/Hide Panel
Document View
See Using the View Tab on page 34.
Operations TabThe Operations tab contains the following:
Instrument Tools
Calculations
Automation
See Using the Operations Tab on page 34.
GxP TabThe GxP tab is available only when using the SoftMax Pro GxP Software andcontains the following:
User Account
Data
See Using the GxP Tab on page 36.
Help TabThe Help tab contains the following:
Help
About
See Using the Help Tab on page 37.
Chapter 2: User Interface Overview
26 5014177 F
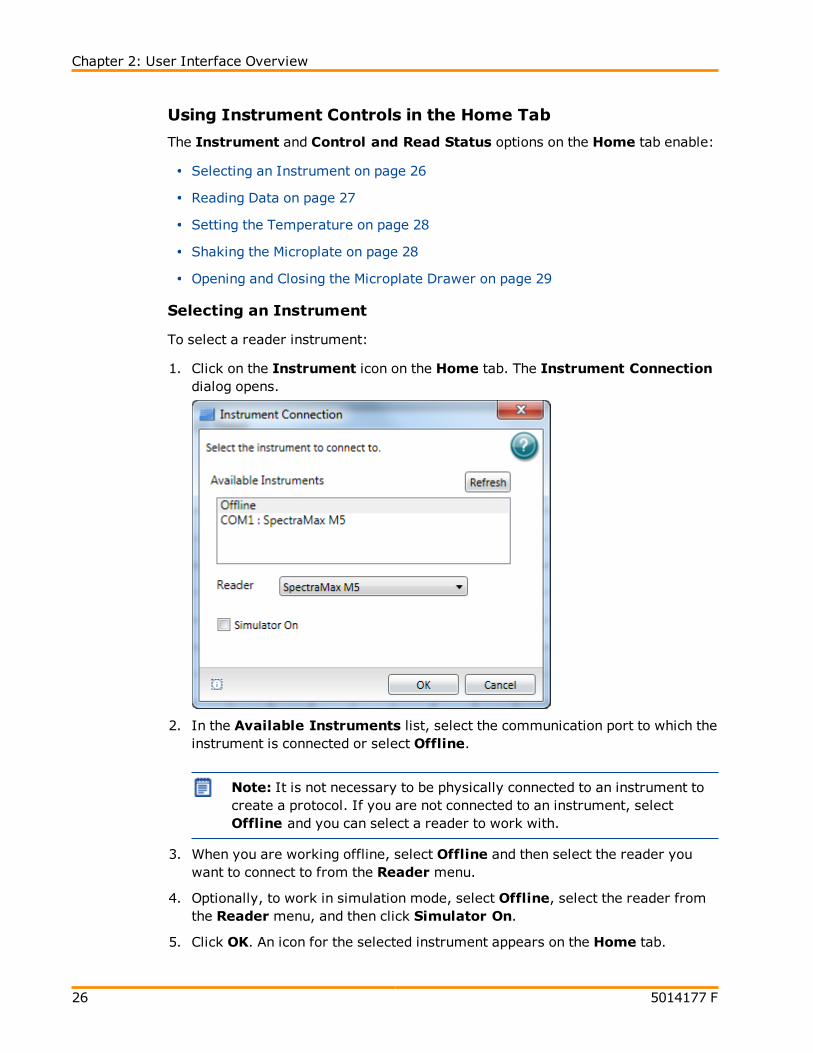
Using Instrument Controls in the Home Tab
The Instrument and Control and Read Status options on the Home tab enable:
Selecting an Instrument on page 26
Reading Data on page 27
Setting the Temperature on page 28
Shaking the Microplate on page 28
Opening and Closing the Microplate Drawer on page 29
Selecting an Instrument
To select a reader instrument:
1. Click on the Instrument icon on the Home tab. The Instrument Connectiondialog opens.
2. In the Available Instruments list, select the communication port to which theinstrument is connected or select Offline.
Note: It is not necessary to be physically connected to an instrument tocreate a protocol. If you are not connected to an instrument, selectOffline and you can select a reader to work with.
3. When you are working offline, select Offline and then select the reader youwant to connect to from the Reader menu.
4. Optionally, to work in simulation mode, select Offline, select the reader fromthe Reader menu, and then click Simulator On.
5. Click OK. An icon for the selected instrument appears on the Home tab.
SoftMax Pro Software User Guide
5014177 F 27
Note: The Information button on the lower-left of the dialog is provided fortroubleshooting purposes only.
SoftMax Pro Software supports the following instruments:
VersaMax ELISA Microplate Reader, see page 120
SpectraMax Plus 384 Absorbance Microplate Reader, see page 120
SpectraMax M2 and M2e Multi-Mode Microplate Readers, see page 121
SpectraMax M3 Multi-Mode Microplate Reader, see page 122
SpectraMax M4 Multi-Mode Microplate Reader, see page 123
SpectraMax M5 and M5e Multi-Mode Microplate Readers, see page 124
SpectraMax 340PC 384 Absorbance Microplate Reader, see page 124
SpectraMax 190 Absorbance Microplate Reader, see page 125
Gemini XPS Fluorescence Microplate Reader, see page 125
Gemini EM Fluorescence Microplate Reader, see page 126
FilterMax F5 Multi-Mode Microplate Reader, see page 127
FilterMax F3 Multi-Mode Microplate Reader, see page 128
DTX 800 and DTX 880 Multi-Mode Microplate Readers, see page 128
Vmax Kinetic ELISA Microplate Reader, see page 129
Emax Endpoint ELISA Microplate Reader, see page 129
SpectraMax Paradigm Multi-Mode Detection Platform, see page 130
StakMax Microplate Handling System, see page 141
Reading Data
After you have your experiment defined and your prepared microplate or cuvetteinserted in the reader, you can start a read.
To start a read, click the plate or cuvette section in the workspace, and then click
the Read button in the Home tab of the ribbon.

Chapter 2: User Interface Overview
28 5014177 F
Setting the Temperature
When connected to an instrument with temperature control, you can set thetemperature in the microplate or cuvette chamber in degrees Celsius.
To set the temperature:
1. Connect to an instrument that is capable of temperature control.
2. Click Temperature on the Home tab in the ribbon.
The Temperature Control dialog opens.
3. Click On.
4. Type the desired temperature in degrees Celsius.
5. Click OK.
With the SpectraMax M2, M2e, M5, M5e, and Plus 384, the Instrument section ofthe Home tab shows the temperature within the microplate chamber. This can bedifferent from the front panel of the instrument, which displays the temperaturewithin the cuvette chamber.
The readings should be very similar to one another after both chambers havereached equilibrium. During warm-up, however, you might notice a discrepancy intemperatures, which is normal.
Shaking the Microplate
If the selected instrument allows manual shaking, then the Shake button isavailable in the Controls and Read Status section on the Home tab in theribbon.
To shake the plate:
1. Insert the prepared microplate into the connected instrument.
2. Click and hold Shake on the Home tab in the ribbon.
3. Release the mouse button to stop the shaking operation.

SoftMax Pro Software User Guide
5014177 F 29
Opening and Closing the Microplate Drawer
To open and close the microplate drawer on the connected instrument:
1. Click Open / Close on the Home tab in the ribbon to open the microplatedrawer.
2. Insert or remove the prepared microplate in the instrument.
3. With the microplate drawer open on the connected instrument, clickOpen / Close on the Home tab in the ribbon to close the microplatedrawer.
Using Section Controls in the Home Tab
The Section controls appear on the Home tab in the ribbon. For information aboutthe section controls, see the following topics:
Creating an Experiment on page 29
Creating a Notes Section on page 30
Deleting a Section on page 30
Creating a Plate Section on page 30
Creating a New Graph Section on page 31
Creating a Cuvette Set Section on page 31
Creating an Experiment
To create a new Experiment:
1. Open a data file in the workspace.
2. If you have more than one Experiment, select the Experiment that you want toduplicate to make the new Experiment.
3. Click New Experiment in Sections on the Home tab in the ribbon.
A duplicate of the selected Experiment appears below the selected Experiment inthe Navigation Tree. The sections and settings are duplicated, but the data is not.

Chapter 2: User Interface Overview
30 5014177 F
Creating a Notes Section
To create a Notes section:
1. Select the experiment where you want to add a Notes section in theNavigation Tree.
2. If you have more than one section in the Experiment, select the section abovewhere you want the new Notes section to appear in the Navigation Tree.
3. Click New Note in Sections on the Home tab in the ribbon.
A new blank Notes section appears below the selected section in the NavigationTree. See Using a Notes Section on page 72.
Deleting a Section
To delete a section:
1. Select the section or sections that you want to delete in either the NavigationTree or a section in the Workspace. To delete and entire Experiment. select theExperiment in the Navigation Tree.
Note: To select multiple sections, press and hold the Ctrl or Shift keyand then click the sections you want to select in the Navigation Tree.
2. Click Delete Selection in Sections on the Home tab in the ribbon.
Deleting a section or experiment cannot be undone. When you delete a Platesection, the data from the Plate section is also deleted.
Creating a Plate Section
To create a new Plate section:
1. Select the Experiment where you want to add a Plate section in theNavigation Tree.
2. If you have more than one section in the Experiment, select the section abovewhere you want the new Plate section to appear in the Navigation Tree.
3. Click New Plate in Sections on the Home tab in the ribbon.
A new blank Plate section appears below the selected section in the NavigationTree. See Using a Plate Section on page 82.

SoftMax Pro Software User Guide
5014177 F 31
Creating a New Graph Section
To create a new graph:
1. Select the Plate section to relate to the graph in either the Navigation Treeor the Workspace.
2. Click New Graph in Sections on the Home tab in the ribbon.
3. In the New Graph dialog, set the options for the graph. See Creating a NewGraph on page 237.
4. When the graph options have been set, click OK.
A new Graph section appears below the selected section in the Navigation Tree.See Using a Graph Section on page 110.
Creating a Cuvette Set Section
To create a new Cuvette Set section:
1. Select the experiment you want to add the Cuvette Set section to in theNavigation Tree.
2. If you have more than one section in the Experiment, select the section abovewhere you want the new Cuvette Set section to appear in the NavigationTree.
3. Click New Cuvette Set in Sections on the Home tab in the ribbon.
A new blank Cuvette Set section appears below the selected section in theNavigation Tree. See Using a Cuvette Set Section on page 90.
Chapter 2: User Interface Overview
32 5014177 F
Using the Protocols Tab to Manage Protocols
The Protocols tab in the ribbon provides easy access to protocol files that arestored in the file system. It also gives you access to the SoftMax Pro Softwareuser’s community for protocol sharing, exchanging tips and tricks, and networkingwith other experienced users.
Protocol files are experiment template files that contain microplate well layoutassignments and all other reader configuration information, but no data.
After the SoftMax Pro Software is installed, the Basic Endpoint protocol is set as thedefault protocol with the filename default.spr. Whenever you create a newdocument, the default.spr protocol file is opened as an untitled document thatcontains the settings from the default protocol file.
You can save the settings of the file currently active in the workspace as the defaultprotocol. After you save the active protocol file as the default, whenever youcreate a new document, the settings in the default.spr file that you have savedare loaded into an untitled document.
A large number of predefined protocols are installed with SoftMax Pro Softwareand are placed in the SoftMax Pro Software Protocols folder.
You can use the predefined protocols and you can create your own protocols. Formore information on protocols, see Creating a Protocol on page 159. When youcreate protocols, save them into folders on your file system. Name the foldersappropriately so that you will be able to find the protocols.

SoftMax Pro Software User Guide
5014177 F 33
Three buttons are provided on the Protocol Manager area of the Protocols tab:
Click Folder Locations to add the folders containing the protocols you want touse to the short cut menu you can access by clicking Protocol Manager. SeeAdding or Removing a Folder in the Protocol Manager on page 50.
Click Save As Default to overwrite the default.spr file with the protocolsetting of the experiment that is active in your workspace. See Saving aProtocol as the Default Protocol on page 49.
Note:When you save the file as the default protocol, any data you havecollected in the current experiment remains unaltered. If you want tokeep the data, you need to save the data into a data file.
Click Protocol Manager to open the Protocol Manager shortcut and select aprotocol to be assigned to the open experiment. See Using the ProtocolManager to Open a File on page 49.
Note: When you add a new plate or cuvette section to an experiment,you can configure settings using the Settings dialog or apply a pre-defined or saved protocol to the new section.
Two buttons are provided in the Community area of the Protocols tab:
Click Protocol Home Page to access the SoftMax Pro Software communityweb site for protocol sharing, exchanging tips and tricks, and networking withother experienced users. To access this site, you must have internet access onyour computer.
Click Export for Sharing to export the active protocol to an encrypted fileformat for sharing with the online community. No data is exported with theprotocol. Before exporting the protocol, make sure that the first Notes sectionhas a clear description of the protocol, since the first Notes section will be usedas the description of the protocol on the web site.
After exporting a protocol for sharing, you can upload the exported protocol tothe community web site. Protocols exported for sharing have a .spz extension.Do not rename the file. The file is encrypted and will not upload properly if it isrenamed. To upload your exported protocol, follow the instructions on thecommunity web site.

Chapter 2: User Interface Overview
34 5014177 F
Using the View Tab
The View tab in the ribbon contains two sections: Show/Hide Panel andDocument View.
In the Show/Hide Panel section, select or clear the Navigation Tree check boxto show or hide the Navigation Tree in the workspace.
In the Document View section, click an option to change the layout of the tabs inthe workspace.
Click Single Tab Group to view one tab group at a time.
Click New Horizontal Tab Group to split the workspace horizontally.The selected tab moves below inactive tabs in the workspace. You can have asmany horizontal areas as you have tabs in the workspace.
Click New Vertical Tab Group to split the workspace vertically. Theselected tab moves to the right of inactive tabs in the workspace. You can haveas many vertical areas as you have tabs in the workspace.
Using the Operations Tab
Instrument ToolsThe buttons that appear in the Instrument Tools group depend on the currentlyselected instrument.
Calibration: The instrument calibration values are stored in the firmware ofthe instrument. For information about updating the instrument calibration, seeCalibrating the Reader on page 259.
Filters: The positions of the filters in the Emax and Vmax ELISA MicroplateReaders can be defined using the Filter Configuration dialog. Forinstructions, see Configuring the Filters for Emax and Vmax ELISA MicroplateReaders on page 260.
Info: In the Instrument Information dialog, you can view a list of theinstalled detection cartridges in a SpectraMax Paradigm Multi-Mode DetectionPlatform or the installed filters in FilterMax F3 and F5 Multi-Mode MicroplateReaders. This dialog also lists other instrument information like the serialnumber and firmware version. For FilterMax F3 and F5 Multi-Mode MicroplateReaders, you can configure the excitation and emission filter slides. See Usingthe Instrument Information Dialog on page 260.
Refresh: To update the software with the currently installed detectioncartridges in a SpectraMax Paradigm Multi-Mode Detection Platform or thecurrently installed filter slides in FilterMax F3 and F5 Multi-Mode MicroplateReaders, click the Refresh button.

SoftMax Pro Software User Guide
5014177 F 35
CalculationsBy default, SoftMax Pro Software performs continuous recalculation of the datawhen you read plates, create or change formulas, or change settings affectingdata. At certain times, it is useful to disable recalculations so that you can edit theExperiment without waiting for recalculations to be completed.
Suspend Calculations disables automatic recalculation. While suspended, norecalculation occurs regardless of what you change, add, or delete from theExperiment. This is useful when creating or changing column formulas withinGroup sections.
Resume Calculations re-enables automatic recalculation.
When recalculation has been suspended, you might want to see the results ofthe changes you have made but might still not want to enable continuousrecalculation. Click Recalculate Now to recalculate all data once withoutenabling continuous recalculation.
Under certain circumstances, a calculation status message appears in theworkspace footer.
Calculating appears when SoftMax Pro Software is calculating an entireexperiment automatically or when Recalculate Now is selected.
Calculating Suspended appears when the Suspend Calculation is selected.
Under all other conditions, no message is displayed.
For technical information about SoftMax Pro Software calculations, seeCalculations and Numerical Precision on page 208.
AutomationAuto Read: You can automatically read plate sections as they appear within anexperiment. See Enabling Auto Read on page 195.
Plate Stacker: The StakMax Microplate Handling System runs using the StakMaxSoftware that is integrated with the SoftMax Pro Software. See StakMax MicroplateHandling System on page 141.
Automation Mode: You can place the software in automation mode, allowing thesoftware to accept legacy commands from scripts written for the SoftMax ProSoftware version 5.x automation interface. See Using Automation Mode on page42.
Chapter 2: User Interface Overview
36 5014177 F
Using the GxP Tab
The GxP tab is available only when using the SoftMax Pro GxP Software. See UsingSoftMax Pro GxP Software Features on page 269.
User AccountThe buttons in the User Account group provide access to information andmanagement of the current user account.
Account Information: The User Account Information dialog providesinformation about the current user. See Viewing the User Information on page273.
User Log On: Click the Log On button to log on after previously logging off.See Logging onto SoftMax Pro GxP Software on page 272.
User Log Off: Click the Log Off button to log the current user off withoutclosing the program.
Change Password: The Change Password dialog allows the current user tochange the password required for logging onto the software. See Changing theUser Password on page 274.
Select Account Database: The User Accounts Connection dialog allowsthe GxP Admin Software administrator to define the location of the user accountfile associated with this installation of the SoftMax Pro GxP Software. SeeConnecting a User Account File on page 270.
DataThe buttons in the Data group provide access to features that are unique to theSoftMax Pro GxP Software.
Statements: The Statements dialog allows you to view, edit, and addstatements. A user with the proper permission can add an electronic signatureto statements. See Working with GxP Statements on page 275.
Audit Trail: The Audit Trail dialog gives you read-only access to the audittrail for the open data file, and allows you to attach a note to the audit trail. SeeViewing the GxP Audit Trail on page 281.

SoftMax Pro Software User Guide
5014177 F 37
Using the Help Tab
SoftMax Pro Software has a comprehensive help library. You can open theapplication help documents from the Help tab in the ribbon.
Click SoftMax Pro Help to view the SoftMax Pro Application Help. Thishelp contains task-oriented information about how to use SoftMax ProSoftware. You can find topics through the table of contents and by using thesearch function. This document also features a linked index and glossary.
Click Formula Reference to view the SoftMax Pro Formula ReferenceGuide. This document is broken into four main sections:
The first section provides a general introduction to SoftMax Pro Softwareformulas.
Operators describes the different types of operators that can be used tobuild formulas.
Functions describes the different types of built-in functions that can beused to build formulas.
Accessors describes the special functions that provide access to otherspecific information.
You can find topics through the table of contents and by using the searchfunction. This document also features a linked index.
Click Release Notes to view the SoftMax Pro Software Release Notes forthis release of the software. This document is in PDF format and can be viewedusing a PDF viewer like Adobe Reader.
Click Contact Us to display the SoftMax Pro Software What's New page,view the Molecular Devices home page, access the knowledge base, or requesttechnical support.
The knowledge base contains documentation supporting Molecular Devicesproducts. You can use the customer login tools and featured links to help youget the information you need.
Click Software License and follow the instructions in the SoftwareLicense Activation dialog to activate your SoftMax Pro Software license.
Click SoftMax Pro in the About section to see release information aboutthis release of the SoftMax Pro Software application.
Chapter 2: User Interface Overview
38 5014177 F
Context-sensitive help is available for the dialogs that have a help button.
Additional documentation in PDF format can be found in the Windows Start menu.
To view the SoftMax Pro User Guide, the Formula Reference Guide, or theSoftware Release Notes, click Start > All Programs > Molecular Devices> SoftMax Pro 6.2.2 and then click the document you want to view.
To view user guides for the supported instruments, click Start >All Programs > Molecular Devices > SoftMax Pro 6.2.2 >Hardware User Guides and then click the document you want to view.
These documents are in PDF format and can be viewed using a PDF viewer likeAdobe Reader.
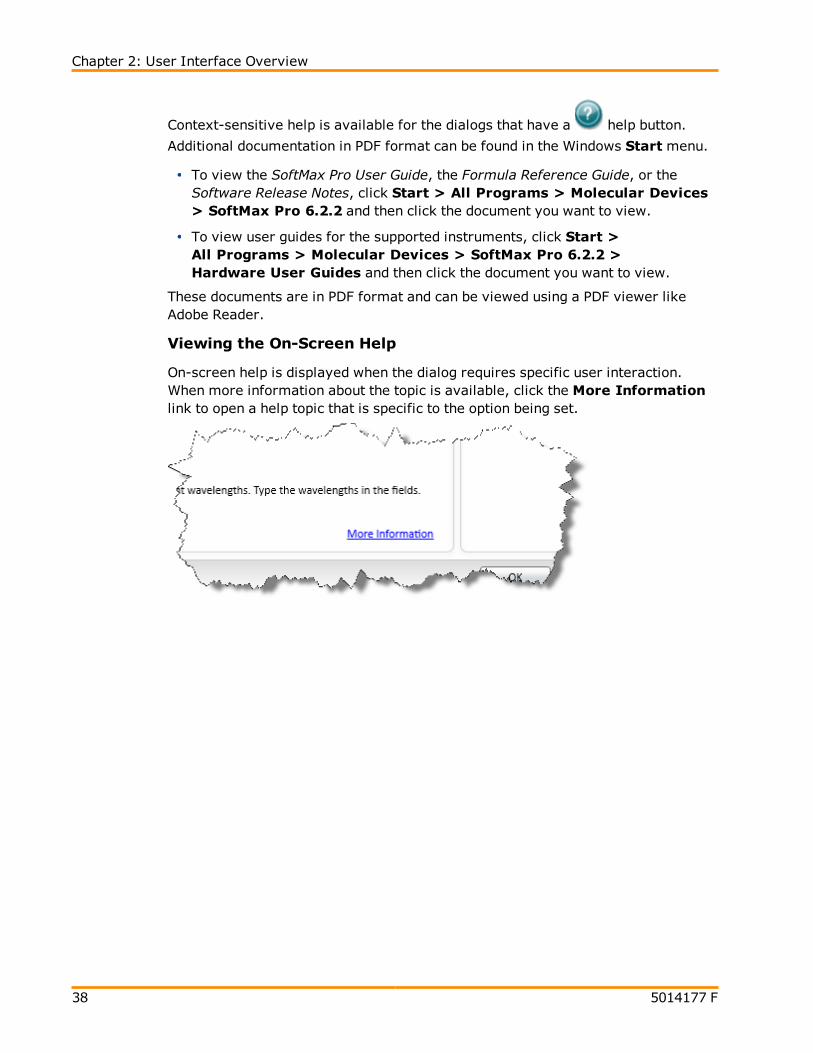
Viewing the On-Screen Help
On-screen help is displayed when the dialog requires specific user interaction.When more information about the topic is available, click the More Informationlink to open a help topic that is specific to the option being set.
SoftMax Pro Software User Guide
5014177 F 39
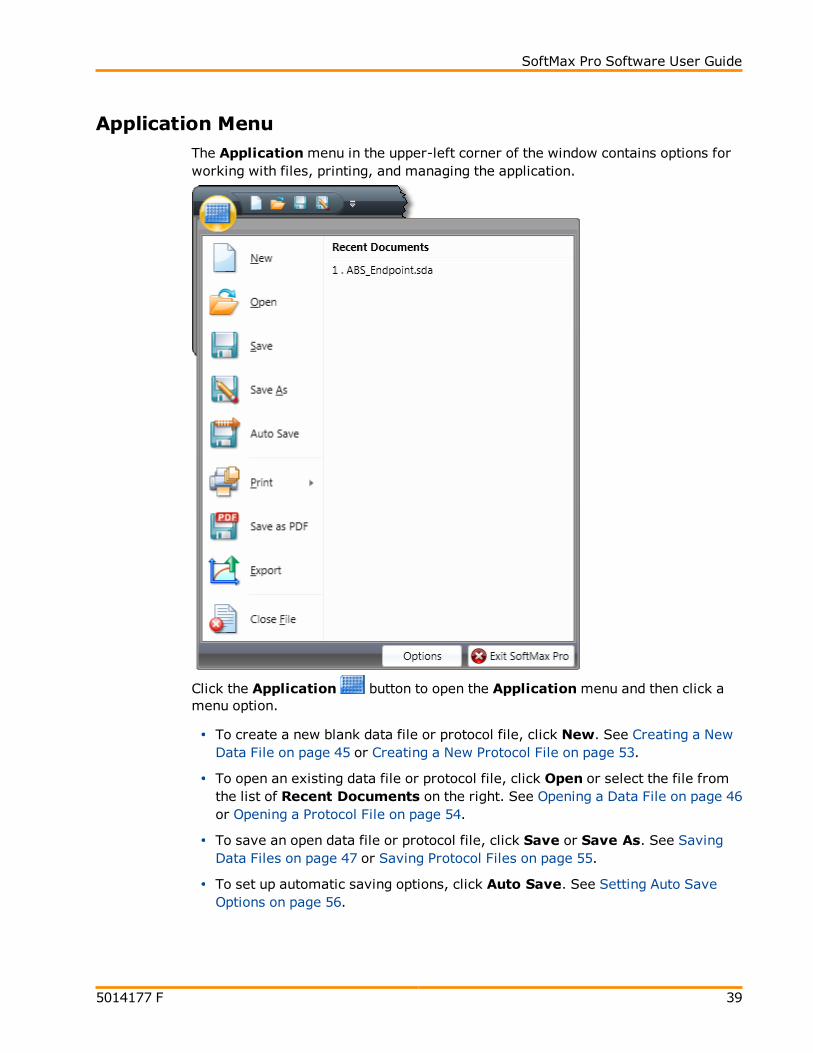
Application MenuThe Applicationmenu in the upper-left corner of the window contains options forworking with files, printing, and managing the application.
Click the Application button to open the Applicationmenu and then click amenu option.
To create a new blank data file or protocol file, click New. See Creating a NewData File on page 45 or Creating a New Protocol File on page 53.
To open an existing data file or protocol file, click Open or select the file fromthe list of Recent Documents on the right. See Opening a Data File on page 46or Opening a Protocol File on page 54.
To save an open data file or protocol file, click Save or Save As. See SavingData Files on page 47 or Saving Protocol Files on page 55.
To set up automatic saving options, click Auto Save. See Setting Auto SaveOptions on page 56.
Chapter 2: User Interface Overview
40 5014177 F
To print the sections of an experiment, preview a print job, or set printingoptions, click Print and then click the option you want on the right. See Printingon page 60.
To save the defined printed output of a file in portable document format (PDF),click Save As PDF. See Saving Data in a PDF File on page 65.
To export the data in a data file, click Export. See Exporting Plate Data on page68.
To close the currently open document in the workspace, click Close File.
To set application options, click Options at the bottom of the menu. SeeSetting Application Options on page 69.
To exit the program, click Exit SoftMax Pro at the bottom of the menu.
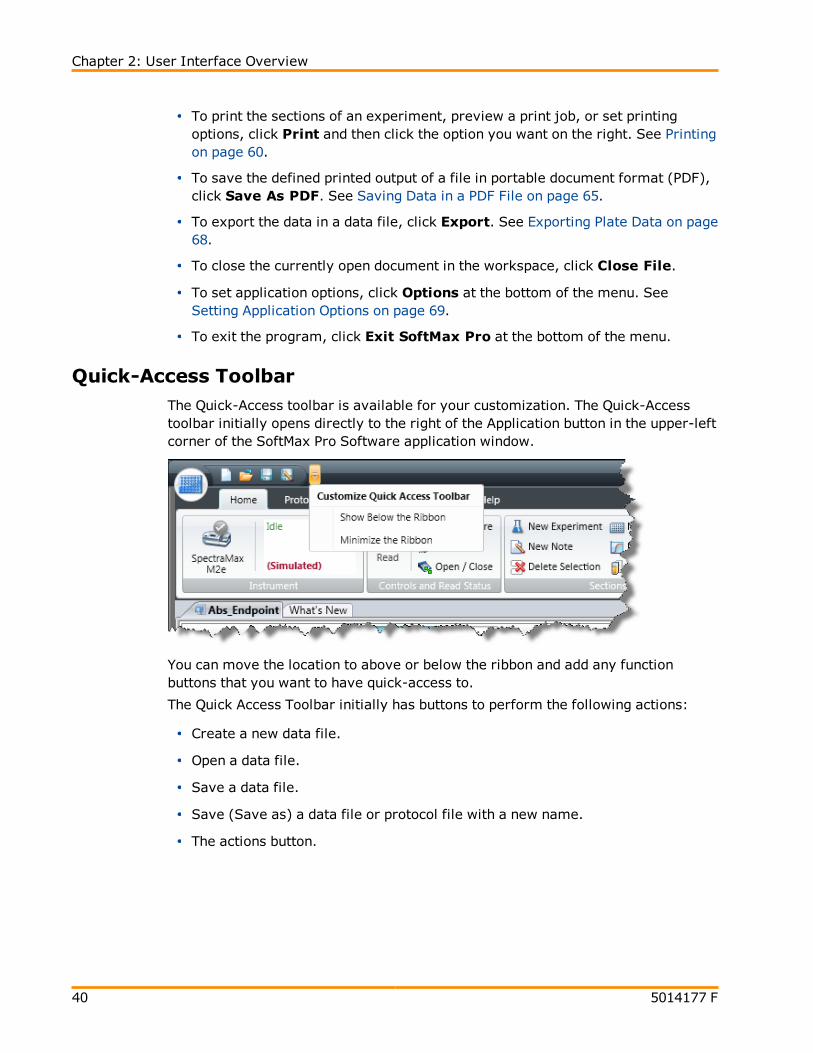
Quick-Access ToolbarThe Quick-Access toolbar is available for your customization. The Quick-Accesstoolbar initially opens directly to the right of the Application button in the upper-leftcorner of the SoftMax Pro Software application window.
You can move the location to above or below the ribbon and add any functionbuttons that you want to have quick-access to.
The Quick Access Toolbar initially has buttons to perform the following actions:
Create a new data file.
Open a data file.
Save a data file.
Save (Save as) a data file or protocol file with a new name.
The actions button.

SoftMax Pro Software User Guide
5014177 F 41
Repositioning the Quick-Access ToolbarThe Quick-Access toolbar can appear above or below the application ribbon.
To reposition the Quick-Access toolbar:
1. Click the actions button to the right of the Quick-Access toolbar.
2. From the menu that appears, click either Show Below the Ribbon or ShowAbove the Ribbon.
Adding a ButtonTo add a function button to the Quick-Access toolbar:
1. Right-click the button you want to add in the ribbon.
2. From the menu that appears, click Add to Quick-Access Toolbar.
Removing a ButtonTo remove a function button from the Quick-Access toolbar:
1. Right-click the button you want to remove in the Quick-Access toolbar.
2. From the menu that appears, click Remove from Quick-Access Toolbar.
Minimizing the RibbonTo minimize the ribbon display:
1. Click the actions button to the right of the Quick-Access toolbar.
2. From the menu that appears, click Minimize the Ribbon.
To return the minimized ribbon to the display:
1. Click the actions button to the right of the Quick-Access toolbar.
2. From the menu that appears, click Minimize the Ribbon to remove the checkmark next to the option.
Integrated Web BrowserTheWhat’s New tab in the document area contains a built-in web browser to keepyou informed of new or updated products and to give you access to the technicalsupport knowledge base.
This tab automatically starts each time you start the SoftMax Pro Software. To hidethis tab on start up, select the Hide web browser tab when application startscheck box in the SoftMax Pro Options dialog. See Setting Application Options onpage 69.

Chapter 2: User Interface Overview
42 5014177 F
Using Automation ModeThe SoftMax Pro Software automation mode prevents user interaction when thesoftware is being controlled by the automation interface through third-partyautomation software or the StakMax Software. To write scripts to use with theSoftMax Pro Software version 6 automation interface, Molecular Devicesrecommends that you use the most recent version of the automation commands asdescribed in the SoftMax Pro Software Automation API Reference Guide.
To show that the SoftMax Pro Software is in automation mode, a dialog appears infront of the main window.
When the automation software acquires data, the related Plate section appears inthe SoftMax Pro Software main window behind the automation mode dialog anddisplays the acquired data.
If the automation software encounters an error, an error message appears in theAutomation Messages area of the automation mode dialog.
If you need to stop the automation process and regain control of the SoftMax ProSoftware, click Terminate.
To allow the software to accept legacy commands from scripts written for theSoftMax Pro Software version 5.x automation interface, go to the Operations tab
in the ribbon, and then in the Automation section click Automation Mode .The legacy script must use the Windows message WM_COPYDATA command. TheWM_SETTEXT command is not supported. Legacy scripts might not work correctlywith the new automation interface. If your legacy script does not work properly,Molecular Devices recommends that you rewrite the script using the most recentversion of the automation commands as described in the SoftMax Pro SoftwareAutomation API Reference Guide.
For more information on automation, see StakMax Microplate Handling System onpage 141 or the SoftMax Pro Software Automation API Reference Guide.

5014177 F 43
Chapter 3: File and Application Management
The Applicationmenu in the upper-left corner of the SoftMax Pro Softwarewindow contains options for working with files, printing, and managing theapplication.
Click the Application button to open the Applicationmenu and then click amenu option. See Application Menu on page 39.
File TypesSoftMax Pro Software uses two basic file types: data files and protocol files.
Data filesData files contain the experiment settings, the raw data collected by your reader,and any data analysis you might have completed.
SoftMax Pro Software 6 can open files created by version 4.0 or later. Before youopen a file you must make sure that your currently selected instrument is the samemodel as the one used to create the file, or a model with instrument settings thatare compatible with the model used to create the file.
You can open data files that have the following file extensions:
.sda (SoftMax Pro Software 6 data files)
.sdax (SoftMax Pro GxP Software 6 data files)
.pda (SoftMax Pro Software 4 and 5 data files)
.eda (SoftMax Pro GxP Software 4 and 5 data files)
See Opening a Data File on page 46.
All SoftMax Pro Software 6 data files are saved with the .sda or .sdax extension.See Saving Data Files on page 47.
The Auto Save feature can be used to prevent data loss. For more information anda description of the data file types, see Setting Auto Save Options on page 56.
Data Export Formats
You can export the data from a SoftMax Pro Software data file using the followingfile extensions:
.xml
.txt (list)
.txt (plate)
.xls (list)
.xls (plate)
See Exporting Plate Data on page 68.

Chapter 3: File and Application Management
44 5014177 F
Protocol FilesProtocol files are experiment template files that contain microplate well layoutassignments and all other reader configuration information, but no data.
You can open protocol files that have the following file extensions:
.spr (SoftMax Pro Software 6 protocol files)
.sprx (SoftMax Pro GxP Software 6 protocol files)
.ppr (SoftMax Pro Software 4 and 5 protocol files)
.epr (SoftMax Pro GxP Software 4 and 5 protocol files)
See Opening a Protocol File on page 54.
All SoftMax Pro Software 6 protocol files are saved with the .spr or .sprx extension.Saving a data file as a protocol file removes any data in the file, leaving only theconfiguration information. See Saving Protocol Files on page 55.
Predefined Protocols
A large number of predefined protocols are installed with SoftMax Pro Softwareand are placed in the default protocols folder. During software installation, theBasic Endpoint protocol is set as the default protocol. Whenever you open a newfile, the new file contains the settings from the default protocol file. To change thedefault protocol file, see Saving a Protocol as the Default Protocol on page 49.
You can use the features available in the Protocols tab in the application ribbon tomanage and share protocol files. See Using the Protocols Tab to Manage Protocolson page 32.

SoftMax Pro Software User Guide
5014177 F 45
Creating a New Data FileYou can create a new empty data file and save it into a folder.
The Applicationmenu New command opens a new data file named Untitled,based on the default protocol.
To create a new data file:
1. Click the Application button to open the Applicationmenu.
2. Click New. A new blank file opens and a new tab appears above the navigationtree.
Note:Molecular Devices recommends that you name the file before youconfigure settings and collect data.
3. Click the Application button to open the Applicationmenu.
4. Click Save as to open the Save As dialog.
5. Navigate to where you want to save the file.
6. Type the file name in the File name field.
7. In the Save as type list, select Data Files (*.sda).
If you are working with the SoftMax Pro GxP Software, select Data Files(*.sdax).
8. Click Save.
The name of the data file appears on the tab above the navigation tree.
Chapter 3: File and Application Management
46 5014177 F
Opening a Data FileTo open a supported protocol or data file, use the Applicationmenu. SoftMax ProSoftware 6 can open files created by version 4.0 or later. However, after you savea file, it is readable only by the current version.
You can open data files that have the following file extensions:
.sda (SoftMax Pro Software 6 data files)
.sdax (SoftMax Pro GxP Software 6 data files)
.pda (SoftMax Pro Software 4 and 5 data files)
.eda (SoftMax Pro GxP Software 4 and 5 data files)
Note: Before you open a file you must make sure that your currentlyselected instrument is the same model as the one used to create the file, or amodel with instrument settings that are compatible with the model used tocreate the file.
SoftMax Pro Software 6 can open files created by version 4.0 or later. If youwant to open a file created in a version earlier than version 4.0, you mustfirst open the file in SoftMax Pro Software 4.0 or later, and then save it as aversion 4.0 or later file. Instrument compatibility requirements also must bemet.
If you need to continue using a data file with an older version of SoftMax ProSoftware, then save the file with a different name or in a different location afteryou open the file with the current version.
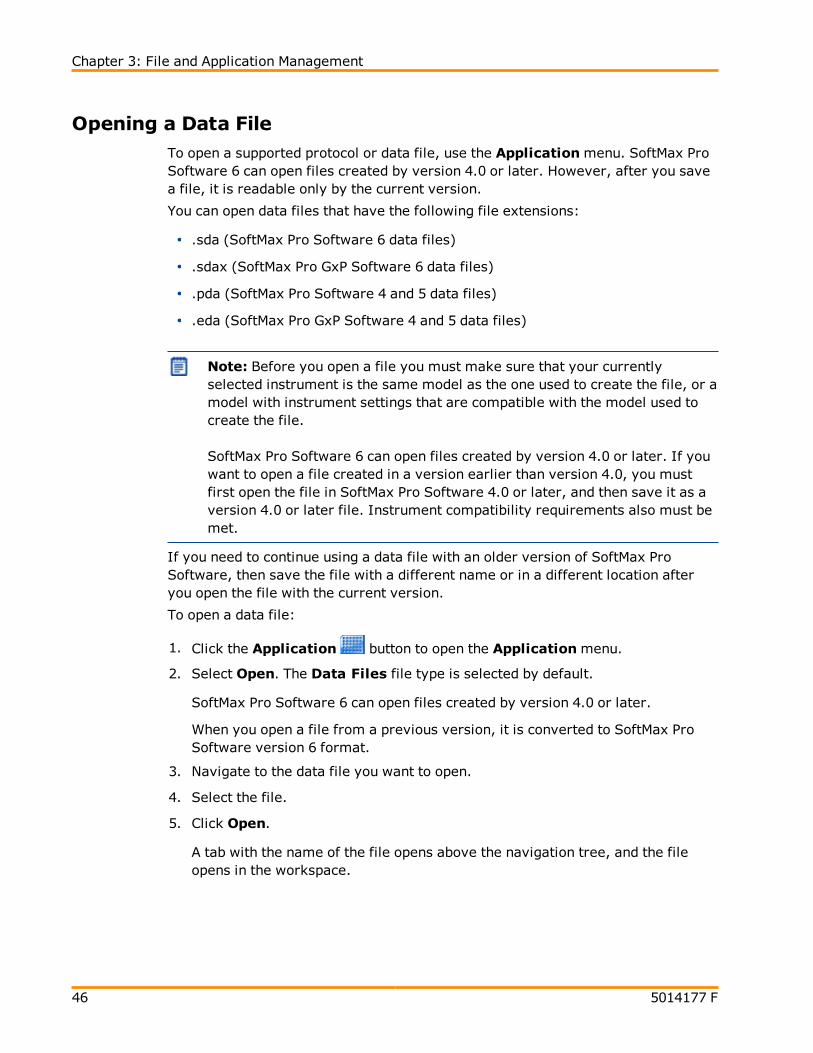
To open a data file:
1. Click the Application button to open the Applicationmenu.
2. Select Open. The Data Files file type is selected by default.
SoftMax Pro Software 6 can open files created by version 4.0 or later.
When you open a file from a previous version, it is converted to SoftMax ProSoftware version 6 format.
3. Navigate to the data file you want to open.
4. Select the file.
5. Click Open.
A tab with the name of the file opens above the navigation tree, and the fileopens in the workspace.

SoftMax Pro Software User Guide
5014177 F 47
Saving Data FilesUse the Applicationmenu Save or Save As commands to save data files.
If you want to save data in PDF format, see Saving Data in a PDF File on page 65.
To save a data file:
1. Click the Application button to open the Applicationmenu.
2. Click Save (for first time file saving) or Save As.
3. In the Save As dialog, navigate to where you want the file to be saved.
4. In the File name field, type a name for the file.
5. From the Save as type field, select Data Files (*.sda).
If you are working with the SoftMax Pro GxP Software, select Data Files(*.sdax).
6. Click Save.
Molecular Devices recommends that you save your data file frequently. When you
want to save the data file, click the Application button to open theApplicationmenu and then click Save to save the file without opening the SaveAs dialog.
Copying and Pasting DataYou can copy plate data from one Plate section to another within the same datafile or between different data files. The format of the copied plate data must matchthe format of the target Plate section. If you want to copy plate data betweenPlate sections in the same file, it might be easier to use the Clone Plate feature.See Cloning a Plate Section on page 89.
In some cases, you can paste endpoint plate data copied from an externalprogram, such as a spreadsheet or text editor. When pasting data from an externalprogram, the format of the copied endpoint data must exactly match the format ofthe target Plate section. Only endpoint data can be pasted from an externalprogram.
For more information about Plate sections, see Using a Plate Section on page 82.
To copy data from a Plate section:
1. View the Plate section that has the data you want to copy.
2. Right-click the plate data area and click Copy Plate Data to copy all of thedata in the entire plate.

Chapter 3: File and Application Management
48 5014177 F
To paste data in a Plate section:
1. View the Plate section where you want to paste the data.
2. Right-click the plate data area and click Paste Plate Data.
If you are pasting data from an external program, click Paste Data.
3. When pasting over existing data, click Yes in the message box that appears.
If the format of the data does not match the format of the target plate, amessage appears informing you of this. Click OK to close the message withoutpasting the data.
After the data is pasted into the Plate section, the Read Information on the rightindicates that the data was pasted and shows the time and date of when it waspasted.
Managing Protocol FilesProtocol files are experiment template files that contain microplate well layoutassignments and all other reader configuration information and reductionparameters, but no data. Protocol files can be useful if you repeat a particular typeof experiment frequently.
The Protocols tab in the ribbon provides easy access to protocol files that arestored in the file system. It also gives you access to the SoftMax Pro Softwareuser’s community for protocol sharing, exchanging tips and tricks, and networkingwith other experienced users. See Using the Protocols Tab to Manage Protocols onpage 32.
Over 120 assay protocols are included in the software to speed life scienceresearch and drug discovery assay development and screening. Researchers cancustomize experiment protocols, analyze and display data, and create meaningfulreports. The straightforward yet powerful programming capabilities of the SoftMaxPro Software can further enhance any specialized data collection and analysisneeds through custom assay development.
The predefined protocols installed with SoftMax Pro Software are placed in theSoftMax Pro Software Protocols folder. You can use the Protocol Manager to quicklyfind and open a protocol. See Using the Protocol Manager to Open a File on page49.
During software installation, the Basic Endpoint protocol is set as the defaultprotocol. Whenever you open a new file, the new file contains the settings from thedefault protocol file. You replace the default protocol with the settings from anopen file so that future new files will use those settings. See Saving a Protocol asthe Default Protocol on page 49.
Saving a data file as a protocol file removes any data in the file, leaving only theconfiguration information. You can add or remove folders in the Protocol Managerto help you find the protocols you use most often. See Adding or Removing a Folderin the Protocol Manager on page 50.

SoftMax Pro Software User Guide
5014177 F 49
Using the Protocol Manager to Open a File
The predefined protocols installed with SoftMax Pro Software are placed in theSoftMax Pro Software Protocols folder. You can use one of the predefinedprotocols, or you can create your own protocol. For more information on protocols,see Creating a Protocol on page 159.
You can use the Protocol Manager to quickly find and open a protocol.
To open a protocol file in the Protocol Manager:
1. Click Protocol Manager on the Protocols tab to open the ProtocolManager where you can select a protocol to be assigned to a new file.
2. Select Protocol Library > foldername to view the available protocols in thatfolder.
To open the default protocol, click Default at the bottom of the ProtocolLibrary.
3. Click the protocol you want to open.
4. When you save the section as a data file the settings from the protocol aresaved along with the data.
Note: When you add a new plate or cuvette section to an experiment, youcan configure thee instrument settings using the Settings dialog. SeeInstrument Settings on page 142.
Saving a Protocol as the Default Protocol
After the SoftMax Pro Software is installed, the Basic Endpoint protocol is set as thedefault protocol with the filename default.spr. Whenever you create a newdocument, the default.spr protocol file is opened as an untitled document thatcontains the settings from the default protocol file.
You can save the settings of the file currently active in the workspace as the defaultprotocol. After you save the active protocol file as the default, whenever youcreate a new document, the settings in the default.spr file that you have savedare loaded into an untitled document.

Chapter 3: File and Application Management
50 5014177 F
Saving a Default Protocol
1. Click Save as Default to overwrite the default.spr file with the protocolsetting of the experiment that is active in your workspace.
2. Click OK to overwrite the default protocol file with this file. With the exceptionof acquired data, all settings and sections (with their contents) are saved aspart of the new default protocol. Any new file you create will initially beidentical to this current data file (minus existing data).
Note:When you save the file as the default protocol, any data you havecollected in the current experiment remains unaltered. If you want to keepthe data, you need to save the data into a data file. See Saving Data Files onpage 47.
Adding or Removing a Folder in the Protocol Manager
You can add folders in your file system to those folder where protocols can bestored. Whenever you store protocol files in the added folder, those protocols areavailable in the Protocol Manager. See Using the Protocol Manager to Open a Fileon page 49.
Adding a Protocol Folder LocationTo add a protocol folder location:
1. Click Folder Locations to open the Folder Locations dialog.
2. Click Add to browse the file system to the folder to be added.

SoftMax Pro Software User Guide
5014177 F 51
3. Select the folder where you want to store protocols.
4. Optionally, click Make New Folder to add a New Folder inside the selectedfolder and then type a name for the folder.
5. Click OK. The selected folder is added to the folder list in the FolderLocations dialog.
6. Click OK to close the Folder Locations dialog.

Chapter 3: File and Application Management
52 5014177 F
Deleting a Protocol Folder LocationTo remove a protocol folder location:
1. Click Folder Locations to open the Folder Locations dialog.
2. Click the check box to select the folder location you want to remove.
3. Click Remove. The selected folder is removed from the folder list in theFolder Locations dialog.
4. Click OK to close the Folder Locations dialog.
SoftMax Pro Software User Guide
5014177 F 53
Creating a New Protocol FileYou can create a new blank protocol file and save it into a folder.
To create a new protocol file from a predefined protocol in the Protocol Manager,see Using the Protocol Manager to Open a File on page 49.
To create a new protocol file:
1. Click the Application button to open the Applicationmenu.
2. Click New. A new blank file opens and a new tab appears above the navigationtree.
3. Configure the protocol settings, see Creating a Protocol on page 159.
Note:Molecular Devices recommends that you name the protocol filebefore you collect data with the settings.
4. Click the Application button to open the Applicationmenu.
5. Click Save as to open the Save As dialog.
6. Navigate to where you want to save the protocol file.
7. Type the file name in the File name field.
8. In the Save as type list, select Protocol Files (*.spr).
If you are working with the SoftMax Pro GxP Software, select Protocol Files(*.sprx).
9. Click Save.
Before using the protocol to collect data, save it as a data file. See Saving DataFiles on page 47.

Chapter 3: File and Application Management
54 5014177 F
Opening a Protocol FileTo open a supported protocol file, use the Applicationmenu. SoftMax ProSoftware 6 can open files created by version 4.0 or later. However, after you savea file, it is readable only by the current version.
You can open protocol files that have the following file extensions:
.spr (SoftMax Pro Software 6 protocol files)
.sprx (SoftMax Pro GxP Software 6 protocol files)
.ppr (SoftMax Pro Software 4 and 5 protocol files)
.epr (SoftMax Pro GxP Software 4 and 5 protocol files)
Note: Before you open a file you must make sure that your currentlyselected instrument is the same model as the one used to create the file, or amodel with instrument settings that are compatible with the model used tocreate the file.
SoftMax Pro Software 6 can open files created by version 4.0 or later. If youwant to open a file created in a version earlier than version 4.0, you mustfirst open the file in SoftMax Pro Software 4.0 or later, and then save it as aversion 4.0 or later file. Instrument compatibility requirements also must bemet.
If you need to continue using a protocol file with an older version of SoftMax ProSoftware, then save the file with a different name or in a different location afteryou open the file with the current version.
To open a predefined protocol in the Protocol Manager, see Using the ProtocolManager to Open a File on page 49.

SoftMax Pro Software User Guide
5014177 F 55
To open a protocol file:
1. Click the Application button to open the Applicationmenu.
2. Select Open. The Data Files file type is selected by default.
3. Select a protocol file type from the list.
SoftMax Pro Software 6 can open files created by version 4.0 or later.
When you open a file from a previous version, it is converted to SoftMax ProSoftware version 6 format.
4. Navigate to the protocol file you want to open.
5. Select the file.
6. Click Open.
An untitled file opens in the workspace with the settings of the selected protocolapplied to it. Before using the protocol to collect data, save it as a data file. SeeSaving Data Files on page 47.
Saving Protocol FilesUse the Applicationmenu Save As command to save a file as a protocol file.
1. Click the Application button to open the Applicationmenu.
2. Click Save As.
3. In the Save As dialog, navigate to where you want the protocol file to besaved.
4. In the File name field, type a name for the file.
5. From the Save as type field, select Protocol Files (*.spr).
If you are working with the SoftMax Pro GxP Software, select Protocol Files(*.sprx).
6. Click Save.
Saving a data file as a protocol file removes any data in the file, leaving only theconfiguration information.
Before using the protocol to collect data, save it as a data file. See Saving DataFiles on page 47.

Chapter 3: File and Application Management
56 5014177 F
Setting Auto Save OptionsWhen Auto Save is enabled, the collected data is saved automatically to a user-defined location immediately after each plate read is completed. Auto Savereduces the likelihood of lost data, particularly when Auto Save is set to save filesto corporate network volumes that are backed up on a regular basis.
You can add as many Auto Save instances as desired, each with its own settings.
Note: Auto Save settings are saved with each document.
This feature helps prevent data loss when used with automated reads, such as withthe StakMax Microplate Handling System. See StakMax Microplate HandlingSystem on page 141.
To set Auto Save options:
1. Click the Application button in the ribbon to open the Applicationmenu
and then click Auto Save to open the Auto Save dialog.
2. To enable Auto Save, select Save Data After Read.
3. To create a new Auto Save location, click Add.
4. To modify an existing Auto Save location, select the location in the list and thenclick Edit.
5. When you are finished setting Auto Save options, click OK.
SoftMax Pro Software User Guide
5014177 F 57
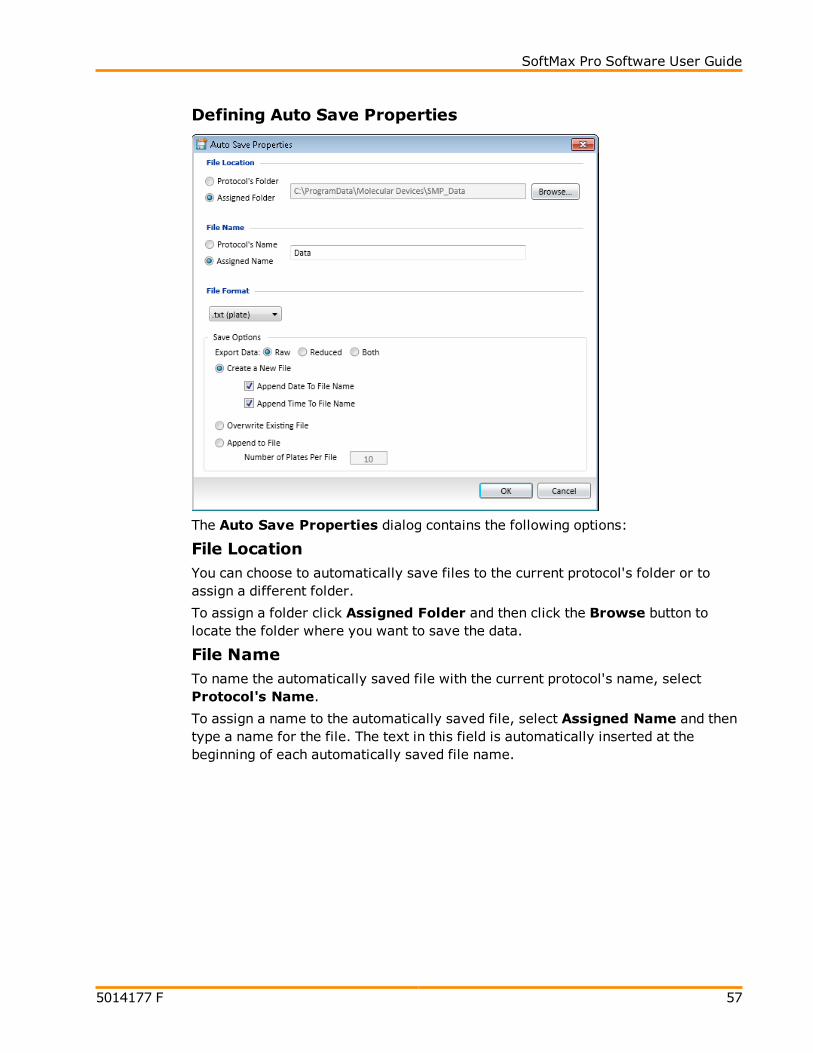
Defining Auto Save Properties
The Auto Save Properties dialog contains the following options:
File LocationYou can choose to automatically save files to the current protocol's folder or toassign a different folder.
To assign a folder click Assigned Folder and then click the Browse button tolocate the folder where you want to save the data.
File NameTo name the automatically saved file with the current protocol's name, selectProtocol's Name.
To assign a name to the automatically saved file, select Assigned Name and thentype a name for the file. The text in this field is automatically inserted at thebeginning of each automatically saved file name.

Chapter 3: File and Application Management
58 5014177 F
File FormatSelect a data format from the menu. Options include:
.sda or .sdax
.xml
.txt (list)
.txt (plate)
.xls (list)
.xls (plate)
Format options allow you to specify what type of file is automatically saved.Version 6 supports the following file formats: SoftMax Pro (.sda), XML (.xml), tab-delimited text (.txt) in list or plate layouts, and Excel (.xls) in list or plate layout.
SoftMax Pro File Format
When .sda or .sdax is selected, your data is automatically saved as a proprietarySoftMax Pro Software file format.
XML File
When .xml is selected, you data is automatically saved in XML format. XML issupported for data export and Auto Save. XML is the best file format if you plan toimport all read data into other data collection and storage applications—specifically, LIMS (Laboratory Information Management System) or SDMS(Scientific Data Management System) packages.
Tab-Delimited File
When either .txt (list) or .txt (plate) is selected, your data is automaticallysaved as a tab-delimited text file, which can be opened by most word processor,spreadsheet, or database programs.
Excel
When either .xls (list) or .xls (plate) is selected, your data is automaticallysaved in a format that can be opened by Microsoft Excel.The Excel output has thesame format as a tab-delimited file with the .xls file extension which allows the fileto be opened easily by Excel.

SoftMax Pro Software User Guide
5014177 F 59
Save OptionsThe available save options depend on the selected file format for the automaticallysaved file.
Export Data
For all data formats except .sda, you can you can specify the type of data to save.
Select Raw to export only the raw data.
Select Reduced to export only the reduced data.
Select Both to export both the raw and the reduced data in the same file.
Create a New File
When you choose to create a new file after each read, you can also choose toappend the date and time to the file name.
Select Append Date to File Name to add the date after the specified filename.
Select Append Time to File Name to add the time after the specified filename.
If you select to append both the date and the time to the file name, the time followsthe date.
If you do not select to append the date or the time to the file name, files with thesame name are numbered sequentially, for example Data 1, Data 2, and so on.
If you select to append only the date to the file name, SoftMax Pro Softwareindexes the runs for that day starting with 1 and increments with each successiverun. For example, the first file named Data that is automatically saved onNovember 18th, 2012 would be named as Data-11-18-12 1, while the secondautomatically saved file would be named Data-11-18-12 2, and so on.
Overwrite Existing File
This option should be used carefully as overwriting a file can cause loss of data. Tohelp ensure against data loss, a file can overwrite only itself. If another file withthe same name exists in the defined autosave directory, the SoftMax Pro Softwareappends a number to the end of the file name.
Append to File
If either a .txt or .xls format is selected, you can choose to append the plate datato the current file. Enter the maximum number of plates to append per file.
If you are reading 10 microplates using the StakMax Microplate Handling System,you can use Append to File to save the data from all 10 microplates in a singledata file.
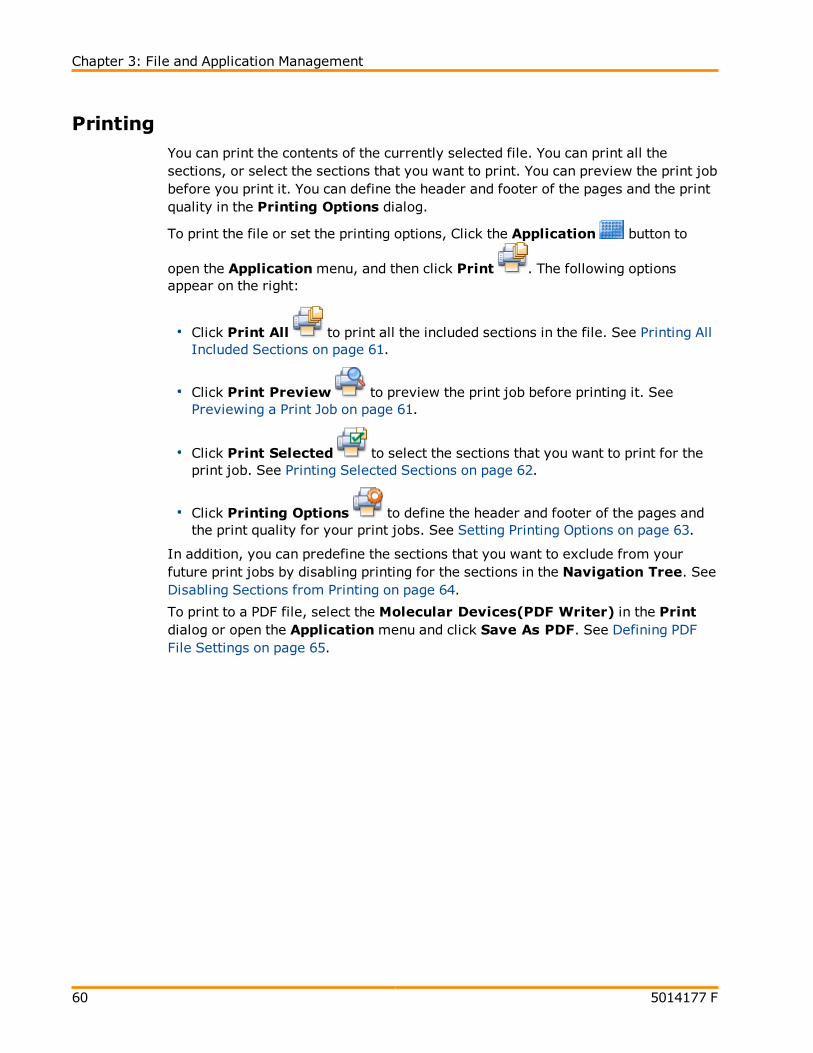
Chapter 3: File and Application Management
60 5014177 F
PrintingYou can print the contents of the currently selected file. You can print all thesections, or select the sections that you want to print. You can preview the print jobbefore you print it. You can define the header and footer of the pages and the printquality in the Printing Options dialog.
To print the file or set the printing options, Click the Application button to
open the Applicationmenu, and then click Print . The following optionsappear on the right:
Click Print All to print all the included sections in the file. See Printing AllIncluded Sections on page 61.
Click Print Preview to preview the print job before printing it. SeePreviewing a Print Job on page 61.
Click Print Selected to select the sections that you want to print for theprint job. See Printing Selected Sections on page 62.
Click Printing Options to define the header and footer of the pages andthe print quality for your print jobs. See Setting Printing Options on page 63.
In addition, you can predefine the sections that you want to exclude from yourfuture print jobs by disabling printing for the sections in the Navigation Tree. SeeDisabling Sections from Printing on page 64.
To print to a PDF file, select the Molecular Devices(PDF Writer) in the Printdialog or open the Applicationmenu and click Save As PDF. See Defining PDFFile Settings on page 65.
SoftMax Pro Software User Guide
5014177 F 61
Printing All Included Sections
When you select to print all the sections in the file, all the included sections print inthe order they are listed in the Navigation Tree. If you have excluded a sectionfrom printing by disabling printing for the section in the Navigation Tree, thesection does not print. See Disabling Sections from Printing on page 64.
To print all the included sections in the file:
1. Click the Application button to open the Applicationmenu, and then click
Print .
2. From the list on the right, click Print All .
3. In the Print dialog, select the printer you want to use and set any print settingsavailable for that printer, including the number of copies that you want to print.
To print to a PDF file, select the Molecular Devices (PDF Writer). SeeDefining PDF File Settings on page 65.
4. Click Print.
Previewing a Print Job
To preview the print job before printing it:
1. Click the Application button to open the Applicationmenu, and then click
Print .
2. From the list on the right, click Print Preview .
3. In the Print Preview dialog, you can scroll through the pages and zoom in andout.
4. Click the Print button in the toolbar at the top of the dialog.
5. In the Print dialog, select the printer you want to use and set any print settingsavailable for that printer, including the number of copies that you want to print.
To print to a PDF file, select the Molecular Devices (PDF Writer). SeeDefining PDF File Settings on page 65.
6. Click Print.
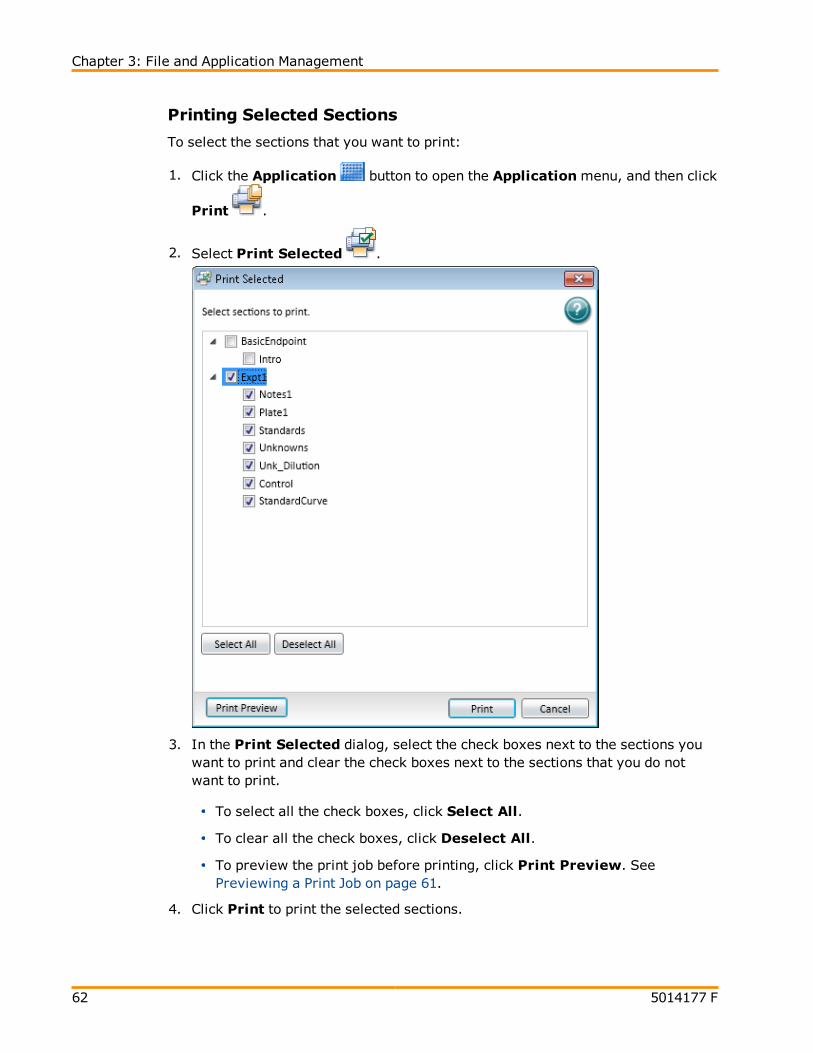
Chapter 3: File and Application Management
62 5014177 F
Printing Selected Sections
To select the sections that you want to print:
1. Click the Application button to open the Applicationmenu, and then click
Print .
2. Select Print Selected .
3. In the Print Selected dialog, select the check boxes next to the sections youwant to print and clear the check boxes next to the sections that you do notwant to print.
To select all the check boxes, click Select All.
To clear all the check boxes, click Deselect All.
To preview the print job before printing, click Print Preview. SeePreviewing a Print Job on page 61.
4. Click Print to print the selected sections.

SoftMax Pro Software User Guide
5014177 F 63
5. In the Print dialog, select the printer you want to use and set any print settingsavailable for that printer, including the number of copies that you want to print.
To print to a PDF file, select the Molecular Devices (PDF Writer). SeeDefining PDF File Settings on page 65.
6. Click Print.
Setting Printing Options
To define the contents of the header and footer and the quality of the printedoutput:
1. Click the Application button to open the Applicationmenu, and then click
Print .
2. Click Printing Options .
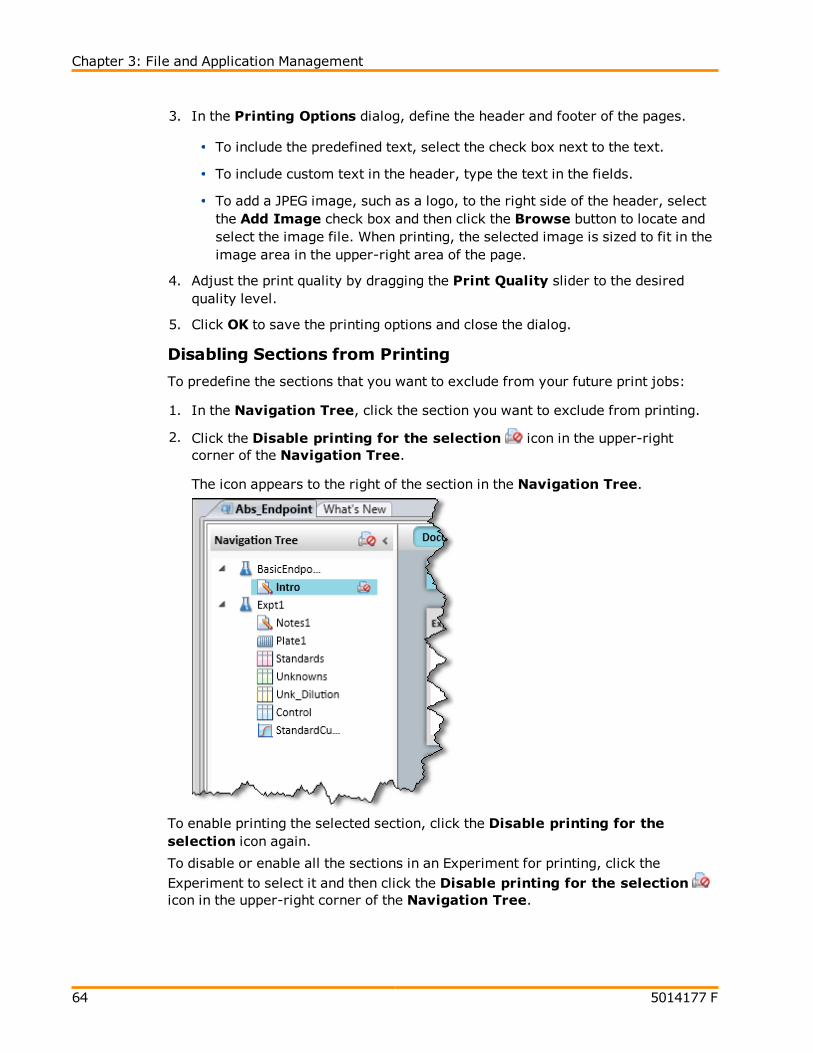
Chapter 3: File and Application Management
64 5014177 F
3. In the Printing Options dialog, define the header and footer of the pages.
To include the predefined text, select the check box next to the text.
To include custom text in the header, type the text in the fields.
To add a JPEG image, such as a logo, to the right side of the header, selectthe Add Image check box and then click the Browse button to locate andselect the image file. When printing, the selected image is sized to fit in theimage area in the upper-right area of the page.
4. Adjust the print quality by dragging the Print Quality slider to the desiredquality level.
5. Click OK to save the printing options and close the dialog.
Disabling Sections from Printing
To predefine the sections that you want to exclude from your future print jobs:
1. In the Navigation Tree, click the section you want to exclude from printing.
2. Click the Disable printing for the selection icon in the upper-rightcorner of the Navigation Tree.
The icon appears to the right of the section in the Navigation Tree.
To enable printing the selected section, click the Disable printing for theselection icon again.
To disable or enable all the sections in an Experiment for printing, click theExperiment to select it and then click the Disable printing for the selectionicon in the upper-right corner of the Navigation Tree.
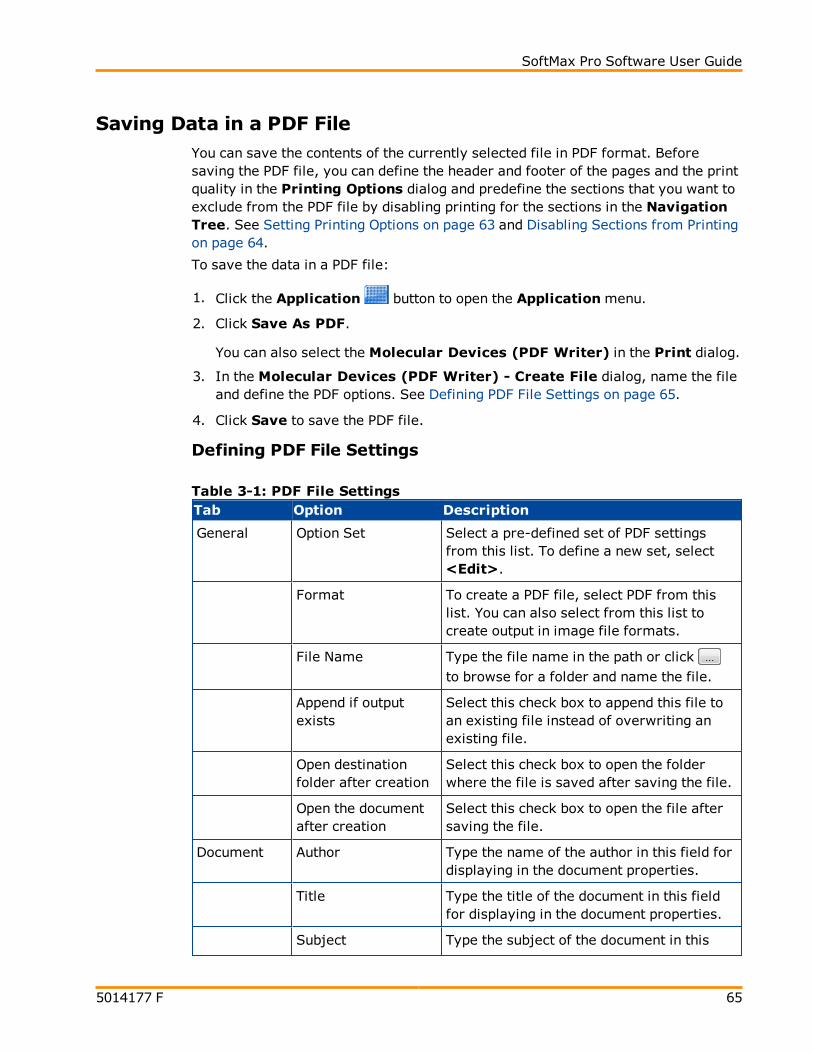
SoftMax Pro Software User Guide
5014177 F 65
Saving Data in a PDF FileYou can save the contents of the currently selected file in PDF format. Beforesaving the PDF file, you can define the header and footer of the pages and the printquality in the Printing Options dialog and predefine the sections that you want toexclude from the PDF file by disabling printing for the sections in the NavigationTree. See Setting Printing Options on page 63 and Disabling Sections from Printingon page 64.
To save the data in a PDF file:
1. Click the Application button to open the Applicationmenu.
2. Click Save As PDF.
You can also select the Molecular Devices (PDF Writer) in the Print dialog.
3. In the Molecular Devices (PDF Writer) - Create File dialog, name the fileand define the PDF options. See Defining PDF File Settings on page 65.
4. Click Save to save the PDF file.
Defining PDF File Settings
Tab Option Description
General Option Set Select a pre-defined set of PDF settingsfrom this list. To define a new set, select<Edit>.
Format To create a PDF file, select PDF from thislist. You can also select from this list tocreate output in image file formats.
File Name Type the file name in the path or click to browse for a folder and name the file.
Append if outputexists
Select this check box to append this file toan existing file instead of overwriting anexisting file.
Open destinationfolder after creation
Select this check box to open the folderwhere the file is saved after saving the file.
Open the documentafter creation
Select this check box to open the file aftersaving the file.
Document Author Type the name of the author in this field fordisplaying in the document properties.
Title Type the title of the document in this fieldfor displaying in the document properties.
Subject Type the subject of the document in this
Table 3-1: PDF File Settings

Chapter 3: File and Application Management
66 5014177 F
Tab Option Description
field for displaying in the documentproperties.
Keywords Type keywords for the document in thisfield for displaying in the documentproperties.
Quality Select a quality option from this list todefine the size of the PDF file.
Initial zoom level Select a zoom level from this list to definehow the document appears each time it isopened.
Compatibility Level Select a format from this list to make thePDF file compatible with older versions ofPDF readers. Some options might not besupported in older version.
PDF/A-1b Select this check box to use the PDF/A-1barchiving standard.
Image DPI When creating an image file, select theresolution for the image in dots per inch.
Text Alpha Bits When creating an image file, select thenumber of bits to use for the alpha channelfor text.
Watermark Text Type the text that you want to appear in thewatermark.
Font Select the typeface for the watermark.
Color Click to select the color for the text.
Size Type the size of the text in points.
Outline width Type the width of the text outline in pixelsto have the text appear in outlines. To havethe text appear as a solid color, leave thisfield blank.
Layer To have the watermark text appear on topof the document text, select Stamp. Tohave the watermark text appear behind thedocument text, selectWatermark.
Rotation Select to display the text upward from thelower left-corner or downward from theupper-left corner.
Vertical position Select to display the text on the top, center,
Table 3-1: PDF File Settings (continued)
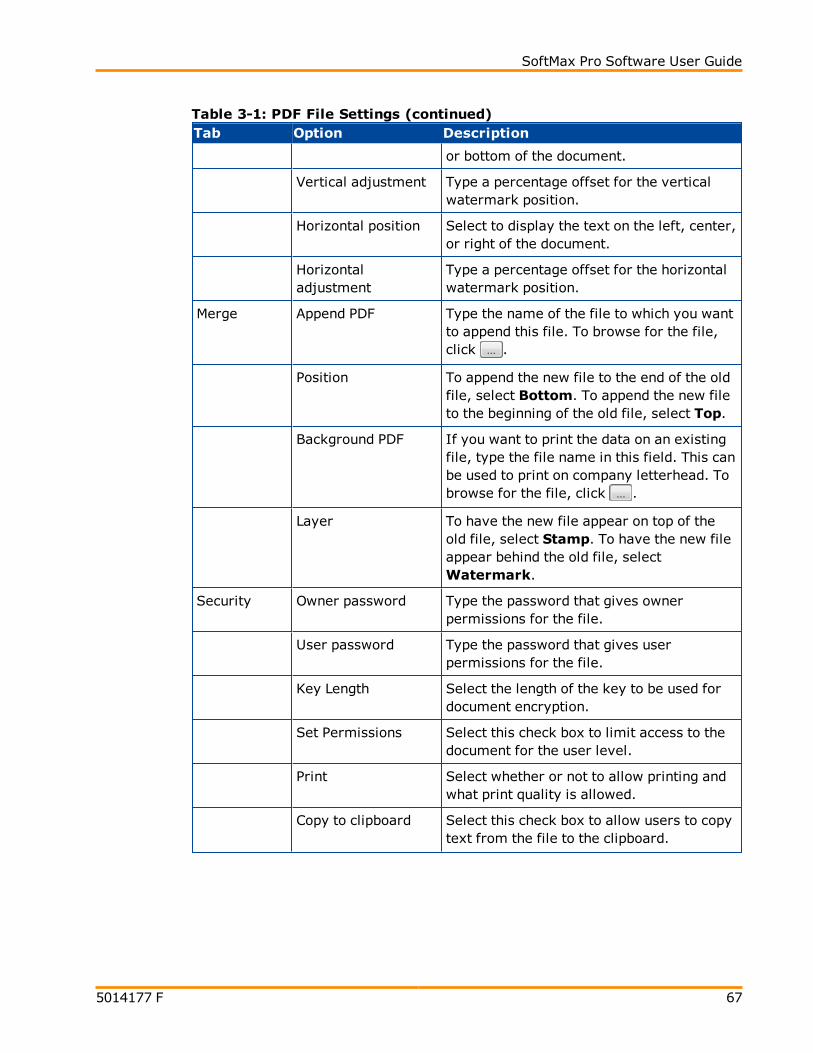
SoftMax Pro Software User Guide
5014177 F 67
Tab Option Description
or bottom of the document.
Vertical adjustment Type a percentage offset for the verticalwatermark position.
Horizontal position Select to display the text on the left, center,or right of the document.
Horizontaladjustment
Type a percentage offset for the horizontalwatermark position.
Merge Append PDF Type the name of the file to which you wantto append this file. To browse for the file,click .
Position To append the new file to the end of the oldfile, select Bottom. To append the new fileto the beginning of the old file, select Top.
Background PDF If you want to print the data on an existingfile, type the file name in this field. This canbe used to print on company letterhead. Tobrowse for the file, click .
Layer To have the new file appear on top of theold file, select Stamp. To have the new fileappear behind the old file, selectWatermark.
Security Owner password Type the password that gives ownerpermissions for the file.
User password Type the password that gives userpermissions for the file.
Key Length Select the length of the key to be used fordocument encryption.
Set Permissions Select this check box to limit access to thedocument for the user level.
Print Select whether or not to allow printing andwhat print quality is allowed.
Copy to clipboard Select this check box to allow users to copytext from the file to the clipboard.
Table 3-1: PDF File Settings (continued)
Chapter 3: File and Application Management
68 5014177 F
Exporting Plate DataThe Export feature creates a data file from the selected sections in a SoftMax ProSoftware file.
The precision of the data displayed in a Plate section varies based on the amountof space available to view the characters.
For example, for a plate with 96 wells or fewer, each well is limited to 5 digits, plusone character for the decimal point, if applicable. For a 384-well plate, each well islimited to 4 characters, including the decimal point.
When SoftMax Pro Software exports plate data, the values are not limited by spaceand can have more digits for each well.
The values displayed in a Plate section are only a representation of the data. Inboth the Plate section and in the exported data, the last digit displayed or exportedis rounded based on the actual data value.
If you want to export data in PDF format, see Saving Data in a PDF File on page 65.
To export the data from a file:
1. Click the Application button to open the Applicationmenu.
2. Click Export .
3. In the Export dialog, select the sections to export:
To include a section in the export, select the check box next to the section.
To exclude a section from the export, clear the check box next to thesection.
To export all plate data, select the All Plates check box.
To export all group data, select the All Groups check box.
To export all notes data, select the All Notes check box.
4. Click one of the following the Plate Data Options:
Raw
Reduced
Both
Note: These options apply only if one or more plate sections areselected.

SoftMax Pro Software User Guide
5014177 F 69
5. Click the Output Format you want for the export file:
Columns exports data in single column of text for each well.
Plate exports data in a text matrix corresponding to a microplate grid.
XML exports data in an XML file format. For a copy of the SoftMax Pro XMLschema, contact Molecular Devices Technical Support.
Note: These options apply only if one or more plate sections areselected.
6. Click OK to export the data.
7. In the Save As dialog, navigate to the folder where you want to save theexported data.
8. In the File name field, type a name for the export file.
9. From the Save as type list, select the file type for the export file. For XMLexports, only .xml is available in this list.
10. Click Save to save the file with the exported data.
Setting Application Options
Click the Application button to open the Applicationmenu, and then click theOptions button at the bottom of the menu.
The SoftMax Pro Options dialog contains settings for the following options:
Data Recovery
The Data Recovery option contains an informational setting to inform you thatopened files will automatically be saved to a temporary file every five minutesto assist with data recovery. This option cannot be turned off. For moreinformation, see Enabling Data Recovery on page 70.
Web Browser
The Web Browser option contains a setting to allow you to hide the integratedweb browser tab when the SoftMax Pro Software starts. The web browserautomatically starts with the program when this check box is cleared. For moreinformation, see Integrated Web Browser on page 41.
Plate Setup Helper
The Plate Setup Helper option contains a setting to prevent the Plate SetupHelper from automatically starting each time you open a new protocol. ThePlate Setup Helper automatically opens each time you open a new SoftMax ProSoftware file when this check box is cleared. For more information, see Usingthe Plate Setup Helper on page 19.
To close the SoftMax ProOptions dialog and save your settings, click OK.

Chapter 3: File and Application Management
70 5014177 F
Enabling Data Recovery
To verify data recovery:
1. Click the Application button to open the Applicationmenu.
2. Click the Options button at the bottom of the menu.
3. In the SoftMax Pro Options dialog, verify that Save open files for datarecovery every five minutes is selected.
4. Click OK to close the dialog.
When Data Recovery is enabled, opened files are automatically saved to atemporary file every five minutes to assist with data recovery.
Recovering Files
If the SoftMax Pro Software experiences an unexpected application interruption,then when the SoftMax Pro Software restarts, it lists the files that are available forrecovery.
1. Select the file or files you want to recover.
2. Click Close to close the dialog.
3. The selected files open in the SoftMax Pro Software.
The files that are not selected from the list are deleted after the dialog closes.
Saving a recovered file overwrites the original file. If an "untitled" file is recoveredand opened, SoftMax Pro Software prompts for a file name and location when thefile is saved.

5014177 F 71
Chapter 4: Workspace Sections
The workspace can contain five different types of sections.
Notes sections are used to record text or to report summary data pertaining tothe experiment. Notes sections can contain text and graphics, and can containimages of the other sections in the file. You can have as many not sections asyou want in the file. For more information, see Using a Notes Section on page72.
Plate sections are used to collect data from the instrument, and to define datadisplay and data reduction. You can have as many Plate sections as you want,and each Plate section can have different instrument settings from the otherPlate sections in the file. For more information, see Using a Plate Section onpage 82.
Cuvette Set sections are used to collect data from a cuvette port. You canhave as many Cuvette Set sections as you want, and each Cuvette Setsection can have different instrument settings from the other Cuvette Setsections in the file. For more information see Using a Cuvette Set Section onpage 90.
Unlike other section types, Group sections are created automatically when youcreate and assign a Group to a Plate section within the Template Editordialog (after clicking the Template button in a Plate section). For moreinformation, see Using a Group Section on page 100.
Graph sections are used to plot information from groups as scatter plots or bargraphs. You can have as many Graph section as you want in a file. For moreinformation, see Using a Graph Section on page 110.
The sections are contained in an Experiment. Experiments can be used as anorganizational tool within the file to maintain separate data sets. You can have asmany Experiments as you want in a file.
When you use the AutoRead feature, only the Plate sections within the selectedExperiment are run. See Enabling Auto Read on page 195.
In the SoftMax Pro GxP Software, you can lock the individual sections in anexperiment to prevent changes to them. See Locking and Unlocking Sections onpage 283.

Chapter 4: Workspace Sections
72 5014177 F
Using a Notes SectionNotes sections are used to record text or to report summary data pertaining to theexperiment.
You can type text in a Notes section, add images, and create summariescontaining formulas for displaying reduced data.
A Summary is part of a Notes section or Group section that is generated by auser-entered formula applied to data in the file. It can also be text or a user-entered constant, such as certificate value.
Text in Notes sections can be formatted (font face, font size, and font style)using the Notes Controls formatting tools on the Home tab.
Images can be inserted into the Notes section including, images from otherprograms and section images from the current document.
Note: Each image must be placed in its own frame, and the frame cannotcontain any text.
You can create multiple Notes sections within the same experiment.
To work in a Notes section, see the following topics:
Adding a Notes Section on page 73
Inserting an Image on page 73
Deleting an Image on page 73
Inserting an Image of a Section on page 74
Refreshing Section Images on page 74
Deleting a Section Image on page 75
Adding Text to a Notes Section on page 75
Aligning Text on page 75
Editing Text in a Text Frame on page 76
Formatting Text in a Text Frame on page 77
Positioning a Text Frame in a Notes Section on page 78
Resizing a Text Frame on page 78
Deleting a Text Frame on page 78
Adding a New Summary Formula on page 79
Deleting a Summary Formula on page 81
Enabling Syntax Helper on page 80
SoftMax Pro Software User Guide
5014177 F 73
Adding a Notes Section
To create a Notes section:
1. Select the experiment where you want to add a Notes section in theNavigation Tree.
2. If you have more than one section in the Experiment, select the section abovewhere you want the new Notes section to appear in the Navigation Tree.
3. Click New Note in Sections on the Home tab in the ribbon.
A new blank Notes section appears below the selected section in the NavigationTree.
Inserting an Image
To insert an image into a Notes section:
1. With a Notes section active in the workspace, click in a blank area of theNotes section to place the cursor in a new frame where you want to insert theimage.
Note: Each image must be placed in its own frame, and the frame cannotcontain any text.
2. Click Add Image in Note Controls on the Home tab in the ribbon or inthe toolbar at the top of the Notes section.
3. In the Open dialog, browse to locate the image to be inserted.
4. Select the image and click Open.
The image appears in the Notes section.
Deleting an Image
To delete an image from a Notes section:
1. Click to select the image to be deleted.
2. Right-click the image and then click Delete.
The image is deleted from the Notes section.
Chapter 4: Workspace Sections
74 5014177 F
Inserting an Image of a Section
To insert an image of a section from the current data file into a Notes section:
1. With a Notes section active in the workspace, click in a blank area of theNotes section to place the cursor in a new frame where you want to insert thesection image.
Note: Each image must be placed in its own frame, and the frame cannotcontain any text.
2. Click Add Section Image in Note Controls on the Home tab in theribbon or in the toolbar at the top of the Notes section.
3. In the Add Section Image dialog, locate the section to be inserted.
4. Select the section and then click Add Section Image.
The section image appears in the Notes section.
Note: You can also right-click in the Note section and then click AddSection Image to select the section from the cascading menus.
Refreshing Section Images
To refresh all the section images in a Notes section, click
Refresh Section Images in the toolbar at the top of the Notes section.
All the section images in the Notes section are updated to their current state. Forexample, if you inserted an image of a Graph section and then made changes tothe graph section, you can refresh the Graph section image in the Notes section.
Note: The section images are automatically refreshed periodically, such aswhen you open the data file, scroll up and down, switch between Documentand Comparison views, or start to print or print preview the file.

SoftMax Pro Software User Guide
5014177 F 75
Deleting a Section Image
To delete a section image from a Notes section:
1. Click to select the section image to be deleted.
2. Right-click the section image and then click Delete.
The section image is deleted from the Notes section.
Note:When you delete a section from the data file, any images of thatsection are also deleted from the Notes sections. When you delete anexperiment from the data file, any images of the sections in the experimentare also deleted from the remaining Notes sections.
Adding Text to a Notes Section
To add text to a Notes section:
1. With a Notes section active in the workspace, click in a blank area of theNotes section to place the cursor in a new frame where you want the text.
2. Type the text you want to appear.
3. To exit from the text frame, click somewhere else in the Notes section.
Note: You can add additional text to any text frame by clicking where youwant to add text within the frame.
Aligning Text
Text in a text frame is aligned on a line by line basis. Each line in the text framecan be aligned separately.
To adjust the alignment of text within a text frame, click to select the line of text tobe aligned, or click and drag to select multiple lines of text.
The following alignment options are in Formatting Tools on the Home tab in theribbon:
To align the line to the left edge, click Align Left .
To center the line, click Align Center .
To align the line to the right edge, click Align Right .
To left and right justify the line, click Justify .
To outdent an indented line, click Decrease Indent .
To indent the selected line, click Increase Indent .

Chapter 4: Workspace Sections
76 5014177 F
Editing Text in a Text Frame
To edit text in a text frame:
1. Click on the word or click and drag on a group of words to select the text to beedited.
2. Type the revised text.
The selected text is replaced with the text you typed.
Copying Text
To copy text in a text frame:
1. Click on the word or click and drag on a group of words to select the text to becopied.
2. Right-click and then click Copy, or press Ctrl+C.
The selected text is placed in the clipboard.
Pasting Text
To paste text from the clipboard into a text frame:
1. Copy text into the clipboard.
2. Click to place the cursor in the text frame where you want to insert the text.
3. Right-click and then click Paste, or press Ctrl+V.
The text in the clipboard is pasted into the text frame.
Cutting Text
To cut text out of a text frame:
1. Click on the word or click and drag on a group of words to select the text to becut.
2. Right-click and then click Cut, or press Ctrl+X.
The selected text is cut from the text frame and placed in the clipboard.
Deleting Text
To delete text from a text frame:
1. Click on the word or click and drag on a group of words to select the text to bedeleted.
2. Press Delete.
The selected text is removed from the text frame and not placed in theclipboard.

SoftMax Pro Software User Guide
5014177 F 77
Formatting Text in a Text Frame
You can format text in a text frame using the formatting tools located in NoteControls on the Home tab in the ribbon.
Click and drag or double-click text in a text frame to select the text and then clickthe formatting tools to perform the following functions:
Select a font face
Select a font size
Create Subscript or Superscript characters
Format Bold , Italic , or Underline characters
Add Bullets
To add a blank line between lines of bulleted text, click at the end of a line andthen press Shift+Enter to add a soft line break.
Add Numbering
To add a blank line between lines of numbered text, click at the end of a lineand then press Shift+Enter to add a soft line break.
Change the Font Color
You can also click Undo Previous Action or Redo Previous Action forquick formatting changes.

Chapter 4: Workspace Sections
78 5014177 F
Positioning a Text Frame in a Notes Section
You can manually position a text frame within the Notes section:
1. Click and hold down the mouse button on the border of a text frame.
The four-arrowhead cursor appears.
2. Drag the text to the desired location and release the mouse button.
To automatically position text frames within a Notes section:
1. Click on a text frame border to select the text frame.
You can also select multiple text frames, summaries, and images by pressingCtrl and then clicking on the frame borders.
2. Click an alignment option in Note Controls on the Home tab in the ribbon.
To align a single text frame to the left edge of the Notes section or align theleft edges of multiple frames to the left-most text frame, click Align Lefts.
To align a single text frame to the right edge of the Notes section or alignthe right edges of multiple frames to the right-most text frame, clickAlign Rights .
To align a single text frame to the top edge of the Notes section or align thetop edges of multiple frames to the top-most text frame, click Align Tops.
To align a single text frame to the bottom edge of the Notes section or alignthe bottom edges of multiple frames to the bottom-most text frame, clickAlign Bottoms .
Resizing a Text Frame
To resize a text frame:
1. Click the text frame to select it.
2. Click and hold on the right or left side border of the text frame.
A double-ended arrow appears.
3. Drag the box to the desired size and release the mouse button.
Deleting a Text Frame
To delete a text frame:
1. Click on the border of the text frame to select the text frame.
2. Right-click and then click Delete, or press Delete on your keyboard.
The text frame is deleted from the Notes section.

SoftMax Pro Software User Guide
5014177 F 79
Adding a New Summary Formula
To add a new Summary Formula to a Notes section:
1. Click the Notes section to make it active in the Workspace.
2. Click New Summary in Note Controls on the Home tab in the ribbon.
3. In the Formula Editor dialog, type a short descriptive name for the summaryformula in the Name field.
Note: If you plan to reference this formula in another formula, forexample referencing the formula in a column of a group table, make surethat you do not use reserved characters or names of operators, functions,or accessors in this name. For information about reserved characters andwords, see "Rules to Follow When Writing Formulas" in the SoftMax ProSoftware Formula Reference Guide.
4. Optionally, click Hide Name to hide the name of the Summary in the Notessection or Group section.
5. Optionally, type a brief text Description of the formula.
Chapter 4: Workspace Sections
80 5014177 F
6. Optionally, click Syntax Helper to turn on the formula completion tool. SeeEnabling Syntax Helper on page 80.
7. Type a Formula to be used for the Summary or column.
8. Optionally, click Check Syntax check the validity of the formula. A messageappears to the right of the button to help you troubleshoot the syntax of theformula.
9. Specify the Data Display characteristics:
For Precision, click Decimal Places and type the number of places todisplay or click Significant Figures and type the number of figures todisplay.
For Format, click either Numeric Notation or Scientific Notation.
A preview of the Data Display appears in the Sample on the right.
10. Click OK.
For a complete guide to the formulas used in the SoftMax Pro Software, click
Formula Reference on the Help tab in the ribbon.
Enabling Syntax Helper
For assistance creating formulas in the Formula Editor dialog, click SyntaxHelper. To disable the Syntax Helper, click Syntax Helper to clear the check box.
When you first start typing a formula, a pop-up displays below your text as youtype. This is Syntax Helper, a technology that analyzes text as you type andcompares it to formulas that are available for use in the SoftMax Pro Software.
Syntax Helper allows you to quickly see what formulas are available and whatparameters these formulas expect to receive.
By default, Syntax Helper is enabled when you first launch the SoftMax ProSoftware. You can enable and disable this feature whenever you are working in theFormula Editor dialog.
SoftMax Pro Software User Guide
5014177 F 81
Editing a Summary Formula
To edit an existing summary formula:
1. Click the summary formula text frame in the Notes section to select the textframe.
2. Click Edit Summary in Note Controls on the Home tab in the ribbon.
You can also double-click the formula to open the Formula Editor dialog.
3. In the Formula Editor dialog, make the required edits. See Adding a NewSummary Formula on page 79.
4. Click OK.
Showing or Hiding the Formula in a Summary Formula
Generally, the summary formula in the Notes section displays the result of theformula. You can show or hide the formula in addition to the result.
To show the formula in the summary formula:
1. Click the summary formula text frame.
2. Click Show Formulas in the Note Controls section of the Home tab in theribbon.
To hide the formula in the summary formula:
1. Click the summary formula text frame.
2. Click Hide Formulas in the Note Controls section of the Home tab in theribbon.
Deleting a Summary Formula
To delete an existing summary formula:
1. Click the summary formula text frame.
2. Click Delete in the Note Controls section of the Home tab in the ribbon.

Chapter 4: Workspace Sections
82 5014177 F
Using a Plate SectionA Plate section is used to collect data from the instrument, and to define datadisplay and data reduction. If you read the same physical plate twice with differentinstrument settings, you would want to have two Plate sections. You can create asmany Plate sections as you need.
The precision of the data displayed in a Plate section varies based on the amountof space available to view the characters.
For example, for a plate with 96 wells or fewer, each well is limited to 5 digits, plusone character for the decimal point, if applicable. For a 384-well plate, each well islimited to 4 characters, including the decimal point.
When SoftMax Pro Software exports plate data, the values are not limited by spaceand can have more digits for each well.
The values displayed in a Plate section are only a representation of the data. Inboth the Plate section and in the exported data, the last digit displayed or exportedis rounded based on the actual data value.
To change the properties of the plate, such as the number of wells, click Settings
on the Home tab in the ribbon to open the Settings dialog, and then click thePlate Type category to view a list of the available plate definitions. See PlateType Settings on page 144.
The Template Editor in the Plate section is used to create a map of the contentsof the microplate.
Plate sections have the following areas:
Tool bar (above the data display)
Data display (in a microplate grid format)
Instrument Settings Information and Read Information (to the right of the datadisplay)
Reduction settings (below the data display)
If the plate grid in the Plate section is colored, then a template has been definedfor the Plate section. Each group defined in the template has a different color andthe corresponding group table has the same color.
For information about using a Plate section, see the following topics:
Adding a Plate Section on page 83
Using Plate Tools on page 83
Using Template Tools on page 89

SoftMax Pro Software User Guide
5014177 F 83
Adding a Plate Section
To add a Plate section:
1. Select the experiment where you want to add a Plate section in theNavigation Tree.
2. If you have more than one section in the Experiment, select the section abovewhere you want the new Plates section to appear in the Navigation Tree.
3. Click New Plate in Sections on the Home tab in the ribbon.
A blank Plate section opens in the Workspace. You can add as many Platesections as you need to your data file.
Using Plate Tools
When a Plate section is active in the Workspace, Plate Tools are available on theHome tab in the ribbon.
Many of the Plate Tools available in Home tab are also available in the toolbar atthe top of the Plate section.
For information about using the Plate Tools, see the following topics:
Modifying Instrument Settings on page 84
Modifying Data Reduction Settings on page 84
Modifying the Data Display on page 85
Showing Reduced Data in a Three-Dimensional Graph on page 86
Zooming the Well Display on page 87
Masking Wells on page 88
Cloning a Plate Section on page 89

Chapter 4: Workspace Sections
84 5014177 F
Modifying Instrument Settings
Instrument settings are part of the protocol used to collect data. To modify settingsfor the selected instrument, select a plate or cuvette section in the Workspace and
then click Settings on the Home tab in the ribbon.
The Settings dialog appears.
Use the options in the Settings dialog to define the parameters for acquiring datafrom a plate or cuvette. See Selecting Instrument Settings on page 160.
Modifying Data Reduction Settings
To modify the data reduction settings for a plate or cuvette, click Reductionon the Home tab in the ribbon to view the Data Reduction dialog.
The Data Reduction dialog displays only the reduction options that are availablefor the instrument you are using, the options that have been selected in theSettings dialog, and the options defined in the template.
For more information, see Performing Data Reduction on page 214.

SoftMax Pro Software User Guide
5014177 F 85
Modifying the Data Display
At any time in an active Plate section or Cuvette Set section you can change how
the data is presented by clicking Display on the Home tab in the ribbon or inthe toolbar at the top of the section.
Choices available in the Display Options dialog include selecting between RawData and Reduced Data.
Raw DataSelecting Raw Data displays the default data type for the selected read type:
Endpoint: Raw absorbance, fluorescence, or luminescence values.
Kinetic: The change in raw OD/RFU/RLU values over time, displayed as a plot.
Spectrum: Raw OD/RFU/RLU values for the range of wavelengths, displayedas a plot.
Well Scan: Raw OD/RFU/RLU values as shades of blue to red.
To see a reduced number, click with Reduced Number.
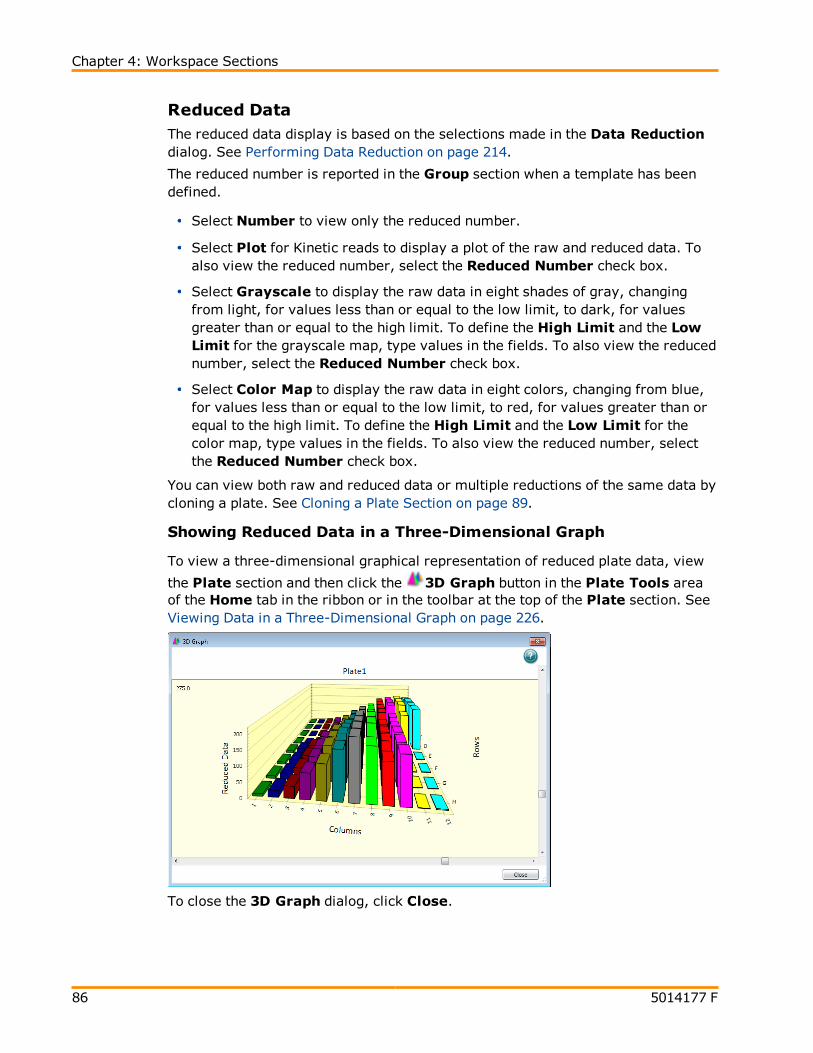
Chapter 4: Workspace Sections
86 5014177 F
Reduced DataThe reduced data display is based on the selections made in the Data Reductiondialog. See Performing Data Reduction on page 214.
The reduced number is reported in the Group section when a template has beendefined.
Select Number to view only the reduced number.
Select Plot for Kinetic reads to display a plot of the raw and reduced data. Toalso view the reduced number, select the Reduced Number check box.
Select Grayscale to display the raw data in eight shades of gray, changingfrom light, for values less than or equal to the low limit, to dark, for valuesgreater than or equal to the high limit. To define the High Limit and the LowLimit for the grayscale map, type values in the fields. To also view the reducednumber, select the Reduced Number check box.
Select Color Map to display the raw data in eight colors, changing from blue,for values less than or equal to the low limit, to red, for values greater than orequal to the high limit. To define the High Limit and the Low Limit for thecolor map, type values in the fields. To also view the reduced number, selectthe Reduced Number check box.
You can view both raw and reduced data or multiple reductions of the same data bycloning a plate. See Cloning a Plate Section on page 89.
Showing Reduced Data in a Three-Dimensional Graph
To view a three-dimensional graphical representation of reduced plate data, view
the Plate section and then click the 3D Graph button in the Plate Tools areaof the Home tab in the ribbon or in the toolbar at the top of the Plate section. SeeViewing Data in a Three-Dimensional Graph on page 226.
To close the 3D Graph dialog, click Close.

SoftMax Pro Software User Guide
5014177 F 87
Zooming the Well Display
The Zoom icon becomes active when the data in a well is available for a zoomeddisplay.
To display the Zoom Well dialog:
1. Click the well or cuvette that you want to zoom.
2. Click Zoom on the Home tab in the ribbon or Zoom in the toolbar at thetop of the section.
The data from the selected well or cuvette appears in a zoomed graph window.
3. To print the graph window, click Print.
4. To scale the display to the data, select Scale to Data.
5. To toggle between reduced and raw data, click Show Reduced or Show Raw.
6. To modify the reduction settings, click Reduction. The Data Reduction dialogopens. See Performing Data Reduction on page 214.
7. To modify the zoom well display settings, click Options. The Zoom WellOptions dialog opens.
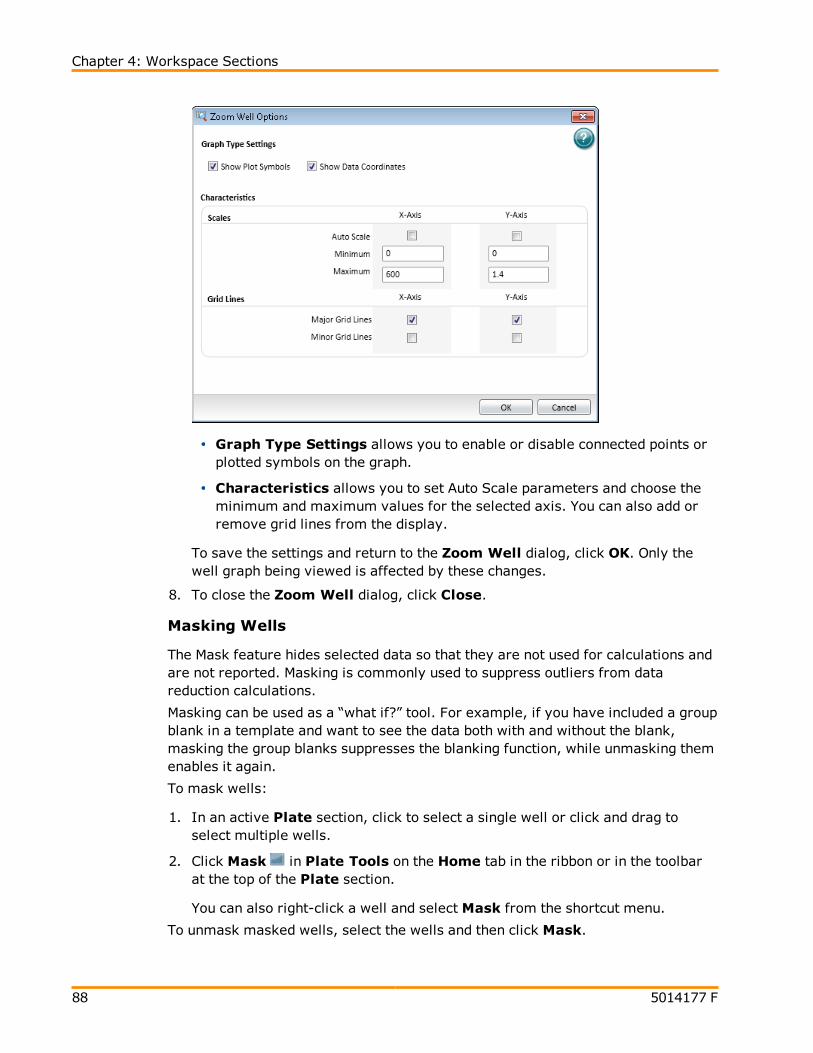
Chapter 4: Workspace Sections
88 5014177 F
Graph Type Settings allows you to enable or disable connected points orplotted symbols on the graph.
Characteristics allows you to set Auto Scale parameters and choose theminimum and maximum values for the selected axis. You can also add orremove grid lines from the display.
To save the settings and return to the Zoom Well dialog, click OK. Only thewell graph being viewed is affected by these changes.
8. To close the Zoom Well dialog, click Close.
Masking Wells
The Mask feature hides selected data so that they are not used for calculations andare not reported. Masking is commonly used to suppress outliers from datareduction calculations.
Masking can be used as a “what if?” tool. For example, if you have included a groupblank in a template and want to see the data both with and without the blank,masking the group blanks suppresses the blanking function, while unmasking themenables it again.
To mask wells:
1. In an active Plate section, click to select a single well or click and drag toselect multiple wells.
2. Click Mask in Plate Tools on the Home tab in the ribbon or in the toolbarat the top of the Plate section.
You can also right-click a well and selectMask from the shortcut menu.
To unmask masked wells, select the wells and then click Mask.

SoftMax Pro Software User Guide
5014177 F 89
Cloning a Plate Section
Cloning a plate causes a duplicate copy of the active plate to be added to the platesection. This can allow you to apply multiple templates and reductions to the sameset of raw data.
To clone a plate:
1. With the Plate section you want to clone active in the workspace, click ClonePlate on the Home tab in the ribbon.
2. The cloned plate is added to the active plate section.
You can add as many plate clones as needed for your experiment. The clonedplates are shown in tabs at the top of the Plate section. The first tab on the left isthe original plate. Clones are listed with the original plate name and a numbercorresponding to the number of the clone.
To make a cloned plate active in the section, click the tab for the cloned plate.
To delete a cloned plate, click the X in the tab for the cloned plate.
Using Template Tools
When a Plate section is active in the Workspace, Template Tools are availableon the Home tab in the ribbon.
A Template is a map of the microplate or cuvette that is used to describe thelocation of samples in the microplate or cuvette, and it provides the link betweenraw data and analysis groups.
Each template contains samples and groups:
A set of one or more replicate wells makes up a sample.
A set of related samples forms a group.
For example, you can have a group named “Standards” that contains sevensamples named STD01, STD02, …, STD07, and a group named “Unknowns” thatcontains five samples named UNK01, UNK02, …, UNK05.
Each sample would be generally applied to a column or some other subset of wellson a microplate, or to one or more cuvettes. Each well designated as being part ofa group has associated with it a group name, a sample name (or replicate ID), asample descriptor (optional), and a column format for the calculations and datareported in the associated Group section.

Chapter 4: Workspace Sections
90 5014177 F
Samples and groups can exist across multiple Plate sections and Cuvette Setsections as well as within a single Plate section or Cuvette Set section. Deletingthe wells assigned to a group from the template does not delete the group. Todelete a group name in the Template Editor you must delete the correspondingGroup section from the data file.
For information about using the Template Tools, see Configuring a MicroplateTemplate on page 162.
Using a Cuvette Set SectionCuvette Set sections are used to collect data from the cuvette port of theSpectraMax M2 and M2e Multi-Mode Microplate Readers, SpectraMax M5 and M5eMulti-Mode Microplate Readers, and the SpectraMax Plus 384 AbsorbanceMicroplate Reader. You can use a Cuvette Set section to define an analysistemplate and to define data display and data reduction. The Template Editor inthe Cuvette Set section is used to describe the contents of each cuvette within theCuvette Set.
You can add up to 96 cuvettes in a single Cuvette Set section or create as manyCuvette Set sections as you need. Cuvettes are read one at a time.
Cuvette Set sections have the following areas:
Tool bar (above the data display)
Cuvette data display
Instrument Settings Information and Read Information (to the right of the datadisplay)
Reduction settings (below the data display)
When colors appear in the name labels above individual cuvettes this means atemplate has been defined for the Cuvette Set section.
Each group defined in the template has a different color. The icon of thecorresponding group table has the same color.
For information about using a Cuvette Set section, see the following topics:
Adding a Cuvette Set Section on page 91
Using Cuvette Tools on page 91
Using the Template Tool with a Cuvette Set on page 99

SoftMax Pro Software User Guide
5014177 F 91
Adding a Cuvette Set Section
To add a new Cuvette Set section:
1. Select the experiment where you want to add a Cuvette Set section in theNavigation Tree.
2. If you have more than one section in the Experiment, select the section abovewhere you want the new Cuvette Set section to appear in the NavigationTree.
3. Click New Cuvette Set in Sections on the Home tab in the ribbon.
A new Cuvette Set section opens in the Workspace. You can add as manyCuvette Set sections as you need to your data file. Each Cuvette Set section canhave up to 96 cuvettes defined in the section.
Note:When you create a new Cuvette Set section with an existing CuvetteSet section active in the workspace, SoftMax Pro Software makes a copy ofthe active Cuvette Set section and the new Cuvette Set section is a duplicateof the active Cuvette Set section.
Using Cuvette Tools
Cuvette Tools appear on the Home tab when a Cuvette Set section is active inthe workspace. Cuvette Tools include the following:
Modifying Instrument Settings for Cuvettes on page 92
Modifying Data Reduction Settings for Cuvettes on page 92
Modifying the Cuvette Data Display on page 93
Zooming the Cuvette Display on page 95
Masking Cuvettes on page 96
Adding a Cuvette to a Cuvette Set on page 97
Deleting a Cuvette from a Cuvette Set on page 97
Copying a Cuvette Set Section on page 97
Copying and Pasting Cuvette Data on page 98

Chapter 4: Workspace Sections
92 5014177 F
Modifying Instrument Settings for Cuvettes
Changing the instrument settings for a cuvette changes the setting for all thecuvettes in the Cuvette Set section.
To change the instrument settings:
1. Click the Cuvette Set section to make it active in the workspace.
2. Click Settings in the Cuvette Tools on the Home tab in the ribbon or inthe toolbar at the top of the Cuvette Set section. The Settings dialog opens.
3. Set the instrument settings options as needed. See Selecting InstrumentSettings on page 160.
4. Click OK.
Modifying Data Reduction Settings for Cuvettes
To change the data reduction settings:
1. Click Reduction in the Cuvette Tools on the Home tab in the ribbon or inthe toolbar at the top of the Cuvette Set section. The Data Reduction dialogopens.
The Data Reduction dialog displays only the reduction options that areavailable for the instrument you are using, the options that have been selectedin the Settings dialog, and the options defined in the template.
2. Change the reduction settings as needed. See Performing Data Reduction onpage 214.
3. Click OK.
Note: Changing the data reduction setting for one cuvette, changes thesettings for all the cuvettes in the active Cuvette Set section.
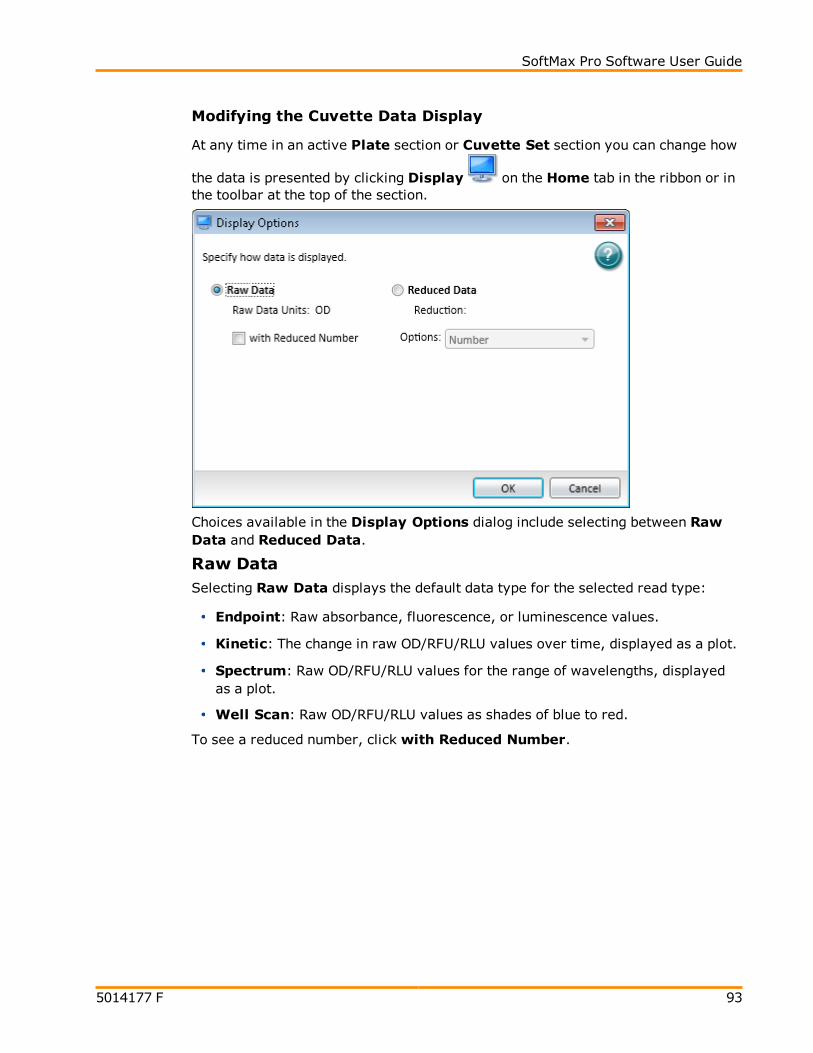
SoftMax Pro Software User Guide
5014177 F 93
Modifying the Cuvette Data Display
At any time in an active Plate section or Cuvette Set section you can change how
the data is presented by clicking Display on the Home tab in the ribbon or inthe toolbar at the top of the section.
Choices available in the Display Options dialog include selecting between RawData and Reduced Data.
Raw DataSelecting Raw Data displays the default data type for the selected read type:
Endpoint: Raw absorbance, fluorescence, or luminescence values.
Kinetic: The change in raw OD/RFU/RLU values over time, displayed as a plot.
Spectrum: Raw OD/RFU/RLU values for the range of wavelengths, displayedas a plot.
Well Scan: Raw OD/RFU/RLU values as shades of blue to red.
To see a reduced number, click with Reduced Number.

Chapter 4: Workspace Sections
94 5014177 F
Reduced DataThe reduced data display is based on the selections made in the Data Reductiondialog. See Performing Data Reduction on page 214.
The reduced number is reported in the Group section when a template has beendefined.
Select Number to view only the reduced number.
Select Plot for Kinetic reads to display a plot of the raw and reduced data. Toalso view the reduced number, select the Reduced Number check box.
Select Grayscale to display the raw data in eight shades of gray, changingfrom light, for values less than or equal to the low limit, to dark, for valuesgreater than or equal to the high limit. To define the High Limit and the LowLimit for the grayscale map, type values in the fields. To also view the reducednumber, select the Reduced Number check box.
Select Color Map to display the raw data in eight colors, changing from blue,for values less than or equal to the low limit, to red, for values greater than orequal to the high limit. To define the High Limit and the Low Limit for thecolor map, type values in the fields. To also view the reduced number, selectthe Reduced Number check box.
You can view both raw and reduced data or multiple reductions of the same data bycloning a plate. See Cloning a Plate Section on page 89.
Note: Changing the display setting for one cuvette, changes the displaysettings for all the cuvettes in the active Cuvette Set section.

SoftMax Pro Software User Guide
5014177 F 95
Zooming the Cuvette Display
The Zoom icon becomes active when the data in a cuvette is available for azoomed display.
To display the Zoom Well dialog:
1. Click the well or cuvette that you want to zoom.
2. Click Zoom on the Home tab in the ribbon or Zoom in the toolbar at thetop of the section.
The data from the selected well or cuvette appears in a zoomed graph window.
3. To print the graph window, click Print.
4. To scale the display to the data, select Scale to Data.
5. To toggle between reduced and raw data, click Show Reduced or Show Raw.
6. To modify the reduction settings, click Reduction. The Data Reduction dialogopens. See Performing Data Reduction on page 214.
7. To modify the zoom well display settings, click Options. The Zoom WellOptions dialog opens.

Chapter 4: Workspace Sections
96 5014177 F
Graph Type Settings allows you to enable or disable connected points orplotted symbols on the graph.
Characteristics allows you to set Auto Scale parameters and choose theminimum and maximum values for the selected axis. You can also add orremove grid lines from the display.
To save the settings and return to the Zoom Well dialog, click OK. Only thewell graph being viewed is affected by these changes.
8. To close the Zoom Well dialog, click Close.
Masking Cuvettes
The Mask feature hides selected data so that they are not used for calculations andare not reported. Masking is commonly used to suppress outliers from datareduction calculations.
Masking can be used as a “what if?” tool. For example, if you have included a groupblank in a template and want to see the data both with and without the blank,masking the group blanks suppresses the blanking function, while unmasking themenables it again.
To mask cuvettes:
1. In an active Cuvette Set section, click to select a single cuvette or hold downthe Ctrl key and click to select multiple cuvettes.
2. Click Mask in Cuvette Tools on the Home tab in the ribbon or in thetoolbar at the top of the Cuvette Set section.
You can also right-click a cuvette and selectMask from the shortcut menu.
To unmask masked cuvettes, select the cuvettes and then click Mask.

SoftMax Pro Software User Guide
5014177 F 97
Adding a Cuvette to a Cuvette Set
To add a cuvette to a Cuvette Set section:
1. Click on a Cuvette Set section to make it active in the workspace.
2. Click New in Cuvette Tools on the Home tab in the ribbon.
Up to 96 cuvettes can be added to one Cuvette Set section.
The cuvettes in a Cuvette Set are numbered as if they were wells in a microplate.The first 12 cuvettes are numbered A1 through A12, and then the next new cuvetteis numbered B1. This representation provides easy access to the data analysiscapabilities of the SoftMax Pro Software.
You can also add cuvettes with the Template Editor. See Using the Template Toolwith a Cuvette Set on page 99.
Deleting a Cuvette from a Cuvette Set
To delete a cuvette from a Cuvette Set section:
1. In an active Cuvette Set section, click to select a single cuvette or hold downthe Ctrl key and click to select multiple cuvettes.
2. Click Delete in Cuvette Tools on the Home tab in the ribbon.
Copying a Cuvette Set Section
To make a duplicate copy of a Cuvette Set section:
1. Click the Cuvette Set section you want to duplicate to make it active in theworkspace.
2. Click New Cuvette Set in Sections on the Home tab in the ribbon.
3. A new Cuvette Set section that is a duplicate of the active Cuvette Setsection is added to the Experiment and appears on the Navigation Tree.
A new Cuvette Set section opens in the Workspace that is a duplicate copy of theactive Cuvette Set section.
You can add as many Cuvette Set sections as you need to your data file. EachCuvette Set section can have up to 96 cuvettes defined in the section.

Chapter 4: Workspace Sections
98 5014177 F
Copying and Pasting Cuvette Data
You can copy cuvette data from one or more cuvettes in a Cuvette Set section to acuvette or cuvettes in the same or another Cuvette Set section. Data can becopied and pasted within the same data file or between different data files.
If you want to copy all the cuvette data from one Cuvette Set section to all thecuvettes in another Cuvette Set section in the same file, it might be easier tomake a duplicate copy of the Cuvette Set section. See Copying a Cuvette SetSection on page 97.
To copy cuvette data:
1. In an active Cuvette Set section, click to select a single cuvette or hold downthe Ctrl key and click to select multiple cuvettes.
2. Right-click and select Copy Cuvette Data from the shortcut menu.
3. The data is copied into the clipboard.
To paste cuvette data that is stored in the clipboard:
1. Click the cuvette that the data should be pasted into.
2. If you copied data from multiple cuvettes, click the first cuvette where youwant to paste the data. SoftMax Pro Software pastes cuvette data intoconsecutive cuvettes. For example, if you copied data from three cuvettes andthen click cuvette A6 to paste the data, the data will be pasted into cuvettes A6,A7, and A8.
3. Right-click and select Paste Cuvette Data from the shortcut menu.
After data is pasted into a cuvette, the Read Information on the right indicatesthat the data was pasted and shows the time and date of when it was pasted.

SoftMax Pro Software User Guide
5014177 F 99
Using the Template Tool with a Cuvette Set
When a Cuvette Set section is active in the Workspace, the Template Tool isavailable on the Home tab in the ribbon.
A Template is a map of the microplate or cuvette that is used to describe thelocation of samples in the microplate or cuvette, and it provides the link betweenraw data and analysis groups.
Each template contains samples and groups:
A set of one or more replicate wells makes up a sample.
A set of related samples forms a group.
For example, you can have a group named “Standards” that contains sevensamples named STD01, STD02, …, STD07, and a group named “Unknowns” thatcontains five samples named UNK01, UNK02, …, UNK05.
Each sample would be generally applied to a column or some other subset of wellson a microplate, or to one or more cuvettes. Each well designated as being part ofa group has associated with it a group name, a sample name (or replicate ID), asample descriptor (optional), and a column format for the calculations and datareported in the associated Group section.
Samples and groups can exist across multiple Plate sections and Cuvette Setsections as well as within a single Plate section or Cuvette Set section. Deletingthe wells assigned to a group from the template does not delete the group. Todelete a group name in the Template Editor you must delete the correspondingGroup section from the data file.
When working within a Cuvette Set section, adding template information in theform of groups automatically adds cuvettes to the active Cuvette Set section.
Up to 96 cuvettes can be added to one Cuvette Set section.
When you open the template editor with a Cuvette Set section active in theworkspace, the template editor window contains 96 wells in the column and rowformat of a 96-well microplate. The cuvettes in the template are numbered as ifthey were wells in a microplate. This representation provides easy access to thedata analysis capabilities of the SoftMax Pro Software.
For information about using the Template Tools with a Cuvette Set section, seeConfiguring a Microplate Template on page 162.

Chapter 4: Workspace Sections
100 5014177 F
Using a Group SectionUnlike other section types, Group sections are created automatically when youcreate and assign a Group to a Plate section or Cuvette Set section from withinthe Template Editor dialog. See Configuring a Microplate Template on page 162.
Reduced numbers from the Plate section or Cuvette Set section appear in theValues column of the Group section tables by default.
Custom reduction formulas require the use of accessors and operators that areunderstood by SoftMax Pro Software. For a list of these accessors and operatorssee the SoftMax Pro Formula Reference Guide.
Reusing Formulas
Formulas are used in Group columns and custom reductions. Sometimes it isuseful to copy an existing formula or column from one area of the program toanother, or from one Experiment to another, rather than recreating it. Afterpasting, formulas can be edited.
Formulas in contiguous column formulas can be copied and then pasted as a unit.
When a Group section is active in the workspace Column Tools, SummaryTools, and Formatting Tools appear on the Home tab in the ribbon.
For information about using a Group section, see the following topics:
Using the Group Settings Dialog on page 100
Using Column Tools on page 104
Using Summary Tools on page 108
Using Formatting Tools in a Group Section on page 110
Using the Group Settings Dialog
The Group Settings dialog allows you to define the name for a group of relatedsamples, a descriptor associated with the samples, and the initial column formatfor the data calculated and reported in the associated Group section.
Whenever a new group is created (whether or not wells are selected in thetemplate), a Group section is created in your Experiment. To delete a group, youmust delete the Group section. Clearing a group from the Template Editorremoves only the assignment of wells to that group name; it does not delete thegroup.
For information about the column formats, see Group Table Column Format onpage 103.
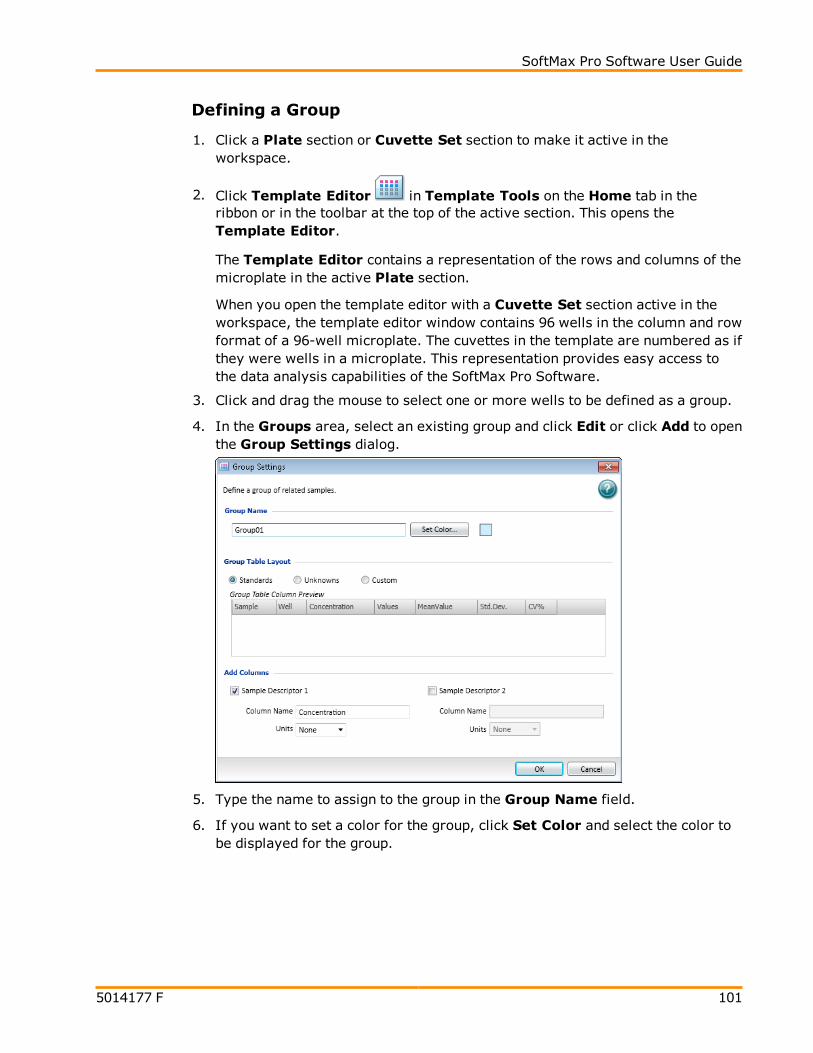
SoftMax Pro Software User Guide
5014177 F 101
Defining a Group
1. Click a Plate section or Cuvette Set section to make it active in theworkspace.
2. Click Template Editor in Template Tools on the Home tab in theribbon or in the toolbar at the top of the active section. This opens theTemplate Editor.
The Template Editor contains a representation of the rows and columns of themicroplate in the active Plate section.
When you open the template editor with a Cuvette Set section active in theworkspace, the template editor window contains 96 wells in the column and rowformat of a 96-well microplate. The cuvettes in the template are numbered as ifthey were wells in a microplate. This representation provides easy access tothe data analysis capabilities of the SoftMax Pro Software.
3. Click and drag the mouse to select one or more wells to be defined as a group.
4. In the Groups area, select an existing group and click Edit or click Add to openthe Group Settings dialog.
5. Type the name to assign to the group in the Group Name field.
6. If you want to set a color for the group, click Set Color and select the color tobe displayed for the group.
Chapter 4: Workspace Sections
102 5014177 F
7. In the Group Table Layout area, click Standards, Unknowns, or Custom tospecify the column format.
For information about the column formats, see Group Table Column Format onpage 103.
When the Standards group type is selected, Sample Descriptor1 isautomatically activated and the assumption is that it will be used forconcentration information. However, it could be used for any numerical data,that is, dilution factor or fraction number. The other two group types do nothave sample descriptors by default.
8. In the Add Columns area, if it is not already selected, click SampleDescriptor1 to apply a descriptor and its units to the group.
9. Type a short descriptive name for the sample descriptor in the Column Namefield.
Note: If you plan to reference the name of this column in a formula,make sure that you do not use reserved characters or names ofoperators, functions, or accessors in this name. For information aboutreserved characters and words, see "Rules to Follow When WritingFormulas" in the SoftMax Pro Software Formula Reference Guide.
10. Select a set of units from the list or type them directly in the Units field.
11. Optionally, click Sample Descriptor2 to define a second sample descriptor.
The Group Table Column Preview shows an example of how the columnswill appear in the group table.
12. Click OK to close the Group Settings dialog.
The selected wells are placed in the newly defined group.
13. Click OK to close the Template Editor and apply the template.
Note: No sample descriptor is assigned automatically for the Unknownscolumn format. You can assign a sample descriptor to these column formatsmanually, but the information does not appear automatically in the Groupsection. To see it, create a new column containing the formula!Sampledescriptor, !factor, or !concentration. For more information aboutcreating columns, see Adding a New Column on page 104.
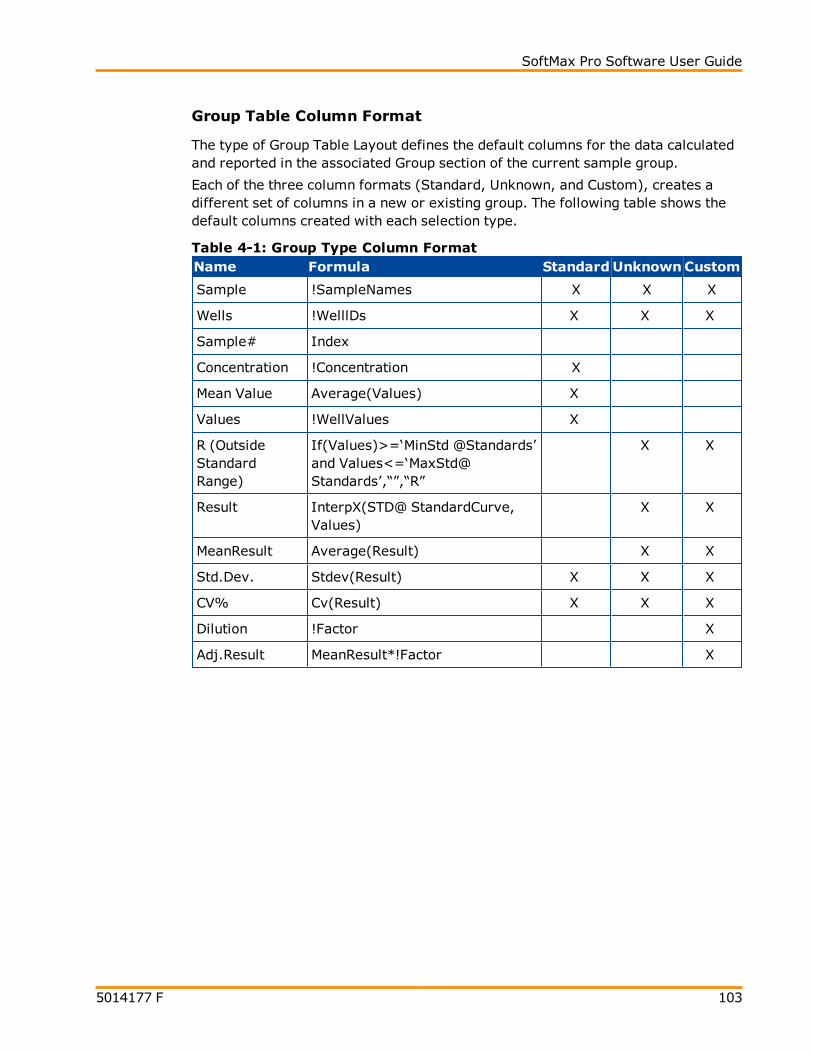
SoftMax Pro Software User Guide
5014177 F 103
Group Table Column Format
The type of Group Table Layout defines the default columns for the data calculatedand reported in the associated Group section of the current sample group.
Each of the three column formats (Standard, Unknown, and Custom), creates adifferent set of columns in a new or existing group. The following table shows thedefault columns created with each selection type.
Name Formula StandardUnknownCustom
Sample !SampleNames X X X
Wells !WelllDs X X X
Sample# Index
Concentration !Concentration X
Mean Value Average(Values) X
Values !WellValues X
R (OutsideStandardRange)
If(Values)>=‘MinStd @Standards’and Values<=‘MaxStd@Standards’,“”,“R”
X X
Result InterpX(STD@ StandardCurve,Values)
X X
MeanResult Average(Result) X X
Std.Dev. Stdev(Result) X X X
CV% Cv(Result) X X X
Dilution !Factor X
Adj.Result MeanResult*!Factor X
Table 4-1: Group Type Column Format

Chapter 4: Workspace Sections
104 5014177 F
Using Column Tools
When a column or data is selected in the group table, the Column Tools that canbe used on the selected items are active. Actions not appropriate for a selecteditem are disabled.
After selecting a column or data in a group table, functions appropriate to theselected item are available by right-clicking to open the Group tools shortcut menu.
For information about using the Column Tools on the Home tab, see the followingtopics:
Adding a New Column on page 104
Modifying a Column on page 105
Copying Column Contents on page 106
Pasting Column Contents on page 106
Cutting Column Content on page 106
Deleting a Column on page 107
Autosizing a Column on page 107
Hiding Columns on page 107
Showing Hidden Columns on page 108
Hiding Replicates on page 108
Adding a New Column
To add a new column to a group:
1. Click a Group section to make it active in the workspace.
2. Click New in Column Tools on the Home tab in the ribbon.
3. In the Formula Editor dialog, type a short descriptive name for the summaryformula in the Name field.
Note: If you plan to reference this formula in another formula, forexample referencing the formula in a column of a group table, make surethat you do not use reserved characters or names of operators, functions,or accessors in this name. For information about reserved characters andwords, see "Rules to Follow When Writing Formulas" in the SoftMax ProSoftware Formula Reference Guide.
4. Optionally, click Hide Name to hide the name of the Summary in the Notessection or Group section.
5. Optionally, type a brief text Description of the formula.

SoftMax Pro Software User Guide
5014177 F 105
6. Optionally, click Syntax Helper to turn on the formula completion tool. SeeEnabling Syntax Helper on page 80.
7. Type a Formula to be used for the Summary or column.
8. Optionally, click Check Syntax check the validity of the formula. A messageappears to the right of the button to help you troubleshoot the syntax of theformula.
9. Specify the Data Display characteristics:
For Precision, click Decimal Places and type the number of places todisplay or click Significant Figures and type the number of figures todisplay.
For Format, click either Numeric Notation or Scientific Notation.
A preview of the Data Display appears in the Sample on the right.
10. Click OK.
If no columns are selected, the column is added at the end of the group onthe right.
If you select a column first, the new column is added to the right of theselected column.
New columns can contain references to other columns, either in the current sectionor in a different one. For example, if you wanted to subtract the mean values inone group from those in another, you could create a new column (in either group)to do this. If the two groups were named “Group 1” and “Group 2,” for example,and both groups contained a column entitled “Mean,” you could create a columnwithin “Group 1” that would subtract the mean values in “Group 2” from those in“Group 1.” The column formula needed to do this would be:
Mean – (Mean@Group2)
Many possibilities exist for creating and editing column formulas. For a completediscussion, see the SoftMax Pro Formula Reference Guide help.
Modifying a Column
To modify a column formula:
1. Click a Group section to make it active in the workspace.
2. To modify a column formula, double click the column heading to open theFormula Editor dialog. See Adding a New Summary Formula on page 79.
3. To resize the column width, click and hold the column border and then drag it tothe desired column width.

Chapter 4: Workspace Sections
106 5014177 F
Copying Column Contents
To paste content into a column you must first copy appropriate content into theclipboard using the copy operation provided in the Column Tools.
To copy content to the clipboard:
1. Click a Group section to make it active in the workspace.
2. Select the content to be copied.
3. Click Copy in Column Tools on the Home tab in the ribbon.
Pasting Column Contents
The content to be pasted into a column must be copied from another columnlocation and be present in the clipboard.
To paste content into a column:
1. Click a Group section to make it active in the workspace.
2. Click to select the target column location.
3. Click Paste in Column Tools on the Home tab in the ribbon.
Note: If the Paste button is disabled when you attempt this operation, thereis no appropriate content present in the clipboard. You must first copycontent to the clipboard.
Cutting Column Content
To cut content out of a column:
1. Click a Group section to make it active in the workspace.
2. Select the content to be removed.
3. Click Cut in Column Tools on the Home tab in the ribbon.
Note: Content that is cut from a column is not placed in the clipboard. Toplace content in the clipboard, the content must be copied.
SoftMax Pro Software User Guide
5014177 F 107
Deleting a Column
To delete a column:
1. Click a Group section to make it active in the workspace.
2. Click a column title to select the column.
To select multiple columns, hold down the Shift key and click to select a rangeof columns or hold down the Ctrl key and click to select non-contiguouscolumns.
3. Click Delete in Column Tools on the Home tab in the ribbon, or right-clickand select Delete Column from the shortcut menu.
Autosizing a Column
You can autosize a column to set the width of the selected column to accommodatethe longest text string:
1. Click a Group section to make it active in the workspace.
2. Click a column title to select the column.
To select multiple columns, hold down the Shift key and click to select a rangeof columns or hold down the Ctrl key and click to select non-contiguouscolumns.
3. Click Auto Size in Column Tools on the Home tab in the ribbon, or right-click and select Auto Size from the shortcut menu.
Hiding Columns
To hide one or more columns:
1. Click a Group section to make it active in the workspace.
2. Click Show/Hide in Column Tools on the Home tab in the ribbon or abovethe right side of the group table.
3. In the Show Hide group table columns dialog, clear the check boxes next tothe columns that you want to hide.
4. Click OK.

Chapter 4: Workspace Sections
108 5014177 F
Showing Hidden Columns
To show hidden columns:
1. Click a Group section to make it active in the workspace.
2. Click Show/Hide in Column Tools on the Home tab in the ribbon or abovethe right side of the group table.
3. In the Show Hide group table columns dialog, select the check boxes nextto the columns that you want to show.
4. Click OK.
Hiding Replicates
To hide data for all replicates:
1. Click a Group section to make it active in the workspace.
2. Click Hide Replicates in the Column Tools on the Home tab in the ribbon.
Using Summary Tools
When a Group section is active in the workspace, the Home tab in the ribbondisplays the Summary Tools.
For information about using the Summary Tools, see the following topics:
Copying and Pasting a Formula on page 108
Deleting a Formula on page 109
Adding a New Formula on page 109
Editing a Formula on page 109
Showing and Hiding the Formulas in a Group Section on page 109
Copying and Pasting a Formula
To copy a formula and paste it into a new summary:
1. Click a Group section to make it active in the workspace.
2. Select the Summary formula to be copied.
3. Click Copy in Summary Tools on the Home tab in the ribbon.
4. Click the location where you want to paste the copy of the Summary formula.
5. Click Paste in Summary Tools on the Home tab in the ribbon.

SoftMax Pro Software User Guide
5014177 F 109
Deleting a Formula
To delete a formula:
1. Click a Group section to make it active in the workspace.
2. Click a formula to select the formula to be deleted.
3. Click Delete in Summary Tools on the Home tab in the ribbon.
Adding a New Formula
To add a new formula to a Group section:
1. Click on a Group section to make it active in the workspace.
2. Click New Summary in Summary Tools on the Home tab in the ribbon toopen the Formula Editor dialog. For more information, see Adding a NewSummary Formula on page 79.
3. Type the formula to be added and click OK.
Editing a Formula
To edit a formula in a Group section:
1. Click a Group section to make it active in the workspace.
2. Click the formula to be changed to select it.
3. Click Edit Summary in Summary Tools on the Home tab in the ribbon toopen the Formula Editor dialog. For more information, see Adding a NewSummary Formula on page 79.
4. Type the changes to formula and click OK.
Showing and Hiding the Formulas in a Group Section
Generally, the summary formulas in the Group section display the results of theformulas. You can show or hide the formulas in addition to the results.
To show the formulas in the Group section:
1. Click a Group section to make it active in the workspace.
2. Click Show Formulas in Summary Controls on the Home tab in theribbon.
To hide the formula in the Group section:
1. Click a Group section to make it active in the workspace.
2. Click Hide Formulas in Summary Controls on the Home tab in theribbon.
Chapter 4: Workspace Sections
110 5014177 F
Using Formatting Tools in a Group Section
When a Group section is active in the workspace, the Home tab in the ribbondisplays the Formatting Tools.
You can format the text in the summaries and text frames in the Group sectionusing the available Formatting Tools. Formatting text in a Group section issimilar to formatting text in a Notes section. See the following topics:
Adding Text to a Notes Section on page 75
Aligning Text on page 75
Editing Text in a Text Frame on page 76
Formatting Text in a Text Frame on page 77
Positioning a Text Frame in a Notes Section on page 78
Resizing a Text Frame on page 78
Deleting a Text Frame on page 78
Using a Graph SectionGraph sections are used to plot information from groups as scatter plots.
You can create more than one Graph section within a data file, and plots in theGraph section can be created from any Experiment in the file.
After a graph has been created, new plots can be added and deleted, the axes canbe customized, and the size of the graph can be changed. The grid lines for thegraph can be enabled or disabled. The default setting has grid lines enabled.
Graph sections are divided into the following areas:
The body of the Graph section.
The Legend.
For more information see Working with Graphs on page 234.
5014177 F 111
Chapter 5: Instrument and DetectionSettings
Over 120 assay protocols are included in the software to speed life scienceresearch and drug discovery assay development and screening. Researchers cancustomize experiment protocols, analyze and display data, and create meaningfulreports. The straightforward yet powerful programming capabilities of the SoftMaxPro Software can further enhance any specialized data collection and analysisneeds through custom assay development.
Supported Read TypesSoftMax Pro Software supports the following Read Types:
Endpoint Read Type on page 111
Kinetic Read Type on page 111
Spectrum Read Type on page 111
Well Scan Read Type on page 112
Endpoint Read Type
In an Endpoint read, a reading of each microplate well or cuvette is taken once, inthe center of each well, at a single wavelength or at multiple wavelengths.Depending on the read mode, raw data values are reported as optical density,%Transmittance, RFUs, or RLUs.
Kinetic Read Type
In a Kinetic read, the instrument collects data over time with multiple readingstaken at regular intervals. To achieve the shortest possible interval for Kineticreadings, choose wavelengths in ascending order.
The values calculated based on raw kinetic data are VMax, VMax per Sec, Time toVMax, and Onset Time. Kinetic readings can be single-wavelength or multiple-wavelength readings.
Spectrum Read Type
Depending on the read mode selected, a Spectrum read measures optical density,%Transmittance, relative fluorescence units (RFUs), or relative luminescence units(RLUs) across a spectrum of wavelengths.

Chapter 5: Instrument and Detection Settings
112 5014177 F
Well Scan Read Type
A Well Scan read can take readings at more than one location within a well. A WellScan read takes one or more readings of a single well of a microplate on an evenlyspaced grid inside of each well at single or multiple wavelengths.
Some applications involve the detection of whole cells in large-area tissue cultureplates. Well Scan reads can be used with such microplates to allow maximumsurface area detection in whole-cell protocols. Since many cell lines tend to growas clumps or in the corners of microplate wells, you can choose from severalpatterns and define the number of points to be scanned to work best with yourparticular application.
The options available for Endpoint reads are available for Well Scan reads.
Supported Read ModesSoftMax Pro Software supports the following Read Modes:
ABS Read Mode on page 113
FL Read Mode on page 114
LUM Read Mode on page 114
TRF Read Mode on page 115
FP Read Mode on page 116
AlphaScreen Read Mode on page 117
FRET Read Mode on page 118
SoftMax Pro Software User Guide
5014177 F 113
ABS Read Mode
In the Absorbance (ABS) read mode, the instrument measures the Optical Density(OD) of the sample solutions.
Absorbance is the amount of light absorbed by a solution. To measure absorbanceaccurately, it is necessary to eliminate light scatter. In the absence of turbidity,absorbance = optical density.
A = log10(I0 /I) = –log
10(I/I
0)
where I0is incident light before it enters the sample, I is the intensity of light after
it passes through the sample, and A is the measured absorbance.
Absorbance-based detection has been commonly used to assess changes in color orturbidity, allowing for widespread use including ELISAs, protein quantitation,endotoxin assays, and cytotoxicity assays. With absorbance readers that arecapable of measuring in the ultraviolet (UV) range, the concentration of nucleicacids (DNA and RNA) can be found using their molar extinction coefficients.
For Absorbance reads, you can choose whether to display absorbance data asOptical Density or %Transmittance in the Reduction dialog.
%Transmittance is the ratio of transmitted light to the incident light for absorbancereads.
T = I/I0
%T = 100T
where I is the intensity of light after it passes through the sample and I0is incident
light before it enters the sample.
Optical Density and %Transmittance are related by the following formulas:
%T = 102–OD
OD = 2 – log10(%T)
The factor of two comes from the fact that %T is expressed as a percent of thetransmitted light and log
10(100) = 2.
When in %Transmittance analysis mode, the SoftMax Pro Software converts theraw OD values reported by the instrument to %Transmittance using the aboveformula. All subsequent calculations are performed on the converted numbers.
For information about setting up an Absorbance mode protocol, see Creating anAbsorbance Mode Protocol on page 174.
Chapter 5: Instrument and Detection Settings
114 5014177 F
FL Read Mode
In the Fluorescence Intensity (FL) read mode, the instrument measuresFluorescence Intensity in Relative Fluorescence Units (RFUs).
Fluorescence occurs when absorbed light is re-radiated at a longer wavelength.Fluorescence intensity measures the light emitted by certain substances resultingfrom the absorption of incident radiation.
To measure fluorescence accurately, it is necessary to reduce light scatter.
The governing equation for fluorescence is:
Fluorescence = extinction coefficient * concentration * quantum yield *excitation intensity * pathlength * emission collection efficiency
Fluorescence intensity detection uses an external light source to excite molecules(fluorophores), which then emit light of a longer wavelength. The emitted light isthen captured and analyzed to quantitate changes in the fluorophores.Fluorescence intensity is used widely in applications not limited to fluorescentELISAs, protein assays, nucleic acid quantitation, reporter gene assays, cellviability, cell proliferation, and cytotoxicity. Another major application of this modeis to study the kinetics of ion release.
For information about setting up a Fluorescence Intensity mode protocol, seeCreating a Fluorescence Intensity Mode Protocol on page 176.
LUM Read Mode
In the Luminescence (LUM) read mode provides measurements in RelativeLuminescence Units (RLUs).
Luminescence is the emission of light by processes that derive energy fromessentially non-thermal changes, the motion of subatomic particles, or theexcitation of an atomic system by radiation. Luminescence detection relies on theproduction of light from a chemical reaction in a sample.
The highly efficient conversion of chemical energy to light has been used inreporter gene assays, aequorin GPCR, and secreted luciferase assays, to name afew.
For information about setting up a Luminescence mode protocol, see Creating aLuminescence Mode Protocol on page 184.

SoftMax Pro Software User Guide
5014177 F 115
TRF Read Mode
In Time-Resolved Fluorescence (TRF) read mode, the instrument detects theextremely long emission half-lives of rare earth elements called lanthanides.
Time-resolved fluorescence (TRF) detection is similar to fluorescence intensity (FL)detection. The difference is that the fluorophores are a special type calledlanthanides that have a longer lifetime than standard fluorophores used with FLdetection. The fluorescence emitted by lanthanide dyes is delayed long enough tomeasure fluorescence after the lamp is turned off. Time resolved fluorescence isused to reduce the amount of background noise interfering with fluorescence. Theexcitation lamp flashes and, after it is off, the delayed emission is collected beforethe lamp flashes again.
The use of long-lived fluorophores combined with time-resolved detection (a delaybetween excitation and emission detection) minimizes interference fromfluorescence excitation light. Assays with these long-lifetime fluorophores have theadvantage of very low background fluorescence. TRF detection is widely used inhigh throughput screening applications such as kinase assays.
The Cisbio Bioassays HTRF (Homogeneous Time-Resolved Fluorescence)technology is a proprietary time-resolved fluorescence technology that overcomesmany of the drawbacks of standard Fluorescence Resonance Energy Transfer(FRET) techniques, such as the requirements to correct for autofluorescence andthe fluorescent contributions of unbound fluorophores. The HTRF technology isavailable for the SpectraMax M5e Multi-Mode Microplate Reader and theSpectraMax Paradigm Multi-Mode Detection Platform with the Cisbio HTRFDetection Cartridge.
For information about setting up a TRF mode protocol, see Creating a Time-Resolved Fluorescence Mode Protocol on page 186.

Chapter 5: Instrument and Detection Settings
116 5014177 F
FP Read Mode
Fluorescence Polarization (FP) mode measures the relative change of polarizationof emitted fluorescent compared to excitation light.
Fluorescence polarization detection is similar to fluorescence intensity, with theimportant difference that it uses plane-polarized light, rather than non-polarizedlight. Plate readers measure FP of the sample by detecting light emitted bothparallel and perpendicular to the plane of excitation.
By using a fluorescent dye to label a small molecule, its binding to anothermolecule of equal or greater size can be monitored through its speed of rotation.
When molecules are excited with polarized light, the polarization of the emittedlight depends on the size of the molecule to which the fluorophore is bound. Largermolecules emit a higher percentage of polarized light, while smaller moleculesemit a lower percentage of polarized light because of their rapid molecularmovement. For this reason FP is typically used for molecular binding assays inHTS.
Fluorescence Polarization mode returns two sets of data: one for fluorescenceintensity parallel (P) to the excitation plane, and the other for fluorescenceintensity perpendicular (S) to the excitation plane. These S and P values are usedto calculate the Polarization (mP) and Anisotropy (r) values in SoftMax ProSoftware.
You can choose to display either of these data types on the Plate section byselecting Reduced Data in the Display dialog and then selecting the data type inthe Data Reduction dialog. When Raw (S&P) is displayed, the mP value is bydefault used for all reduction calculations. See Setting the Data Display Options onpage 210 and Performing Data Reduction on page 214.
When exporting, you can export either mP or r as reduced data.
Polarization (mP) is calculated as follows:
mP = 1000(parallel + (G perpendicular))
(parallel (G perpendicular))-*-
*
*
Anisotropy (r) is calculated as follows:
r = -(parallel (G perpendicular))- *
(parallel + (2G perpendicular))*
G factor, or grating factor, is used in fluorescence polarization to correctpolarization data for optical artifacts, converting relative mP data to theoretical mPdata. Optical systems, particularly with reflective components, pass light ofdifferent polarization with different efficiency. G factor corrects this instrumentalbias. See Performing Data Reduction on page 214.
For information about setting up a Fluorescence Polarization mode protocol, seeCreating a Fluorescence Polarization Mode Protocol on page 188.

SoftMax Pro Software User Guide
5014177 F 117
AlphaScreen Read Mode
ALPHA stands for Amplified Luminescent Proximity Homogeneous Assay.AlphaScreen is a bead-based chemistry used to study molecular interactionsbetween moieties A and B, for example. When a biological interaction between Aand B brings beads—coated with A and B, respectively—together, a cascade ofchemical reactions acts to produce a greatly amplified signal.
The cascade finally resulting in signal is triggered by laser excitation (680 nm),making a photosensitizer on the A-beads convert oxygen to an excited (singlet)state. That energized oxygen diffuses away from the A-bead. When reaching the B-bead in close proximity, it reacts with a thioxene derivative on the B-beadgenerating chemiluminescence at 370 nm. Energy transfer to a fluorescent dye onthe same bead shifts the emission wavelength into the 520 nm to 620 nm range.The limited lifetime of singlet oxygen in solvent (~4 microseconds) allows diffusionreach only up to about 200 nm distance. Thus, only B-beads in the proximity of A-beads yield signal, which indicates binding between moieties A and B.
An AlphaScreen measurement includes a light pulse, by turning on the laser diodefor a specified time, turning off the laser diode, followed by the measurement ofthe AlphaScreen signal, as specified in the measurement protocol timingparameters.
Note: AlphaScreen mode is available with a SpectraMax Paradigm Multi-Mode Detection Platform with an AlphaScreen Detection Cartridge.
For information about setting up an AlphaScreen mode protocol, see Creating anAlphaScreen Mode Protocol on page 190.

Chapter 5: Instrument and Detection Settings
118 5014177 F
FRET Read Mode
Fluorescence resonance energy transfer (FRET) is a distance-dependent interactionbetween the electronic excited states of two dye molecules in which excitation istransferred from a donor molecule to an acceptor molecule without emission of aphoton.
FRET relies on the distance-dependent transfer of energy from a donor molecule toan acceptor molecule. Due to its sensitivity to distance, FRET has been used toinvestigate molecular interactions. FRET is the radiationless transmission of energyfrom a donor molecule to an acceptor molecule. The donor molecule is the dye orchromophore that initially absorbs the energy and the acceptor is the chromophoreto which the energy is subsequently transferred. This resonance interaction occursover greater than interatomic distances, without conversion to thermal energy, andwithout any molecular collision. The transfer of energy leads to a reduction in thedonor’s fluorescence intensity and excited state lifetime, and an increase in theacceptor’s emission intensity. A pair of molecules that interact in such a mannerthat FRET occurs is often referred to as a donor/acceptor pair.
While there are many factors that influence FRET, the primary conditions that needto be met for FRET to occur are relatively few. The donor and acceptor moleculesmust be in close proximity to one another. The absorption or excitation spectrum ofthe acceptor must overlap the fluorescence emission spectrum of the donor. Thedegree to which they overlap is referred to as the spectral overlap integral (J).
For information about setting up a FRET mode protocol, see Creating a FRET ModeProtocol on page 192.
SoftMax Pro Software User Guide
5014177 F 119
Supported InstrumentsUser guides for each of the supported instruments are installed during the SoftMaxPro Software installation. You can view these user guides from the Windows Startmenu at Start > All Programs > Molecular Devices > SoftMax Pro 6.2.2 >Hardware User Guides.
SoftMax Pro Software supports the following instruments:
VersaMax ELISA Microplate Reader, see page 120
SpectraMax Plus 384 Absorbance Microplate Reader, see page 120
SpectraMax M2 and M2e Multi-Mode Microplate Readers, see page 121
SpectraMax M3 Multi-Mode Microplate Reader, see page 122
SpectraMax M4 Multi-Mode Microplate Reader, see page 123
SpectraMax M5 and M5e Multi-Mode Microplate Readers, see page 124
SpectraMax 340PC 384 Absorbance Microplate Reader, see page 124
SpectraMax 190 Absorbance Microplate Reader, see page 125
Gemini XPS Fluorescence Microplate Reader, see page 125
Gemini EM Fluorescence Microplate Reader, see page 126
FilterMax F5 Multi-Mode Microplate Reader, see page 127
FilterMax F3 Multi-Mode Microplate Reader, see page 128
DTX 800 and DTX 880 Multi-Mode Microplate Readers, see page 128
Vmax Kinetic ELISA Microplate Reader, see page 129
Emax Endpoint ELISA Microplate Reader, see page 129
SpectraMax Paradigm Multi-Mode Detection Platform, see page 130
StakMax Microplate Handling System, see page 141

Chapter 5: Instrument and Detection Settings
120 5014177 F
VersaMax ELISA Microplate Reader
The VersaMax™ ELISA Microplate Reader provides rapid and sensitivemeasurements of a variety of analytes across a wide range of concentrations. Youcan run both standard spectrophotometer and microplate reader applications onthe same instrument. Read one sample or up to 96 at a time. Use any standard 96-well microplate.
Detection mode includes:
Visible Absorbance (ABS), see ABS Read Mode on page 113.
VersaMax ELISA Microplate Readerfeatures include:
Full spectral range: 340 nm to 850 nm, tunable in 1 nm increments.
Superior performance: 2 nm bandwidth provides exceptional accuracy andlinearity for the widest range of assays.
Endpoint and Kinetic reads.
SpectraMax Plus 384 Absorbance Microplate Reader
The SpectraMax® Plus 384 Absorbance Microplate Reader has a built-in cuvetteport and microplate drawer. You can run both standard spectrophotometer andmicroplate reader applications on the same instrument. Read one sample or up to384 at a time. Use any standard cuvette, 12 x 75 mm test tube, or 96-well or 384-well microplate. For more sample throughput, the SpectraMax Plus 384Absorbance Microplate Reader can be integrated into a full robotic system.
Detection mode includes:
UV and Visible Absorbance (ABS), see ABS Read Mode on page 113.
SpectraMax Plus 384 Absorbance Microplate Reader features include:
Full spectral range: 190 nm to 1000 nm, tunable in 1 nm increments.
Superior performance: 2 nm bandwidth provides exceptional accuracy andlinearity for the widest range of assays.
Speed read mode: Reads 96-well microplates in just 5 seconds and 384-wellmicroplates in 16 seconds for ultra-fast sample throughput.
PathCheck Pathlength Measurement Technology reports the microplate data asstandard 1 cm cuvette values.
SoftMax Pro Software User Guide
5014177 F 121
SpectraMax M2 and M2e Multi-Mode Microplate Readers
The SpectraMax® M2 and M2e Multi-Mode Microplate Readers are instrumentswith two monochromators, dual-mode cuvette ports, and top-plate and bottom-plate reading capability (top-reading only on the SpectraMax M2 Multi-ModeMicroplate Reader). Area-well scanning read types and the Molecular DevicesPathCheck® Pathlength Measurement Technology allow homogeneous andheterogeneous microplate assays to be performed in one flexible system.
Detection modes include:
UV and Visible Absorbance (ABS), see ABS Read Mode on page 113.
Fluorescence Intensity (FL), see FL Read Mode on page 114.
Luminescence (LUM), see LUM Read Mode on page 114.
Time-Resolved Fluorescence (TRF), see TRF Read Mode on page 115.
Features of the SpectraMax M2 and M2e Multi-Mode Microplate Readers include:
Multi-detection capability
Top-read and bottom-read (M2e only)
Dual-mode cuvette port
Two monochromators
PathCheck Pathlength Measurement Technology and well volume sensors
Instrument and software validation
Automation compatible
Chapter 5: Instrument and Detection Settings
122 5014177 F
SpectraMax M3 Multi-Mode Microplate Reader
The SpectraMax® M3 Multi-Mode Microplate Reader is a modular, dual-monochromator microplate reader platform offering a wide range of highperformance multi-mode capabilities ideal for life science research and drugdiscovery screening. The SpectraMax M3 Multi-Mode Microplate Reader contains atriple-mode cuvette port, accurate temperature control, and microplate shakingcapability.
Detection modes include:
UV and Visible Absorbance (ABS), see ABS Read Mode on page 113.
Fluorescence Intensity (FL), see FL Read Mode on page 114.
Luminescence (LUM), see LUM Read Mode on page 114.
Features of the SpectraMax M3 Multi-Mode Microplate Reader include:
Three-mode cuvette port for assay development
Dual monochromator tunability
Automated Absorbance Pathlength Correction with PathCheck PathlengthMeasurement Technology
Endpoint, kinetic, spectral and well-scanning read types
Comprehensive Data Analysis with SoftMax Pro Software
Validation and compliance
Robotics compatibility
SoftMax Pro Software User Guide
5014177 F 123
SpectraMax M4 Multi-Mode Microplate Reader
The SpectraMax® M4 Multi-Mode Microplate Reader is a modular, dual-monochromator microplate reader platform offering a wide range of highperformance multi-mode capabilities ideal for life science research and drugdiscovery screening.
The SpectraMax M4 Multi-Mode Microplate Reader offers a triple-mode cuvetteport, accurate temperature control, and microplate shaking capability.
Detection modes include:
UV and Visible Absorbance (ABS), see ABS Read Mode on page 113.
Fluorescence Intensity (FL), see FL Read Mode on page 114.
Luminescence (LUM), see LUM Read Mode on page 114.
Time-Resolved Fluorescence (TRF), see TRF Read Mode on page 115.
Features of the SpectraMax M4 Multi-Mode Microplate Reader include:
Three-mode cuvette port for assay development
Dual monochromator tunability
PathCheck Pathlength Measurement Technology
Endpoint, kinetic, spectrum, and well scan read types
Comprehensive Data Analysis with SoftMax Pro Software
Validation and compliance
Automation compatibility
Chapter 5: Instrument and Detection Settings
124 5014177 F
SpectraMax M5 and M5e Multi-Mode Microplate Readers
The SpectraMax® M5 and M5e Multi-Mode Microplate Readers are modular,upgradable, dual-monochromator microplate reader platforms offering a widerange of high performance multi-mode capabilities ideal for life science researchand drug discovery screening.
The SpectraMax M5 and M5e Multi-Mode Microplate Readers offer triple-modecuvette port, accurate temperature control, and microplate shaking capability.
Detection modes include:
UV and Visible Absorbance (ABS), see ABS Read Mode on page 113.
Fluorescence Intensity (FL), see FL Read Mode on page 114.
Luminescence (LUM), see LUM Read Mode on page 114.
Time-Resolved Fluorescence (TRF), see TRF Read Mode on page 115.
Fluorescence Polarization (FP), see FP Read Mode on page 116.
Features of the SpectraMax M5 and M5e Multi-Mode Microplate Readers include:
Three-mode cuvette port for assay development
Dual monochromator tunability
PathCheck Pathlength Measurement Technology
Endpoint, kinetic, spectral, and well-scanning read types
Comprehensive Data Analysis with SoftMax Pro Software
Validation and compliance
Automation compatibility
SpectraMax 340PC 384 Absorbance Microplate Reader
The SpectraMax® 340PC 384 Absorbance Microplate Reader provides rapid andsensitive measurements of a variety of analytes across a wide range ofconcentrations. You can run both standard spectrophotometer and microplatereader applications on the same instrument. Read one sample or up to 384 at atime. Use any standard 96-well or 384-well microplate.
Detection mode includes:
Visible Absorbance (ABS), see ABS Read Mode on page 113.
SpectraMax 340PC 384 Absorbance Microplate Reader features include:
Full spectral range: 340 nm to 850 nm, tunable in 1 nm increments.
Superior performance: 2 nm bandwidth provides exceptional accuracy andlinearity for the widest range of assays.
PathCheck Pathlength Measurement Technology reports the microplate data asstandard 1 cm cuvette values.

SoftMax Pro Software User Guide
5014177 F 125
SpectraMax 190 Absorbance Microplate Reader
The SpectraMax® 190 Absorbance Microplate Reader provides rapid and sensitivemeasurements of a variety of analytes across a wide range of concentrations. Readone sample or up to 96 at a time. Use any standard 96-well microplate.
Detection mode includes:
UV and Visible Absorbance (ABS), see ABS Read Mode on page 113.
SpectraMax 190 Absorbance Microplate Reader features include:
Full spectral range: 190 nm to 850 nm, tunable in 1 nm increments.
Superior performance: 2 nm bandwidth provides exceptional accuracy andlinearity for the widest range of assays.
PathCheck Pathlength Measurement Technology reports the microplate data asstandard 1 cm cuvette values.
Gemini XPS Fluorescence Microplate Reader
The Gemini™ XPS Fluorescence Microplate Reader can perform a variety offluorescent applications. The extreme flexibility and high sensitivity makes theGemini XPS Fluorescence Microplate Reader appropriate for applications withinthe fields of biochemistry, cell biology, immunology, molecular biology, andmicrobiology.
Detection modes include:
Fluorescence Intensity (FL), see FL Read Mode on page 114.
Luminescence (LUM), see LUM Read Mode on page 114.
Time-Resolved Fluorescence (TRF), see TRF Read Mode on page 115.
Gemini XPS Fluorescence Microplate Reader features include:
Dual monochromators allow the selection of any wavelength in 1 nmincrements.
Cutoff filters reduce stray light and minimize background interference.
Wavelength scanning ensures that the most sensitive assay conditions areused.

Chapter 5: Instrument and Detection Settings
126 5014177 F
Gemini EM Fluorescence Microplate Reader
The Gemini™ EM Fluorescence Microplate Reader can perform a variety offluorescent applications. The extreme flexibility and high sensitivity makes theGemini EM Fluorescence Microplate Reader appropriate for applications within thefields of biochemistry, cell biology, immunology, molecular biology, andmicrobiology. The top-read and bottom-read optical design allows formeasurements for both solution and cell-based assays.
Detection modes include:
Fluorescence Intensity (FL), see FL Read Mode on page 114.
Luminescence (LUM), see LUM Read Mode on page 114.
Time-Resolved Fluorescence (TRF), see TRF Read Mode on page 115.
Gemini EM Fluorescence Microplate Reader features include:
Dual monochromators allow the selection of any wavelength in 1 nmincrements.
Cutoff filters reduce stray light and minimize background interference.
Wavelength scanning ensures that the most sensitive assay conditions areused.

SoftMax Pro Software User Guide
5014177 F 127
FilterMax F5 Multi-Mode Microplate Reader
The FilterMax™ F5 Multi-Mode Microplate Reader is ideal for a broad range ofapplications, including drug discovery, genomics, proteomics, and cell-basedresearch. The unique patented design ensures precise performance and sensitivityacross all detection modes.
Detection modes include:
UV and Visible Absorbance (ABS), see ABS Read Mode on page 113.
Fluorescence Intensity (FL), see FL Read Mode on page 114.
Luminescence (LUM), see LUM Read Mode on page 114.
Time-Resolved Fluorescence (TRF), see TRF Read Mode on page 115.
Fluorescence Polarization (FP), see FP Read Mode on page 116.
Fluorescence Resonance Energy Transfer (FRET), see FRET Read Mode on page118.
Features of the FilterMax F5 Multi-Mode Microplate Reader include:
Absorbance detection in the UV and visible range (230 nm to 650 nm)
Fluorescence Intensity (FL) top read and bottom read
Endpoint, kinetic, multiple wavelength, linear scan, and area scan read types
PathCheck Pathlength Measurement Technology
Automatic read height (Z-height) optimization for top read
Temperature Control
Comprehensive Data Analysis with SoftMax Pro Software
The filters used to perform measurements are mounted on two types ofinterchangeable slides. One slide is reserved for excitation filters used inabsorbance and fluorescence measurements; the other is used for emission filtersused in fluorescence and some luminescence measurements. Each slide can holdup to six filters. For more information, see Configuring Filter Slides on page 262.
Chapter 5: Instrument and Detection Settings
128 5014177 F
FilterMax F3 Multi-Mode Microplate Reader
The FilterMax™ F3 Multi-Mode Microplate Reader is ideal for a broad range ofapplications, including drug discovery, genomics, proteomics, and cell-basedresearch. The unique patented design ensures precise performance and sensitivityacross all detection modes.
Detection modes include:
Visible Absorbance (ABS), see ABS Read Mode on page 113.
Fluorescence Intensity (FL), see FL Read Mode on page 114.
Luminescence (LUM), see LUM Read Mode on page 114.
Fluorescence Resonance Energy Transfer (FRET), see FRET Read Mode on page118.
Features of the FilterMax F3 Multi-Mode Microplate Reader include:
Absorbance detection in the visible range (340 nm to 650 nm)
Endpoint, kinetic, multiple wavelength, linear scan, and area scan read types
Comprehensive Data Analysis with SoftMax Pro Software
The filters used to perform measurements are mounted on two types ofinterchangeable slides. One slide is reserved for excitation filters used inabsorbance and fluorescence measurements; the other is used for emission filtersused in fluorescence and some luminescence measurements. Each slide can holdup to six filters. For more information, see Configuring Filter Slides on page 262.
DTX 800 and DTX 880 Multi-Mode Microplate Readers
The DTX 800 and DTX 880 Multi-Mode Microplate Readers are earlier models ofthe FilterMax F3 and F5 Multi-Mode Microplate Readers. For information about theDTX 800 and DTX 880 Multi-Mode Microplate Readers, refer to information in thisdocumentation regarding the FilterMax F3 and F5 Multi-Mode Microplate Readers.
For information about the DTX 800 Multi-Mode Microplate Reader, seeFilterMax F3 Multi-Mode Microplate Reader on page 128.
For information about the DTX 880 Multi-Mode Microplate Reader, seeFilterMax F5 Multi-Mode Microplate Reader on page 127.

SoftMax Pro Software User Guide
5014177 F 129
Vmax Kinetic ELISA Microplate Reader
The Vmax® Kinetic ELISA Microplate Reader measures optical density (OD) andcan conduct a kinetic analysis, the rate of optical density change per minute(milliOD/min). The optical array is designed to analyze the absorbance of multiplesample sites with 9 mm centers. Read one sample or up to 96 at a time. Use anystandard 96-well microplate.
Detection mode includes:
Visible Absorbance (ABS), see ABS Read Mode on page 113.
Vmax Kinetic ELISA Microplate Reader features include:
Filter range: 400 nm to 750 nm
Filter capacity: 6
Optical density: single wavelength and dual wavelength
Emax Endpoint ELISA Microplate Reader
The Emax® Endpoint ELISA Microplate Reader measures optical density (OD). Theoptical array is designed to analyze the absorbance of multiple sample sites with9 mm centers. Read one sample or up to 96 at a time. Use any standard 96-wellmicroplate.
Detection mode includes:
Visible Absorbance (ABS), see ABS Read Mode on page 113.
Emax Endpoint ELISA Microplate Reader features include:
Filter range: 400 nm to 750 nm
Filter capacity: 6
Optical density: single wavelength and dual wavelength
Chapter 5: Instrument and Detection Settings
130 5014177 F
SpectraMax Paradigm Multi-Mode Detection Platform
The SpectraMax® Paradigm® Multi-Mode Detection Platform is a modular multi-mode microplate reader. User-installable and removable detection cartridges allowthe reader to be configured for specific applications and easily expand thecapabilities of the reader at any time. The measurement capabilities of the readerare defined by the installed detection cartridges.
Up to six detection cartridges can be installed in each of the two detection cartridgedrawers of the SpectraMax Paradigm Multi-Mode Detection Platform.
Every detection cartridge starts with an excitation energy source either in the formof long-life, high-powered LED, a xenon flash lamp, or a laser diode. Byconcentrating the excitation energy on the sample through label-specific optics,high levels of sensitivity and performance are reached.
For information about the different detection cartridges, see SpectraMax ParadigmDetection Cartridges on page 131.
Features of the SpectraMax® Paradigm® Multi-Mode Detection Platform include:
Array of detection cartridge capabilities
Automatic read height (Z-height) optimization for both top and bottom read
Patent-pending LED intensity adjustment
Up to 1536-well format
Temperature control
Monochromator and filter based options available
PathCheck Pathlength Measurement Technology
AlphaScreen

SoftMax Pro Software User Guide
5014177 F 131
SpectraMax Paradigm Detection Cartridges
The SpectraMax Paradigm Multi-Mode Detection Platform supports the followingdetection cartridges:
Absorbance Detection Cartridge, see page 132
Tunable Wavelength (TUNE) Detection Cartridge, see page 132
Multi-Mode (MULTI) Detection Cartridge, see page 133
AlphaScreen Detection Cartridges , see page 134
Cisbio HTRF Detection Cartridge on page 135
Time Resolved Fluorescence (TRF) Detection Cartridge, see page 136
Fluorescence Intensity (FI) Detection Cartridges, see page 137
Fluorescence Intensity (FI) GeneBLAzer Detection Cartridge, see page 138
Fluorescence Intensity Dual Label (FI-DL) (MultiTox-Fluor) Detection Cartridge,see page 138
Fluorescence Polarization (FP) Detection Cartridge, see page 139
Glow Luminescence (LUM) Detection Cartridges, see page 140
Dual Color Luminescence (LUM) (BRET2) Detection Cartridge, see page 140
Dual Color Luminescence (LUM) (Chroma-Glo) Detection Cartridge, see page140
For complete descriptions and specifications for each of the supported detectioncartridges, see the SpectraMax Paradigm Multi-Mode Detection Platform UserGuide.

Chapter 5: Instrument and Detection Settings
132 5014177 F
Absorbance Detection Cartridge
The SpectraMax® Paradigm® Absorbance Detection Cartridge combineswavelength scanning and a broad spectrum wavelength range necessary to addressa variety of nucleic acids, proteins, ELISAs, and immunoassays found in thelaboratory. The Absorbance Detection Cartridge uses a monochromator to performabsorbance endpoint, kinetic, well scan, and spectrum read types (wavelengthscanning) measurements.
The Absorbance Detection Cartridge consists of two components: a detectioncomponent (ABS-DET) which measures the absorbance, and an excitationcomponent (ABS-MONO) which sets the absorbance wavelengths. The detectioncomponent is installed in the top read detection cartridge drawer and occupies one(1) detection cartridge slot. The excitation component is installed in the bottomread detection cartridge drawer and occupies two (2) detection cartridge slots.Both components must be installed to perform absorbance measurements with theSpectraMax Paradigm Multi-Mode Detection Platform.
Typical Applications
Nucleic Acid Quantitation
Protein Quantitation
ELISA
Immunoassay
Proliferation/Viability
Tunable Wavelength (TUNE) Detection Cartridge
The SpectraMax® Paradigm® Tunable Wavelength (TUNE) Detection Cartridge isa detection cartridge for use with the SpectraMax Paradigm Multi-Mode DetectionPlatform. Installing the Tunable Wavelength (TUNE) Detection Cartridge enablesseveral detection modes, including:
Fluorescence Intensity (FL), see FL Read Mode on page 114.
Glow Luminescence (LUM), see LUM Read Mode on page 114.
Time-Resolved Fluorescence (TRF), see TRF Read Mode on page 115.
The spectral optimization feature of the Tunable Wavelength (TUNE) DetectionCartridge can help to get the maximum signal to background ratio for virtually anyfluorophore or luminescence label compatible with the wavelength ranges.
In addition, the Tunable Wavelength (TUNE) Detection Cartridge can perform aSpectrum read to apply either excitation or emission scanning. See SpectralOptimization on page 202.
The Tunable Wavelength (TUNE) Detection Cartridge occupies three (3) slots. Itcan be installed in either the top read detection cartridge drawer for top reading, orin the bottom read detection cartridge drawer for bottom reading.

SoftMax Pro Software User Guide
5014177 F 133
Multi-Mode (MULTI) Detection Cartridge
Optimized for 96-well and 384-well plates, the SpectraMax® Paradigm® Multi-Mode (MULTI) Detection Cartridge provides a broad array of measurementcapabilities:
Fluorescence Intensity (FL), see FL Read Mode on page 114.
Glow Luminescence (LUM), see LUM Read Mode on page 114.
Time-Resolved Fluorescence (TRF), see TRF Read Mode on page 115.
Typical Applications
Proliferation/Viability
Nucleic Acid Quantitation
cAMP Quantitation
GPCR
Immunoassay
Ion Channel
Reporter
Typical Fluorophores
Coumarin
Fluorescein
Rhodamine
Texas Red
Europium (TRF only)
Note: This list does not represent a complete list of applications or labelswhich can be performed by the Multi-Mode (MULTI) Detection Cartridge.

Chapter 5: Instrument and Detection Settings
134 5014177 F
AlphaScreen Detection Cartridges
The SpectraMax® Paradigm® AlphaScreen® Detection Cartridges use a 680 nmlaser diode to provide a sensitive reading system for AlphaScreen assays. Inaddition, a patent-pending design that isolates each well enables optimalperformance for AlphaScreen assays.
The following AlphaScreen Detection Cartridges are available:
AlphaScreen 384 Std Detection Cartridge
AlphaScreen 384 HTS Detection Cartridge
AlphaScreen 1536 HTS Detection Cartridge
Typical Applications
The AlphaScreen Detection Cartridge provides optimal performance for keyapplications in drug discovery:
GPCR Assays
Cytokine Assays
cAMP Quantitation
Kinase Assays
ALPHASCREEN is a registered trademark of PerkinElmer, Inc.
SoftMax Pro Software User Guide
5014177 F 135
Cisbio HTRF Detection Cartridge
The SpectraMax® Paradigm® Cisbio HTRF® Detection Cartridge uses a high-energy Xenon flash lamp for sensitive reading of HTRF reagents. In addition, thestandard dual-emission design gives the most accurate results in short overall readtime.
Typical Applications
The Cisbio HTRF Detection Cartridge provides optimal performance for keyapplications for drug discovery, bioprocess development, and others.
GPCR Assays
Cytokine Assays
cAMP Quantitation
Human mAb Screening
Kinase Assays
HTRF is a registered trademark of Cisbio Bioassays.
The fluorescence ratio associated with the HTRF readout is a correction methoddeveloped by CisBio and covered by the US patent 5,527,684 and its foreignequivalents, for which CisBio has granted a license to Molecular Devices. Itsapplication is strictly limited to the use of HTRF reagents and technology, excludingany other TR-FRET technologies such as IMAP TR-FRET calculations of acceptor todonor ratios.

Chapter 5: Instrument and Detection Settings
136 5014177 F
Time Resolved Fluorescence (TRF) Detection Cartridge
The SpectraMax® Paradigm® Time Resolved Fluorescence (TRF) DetectionCartridge is built to measure Europium and Samarium. It is ideal for your proteininteraction, GPCR, and enzyme activity applications.
Typical Applications
cAMP Quantitation
Immunoassays
GTP Binding
Apoptosis
GPCR Ligand Binding
Typical Fluorophores
Europium Chelates
Samarium Chelates
Note: These lists do not represent a complete list of applications or labelsthat can be performed by the Time Resolved Fluorescence (TRF) DetectionCartridge.
SoftMax Pro Software User Guide
5014177 F 137
Fluorescence Intensity (FI) Detection Cartridges
The SpectraMax® Paradigm® Fluorescence Intensity (FI) Detection Cartridgesprovide speed, sensitivity, and flexibility. The cartridge design providesuncompromised performance for both top and bottom reads. In addition, thestandard dual-emission design enables simple, straightforward FRET (fluorescenceresonance energy transfer) measurement.
The following Fluorescence Intensity (FI) Detection Cartridges are available:
Fluorescence Intensity (FI) (coum-fluor) Detection Cartridge
Fluorescence Intensity (FI) (fluor-rhod) Detection Cartridge
Fluorescence Intensity (FI) (Cy3-Cy5) Detection Cartridge
Fluorescence Intensity (FI) (CFP-YFP) Detection Cartridge
Other Fluorescence Intensity (FI) Detection Cartridges include the FluorescenceIntensity (FI) GeneBLAzer Detection Cartridge on page 138 and the FluorescenceIntensity Dual Label (FI-DL) (MultiTox-Fluor) Detection Cartridge on page 138.
Typical Applications
Nucleic Acid Quantitation
Molecular Interaction
Ion Channel
Protein Quantitation
Reporter Gene Assays
Apoptosis
Proliferation/Viability
Note: This list does not represent a complete list of applications or labelswhich can be performed by the Fluorescence Intensity (FI) DetectionCartridges.

Chapter 5: Instrument and Detection Settings
138 5014177 F
Fluorescence Intensity (FI) GeneBLAzer Detection Cartridge
The SpectraMax®Paradigm®Fluorescence Intensity (FI) GeneBLAzer DetectionCartridge is designed for use with GeneBLAzer assays from Invitrogen. Thecartridge design provides uncompromised performance for both top and bottomreads. In addition, the standard dual-emission design enables simple,straightforward FRET (fluorescence resonance energy transfer) measurement.
Typical Applications
Cell Based assays:
GPCR Assays
Ion Channel
Nuclear & Cytokine Receptor Assays
Signal Transduction Pathways
Transcriptional Regulators (Kinases)
Fluorescence Intensity Dual Label (FI-DL) (MultiTox-Fluor) DetectionCartridge
The innovative SpectraMax®Paradigm®Fluorescence Intensity Dual Label (FI-DL)(MultiTox-Fluor) Detection Cartridge is designed for use with MultiTox-Fluorassays from Promega. It uses two high-powered LEDs to provide fast, sensitive,simultaneous reads of two distinct labels.
In a dual color method, dual labels (such as gene reporters) causing the emissionof different wavelength bands at the same time are measured.
Typical Applications
The Fluorescence Intensity Dual Label (FI-DL) (MultiTox-Fluor) DetectionCartridge provides optimal performance for key applications for Drug Discovery,Cancer Research, ADME-Tox studies, and others.

SoftMax Pro Software User Guide
5014177 F 139
Fluorescence Polarization (FP) Detection Cartridge
The SpectraMax® Paradigm® Fluorescence Polarization (FP) Detection Cartridgetakes full advantage of the standard dual photomultiplier tube design of theSpectraMax Paradigm Multi-Mode Detection Platform to collect all the necessarydata in a single read of a microplate. The resulting speed and performance areexceptional.
Typical Applications
cAMP Quantitation
Genotyping (AcycloPrime)
Immunoassay
Molecular Interaction
Nuclear Receptor
Typical Fluorophores
Fluorescein
FP - green
Rhodamine
FP - red-shifted dye
Note: This list does not represent a complete list of applications or labelsthat can be performed by the Fluorescence Polarization (FP) DetectionCartridge.

Chapter 5: Instrument and Detection Settings
140 5014177 F
Glow Luminescence (LUM) Detection Cartridges
The SpectraMax® Paradigm® Glow Luminescence (LUM) Detection Cartridgesuse a patent-pending design that isolates each well to provide optimal performancefor glow-luminescence applications.
The three Glow Luminescence (LUM) Detection Cartridges are each optimized for apopular plate format: 96-well, 384-well, or 1536-well.
Typical Applications
Apoptosis
cAMP Quantitation
GPCR Ligand Binding
GTP Binding
Immunoassay
Note: This list does not represent a complete list of applications or labelsthat can be performed by the Glow Luminescence (LUM) DetectionCartridges.
Dual Color Luminescence (LUM) (BRET2) Detection Cartridge
The SpectraMax® Paradigm® Dual Color Luminescence (LUM) (BRET2™)Detection Cartridge uses a patent-pending design that isolates each well to provideoptimal performance for chemiluminescence applications. In addition, the standarddual-emission design gives most accurate results in short overall read time.
In a dual-color method, dual labels (such as gene reporters) causing the emissionof different wavelength bands at the same time are measured.
The Dual Color Luminescence (LUM) (BRET2) Detection Cartridge is designed toprovide optimal performance when used with PerkinElmer BRET2 reagents. Wheninserted, the template protocols are enabled with predefined data reduction suchas blank subtraction, green to blue ratio, and determination of the Z’ factor.
BRET2 is a trademark of PerkinElmer, Inc.
Dual Color Luminescence (LUM) (Chroma-Glo) Detection Cartridge
The SpectraMax® Paradigm® Dual Color Luminescence (LUM) (Chroma-Glo™)Detection Cartridge uses a patent-pending design that isolates each well to provideoptimal performance for chemiluminescence applications. In addition, the standarddual-emission design gives most accurate results in short overall read time.
In a dual-color method, dual labels (such as gene reporters) causing the emissionof different wavelength bands at the same time are measured.
The Dual Color Luminescence (LUM) (Chroma-Glo) Detection Cartridge containsemission filters designed for Promega Chroma-Glo reagents.
Chroma-Glo is a trademark of Promega Corporation.

SoftMax Pro Software User Guide
5014177 F 141
StakMax Microplate Handling System
The StakMax® Microplate Handling System is an integrated microplate stacker foruse with Molecular Devices microplate readers, providing simple, powerful, walk-away benchtop automation.
The StakMax Software is accessed from the Operations tab in the ribbon. Whenyou click Plate Stacker, the SoftMax Pro Software is place in automation mode,and then the StakMax Software starts and automatically connects to the StakMaxMicroplate Handling System. The current status of the instrument appears in thestatus bar of the StakMax Software window.
CAUTION! To prevent data loss, make sure that Auto Save is enabled foreach protocol you want to run before you start the StakMax Software to runautomated reads. See Setting Auto Save Options on page 56.
The StakMax Microplate Handling System is compatible with the followingmicroplate readers:
SpectraMax M2 and M2e Multi-Mode Microplate Readers
SpectraMax M3 Multi-Mode Microplate Reader
SpectraMax M4 Multi-Mode Microplate Reader
SpectraMax M5 and M5e Multi-Mode Microplate Readers
Gemini™ EM and XPS Fluorescence Microplate Readers
SpectraMax Paradigm Multi-Mode Detection Platform
In addition, newer models of the following readers are compatible with theStakMax Microplate Handling System:
SpectraMax Plus 384 Absorbance Microplate Reader
SpectraMax 340PC 384 Absorbance Microplate Reader
SpectraMax 190 Absorbance Microplate Reader
VersaMax ELISA Microplate Reader
For more information about using the StakMax Microplate Handling System, seethe StakMax Microplate Handling System User Guide or the help available in theStakMax Software.
For information about the SoftMax Pro Software automation mode, see UsingAutomation Mode on page 42.
Chapter 5: Instrument and Detection Settings
142 5014177 F
Instrument SettingsEach Plate section or Cuvette Set section in a file or experiment must use thesame instrument, but can have different parameters for the instrument settings.
Use the Settings dialog to configure all parameters for a microplate or cuvetteread, such as the read type (Endpoint, Kinetic, Spectrum, Well Scan), the readmode (Absorbance, Fluorescence, Luminescence, Time Resolved Fluorescence,Fluorescence Polarization, ALPHAScreen, FRET), wavelength settings, microplatetype, wells to read, PathCheck technology, optics settings, shake parameters,timing for Kinetic runs, speed read, and more.
To open the Settings dialog:
1. Click a Plate section or Cuvette Set section to make it active in theworkspace.
2. Click Settings on the Home tab in the ribbon or in the toolbar at the topof the active section.
The available options in the Settings dialog depend on the instrument that isselected. For information about the available settings, see the following topics:
Wavelength Settings on page 143
Plate Type Settings on page 144
Read Area Settings on page 147
PathCheck Pathlength Measurement Technology on page 148
TRF Settings on page 152
PMT and Optics Settings on page 152
Timing Settings on page 153
Well Scan Settings on page 154
Shake Settings on page 155
Speed Read on page 155
More Settings on page 156

SoftMax Pro Software User Guide
5014177 F 143
Wavelength Settings
Wavelength settings vary depending on the selected instrument, read mode, andread type.
Procedures to optimize excitation and emission wavelengths for a given protocolare described in the instrument user guides for the readers that support thisfunction. For more information, see those user guides.
For Endpoint, Kinetic, or Well Scan Reads
Specify the number of wavelengths to read, and then type a wavelength valuewithin the available range for the instrument in the field for each wavelength.
For filter-based instruments, select from the available filters.
For Spectrum Reads
Choose a Start and a Stop wavelength value within the available range for theinstrument, and choose a wavelength Step for each increment between reads.
The minimum selectable Step increment is 1 nm.
Cutoffs
The choices in this portion of the Wavelengths setting depend on the selections forread type (Endpoint, Kinetic, Spectrum, or Well Scan) and read mode(Fluorescence, Fluorescence Polarization, or Time Resolved Fluorescence).
The term cutoff refers to filters used to block unwanted residual excitation light andminimize background interference.
No emission cutoff filter is used when a Luminescence read mode is selected. Withother read modes, choices are to enable or disable Auto Cutoff with specific filtersettings available if it is disabled (manual cutoff selection). When Auto Cutoff isenabled, the instrument sets the cutoffs based on the wavelengths chosen forreading. When a Spectrum read type is selected, a manual setting for the emissionmonochromator is required, with the default being no cutoff filter.
Determining a manual setting for a cutoff filter is based on the known value of theStokes shift, which the difference between the wavelengths of the excitation andemission maxima. If the Stokes shift is small, it is advisable to choose anexcitation wavelength that is as far as possible from the emission maximum whilestill being capable of exciting the fluorophore. Doing this causes less of the excitedlight to overlap the emission spectrum, allowing better selection and quantitationof the emitted light. See the individual instrument user guides for more informationabout cutoff filter settings.
Chapter 5: Instrument and Detection Settings
144 5014177 F
Plate Type Settings
The Plate Type settings determines the display of the wells in the Plate section.Set it to match the microplate type, the number of wells, the clarity or opaquenessof the wells, and the round or square shape of the wells in the microplate to beread.
The Plate Library includes entries for microplates of various sizes with standarddimensions.
If you are uncertain which plate to select, then select the Standard plate definition.
You can choose to edit the dimensions of a plate or add a custom plate to the platelibrary.
To edit the dimensions of a plate in the library, select the plate from the list andclick Edit Plate.
To add a new plate to the library, select any plate from the list and click EditPlate. Type a name for the new plate in the Plate Name field of the PlateEditor dialog.
To include a plate from a predefined plate description, click Import Plate anduse the file system browser to locate the plate description file.
Note: The Import Plate option is available only for the SpectraMaxParadigm Multi-Mode Detection Platform and the FilterMax F3 and F5Multi-Mode Microplate Readers.
To delete a plate from the plate library, select the plate to be removed and clickRemove.
For information about entering custom plate dimensions, see Using the Plate Editoron page 145.
When using a SpectraMax Paradigm Multi-Mode Detection Platform, you candefine the plate orientation.
Choose the plate orientation to match the orientation of the plate in the platedrawer.
Landscape puts the A1 location in the upper-left corner closest to theinstrument.
Portrait puts the A1 location in the upper-right corner closest to theinstrument.
Opposite Landscape puts the A1 location in the lower-right corner farthestfrom the instrument.
Opposite Portrait puts the A1 location in the lower-left corner farthest fromthe instrument.
Changing the Plate Type within a Plate section causes the well assignments storedin the previous template to be discarded. The groups created previously remain,however, so you can select new wells and apply existing groups to these wells.
SoftMax Pro Software User Guide
5014177 F 145
Using the Plate Editor
Use the Plate Editor to modify the definition of an existing microplate, or to add anew microplate definition to the Plate Library.
To view the Plate Editor:
1. Click a Plate section to make it active in the workspace.
2. Click Settings on the Home tab in the ribbon or in the toolbar at the topof the active section.
3. In the Settings dialog, click the Plate Type category.
4. In the Plate Type Settings, click Edit Plate.
The Plate Editor has five fields and one or two check boxes that you can use todefine plate dimensions, in millimeters.
Note: SoftMax Pro Software comes with plate definitions for the μMax 24-well low-volume microplates and μMax 64-well low-volume microplates.
Modifying the Dimension of an Existing Plate
To modify the dimension of an existing plate when you do not want to change thename of the plate:
1. In the Plate Type Settings, click the plate in the list and then click EditPlate.
2. Type the custom dimensions as needed.
3. Click Save.
The changed plate has an asterisk at the end of the plate name.
Creating a New Plate
1. In the Plate Type Settings, click any plate in the plate list then and click EditPlate.
Defining a new plate can be easier if you select a similar plate from the listbefore opening the Plate editor.
2. In the Plate Editor, in the Plate Name field, type a name for the new platedefinition.
3. Type the dimensions of the new plate as needed.
4. Click Save.
The new plate name appears in the plate list.

Chapter 5: Instrument and Detection Settings
146 5014177 F
Field Name Image Description
Left Edge toLeft WellCenter
The distance from the left edge of the plate to thecenter of well A1.
Top Edge toTop Left WellCenter
The distance from the top edge of the plate to thecenter of well A1.
HorizontalCenter toCenter
The horizontal distance between well centers.
VerticalCenter toCenter
The vertical distance between well centers.
WellDiameter
The diameter of a round well or the width of a squarewell.
Well ShapeSquare
Check box The wells have a square shape, rather than round.
This setting is available only with the SpectraMaxParadigm Multi-Mode Detection Platform and theFilterMax F3 and F5 Multi-Mode Microplate Readers.
Well BottomTypeClear wellbottom
Check box The wells have a clear bottom, rather than opaque.
Plate Height The height of the microplate used to determine theread height for top reads.
This setting is available only with the SpectraMaxParadigm Multi-Mode Detection Platform and theFilterMax F3 and F5 Multi-Mode Microplate Readers.
Table 5-1: Plate Editor Tools
The distance from the left edge of the plate to the center of well A1 must alsoinclude an offset to accommodate the angle of the optics.
Appropriate measurements should be taken in the lab to determine the correctsettings for these fields.
Microplate definitions are saved in the CustomPlates.plt file in the MolecularDevices folder. A custom microplate definition is specific to the computer onwhich it is saved, when a protocol that has a custom microplate selected is openedon another computer, the SoftMax Pro Software gives an option to save the custommicroplate definition on the new computer

SoftMax Pro Software User Guide
5014177 F 147
Importing a Plate Definition
For the SpectraMax Paradigm Multi-Mode Detection Platform, you can import apreviously saved microplate definition.
1. In the Plate Type Settings, click Import Plate.
2. In the Open dialog, navigate to the location where the microplate definition issaved.
3. Select the Microplate File (*.plt) or Multimode File (*.xml) file type.
4. Select the plate definition file.
5. Click Open to add the plate definition to the list.
Read Area Settings
Partial-plate reading is available for all read types, although it is most useful forfast Kinetic analysis. The time required for Kinetic readings can be significantlyreduced using this setting since the instrument does not have to read the entireplate.
You can choose to read an entire plate or a subset of wells. Drag the cursor toselect the wells to be read.
You can select a contiguous, rectangular region on the plate. Columns do not needto start with “1” but must be contiguous.
To read all the wells in the plate, select the Select All check box.
If you enable a partial-plate reading, only the wells to be read are visible in thedata display, indicating that no data will be collected for the other wells. All wells,however, are present in the Template Editor. See Configuring a MicroplateTemplate on page 162.
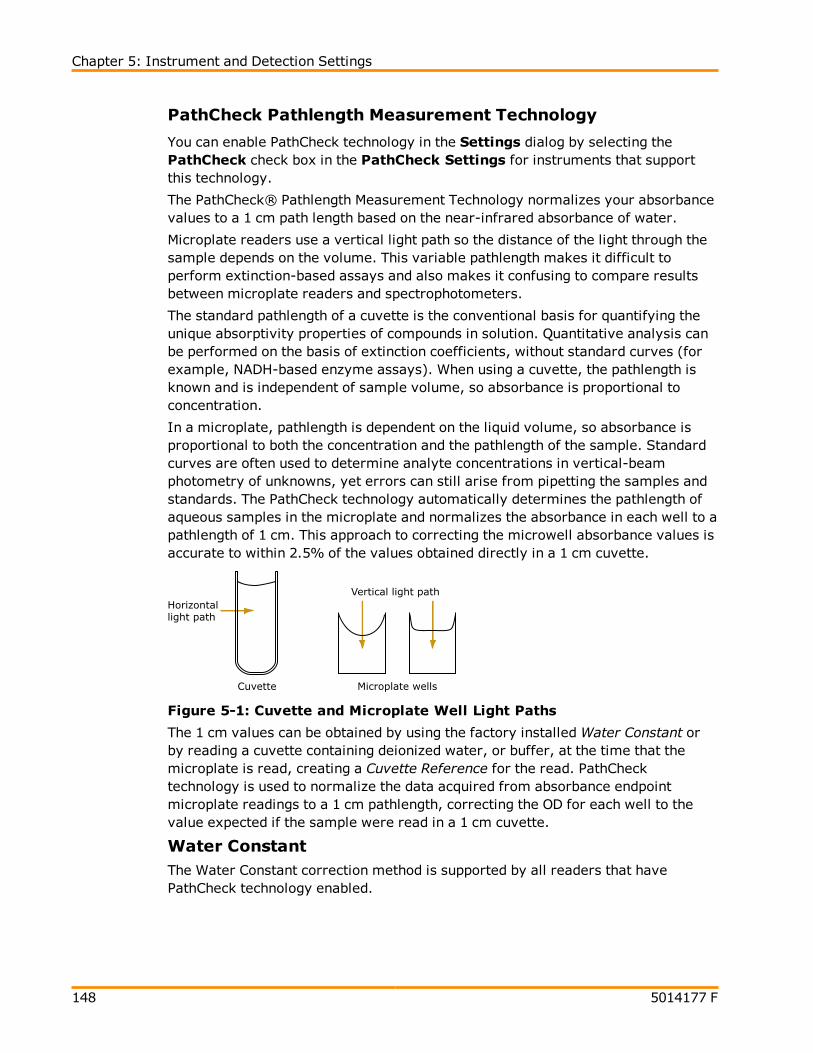
Chapter 5: Instrument and Detection Settings
148 5014177 F
PathCheck Pathlength Measurement Technology
You can enable PathCheck technology in the Settings dialog by selecting thePathCheck check box in the PathCheck Settings for instruments that supportthis technology.
The PathCheck® Pathlength Measurement Technology normalizes your absorbancevalues to a 1 cm path length based on the near-infrared absorbance of water.
Microplate readers use a vertical light path so the distance of the light through thesample depends on the volume. This variable pathlength makes it difficult toperform extinction-based assays and also makes it confusing to compare resultsbetween microplate readers and spectrophotometers.
The standard pathlength of a cuvette is the conventional basis for quantifying theunique absorptivity properties of compounds in solution. Quantitative analysis canbe performed on the basis of extinction coefficients, without standard curves (forexample, NADH-based enzyme assays). When using a cuvette, the pathlength isknown and is independent of sample volume, so absorbance is proportional toconcentration.
In a microplate, pathlength is dependent on the liquid volume, so absorbance isproportional to both the concentration and the pathlength of the sample. Standardcurves are often used to determine analyte concentrations in vertical-beamphotometry of unknowns, yet errors can still arise from pipetting the samples andstandards. The PathCheck technology automatically determines the pathlength ofaqueous samples in the microplate and normalizes the absorbance in each well to apathlength of 1 cm. This approach to correcting the microwell absorbance values isaccurate to within 2.5% of the values obtained directly in a 1 cm cuvette.
Horizontal light path
Vertical light path
Cuvette Microplate wells
Figure 5-1: Cuvette and Microplate Well Light Paths
The 1 cm values can be obtained by using the factory installedWater Constant orby reading a cuvette containing deionized water, or buffer, at the time that themicroplate is read, creating a Cuvette Reference for the read. PathChecktechnology is used to normalize the data acquired from absorbance endpointmicroplate readings to a 1 cm pathlength, correcting the OD for each well to thevalue expected if the sample were read in a 1 cm cuvette.
Water ConstantThe Water Constant correction method is supported by all readers that havePathCheck technology enabled.
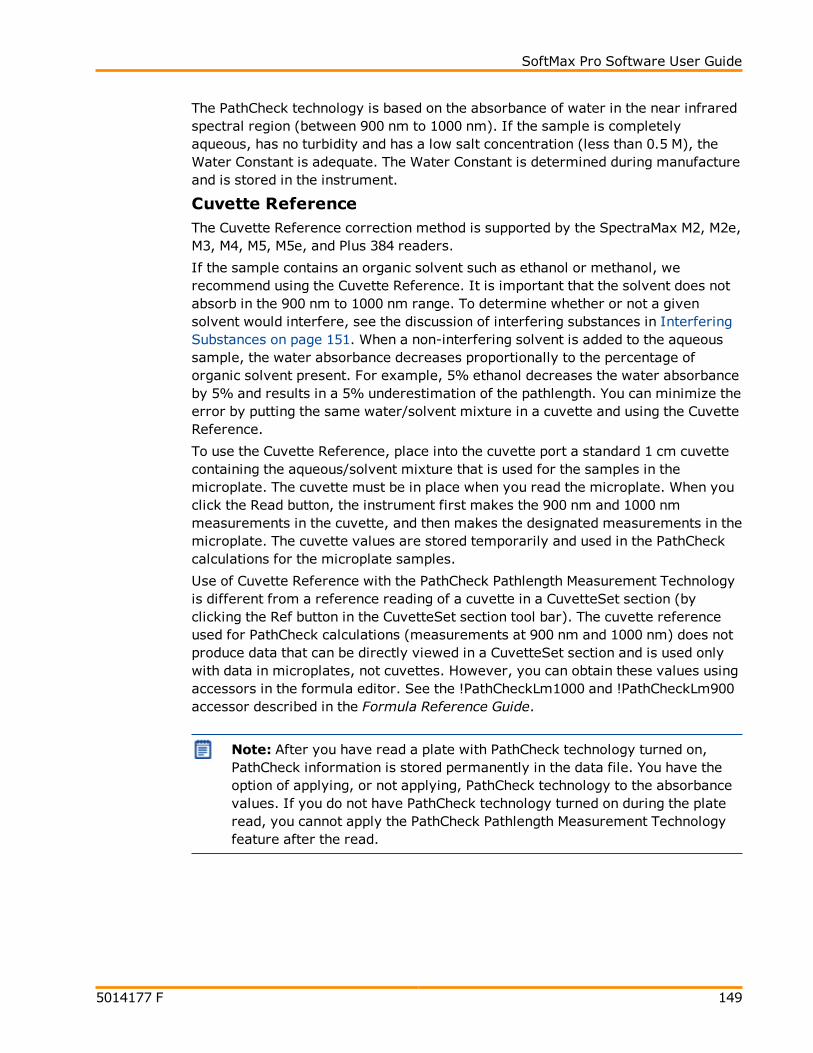
SoftMax Pro Software User Guide
5014177 F 149
The PathCheck technology is based on the absorbance of water in the near infraredspectral region (between 900 nm to 1000 nm). If the sample is completelyaqueous, has no turbidity and has a low salt concentration (less than 0.5 M), theWater Constant is adequate. The Water Constant is determined during manufactureand is stored in the instrument.
Cuvette ReferenceThe Cuvette Reference correction method is supported by the SpectraMax M2, M2e,M3, M4, M5, M5e, and Plus 384 readers.
If the sample contains an organic solvent such as ethanol or methanol, werecommend using the Cuvette Reference. It is important that the solvent does notabsorb in the 900 nm to 1000 nm range. To determine whether or not a givensolvent would interfere, see the discussion of interfering substances in InterferingSubstances on page 151. When a non-interfering solvent is added to the aqueoussample, the water absorbance decreases proportionally to the percentage oforganic solvent present. For example, 5% ethanol decreases the water absorbanceby 5% and results in a 5% underestimation of the pathlength. You can minimize theerror by putting the same water/solvent mixture in a cuvette and using the CuvetteReference.
To use the Cuvette Reference, place into the cuvette port a standard 1 cm cuvettecontaining the aqueous/solvent mixture that is used for the samples in themicroplate. The cuvette must be in place when you read the microplate. When youclick the Read button, the instrument first makes the 900 nm and 1000 nmmeasurements in the cuvette, and then makes the designated measurements in themicroplate. The cuvette values are stored temporarily and used in the PathCheckcalculations for the microplate samples.
Use of Cuvette Reference with the PathCheck Pathlength Measurement Technologyis different from a reference reading of a cuvette in a CuvetteSet section (byclicking the Ref button in the CuvetteSet section tool bar). The cuvette referenceused for PathCheck calculations (measurements at 900 nm and 1000 nm) does notproduce data that can be directly viewed in a CuvetteSet section and is used onlywith data in microplates, not cuvettes. However, you can obtain these values usingaccessors in the formula editor. See the !PathCheckLm1000 and !PathCheckLm900accessor described in the Formula Reference Guide.
Note: After you have read a plate with PathCheck technology turned on,PathCheck information is stored permanently in the data file. You have theoption of applying, or not applying, PathCheck technology to the absorbancevalues. If you do not have PathCheck technology turned on during the plateread, you cannot apply the PathCheck Pathlength Measurement Technologyfeature after the read.
Chapter 5: Instrument and Detection Settings
150 5014177 F
Background Constant Subtraction
Raw OD measurements of microplate samples include both pathlength-dependentcomponents (sample and solvent) and a pathlength-independent component (OD ofmicroplate material). The latter must be eliminated from the PathCheck technologycalculation to get valid results that have been normalized by the PathChecktechnology. There are two ways to accomplish this, described below, beginningwith the easiest.
Use a Plate Blank
This method can be used only if all samples in the microplate are the same volumeand you are not depending on the PathCheck technology to correct for variability involumes.
To use this method:
1. Designate at least one well (preferably several) as Plate Blank (see Blanking onpage 169).
2. Pipette buffer (for example, your sample matrix) into those wells and readalong with your samples. SoftMax Pro Software automatically subtracts theaverage of the blank wells from each of the samples. The OD of the microplatematerial is subtracted as part of the blank.
3. Make sure that Use Plate Blank is checked under Other Options in the DataReduction dialog. See Performing Data Reduction on page 214.
Use Plate Background Constant
If your sample volumes are not identical or if you choose not to use a Plate Blank,then you can use the Plate Background Constants.
To determine Plate Background Constants:
1. Fill a clean microplate with water.
2. Read at the wavelengths that you will be reading your samples.
3. The average OD value is the Plate Background Constant.
4. If you intend to read your samples at more than one wavelength, there shouldbe a corresponding number of Background Constants.
Note: It is important that you put water in the wells and not read a dry platefor the Background Constant. Dry plates have a slightly higher OD value thana water-filled plate because of differences in refractive indices. Using a dryplate results in PathCheck technology normalized values that are lower than1 cm cuvette values. Omitting the Background Constant results in values thathave been normalized by the PathCheck technology and are higher than 1 cmcuvette values.
SoftMax Pro Software User Guide
5014177 F 151
Interfering Substances
Any material that absorbs in the 900 nm to 1000 nm spectral region could interferewith PathCheck technology measurements. Fortunately, there are few materialsthat do interfere at the concentrations generally used.
Turbidity is the most common interference. If you can detect any turbidity in yoursample, you should not use the PathCheck technology. Turbidity elevates the900 nm measurement more than the 1000 nm measurement and causes anerroneously low estimate of pathlength. Using Cuvette Reference does not reliablycorrect for turbidity.
Samples that are highly colored in the upper-visible spectrum might haveabsorbance extending into the near-infrared (NIR) spectrum and can interfere withthe PathCheck technology. Examples include Lowry assays, molybdate-basedassays, and samples containing hemoglobins or porphyrins. In general, if thesample is distinctly red or purple, you should check for interference before usingthe PathCheck technology.
To determine possible color interference, do the following:
Measure the OD at 900 nm and 1000 nm (both measured with air reference).
Subtract the 900 nm value from the 1000 nm value.
Do the same for pure water.
If the delta OD for the sample differs significantly from the delta OD for water,then it is advisable not to use the PathCheck technology. Use of Cuvette Referenceon supported readers does not correct for the interference with the currentcalculation scheme in SoftMax Pro Software. Currently, Cuvette Reference involvesa single (automated) read at 900 nm and 1000 nm and the automated calculationsin SoftMax Pro Software do not compensate for color or solvent interference.However, you could correct for such interference by taking two cuvettemeasurements and using a different set of calculations. For further information,contact Molecular Devices Technical Support.
Organic solvents could interfere with the PathCheck technology if they haveabsorbance in the region of the NIR water peak. Solvents such as ethanol andmethanol do not absorb in the NIR region, so they do not interfere, except forcausing a decrease in the water absorbance to the extent of their presence in thesolution. Their passive interference can be avoided by using the Cuvette Reference.If, however, the solvent absorbs between 900 nm and 1000 nm, the interferencewould be similar to the interference of highly colored samples as previouslydescribed. If you are considering adding an organic solvent other than ethanol ormethanol, you are advised to run a Spectrum scan between 900 nm and 1000 nm todetermine if the solvent would interfere with the PathCheck technology.

Chapter 5: Instrument and Detection Settings
152 5014177 F
TRF Settings
TRF measures fluorescence as a function of time after excitation. You can set atime delay before collecting data and the integration time of the fluorescencesignal. See TRF Read Mode on page 115.
PMT and Optics Settings
The sensitivity settings can be set in PMT and Optics Settings in the Settingsdialog.
PMT sensitivity can be set to Low, Medium, or High. To get optimal PMT responsewithout saturation, set the PMT gain to High for samples having lowerconcentration (dim samples), or use a lower PMT gain for samples having a higherconcentration (bright samples).
To define the exact voltage to use for the PMT Gain, selectManual and then typea value in the field between 200 volts and 1000 volts.
In Endpoint reads, the Automatic setting allows the instrument to adjust the PMTvoltage automatically for varying concentrations of sample in the plate.
Automatic is not available for Fluorescence Polarization reads.
For the SpectraMax M5 and M5e Multi-Mode Microplate Readers, the PMTSensitivity is always set to Automatic for Luminescence (LUM) and Time ResolvedFluorescence (TRF) read modes.
For the SpectraMax Paradigm Multi-Mode Detection Platform, you can select Onthe Fly Detection options.
On the Fly Detection, when enabled, yields considerably faster read times while theplate moves continuously as each well is measured, as opposed to when it isdisabled (Off-stop and go) and the plate stops moving for each read.
To use On the Fly Detection, select an option to specify whether the detectionmethod should be optimized for Performance or Speed.
Selecting Performance results in a faster read time than not using On the FlyDetection, but not as fast as the Speed mode. Performance providesconsiderably better results than Speed for demanding assays.
Selecting Speed results in the fastest possible read time per plate. However,there is a trade-off between the data quality and read speed because each wellis sampled for shorter integration times.
SoftMax Pro Software User Guide
5014177 F 153
For the SpectraMax Paradigm and FilterMax instruments, you can set theIntegration Time. Type a value in the Integration Time field in milliseconds, tospecify the measurement time per well to be validated.
Select the Read From Bottom check box to have an instrument with bottom-readcapability read up through the bottom of the microplate rather than down from thetop.
For the SpectraMax Paradigm Multi-Mode Detection Platform and the FilterMax F5Multi-Mode Microplate Reader, you can specify the Read Height.
Read Height specifies the distance in millimeters between the objective lens andthe microplate. You can type a value for the read height in this field.
To have SoftMax Pro Software find the optimized read height before the read, usethe Read Height Optimization feature in the Pre-Read Optimization dialog byselecting the Show Pre-Read Optimization Options check box in the MoreSettings tab.
Read Height is available for the FilterMax F5 Multi-Mode Microplate Reader fortop-read only.
Timing Settings
For Kinetic reads you can configure the total Kinetic run time and the time intervalbetween readings.
Type a Total Run Time and the Interval between readings in hh:mm:ss format.
To achieve the shortest possible interval, choose wavelengths in ascending order.
The minimum allowable interval values are shown below the Interval field.
The Number of Reads is calculated based on the values in the Total Run Timeand Interval fields.
The minimum allowable read interval is determined by the instrument, anddepends on many factors including the number of wavelengths, the number ofwells being read, and the distance the instrument’s filter wheel must move.Maximum read intervals also vary by instrument, for example the SpectraMax M2Multi-Mode Microplate Reader has a maximum read interval of 2 hours and 45minutes, and the SpectraMax Paradigm Multi-Mode Detection Platform has amaximum read interval of 18 hours and 12 minutes. If you type a non-allowed readinterval, a message appears defining the minimum or maximum allowable valuefor the read interval.

Chapter 5: Instrument and Detection Settings
154 5014177 F
Well Scan Settings
A Well Scan read can take readings at more than one location within a well. A WellScan read takes one or more readings of a single well of a microplate on an evenlyspaced grid inside of each well at single or multiple wavelengths.
Some applications involve the detection of whole cells in large-area tissue cultureplates. Well Scan reads can be used with such microplates to allow maximumsurface area detection in whole-cell protocols. Since many cell lines tend to growas clumps or in the corners of microplate wells, you can choose from severalpatterns and define the number of points to be scanned to work best with yourparticular application.
The options available for Endpoint reads are also available for Well Scan reads.
Well Scan reads allow readings to be taken at more than one location within a well.Well Scan settings allow you to specify how a Well Scan is performed.
You can specify the scanning pattern and the scanning density.
For some instruments, only odd numbers of points are included in density settings.
Values reported are optical density, %Transmittance, relative fluorescence units(RFU), or relative luminescence units (RLU).
Up to four scanning patterns are available, depending on the selected instrument:
A horizontal line
A vertical line
A cross (which is a combination of a horizontal and vertical line)
A fill pattern
The fill pattern can be either round or square to match the shape of the well. Theimage in the Well Scan settings shows the shape of the well as defined for theselected microplate. See Plate Type Settings on page 144.
The density setting determines:
The number of points read in the line patterns.
The maximum number of horizontal and vertical points included in the gridpattern.

SoftMax Pro Software User Guide
5014177 F 155
Shake Settings
Shake is a feature that allows you to set automated shaking of the microplate. Theoptions available for Shake depend on the read type and the instrument.
Before First Read
This setting can be used with any read type. Whether you read at a singlewavelength or at multiple wavelengths, selecting the Before First Read shakes theplate for the set amount of time before the first wavelength reading only.
Between Reads
This option is available only when a Kinetic read type is selected.
For readings at a single wavelength, Between Reads shakes the plate for thespecified amount of time prior to each reading at that wavelength.
For readings at multiple wavelengths, enabling Between Reads shakes the plate forthe specified amount of time before each reading at the first wavelength only.
SpectraMax Paradigm Multi-Mode Detection Platform MicroplateShaking Options
The SpectraMax Paradigm Multi-Mode Detection Platform can perform microplateshaking operations inside the microplate chamber as part of a measurementprotocol.
Microplate shaking options include:
Intensity: Low, Medium, or High. The actual shake speed is based on themicroplate format.
Direction: Linear or Orbital patterns.
Duration: Length of time in seconds (1 to 60) to shake.
Speed Read
Enable Speed Read for an Absorbance read to read the plate faster by substitutingfirmware values for calibration values and by decreasing the number of lampflashes.
Speed Read turns off Calibration and uses the air calibration values stored in theinstrument. As a result, Speed Read might not provide as accurate an absorbancemeasurement at each wavelength of a scan as with the normal read.

Chapter 5: Instrument and Detection Settings
156 5014177 F
More Settings
The More Settings tab in the Settings dialog provides additional settings options.The options in this tab vary depending on the selected instrument, read mode, andread type.
CalibrateFor Absorbance reads, the Calibrate setting tells the instrument to make an aircalibration measurement at each wavelength before reading the microplate, asdetermined by the type of instrument and the read settings. For kinetic readingsthis measurement is sometimes taken between readings during a run.
For Fluorescence instruments, the measurement occurs before reads, andsometimes between kinetic reads if the interval is long enough.
If you turn calibration off, SoftMax Pro Software uses the calibration values storedin the firmware of the instrument.
If Calibrate is set to On in the More Settings tab, the wavelengths specified inthe protocol are calibrated before each read.
These new calibrations overwrite the calibration setting stored in firmware for thecurrent data acquisition read only. When the instrument is powered off and on, thecalibrations revert to those stored in firmware. The calibration values stored in thefirmware can be updated using the Calibration button on the Operations tab inthe application ribbon.
Carriage SpeedCarriage Speed can be slowed down to accommodate samples (such as, fragileclots) that could be disrupted by rapid carriage movement. Select a CarriageSpeed of Normal or Slow.
Read Order Column/WavelengthChoosing column or wavelength priority determines the order in which a plate isread in multi-wavelength readings:
In column priority, the instrument reads all wavelengths for the first column ofwells in the microplate first, and then reads all wavelengths for the secondcolumn, third column, etc.
In wavelength priority, an instrument reads the entire microplate (or chosennumber of strips) at the first wavelength, and then goes back and reads themicroplate at the second and any additionally selected wavelengths.
Settling TimeTo specify a settling time, select the Settling Time check box, and then type atime between 100 and 1000 milliseconds. The specified delay is added between thereading of each column. There is no delay between each well in a column.
SoftMax Pro Software User Guide
5014177 F 157
More Settings for the SpectraMax Paradigm and FilterMaxInstruments
Microplate Read Order
Row reads plates row-by-row.
Column reads plates column-by-column.
Well reads each well individually before reading the next well, which is usefulfor short-interval kinetic, area scan, and wavelength scan measurements.
Show Pre-Read Optimization OptionsSelecting Show Pre-Read Optimization Options causes the Pre-ReadOptimization Options dialog to open before the microplate is read. The availableoptimization options are dependant on the read mode.
Microplate Optimization
Microplate dimensions can vary slightly between production lots, which potentiallyaffects measurement accuracy. SoftMax Pro Software allows labware dimensionsto be optimized by determining the centers of the four corner wells on the plate.Each time a labware type is optimized before a read, a new plate definition isadded to the Plate Library with dimensions from the labware optimization.
If a microplate type is to be used in different plate orientations for measurements,labware optimization must be done for each plate orientation separately.
Read Height Optimization
The SpectraMax Paradigm Multi-Mode Microplate reader features an objective lensthat can be moved up and down to optimize the read height used in luminescence,fluorescence intensity top, fluorescence polarization, and time-resolvedfluorescence protocols. Read height is the distance between the top (using topreading) or bottom (using bottom reading) surface of the microplate being readand the surface of the objective lens. Optimizing read height matches the focus ofthe optics with the sample volume. This maximizes the raw signal, which yields thehighest precision and maximum sensitivity.
Read Height Optimization is available for the FilterMax F5 Multi-ModeMicroplate Reader for top-read only.
Read Height Optimization is not available for the FilterMax F3 Multi-ModeMicroplate Reader.
AttenuationVery bright samples can exceed the linear dynamic range of the detection system.If such is the case, the read can be performed using an attenuation filter.

Chapter 5: Instrument and Detection Settings
158 5014177 F
Normalization of AlphaScreen DataThe conversion rate of photons to counts is individual for each detector. Therefore,raw data from the same plate can appear to be different from one instrument tothe next. In addition, the data format used by instrument manufacturers can becounts normalized-per-second or not-normalized counts, therefore raw data can bedifferent by several orders of magnitude. It is important to know that the numberof counts and the size of figures is in no way an indication of sensitivity.
The raw data can be normalized to counts per second by selecting theNormalization option.
Background Correction with Interlaced ReadingsAlthough background is significantly lower with AlphaScreen than with fluorescenceintensity measurements, Molecular Devices recommends that you use blank orassay controls for background correction. The background can be effectivelymeasured using blank replicates. When reading a sample with small signal, aninterference can occur from the afterglow of a very strong emitting adjacentsample that was measured just before. Such cross talk can occur through the wallof a white 384-well microplate. To prevent such interference, you can select theInterlaced Reading option, which reads only every other well in a checkerboardpattern, and adds another plate run to read the previously omitted wells.
For improved results, Molecular Devices recommends that you use replicates forall blanks, controls, and samples.

5014177 F 159
Chapter 6: Collecting Data
A general process for preparing, collecting, and analyzing data is as follows:
1. Start the SoftMax Pro Software. See Starting the Software on page 10.
2. Select an instrument. See Selecting and Connecting to an Instrument on page11.
3. Choose a data acquisition protocol. You can use an existing protocol or create anew one.
To use an existing protocol, see Opening a Protocol File on page 54.
To set up a new protocol, see Creating a Protocol on page 159.
4. Prepare the microplate or the cuvette and insert it into the instrument.
5. Click the Read button to read the microplate or the cuvette.
6. Analyze the data. See Analyzing Data on page 207.
7. Save the acquired data, see Saving Data Files on page 47.
Creating a ProtocolProtocols contain instrument settings, template maps, Data Reduction, and Displayoptions. Templates are maps to the contents of a microplates or the cuvettes in acuvette set, and how the data will be collected and displayed.
You can manage protocols using the Protocol Manager on the Protocols tab inthe ribbon. See Using the Protocols Tab to Manage Protocols on page 32.
You can create as many different protocols as you need. You can create a newprotocol from a blank file or by modifying an existing protocol and saving it under anew name.
To create a protocol, follow these steps:
1. Start the SoftMax Pro Software. See Starting the Software on page 10.
2. Select the instrument to be used with the protocol. See Selecting andConnecting to an Instrument on page 11.
3. Define the instrument settings to use with the protocol. See SelectingInstrument Settings on page 160.
4. Create a template, if applicable. See Configuring a Microplate Template onpage 162.
5. Set Data Reduction parameters, if applicable. See Performing Data Reductionon page 214.

Chapter 6: Collecting Data
160 5014177 F
6. Save the settings to a protocol file. See Saving the Settings to a Protocol File onpage 193.
7. Set Display options, if applicable. See Setting the Data Display Options on page210.
Selecting Instrument Settings
Use the options in the Settings dialog to define the parameters for acquiring datafrom a plate or cuvette using the selected instrument.
To select and connect to an instrument see, Selecting and Connecting to anInstrument on page 11.
To select instrument settings:
1. Click a Plate section or Cuvette Set section to make it active in theworkspace.
2. Click Settings on the Home tab in the ribbon or in the toolbar at the topof the active section.
3. When working with a SpectraMax Paradigm Multi-Mode Detection Platform,select a detection cartridge. See Selecting the SpectraMax Paradigm DetectionCartridge on page 161.
4. Select a Read Mode. See Selecting the Read Mode on page 161.
5. Select a Read Type. See Selecting the Read Type on page 162.
6. After defining the settings for the protocol, click OK to close the Settingsdialog.
To continue creating the protocol see the following:
Create a template, if applicable. See Configuring a Microplate Template onpage 162.
Set Data Reduction parameters, if applicable. See Performing Data Reductionon page 214.
Save the settings to a protocol file. See Saving the Settings to a Protocol File onpage 193.

SoftMax Pro Software User Guide
5014177 F 161
Selecting the SpectraMax Paradigm Detection Cartridge
1. Select the SpectraMax Paradigm Multi-Mode Detection Platform using theInstrument Connection dialog. See Selecting and Connecting to anInstrument on page 11.
2. Click a Plate section to make it active in the workspace.
3. Click Settings on the Home tab in the ribbon or in the toolbar at the topof the active section.
4. Select a Cartridge from those shown at the top of the Settings dialog.
Note:When you select to work Offline in the Instrument Connection dialog,you can see all the cartridges that the SpectraMax Paradigm Multi-ModeDetection Platform can support.
When you are actually connected to the SpectraMax Paradigm Multi-ModeDetection Platform, you see only the cartridges that are installed in theinstrument.
For information on the available detection cartridges, see SpectraMax ParadigmDetection Cartridges on page 131.
Selecting the Read Mode
1. Click a Plate section or Cuvette Set section to make it active in theworkspace.
2. Click Settings on the Home tab in the ribbon or in the toolbar at the topof the active section.
3. When working with a SpectraMax Paradigm Multi-Mode Detection Platform,select a detection cartridge. See Selecting the SpectraMax Paradigm DetectionCartridge on page 161.
4. Click a Read Mode button.
For information on the available read modes, see Supported Read Modes on page112.
Chapter 6: Collecting Data
162 5014177 F
Selecting the Read Type
1. Click a Plate section or Cuvette Set section to make it active in theworkspace.
2. Click Settings on the Home tab in the ribbon or in the toolbar at the topof the active section.
3. When working with a SpectraMax Paradigm Multi-Mode Detection Platform,select a detection cartridge. See Selecting the SpectraMax Paradigm DetectionCartridge on page 161.
4. Select a Read Mode. See Selecting the Read Mode on page 161.
5. Click a Read Type button.
For information on the available read types, see Supported Read Types on page111.
Configuring a Microplate TemplateThe Template Editor is a representation of the microplate or set of cuvettesshown as a grid of wells that can be used to designate the location of blanks,standards, controls, unknowns, empty wells, or to assign wells to other groups youcreate.
When you select multiple wells in the Template Editor, the selection must be arectangular group of contiguous wells.
1. Click a Plate section or Cuvette Set section to make it active in theworkspace.
2. Click Template in the Template Tools section of the Home tab in theribbon or in the toolbar at the top of the section. This opens the TemplateEditor.

SoftMax Pro Software User Guide
5014177 F 163
The Template Editor contains a representation of the rows and columns of themicroplate in the active Plate section.
When you open the template editor with a Cuvette Set section active in theworkspace, the template editor window contains 96 wells in the column and rowformat of a 96-well microplate. The cuvettes in the template are numbered as ifthey were wells in a microplate. This representation provides easy access tothe data analysis capabilities of the SoftMax Pro Software.
3. Define a group of wells, see Defining a Group on page 164.
To assign wells to an existing group, select the wells to add to the group,click the group name, and then click Assign.
To specify wells as Plate Blank, select the wells and then click Plate Blank.
To specify wells as Group Blank, select the wells, click Group Blank, andthen click Assign.
Note: For more information about using blanks, see Blanking on page169.
To remove wells from a group, select the wells to be removed and thenclick Clear.
To print the Template Editor dialog, click the Print button.
4. To assign wells to a series, select the wells and then click the Series button.See Creating a Series on page 165.
5. Click OK to close the Template Editor and apply the template.
To save the template in a protocol file for use on future experiments, see SavingProtocol Files on page 55.
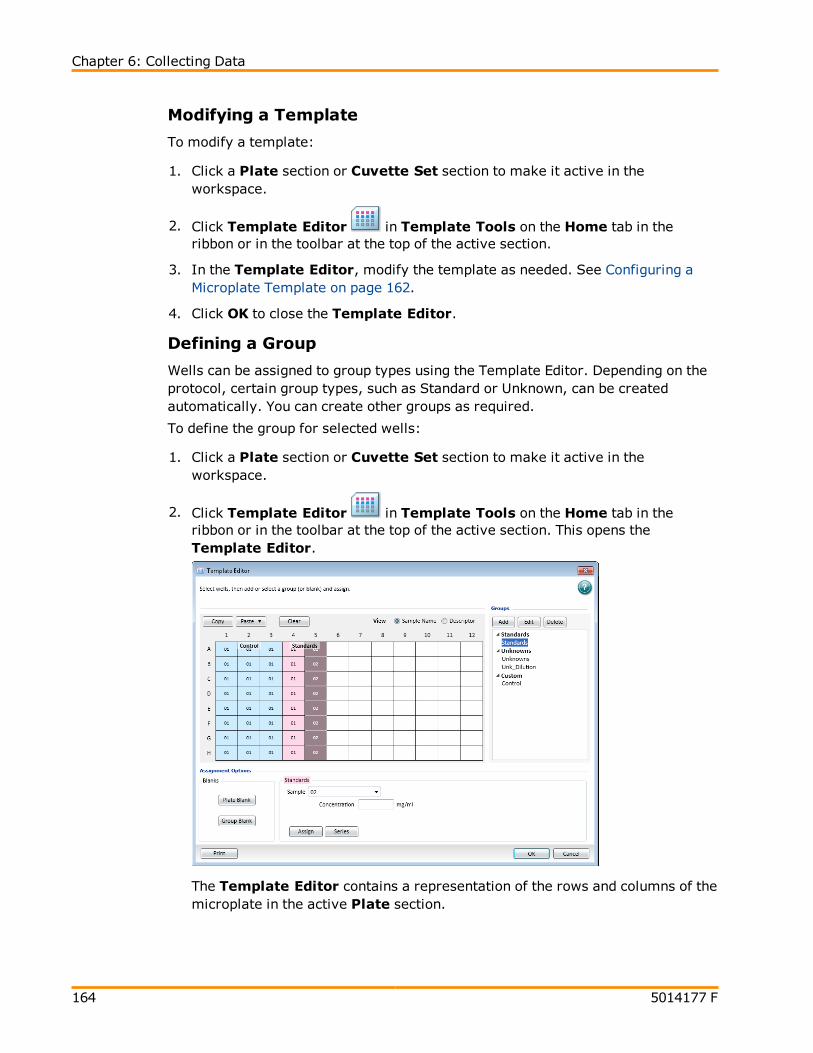
Chapter 6: Collecting Data
164 5014177 F
Modifying a Template
To modify a template:
1. Click a Plate section or Cuvette Set section to make it active in theworkspace.
2. Click Template Editor in Template Tools on the Home tab in theribbon or in the toolbar at the top of the active section.
3. In the Template Editor, modify the template as needed. See Configuring aMicroplate Template on page 162.
4. Click OK to close the Template Editor.
Defining a Group
Wells can be assigned to group types using the Template Editor. Depending on theprotocol, certain group types, such as Standard or Unknown, can be createdautomatically. You can create other groups as required.
To define the group for selected wells:
1. Click a Plate section or Cuvette Set section to make it active in theworkspace.
2. Click Template Editor in Template Tools on the Home tab in theribbon or in the toolbar at the top of the active section. This opens theTemplate Editor.
The Template Editor contains a representation of the rows and columns of themicroplate in the active Plate section.

SoftMax Pro Software User Guide
5014177 F 165
When you open the template editor with a Cuvette Set section active in theworkspace, the template editor window contains 96 wells in the column and rowformat of a 96-well microplate. The cuvettes in the template are numbered as ifthey were wells in a microplate. This representation provides easy access tothe data analysis capabilities of the SoftMax Pro Software.
3. Click and drag the mouse to select one or more wells to be defined as a group.
4. In the Groups area, select an existing group name.
To create a new group, click Add to open the Group Settings dialog. SeeUsing the Group Settings Dialog on page 100.
5. If a sample descriptor has been defined for the selected group, type anappropriate value in the field for the descriptor.
6. Click Assign to assign the group to the selected wells.
To define a series for the selected wells, click Series. See Creating a Series onpage 165.
7. Click OK to close the Template Editor and apply the template.
Creating a Series
You can define several samples as a series, allowing you to easily enterincremental sample descriptors (for example, dilutions or concentrations) andsample names to the template as long as the increment can be expressed as amathematical operation. This allows you to work with groups of wells in theTemplate so that the standard value or dilution factor increases or decreases inspecified steps. The series name can be incremented as well.
You can assign the same group or sample definition (same sample name anddescription within a group) to multiple wells to create replicates. For example, youmight want to read standards in replicate to ensure that anomalies can be excludedprior to generating a standard curve. To create replicates, click the Assign buttonor use the Series dialog.
A series is defined in one direction (starting from left, right, top, or bottom) andtherefore samples must be arranged sequentially in either ascending or descendingorder.
To create a series:
1. Click a Plate section or Cuvette Set section to make it active in theworkspace.
2. Click Template Editor in Template Tools on the Home tab in theribbon or in the toolbar at the top of the active section.
3. In the Template Editor dialog, click and drag the mouse to select one or morewells to be part of the series.

Chapter 6: Collecting Data
166 5014177 F
4. In the Groups area, select an existing group name.
Note: A series is associated with a group. If no groups have beendefined, you will need to define a group and then define the series. Tocreate a new group, click Add to open the Group Settings dialog. SeeUsing the Group Settings Dialog on page 100.
5. Click the Series button.
6. Select options in Series Layout.
Choose a fill direction to describe how the series fills the wells from theStart From options. Select one of Top to Bottom, Bottom to Top, Leftto Right, or Right to Left.
In Patterns of Replicates, type the number of replicates in the Y-Direction and type the number of replicates in the X-Direction.
The maximum number of replicates depends on the selection of wells. Forexample, if you are filling down from the top and you have chosen a blockof wells that is 4 wells wide by 8 wells high, the maximum number ofreplicates will be four. With the same block of wells selected, filling fromthe left would allow eight replicates. If the number of replicates you choosedoes not divide evenly into the number of rows or columns you select,depending on the filling direction, the remaining wells that cannot containreplicates will be labeled as additional individual wells in the series. Tocreate a series that includes all the wells in the microplate, select all thewells, select the fill direction, and then set the replicates to 1.
Optionally, click Reverse Series Order to reverse the order of the series.
7. In Sample Information type the name of the first sample in the series in theStarting Sample Name field. Subsequent replicates use this name as a baseand either increment the number within the name or append a number to it.
8. If a sample descriptor has been defined for the selected group, type an aopriatevalue in the Starting Value field for the descriptor.
9. From the Step by list, select the operator for the series (+, -, *, or /) and thenenter a value for the increment. For example, with a starting value of 0.5, thedivision operator (/) and the increment 2, the series will start with 0.5 anddivide each subsequent sample by 2 to produce the series 0.5, 0.25, 0.125, andso on.
10. Click OK to save the series and close the dialog.
SoftMax Pro Software User Guide
5014177 F 167
Incrementing the Names OnlyTo increment the names of a series of samples without applying a concentration ordilution:
1. Create a series in the Series dialog.
2. If a sample descriptor has been defined for the selected group, clear the checkbox next to the descriptor.
Incrementing with a ConstantTo increment the names of a series of samples with a constant concentration ordilution:
1. Create a series in the Series dialog.
2. In the Starting Value field for the sample descriptor, type a value for theconcentration or dilution.
3. From the Step by list, select the multiplication operator (*) and then enter avalue of 1 for the increment.
If sample names are set to increment automatically using the Series function,be aware that SoftMax Pro Software automatically truncates the sample nameto three or four characters, including the incrementing number if the samplename starts with letters. If the sample name is entirely numeric, it is nottruncated. If sample names are very long, and they must be kept long forreference, you need to set up your replicates manually.
Copying and Pasting Template Contents
The content of a template can be copied and pasted to another section within thesame experiment or between different experiments. Only contiguous subsets canbe copied in the template.
Within the Same Experiment SectionThe destination template is an extension of the original template and all wells onthe destination plate are considered replicates of the wells on the source plate,with the same group and sample names.
Changes made to the template on the destination plate are also made on thesource plate.
Data from the two Plate sections are analyzed together.
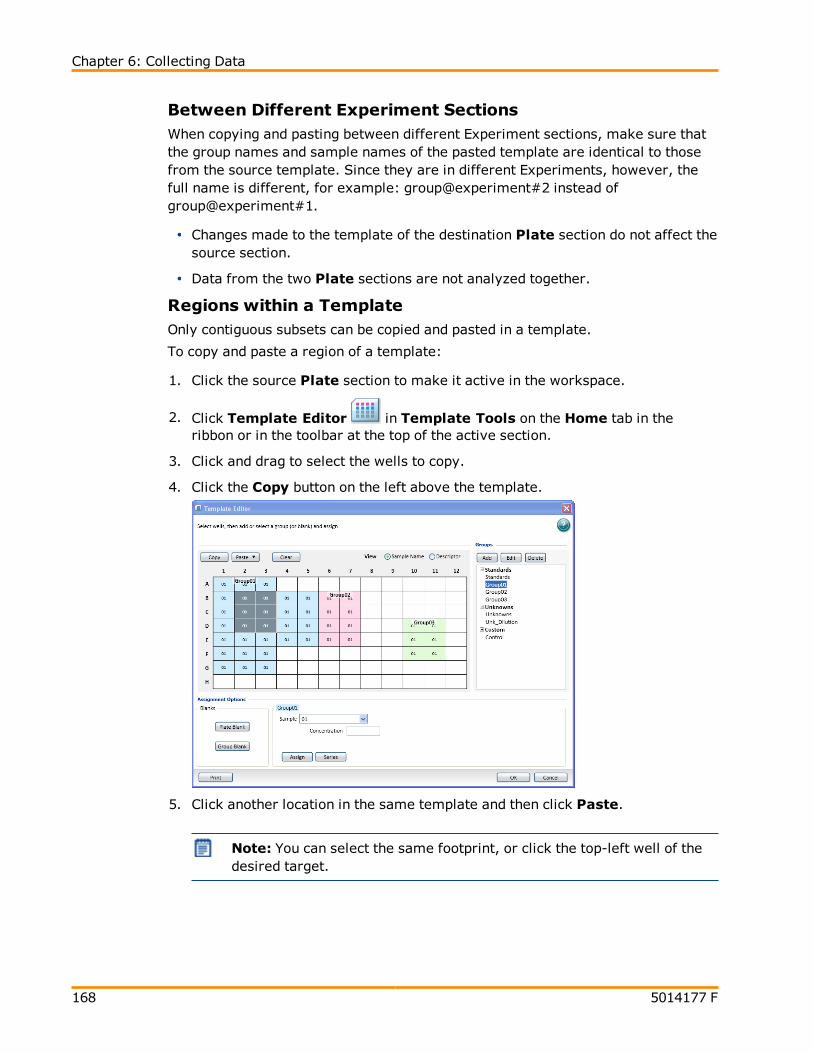
Chapter 6: Collecting Data
168 5014177 F
Between Different Experiment SectionsWhen copying and pasting between different Experiment sections, make sure thatthe group names and sample names of the pasted template are identical to thosefrom the source template. Since they are in different Experiments, however, thefull name is different, for example: group@experiment#2 instead ofgroup@experiment#1.
Changes made to the template of the destination Plate section do not affect thesource section.
Data from the two Plate sections are not analyzed together.
Regions within a TemplateOnly contiguous subsets can be copied and pasted in a template.
To copy and paste a region of a template:
1. Click the source Plate section to make it active in the workspace.
2. Click Template Editor in Template Tools on the Home tab in theribbon or in the toolbar at the top of the active section.
3. Click and drag to select the wells to copy.
4. Click the Copy button on the left above the template.
5. Click another location in the same template and then click Paste.
Note: You can select the same footprint, or click the top-left well of thedesired target.

SoftMax Pro Software User Guide
5014177 F 169
6. A menu appears asking whether to Paste or Paste-with-New-Groups.
Paste adds the copied wells to the current group.
Paste with a new Group pastes a the copied cells into a new group.
If more wells are selected for pasting than were selected for copying, the extrawells are left empty.
The real value in this method is the ability to copy a complicated template and thento be able to analyze the data separately from the original plate.
Blanking
In the Template Editor you can configure Plate Blanks and Group Blanks.
The different blank types have the following features:
Plate Blanks are used to correct readings when all samples on a plate havebeen prepared in the same buffer or matrix, and therefore can use the samecorrection value. Plate blanks are subtracted from the raw data, or afterpathlength correction if PathCheck is selected.
Group Blanks are used to correct readings when samples on a plate havebeen prepared in a different buffer or matrix, and therefore have to beindividually corrected. Group blanks can be subtracted from raw data, like plateblank, or after post-reduction calculations, for example, wavelength, kineticreduction, and so on.
Blanks can be used in combination and have cumulative effects.
Plate BlanksPlate Blanks can be assigned in Plate sections and in Cuvette Set sections.
Plate Sections
Wells can be assigned to a Plate Blank:
1. Click a Plate section to make it active in the workspace.
2. Click Template Editor on the Home tab in the ribbon or in the toolbarabove the active section.
3. In the Template Editor, select the wells to be used for the Plate Blank.
4. Click Plate Blank.
Use Plate Blanks when all samples on the plate have been prepared in the sameway, and therefore can be corrected from a single blank reading. Plate Blanksubtraction can be turned off in the Data Reduction dialog so that the data can bereviewed with or without Plate Blank subtraction. See Performing Data Reductionon page 214.
For Kinetic and Spectrum data, the blank value is averaged and subtracted fromeach point in the read.
Chapter 6: Collecting Data
170 5014177 F
Cuvette Set Sections
To perform a similar function to Plate Blanking for Cuvette Set sections, you canassign cuvettes to a Blank group in the Template Editor of the Cuvette Set sectionand create a Template Blank:
1. Click a Cuvette Set section to make it active in the workspace.
2. Click Template Editor on the Home tab in the ribbon or in the toolbarabove the active section.
3. In the Template Editor, select the cuvettes to be used for the Template Blank.
4. Click Blank.
The average value of all the cuvettes in a Template Blank group is subtracted fromindividual cuvette readings in the same Cuvette Set section.
For Kinetic and Spectrum data, the blank value is averaged and subtracted fromeach point in the read.
Template blanks are subtracted after the cuvette reference reading is subtracted.
Group Blanks (Plates and Cuvettes)Blank wells can be assigned within any group (other than the “Blank” group) in theTemplate Editor:
1. Click a Plate section or Cuvette Set section to make it active in theworkspace.
2. Click Template Editor on the Home tab in the ribbon or in the toolbarabove the active section.
3. In the Template Editor, select the wells or cuvettes to be used for the groupblank. These should be wells or cuvettes that are already assigned to a Group,but not the “Blank” group.
4. Select a group from the Group Types list.
5. Click Group Blank and then click Assign.
In a plate blank group the average value of all the wells in the Blank group issubtracted from each individual well value on the microplate. If you have aninstrument that supports PathCheck Pathlength Measurement Technology, the PlateBlank is subtracted after pathlength correction. The average reduced value of theblank wells or cuvettes within that group is subtracted from individual reducedvalues within that group only.
Use Group Blanks when samples on the plate have been prepared differently, andtherefore require individual blank correction.
The Group Blank function offers the options of subtraction before or after datareduction. When a group blank has been assigned, it is automatically subtractedand you do not have the option of reviewing the uncorrected data. To see thereduced number without the group blank subtracted, you must mask the groupblank wells or cuvettes. See Masking Wells or Cuvettes on page 214.
SoftMax Pro Software User Guide
5014177 F 171
Group blanks apply to all wells or cuvettes in a group and can be subtracted fromwells or cuvettes in more than one Plate section or Cuvette Set section.
Exporting a Template
To export template information from a Plate section:
1. Click the Plate section with the template to be exported to make it active in theworkspace.
2. Click Export in Template Tools on the Home tab in the ribbon.
3. In the Save As dialog, navigate to the location in the file system where youwant to save the template file.
4. Type a name for the file in the File name field
5. From the Save as type list, select Text files (*.txt) or Excel files (*xls).
Text files are save in tab-delimited format.
6. Click Save.
For information about the format of an imported or exported template file, seeTemplate File Formats on page 172.
Importing a Template
Template information can be imported into a Plate section from a tab-delimitedtext file. Template files can be prepared outside SoftMax Pro Software and thenimported as needed when ready to run samples.
For information about the format of an imported or exported template file, seeTemplate File Formats on page 172.
Note: A good way to determine the correct format for importing a templateis to export a template from SoftMax Pro Software and examine the contentsof the resulting file.
1. Click the Plate section where you want to import template information to makeit active in the workspace.
2. Click Import in Template Tools on the Home tab in the ribbon.
3. In the Open dialog, navigate to and select the file to be imported.
4. Click Open.
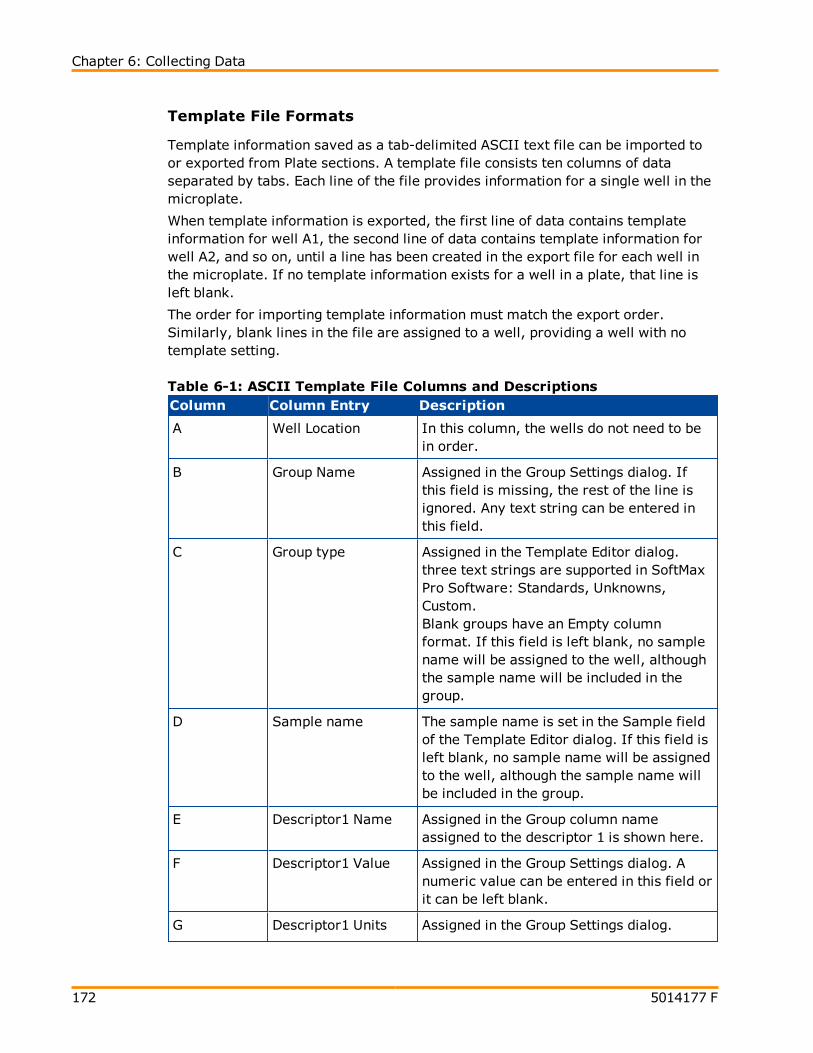
Chapter 6: Collecting Data
172 5014177 F
Template File Formats
Template information saved as a tab-delimited ASCII text file can be imported toor exported from Plate sections. A template file consists ten columns of dataseparated by tabs. Each line of the file provides information for a single well in themicroplate.
When template information is exported, the first line of data contains templateinformation for well A1, the second line of data contains template information forwell A2, and so on, until a line has been created in the export file for each well inthe microplate. If no template information exists for a well in a plate, that line isleft blank.
The order for importing template information must match the export order.Similarly, blank lines in the file are assigned to a well, providing a well with notemplate setting.
Column Column Entry Description
A Well Location In this column, the wells do not need to bein order.
B Group Name Assigned in the Group Settings dialog. Ifthis field is missing, the rest of the line isignored. Any text string can be entered inthis field.
C Group type Assigned in the Template Editor dialog.three text strings are supported in SoftMaxPro Software: Standards, Unknowns,Custom.Blank groups have an Empty columnformat. If this field is left blank, no samplename will be assigned to the well, althoughthe sample name will be included in thegroup.
D Sample name The sample name is set in the Sample fieldof the Template Editor dialog. If this field isleft blank, no sample name will be assignedto the well, although the sample name willbe included in the group.
E Descriptor1 Name Assigned in the Group column nameassigned to the descriptor 1 is shown here.
F Descriptor1 Value Assigned in the Group Settings dialog. Anumeric value can be entered in this field orit can be left blank.
G Descriptor1 Units Assigned in the Group Settings dialog.
Table 6-1: ASCII Template File Columns and Descriptions

SoftMax Pro Software User Guide
5014177 F 173
Column Column Entry Description
Supported strings are unit/ml, mg/ml,µg/ml, ng/ml, mg, ng, and ml. If thiscolumn is left blank, unit/ml is assigned.
H Descriptor2 Name Assigned in the Group column nameassigned to the descriptor 2 is shown here.
I Descriptor2 Value Assigned in the Group Settings dialog. Anumeric value can be entered in this field orit can be left blank.
J Descriptor2 Units Assigned in the Group Settings dialog.Supported strings are unit/ml, mg/ml,µg/ml, ng/ml, mg, ng, and ml. If thiscolumn is left blank, unit/ml is assigned.
Table 6-1: ASCII Template File Columns and Descriptions (continued)
A tab-delimited ASCII file can be opened with a spreadsheet program, such asMicrosoft Excel. If the file is edited in Microsoft Excel, it cannot be imported backinto SoftMax Pro Software.

Chapter 6: Collecting Data
174 5014177 F
Creating an Absorbance Mode ProtocolTo create an Absorbance Mode protocol:
1. Start the SoftMax Pro Software. See Starting the Software on page 10.
2. Select an instrument. See Selecting and Connecting to an Instrument on page11.
Note: It is not necessary to be physically connected to an instrument tocreate a protocol. If you are not connected to an instrument you canselect the target instrument and work offline.
3. With the plate or cuvette section active, click Settings on the Home tabin the ribbon.
4. When working with a SpectraMax Paradigm Multi-Mode Detection Platform,click the Absorbance Detection Cartridge from the Cartridges list.
5. Click ABS to select the Absorbance read mode.
6. Click a Read Type.
7. Define the settings.
For more information about the settings, see the SoftMax Pro ApplicationHelp.
8. After defining the settings for the protocol, click OK to close the Settingsdialog.
9. Create a template, if applicable. See Configuring a Microplate Template onpage 162.
10. Set Data Reduction parameters, if applicable. See Performing Data Reductionon page 214.
11. Set Display options, if applicable. See Setting the Data Display Options on page210.
12. Save the settings to a protocol file. See Saving the Settings to a Protocol File onpage 193.
SoftMax Pro Software User Guide
5014177 F 175
Absorbance Mode Protocol Overview
Absorbance is the amount of light absorbed by a solution. To measure absorbanceaccurately, it is necessary to eliminate light scatter. In the absence of turbidity,absorbance = optical density.
A = log10(I0 /I) = –log
10(I/I
0)
where I0is incident light before it enters the sample, I is the intensity of light after
it passes through the sample, and A is the measured absorbance.
Applications of Absorbance
Absorbance measurements are used to quantify the concentration of an absorbingspecies. It must be known at what wavelength a species absorbs light. Forexample, the concentration of nucleic acids can be quantified by measuring theabsorbance at 260 nm.
Optimizing Absorbance Assays
The wavelength of the incident light can be adjusted in 1 nm increments. SoftMaxPro Software also allows reading up to six wavelengths per plate or cuvette forEndpoint and Kinetic read types, and four wavelengths forWell Scan reads.
It is always good scientific practice to designate wells in the microplate to serve asplate blanks or group blanks. This can be done in the Template Editor dialog ofthe Plate section in the SoftMax Pro Software. See Configuring a MicroplateTemplate on page 162.
If desired, the PathCheck Pathlength Measurement Technology feature can be usedto normalize the data to a 1 cm pathlength. See PathCheck PathlengthMeasurement Technology on page 148.
Note: Assay optimization requires the use of a computer and SoftMax ProSoftware.

Chapter 6: Collecting Data
176 5014177 F
Creating a Fluorescence Intensity Mode ProtocolTo create a Fluorescence Intensity protocol:
1. Start the SoftMax Pro Software. See Starting the Software on page 10.
2. Select an instrument. See Selecting and Connecting to an Instrument on page11.
Note: It is not necessary to be physically connected to an instrument tocreate a protocol. If you are not connected to an instrument you canselect the target instrument and work offline.
3. With the plate or cuvette section active, click Settings on the Home tabin the ribbon.
4. When working with a SpectraMax Paradigm Multi-Mode Detection Platform,click one of the Fluorescence Intensity cartridges from the Cartridges list.
5. Click FL to select the Fluorescence Intensity read mode.
6. Click a Read Type.
7. Define the settings.
For more information about the settings, see the SoftMax Pro ApplicationHelp.
8. After defining the settings for the protocol, click OK to close the Settingsdialog.
9. Create a template, if applicable. See Configuring a Microplate Template onpage 162.
10. Set Data Reduction parameters, if applicable. See Performing Data Reductionon page 214.
11. Set Display options, if applicable. See Setting the Data Display Options on page210.
12. Save the settings to a protocol file. See Saving the Settings to a Protocol File onpage 193.

SoftMax Pro Software User Guide
5014177 F 177
Fluorescence Intensity Mode Overview
Fluorescence is light emitted by a substance resulting from the absorption ofincident radiation. The governing equation for fluorescence is:
Fluorescence = (extinction coefficient) × (concentration) × (quantum yield) ×(excitation intensity) × (pathlength) × (emission collection efficiency)
Fluorescent materials absorb light energy of a characteristic wavelength(excitation), undergo an electronic state change, and instantaneously emit light ofa longer wavelength (emission). Most common fluorescent materials have well-characterized excitation and emission spectra. The following figure shows anexample of excitation and emission spectra for a fluorophore. The excitation andemission bands are each fairly broad, with half-bandwidths of approximately40 nm, and the difference between the wavelengths of the excitation and emissionmaxima (the Stokes shift) is generally fairly small, about 30 nm. There isconsiderable overlap between the excitation and emission spectra (gray area)when a small Stokes shift is present.
500 550 600 650
0
0.5
1.0
Excitation maximum
Emission maximum
Rela
tive F
luore
scence
Wavelength (nm)
Absorption
Stokes Shift
Figure 6-1: Excitation and Emission Spectra
Because the intensity of the excitation light is usually many tens of thousands oftimes greater than that of the emitted light, some type of spectral separation isnecessary to reduce the interference of the excitation light with detection of theemitted light. The SpectraMax reader incorporates many features designed torestrict interference from reflected excitation light. Among these features is a setof long-pass emission cutoff filters that can be set automatically by the instrumentor manually by the user. If the Stokes shift is small, it is advisable to choose anexcitation wavelength that is as far away from the emission maximum as possiblewhile still being capable of stimulating the fluorophore so that less of the excitedlight overlaps the emission spectrum, allowing better selection and quantitation ofthe emitted light.
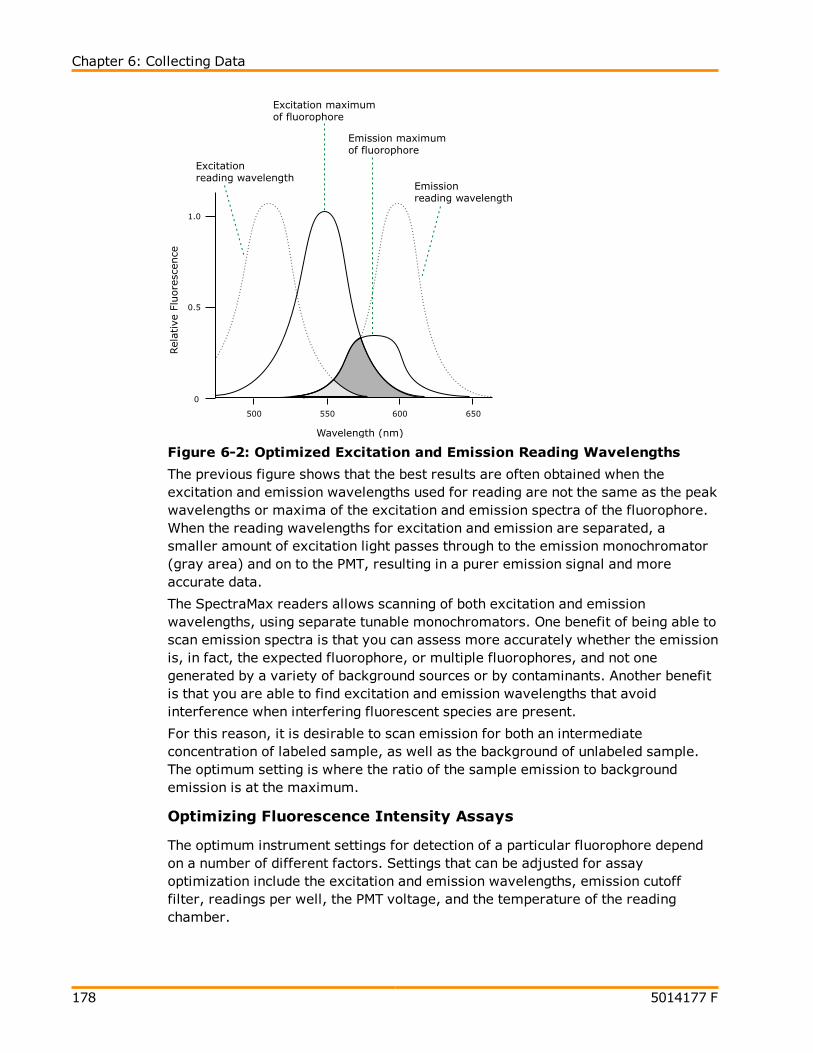
Chapter 6: Collecting Data
178 5014177 F
500 550 600 650
0
0.5
1.0
Excitation maximum of fluorophore
Emission maximum of fluorophore
Rela
tive F
luore
scence
Wavelength (nm)
Excitation reading wavelength
Emission reading wavelength
Figure 6-2: Optimized Excitation and Emission Reading Wavelengths
The previous figure shows that the best results are often obtained when theexcitation and emission wavelengths used for reading are not the same as the peakwavelengths or maxima of the excitation and emission spectra of the fluorophore.When the reading wavelengths for excitation and emission are separated, asmaller amount of excitation light passes through to the emission monochromator(gray area) and on to the PMT, resulting in a purer emission signal and moreaccurate data.
The SpectraMax readers allows scanning of both excitation and emissionwavelengths, using separate tunable monochromators. One benefit of being able toscan emission spectra is that you can assess more accurately whether the emissionis, in fact, the expected fluorophore, or multiple fluorophores, and not onegenerated by a variety of background sources or by contaminants. Another benefitis that you are able to find excitation and emission wavelengths that avoidinterference when interfering fluorescent species are present.
For this reason, it is desirable to scan emission for both an intermediateconcentration of labeled sample, as well as the background of unlabeled sample.The optimum setting is where the ratio of the sample emission to backgroundemission is at the maximum.
Optimizing Fluorescence Intensity Assays
The optimum instrument settings for detection of a particular fluorophore dependon a number of different factors. Settings that can be adjusted for assayoptimization include the excitation and emission wavelengths, emission cutofffilter, readings per well, the PMT voltage, and the temperature of the readingchamber.

SoftMax Pro Software User Guide
5014177 F 179
Another important factor that is independent of the instrument but which affectsassay optimization is the Stokes shift, which is the difference between thewavelengths of the excitation and emission maxima. When the Stokes shift is verysmall, optimizing the excitation and emission wavelengths and correct cutoff filterchoices are very important.
Excitation and Emission Wavelengths
The excitation and emission wavelengths can be set in 1-nm incrementsbetween 250 nm and 850 nm. The available wavelengths are dependent on theinstrument. For more information about the available wavelengths, see thedocumentation for the instrument you are using.
A procedure to optimize excitation and emission wavelengths for a given assayis outlined in Spectral Scanning on page 180.
Emission Cutoff Filter
The emission cutoff filters assist in reducing background. Sources ofbackground include stray excitation light and native fluorescence of platematerials, sample constituents, and solvents (including water). The defaultsetting allows the instrument and SoftMax Pro Software to determine whichcutoff filter should be used in endpoint and kinetic modes. The spectral scanmode default uses no cutoff filter.
Readings Per Well
The number of readings per well can vary between 1 (used for a quickestimate) and 100 (for very precise measurements). The default number ofreadings per well varies with the read mode: for fluorescence, the default is 6,and for luminescence the display shows 1 read per well.
PMT Voltage
The voltage of the photomultiplier tube can be set to low (for higherconcentration samples), medium, or high (for lower concentration samples) inall read modes. In endpoint and spectrum mode, there is an additional setting,automatic, in which the instrument automatically adjusts the PMT voltage forvarying concentrations of sample in the plate.
Temperature Control
The chamber of the SpectraMax reader is isothermal at ambient as well as atelevated temperatures. The temperature in the reading chamber can beadjusted from 2°C above ambient to 60°C.
For information about using spectral scanning to optimize excitation and emissionwavelengths for Fluorescence Assays, see Spectral Scanning on page 180.

Chapter 6: Collecting Data
180 5014177 F
Spectral Scanning
This procedure optimizes excitation and emission wavelengths for fluorescenceassays using spectral scanning.
If you are using the SpectraMax Paradigm Tunable Wavelength (TUNE) DetectionCartridge, see Spectral Optimization on page 202.
Pipette 200 µL of sample that includes the fluorophore and 200 µL of a buffercontrol into separate wells of a microplate.
Perform the Excitation Scan
1. Using SoftMax Pro Software, set up a Plate section for a fluorescence read,spectrum mode, Em Fixed/Ex Scan, with no cutoff filter (default), and mediumPMT.
2. Set the emission wavelength based on the tentative value from the literature(or from a customary filter set used to measure your fluorophore). If theemission wavelength is not known, select a tentative emission wavelengthabout 50 nanometers greater than the absorbance maximum of thefluorophore. If necessary, the absorbance maximum can be determined byperforming an optical density spectral scan first.
3. Set the excitation scan to start/stop approximately 50 nm below/above thetentative excitation value obtained from the literature (or the customaryexcitation filter).
4. Set the step increment to 2 nm or 3 nm. You can choose to do a preliminaryscan with a 10 nm increment to determine the approximate peak location, andthen repeat the scan over a narrower wavelength range with a 2 nm or 3 nmincrement.
5. Perform the scan and view the results as a plot of emission fluorescence vs.excitation wavelength. Note the excitation wavelength at the emission peak andthe maximum RFU value.
If an error message reporting missing data points occurs, it can be due topossible saturation reported by the SoftMax Pro Software program at the end ofthe spectral scan. Reset the PMT to “low” and rescan the sample (scan thebuffer blank with the PMT set to “medium” or “high”). If the error occurs afterscanning with the PMT set to “low,” it can be necessary to dilute the sample.
If the excitation scan shows no apparent peak, change the PMT setting to “high”and rescan the sample. If the spectral scan still shows no apparent peak, adjustthe Y-scale of the zoom plot so that the plot fills the graph.
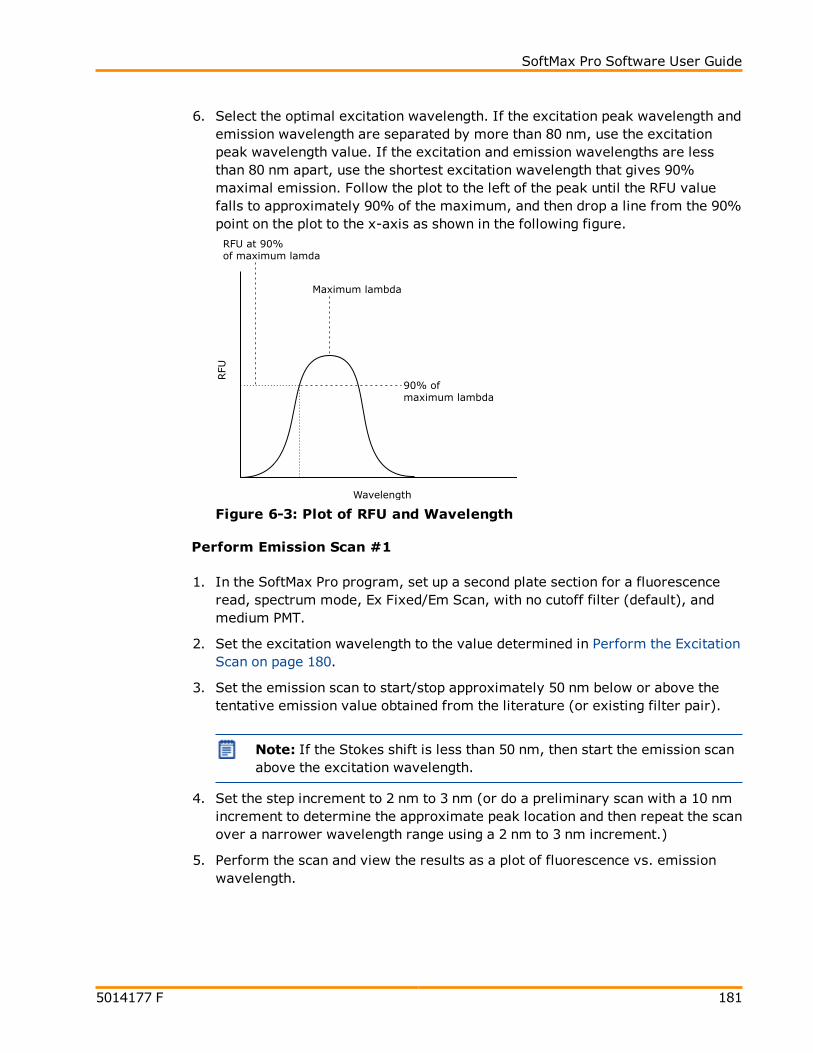
SoftMax Pro Software User Guide
5014177 F 181
6. Select the optimal excitation wavelength. If the excitation peak wavelength andemission wavelength are separated by more than 80 nm, use the excitationpeak wavelength value. If the excitation and emission wavelengths are lessthan 80 nm apart, use the shortest excitation wavelength that gives 90%maximal emission. Follow the plot to the left of the peak until the RFU valuefalls to approximately 90% of the maximum, and then drop a line from the 90%point on the plot to the x-axis as shown in the following figure.
RFU
RFU at 90% of maximum lamda
90% of maximum lambda
Maximum lambda
Wavelength
Figure 6-3: Plot of RFU and Wavelength
Perform Emission Scan #1
1. In the SoftMax Pro program, set up a second plate section for a fluorescenceread, spectrum mode, Ex Fixed/Em Scan, with no cutoff filter (default), andmedium PMT.
2. Set the excitation wavelength to the value determined in Perform the ExcitationScan on page 180.
3. Set the emission scan to start/stop approximately 50 nm below or above thetentative emission value obtained from the literature (or existing filter pair).
Note: If the Stokes shift is less than 50 nm, then start the emission scanabove the excitation wavelength.
4. Set the step increment to 2 nm to 3 nm (or do a preliminary scan with a 10 nmincrement to determine the approximate peak location and then repeat the scanover a narrower wavelength range using a 2 nm to 3 nm increment.)
5. Perform the scan and view the results as a plot of fluorescence vs. emissionwavelength.
Chapter 6: Collecting Data
182 5014177 F
Choose the Emission FilterSelect an emission cutoff filter that blocks as much of the residual excitation lightas possible without unduly reducing the fluorescence signal. The cutoff wavelengthchoices are 325, 420, 435, 475, 495, 515, 530, 550, 570, 590, 610, 630, 665, or695 nm. The cutoff value should be near the maximum emission wavelength(preferably between the excitation wavelength and the maximal emissionwavelength) but at least 10 nm less than the emission wavelength. If you havequestions about this procedure please contact Molecular Devices Technical Supportand ask to speak to an applications scientist.
Perform Emission Scan #2
1. In the SoftMax Pro Software, set up a third plate section for an emission scanas specified in Perform Emission Scan #1 on page 181, except selecting ManualCutoff Filter and setting the wavelength to that determined in Choose theEmission Filter on page 182.
2. Perform the scan and view the results as a plot of fluorescence vs. emissionwavelength. Note the wavelength giving the maximum emission (the optimalemission wavelength).
3. Compare the spectra of the sample containing the fluorophore to the spectra ofthe buffer blank to get an estimate of the signal-to-noise ratio. If there issignificant background interference, repeat Choose the Emission Filter on page182 and Perform Emission Scan #2 on page 182 with another choice of cutofffilter.
ResultsThe optimal excitation and emission wavelengths are those determine in Performthe Excitation Scan on page 180 and Perform Emission Scan #2 on page 182.
Comments
In endpoint or kinetic fluorescence modes, the AutoCutoff feature generallyselects the same cutoff filter wavelength as the previously describedoptimization method. If desired, however, you can specify the cutoff filtersmanually.
For emission wavelengths less than 325 nanometers, experimental iteration isusually the best method of determining the optimal emission and excitationwavelengths. Begin the previously described optimization procedure. Tryemission and excitation wavelength combinations with the 325 cutoff or with nocutoff filter. Similarly, for excitation wavelengths greater than660 nanometers, try emission and excitation wavelength combinations with the695 cutoff or with no cutoff filter.
The following table lists default settings for the emission cutoff filters.
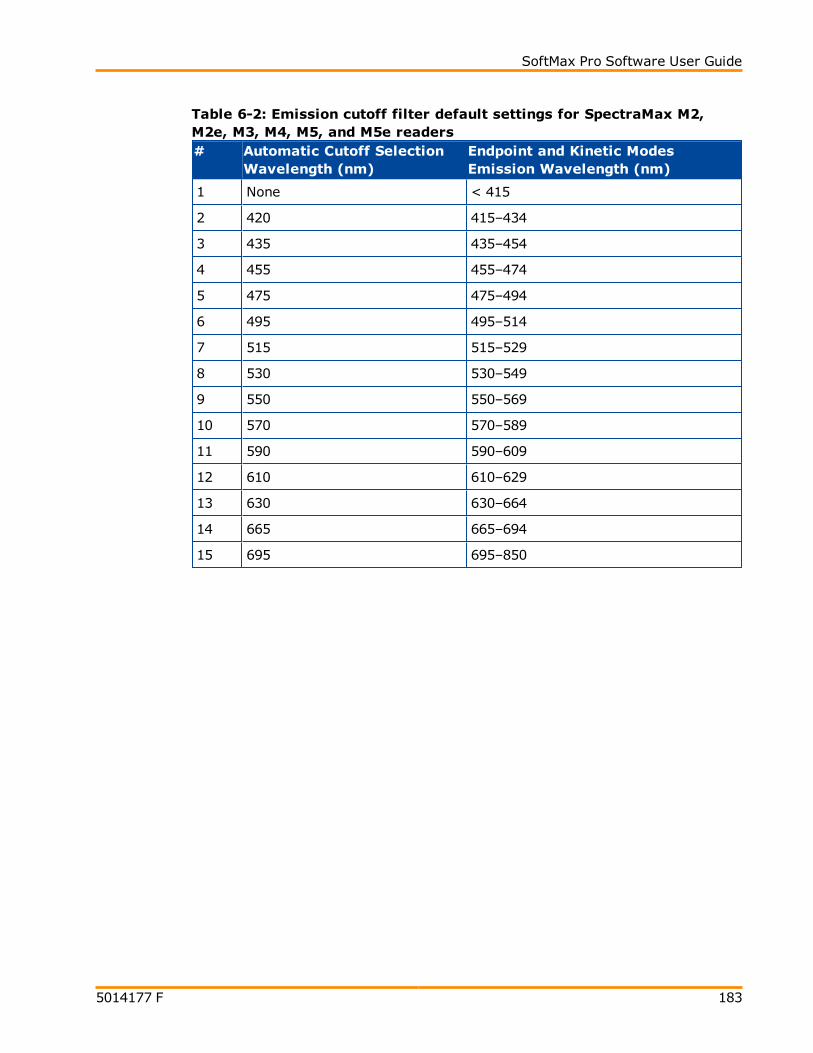
SoftMax Pro Software User Guide
5014177 F 183
# Automatic Cutoff SelectionWavelength (nm)
Endpoint and Kinetic ModesEmission Wavelength (nm)
1 None < 415
2 420 415–434
3 435 435–454
4 455 455–474
5 475 475–494
6 495 495–514
7 515 515–529
8 530 530–549
9 550 550–569
10 570 570–589
11 590 590–609
12 610 610–629
13 630 630–664
14 665 665–694
15 695 695–850
Table 6-2: Emission cutoff filter default settings for SpectraMax M2,M2e, M3, M4, M5, and M5e readers

Chapter 6: Collecting Data
184 5014177 F
Creating a Luminescence Mode ProtocolTo create a Luminescence Mode protocol:
1. Start the SoftMax Pro Software. See Starting the Software on page 10.
2. Select an instrument. See Selecting and Connecting to an Instrument on page11.
Note: It is not necessary to be physically connected to an instrument tocreate a protocol. If you are not connected to an instrument you canselect the target instrument and work offline.
3. With the plate or cuvette section active, click Settings on the Home tabin the ribbon.
4. When working with a SpectraMax Paradigm Multi-Mode Detection Platform,click a Luminescence detection cartridge from the Cartridges list.
5. Click LUM to select the Luminescence read mode.
6. Click a Read Type.
7. Define the settings.
For more information about the settings, see the SoftMax Pro ApplicationHelp.
8. After defining the settings for the protocol, click OK to close the Settingsdialog.
9. Create a template, if applicable. See Configuring a Microplate Template onpage 162.
10. Set Data Reduction parameters, if applicable. See Performing Data Reductionon page 214.
11. Set Display options, if applicable. See Setting the Data Display Options on page210.
12. Save the settings to a protocol file. See Saving the Settings to a Protocol File onpage 193.

SoftMax Pro Software User Guide
5014177 F 185
Luminescence Mode Protocol Overview
Luminescence is the emission of light by processes that derive energy from non-thermal changes, the motion of subatomic particles, or the excitation of an atomicsystem by radiation.
Optimizing Luminescence Assays
Luminescence can be read from the top or the bottom of a microplate. Solid whiteplates or white plates with clear bottoms are recommended for luminescencereads.
For standard luminescence a separate light path without monochromators carriesthe emitted light to a dedicated PMT. The optimum emission wavelength is between360 nm and 630 nm. Under reader set-up the emission says All.
For wavelength-selectable luminescence, the emission monochromator is used todifferentiate the wavelengths being emitted from the well. Up to four emissionwavelengths within the specified reader range can be selected. If reading only oneluminescent event in the well, best sensitivity should be achieved using thestandard luminescence measurement, without a wavelength selected.
Luminescence read times are not designated by multiple reads per well, but ratherby choosing the total integration time desired between 1 ms and 1,500 ms. Typicalluminescence assays require between 500 ms and 1000 ms integration.
If wells have been incubating for a long period of time, it is a good idea to mix theplate before reading. This can be done using the Shake function.
If it appears that the signal is always higher in the first wells read (for example,column A), the plate might need to be “dark adapted” to reduce the auto-luminescence of the white plastic. The auto-luminescence decreases quickly, somanually load the plate using the hardware controls and wait for 1 to 2 minutesbefore initiating the read and determine if the read-out is more consistent acrossthe plate.

Chapter 6: Collecting Data
186 5014177 F
Creating a Time-Resolved Fluorescence Mode ProtocolTo create a Time-Resolved Fluorescence Mode protocol:
1. Start the SoftMax Pro Software. See Starting the Software on page 10.
2. Select an instrument. See Selecting and Connecting to an Instrument on page11.
Note: It is not necessary to be physically connected to an instrument tocreate a protocol. If you are not connected to an instrument you canselect the target instrument and work offline.
3. With the plate or cuvette section active, click Settings on the Home tabin the ribbon.
4. When working with a SpectraMax Paradigm Multi-Mode Detection Platform,click a TRF-capable detection cartridge from the Cartridges list.
5. Click TRF to select the Time-Resolved Fluorescence read mode.
6. Click a Read Type.
7. Define the settings.
For more information about the settings, see the SoftMax Pro ApplicationHelp.
8. After defining the settings for the protocol, click OK to close the Settingsdialog.
9. Create a template, if applicable. See Configuring a Microplate Template onpage 162.
10. Set Data Reduction parameters, if applicable. See Performing Data Reductionon page 214.
11. Set Display options, if applicable. See Setting the Data Display Options on page210.
12. Save the settings to a protocol file. See Saving the Settings to a Protocol File onpage 193.
SoftMax Pro Software User Guide
5014177 F 187
Time-Resolved Fluorescence Mode Overview
Time-Resolved Fluorescence (TRF) is a method of detection, which uses a delaybetween the excitation, and emission detection. This delay allows for the reductionof background fluorescence. Most fluorescence substances are not suitable for thistype of reading. However, the fluorescence emitted by the lanthanide dyes aredelayed long enough to measure fluorescence to use for this detection mode. Thisis different from Fluorescence Intensity mode reads, which do not have a delaybetween the excitation and emission.
TRF is used to reduce the amount of background noise that interferes withfluorescence. The excitation lamp flashes, and after it is off, the delayed emissionis collected for a set period of time before the lamp is flashed again.
In normal Fluorescence Intensity mode, the SpectraMax readings are taken whilethe lamp is on. The most common limitation to sensitivity in normal fluorescence isexcitation energy or background fluorescence that cannot be eliminated from theemission signal. Since the lamp is the source of excitation energy, turning it offprovides the best means of eliminating background excitation. The elimination ofbackground excitation is the critical difference between fluorescence intensitymeasurements and TRF measurements.
Optimizing Time-Resolved Fluorescence Assays
Time-resolved fluorescence is performed by flashing the excitation lamp and, afterit is off, collecting the delayed emission for a period of time before the lamp isflashed again. Long-lifetime rare-earth lanthanide dyes are typically used toprovide a long-lived fluorescent signal that persists after the lamp is turned off.Background fluorescence usually fades, while lanthanide chelates and cryptateshave fluorescent lifetimes between 100 µs and 2 ms.
To optimize data collection for a particular assay, you can select when to start andend data acquisition-the minimum is 50 µs after the lamp has been turned off, andthe maximum is 1450 µs, in 50 µs or 200 µs steps.
Some examples of TRF assays are:
IMAP® TR-FRET
Cisbio HTRF
LanthaScreen TR-FRET
LANCE TR-FRET
DELFIA TRF

Chapter 6: Collecting Data
188 5014177 F
Creating a Fluorescence Polarization Mode ProtocolTo create a Fluorescence Polarization Mode protocol:
1. Start the SoftMax Pro Software. See Starting the Software on page 10.
2. Select an instrument. See Selecting and Connecting to an Instrument on page11.
Note: It is not necessary to be physically connected to an instrument tocreate a protocol. If you are not connected to an instrument you canselect the target instrument and work offline.
3. With the plate or cuvette section active, click Settings on the Home tabin the ribbon.
4. When working with a SpectraMax Paradigm Multi-Mode Detection Platform,click a Fluorescence Polarization (FP) Detection Cartridge from theCartridges list.
5. Click FP to select the Fluorescence Polarization read mode.
6. Click a Read Type.
7. Define the settings.
For more information about the settings, see the SoftMax Pro ApplicationHelp.
8. After defining the settings for the protocol, click OK to close the Settingsdialog.
9. Create a template, if applicable. See Configuring a Microplate Template onpage 162.
10. Set Data Reduction parameters, if applicable. See Performing Data Reductionon page 214.
11. Set Display options, if applicable. See Setting the Data Display Options on page210.
12. Save the settings to a protocol file. See Saving the Settings to a Protocol File onpage 193.
Fluorescence Polarization Mode Protocol Overview
By using a fluorescent dye to label a small molecule, its binding to a large moleculecan be monitored through changes in its speed of rotation.

SoftMax Pro Software User Guide
5014177 F 189
Fluorescence Polarization mode returns two sets of data: one for fluorescenceintensity parallel (P) to the excitation plane, and the other for fluorescenceintensity perpendicular (S) to the excitation plane. These S and P values are usedto calculate the Polarization (mP) and Anisotropy (r) values in SoftMax ProSoftware. Although the Raw S&P values are the true actual values returned fromthe instrument, the calculated Polarization (mP) and Anisotropy (r) values aretreated as the raw data; these become the basis for further reduction calculations.You can choose to display any of these data types in the Plate section.
When raw (S&P) is displayed, the mP value is by default used for all reductioncalculations. When exporting, the displayed raw values are exported, whether mP,r, or Raw (S&P).
Polarization (mP) is calculated as follows:
mP = 1000(parallel + (G perpendicular))
(parallel (G perpendicular))-*-
*
*
Anisotropy (r) is calculated as follows:
r = -(parallel (G perpendicular))- *
(parallel + (2G perpendicular))*
Optimizing Fluorescence Polarization Assays
Fluorescence polarization for the SpectraMax M5 and M5e Multi-Mode MicroplateReaders, the FilterMax F3 and F5 Multi-Mode Microplate Readers, and theSpectraMax Paradigm Multi-Mode Detection Platform can be read only from thetop of a microplate. The plastic from which a microplate is formed affects the lightpolarization, precluding bottom reads and reading a covered plate.
Solid black plates are recommended for fluorescence polarization reads. If theassay components seem to bind to the microplate, as evidenced by poor mPdynamic range (small difference between bound and unbound tracer), we suggestusing plates treated to minimize binding, or polypropylene plates and adding a verysmall amount of detergent, to the assay buffer.
Background wells, containing all assay components minus the fluorophore, shouldbe tested. If the signal in the background wells is more than 1/10 the signal in thewells containing fluorophore, then background wells should be run on each assayplate. The average raw signal from the background's parallel and perpendicularreadings should be subtracted from the raw parallel and perpendicular readings ofeach sample well before the mP calculation is performed.
For best precision in assays using a low amount of fluorophore (for example,<5 nm fluorescein), set the PMT sensitivity to High and the number of readings to100. If faster read speed is required, be sure Settling Time is “Off” in the SoftMaxPro Software settings, and experiment with fewer flashes per well until acceptablespeed and still enough precision are achieved.
Note: Fewer flashes result in a higher speed, but less precision is achieved.

Chapter 6: Collecting Data
190 5014177 F
Creating an AlphaScreen Mode ProtocolTo create an AlphaScreen Mode protocol:
1. Start the SoftMax Pro Software. See Starting the Software on page 10.
2. Select the SpectraMax Paradigm Multi-Mode Detection Platform. See Selectingand Connecting to an Instrument on page 11.
Note: It is not necessary to be physically connected to an instrument tocreate a protocol. If you are not connected to an instrument you canselect the target instrument and work offline.
3. With the plate section active, click Settings on the Home tab in theribbon.
4. Click one of the AlphaScreen Detection Cartridges from the Cartridges list.
5. Click Screen to select the AlphaScreen read mode.
6. Click a Read Type.
7. Define the settings.
For more information about the settings, see the SoftMax Pro ApplicationHelp.
8. After defining the settings for the protocol, click OK to close the Settingsdialog.
9. Create a template, if applicable. See Configuring a Microplate Template onpage 162.
10. Set Data Reduction parameters, if applicable. See Performing Data Reductionon page 214.
11. Set Display options, if applicable. See Setting the Data Display Options on page210.
12. Save the settings to a protocol file. See Saving the Settings to a Protocol File onpage 193.

SoftMax Pro Software User Guide
5014177 F 191
AlphaScreen Mode Protocol Overview
ALPHA stands for Amplified Luminescent Proximity Homogeneous Assay.AlphaScreen is a bead-based chemistry used to study molecular interactionsbetween moieties A and B, for example. When a biological interaction between Aand B brings beads (coated with A and B, respectively) together, a cascade ofchemical reactions acts to produce a greatly amplified signal.
The cascade finally resulting in signal is triggered by laser excitation (680 nm),making a photosensitizer on the A-beads convert oxygen to an excited (singlet)state. That energized oxygen diffuses away from the A-bead. When reaching the B-bead in close proximity, it reacts with a thioxene derivative on the B-beadgenerating chemiluminescence at 370 nm. Energy transfer to a fluorescent dye onthe same bead shifts the emission wavelength into the 520 nm to 620 nm range.The limited lifetime of singlet oxygen in solvent (~4 microseconds) allows diffusionreach only up to about 200 nm distance. Thus, only B-beads in the proximity of A-beads yield signal, which indicates binding between moieties A and B.
An AlphaScreen measurement includes a light pulse, by turning on the laser diodefor a specified time, turning off the laser diode, followed by the measurement ofthe AlphaScreen signal, as specified in the measurement protocol timingparameters.
AlphaScreen beads are light sensitive. Beads are best handled under subdued(<100 lux) or green filtered (Roscolux filters #389 from Rosco, or equivalent) lightconditions. Incubation steps should be performed in the dark.
Applications of AlphaScreen
AlphaScreen reagent and assays are used for drug discovery purposes. Examplesof AlphaScreen assays include:
G-protein coupled receptor (GPCR) assay kits, for cAMP quantification or IP3quantification.
Tyrosine Kinase assays.
Cytokine detection kits, such as TNF-alpha detection (immunoassay).

Chapter 6: Collecting Data
192 5014177 F
Creating a FRET Mode ProtocolTo create a Fluorescence Resonance Energy Transfer (FRET) protocol:
1. Start the SoftMax Pro Software. See Starting the Software on page 10.
2. Select an instrument. See Selecting and Connecting to an Instrument on page11.
Note: It is not necessary to be physically connected to an instrument tocreate a protocol. If you are not connected to an instrument you canselect the target instrument and work offline.
3. With the plate or cuvette section active, click Settings on the Home tabin the ribbon.
4. When working with a SpectraMax Paradigm Multi-Mode Detection Platform,click one of the Fluorescence Intensity cartridges from the Cartridges list.
5. Click FRET to select the FRET read mode.
6. Click a Read Type.
7. Define the settings.
For more information about the settings, see the SoftMax Pro ApplicationHelp.
8. After defining the settings for the protocol, click OK to close the Settingsdialog.
9. Create a template, if applicable. See Configuring a Microplate Template onpage 162.
10. Set Data Reduction parameters, if applicable. See Performing Data Reductionon page 214.
11. Set Display options, if applicable. See Setting the Data Display Options on page210.
12. Save the settings to a protocol file. See Saving the Settings to a Protocol File onpage 193.
SoftMax Pro Software User Guide
5014177 F 193
Fluorescence Resonance Energy Transfer Overview
Fluorescence resonance energy transfer (FRET) is a distance-dependent interactionbetween the electronic excited states of two dye molecules in which excitation istransferred from a donor molecule to an acceptor molecule without emission of aphoton.
FRET relies on the distance-dependent transfer of energy from a donor molecule toan acceptor molecule. Due to its sensitivity to distance, FRET has been used toinvestigate molecular interactions. FRET is the radiationless transmission of energyfrom a donor molecule to an acceptor molecule. The donor molecule is the dye orchromophore that initially absorbs the energy and the acceptor is the chromophoreto which the energy is subsequently transferred. This resonance interaction occursover greater than interatomic distances, without conversion to thermal energy, andwithout any molecular collision. The transfer of energy leads to a reduction in thedonor’s fluorescence intensity and excited state lifetime, and an increase in theacceptor’s emission intensity. A pair of molecules that interact in such a mannerthat FRET occurs is often referred to as a donor/acceptor pair.
While there are many factors that influence FRET, the primary conditions that needto be met in order for FRET to occur are relatively few. The donor and acceptormolecules must be in close proximity to one another. The absorption or excitationspectrum of the acceptor must overlap the fluorescence emission spectrum of thedonor. The degree to which they overlap is referred to as the spectral overlapintegral (J). The donor and acceptor transition dipole orientations must beapproximately parallel.
Saving the Settings to a Protocol FileTo save the settings for the experiment into a protocol file:
1. Click the Application button to open the Applicationmenu.
2. Click Save As.
3. In the Save As dialog, navigate to where you want the protocol file to besaved.
4. In the File name field, type a name for the file.
5. From the Save as type field, select Protocol Files (*.spr).
If you are working with the SoftMax Pro GxP Software, select Protocol Files(*.sprx).
6. Click Save.
Saving a data file as a protocol file removes any data in the file, leaving only theconfiguration information.

Chapter 6: Collecting Data
194 5014177 F
Collecting Data from a MicroplateYou can start a reading at any time after defining instrument settings. It is notnecessary to define groups and assign wells in the Template Editor first. The valuesreceived from the instrument are raw values and are not affected by the settings inthe Template Editor.
To automatically read multiple Plate sections in the same experiment, seeEnabling Auto Read on page 195.
To read a microplate:
1. Open the drawer of the instrument by clicking Open/Close on the Hometab in the ribbon.
2. Insert the prepared microplate matching well A1 with position A1 in the drawer.Make sure the microplate is flat against the drawer bottom or against theadapter.
3. Click Open/Close to close the drawer.
4. Open a SoftMax Pro Software data file or protocol file that contains theappropriate experiment settings for the plate read. Alternatively, create newsettings by selecting the Plate section in the SoftMax Pro Software programand configuring the instrument settings using the Settings dialog. For Moreinformation, see Selecting Instrument Settings on page 160.
5. Click Read on the Home tab in the ribbon.
The Read button changes to Stop , allowing you to terminate a reading ifdesired.
6. The active Plate section is read.
If you are using a SpectraMax Paradigm Multi-Mode Detection Platformand selected to perform pre-read optimizations, the Pre-ReadOptimization Options dialog appears. See Performing Pre-ReadOptimization on page 196.
If you are using a SpectraMax Paradigm Tunable Wavelength (TUNE)Detection Cartridge and selected to run spectral optimization, the SpectralOptimization Wizard runs before the microplate is read. See SpectralOptimization on page 202.

SoftMax Pro Software User Guide
5014177 F 195
7. When reading is complete, the drawer of the instrument opens, allowing you toremove the microplate. If temperature control is on, the drawer closes againafter approximately 10 seconds.
Note: If you return to the instrument and find the drawer closed after areading has finished, press the Drawer button on the instrument. After thedrawer opens, you can remove the microplate.
After the reading is complete, save the data. See Saving Data Files on page 47.
For information on the data-analysis tools in the SoftMax Pro Software, seeAnalyzing Data on page 207.
Enabling Auto Read
AutoRead enables automatic reading of Plate sections in the order they appearwithin a single Experiment. When you start a read for any Plate section in theExperiment that is enabled for automatic reading, all enabled Plate sectionsfollowing the selected Plate section are read. Enabled Plate sections above theselected Plate section are not read. You can set intervals (delay times) betweenthe plate readings, if desired.
1. In the Navigation Tree or the workspace, select the Experiment that has thePlate sections that you want to automatically read.
2. Click Auto Read in the Operations tab of the ribbon.
Chapter 6: Collecting Data
196 5014177 F
2. In the AutoRead dialog, select the Plate sections that you want toautomatically read.
3. Optionally, type the number of seconds to delay (the interval) between readingeach Plate section.
4. Click OK to close the dialog.
Note: If you have non-enabled Plate sections following the last enabledPlate section, the first non-enabled Plate section following the last enablePlate section is also read. For example, if you have four Plate sections(Plate 1, Plate 2, Plate 3, and Plate 4) with Plate 1 and Plate 2 enabled forAutoRead and then start a Read operation for Plate 1, then Plate 1, Plate 2,and Plate 3 are read in sequence.
Performing Pre-Read Optimization
When using the SpectraMax Paradigm Multi-Mode Detection Platform or theFilterMax F3 and F5 Multi-Mode Microplate Readers, you can use pre-readoptimization options. Using this function allows you to perform microplateoptimization and read height adjustment.
The Pre-Read Optimization Options dialog appears when the Show Pre-ReadOptimization Options check box is selected on the More Settings tab of theSettings dialog for the SpectraMax Paradigm detection cartridges or the FilterMaxF3 and F5 Multi-Mode Microplate Readers. The available optimization options aredependant on the read mode.
Note: If you are using a SpectraMax Paradigm Tunable Wavelength (TUNE)Detection Cartridge and selected to run spectral optimization, the SpectralOptimization Wizard runs before the Pre-Read Optimization Options dialogappears. See Spectral Optimization on page 202.
To select pre-read optimization options:
1. Select the Run Microplate Optimization check box to run the MicroplateOptimization Wizard before reading the microplate. See MicroplateOptimization on page 197.
2. Select the Run Read Height Adjustment check box to run the Read HeightOptimization Wizard before reading the plate. See Read Height Optimization onpage 200.
3. Click Run Optimization to run the selected optimization options.
4. If the microplate has a lid on it, select the Plate is Lidded check box.
SoftMax Pro Software User Guide
5014177 F 197
5. Optionally, you can select the orientation for the microplate:
Landscape
Portrait
Opposite Landscape
Opposite Portrait
6. Click Read Plate to start the read.
Microplate Optimization
Microplate dimensions can vary slightly between production lots, which potentiallyaffects measurement accuracy. SoftMax Pro Software allows microplatedimensions to be optimized by determining the centers of the four corner wells onthe plate. Each time a microplate is optimized, a new microplate definition iscreated with dimensions specific to that lot.
Note: If a microplate type is to be used in different plate orientations formeasurements, microplate optimization must be done for each plateorientation separately.
The microplate is optimized using the Microplate Optimization Wizard.
You can select to run the Microplate Optimization Wizard in the Pre-ReadOptimization Options dialog that appears if the Show Pre-Read OptimizationOptions check box is selected on the More Settings tab of the Settings dialogfor a SpectraMax Paradigm detection cartridge. See Selecting Instrument Settingson page 160.
When selected, the Pre-Read Optimization Options dialog runs after the Readbutton is clicked.
To perform microplate optimization:
1. In the Pre-Read Optimization Options dialog, select the Run MicroplateOptimization before reading the plate check box.
2. Click Run Optimization.
The Microplate Optimization Wizard takes you through the optimization process:
Insert the Microplate on page 198
Running Optimization on page 198
Selecting the Centers of the Four Corner Wells on page 199
Verifying Microplate Dimensions on page 199
Chapter 6: Collecting Data
198 5014177 F
Insert the MicroplateMicroplate dimensions are optimized by reading the four corner wells of the plate.The Insert the Microplate step provides controls to load and eject the microplatefrom the instrument and to select the orientation of the plate in the microplatedrawer.
To insert the prepared microplate for optimization:
1. Click Open the Microplate Drawer to move the microplate drawer carrieroutside the instrument.
2. Fill the corner wells of the plate with identical samples. To ensure accuracy,samples must be appropriate for the selected read mode detection method.Sample concentration and volume must be identical in each well.
3. Place the prepared microplate on the microplate drawer.
4. Click Close the Microplate Drawer to load the microplate into theinstrument.
5. In Select the Microplate Orientation, select the orientation of the plate onthe microplate drawer. The selected orientation is displayed graphically on theright, with well A1 marked in red. Make sure this orientation is the same as theorientation of the microplate in the drawer selected in the Pre-ReadOptimization Options dialog.
6. Click Next to start the optimization. See Running Optimization on page 198.The optimization read begins automatically.
Running OptimizationOptimization in Progress displays the status of the optimization read andprovides the ability to cancel the optimization in progress. The optimization readrequires several minutes to complete.
To cancel the optimization process and close the Microplate Optimization wizardwithout saving the optimization data, click the Cancel button.
When the optimization read is complete, you can select the centers of each of thefour corner wells. See Selecting the Centers of the Four Corner Wells on page 199.

SoftMax Pro Software User Guide
5014177 F 199
Selecting the Centers of the Four Corner WellsUse the Select the Center steps to precisely define the centers of the cornerwells read in the optimization. Each Select the Center step displays an image ofthe well generated by the optimization read. Define the well centers by draggingthe cross hairs to the position visually identified as the center. Perform a Selectthe Center step for each corner well individually.
To define the centers of the wells:
1. Place the pointer in the well image.
2. Click-and-drag the cross hairs to the desired center of the well.
Note: The cross hairs appear after the cursor is placed in the well image.
3. Click Next to define the centers of the remaining well reads.
After all four well centers are defined, the Verify Microplate Dimensions stepappears. See Verifying Microplate Dimensions on page 199.
Verifying Microplate DimensionsUse the Verify Microplate Dimensions step to verify that the x and y offsetsand distances between rows and columns are correct. The offsets, distances, andlot name can be edited in the Verify Microplate Dimensions step.
1. If necessary, click the + next to Microplate Dimensions to display the fieldsin the category.
2. Verify that the x and y offset and distances between rows and columns arecorrect. If necessary, you can edit the dimension. All offsets and well-spacingdimensions are defined in millimeters.
3. If necessary, click the + next to Microplate Name to display the default nameassigned to the new microplate definition.
4. Type a new Microplate Name, if desired.
5. Click Save to save the optimization data and create the new Microplatedefinition.
This new microplate definition can be selected from the plate types listed in thePlate Type Library. For additional information, see Plate Type Settings on page144.
If you have selected the Run Read Height Adjustment check box in the Pre-Read Optimization Options dialog, the Read Height Optimization Wizardruns before reading the plate. See Read Height Optimization on page 200.

Chapter 6: Collecting Data
200 5014177 F
Read Height Optimization
The SpectraMax Paradigm Multi-Mode Detection Platform features an objectivelens that can be moved up and down to optimize the read height used inluminescence, fluorescence intensity top, fluorescence polarization, and time-resolved fluorescence protocols. Read height is the distance between the top (usingtop reading) or bottom (using bottom reading) surface of the microplate being readand the surface of the objective lens. Optimizing read height matches the focus ofthe optics with the sample volume. This maximizes the raw signal, which yields thehighest precision and maximum sensitivity.
A single sample with a known maximum signal and volume is placed on the sametype of microplate used in the protocol. The sample is measured using the same, orvery similar, read mode used in the protocol.
The optimized read height is saved in the protocol and is used for all subsequentruns of the protocol until reset by performing a new optimization or manuallyselecting a read height option.
You can select to run the Read Height Optimization Wizard in the Pre-ReadOptimization Options dialog that appears if the Show Pre-Read OptimizationOptions check box is selected on the More Settings tab of the Settings dialogfor a SpectraMax Paradigm detection cartridge. See Selecting Instrument Settingson page 160.
When selected, the Pre-Read Optimization Options dialog opens after the Readbutton is clicked.
To perform Read Height optimization:
1. Select the Run Read Height Adjustments before reading the plate checkbox.
2. SelectMicroplate options.
3. Click Run Optimization.

SoftMax Pro Software User Guide
5014177 F 201
Running Read Height OptimizationSelect the well to be measured to perform the optimization.
Use a standard or sample position with a good signal or pipette liquid with a knownmaximum signal to a well on the microplate used in the optimization. Theconcentration of the optimization sample should be at least ten times greater thanthe detection limit. The sample volume should be the same as that of samplesmeasured in the protocol. If using a layout with standards, the standard wellclosest to the center of the plate is pre-selected. If not using a layout withstandards, the first sample is pre-selected.
Note:When optimizing read height for a fluorescence protocol, make surethe optimization sample is the same fluorescent substance that the detectionmethod is configured to detect.
1. Load the plate into the instrument.
2. In the Select Well step, select the well containing the optimization sample.
3. Click Next to start the optimization.
The Optimization in Progress step appears. The optimization can take fromseveral seconds to several minutes depending on the detection methods used.
4. When the read is finished, the Optimization Complete step appears,displaying the Optimized Read Height. To specify a different read height, type avalue in the Custom Read Height field. The read height is measured inmillimeters.
5. Click Save to save the specified read height in the protocol. The specified readheight is used for all subsequent runs of the protocol until reset by performing anew optimization or manually selecting a read height option.
When Read Height Optimization is complete and you return to the Pre-ReadOptimization dialog, you can choose to change the microplate options and rerunMicroplate Optimization or Read Height Optimization. When all you have completedall the desired optimization, click Read Plate to start reading the plate.
After the wizard closes, the Pre-Read Optimization Options dialog appears.

Chapter 6: Collecting Data
202 5014177 F
Spectral Optimization
Spectral optimization in spectral assays improves accuracy while reducing dataacquisition and computational burden. Spectral optimization can help to get themaximum signal-to-background ratio for virtually any fluorophore or luminescencelabel compatible with the wavelength ranges of the cartridge.
Spectral Optimization is available for the SpectraMax Paradigm Multi-ModeDetection Platform with the following detection cartridge:
Tunable Wavelength (TUNE) Detection Cartridge
To run the Spectral Optimization Wizard, select Unknown on theWavelengths tab in the Settings dialog.
When Unknown is selected, the Spectral Optimization Wizard dialog opensafter the Read button is clicked.
Running Spectral Optimization
1. In the Read Settings step, specify the wavelength ranges and otherparameters for the optimization.
The Start Emission Wavelength value must be at least 20 nm greater thanthe Start Excitation Wavelength value. Molecular Devices recommendsusing an emission value that is at least 40 nm greater than the excitation value.
To perform Spectral Optimization, there must be at least 10 data points in therange for both the excitation and emission wavelengths. Make sure that theWavelength Increment allows a minimum of 10 data points in each range.
For a luminescence read, only emission values can be specified.
2. To specify the Read Height or Integration Time, click Advancedparameters and then type the desired values in the fields.
For Time-Resolved Fluorescence (TRF) reads, you can also specify PulseLength, Number of Pulses, andMeasurement Delay.
3. Click Next to continue.
4. In the Sample Well step, select the well in the plate layout that correspondswith the well in the microplate that contains your sample.
5. Click Next to continue.
6. Wait while the indicator in the Optimization in Progress step displays theoperation's progress.
7. In the Optimization Complete step, a 3-dimensional heat map imageappears. The heat map is generated using the formula (S – B) / B, whereS = signal and B = background.
Note: For a luminescence read, the Spectral Optimization Wizardgenerates a 2-dimensional graph.

SoftMax Pro Software User Guide
5014177 F 203
The cross hair in the image indicates the optimized peak wavelengths. Tochange the wavelengths for the read, drag the cross hair to a new location ortype values in the fields.
The Emission value must be at least 20 nm greater than the Excitation value.Molecular Devices recommends using an emission value that is at least 40 nmgreater than the excitation value.
For a luminescence read, only emission values can be specified.
To change the way the a 3-dimensional heat map image appears, select orclear the Use LogScale check box.
If you have edited the Wavelength (Custom) values and want to reset thevalues to the wizard-defined optimized peak, click Reset to OptimizedPeak.
If you want to redefine the settings and run the wizard again, click RestartWizard.
If you want to save the wavelength values without immediately reading themicroplate, click Cancel, and then click Save in the message that appears.
Right-click on the image to display the shortcut menu. You can select from thefollowing options:
Copy Image copies the image into a bitmap file that can be pasted into agraphic application.
Save Image to Disk saves the image into a .bmp file.
8. Click Read to save the protocol with the specified excitation and emissionwavelengths and use these values to read the microplate.
If you selected to perform pre-read optimizations, the Pre-Read OptimizationOptions dialog appears before the plate is read. See Performing Pre-ReadOptimization on page 196.
Collecting Data From a CuvetteTwo types of data collection are possible using a cuvette: a reference and a samplereading.
You can start a reading at any time after defining instrument settings. It is notnecessary to define groups and assign cuvettes in the Template Editor first, but youcan use the Template Editor to create the appropriate number of cuvettes in thesection. Alternatively, you can create a small number of cuvettes one at a time
with New Cuvette Set on the Home tab in the ribbon.
Instrument settings must be the same for all cuvettes in a Cuvette Set section.

Chapter 6: Collecting Data
204 5014177 F
Sample ReadingYou can select any cuvette in the Cuvette Set section and choose to read it by
clicking Read on the Home tab in the ribbon.
The Read button changes to Stop , allowing you to terminate a reading ifdesired.
If you select more than one cuvette, the software starts with the left-most selectedcuvette that does not contain sample read data.
Cuvette Set sections have a limit of 96 cuvettes. If this limit is reached, create anew Cuvette Set section.
Reference ReadingA reference reading can be taken either on air or using a cuvette containing thebuffer of your sample.
The reference can be read before or after reading samples.
If no reference has been taken in a Cuvette Set section before samples were readand you then read a reference, the following occurs:
The reference reading is applied to all cuvettes in the Cuvette Set section if it isthe first reference reading.
In subsequent reference readings, if you select one or more cuvettes it willselectively replace the reference reading for those selected cuvettes.
The time and date of the reading are displayed under each cuvette in thesection.
The reference is applied to any new cuvettes subsequently created in thatsection.
You can have more than one reference per Cuvette Set section.
To apply a different reference to cuvettes:
1. Select the cuvettes in the Cuvette Set section.
2. Place the appropriate reference in the cuvette port.
3. Click the Ref button.
The time and date stamp of the reference for the selected cuvettes changes.
Any new cuvettes created in the Cuvette Set section after reading a secondreference use the new reference reading.
The reference reading is applied to all cuvettes in the Cuvette Set section, unlessyou have selected specific cuvettes. The reference value is not displayed inSoftMax Pro Software. If you want to see the reference value, you can use one ofthe following procedures.
SoftMax Pro Software User Guide
5014177 F 205
Procedure 1:
1. Create a cuvette in the CuvetteSet section and Ref on air (empty cuvette port).
2. Read a cuvette containing the blanking solution.
If you want to have both reference and read values available, do the following:
3. Create a Cuvette Set with up to the maximum of 96 cuvettes.
4. Define a template blank in the Cuvette Set section.
5. Place buffer in the cuvette and select Read.
6. Click Read to read the remaining samples.
The optical density of the cuvette designated as the template blank is subtractedfrom the optical density of all the other cuvettes in the Cuvette Set section.
Procedure 2:
1. Create a Cuvette Set with up to the maximum of 96 cuvettes.
2. Reference and read the cuvette.
3. Create a template with the appropriate groups.
4. Create a column in each Group table with the formula !wellprereadLm1.
If you have a multiple-wavelength reading and want to see the reference at eachwavelength, create additional columns with the formula !wellprereadLmx where xis 2, 3, or 4, corresponding to the wavelength for which you want to see areference.
The OD/RFU/RLU with the reference subtracted is displayed in the Values column.The reference value for each sample is displayed in the custom column you havecreated.

Chapter 6: Collecting Data
206 5014177 F

5014177 F 207
Chapter 7: Analyzing Data
Each SoftMax Pro Software data file has a minimum of one Plate section or oneCuvette Set section. Most files also have an assigned plate template andassociated Group sections, Graph sections, and Notes sections. However,depending upon the protocol and how you want to report the data, only some ofthese sections might be present in every file.
Some simple protocols, such as reading the absorbance of proteins at 280 nm in acuvette (or in a microplate with PathCheck Pathlength Measurement Technology),allow you to calculate concentration in the Plate section or Cuvette Set section.In such an example, Group sections and Graph sections are necessary only if youwant to display the data in tables or graphically.
Many common protocols consist of data acquired in a Plate section or CuvetteSet section. Standards and unknowns are defined in a template. Unknowns arethen interpolated from a standard curve.
For more information see:
Calculations and Numerical Precision on page 208
Setting the Data Display Options on page 210
Performing Data Reduction on page 214
Viewing Data in a Three-Dimensional Graph on page 226
Graphing Data on page 233
Chapter 7: Analyzing Data
208 5014177 F
Calculations and Numerical PrecisionThe calculations performed by the SoftMax Pro Software use 64-bit double-precision real numbers (15+ digits of precision) as defined by IEEE standard 754for binary floating-point arithmetic.
Numbers from Plate sections or Cuvette Set sections are presented, printed, andexported with three to four digits after the decimal point depending on the readmode and the instrument in use. Numbers from Group sections and Summaries arepresented, printed, and exported with as many as nine digits after the decimalpoint, as specified by the user. All numbers saved in the SoftMax Pro Software datafiles are stored with full 64-bit precision.
The precision of the data displayed in a Plate section varies based on the amountof space available to view the characters.
For example, for a plate with 96 wells or fewer, each well is limited to 5 digits, plusone character for the decimal point, if applicable. For a 384-well plate, each well islimited to 4 characters, including the decimal point.
When SoftMax Pro Software exports plate data, the values are not limited by spaceand can have more digits for each well.
The values displayed in a Plate section are only a representation of the data. Inboth the Plate section and in the exported data, the last digit displayed or exportedis rounded based on the actual data value.
Although the SoftMax Pro Software can display readings and numbers derived fromthose readings with more than four decimal places, the resolution of the readerultimately determines the precision of the calculations. For more information aboutthe numerical resolution of a reader, see the documentation for that reader.
For information on suspending and resuming calculations, see Using the OperationsTab on page 34.
SoftMax Pro Software User Guide
5014177 F 209
Calculation HierarchySoftMax Pro Software performs calculations hierarchically when reducing the datacollected from the instrument. If an option either has not been selected in theSettings dialog, is not available for the instrument being used, is not applicable tothe type of read being performed, or has not been defined in the Template dialogor the Reduction dialog, SoftMax Pro Software continues with the next listedcalculation.
The following is the general hierarchy of calculations:
1. Apply Well Masking
2. Subtract Plate Background constant
3. Apply PathCheck Technology normalization
4. Subtract Plate Blank
5. Subtract Group Blank (pre-reduction option)
6. Calculate mP or Anisotropy
7. Set first data point to zero
8. Convert OD to %T
9. Apply Reduction Limits
10. Apply Wavelength Combination
11. Apply Kinetic or Spectrum Reduction
12. Subtract Group Blank (post-reduction option)
More information on SoftMax Pro Software calculations can be found in thefollowing topics or references:
For information on Optical Density and %Transmittance calculations, see ABSRead Mode on page 113.
For information on Fluorescence Polarization calculations, see FP Read Mode onpage 116.
For information on pathlength calculations, see PathCheck PathlengthMeasurement Technology on page 148.
For information on kinetic and spectrum reductions, see Kinetic Data ReductionOptions on page 223 and Spectrum Data Reduction Options on page 225.
For information on statistical functions, see the SoftMax Pro Software FormulaReference Guide.
For information on curve fit calculations, see Curve Fit Functions on page 245.
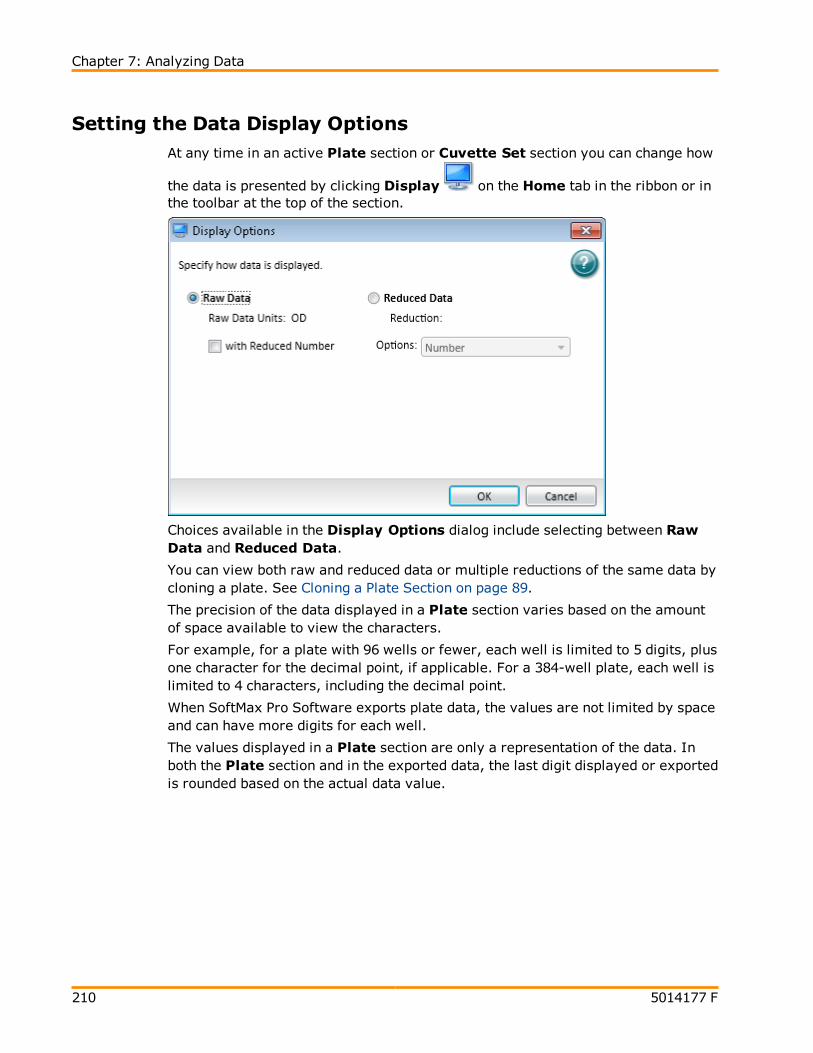
Chapter 7: Analyzing Data
210 5014177 F
Setting the Data Display OptionsAt any time in an active Plate section or Cuvette Set section you can change how
the data is presented by clicking Display on the Home tab in the ribbon or inthe toolbar at the top of the section.
Choices available in the Display Options dialog include selecting between RawData and Reduced Data.
You can view both raw and reduced data or multiple reductions of the same data bycloning a plate. See Cloning a Plate Section on page 89.
The precision of the data displayed in a Plate section varies based on the amountof space available to view the characters.
For example, for a plate with 96 wells or fewer, each well is limited to 5 digits, plusone character for the decimal point, if applicable. For a 384-well plate, each well islimited to 4 characters, including the decimal point.
When SoftMax Pro Software exports plate data, the values are not limited by spaceand can have more digits for each well.
The values displayed in a Plate section are only a representation of the data. Inboth the Plate section and in the exported data, the last digit displayed or exportedis rounded based on the actual data value.

SoftMax Pro Software User Guide
5014177 F 211
Viewing Raw Data
1. Click Display on the Home tab in the ribbon or in the toolbar at the top ofthe section.
2. In the Display Options dialog, click Raw Data.
3. Optionally, click with Reduced Number to include the reduced data numberon the display.
4. Click OK.
Raw Data OptionsSelecting Raw Data displays the default data type for the selected read type:
Endpoint: Raw absorbance, fluorescence, or luminescence values.
Kinetic: The change in raw OD/RFU/RLU values over time, displayed as a plot.
Spectrum: Raw OD/RFU/RLU values for the range of wavelengths, displayedas a plot.
Well Scan: Raw OD/RFU/RLU values as shades of blue to red.
To see a reduced number, click with Reduced Number.
Viewing Reduced Data
1. Click Display on the Home tab in the ribbon or in the toolbar at the top ofthe section.
2. In the Display Options dialog, click Reduced Data.
3. Select an option from the Options list.
4. Click OK.
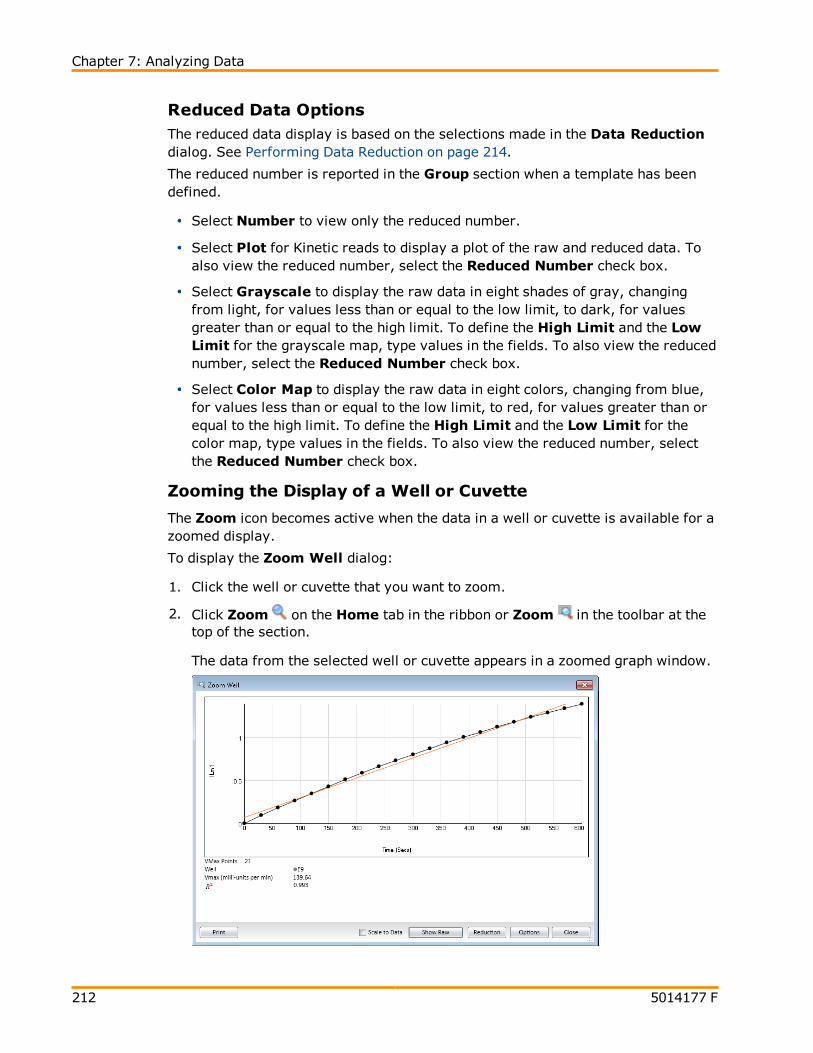
Chapter 7: Analyzing Data
212 5014177 F
Reduced Data OptionsThe reduced data display is based on the selections made in the Data Reductiondialog. See Performing Data Reduction on page 214.
The reduced number is reported in the Group section when a template has beendefined.
Select Number to view only the reduced number.
Select Plot for Kinetic reads to display a plot of the raw and reduced data. Toalso view the reduced number, select the Reduced Number check box.
Select Grayscale to display the raw data in eight shades of gray, changingfrom light, for values less than or equal to the low limit, to dark, for valuesgreater than or equal to the high limit. To define the High Limit and the LowLimit for the grayscale map, type values in the fields. To also view the reducednumber, select the Reduced Number check box.
Select Color Map to display the raw data in eight colors, changing from blue,for values less than or equal to the low limit, to red, for values greater than orequal to the high limit. To define the High Limit and the Low Limit for thecolor map, type values in the fields. To also view the reduced number, selectthe Reduced Number check box.
Zooming the Display of a Well or Cuvette
The Zoom icon becomes active when the data in a well or cuvette is available for azoomed display.
To display the Zoom Well dialog:
1. Click the well or cuvette that you want to zoom.
2. Click Zoom on the Home tab in the ribbon or Zoom in the toolbar at thetop of the section.
The data from the selected well or cuvette appears in a zoomed graph window.

SoftMax Pro Software User Guide
5014177 F 213
3. To print the graph window, click Print.
4. To scale the display to the data, select Scale to Data.
5. To toggle between reduced and raw data, click Show Reduced or Show Raw.
6. To modify the reduction settings, click Reduction. The Data Reduction dialogopens. See Performing Data Reduction on page 214.
7. To modify the zoom well display settings, click Options. The Zoom WellOptions dialog opens.
Graph Type Settings allows you to enable or disable connected points orplotted symbols on the graph.
Characteristics allows you to set Auto Scale parameters and choose theminimum and maximum values for the selected axis. You can also add orremove grid lines from the display.
To save the settings and return to the Zoom Well dialog, click OK. Only thewell graph being viewed is affected by these changes.
8. To close the Zoom Well dialog, click Close.

Chapter 7: Analyzing Data
214 5014177 F
Masking Wells or Cuvettes
The Mask feature hides selected data so that they are not used for calculations andare not reported. Masking is commonly used to suppress outliers from datareduction calculations.
Masking can be used as a “what if?” tool. For example, if you have included a groupblank in a template and want to see the data both with and without the blank,masking the group blanks suppresses the blanking function, while unmasking themenables it again.
To mask wells or cuvettes:
1. In an active Plate section or Cuvette Set section, select a well or cuvette orselect multiple wells or cuvettes.
To select multiple wells in a Plate section, click and drag across the desiredwells.
To select multiple cuvettes in a Cuvette Set section, hold down the Ctrlkey and click the desired wells.
2. Click Mask in Plate Tools or Cuvette Tools on the Home tab in the ribbonor in the toolbar at the top of the section.
You can also right-click a well or cuvette and selectMask from the shortcutmenu.
To unmask masked wells or cuvettes select them and then click Mask.
Performing Data ReductionThe reduction process in SoftMax Pro Software is based on formulas that reducethe raw data to show a single number for each well or cuvette. Further analysis ofthis reduced number is done in Group and Graph sections.
When reducing raw information collected from the instrument, SoftMax ProSoftware performs calculations hierarchically. Only the data reduction calculationsthat apply to the data that is read according to the instruments mode, type, andsettings are performed.
Click the Reduction button on the Home tab or the Reduction shortcut button onthe window header bar to open the Data Reduction dialog.
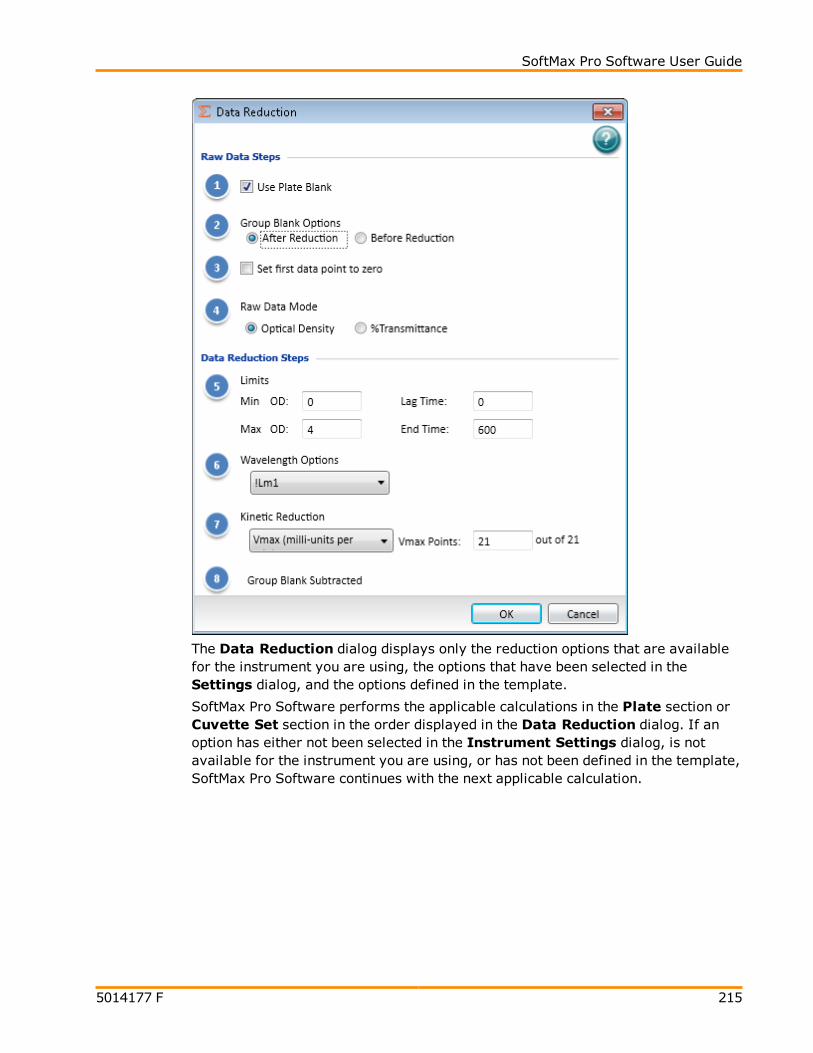
SoftMax Pro Software User Guide
5014177 F 215
The Data Reduction dialog displays only the reduction options that are availablefor the instrument you are using, the options that have been selected in theSettings dialog, and the options defined in the template.
SoftMax Pro Software performs the applicable calculations in the Plate section orCuvette Set section in the order displayed in the Data Reduction dialog. If anoption has either not been selected in the Instrument Settings dialog, is notavailable for the instrument you are using, or has not been defined in the template,SoftMax Pro Software continues with the next applicable calculation.

Chapter 7: Analyzing Data
216 5014177 F
Raw Data StepsRaw data displays are calculated using the following steps that apply to theselected mode, type, and settings:
Apply PathCheck (Absorbance Endpoint only)
PathCheck Pathlength Measurement Technology normalization calculations apply tothe data only when PathCheck has been enabled in the PathCheck settings for anAbsorbance Endpoint read. When PathCheck is enabled, this calculation can bedisabled in the Data Reduction dialog by clearing the Apply Pathcheck checkbox. For more information, see PathCheck Pathlength Measurement Technology onpage 148.
Apply Plate Background OD (Absorbance Endpoint only)
Subtraction of the Plate Background constant applies to the data only whenPathCheck has been enabled in the PathCheck settings for an Absorbance Endpointread. To define the constant, type a value in the field. When PathCheck is enabled,this calculation can be disabled in the Data Reduction dialog by clearing theApply Plate Background OD check box.
SoftMax Pro Software User Guide
5014177 F 217
Use Plate Blank
The Use Plate Blank calculation is available when a plate blank is specified in thetemplate settings for the plate. To enable subtraction of the plate blank value,select the Use Plate Blank check box. For more information about plate blanks,see Blanking on page 169.
Group Blank Options
The Group Blank Options calculation is available when a group blank is specifiedin the template settings for the plate. The subtraction of the group blank value canbe selected as a pre-reduction action or a post-reduction action.
To enable the group blank value subtraction calculation as a pre-reductionaction, click Before Reduction.
To enable the group blank value subtraction calculation as a post-reductionaction, click After Reduction. When After Reduction is selected underGroup Blank Options, the last step in the Data Reduction dialog showsGroup Blank Subtracted.
For more information about group blanks, see Blanking on page 169.
Polarization or Anisotropy (Fluorescence Polarization only)
Fluorescence Polarization mode returns two sets of data: one for fluorescenceintensity parallel (P) to the excitation plane, and the other for fluorescenceintensity perpendicular (S) to the excitation plane. These S and P values are usedto calculate the Polarization (mP) and Anisotropy (r) values in SoftMax ProSoftware. Click the data type to use as the raw data for the reduction.
G Factor
G factor, or grating factor, is used in fluorescence polarization to correctpolarization data for optical artifacts, converting relative mP data to theoretical mPdata. Optical systems, particularly with reflective components, pass light ofdifferent polarization with different efficiency. G factor corrects this instrumentalbias. To define the G Factor, type a value in the field.
Set first data point to zero (Kinetic only)
Select this check box to offset the first data point to (0,) and shift all other dataaccordingly. Clearing this check box can cause some data points that do not fallwithin the reduction limits to disappear.
To see more data and still display absolute values, increase the reduction limits forMin OD, Min RLU, or Min RFU and the Max OD, Max RLU, or Max RFU.

Chapter 7: Analyzing Data
218 5014177 F
Raw Data Display Mode (Absorbance only)
For Absorbance reads, you can choose whether to display absorbance data asOptical Density or %Transmittance.
Optical Density: The amount of light passing through a sample to a detectorrelative to the total amount of light available. Optical Density includesabsorbance of the sample plus light scatter from turbidity.
% Transmittance is the ratio of transmitted light to the incident light (forabsorbance readings).
Click the data type to use as the raw data for the reduction.
Note: Separate mathematical calculations are used for handling OpticalDensity (OD)and %Transmittance (%T) calculations for Pre-read plateblanking, PathCheck Pathlength Measurement Technology, and Reference,because OD calculations are performed on a linear scale, while %Tcalculations are performed on a logarithmic scale. However, SoftMax ProSoftware does not perform other calculations differently for OD and %Tmodes. Because of this, Molecular Devices recommends that %T be usedonly for raw OD, raw OD with Pre-read plate blank subtraction, or raw ODreadings which are normalized by the PathCheck Pathlength MeasurementTechnology. Use caution when using %T on reduced numbers or any readingsthat apply other calculations since the data might not be calculated correctly.

SoftMax Pro Software User Guide
5014177 F 219
Data Reduction StepsData Reduction display includes one or more of the following calculations:
Limits
Apply the specified reduction limits to the reduced data after this step. To specifythe limits, type values in the fields.
Limits define the data that are viewed and included in data reduction. If you alter alimit to show less data, you can always display the excluded data again bychanging the limit.
The display of OD, RFU, or RLU values is relative to the first point measured foreach well.
Negative Kinetic values decrease with time, and limits should be set accordingly(below 0) to view negative Kinetic data.
Min OD, Min RFU, or Min RLU defines the limit for the minimum value toreport. Any values from the reading that are under this limit are not shown andare excluded from data reduction. The default is 0 OD or RFU/RLU. To displaynegative Kinetics, the value should be set below 0 (zero).
Max OD, Max RFU, or Max RLU defines the limit for the minimum value toreport. Any values from the reading that are under this limit are not shown andare excluded from data reduction. The default is 0 OD or RFU/RLU. To displaynegative Kinetics, the value should be set below 0 (zero).
Lag Time in a kinetic read defines the period of very slow growth ofmicroorganisms or the rate of reaction that can precede the rapid or linearphase of reaction.The lag time specifies how many initial data points areexcluded from the calculation of Vmax Rate. Lag time truncates the data usedin the calculation, but does not prevent data from being collected. Kinetic plotsdo not display the data collected prior to the lag time.
End Time in a kinetic read specifies the time at which to stop showing data inthe display and exclude it from data reduction. Any values occurring after thislimit are not reported in the display and are excluded from data reduction. Thedefault setting is the total assay time for the kinetic read.
Start in a spectrum read specifies the limit in nm for the minimum wavelengthsetting to report. Any values from the reading that are under this limit are notshown and are excluded from data reduction.
End in a spectrum read specifies the limit for the maximum wavelength settingto report. Any values from the reading that are above this limit are not shownand are excluded from data reduction.
Chapter 7: Analyzing Data
220 5014177 F
Wavelength Options
Select an available wavelength formula from the list. To use a custom reduction,
select Custom from the list and then, click to open the Formula Editor. SeeData Reduction Formulas on page 221.
Kinetic Reduction
Select a Kinetic reduction mode from the list. To use a custom reduction, select
Custom from the list and then, click to open the Formula Editor. See DataReduction Formulas on page 221.
For more information about kinetic reductions, see Kinetic Data Reduction Optionson page 223.
The number of Vmax Points is determined by the Timing settings.
Spectrum Reduction
Select a Spectrum reduction mode from the list. To use a custom reduction, select
Custom from the list and then, click to open the Formula Editor. See DataReduction Formulas on page 221.
For more information about spectrum reductions, see Spectrum Data ReductionOptions on page 225.
Well Scan Reduction
SelectMaximum, Minimum, Average, or Custom from the list. Averageprovides the average value for all points in the Well Scan. To use a custom
reduction, select Custom from the list and then, click to open the FormulaEditor. See Data Reduction Formulas on page 221.
Group Blank Subtracted
When After Reduction is selected under Group Blank Options, the last step inthe Data Reduction dialog shows Group Blank Subtracted.
After all applicable data reduction options have been set, click OK.
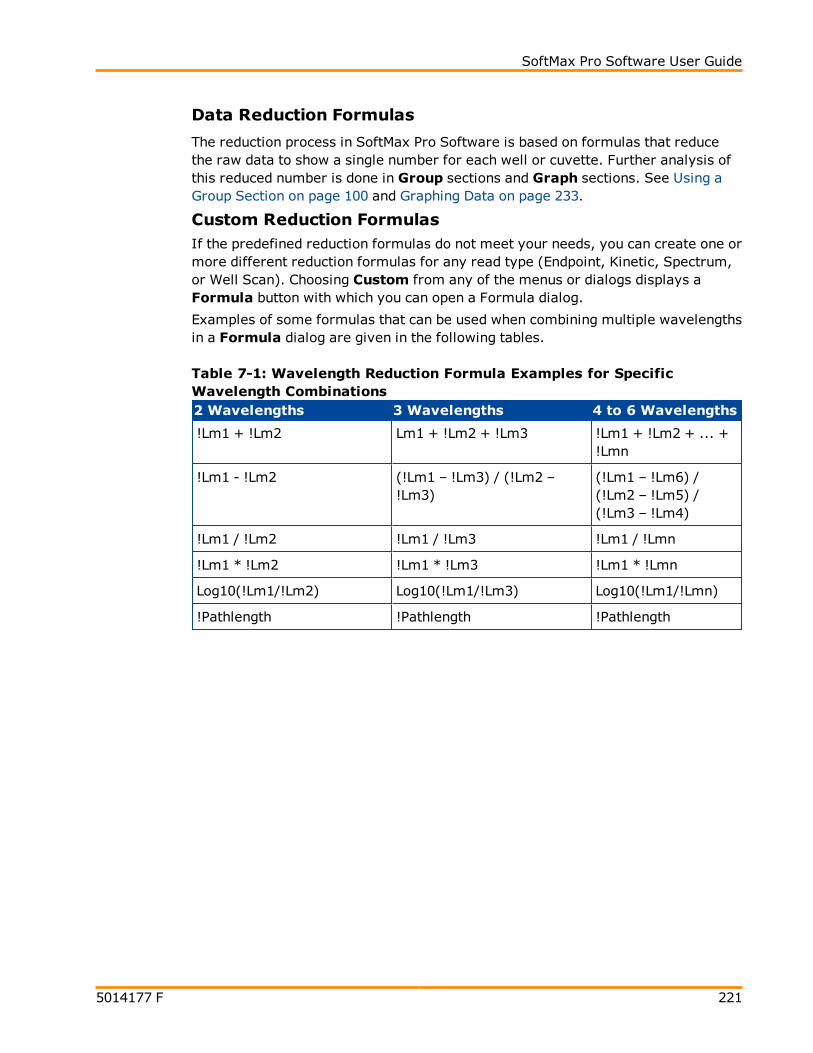
SoftMax Pro Software User Guide
5014177 F 221
Data Reduction Formulas
The reduction process in SoftMax Pro Software is based on formulas that reducethe raw data to show a single number for each well or cuvette. Further analysis ofthis reduced number is done in Group sections and Graph sections. See Using aGroup Section on page 100 and Graphing Data on page 233.
Custom Reduction FormulasIf the predefined reduction formulas do not meet your needs, you can create one ormore different reduction formulas for any read type (Endpoint, Kinetic, Spectrum,or Well Scan). Choosing Custom from any of the menus or dialogs displays aFormula button with which you can open a Formula dialog.
Examples of some formulas that can be used when combining multiple wavelengthsin a Formula dialog are given in the following tables.
2 Wavelengths 3 Wavelengths 4 to 6 Wavelengths
!Lm1 + !Lm2 Lm1 + !Lm2 + !Lm3 !Lm1 + !Lm2 + ... +!Lmn
!Lm1 - !Lm2 (!Lm1 – !Lm3) / (!Lm2 –!Lm3)
(!Lm1 – !Lm6) /(!Lm2 – !Lm5) /(!Lm3 – !Lm4)
!Lm1 / !Lm2 !Lm1 / !Lm3 !Lm1 / !Lmn
!Lm1 * !Lm2 !Lm1 * !Lm3 !Lm1 * !Lmn
Log10(!Lm1/!Lm2) Log10(!Lm1/!Lm3) Log10(!Lm1/!Lmn)
!Pathlength !Pathlength !Pathlength
Table 7-1: Wavelength Reduction Formula Examples for SpecificWavelength Combinations

Chapter 7: Analyzing Data
222 5014177 F
Formula Description
!Lmx / constant For example, Lm1 / 1.44 for quantitating apolyclonal antibody by measuring the absorbanceat A280 with PathCheck Technology on.
Average(!Lm1&!Lm2&!Lm3) Averages together the optical densities for multiplereadings at the same wavelength (for example, ifyou read the well six times at 280 nm).
Min(!Lm1&!Lm2&!Lm3) Reports the minimum OD/RFU/RLU recorded formultiple wavelength readings in each well.
Max(!Lm1&!Lm2&!Lm3) Reports the maximum OD/RFU/RLU recorded formultiple wavelength readings in each well.
If(!Lmz<A,makeerr(118), (if(!Lmx>B, makeerr(117),!Lm1)))
Reports “low” for any well with an OD/RFU/RLUless than A, “high” for any OD/ RFU/RLU greaterthan B, and the OD/ RFU/RLU of any well that liesbetween A and B.
Table 7-2: Wavelength Reduction Formula Examples for all WavelengthCombinations
Custom reduction formulas using mathematical operators or terms can be used toobtain specific types of data. The following table provides some examples of suchformulas for Kinetic and Spectrum readings.
Formula Description
Vmaxcorr(!combinedplot,!Vmaxpoints,!readinterval)
Reports Vmax correlation coefficient for plots in all96 wells.
Vmax(Delta(!combinedplot),!Vmaxpoints,!readinterval)
Reports the Vmax Rate of the delta between eachtime point.
Table 7-3: Kinetic Reduction Formula Examples
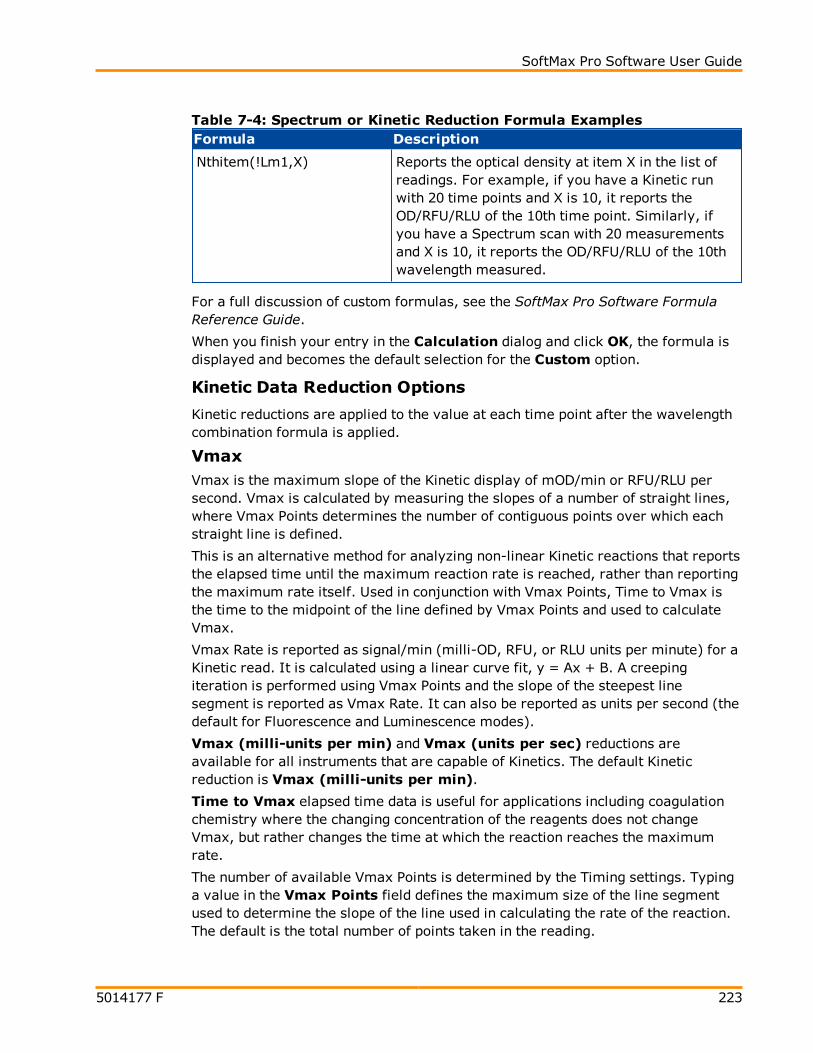
SoftMax Pro Software User Guide
5014177 F 223
Formula Description
Nthitem(!Lm1,X) Reports the optical density at item X in the list ofreadings. For example, if you have a Kinetic runwith 20 time points and X is 10, it reports theOD/RFU/RLU of the 10th time point. Similarly, ifyou have a Spectrum scan with 20 measurementsand X is 10, it reports the OD/RFU/RLU of the 10thwavelength measured.
Table 7-4: Spectrum or Kinetic Reduction Formula Examples
For a full discussion of custom formulas, see the SoftMax Pro Software FormulaReference Guide.
When you finish your entry in the Calculation dialog and click OK, the formula isdisplayed and becomes the default selection for the Custom option.
Kinetic Data Reduction Options
Kinetic reductions are applied to the value at each time point after the wavelengthcombination formula is applied.
VmaxVmax is the maximum slope of the Kinetic display of mOD/min or RFU/RLU persecond. Vmax is calculated by measuring the slopes of a number of straight lines,where Vmax Points determines the number of contiguous points over which eachstraight line is defined.
This is an alternative method for analyzing non-linear Kinetic reactions that reportsthe elapsed time until the maximum reaction rate is reached, rather than reportingthe maximum rate itself. Used in conjunction with Vmax Points, Time to Vmax isthe time to the midpoint of the line defined by Vmax Points and used to calculateVmax.
Vmax Rate is reported as signal/min (milli-OD, RFU, or RLU units per minute) for aKinetic read. It is calculated using a linear curve fit, y = Ax + B. A creepingiteration is performed using Vmax Points and the slope of the steepest linesegment is reported as Vmax Rate. It can also be reported as units per second (thedefault for Fluorescence and Luminescence modes).
Vmax (milli-units per min) and Vmax (units per sec) reductions areavailable for all instruments that are capable of Kinetics. The default Kineticreduction is Vmax (milli-units per min).
Time to Vmax elapsed time data is useful for applications including coagulationchemistry where the changing concentration of the reagents does not changeVmax, but rather changes the time at which the reaction reaches the maximumrate.
The number of available Vmax Points is determined by the Timing settings. Typinga value in the Vmax Points field defines the maximum size of the line segmentused to determine the slope of the line used in calculating the rate of the reaction.The default is the total number of points taken in the reading.

Chapter 7: Analyzing Data
224 5014177 F
The first slope is calculated for a line drawn beginning at the first reading asdefined by Lag Time and ending at a total number of readings equal to the VmaxPoints setting. The second and any subsequent slopes are calculated beginning atthe second time point and ending at a total number of readings equal to . Thesteepest positive or negative slope is reported as Vmax.
If the data plot displays fewer time points (data points) than Vmax Points, all of thetime points are used to determine the slope of the data.
Onset TimeOnset time is a method for analyzing non-linear Kinetic reactions. Onset Timereports the time required for a Kinetic reaction to reach a specified OD or RFU/RLU(onset OD/RFU/RLU).
This elapsed time data is useful for cascade reactions including clot formation(such as, endotoxin testing) and clot lysis applications where the change in reagentconcentration does not affect the maximum optical density change but changes thetime required for the reaction to reach completion.
Time at Minimum
This setting reports the time at the minimum OD, RFU/RLU, or %T that falls withinthe reduction limits.
Time at Maximum
This setting reports the time at the maximum OD, RFU/RLU, or %T that falls withinthe reduction limits.
Time at 1/2 Maximum
This setting reports the time at the half of the maximum OD, RFU/RLU, or %T thatfalls within the reduction limits.
To calculate this reduction, SoftMax Pro Software determines the Kinetic point(within the reduction limits) that has the maximum signal level (OD or %T) anddivides it by 2 to get the 1/2 Maximum value. Then it finds the time value at the 1/2Maximum.
Area Under Curve
This reduction estimates the area under the curve as defined by the data plotswithin the reduction limits. The data plots are treated as a series of trapezoids withvertices at successive data points and at the X-axis coordinates of the data points.The areas defined by each of the trapezoids are then computed and summed.
Slope
The slope reduction option determines the slope of the combined plot (for example,the slope of the line using linear regression after the wavelength combinationreduction). This reduction uses all visible time points in the reduction window.
Slope is the same as Vmax Rate when Vmax Rate is set to the same number ofpoints as the run, but is different if you have modified Vmax Points.
To use a custom reduction, select Custom from the list and then, click to openthe Formula Editor. See Data Reduction Formulas on page 221.

SoftMax Pro Software User Guide
5014177 F 225
Spectrum Data Reduction Options
The Spectrum Reduction formula is applied to the list of numbers in each well(values at each wavelength) after the wavelength combination formula is applied.The default reduction for a Spectrum read is Lambda at Maximum.
MaximumThis reduction reports the maximum absorbance (optical density) or percenttransmittance (%T), RFU, or RLU within the reduction limits.
MinimumThis reduction reports the minimum absorbance (optical density) or percenttransmittance (%T), RFU, or RLU within the reduction limits.
Lambda at MaximumThis reduction reports the wavelength at which maximum absorbance (opticaldensity) or percent transmittance (%T), RFU, or RLU within the reduction limits.
Lambda at MinimumThis reduction reports the wavelength of minimum absorbance (optical density) orpercent transmittance (%T), RFU, or RLU within the reduction limits.
Area Under CurveThis reduction estimates the area under the curve as defined by the data plots,within the reduction limits. The data plots are treated as a series of trapezoids withvertices at successive data points and at the X-axis coordinates of the data points.The areas defined by each of the trapezoids are then computed and summed.
To use a custom reduction, select Custom from the list and then, click to openthe Formula Editor. See Data Reduction Formulas on page 221.

Chapter 7: Analyzing Data
226 5014177 F
Viewing Data in a Three-Dimensional GraphTo view a three-dimensional graphical representation of reduced plate data, view
the Plate section and then click the 3D Graph button in the Plate Tools areaof the Home tab in the ribbon or in the toolbar at the top of the Plate section.
You can rotate a 3D graph vertically and horizontally.
To rotate the 3D graph:
To rotate the 3D graph vertically, drag the vertical scroll bar located to the rightof the 3D graph.
To rotate the 3D graph horizontally, drag the horizontal scroll bar located belowthe 3D graph.
To start or stop a continuous animated horizontal rotation of the 3D graph,double-click the 3D graph.
You can resize the 3D Graph dialog by dragging a side or a corner of the dialog.
For customization and export options, right-click anywhere on the 3D graph.
You can quickly choose a customization option from the menu, or clickCustomization Dialog to change several options at the same time. SeeCustomizing a Three-Dimensional Graph on page 227.

SoftMax Pro Software User Guide
5014177 F 227
Other options in the 3D graph dialog include:
Plotting Method allows you to view the graphed data inWire Frame,Surface, Surface with Shading views.
Maximize expands the 3D graph to a full screen view. To return to the normalview, click the title bar or press Esc.
Export Dialog opens the Export Control dialog allowing you to export thegraphical image to your choice of formats, or export the data to a text format.See Exporting a Three-Dimensional Graph on page 230.
To close the 3D Graph dialog, click Close.
Customizing a Three-Dimensional Graph
The customization dialog has five tabs that contain customization options for thecurrent 3D graph.
Click a tab to work with the options under that tab.
For the General tab, see General Customization Options for a 3D graph onpage 228.
For the More tab, see More Customization Options for a 3D graph on page 228.
For the Font tab, see Font Customization Options for a 3D graph on page 229.
For the Color tab, see Color Customization Options for a 3D graph on page 229.
For the Style tab, see Style Customization Options for a 3D graph on page 230.
After making changes to the options in this dialog, you can click Apply to view howthe changes affect the 3D graph.
To close the Customization dialog and save any unapplied changes, click OK.
Click Export to close the Customization dialog and open the Export Controldialog allowing you to export the graphical image to your choice of formats, or toexport the data to a text format. See Exporting a Three-Dimensional Graph on page230.

Chapter 7: Analyzing Data
228 5014177 F
Click Maximize to close the Customization dialog and expand the 3D graph to afull screen view. To return to the normal view, click the title bar or press Esc.
General Customization Options for a 3D graph
Click the General tab to customize the 3D graph with the following options:
Main Title: Type the text you want for the title of the 3D graph.
Sub Title: Type the text you want below the title of the 3D graph.
Show Annotations: To show annotations, select this check box. This option isnot available if there are no annotations available.
Border Style: To change the border around the outside of the graphical image,click No Border, Line, Shadow, or 3D Inset.
Viewing Style: To change the display of the image background, click Color,Monochrome, or Monochrome + Symbols.
Font Size: To change the font size for all the text, click Large, Med, or Small.
Grid Lines: To view both the Y and X grid lines, click Both. To view only thegrid lines for the Y-axis, click Y. To view only the grid lines for the X-axis, clickX. To remove the grid lines, click None.
Rotation Animation: To start a continuous animated horizontal rotation of the3D graph, select this check box.
Show Bounding Box: To display a wire-frame box around the 3D graph underspecific conditions, clickWhile Rotating, Always, or Never.
More Customization Options for a 3D graph
Click the More tab to customize the 3D graph with the following options:
Rotation Detail: To change the display style when the 3D graph rotates, clickWireframe to display only the outlines of the 3D graph, Plotting Method todisplay the data plot in full 3D while displaying only outlines for the grid, or Fullto display the entire 3D graph in full 3D during rotation.
Rotation Increment: To control the speed and direction of the animatedrotation, select an increment from the list. Values closer to zero rotate slower,while values farther from zero rotate faster. To rotate counter-clockwise,select a negative value.
Shading Style: To change the display of the shading, clickWhite or Color.This option has no effect on the display if there is no shading in the 3D graph.
Plotting Method: To change the display of the data plot, clickWire Frame,Surface, or Surface with Shading.
SoftMax Pro Software User Guide
5014177 F 229
Font Customization Options for a 3D graph
Click the Font tab to customize the text in the 3D graph:
Main Title includes only the title of the 3D graph.
Sub-Title includes only the text directly below the title of the 3D graph, ifapplicable.
Subset/Point/Axis Labels includes all of the other text in the 3D graph.
For each text area, you can select the font and select a check box to add bold,italic, and underline styles to the text.
A sample appears at the bottom to help you with your selections.
Color Customization Options for a 3D graph
Click the Color tab to customize the colors used in the 3D graph.
Changes in the Color tab are automatically applied to the 3D graph as they areselected.
Click an option from the Graph Attributes group and then click a color to apply tothe selected attribute:
Desk Foreground includes the text of the title and subtitle of the 3D graph.
Desk Background includes the area behind the title and subtitle of the 3Dgraph.
Shadow Color includes the border shadowing when Shadow is select for theBorder Style in the General tab.
Graph Foreground includes all the text other than the title and subtitle, andthe border around the 3D graph.
Graph Background includes the area within the border and behind the 3Dgraph.
X and Z Axis Plane includes the floor of the 3D graph.
Y Axis Plane includes the walls of the 3D graph.
Quick Styles group allows you to select from pre-defined styles for the 3D graph:
Select the Bitmap/Gradient Styles check box to add texture to the 3D graph.
Click the Inset, Shadow, Line, and No Border options in the Light, Medium,and Dark columns to view how the selected styles affect the 3D graph.

Chapter 7: Analyzing Data
230 5014177 F
Style Customization Options for a 3D graph
Click the Style tab to customize colors used in the 3D graph.
Changes in the Style tab are automatically applied to the 3D graph as they areselected.
The customizable items in the list on the left are dependent on the some of theselections in the other tabs, and on the type of data.
Click an item in the list, and then click a color to apply to it.
Exporting a Three-Dimensional Graph
Before exporting an image of a 3D graph, make sure that you have rotated the 3Dgraph to the view that you want and that you have set your customization options.See Customizing a Three-Dimensional Graph on page 227.
For export options, right-click anywhere on the 3D graph and then click ExportDialog to open the Export Control dialog.
Click the graphic format from the Export area. If you select Text/Data, only thedata is exported. For more information about exporting the data, see ExportingData from a Three-Dimensional Graph on page 232.
In the Export Destination area, select how you want to export the image or data:
Click ClipBoard to export the image or data to the Windows clipboard so thatyou can paste it into another program like a word processor or a spreadsheet.
Click File to save the image or data in a file on your computer or network. ClickBrowse to choose the destination and give the file a name.
Click Printer to export the image or data directly to a printer. After you clickPrint, you can select the printer and printer options.

SoftMax Pro Software User Guide
5014177 F 231
The options in the Export Size area are dependent on the selected Export formatand the Export Destination:
Full Page is available for exporting to a Printer.
No Specific Size is available for the WMF format exported to the clipboard ora file. Click this option to let the export operation select the appropriate size forthe image.
Pixels is available for BMP, JPG, and PNG formats exported to the clipboard ora file.
Millimeters, Inches, and Points are available for EMF and WMF formatsexported to the clipboard or a file, and for all graphic formats exported to aprinter.
If you have selected measurement units, type the width and height for theexported image.
For all graphic formats exported to the clipboard or a file, select the DPI (dotsper inch) for the exported image.
For all graphic formats exported to the clipboard or a file, You can select theLarge Font check box to increase the size of the text in the exported image.
When you have finished selecting your export options, click Export or Print.
If you are exporting the data as text, then the Export dialog opens with additionaloptions for formatting the exported data. See Exporting Data from a Three-Dimensional Graph on page 232.

Chapter 7: Analyzing Data
232 5014177 F
Exporting Data from a Three-Dimensional Graph
To export just the data from a 3D graph:
1. Right-click anywhere on the 3D graph and then click Export Dialog.
2. In the Export Control dialog, click Text/Data.
3. In the Export Destination area, select how you want to export the data:
Click ClipBoard to export the data to the Windows clipboard so that youcan paste it into another program like a word processor or a spreadsheet.
Click File to save the data in a file on your computer or network. ClickBrowse to choose the destination and give the file a name.
4. Click Export.
5. In the Export dialog, in the Select Subsets and Points area, choose toexport All Data or Selected Data.
If you choose Selected Data, you can export columns of data by clicking thenumbers that correspond to the column numbers on the microplate, or you canexport rows of data by clicking the letters that correspond to the row letters onthe microplate. If you want to export a single well or a group of wells, click thecolumn numbers and row letters that correspond to the well or group of wellson the microplate. To select more than one column or row in each list, holddown the Shift or Ctrl key as you click.
6. In the Export What area choose to export just the Data or the Data andLabels.
7. If you have multiple values available in your data, choose an option from theData to Export area.
8. In the Export Style area, click List or Table.
When you choose to export a List, define the delimiter for the data in eachline by clicking Tab or Comma. The type of delimiter you choose mustmatch the requirements of the program where you want to use the exporteddata.
When you choose to export a Table, you can click Subsets/Points to placethe data from the microplate column numbers into the rows of the table andthe data from the microplate row letter into the columns of the table, orclick Point/Subsets to place the data from the microplate row letters intothe rows of the table and the data from the microplate column numbers intothe columns of the table.

SoftMax Pro Software User Guide
5014177 F 233
10. In the Numeric Precision area, click Current Precision to export the datausing the rounding defined in the 3D graph, or click Maximum Precision toexport the rounding available in the data file.
11. Click Export to export the data to the format defined in Step 3.
Note: If you exported the data to the Windows clipboard, you need toimmediately open the program where you want to use the data and paste thedata into that program.
Graphing Data
Click New Graph in Sections on the Home tab in the ribbon to open the PlotEditor dialog where you can create a graph from the collected data.
After a graph has been created, new plots can be added and deleted, the axes canbe customized, and the size of the graph can be changed. The grid lines for thegraph can be enabled or disabled. The default setting has grid lines enabled.
To view a zoomed well plot of the data in a well, double-click the well. SeeZooming the Display of a Well or Cuvette on page 212.
To view a three-dimensional graphical display of the data, see Viewing Data in aThree-Dimensional Graph on page 226.
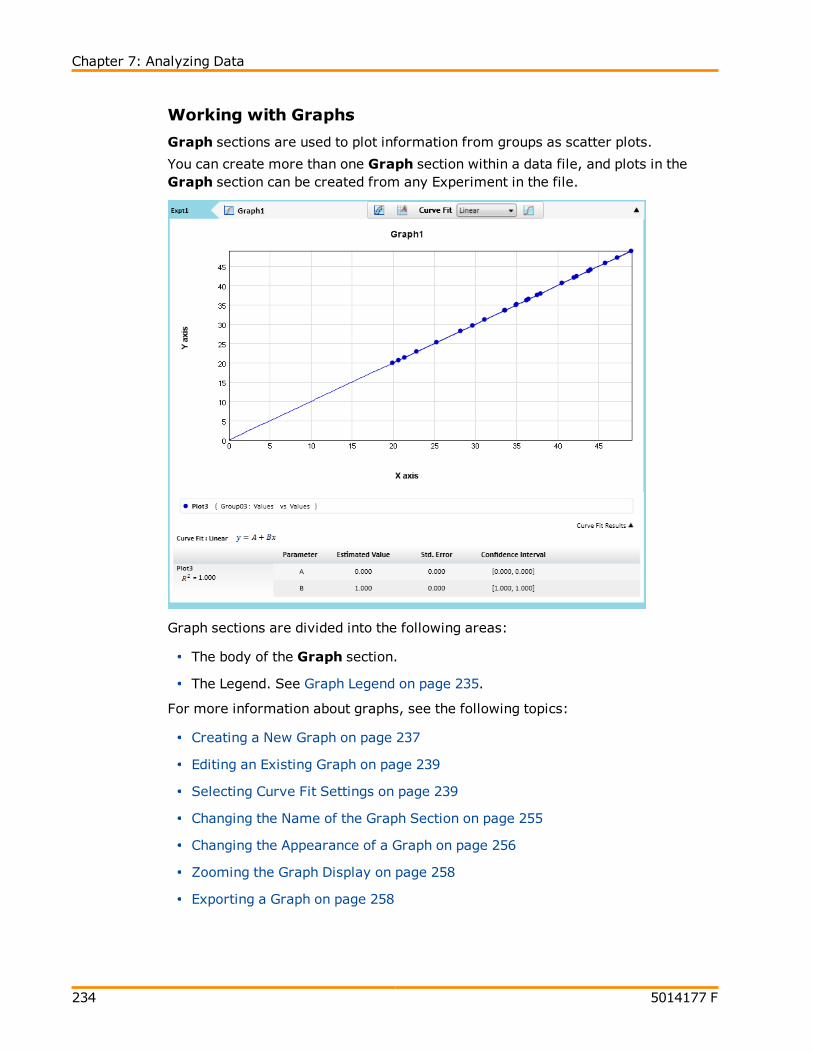
Chapter 7: Analyzing Data
234 5014177 F
Working with Graphs
Graph sections are used to plot information from groups as scatter plots.
You can create more than one Graph section within a data file, and plots in theGraph section can be created from any Experiment in the file.
Graph sections are divided into the following areas:
The body of the Graph section.
The Legend. See Graph Legend on page 235.
For more information about graphs, see the following topics:
Creating a New Graph on page 237
Editing an Existing Graph on page 239
Selecting Curve Fit Settings on page 239
Changing the Name of the Graph Section on page 255
Changing the Appearance of a Graph on page 256
Zooming the Graph Display on page 258
Exporting a Graph on page 258
SoftMax Pro Software User Guide
5014177 F 235
Graph Legend
The graph legend contains information about the contents of the graph. To view orhide the graph legend, click Curve Fit Results on the right below the graph.
Independent Fits
The formulas for the selected curve fits
For each plot:
R2 value
EC50 value (4-Parameter and 5-Parameter only)
For each parameter:
Estimated Value
Standard Error (Std. Error) of the estimate
The confidence interval for a given confidence level is a range such that thetrue value lies within the range with the desired probability. The confidencelevel is usually specified as a percentage. The greater the confidence level,the wider the resulting confidence interval. Calculation of the confidenceinterval is based on sampling statistics. For example, suppose that manydata sets are obtained, and the confidence interval is calculated for eachdata set according to a chosen statistic. The percentage of those confidenceintervals containing the true value is the specified confidence level. Selectthe Confidence Interval Method in the Statistics tab of the Curve Fit Settingsdialog. See Curve Fit Statistics Tab on page 252.
Independence: Parameter Independence is one way to examine thesuitability of a given curve fit for the data set. It is a measure of the extentto which the best value of one parameter depends on the best values of theother parameters, and is a number between 0 and 1, with 1 being the ideal.In the graph fit legend, parameter independence has been translated intobars, where 10 bars indicate a high degree of independence; because onlyvery small values indicate a problem, a nonlinear transformation is used forthis translation. If one or more parameters have few bars or no bars, thecurve fit might not be appropriate for the data set.
For example, if the data set is sigmoidal with clear lower and upperasymptotes, 4-parameter fits should be appropriate with many bars for allparameters. However, if one or both of the asymptotes is missing, the A orthe D parameter will have few bars, indicating that reliable values cannotbe deduced from the data set.

Chapter 7: Analyzing Data
236 5014177 F
Global Fits
The formula for the selected curve fit.
For each plot:
Estimated Relative Potency (Estimated Rel. Pot.) –
Standard Error (Std. Error) of the estimate
Confidence Interval of the estimate (see explanation under IndependentFits on page 235)
Independence (see explanation under Independent Fits on page 235)
EC50 value (4-Parameter and 5-Parameter only)
R2 value
For each parameter:
Estimated Value
Standard Error (Std. Error) of the estimate
Confidence Interval of the estimate
Independence
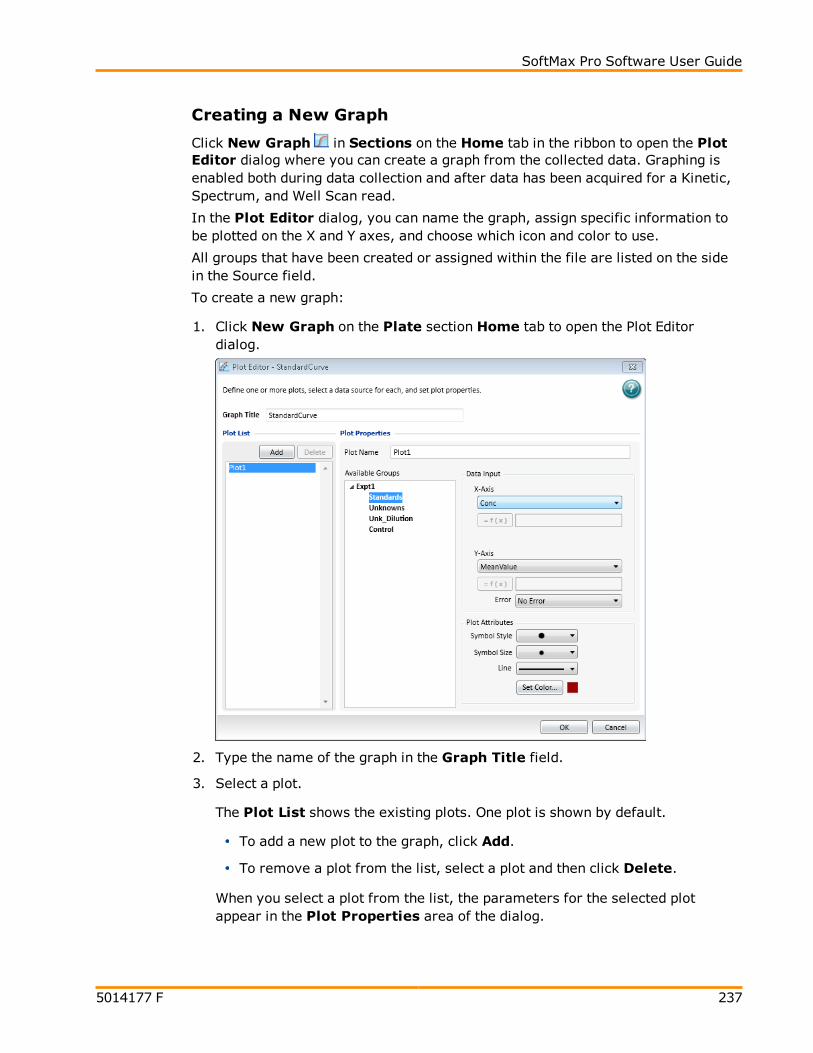
SoftMax Pro Software User Guide
5014177 F 237
Creating a New Graph
Click New Graph in Sections on the Home tab in the ribbon to open the PlotEditor dialog where you can create a graph from the collected data. Graphing isenabled both during data collection and after data has been acquired for a Kinetic,Spectrum, and Well Scan read.
In the Plot Editor dialog, you can name the graph, assign specific information tobe plotted on the X and Y axes, and choose which icon and color to use.
All groups that have been created or assigned within the file are listed on the sidein the Source field.
To create a new graph:
1. Click New Graph on the Plate section Home tab to open the Plot Editordialog.
2. Type the name of the graph in the Graph Title field.
3. Select a plot.
The Plot List shows the existing plots. One plot is shown by default.
To add a new plot to the graph, click Add.
To remove a plot from the list, select a plot and then click Delete.
When you select a plot from the list, the parameters for the selected plotappear in the Plot Properties area of the dialog.

Chapter 7: Analyzing Data
238 5014177 F
4. Optionally, type the name of the plot in the Plot Name field. The plot namechanges in the plots list.
5. Select a group from the Available Groups list. Data from the selected groupwill be plotted in the graph.
Note: Groups are defined using the template editor. If no groups appearin the list you must go to the Template Editor dialog and define one ormore groups. See Defining a Group on page 164.
6. In the Data Input area, select column types from those listed to assign to theplot in the X-Axis and Y-Axis. The list contains only the group column namesavailable for the group that is selected in Available Groups. When you select theCustom type, the Formula Editor opens for you to define the custom formula.See Using the Formula Editor.
7. Select a column or No Error in the Error field to define the display of errorbars.
Note:When data is displayed as a scatter graph, you can choose todisplay error bars for the plot of the data for the X-axis and Y-axis. Errorbars are lines that extend beyond a plotted value in either or bothdirections and graphically represent some amount of error in plotteddata.
8. Use the Plot Attributes area to change the graph's appearance:
Select the Symbol Style to define the symbol to be used to mark each datapoint.
Select the Symbol Size to define the size of the selected symbol.
Select the Line Style to define the line to be used between data points.
Click Set Color and select the color from the color picker to define thecolor of the symbol and line in the plot.
9. Click OK to apply the settings and close the New Graph dialog.
A new Graph section is added to the experiment with the resulting data plotsdisplayed as specified.

SoftMax Pro Software User Guide
5014177 F 239
Editing an Existing Graph
You can change a graph by editing the appearance of the graph or by using the PlotEditor dialog to change the plots and the data or plot attributes.
To edit the appearance of the graph, see Changing the Appearance of a Graph onpage 256.
To use the Plot Editor dialog to change the plots and the data or plot attributes:
1. With a Graph section active in the workspace, click Plot Editor in theGraph Tools section on the Home tab in the ribbon or in the toolbar at the topof the Graph section.
2. Make the required changes to the graph definitions. See Creating a New Graphon page 237.
3. Click OK to apply the settings and close the Plot Editor dialog.
Note: You can add as many plots as you need during one editing session. Toadd additional plots click Add. To delete a plot from the graph select the plotand click Delete.
Selecting Curve Fit Settings
When you first create a graph of the data, it does not have a fit associated with it.You can fit any plot to one curve fit selection. These selections are shown in theCurve Fit list in toolbar at the top of the Graph section. All plots on a graph musthave the same type of fit.
Generally, a standard curve refers to the curve fitted to the plot of concentrationversus the mean value for the Standard group.
After you have selected a fit type, SoftMax Pro Software determines the parametervalues that best fit the data. The function with these parameters is drawn on thegraph.
Note: Ideally, the type of fit used is determined by the underlying chemistryof the assay and can be set before data is read.
When a fit is performed, the parameter values are tabulated in the legend at thebottom of the graph. The parameter table also contains information regarding theuncertainty of the parameters, specifically standard errors and (optionally)confidence intervals.
A good discussion of curve fitting appears in “Data Analysis and Quality Control ofAssays: A Practical Primer” by R. P. Channing Rogers in Practical Immuno Assay,edited by Wilfrid R. Butt (published by Marcel Dekker, Inc., New York, 1984).
Chapter 7: Analyzing Data
240 5014177 F
Judging a Good Curve FitVisual inspection is always useful for assessing a curve fit. The legend at thebottom of the graph contains information summarizing the numerical output of thefit. This includes the coefficient of determination R2, a traditional measure ofgoodness of fit. R2 is the fraction of the variance of the y-values explained by thefit, and is 1 for a perfect fit. However, this should not be used to assess thestatistical significance of the fit, or to compare the suitability of different curve fitfunctions. For such purposes, statistics such as chi-squared or Fisher-F can beused. These statistics can be obtained from the formula system.
Even for a good fit, as judged by eye or R2, some parameters might have highuncertainty.
To define a curve fit for the plots in a graph, click Curve Fit in the GraphTools section on the Home tab in the ribbon or in the toolbar at the top of theGraph section.
The Curve Fit Settings dialog has three tabs available for defining the curve fit:
Curve Fit, see Curve Fit Tab on page 241.
Weighting, see Curve Fit Weighting Tab on page 251.
Statistics, see Curve Fit Statistics Tab on page 252.
After you finish defining the curve fit, click OK.

SoftMax Pro Software User Guide
5014177 F 241
Curve Fit Tab
When you first create a graph of the data, it does not have a fit associated with it.You can fit any plot to one of the pre-defined curve-fit functions.
These selections are shown in the Curve Fit list in the Graph section header bar.
You can also select a plot from the graph and a curve fit to apply to that plot fromthe list on the Curve Fit tab in the Curve Fit Settings dialog.
All plots on a graph can have the same type of fit or each plot can have a differentfit applied individually. The Curve Fit tab of the Curve Fit Settings dialogprovides the ability to set a different fit to individual plots.
To define a curve fit for the plots in a graph, click Curve Fit in the GraphTools section on the Home tab in the ribbon or in the toolbar at the top of theGraph section. You can choose to fit each plot independently or to combine allplots into one data set for a global fit.
To fit each plot independently, see Independent Fits on page 243.
To combine all plots into one data set, see Global Fit (PLA) on page 244.
Generally, a standard curve refers to the curve fitted to the plot of concentrationversus mean value for the Standard group.
For information about the available curve fit functions, see Curve Fit Functions onpage 245.
Chapter 7: Analyzing Data
242 5014177 F
After you have selected a fit type, SoftMax Pro Software determines the parametervalues that best fit the data. The function with these parameters is drawn on thegraph.
Note: Ideally, the type of fit used should be determined by the underlyingchemistry of the assay and could be set before data is read.
Note: A good discussion of curve fitting appears in “Data Analysis andQuality Control of Assays: A Practical Primer” by R. P. Channing Rogers inPractical Immuno Assay, edited by Wilfrid R. Butt (published by MarcelDekker, Inc., New York, 1984).
For linear fits, parameters can be fixed at specified values.
For nonlinear fits, an initial value can be specified for each parameter. This canbe designated as an initial estimate (the seed value)`, or as the fixed value.
You can specify whether a Confidence Interval should be calculated for eachparameter.
The confidence interval for a given confidence level is a range such that the truevalue lies within the range with the desired probability. The confidence level isusually specified as a percentage. The greater the confidence level, the wider theresulting confidence interval. Calculation of the confidence interval is based onsampling statistics. For example, suppose that many data sets are obtained, andthe confidence interval is calculated for each data set according to a chosenstatistic. The percentage of those confidence intervals containing the true value isthe specified confidence level.

SoftMax Pro Software User Guide
5014177 F 243
Independent Fits
When plots in a graph are to be fit with curve fit functions independently:
1. Open a Graph section with multiple plots in the workspace.
2. Click Curve Fit in the Graph Tools section on the Home tab in theribbon or in the toolbar at the top of the Graph section.
3. In the Curve Fit Settings dialog in the Curve Fit tab, select IndependentFits.
4. Select a plot from the Fit list.
5. Select which curve fit function to apply to the plot from theWith list.
6. Continue selecting plots and apply curve fit functions as needed.
7. If applicable, click theWeighting tab. See Curve Fit Weighting Tab on page251.
8. If applicable, click the Statistics tab. See Curve Fit Statistics Tab on page 252.
9. When all curve fit options have been set, click OK.
Note: For independent fits (and global to a limited extent), you have theability to fix values. Curve fit parameter values can either be fixed, or"manually seeded" to start the curve fit algorithm search.

Chapter 7: Analyzing Data
244 5014177 F
Global Fit (PLA)
When all the plots in a graph are to have the same curve fit functions applied:
1. Open a Graph section with multiple plots in the workspace.
2. Click Curve Fit in the Graph Tools section on the Home tab in theribbon or in the toolbar at the top of the Graph section.
3. In the Curve Fit Settings dialog, select Global Fit (PLA).
The available global fit is parallel line analysis. See Parallel Line Analysis onpage 245.
6. Select the plot from the Fit list.
7. Select any option except point-to-point or cubic spline from theWith list.
8. If applicable, select Relative Potency Confidence Interval.
9. Select a plot for the Reference Plot list.
10. If applicable, click theWeighting tab. See Curve Fit Weighting Tab on page251.
11. If applicable, click the Statistics tab. See Curve Fit Statistics Tab on page 252.
12. When all curve fit options have been set, click OK.

SoftMax Pro Software User Guide
5014177 F 245
Parallel Line AnalysisParallel line analysis (PLA) is available for all Global fits except point-to-point andcubic spline fits.
Determining parallelism between a standard and test compound, and subsequentestimation of relative potency, are fundamentals of bioassay use inbiopharmaceutical development and testing. For linear data, parallelism can beevaluated by examining the similarity between the slopes of straight lines.
Bioassay data and immunoassays in particular, have been demonstrated to fit wellwith a sigmoidal shape defined by a 4-parameter or 5-parameter curve fit. Thebasic question of whether a curve with a specified shape can fit both standard andtest data sets when shifted along the X-axis can be addressed following a methoddetailed by Gottschalk and Dunn (Journal of Biopharmaceutical Statistics, 15:437-463, 2005).
The parameters are those for the fit function, plus a relative potency factor foreach data set relative to one designated as a reference. Beneath the graph aredisplayed their values, standard errors, and (optionally) confidence intervals.
Function operators are included with SoftMax Pro Software that can be used tosummarize this information in a Notes section. For additional details, see theSoftMax Pro Formula Reference Guide.
Curve Fit Functions
When you first create a graph of the data, it does not have a fit associated with it.You can fit any plot to one of the following curve-fit functions.
These selections are shown in the Curve Fit list in the toolbar at the top of theGraph section.
Generally, a standard curve refers to the curve fitted to the plot of concentrationversus mean value for the Standard group.
After you have selected a fit type, SoftMax Pro Software determines the parametervalues that best fit the data. The function with these parameters is drawn on thegraph. Ideally, the type of fit used is determined by the underlying chemistry of theassay and can be set before data is read.
When a fit is performed, the parameter values are displayed in the legend at thebottom of the graph. The correlation coefficient describes how well a change in xvalues correlates with a change in the y values. The R2 value should be used onlyfor linear curve fits.
A good discussion of curve fitting appears in “Data Analysis and Quality Control ofAssays: A Practical Primer” by R. P. Channing Rogers in Practical Immuno Assay,edited by Wilfrid R. Butt (published by Marcel Dekker, Inc., New York, 1984).

Chapter 7: Analyzing Data
246 5014177 F
No Fit
Select No Fit to apply no curve fit, and to plot the scatter of the data points.
Linear
Select a Linear curve fit to fit the best straight line to the data.
The equation for this fit has the form of:
y = A + Bx
where A is the y-intercept of the line and B is the slope.
Use a linear fit when the values appear to lie on or are scattered around a straightline.
For the best results, you should always exceed the minimum number of standardsrequired for a curve fit. The minimum number of standards requiredmathematically for a linear curve fit algorithm is 2.
Semi-Log
Select a Semi-Log curve fit to fit the best straight line to a set of data for log(x)plotted against y. The resulting curve displayed will be a straight line with the X-axis drawn in logarithmic scale.
The equation for a semi-log fit is:
y = A + B * Log(x)
where A is the y-intercept of the line at x=1 and B is the slope. Log in this equationis the common or base-10 logarithm.
For the best results, you should always exceed the minimum number of standardsrequired for a curve fit. The minimum number of standards requiredmathematically for a semi-log curve fit algorithm is 2.
Log-Log
Select a Log-Log curve fit to fit the best straight line to the set of data that consistsof the logarithm of the readings on the Y-axis (the response) and the logarithm ofthe dose on the X-axis. The resulting display is a straight line with both axes drawnin logarithmic scale. The equation for the log-log fit is:
Log(y) = A + B * Log(x)
where A is the log(y)-intercept of the line for log(x) = 0, and B is the slope. Log inthis equation is the common or base-10 logarithm.
For the best results, you should always exceed the minimum number of standardsrequired for a curve fit. The minimum number of standards requiredmathematically for a log-log curve fit algorithm is 2.
SoftMax Pro Software User Guide
5014177 F 247
Quadratic
Select a Quadratic curve fit to fit the best parabola to the data. The parabola is acurved line based on the equation:
y = A + Bx + Cx2
where A is the intercept, B is the slope of the curve at the intercept, and C is themeasure of the curvature of the parabola.
The quadratic fit is most appropriate when the standard curve has a tendency tocurve up or down.
For the best results, you should always exceed the minimum number of standardsrequired for a curve fit. The minimum number of standards requiredmathematically for a quadratic curve fit algorithm is 3.
Cubic
Select a Cubic curve fit to fit the best third-order polynomial to the data, based onthe equation:
y = A + Bx + Cx2 + Dx3
For the best results, you should always exceed the minimum number of standardsrequired for a curve fit. The minimum number of standards requiredmathematically for a cubic curve fit algorithm is 4.
4-Parameter, 5-Parameter, and Log-Logit
If the standard curve has a sigmoidal shape when plotted on the semi-log axes, itcan be appropriate to use either a 4-Parameter, 5-Parameter, or Log-Logitcurve fit.
Both the 4-parameter and log-logit fits are based on the equation:
y= D +A D
+1xC( )B
where D is the Y-value corresponding to the asymptote at high values of the X-axis,and A is the Y-value corresponding to the asymptote at low values of the X-axis.The coefficient C is the X-value corresponding to the midpoint between A and D,commonly called the IC50 or EC50. The coefficient B describes how rapidly thecurve makes its transition from the asymptotes in the center of the curve, and iscommonly known as the slope factor. A large value of B describes a sharpertransition. Generally, B has a magnitude of about 1 for inhibitory experiments and–1 for excitatory experiments.
Chapter 7: Analyzing Data
248 5014177 F
The difference between the 4-parameter fit and the log-logit fit are in the way thecoefficients A and D are calculated. For the log-logit method, the standard valuesfor the lowest and highest values of x are used. The corresponding y values areassigned to A and D, respectively. Based on these fixed values for A and D, thealgorithm then computes values for B and C. This technique works well if there arestandard points along the upper and lower asymptotes. If this is not true, the log-logit fit should be avoided in favor of the 4-parameter logistic.
The 5-parameter logistic equation has an extra exponential term G that issometimes described as an asymmetry factor:
y= D +A D
+{ }1xC( )B G
As with the 4-parameter logistic equation, D is the high asymptote, A is the lowasymptote and B is the slope factor. Unlike the 4-parameter logistic equation,however, C is not the IC50 value. The IC50 value needs to be calculatedseparately. This is described in the SoftMax Pro Software Formula ReferenceGuide.
Use the 5-parameter logistic equation instead of the 4-parameter logistic equationwhen you need to fit to a non-symmetrical sigmoidal shape. The non-symmetry istypically seen in the rate of change of the slope of the curve as it approaches theasymptote. With 4-parameter fits, the rate of change of the slope is the same atthe lower asymptote as at the upper asymptote. With 5-parameter fits, the upperand lower portions of the curve can have very different shapes.
For the best results, you should always exceed the minimum number of standardsrequired for a curve fit. The minimum number of standards requiredmathematically for a 4-parameter curve fit algorithm or a log-logit curve fitalgorithm is 4. For a 5-parameter curve fit algorithm minimum is 5.
The fits for these logistic curves are based on the assumption that the curve has ahigh and a low asymptote, and a certain steepness for the linear portion around theinflection point between the asymptotes. An insufficient number of points definingthe inflection point and the asymptotes results in an inappropriate fit. For bestresults, make sure that the logistic fit is appropriate for your assay and that theentire range of the assay is represented in your standards.
If your standards do not clearly define both a high and low asymptote, the cubicspline curve fit might be more appropriate for your assay. See Cubic Spline onpage 249.
The minimization method for the 4-parameter and 5-parameter equations is basedon the Levenberg-Marquardt Method. Discussion of these methods can be found inThe Art of Scientific Computing by William H. Press, Brian P. Flannery, Saul ATeukolski, and William T. Vetterling, published by Cambridge University Press,New York, 1988.

SoftMax Pro Software User Guide
5014177 F 249
Cubic Spline
Select a Cubic Spline curve fit to generate a piece-wise fit to a cubic equationbetween each pair of adjacent data points. The equations are computed with therequirement that the first and second derivatives of the curve are continuous at thedata points, with the additional constraints that the second derivatives are zero atthe Endpoints.
As this is not a least-squares fit, parameters are not shown with the graph andthere are no available statistics.
For the best results, you should always exceed the minimum number of standardsrequired for a curve fit. The minimum number of standards requiredmathematically for a cubic spline curve fit algorithm is 4.
Exponential
The exponential function used to generate the Exponential curve fit is:
y = A + B * (1 - e-x/C)
In previous versions of SoftMax Pro Software, it was possible to select a linearizedversion of this fit. This option is not available in SoftMax Pro Software 6.
For the best results, you should always exceed the minimum number of standardsrequired for a curve fit. The minimum number of standards requiredmathematically for an exponential curve fit algorithm is 3.
Point-to-Point
A Point-to-Point curve fit uses a linear equation to fit each pair of data points.This curve fit is composed of multiple linear pieces joining the points. The linesegment defined by each pair is used to interpolate data between those points.
As with a Cubic Spline curve fit, this is not a least-squares fit, so no parameter isshown and statistics are not available.
For the best results, you should always exceed the minimum number of standardsrequired for a curve fit. The minimum number of standards requiredmathematically for a point-to-point curve fit algorithm is 2.
Rectangular Hyperbola
A Rectangular Hyperbola curve fit generates a hyperbola for which theasymptotes are perpendicular, also called an equilateral hyperbola or righthyperbola. This occurs when the semi-major and semi-minor axes are equal.
The function used to generate the Rectangular Hyperbola curve fit is:
y =Ax
x + B
This fit is applicable to both the Michaelis-Menten model for enzyme kinetics andthe one-site binding model.

Chapter 7: Analyzing Data
250 5014177 F
2-Parameter Exponential
The function used to generate the 2-Parameter Exponential curve fit is:
y = A * eBx
This fit would generally be used for a simple exponential decay.
Bi-Exponential
The function used to generate the Bi-Exponential curve fit is:
y = AeBx + CeDx + G
This fit would generally be used for a rate process with two exponential phases.
Bi-Rectangular Hyperbola
The function used to generate the Bi-Rectangular Hyperbola curve fit is:
y =Ax
x + B
Cx
x + D+
This fit is applicable to equilibrium binding of a ligand to two binding sites withdifferent affinities, and to two enzymes catalyzing a chemical reaction withdifferent Michaelis constants.
Two-Site Competition
The function used to generate the Two-Site Competition curve fit is:
y = D + (A - D) +
1 +xC( )
B
( )1 - B
1 +xG( )
This fit is applicable to competition studies involving two receptor binding sites.
Gaussian
The function used to generate the Gaussian curve fit is:
y = A * e + D
x - B
C- ( )
2
_

SoftMax Pro Software User Guide
5014177 F 251
Curve Fit Weighting Tab
For each plot, specify whether the data should be weighted and, if so, the desiredweighting formula, which must evaluate to an array of numbers.
Least-squares fitting is based on the assumption that errors are normallydistributed. If the variance of each point in the fit is known, or can be estimated bysome means, its inverse should be specified as the weight for the point. If thevariances are not known, but are believed to be non-uniform across the data, thatis, a known function of y, then a weighting function should be used to reflect thisinformation. If a formula for the weights is not provided, then all points have equalweight.
The weighting feature allows independent weighting of individual plots within aGraph section.
To apply weighting to a plot:
1. On the graph, select Settings.
2. In the Curve Fit Settings dialog, click theWeighting tab.
3. Select a plot from theWeighting list.
4. Select Apply Weighting.
5. Click the Formula button.
6. In the Formula field, type the formula to be applied as the weighting.
7. Click OK.
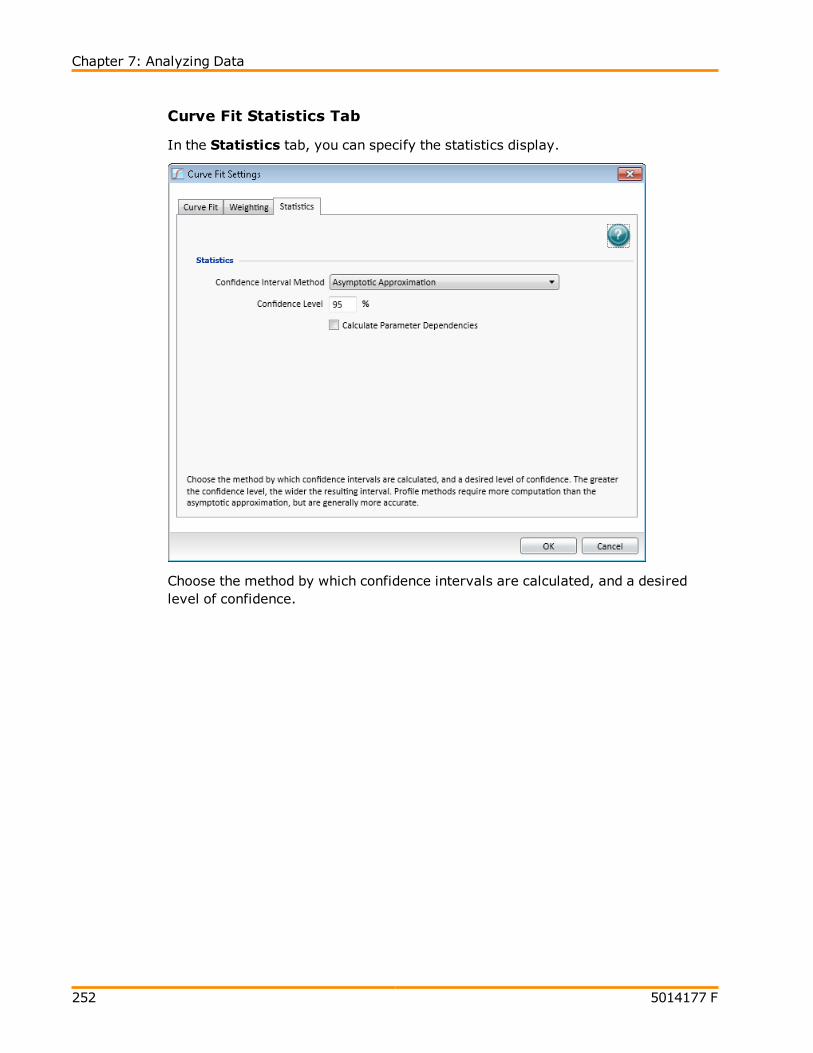
Chapter 7: Analyzing Data
252 5014177 F
Curve Fit Statistics Tab
In the Statistics tab, you can specify the statistics display.
Choose the method by which confidence intervals are calculated, and a desiredlevel of confidence.

SoftMax Pro Software User Guide
5014177 F 253
Confidence Interval MethodThe confidence interval for a given confidence level is a range such that the truevalue lies within the range with the desired probability. The confidence level isusually specified as a percentage. The greater the confidence level, the wider theresulting confidence interval. Calculation of the confidence interval is based onsampling statistics. For example, suppose that many data sets are obtained, andthe confidence interval is calculated for each data set according to a chosenstatistic. The percentage of those confidence intervals containing the true value isthe specified confidence level.
To specify the method used to establish the confidence interval, select a confidenceinterval method from the list.
Confidence IntervalMethod
Description
Asymptotic Approximation Calculates Wald confidence interval, which issimply related to the standard error.
Profile Method (Fdistribution)
Based on model comparison with F-statistic.
Profile Method (Chi-Squareddistribution)
Based on model comparison with chi-squared-statistic.
Profile Method (tdistribution)
Based on T-profile function.
Table 7-5: Confidence Interval Method
Note: Profile methods require more computation than the asymptoticapproximation, but are generally more accurate.

Chapter 7: Analyzing Data
254 5014177 F
Confidence LevelHow likely the interval is to contain the parameter is determined by theConfidence Level. Increasing the desired confidence level usually widens theconfidence interval.
Calculate Parameter DependenciesTo calculate dependencies between parameters, select Calculate ParameterDependencies.
With this option selected, the graphical representation in the graph legendrepresents the parameter independence of the curve fit. See Graph Legend on page235.
Parameter Independence is one way to examine the suitability of a given curve fitfor the data set. It is a measure of the extent to which the best value of oneparameter depends on the best values of the other parameters, and is a numberbetween 0 and 1, with 1 being the ideal. In the graph fit legend, parameterindependence has been translated into bars, where 10 bars indicate a high degreeof independence; because only very small values indicate a problem, a nonlineartransformation is used for this translation. If one or more parameters have fewbars or no bars, the curve fit might not be appropriate for the data set.
For example, if the data set is sigmoidal with clear lower and upper asymptotes, 4-parameter fits should be appropriate with many bars for all parameters. However,if one or both of the asymptotes is missing, the A or the D parameter will have fewbars, indicating that reliable values cannot be deduced from the data set.
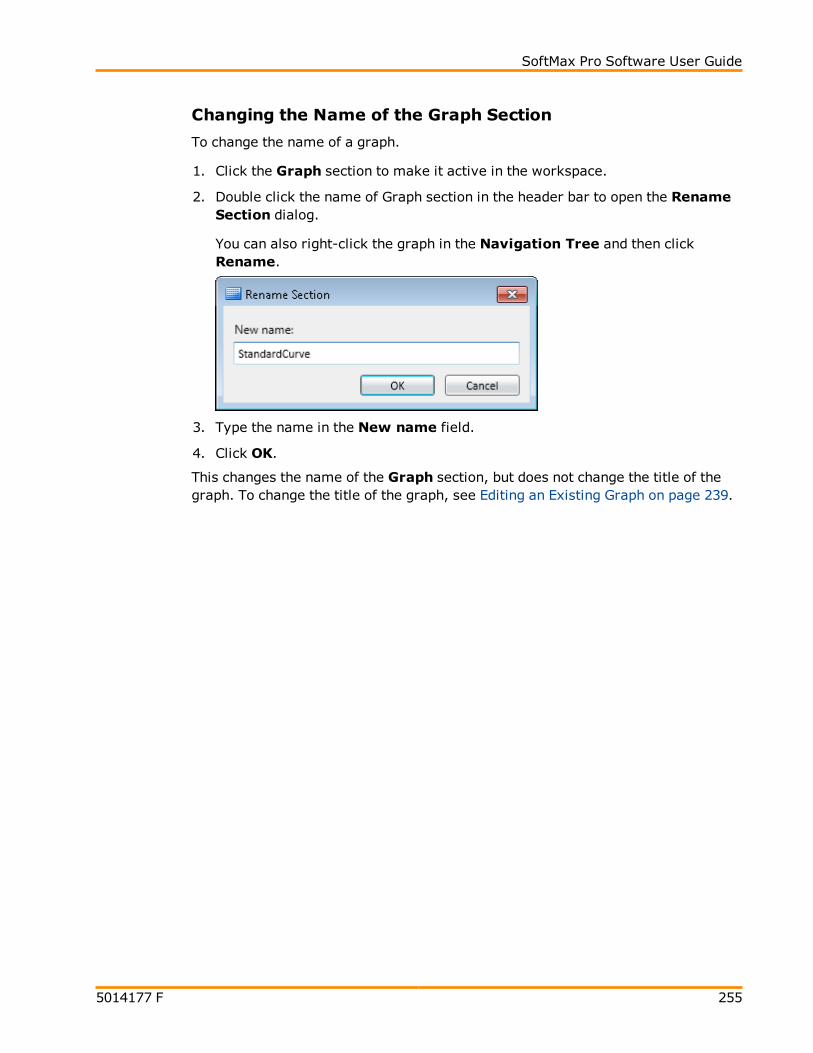
SoftMax Pro Software User Guide
5014177 F 255
Changing the Name of the Graph Section
To change the name of a graph.
1. Click the Graph section to make it active in the workspace.
2. Double click the name of Graph section in the header bar to open the RenameSection dialog.
You can also right-click the graph in the Navigation Tree and then clickRename.
3. Type the name in the New name field.
4. Click OK.
This changes the name of the Graph section, but does not change the title of thegraph. To change the title of the graph, see Editing an Existing Graph on page 239.
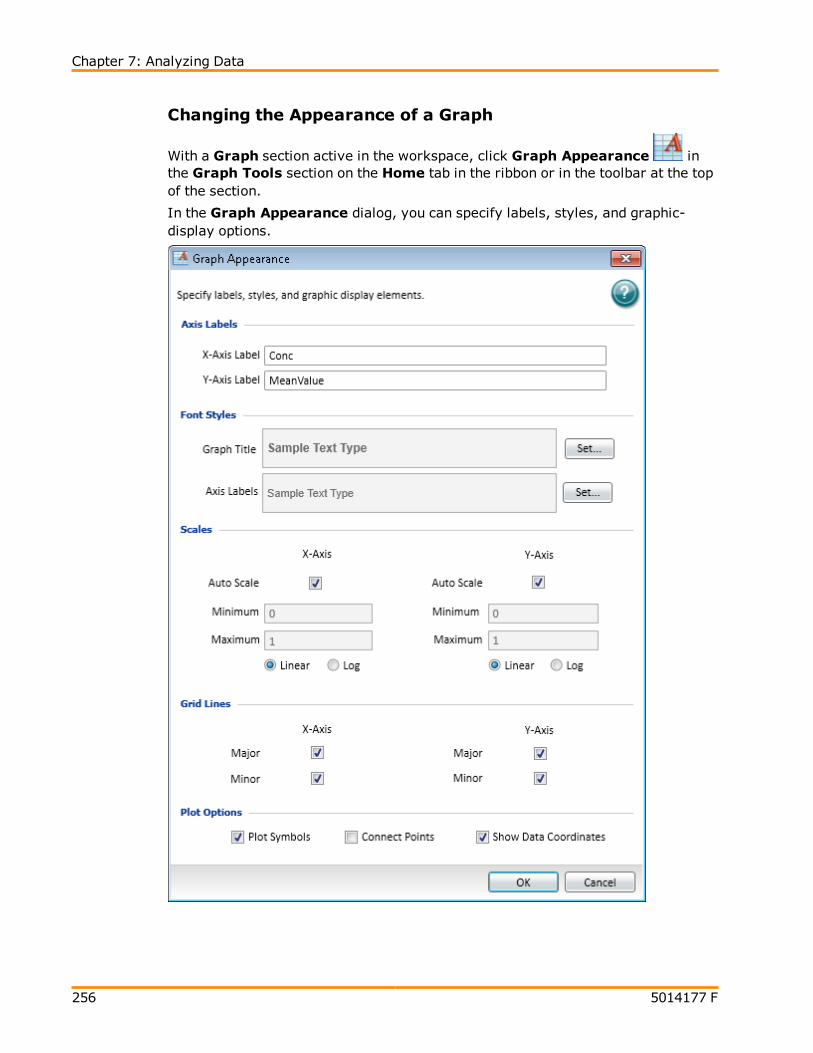
Chapter 7: Analyzing Data
256 5014177 F
Changing the Appearance of a Graph
With a Graph section active in the workspace, click Graph Appearance inthe Graph Tools section on the Home tab in the ribbon or in the toolbar at the topof the section.
In the Graph Appearance dialog, you can specify labels, styles, and graphic-display options.

SoftMax Pro Software User Guide
5014177 F 257
Axis LabelsDefine labels for the X-Axis and Y-Axis by typing the text of the labels in the fields.These labels are displayed in the font specified in the Font Styles area.
Font StylesFont Styles provides separate control of the fonts used for the Graph Title and AxisLabels. Click Set to open the Font Style dialog.
After you have finished defining the font style, click OK. The defined font styleappears in the Sample Text Type example text.
ScalesTo automatically scale one or both axes, select the Auto Scale check box for theaxis.
Alternatively, you can define Minimum andMaximum scaling values.
You can also select either a Linear or a Log display of each axis. Log is the defaultselection.
Grid LinesYou can choose to display the major and minor grid lines for the X-Axis and the Y-Axis individually. To display a grid line, select the related check box.
Plot OptionsIn the Plot Options area you can select the following for display on a plot:
Select Plot Symbols to display the defined symbol for each data point.
Select Connect Points to display a line connecting each of the data points.
Show Data Coordinates to display the coordinates for each data point whenyou use your mouse to hover the pointer over the data point.
To define the size and style of the symbol and the color of the symbol and the linein the Plot Editor dialog. See Creating a New Graph on page 237.

Chapter 7: Analyzing Data
258 5014177 F
Zooming the Graph Display
To zoom in on a section of a graph, use your mouse to draw a rectangle over thesection. After you release the mouse button, the display zooms into the selectedregion.
To return to the default view, double-click the graph body.
Exporting a Graph
To export an image of a graph to a .png file:
1. Click the Graph section to make it active in the workspace.
2. Make sure that the graph appears the way you want, including whether or notthe graph legend is displayed. See Graph Legend on page 235.
3. Click Export Graph in the Graph Tools section on the Home tab in theribbon.
4. In the Save As dialog, browse to the file location where you want to save the.png file.
5. In the File name field, type a name for the file.
6. Click Save.
An image of the active Graph section is saved as a .png file.

5014177 F 259
Chapter 8: Maintaining and Calibrating anInstrument
Instrument maintenance is detailed in the user guide for the instrument. Pleaserefer to the user guide that came with your instrument for instructions.
Information on configuration, maintenance, and calibration tasks that can beperformed using the SoftMax Pro Software can be found in the following topics:
Calibrating the Reader on page 259
Configuring the Filters for Emax and Vmax ELISA Microplate Readers on page260
Using the Instrument Information Dialog on page 260
Viewing Instrument Software Support on page 268
Calibrating the ReaderTo calibrate the reader:
1. Click Calibration on the Operations tab in the ribbon.
The Calibration dialog opens.
2. To calibrate a plate, select Plate and click Calibrate Now.
3. To calibrate a cuvette, select Cuvette and click Calibrate Now.
4. When the calibration indicator shows that the calibration is complete, clickClose.
The calibration values determined using this operation are stored in the firmwareof the instrument.
Note: If the Calibration button is not active in the Operations tab, theneither the instrument is not connected to the computer or the connectedinstrument does not support the calibration process.
Chapter 8: Maintaining and Calibrating an Instrument
260 5014177 F
Configuring the Filters for Emax and Vmax ELISA MicroplateReaders
The Emax and Vmax ELISA Microplate Readers have configurable filters. If youchange the order of the filters, or add or remove filters, you need to use the FilterConfiguration dialog to define the positions of the filters. If the filter settings inthe Filter Configuration dialog are incorrect, the reader will generate incorrectdata. For information about changing the filters, see the user guide for the Emaxand Vmax ELISA Microplate Readers.
To define the filter positions:
1. Click Filters on the Operations tab.
2. In the Filter Configuration dialog, type the wavelength values in the correctpositions for each installed filter.
You can define up to six filters. The allowed wavelength range is 400 nm to750 nm.
3. After all the installed filters have been defined, click OK.
The defined filters are available for selection in the Settings dialog. See Creatingan Absorbance Mode Protocol on page 174.
Using the Instrument Information DialogTo view the Instrument Information dialog, go to the Operations tab in theribbon and click Info.
The Instrument Information dialog lists the PIC firmware version, the instrumentfirmware version, the instrument serial number, and the automation devicenumber for the selected SpectraMax Paradigm Multi-Mode Detection Platform,FilterMax F3 Multi-Mode Microplate Reader, or FilterMax F5 Multi-ModeMicroplate Reader. To update the PIC or instrument firmware, click thecorresponding Update button. For more information about updating firmware,contact Molecular Devices support.
The lower portion of the dialog shows instrument-specific information for either theSpectraMax Paradigm Multi-Mode Detection Platform or FilterMax F3 and F5Multi-Mode Microplate Readers.

SoftMax Pro Software User Guide
5014177 F 261
SpectraMax Paradigm Multi-Mode Detection PlatformInstrument InformationThe software detects the installed detection cartridges and displays them in theInstrument Information dialog. The name and serial number for the detectioncartridge appears under its position in the drawer.
To open or close a detection cartridge drawer, click to the left of thedetection cartridge definitions for that drawer.
You can lock or unlock the cartridge drawers when you are using the StakMaxMicroplate Handling System:
When the stacker is installed, the detection cartridge drawers must be locked.To lock the cartridge drawers, click Lock Drawers for StakMax.
When you need to open a detection cartridge drawer, remove the stacker fromthe detection platform and then unlock the drawers. To unlock the cartridgedrawers, click Unlock Drawers for StakMax.
For more information, see the user guide for the StakMax Microplate HandlingSystem.
To lock all the drawers closed, click Lock Instrument for Shipment and followthe on-screen instructions. For information about preparing an instrument forshipment, contact Molecular Devices support.
For information about unlocking the drawers, see Unlocking the SpectraMaxParadigm Multi-Mode Detection Platform Drawers on page 13.
To align the transfer position of the StakMax Microplate Handling System with theplate drawer of the SpectraMax Paradigm Multi-Mode Detection Platform, clickStakMax Alignment Wizard. For information about using the StakMax AlignmentWizard, see the user guide for the StakMax Microplate Handling System.
FilterMax F3 and F5 Multi-Mode Microplate ReadersInstrument InformationThe software detects the installed excitation and emission filter slides and displaystheir saved configurations in the Instrument Information dialog. Theidentification number for the slide appears on the right. Each filter has its definedwavelength, bandwidth, and read mode displayed under its position in the slide.
To eject or retract a filter slide, click to the left of the slide definition.
To edit the filters in a slide, or to define additional slides, click Edit SlideConfiguration. See Configuring Filter Slides on page 262.
Chapter 8: Maintaining and Calibrating an Instrument
262 5014177 F
Configuring Filter Slides
The FilterMax F3 and F5 Multi-Mode Microplate Readers have configurable filterslides. If you add or remove filter slides, or change the order of the filters in aslide, you need to use the Filter Settings dialog to define the filters in the slide. Ifthe defined filter settings in the Instrument Information dialog are incorrect,the reader will generate incorrect data. For information about changing the filterslides, see the user guide for the FilterMax F3 and F5 Multi-Mode MicroplateReaders.
To view the Filter Settings dialog, go to the Operations tab in the ribbon andclick Info. Then, in the Instrument Information dialog, click Edit SlideConfiguration.
The filters used to perform measurements are mounted on two types ofinterchangeable slides. One slide is reserved for excitation filters used inabsorbance and fluorescence measurements; the other is used for emission filtersused in fluorescence and some luminescence measurements. Each slide can holdup to six filters.
Note: Excitation and emission filter slides are different sizes to prevent themfrom being installed in the incorrect position.
When exchanging slides, an identification code built into the slide allows theSoftMax Pro Software to recognize the new slide and filter configuration. When aslide with a new configuration is inserted, or the filters on a slide change, the slidemust be configured in the Filter Settings dialog. Up to 31 excitation filter slidesand 31 emission filter slides can be stored in the software at one time.
For quantitation protocols, a genomic filter slide, which contains narrowbandwidth 260 nm and 280 nm filters must be installed and configured.
For protocols that use PathCheck Pathlength Measurement Technology, a filterslide designed for PathCheck technology must be used.
To work with a filter slide, click Excitation or Emission to display a list of theselected type of filter slides. To add, remove, export, or import filter slides, click abutton on the left side of the dialog.
Click Add Slide to add a new filter slide to the list. See Adding a Filter Slide onpage 263.
Click Remove Slide to delete the selected filter slide. See Removing a FilterSlide on page 264.
Click Export selected Slide to export the filter definitions for the selectedfilter slide. See Exporting a Filter Slide on page 264.
Click Import Slides to import a filter slide definition file that defines one ormore filter slides. See Importing Filter Slides on page 265.
Click Load Slides to replace all the current filter slide definitions with theimported definitions. See Replacing the Filter Slide Definitions on page 266.
SoftMax Pro Software User Guide
5014177 F 263
Click Export Slides to export all the defined filter slides. See Exporting theFilter Slide Definitions on page 267.
Note: Molecular Devices recommends that you do not reconfigure standardfilter slides.
Adding a Filter Slide
The filters used to perform measurements are mounted on two types ofinterchangeable slides. One slide is reserved for excitation filters used inabsorbance and fluorescence measurements; the other is used for emission filtersused in fluorescence and some luminescence measurements. Each slide can holdup to six filters.
To add a filter slide and configure the filters:
1. Go to the Operations tab in the ribbon and click Info.
2. In the Instrument Information dialog, click Edit Slide Configuration.
3. In the Filter Settings dialog, click Excitation or Emission to display a list ofthe selected type of filter slides.
4. Click Add Slide to add a new slide to the list.
5. The Filter Slide Properties pane displays information about the selectedslide.
6. In the Slide ID field, type the identification number printed on the slide.
7. In the list of filter slides, click the + to the left of the filter slide name to displaythe list of filters installed on the slide.
8. Click a filter in the list to display the Filter Properties for the selected filter.
9. In theWavelength field, type the wavelength of the filter.
10. In the Technique(s) field, select the read mode for which the filter applies.The filter can be used only for measurements of the selected read mode. Forthe FilterMax F5 instrument only, you can select Polarization for filterpositions that have a polarization filter installed.
After a read mode is selected, the Installed field displays Yes.
If no read mode is selected, the Installed field displays No, and the filterposition cannot be used for measurements.
Note: The Installed and Position fields cannot be edited.
11. In the Bandwidth field, type the bandwidth of the filter.
12. In the Order# field, type the manufacturer's part number for the filter for yourreference.

Chapter 8: Maintaining and Calibrating an Instrument
264 5014177 F
13. Continue configuring the rest of filters on the slide.
14. After the filters on the slide have been properly configured, click OK.
Note: Molecular Devices recommends that you do not reconfigure standardfilter slides.
Removing a Filter Slide
If a filter slide is no longer used with an instrument, it can be removed from thelist.
CAUTION! After you remove a filter slide from the list, it cannot berecovered. If you think you might want to use this filter slide definition again,export the slide definition before removing it from the list. See Exporting aFilter Slide on page 264.
To remove a filter slide from the list:
1. Go to the Operations tab in the ribbon and click Info.
2. In the Instrument Information dialog, click Edit Slide Configuration.
3. In the Filter Settings dialog, click Excitation or Emission to display a list ofthe selected type of filter slides.
4. In the slide list, click the slide that you want to remove.
5. Click Remove Slide to remove slide from the list.
6. Click OK.
Note: Molecular Devices recommends that you do not reconfigure standardfilter slides.
Exporting a Filter Slide
Exported slide definitions are saved in XML files that can be imported again later orimported into the software on another computer.
Using the Export selected Slide feature exports the definition for a single filterslide. To export all the current filter slide definitions, see Exporting the Filter SlideDefinitions on page 267.
To export a filter slide in the list:
1. Go to the Operations tab in the ribbon and click Info.
2. In the Instrument Information dialog, click Edit Slide Configuration.
3. In the Filter Settings dialog, click Excitation or Emission to display a list ofthe selected type of filter slides.
4. In the slide list, click the slide that you want to export.
SoftMax Pro Software User Guide
5014177 F 265
5. Click Export selected Slide.
6. In the Save As dialog, navigate to the folder where you want to save theexported XML file and type a name for the file in the File name field.
The default location for filter slide definitions is:C:\ProgramData\Molecular Devices\SMP621\MultiMode\DetectionSoftware\Filters
7. Click Save.
8. In the Filter Settings dialog, click OK.
Note: Molecular Devices recommends that you do not reconfigure standardfilter slides.
Importing Filter Slides
Filter slide definitions can be imported from XML files that were previouslyexported or provided by Molecular Devices. Slide definition files can containdefinitions of one or more filter slides.
Each filter slide definition must have a unique Slide ID. If the Slide ID of a filterslide that you want to import already exists in the list, rename the Slide ID orremove the slide from the list before importing.
To import filter slide definitions into the list:
1. Go to the Operations tab in the ribbon and click Info.
2. In the Instrument Information dialog, click Edit Slide Configuration.
3. In the Filter Settings dialog, click Excitation or Emission to display a list ofthe selected type of filter slides.
4. Click Import Slides.
5. In the Open dialog, navigate to the folder where XML file is saved and selectthe file.
The default location for filter slide definitions is:C:\ProgramData\Molecular Devices\SMP621\MultiMode\DetectionSoftware\Filters
6. Click Open.
7. In the Filter Settings dialog, click OK.
Note: Molecular Devices recommends that you do not reconfigure standardfilter slides.

Chapter 8: Maintaining and Calibrating an Instrument
266 5014177 F
Replacing the Filter Slide Definitions
Filter slide definitions can be imported from XML files that were previouslyexported or provided by Molecular Devices. Slide definition files can containdefinitions of one or more filter slides for both excitation and emission filters.
CAUTION!When you use the Load Slides feature, all the current definitionsare deleted, and are replaced by the imported definitions for both excitationand emission filters. If you think you might want to use any of the currentfilter slide definitions again, export the slide definitions before replacingthem in the list. See Exporting a Filter Slide on page 264 or Exporting theFilter Slide Definitions on page 267.
To replace the current filter slide definitions:
1. Go to the Operations tab in the ribbon and click Info.
2. In the Instrument Information dialog, click Edit Slide Configuration.
3. In the Filter Settings dialog, click Load Slides.
4. In the message that appears, click Yes.
5. In the Open dialog, navigate to the folder where the XML file is saved andselect the file.
The default location for filter slide definitions is:C:\ProgramData\Molecular Devices\SMP62\MultiMode\Detection Software\Filte-rs
6. Click Open.
7. In the Filter Settings dialog, click OK.
Note: Molecular Devices recommends that you do not reconfigure standardfilter slides.
SoftMax Pro Software User Guide
5014177 F 267
Exporting the Filter Slide Definitions
Exported filter slide definitions are saved in XML files that can be imported againlater or imported into the software on another computer.
Using the Export Slides feature exports all the filter slide definitions in both theexcitation and emission lists. If you want to export a single filter slide definition,see Exporting a Filter Slide on page 264.
To export all the filter slide definitions in the lists:
1. Go to the Operations tab in the ribbon and click Info.
2. In the Instrument Information dialog, click Edit Slide Configuration.
3. In the Filter Settings dialog, click Export Slides.
4. In the Save As dialog, navigate to the folder where you want to save theexported XML file and type a name for the file in the File name field.
The default location for filter slide definitions is:C:\Program Data\Molecular Devices\SMP621\MultiMode\DetectionSoftware\Filters
5. Click Save.
6. In the Filter Settings dialog, click OK.
Note: Molecular Devices recommends that you do not reconfigure standardfilter slides.

Chapter 8: Maintaining and Calibrating an Instrument
268 5014177 F
Viewing Instrument Software SupportEach of the supported instruments has related "plug-in" support that defines theinteraction between the instrument and the SoftMax Pro Software interface. Youcan view a list of the of these plug-ins for troubleshooting purposes. Generally, youwould view this list after contacting Molecular Devices technical support.
Click the Information button on the lower-left of the Instrument Connectiondialog to open a list of the plug-ins currently installed with the SoftMax ProSoftware.
For a list of the instruments that are supported by this version of the SoftMax ProSoftware, see Supported Instruments on page 119.

5014177 F 269
Chapter 9: Using SoftMax Pro GxP SoftwareFeatures
Molecular Devices provides a fully integrated hardware and software solution foradherence to Good Manufacturing Practices (GMP), Good Laboratory Practices(GLP), and many other regulatory compliance requirements including21 CFR Part 11. SoftMax® Pro GxP Microplate Data Compliance Software extendsSoftMax Pro Software into regulated laboratories working under GMP, GLP, and21 CFR Part 11 guidelines for secure electronic records. SoftMax Pro GxP Softwareprovides a method for electronically signing data files, and also automaticallymaintains a document-based audit trail for electronic records. This audit trailpreserves user actions and modifications for review even after microplate data iscollected and analyzed.
This integrated solution consists of the following components:
A Molecular Devices microplate reader.
SoftMax Pro GxP Software for data collection and analysis.
GxP Admin Software for user management in SoftMax Pro GxP Software.
MDC File Server (optional) for TCP/IP-based file serving of the User Accountfiles.
The SoftMax Pro GxP Software connects to and controls the Molecular Devicesmicroplate reader, and analyzes all collected data.
Use the GxP Admin Software to set up User Accounts that can be linked to theSoftMax Pro GxP Software through a Network File Server or the optional MDC FileServer. See Setting Up User Accounts for SoftMax Pro GxP Software on page 270.
The SoftMax Pro GxP Software is installed on individual computers that are usedfor data collection or data analysis. Each user account must be linked to a UserAccounts file before users can log onto the SoftMax Pro GxP Software and use thesoftware to collect and analyze microplate data.

Chapter 9: Using SoftMax Pro GxP Software Features
270 5014177 F
Setting Up User Accounts for SoftMax Pro GxP SoftwareUse GxP Admin Software to create and maintain User Account (.edb) files. SoftMaxPro GxP Software uses these User Account files to regulate user access to thefeatures of SoftMax Pro GxP Software and to provide traceability and accountabilityin electronic records. The User Account file records all authorized users and theirassociated information, including the following:
User names, user logon IDs, and passwords.
Assigned user permissions to SoftMax Pro GxP Software features.
Global settings pertaining to all listed users, such as password aging, non-network use, guest access, and so on.
Audit histories of all administrator actions GxP Admin, such as user creation,modification, and so on.
If set by the administrator, SoftMax Pro GxP Software users do not requirecontinual access to a User Accounts (.edb) file in order to use the SoftMax Pro GxPSoftware for data collection and analysis when no network connection is available,such as during a corporate network failure or using SoftMax Pro GxP Softwarewhile traveling.
SoftMax Pro GxP Software users can be connected to a User Account file in one oftwo ways:
Network File Server (File Path connection) where the User Account file isplaced on a secure, shared network file server, and the system browser is usedto link each SoftMax Pro GxP Software installation directly to the defined UserAccount file.
MDC File Server (TCP/IP Server connection) where the User Account file isplaced on a secure network location and each SoftMax Pro GxP Softwareinstallation is linked indirectly to the defined User Account file using a TCP/IPaddress provided by the MDC File Server.
For information about setting up User Account files, see the GxP Admin SoftwareUser Guide.
Connecting a User Account FileBefore users can log onto the SoftMax Pro GxP Software, the installed programneeds to be connected to a User Account file. You can also change the associatedUser Account file.

SoftMax Pro Software User Guide
5014177 F 271
To define the User Account file connection:
1. Start the SoftMax Pro GxP Software.
2. In the Log On dialog, click the Change button.
If the software is already running with a user logged on, then go to the GxP tab
in the ribbon. In the User Account area, click User Log Off and then
click Select Account Database .
3. In the User Accounts Connection dialog, click the Connection Type foreither a File Path or TCP/IP Server connection.
If you are setting up a File Path connection, then click the Browse buttonand use the Open dialog to locate the User Account (.edb) file on yournetwork. Click Open to return to the User Accounts Connection dialogwhere the selected file path is shown.
If you are setting up a TCP/IP Server connection, then type the servercomputer Name or IP Address and the Port Number in the fields.
For information about setting up User Account files, see the GxP AdminSoftware User Guide.
4. Click Connect.
5. In the Log On dialog, type your user name and password.
6. Click Log On.
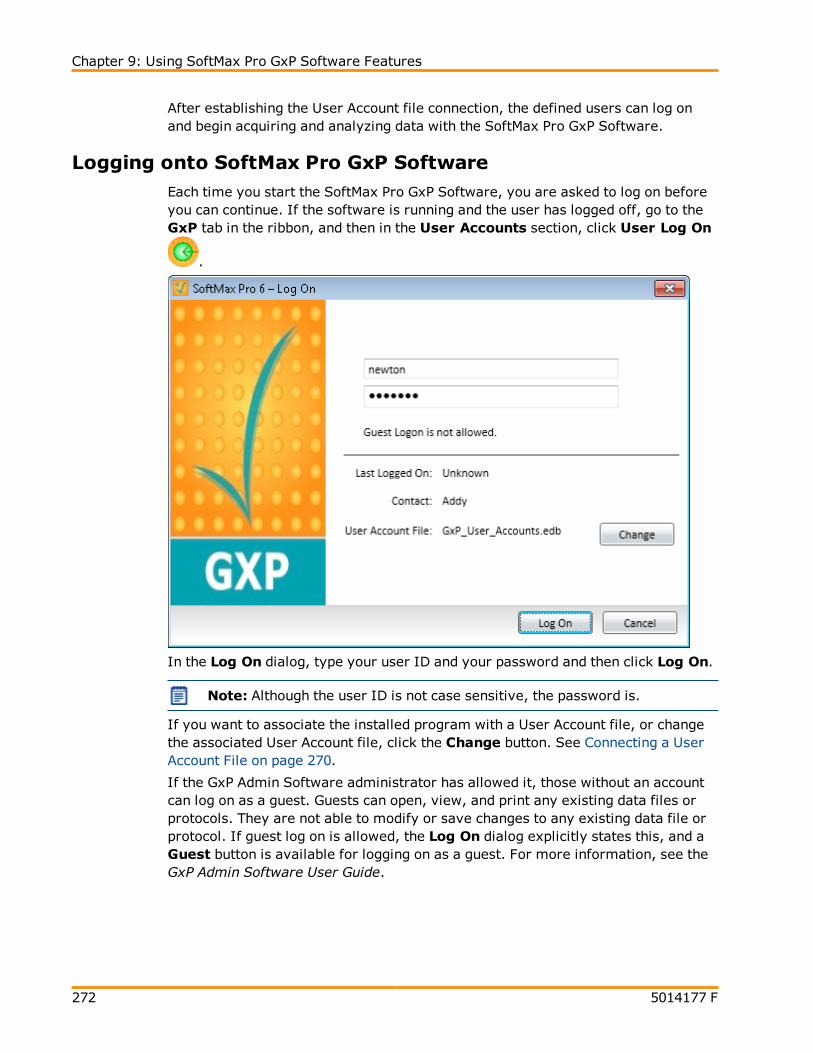
Chapter 9: Using SoftMax Pro GxP Software Features
272 5014177 F
After establishing the User Account file connection, the defined users can log onand begin acquiring and analyzing data with the SoftMax Pro GxP Software.
Logging onto SoftMax Pro GxP SoftwareEach time you start the SoftMax Pro GxP Software, you are asked to log on beforeyou can continue. If the software is running and the user has logged off, go to theGxP tab in the ribbon, and then in the User Accounts section, click User Log On
.
In the Log On dialog, type your user ID and your password and then click Log On.
Note: Although the user ID is not case sensitive, the password is.
If you want to associate the installed program with a User Account file, or changethe associated User Account file, click the Change button. See Connecting a UserAccount File on page 270.
If the GxP Admin Software administrator has allowed it, those without an accountcan log on as a guest. Guests can open, view, and print any existing data files orprotocols. They are not able to modify or save changes to any existing data file orprotocol. If guest log on is allowed, the Log On dialog explicitly states this, and aGuest button is available for logging on as a guest. For more information, see theGxP Admin Software User Guide.
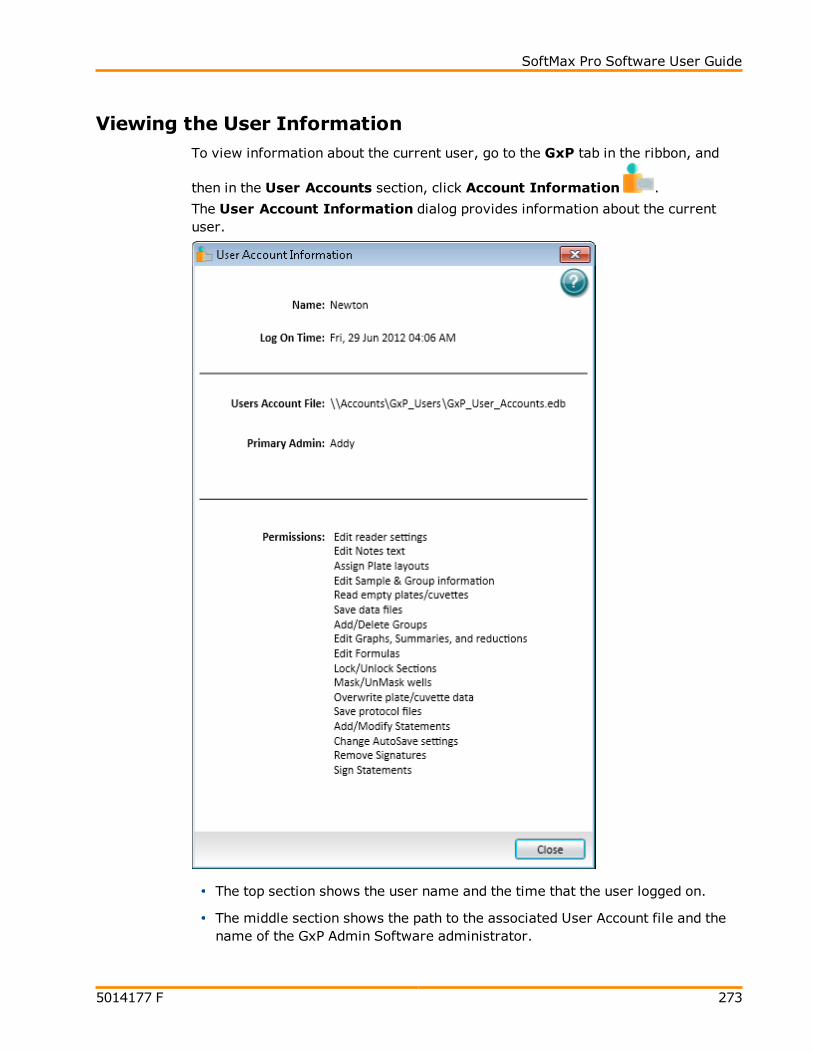
SoftMax Pro Software User Guide
5014177 F 273
Viewing the User InformationTo view information about the current user, go to the GxP tab in the ribbon, and
then in the User Accounts section, click Account Information .
The User Account Information dialog provides information about the currentuser.
The top section shows the user name and the time that the user logged on.
The middle section shows the path to the associated User Account file and thename of the GxP Admin Software administrator.
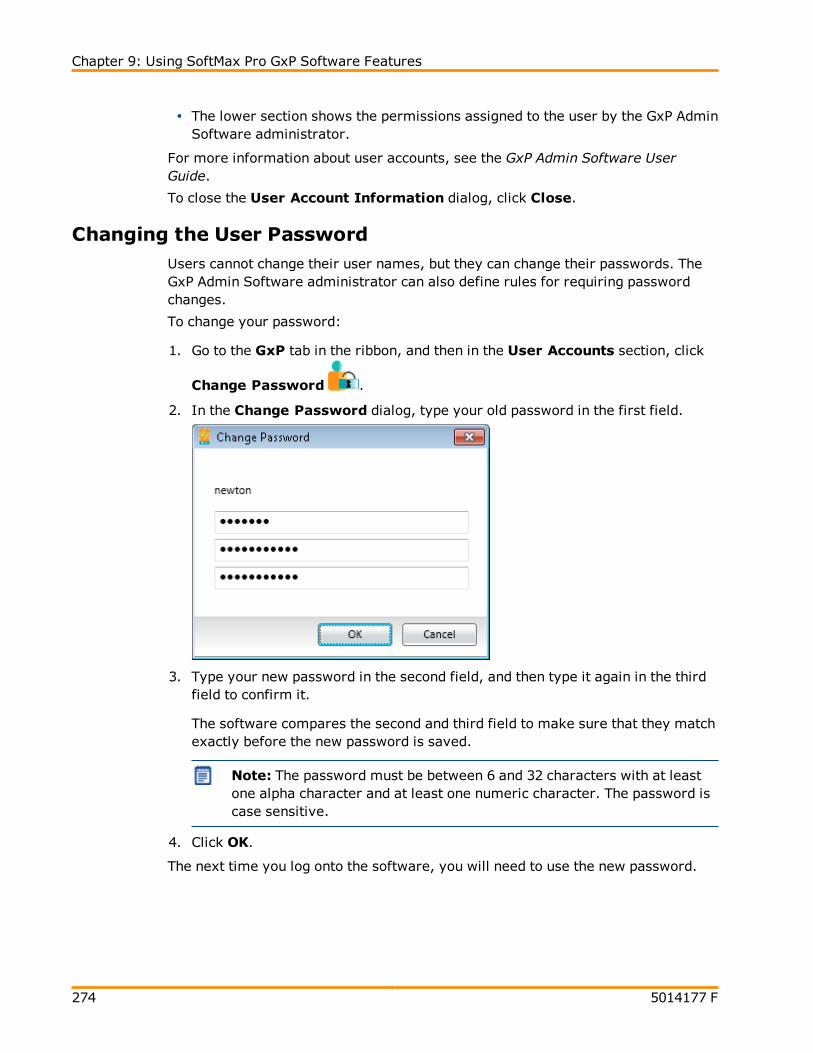
Chapter 9: Using SoftMax Pro GxP Software Features
274 5014177 F
The lower section shows the permissions assigned to the user by the GxP AdminSoftware administrator.
For more information about user accounts, see the GxP Admin Software UserGuide.
To close the User Account Information dialog, click Close.
Changing the User PasswordUsers cannot change their user names, but they can change their passwords. TheGxP Admin Software administrator can also define rules for requiring passwordchanges.
To change your password:
1. Go to the GxP tab in the ribbon, and then in the User Accounts section, click
Change Password .
2. In the Change Password dialog, type your old password in the first field.
3. Type your new password in the second field, and then type it again in the thirdfield to confirm it.
The software compares the second and third field to make sure that they matchexactly before the new password is saved.
Note: The password must be between 6 and 32 characters with at leastone alpha character and at least one numeric character. The password iscase sensitive.
4. Click OK.
The next time you log onto the software, you will need to use the new password.

SoftMax Pro Software User Guide
5014177 F 275
Working with GxP StatementsA user with the correct permission can view, add, and edit GxP statements to aSoftMax Pro GxP Software data file. You can use GxP statements to designate thatan Experiment has been approved, reviewed, or verified.
A user with the correct permission can apply an electronic signature to astatement. See Signing a GxP Statement on page 278. After a GxP statement issigned, the SoftMax Pro GxP Software locks the data file to prevent any furtherchanges to the file. To unlock the file, remove all the statement signatures. SeeRemoving Signatures from All GxP Statements on page 279.
To work with GxP statements, go to the GxP tab in the ribbon, and then in the Data
section, click Statements .
In the Statements dialog, you can work with GxP statements by clicking the toolsin the toolbar at the top of the dialog.
To close the Statements dialog, click Close.
The statements status button in the upper-right corner of the work area displaysthe number of statements in the file, and how many statements are signed.
To quickly open the Statements dialog, click the statements status button.

Chapter 9: Using SoftMax Pro GxP Software Features
276 5014177 F
Adding a GxP Statement
1. Go to the GxP tab in the ribbon, and then in the Data section, click
Statements .
2. If there is more than one statement displayed in the Statement dialog, clickthe statement directly above where you want to add the new statement.
3. Click Add Statement in the toolbar at the top of the dialog.
4. In the Add Statement dialog, click in the upper field and type a title for thestatement.
A title is required for each statement.
5. Click in the lower field and type the content of the statement.
6. Click Add.
Editing a GxP Statement
1. Go to the GxP tab in the ribbon, and then in the Data section, click
Statements .
2. In the Statement dialog, click the statement that you want to edit.
3. Click Edit Statement in the toolbar at the top of the dialog.
4. In the Edit Statement dialog, click in the upper field and edit the title for thestatement.
5. Click in the lower field and edit the content of the statement.
6. Click Save.

SoftMax Pro Software User Guide
5014177 F 277
Deleting All GxP Statements
1. Go to the GxP tab in the ribbon, and then in the Data section, click
Statements .
2. Click Delete Statements in the toolbar at the top of the dialog.
CAUTION: Deleting statements deletes all the GxP statements in theSoftMax Pro GxP Software data file. There is no undo for this. Afterdeleting the statements, they cannot be retrieved.
3. In the Delete Statements message, click OK to delete all the GxP statementsin the SoftMax Pro GxP Software data file.
Duplicating a GxP Statement
1. Go to the GxP tab in the ribbon, and then in the Data section, click
Statements .
2. In the Statement dialog, click the statement that you want to duplicate.
3. Click Copy Statement in the toolbar at the top of the dialog.
4. Click the statement directly above where you want to paste the copiedstatement.
5. Click Paste Statement in the toolbar at the top of the dialog.
To edit the pasted statement, click the statement to select it and then click EditStatement in the toolbar at the top of the dialog. See Editing a GxP Statementon page 276.
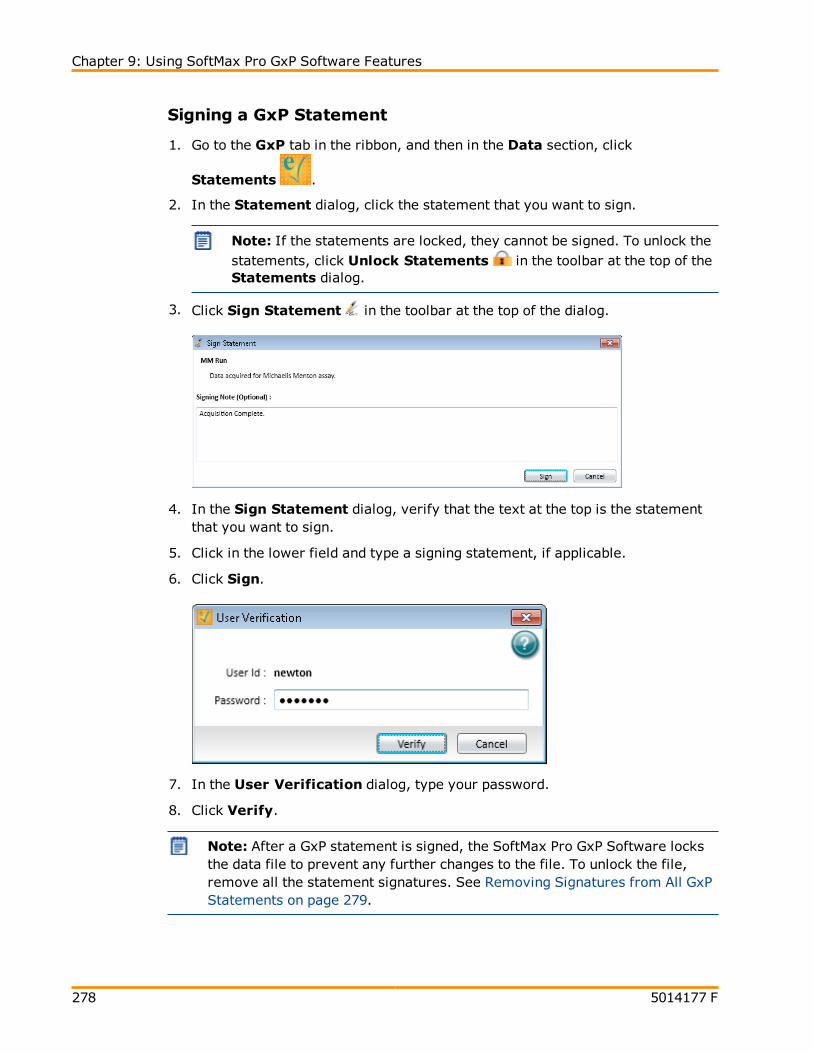
Chapter 9: Using SoftMax Pro GxP Software Features
278 5014177 F
Signing a GxP Statement
1. Go to the GxP tab in the ribbon, and then in the Data section, click
Statements .
2. In the Statement dialog, click the statement that you want to sign.
Note: If the statements are locked, they cannot be signed. To unlock thestatements, click Unlock Statements in the toolbar at the top of theStatements dialog.
3. Click Sign Statement in the toolbar at the top of the dialog.
4. In the Sign Statement dialog, verify that the text at the top is the statementthat you want to sign.
5. Click in the lower field and type a signing statement, if applicable.
6. Click Sign.
7. In the User Verification dialog, type your password.
8. Click Verify.
Note: After a GxP statement is signed, the SoftMax Pro GxP Software locksthe data file to prevent any further changes to the file. To unlock the file,remove all the statement signatures. See Removing Signatures from All GxPStatements on page 279.
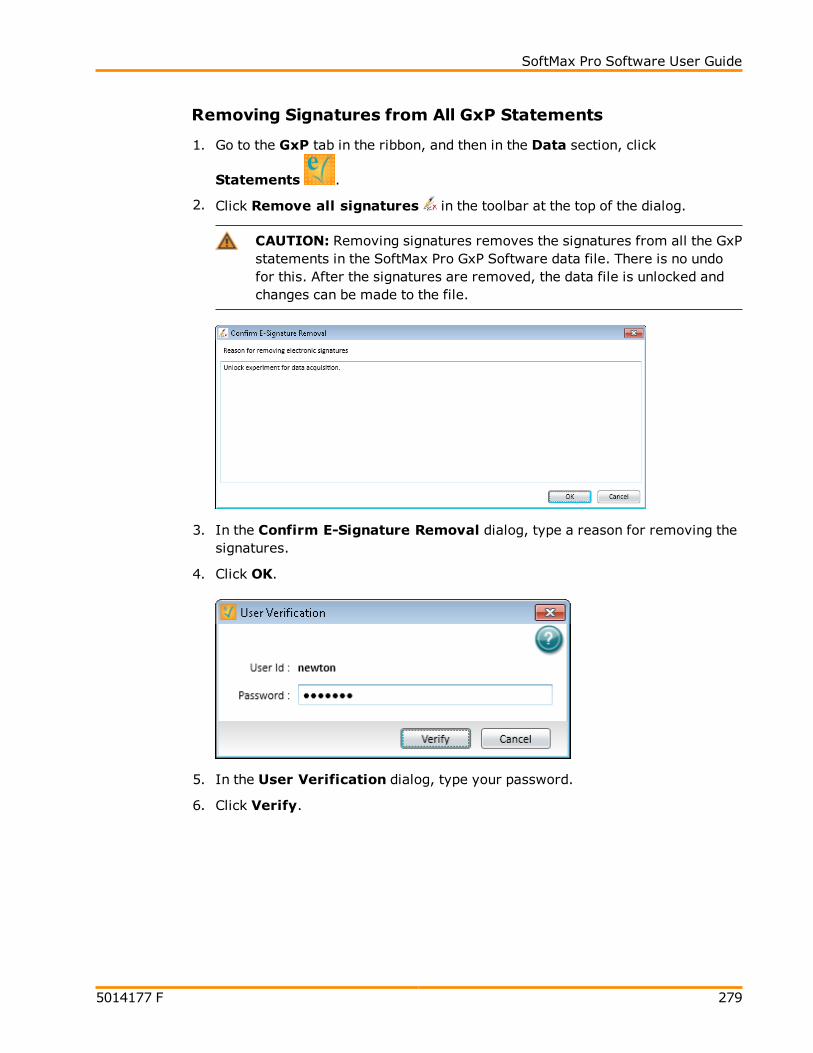
SoftMax Pro Software User Guide
5014177 F 279
Removing Signatures from All GxP Statements
1. Go to the GxP tab in the ribbon, and then in the Data section, click
Statements .
2. Click Remove all signatures in the toolbar at the top of the dialog.
CAUTION: Removing signatures removes the signatures from all the GxPstatements in the SoftMax Pro GxP Software data file. There is no undofor this. After the signatures are removed, the data file is unlocked andchanges can be made to the file.
3. In the Confirm E-Signature Removal dialog, type a reason for removing thesignatures.
4. Click OK.
5. In the User Verification dialog, type your password.
6. Click Verify.

Chapter 9: Using SoftMax Pro GxP Software Features
280 5014177 F
Printing GxP Statements
By default, GxP statements do not print when users print the contents of the datafile. You can allow the statements to print or block the statements from printing inthe Statements dialog .
To change the GxP printing options, go to the GxP tab in the ribbon, and then in the
Data section, click Statements to open the Statements dialog.
To allow the statements to be printed with the data file, click Enable printingof Statements in the toolbar at the top of the dialog.
To prevent the statements from printing with the data file, click Disableprinting of Statements in the toolbar at the top of the dialog.
The button switches between and to indicate whether or not statements willbe printed.
For information about printing the contents of a data file, see Printing on page 60.
Locking and Unlocking GxP Statements
You can lock the statements to prevent changes to the Statements dialog.
You cannot lock signed statements. After a GxP statement is signed, the SoftMaxPro GxP Software locks the data file to prevent any further changes to the file. Tounlock the file, remove all the statement signatures. See Removing Signaturesfrom All GxP Statements on page 279.
To change the GxP statements lock options, go to the GxP tab in the ribbon, and
then in the Data section, click Statements to open the Statements dialog.
To prevent changes to the statements, click Lock Statements in thetoolbar at the top of the dialog.
To allow changes to the statements, click Unlock Statements in thetoolbar at the top of the dialog.
The button switches between and to indicate whether or not statements arelocked.
All the statements are locked or unlocked at the same time.
With the statements locked, you can still change the printing options. See PrintingGxP Statements on page 280.
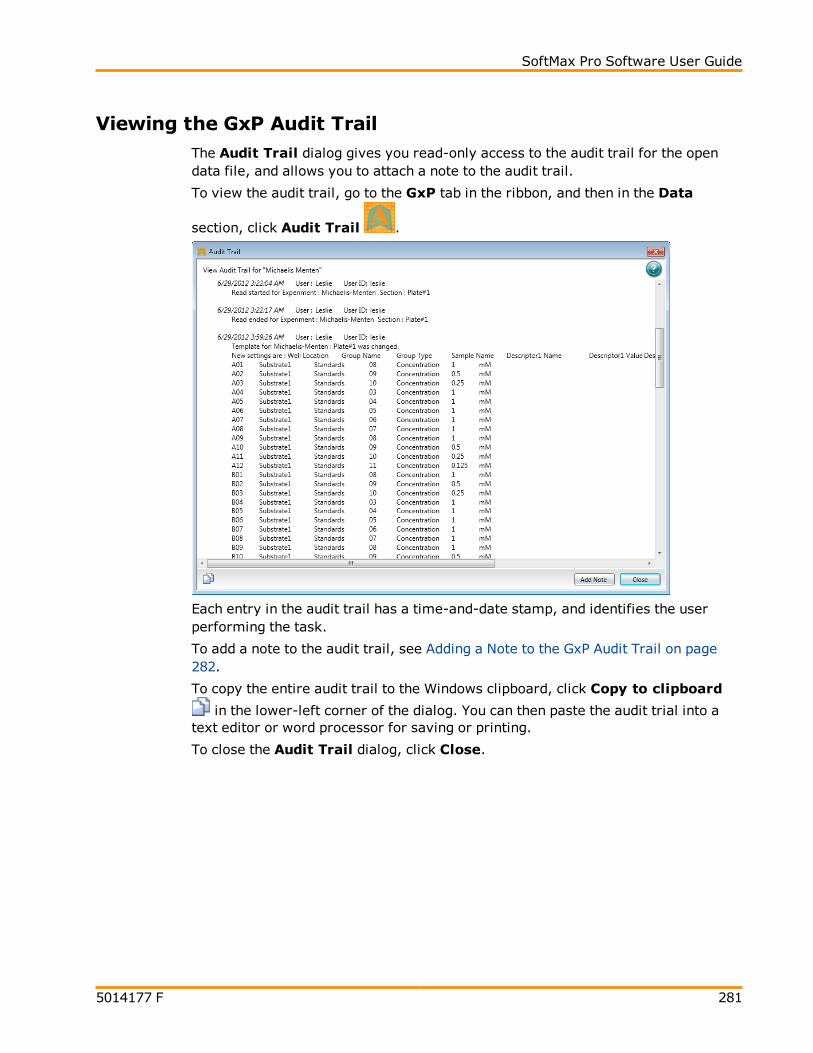
SoftMax Pro Software User Guide
5014177 F 281
Viewing the GxP Audit TrailThe Audit Trail dialog gives you read-only access to the audit trail for the opendata file, and allows you to attach a note to the audit trail.
To view the audit trail, go to the GxP tab in the ribbon, and then in the Data
section, click Audit Trail .
Each entry in the audit trail has a time-and-date stamp, and identifies the userperforming the task.
To add a note to the audit trail, see Adding a Note to the GxP Audit Trail on page282.
To copy the entire audit trail to the Windows clipboard, click Copy to clipboard
in the lower-left corner of the dialog. You can then paste the audit trial into atext editor or word processor for saving or printing.
To close the Audit Trail dialog, click Close.

Chapter 9: Using SoftMax Pro GxP Software Features
282 5014177 F
Adding a Note to the GxP Audit Trail
1. Go to the GxP tab in the ribbon, and then in the Data section, click Audit Trail
.
2. In the Audit Trail dialog, click Add Note.
3. In the Add a Note dialog, type the content of the note.
4. Click OK.
The note is added to the end of the audit trail and becomes part of the permanentrecord for the open data file.

SoftMax Pro Software User Guide
5014177 F 283
Locking and Unlocking SectionsIn the SoftMax Pro GxP Software, you can lock the individual sections in anexperiment to prevent changes to them. A locked section cannot be deleted norhave its data altered. When a locked section is duplicated, the duplicate section isunlocked by default. Locked sections can be printed with the data file.
To lock or unlock a section, click the section to select it and then click LockSelection at the top of the Navigation Tree.
To lock or unlock all the sections in an Experiment, click the Experiment to select itand then click Lock Selection at the top of the Navigation Tree.
When a section is locked, no direct changes can be made to it, with the followingexceptions:
In a Plate section, the data cannot be overwritten. However, a Plate sectionthat has no data can have data acquired and added to the section.
The name of a Group section can be changed indirectly in the Group Settingsdialog.

Chapter 9: Using SoftMax Pro GxP Software Features
284 5014177 F

5014177 F 285
Glossary
Numerics
21 CFR Part 11The FDA guidelines for trustworthy electronic records, known as 21 CFR Part 11,requires companies to employ procedures and controls designed to ensure theauthenticity, integrity, and when appropriate the confidentiality of electronicrecords, and to ensure that the signer cannot readily repudiate the signed record asnot genuine. To satisfy this requirement persons must, among other things, employprocedures and controls that include the use of computer-generated time stamps.
Note: No software by itself can be 21 CFR Part 11 compliant. The SoftMaxPro GxP Software provides features that allow users to demonstratecompliance with these regulations.
See Using SoftMax Pro GxP Software Features on page 269.
A
AbsorbanceAbsorbance is the amount of light absorbed by a solution. To measure absorbanceaccurately, it is necessary to eliminate light scatter. In the absence of turbidity,absorbance = optical density.
A = log10(I0 /I) = –log
10(I/I
0)
where I0is incident light before it enters the sample, I is the intensity of light after
it passes through the sample, and A is the measured absorbance.
See ABS Read Mode on page 113.
AutoReadAutoRead enables automatic reading of Plate sections in the order they appearwithin a single Experiment. When you start a read for any Plate section in theExperiment that is enabled for automatic reading, all enabled Plate sectionsfollowing the selected Plate section are read. Enabled Plate sections above theselected Plate section are not read. You can set intervals (delay times) betweenthe plate readings, if desired.
See Enabling Auto Read on page 195.
Glossary
286 5014177 F
Auto SaveWhen Auto Save is enabled, the collected data is saved automatically to a user-defined location immediately after each plate read is completed. Auto Savereduces the likelihood of lost data, particularly when Auto Save is set to save filesto corporate network volumes that are backed up on a regular basis.
You can add as many Auto Save instances as desired, each with its own settings.
Note: Auto Save settings are saved with each document.
See Setting Auto Save Options on page 56.
B
Bottom ReadYou can set up a bottom read in the PMT and Optics category of the Settingsdialog. Select the Read From Bottom check box to have an instrument withbottom-read capability read up through the bottom of the microplate rather thandown from the top.
See PMT and Optics Settings on page 152.
C
CalibrateFor Absorbance reads, the Calibrate setting tells the instrument to make an aircalibration measurement at each wavelength before reading the microplate, asdetermined by the type of instrument and the read settings. For kinetic readingsthis measurement is sometimes taken between readings during a run.
For Fluorescence instruments, the measurement occurs before reads, andsometimes between kinetic reads if the interval is long enough.
If you turn calibration off, SoftMax Pro Software uses the calibration values storedin the firmware of the instrument.
See More Settings on page 156.

SoftMax Pro Software User Guide
5014177 F 287
CutoffThe term cutoff refers to filters used to block unwanted residual excitation light andminimize background interference.
No emission cutoff filter is used when a Luminescence read mode is selected. Withother read modes, choices are to enable or disable Auto Cutoff with specific filtersettings available if it is disabled (manual cutoff selection). When Auto Cutoff isenabled, the instrument sets the cutoffs based on the wavelengths chosen forreading. When a Spectrum read type is selected, a manual setting for the emissionmonochromator is required, with the default being no cutoff filter.
See Wavelength Settings on page 143.
Cuvette Set SectionCuvette Set sections are used to collect data from the cuvette port of theSpectraMax M2 and M2e Multi-Mode Microplate Readers, SpectraMax M5 and M5eMulti-Mode Microplate Readers, and the SpectraMax Plus 384 AbsorbanceMicroplate Reader. You can use a Cuvette Set section to define an analysistemplate and to define data display and data reduction. The Template Editor inthe Cuvette Set section is used to describe the contents of each cuvette within theCuvette Set.
See Using a Cuvette Set Section on page 90.
D
Default ProtocolAfter the SoftMax Pro Software is installed, the Basic Endpoint protocol is set as thedefault protocol with the filename default.spr. Whenever you create a newdocument, the default.spr protocol file is opened as an untitled document thatcontains the settings from the default protocol file.
You can save the settings of the file currently active in the workspace as the defaultprotocol. After you save the active protocol file as the default, whenever youcreate a new document, the settings in the default.spr file that you have savedare loaded into an untitled document.
See Saving a Protocol as the Default Protocol on page 49.
Glossary
288 5014177 F
E
Emission Spectrum ScanAn emission spectrum scan measures fluorescence or luminescence across aspectrum of wavelengths for the emitted light from a fixed excitation wavelength.The default value reported for each well is the wavelength of maximum emission ineither RFU for fluorescence mode or RLU for luminescence mode.
See Excitation Spectrum Scan on page 288.
End TimeEnd Time in a kinetic read specifies the time at which to stop showing data in thedisplay and exclude it from data reduction. Any values occurring after this limit arenot reported in the display and are excluded from data reduction. The defaultsetting is the total assay time for the kinetic read.
See Performing Data Reduction on page 214.
EndpointIn an Endpoint read, a reading of each microplate well or cuvette is taken once, inthe center of each well, at a single wavelength or at multiple wavelengths.Depending on the read mode, raw data values are reported as optical density,%Transmittance, RFUs, or RLUs.
See Endpoint Read Type on page 111.
Excitation Spectrum ScanAn emission spectrum scan measures fluorescence at a single emission wavelengthfor the emitted light across a spectrum of excitation wavelengths. The defaultvalue reported for each well is the wavelength of maximum fluorescence excitationin RFU.
See Emission Spectrum Scan on page 288.
SoftMax Pro Software User Guide
5014177 F 289
F
FluorescenceFluorescence occurs when absorbed light is re-radiated at a longer wavelength.Fluorescence intensity measures the light emitted by certain substances resultingfrom the absorption of incident radiation.
To measure fluorescence accurately, it is necessary to reduce light scatter.
The governing equation for fluorescence is:
Fluorescence = extinction coefficient * concentration * quantum yield *excitation intensity * pathlength * emission collection efficiency
See FL Read Mode on page 114.
Fluorescence PolarizationFluorescence polarization detection is similar to fluorescence intensity, with theimportant difference that it uses plane-polarized light, rather than non-polarizedlight. Plate readers measure FP of the sample by detecting light emitted bothparallel and perpendicular to the plane of excitation.
By using a fluorescent dye to label a small molecule, its binding to anothermolecule of equal or greater size can be monitored through its speed of rotation.
See FP Read Mode on page 116.
FluorophoreA fluorophore is a material that absorbs light energy of a characteristicwavelength, undergoes an electronic state change, and instantaneously emits lightof a longer wavelength.
See FL Read Mode on page 114, TRF Read Mode on page 115, and FP Read Mode onpage 116.

Glossary
290 5014177 F
G
G FactorG factor, or grating factor, is used in fluorescence polarization to correctpolarization data for optical artifacts, converting relative mP data to theoretical mPdata. Optical systems, particularly with reflective components, pass light ofdifferent polarization with different efficiency. G factor corrects this instrumentalbias.
See Performing Data Reduction on page 214.
GainGain is the amount of increase in signal power expressed as the ratio of output toinput for a photomultiplier tube (PMT).
See PMT and Optics Settings on page 152.
GroupWells can be assigned to group types using the Template Editor. Depending on theprotocol, certain group types, such as Standard or Unknown, can be createdautomatically. You can create other groups as required.
See Defining a Group on page 164.
K
KineticIn a Kinetic read, the instrument collects data over time with multiple readingstaken at regular intervals. To achieve the shortest possible interval for Kineticreadings, choose wavelengths in ascending order.
The values calculated based on raw kinetic data are VMax, VMax per Sec, Time toVMax, and Onset Time. Kinetic readings can be single-wavelength or multiple-wavelength readings.
See Kinetic Read Type on page 111.
SoftMax Pro Software User Guide
5014177 F 291
L
Lag TimeLag Time in a kinetic read defines the period of very slow growth ofmicroorganisms or the rate of reaction that can precede the rapid or linear phaseof reaction.The lag time specifies how many initial data points are excluded fromthe calculation of Vmax Rate. Lag time truncates the data used in the calculation,but does not prevent data from being collected. Kinetic plots do not display the datacollected prior to the lag time.
See Performing Data Reduction on page 214.
LuminescenceLuminescence is the emission of light by processes that derive energy fromessentially non-thermal changes, the motion of subatomic particles, or theexcitation of an atomic system by radiation. Luminescence detection relies on theproduction of light from a chemical reaction in a sample.
See LUM Read Mode on page 114.
M
MaskThe Mask feature hides selected data so that they are not used for calculations andare not reported. Masking is commonly used to suppress outliers from datareduction calculations.
Masking can be used as a “what if?” tool. For example, if you have included a groupblank in a template and want to see the data both with and without the blank,masking the group blanks suppresses the blanking function, while unmasking themenables it again.
See Masking Wells or Cuvettes on page 214.
O
Onset TimeOnset time is a method for analyzing non-linear Kinetic reactions. Onset Timereports the time required for a Kinetic reaction to reach a specified OD or RFU/RLU(onset OD/RFU/RLU).
See Kinetic Data Reduction Options on page 223.
Glossary
292 5014177 F
Optical Density (OD)Optical density (OD) is the amount of light passing through a sample to a detectorrelative to the total amount of light available. Optical Density includes absorbanceof the sample plus light scatter from turbidity.
P
PathCheck TechnologyThe PathCheck® Pathlength Measurement Technology normalizes your absorbancevalues to a 1 cm path length based on the near-infrared absorbance of water.
Microplate readers use a vertical light path so the distance of the light through thesample depends on the volume. This variable pathlength makes it difficult toperform extinction-based assays and also makes it confusing to compare resultsbetween microplate readers and spectrophotometers.
The standard pathlength of a cuvette is the conventional basis for quantifying theunique absorptivity properties of compounds in solution. Quantitative analysis canbe performed on the basis of extinction coefficients, without standard curves (forexample, NADH-based enzyme assays). When using a cuvette, the pathlength isknown and is independent of sample volume, so absorbance is proportional toconcentration.
See PathCheck Pathlength Measurement Technology on page 148.
Photomultiplier Tube (PMT)A Photomultiplier Tube (PMT) is a vacuum tube that can detect light from dimsources through the use of photo emission and successive instances of secondaryemission to produce enough electrons to generate a useful current.
Plate SectionA Plate section is used to collect data from the instrument, and to define datadisplay and data reduction. If you read the same physical plate twice with differentinstrument settings, you would want to have two Plate sections. You can create asmany Plate sections as you need.
See Using a Plate Section on page 82.
Protocol FileProtocol files are experiment template files that contain microplate well layoutassignments and all other reader configuration information and reductionparameters, but no data. Protocol files can be useful if you repeat a particular typeof experiment frequently.
See Managing Protocol Files on page 48.

SoftMax Pro Software User Guide
5014177 F 293
R
Raw DataRaw data is the signal reported from the instrument with no alteration. This isreported as OD, RFU, or RLU, depending on the read mode.
Raw Data ModeIn Absorbance (ABS) read mode or Fluorescence Polarization (FP) read mode, youcan select the type of raw data to display and use for reduction calculations.
For Absorbance reads, you can choose whether to display absorbance data asOptical Density or %Transmittance.
Fluorescence Polarization mode returns two sets of data: one for fluorescenceintensity parallel (P) to the excitation plane, and the other for fluorescenceintensity perpendicular (S) to the excitation plane. These S and P values are usedto calculate the Polarization (mP) and Anisotropy (r) values in SoftMax ProSoftware.
See Performing Data Reduction on page 214.
Read ModeSoftMax Pro Software supports the following Read Modes:
ABS Read Mode on page 113
FL Read Mode on page 114
LUM Read Mode on page 114
TRF Read Mode on page 115
FP Read Mode on page 116
AlphaScreen Read Mode on page 117
FRET Read Mode on page 118
Read TypeSoftMax Pro Software supports the following Read Types:
Endpoint Read Type on page 111
Kinetic Read Type on page 111
Spectrum Read Type on page 111
Well Scan Read Type on page 112

Glossary
294 5014177 F
Reduced DataData reduction causes the raw signal values reported by the instrument to becalculated and displayed according to user-defined formula settings.
See Performing Data Reduction on page 214.
ReferenceA reference reading can be taken either on air or using a cuvette containing thebuffer of your sample.
See Collecting Data From a Cuvette on page 203.
S
SeriesYou can define several samples as a series, allowing you to easily enterincremental sample descriptors (for example, dilutions or concentrations) andsample names to the template as long as the increment can be expressed as amathematical operation. This allows you to work with groups of wells in theTemplate so that the standard value or dilution factor increases or decreases inspecified steps. The series name can be incremented as well.
See Creating a Series on page 165.
SlopeThe slope reduction option determines the slope of the combined plot (for example,the slope of the line using linear regression after the wavelength combinationreduction). This reduction uses all visible time points in the reduction window.
Slope is the same as Vmax Rate when Vmax Rate is set to the same number ofpoints as the run, but is different if you have modified Vmax Points.
See Kinetic Data Reduction Options on page 223.
SpectrumDepending on the read mode selected, a Spectrum read measures optical density,%Transmittance, relative fluorescence units (RFUs), or relative luminescence units(RLUs) across a spectrum of wavelengths.
See Spectrum Read Type on page 111, Emission Spectrum Scan on page 288, andExcitation Spectrum Scan on page 288.
Stokes ShiftThe Stokes shift is the difference between the wavelengths of the excitation andemission maxima, or peaks.
See Emission Spectrum Scan on page 288 and Excitation Spectrum Scan on page288.
SoftMax Pro Software User Guide
5014177 F 295
T
Template EditorA Template is a map of the microplate or cuvette that is used to describe thelocation of samples in the microplate or cuvette, and it provides the link betweenraw data and analysis groups.
The Template Editor is a representation of the microplate or set of cuvettesshown as a grid of wells that can be used to designate the location of blanks,standards, controls, unknowns, empty wells, or to assign wells to other groups youcreate.
See Configuring a Microplate Template on page 162.
Time-Resolved Fluorescence (TRF)Time-resolved fluorescence (TRF) detection is similar to fluorescence intensity (FL)detection. The difference is that the fluorophores are a special type calledlanthanides that have a longer lifetime than standard fluorophores used with FLdetection. The fluorescence emitted by lanthanide dyes is delayed long enough tomeasure fluorescence after the lamp is turned off. Time resolved fluorescence isused to reduce the amount of background noise interfering with fluorescence. Theexcitation lamp flashes and, after it is off, the delayed emission is collected beforethe lamp flashes again.
See TRF Read Mode on page 115.
%Transmittance%Transmittance is the ratio of transmitted light to the incident light for absorbancereads.
T = I/I0
%T = 100T
where I is the intensity of light after it passes through the sample and I0is incident
light before it enters the sample.

Glossary
296 5014177 F
V
Vmax PointsVmax is the maximum slope of the Kinetic display of mOD/min or RFU/RLU persecond. Vmax is calculated by measuring the slopes of a number of straight lines,where Vmax Points determines the number of contiguous points over which eachstraight line is defined.
This is an alternative method for analyzing non-linear Kinetic reactions that reportsthe elapsed time until the maximum reaction rate is reached, rather than reportingthe maximum rate itself. Used in conjunction with Vmax Points, Time to Vmax isthe time to the midpoint of the line defined by Vmax Points and used to calculateVmax.
See Kinetic Data Reduction Options on page 223.
Vmax RateVmax Rate is reported as signal/min (milli-OD, RFU, or RLU units per minute) for aKinetic read. It is calculated using a linear curve fit, y = Ax + B. A creepingiteration is performed using Vmax Points and the slope of the steepest linesegment is reported as Vmax Rate. It can also be reported as units per second (thedefault for Fluorescence and Luminescence modes).
See Kinetic Data Reduction Options on page 223.
W
Well ScanA Well Scan read can take readings at more than one location within a well. A WellScan read takes one or more readings of a single well of a microplate on an evenlyspaced grid inside of each well at single or multiple wavelengths.
Some applications involve the detection of whole cells in large-area tissue cultureplates. Well Scan reads can be used with such microplates to allow maximumsurface area detection in whole-cell protocols. Since many cell lines tend to growas clumps or in the corners of microplate wells, you can choose from severalpatterns and define the number of points to be scanned to work best with yourparticular application.
See Well Scan Read Type on page 112.

5014177 F 297
Index
A
ABS
absorbance 113, 175, 285
detection cartridge 132
read mode 113
absorbance
ABS 113, 175, 285
read mode 113
account database 36, 270
account information 36, 273
account setup 270
adding
audit trail note 282
column to group table 104
cuvette set 91
cuvette to a set 97
formula to a table 109
Plate section 83
plots to a graph 237
statement 276
Summary Formula 79
text frame 75
aligning
text 75
text frame 78
ALPHA
AlphaScreen 117
detection cartridge 134
read mode 117
AlphaScreen
ALPHA 117
application management 43
application menu 39
area under curve 224-225
audit trail
adding a note 282
copying 281
printing 281
saving 281
viewing 36, 281
auto read
enabling 195, 285
auto save
enabling 56, 286
automation mode 42
autosizing
column 107
B
background constant subtraction
settings 150
BRET2
detection cartridge 140
C
calculation
hierarchy 208
recalculate manually 35
resume 35
suspend 35
calibrate 34
reader 259
settings 156, 286
carriage speed
settings 156
cartridges
detection 131

Index
298 5014177 F
refresh 34
celsius 28
change password 36, 274
chi-squared 253
Chroma-Glo
detection cartridge 140
Cisbio HTRF 115
cloning
plate section 89
closing the drawer 29
column
adding 104
autosizing 107
content 106
copying content 106
deleting 107
formula 105
modifying 105
pasting content 106
showing all 108
columns format 69
community
export protocol 33
home page 33
comparison view 23
computer requirements 8
confidence interval methods 252
Chi-Squared 253
F-distribution 253
T-distribution 253
confidence level 254
content
copying 106
controls
instrument 26
copying
between experiments 167
column content 106
cuvette 97
cuvette data 98
data 47
in an experiment section 167
statements 277
template contents 167
curve fit 241
judging 240
settings 239
weighting 251
cutoff 143, 287
cutting
content 106
cuvette
adding a set 91
adding to a set 97
copying 97
data reduction 92
masking 96
new 31
zooming the display 95
cuvette reference
settings 149
D
data
copying 47, 98
formats 69
pasting 47
reading 27
data files 43, 45-46
data formats
columns 69

SoftMax Pro Software User Guide
5014177 F 299
plate 69
xml 69
data reduction 84
calculation hierarchy 214
cuvette 92
database, user account 36, 270
deleting
a column 107
cuvette 97
formula 109
sections 30
statements 277
Summary Formula 81
text frame 78
detection cartridges 131
ABS 132
ALPHA 134
BRET2 140
Chroma-Glo 140
FI 137-138
FI-DL 138
FP 139
GeneBLAzer 138
HTRF 135
LUM 140
MULTI 133
MultiTox-Fluor 138
TRF 136
TUNE 132
display
modifying 85, 93-94
zooming a cuvette 95
zooming a well 212
zooming well 87
drawer
closing 29
locking 261
opening 29
unlocking 13
DTX 800 128
DTX 880 128
E
editing
formula 109
graphs 239
Summary Formula 81
text 76
Emax reader 129
enabling
auto read 195, 285
syntax helper 80
end time 219, 288
endpoint
read type 111, 288
experiment
new 29
exporting
formats 69
template 171
F
F-distribution 253
FI
detection cartridge 137-138
FI-DL
detection cartridge 138
file management 43
file menu 39
Index
300 5014177 F
files
creating new 45
protocol 53
data
exporting 68
exporting 68
opening 46, 54
saving 47
filter slides
adding 263
configuring 262
definitions 266-267
exporting 264, 267
importing 265-266
removing 264
replacing 266
FilterMax
filter refresh 34
filter slides 262
instrument information 260
FilterMax F3 128
FilterMax F5 127
filters
cutoff 143, 287
Emax 34, 260
FilterMax 262
refresh 34
Vmax 34, 260
FL
fluorescence intensity 114, 289
read mode 114
fluorescence intensity
FL 114, 289
read mode 114
fluorescence polarization
FP 116, 289
read mode 116
fluorescence resonance energy transfer
FRET 118
folder
location 50
formats
columns 69
plate 69
xml 69
formatting
text 77
formula
adding 109
column 105
deleting 109
editing 109
weighting 251
FP
detection cartridge 139
fluorescence polarization 116, 289
read mode 116
FRET
fluorescence resonance energytransfer 118
read mode 118
G
Gemini EM 126
Gemini XPS 125
GeneBLAzer
detection cartridge 138
getting help 37
GLP
good laboratory practices 7, 269
GMP
good manufacturing practices 7, 269

SoftMax Pro Software User Guide
5014177 F 301
graph (3D)
export data 232
exporting 230
viewing 86, 226
graphs
appearance 256
creating 237
editing 239
fonts 257
global fits 235
grid lines 257
independent fits 235
legend 235
new 31
scales 257
types 256
zooming 258
grid lines 257
group
defining 101
settings dialog 100
H
hardware requirements 8
help
getting 37
hiding
protocols 34
replicates 108
sections 34
Home tab 24
homogeneous time-resolved fluorescence
HTRF 115
HTRF
detection cartridge 135
homogeneous time-resolvedfluorescence 115
I
images
deleting 73
inserting in Notes 73
importing
a template 171
instrument
compatibility 43
selection 26
settings
modifying 84
interfering substances 151
K
kinetic
read type 111, 290
L
labels
axes 257
lag time 219, 291
lambda at maximum 225
lambda at minimum 225
locking
drawers 261
statements 280
log off 36
log on 36, 272
LUM
detection cartridge 140
luminescence 114, 291
read mode 114

Index
302 5014177 F
luminescence
LUM 114, 291
read mode 114
M
managing
files 43
masking 96
wells 88
Max OD 219
Max RFU 219
maximum 225
method
confidence interval 252
microplate
library 144
read area 147
setup helper 19
types 144
microplate readers 7
Min OD 219
Min RFU 219
Min RLU 219
minimum 225
modifying
column 105
data reduction 84
display 85, 93
template 164
MULTI
detection cartridge 133
MultiTox-Fluor
detection cartridge 138
N
navigation
tree 21
new
cuvette set 31
experiment 29
graph 31
notes 30, 73
plate 30
protocol folder 50
statement 276
notes
new 30, 73
Notes section 72
inserting images 73
inserting section images 74
numerical precision 208
O
onset time 224
opening the drawer 29
P
parallel line analysis 245
parameter dependencies 254
password
change 36, 274
pasting
column content 106
data 47
statements 277
PathCheck technology
settings 148
pdf 65

SoftMax Pro Software User Guide
5014177 F 303
plate
format 69
library 144
new 30
read area 147
section 82, 292
cloning 89
tools 83
tools 83
types 144
plate setup helper 19
plots
adding 237
PMT and optics
settings 152
precision, numerical 208
printing 60
protocol
community web site 33
default 32, 44, 48-49, 287
export for sharing 33
files 32, 44, 48, 292
folders 50
manager 33
predefined 32, 44, 48
R
read area 147
read modes 112, 293
ABS 113
ALPHA 117
FL 114
FP 116
FRET 118
LUM 114
TRF 115
read types 111, 293
endpoint 111, 288
kinetic 111, 290
spectrum 111, 294
well scan 112, 154, 296
reading data 27
replicates
hiding 108
requirements
system 8
resizing
text frame 78
ribbon 24
S
saving
auto save 56, 286
data 47
section images
deleting 75
inserting in Notes 74
refreshing 74
sections
cuvette set 31
deleting 30
graph 110, 234
notes 72
plate 83
select account database 36, 270
sensitivity
settings 152
serial port 8
set first data point to zero 217
settings
background constant subtraction 150
calibrate 156, 286

Index
304 5014177 F
carriage speed 156
cuvette 92
cuvette reference 149
data reduction 84
group 100
modifying 92
modifying display 85, 93
modifying instrument 84
PathCheck technology 148
PMT and optics 152
sensitivity 152
settling time 156
shake 155
speed read 155
timing 153
TRF 152
water constant 148
wavelengths 143
well scan 154
settling time
settings 156
setup user account 270
shake 28
settings 155
showing
protocols 34
sections 34
signatures
removing 279
signing 278
simulation
enabling 26
slope 224
spectral optimization wizard 202
spectral scanning 180
SpectraMax 190 125
SpectraMax 340PC 384 124
SpectraMax M2 121
SpectraMax M3 122
SpectraMax M4 123
SpectraMax M5 124
SpectraMax Paradigm 130
cartridge refresh 34
detection cartridges 131
instrument information 260
SpectraMax Plus 384 120
spectrophotometers 7
spectrum
read type 111, 294
speed read
settings 155
StakMax 141
alignment wizard 261
statements
adding 276
copying 277
deleting 277
duplicating 277
editing 276
locking 280
pasting 277
printing 280
removing signatures 279
signing 278
unlocking 280
viewing 36, 275
statistics 252
summary formula
adding 79
deleting 81
editing 81
hide formula 81, 109
SoftMax Pro Software User Guide
5014177 F 305
show formula 81, 109
syntax helper
enabling 80
system requirements 8
T
T-distribution 253
tab groups 34
tabs
Home 24
temperature
setting 28
template
copying contents 167
exporting 171
importing 171
modifying 164
text
editing 76
formatting 77
text frame
adding 75
aligning 78
deleting 78
resizing 78
time-resolved fluorescence
read mode 115
TRF 115, 295
time at 1/2 maximum 224
time at maximum 224
time at minimum 224
time to Vmax 223
timing
settings 153
tools
cuvette 91
plate 83
template 89, 99
TRF
detection cartridge 136
read mode 115
settings 152
time-resolved fluorescence 115, 295
TUNE
detection cartridge 132
U
unlocking
drawers 13
statements 280
USB adapter 8
user
account information 36, 273
account setup 270
change password 36, 274
log off 36
log on 36, 272
select account database 36, 270
user accounts connection 270
V
VersaMax 120
views
Comparison 23
Document 22
show/hide 34
single document 34
Vmax points 223-224
Vmax reader 129

Index
306 5014177 F
W
water constant
settings 148
wavelength
cutoffs 143, 287
settings 143
weighting
curve fit 251
formula 251
well scan
read type 112, 154, 296
settings 154
wells
masking 88
zooming the display 87, 212
Windows 7 8
wizard
plate setup helper 19
X
xml data format 69
Z
zooming 95, 212
a graph 258