société d’investissement morgan stanley à capital ... · à capital variable incorporated...
TRANSCRIPT

Morgan Stanley Investment Funds
Société d’Investissement à Capital Variable incorporated under the laws of Luxembourg
Annual ReportDecember 31, 2012
InveStMent ManageMent
R.C.S. Luxembourg: B-29. 192
UCITS DO NOT HAVE A GUARANTEED RETURN AND PAST PERFORMANCE DOES NOT GUARANTEE FUTURE RETURNS


Morgan Stanley Investment Funds 31 December 2012
1 Shareholders’ information
Statement of inveStmentS
equity funds
2 Asian Equity Fund
5 Asia-Pacific Equity Fund
8 Asian Property Fund
10 Emerging Europe, Middle East and Africa Equity Fund
12 Emerging Leaders Equity Fund
14 Emerging Markets Equity Fund
17 European Equity Alpha Fund
19 European Property Fund
21 Eurozone Equity Alpha Fund
23 Global Brands Fund
25 Global Equity Allocation Fund
33 Global Infrastructure Fund
35 Global Opportunity Fund
37 Global Property Fund
40 Indian Equity Fund
42 Japanese Equity Fund
44 Latin American Equity Fund
46 US Advantage Fund
48 US Growth Fund
50 US Property Fund
Bond funds
52 Emerging Markets Corporate Debt Fund
55 Emerging Markets Debt Fund
59 Emerging Markets Domestic Debt Fund
62 Euro Bond Fund
67 Euro Corporate Bond (ex Financials) Fund
72 Euro Corporate Bond Fund
78 Euro Strategic Bond Fund
86 European Currencies High Yield Bond Fund
91 Global Bond Fund
101 Global Convertible Bond Fund
105 Global Credit Fund
109 Global Fixed Income Opportunities Fund
117 Global High Yield Bond Fund
121 Global Mortgage Securities Fund
123 Global Premier Credit Fund
126 Short Maturity Euro Bond Fund
Liquidity funds
130 Euro Liquidity Fund
132 US Dollar Liquidity Fund
asset allocation funds
134 Diversified Alpha Plus Fund
142 Global Balanced Risk Control Fund of Funds
alternative investment funds
144 Absolute Return Currency Fund
StatementS anD noteS
146 Statement of assets and liabilities
160 Statement of changes in number of shares
167 Statement of operations and changes in net assets
178 Statement of share and net assets statistics
186 Notes to the financial statements
other information
197 Independent Auditor’s Report
198 Directors and service providers
200 Paying and information agents
201 Appendix 1: Fund expense ratios (audited)
204 Appendix 2: Portfolio turnover rate (unaudited)
205 Appendix 3: Sub-Advisers
206 Appendix 4: Hedged Share Classes
207 Appendix 5: Performance Summary (unaudited)
210 Appendix 6: Risk Measurement and Global Exposure (unaudited)
Table of contents

1 Morgan Stanley Investment Funds 31 December 2012
The annual general meeting of shareholders of the Company is held at the registered office of the Company and will be held on the second Tuesday of the month of May at 10.30 am, or if such day is not a bank business day on the following bank business day.
notices of all general meetings are sent by mail to all registered shareholders at their registered address at least 8 days prior to the meeting. Such notices will indicate the time and place of the meeting as well as the conditions of admission thereto. Said notices will also contain the agenda and requirements of Luxembourg law with regard to the necessary quorum and majorities at the meeting. to the extent required by law, further notices will be published in the Mémorial and in one Luxembourg newspaper.
audited financial statements in respect of the preceding financial period are made available at the registered office of the Company and are available to shareholders upon request. In addition, unaudited semi-annual reports are also made available at the registered office.
The annual and semi-annual reports are also available on the Company’s web-site (http://morganstanleyinvestmentfunds.com).
The Company’s financial year end is 31 December.
any other notices relevant to the Company are also published in a Luxembourg newspaper or mailed to affected shareholders.
The net asset value per share of each Class of Share is available on each dealing day during Luxembourg business hours at the registered office of the Company. net asset value per share information is also available from market information providers, such as Bloomberg and Morningstar, as well as being available at www.morganstanleyinvestmentfunds.com.
no subscriptions can be received on the basis of financial reports alone. Subscriptions are only valid if made on the basis of the current prospectus and the latest Key Investor Information Document if applicable, the latest annual report and the most recent semi-annual report, if published thereafter.
Morgan Stanley & Co. International plc, London, Zurich Branch, Bahnhofstrasse 92, 8001 Zurich, is the representative in Switzerland
and RBC Investor Services Bank S.a., esch-sur-alzette, Zurich Branch, Badenerstrasse 567, 8048 Zurich, is the paying agent in Switzerland. The Prospectus, the latest Key Investor Information Document, the articles and the annual and semi-annual reports of the Company may be obtained free of charge from the representative in Switzerland.
a list of purchases and sales (securities transactions) carried out by the Company during the reporting period may be obtained free of charge from the representative in Switzerland.
The investment aims set out in this annual report are summaries only. The complete investment objectives and policies for each Fund are set out in the Company’s current prospectus.
Shareholders’ information
Please refer to the full prospectus for the Fund’s investment objective and policy.
Morgan Stanley Investment Funds 31 December 2012 2
Asian Equity Fund
equities
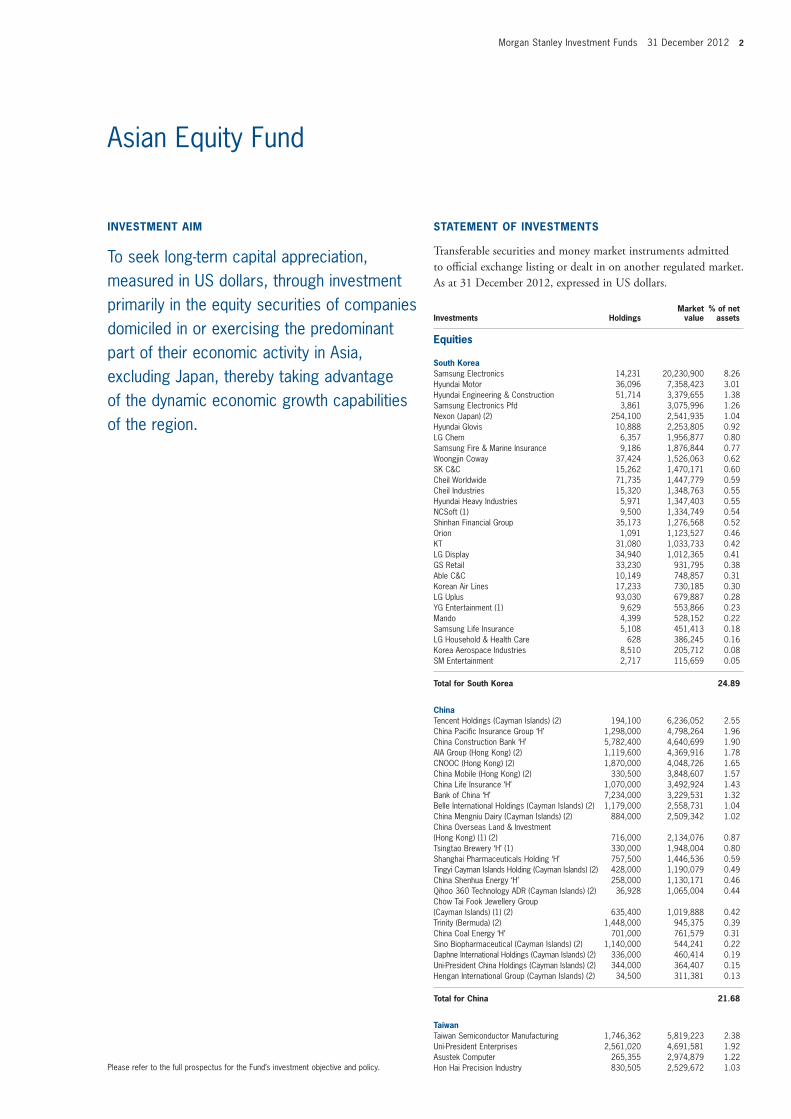
South KoreaSamsung Electronics 14,231 20,230,900 8.26Hyundai Motor 36,096 7,358,423 3.01Hyundai Engineering & Construction 51,714 3,379,655 1.38Samsung Electronics Pfd 3,861 3,075,996 1.26Nexon (Japan) (2) 254,100 2,541,935 1.04Hyundai Glovis 10,888 2,253,805 0.92LG Chem 6,357 1,956,877 0.80Samsung Fire & Marine Insurance 9,186 1,876,844 0.77Woongjin Coway 37,424 1,526,063 0.62SK C&C 15,262 1,470,171 0.60Cheil Worldwide 71,735 1,447,779 0.59Cheil Industries 15,320 1,348,763 0.55Hyundai Heavy Industries 5,971 1,347,403 0.55NCSoft (1) 9,500 1,334,749 0.54Shinhan Financial Group 35,173 1,276,568 0.52Orion 1,091 1,123,527 0.46KT 31,080 1,033,733 0.42LG Display 34,940 1,012,365 0.41GS Retail 33,230 931,795 0.38Able C&C 10,149 748,857 0.31Korean Air Lines 17,233 730,185 0.30LG Uplus 93,030 679,887 0.28YG Entertainment (1) 9,629 553,866 0.23Mando 4,399 528,152 0.22Samsung Life Insurance 5,108 451,413 0.18LG Household & Health Care 628 386,245 0.16Korea Aerospace Industries 8,510 205,712 0.08SM Entertainment 2,717 115,659 0.05
total for South Korea 24.89
China Tencent Holdings (Cayman Islands) (2) 194,100 6,236,052 2.55China Pacific Insurance Group ‘H’ 1,298,000 4,798,264 1.96China Construction Bank ‘H’ 5,782,400 4,640,699 1.90AIA Group (Hong Kong) (2) 1,119,600 4,369,916 1.78CNOOC (Hong Kong) (2) 1,870,000 4,048,726 1.65China Mobile (Hong Kong) (2) 330,500 3,848,607 1.57China Life Insurance ‘H’ 1,070,000 3,492,924 1.43Bank of China ‘H’ 7,234,000 3,229,531 1.32Belle International Holdings (Cayman Islands) (2) 1,179,000 2,558,731 1.04China Mengniu Dairy (Cayman Islands) (2) 884,000 2,509,342 1.02China Overseas Land & Investment (Hong Kong) (1) (2) 716,000 2,134,076 0.87Tsingtao Brewery ‘H’ (1) 330,000 1,948,004 0.80Shanghai Pharmaceuticals Holding ‘H’ 757,500 1,446,536 0.59Tingyi Cayman Islands Holding (Cayman Islands) (2) 428,000 1,190,079 0.49China Shenhua Energy ‘H’ 258,000 1,130,171 0.46Qihoo 360 Technology ADR (Cayman Islands) (2) 36,928 1,065,004 0.44Chow Tai Fook Jewellery Group (Cayman Islands) (1) (2) 635,400 1,019,888 0.42Trinity (Bermuda) (2) 1,448,000 945,375 0.39China Coal Energy ‘H’ 701,000 761,579 0.31Sino Biopharmaceutical (Cayman Islands) (2) 1,140,000 544,241 0.22Daphne International Holdings (Cayman Islands) (2) 336,000 460,414 0.19Uni-President China Holdings (Cayman Islands) (2) 344,000 364,407 0.15Hengan International Group (Cayman Islands) (2) 34,500 311,381 0.13
total for China 21.68
taiwan Taiwan Semiconductor Manufacturing 1,746,362 5,819,223 2.38Uni-President Enterprises 2,561,020 4,691,581 1.92Asustek Computer 265,355 2,974,879 1.22Hon Hai Precision Industry 830,505 2,529,672 1.03
inveStment aim
To seek long-term capital appreciation, measured in US dollars, through investment primarily in the equity securities of companies domiciled in or exercising the predominant part of their economic activity in Asia, excluding Japan, thereby taking advantage of the dynamic economic growth capabilities of the region.
Statement of inveStmentS
transferable securities and money market instruments admitted to official exchange listing or dealt in on another regulated market. as at 31 December 2012, expressed in US dollars.
investments holdingsmarket
value% of net
assets

3 Morgan Stanley Investment Funds 31 December 2012
Asian Equity Fund
Statement of inveStmentS (continued)
transferable securities and money market instruments admitted to official exchange listing or dealt in on another regulated market. as at 31 December 2012, expressed in US dollars.
investments holdingsmarket
value% of net
assets
investments holdingsmarket
value% of net
assets
Taiwan Cement 1,317,000 1,759,076 0.72MediaTek 143,928 1,598,854 0.65Taiwan Fertilizer 569,000 1,479,250 0.60Formosa Plastics 508,000 1,372,061 0.56China Life Insurance 1,488,294 1,336,815 0.55Chailease Holding (Cayman Islands) (2) 571,000 1,305,944 0.53Lung Yen Life Service 316,000 1,014,816 0.41Cleanaway 94,000 619,064 0.25Wowprime 41,000 582,138 0.24MStar Semiconductor (Cayman Islands) (2) 77,000 576,663 0.24Chailease Holding GDR Regd (Cayman Islands) (2) 46,100 528,317 0.21Siliconware Precision Industries 320,000 340,317 0.14Ruentex Development 130,000 266,770 0.11Ginko International (Cayman Islands) (2) 19,000 211,660 0.09CHC Healthcare Group 42,000 172,371 0.07
total for taiwan 11.92
hong Kong Wharf Holdings 552,323 4,318,676 1.77Hutchison Whampoa 265,000 2,766,172 1.13Samsonite International (Luxembourg) (2) 1,153,500 2,378,369 0.97Cheung Kong Holdings 133,000 2,042,130 0.84Hongkong Land Holdings (Bermuda) (1) (2) 267,000 1,866,330 0.76BOC Hong Kong Holdings 517,500 1,609,208 0.66Lifestyle International Holdings (Cayman Islands) (2) 581,000 1,424,343 0.58Kerry Properties (Bermuda) (2) 273,570 1,420,755 0.58Hong Kong Exchanges & Clearing (1) 61,000 1,038,148 0.42Henderson Land Development 117,000 825,768 0.34HKT Trust 554,000 541,116 0.22SmarTone Telecommunications Holdings (Bermuda) (1) (2) 296,000 537,749 0.22
total for hong Kong 8.49
indonesia PT Indosat 4,492,000 3,003,765 1.23PT Bank Tabungan Negara 18,497,660 2,780,955 1.14PT Lippo Karawaci 22,216,500 2,303,468 0.94PT Kalbe Farma 18,688,000 2,048,706 0.84Indofood Agri Resources (Singapore) (1) (2) 1,548,000 1,691,990 0.69PT Indofood Sukses Makmur 2,122,000 1,286,692 0.52PT Tempo Scan Pacific 3,317,500 1,281,846 0.52PT Ace Hardware Indonesia 14,465,000 1,230,226 0.50PT Semen Gresik Persero 694,500 1,140,552 0.47PT Gudang Garam 180,500 1,051,830 0.43PT Nippon Indosari Corpindo 940,000 672,296 0.27PT Adaro Energy 3,857,000 634,436 0.26PT Harum Energy 510,500 316,868 0.13
total for indonesia 7.94
Philippines BDO Unibank 1,383,220 2,454,242 1.00Ayala 173,158 2,181,463 0.89Metro Pacific Investments 16,843,000 1,825,806 0.75DMCI Holdings 1,208,940 1,590,491 0.65Bloomberry Resorts 4,177,300 1,342,974 0.55International Container Terminal Services 674,000 1,215,238 0.50Metropolitan Bank & Trust 451,010 1,120,848 0.46Puregold Price Club 1,386,700 1,115,744 0.45SM Investments 39,230 842,713 0.34STI Education Systems Holdings 30,622,000 762,372 0.31
total for Philippines 5.90
thailand Banpu (Foreign) Regd 199,271 2,683,872 1.09Bangkok Bank Public ‘NVDR’ 418,000 2,667,010 1.09Land & Houses ‘NVDR’ 7,843,000 2,496,317 1.02Bank of Ayudhya (Foreign) 1,953,600 2,075,701 0.85Minor International (Foreign) 1,220,700 782,142 0.32Bank of Ayudhya ‘NVDR’ 622,100 660,978 0.27Thai Union Frozen Products (Foreign) 142,000 334,227 0.14Supalai (Foreign) 561,200 324,722 0.13Kasikornbank (Foreign) 44,200 279,277 0.11Thai Union Frozen Products ‘NVDR’ 82,500 194,040 0.08Supalai ‘NVDR’ 128,000 73,958 0.03Banpu ‘NVDR’ 2,800 37,680 0.02
total for thailand 5.15
Singapore DBS Group Holdings 254,500 3,092,198 1.26Keppel 309,900 2,791,000 1.14Olam International (1) 1,780,772 2,267,171 0.93Oversea-Chinese Banking 284,300 2,264,829 0.92CapitaLand 602,000 1,823,660 0.75Olam International Rights 21/01/2013 557,381 43,718 0.02
total for Singapore 5.02
malaysia CIMB Group Holdings 711,900 1,776,258 0.73UEM Land Holdings 2,367,000 1,625,474 0.66Gamuda 1,236,700 1,472,069 0.60IJM 764,700 1,245,326 0.51IHH Healthcare 873,200 962,290 0.39Mah Sing Group 1,335,300 903,882 0.37Astro Malaysia Holdings 635,300 623,250 0.26
total for malaysia 3.52
Laos Kolao Holdings (Cayman Islands) (2) 172,042 2,961,885 1.21
total for Laos 1.21
total for equities 95.72
mutual fund
Morgan Stanley Funds plc - US Dollar Liquidity Fund (Ireland) (2) (4) 9,107,144 9,107,144 3.72
total for mutual fund 3.72
total investment Securities 243,395,108 99.44
equities (continued)
equities (continued)
taiwan (continued)

Morgan Stanley Investment Funds 31 December 2012 4
Asian Equity Fund
DerivativeS
OtC and exchange traded derivatives as at 31 December 2012, expressed in US dollars.
forward foreign Currency exchange Contracts
maturity date
amount bought Ccy
amount sold Ccy Counterparty
Unrealised gain/(loss)
USD% of net
assets
24/01/2013 1,315,531 USD 110,686,184 JPY State Street 33,829 0.01
Unrealised Gain on forward foreign Currency exchange Contracts 33,829 0.01
24/01/2013 604,027 USD 52,219,302 JPY State Street (652) 0.00
Unrealised Loss on forward foreign Currency exchange Contracts (652) 0.00
net Unrealised Gain on forward foreign Currency exchange Contracts 33,177 0.01
total Derivatives 33,177 0.01
other assets less Liabilities 1,334,968 0.55
total net asset value 244,763,253 100.00
(1) All or part of this position is out on loan.(2) The country in brackets represents the country of incorporation of this security.(4) Managed by an affiliate of the Investment Adviser.

5 Morgan Stanley Investment Funds 31 December 2012
Please refer to the full prospectus for the Fund’s investment objective and policy.
Asia-Pacific Equity Fund
equities
australiaNational Australia Bank 159,256 4,132,713 3.73BHP Billiton 70,317 2,707,907 2.44Australia & New Zealand Banking Group 101,671 2,643,652 2.39Santos 173,084 1,994,249 1.80UGL 156,400 1,766,302 1.59Seek 233,600 1,697,346 1.53AMP 293,081 1,463,296 1.32Lend Lease Group 135,259 1,302,907 1.18AGL Energy 73,852 1,179,011 1.06Suncorp Group 85,623 903,880 0.82Incitec Pivot 264,327 886,224 0.80Treasury Wine Estates 162,296 790,096 0.71
total for australia 19.37
South Korea Samsung Electronics 4,204 5,976,439 5.39Hyundai Motor 11,160 2,275,044 2.05Nexon (Japan) (2) 94,100 941,346 0.85Hyundai Engineering & Construction 14,339 937,094 0.85Hyundai Glovis 4,430 917,005 0.83LG Chem 2,706 832,989 0.75NCSoft 4,675 656,837 0.59Woongjin Coway 14,720 600,247 0.54Hyundai Heavy Industries 2,537 572,494 0.52KT 15,670 521,190 0.47Cheil Worldwide 25,660 517,879 0.47Orion 501 515,937 0.47LG Display 17,730 513,716 0.46Able C&C 5,259 388,042 0.35Samsung Electronics Pfd 474 377,628 0.34LG Uplus 46,910 342,830 0.31Cheil Industries 3,642 320,639 0.29Shinhan Financial Group 7,820 283,819 0.26GS Retail 9,910 277,884 0.25Korean Air Lines 6,080 257,618 0.23YG Entertainment 3,709 213,344 0.19Samsung Life Insurance 2,331 205,999 0.19LG Household & Health Care 324 199,273 0.18Mando 1,629 195,581 0.18GS Retail 6,870 192,979 0.17SK C&C 1,123 108,177 0.10Korea Aerospace Industries 3,850 93,066 0.08Samsung Fire & Marine Insurance 446 91,125 0.08SM Entertainment 863 36,737 0.03
total for South Korea 17.47
China Tencent Holdings (Cayman Islands) (2) 55,900 1,795,957 1.62AIA Group (Hong Kong) (2) 393,800 1,537,043 1.39China Pacific Insurance Group ‘H’ 371,800 1,374,418 1.24China Construction Bank ‘H’ 1,662,000 1,333,848 1.20China Mobile (Hong Kong) (2) 93,500 1,088,789 0.98CNOOC (Hong Kong) (2) 487,000 1,054,401 0.95China Life Insurance ‘H’ 315,000 1,028,291 0.93Bank of China ‘H’ 1,996,000 891,090 0.80China Mengniu Dairy (Cayman Islands) (2) 305,000 865,780 0.78Belle International Holdings (Cayman Islands) (2) 370,000 802,995 0.73China Overseas Land & Investment (Hong Kong) (1) (2) 200,000 596,111 0.54Tsingtao Brewery ‘H’ 94,000 554,886 0.50Shanghai Pharmaceuticals Holding ‘H’ (1) 263,000 502,230 0.45Trinity (Bermuda) (2) 582,000 379,978 0.34Tingyi Cayman Islands Holding (Cayman Islands) (2) 126,000 350,350 0.32Qihoo 360 Technology ADR (Cayman Islands) (2) 11,889 342,879 0.31China Shenhua Energy ‘H’ 78,000 341,680 0.31
inveStment aim
To seek long term capital appreciation, measured in US dollars, through investment primarily in the equity securities of companies domiciled in or exercising the predominant part of their economic activity in the Asia-Pacific region, excluding Japan, thereby taking advantage of the dynamic economic growth capabilities of the region.
Statement of inveStmentS
transferable securities and money market instruments admitted to official exchange listing or dealt in on another regulated market. as at 31 December 2012, expressed in US dollars.
investments holdingsmarket
value% of net
assets
Morgan Stanley Investment Funds 31 December 2012 6
Asia-Pacific Equity Fund
Statement of inveStmentS (continued)
transferable securities and money market instruments admitted to official exchange listing or dealt in on another regulated market. as at 31 December 2012, expressed in US dollars.
investments holdingsmarket
value% of net
assets
investments holdingsmarket
value% of net
assets
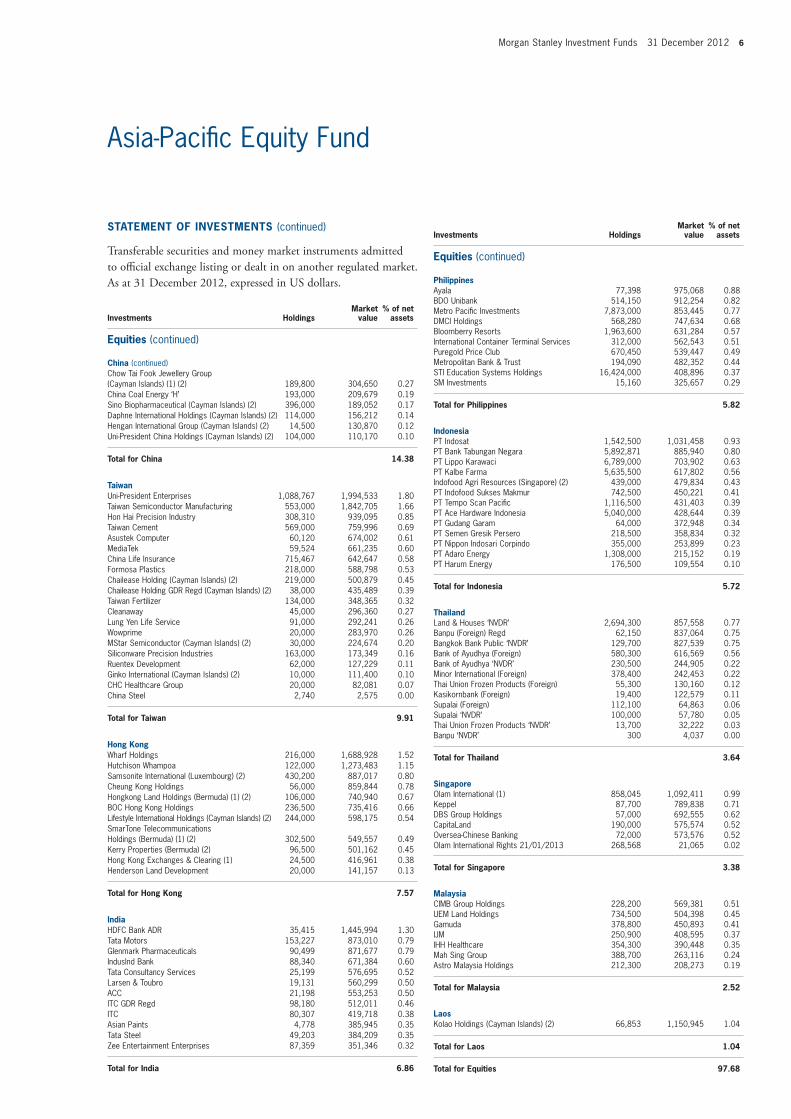
Philippines Ayala 77,398 975,068 0.88BDO Unibank 514,150 912,254 0.82Metro Pacific Investments 7,873,000 853,445 0.77DMCI Holdings 568,280 747,634 0.68Bloomberry Resorts 1,963,600 631,284 0.57International Container Terminal Services 312,000 562,543 0.51Puregold Price Club 670,450 539,447 0.49Metropolitan Bank & Trust 194,090 482,352 0.44STI Education Systems Holdings 16,424,000 408,896 0.37SM Investments 15,160 325,657 0.29
total for Philippines 5.82
indonesia PT Indosat 1,542,500 1,031,458 0.93PT Bank Tabungan Negara 5,892,871 885,940 0.80PT Lippo Karawaci 6,789,000 703,902 0.63PT Kalbe Farma 5,635,500 617,802 0.56Indofood Agri Resources (Singapore) (2) 439,000 479,834 0.43PT Indofood Sukses Makmur 742,500 450,221 0.41PT Tempo Scan Pacific 1,116,500 431,403 0.39PT Ace Hardware Indonesia 5,040,000 428,644 0.39PT Gudang Garam 64,000 372,948 0.34PT Semen Gresik Persero 218,500 358,834 0.32PT Nippon Indosari Corpindo 355,000 253,899 0.23PT Adaro Energy 1,308,000 215,152 0.19PT Harum Energy 176,500 109,554 0.10
total for indonesia 5.72
thailand Land & Houses ‘NVDR’ 2,694,300 857,558 0.77Banpu (Foreign) Regd 62,150 837,064 0.75Bangkok Bank Public ‘NVDR’ 129,700 827,539 0.75Bank of Ayudhya (Foreign) 580,300 616,569 0.56Bank of Ayudhya ‘NVDR’ 230,500 244,905 0.22Minor International (Foreign) 378,400 242,453 0.22Thai Union Frozen Products (Foreign) 55,300 130,160 0.12Kasikornbank (Foreign) 19,400 122,579 0.11Supalai (Foreign) 112,100 64,863 0.06Supalai ‘NVDR’ 100,000 57,780 0.05Thai Union Frozen Products ‘NVDR’ 13,700 32,222 0.03Banpu ‘NVDR’ 300 4,037 0.00
total for thailand 3.64
Singapore Olam International (1) 858,045 1,092,411 0.99Keppel 87,700 789,838 0.71DBS Group Holdings 57,000 692,555 0.62CapitaLand 190,000 575,574 0.52Oversea-Chinese Banking 72,000 573,576 0.52Olam International Rights 21/01/2013 268,568 21,065 0.02
total for Singapore 3.38
malaysia CIMB Group Holdings 228,200 569,381 0.51UEM Land Holdings 734,500 504,398 0.45Gamuda 378,800 450,893 0.41IJM 250,900 408,595 0.37IHH Healthcare 354,300 390,448 0.35Mah Sing Group 388,700 263,116 0.24Astro Malaysia Holdings 212,300 208,273 0.19
total for malaysia 2.52
Laos Kolao Holdings (Cayman Islands) (2) 66,853 1,150,945 1.04
total for Laos 1.04
total for equities 97.68
Chow Tai Fook Jewellery Group (Cayman Islands) (1) (2) 189,800 304,650 0.27China Coal Energy ‘H’ 193,000 209,679 0.19Sino Biopharmaceutical (Cayman Islands) (2) 396,000 189,052 0.17Daphne International Holdings (Cayman Islands) (2) 114,000 156,212 0.14Hengan International Group (Cayman Islands) (2) 14,500 130,870 0.12Uni-President China Holdings (Cayman Islands) (2) 104,000 110,170 0.10
total for China 14.38
taiwan Uni-President Enterprises 1,088,767 1,994,533 1.80Taiwan Semiconductor Manufacturing 553,000 1,842,705 1.66Hon Hai Precision Industry 308,310 939,095 0.85Taiwan Cement 569,000 759,996 0.69Asustek Computer 60,120 674,002 0.61MediaTek 59,524 661,235 0.60China Life Insurance 715,467 642,647 0.58Formosa Plastics 218,000 588,798 0.53Chailease Holding (Cayman Islands) (2) 219,000 500,879 0.45Chailease Holding GDR Regd (Cayman Islands) (2) 38,000 435,489 0.39Taiwan Fertilizer 134,000 348,365 0.32Cleanaway 45,000 296,360 0.27Lung Yen Life Service 91,000 292,241 0.26Wowprime 20,000 283,970 0.26MStar Semiconductor (Cayman Islands) (2) 30,000 224,674 0.20Siliconware Precision Industries 163,000 173,349 0.16Ruentex Development 62,000 127,229 0.11Ginko International (Cayman Islands) (2) 10,000 111,400 0.10CHC Healthcare Group 20,000 82,081 0.07China Steel 2,740 2,575 0.00
total for taiwan 9.91
hong Kong Wharf Holdings 216,000 1,688,928 1.52Hutchison Whampoa 122,000 1,273,483 1.15Samsonite International (Luxembourg) (2) 430,200 887,017 0.80Cheung Kong Holdings 56,000 859,844 0.78Hongkong Land Holdings (Bermuda) (1) (2) 106,000 740,940 0.67BOC Hong Kong Holdings 236,500 735,416 0.66Lifestyle International Holdings (Cayman Islands) (2) 244,000 598,175 0.54SmarTone Telecommunications Holdings (Bermuda) (1) (2) 302,500 549,557 0.49Kerry Properties (Bermuda) (2) 96,500 501,162 0.45Hong Kong Exchanges & Clearing (1) 24,500 416,961 0.38Henderson Land Development 20,000 141,157 0.13
total for hong Kong 7.57
india HDFC Bank ADR 35,415 1,445,994 1.30Tata Motors 153,227 873,010 0.79Glenmark Pharmaceuticals 90,499 871,677 0.79IndusInd Bank 88,340 671,384 0.60Tata Consultancy Services 25,199 576,695 0.52Larsen & Toubro 19,131 560,299 0.50ACC 21,198 553,253 0.50ITC GDR Regd 98,180 512,011 0.46ITC 80,307 419,718 0.38Asian Paints 4,778 385,945 0.35Tata Steel 49,203 384,209 0.35Zee Entertainment Enterprises 87,359 351,346 0.32
total for india 6.86
equities (continued)
equities (continued)
China (continued)

7 Morgan Stanley Investment Funds 31 December 2012
Asia-Pacific Equity Fund
mutual fund
Morgan Stanley Funds plc - US Dollar Liquidity Fund (Ireland) (2) (4) 2,856,313 2,856,313 2.58
total for mutual fund 2.58
total investment Securities 111,114,985 100.26
DerivativeS
OtC and exchange traded derivatives as at 31 December 2012, expressed in US dollars.
forward foreign Currency exchange Contracts
maturity date
amount bought Ccy
amount sold Ccy Counterparty
Unrealised gain/(loss)
USD% of net
assets
24/01/2013 484,373 USD 40,754,192 JPY State Street 12,456 0.01
Unrealised Gain on forward foreign Currency exchange Contracts 12,456 0.01
eUr hedged Share Class11/01/2013 12,948 EUR 17,064 USD J.P. Morgan 53 0.00
Unrealised Gain on nav hedged Share Classes forward foreign Currency exchange Contracts 53 0.00
total Unrealised Gain on forward foreign Currency exchange Contracts 12,509 0.01
24/01/2013 230,208 USD 19,901,951 JPY State Street (249) 0.00
Unrealised Loss on forward foreign Currency exchange Contracts (249) 0.00
eUr hedged Share Class 11/01/2013 1,239,019 EUR 1,639,394 USD J.P. Morgan (1,362) 0.00
Unrealised Loss on nav hedged Share Classes forward foreign Currency exchange Contracts (1,362) 0.00
total Unrealised Loss on forward foreign Currency exchange Contracts (1,611) 0.00
net Unrealised Gain on forward foreign Currency exchange Contracts 10,898 0.01
total Derivatives 10,898 0.01
other assets less Liabilities (296,397) (0.27)
total net asset value 110,829,486 100.00
(1) All or part of this position is out on loan.(2) The country in brackets represents the country of incorporation of this security.(4) Managed by an affiliate of the Investment Adviser.
Statement of inveStmentS (continued)
transferable securities and money market instruments admitted to official exchange listing or dealt in on another regulated market. as at 31 December 2012, expressed in US dollars.
investments holdingsmarket
value% of net
assets

Morgan Stanley Investment Funds 31 December 2012 8
Please refer to the full prospectus for the Fund’s investment objective and policy.
Asian Property Fund
equities
hong KongSun Hung Kai Properties 3,680,041 55,175,164 9.74Hongkong Land Holdings (Bermuda) (2) 3,774,000 26,380,260 4.66Hysan Development 4,381,705 21,059,801 3.72Kerry Properties (Bermuda) (2) 3,416,713 17,744,315 3.13Link REIT 3,416,000 17,057,433 3.01New World Development 8,436,451 13,084,258 2.31Henderson Land Development 1,833,118 12,937,864 2.28Sino Land 6,388,614 11,490,906 2.03Hang Lung Properties 2,747,000 10,916,772 1.93Wharf Holdings 1,351,122 10,564,575 1.86Swire Properties 2,985,850 9,958,946 1.76
total for hong Kong 36.43
JapanMitsubishi Estate 2,224,000 52,497,682 9.27Mitsui Fudosan 1,626,000 39,117,480 6.91Sumitomo Realty & Development 928,000 30,430,947 5.37Nippon Building Fund 971 10,031,963 1.77Japan Real Estate Investment 996 9,790,754 1.73GLP J-REIT 4,843 3,711,799 0.66NTT Urban Development 1,240 1,190,451 0.21Tokyo Tatemono 182,000 919,229 0.16United Urban Investment 779 893,710 0.16Daiwa House REIT Investment 119 756,365 0.13Japan Retail Fund Investment 273 500,665 0.09Activia Properties 76 476,792 0.09Japan Logistics Fund 29 252,376 0.04
total for Japan 26.59
australiaWestfield 3,723,388 40,813,293 7.21Westfield Retail Trust 4,841,731 15,177,737 2.68GPT Group 3,421,460 13,069,492 2.31Dexus Property 9,099,472 9,586,976 1.69Stockland 2,474,150 9,065,675 1.60Mirvac Group 5,325,687 8,209,213 1.45Goodman Group 1,729,365 7,772,737 1.37Centro Retail Australia REIT 2,564,574 6,042,832 1.07Commonwealth Property Office Fund 3,767,504 3,988,901 0.70CFS Retail Property Trust 2,000,582 3,976,716 0.70Investa Office Fund 565,875 1,744,522 0.31
total for australia 21.09
SingaporeCapitaLand 4,894,000 14,825,568 2.62CapitaMall Trust 4,643,000 8,096,996 1.43Global Logistic Properties 3,466,000 7,888,946 1.39City Developments 555,000 5,848,132 1.03CapitaMalls Asia 2,111,000 3,353,016 0.59CapitaCommercial Trust 2,391,000 3,298,566 0.58Suntec Real Estate Investment Trust 2,175,000 2,982,770 0.53UOL Group 602,000 2,942,500 0.52Mapletree Commercial Trust 1,682,000 1,673,200 0.30Keppel Land 344,000 1,135,035 0.20
total for Singapore 9.19
inveStment aim
To seek long-term capital appreciation, measured in US dollars, through investment in the equity securities of companies in the Asian and Oceanian real estate industry.
Statement of inveStmentS
transferable securities and money market instruments admitted to official exchange listing or dealt in on another regulated market. as at 31 December 2012, expressed in US dollars.
investments holdingsmarket
value% of net
assets
9 Morgan Stanley Investment Funds 31 December 2012
Asian Property Fund
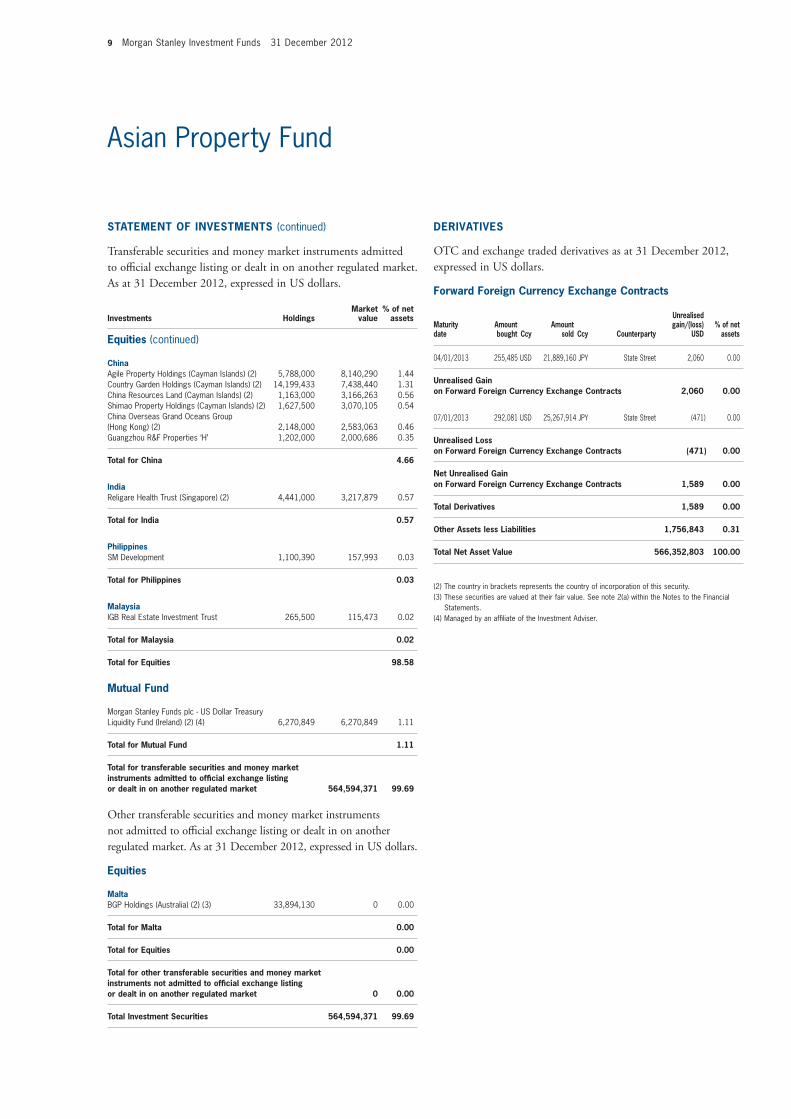
Statement of inveStmentS (continued)
ChinaAgile Property Holdings (Cayman Islands) (2) 5,788,000 8,140,290 1.44Country Garden Holdings (Cayman Islands) (2) 14,199,433 7,438,440 1.31China Resources Land (Cayman Islands) (2) 1,163,000 3,166,263 0.56Shimao Property Holdings (Cayman Islands) (2) 1,627,500 3,070,105 0.54China Overseas Grand Oceans Group (Hong Kong) (2) 2,148,000 2,583,063 0.46Guangzhou R&F Properties ‘H’ 1,202,000 2,000,686 0.35
total for China 4.66
indiaReligare Health Trust (Singapore) (2) 4,441,000 3,217,879 0.57
total for india 0.57
PhilippinesSM Development 1,100,390 157,993 0.03
total for Philippines 0.03
malaysiaIGB Real Estate Investment Trust 265,500 115,473 0.02
total for malaysia 0.02
total for equities 98.58
mutual fund
Morgan Stanley Funds plc - US Dollar Treasury Liquidity Fund (Ireland) (2) (4) 6,270,849 6,270,849 1.11
total for mutual fund 1.11
total for transferable securities and money market instruments admitted to official exchange listing or dealt in on another regulated market 564,594,371 99.69
Other transferable securities and money market instruments not admitted to official exchange listing or dealt in on another regulated market. as at 31 December 2012, expressed in US dollars.
equities
maltaBGP Holdings (Australia) (2) (3) 33,894,130 0 0.00
total for malta 0.00
total for equities 0.00
total for other transferable securities and money market instruments not admitted to official exchange listing or dealt in on another regulated market 0 0.00
total investment Securities 564,594,371 99.69
DerivativeS
OtC and exchange traded derivatives as at 31 December 2012, expressed in US dollars.
forward foreign Currency exchange Contracts
maturity date
amount bought Ccy
amount sold Ccy Counterparty
Unrealised gain/(loss)
USD% of net
assets
04/01/2013 255,485 USD 21,889,160 JPY State Street 2,060 0.00
Unrealised Gain on forward foreign Currency exchange Contracts 2,060 0.00
07/01/2013 292,081 USD 25,267,914 JPY State Street (471) 0.00
Unrealised Loss on forward foreign Currency exchange Contracts (471) 0.00
net Unrealised Gain on forward foreign Currency exchange Contracts 1,589 0.00
total Derivatives 1,589 0.00
other assets less Liabilities 1,756,843 0.31
total net asset value 566,352,803 100.00
(2) The country in brackets represents the country of incorporation of this security.(3) These securities are valued at their fair value. See note 2(a) within the Notes to the Financial
Statements.(4) Managed by an affiliate of the Investment Adviser.
transferable securities and money market instruments admitted to official exchange listing or dealt in on another regulated market. as at 31 December 2012, expressed in US dollars.
investments holdingsmarket
value% of net
assets equities (continued)

Morgan Stanley Investment Funds 31 December 2012 10
Please refer to the full prospectus for the Fund’s investment objective and policy.
equities
South africaSasol 389,720 12,612,921 6.12Naspers ‘N’ 217,374 10,533,266 5.11AngloGold Ashanti 329,340 7,707,343 3.74SABMiller (United Kingdom) (2) 140,043 4,865,166 2.36Pick n Pay Stores 1,194,516 4,740,783 2.30Clicks Group 765,252 4,431,102 2.15Life Healthcare Group Holdings 1,380,300 4,186,471 2.03AVI 733,466 3,922,517 1.90Impala Platinum Holdings 161,884 2,421,769 1.18
total for South africa 26.89
russiaLukoil ADR 301,610 15,092,707 7.33Sberbank 3,899,371 9,001,440 4.37Gazprom ADR 1,122,843 8,035,293 3.90Eurasia Drilling GDR Regd (Cayman Islands) (2) 294,019 7,940,268 3.85Mail.ru Group GDR Regd (British Virgin Islands) (2) 192,600 5,026,515 2.44MegaFon OJSC GDR Regd 217,626 3,918,134 1.90NovaTek GDR Regd 33,000 2,990,628 1.45TNK-BP Holding 1,388,200 2,001,694 0.97
total for russia 26.21
turkeyTurkiye Garanti Bankasi 2,656,706 10,463,178 5.08Anadolu Efes Biracilik Ve Malt Sanayii 656,291 7,198,357 3.49Haci Omer Sabanci Holding 1,611,134 6,741,022 3.27Turkiye Halk Bankasi 650,615 4,876,795 2.37Ulker Biskuvi Sanayi 813,392 3,348,138 1.63Tupras Turkiye Petrol Rafinerileri 118,281 2,542,074 1.23
total for turkey 17.07
PolandLPP 5,972 6,664,262 3.23Eurocash 471,364 5,051,946 2.45Powszechny Zaklad Ubezpieczen 45,557 4,882,671 2.37Jeronimo Martins SGPS (Portugal) (2) 323,977 4,730,064 2.30Polskie Gornictwo Naftowe i Gazownictwo 3,597,897 4,597,347 2.23Telekomunikacja Polska 900,062 2,699,726 1.31Alior Bank 146,725 2,254,478 1.09Integer.pl 46,355 2,097,557 1.02
total for Poland 16.00
United States of americaEPAM Systems 322,000 4,647,569 2.26Schlumberger (Curacao) (2) 55,000 2,827,533 1.37
total for United States of america 3.63
hungaryRichter Gedeon 49,415 6,146,977 2.98
total for hungary 2.98
romaniaFondul Proprietatea 26,646,810 3,293,896 1.60
total for romania 1.60
inveStment aim
To seek long-term capital appreciation, measured in Euro, by investing primarily in equity securities of issuers in Central, Eastern and Southern Europe (including the Russian Federation), the Middle East and Africa.
Statement of inveStmentS
transferable securities and money market instruments admitted to official exchange listing or dealt in on another regulated market. as at 31 December 2012, expressed in euro.
investments holdingsmarket
value% of net
assets
Emerging Europe, Middle East and Africa Equity Fund

11 Morgan Stanley Investment Funds 31 December 2012
Statement of inveStmentS (continued)
transferable securities and money market instruments admitted to official exchange listing or dealt in on another regulated market. as at 31 December 2012, expressed in euro.
investments holdingsmarket
value% of net
assets
egyptJuhayna Food Industries 2,214,797 2,024,264 0.98Commercial International Bank 261,085 1,072,724 0.52
total for egypt 1.50
austriaVienna Insurance Group 69,359 2,800,370 1.36
total for austria 1.36
total for equities 97.24
mutual fund
Morgan Stanley Funds plc - US Dollar Liquidity Fund (Ireland) (2) (4) 4,202,795 3,179,287 1.54
total for mutual fund 1.54
total investment Securities 203,568,252 98.78
other assets less Liabilities 2,509,788 1.22
total net asset value 206,078,040 100.00
(2) The country in brackets represents the country of incorporation of this security.(4) Managed by an affiliate of the Investment Adviser.
Emerging Europe, Middle East and Africa Equity Fund
equities (continued)

Morgan Stanley Investment Funds 31 December 2012 12
Please refer to the full prospectus for the Fund’s investment objective and policy.
equities
india GlaxoSmithKline Consumer Healthcare Wts exp. 04/11/2015 (Curacao) (2) 32,071 2,218,524 4.84Akzo Nobel India Wts exp. 04/12/2017 (Australia) (2) 78,602 1,372,532 2.99ITC Wts exp. 04/08/2015 (Curacao) (2) 256,414 1,337,199 2.91Religare Health Trust (Singapore) (2) 1,141,000 826,751 1.80Zee Entertainment Enterprises Wts exp. 09/12/2015 (Curacao) (2) 83,975 337,000 0.74Agro Tech Foods Wts exp. 26/11/2015 (Australia) (2) 30,871 287,276 0.63ITC Wts exp. 28/05/2013 (Australia) (2) 36,824 192,458 0.42
total for india 14.33
United States of america Yum! Brands 44,878 2,919,314 6.37Mead Johnson Nutrition 32,192 2,092,480 4.56
total for United States of america 10.93
China Tsingtao Brewery ‘H’ 332,000 1,959,810 4.27China Mengniu Dairy (Cayman Islands) (2) 470,000 1,334,152 2.91Ajisen China Holdings (Cayman Islands) (2) 1,180,000 1,126,675 2.45Tingyi Cayman Islands Holding (Cayman Islands) (2) 148,000 411,523 0.90
total for China 10.53
Brazil Companhia de Bebidas das Americas ADR Pfd 38,300 1,596,344 3.48Fleury 77,700 873,864 1.90Diagnosticos da America 105,200 677,037 1.48Raia Drogasil 39,800 448,005 0.98
total for Brazil 7.84
South africa SABMiller (United Kingdom) (2) 55,720 2,557,818 5.58Life Healthcare Group Holdings 248,600 996,745 2.17
total for South africa 7.75
South Korea Hyundai Mobis 6,415 1,727,200 3.76Nexon (Japan) (2) 117,300 1,173,432 2.56
total for South Korea 6.32
hong Kong Samsonite International (Luxembourg) (2) 1,331,700 2,745,794 5.99
total for hong Kong 5.99
russia O’Key Group GDR Regd (Luxembourg) (2) 202,800 2,372,760 5.17
total for russia 5.17
inveStment aim
To seek long-term capital appreciation, measured in US dollars, through investment primarily in a concentrated portfolio of equity securities in emerging and frontier countries.
Statement of inveStmentS
transferable securities and money market instruments admitted to official exchange listing or dealt in on another regulated market. as at 31 December 2012, expressed in US dollars.
investments holdingsmarket
value% of net
assets
Emerging Leaders Equity Fund*
* Fund commenced operations on 17 August 2012.

13 Morgan Stanley Investment Funds 31 December 2012
Emerging Leaders Equity Fund
Statement of inveStmentS (continued)
transferable securities and money market instruments admitted to official exchange listing or dealt in on another regulated market. as at 31 December 2012, expressed in US dollars.
investments holdingsmarket
value% of net
assets
United Kingdom British American Tobacco 29,527 1,497,453 3.27Diageo ADR 5,815 674,831 1.47
total for United Kingdom 4.74
thailand Bangkok Bank Public ‘NVDR’ 200,500 1,279,272 2.79Big C Supercenter ‘NVDR’ 120,000 811,026 1.77
total for thailand 4.56
Switzerland Swatch Group ‘Bearer’ 2,421 1,222,561 2.66
total for Switzerland 2.66
turkey Anadolu Efes Biracilik Ve Malt Sanayii 84,145 1,220,039 2.66
total for turkey 2.66
Chile SACI Falabella 66,541 685,339 1.49Cencosud 94,777 513,771 1.12
total for Chile 2.61
indonesia PT Bank Rakyat Indonesia Persero 1,267,500 911,864 1.99
total for indonesia 1.99
Poland Jeronimo Martins SGPS (Portugal) (2) 40,578 783,163 1.71
total for Poland 1.71
mexico Wal-Mart de Mexico ‘V’ 227,600 738,967 1.61
total for mexico 1.61
Peru Credicorp (Bermuda) (2) 3,200 467,936 1.01
total for Peru 1.01
total for equities 92.41
mutual fund
Morgan Stanley Funds plc - US Dollar Liquidity Fund (Ireland) (2) (4) 3,400,973 3,400,973 7.41
total for mutual fund 7.41
total investment Securities 45,791,888 99.82
DerivativeS
OtC and exchange traded derivatives as at 31 December 2012, expressed in US dollars.
forward foreign Currency exchange Contracts
maturity date
amount bought Ccy
amount sold Ccy Counterparty
Unrealised gain/(loss)
USD% of net
assets
07/01/2013 228,610 ZAR 26,928 USD RBS 12 0.00
Unrealised Gain on forward foreign Currency exchange Contracts 12 0.00
eUr hedged Share Class 11/01/2013 254,972 EUR 336,053 USD J.P. Morgan 1,031 0.00
Unrealised Gain on nav hedged Share Classes forward foreign Currency exchange Contracts 1,031 0.00
total Unrealised Gain on forward foreign Currency exchange Contracts 1,043 0.00
eUr hedged Share Class 11/01/2013 8,041,255 EUR 10,641,555 USD J.P. Morgan (10,699) (0.02)
total Unrealised Loss on forward foreign Currency exchange Contracts (10,699) (0.02)
net Unrealised Loss on forward foreign Currency exchange Contracts (9,656) (0.02)
total Derivatives (9,656) (0.02)
other assets less Liabilities 91,557 0.20
total net asset value 45,873,789 100.00
(2) The country in brackets represents the country of incorporation of this security.(4) Managed by an affiliate of the Investment Adviser.
equities (continued)
Morgan Stanley Investment Funds 31 December 2012 14
Please refer to the full prospectus for the Fund’s investment objective and policy.
Emerging Markets Equity Fund
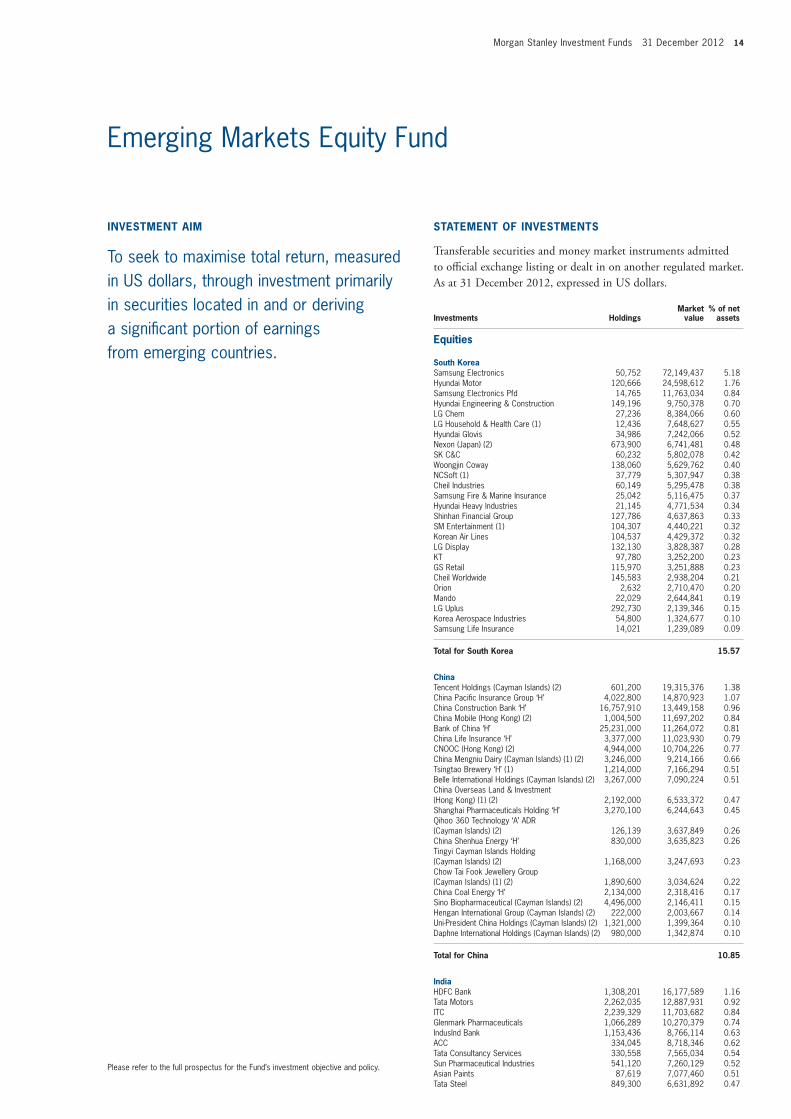
equities
South KoreaSamsung Electronics 50,752 72,149,437 5.18Hyundai Motor 120,666 24,598,612 1.76Samsung Electronics Pfd 14,765 11,763,034 0.84Hyundai Engineering & Construction 149,196 9,750,378 0.70LG Chem 27,236 8,384,066 0.60LG Household & Health Care (1) 12,436 7,648,627 0.55Hyundai Glovis 34,986 7,242,066 0.52Nexon (Japan) (2) 673,900 6,741,481 0.48SK C&C 60,232 5,802,078 0.42Woongjin Coway 138,060 5,629,762 0.40NCSoft (1) 37,779 5,307,947 0.38Cheil Industries 60,149 5,295,478 0.38Samsung Fire & Marine Insurance 25,042 5,116,475 0.37Hyundai Heavy Industries 21,145 4,771,534 0.34Shinhan Financial Group 127,786 4,637,863 0.33SM Entertainment (1) 104,307 4,440,221 0.32Korean Air Lines 104,537 4,429,372 0.32LG Display 132,130 3,828,387 0.28KT 97,780 3,252,200 0.23GS Retail 115,970 3,251,888 0.23Cheil Worldwide 145,583 2,938,204 0.21Orion 2,632 2,710,470 0.20Mando 22,029 2,644,841 0.19LG Uplus 292,730 2,139,346 0.15Korea Aerospace Industries 54,800 1,324,677 0.10Samsung Life Insurance 14,021 1,239,089 0.09
total for South Korea 15.57
ChinaTencent Holdings (Cayman Islands) (2) 601,200 19,315,376 1.38China Pacific Insurance Group ‘H’ 4,022,800 14,870,923 1.07China Construction Bank ‘H’ 16,757,910 13,449,158 0.96China Mobile (Hong Kong) (2) 1,004,500 11,697,202 0.84Bank of China ‘H’ 25,231,000 11,264,072 0.81China Life Insurance ‘H’ 3,377,000 11,023,930 0.79CNOOC (Hong Kong) (2) 4,944,000 10,704,226 0.77China Mengniu Dairy (Cayman Islands) (1) (2) 3,246,000 9,214,166 0.66Tsingtao Brewery ‘H’ (1) 1,214,000 7,166,294 0.51Belle International Holdings (Cayman Islands) (2) 3,267,000 7,090,224 0.51China Overseas Land & Investment (Hong Kong) (1) (2) 2,192,000 6,533,372 0.47Shanghai Pharmaceuticals Holding ‘H’ 3,270,100 6,244,643 0.45Qihoo 360 Technology ‘A’ ADR (Cayman Islands) (2) 126,139 3,637,849 0.26China Shenhua Energy ‘H’ 830,000 3,635,823 0.26Tingyi Cayman Islands Holding (Cayman Islands) (2) 1,168,000 3,247,693 0.23Chow Tai Fook Jewellery Group (Cayman Islands) (1) (2) 1,890,600 3,034,624 0.22China Coal Energy ‘H’ 2,134,000 2,318,416 0.17Sino Biopharmaceutical (Cayman Islands) (2) 4,496,000 2,146,411 0.15Hengan International Group (Cayman Islands) (2) 222,000 2,003,667 0.14Uni-President China Holdings (Cayman Islands) (2) 1,321,000 1,399,364 0.10Daphne International Holdings (Cayman Islands) (2) 980,000 1,342,874 0.10
total for China 10.85
indiaHDFC Bank 1,308,201 16,177,589 1.16Tata Motors 2,262,035 12,887,931 0.92ITC 2,239,329 11,703,682 0.84Glenmark Pharmaceuticals 1,066,289 10,270,379 0.74IndusInd Bank 1,153,436 8,766,114 0.63ACC 334,045 8,718,346 0.62Tata Consultancy Services 330,558 7,565,034 0.54Sun Pharmaceutical Industries 541,120 7,260,129 0.52Asian Paints 87,619 7,077,460 0.51Tata Steel 849,300 6,631,892 0.47
Statement of inveStmentS
transferable securities and money market instruments admitted to official exchange listing or dealt in on another regulated market. as at 31 December 2012, expressed in US dollars.
investments holdingsmarket
value% of net
assets
inveStment aim
To seek to maximise total return, measured in US dollars, through investment primarily in securities located in and or deriving a significant portion of earnings from emerging countries.
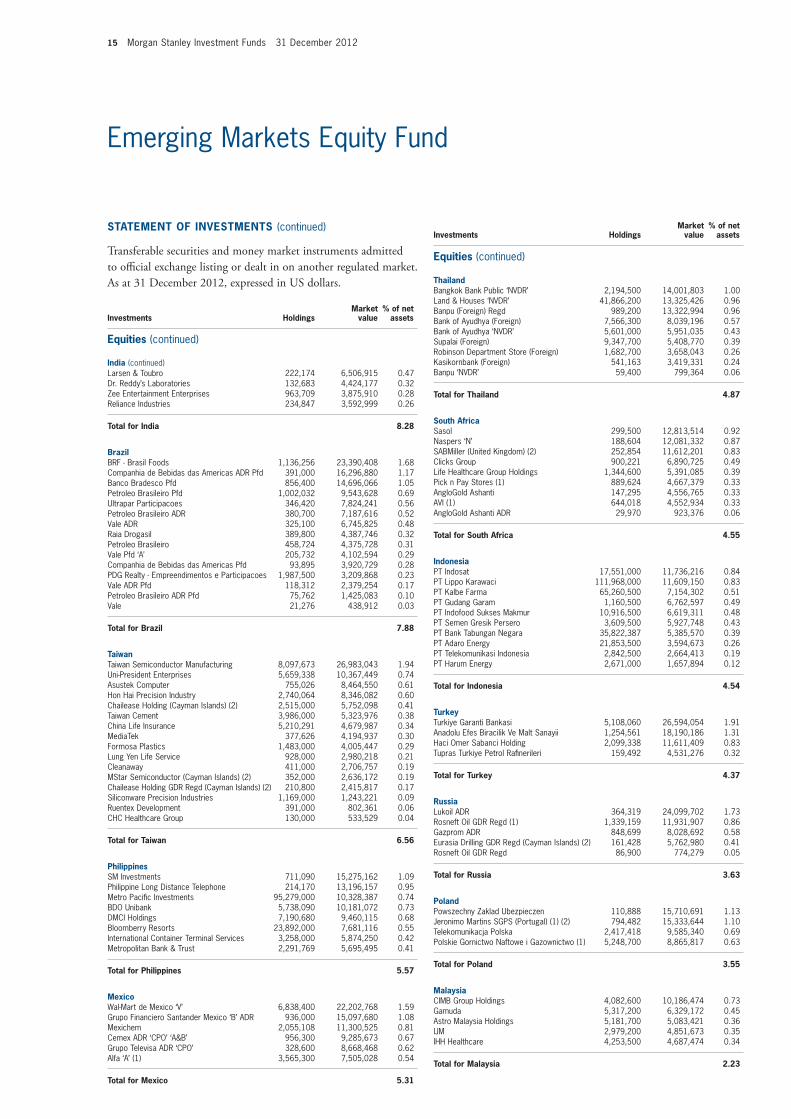
15 Morgan Stanley Investment Funds 31 December 2012
Statement of inveStmentS (continued)
transferable securities and money market instruments admitted to official exchange listing or dealt in on another regulated market. as at 31 December 2012, expressed in US dollars.
investments holdingsmarket
value% of net
assets
Larsen & Toubro 222,174 6,506,915 0.47Dr. Reddy’s Laboratories 132,683 4,424,177 0.32Zee Entertainment Enterprises 963,709 3,875,910 0.28Reliance Industries 234,847 3,592,999 0.26
total for india 8.28
BrazilBRF - Brasil Foods 1,136,256 23,390,408 1.68Companhia de Bebidas das Americas ADR Pfd 391,000 16,296,880 1.17Banco Bradesco Pfd 856,400 14,696,066 1.05Petroleo Brasileiro Pfd 1,002,032 9,543,628 0.69Ultrapar Participacoes 346,420 7,824,241 0.56Petroleo Brasileiro ADR 380,700 7,187,616 0.52Vale ADR 325,100 6,745,825 0.48Raia Drogasil 389,800 4,387,746 0.32Petroleo Brasileiro 458,724 4,375,728 0.31Vale Pfd ‘A’ 205,732 4,102,594 0.29Companhia de Bebidas das Americas Pfd 93,895 3,920,729 0.28PDG Realty - Empreendimentos e Participacoes 1,987,500 3,209,868 0.23Vale ADR Pfd 118,312 2,379,254 0.17Petroleo Brasileiro ADR Pfd 75,762 1,425,083 0.10Vale 21,276 438,912 0.03
total for Brazil 7.88
taiwanTaiwan Semiconductor Manufacturing 8,097,673 26,983,043 1.94Uni-President Enterprises 5,659,338 10,367,449 0.74Asustek Computer 755,026 8,464,550 0.61Hon Hai Precision Industry 2,740,064 8,346,082 0.60Chailease Holding (Cayman Islands) (2) 2,515,000 5,752,098 0.41Taiwan Cement 3,986,000 5,323,976 0.38China Life Insurance 5,210,291 4,679,987 0.34MediaTek 377,626 4,194,937 0.30Formosa Plastics 1,483,000 4,005,447 0.29Lung Yen Life Service 928,000 2,980,218 0.21Cleanaway 411,000 2,706,757 0.19MStar Semiconductor (Cayman Islands) (2) 352,000 2,636,172 0.19Chailease Holding GDR Regd (Cayman Islands) (2) 210,800 2,415,817 0.17Siliconware Precision Industries 1,169,000 1,243,221 0.09Ruentex Development 391,000 802,361 0.06CHC Healthcare Group 130,000 533,529 0.04
total for taiwan 6.56
PhilippinesSM Investments 711,090 15,275,162 1.09Philippine Long Distance Telephone 214,170 13,196,157 0.95Metro Pacific Investments 95,279,000 10,328,387 0.74BDO Unibank 5,738,090 10,181,072 0.73DMCI Holdings 7,190,680 9,460,115 0.68Bloomberry Resorts 23,892,000 7,681,116 0.55International Container Terminal Services 3,258,000 5,874,250 0.42Metropolitan Bank & Trust 2,291,769 5,695,495 0.41
total for Philippines 5.57
mexicoWal-Mart de Mexico ‘V’ 6,838,400 22,202,768 1.59Grupo Financiero Santander Mexico ‘B’ ADR 936,000 15,097,680 1.08Mexichem 2,055,108 11,300,525 0.81Cemex ADR ‘CPO’ ‘A&B’ 956,300 9,285,673 0.67Grupo Televisa ADR ‘CPO’ 328,600 8,668,468 0.62Alfa ‘A’ (1) 3,565,300 7,505,028 0.54
total for mexico 5.31
thailandBangkok Bank Public ‘NVDR’ 2,194,500 14,001,803 1.00Land & Houses ‘NVDR’ 41,866,200 13,325,426 0.96Banpu (Foreign) Regd 989,200 13,322,994 0.96Bank of Ayudhya (Foreign) 7,566,300 8,039,196 0.57Bank of Ayudhya ‘NVDR’ 5,601,000 5,951,035 0.43Supalai (Foreign) 9,347,700 5,408,770 0.39Robinson Department Store (Foreign) 1,682,700 3,658,043 0.26Kasikornbank (Foreign) 541,163 3,419,331 0.24Banpu ‘NVDR’ 59,400 799,364 0.06
total for thailand 4.87
South africaSasol 299,500 12,813,514 0.92Naspers ‘N’ 188,604 12,081,332 0.87SABMiller (United Kingdom) (2) 252,854 11,612,201 0.83Clicks Group 900,221 6,890,725 0.49Life Healthcare Group Holdings 1,344,600 5,391,085 0.39Pick n Pay Stores (1) 889,624 4,667,379 0.33AngloGold Ashanti 147,295 4,556,765 0.33AVI (1) 644,018 4,552,934 0.33AngloGold Ashanti ADR 29,970 923,376 0.06
total for South africa 4.55
indonesiaPT Indosat 17,551,000 11,736,216 0.84PT Lippo Karawaci 111,968,000 11,609,150 0.83PT Kalbe Farma 65,260,500 7,154,302 0.51PT Gudang Garam 1,160,500 6,762,597 0.49PT Indofood Sukses Makmur 10,916,500 6,619,311 0.48PT Semen Gresik Persero 3,609,500 5,927,748 0.43PT Bank Tabungan Negara 35,822,387 5,385,570 0.39PT Adaro Energy 21,853,500 3,594,673 0.26PT Telekomunikasi Indonesia 2,842,500 2,664,413 0.19PT Harum Energy 2,671,000 1,657,894 0.12
total for indonesia 4.54
turkeyTurkiye Garanti Bankasi 5,108,060 26,594,054 1.91Anadolu Efes Biracilik Ve Malt Sanayii 1,254,561 18,190,186 1.31Haci Omer Sabanci Holding 2,099,338 11,611,409 0.83Tupras Turkiye Petrol Rafinerileri 159,492 4,531,276 0.32
total for turkey 4.37
russiaLukoil ADR 364,319 24,099,702 1.73Rosneft Oil GDR Regd (1) 1,339,159 11,931,907 0.86Gazprom ADR 848,699 8,028,692 0.58Eurasia Drilling GDR Regd (Cayman Islands) (2) 161,428 5,762,980 0.41Rosneft Oil GDR Regd 86,900 774,279 0.05
total for russia 3.63
PolandPowszechny Zaklad Ubezpieczen 110,888 15,710,691 1.13Jeronimo Martins SGPS (Portugal) (1) (2) 794,482 15,333,644 1.10Telekomunikacja Polska 2,417,418 9,585,340 0.69Polskie Gornictwo Naftowe i Gazownictwo (1) 5,248,700 8,865,817 0.63
total for Poland 3.55
malaysiaCIMB Group Holdings 4,082,600 10,186,474 0.73Gamuda 5,317,200 6,329,172 0.45Astro Malaysia Holdings 5,181,700 5,083,421 0.36IJM 2,979,200 4,851,673 0.35IHH Healthcare 4,253,500 4,687,474 0.34
total for malaysia 2.23
investments holdingsmarket
value% of net
assets equities (continued)
equities (continued)
india (continued)
Emerging Markets Equity Fund

Morgan Stanley Investment Funds 31 December 2012 16
investments holdingsmarket
value% of net
assets Statement of inveStmentS (continued)
transferable securities and money market instruments admitted to official exchange listing or dealt in on another regulated market. as at 31 December 2012, expressed in US dollars.
investments holdingsmarket
value% of net
assets
ChileSACI Falabella 1,018,393 10,488,937 0.75Sociedad Quimica y Minera de Chile ADR 180,100 10,236,884 0.74Empresa Nacional de Electricidad 3,372,670 5,481,011 0.39
total for Chile 1.88
United States of americaYum! Brands 201,113 13,082,401 0.94Mead Johnson Nutrition 154,515 10,043,475 0.72
total for United States of america 1.66
PeruCredicorp (Bermuda) (2) 115,710 16,920,273 1.21
total for Peru 1.21
ColombiaCemex Latam Holdings (Spain) (2) 587,771 3,785,418 0.27Grupo de Inversiones Suramericana pfd 157,600 3,478,438 0.25Grupo de Inversiones Suramericana 160,130 3,443,656 0.25Almacenes Exito 142,751 2,867,946 0.20
total for Colombia 0.97
hungaryRichter Gedeon 74,798 12,299,889 0.88
total for hungary 0.88
hong KongSamsonite International (Luxembourg) (2) 5,109,000 10,534,102 0.76
total for hong Kong 0.76
SwitzerlandSwatch Group ‘Bearer’ 19,567 9,880,981 0.71
total for Switzerland 0.71
QatarIndustries Qatar 176,700 7,527,100 0.54
total for Qatar 0.54
PanamaCopa Holdings ‘A’ 67,300 6,670,776 0.48
total for Panama 0.48
austriaVienna Insurance Group 42,652 2,276,462 0.16
total for austria 0.16
total for equities 97.01
mutual funds
Morgan Stanley Funds plc - US Dollar Liquidity Fund (Ireland) (2) (4) 33,521,771 33,521,771 2.40Morgan Stanley Growth Fund (India) (2) (4) 5,372,744 6,502,513 0.47
total for mutual funds 2.87
total for transferable securities and money market instruments admitted to official exchange listing or dealt in on another regulated market 1,392,675,886 99.88
Other transferable securities and money market instruments not admitted to official exchange listing or dealt in on another regulated market. as at 31 December 2012, expressed in US dollars.
equities
BrazilLojas Arapua Pfd (3) 11,491,000 0 0.00Banco Nacional Pfd (3) 30,754,160 0 0.00
total for Brazil 0.00
russiaAlliance Celluose (United States of America) (2) (3) 50,000 0 0.00
total for russia 0.00
total for equities 0.00
total for other transferable securities and money market instruments not admitted to official exchange listing or dealt in on another regulated market 0 0.00
total investment Securities 1,392,675,886 99.88
DerivativeS
OtC and exchange traded derivatives as at 31 December 2012, expressed in US dollars.
forward foreign Currency exchange Contracts
maturity date
amount bought Ccy
amount sold Ccy Counterparty
Unrealised gain/(loss)
USD% of net
assets
24/01/2013 3,516,485 USD 295,870,026 JPY State Street 90,427 0.01
Unrealised Gain on forward foreign Currency exchange Contracts 90,427 0.01
24/01/2013 1,516,733 USD 131,124,612 JPY State Street (1,638) 0.00
Unrealised Loss on forward foreign Currency exchange Contracts (1,638) 0.00
net Unrealised Gain on forward foreign Currency exchange Contracts 88,789 0.01
total Derivatives 88,789 0.01
other assets less Liabilities 1,559,494 0.11
total net asset value 1,394,324,169 100.00
(1) All or part of this position is out on loan.(2) The country in brackets represents the country of incorporation of this security.(3) These securities are valued at their fair value. See note 2(a) within the Notes to the Financial
Statements.(4) Managed by an affiliate of the Investment Adviser.
equities (continued)
Emerging Markets Equity Fund

17 Morgan Stanley Investment Funds 31 December 2012
Please refer to the full prospectus for the Fund’s investment objective and policy.
European Equity Alpha Fund
equities
United KingdomHSBC Holdings 3,126,066 24,858,038 4.41Royal Dutch Shell ‘A’ 738,369 19,259,738 3.42BP 3,591,240 18,752,557 3.33Vodafone Group 9,184,074 17,436,320 3.10British American Tobacco 423,217 16,236,351 2.88GlaxoSmithKline 950,353 15,595,445 2.77Barclays 4,622,842 14,910,920 2.65Reckitt Benckiser Group 286,419 13,656,932 2.42Prudential 1,276,140 13,576,785 2.41BG Group 979,883 12,195,534 2.17Xstrata 912,035 11,872,414 2.11Imperial Tobacco Group 389,635 11,365,466 2.02Rolls-Royce Holdings 973,975 10,457,847 1.86Experian (Jersey) (2) 855,996 10,311,678 1.83Tullow Oil 630,930 9,779,751 1.74
total for United Kingdom 39.12
GermanySiemens Regd 218,032 17,922,230 3.18Bayer Regd 213,054 15,316,452 2.72Volkswagen Pfd 78,673 13,543,557 2.41Daimler Regd 324,396 13,404,043 2.38Muenchener Rueckversicherungs Regd 89,587 12,183,832 2.16Fresenius & Co. 121,858 10,613,832 1.89MAN 90,937 7,343,163 1.30
total for Germany 16.04
SwitzerlandNestlé Regd 542,824 26,796,828 4.76Novartis Regd 458,643 21,824,429 3.88Roche Holding ‘Genusschein’ 135,633 20,670,990 3.67Zurich Insurance Group 64,105 12,902,571 2.29
total for Switzerland 14.60
franceBNP Paribas 372,123 15,846,858 2.82Schneider Electric 258,216 14,157,983 2.51AXA 956,708 12,772,052 2.27Société Générale 401,882 11,389,336 2.02SES (Luxembourg) (2) 438,327 9,513,888 1.69Accor 299,178 7,986,557 1.42
total for france 12.73
netherlandsReed Elsevier 897,584 10,039,477 1.78DE Master Blenders 1753 1,000,313 8,721,729 1.55ArcelorMittal (Luxembourg) (2) 589,013 7,618,883 1.36
total for netherlands 4.69
SpainBanco Bilbao Vizcaya Argentaria 2,118,083 14,741,858 2.62Amadeus IT Holding ‘A’ 503,834 9,598,038 1.70
total for Spain 4.32
inveStment aim
To seek long-term capital growth, measured in Euro, through investment primarily in a concentrated portfolio of equity securities of companies listed on European Stock Exchanges.
Statement of inveStmentS
transferable securities and money market instruments admitted to official exchange listing or dealt in on another regulated market. as at 31 December 2012, expressed in euro.
investments holdingsmarket
value% of net
assets

Morgan Stanley Investment Funds 31 December 2012 18
European Equity Alpha Fund
Statement of inveStmentS (continued)
transferable securities and money market instruments admitted to official exchange listing or dealt in on another regulated market. as at 31 December 2012, expressed in euro.
investments holdingsmarket
value% of net
assets
BelgiumUmicore 269,585 11,238,999 2.00
total for Belgium 2.00
finlandKone ‘B’ 188,030 10,492,074 1.86
total for finland 1.86
SwedenMillicom International Cellular SDR (Luxembourg) (2) 122,414 8,035,020 1.43
total for Sweden 1.43
PortugalGalp Energia SGPS 664,457 7,814,014 1.39
total for Portugal 1.39
total for equities 98.18
mutual fund
Morgan Stanley Funds plc - Euro Liquidity Fund (Ireland) (2) (4) 8,904,419 8,904,419 1.59
total for mutual fund 1.59
total for transferable securities and money market instruments admitted to official exchange listing or dealt in on another regulated market 561,658,888 99.77
Other transferable securities and money market instruments not admitted to official exchange listing or dealt in on another regulated market. as at 31 December 2012, expressed in euro.
equities
United KingdomRolls-Royce Holdings Pfd ‘C’ (3) 89,398,572 109,891 0.02
total for United Kingdom 0.02
total for equities 0.02
total for other transferable securities and money market instruments not admitted to official exchange listing or dealt in on another regulated market 109,891 0.02
total investment Securities 561,768,779 99.79
equities (continued)
DerivativeS
OtC and exchange traded derivatives as at 31 December 2012, expressed in euro.
forward foreign Currency exchange Contracts
maturity date
amount bought Ccy
amount sold Ccy Counterparty
Unrealised gain/(loss)
eUr% of net
assets
GBP hedged Share Class 11/01/2013 61,341,151 GBP 75,347,497 EUR J.P. Morgan 46,804 0.01
net Unrealised Gain on forward foreign Currency exchange Contracts 46,804 0.01
total Derivatives 46,804 0.01
other assets less Liabilities 1,157,554 0.20
total net asset value 562,973,137 100.00
(2) The country in brackets represents the country of incorporation of this security.(3) These securities are valued at their fair value. See note 2(a) within the Notes to the Financial
Statements.(4) Managed by an affiliate of the Investment Adviser.

19 Morgan Stanley Investment Funds 31 December 2012
Please refer to the full prospectus for the Fund’s investment objective and policy.
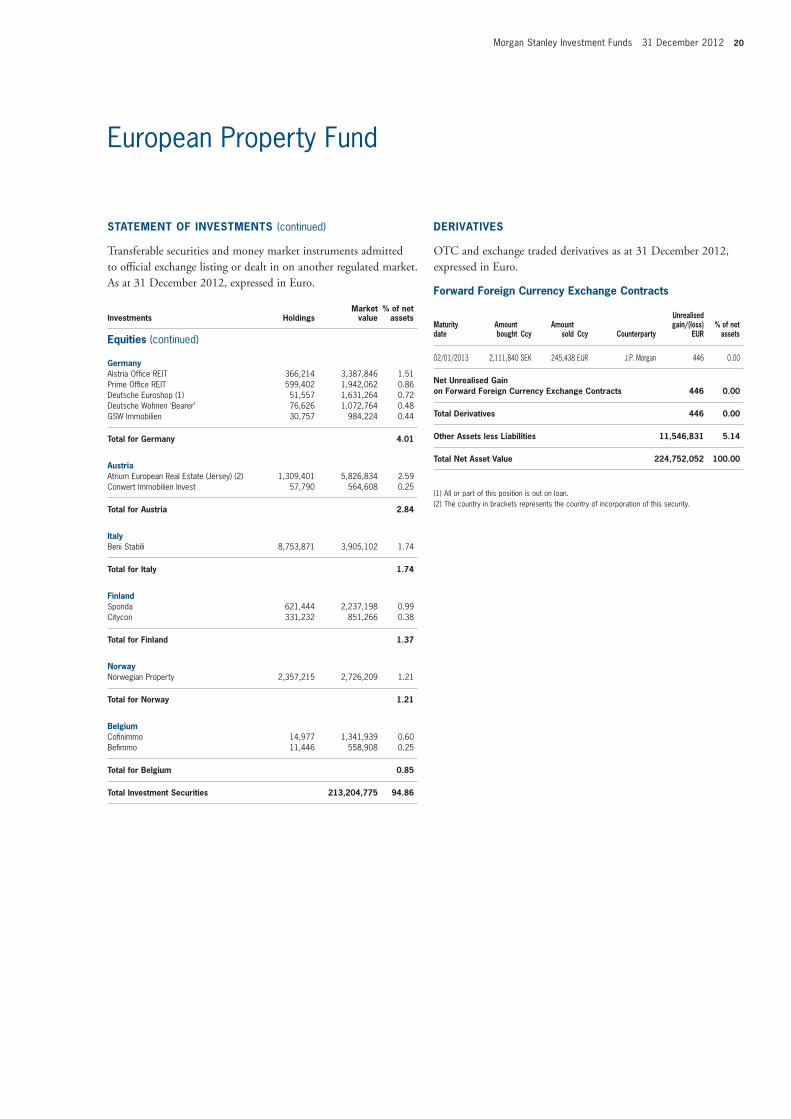
European Property Fund
equities
United KingdomLand Securities Group 1,449,721 14,496,846 6.45British Land 1,598,829 11,045,106 4.91Hammerson 1,796,600 10,783,746 4.80LXB Retail Properties (Jersey) (2) 3,912,746 5,675,384 2.52Capital Shopping Centres Group 1,013,458 4,362,681 1.94Unite Group 1,187,977 4,034,786 1.79Derwent London 154,512 3,999,928 1.78Safestore Holdings 2,925,550 3,883,853 1.73Great Portland Estates 548,483 3,297,558 1.47ST Modwen Properties 1,087,564 3,070,771 1.37Quintain Estates & Development 4,214,496 2,758,651 1.23Segro 894,078 2,710,192 1.21Grainger 1,746,531 2,546,200 1.13Metric Property Investments 1,905,447 2,377,357 1.06Big Yellow Group 516,750 2,207,328 0.98Capital & Regional (1) 5,357,029 1,893,186 0.84Shaftesbury 243,238 1,680,348 0.75Capital & Counties Properties 548,314 1,631,084 0.73
total for United Kingdom 36.69
franceUnibail-Rodamco (1) 120,388 21,904,597 9.75Gecina 106,633 9,053,142 4.03Klepierre 291,570 8,752,931 3.90Mercialys 423,247 7,258,686 3.23ICADE (1) 101,114 6,766,549 3.01Foncière des Regions (1) 65,317 4,134,566 1.84Altarea 24,663 2,885,571 1.28SILIC (Société Immobilière de Location pour l’Industrie et le Commerce) 22,608 1,888,898 0.84Société de la Tour Eiffel 24,872 1,106,804 0.49
total for france 28.37
SwitzerlandPSP Swiss Property Regd 146,870 10,528,785 4.68Swiss Prime Site Regd (1) 56,389 3,566,002 1.59Mobimo Holding Regd 10,301 1,867,683 0.83
total for Switzerland 7.10
SwedenHufvudstaden ‘A’ 722,849 6,897,090 3.07Atrium Ljungberg ‘B’ 506,745 5,133,080 2.28Castellum 236,276 2,539,163 1.13
total for Sweden 6.48
netherlandsCorio 161,882 5,554,981 2.47Eurocommercial Properties ‘CVA’ (1) 80,885 2,437,874 1.09Vastned Retail 25,034 819,864 0.36Wereldhave (1) 12,985 623,280 0.28
total for netherlands 4.20
inveStment aim
To seek long-term capital appreciation, measured in Euro, through investment in the equity securities of companies in the European real estate industry.
Statement of inveStmentS
transferable securities and money market instruments admitted to official exchange listing or dealt in on another regulated market. as at 31 December 2012, expressed in euro.
investments holdingsmarket
value% of net
assets
Morgan Stanley Investment Funds 31 December 2012 20
European Property Fund
Statement of inveStmentS (continued)
transferable securities and money market instruments admitted to official exchange listing or dealt in on another regulated market. as at 31 December 2012, expressed in euro.
investments holdingsmarket
value% of net
assets
GermanyAlstria Office REIT 366,214 3,387,846 1.51Prime Office REIT 599,402 1,942,062 0.86Deutsche Euroshop (1) 51,557 1,631,264 0.72Deutsche Wohnen ‘Bearer’ 76,626 1,072,764 0.48GSW Immobilien 30,757 984,224 0.44
total for Germany 4.01
austriaAtrium European Real Estate (Jersey) (2) 1,309,401 5,826,834 2.59Conwert Immobilien Invest 57,790 564,608 0.25
total for austria 2.84
italyBeni Stabili 8,753,871 3,905,102 1.74
total for italy 1.74
finlandSponda 621,444 2,237,198 0.99Citycon 331,232 851,266 0.38
total for finland 1.37
norwayNorwegian Property 2,357,215 2,726,209 1.21
total for norway 1.21
BelgiumCofinimmo 14,977 1,341,939 0.60Befimmo 11,446 558,908 0.25
total for Belgium 0.85
total investment Securities 213,204,775 94.86
DerivativeS
OtC and exchange traded derivatives as at 31 December 2012, expressed in euro.
forward foreign Currency exchange Contracts
maturity date
amount bought Ccy
amount sold Ccy Counterparty
Unrealised gain/(loss)
eUr% of net
assets
02/01/2013 2,111,840 SEK 245,438 EUR J.P. Morgan 446 0.00
net Unrealised Gain on forward foreign Currency exchange Contracts 446 0.00
total Derivatives 446 0.00
other assets less Liabilities 11,546,831 5.14
total net asset value 224,752,052 100.00
(1) All or part of this position is out on loan.(2) The country in brackets represents the country of incorporation of this security.
equities (continued)
21 Morgan Stanley Investment Funds 31 December 2012
Please refer to the full prospectus for the Fund’s investment objective and policy.
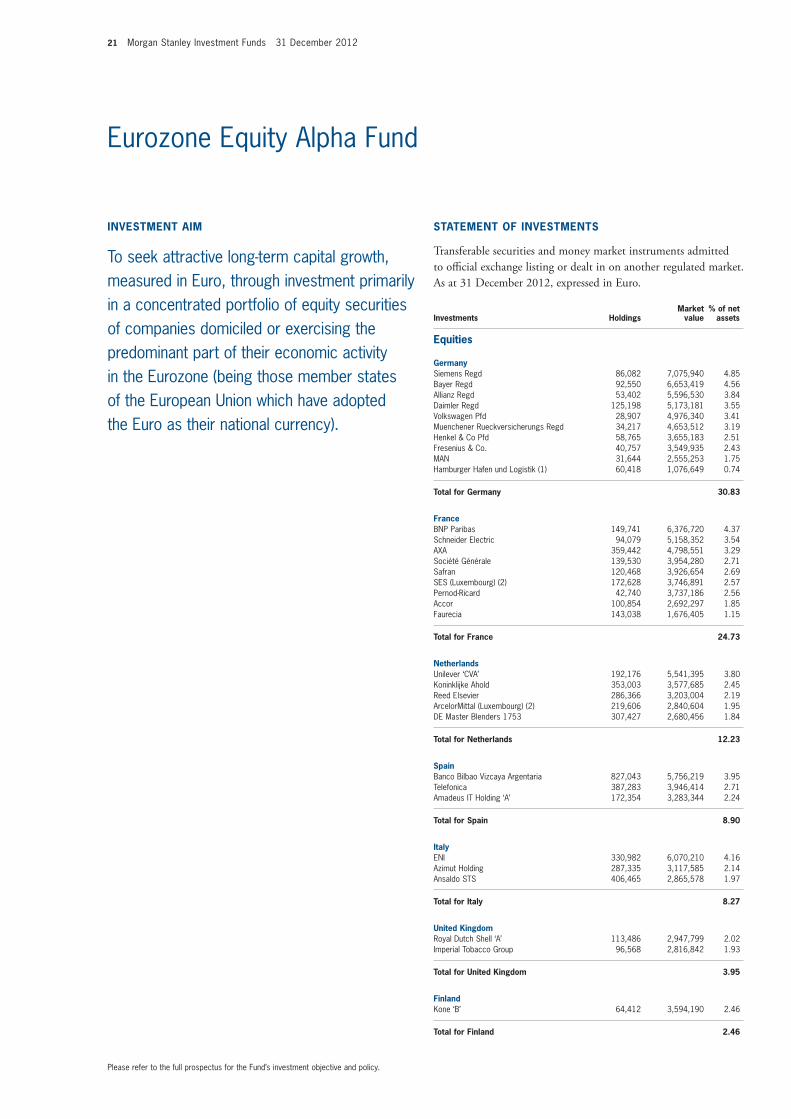
Eurozone Equity Alpha Fund
equities
GermanySiemens Regd 86,082 7,075,940 4.85Bayer Regd 92,550 6,653,419 4.56Allianz Regd 53,402 5,596,530 3.84Daimler Regd 125,198 5,173,181 3.55Volkswagen Pfd 28,907 4,976,340 3.41Muenchener Rueckversicherungs Regd 34,217 4,653,512 3.19Henkel & Co Pfd 58,765 3,655,183 2.51Fresenius & Co. 40,757 3,549,935 2.43MAN 31,644 2,555,253 1.75Hamburger Hafen und Logistik (1) 60,418 1,076,649 0.74
total for Germany 30.83
franceBNP Paribas 149,741 6,376,720 4.37Schneider Electric 94,079 5,158,352 3.54AXA 359,442 4,798,551 3.29Société Générale 139,530 3,954,280 2.71Safran 120,468 3,926,654 2.69SES (Luxembourg) (2) 172,628 3,746,891 2.57Pernod-Ricard 42,740 3,737,186 2.56Accor 100,854 2,692,297 1.85Faurecia 143,038 1,676,405 1.15
total for france 24.73
netherlandsUnilever ‘CVA’ 192,176 5,541,395 3.80Koninklijke Ahold 353,003 3,577,685 2.45Reed Elsevier 286,366 3,203,004 2.19ArcelorMittal (Luxembourg) (2) 219,606 2,840,604 1.95DE Master Blenders 1753 307,427 2,680,456 1.84
total for netherlands 12.23
SpainBanco Bilbao Vizcaya Argentaria 827,043 5,756,219 3.95Telefonica 387,283 3,946,414 2.71Amadeus IT Holding ‘A’ 172,354 3,283,344 2.24
total for Spain 8.90
italyENI 330,982 6,070,210 4.16Azimut Holding 287,335 3,117,585 2.14Ansaldo STS 406,465 2,865,578 1.97
total for italy 8.27
United KingdomRoyal Dutch Shell ‘A’ 113,486 2,947,799 2.02Imperial Tobacco Group 96,568 2,816,842 1.93
total for United Kingdom 3.95
finlandKone ‘B’ 64,412 3,594,190 2.46
total for finland 2.46
inveStment aim
To seek attractive long-term capital growth, measured in Euro, through investment primarily in a concentrated portfolio of equity securities of companies domiciled or exercising the predominant part of their economic activity in the Eurozone (being those member states of the European Union which have adopted the Euro as their national currency).
Statement of inveStmentS
transferable securities and money market instruments admitted to official exchange listing or dealt in on another regulated market. as at 31 December 2012, expressed in euro.
investments holdingsmarket
value% of net
assets

Morgan Stanley Investment Funds 31 December 2012 22
Eurozone Equity Alpha Fund
Statement of inveStmentS (continued)
transferable securities and money market instruments admitted to official exchange listing or dealt in on another regulated market. as at 31 December 2012, expressed in euro.
investments holdingsmarket
value% of net
assets
irelandCRH 224,992 3,442,378 2.36
total for ireland 2.36
BelgiumUmicore 81,371 3,392,357 2.33
total for Belgium 2.33
PortugalGalp Energia SGPS 244,397 2,874,109 1.97
total for Portugal 1.97
total for equities 98.03
mutual fund
Morgan Stanley Funds plc - Euro Liquidity Fund (Ireland) (2) (4) 2,100,661 2,100,661 1.44
total for mutual fund 1.44
total investment Securities 145,084,108 99.47
other assets less Liabilities 775,737 0.53
total net asset value 145,859,845 100.00
(1) All or part of this position is out on loan.(2) The country in brackets represents the country of incorporation of this security.(4) Managed by an affiliate of the Investment Adviser.
equities (continued)

23 Morgan Stanley Investment Funds 31 December 2012
Please refer to the full prospectus for the Fund’s investment objective and policy.
Global Brands Fund
equities
United KingdomBritish American Tobacco 17,160,053 870,266,747 9.57Unilever 16,896,989 649,626,986 7.15Reckitt Benckiser Group 9,708,194 611,925,035 6.73Imperial Tobacco Group 14,185,236 546,983,593 6.02Diageo 11,271,557 327,301,850 3.60Experian (Jersey) (2) 8,463,713 134,780,480 1.48Admiral Group 5,500,102 103,673,731 1.14
total for United Kingdom 35.69
United States of americaAccenture ‘A’ (Ireland) (2) 6,168,314 407,232,090 4.48Philip Morris International 4,833,933 399,427,884 4.39Procter & Gamble 5,676,830 380,688,220 4.19Microsoft 14,290,636 379,845,105 4.18Dr Pepper Snapple Group 7,831,834 342,486,101 3.77Visa ‘A’ 1,427,040 213,556,536 2.35Mead Johnson Nutrition 2,930,894 190,508,110 2.09Mondelez International ‘A’ 6,734,797 168,841,361 1.86Moody’s 3,198,162 159,268,468 1.75Kraft Foods Group 3,263,710 144,941,361 1.59Herbalife (Cayman Islands) (2) 4,321,796 131,901,214 1.45Nike ‘B’ 1,419,602 72,484,878 0.80
total for United States of america 32.90
SwitzerlandNestlé Regd 13,543,757 883,836,546 9.72
total for Switzerland 9.72
franceSanofi 4,591,645 433,325,384 4.76Legrand 3,401,473 143,326,227 1.58
total for france 6.34
GermanySAP 4,542,659 364,448,125 4.01
total for Germany 4.01
SwedenSwedish Match 9,862,836 331,233,560 3.64
total for Sweden 3.64
netherlandsDE Master Blenders 1753 15,522,684 178,913,017 1.97
total for netherlands 1.97
finlandKone ‘B’ 1,513,922 111,672,476 1.23
total for finland 1.23
inveStment aim
To seek an attractive long-term rate of return, measured in US dollars, through investment principally in equity securities of companies in the world’s developed countries, by investing in a concentrated portfolio of companies whose success the Company believes depends on intangible assets (for example, but not limited to, brand names, copyrights or methods of distribution) underpinning a strong business franchise.
Statement of inveStmentS
transferable securities and money market instruments admitted to official exchange listing or dealt in on another regulated market. as at 31 December 2012, expressed in US dollars.
investments holdingsmarket
value% of net
assets
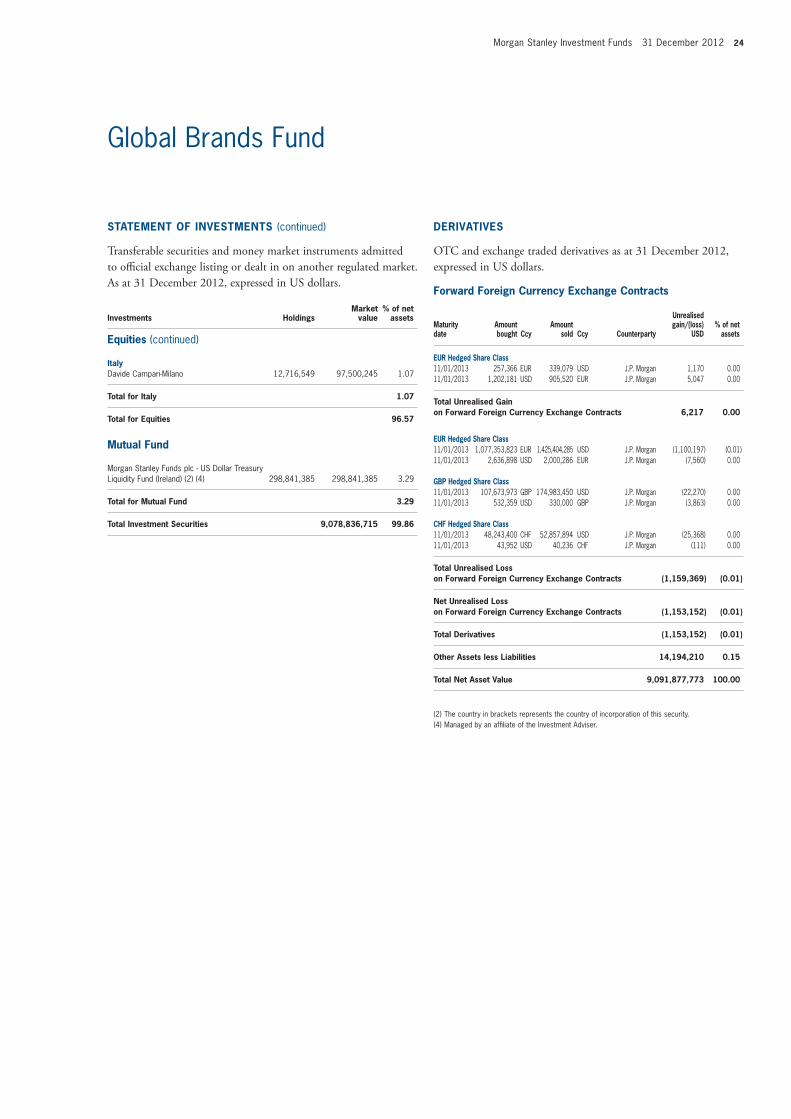
Morgan Stanley Investment Funds 31 December 2012 24
Global Brands Fund
italyDavide Campari-Milano 12,716,549 97,500,245 1.07
total for italy 1.07
total for equities 96.57
mutual fund
Morgan Stanley Funds plc - US Dollar Treasury Liquidity Fund (Ireland) (2) (4) 298,841,385 298,841,385 3.29
total for mutual fund 3.29
total investment Securities 9,078,836,715 99.86
DerivativeS
OtC and exchange traded derivatives as at 31 December 2012, expressed in US dollars.
forward foreign Currency exchange Contracts
maturity date
amount bought Ccy
amount sold Ccy Counterparty
Unrealised gain/(loss)
USD% of net
assets
eUr hedged Share Class 11/01/2013 257,366 EUR 339,079 USD J.P. Morgan 1,170 0.00 11/01/2013 1,202,181 USD 905,520 EUR J.P. Morgan 5,047 0.00
total Unrealised Gain on forward foreign Currency exchange Contracts 6,217 0.00
eUr hedged Share Class 11/01/2013 1,077,353,823 EUR 1,425,404,285 USD J.P. Morgan (1,100,197) (0.01)11/01/2013 2,636,898 USD 2,000,286 EUR J.P. Morgan (7,560) 0.00
GBP hedged Share Class 11/01/2013 107,673,973 GBP 174,983,450 USD J.P. Morgan (22,270) 0.00 11/01/2013 532,359 USD 330,000 GBP J.P. Morgan (3,863) 0.00
Chf hedged Share Class 11/01/2013 48,243,400 CHF 52,857,894 USD J.P. Morgan (25,368) 0.00 11/01/2013 43,952 USD 40,236 CHF J.P. Morgan (111) 0.00
total Unrealised Loss on forward foreign Currency exchange Contracts (1,159,369) (0.01)
net Unrealised Loss on forward foreign Currency exchange Contracts (1,153,152) (0.01)
total Derivatives (1,153,152) (0.01)
other assets less Liabilities 14,194,210 0.15
total net asset value 9,091,877,773 100.00
(2) The country in brackets represents the country of incorporation of this security.(4) Managed by an affiliate of the Investment Adviser.
Statement of inveStmentS (continued)
transferable securities and money market instruments admitted to official exchange listing or dealt in on another regulated market. as at 31 December 2012, expressed in US dollars.
investments holdingsmarket
value% of net
assets equities (continued)
25 Morgan Stanley Investment Funds 31 December 2012
Please refer to the full prospectus for the Fund’s investment objective and policy.
Global Equity Allocation Fund
equities
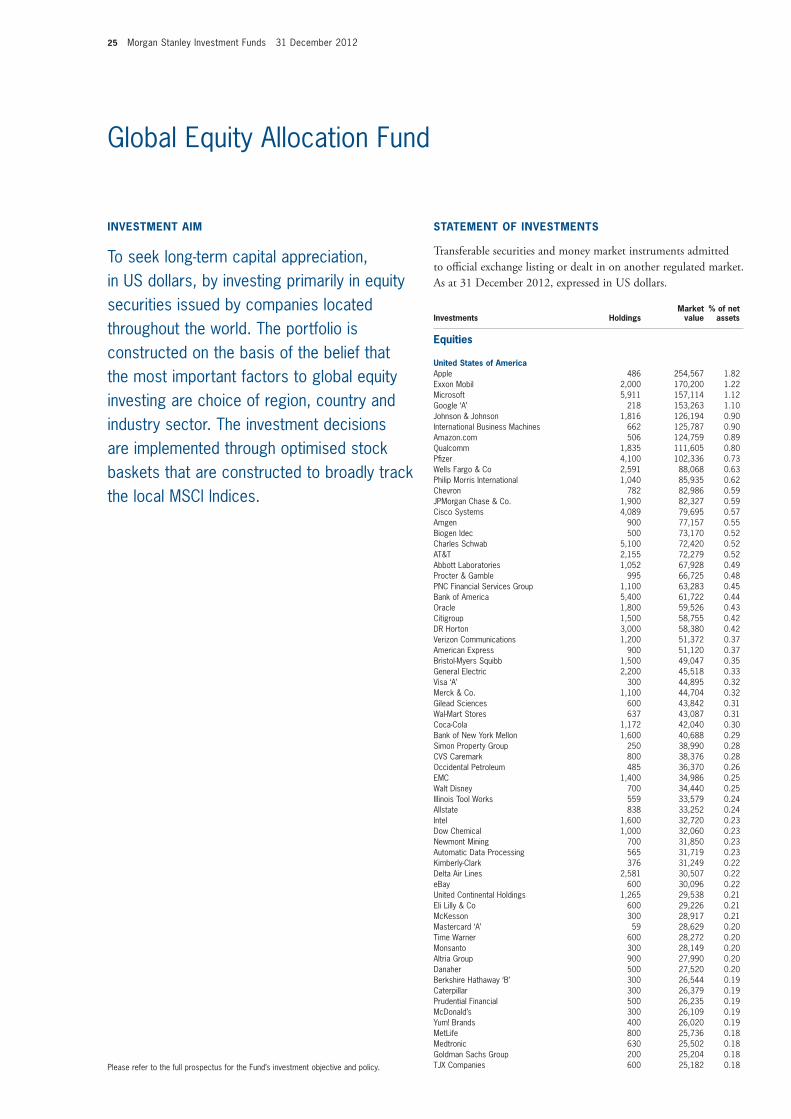
United States of americaApple 486 254,567 1.82Exxon Mobil 2,000 170,200 1.22Microsoft 5,911 157,114 1.12Google ‘A’ 218 153,263 1.10Johnson & Johnson 1,816 126,194 0.90International Business Machines 662 125,787 0.90Amazon.com 506 124,759 0.89Qualcomm 1,835 111,605 0.80Pfizer 4,100 102,336 0.73Wells Fargo & Co 2,591 88,068 0.63Philip Morris International 1,040 85,935 0.62Chevron 782 82,986 0.59JPMorgan Chase & Co. 1,900 82,327 0.59Cisco Systems 4,089 79,695 0.57Amgen 900 77,157 0.55Biogen Idec 500 73,170 0.52Charles Schwab 5,100 72,420 0.52AT&T 2,155 72,279 0.52Abbott Laboratories 1,052 67,928 0.49Procter & Gamble 995 66,725 0.48PNC Financial Services Group 1,100 63,283 0.45Bank of America 5,400 61,722 0.44Oracle 1,800 59,526 0.43Citigroup 1,500 58,755 0.42DR Horton 3,000 58,380 0.42Verizon Communications 1,200 51,372 0.37American Express 900 51,120 0.37Bristol-Myers Squibb 1,500 49,047 0.35General Electric 2,200 45,518 0.33Visa ‘A’ 300 44,895 0.32Merck & Co. 1,100 44,704 0.32Gilead Sciences 600 43,842 0.31Wal-Mart Stores 637 43,087 0.31Coca-Cola 1,172 42,040 0.30Bank of New York Mellon 1,600 40,688 0.29Simon Property Group 250 38,990 0.28CVS Caremark 800 38,376 0.28Occidental Petroleum 485 36,370 0.26EMC 1,400 34,986 0.25Walt Disney 700 34,440 0.25Illinois Tool Works 559 33,579 0.24Allstate 838 33,252 0.24Intel 1,600 32,720 0.23Dow Chemical 1,000 32,060 0.23Newmont Mining 700 31,850 0.23Automatic Data Processing 565 31,719 0.23Kimberly-Clark 376 31,249 0.22Delta Air Lines 2,581 30,507 0.22eBay 600 30,096 0.22United Continental Holdings 1,265 29,538 0.21Eli Lilly & Co 600 29,226 0.21McKesson 300 28,917 0.21Mastercard ‘A’ 59 28,629 0.20Time Warner 600 28,272 0.20Monsanto 300 28,149 0.20Altria Group 900 27,990 0.20Danaher 500 27,520 0.20Berkshire Hathaway ‘B’ 300 26,544 0.19Caterpillar 300 26,379 0.19Prudential Financial 500 26,235 0.19McDonald’s 300 26,109 0.19Yum! Brands 400 26,020 0.19MetLife 800 25,736 0.18Medtronic 630 25,502 0.18Goldman Sachs Group 200 25,204 0.18TJX Companies 600 25,182 0.18
inveStment aim
To seek long-term capital appreciation, in US dollars, by investing primarily in equity securities issued by companies located throughout the world. The portfolio is constructed on the basis of the belief that the most important factors to global equity investing are choice of region, country and industry sector. The investment decisions are implemented through optimised stock baskets that are constructed to broadly track the local MSCl lndices.
Statement of inveStmentS
transferable securities and money market instruments admitted to official exchange listing or dealt in on another regulated market. as at 31 December 2012, expressed in US dollars.
investments holdingsmarket
value% of net
assets

Morgan Stanley Investment Funds 31 December 2012 26
Global Equity Allocation Fund
Union Pacific 200 24,838 0.18U.S. Bancorp 783 24,751 0.18Home Depot 400 24,408 0.17Travelers 342 24,207 0.17United Technologies 300 24,198 0.17EOG Resources 200 23,760 0.17ACE (Switzerland) (2) 300 23,598 0.17Comerica 783 23,537 0.17Weyerhaeuser 850 23,502 0.17Salesforce.com 139 22,967 0.16Covidien (Ireland) (2) 400 22,548 0.16Raytheon 397 22,399 0.16EI du Pont de Nemours & Co. 500 22,275 0.16Walgreen 598 22,042 0.16Comcast ‘A’ 600 22,020 0.16United Parcel Service ‘B’ 300 21,876 0.16Praxair 200 21,682 0.16PepsiCo 318 21,519 0.15UnitedHealth Group 400 21,516 0.15Lowe’s Cos 600 21,132 0.15Starbucks 400 21,092 0.153M 228 20,901 0.15Viacom ‘B’ 400 20,896 0.15General Mills 522 20,838 0.15Ford Motor 1,600 20,624 0.15Computer Sciences 525 20,570 0.15Devon Energy 400 20,496 0.15CA 939 20,423 0.15Schlumberger (Curacao) (2) 300 20,388 0.15Eaton (Ireland) (2) 377 20,090 0.14Agilent Technologies 500 20,070 0.14Northern Trust 400 19,940 0.14News ‘A’ 800 19,904 0.14Accenture ‘A’ (Ireland) (2) 300 19,806 0.14Baxter International 300 19,743 0.14Costco Wholesale 200 19,526 0.14Macy’s 500 19,310 0.14Broadcom ‘A’ 586 19,051 0.14American Tower 250 19,037 0.14Honeywell International 300 18,765 0.13H&R Block 1,024 18,739 0.13CBS non-vtg ‘B’ 500 18,630 0.13General Dynamics 274 18,511 0.13Limited Brands 400 18,492 0.13Adobe Systems 500 18,490 0.13State Street 400 18,472 0.13Johnson Controls 600 18,084 0.13Western Digital 429 18,052 0.13WellPoint 300 17,985 0.13Intuit 300 17,724 0.13Target 300 17,619 0.13Express Scripts Holding 324 17,169 0.12Laboratory Corp of America Holdings 200 17,066 0.12Marsh & McLennan 500 17,010 0.12Deere & Co 200 17,002 0.12Starwood Hotels & Resorts Worldwide 300 16,896 0.12Parker Hannifin 200 16,860 0.12Bed Bath & Beyond 300 16,626 0.12AON (United Kingdom) (2) 300 16,554 0.12Cardinal Health 400 16,320 0.12Spectra Energy 600 16,086 0.12Aflac 300 15,654 0.11Emerson Electric 300 15,654 0.11Fiserv 200 15,650 0.11Marathon Oil 523 15,606 0.11
Statement of inveStmentS (continued)
transferable securities and money market instruments admitted to official exchange listing or dealt in on another regulated market. as at 31 December 2012, expressed in US dollars.
investments holdingsmarket
value% of net
assets
investments holdingsmarket
value% of net
assets
Waste Management 467 15,560 0.11Becton Dickinson & Co. 200 15,420 0.11Apache 200 15,408 0.11Eaton Vance 487 15,389 0.11Northrop Grumman 232 15,363 0.11ConocoPhillips 269 15,328 0.11Sherwin-Williams 100 15,217 0.11Boeing 200 14,840 0.11DIRECTV 300 14,829 0.11NYSE Euronext 465 14,703 0.11TE Connectivity (Switzerland) (2) 400 14,564 0.10Cognizant Technology Solutions ‘A’ 200 14,558 0.10ConAgra Foods 500 14,465 0.10Public Storage 100 14,359 0.10Ecolab 200 14,200 0.10Southwest Airlines 1,383 14,120 0.10Ingersoll-Rand (Ireland) (2) 300 14,097 0.10Equity Residential 250 13,963 0.10Aetna 300 13,716 0.10Liberty Interactive ‘A’ 700 13,601 0.10Halliburton 400 13,544 0.10PPG Industries 100 13,433 0.10Valero Energy 400 13,364 0.10Freeport-McMoRan Copper & Gold 400 13,296 0.10National Oilwell Varco 200 13,256 0.09NetApp 400 13,232 0.09Zimmer Holdings 200 13,086 0.09Dover 200 12,984 0.09Ameren 421 12,769 0.09Mondelez International ‘A’ 500 12,535 0.09Discovery Communications ‘A’ 200 12,504 0.09Progressive 600 12,456 0.09Marathon Petroleum 200 12,354 0.09McCormick & Co non-vtg 196 12,293 0.09Norfolk Southern 200 12,228 0.09Texas Instruments 400 12,184 0.09Baker Hughes 300 11,979 0.09Colgate-Palmolive 114 11,786 0.08International Paper 300 11,784 0.08CSX 600 11,658 0.08Cincinnati Financial 300 11,592 0.08Quest Diagnostics 200 11,534 0.08Discovery Communications ‘C’ 200 11,532 0.08Heinz (H.J.) 200 11,400 0.08LyondellBasell Industries ‘A’ (Netherlands) (2) 200 11,206 0.08Corning 900 11,187 0.08HCP 250 11,163 0.08General Motors 400 11,156 0.08Motorola Solutions 200 10,920 0.08Molson Coors Brewing ‘B’ 257 10,869 0.08Stryker 200 10,862 0.08Cummins 100 10,677 0.08St Jude Medical 300 10,671 0.08Cigna 200 10,566 0.08Boston Properties 100 10,473 0.07Campbell Soup 300 10,353 0.07Vulcan Materials 200 10,296 0.07Omnicom Group 200 9,886 0.07Life Technologies 200 9,706 0.07Time Warner Cable 100 9,560 0.07Harley-Davidson 200 9,480 0.07MeadWestvaco 300 9,420 0.07Phillips 66 184 9,360 0.07Hershey 128 9,101 0.07FedEx 100 9,068 0.06Paccar 200 8,932 0.06ProLogis 250 8,930 0.06Ball 200 8,848 0.06MDU Resources Group 415 8,636 0.06Tyco International (Switzerland) (2) 300 8,586 0.06Nucor 200 8,538 0.06Air Products & Chemicals 100 8,328 0.06Rockwell Automation 100 8,258 0.06
equities (continued)
United States of america (continued)
equities (continued)
United States of america (continued)

27 Morgan Stanley Investment Funds 31 December 2012
Global Equity Allocation Fund
FMC Technologies 200 8,234 0.06Pentair Regd (Switzerland) (2) 171 8,198 0.06Archer-Daniels-Midland 300 8,124 0.06Western Union 600 8,010 0.06BMC Software 200 7,908 0.06Vornado Realty Trust 100 7,890 0.06Juniper Networks 400 7,792 0.06CenturyLink 200 7,744 0.06Kroger 300 7,707 0.06Host Hotels & Resorts 500 7,700 0.06News ‘B’ 300 7,683 0.05Discover Financial Services 200 7,600 0.05L-3 Communications Holdings 100 7,510 0.05Kraft Foods Group 166 7,372 0.05Symantec 400 7,336 0.05Sigma-Aldrich 100 7,307 0.05Crown Holdings 200 7,288 0.05Clorox 100 7,244 0.05Anadarko Petroleum 100 7,232 0.05Autodesk 200 6,994 0.05SPX 100 6,940 0.05Noble (Switzerland) (2) 200 6,810 0.05ADT 150 6,786 0.05Sprint Nextel 1,200 6,732 0.05Staples 600 6,714 0.05Eastman Chemical 100 6,691 0.05Kimco Realty 350 6,639 0.05Masco 400 6,488 0.05Citrix Systems 100 6,440 0.05T Rowe Price Group 100 6,413 0.05Ventas 100 6,380 0.05Consol Energy 200 6,346 0.05Joy Global 100 6,267 0.04Liberty Global ‘A’ 100 6,217 0.04Regeneron Pharmaceuticals 37 6,215 0.04Ameriprise Financial 100 6,208 0.04Paychex 200 6,156 0.04Range Resources 100 6,145 0.04Unum Group 300 6,141 0.04Hospira 200 6,104 0.04Health Care REIT 100 6,055 0.04Pall 100 6,019 0.04Yahoo! 300 5,883 0.04American Capital Agency 205 5,877 0.04Liberty Global ‘C’ 100 5,824 0.04Republic Services 200 5,776 0.04EQT 100 5,748 0.04Fluor 100 5,745 0.04Rockwell Collins 100 5,717 0.04CareFusion 200 5,630 0.04Mosaic 100 5,575 0.04Helmerich & Payne 100 5,482 0.04Duke Energy 87 5,461 0.04Cameron International 100 5,442 0.04Tenaris (Luxembourg) (2) 264 5,437 0.04Equifax 100 5,323 0.04Safeway 300 5,322 0.04Xylem 200 5,300 0.04SanDisk 122 5,217 0.04Peabody Energy 200 5,168 0.04Boston Scientific 900 5,022 0.04GameStop ‘A’ 200 4,914 0.04Annaly Capital Management 350 4,847 0.03Equinix 23 4,715 0.03IAMGOLD (Canada) (2) 400 4,472 0.03Trimble Navigation 76 4,463 0.03
Statement of inveStmentS (continued)
transferable securities and money market instruments admitted to official exchange listing or dealt in on another regulated market. as at 31 December 2012, expressed in US dollars.
investments holdingsmarket
value% of net
assets
investments holdingsmarket
value% of net
assets
Edison International 100 4,457 0.03Coventry Health Care 100 4,452 0.03UDR 189 4,441 0.03Plum Creek Timber 100 4,395 0.03Celanese ‘A’ 100 4,384 0.03Dr Pepper Snapple Group 100 4,373 0.03Weatherford International (Switzerland) (2) 400 4,320 0.03Kohl’s 100 4,248 0.03Southern 100 4,220 0.03American Electric Power 100 4,208 0.03Jacobs Engineering Group 100 4,167 0.03Owens-Illinois 200 4,152 0.03International Game Technology 300 4,149 0.03FirstEnergy 100 4,104 0.03Akamai Technologies 100 4,056 0.03Cintas 100 4,032 0.03TransDigm Group 30 4,018 0.03CMS Energy 162 3,901 0.03Wyndham Worldwide 74 3,894 0.03Cliffs Natural Resources 100 3,730 0.03Murphy Oil 62 3,634 0.03Liberty Property Trust 100 3,552 0.03SL Green Realty 47 3,543 0.03Xilinx 100 3,540 0.03PVH 32 3,518 0.03Kinder Morgan 100 3,472 0.02Alcoa 400 3,412 0.02Rackspace Hosting 46 3,386 0.02Applied Materials 300 3,381 0.02Tractor Supply 38 3,327 0.02Iron Mountain 108 3,316 0.02Chesapeake Energy 200 3,282 0.02Southwestern Energy 100 3,270 0.02Robert Half International 100 3,126 0.02Kinder Morgan Management 41 3,022 0.02Allegheny Technologies 100 2,945 0.02Affiliated Managers Group 23 2,938 0.02KBR 100 2,914 0.02Exelon 100 2,908 0.02Nabors Industries (Bermuda) (2) 200 2,824 0.02PPL 100 2,814 0.02Electronic Arts 200 2,810 0.02Avon Products 200 2,806 0.02Hillshire Brands 100 2,750 0.02Xcel Energy 100 2,623 0.02Ansys 39 2,622 0.02Ulta Salon Cosmetics & Fragrance 27 2,612 0.02Catamaran (Canada) (2) 54 2,534 0.02Pinnacle West Capital 50 2,519 0.02LinkedIn ‘A’ 22 2,515 0.02Albemarle 39 2,384 0.02Liberty Ventures ‘A’ 35 2,317 0.02United States Steel 100 2,316 0.02Dick’s Sporting Goods 51 2,307 0.02NRG Energy 100 2,250 0.02Calpine 100 1,772 0.01Delphi Automotive (Jersey) (2) 44 1,664 0.01VeriFone Systems 54 1,570 0.01Charter Communications ‘A’ 19 1,403 0.01Sensata Technologies Holdings (Netherlands) (2) 40 1,288 0.01First Republic Bank 37 1,208 0.01ACCO Brands 97 697 0.00Engility Holdings 16 302 0.00
total for United States of america 47.60
JapanFast Retailing 400 100,887 0.72Fanuc 500 91,593 0.66Bridgestone 2,800 71,732 0.51Toyota Motor 1,500 69,143 0.50Shin-Etsu Chemical 800 48,172 0.35Mitsui Fudosan 2,000 48,115 0.35
equities (continued)
United States of america (continued)
equities (continued)
United States of america (continued)

Morgan Stanley Investment Funds 31 December 2012 28
Global Equity Allocation Fund
Takeda Pharmaceutical 1,000 44,531 0.32Daiwa House Industry 2,000 34,114 0.24Komatsu 1,200 30,102 0.22Shizuoka Bank 3,000 29,130 0.21Keikyu 3,000 26,553 0.19Shimano 400 25,510 0.18Bank of Kyoto 3,000 25,184 0.18Nitto Denko 500 24,312 0.17Central Japan Railway 300 24,266 0.17Nippon Building Fund 2 20,663 0.15Japan Real Estate Investment 2 19,660 0.14East Japan Railway 300 19,344 0.14Daito Trust Construction 200 18,840 0.13Sumitomo Mitsui Financial Group 500 17,938 0.13SMC 100 17,921 0.13Chiba Bank 3,000 17,458 0.12Murata Manufacturing 300 17,437 0.12Tokyu 3,000 16,855 0.12Eisai 400 16,627 0.12Daiwa Securities Group 3,000 16,370 0.12Tobu Railway 3,000 15,847 0.11Hankyu Hanshin Holdings 3,000 15,464 0.11Secom 300 15,002 0.11Hachijuni Bank 3,000 14,908 0.11Gunma Bank 3,000 14,576 0.10Honda Motor 400 14,452 0.10Sumitomo Metal Mining 1,000 13,898 0.10Bank of Yokohama 3,000 13,858 0.10Tokyo Gas 3,000 13,699 0.10Tokio Marine Holdings 500 13,699 0.10Denso 400 13,674 0.10Astellas Pharma 300 13,432 0.10Ajinomoto 1,000 13,215 0.09IHI 5,000 12,791 0.09Toyota Industries 400 12,568 0.09Fuji Heavy Industries 1,000 12,375 0.09Credit Saison 500 12,349 0.09Itochu Techno-Solutions 300 12,324 0.09Mitsubishi Chemical Holdings 2,500 12,250 0.09Toray Industries 2,000 12,132 0.09Hoya 600 11,696 0.08Kubota 1,000 11,362 0.08Inpex 2 10,533 0.08Sumitomo Mitsui Trust Holdings 3,000 10,396 0.07Nomura Research Institute 500 10,350 0.07Mitsubishi Heavy Industries 2,000 9,564 0.07Terumo 200 7,840 0.06Nissan Motor 800 7,458 0.05Asahi Glass 1,000 7,202 0.05Kuraray 500 6,487 0.05Trend Micro 200 5,979 0.04Isuzu Motors 1,000 5,887 0.04Unicharm 100 5,197 0.04Sumitomo Heavy Industries 1,000 4,675 0.03Sysmex 100 4,578 0.03Makita 100 4,568 0.03Tokyo Electron 100 4,526 0.03NKSJ Holdings 200 4,223 0.03Mabuchi Motor 100 4,209 0.03Nippon Telegraph & Telephone 100 4,198 0.03Benesse Holdings 100 4,151 0.03Nippon Express 1,000 4,098 0.03Kintetsu 1,000 4,090 0.03West Japan Railway 100 3,930 0.03Toshiba 1,000 3,868 0.03Canon 100 3,835 0.03
Statement of inveStmentS (continued)
transferable securities and money market instruments admitted to official exchange listing or dealt in on another regulated market. as at 31 December 2012, expressed in US dollars.
investments holdingsmarket
value% of net
assets
investments holdingsmarket
value% of net
assets
Santen Pharmaceutical 100 3,832 0.03JSR 200 3,779 0.03Shimizu 1,000 3,724 0.03Japan Retail Fund Investment 2 3,668 0.03Osaka Gas 1,000 3,631 0.03Softbank 100 3,617 0.03Hamamatsu Photonics 100 3,600 0.03OJI Holdings 1,000 3,408 0.02Daikin Industries 100 3,387 0.02Mitsubishi Materials 1,000 3,361 0.02Orix 30 3,352 0.02Taisei 1,000 3,301 0.02Kajima 1,000 3,277 0.02USS 30 3,115 0.02NTT Data 1 3,099 0.02Sumitomo Chemical 1,000 3,088 0.02Daiichi Sankyo 200 3,053 0.02Asics 200 3,020 0.02Yamato Holdings 200 3,018 0.02Mitsui & Co. 200 2,955 0.02Nikon 100 2,906 0.02Japan Prime Realty Investment 1 2,882 0.02NTT DoCoMo 2 2,866 0.02Otsuka Holdings 100 2,815 0.02Taiheiyo Cement 1,000 2,719 0.02Kawasaki Heavy Industries 1,000 2,667 0.02Mitsui Chemicals 1,000 2,562 0.02Sumitomo 200 2,534 0.02Teijin 1,000 2,451 0.02Aeon Mall 100 2,443 0.02Nippon Steel & Sumitomo Metal 1,000 2,414 0.02Omron 100 2,368 0.02Nippon Yusen 1,000 2,310 0.02Nomura Holdings 400 2,309 0.02Konami 100 2,227 0.02Nabtesco 100 2,197 0.02Yokogawa Electric 200 2,170 0.02Yamaha 200 2,091 0.01Itochu 200 2,091 0.01NEC 1,000 2,088 0.01FUJIFILM Holdings 100 1,982 0.01Mitsubishi 100 1,896 0.01Nomura Real Estate Holdings 100 1,888 0.01Mizuho Financial Group 1,000 1,809 0.01JX Holdings 300 1,669 0.01Yahoo Japan 5 1,607 0.01Ibiden 100 1,572 0.01Citizen Holdings 300 1,559 0.01Advantest 100 1,550 0.01Nippon Paper Group 100 1,374 0.01Chubu Electric Power 100 1,328 0.01Toyo Seikan Kaisha 100 1,326 0.01Yamada Denki 30 1,151 0.01Sumitomo Electric Industries 100 1,136 0.01
total for Japan 10.50
United KingdomWPP (Jersey) (2) 3,063 44,198 0.32Royal Dutch Shell ‘A’ 1,042 35,930 0.26BP 5,196 35,867 0.26HSBC Holdings 3,301 34,699 0.25Reckitt Benckiser Group 493 31,075 0.22Standard Chartered 1,211 30,964 0.22Aggreko 1,054 29,801 0.22Rio Tinto 469 26,761 0.19BHP Billiton 752 26,022 0.19Legal & General Group 10,708 25,334 0.18British American Tobacco 499 25,307 0.18GlaxoSmithKline 1,097 23,797 0.17Imperial Tobacco Group 565 21,786 0.16AstraZeneca 447 21,133 0.15Pearson 1,002 19,343 0.14
equities (continued)
Japan (continued)
equities (continued)
Japan (continued)

29 Morgan Stanley Investment Funds 31 December 2012
Global Equity Allocation Fund
Xstrata 1,119 19,256 0.14Marks & Spencer Group 3,094 19,220 0.14Smith & Nephew 1,648 18,196 0.13Centrica 2,859 15,498 0.11BAE Systems 2,799 15,323 0.11Carnival 395 15,135 0.11Royal Dutch Shell ‘B’ 413 14,597 0.11Prudential 1,025 14,416 0.10Reed Elsevier 1,372 14,313 0.10Sage Group 2,833 13,548 0.10TUI Travel 2,943 13,510 0.10Aviva 2,191 13,280 0.10Unilever 339 13,033 0.09Anglo American 417 12,834 0.09Next 212 12,777 0.09Diageo 423 12,283 0.09Royal Bank of Scotland Group 2,205 11,627 0.08Old Mutual 3,723 10,781 0.08Barclays 2,419 10,314 0.07BG Group 620 10,201 0.07Tesco 1,717 9,375 0.07British Sky Broadcasting 750 9,348 0.07National Grid 769 8,785 0.06Vodafone Group 3,441 8,636 0.06SSE 347 7,996 0.06ICAP 1,514 7,553 0.05Compass Group 637 7,504 0.05J Sainsbury 1,331 7,464 0.05Intercontinental Hotels Group 218 6,047 0.04Experian (Jersey) (2) 374 5,956 0.04Land Securities Group 434 5,737 0.04Johnson Matthey 137 5,289 0.04Cobham 1,407 5,048 0.04Kingfisher 1,056 4,875 0.04Rexam 662 4,690 0.03Petrofac (Jersey) (2) 174 4,589 0.03British Land 493 4,502 0.03Whitbread 112 4,453 0.03Severn Trent 173 4,425 0.03Tullow Oil 190 3,893 0.03Capita 291 3,570 0.03Wolseley (Jersey) (2) 72 3,393 0.02AMEC 183 2,983 0.02Rolls-Royce Holdings 209 2,967 0.02Croda International 71 2,741 0.02Intertek Group 53 2,669 0.02Bunzl 137 2,246 0.02GKN 531 1,974 0.01Aberdeen Asset Management 301 1,796 0.01Smiths Group 91 1,761 0.01Weir Group 56 1,710 0.01Meggitt 225 1,398 0.01
total for United Kingdom 6.21
SwitzerlandNestlé Regd 1,965 128,232 0.92Roche Holding ‘Genusschein’ 470 94,690 0.68Novartis Regd 1,344 84,543 0.60Holcim Regd 581 42,559 0.30Syngenta Regd 77 30,908 0.22UBS Regd 1,925 30,077 0.21ABB Regd 896 18,395 0.13Credit Suisse Group Regd 687 16,744 0.12Compagnie Financiere Richemont ‘Bearer’ ‘A & B’ Regd 157 12,274 0.09
Statement of inveStmentS (continued)
transferable securities and money market instruments admitted to official exchange listing or dealt in on another regulated market. as at 31 December 2012, expressed in US dollars.
investments holdingsmarket
value% of net
assets
investments holdingsmarket
value% of net
assets
Transocean 242 10,689 0.08Sonova Holding Regd 64 7,106 0.05Lindt & Spruengli 2 6,526 0.05Lonza Group Regd 120 6,485 0.05Actelion Regd 127 6,053 0.04Swatch Group ‘Bearer’ 10 5,050 0.04Kuehne & Nagel International Regd 34 4,095 0.03Adecco Regd 75 3,945 0.03Givaudan Regd 3 3,163 0.02Geberit Regd 14 3,087 0.02Swiss Prime Site Regd 30 2,508 0.02Schindler Holding ‘PC’ 17 2,457 0.02SGS Regd 1 2,218 0.01Banque Cantonale Vaudoise Regd 2 1,062 0.01
total for Switzerland 3.74
CanadaBarrick Gold 1,100 37,745 0.27Goldcorp 900 32,329 0.23Franco-Nevada 400 22,862 0.16Canadian National Railway 200 18,149 0.13Royal Bank of Canada 300 17,957 0.13Enbridge 400 17,101 0.12Toronto-Dominion Bank 200 16,703 0.12Suncor Energy 500 16,223 0.12TransCanada 300 14,016 0.10Eldorado Gold 1,100 13,944 0.10Rogers Communications ‘B’ 300 13,672 0.10Imperial Oil 300 12,813 0.09Metro 200 12,701 0.09Potash Corporation of Saskatchewan 300 12,021 0.09Valeant Pharmaceuticals International 200 11,809 0.08Bank of Nova Scotia 200 11,508 0.08Brookfield Asset Management vtg ‘A’ 300 10,888 0.08Agnico-Eagle Mines 200 10,304 0.07Canadian Pacific Railway 100 10,154 0.07Cenovus Energy 300 9,957 0.07Agrium 100 9,828 0.07Canadian Natural Resources 300 8,552 0.06BCE 200 8,540 0.06Manulife Financial 600 8,076 0.06Nexen 300 8,070 0.06Canadian Imperial Bank of Commerce 100 8,036 0.06National Bank of Canada 100 7,735 0.06CI Financial 300 7,461 0.05Great-West Lifeco 300 7,311 0.05Teck Resources ‘B’ 200 7,122 0.05George Weston 100 7,098 0.05Canadian Tire ‘A’ 100 6,932 0.05Yamana Gold 400 6,758 0.05Kinross Gold 700 6,638 0.05First Quantum Minerals 300 6,455 0.05Bank of Montreal 100 6,092 0.04Husky Energy 200 5,876 0.04Encana 300 5,858 0.04Cameco 300 5,801 0.04Talisman Energy 500 5,540 0.04Power Financial 200 5,442 0.04Sun Life Financial 200 5,288 0.04Power Corp of Canada 200 5,051 0.04Magna International 100 4,988 0.04Shaw Communications ‘B’ 200 4,546 0.03New Gold 400 4,267 0.03Shoppers Drug Mart 100 4,263 0.03IGM Financial 100 4,181 0.03SNC-Lavalin Group 100 4,043 0.03Crescent Point Energy 100 3,739 0.03Fortis 100 3,413 0.02Bombardier ‘B’ 700 2,630 0.02Penn West Petroleum 200 2,103 0.02
total for Canada 3.73
equities (continued)
Switzerland (continued)
equities (continued)
United Kingdom (continued)

Morgan Stanley Investment Funds 31 December 2012 30
Global Equity Allocation Fund
GermanyDeutsche Bank Regd 850 37,024 0.26Daimler Regd 548 29,933 0.21SAP 336 26,957 0.19Volkswagen Pfd 87 19,799 0.14Bayerische Motoren Werke 200 19,282 0.14Siemens Regd 148 16,082 0.12Hannover Rueckversicherung Regd 167 13,016 0.09Deutsche Post Regd 528 11,586 0.08ProSiebenSat.1 Media Pfd 357 10,052 0.07Adidas 109 9,702 0.07Porsche Automobil Holding Pfd 87 7,096 0.05Kabel Deutschland Holding 52 3,889 0.03GEA Group 111 3,591 0.03Brenntag 27 3,549 0.03United Internet Regd 64 1,380 0.01Fraport Frankfurt Airport Services Worldwide 20 1,162 0.01Commerzbank 474 899 0.01
total for Germany 1.54
italyAssicurazioni Generali 3,955 71,836 0.51ENI 1,039 25,190 0.18Telecom Italia 19,639 17,732 0.13Enel 3,666 15,207 0.11UniCredit 2,556 12,522 0.09Intesa Sanpaolo 6,347 10,907 0.08Telecom Italia ‘RSP’ Pfd 11,749 9,280 0.07Saipem 146 5,655 0.04Snam 797 3,702 0.03Atlantia 197 3,560 0.03Fiat 705 3,532 0.02Terna Rete Elettrica Nazionale 812 3,246 0.02Fiat Industrial 254 2,772 0.02Unione Di Banche Italiane 573 2,656 0.02Enel Green Power 1,092 2,028 0.01Luxottica Group 41 1,684 0.01Pirelli & Co 138 1,579 0.01Banco Popolare 159 264 0.00
total for italy 1.38
australiaBHP Billiton 512 19,717 0.14Commonwealth Bank of Australia 278 17,943 0.13Westpac Banking 534 14,434 0.10Australia & New Zealand Banking Group 489 12,715 0.09CSL 190 10,630 0.08National Australia Bank 408 10,588 0.08Woolworths 257 7,824 0.05AGL Energy 409 6,529 0.05Brambles 773 6,026 0.04Wesfarmers 131 5,011 0.04Rio Tinto 71 4,865 0.03Westfield 380 4,165 0.03Woodside Petroleum 104 3,657 0.03Caltex Australia 150 2,991 0.02Newcrest Mining 104 2,394 0.02QBE Insurance Group 207 2,342 0.02Macquarie Group 59 2,173 0.02Origin Energy 158 1,906 0.01Amcor 205 1,717 0.01Orica 60 1,561 0.01
Statement of inveStmentS (continued)
transferable securities and money market instruments admitted to official exchange listing or dealt in on another regulated market. as at 31 December 2012, expressed in US dollars.
investments holdingsmarket
value% of net
assets
James Hardie Industries (Ireland) (2) 82 776 0.01Centro Retail Australia REIT 197 464 0.00Shopping Centres Australasia Property Group REIT 51 79 0.00
total for australia 1.01
norwayTelenor 1,617 32,633 0.23Statoil 804 20,101 0.14DnB 1,434 18,158 0.13Orkla 1,307 11,402 0.08Aker Solutions 534 10,844 0.08Seadrill (Bermuda) (2) 174 6,363 0.05Yara International 107 5,269 0.04Norsk Hydro 609 3,054 0.02Subsea 7 (Luxembourg) (2) 108 2,566 0.02
total for norway 0.79
franceSanofi 337 31,804 0.23Société Générale 432 16,184 0.12LVMH Moet Hennessy Louis Vuitton 77 14,128 0.10Compagnie Generale des Etablissements Michelin 60 5,678 0.04Compagnie de Saint-Gobain 115 4,898 0.04Schneider Electric 57 4,131 0.03European Aeronautic Defence and Space (Netherlands) (2) 105 4,095 0.03BNP Paribas 71 3,997 0.03Christian Dior 19 3,221 0.02Vinci 62 2,947 0.02Publicis Groupe 48 2,871 0.02Safran 64 2,758 0.02Legrand 65 2,739 0.02Alstom 57 2,271 0.02Bouygues 74 2,191 0.01Remy Cointreau 12 1,312 0.01Crédit Agricole 75 603 0.00Vivendi 14 314 0.00Natixis 86 290 0.00
total for france 0.76
DenmarkNovo-Nordisk ‘B’ 286 46,444 0.33TDC 1,564 11,096 0.08Danske Bank 451 7,644 0.06AP Moller - Maersk ‘B’ 1 7,548 0.05Carlsberg ‘B’ 74 7,264 0.05Novozymes ‘B’ 180 5,077 0.04Coloplast ‘B’ 90 4,409 0.03DSV 138 3,563 0.03
total for Denmark 0.67
SwedenSvenska Cellulosa ‘B’ 518 11,242 0.08Telefonaktiebolaget LM Ericsson ‘B’ 997 9,990 0.07Boliden 528 9,923 0.07TeliaSonera 1,268 8,599 0.06Securitas ‘B’ 963 8,404 0.06Tele2 ‘B’ 454 8,183 0.06Volvo ‘B’ 371 5,071 0.04Atlas Copco ‘A’ 176 4,830 0.03Sandvik 287 4,572 0.03Assa Abloy ‘B’ 98 3,664 0.03Elekta ‘B’ 208 3,246 0.02SKF ‘B’ 113 2,838 0.02Atlas Copco ‘B’ 98 2,386 0.02Skanska ‘B’ 140 2,288 0.02
equities (continued)
equities (continued)
australia (continued)
investments holdingsmarket
value% of net
assets

31 Morgan Stanley Investment Funds 31 December 2012
Global Equity Allocation Fund
Electrolux ‘B’ 79 2,073 0.02Scania ‘B’ 100 2,067 0.01Alfa Laval 75 1,562 0.01
total for Sweden 0.65
netherlandsING Groep ‘CVA’ ADR 1,468 13,703 0.10Koninklijke Boskalis Westminster 242 10,877 0.08Wolters Kluwer 498 10,188 0.07Randstad Holding 245 9,005 0.06DE Master Blenders 1753 500 5,763 0.04Koninklijke Ahold 380 5,091 0.04Gemalto 35 3,146 0.02Core Laboratories 27 2,918 0.02Koninklijke Philips Electronics 108 2,840 0.02
total for netherlands 0.45
South africaSABMiller (United Kingdom) (2) 1,065 48,889 0.35
total for South africa 0.35
BelgiumAnheuser-Busch InBev 282 24,507 0.18Telenet Group Holding 400 18,851 0.13KBC Groep 11 380 0.00Mobistar 11 282 0.00
total for Belgium 0.31
finlandMetso 237 10,038 0.07Elisa 384 8,493 0.06UPM-Kymmene 672 7,822 0.06Neste Oil 341 4,404 0.03Kone ‘B’ 46 3,393 0.02Wartsila 57 2,465 0.02
total for finland 0.26
SingaporeSeagate Technology (Ireland) (2) 699 21,166 0.15Flextronics International 900 5,499 0.04
total for Singapore 0.19
SpainBanco Santander 719 5,798 0.04Banco Bilbao Vizcaya Argentaria 390 3,588 0.03Banco de Sabadell 202 527 0.00Banco Popular Espanol 418 324 0.00CaixaBank 69 241 0.00
total for Spain 0.07
Statement of inveStmentS (continued)
transferable securities and money market instruments admitted to official exchange listing or dealt in on another regulated market. as at 31 December 2012, expressed in US dollars.
investments holdingsmarket
value% of net
assets
austriaOMV 249 9,004 0.07Erste Group Bank 18 572 0.00
total for austria 0.07
irelandCRH 304 6,149 0.04Kerry Group ‘A’ 40 2,106 0.02
total for ireland 0.06
hong KongMGM China Holdings (Cayman Islands) (2) 800 1,447 0.01
total for hong Kong 0.01
South KoreaNexon (Japan) (2) 100 1,000 0.01
total for South Korea 0.01
russiaEvraz (United Kingdom) (2) 235 989 0.01
total for russia 0.01
total for equities 80.37
mutual fund
Morgan Stanley Funds plc - US Dollar Treasury Liquidity Fund (Ireland) (2) (4) 1,200,970 1,200,970 8.59
total for mutual fund 8.59
total for transferable securities and money market instruments admitted to official exchange listing or dealt in on another regulated market 12,432,985 88.96
Other transferable securities and money market instruments not admitted to official exchange listing or dealt in on another regulated market. as at 31 December 2012, expressed in US dollars.
equities
United KingdomRolls-Royce Holdings Pfd ‘C’ (3) 15,884 26 0.00
total for United Kingdom 0.00
total for equities 26 0.00
total for other transferable securities and money market instruments not admitted to official exchange listing or dealt in on another regulated market 26 0.00
total investment Securities 12,433,011 88.96
equities (continued)
Sweden (continued)
investments holdingsmarket
value% of net
assets equities (continued)
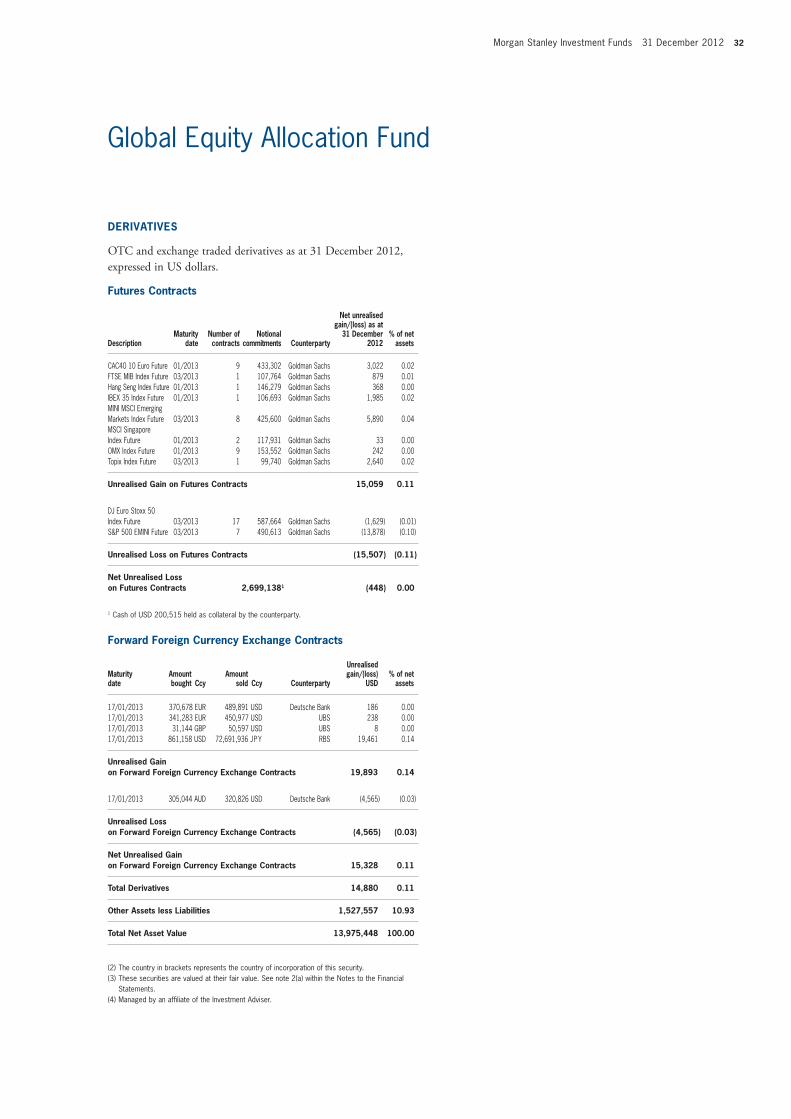
Morgan Stanley Investment Funds 31 December 2012 32
Global Equity Allocation Fund
DerivativeS
OtC and exchange traded derivatives as at 31 December 2012, expressed in US dollars.
futures Contracts
Descriptionmaturity
datenumber of contracts
notional commitments Counterparty
net unrealised gain/(loss) as at
31 December 2012
% of net assets
CAC40 10 Euro Future 01/2013 9 433,302 Goldman Sachs 3,022 0.02FTSE MIB Index Future 03/2013 1 107,764 Goldman Sachs 879 0.01Hang Seng Index Future 01/2013 1 146,279 Goldman Sachs 368 0.00IBEX 35 Index Future 01/2013 1 106,693 Goldman Sachs 1,985 0.02MINI MSCI Emerging Markets Index Future 03/2013 8 425,600 Goldman Sachs 5,890 0.04MSCI Singapore Index Future 01/2013 2 117,931 Goldman Sachs 33 0.00OMX Index Future 01/2013 9 153,552 Goldman Sachs 242 0.00Topix Index Future 03/2013 1 99,740 Goldman Sachs 2,640 0.02
Unrealised Gain on futures Contracts 15,059 0.11
DJ Euro Stoxx 50 Index Future 03/2013 17 587,664 Goldman Sachs (1,629) (0.01)S&P 500 EMINI Future 03/2013 7 490,613 Goldman Sachs (13,878) (0.10)
Unrealised Loss on futures Contracts (15,507) (0.11)
net Unrealised Loss on futures Contracts 2,699,1381 (448) 0.00
1 Cash of USD 200,515 held as collateral by the counterparty.
forward foreign Currency exchange Contracts
maturity date
amount bought Ccy
amount sold Ccy Counterparty
Unrealised gain/(loss)
USD% of net
assets
17/01/2013 370,678 EUR 489,891 USD Deutsche Bank 186 0.00 17/01/2013 341,283 EUR 450,977 USD UBS 238 0.00 17/01/2013 31,144 GBP 50,597 USD UBS 8 0.00 17/01/2013 861,158 USD 72,691,936 JPY RBS 19,461 0.14
Unrealised Gain on forward foreign Currency exchange Contracts 19,893 0.14
17/01/2013 305,044 AUD 320,826 USD Deutsche Bank (4,565) (0.03)
Unrealised Loss on forward foreign Currency exchange Contracts (4,565) (0.03)
net Unrealised Gain on forward foreign Currency exchange Contracts 15,328 0.11
total Derivatives 14,880 0.11
other assets less Liabilities 1,527,557 10.93
total net asset value 13,975,448 100.00
(2) The country in brackets represents the country of incorporation of this security.(3) These securities are valued at their fair value. See note 2(a) within the Notes to the Financial
Statements.(4) Managed by an affiliate of the Investment Adviser.

33 Morgan Stanley Investment Funds 31 December 2012
Please refer to the full prospectus for the Fund’s investment objective and policy.
Global Infrastructure Fund
equities
United States of america American Tower 153,660 11,701,209 5.20 Williams 245,050 7,839,149 3.48 Northeast Utilities 197,953 7,585,559 3.37 SBA Communications ‘A’ 106,280 7,508,682 3.33 Sempra Energy 106,290 7,441,363 3.30 Spectra Energy 271,870 7,288,835 3.24 Kinder Morgan 200,110 6,947,819 3.09 Crown Castle International 76,920 5,485,165 2.44 PG&E 131,260 5,196,583 2.31 Enbridge Energy Management 177,855 5,091,989 2.26 ITC Holdings 53,290 4,053,770 1.80 Oneok 93,630 3,940,887 1.75 Centerpoint Energy 191,100 3,617,523 1.61 NiSource 137,430 3,369,784 1.50 American Water Works 85,266 3,137,789 1.39 Consolidated Edison 33,907 1,852,339 0.82 AGL Resources 37,910 1,491,000 0.66 Cheniere Energy 69,610 1,284,304 0.57 New Jersey Resources 27,150 1,055,049 0.47 WGL Holdings 20,480 788,070 0.35 Atmos Energy 19,440 670,097 0.30 California Water Service Group 31,000 562,960 0.25
total for United States of america 43.49
Canada TransCanada 354,430 16,558,722 7.36 Enbridge 252,422 10,791,426 4.79
total for Canada 12.15
China Beijing Enterprises Holdings (Hong Kong) (2) 2,435,500 15,869,541 7.05 Jiangsu Expressway ‘H’ 2,730,000 2,814,455 1.25 China Gas Holdings (Bermuda) (2) 3,372,000 2,654,008 1.18 ENN Energy Holdings (Cayman Islands) (2) 346,000 1,506,728 0.67 Sichuan Expressway ‘H’ 3,886,200 1,398,989 0.62 China Merchants Holdings International (Hong Kong) (2) 390,498 1,252,074 0.56
total for China 11.33
United Kingdom National Grid 1,340,043 15,307,845 6.80 Severn Trent 113,766 2,909,760 1.29 United Utilities Group 231,509 2,533,643 1.13
total for United Kingdom 9.22
italy Snam 1,305,540 6,064,575 2.69 Atlantia 204,099 3,688,229 1.64 Terna Rete Elettrica Nazionale 609,527 2,436,594 1.08 Societa Iniziative Autostradali e Servizi 206,390 1,928,930 0.86
total for italy 6.27
inveStment aim
To seek to provide long term capital appreciation, measured in US dollars, by investing primarily in equity securities issued by companies located throughout the world that are engaged in the infrastructure business.
Statement of inveStmentS
transferable securities and money market instruments admitted to official exchange listing or dealt in on another regulated market. as at 31 December 2012, expressed in US dollars.
investments holdingsmarket
value% of net
assets

Morgan Stanley Investment Funds 31 December 2012 34
Global Infrastructure Fund
Statement of inveStmentS (continued)
transferable securities and money market instruments admitted to official exchange listing or dealt in on another regulated market. as at 31 December 2012, expressed in US dollars.
investments holdingsmarket
value% of net
assets
DerivativeS
OtC and exchange traded derivatives as at 31 December 2012, expressed in US dollars.
forward foreign Currency exchange Contracts
maturity date
amount bought Ccy
amount sold Ccy Counterparty
Unrealised gain/(loss)
USD% of net
assets
02/01/2013 344,728 EUR 454,289 USD UBS 1,418 0.00
Unrealised Gain on forward foreign Currency exchange Contracts 1,418 0.00
eUr hedged Share Class 11/01/2013 106,421 EUR 140,225 USD J.P. Morgan 469 0.00
Unrealised Gain on nav hedged Share Classes forward foreign Currency exchange Contracts 469 0.00
total Unrealised Gain on forward foreign Currency exchange Contracts 1,887 0.00
08/01/2013 9,126,152 JPY 106,024 USD UBS (361) 0.00
Unrealised Loss on forward foreign Currency exchange Contracts (361) 0.00
eUr hedged Share Class 11/01/2013 54,258,875 EUR 71,792,566 USD J.P. Morgan (60,202) (0.03)
Unrealised Loss on nav hedged Share Classes forward foreign Currency exchange Contracts (60,202) (0.03)
total Unrealised Loss on forward foreign Currency exchange Contracts (60,563) (0.03)
net Unrealised Loss on forward foreign Currency exchange Contracts (58,676) (0.03)
total Derivatives (58,676) (0.03)
other assets less Liabilities 3,483,668 1.55
total net asset value 225,112,504 100.00
(2) The country in brackets represents the country of incorporation of this security.(4) Managed by an affiliate of the Investment Adviser.
australia Transurban Group 751,180 4,748,547 2.11 Sydney Airport 745,099 2,614,148 1.16 DUET 786,918 1,698,995 0.75 APA 284,981 1,635,839 0.73 Macquarie Atlas Roads 236,958 409,529 0.18
total for australia 4.93
france SES (Luxembourg) (2) 189,848 5,447,212 2.42 Eutelsat Communications 37,631 1,248,613 0.55
total for france 2.97
Spain Abertis Infraestructuras 116,607 1,914,497 0.85 Ferrovial 101,502 1,502,800 0.67
total for Spain 1.52
Switzerland Flughafen Zuerich Regd 6,773 3,135,099 1.39
total for Switzerland 1.39
Japan Tokyo Gas 562,000 2,566,346 1.14
total for Japan 1.14
Germany Fraport Frankfurt Airport Services Worldwide 30,897 1,794,467 0.80
total for Germany 0.80
netherlands Koninklijke Vopak 24,745 1,743,832 0.78
total for netherlands 0.78
Brazil Cia de Saneamento Basico do Estado de Sao Paulo ADR 12,532 1,046,923 0.47
total for Brazil 0.47
total for equities 96.46
mutual fund
Morgan Stanley Funds plc - US Dollar Treasury Liquidity Fund (Ireland) (2) (4) 4,555,221 4,555,221 2.02
total for mutual fund 2.02
total investment Securities 221,687,512 98.48
equities (continued)
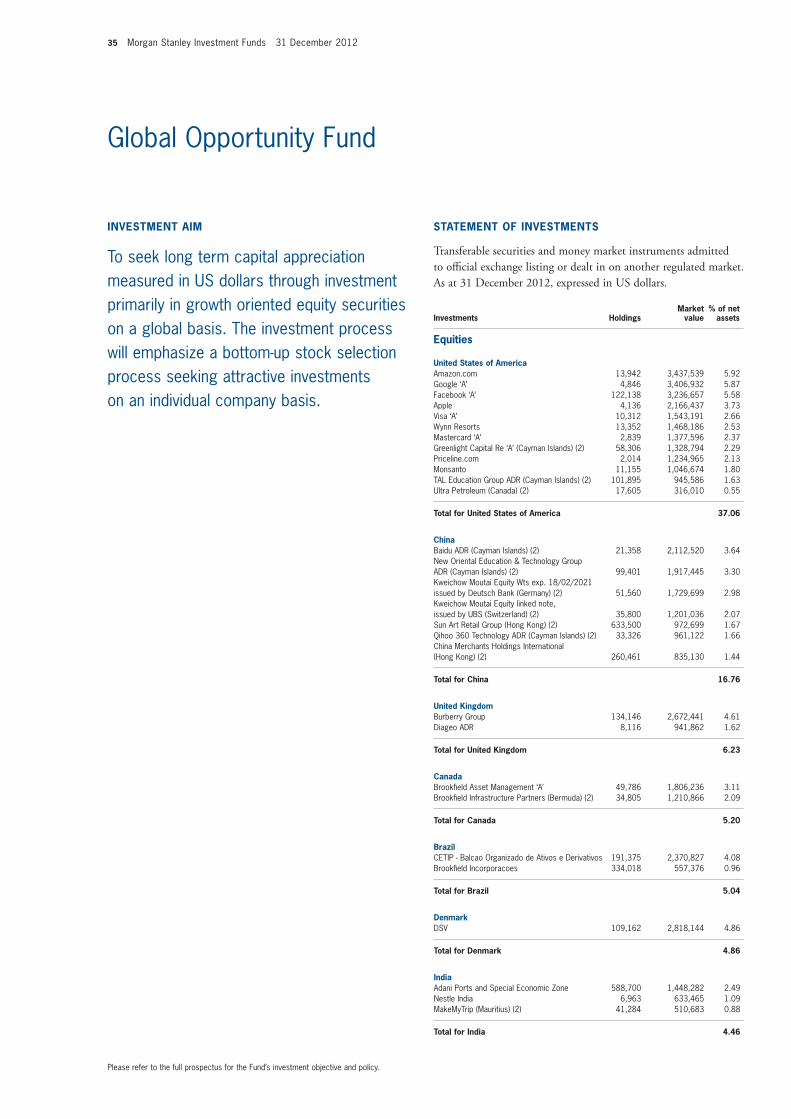
35 Morgan Stanley Investment Funds 31 December 2012
Please refer to the full prospectus for the Fund’s investment objective and policy.
Global Opportunity Fund
equities
United States of america Amazon.com 13,942 3,437,539 5.92 Google ‘A’ 4,846 3,406,932 5.87 Facebook ‘A’ 122,138 3,236,657 5.58 Apple 4,136 2,166,437 3.73 Visa ‘A’ 10,312 1,543,191 2.66 Wynn Resorts 13,352 1,468,186 2.53 Mastercard ‘A’ 2,839 1,377,596 2.37 Greenlight Capital Re ‘A’ (Cayman Islands) (2) 58,306 1,328,794 2.29 Priceline.com 2,014 1,234,965 2.13 Monsanto 11,155 1,046,674 1.80 TAL Education Group ADR (Cayman Islands) (2) 101,895 945,586 1.63 Ultra Petroleum (Canada) (2) 17,605 316,010 0.55
total for United States of america 37.06
China Baidu ADR (Cayman Islands) (2) 21,358 2,112,520 3.64 New Oriental Education & Technology Group ADR (Cayman Islands) (2) 99,401 1,917,445 3.30 Kweichow Moutai Equity Wts exp. 18/02/2021 issued by Deutsch Bank (Germany) (2) 51,560 1,729,699 2.98 Kweichow Moutai Equity linked note, issued by UBS (Switzerland) (2) 35,800 1,201,036 2.07 Sun Art Retail Group (Hong Kong) (2) 633,500 972,699 1.67 Qihoo 360 Technology ADR (Cayman Islands) (2) 33,326 961,122 1.66 China Merchants Holdings International (Hong Kong) (2) 260,461 835,130 1.44
total for China 16.76
United Kingdom Burberry Group 134,146 2,672,441 4.61 Diageo ADR 8,116 941,862 1.62
total for United Kingdom 6.23
Canada Brookfield Asset Management ‘A’ 49,786 1,806,236 3.11 Brookfield Infrastructure Partners (Bermuda) (2) 34,805 1,210,866 2.09
total for Canada 5.20
Brazil CETIP - Balcao Organizado de Ativos e Derivativos 191,375 2,370,827 4.08 Brookfield Incorporacoes 334,018 557,376 0.96
total for Brazil 5.04
Denmark DSV 109,162 2,818,144 4.86
total for Denmark 4.86
india Adani Ports and Special Economic Zone 588,700 1,448,282 2.49 Nestle India 6,963 633,465 1.09 MakeMyTrip (Mauritius) (2) 41,284 510,683 0.88
total for india 4.46
inveStment aim
To seek long term capital appreciation measured in US dollars through investment primarily in growth oriented equity securities on a global basis. The investment process will emphasize a bottom-up stock selection process seeking attractive investments on an individual company basis.
Statement of inveStmentS
transferable securities and money market instruments admitted to official exchange listing or dealt in on another regulated market. as at 31 December 2012, expressed in US dollars.
investments holdingsmarket
value% of net
assets

Morgan Stanley Investment Funds 31 December 2012 36
Global Opportunity Fund
italy Prada 266,100 2,539,030 4.37
total for italy 4.37
Belgium Anheuser-Busch InBev 21,770 1,891,893 3.26
total for Belgium 3.26
South africa Naspers ‘N’ 19,370 1,240,776 2.14
total for South africa 2.14
france Pernod-Ricard 7,383 853,398 1.47
total for france 1.47
Switzerland Kuehne & Nagel International Regd 5,780 696,157 1.20
total for Switzerland 1.20
total for equities 92.05
mutual fund
Morgan Stanley Funds plc - US Dollar Treasury Liquidity Fund (Ireland) (2) (4) 3,801,933 3,801,933 6.55
total for mutual fund 6.55
total investment Securities 57,231,587 98.60
Statement of inveStmentS (continued)
transferable securities and money market instruments admitted to official exchange listing or dealt in on another regulated market. as at 31 December 2012, expressed in US dollars.
investments holdingsmarket
value% of net
assets
DerivativeS
OtC and exchange traded derivatives as at 31 December 2012, expressed in US dollars.
forward foreign Currency exchange Contracts
maturity date
amount bought Ccy
amount sold Ccy Counterparty
Unrealised gain/(loss)
USD% of net
assets
eUr hedged Share Class 11/01/2013 9,988 EUR 13,158 USD J.P. Morgan 45 0.00
total Unrealised Gain on forward foreign Currency exchange Contracts 45 0.00
eUr hedged Share Class 11/01/2013 2,567,493 EUR 3,398,790 USD J.P. Morgan (4,464) (0.01)
total Unrealised Loss on forward foreign Currency exchange Contracts (4,464) (0.01)
net Unrealised Loss on forward foreign Currency exchange Contracts (4,419) (0.01)
total Derivatives (4,419) (0.01)
other assets less Liabilities 815,059 1.41
total net asset value 58,042,227 100.00
(2) The country in brackets represents the country of incorporation of this security.(4) Managed by an affiliate of the Investment Adviser.
equities (continued)
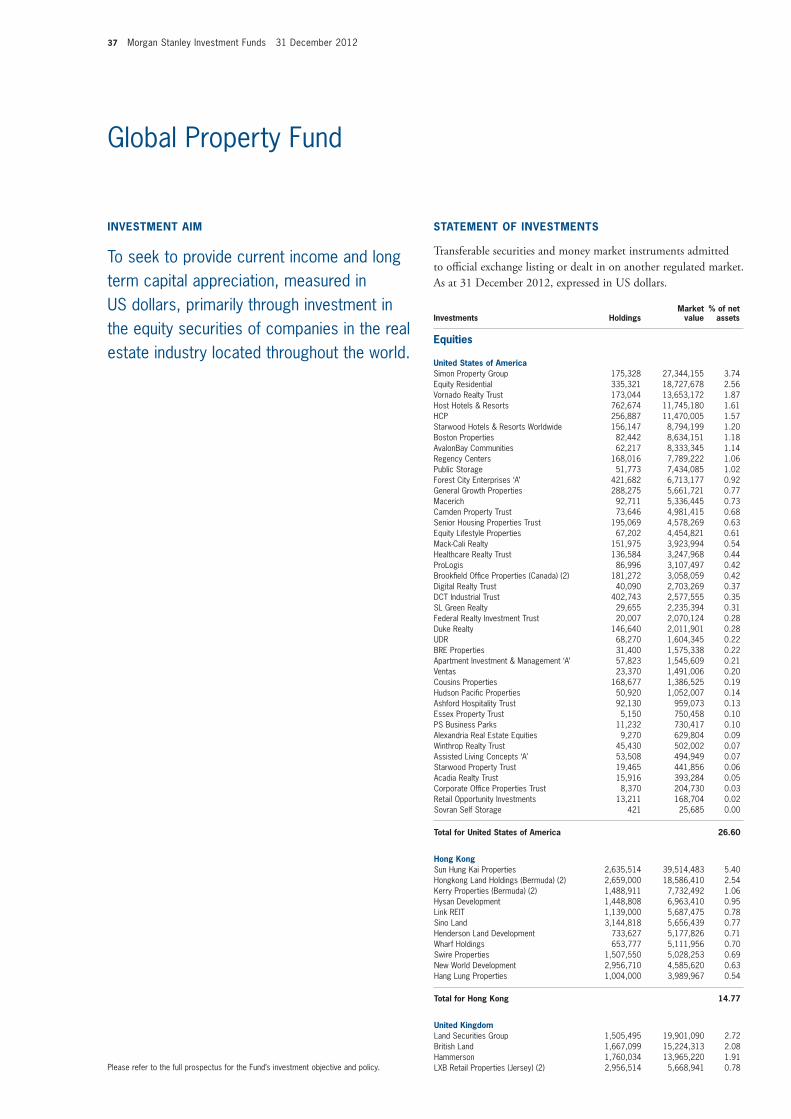
37 Morgan Stanley Investment Funds 31 December 2012
Please refer to the full prospectus for the Fund’s investment objective and policy.
Global Property Fund
equities
United States of america Simon Property Group 175,328 27,344,155 3.74 Equity Residential 335,321 18,727,678 2.56 Vornado Realty Trust 173,044 13,653,172 1.87 Host Hotels & Resorts 762,674 11,745,180 1.61 HCP 256,887 11,470,005 1.57 Starwood Hotels & Resorts Worldwide 156,147 8,794,199 1.20 Boston Properties 82,442 8,634,151 1.18 AvalonBay Communities 62,217 8,333,345 1.14 Regency Centers 168,016 7,789,222 1.06 Public Storage 51,773 7,434,085 1.02 Forest City Enterprises ‘A’ 421,682 6,713,177 0.92 General Growth Properties 288,275 5,661,721 0.77 Macerich 92,711 5,336,445 0.73 Camden Property Trust 73,646 4,981,415 0.68 Senior Housing Properties Trust 195,069 4,578,269 0.63 Equity Lifestyle Properties 67,202 4,454,821 0.61 Mack-Cali Realty 151,975 3,923,994 0.54 Healthcare Realty Trust 136,584 3,247,968 0.44 ProLogis 86,996 3,107,497 0.42 Brookfield Office Properties (Canada) (2) 181,272 3,058,059 0.42 Digital Realty Trust 40,090 2,703,269 0.37 DCT Industrial Trust 402,743 2,577,555 0.35 SL Green Realty 29,655 2,235,394 0.31 Federal Realty Investment Trust 20,007 2,070,124 0.28 Duke Realty 146,640 2,011,901 0.28 UDR 68,270 1,604,345 0.22 BRE Properties 31,400 1,575,338 0.22 Apartment Investment & Management ‘A’ 57,823 1,545,609 0.21 Ventas 23,370 1,491,006 0.20 Cousins Properties 168,677 1,386,525 0.19 Hudson Pacific Properties 50,920 1,052,007 0.14 Ashford Hospitality Trust 92,130 959,073 0.13 Essex Property Trust 5,150 750,458 0.10 PS Business Parks 11,232 730,417 0.10 Alexandria Real Estate Equities 9,270 629,804 0.09 Winthrop Realty Trust 45,430 502,002 0.07 Assisted Living Concepts ‘A’ 53,508 494,949 0.07 Starwood Property Trust 19,465 441,856 0.06 Acadia Realty Trust 15,916 393,284 0.05 Corporate Office Properties Trust 8,370 204,730 0.03 Retail Opportunity Investments 13,211 168,704 0.02 Sovran Self Storage 421 25,685 0.00
total for United States of america 26.60
hong Kong Sun Hung Kai Properties 2,635,514 39,514,483 5.40 Hongkong Land Holdings (Bermuda) (2) 2,659,000 18,586,410 2.54 Kerry Properties (Bermuda) (2) 1,488,911 7,732,492 1.06 Hysan Development 1,448,808 6,963,410 0.95 Link REIT 1,139,000 5,687,475 0.78 Sino Land 3,144,818 5,656,439 0.77 Henderson Land Development 733,627 5,177,826 0.71 Wharf Holdings 653,777 5,111,956 0.70 Swire Properties 1,507,550 5,028,253 0.69 New World Development 2,956,710 4,585,620 0.63 Hang Lung Properties 1,004,000 3,989,967 0.54
total for hong Kong 14.77
United Kingdom Land Securities Group 1,505,495 19,901,090 2.72 British Land 1,667,099 15,224,313 2.08 Hammerson 1,760,034 13,965,220 1.91 LXB Retail Properties (Jersey) (2) 2,956,514 5,668,941 0.78
inveStment aim
To seek to provide current income and long term capital appreciation, measured in US dollars, primarily through investment in the equity securities of companies in the real estate industry located throughout the world.
Statement of inveStmentS
transferable securities and money market instruments admitted to official exchange listing or dealt in on another regulated market. as at 31 December 2012, expressed in US dollars.
investments holdingsmarket
value% of net
assets
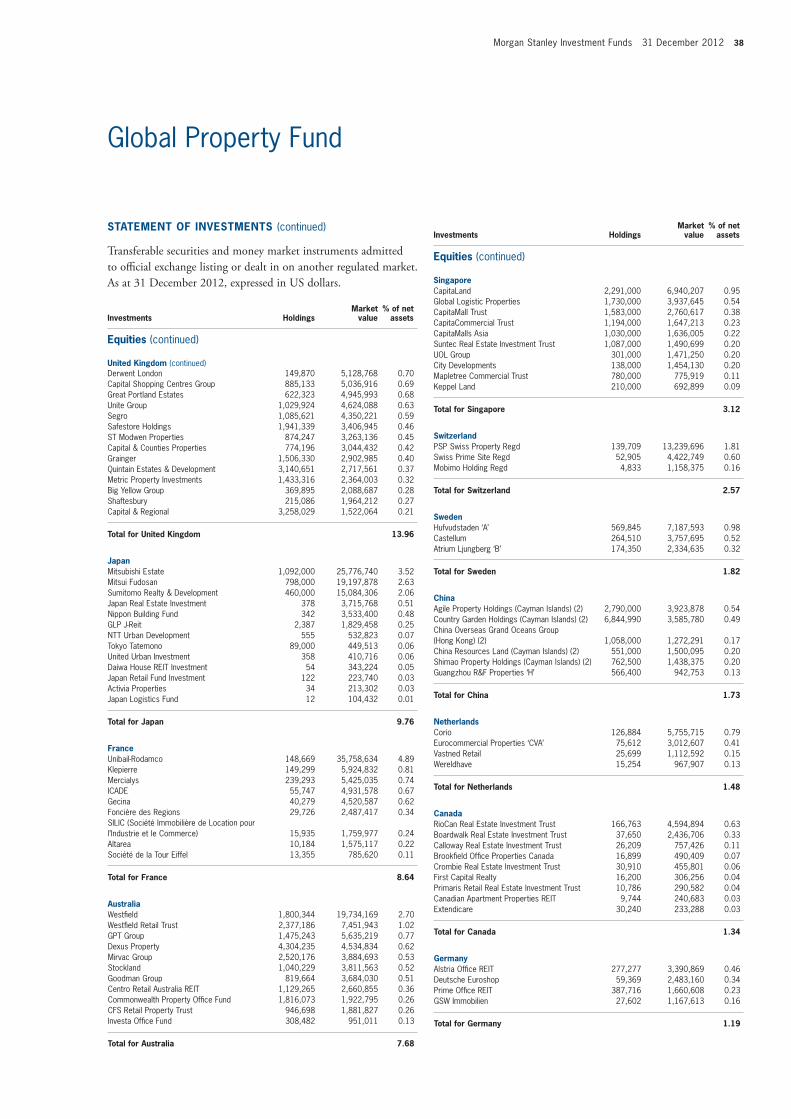
Morgan Stanley Investment Funds 31 December 2012 38
Global Property Fund
Derwent London 149,870 5,128,768 0.70 Capital Shopping Centres Group 885,133 5,036,916 0.69 Great Portland Estates 622,323 4,945,993 0.68 Unite Group 1,029,924 4,624,088 0.63 Segro 1,085,621 4,350,221 0.59 Safestore Holdings 1,941,339 3,406,945 0.46 ST Modwen Properties 874,247 3,263,136 0.45 Capital & Counties Properties 774,196 3,044,432 0.42 Grainger 1,506,330 2,902,985 0.40 Quintain Estates & Development 3,140,651 2,717,561 0.37 Metric Property Investments 1,433,316 2,364,003 0.32 Big Yellow Group 369,895 2,088,687 0.28 Shaftesbury 215,086 1,964,212 0.27 Capital & Regional 3,258,029 1,522,064 0.21
total for United Kingdom 13.96
Japan Mitsubishi Estate 1,092,000 25,776,740 3.52 Mitsui Fudosan 798,000 19,197,878 2.63 Sumitomo Realty & Development 460,000 15,084,306 2.06 Japan Real Estate Investment 378 3,715,768 0.51 Nippon Building Fund 342 3,533,400 0.48 GLP J-Reit 2,387 1,829,458 0.25 NTT Urban Development 555 532,823 0.07 Tokyo Tatemono 89,000 449,513 0.06 United Urban Investment 358 410,716 0.06 Daiwa House REIT Investment 54 343,224 0.05 Japan Retail Fund Investment 122 223,740 0.03 Activia Properties 34 213,302 0.03 Japan Logistics Fund 12 104,432 0.01
total for Japan 9.76
france Unibail-Rodamco 148,669 35,758,634 4.89 Klepierre 149,299 5,924,832 0.81 Mercialys 239,293 5,425,035 0.74 ICADE 55,747 4,931,578 0.67 Gecina 40,279 4,520,587 0.62 Foncière des Regions 29,726 2,487,417 0.34 SILIC (Société Immobilière de Location pour l’Industrie et le Commerce) 15,935 1,759,977 0.24 Altarea 10,184 1,575,117 0.22 Société de la Tour Eiffel 13,355 785,620 0.11
total for france 8.64
australia Westfield 1,800,344 19,734,169 2.70 Westfield Retail Trust 2,377,186 7,451,943 1.02 GPT Group 1,475,243 5,635,219 0.77 Dexus Property 4,304,235 4,534,834 0.62 Mirvac Group 2,520,176 3,884,693 0.53 Stockland 1,040,229 3,811,563 0.52 Goodman Group 819,664 3,684,030 0.51 Centro Retail Australia REIT 1,129,265 2,660,855 0.36 Commonwealth Property Office Fund 1,816,073 1,922,795 0.26 CFS Retail Property Trust 946,698 1,881,827 0.26 Investa Office Fund 308,482 951,011 0.13
total for australia 7.68
Statement of inveStmentS (continued)
transferable securities and money market instruments admitted to official exchange listing or dealt in on another regulated market. as at 31 December 2012, expressed in US dollars.
investments holdingsmarket
value% of net
assets
investments holdingsmarket
value% of net
assets
Singapore CapitaLand 2,291,000 6,940,207 0.95 Global Logistic Properties 1,730,000 3,937,645 0.54 CapitaMall Trust 1,583,000 2,760,617 0.38 CapitaCommercial Trust 1,194,000 1,647,213 0.23 CapitaMalls Asia 1,030,000 1,636,005 0.22 Suntec Real Estate Investment Trust 1,087,000 1,490,699 0.20 UOL Group 301,000 1,471,250 0.20 City Developments 138,000 1,454,130 0.20 Mapletree Commercial Trust 780,000 775,919 0.11 Keppel Land 210,000 692,899 0.09
total for Singapore 3.12
Switzerland PSP Swiss Property Regd 139,709 13,239,696 1.81 Swiss Prime Site Regd 52,905 4,422,749 0.60 Mobimo Holding Regd 4,833 1,158,375 0.16
total for Switzerland 2.57
Sweden Hufvudstaden ‘A’ 569,845 7,187,593 0.98 Castellum 264,510 3,757,695 0.52 Atrium Ljungberg ‘B’ 174,350 2,334,635 0.32
total for Sweden 1.82
China Agile Property Holdings (Cayman Islands) (2) 2,790,000 3,923,878 0.54 Country Garden Holdings (Cayman Islands) (2) 6,844,990 3,585,780 0.49 China Overseas Grand Oceans Group (Hong Kong) (2) 1,058,000 1,272,291 0.17 China Resources Land (Cayman Islands) (2) 551,000 1,500,095 0.20 Shimao Property Holdings (Cayman Islands) (2) 762,500 1,438,375 0.20 Guangzhou R&F Properties ‘H’ 566,400 942,753 0.13
total for China 1.73
netherlands Corio 126,884 5,755,715 0.79 Eurocommercial Properties ‘CVA’ 75,612 3,012,607 0.41 Vastned Retail 25,699 1,112,592 0.15 Wereldhave 15,254 967,907 0.13
total for netherlands 1.48
Canada RioCan Real Estate Investment Trust 166,763 4,594,894 0.63 Boardwalk Real Estate Investment Trust 37,650 2,436,706 0.33 Calloway Real Estate Investment Trust 26,209 757,426 0.11 Brookfield Office Properties Canada 16,899 490,409 0.07 Crombie Real Estate Investment Trust 30,910 455,801 0.06 First Capital Realty 16,200 306,256 0.04 Primaris Retail Real Estate Investment Trust 10,786 290,582 0.04 Canadian Apartment Properties REIT 9,744 240,683 0.03 Extendicare 30,240 233,288 0.03
total for Canada 1.34
GermanyAlstria Office REIT 277,277 3,390,869 0.46 Deutsche Euroshop 59,369 2,483,160 0.34 Prime Office REIT 387,716 1,660,608 0.23 GSW Immobilien 27,602 1,167,613 0.16
total for Germany 1.19
equities (continued)
equities (continued)
United Kingdom (continued)

39 Morgan Stanley Investment Funds 31 December 2012
Global Property Fund
finland Sponda 561,165 2,670,555 0.36 Citycon 211,465 718,423 0.10
total for finland 0.46
italy Beni Stabili 5,045,305 2,975,282 0.41
total for italy 0.41
norway Norwegian Property 1,913,886 2,926,068 0.40
total for norway 0.40
austria Atrium European Real Estate (Jersey) (2) 408,690 2,404,155 0.33 Conwert Immobilien Invest 27,772 358,682 0.05
total for austria 0.38
Brazil Iguatemi Empresa de Shopping Centers 64,200 853,285 0.12 PDG Realty - Empreendimentos e Participacoes 351,800 568,167 0.08 BR Properties 35,000 435,472 0.06 BR Malls Participaçoes 8,000 105,470 0.01
total for Brazil 0.27
Belgium Cofinimmo 8,054 953,955 0.13 Befimmo 9,549 616,386 0.08
total for Belgium 0.21
india Religare Health Trust (Singapore) (2) 704,000 510,107 0.07
total for india 0.07
total for equities 96.86
mutual fund
Morgan Stanley Funds plc - US Dollar Treasury Liquidity Fund (Ireland) (2) (4) 11,983,539 11,983,539 1.63
total for mutual fund 1.63
total for transferable securities and money market instruments admitted to official exchange listing or dealt in on another regulated market 720,440,696 98.49
Statement of inveStmentS (continued)
transferable securities and money market instruments admitted to official exchange listing or dealt in on another regulated market. as at 31 December 2012, expressed in US dollars.
investments holdingsmarket
value% of net
assets
Other transferable securities and money market instruments not admitted to official exchange listing or dealt in on another regulated market. as at 31 December 2012, expressed in US dollars.
investments holdingsmarket
value% of net
assets
equities
maltaBGP Holdings (Australia) (2) (3) 3,475,560 0 0.00
total for malta 0.00
total for equities 0.00
total for other transferable securities and money market instruments not admitted to official exchange listing or dealt in on another regulated market 0 0.00
total investment Securities 720,440,696 98.49
DerivativeS
OtC and exchange traded derivatives as at 31 December 2012, expressed in US dollars.
forward foreign Currency exchange Contracts
maturity date
amount bought Ccy
amount sold Ccy Counterparty
Unrealised gain/(loss)
USD% of net
assets
02/01/2013 1,741,756 SEK 202,427 EUR J.P. Morgan 487 0.00 04/01/2013 118,690 USD 10,168,978 JPY State Street 956 0.00
Unrealised Gain on forward foreign Currency exchange Contracts 1,443 0.00
eUr hedged Share Class 11/01/2013 96,450 EUR 127,085 USD J.P. Morgan 427 0.00
Unrealised Gain on nav hedged Share Classes forward foreign Currency exchange Contracts 427 0.00
total Unrealised Gain on forward foreign Currency exchange Contracts 1,870 0.00
07/01/2013 129,814 USD 11,230,184 JPY State Street (209) 0.00
Unrealised Loss on forward foreign Currency exchange Contracts (209) 0.00
eUr hedged Share Class 11/01/2013 7,932,753 EUR 10,499,891 USD J.P. Morgan (12,481) 0.00
Unrealised Loss on nav hedged Share Classes forward foreign Currency exchange Contracts (12,481) 0.00
total Unrealised Loss on forward foreign Currency exchange Contracts (12,690) 0.00
net Unrealised Loss on forward foreign Currency exchange Contracts (10,820) 0.00
total Derivatives (10,820) 0.00
other assets less Liabilities 11,028,771 1.51
total net asset value 731,458,647 100.00
(2) The country in brackets represents the country of incorporation of this security.(3) These securities are valued at their fair value. See note 2(a) within the Notes to the Financial
Statements.(4) Managed by an affiliate of the Investment Adviser.
equities (continued)

Morgan Stanley Investment Funds 31 December 2012 40
Please refer to the full prospectus for the Fund’s investment objective and policy.
* Please refer to Significant Accounting Policies note 2(k).
Indian Equity Fund
Commercial Banks HDFC Bank 613,148 7,582,364 6.18 ICICI Bank 253,516 5,258,580 4.29 IndusInd Bank 642,943 4,886,367 3.99 Jammu & Kashmir Bank 159,900 3,772,620 3.08 State Bank of India 27,684 1,203,466 0.98
total for Commercial Banks 18.52
Pharmaceuticals Glenmark Pharmaceuticals 825,932 7,955,287 6.49 Cipla 423,949 3,200,380 2.61 IPCA Laboratories 214,500 2,027,147 1.66
total for Pharmaceuticals 10.76
thrifts & mortgage finance Housing Development Finance 759,204 11,467,266 9.36
total for thrifts & mortgage finance 9.36
it Services Infosys 87,950 3,716,258 3.03 Tata Consultancy Services 142,984 3,272,282 2.67 Wipro 403,460 2,900,500 2.37
total for it Services 8.07
media Zee Entertainment Enterprises 1,215,693 4,889,357 3.99 Dish TV India 1,119,000 1,549,777 1.26 D.B. 337,927 1,408,363 1.15
total for media 6.40
tobacco ITC 1,314,952 6,872,496 5.61
total for tobacco 5.61
Construction materials ACC 147,712 3,855,182 3.15 Madras Cements 641,454 2,874,415 2.34
total for Construction materials 5.49
automobiles Tata Motors ‘A’ 901,284 2,852,903 2.33 Tata Motors ADR 99,700 2,809,546 2.29
total for automobiles 4.62
oil, Gas & Consumable fuels Reliance Industries 226,258 3,461,593 2.83 Bharat Petroleum 181,817 1,180,692 0.96
total for oil, Gas & Consumable fuels 3.79
inveStment aim
To seek long-term capital appreciation, measured in US dollars, by investment directly (subject to the Fund’s obtaining applicable regulatory approval as the case may be) or through Morgan Stanley SICAV (Mauritius) Limited (the “Subsidiary”), primarily in the equity securities of companies domiciled or exercising the predominant part of their economic activity in India.
Statement of inveStmentS
The investments listed are those of the Subsidiary.*
transferable securities and money market instruments admitted to official exchange listing or dealt in on another regulated market. as at 31 December 2012, expressed in US dollars.
investments holdingsmarket
value% of net
assets
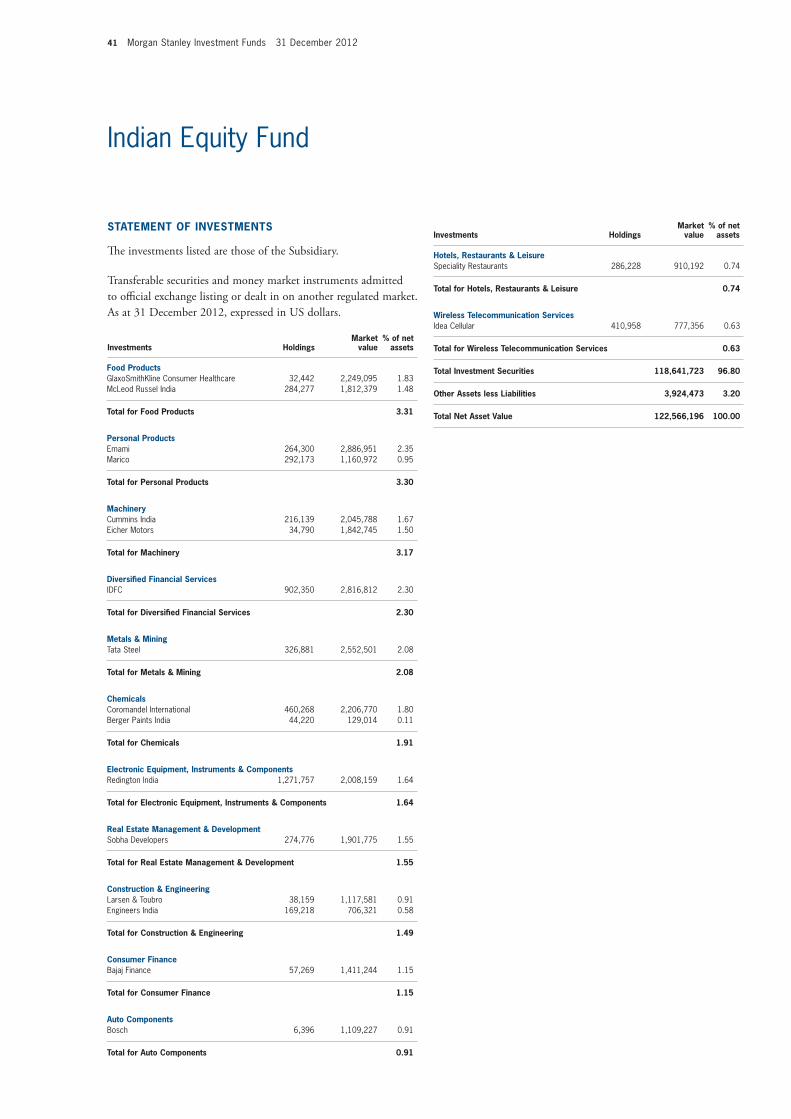
41 Morgan Stanley Investment Funds 31 December 2012
Indian Equity Fund
Statement of inveStmentS
The investments listed are those of the Subsidiary.
transferable securities and money market instruments admitted to official exchange listing or dealt in on another regulated market. as at 31 December 2012, expressed in US dollars.
investments holdingsmarket
value% of net
assets food Products GlaxoSmithKline Consumer Healthcare 32,442 2,249,095 1.83 McLeod Russel India 284,277 1,812,379 1.48
total for food Products 3.31
Personal Products Emami 264,300 2,886,951 2.35 Marico 292,173 1,160,972 0.95
total for Personal Products 3.30
machinery Cummins India 216,139 2,045,788 1.67 Eicher Motors 34,790 1,842,745 1.50
total for machinery 3.17
Diversified financial Services IDFC 902,350 2,816,812 2.30
total for Diversified financial Services 2.30
metals & mining Tata Steel 326,881 2,552,501 2.08
total for metals & mining 2.08
Chemicals Coromandel International 460,268 2,206,770 1.80 Berger Paints India 44,220 129,014 0.11
total for Chemicals 1.91
electronic equipment, instruments & Components Redington India 1,271,757 2,008,159 1.64
total for electronic equipment, instruments & Components 1.64
real estate management & Development Sobha Developers 274,776 1,901,775 1.55
total for real estate management & Development 1.55
Construction & engineering Larsen & Toubro 38,159 1,117,581 0.91 Engineers India 169,218 706,321 0.58
total for Construction & engineering 1.49
Consumer finance Bajaj Finance 57,269 1,411,244 1.15
total for Consumer finance 1.15
auto Components Bosch 6,396 1,109,227 0.91
total for auto Components 0.91
hotels, restaurants & Leisure Speciality Restaurants 286,228 910,192 0.74
total for hotels, restaurants & Leisure 0.74
Wireless telecommunication Services Idea Cellular 410,958 777,356 0.63
total for Wireless telecommunication Services 0.63
total investment Securities 118,641,723 96.80
other assets less Liabilities 3,924,473 3.20
total net asset value 122,566,196 100.00
investments holdingsmarket
value% of net
assets

Morgan Stanley Investment Funds 31 December 2012 42
Please refer to the full prospectus for the Fund’s investment objective and policy.
automobiles Toyota Motor 108,960 433,824 6.43 Yamaha Motor 285,000 268,779 3.99 Honda Motor 79,800 249,029 3.69 Nissan Motor 266,000 214,185 3.18
total for automobiles 17.29
machinery Sumitomo Heavy Industries 762,000 307,706 4.56 NSK 310,000 187,384 2.78 THK 89,820 136,987 2.03 Fanuc 8,100 128,164 1.90 Amada 189,000 104,064 1.54
total for machinery 12.81
Commercial Banks Sumitomo Mitsui Financial Group 106,240 329,209 4.88 Mizuho Financial Group 1,671,040 261,125 3.87 Sumitomo Mitsui Trust Holdings 841,180 251,780 3.73
total for Commercial Banks 12.48
Capital markets Nomura Holdings 638,380 318,311 4.72 Daiwa Securities Group 584,600 275,539 4.09
total for Capital markets 8.81
insurance Dai-ichi Life Insurance 2,252 267,696 3.97 T&D Holdings 234,530 242,391 3.59
total for insurance 7.56
real estate management & Development Mitsubishi Estate 149,600 305,018 4.52 Mitsui Fudosan 71,000 147,536 2.19
total for real estate management & Development 6.71
Semiconductors & Semiconductor equipment Tokyo Electron 45,480 177,809 2.64 Disco 30,100 134,152 1.99 Dainippon Screen Manufacturing 98,000 50,873 0.76
total for Semiconductors & Semiconductor equipment 5.39
marine Mitsui OSK Lines 828,400 208,631 3.09 Nippon Yusen 699,800 139,626 2.07
total for marine 5.16
Chemicals Teijin 663,000 140,376 2.08 JSR 57,900 94,493 1.40
total for Chemicals 3.48
Specialty retail K’s Holdings 97,900 214,830 3.19
total for Specialty retail 3.19
Statement of inveStmentS
transferable securities and money market instruments admitted to official exchange listing or dealt in on another regulated market. as at 31 December 2012, expressed in Japanese Yen.
investments holdings
market value
(JPY000’s)% of net
assets
Japanese Equity Fund
inveStment aim
To seek long-term capital appreciation, measured in Yen, through investment primarily in the equity securities of companies domiciled in or exercising the predominant part of their economic activity in Japan and which are listed on any exchanges or over-the-counter markets.
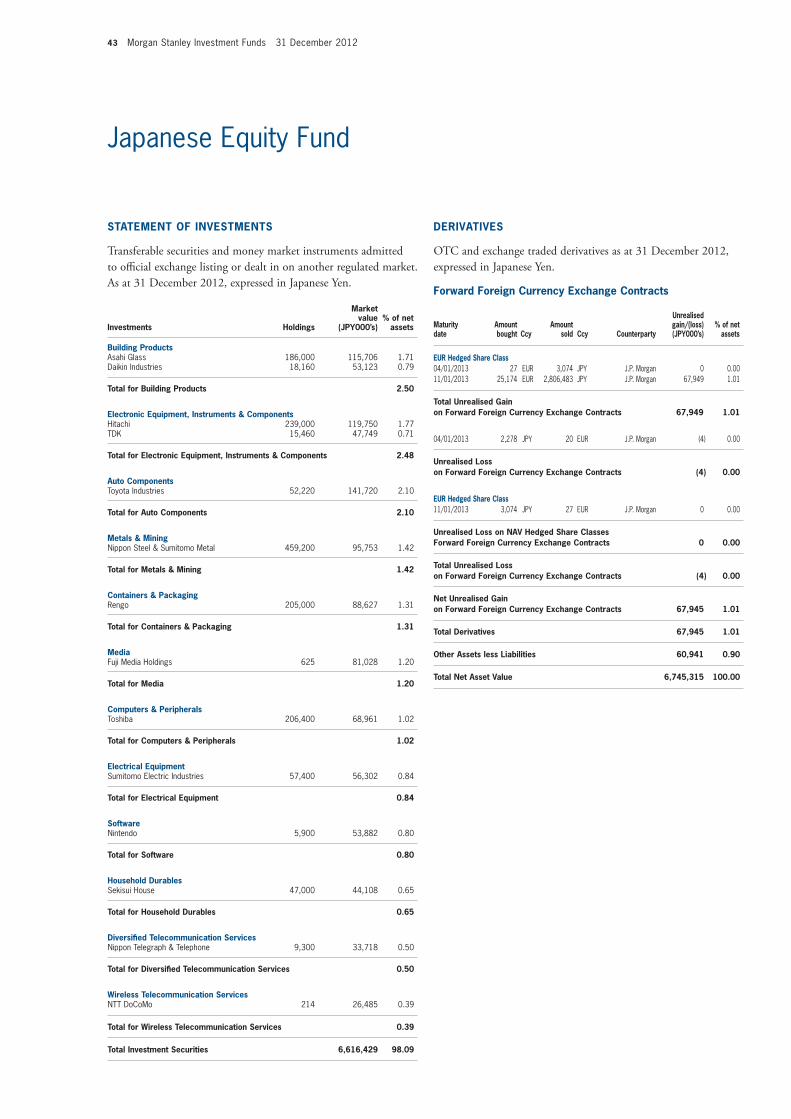
43 Morgan Stanley Investment Funds 31 December 2012
Japanese Equity Fund
Statement of inveStmentS
transferable securities and money market instruments admitted to official exchange listing or dealt in on another regulated market. as at 31 December 2012, expressed in Japanese Yen.
investments holdings
market value
(JPY000’s)% of net
assets Building Products Asahi Glass 186,000 115,706 1.71 Daikin Industries 18,160 53,123 0.79
total for Building Products 2.50
electronic equipment, instruments & Components Hitachi 239,000 119,750 1.77 TDK 15,460 47,749 0.71
total for electronic equipment, instruments & Components 2.48
auto Components Toyota Industries 52,220 141,720 2.10
total for auto Components 2.10
metals & mining Nippon Steel & Sumitomo Metal 459,200 95,753 1.42
total for metals & mining 1.42
Containers & Packaging Rengo 205,000 88,627 1.31
total for Containers & Packaging 1.31
media Fuji Media Holdings 625 81,028 1.20
total for media 1.20
Computers & Peripherals Toshiba 206,400 68,961 1.02
total for Computers & Peripherals 1.02
electrical equipment Sumitomo Electric Industries 57,400 56,302 0.84
total for electrical equipment 0.84
Software Nintendo 5,900 53,882 0.80
total for Software 0.80
household Durables Sekisui House 47,000 44,108 0.65
total for household Durables 0.65
Diversified telecommunication Services Nippon Telegraph & Telephone 9,300 33,718 0.50
total for Diversified telecommunication Services 0.50
Wireless telecommunication Services NTT DoCoMo 214 26,485 0.39
total for Wireless telecommunication Services 0.39
total investment Securities 6,616,429 98.09
DerivativeS
OtC and exchange traded derivatives as at 31 December 2012, expressed in Japanese Yen.
forward foreign Currency exchange Contracts
maturity date
amount bought Ccy
amount sold Ccy Counterparty
Unrealised gain/(loss) (JPY000’s)
% of net assets
eUr hedged Share Class 04/01/2013 27 EUR 3,074 JPY J.P. Morgan 0 0.00 11/01/2013 25,174 EUR 2,806,483 JPY J.P. Morgan 67,949 1.01
total Unrealised Gain on forward foreign Currency exchange Contracts 67,949 1.01
04/01/2013 2,278 JPY 20 EUR J.P. Morgan (4) 0.00
Unrealised Loss on forward foreign Currency exchange Contracts (4) 0.00
eUr hedged Share Class 11/01/2013 3,074 JPY 27 EUR J.P. Morgan 0 0.00
Unrealised Loss on nav hedged Share Classes forward foreign Currency exchange Contracts 0 0.00
total Unrealised Loss on forward foreign Currency exchange Contracts (4) 0.00
net Unrealised Gain on forward foreign Currency exchange Contracts 67,945 1.01
total Derivatives 67,945 1.01
other assets less Liabilities 60,941 0.90
total net asset value 6,745,315 100.00

Morgan Stanley Investment Funds 31 December 2012 44
Please refer to the full prospectus for the Fund’s investment objective and policy.
Latin American Equity Fund
equities
Brazil Companhia de Bebidas das Americas ADR Pfd 1,114,400 46,448,192 5.47 BRF - Brasil Foods 1,977,476 40,707,349 4.80 Banco Bradesco ADR 1,745,155 30,069,021 3.54 Vale ADR Pfd 1,379,898 27,749,749 3.27 Petroleo Brasileiro Pfd 2,879,720 27,427,243 3.23 Itau Unibanco Holding Pfd 1,536,300 25,029,059 2.95 Ultrapar Participacoes 996,500 22,506,946 2.65 Vale ADR 1,016,705 21,096,629 2.49 Petroleo Brasileiro ADR 996,400 18,812,032 2.22 Petroleo Brasileiro ADR Pfd 983,402 18,497,792 2.18 Banco Bradesco Pfd 982,421 16,858,622 1.99 Amil Participaçoes 1,077,617 16,220,778 1.91 Vale Pfd ‘A’ 805,688 16,066,586 1.89 BR Malls Participaçoes 1,113,300 14,677,417 1.73 Petroleo Brasileiro 1,444,757 13,781,410 1.62 Itau Unibanco Holding ADR Pfd 836,903 13,666,626 1.61 Vale 593,024 12,233,742 1.44 Mills Estruturas e Servicos de Engenharia 702,300 11,650,744 1.37 Raia Drogasil 1,000,200 11,258,655 1.33 Diagnosticos da America 1,361,800 8,764,158 1.03 Cielo 309,200 8,597,857 1.01 Iochpe-Maxion 641,000 8,553,964 1.01 Gerdau ADR Pfd 923,600 8,173,860 0.96 PDG Realty - Empreendimentos e Participacoes 5,050,844 8,157,255 0.96 Companhia de Bebidas das Americas Pfd 102,514 4,280,629 0.51 Gerdau Pfd 172,300 1,507,362 0.18
total for Brazil 53.35
mexico Wal-Mart de Mexico ‘V’ (1) 10,849,102 35,224,628 4.15 Mexichem 5,719,590 31,450,594 3.71 Grupo Financiero Banorte ‘O’ 4,021,134 25,715,457 3.03 Cemex ADR ‘CPO’ ‘A&B’ 2,462,236 23,908,312 2.82 Grupo Televisa ADR ‘CPO’ 897,600 23,678,688 2.79 Fomento Economico Mexicano ADR 217,900 21,818,327 2.57 Alfa ‘A’ (1) 7,157,800 15,067,314 1.77 Grupo Financiero Santander Mexico ‘B’ ADR 868,500 14,008,905 1.65 Empresas ICA 3,742,700 9,156,981 1.08 El Puerto de Liverpool 602,800 6,088,060 0.72 Banregio Grupo Financiero 1,298,377 5,893,768 0.69 Concentradora Fibra Hotelera Mexicana 2,625,900 3,818,389 0.45 Promotora y Operadora de Infraestructura 37,700 244,488 0.03
total for mexico 25.46
Chile Sociedad Quimica y Minera de Chile ADR 401,047 22,795,511 2.68 SACI Falabella 2,140,641 22,047,529 2.60 Empresa Nacional de Electricidad 8,571,857 13,930,342 1.64 CFR Pharmaceuticals 16,551,476 4,182,808 0.49 Sociedad Matriz SAAM 34,016,454 4,077,996 0.48 Banco Santander Chile ADR 173,105 4,893,678 0.58 Parque Arauco 1,804,314 4,467,448 0.53 Empresa Nacional de Electricidad ADR 4,900 236,376 0.03
total for Chile 9.03
Colombia Grupo de Inversiones Suramericana pfd 661,500 14,600,170 1.72 Almacenes Exito 580,606 11,664,693 1.38 Pacific Rubiales Energy (Canada) (2) 336,325 7,860,907 0.93 Cemex Latam Holdings (Spain) (2) 1,165,131 7,503,787 0.88 Grupo de Inversiones Suramericana 102,500 2,204,301 0.26
total for Colombia 5.17
inveStment aim
To seek to maximise total return, measured in US dollars, through investment primarily in the common shares of companies incorporated in Latin American countries.
Statement of inveStmentS
transferable securities and money market instruments admitted to official exchange listing or dealt in on another regulated market. as at 31 December 2012, expressed in US dollars.
investments holdingsmarket
value% of net
assets
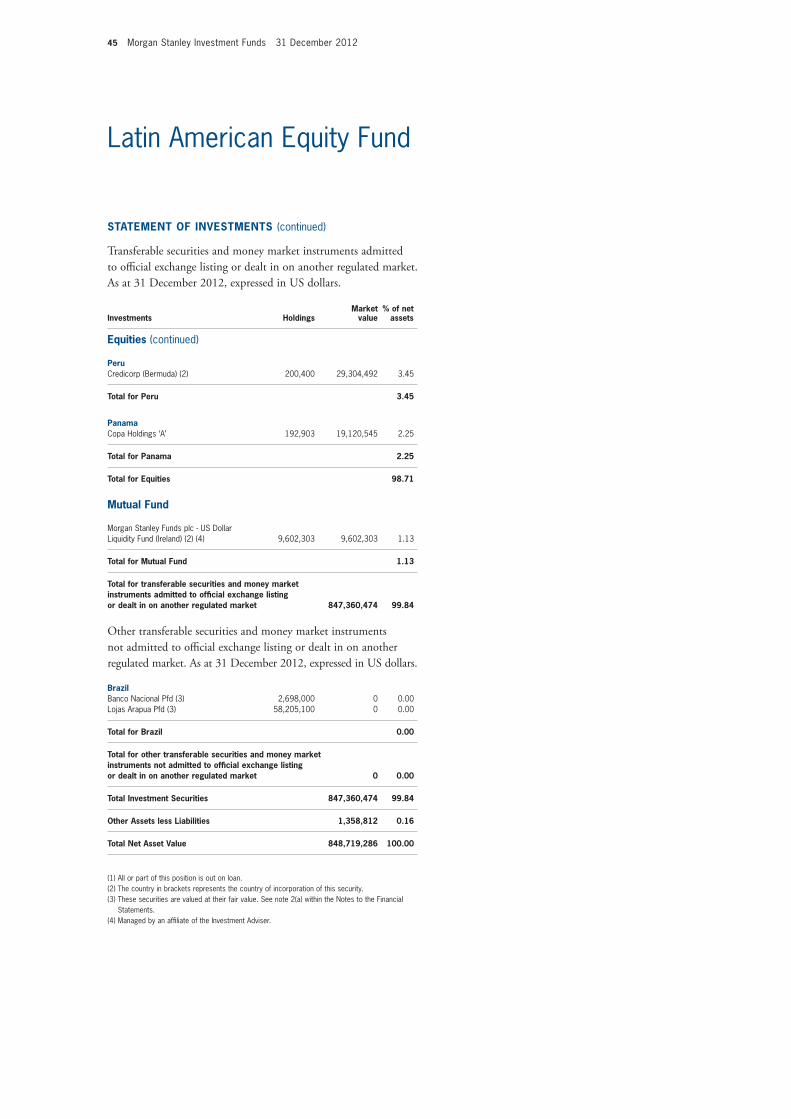
45 Morgan Stanley Investment Funds 31 December 2012
Latin American Equity Fund
Statement of inveStmentS (continued)
transferable securities and money market instruments admitted to official exchange listing or dealt in on another regulated market. as at 31 December 2012, expressed in US dollars.
investments holdingsmarket
value% of net
assets
Peru Credicorp (Bermuda) (2) 200,400 29,304,492 3.45
total for Peru 3.45
Panama Copa Holdings ‘A’ 192,903 19,120,545 2.25
total for Panama 2.25
total for equities 98.71
mutual fund
Morgan Stanley Funds plc - US Dollar Liquidity Fund (Ireland) (2) (4) 9,602,303 9,602,303 1.13
total for mutual fund 1.13
total for transferable securities and money market instruments admitted to official exchange listing or dealt in on another regulated market 847,360,474 99.84
Other transferable securities and money market instruments not admitted to official exchange listing or dealt in on another regulated market. as at 31 December 2012, expressed in US dollars.
Brazil Banco Nacional Pfd (3) 2,698,000 0 0.00 Lojas Arapua Pfd (3) 58,205,100 0 0.00
total for Brazil 0.00
total for other transferable securities and money market instruments not admitted to official exchange listing or dealt in on another regulated market 0 0.00
total investment Securities 847,360,474 99.84
other assets less Liabilities 1,358,812 0.16
total net asset value 848,719,286 100.00
(1) All or part of this position is out on loan.(2) The country in brackets represents the country of incorporation of this security.(3) These securities are valued at their fair value. See note 2(a) within the Notes to the Financial
Statements.(4) Managed by an affiliate of the Investment Adviser.
equities (continued)

Morgan Stanley Investment Funds 31 December 2012 46
Please refer to the full prospectus for the Fund’s investment objective and policy.
US Advantage Fund
equities
internet Software & Services Google ‘A’ 322,419 226,673,454 6.02 Facebook ‘A’ 6,961,682 184,484,573 4.89
total for internet Software & Services 10.91
Beverages DE Master Blenders 1753 (Netherlands) (2) 10,254,794 118,195,805 3.14 Anheuser-Busch InBev ADR (Belgium) (2) 876,475 76,209,501 2.02 PepsiCo 995,390 67,358,041 1.79 Monster Beverage 1,196,260 62,636,174 1.66
total for Beverages 8.61
internet & Catalog retail Amazon.com 1,098,336 270,805,724 7.19
total for internet & Catalog retail 7.19
food Products Nestlé ADR Regd (Switzerland) (2) 1,979,982 129,255,205 3.43 Mead Johnson Nutrition 1,407,714 91,501,410 2.43 Mondelez International ‘A’ 1,929,011 48,360,306 1.28
total for food Products 7.14
it Services Visa ‘A’ 901,951 134,976,967 3.58 Mastercard ‘A’ 265,102 128,638,094 3.42
total for it Services 7.00
Computers & Peripherals Apple 498,132 260,921,542 6.93
total for Computers & Peripherals 6.93
insurance Progressive 5,221,012 108,388,209 2.88 Berkshire Hathaway ‘B’ 982,708 86,950,004 2.31 Arch Capital Group (Bermuda) (2) 1,237,345 54,059,603 1.43
total for insurance 6.62
hotels, restaurants & Leisure Starbucks 2,454,233 129,411,706 3.44 Dunkin’ Brands Group 1,493,599 48,646,519 1.29
total for hotels, restaurants & Leisure 4.73
Professional Services Intertek Group (United Kingdom) (2) 1,961,387 98,769,957 2.62 Verisk Analytics ‘A’ 1,057,667 53,242,957 1.42
total for Professional Services 4.04
Commercial Services & Supplies Edenred (France) (2) 4,005,376 123,369,458 3.28 Covanta Holding 1,435,954 26,091,284 0.69
total for Commercial Services & Supplies 3.97
inveStment aim
To seek long-term capital appreciation, measured in US dollars, by investing primarily in securities issued by US companies and on ancillary basis in securities issued by companies that are not from the US.
Statement of inveStmentS
transferable securities and money market instruments admitted to official exchange listing or dealt in on another regulated market. as at 31 December 2012, expressed in US dollars.
investments holdingsmarket
value% of net
assets
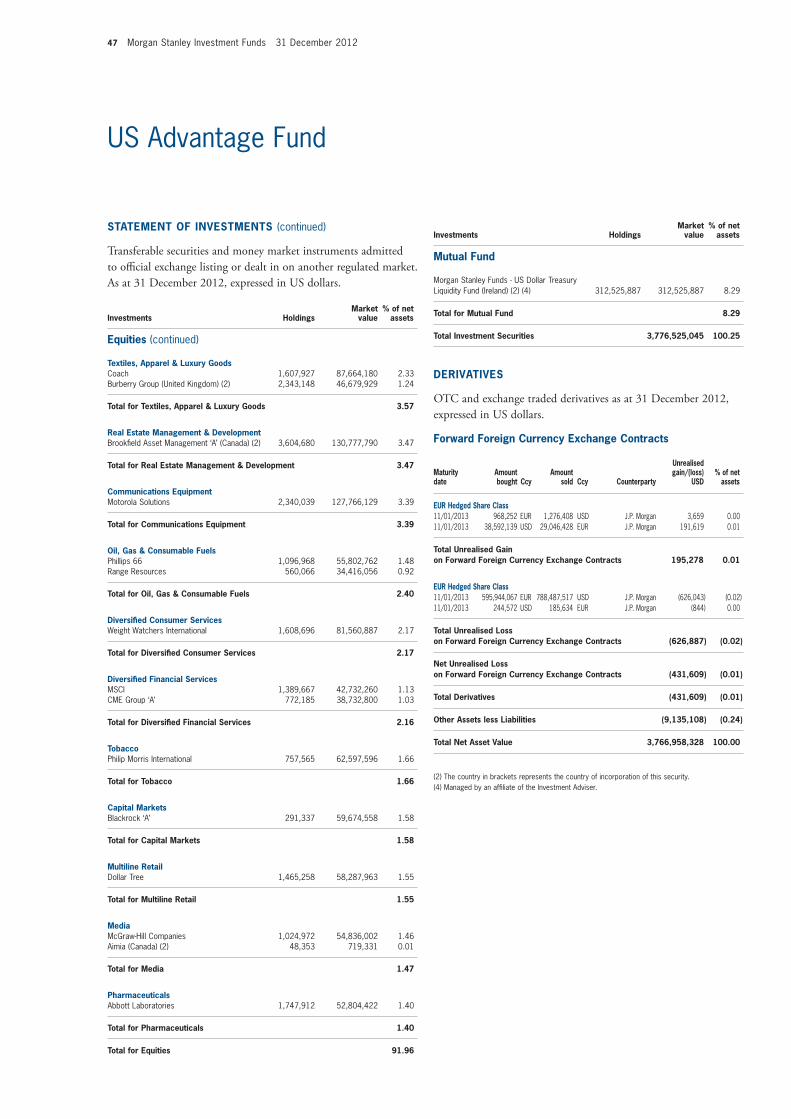
47 Morgan Stanley Investment Funds 31 December 2012
US Advantage Fund
Statement of inveStmentS (continued)
transferable securities and money market instruments admitted to official exchange listing or dealt in on another regulated market. as at 31 December 2012, expressed in US dollars.
investments holdingsmarket
value% of net
assets
textiles, apparel & Luxury Goods Coach 1,607,927 87,664,180 2.33 Burberry Group (United Kingdom) (2) 2,343,148 46,679,929 1.24
total for textiles, apparel & Luxury Goods 3.57
real estate management & Development Brookfield Asset Management ‘A’ (Canada) (2) 3,604,680 130,777,790 3.47
total for real estate management & Development 3.47
Communications equipment Motorola Solutions 2,340,039 127,766,129 3.39
total for Communications equipment 3.39
oil, Gas & Consumable fuels Phillips 66 1,096,968 55,802,762 1.48 Range Resources 560,066 34,416,056 0.92
total for oil, Gas & Consumable fuels 2.40
Diversified Consumer Services Weight Watchers International 1,608,696 81,560,887 2.17
total for Diversified Consumer Services 2.17
Diversified financial Services MSCI 1,389,667 42,732,260 1.13 CME Group ‘A’ 772,185 38,732,800 1.03
total for Diversified financial Services 2.16
tobacco Philip Morris International 757,565 62,597,596 1.66
total for tobacco 1.66
Capital markets Blackrock ‘A’ 291,337 59,674,558 1.58
total for Capital markets 1.58
multiline retail Dollar Tree 1,465,258 58,287,963 1.55
total for multiline retail 1.55
media McGraw-Hill Companies 1,024,972 54,836,002 1.46 Aimia (Canada) (2) 48,353 719,331 0.01
total for media 1.47
Pharmaceuticals Abbott Laboratories 1,747,912 52,804,422 1.40
total for Pharmaceuticals 1.40
total for equities 91.96
mutual fund
Morgan Stanley Funds - US Dollar Treasury Liquidity Fund (Ireland) (2) (4) 312,525,887 312,525,887 8.29
total for mutual fund 8.29
total investment Securities 3,776,525,045 100.25
DerivativeS
OtC and exchange traded derivatives as at 31 December 2012, expressed in US dollars.
forward foreign Currency exchange Contracts
maturity date
amount bought Ccy
amount sold Ccy Counterparty
Unrealised gain/(loss)
USD% of net
assets
eUr hedged Share Class 11/01/2013 968,252 EUR 1,276,408 USD J.P. Morgan 3,659 0.00 11/01/2013 38,592,139 USD 29,046,428 EUR J.P. Morgan 191,619 0.01
total Unrealised Gain on forward foreign Currency exchange Contracts 195,278 0.01
eUr hedged Share Class 11/01/2013 595,944,067 EUR 788,487,517 USD J.P. Morgan (626,043) (0.02)11/01/2013 244,572 USD 185,634 EUR J.P. Morgan (844) 0.00
total Unrealised Loss on forward foreign Currency exchange Contracts (626,887) (0.02)
net Unrealised Loss on forward foreign Currency exchange Contracts (431,609) (0.01)
total Derivatives (431,609) (0.01)
other assets less Liabilities (9,135,108) (0.24)
total net asset value 3,766,958,328 100.00
(2) The country in brackets represents the country of incorporation of this security.(4) Managed by an affiliate of the Investment Adviser.
investments holdingsmarket
value% of net
assets
equities (continued)

Morgan Stanley Investment Funds 31 December 2012 48
Please refer to the full prospectus for the Fund’s investment objective and policy.
US Growth Fund
equities
Computer Services Software & Systems Google ‘A’ 82,882 58,269,361 6.55 Facebook ‘A’ 1,911,836 50,663,654 5.69 Salesforce.com 143,537 23,716,619 2.67 Baidu ADR (Cayman Islands) (2) 234,353 23,179,855 2.60 LinkedIn ‘A’ 129,215 14,773,151 1.66 VMware ‘A’ 113,507 10,568,637 1.19
total for Computer Services Software & Systems 20.36
Diversified retail Amazon.com 296,536 73,113,916 8.22 Priceline.com 48,317 29,627,501 3.33 Groupon 2,145,021 10,360,451 1.16
total for Diversified retail 12.71
Computer technology Apple 131,459 68,858,224 7.73 Yandex ‘A’ (Netherlands) (2) 421,794 9,228,853 1.04
total for Computer technology 8.77
Consumer Lending Visa ‘A’ 222,495 33,296,377 3.74 Mastercard ‘A’ 65,396 31,732,755 3.57 CME Group ‘A’ 238,525 11,964,414 1.34
total for Consumer Lending 8.65
Communications technology Motorola Solutions 632,298 34,523,471 3.88
total for Communications technology 3.88
recreational vehicles & Boats Edenred (France) (2) 1,082,272 33,335,025 3.75
total for recreational vehicles & Boats 3.75
real estate investment trusts (reits)Brookfield Asset Management ‘A’ (Canada) (2) 916,068 33,234,947 3.73
total for real estate investment trusts (reits) 3.73
Chemicals - Diversified Monsanto 294,848 27,665,588 3.11
total for Chemicals - Diversified 3.11
Diversified media McGraw-Hill Companies 262,068 14,020,638 1.58 Naspers ‘N’ (South Africa) (2) 209,798 13,438,947 1.51
total for Diversified media 3.09
Pharmaceuticals Mead Johnson Nutrition 208,562 13,556,530 1.52 Valeant Pharmaceuticals International (Canada) (2) 225,521 13,301,229 1.50
total for Pharmaceuticals 3.02
inveStment aim
To seek long-term capital appreciation, measured in US dollars, by investing primarily in securities issued by US companies and on ancillary basis in securities issued by companies that are not from the US.
Statement of inveStmentS
transferable securities and money market instruments admitted to official exchange listing or dealt in on another regulated market. as at 31 December 2012, expressed in US dollars.
investments holdingsmarket
value% of net
assets

49 Morgan Stanley Investment Funds 31 December 2012
US Growth Fund
Statement of inveStmentS (continued)
transferable securities and money market instruments admitted to official exchange listing or dealt in on another regulated market. as at 31 December 2012, expressed in US dollars.
investments holdingsmarket
value% of net
assets
investments holdingsmarket
value% of net
assets
Biotechnology Illumina 469,565 25,779,118 2.90
total for Biotechnology 2.90
medical equipment Intuitive Surgical 52,378 25,289,146 2.84
total for medical equipment 2.84
financial Data & Systems Verisk Analytics ‘A’ 264,032 13,291,371 1.50 MSCI 345,254 10,616,561 1.19
total for financial Data & Systems 2.69
restaurants Starbucks 440,714 23,238,849 2.61
total for restaurants 2.61
Beverages: Brewers and Distillers DE Master Blenders 1753 (Netherlands) (2) 1,823,066 21,012,490 2.35
total for Beverages: Brewers and Distillers 2.35
alternative energy Range Resources 187,775 11,538,774 1.30 Ultra Petroleum (Canada) (2) 437,471 7,852,604 0.88
total for alternative energy 2.18
insurance: Property-Casualty Progressive 882,503 18,320,762 2.06
total for insurance: Property-Casualty 2.06
asset management & Custodian Blackrock ‘A’ 73,169 14,987,206 1.68
total for asset management & Custodian 1.68
Commercial Services Intertek Group (United Kingdom) (2) 289,734 14,590,193 1.64
total for Commercial Services 1.64
foods Nestlé ADR Regd (Switzerland) (2) 209,333 13,665,468 1.53
total for foods 1.53
textiles, apparel & Shoes Coach 242,542 13,223,390 1.48
total for textiles, apparel & Shoes 1.48
electronic Components Sensata Technologies Holdings (Netherlands) (2) 405,739 13,060,738 1.47
total for electronic Components 1.47
Semiconductors & Components First Solar 375,577 11,177,172 1.26
total for Semiconductors & Components 1.26
total for equities 97.76
mutual fund
Morgan Stanley Funds - US Dollar Treasury Liquidity Fund (Ireland) (2) (4) 35,171,285 35,171,285 3.96
total for mutual fund 3.96
total investment Securities 905,245,270 101.72
DerivativeS
OtC and exchange traded derivatives as at 31 December 2012, expressed in US dollars.
forward foreign Currency exchange Contracts
maturity date
amount bought Ccy
amount sold Ccy Counterparty
Unrealised gain/(loss)
USD% of net
assets
eUr hedged Share Class 11/01/2013 14,729,405 USD 11,134,050 EUR J.P. Morgan 9,753 0.00
total Unrealised Gain on forward foreign Currency exchange Contracts 9,753 0.00
eUr hedged Share Class 11/01/2013 69,598,371 EUR 92,086,284 USD J.P. Morgan (74,503) (0.01)11/01/2013 39,917 USD 30,288 EUR J.P. Morgan (125) 0.00
total Unrealised Loss on forward foreign Currency exchange Contracts (74,628) (0.01)
net Unrealised Loss on forward foreign Currency exchange Contracts (64,875) (0.01)
total Derivatives (64,875) (0.01)
other assets less Liabilities (15,209,856) (1.71)
total net asset value 889,970,539 100.00
(2) The country in brackets represents the country of incorporation of this security.(4) Managed by an affiliate of the Investment Adviser.
equities (continued)
equities (continued)
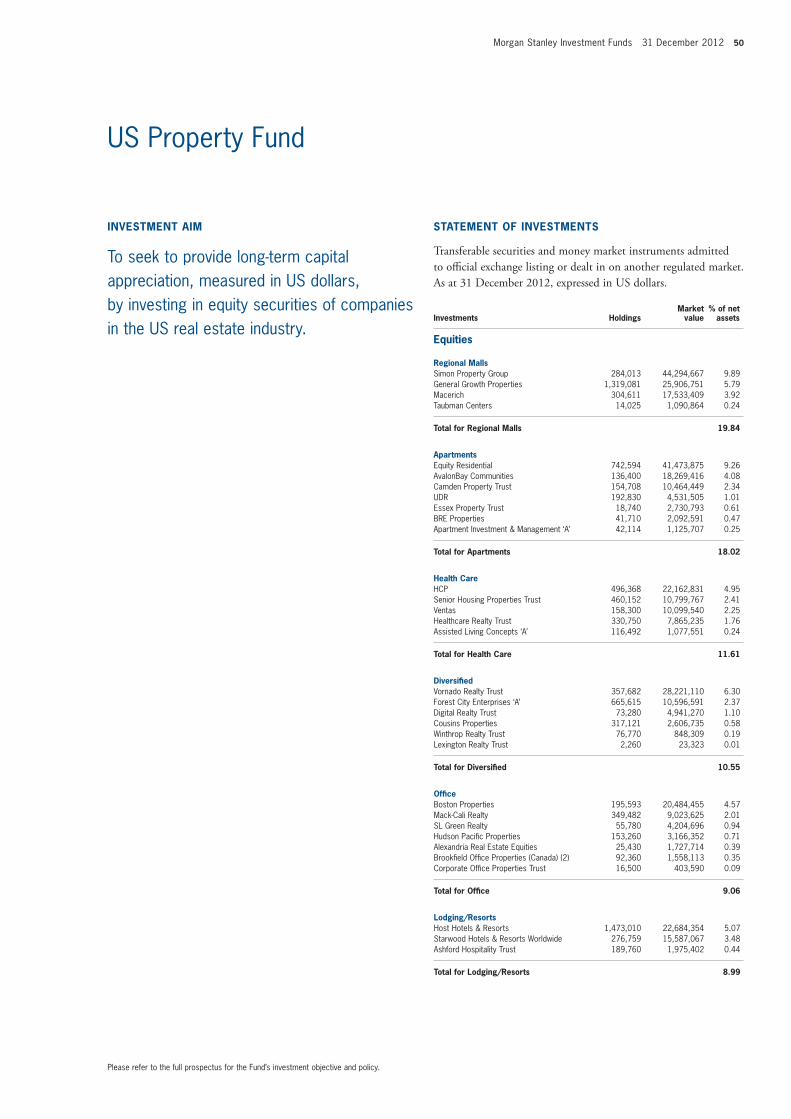
Morgan Stanley Investment Funds 31 December 2012 50
Please refer to the full prospectus for the Fund’s investment objective and policy.
US Property Fund
inveStment aim
To seek to provide long-term capital appreciation, measured in US dollars, by investing in equity securities of companies in the US real estate industry.
Statement of inveStmentS
transferable securities and money market instruments admitted to official exchange listing or dealt in on another regulated market. as at 31 December 2012, expressed in US dollars.
investments holdingsmarket
value% of net
assets equities
regional malls Simon Property Group 284,013 44,294,667 9.89 General Growth Properties 1,319,081 25,906,751 5.79 Macerich 304,611 17,533,409 3.92 Taubman Centers 14,025 1,090,864 0.24
total for regional malls 19.84
apartments Equity Residential 742,594 41,473,875 9.26 AvalonBay Communities 136,400 18,269,416 4.08 Camden Property Trust 154,708 10,464,449 2.34 UDR 192,830 4,531,505 1.01 Essex Property Trust 18,740 2,730,793 0.61 BRE Properties 41,710 2,092,591 0.47 Apartment Investment & Management ‘A’ 42,114 1,125,707 0.25
total for apartments 18.02
health Care HCP 496,368 22,162,831 4.95 Senior Housing Properties Trust 460,152 10,799,767 2.41 Ventas 158,300 10,099,540 2.25 Healthcare Realty Trust 330,750 7,865,235 1.76 Assisted Living Concepts ‘A’ 116,492 1,077,551 0.24
total for health Care 11.61
Diversified Vornado Realty Trust 357,682 28,221,110 6.30 Forest City Enterprises ‘A’ 665,615 10,596,591 2.37 Digital Realty Trust 73,280 4,941,270 1.10 Cousins Properties 317,121 2,606,735 0.58 Winthrop Realty Trust 76,770 848,309 0.19 Lexington Realty Trust 2,260 23,323 0.01
total for Diversified 10.55
office Boston Properties 195,593 20,484,455 4.57 Mack-Cali Realty 349,482 9,023,625 2.01 SL Green Realty 55,780 4,204,696 0.94 Hudson Pacific Properties 153,260 3,166,352 0.71 Alexandria Real Estate Equities 25,430 1,727,714 0.39 Brookfield Office Properties (Canada) (2) 92,360 1,558,113 0.35 Corporate Office Properties Trust 16,500 403,590 0.09
total for office 9.06
Lodging/resorts Host Hotels & Resorts 1,473,010 22,684,354 5.07 Starwood Hotels & Resorts Worldwide 276,759 15,587,067 3.48 Ashford Hospitality Trust 189,760 1,975,402 0.44
total for Lodging/resorts 8.99
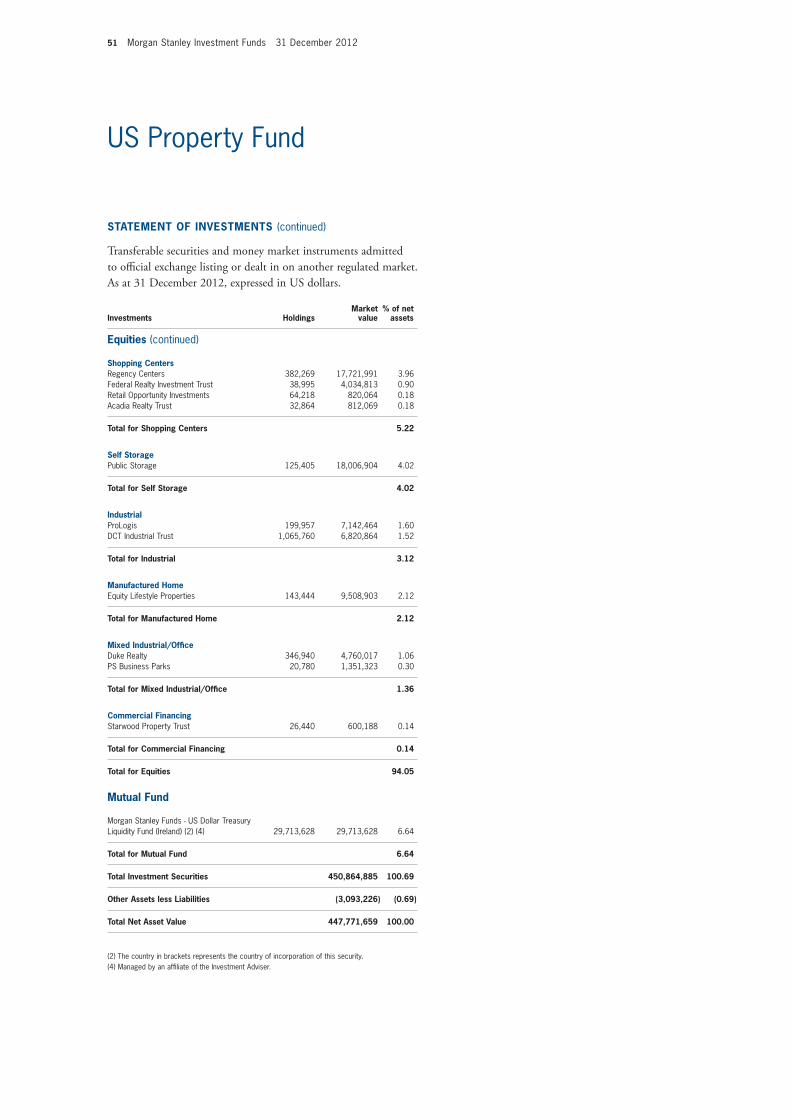
51 Morgan Stanley Investment Funds 31 December 2012
US Property Fund
Statement of inveStmentS (continued)
transferable securities and money market instruments admitted to official exchange listing or dealt in on another regulated market. as at 31 December 2012, expressed in US dollars.
investments holdingsmarket
value% of net
assets
Shopping Centers Regency Centers 382,269 17,721,991 3.96 Federal Realty Investment Trust 38,995 4,034,813 0.90 Retail Opportunity Investments 64,218 820,064 0.18 Acadia Realty Trust 32,864 812,069 0.18
total for Shopping Centers 5.22
Self Storage Public Storage 125,405 18,006,904 4.02
total for Self Storage 4.02
industrial ProLogis 199,957 7,142,464 1.60 DCT Industrial Trust 1,065,760 6,820,864 1.52
total for industrial 3.12
manufactured home Equity Lifestyle Properties 143,444 9,508,903 2.12
total for manufactured home 2.12
mixed industrial/office Duke Realty 346,940 4,760,017 1.06 PS Business Parks 20,780 1,351,323 0.30
total for mixed industrial/office 1.36
Commercial financing Starwood Property Trust 26,440 600,188 0.14
total for Commercial financing 0.14
total for equities 94.05
mutual fund
Morgan Stanley Funds - US Dollar Treasury Liquidity Fund (Ireland) (2) (4) 29,713,628 29,713,628 6.64
total for mutual fund 6.64
total investment Securities 450,864,885 100.69
other assets less Liabilities (3,093,226) (0.69)
total net asset value 447,771,659 100.00
(2) The country in brackets represents the country of incorporation of this security.(4) Managed by an affiliate of the Investment Adviser.
equities (continued)

Morgan Stanley Investment Funds 31 December 2012 52
Please refer to the full prospectus for the Fund’s investment objective and policy.
Emerging Markets Corporate Debt Fund
Bonds
russia Evraz Group nts RegS 7.4% /2017 (Luxembourg) (2) 4,300,000 4,545,788 1.83Severstal Via Steel Capital sr unsecur RegS 5.9% /2022 (Luxembourg) (2) 3,500,000 3,548,125 1.43Vimpel Communications Via VIP Finance Ireland OJSC unsecur RegS LPN 7.748% /2021 (Ireland) (2) 2,755,000 3,188,913 1.29RZD Capital sr unsecur RegS 5.7% /2022 (Ireland) (2) 2,500,000 2,866,750 1.16Alfa Bank OJSC Via Alfa Bond Issuance sr unsecur RegS LPN 7.875% /2017 (Ireland) (2) 2,000,000 2,239,380 0.90Sberbank of Russia sr unsecur RegS LPN 5.18% /2019 (Luxembourg) (2) 2,000,000 2,200,000 0.89Alfa Bank OJSC Via Alfa Bond Issuance subord RegS LPN 7.5% /2019 (Ireland) (2) 2,000,000 2,120,880 0.86Sberbank of Russia Via SB Capital sr unsecur RegS LPN 4.95% /2017 (Luxembourg) (2) 1,900,000 2,059,125 0.83Novatek Finance sr unsecur RegS 4.422% /2022 (Ireland) (1) (2) 2,000,000 2,017,500 0.81Russian Standard Finance subord Ser144A priv plmt 10.75% /2018 (Luxembourg) (2) 1,100,000 1,152,250 0.46
total for russia 10.46
China China Shanshui Cement Group co gtd RegS 10.5% /2017 (Cayman Islands) (1) (2) 3,600,000 4,185,000 1.69Tingyi Cayman Islands Holding sr unsecur RegS 3.875% /2017 (Cayman Islands) (2) 3,000,000 3,211,245 1.29KWG Property Holding sr unsecur 13.25% /2017 (Cayman Islands) (1) (2) 2,000,000 2,389,936 0.96West China Cement co gtd RegS 7.5% /2016 (Jersey) (1) (2) 2,300,000 2,259,750 0.91Shimao Property Holdings secured RegS 8% /2016 (Cayman Islands) (2) 2,100,000 2,170,886 0.88Texhong Textile Group co gtd RegS 7.625% /2016 (Cayman Islands) (2) 2,100,000 2,157,750 0.87Country Garden Holdings co gtd 10.5% /2015 (Cayman Islands) (2) 1,850,000 2,072,980 0.84ENN Energy Holdings sr unsecur RegS 6% /2021 (Cayman Islands) (2) 1,750,000 2,029,538 0.82Country Garden Holdings sr unsecur RegS 11.125% /2018 (Cayman Islands) (1) (2) 1,745,000 2,028,562 0.82Fufeng Group co gtd RegS 7.625% /2016 (Cayman Islands) (2) 1,000,000 1,005,000 0.40Sound Global sr unsecur 11.875% /2017 (Singapore) (2) 875,000 939,174 0.38
total for China 9.86
mexico Mexico Generadora de Energia sr secured RegS 5.5% /2032 4,500,000 4,758,750 1.92Mexichem sr unsecur RegS 4.875% /2022 4,000,000 4,320,000 1.74Alpek sr unsecur RegS 4.5% /2022 4,000,000 4,170,000 1.68Cemex SAB sr secured RegS 9.5% /2018 2,906,000 3,280,874 1.32Corporacion GEO co gtd RegS 9.25% /2020 2,200,000 2,376,000 0.96BBVA Bancomer subord RegS 6.5% /2021 2,000,000 2,230,000 0.90Banco Santander Mexico Institucion de Banca Multiple Grupo Financiero Santand sr unsecur Ser144A priv plmt 4.125% /2022 1,370,000 1,388,837 0.56Cemex SAB sr secured RegS 9% /2018 834,000 902,805 0.37
total for mexico 9.45
inveStment aim
To seek to maximize total return, measured in US dollars, primarily through investments across the credit spectrum of debt securities of corporate issuers, together with investing in debt securities of government and government related issuers located in emerging markets. The Fund intends to invest its assets in emerging market corporate debt securities that provide a high level of current income, while at the same time holding the potential for capital appreciation.
Statement of inveStmentS
transferable securities and money market instruments admitted to official exchange listing or dealt in on another regulated market. as at 31 December 2012, expressed in US dollars.
investments
nominal in US dollars
unless specifiedmarket
value% of net
assets
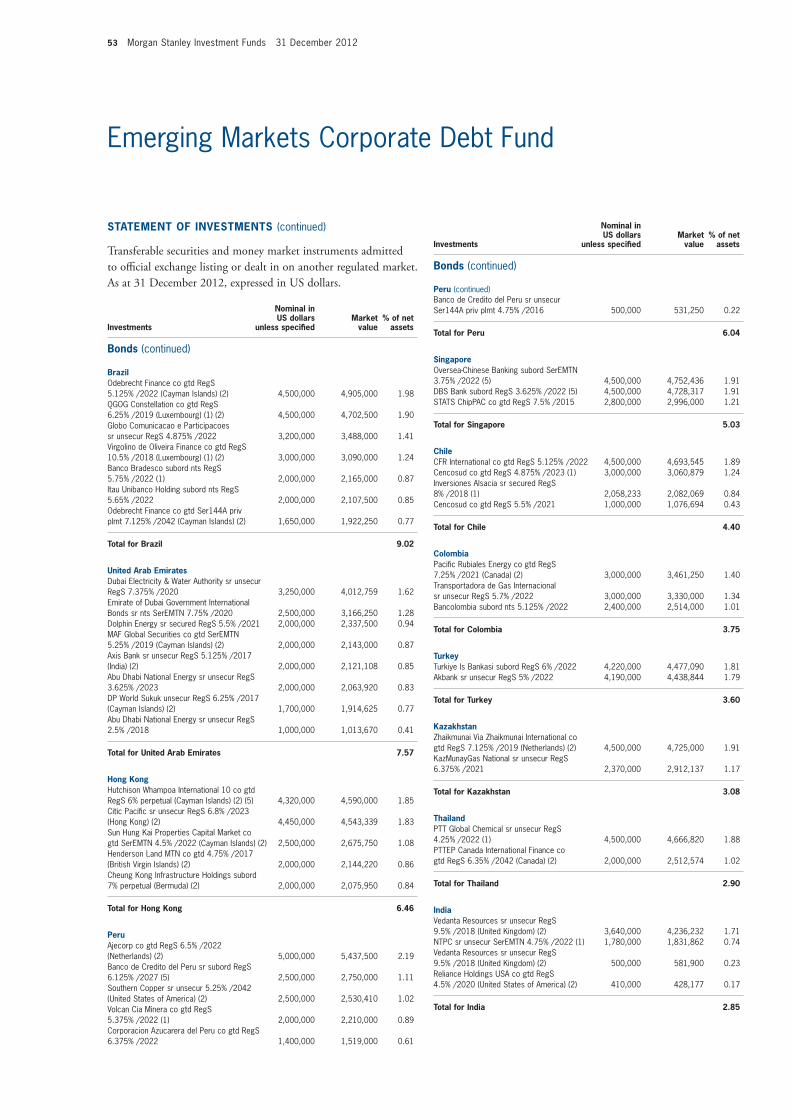
53 Morgan Stanley Investment Funds 31 December 2012
Emerging Markets Corporate Debt Fund
Statement of inveStmentS (continued)
transferable securities and money market instruments admitted to official exchange listing or dealt in on another regulated market. as at 31 December 2012, expressed in US dollars.
investments
nominal in US dollars
unless specifiedmarket
value% of net
assets
investments
nominal in US dollars
unless specifiedmarket
value% of net
assets
Brazil Odebrecht Finance co gtd RegS 5.125% /2022 (Cayman Islands) (2) 4,500,000 4,905,000 1.98QGOG Constellation co gtd RegS 6.25% /2019 (Luxembourg) (1) (2) 4,500,000 4,702,500 1.90Globo Comunicacao e Participacoes sr unsecur RegS 4.875% /2022 3,200,000 3,488,000 1.41Virgolino de Oliveira Finance co gtd RegS 10.5% /2018 (Luxembourg) (1) (2) 3,000,000 3,090,000 1.24Banco Bradesco subord nts RegS 5.75% /2022 (1) 2,000,000 2,165,000 0.87Itau Unibanco Holding subord nts RegS 5.65% /2022 2,000,000 2,107,500 0.85Odebrecht Finance co gtd Ser144A priv plmt 7.125% /2042 (Cayman Islands) (2) 1,650,000 1,922,250 0.77
total for Brazil 9.02
United arab emirates Dubai Electricity & Water Authority sr unsecur RegS 7.375% /2020 3,250,000 4,012,759 1.62Emirate of Dubai Government International Bonds sr nts SerEMTN 7.75% /2020 2,500,000 3,166,250 1.28Dolphin Energy sr secured RegS 5.5% /2021 2,000,000 2,337,500 0.94MAF Global Securities co gtd SerEMTN 5.25% /2019 (Cayman Islands) (2) 2,000,000 2,143,000 0.87Axis Bank sr unsecur RegS 5.125% /2017 (India) (2) 2,000,000 2,121,108 0.85Abu Dhabi National Energy sr unsecur RegS 3.625% /2023 2,000,000 2,063,920 0.83DP World Sukuk unsecur RegS 6.25% /2017 (Cayman Islands) (2) 1,700,000 1,914,625 0.77Abu Dhabi National Energy sr unsecur RegS 2.5% /2018 1,000,000 1,013,670 0.41
total for United arab emirates 7.57
hong Kong Hutchison Whampoa International 10 co gtd RegS 6% perpetual (Cayman Islands) (2) (5) 4,320,000 4,590,000 1.85Citic Pacific sr unsecur RegS 6.8% /2023 (Hong Kong) (2) 4,450,000 4,543,339 1.83Sun Hung Kai Properties Capital Market co gtd SerEMTN 4.5% /2022 (Cayman Islands) (2) 2,500,000 2,675,750 1.08Henderson Land MTN co gtd 4.75% /2017 (British Virgin Islands) (2) 2,000,000 2,144,220 0.86Cheung Kong Infrastructure Holdings subord 7% perpetual (Bermuda) (2) 2,000,000 2,075,950 0.84
total for hong Kong 6.46
Peru Ajecorp co gtd RegS 6.5% /2022 (Netherlands) (2) 5,000,000 5,437,500 2.19Banco de Credito del Peru sr subord RegS 6.125% /2027 (5) 2,500,000 2,750,000 1.11Southern Copper sr unsecur 5.25% /2042 (United States of America) (2) 2,500,000 2,530,410 1.02Volcan Cia Minera co gtd RegS 5.375% /2022 (1) 2,000,000 2,210,000 0.89Corporacion Azucarera del Peru co gtd RegS 6.375% /2022 1,400,000 1,519,000 0.61
Banco de Credito del Peru sr unsecur Ser144A priv plmt 4.75% /2016 500,000 531,250 0.22
total for Peru 6.04
Singapore Oversea-Chinese Banking subord SerEMTN 3.75% /2022 (5) 4,500,000 4,752,436 1.91DBS Bank subord RegS 3.625% /2022 (5) 4,500,000 4,728,317 1.91STATS ChipPAC co gtd RegS 7.5% /2015 2,800,000 2,996,000 1.21
total for Singapore 5.03
Chile CFR International co gtd RegS 5.125% /2022 4,500,000 4,693,545 1.89Cencosud co gtd RegS 4.875% /2023 (1) 3,000,000 3,060,879 1.24Inversiones Alsacia sr secured RegS 8% /2018 (1) 2,058,233 2,082,069 0.84Cencosud co gtd RegS 5.5% /2021 1,000,000 1,076,694 0.43
total for Chile 4.40
Colombia Pacific Rubiales Energy co gtd RegS 7.25% /2021 (Canada) (2) 3,000,000 3,461,250 1.40Transportadora de Gas Internacional sr unsecur RegS 5.7% /2022 3,000,000 3,330,000 1.34Bancolombia subord nts 5.125% /2022 2,400,000 2,514,000 1.01
total for Colombia 3.75
turkey Turkiye Is Bankasi subord RegS 6% /2022 4,220,000 4,477,090 1.81Akbank sr unsecur RegS 5% /2022 4,190,000 4,438,844 1.79
total for turkey 3.60
Kazakhstan Zhaikmunai Via Zhaikmunai International co gtd RegS 7.125% /2019 (Netherlands) (2) 4,500,000 4,725,000 1.91KazMunayGas National sr unsecur RegS 6.375% /2021 2,370,000 2,912,137 1.17
total for Kazakhstan 3.08
thailand PTT Global Chemical sr unsecur RegS 4.25% /2022 (1) 4,500,000 4,666,820 1.88PTTEP Canada International Finance co gtd RegS 6.35% /2042 (Canada) (2) 2,000,000 2,512,574 1.02
total for thailand 2.90
india Vedanta Resources sr unsecur RegS 9.5% /2018 (United Kingdom) (2) 3,640,000 4,236,232 1.71NTPC sr unsecur SerEMTN 4.75% /2022 (1) 1,780,000 1,831,862 0.74Vedanta Resources sr unsecur RegS 9.5% /2018 (United Kingdom) (2) 500,000 581,900 0.23Reliance Holdings USA co gtd RegS 4.5% /2020 (United States of America) (2) 410,000 428,177 0.17
total for india 2.85
Bonds (continued)
Bonds (continued)
Peru (continued)

Morgan Stanley Investment Funds 31 December 2012 54
Emerging Markets Corporate Debt Fund
argentina Arcos Dorados co gtd RegS 7.5% /2019 (Netherlands) (2) 167,000 182,447 0.07
total for argentina 0.07
total for Bonds 94.67
mutual fund
Morgan Stanley Funds plc - US Dollar Liquidity Fund (Ireland) (2) (4) 9,041,832 9,041,832 3.65
total for mutual fund 3.65
total investment Securities 243,822,579 98.32
DerivativeS
OtC and exchange traded derivatives as at 31 December 2012, expressed in US dollars.
forward foreign Currency exchange Contracts
maturity date
amount bought Ccy
amount sold Ccy Counterparty
Unrealised gain/(loss)
USD% of net
assets
eUr hedged Share Class 11/01/2013 732,610 EUR 965,499 USD J.P. Morgan 3,040 0.00
total Unrealised Gain on forward foreign Currency exchange Contracts 3,040 0.00
eUr hedged Share Class 11/01/2013 70,708,001 EUR 93,557,584 USD J.P. Morgan (78,827) (0.03)
total Unrealised Loss on forward foreign Currency exchange Contracts (78,827) (0.03)
net Unrealised Loss on forward foreign Currency exchange Contracts (75,787) (0.03)
total Derivatives (75,787) (0.03)
other assets less Liabilities 4,245,464 1.71
total net asset value 247,992,256 100.00
(1) All or part of this position is out on loan.(2) The country in brackets represents the country of incorporation of this security.(4) Managed by an affiliate of the Investment Adviser.(5) Variable coupon rates are those quoted as of 31 December 2012.
Statement of inveStmentS (continued)
transferable securities and money market instruments admitted to official exchange listing or dealt in on another regulated market. as at 31 December 2012, expressed in US dollars.
investments
nominal in US dollars
unless specifiedmarket
value% of net
assets
South Korea Export-Import Bank of Korea sr unsecur 4% /2017 2,920,000 3,183,524 1.28Korea Gas sr unsecur RegS 4.25% /2020 1,500,000 1,658,400 0.67
total for South Korea 1.95
nigeria Afren sr secured RegS 11.5% /2016 (United Kingdom) (2) 2,800,000 3,262,000 1.32
total for nigeria 1.32
malaysia Malayan Banking subord SerEMTN 3.25% /2022 (5) 3,180,000 3,185,711 1.28
total for malaysia 1.28
Philippines SM Investments sr unsecur 4.25% /2019 3,000,000 3,047,373 1.23
total for Philippines 1.23
Qatar Qtel International Finance co gtd RegS 3.25% /2023 (Bermuda) (2) 3,000,000 3,004,500 1.21
total for Qatar 1.21
Guatemala Central American Bottling co gtd RegS 6.75% /2022 (British Virgin Islands) (2) 2,000,000 2,185,000 0.88
total for Guatemala 0.88
Croatia Agrokor co gtd RegS 8.875% /2020 2,000,000 2,182,500 0.88
total for Croatia 0.88
indonesia Listrindo Capital co gtd RegS 6.95% /2019 (Netherlands) (2) 1,040,000 1,160,970 0.47Indo Energy Finance co gtd RegS 7% /2018 (Netherlands) (2) 890,000 935,497 0.38
total for indonesia 0.85
Canada Eldorado Gold sr unsecur Ser144A priv plmt 6.125% /2020 1,285,000 1,310,700 0.53
total for Canada 0.53
Bonds (continued)
investments
holdings/nominal in US dollars
unless specifiedmarket
value% of net
assets Bonds (continued)
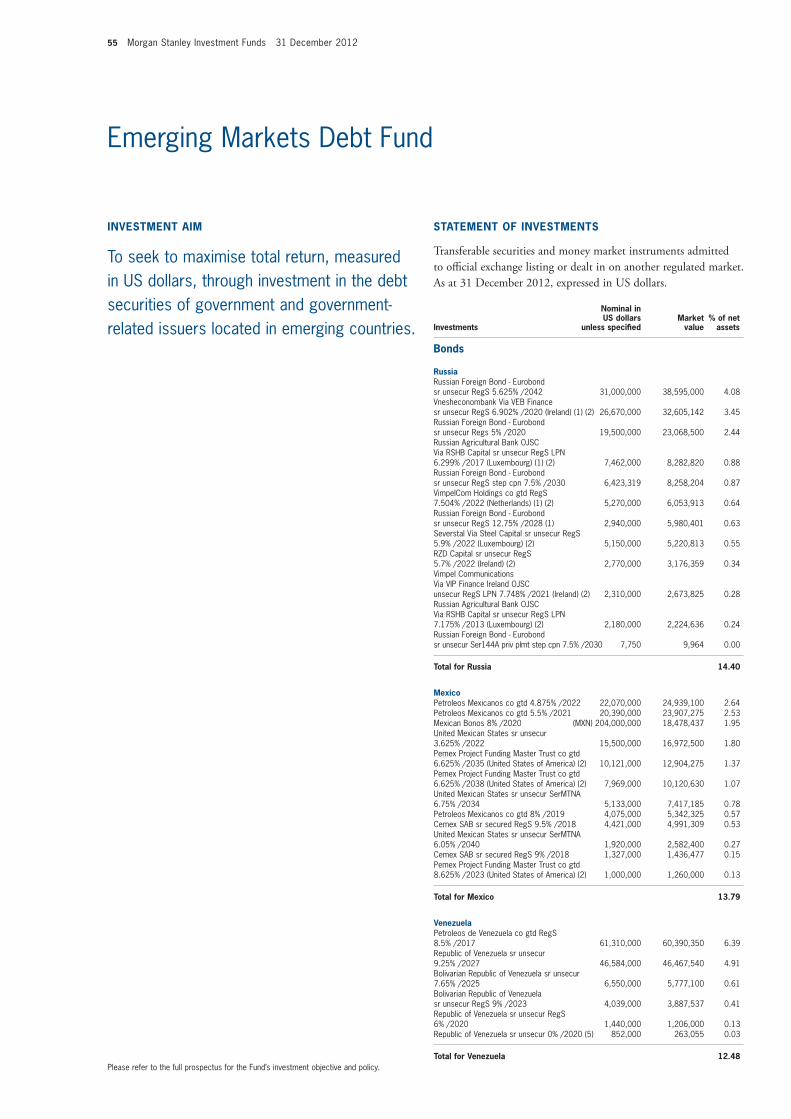
55 Morgan Stanley Investment Funds 31 December 2012
Please refer to the full prospectus for the Fund’s investment objective and policy.
Emerging Markets Debt Fund
Bonds
russia Russian Foreign Bond - Eurobond sr unsecur RegS 5.625% /2042 31,000,000 38,595,000 4.08 Vnesheconombank Via VEB Finance sr unsecur RegS 6.902% /2020 (Ireland) (1) (2) 26,670,000 32,605,142 3.45 Russian Foreign Bond - Eurobond sr unsecur Regs 5% /2020 19,500,000 23,068,500 2.44 Russian Agricultural Bank OJSC Via RSHB Capital sr unsecur RegS LPN 6.299% /2017 (Luxembourg) (1) (2) 7,462,000 8,282,820 0.88 Russian Foreign Bond - Eurobond sr unsecur RegS step cpn 7.5% /2030 6,423,319 8,258,204 0.87 VimpelCom Holdings co gtd RegS 7.504% /2022 (Netherlands) (1) (2) 5,270,000 6,053,913 0.64 Russian Foreign Bond - Eurobond sr unsecur RegS 12.75% /2028 (1) 2,940,000 5,980,401 0.63 Severstal Via Steel Capital sr unsecur RegS 5.9% /2022 (Luxembourg) (2) 5,150,000 5,220,813 0.55 RZD Capital sr unsecur RegS 5.7% /2022 (Ireland) (2) 2,770,000 3,176,359 0.34 Vimpel Communications Via VIP Finance Ireland OJSC unsecur RegS LPN 7.748% /2021 (Ireland) (2) 2,310,000 2,673,825 0.28 Russian Agricultural Bank OJSC Via RSHB Capital sr unsecur RegS LPN 7.175% /2013 (Luxembourg) (2) 2,180,000 2,224,636 0.24 Russian Foreign Bond - Eurobond sr unsecur Ser144A priv plmt step cpn 7.5% /2030 7,750 9,964 0.00
total for russia 14.40
mexico Petroleos Mexicanos co gtd 4.875% /2022 22,070,000 24,939,100 2.64 Petroleos Mexicanos co gtd 5.5% /2021 20,390,000 23,907,275 2.53 Mexican Bonos 8% /2020 (MXN) 204,000,000 18,478,437 1.95 United Mexican States sr unsecur 3.625% /2022 15,500,000 16,972,500 1.80 Pemex Project Funding Master Trust co gtd 6.625% /2035 (United States of America) (2) 10,121,000 12,904,275 1.37 Pemex Project Funding Master Trust co gtd 6.625% /2038 (United States of America) (2) 7,969,000 10,120,630 1.07 United Mexican States sr unsecur SerMTNA 6.75% /2034 5,133,000 7,417,185 0.78 Petroleos Mexicanos co gtd 8% /2019 4,075,000 5,342,325 0.57 Cemex SAB sr secured RegS 9.5% /2018 4,421,000 4,991,309 0.53 United Mexican States sr unsecur SerMTNA 6.05% /2040 1,920,000 2,582,400 0.27 Cemex SAB sr secured RegS 9% /2018 1,327,000 1,436,477 0.15 Pemex Project Funding Master Trust co gtd 8.625% /2023 (United States of America) (2) 1,000,000 1,260,000 0.13
total for mexico 13.79
venezuela Petroleos de Venezuela co gtd RegS 8.5% /2017 61,310,000 60,390,350 6.39 Republic of Venezuela sr unsecur 9.25% /2027 46,584,000 46,467,540 4.91 Bolivarian Republic of Venezuela sr unsecur 7.65% /2025 6,550,000 5,777,100 0.61 Bolivarian Republic of Venezuela sr unsecur RegS 9% /2023 4,039,000 3,887,537 0.41 Republic of Venezuela sr unsecur RegS 6% /2020 1,440,000 1,206,000 0.13 Republic of Venezuela sr unsecur 0% /2020 (5) 852,000 263,055 0.03
total for venezuela 12.48
inveStment aim
To seek to maximise total return, measured in US dollars, through investment in the debt securities of government and government-related issuers located in emerging countries.
Statement of inveStmentS
transferable securities and money market instruments admitted to official exchange listing or dealt in on another regulated market. as at 31 December 2012, expressed in US dollars.
investments
nominal in US dollars
unless specifiedmarket
value% of net
assets

Morgan Stanley Investment Funds 31 December 2012 56
Emerging Markets Debt Fund
Statement of inveStmentS (continued)
transferable securities and money market instruments admitted to official exchange listing or dealt in on another regulated market. as at 31 December 2012, expressed in US dollars.
investments
nominal in US dollars
unless specifiedmarket
value% of net
assets
investments
nominal in US dollars
unless specifiedmarket
value% of net
assets
Brazil Banco Nacional de Desenvolvimento Economico e Social sr unsecur RegS 5.5% /2020 (1) 22,290,000 26,302,200 2.78 Republic of Brazil sr unsecur 7.125% /2037 10,066,000 15,476,475 1.64 Banco Nacional de Desenvolvimento Economico e Social sr unsecur RegS 6.369% /2018 (1) 8,654,000 10,298,260 1.09 Odebrecht Finance co gtd Ser144A priv plmt 7.125% /2042 (Cayman Islands) (2) 6,850,000 7,980,250 0.84 Republic of Brazil sr unsecur 5.875% /2019 5,964,000 7,410,270 0.78 Republic of Brazil sr unsecur 4.875% /2021 5,800,000 7,003,500 0.74 Republic of Brazil sr unsecur 8.875% /2019 3,730,000 5,417,825 0.57 Caixa Economica Federal sr unsecur RegS 3.5% /2022 4,790,000 4,873,825 0.52 Odebrecht Finance co gtd RegS 6% /2023 (Cayman Islands) (2) 3,594,000 4,173,532 0.44 Banco Safra Cayman Islands subord nts RegS 6.75% /2021 3,530,000 3,971,250 0.42 Republic of Brazil sr unsecur 7.125% /2037 2,000,000 3,075,000 0.33 Odebrecht Finance co gtd RegS 6% /2023 (Cayman Islands) (2) 891,000 1,034,674 0.11 Republic of Brazil sr unsecur SerA 8% /2018 465,667 542,408 0.06
total for Brazil 10.32
turkey Republic of Turkey unsecur 6% /2041 18,860,000 23,598,575 2.50 Republic of Turkey sr unsecur 5.625% /2021 14,370,000 17,108,635 1.81 Republic of Turkey sr unsecur 6.875% /2036 11,241,000 15,217,504 1.61 Export Credit Bank of Turkey sr unsecur RegS 5.875% /2019 6,230,000 7,111,545 0.75 Republic of Turkey sr unsecur 5.625% /2021 3,600,000 4,302,000 0.45 Republic of Turkey sr unsecur 7.5% /2017 3,077,000 3,756,863 0.40 Republic of Turkey sr unsecur 7.5% /2019 1,720,000 2,229,120 0.23 Republic of Turkey sr unsecur 8% /2034 925,000 1,387,708 0.15 Republic of Turkey sr unsecur 6.75% /2018 441,000 534,814 0.06
total for turkey 7.96
indonesia Majapahit Holding co gtd RegS 7.75% /2020 (Netherlands) (2) 22,880,000 28,828,800 3.05 Perusahaan Listrik Negara sr unsecur RegS 5.5% /2021 10,120,000 11,486,200 1.22 Republic of Indonesia sr unsecur RegS 7.75% /2038 7,207,000 10,918,605 1.15 Republic of Indonesia sr unsecur RegS SerGMTN 11.625% /2019 4,603,000 7,008,068 0.74 Pertamina Persero sr unsecur RegS 5.25% /2021 (1) 2,410,000 2,705,225 0.29 Pertamina Persero sr unsecur RegS 4.875% /2022 1,120,000 1,226,400 0.13
total for indonesia 6.58
Kazakhstan KazMunayGas National sr unsecur RegS 6.375% /2021 17,620,000 21,650,575 2.29 KazMunayGas Finance sub gtd RegS 9.125% /2018 10,970,000 14,548,962 1.54 Development Bank of Kazakhstan sr unsecur RegS 4.125% /2022 5,240,000 5,305,500 0.56
Intergas Finance co gtd RegS 6.375% /2017 (Netherlands) (2) 560,000 642,600 0.07 Development Bank of Kazakhstan sr unsecur RegS 5.5% /2015 586,000 630,829 0.06
total for Kazakhstan 4.52
Philippines Republic of Philippines sr unsecur 4% /2021 17,552,000 19,746,000 2.09 Republic of Philippines sr unsecur 9.5% /2030 5,500,000 9,556,525 1.01 Republic of Philippines sr unsecur 8.375% /2019 5,017,000 6,936,003 0.73 Republic of Philippines sr unsecur 9.5% /2030 2,500,000 4,343,875 0.46
total for Philippines 4.29
Colombia Republic of Colombia sr unsecur 4.375% /2021 12,092,000 13,966,260 1.48 Republic of Colombia sr unsecur 4.375% /2023 (COP) 14,199,000,000 8,163,541 0.86 Republic of Colombia sr unsecur 6.125% /2041 5,570,000 7,672,675 0.81 Republic of Colombia sr unsecur 7.375% /2019 2,800,000 3,697,400 0.39 Republic of Colombia sr unsecur 11.75% /2020 1,890,000 3,061,800 0.33
total for Colombia 3.87
Peru Republic of Peru sr unsecur RegS 8.2% /2026 (PEN) 22,420,000 12,334,645 1.30 Republic of Peru sr unsecur 7.35% /2025 7,040,000 10,225,600 1.08 Republic of Peru sr unsecur 5.625% /2050 5,060,000 6,603,300 0.70 Republic of Peru sr unsecur 8.75% /2033 1,352,000 2,355,860 0.25 Corporacion Azucarera del Peru co gtd RegS 6.375% /2022 1,880,000 2,039,800 0.22
total for Peru 3.55
Poland Government of Poland sr unsecur 3% /2023 18,770,000 18,753,107 1.99 Government of Poland sr unsecur 5% /2022 1,290,000 1,526,715 0.16
total for Poland 2.15
South africa Eskom Holdings sr unsecur RegS 5.75% /2021 13,834,000 15,753,467 1.67 Transnet SOC sr unsecur RegS 4% /2022 2,590,000 2,612,663 0.27
total for South africa 1.94
argentina Republic of Argentina sr unsecur 7% /2015 11,891,000 10,868,374 1.15
total for argentina 1.15
Lithuania Republic of Lithuania sr unsecur RegS 6.625% /2022 3,860,000 4,950,643 0.52 Republic of Lithuania sr unsecur RegS 6.75% /2015 1,720,000 1,898,656 0.20 Republic of Lithuania sr unsecur RegS 7.375% /2020 (1) 1,270,000 1,650,587 0.18 Republic of Lithuania sr unsecur RegS 6.125% /2021 (1) 700,000 865,410 0.09
total for Lithuania 0.99
Bonds (continued)
Bonds (continued)
Kazakhstan (continued)
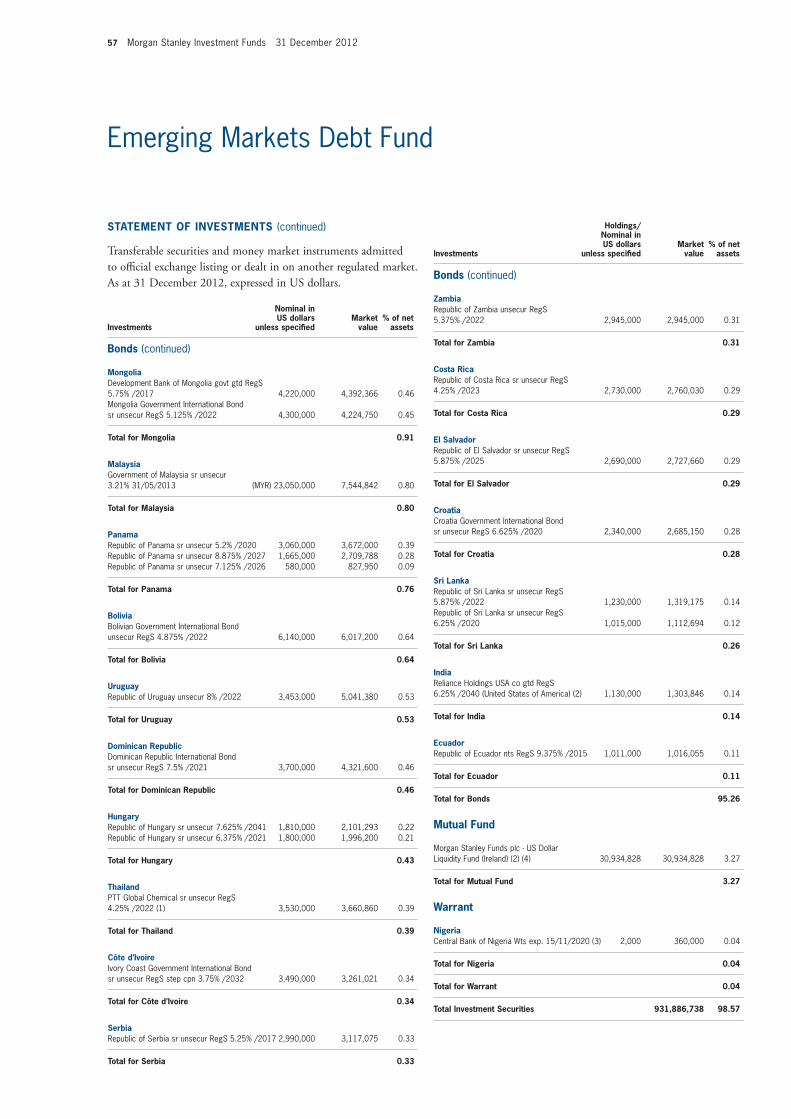
57 Morgan Stanley Investment Funds 31 December 2012
Emerging Markets Debt Fund
mongolia Development Bank of Mongolia govt gtd RegS 5.75% /2017 4,220,000 4,392,366 0.46 Mongolia Government International Bond sr unsecur RegS 5.125% /2022 4,300,000 4,224,750 0.45
total for mongolia 0.91
malaysia Government of Malaysia sr unsecur 3.21% 31/05/2013 (MYR) 23,050,000 7,544,842 0.80
total for malaysia 0.80
Panama Republic of Panama sr unsecur 5.2% /2020 3,060,000 3,672,000 0.39 Republic of Panama sr unsecur 8.875% /2027 1,665,000 2,709,788 0.28 Republic of Panama sr unsecur 7.125% /2026 580,000 827,950 0.09
total for Panama 0.76
Bolivia Bolivian Government International Bond unsecur RegS 4.875% /2022 6,140,000 6,017,200 0.64
total for Bolivia 0.64
Uruguay Republic of Uruguay unsecur 8% /2022 3,453,000 5,041,380 0.53
total for Uruguay 0.53
Dominican republic Dominican Republic International Bond sr unsecur RegS 7.5% /2021 3,700,000 4,321,600 0.46
total for Dominican republic 0.46
hungary Republic of Hungary sr unsecur 7.625% /2041 1,810,000 2,101,293 0.22 Republic of Hungary sr unsecur 6.375% /2021 1,800,000 1,996,200 0.21
total for hungary 0.43
thailand PTT Global Chemical sr unsecur RegS 4.25% /2022 (1) 3,530,000 3,660,860 0.39
total for thailand 0.39
Côte d’ivoire Ivory Coast Government International Bond sr unsecur RegS step cpn 3.75% /2032 3,490,000 3,261,021 0.34
total for Côte d’ivoire 0.34
Serbia Republic of Serbia sr unsecur RegS 5.25% /2017 2,990,000 3,117,075 0.33
total for Serbia 0.33
Statement of inveStmentS (continued)
transferable securities and money market instruments admitted to official exchange listing or dealt in on another regulated market. as at 31 December 2012, expressed in US dollars.
investments
nominal in US dollars
unless specifiedmarket
value% of net
assets
Zambia Republic of Zambia unsecur RegS 5.375% /2022 2,945,000 2,945,000 0.31
total for Zambia 0.31
Costa rica Republic of Costa Rica sr unsecur RegS 4.25% /2023 2,730,000 2,760,030 0.29
total for Costa rica 0.29
el Salvador Republic of El Salvador sr unsecur RegS 5.875% /2025 2,690,000 2,727,660 0.29
total for el Salvador 0.29
Croatia Croatia Government International Bond sr unsecur RegS 6.625% /2020 2,340,000 2,685,150 0.28
total for Croatia 0.28
Sri Lanka Republic of Sri Lanka sr unsecur RegS 5.875% /2022 1,230,000 1,319,175 0.14 Republic of Sri Lanka sr unsecur RegS 6.25% /2020 1,015,000 1,112,694 0.12
total for Sri Lanka 0.26
india Reliance Holdings USA co gtd RegS 6.25% /2040 (United States of America) (2) 1,130,000 1,303,846 0.14
total for india 0.14
ecuador Republic of Ecuador nts RegS 9.375% /2015 1,011,000 1,016,055 0.11
total for ecuador 0.11
total for Bonds 95.26
mutual fund
Morgan Stanley Funds plc - US Dollar Liquidity Fund (Ireland) (2) (4) 30,934,828 30,934,828 3.27
total for mutual fund 3.27
Warrant
nigeria Central Bank of Nigeria Wts exp. 15/11/2020 (3) 2,000 360,000 0.04
total for nigeria 0.04
total for Warrant 0.04
total investment Securities 931,886,738 98.57
investments
holdings/nominal in US dollars
unless specifiedmarket
value% of net
assets Bonds (continued)
Bonds (continued)

Morgan Stanley Investment Funds 31 December 2012 58
Emerging Markets Debt Fund
DerivativeS
OtC and exchange traded derivatives as at 31 December 2012, expressed in US dollars.
forward foreign Currency exchange Contracts
maturity date
amount bought Ccy
amount sold Ccy Counterparty
Unrealised gain/(loss)
USD% of net
assets
18/01/2013 248,000,000 RUB 7,967,104 USD J.P. Morgan 130,233 0.01
Unrealised Gain on forward foreign Currency exchange Contracts 130,233 0.01
eUr hedged Share Class 11/01/2013 287,260 EUR 378,683 USD J.P. Morgan 1,086 0.00 11/01/2013 1,087,591 USD 821,684 EUR J.P. Morgan 1,292 0.00
GBP hedged Share Class 11/01/2013 12,572 GBP 20,326 USD J.P. Morgan 102 0.00
Unrealised Gain on nav hedged Share Classes forward foreign Currency exchange Contracts 2,480 0.00
total Unrealised Gain on forward foreign Currency exchange Contracts 132,713 0.01
eUr hedged Share Class 11/01/2013 163,308,129 EUR 216,071,064 USD J.P. Morgan (171,301) (0.02)11/01/2013 237,814 USD 180,504 EUR J.P. Morgan (820) 0.00
GBP hedged Share Class 11/01/2013 25,642,871 GBP 41,672,869 USD J.P. Morgan (5,354) 0.00 11/01/2013 1,406 USD 867 GBP J.P. Morgan (2) 0.00
Unrealised Loss on nav hedged Share Classes forward foreign Currency exchange Contracts (177,477) (0.02)
total Unrealised Loss on forward foreign Currency exchange Contracts (177,477) (0.02)
net Unrealised Loss on forward foreign Currency exchange Contracts (44,764) (0.01)
total Derivatives (44,764) (0.01)
other assets less Liabilities 13,576,825 1.44
total net asset value 945,418,799 100.00
(1) All or part of this position is out on loan.(2) The country in brackets represents the country of incorporation of this security.(3) These securities are valued at their fair value. See note 2(a) within the Notes to the Financial
Statements.(4) Managed by an affiliate of the Investment Adviser.(5) Variable coupon rates are those quoted as of 31 December 2012.
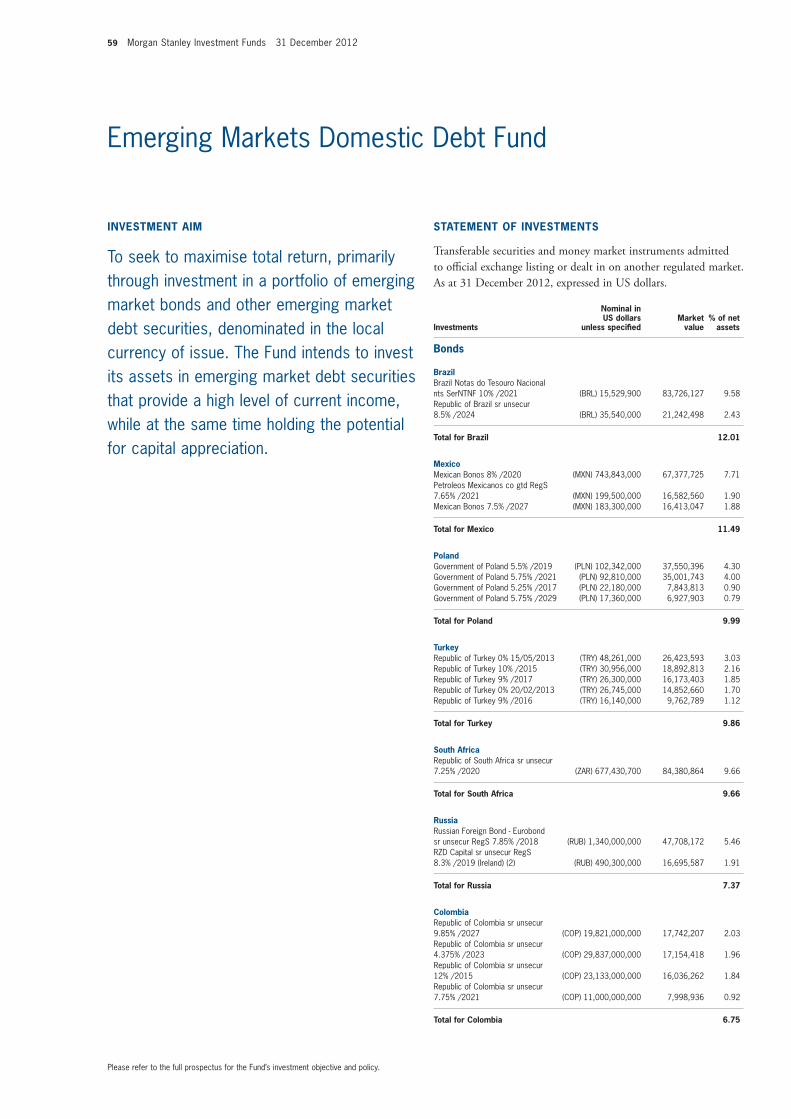
59 Morgan Stanley Investment Funds 31 December 2012
Please refer to the full prospectus for the Fund’s investment objective and policy.
Emerging Markets Domestic Debt Fund
Bonds
BrazilBrazil Notas do Tesouro Nacional nts SerNTNF 10% /2021 (BRL) 15,529,900 83,726,127 9.58Republic of Brazil sr unsecur 8.5% /2024 (BRL) 35,540,000 21,242,498 2.43
total for Brazil 12.01
mexicoMexican Bonos 8% /2020 (MXN) 743,843,000 67,377,725 7.71Petroleos Mexicanos co gtd RegS 7.65% /2021 (MXN) 199,500,000 16,582,560 1.90Mexican Bonos 7.5% /2027 (MXN) 183,300,000 16,413,047 1.88
total for mexico 11.49
PolandGovernment of Poland 5.5% /2019 (PLN) 102,342,000 37,550,396 4.30Government of Poland 5.75% /2021 (PLN) 92,810,000 35,001,743 4.00Government of Poland 5.25% /2017 (PLN) 22,180,000 7,843,813 0.90Government of Poland 5.75% /2029 (PLN) 17,360,000 6,927,903 0.79
total for Poland 9.99
turkeyRepublic of Turkey 0% 15/05/2013 (TRY) 48,261,000 26,423,593 3.03Republic of Turkey 10% /2015 (TRY) 30,956,000 18,892,813 2.16Republic of Turkey 9% /2017 (TRY) 26,300,000 16,173,403 1.85Republic of Turkey 0% 20/02/2013 (TRY) 26,745,000 14,852,660 1.70Republic of Turkey 9% /2016 (TRY) 16,140,000 9,762,789 1.12
total for turkey 9.86
South africaRepublic of South Africa sr unsecur 7.25% /2020 (ZAR) 677,430,700 84,380,864 9.66
total for South africa 9.66
russiaRussian Foreign Bond - Eurobond sr unsecur RegS 7.85% /2018 (RUB) 1,340,000,000 47,708,172 5.46RZD Capital sr unsecur RegS 8.3% /2019 (Ireland) (2) (RUB) 490,300,000 16,695,587 1.91
total for russia 7.37
ColombiaRepublic of Colombia sr unsecur 9.85% /2027 (COP) 19,821,000,000 17,742,207 2.03Republic of Colombia sr unsecur 4.375% /2023 (COP) 29,837,000,000 17,154,418 1.96Republic of Colombia sr unsecur 12% /2015 (COP) 23,133,000,000 16,036,262 1.84Republic of Colombia sr unsecur 7.75% /2021 (COP) 11,000,000,000 7,998,936 0.92
total for Colombia 6.75
inveStment aim
To seek to maximise total return, primarily through investment in a portfolio of emerging market bonds and other emerging market debt securities, denominated in the local currency of issue. The Fund intends to invest its assets in emerging market debt securities that provide a high level of current income, while at the same time holding the potential for capital appreciation.
Statement of inveStmentS
transferable securities and money market instruments admitted to official exchange listing or dealt in on another regulated market. as at 31 December 2012, expressed in US dollars.
investments
nominal in US dollars
unless specifiedmarket
value% of net
assets
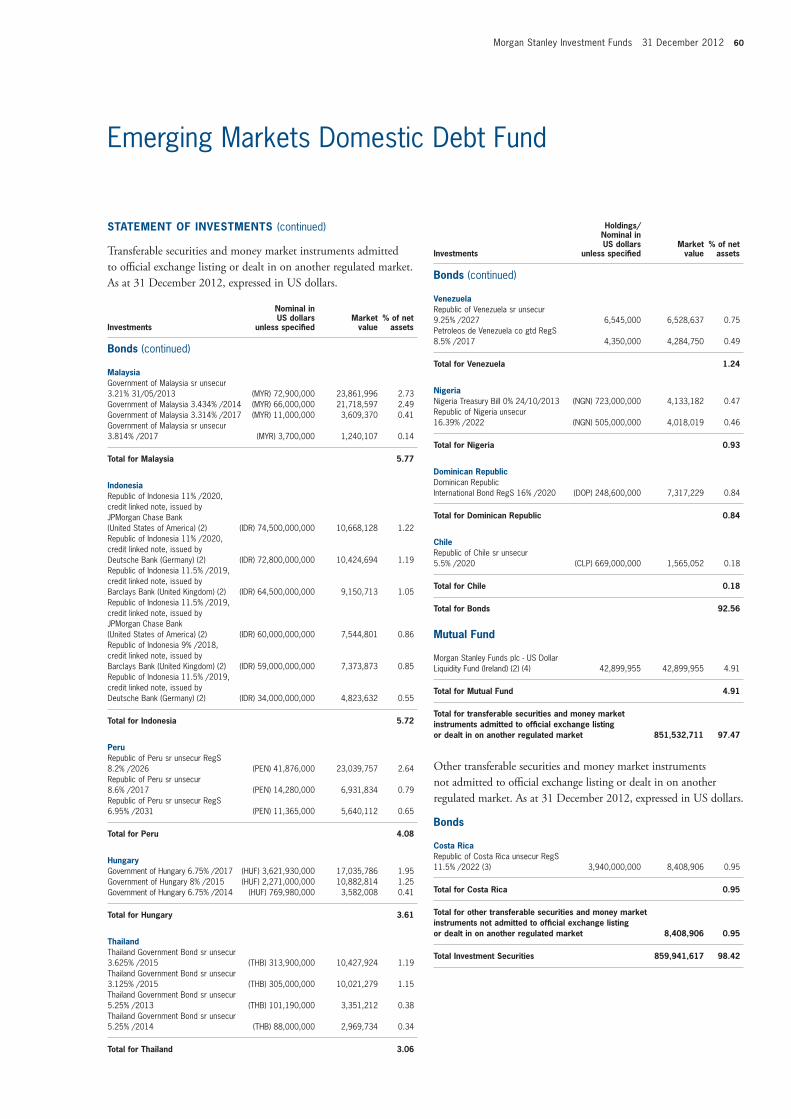
Morgan Stanley Investment Funds 31 December 2012 60
Emerging Markets Domestic Debt Fund
Statement of inveStmentS (continued)
transferable securities and money market instruments admitted to official exchange listing or dealt in on another regulated market. as at 31 December 2012, expressed in US dollars.
investments
nominal in US dollars
unless specifiedmarket
value% of net
assets
malaysiaGovernment of Malaysia sr unsecur 3.21% 31/05/2013 (MYR) 72,900,000 23,861,996 2.73Government of Malaysia 3.434% /2014 (MYR) 66,000,000 21,718,597 2.49Government of Malaysia 3.314% /2017 (MYR) 11,000,000 3,609,370 0.41Government of Malaysia sr unsecur 3.814% /2017 (MYR) 3,700,000 1,240,107 0.14
total for malaysia 5.77
indonesiaRepublic of Indonesia 11% /2020, credit linked note, issued by JPMorgan Chase Bank (United States of America) (2) (IDR) 74,500,000,000 10,668,128 1.22Republic of Indonesia 11% /2020, credit linked note, issued by Deutsche Bank (Germany) (2) (IDR) 72,800,000,000 10,424,694 1.19Republic of Indonesia 11.5% /2019, credit linked note, issued by Barclays Bank (United Kingdom) (2) (IDR) 64,500,000,000 9,150,713 1.05Republic of Indonesia 11.5% /2019, credit linked note, issued by JPMorgan Chase Bank (United States of America) (2) (IDR) 60,000,000,000 7,544,801 0.86Republic of Indonesia 9% /2018, credit linked note, issued by Barclays Bank (United Kingdom) (2) (IDR) 59,000,000,000 7,373,873 0.85Republic of Indonesia 11.5% /2019, credit linked note, issued by Deutsche Bank (Germany) (2) (IDR) 34,000,000,000 4,823,632 0.55
total for indonesia 5.72
PeruRepublic of Peru sr unsecur RegS 8.2% /2026 (PEN) 41,876,000 23,039,757 2.64Republic of Peru sr unsecur 8.6% /2017 (PEN) 14,280,000 6,931,834 0.79Republic of Peru sr unsecur RegS 6.95% /2031 (PEN) 11,365,000 5,640,112 0.65
total for Peru 4.08
hungaryGovernment of Hungary 6.75% /2017 (HUF) 3,621,930,000 17,035,786 1.95Government of Hungary 8% /2015 (HUF) 2,271,000,000 10,882,814 1.25Government of Hungary 6.75% /2014 (HUF) 769,980,000 3,582,008 0.41
total for hungary 3.61
thailandThailand Government Bond sr unsecur 3.625% /2015 (THB) 313,900,000 10,427,924 1.19Thailand Government Bond sr unsecur 3.125% /2015 (THB) 305,000,000 10,021,279 1.15Thailand Government Bond sr unsecur 5.25% /2013 (THB) 101,190,000 3,351,212 0.38Thailand Government Bond sr unsecur 5.25% /2014 (THB) 88,000,000 2,969,734 0.34
total for thailand 3.06
venezuelaRepublic of Venezuela sr unsecur 9.25% /2027 6,545,000 6,528,637 0.75Petroleos de Venezuela co gtd RegS 8.5% /2017 4,350,000 4,284,750 0.49
total for venezuela 1.24
nigeriaNigeria Treasury Bill 0% 24/10/2013 (NGN) 723,000,000 4,133,182 0.47Republic of Nigeria unsecur 16.39% /2022 (NGN) 505,000,000 4,018,019 0.46
total for nigeria 0.93
Dominican republicDominican Republic International Bond RegS 16% /2020 (DOP) 248,600,000 7,317,229 0.84
total for Dominican republic 0.84
ChileRepublic of Chile sr unsecur 5.5% /2020 (CLP) 669,000,000 1,565,052 0.18
total for Chile 0.18
total for Bonds 92.56
mutual fund
Morgan Stanley Funds plc - US Dollar Liquidity Fund (Ireland) (2) (4) 42,899,955 42,899,955 4.91
total for mutual fund 4.91
total for transferable securities and money market instruments admitted to official exchange listing or dealt in on another regulated market 851,532,711 97.47
Other transferable securities and money market instruments not admitted to official exchange listing or dealt in on another regulated market. as at 31 December 2012, expressed in US dollars.
Bonds
Costa ricaRepublic of Costa Rica unsecur RegS 11.5% /2022 (3) 3,940,000,000 8,408,906 0.95
total for Costa rica 0.95
total for other transferable securities and money market instruments not admitted to official exchange listing or dealt in on another regulated market 8,408,906 0.95
total investment Securities 859,941,617 98.42
investments
holdings/nominal in US dollars
unless specifiedmarket
value% of net
assets
Bonds (continued)
Bonds (continued)

61 Morgan Stanley Investment Funds 31 December 2012
Emerging Markets Domestic Debt Fund
DerivativeS
OtC and exchange traded derivatives as at 31 December 2012, expressed in US dollars.
forward foreign Currency exchange Contracts
maturity date
amount bought Ccy
amount sold Ccy Counterparty
Unrealised gain/(loss)
USD% of net
assets
18/01/2013 654,000,000 RUB 21,010,023 USD J.P. Morgan 343,435 0.04 28/01/2013 978,750,000 THB 31,930,511 USD J.P. Morgan 31,584 0.00 29/01/2013 103,880,000 MYR 33,834,929 USD J.P. Morgan 67,419 0.01
Unrealised Gain on forward foreign Currency exchange Contracts 442,438 0.05
eUr hedged Share Class 11/01/2013 154,645 EUR 203,817 USD J.P. Morgan 630 0.00 11/01/2013 295,212 USD 223,157 EUR J.P. Morgan 189 0.00
Unrealised Gain on nav hedged Share Classes forward foreign Currency exchange Contracts 819 0.00
total Unrealised Gain on forward foreign Currency exchange Contracts 443,257 0.05
eUr hedged Share Class 11/01/2013 123,225,351 EUR 163,037,763 USD J.P. Morgan (129,008) (0.01)
total Unrealised Loss on nav hedged Share Classes on forward foreign Currency exchange Contracts (129,008) (0.01)
net Unrealised Gain on forward foreign Currency exchange Contracts 314,249 0.04
total Derivatives 314,249 0.04
other assets less Liabilities 13,447,318 1.54
total net asset value 873,703,184 100.00
(2) The country in brackets represents the country of incorporation of this security.(3) These securities are valued at their fair value. See note 2(a) within the Notes to the Financial
Statements.(4) Managed by an affiliate of the Investment Adviser.

Morgan Stanley Investment Funds 31 December 2012 62
Please refer to the full prospectus for the Fund’s investment objective and policy.
Euro Bond Fund
Corporate Bonds
United States of americaBA Covered Bond Issuer covered SerEMTN 4.25% /2017 13,000,000 14,401,764 2.03WM Covered Bond Program covered SerEMTN 4% /2016 7,000,000 7,802,697 1.10Goldman Sachs Group sr unsecur SerEMTN 4.375% /2017 5,000,000 5,481,167 0.77GE Capital European Funding co gtd SerEMTN 5.25% /2015 (Ireland) (1) (2) 4,000,000 4,410,920 0.62JPMorgan Chase & Co sr unsecur SerEMTN 5.25% /2015 3,850,000 4,195,998 0.59Bank of America sr unsecur SerEMTN 5.125% /2014 3,550,000 3,793,390 0.54Citigroup subord SerEMTN 1.458% /2017 (5) 3,950,000 3,721,986 0.53Wachovia sr unsecur SerEMTN 0.343% /2014 (5) 2,900,000 2,900,131 0.41Philip Morris International sr unsecur SerEMTN 5.875% /2015 2,500,000 2,844,108 0.40Merrill Lynch & Co sr unsecur SerEMTN 0.488% /2014 (5) 2,500,000 2,474,175 0.35Goldman Sachs Group sr unsecur SerEMTN 6.375% /2018 1,800,000 2,173,610 0.31Merrill Lynch & Co sr unsecur SerEMTN 6.75% 21/05/2013 1,950,000 1,992,734 0.28John Deere Bank co gtd SerEMTN 3.25% /2016 (Luxembourg) (2) 1,625,000 1,757,405 0.25Citigroup sr unsecur SerEMTN 4% /2015 1,500,000 1,624,864 0.23GE Capital Trust II ltd gtd RegS 5.5% /2067 (5) 1,555,000 1,544,407 0.22AT&T sr unsecur 3.55% /2032 1,200,000 1,254,900 0.18Paccar Financial Europe sr unsecur SerEMTN 3% /2014 (Netherlands) (2) 1,200,000 1,237,302 0.18GE Capital European Funding co gtd SerEMTN 4.625% 29/10/2013 (Ireland) (2) 1,000,000 1,034,660 0.15Wells Fargo & Co sr unsecur SerEMTN 2.625% /2022 850,000 881,147 0.12Philip Morris International sr unsecur SerEMTN 5.75% /2016 700,000 809,946 0.11Procter & Gamble sr unsecur RegS 2% /2022 (1) 775,000 778,449 0.11Metropolitan Life Global Funding secured SerGMTN 2.375% /2019 600,000 630,163 0.09Caterpillar International Finance co gtd SerEMTN 2.75% /2014 (Ireland) (2) 600,000 618,907 0.09JPMorgan Chase & Co sr unsecur SerEMTN 2.75% /2022 575,000 595,731 0.08GE Capital European Funding co gtd SerEMTN 1.25% /2015 (Ireland) (2) 450,000 455,455 0.06Caterpillar International Finance co gtd SerEMTN 1.375% /2015 (Ireland) (2) 400,000 406,633 0.06Philip Morris International sr unsecur 2.125% /2019 300,000 310,732 0.04
total for United States of america 9.90
United KingdomBank of Scotland covered SerEMTN 4.5% 23/10/2013 6,500,000 6,719,115 0.95Abbey National Treasury Services covered SerEMTN 3.625% /2016 4,400,000 4,845,399 0.68Bank of Scotland covered SerEMTN 4.625% /2017 3,500,000 4,071,371 0.57Yorkshire Building Society covered SerEMTN 3.25% /2015 3,250,000 3,454,781 0.49Royal Bank of Scotland subord SerEMTN 10.5% /2022 (1) (5) 2,497,000 3,070,342 0.43
inveStment aim
To provide an attractive rate of return, measured in Euro, through investment in Euro-denominated fixed income securities of high quality issued by governments, agencies and corporations.
Statement of inveStmentS
transferable securities and money market instruments admitted to official exchange listing or dealt in on another regulated market. as at 31 December 2012, expressed in euro.
investments
nominal in euro unless
specifiedmarket
value% of net
assets

63 Morgan Stanley Investment Funds 31 December 2012
Euro Bond Fund
Statement of inveStmentS (continued)
transferable securities and money market instruments admitted to official exchange listing or dealt in on another regulated market. as at 31 December 2012, expressed in euro.
investments
nominal in euro unless
specifiedmarket
value% of net
assets
investments
nominal in euro unless
specifiedmarket
value% of net
assets
BP Capital Markets co gtd SerEMTN 3.472% /2016 2,700,000 2,934,715 0.41Barclays Bank subord SerEMTN 6% /2021 2,500,000 2,837,238 0.40Standard Chartered sr unsecur 3.875% /2016 2,300,000 2,532,414 0.36HSBC Holdings subord 3.625% /2020 (5) 2,430,000 2,514,579 0.35Elsevier Finance Via ELM sr unsecur SerEMTN 2.5% /2020 (Netherlands) (2) 2,400,000 2,475,798 0.35Co-operative Bank sr unsecur SerEMTN 2.375% /2015 2,300,000 2,306,200 0.33Nationwide Building Society covered SerEMTN 3.5% /2015 2,000,000 2,173,002 0.31HBOS subord SerEMTN 4.5% /2030 (5) 2,500,000 2,089,113 0.30Royal Bank of Scotland sr unsecur SerEMTN 5.375% /2019 1,700,000 2,033,773 0.29Nationwide Building Society sr unsecur SerEMTN 3.75% /2015 1,900,000 2,010,722 0.28HSBC Holdings subord SerEMTN 6.25% /2018 1,500,000 1,802,459 0.25Nationwide Building Society subord SerEMTN 6.75% /2020 1,500,000 1,761,029 0.25Abbey National Treasury Services bnk gtd SerEMTN 3.375% /2015 1,500,000 1,594,645 0.23Heathrow Funding sr secured Ser144A priv plmt 4.6% /2018 (Jersey) (2) 1,400,000 1,593,934 0.23Lloyds TSB Bank subord SerEMTN 5.625% /2018 (5) 1,600,000 1,547,696 0.22Lloyds TSB Bank subord SerEMTN 6.5% /2020 (1) 1,350,000 1,545,733 0.22Hammerson sr unsecur 2.75% /2019 (1) 1,200,000 1,238,698 0.17HSBC Holdings subord SerEMTN 6% /2019 1,000,000 1,211,696 0.17Anglo American Capital co gtd SerEMTN 5.875% /2015 900,000 997,610 0.14British American Tobacco Holdings The Netherlands co gtd SerEMTN 2.375% /2023 (Netherlands) (2) 900,000 901,319 0.13BP Capital Markets co gtd SerEMTN 3.83% /2017 700,000 790,297 0.11Compass Group sr unsecur SerEMTN 3.125% /2019 700,000 760,876 0.11BAT International Finance co gtd SerEMTN 3.625% /2021 650,000 725,729 0.10Leek Finance 17X A2C 0.463% /2037 (5) 568,740 590,002 0.08Rio Tinto Finance co gtd SerEMTN 2.875% /2024 550,000 562,716 0.08Barclays Bank sr unsecur 3.5% /2015 500,000 529,311 0.08Standard Chartered subord nts SerEMTN 3.625% /2022 (1) 500,000 512,914 0.07BAT International Finance co gtd SerEMTN 5.375% /2017 300,000 354,961 0.05Barclays Bank sr unsecur SerEMTN 4.125% /2016 300,000 329,674 0.05Standard Chartered sr unsecur SerEMTN 4.125% /2019 250,000 286,696 0.04
total for United Kingdom 9.28
franceCaisse d’Amortissement de la Dette Sociale sr unsecur SerEMTN 1.75% 18/11/2013 6,000,000 6,084,870 0.86Compagnie de Financement Foncier covered SerEMTN 4.625% /2017 3,000,000 3,498,105 0.49
BNP Paribas subord SerEMTN 5.431% /2017 (1) 3,000,000 3,431,350 0.48Christian Dior sr unsecur 4% /2016 2,100,000 2,239,608 0.32Caisse d’Amortissement de la Dette Sociale sr unsecur SerEMTN 3.625% /2016 2,000,000 2,208,875 0.31Banque Federative du Credit Mutuel sr unsecur SerEMTN 3% /2015 2,000,000 2,115,078 0.30Credit Agricole subord SerEMTN 3.9% /2021 (1) 2,000,000 2,026,752 0.29Société Générale sr unsecur SerEMTN 4.75% /2021 (1) 1,500,000 1,772,482 0.25Electricité de France unsecur SerEMTN 2.75% /2023 1,700,000 1,730,212 0.24Société Générale jr subord 6.999% perpetual (1) (5) 1,650,000 1,654,991 0.23BPCE sr unsecur SerEMTN 2% /2018 1,500,000 1,529,750 0.22BNP Paribas sr unsecur SerEMTN 2.5% /2019 1,450,000 1,509,937 0.21BNP Paribas sr unsecur 2.875% /2017 1,400,000 1,499,213 0.21France Telecom sr unsecur SerEMTN 8.125% /2033 900,000 1,422,830 0.20Crédit Agricole sr unsecur SerEMTN 6% 24/06/2013 (1) 1,300,000 1,335,490 0.19Groupe Auchan sr unsecur SerEMTN 6% /2019 1,000,000 1,271,932 0.18SA de Gestion des Stocks de Securite sr unsecur 1.75% /2019 1,200,000 1,227,768 0.17Crédit Agricole sr unsecur SerEMTN 3.875% /2019 (1) 1,100,000 1,226,402 0.17AXA sr unsecur SerEMTN 4.5% /2015 1,100,000 1,183,131 0.17Banque Federative du Credit Mutuel sr unsecur SerEMTN 0.34% /2014 (1) (5) 1,000,000 999,015 0.14Unibail-Rodamco sr unsecur SerEMTN 3.375% /2015 900,000 948,675 0.13Unibail-Rodamco sr unsecur SerEMTN 1.625% /2017 (1) 925,000 935,595 0.13Société Générale sr unsecur SerEMTN 3.75% /2014 800,000 838,231 0.12Unibail-Rodamco sr unsecur SerEMTN 3.875% /2020 (1) 550,000 627,459 0.09Air Liquide Finance co gtd SerEMTN 2.125% /2021 600,000 607,573 0.09AXA subord SerEMTN 5.25% /2040 (5) 450,000 471,206 0.07Legrand sr unsecur SerEMTN 3.375% /2022 300,000 328,208 0.05Credit Agricole jr subord 7.875% perpetual (5) 200,000 211,040 0.03
total for france 6.34
SpainFondo de Reestructuracion Ordenada Bancaria govt gtd 4.4% 21/10/2013 10,800,000 10,936,188 1.54Fondo de Reestructuracion Ordenada Bancaria govt gtd 4.5% /2014 7,800,000 7,917,901 1.12Banco Bilbao Vizcaya Argentaria covered 3.625% /2017 5,200,000 5,312,525 0.75FADE - Fondo de Amortizacion del Deficit Electrico govt gtd 5% /2015 3,900,000 4,023,960 0.57Santander International Debt bnk gtd SerEMTN 3.5% /2015 (1) 2,800,000 2,834,430 0.40Gas Natural Capital Markets co gtd SerEMTN 4.375% /2016 2,400,000 2,576,833 0.36Santander International Debt co gtd SerEMTN 4.625% /2016 1,700,000 1,778,089 0.25Iberdrola Finanzas co gtd SerEMTN 4.625% /2017 1,500,000 1,637,224 0.23Santander International Debt bnk gtd SerEMTN 3.75% 28/02/2013 1,500,000 1,505,790 0.21CaixaBank sr unsecur SerDMTN 4.125% /2014 (1) 1,200,000 1,209,902 0.17CaixaBank covered 3.375% /2014 1,100,000 1,111,078 0.16Telefonica Emisiones co gtd SerEMTN 5.496% /2016 1,000,000 1,098,819 0.16
Corporate Bonds (continued)
United Kingdom (continued)
Corporate Bonds (continued)
france (continued)

Morgan Stanley Investment Funds 31 December 2012 64
Euro Bond Fund
Statement of inveStmentS (continued)
transferable securities and money market instruments admitted to official exchange listing or dealt in on another regulated market. as at 31 December 2012, expressed in euro.
investments
nominal in euro unless
specifiedmarket
value% of net
assets
CaixaBank sr unsecur SerEMTN 3.75% 05/11/2013 1,050,000 1,060,279 0.15Telefonica Emisiones co gtd SerEMTN 4.693% /2019 (1) 500,000 546,324 0.08Telefonica Emisiones co gtd RegS 4.75% /2017 500,000 542,936 0.08Telefonica Emisiones co gtd SerGMTN 3.661% /2017 500,000 522,321 0.07
total for Spain 6.30
GermanyKfW - Kreditanstalt fuer Wiederaufbau govt gtd 3.875% /2019 12,000,000 14,128,224 1.99State of Saxony-Anhalt 3.75% /2021 4,750,000 5,604,404 0.79Deutsche Bank subord SerEMTN 5% /2020 2,100,000 2,338,957 0.33Muenchener Rueckversicherungs subord SerEMTN 6% /2041 (5) 1,800,000 2,160,980 0.31Daimler International Finance co gtd SerEMTN 7.875% /2014 (Netherlands) (1) (2) 2,000,000 2,149,696 0.30Allianz Finance II co gtd SerEMTN 5.75% /2041 (Netherlands) (2) (5) 1,800,000 2,069,059 0.29BMW US Capital co gtd SerEMTN 5% /2015 (United States of America) (2) 1,800,000 1,980,126 0.28Deutsche Boerse sr unsecur 2.375% /2022 1,500,000 1,537,995 0.22BASF sr unsecur SerEMTN 1.5% /2018 1,250,000 1,279,334 0.18Deutsche Telekom International Finance co gtd SerEMTN 5.75% /2015 (Netherlands) (2) 1,000,000 1,108,666 0.16KfW - Kreditanstalt fuer Wiederaufbau govt gtd SerEMTN 3.125% /2016 1,000,000 1,092,021 0.15Allianz Finance II co gtd SerEMTN 4.75% /2019 (Netherlands) (2) 900,000 1,078,019 0.15MAN sr unsecur SerEMTN 1% /2015 1,025,000 1,035,498 0.15Muenchener Rueckversicherungs jr subord 5.767% perpetual (5) 750,000 794,225 0.11Merck Financial Services co gtd SerEMTN 3.375% /2015 575,000 608,916 0.09
total for Germany 5.50
netherlandsING Bank govt liquid gtd SerEMTN 3.375% /2014 6,000,000 6,224,550 0.88SNS Bank govt liquid gtd SerEMTN 3.5% /2014 5,000,000 5,196,170 0.73ING Groep sr unsecur SerEMTN 5.625% 03/09/2013 2,900,000 2,996,181 0.42ABN Amro Bank subord SerEMTN 6.375% /2021 2,400,000 2,752,784 0.39ABN Amro Bank covered SerEMTN 1.875% /2019 2,150,000 2,225,079 0.31Volkswagen International Finance co gtd SerEMTN 1.875% /2017 2,000,000 2,062,994 0.29ABN Amro Bank covered SerEMTN 3.75% /2014 1,500,000 1,578,186 0.22Cooperatieve Centrale Raiffeisen-Boerenleenbank subord SerEMTN 5.875% /2019 (1) 1,300,000 1,569,126 0.22Cooperatieve Centrale Raiffeisen-Boerenleenbank unsecur SerEMTN 3.5% /2018 (1) 1,250,000 1,388,675 0.20Alliander subord 4.875% perpetual (5) 1,200,000 1,278,322 0.18Enexis Holding sr unsecur SerEMTN 1.875% /2020 1,100,000 1,103,406 0.16Cooperatieve Centrale Raiffeisen-Boerenleenbank sr unsecur SerEMTN 3.875% /2016 1,000,000 1,094,880 0.15
TenneT Holding sr unsecur SerEMTN 4.625% /2023 700,000 832,259 0.12Nederlandse Gasunie sr unsecur SerEMTN 0.875% /2015 550,000 553,942 0.08LeasePlan Finance co gtd SerEMTN 3.75% 18/03/2013 200,000 201,267 0.03
total for netherlands 4.38
italyBanca Monte dei Paschi di Siena covered SerEMTN 4.875% /2016 4,000,000 4,199,132 0.59Banca Monte dei Paschi di Siena covered 3.125% /2015 3,700,000 3,692,322 0.52Banco Popolare covered RegS 4.75% /2016 2,300,000 2,392,768 0.34Intesa Sanpaolo sr unsecur SerGMTN 4.75% /2017 (1) 2,100,000 2,260,714 0.32Telecom Italia Finance co gtd SerEMTN 7.75% /2033 (Luxembourg) (2) 1,900,000 2,201,714 0.31Snam sr unsecur SerEMTN 5.25% /2022 1,850,000 2,121,246 0.30UniCredit sr unsecur RegS 3.625% 21/08/2013 (1) 1,700,000 1,724,761 0.24Hera sr unsecur 4.125% /2016 (1) 1,500,000 1,590,166 0.22Assicurazioni Generali sr unsecur SerEMTN 5.125% /2024 1,450,000 1,552,783 0.22Intesa Sanpaolo sr unsecur SerEMTN 4.125% /2016 1,400,000 1,458,696 0.21Terna Rete Elettrica Nazionale sr unsecur SerEMTN 4.75% /2021 1,000,000 1,142,917 0.16Intesa Sanpaolo Bank Ireland bnk gtd SerEMTN 4% 08/08/2013 (Ireland) (2) 900,000 913,734 0.13Finmeccanica Finance co gtd SerEMTN 8.125% 03/12/2013 (Luxembourg) (1) (2) 750,000 797,100 0.11Snam sr unsecur SerEMTN 5% /2019 350,000 396,960 0.06
total for italy 3.73
SwedenSwedbank govt liquid gtd 3.375% /2014 3,000,000 3,135,579 0.44Svensk Exportkredit sr unsecur SerEMTN 3.625% /2014 3,000,000 3,135,109 0.44Nordea Bank subord SerEMTN 4.625% /2022 (5) 1,550,000 1,678,758 0.24Swedbank sr unsecur SerEMTN 3.375% /2017 1,450,000 1,577,259 0.22Swedbank Hypotek covered 3.625% /2016 1,000,000 1,111,236 0.16Nordea Bank subord SerEMTN 4.625% /2022 (5) 950,000 1,028,920 0.15Svenska Handelsbanken sr unsecur SerEMTN 2.625% /2022 (1) 900,000 931,729 0.13
total for Sweden 1.78
SwitzerlandNestle Finance International co gtd SerEMTN 1.75% /2022 (Luxembourg) (2) 1,960,000 1,943,825 0.28Cloverie for Zurich Insurance subord SerEMTN 7.5% /2039 (Ireland) (1) (2) (5) 1,500,000 1,837,350 0.26Credit Suisse sr unsecur SerEMTN 3.875% /2017 (1) 1,100,000 1,222,031 0.17Zurich Finance USA co gtd SerEMTN 6.5% /2015 (United States of America) (2) 1,000,000 1,153,075 0.16UBS jr subord SerEMTN 7.152% perpetual (1) (5) 350,000 381,938 0.05
total for Switzerland 0.92
norwaySparebank 1 SR Bank sr unsecur 3.625% /2015 2,100,000 2,215,087 0.31DNB Bank sr unsecur RegS 4.375% /2021 1,700,000 1,999,041 0.28DNB Bank sr unsecur SerEMTN 4.25% /2022 (1) 875,000 1,021,662 0.15Statkraft nts SerEMTN 2.5% /2022 (1) 800,000 809,102 0.11
total for norway 0.85
investments
nominal in euro unless
specifiedmarket
value% of net
assets
Corporate Bonds (continued)
Spain (continued)
Corporate Bonds (continued)
netherlands (continued)

65 Morgan Stanley Investment Funds 31 December 2012
Euro Bond Fund
Statement of inveStmentS (continued)
transferable securities and money market instruments admitted to official exchange listing or dealt in on another regulated market. as at 31 December 2012, expressed in euro.
investments
nominal in euro unless
specifiedmarket
value% of net
assets
australiaAustralia & New Zealand Banking Group sr unsecur SerEMTN 3.75% /2017 (1) 2,100,000 2,337,667 0.33National Australia Bank sr unsecur SerEMTN 3.5% /2015 1,900,000 2,010,649 0.28BHP Billiton Finance co gtd SerEMTN 2.25% /2020 1,300,000 1,339,931 0.19
total for australia 0.80
irelandBank of Ireland Mortgage Bank covered SerEMTN 4% 05/07/2013 5,500,000 5,568,640 0.79
total for ireland 0.79
LuxembourgITW Finance Europe co gtd 5.25% /2014 (1) 3,400,000 3,687,897 0.52Enel Finance International co gtd SerGMTN 5.75% /2018 (Netherlands) (1) (2) 1,000,000 1,136,420 0.16
total for Luxembourg 0.68
JerseyASIF III Jersey sr secured SerEMTN 4.75% 11/09/2013 3,000,000 3,071,010 0.44Heathrow Funding sr secured 4.375% /2017 650,000 726,003 0.10
total for Jersey 0.54
new ZealandWestpac Securities covered SerEMTN 3.5% /2016 3,350,000 3,672,590 0.52
total for new Zealand 0.52
United arab emiratesIPIC GMTN co gtd RegS 5.875% /2021 (Cayman Islands) (2) 2,500,000 3,056,896 0.43IPIC GMTN co gtd RegS 2.375% /2018 (Cayman Islands) (2) 250,000 256,875 0.04
total for United arab emirates 0.47
russiaGazprom Via Gaz Capital sr unsecur SerEMTN LPN 6.605% /2018 (Luxembourg) (2) 2,200,000 2,627,625 0.37
total for russia 0.37
hong KongHutchison Whampoa Europe Finance 12 co gtd SerEMTN 2.5% /2017 (Cayman Islands) (2) 2,100,000 2,210,182 0.31
total for hong Kong 0.31
BelgiumAnheuser-Busch InBev co gtd SerEMTN 1.25% /2017 (1) 2,000,000 2,026,469 0.29
total for Belgium 0.29
South KoreaExport-Import Bank of Korea sr unsecur SerEMTN 5.75% 22/05/2013 1,700,000 1,735,700 0.25
total for South Korea 0.25
mexicoAmerica Movil sr unsecur SerEMTN 4.125% /2019 1,425,000 1,635,757 0.23
total for mexico 0.23
finlandFortum sr nts SerEMTN 2.25% /2022 1,600,000 1,588,441 0.22
total for finland 0.22
israelTeva Pharmaceutical Finance IV co gtd SerEMTN 2.875% /2019 (Curacao) (2) 1,000,000 1,070,128 0.15
total for israel 0.15
PortugalEDP Finance sr unsecur SerEMTN 5.875% /2016 (Netherlands) (2) 500,000 531,352 0.08
total for Portugal 0.08
total for Corporate Bonds 54.68
Government Bonds
italyItaly Buoni Poliennali Del Tesoro sr unsecur 5.25% /2017 32,000,000 34,829,456 4.92Italy Buoni Poliennali Del Tesoro 4.25% /2015 21,000,000 21,922,719 3.10Italy Buoni Poliennali Del Tesoro 3% /2015 17,500,000 17,786,178 2.51Italy Buoni Poliennali Del Tesoro 6% /2031 15,000,000 16,737,202 2.36Italy Buoni Poliennali Del Tesoro sr unsecur 5% /2039 14,500,000 14,546,509 2.05
total for italy 14.94
franceGovernment of France OAT 5.5% /2029 20,000,000 27,782,600 3.92Government of France OAT 3.25% /2021 22,000,000 24,673,099 3.48French Treasury Note BTAN nts 2.5% /2015 5,000,000 5,246,423 0.74Government of France OAT 3.25% /2016 4,000,000 4,391,578 0.62French Treasury Note BTAN nts 1.75% /2017 3,800,000 3,996,678 0.57
total for france 9.33
GermanyBundesrepublik Deutschland 4.75% /2034 15,000,000 21,945,825 3.10Bundesrepublik Deutschland 4.25% /2039 9,300,000 13,315,959 1.88Bundesrepublik Deutschland 2.25% /2021 7,000,000 7,633,745 1.08Bundesrepublik Deutschland 6.5% /2027 1 1 0.00
total for Germany 6.06
netherlandsGovernment of Netherlands 3.25% /2021 12,500,000 14,440,650 2.04Government of Netherlands 4% /2037 3,000,000 3,990,522 0.56
total for netherlands 2.60
investments
nominal in euro unless
specifiedmarket
value% of net
assets
Corporate Bonds (continued)
Corporate Bonds (continued)
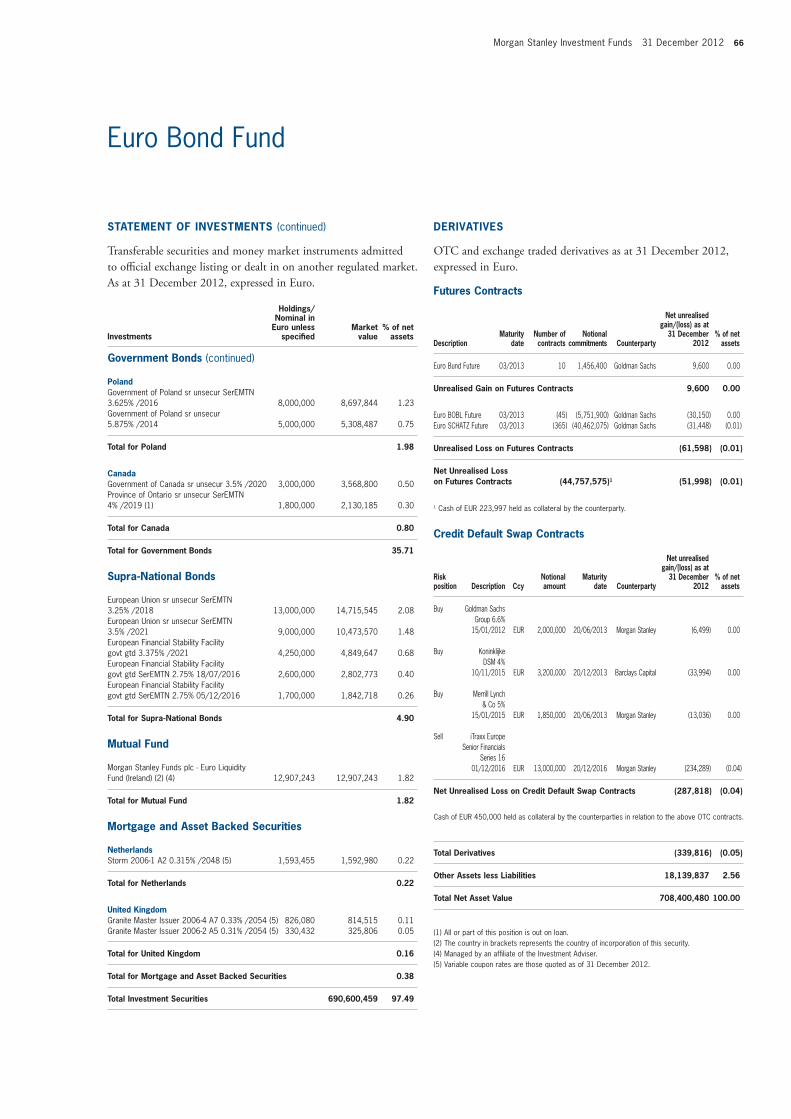
Morgan Stanley Investment Funds 31 December 2012 66
Euro Bond Fund
PolandGovernment of Poland sr unsecur SerEMTN 3.625% /2016 8,000,000 8,697,844 1.23Government of Poland sr unsecur 5.875% /2014 5,000,000 5,308,487 0.75
total for Poland 1.98
CanadaGovernment of Canada sr unsecur 3.5% /2020 3,000,000 3,568,800 0.50Province of Ontario sr unsecur SerEMTN 4% /2019 (1) 1,800,000 2,130,185 0.30
total for Canada 0.80
total for Government Bonds 35.71
Supra-national Bonds
European Union sr unsecur SerEMTN 3.25% /2018 13,000,000 14,715,545 2.08European Union sr unsecur SerEMTN 3.5% /2021 9,000,000 10,473,570 1.48European Financial Stability Facility govt gtd 3.375% /2021 4,250,000 4,849,647 0.68European Financial Stability Facility govt gtd SerEMTN 2.75% 18/07/2016 2,600,000 2,802,773 0.40European Financial Stability Facility govt gtd SerEMTN 2.75% 05/12/2016 1,700,000 1,842,718 0.26
total for Supra-national Bonds 4.90
mutual fund
Morgan Stanley Funds plc - Euro Liquidity Fund (Ireland) (2) (4) 12,907,243 12,907,243 1.82
total for mutual fund 1.82
mortgage and asset Backed Securities
netherlandsStorm 2006-1 A2 0.315% /2048 (5) 1,593,455 1,592,980 0.22
total for netherlands 0.22
United KingdomGranite Master Issuer 2006-4 A7 0.33% /2054 (5) 826,080 814,515 0.11Granite Master Issuer 2006-2 A5 0.31% /2054 (5) 330,432 325,806 0.05
total for United Kingdom 0.16
total for mortgage and asset Backed Securities 0.38
total investment Securities 690,600,459 97.49
DerivativeS
OtC and exchange traded derivatives as at 31 December 2012, expressed in euro.
futures Contracts
Descriptionmaturity
datenumber of contracts
notional commitments Counterparty
net unrealised gain/(loss) as at
31 December 2012
% of net assets
Euro Bund Future 03/2013 10 1,456,400 Goldman Sachs 9,600 0.00
Unrealised Gain on futures Contracts 9,600 0.00
Euro BOBL Future 03/2013 (45) (5,751,900) Goldman Sachs (30,150) 0.00Euro SCHATZ Future 03/2013 (365) (40,462,075) Goldman Sachs (31,448) (0.01)
Unrealised Loss on futures Contracts (61,598) (0.01)
net Unrealised Loss on futures Contracts (44,757,575)1 (51,998) (0.01)
1 Cash of EUR 223,997 held as collateral by the counterparty.
Credit Default Swap Contracts
risk position Description Ccy
notional amount
maturity date Counterparty
net unrealised gain/(loss) as at
31 December 2012
% of net assets
Buy Goldman Sachs Group 6.6% 15/01/2012 EUR 2,000,000 20/06/2013 Morgan Stanley (6,499) 0.00
Buy Koninklijke DSM 4% 10/11/2015 EUR 3,200,000 20/12/2013 Barclays Capital (33,994) 0.00
Buy Merrill Lynch & Co 5% 15/01/2015 EUR 1,850,000 20/06/2013 Morgan Stanley (13,036) 0.00
Sell iTraxx Europe Senior Financials Series 16 01/12/2016 EUR 13,000,000 20/12/2016 Morgan Stanley (234,289) (0.04)
net Unrealised Loss on Credit Default Swap Contracts (287,818) (0.04)
Cash of EUR 450,000 held as collateral by the counterparties in relation to the above OTC contracts.
total Derivatives (339,816) (0.05)
other assets less Liabilities 18,139,837 2.56
total net asset value 708,400,480 100.00
(1) All or part of this position is out on loan.(2) The country in brackets represents the country of incorporation of this security.(4) Managed by an affiliate of the Investment Adviser.(5) Variable coupon rates are those quoted as of 31 December 2012.
Statement of inveStmentS (continued)
transferable securities and money market instruments admitted to official exchange listing or dealt in on another regulated market. as at 31 December 2012, expressed in euro.
investments
holdings/nominal in
euro unless specified
market value
% of net assets
Government Bonds (continued)

67 Morgan Stanley Investment Funds 31 December 2012
Please refer to the full prospectus for the Fund’s investment objective and policy.
Euro Corporate Bond (ex Financials) Fund*
Corporate Bonds
france Veolia Environnement sr unsecur SerEMTN 6.75% /2019 (1) 1,600,000 2,036,062 1.82France Telecom sr unsecur SerEMTN 8.125% /2033 800,000 1,264,738 1.13GDF Suez sr unsecur SerEMTN 2.25% /2018 (1) 1,000,000 1,046,139 0.94Air Liquide sr unsecur SerEMTN 4.75% /2014 800,000 849,652 0.76Compagnie de Saint-Gobain sr unsecur SerEMTN 3.5% /2015 800,000 848,648 0.76Klepierre unsecur SerEMTN 2.75% /2019 (1) 800,000 815,538 0.73Edenred sr unsecur 3.625% /2017 650,000 704,850 0.63Eutelsat sr unsecur 4.125% /2017 600,000 667,727 0.60SA de Gestion des Stocks de Securite sr unsecur 1.75% /2019 600,000 613,884 0.55Schneider Electric sr unsecur SerEMTN 3.75% /2018 500,000 562,616 0.50Legrand sr unsecur 4.25% /2017 (1) 500,000 561,497 0.50Arkema sr unsecur 4% /2017 500,000 552,612 0.49Groupe Auchan sr unsecur SerEMTN 2.875% /2017 500,000 541,095 0.48Schneider Electric sr unsecur SerEMTN 2.875% /2016 500,000 535,020 0.48Michelin Luxembourg co gtd SerEMTN 2.75% /2019 (Luxembourg) (2) 500,000 526,603 0.47Sanofi sr unsecur SerEMTN 4.5% /2016 (1) 450,000 507,358 0.45HIT Finance co gtd 5.75% /2018 (Netherlands) (2) 400,000 446,225 0.40Areva sr unsecur SerEMTN 4.625% /2017 400,000 437,373 0.39Christian Dior sr unsecur 4% /2016 400,000 426,592 0.38Foncière des Regions sr unsecur 3.875% /2018 400,000 424,127 0.38Electricité de France unsecur SerEMTN 2.75% /2023 400,000 407,109 0.36Unibail-Rodamco sr unsecur SerEMTN 1.625% /2017 400,000 404,582 0.36LVMH Moet Hennessy Louis Vuitton sr unsecur SerEMTN 4% /2018 300,000 343,970 0.31Societe Des Autoroutes Paris-Rhin-Rhone sr unsecur SerEMTN 5% /2017 300,000 336,527 0.30Vinci sr unsecur SerEMTN 4.125% /2017 300,000 335,129 0.30Mercialys sr unsecur 4.125% /2019 300,000 330,773 0.30Arkema sr unsecur 3.85% /2020 300,000 326,820 0.29Alstom sr unsecur SerEMTN 2.25% /2017 300,000 305,989 0.27Carrefour sr unsecur SerEMTN 1.875% /2017 300,000 300,517 0.27Sodexo sr unsecur 6.25% /2015 (1) 250,000 277,814 0.25Alstom sr unsecur 4.125% /2017 250,000 274,259 0.25Cie Financiere et Industrielle des Autoroutes sr unsecur 5.875% /2016 200,000 235,105 0.21Societe Des Autoroutes Paris-Rhin-Rhone sr unsecur 5.125% /2018 200,000 229,227 0.21Lafarge sr unsecur SerEMTN 6.75% /2019 200,000 226,265 0.20Eutelsat sr unsecur 4.125% /2017 200,000 222,576 0.20Compagnie Generale des Etablissements Michelin sr unsecur CV 0% /2017 168,600 221,557 0.20Legrand sr unsecur SerEMTN 3.375% /2022 200,000 218,805 0.20Alstom sr unsecur SerEMTN 3.875% /2016 200,000 215,180 0.19Societe Fonciere Lyonnaise sr unsecur 3.5% /2017 200,000 206,942 0.18Air Liquide Finance co gtd SerEMTN 2.125% /2021 200,000 202,524 0.18Eutelsat sr unsecur 5% /2019 100,000 117,596 0.11Legrand sr unsecur SerEMTN 4.375% /2018 100,000 114,965 0.10Alstom sr unsecur SerEMTN 3.875% /2016 100,000 107,590 0.10Areva sr unsecur SerEMTN 3.875% /2016 100,000 106,004 0.09
total for france 18.27
inveStment aim
To provide an attractive rate of return, measured in Euro, by investing primarily in Euro-denominated fixed income securities of high quality issued by corporations and non-government related issuers excluding issuers in the financial industry.
Statement of inveStmentS
transferable securities and money market instruments admitted to official exchange listing or dealt in on another regulated market. as at 31 December 2012, expressed in euro.
investments
nominal in euro unless
specifiedmarket
value% of net
assets
* Name changed from Global Strategic Bond Fund on 1 March 2012.
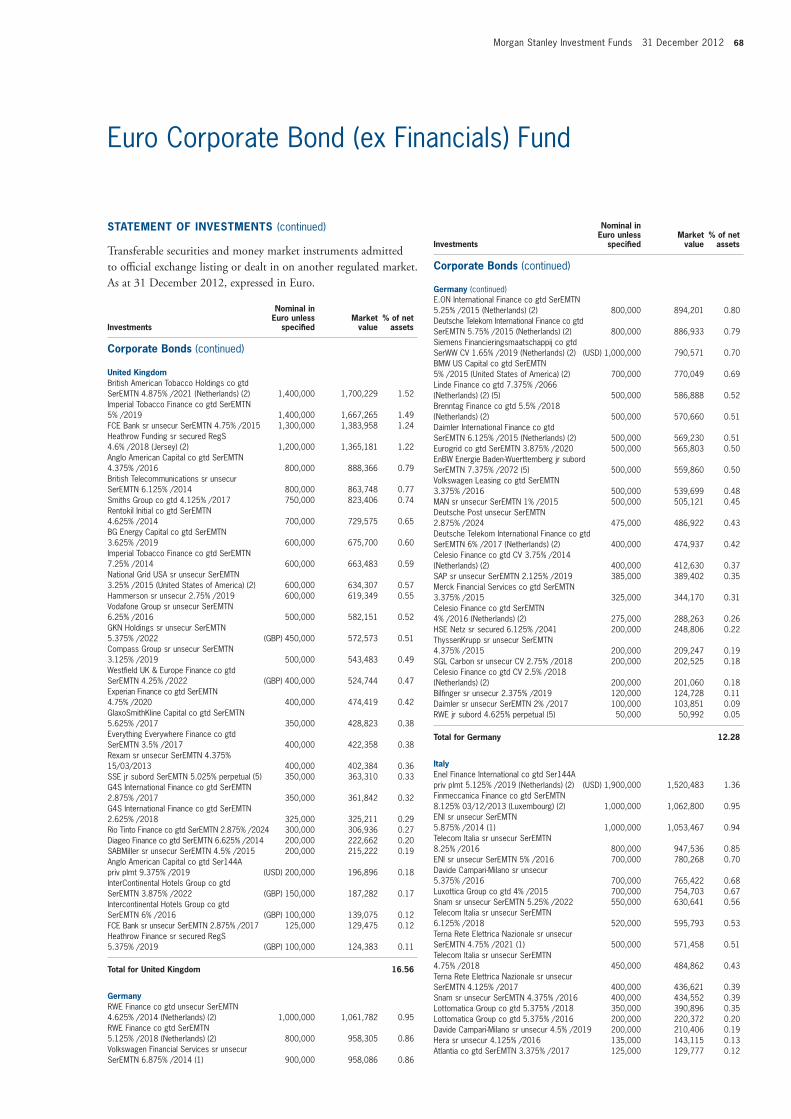
Morgan Stanley Investment Funds 31 December 2012 68
Euro Corporate Bond (ex Financials) Fund
investments
nominal in euro unless
specifiedmarket
value% of net
assets
E.ON International Finance co gtd SerEMTN 5.25% /2015 (Netherlands) (2) 800,000 894,201 0.80Deutsche Telekom International Finance co gtd SerEMTN 5.75% /2015 (Netherlands) (2) 800,000 886,933 0.79Siemens Financieringsmaatschappij co gtd SerWW CV 1.65% /2019 (Netherlands) (2) (USD) 1,000,000 790,571 0.70BMW US Capital co gtd SerEMTN 5% /2015 (United States of America) (2) 700,000 770,049 0.69Linde Finance co gtd 7.375% /2066 (Netherlands) (2) (5) 500,000 586,888 0.52Brenntag Finance co gtd 5.5% /2018 (Netherlands) (2) 500,000 570,660 0.51Daimler International Finance co gtd SerEMTN 6.125% /2015 (Netherlands) (2) 500,000 569,230 0.51Eurogrid co gtd SerEMTN 3.875% /2020 500,000 565,803 0.50EnBW Energie Baden-Wuerttemberg jr subord SerEMTN 7.375% /2072 (5) 500,000 559,860 0.50Volkswagen Leasing co gtd SerEMTN 3.375% /2016 500,000 539,699 0.48MAN sr unsecur SerEMTN 1% /2015 500,000 505,121 0.45Deutsche Post unsecur SerEMTN 2.875% /2024 475,000 486,922 0.43Deutsche Telekom International Finance co gtd SerEMTN 6% /2017 (Netherlands) (2) 400,000 474,937 0.42Celesio Finance co gtd CV 3.75% /2014 (Netherlands) (2) 400,000 412,630 0.37SAP sr unsecur SerEMTN 2.125% /2019 385,000 389,402 0.35Merck Financial Services co gtd SerEMTN 3.375% /2015 325,000 344,170 0.31Celesio Finance co gtd SerEMTN 4% /2016 (Netherlands) (2) 275,000 288,263 0.26HSE Netz sr secured 6.125% /2041 200,000 248,806 0.22ThyssenKrupp sr unsecur SerEMTN 4.375% /2015 200,000 209,247 0.19SGL Carbon sr unsecur CV 2.75% /2018 200,000 202,525 0.18Celesio Finance co gtd CV 2.5% /2018 (Netherlands) (2) 200,000 201,060 0.18Bilfinger sr unsecur 2.375% /2019 120,000 124,728 0.11Daimler sr unsecur SerEMTN 2% /2017 100,000 103,851 0.09RWE jr subord 4.625% perpetual (5) 50,000 50,992 0.05
total for Germany 12.28
italy Enel Finance International co gtd Ser144A priv plmt 5.125% /2019 (Netherlands) (2) (USD) 1,900,000 1,520,483 1.36Finmeccanica Finance co gtd SerEMTN 8.125% 03/12/2013 (Luxembourg) (2) 1,000,000 1,062,800 0.95ENI sr unsecur SerEMTN 5.875% /2014 (1) 1,000,000 1,053,467 0.94Telecom Italia sr unsecur SerEMTN 8.25% /2016 800,000 947,536 0.85ENI sr unsecur SerEMTN 5% /2016 700,000 780,268 0.70Davide Campari-Milano sr unsecur 5.375% /2016 700,000 765,422 0.68Luxottica Group co gtd 4% /2015 700,000 754,703 0.67Snam sr unsecur SerEMTN 5.25% /2022 550,000 630,641 0.56Telecom Italia sr unsecur SerEMTN 6.125% /2018 520,000 595,793 0.53Terna Rete Elettrica Nazionale sr unsecur SerEMTN 4.75% /2021 (1) 500,000 571,458 0.51Telecom Italia sr unsecur SerEMTN 4.75% /2018 450,000 484,862 0.43Terna Rete Elettrica Nazionale sr unsecur SerEMTN 4.125% /2017 400,000 436,621 0.39Snam sr unsecur SerEMTN 4.375% /2016 400,000 434,552 0.39Lottomatica Group co gtd 5.375% /2018 350,000 390,896 0.35Lottomatica Group co gtd 5.375% /2016 200,000 220,372 0.20Davide Campari-Milano sr unsecur 4.5% /2019 200,000 210,406 0.19Hera sr unsecur 4.125% /2016 135,000 143,115 0.13Atlantia co gtd SerEMTN 3.375% /2017 125,000 129,777 0.12
Statement of inveStmentS (continued)
transferable securities and money market instruments admitted to official exchange listing or dealt in on another regulated market. as at 31 December 2012, expressed in euro.
investments
nominal in euro unless
specifiedmarket
value% of net
assets
United Kingdom British American Tobacco Holdings co gtd SerEMTN 4.875% /2021 (Netherlands) (2) 1,400,000 1,700,229 1.52Imperial Tobacco Finance co gtd SerEMTN 5% /2019 1,400,000 1,667,265 1.49FCE Bank sr unsecur SerEMTN 4.75% /2015 1,300,000 1,383,958 1.24Heathrow Funding sr secured RegS 4.6% /2018 (Jersey) (2) 1,200,000 1,365,181 1.22Anglo American Capital co gtd SerEMTN 4.375% /2016 800,000 888,366 0.79British Telecommunications sr unsecur SerEMTN 6.125% /2014 800,000 863,748 0.77Smiths Group co gtd 4.125% /2017 750,000 823,406 0.74Rentokil Initial co gtd SerEMTN 4.625% /2014 700,000 729,575 0.65BG Energy Capital co gtd SerEMTN 3.625% /2019 600,000 675,700 0.60Imperial Tobacco Finance co gtd SerEMTN 7.25% /2014 600,000 663,483 0.59National Grid USA sr unsecur SerEMTN 3.25% /2015 (United States of America) (2) 600,000 634,307 0.57Hammerson sr unsecur 2.75% /2019 600,000 619,349 0.55Vodafone Group sr unsecur SerEMTN 6.25% /2016 500,000 582,151 0.52GKN Holdings sr unsecur SerEMTN 5.375% /2022 (GBP) 450,000 572,573 0.51Compass Group sr unsecur SerEMTN 3.125% /2019 500,000 543,483 0.49Westfield UK & Europe Finance co gtd SerEMTN 4.25% /2022 (GBP) 400,000 524,744 0.47Experian Finance co gtd SerEMTN 4.75% /2020 400,000 474,419 0.42GlaxoSmithKline Capital co gtd SerEMTN 5.625% /2017 350,000 428,823 0.38Everything Everywhere Finance co gtd SerEMTN 3.5% /2017 400,000 422,358 0.38Rexam sr unsecur SerEMTN 4.375% 15/03/2013 400,000 402,384 0.36SSE jr subord SerEMTN 5.025% perpetual (5) 350,000 363,310 0.33G4S International Finance co gtd SerEMTN 2.875% /2017 350,000 361,842 0.32G4S International Finance co gtd SerEMTN 2.625% /2018 325,000 325,211 0.29Rio Tinto Finance co gtd SerEMTN 2.875% /2024 300,000 306,936 0.27Diageo Finance co gtd SerEMTN 6.625% /2014 200,000 222,662 0.20SABMiller sr unsecur SerEMTN 4.5% /2015 200,000 215,222 0.19Anglo American Capital co gtd Ser144A priv plmt 9.375% /2019 (USD) 200,000 196,896 0.18InterContinental Hotels Group co gtd SerEMTN 3.875% /2022 (GBP) 150,000 187,282 0.17Intercontinental Hotels Group co gtd SerEMTN 6% /2016 (GBP) 100,000 139,075 0.12FCE Bank sr unsecur SerEMTN 2.875% /2017 125,000 129,475 0.12Heathrow Finance sr secured RegS 5.375% /2019 (GBP) 100,000 124,383 0.11
total for United Kingdom 16.56
Germany RWE Finance co gtd unsecur SerEMTN 4.625% /2014 (Netherlands) (2) 1,000,000 1,061,782 0.95RWE Finance co gtd SerEMTN 5.125% /2018 (Netherlands) (2) 800,000 958,305 0.86Volkswagen Financial Services sr unsecur SerEMTN 6.875% /2014 (1) 900,000 958,086 0.86
Corporate Bonds (continued)
Corporate Bonds (continued)
Germany (continued)

69 Morgan Stanley Investment Funds 31 December 2012
Euro Corporate Bond (ex Financials) Fund
Snam sr unsecur SerEMTN 5% /2019 100,000 113,417 0.10Atlantia co gtd SerEMTN 5% /2014 100,000 105,457 0.09
total for italy 10.14
Spain Telefonica Emisiones co gtd SerEMTN 4.967% /2016 1,500,000 1,621,541 1.45Gas Natural Capital Markets co gtd SerEMTN 5.25% /2014 (1) 1,200,000 1,267,161 1.13Gas Natural Capital Markets co gtd SerEMTN 4.125% /2018 800,000 849,467 0.76Amadeus Capital Markets co gtd SerEMTN 4.875% /2016 700,000 767,181 0.68Gas Natural Capital Markets co gtd SerEMTN 5% /2018 600,000 661,344 0.59Telefonica Emisiones co gtd SerEMTN 4.71% /2020 500,000 543,982 0.49Iberdrola Finanzas co gtd SerEMTN 4.75% /2016 500,000 539,966 0.48Repsol International Finance co gtd SerEMTN 4.375% /2018 (Netherlands) (2) 500,000 538,112 0.48Repsol International Finance co gtd SerEMTN 4.25% /2016 (Netherlands) (1) (2) 500,000 533,428 0.48Red Electrica Financiaciones co gtd 3.5% /2016 500,000 522,129 0.47Telefonica Emisiones co gtd SerEMTN 4.674% /2014 500,000 516,500 0.46Iberdrola Finanzas co gtd SerEMTN 4.625% /2017 400,000 436,593 0.39Telefonica Emisiones co gtd SerEMTN 4.797% /2018 300,000 328,581 0.29
total for Spain 8.15
netherlands BASF Finance Europe co gtd SerEMTN 5.125% /2015 800,000 888,413 0.79RWE Finance co gtd SerEMTN 6.5% /2021 (1) 600,000 810,724 0.72Koninklijke KPN sr unsecur 6.5% /2016 700,000 800,346 0.72Shell International Finance co gtd SerEMTN 4.5% /2016 500,000 560,605 0.50Paccar Financial Europe sr unsecur SerEMTN 1.375% /2015 550,000 558,616 0.50Nederlandse Gasunie sr unsecur SerEMTN 2.625% /2022 500,000 524,554 0.47ABB Finance co gtd SerEMTN 2.625% /2019 400,000 424,526 0.38TenneT Holding subord 6.655% perpetual (5) 350,000 378,137 0.34BMW Finance co gtd SerEMTN 2.125% /2015 350,000 360,385 0.32Nederlandse Gasunie sr unsecur SerEMTN 0.875% /2015 350,000 352,508 0.31Enel Finance International co gtd SerEMTN 4.875% /2020 310,000 334,803 0.30Siemens Financieringsmaatschappij co gtd 5.25% /2066 (5) 300,000 333,829 0.30Schlumberger Finance co gtd SerEMTN 2.75% /2015 225,000 239,155 0.21Alliander subord 4.875% perpetual (5) 200,000 213,054 0.19Linde Finance co gtd SerEMTN 1.75% /2019 200,000 205,149 0.18Enexis Holding sr unsecur SerEMTN 1.875% /2020 175,000 175,542 0.16
total for netherlands 6.39
Statement of inveStmentS (continued)
transferable securities and money market instruments admitted to official exchange listing or dealt in on another regulated market. as at 31 December 2012, expressed in euro.
investments
nominal in euro unless
specifiedmarket
value% of net
assets
investments
nominal in euro unless
specifiedmarket
value% of net
assets
United States of america Procter & Gamble sr unsecur 4.875% /2027 900,000 1,156,655 1.03Philip Morris International sr unsecur 2.875% /2024 900,000 937,912 0.84CRH Finance co gtd SerEMTN 7.375% /2014 (Ireland) (1) (2) 700,000 763,130 0.68Pfizer sr unsecur SerINTL 4.55% /2017 500,000 578,018 0.52Caterpillar International Finance co gtd SerEMTN 1.375% /2015 (Ireland) (2) 500,000 508,291 0.45Procter & Gamble sr unsecur RegS 2% /2022 400,000 401,780 0.36AT&T sr unsecur 3.55% /2032 350,000 366,012 0.33Coca-Cola Enterprises sr unsecur 2% /2019 350,000 355,892 0.32Philip Morris International sr unsecur SerEMTN 5.75% /2016 300,000 347,120 0.31Paccar Financial Europe sr unsecur SerEMTN 3% /2014 (Netherlands) (2) 150,000 154,663 0.14
total for United States of america 4.98
Denmark AP Moeller - Maersk sr unsecur SerEMTN 3.375% /2019 1,000,000 1,051,175 0.94TDC sr unsecur RegS 3.5% /2015 800,000 844,895 0.75TDC sr unsecur SerEMTN 3.75% /2022 700,000 770,004 0.69Carlsberg Breweries sr unsecur SerEMTN 2.625% /2022 375,000 375,953 0.34DONG Energy jr subord 7.75% /3010 (5) 300,000 336,450 0.30Carlsberg Breweries sr unsecur SerEMTN 6% /2014 300,000 322,348 0.29
total for Denmark 3.31
Sweden TeliaSonera sr unsecur SerEMTN 3.625% /2024 600,000 665,769 0.59Securitas sr unsecur SerEMTN 2.75% /2017 500,000 518,417 0.46Securitas sr unsecur SerEMTN 2.25% /2018 350,000 352,509 0.31Scania co gtd SerEMTN 1.75% /2016 300,000 308,265 0.28TeliaSonera sr unsecur SerEMTN 4.25% /2020 150,000 175,987 0.16
total for Sweden 1.80
australia Wesfarmers sr unsecur SerEMTN 2.75% /2022 700,000 718,149 0.64Origin Energy Finance co gtd SerEMTN 7.875% /2071 (5) 500,000 528,593 0.47BHP Billiton Finance co gtd SerEMTN 2.25% /2020 425,000 438,055 0.39Origin Energy Finance co gtd SerEMTN 2.875% /2019 100,000 103,984 0.10
total for australia 1.60
Switzerland Roche Finance Europe co gtd SerEMTN 2% /2018 (Netherlands) (2) 600,000 630,941 0.56Nestle Finance International co gtd SerEMTN 1.75% /2022 (Luxembourg) (2) 550,000 545,461 0.49Holcim Finance Luxembourg co gtd SerEMTN 4.375% /2014 (Luxembourg) (2) 500,000 532,791 0.48Roche Holdings co gtd SerEMTN 5.625% /2016 (United States of America) (2) 58,000 67,097 0.06
total for Switzerland 1.59
Canada Xstrata Canada Financial co gtd SerEMTN 6.25% /2015 1,000,000 1,117,469 1.00Xstrata Finance Canada co gtd SerEMTN 5.25% /2017 400,000 458,020 0.41
total for Canada 1.41
Corporate Bonds (continued)
italy (continued)
Corporate Bonds (continued)

Morgan Stanley Investment Funds 31 December 2012 70
Euro Corporate Bond (ex Financials) Fund
Belgium Barry Callebaut Services co gtd 5.375% /2021 500,000 567,310 0.50Anheuser-Busch InBev co gtd SerEMTN 8.625% /2017 400,000 522,473 0.47Anheuser-Busch InBev co gtd SerEMTN 4% /2018 300,000 342,347 0.31
total for Belgium 1.28
mexico America Movil sr unsecur SerEMTN 4.125% /2019 1,200,000 1,377,480 1.23
total for mexico 1.23
norway Telenor sr unsecur SerEMTN 1.75% /2018 700,000 719,760 0.64Statkraft nts SerEMTN 2.5% /2022 350,000 353,982 0.32Statoil co gtd SerEMTN 5.625% /2021 200,000 260,969 0.23
total for norway 1.19
ireland WPP Finance co gtd 5.25% /2015 (France) (2) 1,000,000 1,087,264 0.97Bord Gais Eireann sr unsecur SerEMTN 3.625% /2017 100,000 105,577 0.10
total for ireland 1.07
United arab emirates IPIC GMTN co gtd RegS 5.875% /2021 (Cayman Islands) (2) 500,000 611,379 0.55Abu Dhabi National Energy sr unsecur RegS 3.625% /2023 (USD) 250,000 194,890 0.17IPIC GMTN co gtd RegS 2.375% /2018 (Cayman Islands) (2) 150,000 154,125 0.14Xstrata Finance Dubai co gtd SerEMTN 2.375% /2018 125,000 125,669 0.11
total for United arab emirates 0.97
Luxembourg ArcelorMittal sr unsecur 9.375% /2016 (1) 600,000 729,057 0.65ArcelorMittal sr unsecur CV 7.25% /2014 862,400 191,185 0.17
total for Luxembourg 0.82
Brazil Petrobras International Finance co gtd SerEMTN 4.875% /2018 (Cayman Islands) (2) 700,000 782,163 0.70
total for Brazil 0.70
Czech republic CEZ sr unsecur 3.625% /2016 700,000 764,590 0.68
total for Czech republic 0.68
Statement of inveStmentS (continued)
transferable securities and money market instruments admitted to official exchange listing or dealt in on another regulated market. as at 31 December 2012, expressed in euro.
investments
nominal in euro unless
specifiedmarket
value% of net
assets
israel Teva Pharmaceutical Finance IV co gtd SerEMTN 2.875% /2019 (Curacao) (2) 500,000 535,064 0.48
total for israel 0.48
finland Fingrid sr unsecur SerEMTN 3.5% /2024 450,000 484,974 0.43
total for finland 0.43
Portugal EDP Finance sr unsecur SerEMTN 5.75% /2017 (Netherlands) (2) 250,000 268,189 0.24
total for Portugal 0.24
Qatar Qtel International Finance co gtd RegS 3.25% /2023 (Bermuda) (2) (USD) 200,000 151,504 0.14
total for Qatar 0.14
total for Corporate Bonds 95.71
mutual fund
Morgan Stanley Funds plc - Euro Liquidity Fund (Ireland) (2) (4) 1,500,948 1,500,948 1.34
total for mutual fund 1.34
total investment Securities 108,629,779 97.05
DerivativeS
OtC and exchange traded derivatives as at 31 December 2012, expressed in euro.
futures Contracts
Descriptionmaturity
datenumber of contracts
notional commitments Counterparty
net unrealised gain/(loss) as at
31 December 2012
% of net assets
Euro Bund Future 03/2013 25 3,641,000 Goldman Sachs 32,440 0.03US 5yr T-note Future 03/2013 1 94,062 Goldman Sachs 42 0.00US 10yr T-note Future 03/2013 (26) (2,610,341) Goldman Sachs 4,470 0.00
Unrealised Gain on futures Contracts 36,952 0.03
Euro BOBL Future 03/2013 (80) (10,225,600) Goldman Sachs (55,600) (0.05)Euro SCHATZ Future 03/2013 (37) (4,101,634) Goldman Sachs (3,588) 0.00Long Gilt Future 03/2013 (2) (292,359) Goldman Sachs (403) 0.00US 2yr T-note Future 03/2013 (1) (166,790) Goldman Sachs (95) 0.00
Unrealised Loss on futures Contracts (59,686) (0.05)
net Unrealised Loss on futures Contracts (13,661,662)1 (22,734) (0.02)
1 Cash of EUR 166,986 held as collateral by the counterparty.
Corporate Bonds (continued)
Corporate Bonds (continued)
investments
holdings/nominal in
euro unless specified
market value
% of net assets

71 Morgan Stanley Investment Funds 31 December 2012
Euro Corporate Bond (ex Financials) Fund
forward foreign Currency exchange Contracts
maturity date
amount bought Ccy
amount sold Ccy Counterparty
Unrealised gain/(loss)
eUr% of net
assets
16/01/2013 2,603,519 EUR 3,405,000 USD Westpac Bank 28,071 0.03 17/01/2013 124,333 EUR 100,000 GBP J.P. Morgan 1,433 0.00 17/01/2013 1,397,971 EUR 1,135,000 GBP RBC 3,048 0.00
net Unrealised Gain on forward foreign Currency exchange Contracts 32,552 0.03
total Derivatives 9,818 0.01
other assets less Liabilities 3,294,063 2.94
total net asset value 111,933,660 100.00
(1) All or part of this position is out on loan. (2) The country in brackets represents the country of incorporation of this security. (4) Managed by an affiliate of the Investment Adviser. (5) Variable coupon rates are those quoted as of 31 December 2012.
DerivativeS (continued)
OtC and exchange traded derivatives as at 31 December 2012, expressed in euro.

Morgan Stanley Investment Funds 31 December 2012 72
Please refer to the full prospectus for the Fund’s investment objective and policy.
Euro Corporate Bond Fund
inveStment aim
To provide an attractive rate of return, measured in Euro, primarily through investment in Euro-denominated fixed income securities of high quality issued by corporations and non-government related issuers.
Statement of inveStmentS
transferable securities and money market instruments admitted to official exchange listing or dealt in on another regulated market. as at 31 December 2012, expressed in euro.
investments
nominal in euro unless
specifiedmarket
value% of net
assets Corporate Bonds
franceSociété Générale sr unsecur Ser144A priv plmt 5.2% /2021 (USD) 26,000,000 21,767,991 1.37HIT Finance co gtd 5.75% /2018 (Netherlands) (2) 13,200,000 14,725,412 0.93BNP Paribas bnk gtd SerBKNT 5% /2021 (USD) 16,000,000 13,672,071 0.86Edenred sr unsecur 3.625% /2017 11,000,000 11,928,224 0.75BPCE sr unsecur SerEMTN 2% /2018 10,700,000 10,912,213 0.69Societe Des Autoroutes Paris-Rhin-Rhone sr unsecur SerEMTN 5% /2017 (1) 9,500,000 10,656,691 0.67Christian Dior sr unsecur 4% /2016 9,000,000 9,598,320 0.60Credit Mutuel Arkea sr unsecur SerEMTN 0.59% /2014 (5) 8,825,000 8,836,075 0.56Groupama subord 7.875% /2039 (5) 9,800,000 8,396,150 0.53Société Générale jr subord 9.375% perpetual (1) (5) 7,250,000 8,138,560 0.51Societe Fonciere Lyonnaise sr unsecur 4.625% /2016 7,000,000 7,510,577 0.47SA de Gestion des Stocks de Securite sr unsecur 1.75% /2019 7,300,000 7,468,922 0.47Crédit Agricole jr subord Ser144A priv plmt 8.375% perpetual (5) (USD) 9,030,000 7,283,197 0.46Crédit Agricole unsecur Ser144A priv plmt 3% /2017 (USD) 8,720,000 6,762,844 0.42Danone sr unsecur SerEMTN 1.125% /2017 6,000,000 6,033,021 0.38Veolia Environnement sr unsecur SerEMTN 6.75% /2019 4,575,000 5,821,864 0.37BNP Paribas sr unsecur SerEMTN 2.5% /2019 5,000,000 5,206,680 0.33Electricité de France unsecur SerEMTN 2.75% /2023 5,100,000 5,190,635 0.33Credit Agricole subord SerEMTN 3.9% /2021 (1) 5,000,000 5,066,880 0.32Areva sr unsecur SerEMTN 4.625% /2017 (1) 4,600,000 5,029,789 0.32Unibail-Rodamco sr unsecur SerEMTN 1.625% /2017 (1) 4,875,000 4,930,841 0.31AXA subord SerEMTN 5.25% /2040 (5) 4,700,000 4,921,483 0.31BPCE nts SerEMTN 0.640% /2014 (5) 4,700,000 4,702,702 0.30Crédit Agricole subord SerEMTN 5.875% /2019 (1) 4,000,000 4,580,174 0.29RCI Banque sr unsecur SerEMTN 5.625% /2015 (1) 4,000,000 4,347,734 0.27Foncière des Regions sr unsecur 3.875% /2018 (1) 4,000,000 4,241,266 0.27Gecina sr unsecur SerEMTN 4.25% /2016 3,800,000 4,095,412 0.26Carrefour sr unsecur SerEMTN 1.875% /2017 3,800,000 3,806,555 0.24Mercialys sr unsecur 4.125% /2019 (1) 3,000,000 3,307,732 0.21Arkema sr unsecur 3.85% /2020 3,000,000 3,268,200 0.20Compagnie Generale des Etablissements Michelin sr unsecur CV 0% /2017 2,383,201 3,131,753 0.20RCI Banque sr unsecur SerEMTN 4% 11/07/2013 3,050,000 3,096,436 0.19Alstom sr unsecur SerEMTN 2.25% /2017 3,000,000 3,059,895 0.19Galeries Lafayette sr unsecur 4.5% /2017 (1) 2,700,000 2,890,471 0.18Air Liquide Finance co gtd SerEMTN 2.125% /2021 2,800,000 2,835,343 0.18Crédit Agricole jr subord 9.75% perpetual (1) (USD) 3,500,000 2,811,308 0.18Société Générale jr subord 6.999% perpetual (1) (5) 2,550,000 2,557,714 0.15Klepierre unsecur SerEMTN 2.75% /2019 2,400,000 2,446,615 0.15Michelin Luxembourg co gtd SerEMTN 2.75% /2019 (Luxembourg) (2) 2,200,000 2,317,051 0.14Crédit Agricole sr unsecur SerEMTN 3.875% /2019 (1) 2,000,000 2,229,821 0.14Legrand sr unsecur SerEMTN 3.375% /2022 2,000,000 2,188,050 0.14Lafarge sr unsecur SerEMTN 6.625% /2018 (1) 1,800,000 2,034,171 0.13

73 Morgan Stanley Investment Funds 31 December 2012
Euro Corporate Bond Fund
investments
nominal in euro unless
specifiedmarket
value% of net
assets
Statement of inveStmentS (continued)
transferable securities and money market instruments admitted to official exchange listing or dealt in on another regulated market. as at 31 December 2012, expressed in euro.
investments
nominal in euro unless
specifiedmarket
value% of net
assets
Legrand sr unsecur 4.25% /2017 1,500,000 1,684,493 0.11France Telecom sr unsecur SerEMTN 8.125% /2033 1,000,000 1,580,922 0.10AXA jr subord SerEMTN 6.211% perpetual (1) (5) 1,600,000 1,569,589 0.10BNP Paribas jr subord 8.667% perpetual (1) (5) 1,500,000 1,538,527 0.10Societe Fonciere Lyonnaise sr unsecur 3.5% /2017 1,400,000 1,448,597 0.09Credit Agricole jr subord 7.875% perpetual (5) 1,300,000 1,371,760 0.09Areva sr unsecur SerEMTN 3.875% /2016 (1) 1,100,000 1,166,039 0.07Electricité de France sr unsecur SerEMTN 4.5% /2040 (1) 1,000,000 1,140,970 0.07Legrand sr unsecur 4.25% /2017 500,000 561,498 0.03
total for france 16.73
United KingdomLloyds TSB Bank subord SerEMTN 6.5% /2020 (1) 13,000,000 14,884,838 0.94Royal Bank of Scotland sr unsecur SerEMTN 5.5% /2020 11,070,000 13,384,953 0.84Barclays Bank subord SerEMTN 6% /2021 9,700,000 11,008,481 0.69Nationwide Building Society sr unsecur Ser144A priv plmt 6.25% /2020 (USD) 11,565,000 10,392,350 0.65Abbey National Treasury Services bnk gtd SerEMTN 3.375% /2015 9,000,000 9,567,868 0.60Co-operative Bank sr unsecur SerEMTN 2.375% /2015 8,800,000 8,823,720 0.56Smiths Group co gtd 4.125% /2017 8,000,000 8,783,000 0.55British American Tobacco Holdings The Netherlands co gtd SerEMTN 2.375% /2023 (Netherlands) (2) 7,725,000 7,736,325 0.49GKN Holdings sr unsecur SerEMTN 5.375% /2022 (GBP) 5,450,000 6,934,490 0.44Royal Bank of Scotland subord SerEMTN 10.5% /2022 (1) (5) 5,500,000 6,762,869 0.43Heathrow Funding sr secured SerEMTN 6.75% /2026 (Jersey) (2) (GBP) 4,050,000 6,544,078 0.41Standard Chartered sr unsecur SerEMTN 1.75% /2017 6,225,000 6,353,092 0.40Imperial Tobacco Finance co gtd SerEMTN 4.5% /2018 5,500,000 6,294,599 0.40National Express Group co gtd SerEMTN 6.25% /2017 (GBP) 4,400,000 6,020,934 0.38Nationwide Building Society subord SerEMTN 6.75% /2020 5,000,000 5,870,098 0.37Aviva subord SerEMTN 6.875% /2038 (1) (5) 5,200,000 5,690,204 0.36G4S International Finance co gtd SerEMTN 2.625% /2018 5,600,000 5,603,640 0.35Rentokil Initial co gtd SerEMTN 4.625% /2014 5,175,000 5,393,644 0.34SABMiller Holdings co gtd SerEMTN 1.875% /2020 (United States of America) (2) 5,000,000 5,010,175 0.32Aviva subord 5.25% /2023 (5) 4,900,000 4,961,005 0.31Experian Finance co gtd SerEMTN 4.75% /2020 4,000,000 4,744,186 0.30Prudential jr subord SerEMTN 11.75% perpetual (1) (5) (USD) 4,600,000 4,046,596 0.25Rio Tinto Finance co gtd SerEMTN 2.875% /2024 3,900,000 3,990,168 0.25Compass Group sr unsecur SerEMTN 3.125% /2019 3,450,000 3,750,033 0.24BAT International Finance co gtd SerEMTN 3.625% /2021 3,350,000 3,740,293 0.23Standard Chartered subord nts SerEMTN 3.625% /2022 (1) 3,600,000 3,692,983 0.23
Imperial Tobacco Finance co gtd SerEMTN 7.25% /2014 3,000,000 3,317,413 0.21Everything Everywhere Finance co gtd SerEMTN 3.5% /2017 3,000,000 3,167,688 0.20Heathrow Funding secured SerEMTN 6.25% /2018 (Jersey) (1) (2) (GBP) 2,250,000 3,142,303 0.20Coventry Building Society sr unsecur SerEMTN 2.25% /2017 3,000,000 3,062,025 0.19LBG Capital No.2 bnk gtd 15% /2019 (1) 2,000,000 2,827,000 0.18Westfield UK & Europe Finance co gtd SerEMTN 4.25% /2022 (GBP) 2,150,000 2,820,499 0.18HSBC Holdings subord 3.625% /2020 (5) 2,498,000 2,584,945 0.16ICAP Group Holdings sr unsecur SerGMTN 7.5% /2014 (1) 2,400,000 2,553,444 0.16InterContinental Hotels Group co gtd SerEMTN 3.875% /2022 (GBP) 1,900,000 2,372,234 0.15HBOS subord SerEMTN 4.5% /2030 (5) 2,830,000 2,364,875 0.15Anglo American Capital co gtd Ser144A priv plmt 9.375% /2019 (USD) 2,390,000 2,352,915 0.15WPP 2008 co gtd SerEMTN 6.625% /2016 2,000,000 2,341,336 0.15FCE Bank sr unsecur SerEMTN 7.125% 15/01/2013 2,300,000 2,305,462 0.15Standard Chartered sr unsecur SerEMTN 4.125% /2019 2,000,000 2,293,567 0.14G4S International Finance co gtd SerEMTN 2.875% /2017 2,200,000 2,274,438 0.14Nationwide Building Society sr unsecur SerEMTN 3.75% /2015 2,000,000 2,116,550 0.13Heathrow Funding sr secured Ser144A priv plmt 4.6% /2018 (Jersey) (2) 1,750,000 1,992,417 0.13Intercontinental Hotels Group co gtd SerEMTN 6% /2016 (GBP) 1,267,000 1,762,086 0.11BP Capital Markets co gtd SerEMTN 2.994% /2019 1,500,000 1,629,815 0.10FCE Bank sr unsecur SerEMTN 2.875% /2017 (1) 1,450,000 1,501,916 0.09Barclays Bank jr subord SerRCI 14% perpetual (5) (GBP) 900,000 1,480,112 0.09Standard Chartered Bank jr subord 9.5% perpetual (5) (USD) 1,300,000 1,087,259 0.07
total for United Kingdom 14.56
italyEnel Finance International co gtd Ser144A priv plmt 5.125% /2019 (Netherlands) (2) (USD) 24,750,000 19,806,291 1.25Banca Monte dei Paschi di Siena covered SerEMTN 4.875% /2016 13,000,000 13,647,179 0.86Intesa Sanpaolo sr unsecur Ser144A priv plmt 6.5% /2021 (USD) 15,800,000 12,609,235 0.79Banco Popolare covered RegS 4.75% /2016 11,000,000 11,443,674 0.72Davide Campari-Milano sr unsecur 5.375% /2016 9,000,000 9,841,140 0.62Assicurazioni Generali subord SerEMTN 10.125% /2042 (1) (5) 8,000,000 9,578,080 0.60Snam sr unsecur SerEMTN 5.25% /2022 7,450,000 8,542,315 0.54Finmeccanica Finance co gtd SerEMTN 8.125% 03/12/2013 (Luxembourg) (2) 8,000,000 8,502,400 0.54Intesa Sanpaolo sr unsecur Ser144A priv plmt 6.5% /2021 (USD) 10,200,000 8,140,139 0.51Intesa Sanpaolo sr unsecur SerEMTN 4.125% /2016 7,500,000 7,814,441 0.49Telecom Italia Finance co gtd SerEMTN 7.75% /2033 (Luxembourg) (2) 6,000,000 6,952,782 0.44Hera sr unsecur 4.125% /2016 (1) 6,500,000 6,890,718 0.43Lottomatica Group co gtd 5.375% /2018 (1) 6,000,000 6,701,067 0.42Assicurazioni Generali sr unsecur SerEMTN 5.125% /2024 (1) 6,000,000 6,425,307 0.41UniCredit sr unsecur 4.875% /2017 5,600,000 6,012,936 0.38Snam sr unsecur SerEMTN 4.375% /2016 5,400,000 5,866,449 0.37Terna Rete Elettrica Nazionale sr unsecur SerEMTN 4.75% /2021 5,000,000 5,714,585 0.36
Corporate Bonds (continued)
france (continued)
Corporate Bonds (continued)
United Kingdom (continued)

Morgan Stanley Investment Funds 31 December 2012 74
Euro Corporate Bond Fund
investments
nominal in euro unless
specifiedmarket
value% of net
assets
FGA Capital Ireland co gtd SerEMTN 4% 28/03/2013 (Ireland) (2) 4,850,000 4,820,852 0.30Telecom Italia sr unsecur SerEMTN 8.25% /2016 3,500,000 4,145,470 0.26Finmeccanica Finance co gtd SerEMTN 4.375% /2017 (Luxembourg) (1) (2) 3,350,000 3,524,217 0.22Banca Monte dei Paschi di Siena sr unsecur SerEMTN 4.75% /2014 (1) 3,000,000 3,016,830 0.19Pirelli & Co co gtd RegS 5.125% /2016 (1) 2,350,000 2,480,531 0.16Davide Campari-Milano sr unsecur 4.5% /2019 2,200,000 2,314,466 0.15Assicurazioni Generali subord nts SerEMTN 7.75% /2042 (5) 2,100,000 2,236,500 0.14UniCredit sr unsecur SerEMTN 5.25% /2014 (1) 2,000,000 2,076,851 0.13Telecom Italia sr unsecur SerEMTN 4.5% /2017 1,375,000 1,470,103 0.09Telecom Italia sr unsecur SerEMTN 7% /2017 (1) 1,000,000 1,162,534 0.07Terna Rete Elettrica Nazionale sr unsecur SerEMTN 4.125% /2017 (1) 1,000,000 1,091,552 0.07Snam sr unsecur SerEMTN 5% /2019 825,000 935,691 0.06Telecom Italia sr unsecur RegS 4% /2020 850,000 862,686 0.05
total for italy 11.62
United States of americaBank of America sr unsecur SerEMTN 7% /2016 (1) 16,000,000 18,961,776 1.19Goldman Sachs Group sr unsecur SerEMTN 4.375% /2017 15,000,000 16,443,502 1.03Goldman Sachs Group sr unsecur RegS 4.5% /2016 12,000,000 13,039,272 0.82Citigroup sr unsecur SerEMTN 4% /2015 11,465,000 12,419,381 0.78Genworth Financial sr unsecur 7.2% /2021 (USD) 15,000,000 12,312,850 0.77GE Capital European Funding co gtd SerEMTN 1.25% /2015 (Ireland) (2) 9,500,000 9,615,159 0.61JPMorgan Chase & Co sr unsecur 3.25% /2022 (USD) 11,415,000 8,916,606 0.56GE Capital Trust II ltd gtd RegS 5.5% /2067 (5) 7,600,000 7,548,225 0.48Citigroup sr unsecur SerEMTN 7.375% /2014 6,000,000 6,569,724 0.41Paccar Financial Europe sr unsecur SerEMTN 3% /2014 (Netherlands) (2) 6,000,000 6,186,510 0.39GE Capital European Funding co gtd SerEMTN 3.75% /2016 (Ireland) (2) 5,500,000 5,976,820 0.38AT&T sr unsecur 3.55% /2032 4,500,000 4,705,875 0.30Securitas sr unsecur SerEMTN 2.25% /2018 (Sweden) (2) 4,625,000 4,658,161 0.29Bank of America sr unsecur SerEMTN 4.75% /2017 4,000,000 4,510,458 0.28JPMorgan Chase & Co sr unsecur 3.25% /2022 (USD) 5,705,000 4,456,350 0.28GE Capital European Funding co gtd SerEMTN 4.125% /2016 (Ireland) (1) (2) 4,000,000 4,437,212 0.28CRH Finance co gtd SerEMTN 7.375% /2014 (Ireland) (2) 4,000,000 4,360,742 0.27Wells Fargo & Co sr unsecur SerEMTN 2.625% /2022 3,950,000 4,094,742 0.26American International Group sr unsecur 6.4% /2020 (USD) 3,985,000 3,735,563 0.24JPMorgan Chase & Co sr unsecur SerEMTN 2.75% /2022 3,000,000 3,108,163 0.20Citigroup subord SerEMTN 1.458% /2017 (5) 3,275,000 3,085,951 0.19Metropolitan Life Global Funding secured SerGMTN 2.375% /2019 2,550,000 2,678,194 0.17Procter & Gamble sr unsecur RegS 2% /2022 2,625,000 2,636,683 0.17Beam sr unsecur 4% 30/01/2013 2,500,000 2,506,325 0.16
Goldman Sachs Group sr unsecur 4.75% /2014 2,000,000 2,078,430 0.13Philip Morris International sr unsecur 2.125% /2019 2,000,000 2,071,547 0.13Bank of America sr unsecur SerEMTN 4.625% /2017 1,000,000 1,128,475 0.07
total for United States of america 10.84
SpainCaixaBank sr unsecur SerDMTN 4.125% /2014 (1) 13,050,000 13,157,689 0.83Santander International Debt bnk gtd SerEMTN 3.5% /2015 (1) 11,500,000 11,641,410 0.73Amadeus Capital Markets co gtd SerEMTN 4.875% /2016 10,000,000 10,959,735 0.69Telefonica Emisiones co gtd SerEMTN 4.967% /2016 (1) 10,000,000 10,810,275 0.68Santander Consumer Finance sr unsecur 3.25% /2014 9,900,000 9,989,446 0.63Banco Bilbao Vizcaya Argentaria covered 3.625% /2017 9,600,000 9,807,739 0.62Telefonica Emisiones co gtd SerEMTN 4.693% /2019 (1) 6,000,000 6,555,888 0.41Gas Natural Capital Markets co gtd SerEMTN 4.125% /2018 (1) 5,800,000 6,158,637 0.39Telefonica Emisiones co gtd SerEMTN 4.797% /2018 (1) 5,500,000 6,023,991 0.38BBVA Senior Finance bnk gtd SerGMTN 3.25% /2015 (1) 5,800,000 5,800,995 0.37Gas Natural Capital Markets co gtd SerEMTN 4.375% /2016 4,900,000 5,261,034 0.33BBVA Senior Finance bnk gtd SerEMTN 3.625% /2014 4,800,000 4,854,413 0.30CaixaBank covered 3.375% /2014 4,100,000 4,141,291 0.26CaixaBank sr unsecur SerEMTN 3.75% 05/11/2013 4,050,000 4,089,649 0.26Iberdrola Finanzas co gtd SerEMTN 4.75% /2016 3,700,000 3,995,752 0.25Banco Bilbao Vizcaya Argentaria subord 4.375% /2019 (1) (5) 3,500,000 2,955,983 0.19Gas Natural Capital Markets co gtd SerEMTN 4.125% /2017 (1) 2,700,000 2,881,556 0.18
total for Spain 7.50
GermanyMuenchener Rueckversicherungs subord SerEMTN 6% /2041 (5) 9,000,000 10,804,901 0.68Linde Finance co gtd 7.375% /2066 (Netherlands) (2) (5) 8,700,000 10,211,856 0.64HSE Netz sr secured 6.125% /2041 7,500,000 9,330,225 0.59EnBW Energie Baden-Wuerttemberg jr subord SerEMTN 7.375% /2072 (5) 8,300,000 9,293,680 0.58Allianz Finance II co gtd SerEMTN 5.75% /2041 (Netherlands) (2) (5) 7,000,000 8,046,339 0.51Commerzbank subord SerEMTN 7.75% /2021 (1) 7,000,000 7,540,298 0.47Brenntag Finance co gtd 5.5% /2018 (Netherlands) (1) (2) 6,000,000 6,847,920 0.43Celesio Finance co gtd 4.5% /2017 (Netherlands) (1) (2) 6,225,000 6,632,520 0.42Deutsche Post unsecur SerEMTN 2.875% /2024 (1) 5,950,000 6,099,345 0.38BASF sr unsecur 2% /2022 6,000,000 6,002,880 0.38BASF sr unsecur SerEMTN 1.5% /2018 5,700,000 5,833,762 0.37Deutsche Telekom International Finance co gtd SerEMTN 2.75% /2024 (Netherlands) (2) 5,050,000 5,118,321 0.32SAP sr unsecur SerEMTN 2.125% /2019 (1) 4,865,000 4,920,631 0.31Deutsche Boerse sr unsecur 2.375% /2022 4,025,000 4,126,953 0.26SGL Carbon sr unsecur CV 2.75% /2018 2,900,000 2,936,613 0.18MAN sr unsecur SerEMTN 1% /2015 2,900,000 2,929,700 0.18
Statement of inveStmentS (continued)
transferable securities and money market instruments admitted to official exchange listing or dealt in on another regulated market. as at 31 December 2012, expressed in euro.
investments
nominal in euro unless
specifiedmarket
value% of net
assets Corporate Bonds (continued)
italy (continued)
Corporate Bonds (continued)
United States of america (continued)
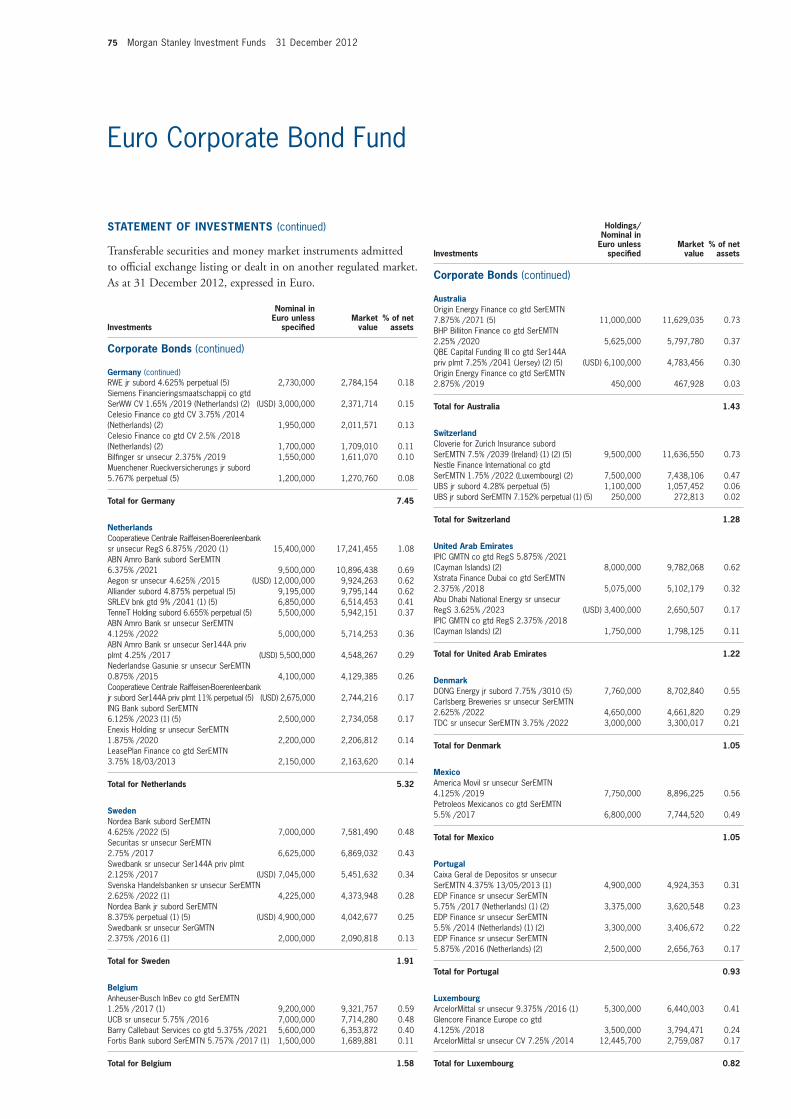
75 Morgan Stanley Investment Funds 31 December 2012
Euro Corporate Bond Fund
RWE jr subord 4.625% perpetual (5) 2,730,000 2,784,154 0.18Siemens Financieringsmaatschappij co gtd SerWW CV 1.65% /2019 (Netherlands) (2) (USD) 3,000,000 2,371,714 0.15Celesio Finance co gtd CV 3.75% /2014 (Netherlands) (2) 1,950,000 2,011,571 0.13Celesio Finance co gtd CV 2.5% /2018 (Netherlands) (2) 1,700,000 1,709,010 0.11Bilfinger sr unsecur 2.375% /2019 1,550,000 1,611,070 0.10Muenchener Rueckversicherungs jr subord 5.767% perpetual (5) 1,200,000 1,270,760 0.08
total for Germany 7.45
netherlandsCooperatieve Centrale Raiffeisen-Boerenleenbank sr unsecur RegS 6.875% /2020 (1) 15,400,000 17,241,455 1.08ABN Amro Bank subord SerEMTN 6.375% /2021 9,500,000 10,896,438 0.69Aegon sr unsecur 4.625% /2015 (USD) 12,000,000 9,924,263 0.62Alliander subord 4.875% perpetual (5) 9,195,000 9,795,144 0.62SRLEV bnk gtd 9% /2041 (1) (5) 6,850,000 6,514,453 0.41TenneT Holding subord 6.655% perpetual (5) 5,500,000 5,942,151 0.37ABN Amro Bank sr unsecur SerEMTN 4.125% /2022 5,000,000 5,714,253 0.36ABN Amro Bank sr unsecur Ser144A priv plmt 4.25% /2017 (USD) 5,500,000 4,548,267 0.29Nederlandse Gasunie sr unsecur SerEMTN 0.875% /2015 4,100,000 4,129,385 0.26Cooperatieve Centrale Raiffeisen-Boerenleenbank jr subord Ser144A priv plmt 11% perpetual (5) (USD) 2,675,000 2,744,216 0.17ING Bank subord SerEMTN 6.125% /2023 (1) (5) 2,500,000 2,734,058 0.17Enexis Holding sr unsecur SerEMTN 1.875% /2020 2,200,000 2,206,812 0.14LeasePlan Finance co gtd SerEMTN 3.75% 18/03/2013 2,150,000 2,163,620 0.14
total for netherlands 5.32
SwedenNordea Bank subord SerEMTN 4.625% /2022 (5) 7,000,000 7,581,490 0.48Securitas sr unsecur SerEMTN 2.75% /2017 6,625,000 6,869,032 0.43Swedbank sr unsecur Ser144A priv plmt 2.125% /2017 (USD) 7,045,000 5,451,632 0.34Svenska Handelsbanken sr unsecur SerEMTN 2.625% /2022 (1) 4,225,000 4,373,948 0.28Nordea Bank jr subord SerEMTN 8.375% perpetual (1) (5) (USD) 4,900,000 4,042,677 0.25Swedbank sr unsecur SerGMTN 2.375% /2016 (1) 2,000,000 2,090,818 0.13
total for Sweden 1.91
BelgiumAnheuser-Busch InBev co gtd SerEMTN 1.25% /2017 (1) 9,200,000 9,321,757 0.59UCB sr unsecur 5.75% /2016 7,000,000 7,714,280 0.48Barry Callebaut Services co gtd 5.375% /2021 5,600,000 6,353,872 0.40Fortis Bank subord SerEMTN 5.757% /2017 (1) 1,500,000 1,689,881 0.11
total for Belgium 1.58
australiaOrigin Energy Finance co gtd SerEMTN 7.875% /2071 (5) 11,000,000 11,629,035 0.73BHP Billiton Finance co gtd SerEMTN 2.25% /2020 5,625,000 5,797,780 0.37QBE Capital Funding III co gtd Ser144A priv plmt 7.25% /2041 (Jersey) (2) (5) (USD) 6,100,000 4,783,456 0.30Origin Energy Finance co gtd SerEMTN 2.875% /2019 450,000 467,928 0.03
total for australia 1.43
SwitzerlandCloverie for Zurich Insurance subord SerEMTN 7.5% /2039 (Ireland) (1) (2) (5) 9,500,000 11,636,550 0.73Nestle Finance International co gtd SerEMTN 1.75% /2022 (Luxembourg) (2) 7,500,000 7,438,106 0.47UBS jr subord 4.28% perpetual (5) 1,100,000 1,057,452 0.06UBS jr subord SerEMTN 7.152% perpetual (1) (5) 250,000 272,813 0.02
total for Switzerland 1.28
United arab emiratesIPIC GMTN co gtd RegS 5.875% /2021 (Cayman Islands) (2) 8,000,000 9,782,068 0.62Xstrata Finance Dubai co gtd SerEMTN 2.375% /2018 5,075,000 5,102,179 0.32Abu Dhabi National Energy sr unsecur RegS 3.625% /2023 (USD) 3,400,000 2,650,507 0.17IPIC GMTN co gtd RegS 2.375% /2018 (Cayman Islands) (2) 1,750,000 1,798,125 0.11
total for United arab emirates 1.22
DenmarkDONG Energy jr subord 7.75% /3010 (5) 7,760,000 8,702,840 0.55Carlsberg Breweries sr unsecur SerEMTN 2.625% /2022 4,650,000 4,661,820 0.29TDC sr unsecur SerEMTN 3.75% /2022 3,000,000 3,300,017 0.21
total for Denmark 1.05
mexicoAmerica Movil sr unsecur SerEMTN 4.125% /2019 7,750,000 8,896,225 0.56Petroleos Mexicanos co gtd SerEMTN 5.5% /2017 6,800,000 7,744,520 0.49
total for mexico 1.05
PortugalCaixa Geral de Depositos sr unsecur SerEMTN 4.375% 13/05/2013 (1) 4,900,000 4,924,353 0.31EDP Finance sr unsecur SerEMTN 5.75% /2017 (Netherlands) (1) (2) 3,375,000 3,620,548 0.23EDP Finance sr unsecur SerEMTN 5.5% /2014 (Netherlands) (1) (2) 3,300,000 3,406,672 0.22EDP Finance sr unsecur SerEMTN 5.875% /2016 (Netherlands) (2) 2,500,000 2,656,763 0.17
total for Portugal 0.93
LuxembourgArcelorMittal sr unsecur 9.375% /2016 (1) 5,300,000 6,440,003 0.41Glencore Finance Europe co gtd 4.125% /2018 3,500,000 3,794,471 0.24ArcelorMittal sr unsecur CV 7.25% /2014 12,445,700 2,759,087 0.17
total for Luxembourg 0.82
Statement of inveStmentS (continued)
transferable securities and money market instruments admitted to official exchange listing or dealt in on another regulated market. as at 31 December 2012, expressed in euro.
investments
nominal in euro unless
specifiedmarket
value% of net
assets
investments
holdings/nominal in
euro unless specified
market value
% of net assets
Corporate Bonds (continued)
Germany (continued)
Corporate Bonds (continued)

Morgan Stanley Investment Funds 31 December 2012 76
Euro Corporate Bond Fund
norwayStatkraft nts SerEMTN 2.5% /2022 (1) 4,500,000 4,551,197 0.29Sparebank 1 SR Bank sr unsecur 3.625% /2015 4,000,000 4,219,214 0.26SpareBank 1 SR Bank sr unsecur SerEMTN 2% /2018 3,750,000 3,824,194 0.24
total for norway 0.79
GreeceOTE co gtd SerEMTN 7.25% /2014 (United Kingdom) (2) 6,200,000 6,146,029 0.39EFG Hellas bnk gtd SerEMTN 4.375% 11/02/2013 (United Kingdom) (1) (2) 5,500,000 5,455,313 0.34
total for Greece 0.73
CanadaXstrata Finance Canada co gtd SerEMTN 5.25% /2017 (1) 8,000,000 9,160,404 0.58
total for Canada 0.58
BrazilPetrobras International Finance co gtd SerEMTN 4.875% /2018 (Cayman Islands) (2) 7,700,000 8,603,787 0.54
total for Brazil 0.54
finlandFortum sr unsecur SerEMTN 2.25% /2022 7,400,000 7,346,539 0.46
total for finland 0.46
hong KongHutchison Whampoa Europe Finance 12 co gtd SerEMTN 2.5% /2017 (Cayman Islands) (2) 6,000,000 6,314,805 0.40
total for hong Kong 0.40
Czech republicCEZ sr unsecur Ser144A priv plmt 4.25% /2022 (USD) 6,130,000 4,987,594 0.32
total for Czech republic 0.32
irelandCRH America co gtd 6% /2016 (United States of America) (2) (USD) 2,500,000 2,127,009 0.13Bord Gais Eireann sr unsecur SerEMTN 3.625% /2017 1,450,000 1,530,874 0.10
total for ireland 0.23
russiaGazprom Via Gaz Capital sr unsecur SerEMTN LPN 6.605% /2018 (Luxembourg) (2) 2,680,000 3,200,925 0.20
total for russia 0.20
JerseyASIF III Jersey sr secured SerEMTN 4.75% 11/09/2013 3,000,000 3,071,010 0.19
total for Jersey 0.19
QatarQtel International Finance co gtd RegS 3.25% /2023 (Bermuda) (2) (USD) 3,250,000 2,461,944 0.15
total for Qatar 0.15
South KoreaExport-Import Bank of Korea sr unsecur SerEMTN 5.75% 22/05/2013 1,450,000 1,480,450 0.09
total for South Korea 0.09
total for Corporate Bonds 89.97
mutual fund
Morgan Stanley Funds plc - Euro Liquidity Fund (Ireland) (2) (4) 78,325,355 78,325,355 4.93
total for mutual fund 4.93
Government Bond
PolandGovernment of Poland sr unsecur SerEMTN 4.675% /2019 (1) 3,000,000 3,520,335 0.22
total for Poland 0.22
total for Government Bond 0.22
total investment Securities 1,511,287,780 95.12
DerivativeS
OtC and exchange traded derivatives as at 31 December 2012, expressed in euro.
futures Contracts
Descriptionmaturity
datenumber of contracts
notional commitments Counterparty
net unrealised gain/(loss) as at
31 December 2012
% of net assets
Euro BOBL Future 03/2013 233 29,782,060 Goldman Sachs 136,372 0.01Euro SCHATZ Future 03/2013 1,154 127,926,670 Goldman Sachs 115,400 0.01US 2yr T-note Future 03/2013 838 139,769,818 Goldman Sachs 79,243 0.00US 5yr T-note Future 03/2013 1,234 116,072,857 Goldman Sachs 20,520 0.00US 10yr T-note Future 03/2013 (1,040) (104,413,626) Goldman Sachs 129,936 0.01US Long Bond Future 03/2013 (24) (2,681,874) Goldman Sachs 17,872 0.00
total Unrealised Gain on futures Contracts 499,343 0.03
Euro Bund Future 03/2013 (192) (27,962,880) Goldman Sachs (136,870) (0.01)Long Gilt Future 03/2013 (144) (21,049,847) Goldman Sachs (28,989) 0.00
Unrealised Loss on futures Contracts (165,859) (0.01)
Duration hedged Share Class Euro BOBL Future 03/2013 (984) (125,774,879) Goldman Sachs (614,681) (0.04)Euro Bund Future 03/2013 (390) (56,799,600) Goldman Sachs (305,010) (0.02)Euro SCHATZ Future 03/2013 (607) (67,288,985) Goldman Sachs (53,207) 0.00
Unrealised Loss on Duration hedged futures Contracts (972,898) (0.06)
total Unrealised Loss on futures Contracts (1,138,757) (0.07)
net Unrealised Loss on futures Contracts 7,579,7141 (639,414) (0.04)
1 Cash of EUR 3,931,026 held as collateral by the counterparty.
investments
holdings/nominal in
euro unless specified
market value
% of net assets
Statement of inveStmentS (continued)
transferable securities and money market instruments admitted to official exchange listing or dealt in on another regulated market. as at 31 December 2012, expressed in euro.
investments
nominal in euro unless
specifiedmarket
value% of net
assets Corporate Bonds (continued)
Corporate Bonds (continued)

77 Morgan Stanley Investment Funds 31 December 2012
Euro Corporate Bond Fund
forward foreign Currency exchange Contracts
maturity date
amount bought Ccy
amount sold Ccy Counterparty
Unrealised gain/(loss)
eUr% of net
assets
16/01/2013 46,506,289 EUR 60,872,500 USD HSBC 464,013 0.03 16/01/2013 46,505,010 EUR 60,872,500 USD J.P. Morgan 462,734 0.03 16/01/2013 46,526,692 EUR 60,872,500 USD State Street 484,416 0.03 16/01/2013 46,514,071 EUR 60,872,500 USD Westpac Bank 471,795 0.03 17/01/2013 30,798,469 EUR 25,005,000 GBP RBC 67,151 0.00
net Unrealised Gain on forward foreign Currency exchange Contracts 1,950,109 0.12
Credit Default Swap Contracts
risk position Description Ccy
notional amount
maturity date Counterparty
net unrealised gain/(loss) as at
31 December 2012
% of net assets
Sell ArcelorMittal 6.125% 01/06/2018 EUR 3,500,000 20/03/2014 J.P. Morgan 174,845 0.01
Unrealised Gain on Credit Default Swap Contracts 174,845 0.01
Buy Koninklijke DSM 4% 10/11/2015 EUR 2,200,000 20/12/2013 Barclays Capital (23,371) 0.00
Sell iTraxx Europe Senior Financials Series 16 01/12/2016 EUR 57,000,000 20/12/2016 Morgan Stanley (1,027,269) (0.07)
Sell iTraxx Europe Senior Financials Series 18 01/12/2017 EUR 20,000,000 20/12/2017
Societe Generale Corporate
& Investment Banking (382,000) (0.02)
Sell iTraxx Europe Series 17 01/06/2017 EUR 1,500,000 20/06/2017 Barclays Capital (6,420) 0.00
Sell iTraxx Europe Series 17 01/06/2017 EUR 2,000,000 20/06/2017
Societe Generale Corporate
& Investment Banking (8,560) 0.00
Sell iTraxx Europe Series 17 01/06/2017 EUR 8,000,000 20/06/2017
Societe Generale Corporate
& Investment Banking (34,241) 0.00
Sell iTraxx Europe Series 18 01/12/2017 EUR 7,000,000 20/12/2017 Morgan Stanley (53,215) 0.00
Sell iTraxx Europe Series 18 01/12/2017 EUR 40,000,000 20/12/2017
Societe Generale Corporate
& Investment Banking (304,084) (0.02)
Unrealised Loss on Credit Default Swap Contracts (1,839,160) (0.11)
net Unrealised Loss on Credit Default Swap Contracts (1,664,315) (0.10)
interest rate Swap Contracts
Description Currencynotional amount
maturity date Counterparty
net unrealised gain/(loss) as at
31 December 2012
% of net assets
Pay fixed rate 0.371% Receive floating rate USD LIBOR 3 months USD 130,360,000 05/10/2014 Barclays Capital 12,754 0.00
Unrealised Gain on interest rate Swap Contracts 12,754 0.00
Pay fixed rate 0.393% Receive floating rate USD LIBOR 3 months USD 112,070,000 25/09/2014 Barclays Capital (105,479) (0.01)
Pay fixed rate 0.811% Receive floating rate USD LIBOR 3 months USD 36,320,000 24/09/2017 Barclays Capital (97,586) (0.01)
Pay fixed rate 0.818% Receive floating rate USD LIBOR 3 months USD 54,080,000 13/09/2017 Goldman Sachs (175,644) (0.01)
Pay fixed rate 0.820% Receive floating rate USD LIBOR 3 months USD 85,205,000 24/07/2017
Royal Bank of Scotland (405,982) (0.02)
Pay fixed rate 3.706% Receive floating rate USD LIBOR 3 months USD 46,700,000 25/01/2020 Bank of America (6,453,994) (0.40)
Unrealised Loss on interest rate Swap Contracts (7,238,685) (0.45)
net Unrealised Loss on interest rate Swap Contracts (7,225,931) (0.45)
Cash of EUR 4,412,536 held as collateral by the counterparties in relation to the above OTC contracts.Cash of EUR 1,220,000 paid as collateral by the counterparties in relation to the above OTC contracts.
total Derivatives (7,579,551) (0.47)
other assets less Liabilities 85,098,605 5.35
total net asset value 1,588,806,834 100.00
(1) All or part of this position is out on loan.(2) The country in brackets represents the country of incorporation of this security.(4) Managed by an affiliate of the Investment Adviser.(5) Variable coupon rates are those quoted as of 31 December 2012.
DerivativeS (continued)
OtC and exchange traded derivatives as at 31 December 2012, expressed in euro.

Morgan Stanley Investment Funds 31 December 2012 78
Please refer to the full prospectus for the Fund’s investment objective and policy.
Euro Strategic Bond Fund
inveStment aim
To provide an attractive rate of return, measured in Euro, through market, instrument and currency selection. The Fund consists of fixed income securities of varying maturities denominated primarily in the Euro and other European currencies and may invest in other fixed income securities denominated in other currencies including Emerging Markets fixed income securities.
Statement of inveStmentS
transferable securities and money market instruments admitted to official exchange listing or dealt in on another regulated market. as at 31 December 2012, expressed in euro.
investments
nominal in euro unless
specifiedmarket
value% of net
assets Corporate Bonds
United KingdomLloyds TSB Bank subord SerEMTN 6.5% /2020 (1) 2,300,000 2,633,471 0.55Barclays Bank subord SerEMTN 6% /2021 2,300,000 2,610,258 0.54Royal Bank of Scotland sr unsecur SerEMTN 5.5% /2020 1,800,000 2,176,415 0.45Nationwide Building Society sr unsecur SerEMTN 3.75% /2015 1,600,000 1,693,240 0.35Abbey National Treasury Services covered SerEMTN 3.625% /2016 1,500,000 1,651,840 0.34HSBC Holdings subord SerEMTN 6% /2019 1,300,000 1,575,205 0.33Priory Group No 3 sr secured RegS 7% /2018 (GBP) 1,050,000 1,373,258 0.29BP Capital Markets co gtd SerEMTN 3.472% /2016 1,200,000 1,304,318 0.27Abbey National Treasury Services bnk gtd SerEMTN 3.375% /2015 1,200,000 1,275,716 0.27Nationwide Building Society subord SerEMTN 6.75% /2020 1,000,000 1,174,019 0.25HSBC Holdings sr unsecur 4% /2022 (USD) 1,375,000 1,141,794 0.24Standard Chartered sr unsecur 3.875% /2016 1,000,000 1,101,049 0.23Nationwide Building Society covered SerEMTN 3.5% /2015 1,000,000 1,086,501 0.23Yorkshire Building Society covered SerEMTN 3.25% /2015 1,000,000 1,063,009 0.22Aviva subord SerEMTN 6.875% /2038 (5) 800,000 875,416 0.18FCE Bank sr unsecur SerEMTN 4.75% /2015 800,000 851,666 0.18GKN Holdings sr unsecur SerEMTN 5.375% /2022 (GBP) 650,000 827,049 0.17Bank of Scotland covered SerEMTN 4.625% /2017 700,000 814,274 0.17Ineos Finance sr secured RegS 9.25% /2015 (1) 700,000 755,044 0.16Imperial Tobacco Finance co gtd SerEMTN 7.25% /2014 600,000 663,483 0.14HSBC Bank sr unsecur SerEMTN 3.125% /2017 600,000 655,393 0.14Imperial Tobacco Finance co gtd SerEMTN 8.375% /2016 500,000 607,348 0.13Anglian Water Osprey Financing sr secured SerEMTN 7% /2018 (GBP) 450,000 601,339 0.13G4S International Finance co gtd SerEMTN 2.625% /2018 600,000 600,390 0.12British American Tobacco Holdings The Netherlands co gtd SerEMTN 2.375% /2023 (Netherlands) (2) 550,000 550,806 0.11Westfield UK & Europe Finance co gtd SerEMTN 4.25% /2022 (GBP) 400,000 524,744 0.11Anglo American Capital co gtd Ser144A priv plmt 9.375% /2019 (USD) 500,000 492,242 0.10Experian Finance co gtd SerEMTN 4.75% /2020 400,000 474,419 0.10Heathrow Funding sr secured Ser144A priv plmt 4.6% /2018 (Jersey) (2) 400,000 455,410 0.10Royal Bank of Scotland subord SerEMTN 6.934% /2018 400,000 452,608 0.09Everything Everywhere Finance co gtd SerEMTN 3.5% /2017 425,000 448,756 0.09BAT International Finance co gtd SerEMTN 3.625% /2021 400,000 446,602 0.09Barclays Bank sr unsecur SerEMTN 4.125% /2016 400,000 439,566 0.09Standard Chartered subord nts SerEMTN 3.625% /2022 (1) 425,000 435,977 0.09Bakkavor Finance 2 sr secured RegS 8.25% /2018 (GBP) 325,000 406,334 0.09

79 Morgan Stanley Investment Funds 31 December 2012
Euro Strategic Bond Fund
investments
nominal in euro unless
specifiedmarket
value% of net
assets
Statement of inveStmentS (continued)
transferable securities and money market instruments admitted to official exchange listing or dealt in on another regulated market. as at 31 December 2012, expressed in euro.
investments
nominal in euro unless
specifiedmarket
value% of net
assets
Compagnie de Financement Foncier covered SerEMTN 4.375% /2021 900,000 1,065,550 0.22Societe Des Autoroutes Paris-Rhin-Rhone sr unsecur SerEMTN 5% /2017 (1) 900,000 1,009,581 0.21AXA subord SerEMTN 5.25% /2040 (5) 950,000 994,768 0.21Europcar Groupe secured RegS 11.5% /2017 925,000 979,228 0.20Christian Dior sr unsecur 4% /2016 900,000 959,832 0.20Electricité de France unsecur SerEMTN 2.75% /2023 900,000 915,994 0.19HIT Finance co gtd 5.75% /2018 (Netherlands) (2) 800,000 892,449 0.19Mercialys sr unsecur 4.125% /2019 (1) 800,000 882,062 0.18BNP Paribas subord SerEMTN 5.431% /2017 (1) 750,000 857,838 0.18Crown European Holdings co gtd RegS 7.125% /2018 700,000 772,569 0.16Compagnie Generale des Etablissements Michelin sr unsecur CV 0% /2017 582,300 765,198 0.16Vivendi sr unsecur SerEMTN 3.875% /2015 700,000 747,630 0.16Foncière des Regions sr unsecur 3.875% /2018 700,000 742,222 0.16Lafarge sr unsecur SerEMTN 6.625% /2018 (1) 650,000 734,562 0.15SA de Gestion des Stocks de Securite sr unsecur 1.75% /2019 700,000 716,198 0.15Banque Federative du Credit Mutuel sr unsecur SerEMTN 3% /2015 650,000 687,400 0.14RCI Banque sr unsecur SerEMTN 5.625% /2015 (1) 600,000 652,160 0.14Carrefour sr unsecur SerEMTN 1.875% /2017 650,000 651,121 0.14Eutelsat sr unsecur 5% /2019 500,000 587,979 0.12Crédit Agricole sr unsecur SerEMTN 3.875% /2019 (1) 500,000 557,455 0.12Edenred sr unsecur 3.625% /2017 500,000 542,192 0.11Societe Fonciere Lyonnaise sr unsecur 4.625% /2016 500,000 536,470 0.11Unibail-Rodamco sr unsecur SerEMTN 1.625% /2017 (1) 525,000 531,014 0.11Alstom sr unsecur SerEMTN 2.25% /2017 500,000 509,982 0.11Veolia Environnement sr unsecur SerEMTN 5.125% /2022 400,000 478,435 0.10Wendel sr unsecur 6.75% /2018 (1) 400,000 451,648 0.09Areva sr unsecur SerEMTN 4.625% /2017 400,000 437,373 0.09Arkema sr unsecur 3.85% /2020 400,000 435,760 0.09Banque PSA Finance sr unsecur RegS 3.875% /2015 (1) 350,000 358,221 0.08Legrand sr unsecur SerEMTN 4.375% /2018 300,000 344,895 0.07Société Générale sr unsecur SerEMTN 4% /2016 (1) 300,000 327,263 0.07AXA sr unsecur SerEMTN 4.5% /2015 300,000 322,672 0.07Klepierre unsecur SerEMTN 2.75% /2019 300,000 305,827 0.06Air Liquide Finance co gtd SerEMTN 2.125% /2021 300,000 303,787 0.06Société Générale jr subord 6.999% perpetual (5) 300,000 300,907 0.06Banque Federative du Credit Mutuel sr unsecur SerEMTN 0.34% /2014 (5) 300,000 299,704 0.06Legrand sr unsecur SerEMTN 3.375% /2022 200,000 218,805 0.05Gecina sr unsecur SerEMTN 4.25% /2016 200,000 215,548 0.05Banque PSA Finance sr unsecur SerEMTN 6% /2014 200,000 210,830 0.04Societe Fonciere Lyonnaise sr unsecur 3.5% /2017 200,000 206,942 0.04Autoroutes du Sud de la France sr unsecur SerEMTN 7.375% /2019 150,000 197,916 0.04Veolia Environnement sr unsecur SerEMTN 6.75% /2019 150,000 190,881 0.04Société Générale sr unsecur SerEMTN 3.75% /2014 150,000 157,168 0.03Areva sr unsecur SerEMTN 3.875% /2016 (1) 100,000 106,004 0.02Banque PSA Finance nts SerEMTN 3.625% 17/09/2013 100,000 100,886 0.02Credit Agricole jr subord 7.875% perpetual (5) 50,000 52,760 0.01RCI Banque sr unsecur SerEMTN 4% 11/07/2013 50,000 50,761 0.01
total for france 7.78
Co-operative Bank sr unsecur SerEMTN 2.375% /2015 400,000 401,078 0.08Compass Group sr unsecur SerEMTN 3.125% /2019 350,000 380,438 0.08Heathrow Finance sr secured RegS 5.375% /2019 (GBP) 300,000 373,149 0.08Rio Tinto Finance co gtd SerEMTN 2.875% /2024 350,000 358,092 0.07National Express Group co gtd SerEMTN 6.25% /2017 (GBP) 250,000 342,099 0.07FCE Bank sr unsecur SerEMTN 9.375% /2014 300,000 324,984 0.07Royal Bank of Scotland subord SerEMTN 10.5% /2022 (1) (5) 258,000 317,240 0.07HSBC Holdings subord 3.625% /2020 (5) 300,000 310,442 0.07G4S International Finance co gtd SerEMTN 2.875% /2017 275,000 284,305 0.06Virgin Media Secured Finance sr secured 5.5% /2021 (GBP) 200,000 276,572 0.06Rentokil Initial co gtd SerEMTN 4.625% /2014 250,000 260,562 0.05FCE Bank sr unsecur SerEMTN 2.875% /2017 (1) 250,000 258,951 0.05Standard Chartered sr unsecur SerEMTN 1.75% /2017 250,000 255,144 0.05HBOS subord SerEMTN 4.5% /2030 (5) 300,000 250,693 0.05InterContinental Hotels Group co gtd SerEMTN 3.875% /2022 (GBP) 200,000 249,709 0.05Barclays Bank jr subord SerRCI 14% perpetual (5) (GBP) 150,000 246,685 0.05Imperial Tobacco Finance co gtd SerEMTN 4.5% /2018 200,000 228,894 0.05BP Capital Markets co gtd SerEMTN 3.83% /2017 200,000 225,799 0.05Smiths Group co gtd 4.125% /2017 195,000 214,086 0.05Intercontinental Hotels Group co gtd SerEMTN 6% /2016 (GBP) 150,000 208,613 0.04Barclays Bank sr unsecur 3.5% /2015 150,000 158,793 0.03Leek Finance 17X A2C 0.463% /2037 (5) 151,664 157,334 0.03Granite Master Issuer 2006-4 A7 0.33% /2054 (5) 132,173 130,322 0.03Standard Chartered sr unsecur SerEMTN 4.125% /2019 100,000 114,678 0.02Granite Master Issuer 2007-2 3A2 0.31% /2054 (5) 99,130 97,742 0.02
total for United Kingdom 8.47
franceDexia Credit Local govt liquid gtd SerEMTN 2.625% /2014 2,600,000 2,652,341 0.55Société Générale sr unsecur Ser144A priv plmt 5.2% /2021 (USD) 2,445,000 2,047,028 0.43Credit Agricole subord SerEMTN 3.9% /2021 (1) 1,650,000 1,672,070 0.35BPCE sr unsecur SerEMTN 2% /2018 1,600,000 1,631,733 0.34BNP Paribas Home Loan Covered Bonds 3.875% /2021 1,200,000 1,404,974 0.29BNP Paribas Home Loan Covered Bonds SerEMTN 3.75% /2021 1,100,000 1,275,198 0.27Crédit Agricole unsecur Ser144A priv plmt 3% /2017 (USD) 1,515,000 1,174,967 0.24BNP Paribas bnk gtd SerBKNT 5% /2021 (USD) 1,370,000 1,170,671 0.24
Corporate Bonds (continued)
United Kingdom (continued)
Corporate Bonds (continued)
france (continued)
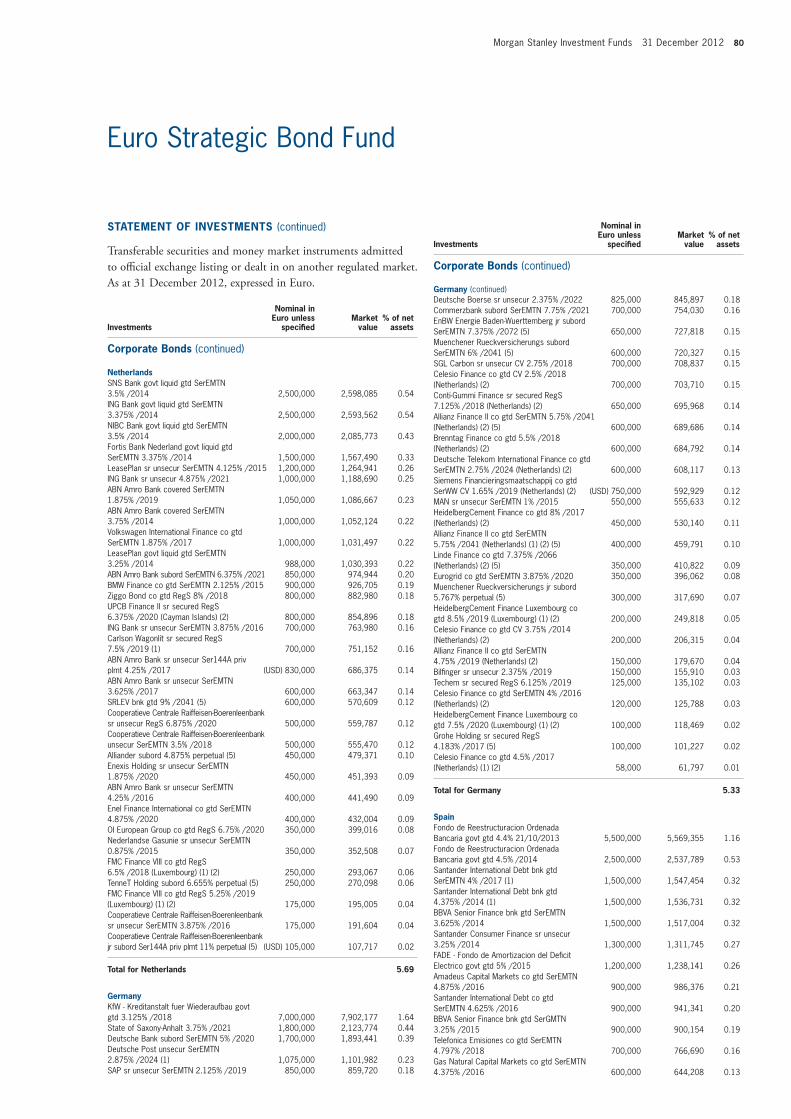
Morgan Stanley Investment Funds 31 December 2012 80
Euro Strategic Bond Fund
investments
nominal in euro unless
specifiedmarket
value% of net
assets
Statement of inveStmentS (continued)
transferable securities and money market instruments admitted to official exchange listing or dealt in on another regulated market. as at 31 December 2012, expressed in euro.
investments
nominal in euro unless
specifiedmarket
value% of net
assets
Deutsche Boerse sr unsecur 2.375% /2022 825,000 845,897 0.18Commerzbank subord SerEMTN 7.75% /2021 700,000 754,030 0.16EnBW Energie Baden-Wuerttemberg jr subord SerEMTN 7.375% /2072 (5) 650,000 727,818 0.15Muenchener Rueckversicherungs subord SerEMTN 6% /2041 (5) 600,000 720,327 0.15SGL Carbon sr unsecur CV 2.75% /2018 700,000 708,837 0.15Celesio Finance co gtd CV 2.5% /2018 (Netherlands) (2) 700,000 703,710 0.15Conti-Gummi Finance sr secured RegS 7.125% /2018 (Netherlands) (2) 650,000 695,968 0.14Allianz Finance II co gtd SerEMTN 5.75% /2041 (Netherlands) (2) (5) 600,000 689,686 0.14Brenntag Finance co gtd 5.5% /2018 (Netherlands) (2) 600,000 684,792 0.14Deutsche Telekom International Finance co gtd SerEMTN 2.75% /2024 (Netherlands) (2) 600,000 608,117 0.13Siemens Financieringsmaatschappij co gtd SerWW CV 1.65% /2019 (Netherlands) (2) (USD) 750,000 592,929 0.12MAN sr unsecur SerEMTN 1% /2015 550,000 555,633 0.12HeidelbergCement Finance co gtd 8% /2017 (Netherlands) (2) 450,000 530,140 0.11Allianz Finance II co gtd SerEMTN 5.75% /2041 (Netherlands) (1) (2) (5) 400,000 459,791 0.10Linde Finance co gtd 7.375% /2066 (Netherlands) (2) (5) 350,000 410,822 0.09Eurogrid co gtd SerEMTN 3.875% /2020 350,000 396,062 0.08Muenchener Rueckversicherungs jr subord 5.767% perpetual (5) 300,000 317,690 0.07HeidelbergCement Finance Luxembourg co gtd 8.5% /2019 (Luxembourg) (1) (2) 200,000 249,818 0.05Celesio Finance co gtd CV 3.75% /2014 (Netherlands) (2) 200,000 206,315 0.04Allianz Finance II co gtd SerEMTN 4.75% /2019 (Netherlands) (2) 150,000 179,670 0.04Bilfinger sr unsecur 2.375% /2019 150,000 155,910 0.03Techem sr secured RegS 6.125% /2019 125,000 135,102 0.03Celesio Finance co gtd SerEMTN 4% /2016 (Netherlands) (2) 120,000 125,788 0.03HeidelbergCement Finance Luxembourg co gtd 7.5% /2020 (Luxembourg) (1) (2) 100,000 118,469 0.02Grohe Holding sr secured RegS 4.183% /2017 (5) 100,000 101,227 0.02Celesio Finance co gtd 4.5% /2017 (Netherlands) (1) (2) 58,000 61,797 0.01
total for Germany 5.33
Spain Fondo de Reestructuracion Ordenada Bancaria govt gtd 4.4% 21/10/2013 5,500,000 5,569,355 1.16Fondo de Reestructuracion Ordenada Bancaria govt gtd 4.5% /2014 2,500,000 2,537,789 0.53Santander International Debt bnk gtd SerEMTN 4% /2017 (1) 1,500,000 1,547,454 0.32Santander International Debt bnk gtd 4.375% /2014 (1) 1,500,000 1,536,731 0.32BBVA Senior Finance bnk gtd SerEMTN 3.625% /2014 1,500,000 1,517,004 0.32Santander Consumer Finance sr unsecur 3.25% /2014 1,300,000 1,311,745 0.27FADE - Fondo de Amortizacion del Deficit Electrico govt gtd 5% /2015 1,200,000 1,238,141 0.26Amadeus Capital Markets co gtd SerEMTN 4.875% /2016 900,000 986,376 0.21Santander International Debt co gtd SerEMTN 4.625% /2016 900,000 941,341 0.20BBVA Senior Finance bnk gtd SerGMTN 3.25% /2015 900,000 900,154 0.19Telefonica Emisiones co gtd SerEMTN 4.797% /2018 700,000 766,690 0.16Gas Natural Capital Markets co gtd SerEMTN 4.375% /2016 600,000 644,208 0.13
netherlandsSNS Bank govt liquid gtd SerEMTN 3.5% /2014 2,500,000 2,598,085 0.54ING Bank govt liquid gtd SerEMTN 3.375% /2014 2,500,000 2,593,562 0.54NIBC Bank govt liquid gtd SerEMTN 3.5% /2014 2,000,000 2,085,773 0.43Fortis Bank Nederland govt liquid gtd SerEMTN 3.375% /2014 1,500,000 1,567,490 0.33LeasePlan sr unsecur SerEMTN 4.125% /2015 1,200,000 1,264,941 0.26ING Bank sr unsecur 4.875% /2021 1,000,000 1,188,690 0.25ABN Amro Bank covered SerEMTN 1.875% /2019 1,050,000 1,086,667 0.23ABN Amro Bank covered SerEMTN 3.75% /2014 1,000,000 1,052,124 0.22Volkswagen International Finance co gtd SerEMTN 1.875% /2017 1,000,000 1,031,497 0.22LeasePlan govt liquid gtd SerEMTN 3.25% /2014 988,000 1,030,393 0.22ABN Amro Bank subord SerEMTN 6.375% /2021 850,000 974,944 0.20BMW Finance co gtd SerEMTN 2.125% /2015 900,000 926,705 0.19Ziggo Bond co gtd RegS 8% /2018 800,000 882,980 0.18UPCB Finance II sr secured RegS 6.375% /2020 (Cayman Islands) (2) 800,000 854,896 0.18ING Bank sr unsecur SerEMTN 3.875% /2016 700,000 763,980 0.16Carlson Wagonlit sr secured RegS 7.5% /2019 (1) 700,000 751,152 0.16ABN Amro Bank sr unsecur Ser144A priv plmt 4.25% /2017 (USD) 830,000 686,375 0.14ABN Amro Bank sr unsecur SerEMTN 3.625% /2017 600,000 663,347 0.14SRLEV bnk gtd 9% /2041 (5) 600,000 570,609 0.12Cooperatieve Centrale Raiffeisen-Boerenleenbank sr unsecur RegS 6.875% /2020 500,000 559,787 0.12Cooperatieve Centrale Raiffeisen-Boerenleenbank unsecur SerEMTN 3.5% /2018 500,000 555,470 0.12Alliander subord 4.875% perpetual (5) 450,000 479,371 0.10Enexis Holding sr unsecur SerEMTN 1.875% /2020 450,000 451,393 0.09ABN Amro Bank sr unsecur SerEMTN 4.25% /2016 400,000 441,490 0.09Enel Finance International co gtd SerEMTN 4.875% /2020 400,000 432,004 0.09OI European Group co gtd RegS 6.75% /2020 350,000 399,016 0.08Nederlandse Gasunie sr unsecur SerEMTN 0.875% /2015 350,000 352,508 0.07FMC Finance VIII co gtd RegS 6.5% /2018 (Luxembourg) (1) (2) 250,000 293,067 0.06TenneT Holding subord 6.655% perpetual (5) 250,000 270,098 0.06FMC Finance VIII co gtd RegS 5.25% /2019 (Luxembourg) (1) (2) 175,000 195,005 0.04Cooperatieve Centrale Raiffeisen-Boerenleenbank sr unsecur SerEMTN 3.875% /2016 175,000 191,604 0.04Cooperatieve Centrale Raiffeisen-Boerenleenbank jr subord Ser144A priv plmt 11% perpetual (5) (USD) 105,000 107,717 0.02
total for netherlands 5.69
GermanyKfW - Kreditanstalt fuer Wiederaufbau govt gtd 3.125% /2018 7,000,000 7,902,177 1.64State of Saxony-Anhalt 3.75% /2021 1,800,000 2,123,774 0.44Deutsche Bank subord SerEMTN 5% /2020 1,700,000 1,893,441 0.39Deutsche Post unsecur SerEMTN 2.875% /2024 (1) 1,075,000 1,101,982 0.23SAP sr unsecur SerEMTN 2.125% /2019 850,000 859,720 0.18
Corporate Bonds (continued)
Corporate Bonds (continued)
Germany (continued)

81 Morgan Stanley Investment Funds 31 December 2012
Euro Strategic Bond Fund
investments
nominal in euro unless
specifiedmarket
value% of net
assets
Banco Bilbao Vizcaya Argentaria covered 3.625% /2017 550,000 561,902 0.12Gas Natural Capital Markets co gtd SerEMTN 4.125% /2017 (1) 400,000 426,897 0.09CaixaBank covered 3.375% /2014 400,000 404,028 0.08Telefonica Emisiones co gtd SerGMTN 3.661% /2017 350,000 365,625 0.08Telefonica Emisiones co gtd SerEMTN 4.674% /2014 350,000 361,550 0.08Santander International Debt bnk gtd SerEMTN 3.5% /2015 (1) 350,000 354,304 0.07CaixaBank sr unsecur SerEMTN 3.75% 05/11/2013 350,000 353,426 0.07Telefonica Emisiones co gtd SerEMTN 4.967% /2016 (1) 300,000 324,308 0.07Gas Natural Capital Markets co gtd SerEMTN 4.125% /2018 200,000 212,367 0.04Gas Natural Capital Markets co gtd SerEMTN 5.25% /2014 200,000 211,193 0.04CaixaBank sr unsecur SerDMTN 4.125% /2014 (1) 200,000 201,650 0.04Nara Cable Funding sr secured RegS 8.875% /2018 (Ireland) (1) (2) 150,000 152,531 0.03Santander US Debt bnk gtd Ser144A priv plmt 3.724% /2015 (USD) 30,000 22,804 0.01
total for Spain 4.89
italyBanca Monte dei Paschi di Siena covered SerEMTN 4.875% /2016 1,400,000 1,469,696 0.31UniCredit sr unsecur RegS 3.625% 21/08/2013 1,400,000 1,420,391 0.30Finmeccanica Finance co gtd SerEMTN 8.125% 03/12/2013 (Luxembourg) (1) (2) 1,300,000 1,381,640 0.29Intesa Sanpaolo sr unsecur Ser144A priv plmt 6.5% /2021 (USD) 1,710,000 1,364,670 0.28Snam sr unsecur SerEMTN 5.25% /2022 1,000,000 1,146,620 0.24Fiat Industrial Finance Europe co gtd SerEMTN 6.25% /2018 (Luxembourg) (1) (2) 900,000 1,011,163 0.21Terna Rete Elettrica Nazionale sr unsecur SerEMTN 4.75% /2021 850,000 971,479 0.20Lottomatica Group co gtd 5.375% /2018 850,000 949,318 0.20Banco Popolare covered RegS 4.75% /2016 800,000 832,267 0.17Telecom Italia Finance co gtd SerEMTN 7.75% /2033 (Luxembourg) (2) 700,000 811,158 0.17Davide Campari-Milano sr unsecur 4.5% /2019 650,000 683,819 0.14Assicurazioni Generali subord nts SerEMTN 7.75% /2042 (5) 600,000 639,000 0.13Banca Monte dei Paschi di Siena covered 3.125% /2015 600,000 598,755 0.12Snam sr unsecur SerEMTN 4.375% /2016 550,000 597,509 0.12Enel Finance International co gtd Ser144A priv plmt 5.125% /2019 (Netherlands) (2) (USD) 700,000 560,178 0.12UniCredit sr unsecur 4.875% /2017 500,000 536,869 0.11Hera sr unsecur 4.125% /2016 500,000 530,055 0.11Wind Acquisition Finance sr secured RegS 7.375% /2018 (Luxembourg) (2) 500,000 506,760 0.11FGA Capital Ireland co gtd SerEMTN 4% 28/03/2013 (Ireland) (2) 450,000 447,296 0.09Intesa Sanpaolo sr unsecur SerEMTN 4.125% /2016 400,000 416,770 0.09Assicurazioni Generali subord SerEMTN 10.125% /2042 (5) 300,000 359,178 0.08Telecom Italia sr unsecur SerEMTN 8.25% /2016 300,000 355,326 0.07Intesa Sanpaolo sr unsecur Ser144A priv plmt 6.5% /2021 (USD) 350,000 279,318 0.06
Statement of inveStmentS (continued)
transferable securities and money market instruments admitted to official exchange listing or dealt in on another regulated market. as at 31 December 2012, expressed in euro.
investments
nominal in euro unless
specifiedmarket
value% of net
assets
Assicurazioni Generali sr unsecur SerEMTN 5.125% /2024 250,000 267,721 0.06Wind Acquisition Finance secured RegS 11.75% /2017 (Luxembourg) (1) (2) 250,000 261,688 0.06Telecom Italia sr unsecur SerEMTN 7% /2017 (1) 200,000 232,507 0.05Lottomatica Group co gtd 5.375% /2016 200,000 220,372 0.05Telecom Italia sr unsecur SerEMTN 4.5% /2017 200,000 213,833 0.04Snam sr unsecur SerEMTN 5% /2019 175,000 198,480 0.04Telecom Italia sr unsecur RegS 4% /2020 150,000 152,239 0.03Telecom Italia sr unsecur RegS 5.125% /2016 100,000 108,822 0.02Pirelli & Co co gtd RegS 5.125% /2016 (1) 100,000 105,555 0.02
total for italy 4.09
United States of americaGE Capital European Funding co gtd SerEMTN 1.25% /2015 (Ireland) (2) 1,750,000 1,771,214 0.37GE Capital European Funding co gtd SerEMTN 3.75% /2016 (Ireland) (2) 1,000,000 1,086,695 0.23Goldman Sachs Group sr unsecur SerEMTN 4.375% /2017 900,000 986,610 0.20Goldman Sachs Group sr unsecur SerEMTN 6.375% /2018 800,000 966,049 0.20AT&T sr unsecur 3.55% /2032 800,000 836,600 0.17Citigroup sr unsecur SerEMTN 4% /2015 750,000 812,432 0.17Securitas sr unsecur SerEMTN 2.25% /2018 (Sweden) (2) 800,000 805,736 0.17AMERIGROUP sr unsecur 7.5% /2019 (USD) 840,000 765,699 0.16GE Capital Trust II ltd gtd RegS 5.5% /2067 (5) 750,000 744,891 0.16CRH Finance co gtd SerEMTN 7.375% /2014 (Ireland) (2) 600,000 654,111 0.14Merrill Lynch & Co sr unsecur SerEMTN 4.875% /2014 600,000 631,494 0.13WM Covered Bond Program covered SerEMTN 4% /2016 500,000 557,336 0.12BA Covered Bond Issuer covered SerEMTN 4.25% /2017 500,000 553,914 0.11Wachovia sr unsecur SerEMTN 0.343% /2014 (5) 550,000 550,025 0.11JPMorgan Chase & Co sr unsecur SerEMTN 5.25% /2015 500,000 544,935 0.11Paccar Financial Europe sr unsecur SerEMTN 3% /2014 (Netherlands) (2) 500,000 515,543 0.11Pioneer Natural Resources sr unsecur 7.5% /2020 (USD) 500,000 480,901 0.10Wells Fargo & Co sr unsecur SerEMTN 2.625% /2022 425,000 440,573 0.09JPMorgan Chase & Co sr unsecur SerEMTN 2.75% /2022 410,000 424,782 0.09Procter & Gamble sr unsecur RegS 2% /2022 (1) 400,000 401,780 0.08Metropolitan Life Global Funding secured SerGMTN 2.375% /2019 325,000 341,338 0.07JPMorgan Chase & Co sr unsecur SerEMTN 3.75% /2016 300,000 328,658 0.07JPMorgan Chase & Co sr unsecur SerEMTN 2.75% /2022 290,000 300,456 0.06Philip Morris International sr unsecur SerEMTN 5.875% /2015 250,000 284,411 0.06QVC sr secured Ser144A priv plmt 7.125% /2017 (USD) 350,000 277,709 0.06BNP Paribas US Medium-Term Note Program bnk gtd sub nts Ser144A priv plmt 5.125% /2015 (France) (2) (USD) 275,000 217,921 0.04Caterpillar International Finance co gtd SerEMTN 1.375% /2015 (Ireland) (2) 200,000 203,316 0.04Citigroup subord SerEMTN 1.458% /2017 (5) 200,000 188,455 0.04American International Group sr unsecur 6.4% /2020 (USD) 185,000 173,420 0.04Countrywide Alternative Loan Trust 2006-OA18 A3 0.4797% /2046 (5) (USD) 163,004 3,727 0.00
total for United States of america 3.50
Corporate Bonds (continued)
Spain (continued)
Corporate Bonds (continued)
italy (continued)
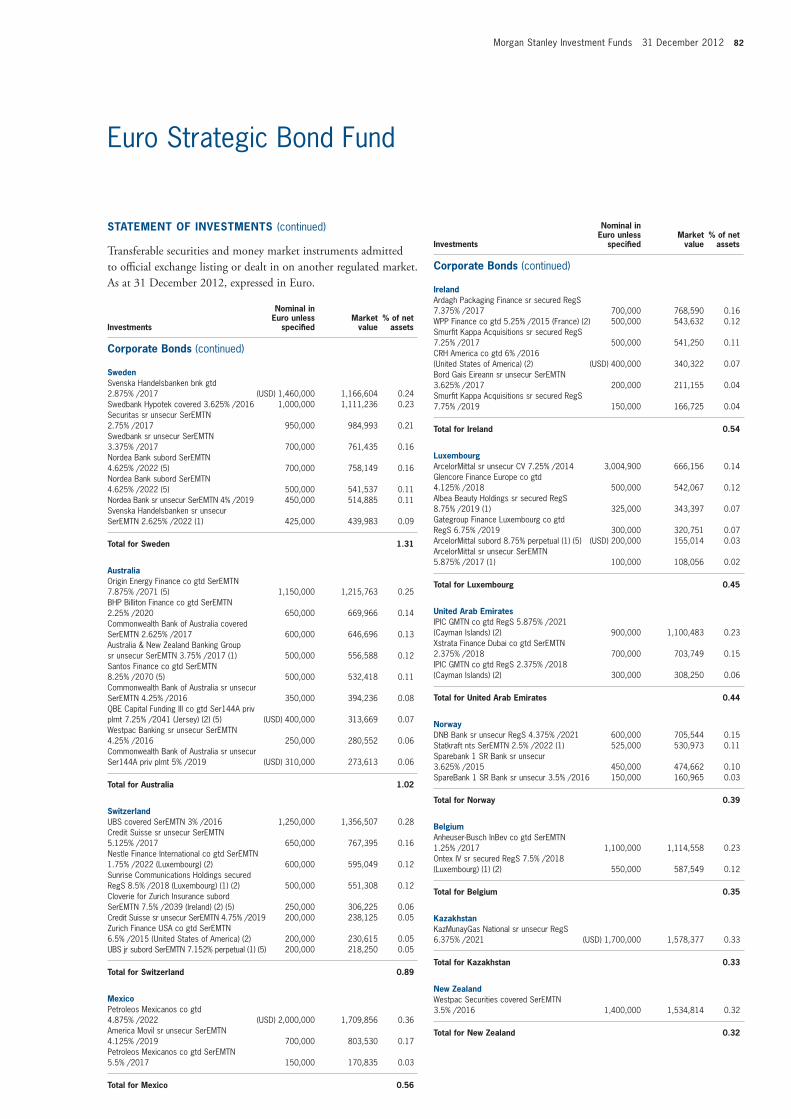
Morgan Stanley Investment Funds 31 December 2012 82
Euro Strategic Bond Fund
investments
nominal in euro unless
specifiedmarket
value% of net
assets
SwedenSvenska Handelsbanken bnk gtd 2.875% /2017 (USD) 1,460,000 1,166,604 0.24Swedbank Hypotek covered 3.625% /2016 1,000,000 1,111,236 0.23Securitas sr unsecur SerEMTN 2.75% /2017 950,000 984,993 0.21Swedbank sr unsecur SerEMTN 3.375% /2017 700,000 761,435 0.16Nordea Bank subord SerEMTN 4.625% /2022 (5) 700,000 758,149 0.16Nordea Bank subord SerEMTN 4.625% /2022 (5) 500,000 541,537 0.11Nordea Bank sr unsecur SerEMTN 4% /2019 450,000 514,885 0.11Svenska Handelsbanken sr unsecur SerEMTN 2.625% /2022 (1) 425,000 439,983 0.09
total for Sweden 1.31
australiaOrigin Energy Finance co gtd SerEMTN 7.875% /2071 (5) 1,150,000 1,215,763 0.25BHP Billiton Finance co gtd SerEMTN 2.25% /2020 650,000 669,966 0.14Commonwealth Bank of Australia covered SerEMTN 2.625% /2017 600,000 646,696 0.13Australia & New Zealand Banking Group sr unsecur SerEMTN 3.75% /2017 (1) 500,000 556,588 0.12Santos Finance co gtd SerEMTN 8.25% /2070 (5) 500,000 532,418 0.11Commonwealth Bank of Australia sr unsecur SerEMTN 4.25% /2016 350,000 394,236 0.08QBE Capital Funding III co gtd Ser144A priv plmt 7.25% /2041 (Jersey) (2) (5) (USD) 400,000 313,669 0.07Westpac Banking sr unsecur SerEMTN 4.25% /2016 250,000 280,552 0.06Commonwealth Bank of Australia sr unsecur Ser144A priv plmt 5% /2019 (USD) 310,000 273,613 0.06
total for australia 1.02
SwitzerlandUBS covered SerEMTN 3% /2016 1,250,000 1,356,507 0.28Credit Suisse sr unsecur SerEMTN 5.125% /2017 650,000 767,395 0.16Nestle Finance International co gtd SerEMTN 1.75% /2022 (Luxembourg) (2) 600,000 595,049 0.12Sunrise Communications Holdings secured RegS 8.5% /2018 (Luxembourg) (1) (2) 500,000 551,308 0.12Cloverie for Zurich Insurance subord SerEMTN 7.5% /2039 (Ireland) (2) (5) 250,000 306,225 0.06Credit Suisse sr unsecur SerEMTN 4.75% /2019 200,000 238,125 0.05Zurich Finance USA co gtd SerEMTN 6.5% /2015 (United States of America) (2) 200,000 230,615 0.05UBS jr subord SerEMTN 7.152% perpetual (1) (5) 200,000 218,250 0.05
total for Switzerland 0.89
mexicoPetroleos Mexicanos co gtd 4.875% /2022 (USD) 2,000,000 1,709,856 0.36America Movil sr unsecur SerEMTN 4.125% /2019 700,000 803,530 0.17Petroleos Mexicanos co gtd SerEMTN 5.5% /2017 150,000 170,835 0.03
total for mexico 0.56
Statement of inveStmentS (continued)
transferable securities and money market instruments admitted to official exchange listing or dealt in on another regulated market. as at 31 December 2012, expressed in euro.
investments
nominal in euro unless
specifiedmarket
value% of net
assets
irelandArdagh Packaging Finance sr secured RegS 7.375% /2017 700,000 768,590 0.16WPP Finance co gtd 5.25% /2015 (France) (2) 500,000 543,632 0.12Smurfit Kappa Acquisitions sr secured RegS 7.25% /2017 500,000 541,250 0.11CRH America co gtd 6% /2016 (United States of America) (2) (USD) 400,000 340,322 0.07Bord Gais Eireann sr unsecur SerEMTN 3.625% /2017 200,000 211,155 0.04Smurfit Kappa Acquisitions sr secured RegS 7.75% /2019 150,000 166,725 0.04
total for ireland 0.54
LuxembourgArcelorMittal sr unsecur CV 7.25% /2014 3,004,900 666,156 0.14Glencore Finance Europe co gtd 4.125% /2018 500,000 542,067 0.12Albea Beauty Holdings sr secured RegS 8.75% /2019 (1) 325,000 343,397 0.07Gategroup Finance Luxembourg co gtd RegS 6.75% /2019 300,000 320,751 0.07ArcelorMittal subord 8.75% perpetual (1) (5) (USD) 200,000 155,014 0.03ArcelorMittal sr unsecur SerEMTN 5.875% /2017 (1) 100,000 108,056 0.02
total for Luxembourg 0.45
United arab emiratesIPIC GMTN co gtd RegS 5.875% /2021 (Cayman Islands) (2) 900,000 1,100,483 0.23Xstrata Finance Dubai co gtd SerEMTN 2.375% /2018 700,000 703,749 0.15IPIC GMTN co gtd RegS 2.375% /2018 (Cayman Islands) (2) 300,000 308,250 0.06
total for United arab emirates 0.44
norwayDNB Bank sr unsecur RegS 4.375% /2021 600,000 705,544 0.15Statkraft nts SerEMTN 2.5% /2022 (1) 525,000 530,973 0.11Sparebank 1 SR Bank sr unsecur 3.625% /2015 450,000 474,662 0.10SpareBank 1 SR Bank sr unsecur 3.5% /2016 150,000 160,965 0.03
total for norway 0.39
BelgiumAnheuser-Busch InBev co gtd SerEMTN 1.25% /2017 1,100,000 1,114,558 0.23Ontex IV sr secured RegS 7.5% /2018 (Luxembourg) (1) (2) 550,000 587,549 0.12
total for Belgium 0.35
KazakhstanKazMunayGas National sr unsecur RegS 6.375% /2021 (USD) 1,700,000 1,578,377 0.33
total for Kazakhstan 0.33
new ZealandWestpac Securities covered SerEMTN 3.5% /2016 1,400,000 1,534,814 0.32
total for new Zealand 0.32
Corporate Bonds (continued)
Corporate Bonds (continued)
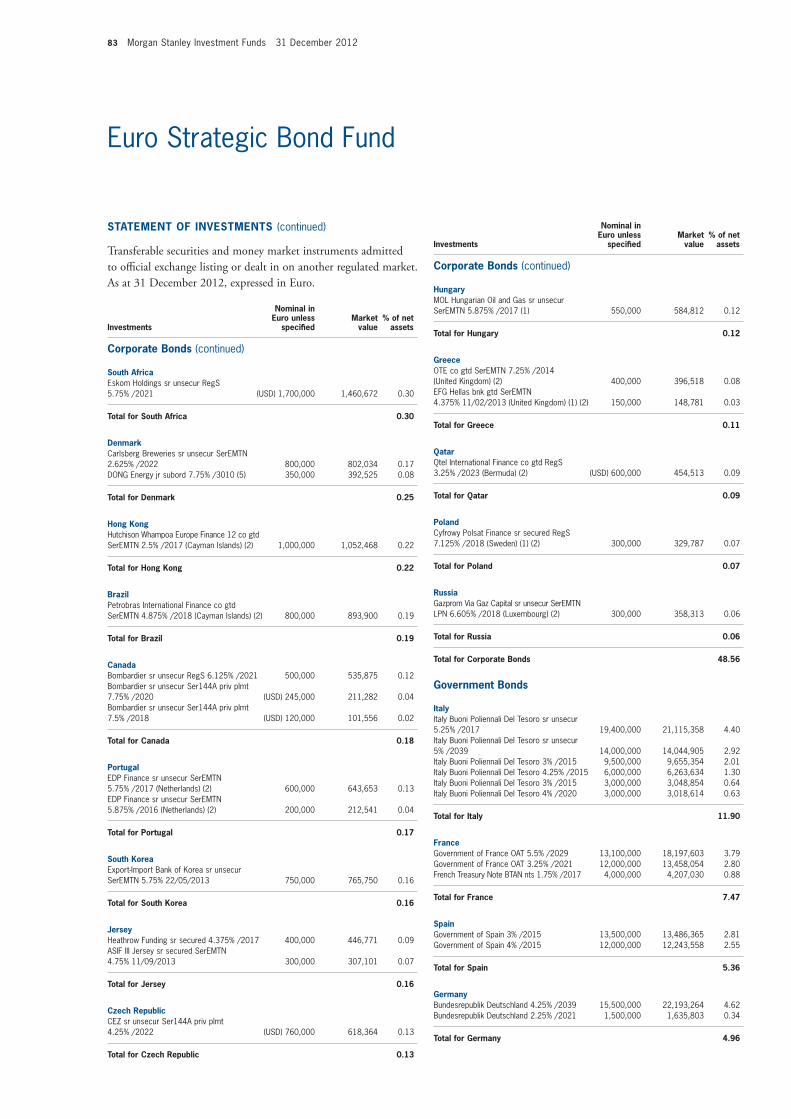
83 Morgan Stanley Investment Funds 31 December 2012
Euro Strategic Bond Fund
investments
nominal in euro unless
specifiedmarket
value% of net
assets
South africaEskom Holdings sr unsecur RegS 5.75% /2021 (USD) 1,700,000 1,460,672 0.30
total for South africa 0.30
DenmarkCarlsberg Breweries sr unsecur SerEMTN 2.625% /2022 800,000 802,034 0.17DONG Energy jr subord 7.75% /3010 (5) 350,000 392,525 0.08
total for Denmark 0.25
hong KongHutchison Whampoa Europe Finance 12 co gtd SerEMTN 2.5% /2017 (Cayman Islands) (2) 1,000,000 1,052,468 0.22
total for hong Kong 0.22
BrazilPetrobras International Finance co gtd SerEMTN 4.875% /2018 (Cayman Islands) (2) 800,000 893,900 0.19
total for Brazil 0.19
CanadaBombardier sr unsecur RegS 6.125% /2021 500,000 535,875 0.12Bombardier sr unsecur Ser144A priv plmt 7.75% /2020 (USD) 245,000 211,282 0.04Bombardier sr unsecur Ser144A priv plmt 7.5% /2018 (USD) 120,000 101,556 0.02
total for Canada 0.18
PortugalEDP Finance sr unsecur SerEMTN 5.75% /2017 (Netherlands) (2) 600,000 643,653 0.13EDP Finance sr unsecur SerEMTN 5.875% /2016 (Netherlands) (2) 200,000 212,541 0.04
total for Portugal 0.17
South KoreaExport-Import Bank of Korea sr unsecur SerEMTN 5.75% 22/05/2013 750,000 765,750 0.16
total for South Korea 0.16
JerseyHeathrow Funding sr secured 4.375% /2017 400,000 446,771 0.09ASIF III Jersey sr secured SerEMTN 4.75% 11/09/2013 300,000 307,101 0.07
total for Jersey 0.16
Czech republicCEZ sr unsecur Ser144A priv plmt 4.25% /2022 (USD) 760,000 618,364 0.13
total for Czech republic 0.13
hungaryMOL Hungarian Oil and Gas sr unsecur SerEMTN 5.875% /2017 (1) 550,000 584,812 0.12
total for hungary 0.12
GreeceOTE co gtd SerEMTN 7.25% /2014 (United Kingdom) (2) 400,000 396,518 0.08EFG Hellas bnk gtd SerEMTN 4.375% 11/02/2013 (United Kingdom) (1) (2) 150,000 148,781 0.03
total for Greece 0.11
QatarQtel International Finance co gtd RegS 3.25% /2023 (Bermuda) (2) (USD) 600,000 454,513 0.09
total for Qatar 0.09
PolandCyfrowy Polsat Finance sr secured RegS 7.125% /2018 (Sweden) (1) (2) 300,000 329,787 0.07
total for Poland 0.07
russiaGazprom Via Gaz Capital sr unsecur SerEMTN LPN 6.605% /2018 (Luxembourg) (2) 300,000 358,313 0.06
total for russia 0.06
total for Corporate Bonds 48.56
Government Bonds
italyItaly Buoni Poliennali Del Tesoro sr unsecur 5.25% /2017 19,400,000 21,115,358 4.40Italy Buoni Poliennali Del Tesoro sr unsecur 5% /2039 14,000,000 14,044,905 2.92Italy Buoni Poliennali Del Tesoro 3% /2015 9,500,000 9,655,354 2.01Italy Buoni Poliennali Del Tesoro 4.25% /2015 6,000,000 6,263,634 1.30Italy Buoni Poliennali Del Tesoro 3% /2015 3,000,000 3,048,854 0.64Italy Buoni Poliennali Del Tesoro 4% /2020 3,000,000 3,018,614 0.63
total for italy 11.90
franceGovernment of France OAT 5.5% /2029 13,100,000 18,197,603 3.79Government of France OAT 3.25% /2021 12,000,000 13,458,054 2.80French Treasury Note BTAN nts 1.75% /2017 4,000,000 4,207,030 0.88
total for france 7.47
SpainGovernment of Spain 3% /2015 13,500,000 13,486,365 2.81Government of Spain 4% /2015 12,000,000 12,243,558 2.55
total for Spain 5.36
GermanyBundesrepublik Deutschland 4.25% /2039 15,500,000 22,193,264 4.62Bundesrepublik Deutschland 2.25% /2021 1,500,000 1,635,803 0.34
total for Germany 4.96
Statement of inveStmentS (continued)
transferable securities and money market instruments admitted to official exchange listing or dealt in on another regulated market. as at 31 December 2012, expressed in euro.
investments
nominal in euro unless
specifiedmarket
value% of net
assets Corporate Bonds (continued)
Corporate Bonds (continued)

Morgan Stanley Investment Funds 31 December 2012 84
Euro Strategic Bond Fund
investments
holdings/nominal in
euro unless specified
market value
% of net assets
PolandGovernment of Poland 5.25% /2017 (PLN) 16,500,000 4,411,953 0.92Government of Poland 5.75% /2021 (PLN) 12,340,000 3,512,821 0.73Government of Poland sr unsecur SerEMTN 3.625% /2016 2,000,000 2,174,461 0.45Government of Poland sr unsecur SerEMTN 4.675% /2019 (1) 750,000 880,084 0.19
total for Poland 2.29
netherlandsGovernment of Netherlands 3.25% /2021 4,000,000 4,621,008 0.96Government of Netherlands 4% /2037 3,000,000 3,990,522 0.83
total for netherlands 1.79
mexicoMexican Bonos 10% /2024 (MXN) 59,500,000 4,871,654 1.01
total for mexico 1.01
PeruRepublic of Peru sr unsecur RegS 8.2% /2026 (PEN) 9,375,000 3,901,700 0.81
total for Peru 0.81
ChileRepublic of Chile sr unsecur 5.5% /2020 (CLP) 2,163,500,000 3,796,327 0.79
total for Chile 0.79
ColombiaRepublic of Colombia sr unsecur 7.75% /2021 (COP) 3,300,000,000 1,802,474 0.37
total for Colombia 0.37
russiaRussian Foreign Bond - Eurobond sr unsecur RegS 4.5% /2022 (USD) 2,000,000 1,732,505 0.36
total for russia 0.36
CanadaGovernment of Canada sr unsecur 3.5% /2020 1,400,000 1,665,440 0.35
total for Canada 0.35
BrazilBrazil Notas do Tesouro Nacional nts SerNTNF 10% /2017 (BRL) 390,600 1,519,502 0.31
total for Brazil 0.31
total for Government Bonds 37.77
mutual fund
Morgan Stanley Funds plc - Euro Liquidity Fund (Ireland) (2) (4) 22,353,579 22,353,579 4.65
total for mutual fund 4.65
Supra-national Bonds
European Union sr unsecur SerEMTN 3.25% /2018 7,500,000 8,489,738 1.77European Union sr unsecur SerEMTN 3.5% /2021 5,500,000 6,400,515 1.33European Financial Stability Facility govt gtd 3.375% /2021 1,850,000 2,111,023 0.44European Financial Stability Facility govt gtd SerEMTN 2.75% /2016 1,150,000 1,246,545 0.26European Union nts SerEMTN 2.75% /2016 1,000,000 1,083,855 0.22European Financial Stability Facility govt gtd SerEMTN 2.75% /2016 800,000 862,392 0.18
total for Supra-national Bonds 4.20
total for transferable securities and money market instruments admitted to official exchange listing or dealt in on another regulated market 457,242,494 95.18
Other transferable securities and money market instruments not admitted to official exchange listing or dealt in on another regulated market. as at 31 December 2012, expressed in euro.
equities
United States of americaWA Funding TR III (3) 200 0 0.00
total for United States of america 0.00
total for equities 0.00
total for other transferable securities and money market instruments not admitted to official exchange listing or dealt in on another regulated market 0 0.00
total investment Securities 457,242,494 95.18
DerivativeS
OtC and exchange traded derivatives as at 31 December 2012, expressed in euro.
futures Contracts
Descriptionmaturity
datenumber of contracts
notional commitments Counterparty
net unrealised gain/(loss) as at
31 December 2012
% of net assets
Euro BOBL Future 03/2013 143 18,278,260 Goldman Sachs 59,857 0.01Euro Bund Future 03/2013 101 14,709,640 Goldman Sachs 75,310 0.02US 2yr T-note Future 03/2013 275 45,867,184 Goldman Sachs 26,004 0.01US 5yr T-note Future 03/2013 385 36,213,979 Goldman Sachs 11,832 0.00US 10yr T-note Future 03/2013 (227) (22,790,282) Goldman Sachs 22,997 0.00
total Unrealised Gain on futures Contracts 196,000 0.04
Euro SCHATZ Future 03/2013 (75) (8,314,125) Goldman Sachs (7,272) 0.00Long Gilt Future 03/2013 (15) (2,192,692) Goldman Sachs (3,020) 0.00
Unrealised Loss on futures Contracts (10,292) 0.00
Duration hedged Share Class Euro BOBL Future 03/2013 (237) (30,293,340) Goldman Sachs (147,610) (0.03)Euro Bund Future 03/2013 (283) (41,216,120) Goldman Sachs (246,650) (0.05)Euro SCHATZ Future 03/2013 (174) (19,288,770) Goldman Sachs (4,085) 0.00
Unrealised Loss on Duration hedged futures Contracts (398,345) (0.08)
total Unrealised Loss on futures Contracts (408,637) (0.08)
net Unrealised Loss on futures Contracts (9,026,266)1 (212,637) (0.04)
1 Cash of EUR 1,625,275 held as collateral by the counterparty.
Statement of inveStmentS (continued)
transferable securities and money market instruments admitted to official exchange listing or dealt in on another regulated market. as at 31 December 2012, expressed in euro.
investments
holdings/nominal in
euro unless specified
market value
% of net assets
Government Bonds (continued)
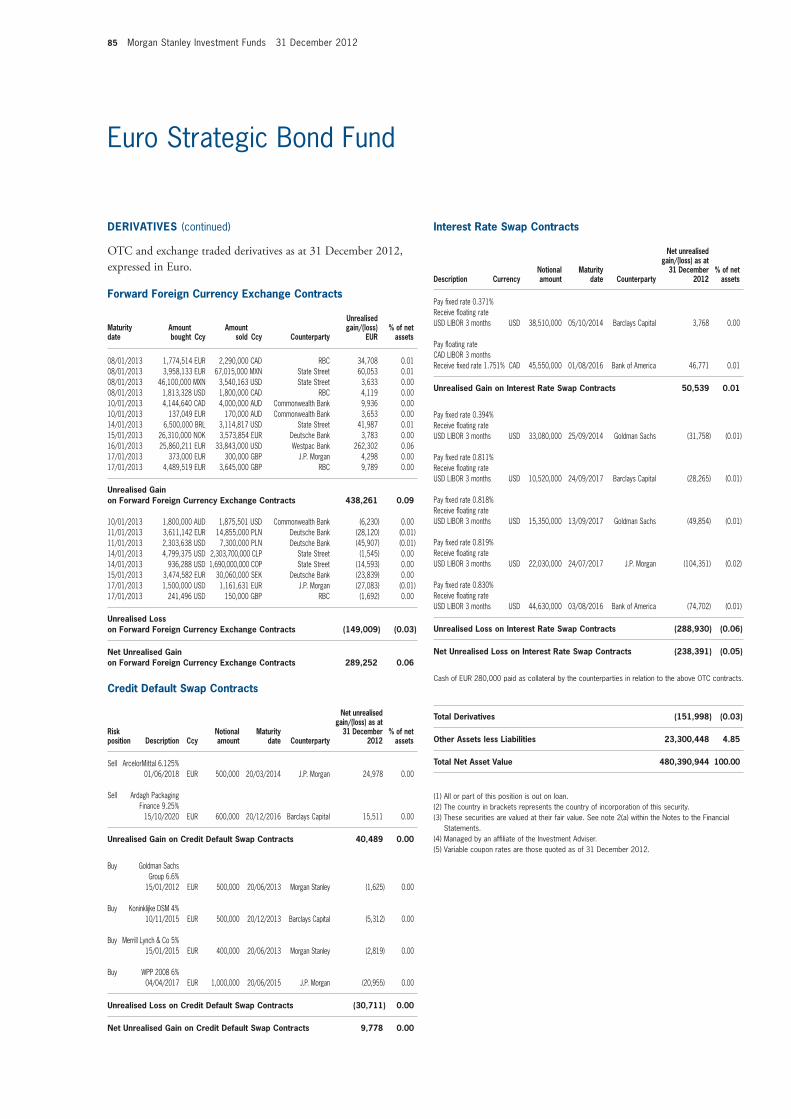
85 Morgan Stanley Investment Funds 31 December 2012
Euro Strategic Bond Fund
interest rate Swap Contracts
Description Currencynotional amount
maturity date Counterparty
net unrealised gain/(loss) as at
31 December 2012
% of net assets
Pay fixed rate 0.371% Receive floating rate USD LIBOR 3 months USD 38,510,000 05/10/2014 Barclays Capital 3,768 0.00
Pay floating rate CAD LIBOR 3 months Receive fixed rate 1.751% CAD 45,550,000 01/08/2016 Bank of America 46,771 0.01
Unrealised Gain on interest rate Swap Contracts 50,539 0.01
Pay fixed rate 0.394% Receive floating rate USD LIBOR 3 months USD 33,080,000 25/09/2014 Goldman Sachs (31,758) (0.01)
Pay fixed rate 0.811% Receive floating rate USD LIBOR 3 months USD 10,520,000 24/09/2017 Barclays Capital (28,265) (0.01)
Pay fixed rate 0.818% Receive floating rate USD LIBOR 3 months USD 15,350,000 13/09/2017 Goldman Sachs (49,854) (0.01)
Pay fixed rate 0.819% Receive floating rate USD LIBOR 3 months USD 22,030,000 24/07/2017 J.P. Morgan (104,351) (0.02)
Pay fixed rate 0.830% Receive floating rate USD LIBOR 3 months USD 44,630,000 03/08/2016 Bank of America (74,702) (0.01)
Unrealised Loss on interest rate Swap Contracts (288,930) (0.06)
net Unrealised Loss on interest rate Swap Contracts (238,391) (0.05)
Cash of EUR 280,000 paid as collateral by the counterparties in relation to the above OTC contracts.
total Derivatives (151,998) (0.03)
other assets less Liabilities 23,300,448 4.85
total net asset value 480,390,944 100.00
(1) All or part of this position is out on loan.(2) The country in brackets represents the country of incorporation of this security.(3) These securities are valued at their fair value. See note 2(a) within the Notes to the Financial
Statements.(4) Managed by an affiliate of the Investment Adviser.(5) Variable coupon rates are those quoted as of 31 December 2012.
forward foreign Currency exchange Contracts
maturity date
amount bought Ccy
amount sold Ccy Counterparty
Unrealised gain/(loss)
eUr% of net
assets
08/01/2013 1,774,514 EUR 2,290,000 CAD RBC 34,708 0.01 08/01/2013 3,958,133 EUR 67,015,000 MXN State Street 60,053 0.01 08/01/2013 46,100,000 MXN 3,540,163 USD State Street 3,633 0.00 08/01/2013 1,813,328 USD 1,800,000 CAD RBC 4,119 0.00 10/01/2013 4,144,640 CAD 4,000,000 AUD Commonwealth Bank 9,936 0.00 10/01/2013 137,049 EUR 170,000 AUD Commonwealth Bank 3,653 0.00 14/01/2013 6,500,000 BRL 3,114,817 USD State Street 41,987 0.01 15/01/2013 26,310,000 NOK 3,573,854 EUR Deutsche Bank 3,783 0.00 16/01/2013 25,860,211 EUR 33,843,000 USD Westpac Bank 262,302 0.06 17/01/2013 373,000 EUR 300,000 GBP J.P. Morgan 4,298 0.00 17/01/2013 4,489,519 EUR 3,645,000 GBP RBC 9,789 0.00
Unrealised Gain on forward foreign Currency exchange Contracts 438,261 0.09
10/01/2013 1,800,000 AUD 1,875,501 USD Commonwealth Bank (6,230) 0.00 11/01/2013 3,611,142 EUR 14,855,000 PLN Deutsche Bank (28,120) (0.01)11/01/2013 2,303,638 USD 7,300,000 PLN Deutsche Bank (45,907) (0.01)14/01/2013 4,799,375 USD 2,303,700,000 CLP State Street (1,545) 0.00 14/01/2013 936,288 USD 1,690,000,000 COP State Street (14,593) 0.00 15/01/2013 3,474,582 EUR 30,060,000 SEK Deutsche Bank (23,839) 0.00 17/01/2013 1,500,000 USD 1,161,631 EUR J.P. Morgan (27,083) (0.01)17/01/2013 241,496 USD 150,000 GBP RBC (1,692) 0.00
Unrealised Loss on forward foreign Currency exchange Contracts (149,009) (0.03)
net Unrealised Gain on forward foreign Currency exchange Contracts 289,252 0.06
Credit Default Swap Contracts
risk position Description Ccy
notional amount
maturity date Counterparty
net unrealised gain/(loss) as at
31 December 2012
% of net assets
Sell ArcelorMittal 6.125% 01/06/2018 EUR 500,000 20/03/2014 J.P. Morgan 24,978 0.00
Sell Ardagh Packaging Finance 9.25% 15/10/2020 EUR 600,000 20/12/2016 Barclays Capital 15,511 0.00
Unrealised Gain on Credit Default Swap Contracts 40,489 0.00
Buy Goldman Sachs Group 6.6% 15/01/2012 EUR 500,000 20/06/2013 Morgan Stanley (1,625) 0.00
Buy Koninklijke DSM 4% 10/11/2015 EUR 500,000 20/12/2013 Barclays Capital (5,312) 0.00
Buy Merrill Lynch & Co 5% 15/01/2015 EUR 400,000 20/06/2013 Morgan Stanley (2,819) 0.00
Buy WPP 2008 6% 04/04/2017 EUR 1,000,000 20/06/2015 J.P. Morgan (20,955) 0.00
Unrealised Loss on Credit Default Swap Contracts (30,711) 0.00
net Unrealised Gain on Credit Default Swap Contracts 9,778 0.00
DerivativeS (continued)
OtC and exchange traded derivatives as at 31 December 2012, expressed in euro.

Morgan Stanley Investment Funds 31 December 2012 86
Please refer to the full prospectus for the Fund’s investment objective and policy.
European Currencies High Yield Bond Fund
Corporate Bonds
United Kingdom GKN Holdings sr unsecur SerEMTN 5.375% /2022 (GBP) 6,000,000 7,634,301 1.24 Ineos Group Holdings secured RegS7.875% /2016 (Luxembourg) (1) (2) 7,500,000 7,476,150 1.22 Jaguar Land Rover co gtd RegS8.25% /2020 (1) (GBP) 4,600,000 6,286,236 1.02 Priory Group No 3 co gtd RegS8.875% /2019 (1) (GBP) 4,500,000 5,761,653 0.94 Elli Finance UK sr secured RegS8.75% /2019 (GBP) 4,021,000 5,436,740 0.88 Anglian Water Osprey Financing sr secured SerEMTN 7% /2018 (GBP) 4,000,000 5,345,238 0.87 Rexam subord 6.75% /2067 (1) (5) 5,000,000 5,260,575 0.86 House of Fraser Funding sr secured RegS8.875% /2018 (GBP) 4,000,000 5,164,025 0.84 Virgin Media Finance co gtd5.125% /2022 (GBP) 3,250,000 4,062,458 0.65 Heathrow Finance sr secured SerEMTN7.125% /2017 (GBP) 3,000,000 4,007,306 0.65 Virgin Media Finance co gtd 8.875% /2019 (GBP) 2,003,000 2,805,915 0.46 Boparan Finance co gtd RegS9.875% /2018 (1) (GBP) 2,000,000 2,787,023 0.45 Jaguar Land Rover co gtd RegS8.25% /2020 (GBP) 1,900,000 2,596,489 0.42 Kerling sr secured RegS 10.625% /2017 (1) 2,500,000 2,435,225 0.40 Heathrow Finance sr secured RegS5.375% /2019 (GBP) 1,775,000 2,207,796 0.36 Virgin Media Finance co gtd 5.125% /2022 (GBP) 1,750,000 2,187,477 0.36 FCE Bank sr unsecur SerEMTN9.375% /2014 2,000,000 2,166,560 0.35 Ineos Finance sr secured RegS 7.25% /2019 (5) 2,000,000 2,087,980 0.34 Bakkavor Finance 2 sr secured RegS8.25% /2018 (GBP) 1,500,000 1,875,386 0.31 Dixons Retail co gtd8.75% /2017 (GBP) 1,000,000 1,337,809 0.22 Priory Group No 3 sr secured RegS 7% /2018 (GBP) 1,000,000 1,307,865 0.21 Lloyds TSB Bank subord SerEMTN6.5% /2020 (1) 1,000,000 1,144,987 0.19 Ineos Finance sr secured RegS9.25% /2015 (1) 1,030,000 1,110,994 0.18
total for United Kingdom 13.42
Germany HeidelbergCement Finance Luxembourg co gtd 7.5% /2020 (Luxembourg) (1) (2) 9,500,000 11,254,555 1.83 Conti-Gummi Finance sr secured RegS7.125% /2018 (Netherlands) (2) 6,500,000 6,959,680 1.13 KION Finance sr secured RegS7.875% /2018 (Luxembourg) (1) (2) 5,000,000 5,413,850 0.88 Conti-Gummi Finance sr secured RegS7.5% /2017 (Netherlands) (2) 5,000,000 5,368,425 0.87 Unitymedia co gtd RegS 9.625% /2019 4,500,000 5,075,482 0.83 HeidelbergCement Finance co gtd 8% /2017 (Netherlands) (2) 4,000,000 4,712,360 0.77 Heckler & Koch sr secured RegS 9.5% /2018 (1) 4,000,000 3,513,320 0.57 Brenntag Finance co gtd5.5% /2018 (Netherlands) (2) 3,000,000 3,423,960 0.56
inveStment aim
To provide an attractive rate of return, measured in Euro, through investments worldwide primarily in lower rated and unrated fixed income securities issued by governments, agencies and corporations that offer a yield above that generally available on debt securities in the four highest rating categories of S&P or Moody’s denominated in European currencies.
Statement of inveStmentS
transferable securities and money market instruments admitted to official exchange listing or dealt in on another regulated market. as at 31 December 2012, expressed in euro.
investments
nominal in euro unless
specifiedmarket
value% of net
assets

87 Morgan Stanley Investment Funds 31 December 2012
European Currencies High Yield Bond Fund
Statement of inveStmentS (continued)
transferable securities and money market instruments admitted to official exchange listing or dealt in on another regulated market. as at 31 December 2012, expressed in euro.
investments
nominal in euro unless
specifiedmarket
value% of net
assets
investments
nominal in euro unless
specifiedmarket
value% of net
assets
Unitymedia Hessen & Co sr secured RegS7.5% /2019 3,000,000 3,314,160 0.54 Grohe Holding sr secured RegS4.183% /2017 (5) 3,000,000 3,036,810 0.50 Commerzbank subord SerEMTN 7.75% /2021 (1) 2,300,000 2,477,527 0.40 EnBW Energie Baden-Wuerttemberg jr subord SerEMTN 7.375% /2072 (5) 2,000,000 2,239,441 0.36 Phoenix PIB Finance co gtd RegS9.625% /2014 (Netherlands) (2) 2,000,000 2,225,000 0.36 Techem Energy Metering Service co gtd RegS 7.875% /2020 (1) 2,000,000 2,221,730 0.36 Kabel Deutschland Vertrieb und Service sr secured RegS 6.5% /2018 2,000,000 2,168,750 0.35 FAGE USA Dairy Industry co gtd9.875% /2020 (United States of America) (2) (USD) 2,500,000 2,051,924 0.33 Unitymedia KabelBW secured RegS 9.5% /2021 1,500,000 1,747,185 0.29 Techem sr secured RegS6.125% /2019 1,325,000 1,432,086 0.23 HeidelbergCement Finance Luxembourg co gtd 8.5% /2019 (Luxembourg) (1) (2) 1,000,000 1,249,090 0.20 Grohe Holding secured RegS8.75% /2017 (5) 1,000,000 1,047,500 0.17 Unitymedia Hessen & Co sr secured RegS5.5% /2022 1,000,000 1,026,155 0.17 Aabar Investments sr unsecur RegS CV 4% /2016 (United Arab Emirates) (2) 900,000 920,025 0.15 SGL Carbon sr unsecur CV 2.75% /2018 900,000 911,363 0.15 Celesio Finance co gtd CV2.5% /2018 (Netherlands) (2) 900,000 904,770 0.15 Fresenius Medical Care US Finance co gtd6.875% /2017 (United States of America) (2) (USD) 1,000,000 865,643 0.14 Techem sr secured RegS 6.125% /2019 675,000 729,553 0.12 Fresenius Medical Care US Finance II co gtd RegS 5.625% /2019 (United States of America) (2) (USD) 455,000 372,159 0.06 HeidelbergCement Finance co gtd SerEMTN9.5% /2018 (Luxembourg) (2) 50,000 64,413 0.01
total for Germany 12.48
france Wendel unsecur SerEMTN 5.875% /2019 8,000,000 8,647,080 1.40 Banque PSA Finance sr unsecur SerEMTN 6% /2014 6,000,000 6,324,894 1.03 Faurecia sr unsecur SerEMTN 8.75% /2019 (1) 5,500,000 5,790,262 0.94 Lafarge sr unsecur SerEMTN 5.875% /2019 5,000,000 5,446,500 0.89 Europcar Groupe subord RegS 9.375% /2018 5,000,000 4,464,900 0.73 Crown European Holdings co gtd RegS7.125% /2018 4,000,000 4,414,680 0.72 SPCM sr unsecur RegS 5.5% /2020 4,000,000 4,256,380 0.69 Renault sr unsecur SerEMTN 4.625% /2016 4,000,000 4,195,120 0.68 Europcar Groupe secured RegS 11.5% /2017 3,500,000 3,705,187 0.60 Lafarge nts SerEMTN 6.25% /2018 3,000,000 3,347,970 0.55 Renault unsecur SerEMTN 4.625% /2017 3,000,000 3,131,430 0.51 Rexel co gtd 7% /2018 (1) 2,500,000 2,763,012 0.45 Nexans sr unsecur SerEMTN 5.75% /2017 (1) 2,500,000 2,685,150 0.44 Lafarge sr unsecur SerEMTN 8.875% /2016 (1) 2,000,000 2,415,400 0.39 Lafarge sr unsecur SerEMTN 8.875% /2014 2,000,000 2,190,730 0.36
Lafarge sr unsecur SerEMTN 6.625% /2018 (1) 1,000,000 1,130,095 0.18 Rexel co gtd 8.25% /2016 1,000,000 1,099,060 0.18 Faurecia co gtd SerEMTN 9.375% /2016 (1) 750,000 871,654 0.14
total for france 10.88
netherlands Ziggo Bond co gtd RegS 8% /2018 7,040,000 7,770,224 1.26 OI European Group co gtd RegS 6.75% /2020 5,600,000 6,384,252 1.04 UPC Holding secured RegS 6.375% /2022 (1) 6,000,000 6,127,560 1.00 Refresco Group sr secured RegS 7.375% /2018 (1) 5,000,000 5,237,200 0.85 FMC Finance VIII co gtd RegS6.5% /2018 (Luxembourg) (1) (2) 3,250,000 3,809,877 0.62 Carlson Wagonlit sr secured RegS 7.5% /2019 (1) 3,400,000 3,648,455 0.59 Fresenius Finance co gtd RegS 4.25% /2019 (1) 3,000,000 3,264,090 0.53 UPCB Finance II sr secured RegS6.375% /2020 (Cayman Islands) (2) 3,000,000 3,205,860 0.52 SRLEV bnk gtd 9% /2041 (5) 2,500,000 2,377,538 0.39 UPCB Finance sr secured RegS7.625% /2020 (Cayman Islands) (1) (2) 2,000,000 2,200,750 0.36 UPC Holding secured RegS 6.375% /2022 2,000,000 2,042,520 0.33 LyondellBasell Industries sr unsecur 5% /2019 (USD) 1,500,000 1,262,489 0.21 FMC Finance VIII co gtd RegS5.25% /2019 (Luxembourg) (1) (2) 300,000 334,295 0.05
total for netherlands 7.75
italy Fiat Industrial Finance Europe co gtd SerEMTN6.25% /2018 (Luxembourg) (1) (2) 7,000,000 7,864,605 1.28 Lottomatica Group jr subord RegS8.25% /2066 (1) (5) 5,500,000 5,785,258 0.94 Wind Acquisition Holdings Finance sr secured RegS PIK 12.25% /2017 (Luxembourg) (1) (2) 5,293,350 5,293,297 0.86 Fiat Finance & Trade co gtd SerEMTN7.375% /2018 (Luxembourg) (2) 5,000,000 5,212,400 0.85 Wind Acquisition Finance secured RegS 11.75% /2017 (Luxembourg) (1) (2) 4,760,000 4,982,530 0.81 Wind Acquisition Finance sr secured RegS7.375% /2018 (Luxembourg) (2) 4,450,000 4,510,164 0.73 Edison sr unsecur SerEMTN 3.875% /2017 4,000,000 4,361,194 0.71 Davide Campari-Milano sr unsecur 4.5% /2019 2,750,000 2,893,083 0.47 Fiat Finance & Trade co gtd SerGMTN6.375% /2016 (Luxembourg) (1) (2) 2,500,000 2,564,013 0.42 Fiat Industrial Finance Europe co gtd SerEMTN5.25% /2015 (Luxembourg) (2) 2,000,000 2,124,000 0.35 Fiat Finance & Trade co gtd7.75% /2016 (Luxembourg) (2) 1,000,000 1,062,720 0.17 Guala Closures sr secured RegS 5.568% /2019 900,000 915,750 0.15
total for italy 7.74
Luxembourg ArcelorMittal sr unsecur SerEMTN 5.875% /2017 (1) 6,000,000 6,483,360 1.05 Telenet Finance V Luxembourg sr secured RegS 6.25% /2022 5,000,000 5,337,300 0.87 Lecta sr secured RegS 8.875% /2019 (1) 5,000,000 5,304,450 0.86 Spie BondCo 3 SCA co gtd RegS 11% /2019 4,000,000 4,363,880 0.71 ARD Finance sr secured RegS PIK 11.125% /2018 3,564,033 3,744,819 0.61 Albea Beauty Holdings sr secured RegS8.75% /2019 (1) 3,500,000 3,698,118 0.60 Codere Finance Luxembourg sr secured RegS8.25% /2015 (1) 4,000,000 3,357,080 0.55
Corporate Bonds (continued)
Germany (continued)
Corporate Bonds (continued)
france (continued)

Morgan Stanley Investment Funds 31 December 2012 88
European Currencies High Yield Bond Fund
Gategroup Finance Luxembourg co gtd RegS6.75% /2019 3,000,000 3,207,510 0.52 Bormioli Rocco Holdings sr secured RegS 10% /2018 (1) 2,808,000 2,990,520 0.49 Matterhorn Midco co gtd RegS7.75% /2020 (1) 2,106,000 2,155,491 0.35 Numericable Finance & Co sr secured RegS8.75% /2019 1,500,000 1,604,550 0.26 ArcelorMittal sr unsecur CV 7.25% /2014 3,786,200 839,363 0.13 Codere Finance Luxembourg sr secured RegS8.25% /2015 1,000,000 830,000 0.14 ArcelorMittal subord 8.75% perpetual (1) (5) (USD) 700,000 542,550 0.09 Hellas Telecommunications Luxembourg II subord nts RegS defaulted 0% /2015 1,000,000 5,100 0.00
total for Luxembourg 7.23
Portugal Brisa Concessao Rodoviaria sr secured SerEMTN 6.875% /2018 5,900,000 6,239,427 1.02 EDP Finance sr unsecur SerEMTN4.625% /2016 (Netherlands) (1) (2) 6,000,000 6,174,960 1.00 EDP Finance sr unsecur SerEMTN5.75% /2017 (Netherlands) (2) 5,000,000 5,363,775 0.87 Portugal Telecom International Finance sr unsecur SerGMTN 4.375% /2017 (Netherlands) (1) (2) 4,000,000 4,068,820 0.66 EDP Finance sr unsecur SerEMTN6.625% /2017 (Netherlands) (2) (GBP) 2,000,000 2,624,925 0.43 EDP Finance sr unsecur SerEMTN5.875% /2016 (Netherlands) (2) 2,300,000 2,444,222 0.40 Portugal Telecom International Finance sr unsecur SerEMTN5.875% /2018 (Netherlands) (2) 2,000,000 2,077,670 0.34 Portugal Telecom International Finance sr unsecur SerEMTN5.625% /2016 (Netherlands) (1) (2) 1,000,000 1,057,765 0.17
total for Portugal 4.89
Spain Nara Cable Funding sr secured RegS8.875% /2018 (Ireland) (1) (2) 6,000,000 6,101,250 0.99 Cirsa Funding Luxembourg co gtd RegS8.75% /2018 (Luxembourg) (2) 5,500,000 5,500,990 0.90 Obrascon Huarte Lain sr unsecur SerEMTN8.75% /2018 (1) 4,000,000 4,383,000 0.71 Campofrio Food Group co gtd RegS8.25% /2016 (1) 4,000,000 4,301,420 0.70 Obrascon Huarte Lain sr unsecur SerEMTN7.375% /2015 3,000,000 3,235,440 0.53 Ono Finance II co gtd RegS 11.125% /2019 (Ireland) (1) (2) 1,950,000 1,874,067 0.31 Ono Finance II co gtd RegS 11.125% /2019 (Ireland) (2) 1,050,000 1,009,113 0.16
total for Spain 4.30
United States of america GMAC International Finance co gtd 7.5% /2015 (Netherlands) (2) 4,000,000 4,384,180 0.71 Iron Mountain co gtd SerEMTN 6.75% /2018 3,800,000 3,927,490 0.64 Capsugel FinanceCo co gtd RegS 9.875% /2019 (Luxembourg) (2) 3,000,000 3,393,000 0.55 Jarden co gtd 7.5% /2020 2,000,000 2,200,000 0.36 Momentive Performance Materials secured9.5% /2021 (1) 2,500,000 1,846,863 0.30 Continental Resources co gtd 7.125% /2021 (USD) 1,800,000 1,540,361 0.25 WMG Acquisition sr secured RegS 6.25% /2021 1,200,000 1,228,998 0.20 AMERIGROUP sr unsecur 7.5% /2019 (USD) 1,165,000 1,061,951 0.17 SunGard Data Systems co gtd 7.375% /2018 (USD) 1,000,000 813,205 0.14 Concho Resources co gtd 7% /2021 (USD) 555,000 470,222 0.08 Travelport co gtd 10.875% /2016 1,100,000 445,500 0.07
total for United States of america 3.47
ireland Smurfit Kappa Acquisitions sr secured RegS 7.75% /2019 6,000,000 6,669,000 1.08 Rottapharm co gtd RegS 6.125% /2019 2,900,000 3,021,249 0.49 Ardagh Glass Finance co gtd RegS 8.75% /2020 (1) 2,500,000 2,624,300 0.43 Ardagh Glass Finance co gtd RegS 7.125% /2017 (1) 2,000,000 2,064,000 0.33 Ardagh Packaging Finance co gtd RegS 9.25% /2020 (1) 1,500,000 1,638,338 0.27 Ardagh Packaging Finance sr secured RegS 7.375% /2017 1,000,000 1,097,985 0.18 Smurfit Kappa Acquisitions sr secured Ser144A priv plmt 5.125% /2018 1,000,000 1,055,230 0.17 Smurfit Kappa Acquisitions sr secured RegS 5.125% /2018 (1) 500,000 530,000 0.09
total for ireland 3.04
australia Santos Finance co gtd SerEMTN 8.25% /2070 (5) 6,000,000 6,389,010 1.04 Origin Energy Finance co gtd SerEMTN 7.875% /2071 (5) 5,000,000 5,285,925 0.86 QBE Capital Funding III co gtd Ser144A priv plmt 7.25% /2041 (Jersey) (2) (5) (USD) 1,650,000 1,293,886 0.21 FMG Resources August 2006 Proprietary co gtd Ser144A priv plmt 8.25% /2019 (USD) 1,500,000 1,214,134 0.20
total for australia 2.31
Canada Bombardier sr unsecur RegS 6.125% /2021 8,500,000 9,109,875 1.48
total for Canada 1.48
Poland Cyfrowy Polsat Finance sr secured RegS 7.125% /2018 (Sweden) (1) (2) 2,700,000 2,968,083 0.48 Polish Television Holding sr secured RegS step cpn 11.25% /2017 (Netherlands) (1) (2) 2,250,000 2,463,750 0.40 TVN Finance III co gtd RegS 7.875% /2018 (Sweden) (2) 2,000,000 2,132,450 0.35
total for Poland 1.23
Statement of inveStmentS (continued)
transferable securities and money market instruments admitted to official exchange listing or dealt in on another regulated market. as at 31 December 2012, expressed in euro.
investments
nominal in euro unless
specifiedmarket
value% of net
assets
investments
nominal in euro unless
specifiedmarket
value% of net
assets
Corporate Bonds (continued)
Luxembourg (continued)
Corporate Bonds (continued)

89 Morgan Stanley Investment Funds 31 December 2012
European Currencies High Yield Bond Fund
Statement of inveStmentS (continued)
transferable securities and money market instruments admitted to official exchange listing or dealt in on another regulated market. as at 31 December 2012, expressed in euro.
investments
nominal in euro unless
specifiedmarket
value% of net
assets
investments holdingsmarket
value% of net
assets
Switzerland Sunrise Communications Holdings secured RegS8.5% /2018 (Luxembourg) (1) (2) 6,000,000 6,615,690 1.08 Sunrise Communications International sr secured RegS 7% /2017 (Luxembourg) (2) 250,000 273,000 0.05
total for Switzerland 1.13
hungary MOL Hungarian Oil and Gas sr unsecur SerEMTN5.875% /2017 (1) 6,500,000 6,911,418 1.12
total for hungary 1.12
Belgium Ontex IV sr secured RegS 7.5% /2018 (Luxembourg) (1) (2) 2,700,000 2,884,329 0.47 Ontex IV co gtd RegS 9% /2019 (Luxembourg) (1) (2) 2,500,000 2,646,875 0.43
total for Belgium 0.90
Greece OTE co gtd SerEMTN7.25% /2014 (United Kingdom) (2) 2,700,000 2,676,497 0.43 OTE co gtd SerEMTN 5% 05/08/2013 (United Kingdom) (2) 1,500,000 1,490,685 0.24 OTE co gtd SerGMTN4.625% /2016 (United Kingdom) (2) 1,500,000 1,331,790 0.22
total for Greece 0.89
Sweden NorCell sr unsecur RegS PIK 12.4% /2019 5,000,000 4,917,075 0.80
total for Sweden 0.80
South africa Edcon Proprietary secured RegS 3.433% /2014 (5) 3,000,000 2,888,715 0.47 Edcon Proprietary sr secured RegS 9.5% /2018 2,000,000 1,939,980 0.31 Edcon Holdings Proprietary secured RegS5.683% /2015 (5) 51,000 47,530 0.01
total for South africa 0.79
new Zealand Beverage Packaging Holdings Luxembourg II secured RegS 9.5% /2017 (Luxembourg) (1) (2) 3,000,000 3,130,005 0.51
total for new Zealand 0.51
Croatia Agrokor co gtd RegS 9.125% /2020 2,000,000 2,176,820 0.35
total for Croatia 0.35
Czech republic New World Resources sr unsecur RegS7.375% /2015 (United Kingdom) (2) 1,700,000 1,738,301 0.29
total for Czech republic 0.29
total for Corporate Bonds 87.00
mutual fund
Morgan Stanley Funds plc - Euro Liquidity Fund (Ireland) (2) (4) 27,807,489 27,807,489 4.52
total for mutual fund 4.52
equities
United States of america General Motors 8,703 183,615 0.03 Motors Liquidation 2,185 33,884 0.01 XO Holdings 1,023 0 0.00
total for United States of america 0.04
total for equities 0.04
Warrants
United States of america General Motors Wts exp. 10/07/2016 7,912 111,145 0.02 General Motors Wts exp. 10/07/2019 7,912 71,044 0.01
total for United States of america 0.03
total for Warrants 0.03
total investment Securities 562,992,539 91.59
DerivativeS
OtC and exchange traded derivatives as at 31 December 2012, expressed in euro.
futures Contracts
Descriptionmaturity
datenumber of contracts
notional commitments Counterparty
net unrealised gain/(loss) as at
31 December 2012
% of net assets
US 10yr T-note Future 03/2013 (52) (5,220,681) Goldman Sachs 4,810 0.00
total Unrealised Gain on futures Contracts 4,810 0.00
US 5yr T-note Future 03/2013 (33) (3,104,055) Goldman Sachs (1,498) 0.00
Unrealised Loss on futures Contracts (1,498) 0.00
Duration hedged Share Class Euro BOBL Future 03/2013 (64) (8,180,481) Goldman Sachs (40,480) (0.01)Euro Bund Future 03/2013 (11) (1,602,040) Goldman Sachs (8,990) 0.00Euro SCHATZ Future 03/2013 (32) (3,547,360) Goldman Sachs (2,857) 0.00
Unrealised Loss on Duration hedged futures Contracts (52,327) (0.01)
total Unrealised Loss on futures Contracts (53,825) (0.01)
net Unrealised Loss on futures Contracts (21,654,617)1 (49,015) (0.01)
1 Cash of EUR 201,671 held as collateral by the counterparty.
Corporate Bonds (continued)
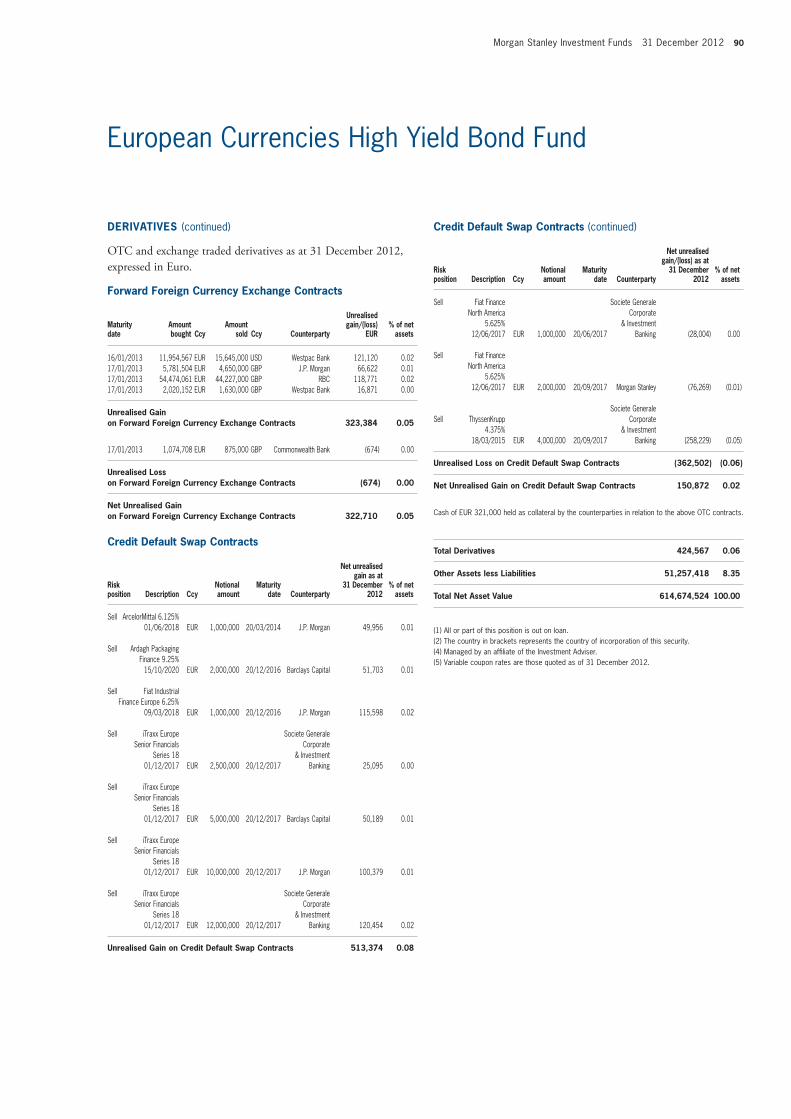
Morgan Stanley Investment Funds 31 December 2012 90
European Currencies High Yield Bond Fund
DerivativeS (continued)
OtC and exchange traded derivatives as at 31 December 2012, expressed in euro.
forward foreign Currency exchange Contracts
maturity date
amount bought Ccy
amount sold Ccy Counterparty
Unrealised gain/(loss)
eUr% of net
assets
16/01/2013 11,954,567 EUR 15,645,000 USD Westpac Bank 121,120 0.02 17/01/2013 5,781,504 EUR 4,650,000 GBP J.P. Morgan 66,622 0.01 17/01/2013 54,474,061 EUR 44,227,000 GBP RBC 118,771 0.02 17/01/2013 2,020,152 EUR 1,630,000 GBP Westpac Bank 16,871 0.00
Unrealised Gain on forward foreign Currency exchange Contracts 323,384 0.05
17/01/2013 1,074,708 EUR 875,000 GBP Commonwealth Bank (674) 0.00
Unrealised Loss on forward foreign Currency exchange Contracts (674) 0.00
net Unrealised Gain on forward foreign Currency exchange Contracts 322,710 0.05
Credit Default Swap Contracts
risk position Description Ccy
notional amount
maturity date Counterparty
net unrealised gain as at
31 December 2012
% of net assets
Sell ArcelorMittal 6.125% 01/06/2018 EUR 1,000,000 20/03/2014 J.P. Morgan 49,956 0.01
Sell Ardagh Packaging Finance 9.25% 15/10/2020 EUR 2,000,000 20/12/2016 Barclays Capital 51,703 0.01
Sell Fiat Industrial Finance Europe 6.25% 09/03/2018 EUR 1,000,000 20/12/2016 J.P. Morgan 115,598 0.02
Sell iTraxx Europe Senior Financials Series 18 01/12/2017 EUR 2,500,000 20/12/2017
Societe Generale Corporate
& Investment Banking 25,095 0.00
Sell iTraxx Europe Senior Financials Series 18 01/12/2017 EUR 5,000,000 20/12/2017 Barclays Capital 50,189 0.01
Sell iTraxx Europe Senior Financials Series 18 01/12/2017 EUR 10,000,000 20/12/2017 J.P. Morgan 100,379 0.01
Sell iTraxx Europe Senior Financials Series 18 01/12/2017 EUR 12,000,000 20/12/2017
Societe Generale Corporate
& Investment Banking 120,454 0.02
Unrealised Gain on Credit Default Swap Contracts 513,374 0.08
Sell Fiat Finance North America 5.625% 12/06/2017 EUR 1,000,000 20/06/2017
Societe Generale Corporate
& Investment Banking (28,004) 0.00
Sell Fiat Finance North America 5.625% 12/06/2017 EUR 2,000,000 20/09/2017 Morgan Stanley (76,269) (0.01)
Sell ThyssenKrupp 4.375% 18/03/2015 EUR 4,000,000 20/09/2017
Societe Generale Corporate
& Investment Banking (258,229) (0.05)
Unrealised Loss on Credit Default Swap Contracts (362,502) (0.06)
net Unrealised Gain on Credit Default Swap Contracts 150,872 0.02
Cash of EUR 321,000 held as collateral by the counterparties in relation to the above OTC contracts.
total Derivatives 424,567 0.06
other assets less Liabilities 51,257,418 8.35
total net asset value 614,674,524 100.00
(1) All or part of this position is out on loan.(2) The country in brackets represents the country of incorporation of this security.(4) Managed by an affiliate of the Investment Adviser.(5) Variable coupon rates are those quoted as of 31 December 2012.
Credit Default Swap Contracts (continued)
risk position Description Ccy
notional amount
maturity date Counterparty
net unrealised gain/(loss) as at
31 December 2012
% of net assets

91 Morgan Stanley Investment Funds 31 December 2012
Please refer to the full prospectus for the Fund’s investment objective and policy.
Global Bond Fund
inveStment aim
To provide an attractive rate of return, measured in US dollars, through market, instrument and currency selection. The Fund consists of domestic, international and Euromarket fixed income securities of varying maturities denominated in US dollars and other currencies, including emerging markets.
Statement of inveStmentS
transferable securities and money market instruments admitted to official exchange listing or dealt in on another regulated market. as at 31 December 2012, expressed in US dollars.
investments
nominal in US dollars
unless specifiedmarket
value% of net
assets Government Bonds
Japan Government of Japan sr unsecur1.7% /2033 (JPY) 1,555,000,000 17,791,018 2.59 Government of Japan sr unsecur1.1% /2021 (JPY) 1,230,000,000 14,828,310 2.16 Government of Japan sr unsecur1.1% /2021 (JPY) 1,160,000,000 13,978,151 2.03 Government of Japan sr unsecur1.7% /2018 (JPY) 660,000,000 8,259,983 1.20 Government of Japan sr unsecur1.4% /2019 (JPY) 320,000,000 3,956,856 0.58
total for Japan 8.56
United Kingdom UK Treasury 4.25% /2032 (GBP) 6,100,000 12,227,054 1.78 UK Treasury 4.25% /2039 (GBP) 3,313,332 6,565,574 0.96 UK Treasury unsecur 3.75% /2020 (GBP) 3,000,000 5,696,321 0.83 UK Treasury 1.75% /2022 (GBP) 1,850,000 2,987,119 0.43
total for United Kingdom 4.00
United States of america US Treasury 3.5% /2039 12,000,000 13,610,625 1.98 US Treasury 3.5% /2018 9,000,000 10,242,773 1.49 US Treasury 3.625% /2021 2,000,000 2,350,469 0.34 US Treasury 0.875% /2017 1,175,000 1,190,192 0.17
total for United States of america 3.98
italy Italy Buoni Poliennali Del Tesoro 4% /2020 (EUR) 13,000,000 17,291,714 2.51 Italy Buoni Poliennali Del Tesoro 3.75% /2016 (EUR) 4,200,000 5,755,410 0.84 Italy Buoni Poliennali Del Tesoro sr unsecur 5% /2039 (EUR) 1,450,000 1,922,947 0.28
total for italy 3.63
Poland Government of Poland 5.5% /2019 (PLN) 20,700,000 7,592,036 1.10 Government of Poland sr unsecur 5% /2022 5,600,000 6,631,884 0.97 Government of Poland 5.75% /2021 (PLN) 12,500,000 4,703,913 0.68
total for Poland 2.75
Canada Government of Canada 4.25% /2018 (CAD) 9,700,000 11,171,779 1.63 Government of Canada 3.75% /2019 (CAD) 3,500,000 3,987,265 0.58
total for Canada 2.21
australia Government of Australia sr unsecur 5.25% /2019 (AUD) 9,200,000 10,798,930 1.57 Treasury of Victoria Local govt gtd 5.75% /2016 (AUD) 3,000,000 3,397,530 0.50
total for australia 2.07

Morgan Stanley Investment Funds 31 December 2012 92
Global Bond Fund
investments
nominal in US dollars
unless specifiedmarket
value% of net
assets
Sweden Swedish Government unsecur 4.25% /2019 (SEK) 16,000,000 2,910,524 0.42
total for Sweden 0.42
Denmark Kingdom of Denmark 4% /2019 (DKK) 10,250,000 2,226,577 0.32
total for Denmark 0.32
netherlands Government of Netherlands 4% /2037 (EUR) 800,000 1,406,717 0.20
total for netherlands 0.20
Qatar Qatar Government International Bond sr unsecur Ser144A priv plmt 4% /2015 1,300,000 1,370,876 0.20
total for Qatar 0.20
South Korea Republic of Korea sr unsecur 7.125% /2019 1,000,000 1,303,850 0.19
total for South Korea 0.19
total for Government Bonds 41.29
Corporate Bonds
United States of america Goldman Sachs Group sr unsecur 6.15% /2018 2,000,000 2,353,570 0.34 Citigroup sr unsecur 8.5% /2019 1,669,000 2,246,891 0.33 Tronox Finance co gtd Ser144A priv plmt 6.375% /2020 1,603,000 1,625,041 0.24 JPMorgan Chase & Co sr unsecur 3.25% /2022 1,555,000 1,605,693 0.23 Prudential Financial nts 7.375% /2019 1,230,000 1,570,901 0.23 Capital One Bank USA subord 8.8% /2019 1,045,000 1,415,494 0.21 Marathon Petroleum sr unsecur 5.125% /2021 1,195,000 1,408,768 0.20 Bank of America sr unsecur SerMTNL 5.65% /2018 1,175,000 1,365,509 0.20 General Electric Capital sr unsecur SerGMTN 6% /2019 1,105,000 1,347,133 0.20 Bank of America sr unsecur 5.625% /2020 1,075,000 1,275,294 0.19 Boston Properties sr unsecur 3.85% /2023 1,200,000 1,263,768 0.18 Bristol-Myers Squibb sr unsecur 0.875% /2017 1,275,000 1,263,047 0.18 Nestle Holdings co gtd SerEMTN 1.25% /2018 1,250,000 1,249,600 0.18 Merrill Lynch & Co sr unsecur SerEMTN 6.75% 21/05/2013 (EUR) 900,000 1,215,810 0.18 Goldman Sachs Group sr unsecur SerEMTN 4.375% /2017 (EUR) 800,000 1,159,315 0.17 Intel sr unsecur 2.7% /2022 1,125,000 1,125,939 0.16 Intelsat Jackson Holdings co gtd 7.5% /2021 (Luxembourg) (2) 1,000,000 1,105,000 0.16 Citigroup sr unsecur 6.125% /2018 913,000 1,094,509 0.16 JPMorgan Chase & Co sr unsecur 3.25% /2022 1,045,000 1,079,067 0.16 CSC Holdings sr unsecur Ser144A priv plmt 6.75% /2021 870,000 970,050 0.14 CIT Group sr unsecur 5% /2017 900,000 960,813 0.14 Microsoft sr unsecur Ser144A priv plmt CV 0% 15/06/2013 953,000 954,277 0.14 Home Depot sr unsecur 5.875% /2036 725,000 953,335 0.14 American International Group sr unsecur 6.4% /2020 760,000 941,781 0.14 International Game Technology sr unsecur CV 3.25% /2014 842,000 877,351 0.13 Verizon Communications sr unsecur 3.5% /2021 775,000 851,710 0.12 Symantec sr unsecur SerB CV 1% 15/06/2013 782,000 831,853 0.12 Hewlett-Packard sr unsecur 4.65% /2021 780,000 787,199 0.11
Statement of inveStmentS (continued)
transferable securities and money market instruments admitted to official exchange listing or dealt in on another regulated market. as at 31 December 2012, expressed in US dollars.
investments
nominal in US dollars
unless specifiedmarket
value% of net
assets
Germany Bundesrepublik Deutschland 4.75% /2034 (EUR) 3,500,000 6,769,197 0.99 Bundesrepublik Deutschland 4% /2037 (EUR) 3,000,000 5,375,253 0.78
total for Germany 1.77
Brazil Federal Republic of Brazil sr unsecur 8.5% /2024 (BRL) 13,700,000 8,188,583 1.19 Brazil Notas do Tesouro Nacional sr nts SerNTNF 10% /2017 (BRL) 396,300 2,037,987 0.30
total for Brazil 1.49
mexico Mexican Bonos 10% /2024 (MXN) 92,000,000 9,957,624 1.45
total for mexico 1.45
norway Government of Norway 4.25% /2017 (NOK) 46,000,000 9,237,125 1.34
total for norway 1.34
South africa Republic of South Africa sr unsecur 7.25% /2020 (ZAR) 68,000,000 8,454,766 1.23
total for South africa 1.23
Colombia Republic of Colombia sr unsecur 7.75% /2021 (COP) 11,000,000,000 7,942,473 1.15
total for Colombia 1.15
russia Russian Foreign Bond - Eurobond sr unsecur RegS 4.5% /2022 5,800,000 6,641,725 0.97
total for russia 0.97
france Government of France OAT 5.5% /2029 (EUR) 3,600,000 6,610,797 0.96
total for france 0.96
Spain Government of Spain 3% /2015 (EUR) 5,000,000 6,602,974 0.96
total for Spain 0.96
Peru Republic of Peru sr unsecur RegS 8.2% /2026 (PEN) 12,000,000 6,601,951 0.96
total for Peru 0.96
new Zealand Government of New Zealand sr unsecur 6% /2021 (NZD) 3,350,000 3,282,330 0.48
total for new Zealand 0.48
Government Bonds (continued)
Government Bonds (continued)

93 Morgan Stanley Investment Funds 31 December 2012
Global Bond Fund
investments
nominal in US dollars
unless specifiedmarket
value% of net
assets
Statement of inveStmentS (continued)
transferable securities and money market instruments admitted to official exchange listing or dealt in on another regulated market. as at 31 December 2012, expressed in US dollars.
investments
nominal in US dollars
unless specifiedmarket
value% of net
assets
Chrysler Group/CG Co-Issuer secured 8% /2019 700,000 768,393 0.11 Genworth Financial sr unsecur 7.2% /2021 700,000 759,580 0.11 Ford Motor Credit sr unsecur 4.207% /2016 710,000 757,943 0.11 AbbVie co gtd Ser144A priv plmt 4.4% /2042 675,000 722,307 0.11 Georgia-Pacific sr unsecur 8.875% /2031 475,000 718,164 0.10 Altria Group co gtd 2.85% /2022 705,000 700,150 0.10 Priceline.com sr unsecur Ser144A priv plmt CV 1% /2018 645,000 688,134 0.10 Wells Fargo & Co sr unsecur SerEMTN 2.625% /2022 (EUR) 500,000 685,185 0.10 Ball co gtd 5% /2022 625,000 671,875 0.10 United Technologies sr unsecur 4.5% /2042 590,000 657,729 0.10 General Electric Capital sr unsecur 3.15% /2022 620,000 635,345 0.09 PPL WEM Holdings sr unsecur Ser144A priv plmt 3.9% /2016 (United Kingdom) (2) 600,000 632,372 0.09 Boston Scientific sr unsecur 6% /2020 535,000 626,234 0.09 Lam Research sr unsecur CV 1.25% /2018 625,000 620,313 0.09 Omnicom Group co gtd 3.625% /2022 575,000 603,532 0.09 Intel jr subord CV 2.95% /2035 565,000 583,292 0.08 Express Scripts Holding co gtd Ser144A priv plmt 2.65% /2017 525,000 546,247 0.08 Pioneer Natural Resources sr unsecur 7.5% /2020 425,000 540,359 0.08 Gilead Sciences sr unsecur 4.5% /2021 470,000 538,117 0.08 Farmers Exchange Capital subord Ser144A priv plmt 7.05% /2028 430,000 532,550 0.08 SABMiller co gtd Ser144A priv plmt 3.75% /2022 480,000 520,730 0.08 Albea Beauty Holdings sr secured Ser144A priv plmt 8.375% /2019 (Luxembourg) (2) 475,000 503,500 0.07 Amgen sr unsecur 2.5% /2016 475,000 499,436 0.07 Life Technologies sr unsecur 6% /2020 410,000 487,808 0.07 Goldman Sachs Group subord 6.75% /2037 420,000 477,271 0.07 Tesoro co gtd 5.375% /2022 440,000 470,800 0.07 NBCUniversal Media sr unsecur 4.375% /2021 415,000 469,083 0.07 GE Capital Trust II ltd gtd RegS 5.5% /2067 (5) (EUR) 350,000 459,524 0.07 QVC sr secured Ser144A priv plmt 7.125% /2017 430,000 451,023 0.07 Goldman Sachs Group sr unsecur sec registered 0.54% /2016 (5) (EUR) 350,000 444,777 0.06 General Electric Capital subord 5.3% /2021 375,000 435,332 0.06 Barrick North America Finance co gtd 4.4% /2021 395,000 433,277 0.06 Procter & Gamble sr unsecur RegS 2% /2022 (1) (EUR) 325,000 431,539 0.06 Verizon Communications sr unsecur 4.6% /2021 360,000 423,441 0.06 Molson Coors Brewing co gtd CV 2.5% 30/07/2013 417,000 422,534 0.06 CBS co gtd 5.75% /2020 345,000 413,127 0.06 L-3 Communications co gtd 4.75% /2020 370,000 411,819 0.06 DISH DBS co gtd RegS 5.875% /2022 375,000 406,406 0.06 Wells Fargo Bank sr unsecur SerEMTN 6% 23/05/2013 (EUR) 300,000 405,380 0.06 MetLife sr unsecur SerA 6.817% /2018 320,000 403,069 0.06 Home Depot sr nts 5.4% /2040 300,000 377,536 0.05 Phillips 66 co gtd 4.3% /2022 325,000 364,857 0.05 Comcast co gtd 5.7% /2018 280,000 337,064 0.05 Direct TV Financing co gtd 4.6% /2021 250,000 274,181 0.04 Agilent Technologies sr unsecur 5.5% /2015 240,000 267,597 0.04 DISH DBS co gtd RegS 4.625% /2017 250,000 261,875 0.04 Express Scripts Holding co gtd Ser144A priv plmt 3.9% /2022 200,000 216,655 0.03
MeadWestvaco sr unsecur 7.375% /2019 170,000 213,955 0.03 CenturyLink sr unsecur 6.45% /2021 185,000 204,824 0.03 Crown Castle International sr unsecur Ser144A priv plmt 5.25% /2023 180,000 193,275 0.03 BNP Paribas US Medium- Term Note Program bnk gtd sub nts Ser144A priv plmt 5.125% /2015 (France) (2) 180,000 188,559 0.03 Amgen sr unsecur 3.875% /2021 160,000 175,978 0.03 JPMorgan Chase & Co sr unsecur 6.3% /2019 115,000 142,141 0.02
total for United States of america 8.74
United Kingdom Lloyds TSB Bank subord SerEMTN 6.5% /2020 (1) (EUR) 1,800,000 2,724,468 0.40 Royal Bank of Scotland sr unsecur SerEMTN 5.5% /2020 (EUR) 1,600,000 2,557,394 0.37 Barclays Bank subord SerEMTN 6% /2021 (EUR) 1,600,000 2,400,403 0.35 Abbey National Treasury Services covered SerEMTN 3.625% /2016 (EUR) 1,500,000 2,183,617 0.32 Aviva subord SerEMTN 6.875% /2038 (5) (EUR) 1,200,000 1,735,858 0.25 HSBC Holdings sr unsecur 4% /2022 1,330,000 1,459,974 0.21 FCE Bank sr unsecur SerEMTN 4.75% /2015 (EUR) 1,000,000 1,407,304 0.21 Nationwide Building Society sr unsecur SerEMTN 3.75% /2015 (1) (EUR) 1,000,000 1,398,965 0.20 Imperial Tobacco Finance co gtd SerEMTN 4.375% 22/11/2013 (EUR) 1,000,000 1,363,293 0.20 HSBC Holdings subord SerEMTN 6% /2019 (EUR) 850,000 1,361,511 0.20 GKN Holdings sr unsecur SerEMTN 5.375% /2022 (GBP) 650,000 1,093,301 0.16 Imperial Tobacco Finance co gtd SerEMTN 7.75% /2019 (GBP) 500,000 1,044,660 0.15 Experian Finance co gtd Ser144A priv plmt 2.375% /2017 1,025,000 1,043,928 0.15 Priory Group No 3 sr secured RegS 7% /2018 (GBP) 500,000 864,453 0.13 Nationwide Building Society sr unsecur Ser144A priv plmt 6.25% /2020 620,000 736,492 0.11 Standard Chartered sr unsecur 3.875% /2016 (EUR) 500,000 727,755 0.11 Ineos Finance sr secured Ser144A priv plmt 7.5% /2020 675,000 708,750 0.10 Bank of Scotland covered Ser144A priv plmt 5.25% /2017 500,000 574,675 0.08 Barclays Bank jr subord SerRCI 14% perpetual (5) (GBP) 250,000 543,501 0.08 Anglian Water Osprey Financing sr secured SerEMTN 7% /2018 (GBP) 300,000 529,952 0.08 Anglo American Capital co gtd Ser144A priv plmt 9.375% /2019 395,000 514,060 0.07 Barclays Bank subord SerEMTN 6% /2018 (EUR) 300,000 450,972 0.07 Diageo Investment co gtd 2.875% /2022 (United States of America) (2) 425,000 439,754 0.06 Diageo Capital co gtd 1.5% /2017 425,000 431,182 0.06 Standard Chartered sub nts SerEMTN 3.625% /2022 (1) (EUR) 300,000 406,822 0.06 Compass Group sr unsecur SerEMTN 3.125% /2019 (EUR) 250,000 359,223 0.05 HSBC Holdings subord SerEMTN 6.25% /2018 (EUR) 200,000 317,697 0.05 Imperial Tobacco Finance co gtd SerEMTN 4.5% /2018 (EUR) 200,000 302,582 0.04 Heathrow Funding secured SerEMTN 6.25% /2018 (Jersey) (2) (GBP) 150,000 276,927 0.04 BAT International Finance co gtd Ser144A priv plmt 9.5% /2018 190,000 265,081 0.04 Standard Chartered sr unsecur Ser144A priv plmt 3.85% /2015 225,000 237,569 0.04 Heathrow Funding sr secured Ser144A priv plmt 4.6% /2018 (Jersey) (2) (EUR) 150,000 225,757 0.03
Corporate Bonds (continued)
United States of america (continued)
Corporate Bonds (continued)
United States of america (continued)

Morgan Stanley Investment Funds 31 December 2012 94
Global Bond Fund
investments
nominal in US dollars
unless specifiedmarket
value% of net
assets
Germany KfW - Kreditanstalt fuer Wiederaufbau govt gtd 2.05% /2026 (JPY) 315,000,000 4,035,224 0.59 Allianz Finance II co gtd SerEMTN 5.75% /2041 (Netherlands) (1) (2) (5) (EUR) 1,600,000 2,431,245 0.35 Deutsche Bank subord SerEMTN 5% /2020 (EUR) 1,500,000 2,208,527 0.32 Muenchener Rueckversicherungs subord SerEMTN 6% /2041 (1) (5) (EUR) 1,200,000 1,904,443 0.28 Fresenius Medical Care US Finance co gtd 6.875% /2017 (United States of America) (2) 1,100,000 1,258,752 0.18 Conti-Gummi Finance sr secured RegS 7.125% /2018 (Netherlands) (2) (EUR) 600,000 849,250 0.12 KfW - Kreditanstalt fuer Wiederaufbau govt gtd SerDPW CV 1.5% /2014 (EUR) 500,000 813,476 0.12 Aabar Investments sr unsecur RegS CV 4% /2016 (United Arab Emirates) (2) (EUR) 600,000 810,806 0.11 HeidelbergCement Finance co gtd 8% /2017 (Netherlands) (2) (EUR) 500,000 778,676 0.11 Muenchener Rueckversicherungs subord SerEMTN 6.25% /2042 (5) (EUR) 400,000 641,750 0.09 E.ON International Finance co gtd Ser144A priv plmt 5.8% /2018 (Netherlands) (2) 450,000 547,175 0.08 Siemens Financieringsmaatschappij co gtd SerWW CV 1.65% /2019 (Netherlands) (2) 500,000 522,540 0.08 Allianz Finance II co gtd SerEMTN 5.75% /2041 (Netherlands) (2) (5) (EUR) 300,000 455,858 0.07 Eurogrid co gtd SerEMTN 3.875% /2020 (EUR) 300,000 448,772 0.07 HeidelbergCement Finance Luxembourg co gtd 7.5% /2020 (Luxembourg) (1) (2) (EUR) 150,000 234,912 0.03 Celesio Finance co gtd CV 3.75% /2014 (Netherlands) (2) (EUR) 150,000 204,550 0.03 RWE jr subord 4.625% perpetual (5) (EUR) 150,000 202,223 0.03 Techem sr secured RegS 6.125% /2019 (EUR) 125,000 178,596 0.03 Daimler Finance North America co gtd 8.5% /2031 (United States of America) (2) 35,000 54,521 0.01
total for Germany 2.70
Brazil Banco Nacional de Desenvolvimento Economico e Social sr unsecur Ser144A priv plmt 5.5% /2020 5,400,000 6,372,000 0.93 Odebrecht Finance co gtd Ser144A priv plmt 6% /2023 (Cayman Islands) (2) 2,100,000 2,435,097 0.35 Banco Nacional de Desenvolvimento Economico e Social sr unsecur RegS 5.5% /2020 1,900,000 2,238,323 0.33 Petrobras International Finance co gtd SerEMTN 4.875% /2018 (Cayman Islands) (2) (EUR) 1,300,000 1,920,219 0.28 Banco Santander Brasil sr unsecur Ser144A priv plmt 4.625% /2017 1,200,000 1,270,782 0.19 Petrobras International Finance co gtd 5.75% /2020 (Cayman Islands) (2) 1,050,000 1,197,740 0.18 Banco Bradesco sr unsecur Ser144A priv plmt 4.125% /2016 720,000 759,618 0.11 Banco Votorantim sr unsecur Ser144A priv plmt 5.25% /2016 410,000 433,374 0.06 Vale Overseas co gtd 5.625% /2019 (Cayman Islands) (2) 325,000 371,321 0.05 Banco Santander Brasil sr unsecur Ser144A priv plmt 4.25% /2016 342,000 355,680 0.05 Vale Overseas co gtd 6.875% /2039 (Cayman Islands) (2) 75,000 95,029 0.01
total for Brazil 2.54
Statement of inveStmentS (continued)
transferable securities and money market instruments admitted to official exchange listing or dealt in on another regulated market. as at 31 December 2012, expressed in US dollars.
investments
nominal in US dollars
unless specifiedmarket
value% of net
assets
Ineos Finance sr secured RegS 9.25% /2015 (1) (EUR) 150,000 213,882 0.03 Lloyds TSB Bank subord SerEMTN 5.625% /2018 (5) (EUR) 150,000 191,807 0.03 BAT International Finance co gtd SerEMTN 3.625% /2021 (EUR) 100,000 147,594 0.02 Heathrow Funding sr secured SerEMTN 4.125% /2016 (Jersey) (2) (EUR) 100,000 146,269 0.02 HBOS subord SerGMTN Ser144A priv plmt 6.75% /2018 130,000 140,562 0.02 WPP Finance co gtd 8% /2014 100,000 110,623 0.02 Heathrow Finance sr secured SerEMTN 7.125% /2017 (GBP) 50,000 88,290 0.01
total for United Kingdom 4.62
france Société Générale sr unsecur Ser144A priv plmt 5.2% /2021 2,100,000 2,324,196 0.34 Credit Agricole subord SerEMTN 3.9% /2021 (1) (EUR) 1,500,000 2,009,418 0.29 BNP Paribas bnk gtd SerBKNT 5% /2021 1,655,000 1,869,480 0.27 AXA subord SerEMTN 5.25% /2040 (5) (EUR) 1,200,000 1,661,069 0.24 Europcar Groupe secured RegS 11.5% /2017 (EUR) 900,000 1,259,485 0.18 Crédit Agricole unsecur Ser144A priv plmt 3% /2017 1,195,000 1,225,150 0.18 Pernod-Ricard sr unsecur SerEMTN 7% /2015 (EUR) 700,000 1,036,270 0.15 AXA sr unsecur SerEMTN 4.5% /2015 (EUR) 700,000 995,283 0.15 Electricité de France sr unsecur Ser144A priv plmt 4.6% /2020 810,000 917,625 0.13 Veolia Environnement sr unsecur SerEMTN 6.75% /2019 (EUR) 500,000 841,103 0.12 Compagnie Generale des Etablissements Michelin sr unsecur CV 0% /2017 (EUR) 478,400 831,049 0.12 Banque Federative du Credit Mutuel sr unsecur SerEMTN 3% /2015 (EUR) 500,000 698,996 0.10 Eutelsat sr unsecur 5% /2019 (EUR) 400,000 621,814 0.09 BNP Paribas subord SerEMTN 5.431% /2017 (1) (EUR) 350,000 529,201 0.08 Pernod-Ricard sr unsecur 4.875% /2016 (EUR) 350,000 514,672 0.08 Crédit Agricole jr subord Ser144A priv plmt 8.375% perpetual (5) 355,000 378,505 0.06 Lafarge sr unsecur SerEMTN 6.625% /2018 (1) (EUR) 250,000 373,477 0.06 Société Générale jr subord 6.999% perpetual (1) (5) (EUR) 250,000 331,482 0.05 Lafarge sr unsecur SerEMTN 6.75% /2019 (EUR) 200,000 299,106 0.04 Crown European Holdings co gtd RegS 7.125% /2018 (EUR) 200,000 291,795 0.04 Areva sr unsecur SerEMTN 4.625% /2017 (1) (EUR) 200,000 289,088 0.04 Credit Agricole subord SerEMTN 5.875% /2019 (1) (EUR) 150,000 227,050 0.03 Banque PSA Finance nts SerEMTN 3.625% 17/09/2013 (EUR) 150,000 200,047 0.03 Banque PSA Finance sr unsecur SerEMTN 6% /2014 (EUR) 100,000 139,351 0.02 Areva sr unsecur SerEMTN 3.875% /2016 (1) (EUR) 50,000 70,065 0.01 Credit Agricole jr subord 7.875% perpetual (5) (EUR) 50,000 69,745 0.01 France Telecom sr unsecur 8.5% /2031 35,000 52,493 0.01
total for france 2.92
Corporate Bonds (continued)
United Kingdom (continued)
Corporate Bonds (continued)

95 Morgan Stanley Investment Funds 31 December 2012
Global Bond Fund
italy UniCredit sr unsecur SerEMTN 4.375% /2014 (EUR) 1,500,000 2,044,517 0.30 Intesa Sanpaolo sr unsecur Ser144A priv plmt 6.5% /2021 1,800,000 1,898,946 0.28 Finmeccanica Finance co gtd SerEMTN 8.125% 03/12/2013 (Luxembourg) (2) (EUR) 1,000,000 1,404,947 0.21 Assicurazioni Generali subord SerEMTN 10.125% /2042 (5) (EUR) 800,000 1,266,155 0.18 Enel Finance International co gtd Ser144A priv plmt 5.125% /2019 (Netherlands) (2) 900,000 952,092 0.14 Fiat Industrial Finance Europe co gtd SerEMTN 6.25% /2018 (Luxembourg) (2) (EUR) 600,000 891,125 0.13 Telecom Italia sr unsecur SerEMTN 6.125% /2018 (EUR) 550,000 833,035 0.12 Telecom Italia Finance co gtd SerEMTN 7.75% /2033 (Luxembourg) (2) (EUR) 500,000 765,924 0.11 Wind Acquisition Finance secured RegS 11.75% /2017 (Luxembourg) (1) (2) (EUR) 400,000 553,492 0.08 Lottomatica Group co gtd 5.375% /2018 (EUR) 300,000 442,917 0.06 Assicurazioni Generali sr unsecur SerEMTN 5.125% /2024 (1) (EUR) 250,000 353,909 0.05 Wind Acquisition Finance sr secured RegS 7.375% /2018 (Luxembourg) (2) (EUR) 250,000 334,951 0.05 Telecom Italia sr unsecur RegS 4% /2020 (EUR) 175,000 234,790 0.03 Lottomatica Group co gtd 5.375% /2016 (EUR) 150,000 218,487 0.03 Intesa Sanpaolo sr unsecur Ser144A priv plmt 6.5% /2021 200,000 210,994 0.03
total for italy 1.80
australia Commonwealth Bank of Australia sr unsecur Ser144A priv plmt 5% /2019 930,000 1,085,091 0.16 Westpac Banking sr unsecur 4.875% /2019 925,000 1,084,183 0.16 Australia & New Zealand Banking Group sr unsecur Ser144A priv plmt 4.875% /2021 925,000 1,081,528 0.16 National Australia Bank sr unsecur SerMTN 2.75% /2017 850,000 896,189 0.13 Origin Energy Finance co gtd SerEMTN 7.875% /2071 (5) (EUR) 600,000 838,515 0.12 Macquarie Bank subord nts Ser144A priv plmt 6.625% /2021 755,000 836,072 0.12 Commonwealth Bank of Australia sr unsecur 1.9% /2017 815,000 834,544 0.12 National Australia Bank sr unsecur SerMTN 2.75% /2017 740,000 780,212 0.11 QBE Capital Funding III co gtd Ser144A priv plmt 7.25% /2041 (Jersey) (2) (5) 700,000 725,635 0.11 Santos Finance co gtd SerEMTN 8.25% /2070 (5) (EUR) 450,000 633,437 0.09 Woolworths sr unsecur Ser144A priv plmt 4% /2020 345,000 375,769 0.05 FMG Resources August 2006 Proprietary co gtd Ser144A priv plmt 6.875% /2018 340,000 351,475 0.05 Wesfarmers co gtd Ser144A priv plmt 2.983% /2016 305,000 319,532 0.05 National Australia Bank sr unsecur SerEMTN 3.5% /2015 (EUR) 200,000 279,783 0.04 FMG Resources August 2006 Proprietary co gtd Ser144A priv plmt 6.375% /2016 220,000 228,800 0.03 Australia & New Zealand Banking Group subord SerEMTN 5.125% /2019 (EUR) 125,000 192,220 0.03
Statement of inveStmentS (continued)
transferable securities and money market instruments admitted to official exchange listing or dealt in on another regulated market. as at 31 December 2012, expressed in US dollars.
investments
nominal in US dollars
unless specifiedmarket
value% of net
assets
investments
nominal in US dollars
unless specifiedmarket
value% of net
assets
Origin Energy Finance co gtd SerEMTN 2.875% /2019 (EUR) 100,000 137,459 0.02 Westpac Banking sr unsecur 3% /2015 50,000 52,976 0.01
total for australia 1.56
Kazakhstan KazMunayGas National sr unsecur Ser144A priv plmt 6.375% /2021 (Netherlands) (2) 5,200,000 6,389,032 0.93 KazMunayGas National sr unsecur RegS 6.375% /2021 (Netherlands) (2) 2,000,000 2,454,710 0.36
total for Kazakhstan 1.29
Spain Telefonica Emisiones co gtd SerEMTN4.967% /2016 (1) (EUR) 800,000 1,143,234 0.17 BBVA Senior Finance bnk gtd SerGMTN3.25% /2015 (EUR) 850,000 1,123,833 0.16 Amadeus Capital Markets co gtd SerEMTN4.875% /2016 (EUR) 750,000 1,086,600 0.16 Gas Natural Capital Markets co gtd SerEMTN4.125% /2018 (1) (EUR) 750,000 1,052,753 0.15 Banco Bilbao Vizcaya Argentaria covered3.625% /2017 (EUR) 700,000 945,375 0.14 Santander Holdings USA sr unsecur4.625% /2016 (United States of America) (2) 730,000 770,792 0.11 Iberdrola Finanzas co gtd SerEMTN4.75% /2016 (EUR) 400,000 571,038 0.08 Santander International Debt bnk gtd SerEMTN 3.5% /2015 (1) (EUR) 400,000 535,274 0.08 Santander US Debt bnk gtd Ser144A priv plmt 3.724% /2015 400,000 401,937 0.06 Iberdrola Finance Ireland co gtd Ser144A priv plmt 5% /2019 (Ireland) (2) 300,000 315,764 0.05 Telefonica Emisiones co gtd SerEMTN4.797% /2018 (1) (EUR) 200,000 289,574 0.04 Telefonica Emisiones co gtd SerEMTN4.693% /2019 (1) (EUR) 150,000 216,661 0.03
total for Spain 1.23
netherlands ABN Amro Bank subord SerEMTN 6.375% /2021 (EUR) 1,400,000 2,122,743 0.31 Cooperatieve Centrale Raiffeisen-Boerenleenbank subord SerGMTN 3.75% /2020 (1) (EUR) 1,000,000 1,416,116 0.21 UPCB Finance II sr secured RegS 6.375% /2020 (Cayman Islands) (2) (EUR) 1,000,000 1,412,641 0.20 Aegon sr unsecur 4.625% /2015 600,000 655,959 0.10 Cooperatieve Centrale Raiffeisen-Boerenleenbank sr unsecur RegS 6.875% /2020 (EUR) 400,000 592,000 0.09 SRLEV bnk gtd 9% /2041 (5) (EUR) 400,000 502,870 0.07 Ziggo Bond co gtd RegS 8% /2018 (EUR) 250,000 364,762 0.05 OI European Group co gtd RegS 6.75% /2020 (EUR) 200,000 301,412 0.04 ABN Amro Bank sr unsecur SerEMTN3.625% /2017 (EUR) 200,000 292,299 0.04 ABN Amro Bank sr unsecur SerEMTN4.25% /2016 (EUR) 200,000 291,810 0.04 Carlson Wagonlit sr secured RegS7.5% /2019 (1) (EUR) 200,000 283,706 0.04 Cooperatieve Centrale Raiffeisen-Boerenleenbank jr subord Ser144A priv plmt 11% perpetual (5) 75,000 101,710 0.02
total for netherlands 1.21
Corporate Bonds (continued)
Corporate Bonds (continued)
australia (continued)
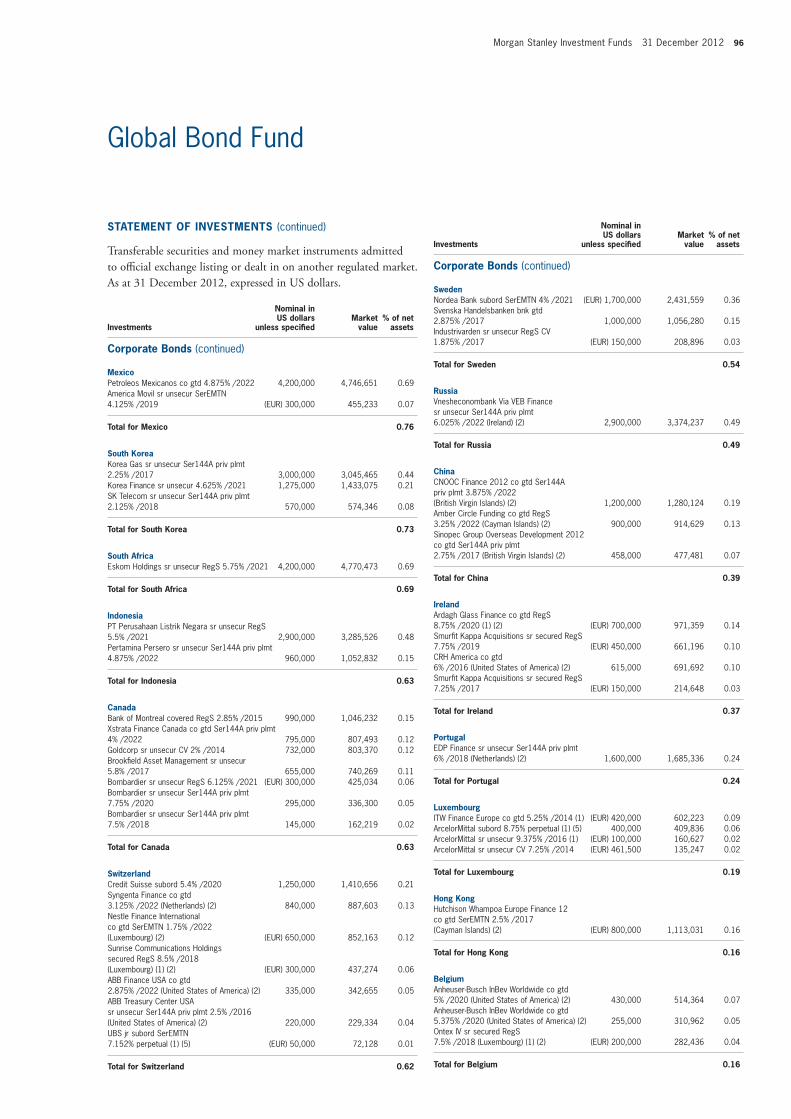
Morgan Stanley Investment Funds 31 December 2012 96
Global Bond Fund
investments
nominal in US dollars
unless specifiedmarket
value% of net
assets
Sweden Nordea Bank subord SerEMTN 4% /2021 (EUR) 1,700,000 2,431,559 0.36 Svenska Handelsbanken bnk gtd 2.875% /2017 1,000,000 1,056,280 0.15 Industrivarden sr unsecur RegS CV 1.875% /2017 (EUR) 150,000 208,896 0.03
total for Sweden 0.54
russia Vnesheconombank Via VEB Finance sr unsecur Ser144A priv plmt 6.025% /2022 (Ireland) (2) 2,900,000 3,374,237 0.49
total for russia 0.49
China CNOOC Finance 2012 co gtd Ser144A priv plmt 3.875% /2022 (British Virgin Islands) (2) 1,200,000 1,280,124 0.19 Amber Circle Funding co gtd RegS 3.25% /2022 (Cayman Islands) (2) 900,000 914,629 0.13 Sinopec Group Overseas Development 2012 co gtd Ser144A priv plmt 2.75% /2017 (British Virgin Islands) (2) 458,000 477,481 0.07
total for China 0.39
ireland Ardagh Glass Finance co gtd RegS 8.75% /2020 (1) (2) (EUR) 700,000 971,359 0.14 Smurfit Kappa Acquisitions sr secured RegS 7.75% /2019 (EUR) 450,000 661,196 0.10 CRH America co gtd 6% /2016 (United States of America) (2) 615,000 691,692 0.10 Smurfit Kappa Acquisitions sr secured RegS 7.25% /2017 (EUR) 150,000 214,648 0.03
total for ireland 0.37
Portugal EDP Finance sr unsecur Ser144A priv plmt 6% /2018 (Netherlands) (2) 1,600,000 1,685,336 0.24
total for Portugal 0.24
Luxembourg ITW Finance Europe co gtd 5.25% /2014 (1) (EUR) 420,000 602,223 0.09 ArcelorMittal subord 8.75% perpetual (1) (5) 400,000 409,836 0.06 ArcelorMittal sr unsecur 9.375% /2016 (1) (EUR) 100,000 160,627 0.02 ArcelorMittal sr unsecur CV 7.25% /2014 (EUR) 461,500 135,247 0.02
total for Luxembourg 0.19
hong Kong Hutchison Whampoa Europe Finance 12 co gtd SerEMTN 2.5% /2017 (Cayman Islands) (2) (EUR) 800,000 1,113,031 0.16
total for hong Kong 0.16
Belgium Anheuser-Busch InBev Worldwide co gtd 5% /2020 (United States of America) (2) 430,000 514,364 0.07 Anheuser-Busch InBev Worldwide co gtd 5.375% /2020 (United States of America) (2) 255,000 310,962 0.05 Ontex IV sr secured RegS 7.5% /2018 (Luxembourg) (1) (2) (EUR) 200,000 282,436 0.04
total for Belgium 0.16
Statement of inveStmentS (continued)
transferable securities and money market instruments admitted to official exchange listing or dealt in on another regulated market. as at 31 December 2012, expressed in US dollars.
investments
nominal in US dollars
unless specifiedmarket
value% of net
assets
mexico Petroleos Mexicanos co gtd 4.875% /2022 4,200,000 4,746,651 0.69 America Movil sr unsecur SerEMTN 4.125% /2019 (EUR) 300,000 455,233 0.07
total for mexico 0.76
South Korea Korea Gas sr unsecur Ser144A priv plmt 2.25% /2017 3,000,000 3,045,465 0.44 Korea Finance sr unsecur 4.625% /2021 1,275,000 1,433,075 0.21 SK Telecom sr unsecur Ser144A priv plmt 2.125% /2018 570,000 574,346 0.08
total for South Korea 0.73
South africa Eskom Holdings sr unsecur RegS 5.75% /2021 4,200,000 4,770,473 0.69
total for South africa 0.69
indonesia PT Perusahaan Listrik Negara sr unsecur RegS 5.5% /2021 2,900,000 3,285,526 0.48 Pertamina Persero sr unsecur Ser144A priv plmt 4.875% /2022 960,000 1,052,832 0.15
total for indonesia 0.63
Canada Bank of Montreal covered RegS 2.85% /2015 990,000 1,046,232 0.15 Xstrata Finance Canada co gtd Ser144A priv plmt 4% /2022 795,000 807,493 0.12 Goldcorp sr unsecur CV 2% /2014 732,000 803,370 0.12 Brookfield Asset Management sr unsecur 5.8% /2017 655,000 740,269 0.11 Bombardier sr unsecur RegS 6.125% /2021 (EUR) 300,000 425,034 0.06 Bombardier sr unsecur Ser144A priv plmt 7.75% /2020 295,000 336,300 0.05 Bombardier sr unsecur Ser144A priv plmt 7.5% /2018 145,000 162,219 0.02
total for Canada 0.63
Switzerland Credit Suisse subord 5.4% /2020 1,250,000 1,410,656 0.21 Syngenta Finance co gtd 3.125% /2022 (Netherlands) (2) 840,000 887,603 0.13 Nestle Finance International co gtd SerEMTN 1.75% /2022 (Luxembourg) (2) (EUR) 650,000 852,163 0.12 Sunrise Communications Holdings secured RegS 8.5% /2018 (Luxembourg) (1) (2) (EUR) 300,000 437,274 0.06 ABB Finance USA co gtd 2.875% /2022 (United States of America) (2) 335,000 342,655 0.05 ABB Treasury Center USA sr unsecur Ser144A priv plmt 2.5% /2016 (United States of America) (2) 220,000 229,334 0.04 UBS jr subord SerEMTN 7.152% perpetual (1) (5) (EUR) 50,000 72,128 0.01
total for Switzerland 0.62
Corporate Bonds (continued)
Corporate Bonds (continued)

97 Morgan Stanley Investment Funds 31 December 2012
Global Bond Fund
United arab emirates IPIC GMTN co gtd RegS 5.875% /2021 (Cayman Islands) (2) (EUR) 400,000 646,560 0.09 IPIC GMTN co gtd RegS 2.375% /2018 (Cayman Islands) (2) (EUR) 250,000 339,571 0.05
total for United arab emirates 0.14
thailand PTT sr unsecur Ser144A priv plmt 3.375% /2022 800,000 799,020 0.12
total for thailand 0.12
israel Teva Pharmaceutical Finance IV co gtd 3.65% /2021 (Curacao) (2) 630,000 676,236 0.10
total for israel 0.10
india Bharat Petroleum sr unsecur RegS 4.625% /2022 530,000 541,745 0.08
total for india 0.08
Qatar Qtel International Finance co gtd RegS 3.25% /2023 (Bermuda) (2) 450,000 450,626 0.07
total for Qatar 0.07
Poland Cyfrowy Polsat Finance sr secured RegS 7.125% /2018 (Sweden) (1) (2) (EUR) 200,000 290,637 0.04
total for Poland 0.04
total for Corporate Bonds 35.76
mortgage and asset Backed Securities
United States of america FNMA Single Family Mortgage 30 Years 3% /2042 11,500,000 12,051,641 1.75 GNMA TBA 4% /2042 7,226,000 7,868,437 1.15 FNMA Pool MA1283 3.5% /2042 5,985,481 6,474,947 0.94 GNMA TBA 4% /2042 5,505,000 6,035,717 0.88 FNMA Pool AJ9630 4% /2041 3,748,548 4,023,139 0.59 FNMA Pool MA1328 3.5% /2043 3,685,000 3,986,343 0.58 RALI Trust 2006-QS8 A1 6% /2036 4,582,185 3,612,702 0.53 WaMu Mortgage Pass Through Certificates 2007-OA4 1A 0.936% /2047 (5) 3,973,165 3,278,985 0.48 FNMA Pool AB6825 3.5% /2042 2,600,330 2,812,973 0.41 Chase Mortgage Finance 2007-A1 11A4 2.903% /2037 (5) 3,122,741 2,755,727 0.40 FNMA Pool AI1647 4.5% /2041 2,469,399 2,740,928 0.40 WaMu Mortgage Pass Through Certificates 2007-HY4 5A1 4.631% /2036 (5) 3,312,720 2,712,936 0.39 JP Morgan Mortgage Trust 2007-A4 2A3 5.547% /2037 (5) 3,069,578 2,659,447 0.39 GNMA TBA 3% /2042 2,300,000 2,444,109 0.36
Countrywide Alternative Loan Trust 2007-5CB 1A12 6% /2037 2,823,135 2,275,251 0.33 FNMA Pool AH7018 5% /2041 1,992,268 2,192,089 0.32 Commercial Mortgage Trust 2012-CR4 A3 2.853% /2045 2,075,000 2,151,341 0.31 JP Morgan Alternative Loan Trust 2006-S1 1A19 6.5% /2036 2,361,060 2,102,674 0.31 Countrywide Alternative Loan Trust 2006-14CB A7 6% /2036 2,117,706 1,711,570 0.25 WaMu Mortgage Pass Through Certificates 2006-AR7 2A 1.145% /2046 (5) 2,250,864 1,696,913 0.25 Banc of America Funding 2006-G 2A4 0.501% /2036 (5) 1,935,000 1,616,653 0.24 Indymac Index Mortgage Loan Trust 2005-AR23 2A1 2.648% /2035 (5) 2,175,351 1,609,283 0.23 GNMA I pool 716848 4.5% /2039 1,455,561 1,599,160 0.23 Countrywide Alternative Loan Trust 2006-6CB 2A4 5.75% /2036 2,117,155 1,572,616 0.23 Freddie Mac Gold Pool Q10201 3.5% /2042 1,465,990 1,558,302 0.23 Freddie Mac TBA 30 Years 3.5% /2042 1,365,000 1,451,166 0.21 Freddie Mac Gold Pool Q04858 4% /2041 1,318,613 1,409,417 0.21 FNMA Pool AD0426 5.5% /2038 1,267,880 1,393,462 0.20 Wells Fargo Commercial Mortgage Trust 2012-LC5 A3 2.918% /2045 1,317,000 1,377,315 0.20 Volkswagen Auto Loan Enhanced Trust 2011-1 A3 1.22% /2015 1,331,662 1,338,313 0.19 Commercial Mortgage Pass Through Certificates 2012-CR3 A3 2.822% /2045 1,252,847 1,298,357 0.19 FNMA Pool AH5714 5% /2041 1,116,319 1,250,261 0.18 Countrywide Alternative Loan Trust 2006-36T2 2A5 6% /2036 1,515,316 1,104,138 0.16 CNH Equipment Trust 1.2% /2016 1,018,481 1,023,769 0.15 Fannie Mae TBA 15 Years 2.5% /2027 960,000 1,003,350 0.15 FNMA Pool AJ2800 4% /2041 899,100 964,962 0.14 Banc of America Funding 2007-5 3A1 6% /2037 1,116,222 902,651 0.13 FNMA Pool AH2426 5% /2041 790,191 885,002 0.13 RALI Trust 2006-QS8 A3 6% /2036 1,059,086 837,726 0.12 Banc of America Funding 2006-8T2 A6 step cpn 6.049% /2036 1,022,338 824,296 0.12 RALI Trust 2006-QS4 A2 6% /2036 1,025,558 802,993 0.12 Countrywide Alternative Loan Trust 2006-4CB 1A1 6% /2036 992,913 774,609 0.11 Citigroup Mortgage Loan Trust 2005-9 2A2 5.5% /2035 720,537 710,071 0.10 JP Morgan Chase Commercial Mortgage Securities 4.717% /2046 600,000 708,245 0.10 First Horizon Alternative Mortgage Securities 2006-FA4 1A1 6% /2036 768,468 650,356 0.09 FNMA Pool AP7911 3.5% /2042 582,242 628,217 0.09 RALI Trust 2007-QS2 A1 6% /2037 806,155 625,571 0.09 Residential Asset Securitization Trust 2006-A6 2A6 6% /2036 704,138 606,598 0.09 Freddie Mac Gold Pool A68767 6% /2037 522,024 567,759 0.08 Banc of America Alternative Loan Trust 2005-8 2CB1 6% /2035 670,000 529,499 0.08 FNMA Pool 190363 5.5% /2035 422,164 461,340 0.07 Luminent Mortgage Trust 2006-6 A2A 0.38% /2046 (5) 1,855,400 445,055 0.06 Countrywide Alternative Loan Trust 2005-86CB A4 5.5% /2036 531,030 422,883 0.06 RALI Trust 2006-QS16 A10 6% /2036 512,957 397,716 0.06 CVS Pass-Through Trust pass through certs Ser144A priv plmt 8.353% /2031 266,936 370,961 0.05 Citigroup Mortgage Loan Trust 2005-9 2A2 5.5% /2035 375,592 370,137 0.05 FNMA Pool 962304 5.5% /2038 299,525 325,449 0.05 Countrywide Alternative Loan Trust 2007-5CB 2A1 6% /2037 433,527 318,273 0.05 Lehman Mortgage Trust 2005-1 2A1 5.5% /2035 314,621 317,404 0.05 CVS Pass-Through Trust pass through certs 6.036% /2028 264,989 312,145 0.05
Statement of inveStmentS (continued)
transferable securities and money market instruments admitted to official exchange listing or dealt in on another regulated market. as at 31 December 2012, expressed in US dollars.
investments
nominal in US dollars
unless specifiedmarket
value% of net
assets
investments
nominal in US dollars
unless specifiedmarket
value% of net
assets
Corporate Bonds (continued)
mortgage and asset Backed Securities (continued)
United States of america (continued)

Morgan Stanley Investment Funds 31 December 2012 98
Global Bond Fund
Citigroup Mortgage Loan Trust 2005-WF1 step cpn A4 5.53% /2034 300,000 287,423 0.04 Countrywide Alternative Loan Trust 2005-86CB A11 5.5% /2036 300,302 239,144 0.03 FNMA Pool AH2962 5% /2041 174,760 195,729 0.03 FNMA Pool AP7586 3.5% /2042 179,112 193,256 0.03 Fannie Mae TBA 30 Years 3.5% /2042 165,000 175,905 0.03 FNMA Pool 490758 6.5% /2029 144,047 169,240 0.02 Citigroup Commercial Mortgage Trust 2008-C7 A4 6.06% /2049 (5) 100,000 121,330 0.02 FNMA Pool AK8789 3.5% /2042 79,554 85,836 0.01 Freddie Mac Gold Pool A64548 6% /2037 63,187 68,737 0.01 FNMA Pool 253894 6.5% /2031 34,279 39,255 0.01 Freddie Mac Gold Pool G05631 7.5% /2035 28,354 34,717 0.01 FNMA Pool AD0273 8.5% /2032 27,623 34,550 0.01 World Financial Properties Tower B pass thru certs Ser144A priv plmt 6.91% 01/09/2013 30,044 30,445 0.00 Freddie Mac Gold Pool C90299 7.5% /2019 18,164 20,627 0.00 Freddie Mac Gold Pool G05640 8.5% /2031 15,352 19,244 0.00 Freddie Mac Gold Pool G05639 8% /2032 14,659 18,136 0.00 FNMA Pool 625393 6.5% /2032 14,680 17,374 0.00 Freddie Mac Gold Pool G00876 6.5% /2028 12,826 14,899 0.00 FNMA Pool 253794 6.5% /2031 12,858 14,725 0.00 FNMA Pool 485674 6.5% /2029 11,104 12,502 0.00 FNMA Pool 653071 6.5% /2032 8,457 9,501 0.00 FNMA Pool 527244 6.5% /2029 8,037 9,465 0.00 FNMA Pool 251898 6.5% /2028 7,022 8,250 0.00 FNMA Pool 251626 7% /2018 6,315 7,056 0.00 FNMA Pool 591189 6.5% /2031 2,944 3,480 0.00 FNMA Pool 252589 6.5% /2029 2,887 3,285 0.00 FNMA Pool 711986 6.5% /2033 2,737 3,243 0.00 FNMA Pool 675952 6.5% /2032 2,237 2,545 0.00 FNMA Pool 496029 6.5% /2029 1,586 1,805 0.00 FNMA Pool 702022 6.5% /2033 1,157 1,371 0.00 FNMA Pool 494724 6.5% /2029 707 804 0.00
total for United States of america 16.41
United Kingdom Holmes Master Issuer 2012-3A A1 2.089% /2054 (5) (GBP) 1,378,000 2,325,468 0.34
total for United Kingdom 0.34
total for mortgage and asset Backed Securities 16.75
mutual fund
Morgan Stanley Funds plc - Euro Liquidity Fund (Ireland) (2) (4) 20,007,734 26,448,823 3.85
total for mutual fund 3.85
Supra-national Bonds
European Union nts SerEMTN 2.75% /2016 3,800,000 5,444,565 0.79 European Investment Bank sr unsecur 2.15% /2027 (JPY) 190,000,000 2,355,668 0.34
total for Supra-national Bonds 1.13
equities
United States of america Stanley Black & Decker Pfd Stock CV 4.75% /2015 2,700 325,350 0.04
total for United States of america 0.04
total for equities 0.04
total investment Securities 679,376,792 98.82
DerivativeS
OtC and exchange traded derivatives as at 31 December 2012, expressed in US dollars.
futures Contracts
Descriptionmaturity
datenumber of contracts
notional commitments Counterparty
net unrealised gain/(loss) as at
31 December 2012
% of net assets
Euro Bund Future 03/2013 17 3,272,940 Goldman Sachs 23,491 0.00US 2yr T-note Future 03/2013 453 99,879,424 Goldman Sachs 56,627 0.01US 5yr T-note Future 03/2013 639 79,455,656 Goldman Sachs 34,946 0.01US 10yr T-note Future 03/2013 (624) (82,816,500) Goldman Sachs 71,520 0.01
Unrealised Gain on futures Contracts 186,584 0.03
Euro BOBL Future 03/2013 (17) (2,872,473) Goldman Sachs (1,573) 0.00Euro SCHATZ Future 03/2013 (12) (1,758,511) Goldman Sachs (1,538) 0.00Long Gilt Future 03/2013 (10) (1,932,391) Goldman Sachs (2,661) 0.00US Treasury Ultra Bond Future 03/2013 37 6,027,531 Goldman Sachs (116,126) (0.02)
Unrealised Loss on futures Contracts (121,898) (0.02)
net Unrealised Gain on futures Contracts 99,255,6761 64,686 0.01
1 Cash of USD 448,278 held as collateral by the counterparty.1 Cash of EUR 37 paid as collateral to the counterparty.
forward foreign Currency exchange Contracts
maturity date
amount bought Ccy
amount sold Ccy Counterparty
Unrealised gain/(loss)
USD% of net
assets
08/01/2013 7,065,000 SGD 5,783,929 USD HSBC 444 0.00 08/01/2013 2,322,067 USD 2,305,000 CAD RBC 6,973 0.00 08/01/2013 804,857 USD 800,000 CAD Westpac Bank 1,353 0.00 08/01/2013 1,550,706 USD 19,865,000 MXN State Street 23,141 0.00 09/01/2013 7,000,000 EUR 9,107,721 USD Commonwealth Bank 146,385 0.03 09/01/2013 3,300,000 EUR 4,304,388 USD State Street 58,261 0.01 09/01/2013 2,700,000 EUR 3,507,621 USD Westpac Bank 61,819 0.01 09/01/2013 6,620,670 USD 5,000,000 EUR Commonwealth Bank 10,595 0.00 10/01/2013 3,419,328 CAD 3,300,000 AUD Commonwealth Bank 10,837 0.00 10/01/2013 11,148,812 USD 10,700,000 AUD Commonwealth Bank 48,958 0.01 10/01/2013 239,150 USD 230,000 AUD Westpac Bank 555 0.00 10/01/2013 3,297,485 USD 4,005,000 NZD J.P. Morgan 2,399 0.00 11/01/2013 4,700,000 PLN 1,142,536 EUR Deutsche Bank 11,762 0.00 14/01/2013 5,855,000,000 KRW 5,398,951 USD HSBC 88,859 0.02 14/01/2013 1,450,000,000 KRW 1,349,842 USD J.P. Morgan 9,223 0.00 15/01/2013 7,400,000 NOK 1,313,370 USD Commonwealth Bank 16,985 0.00 15/01/2013 20,900,000 NOK 3,712,981 USD Deutsche Bank 44,372 0.01 15/01/2013 3,650,000 SEK 421,897 EUR Deutsche Bank 3,827 0.00 16/01/2013 1,910,307 EUR 2,500,000 USD Westpac Bank 25,618 0.00 17/01/2013 375,666 EUR 305,000 GBP RBC 1,083 0.00
investments holdingsmarket
value% of net
assets Statement of inveStmentS (continued)
transferable securities and money market instruments admitted to official exchange listing or dealt in on another regulated market. as at 31 December 2012, expressed in US dollars.
investments
holdings/nominal in US dollars
unless specifiedmarket
value% of net
assets mortgage and asset Backed Securities (continued)
United States of america (continued)
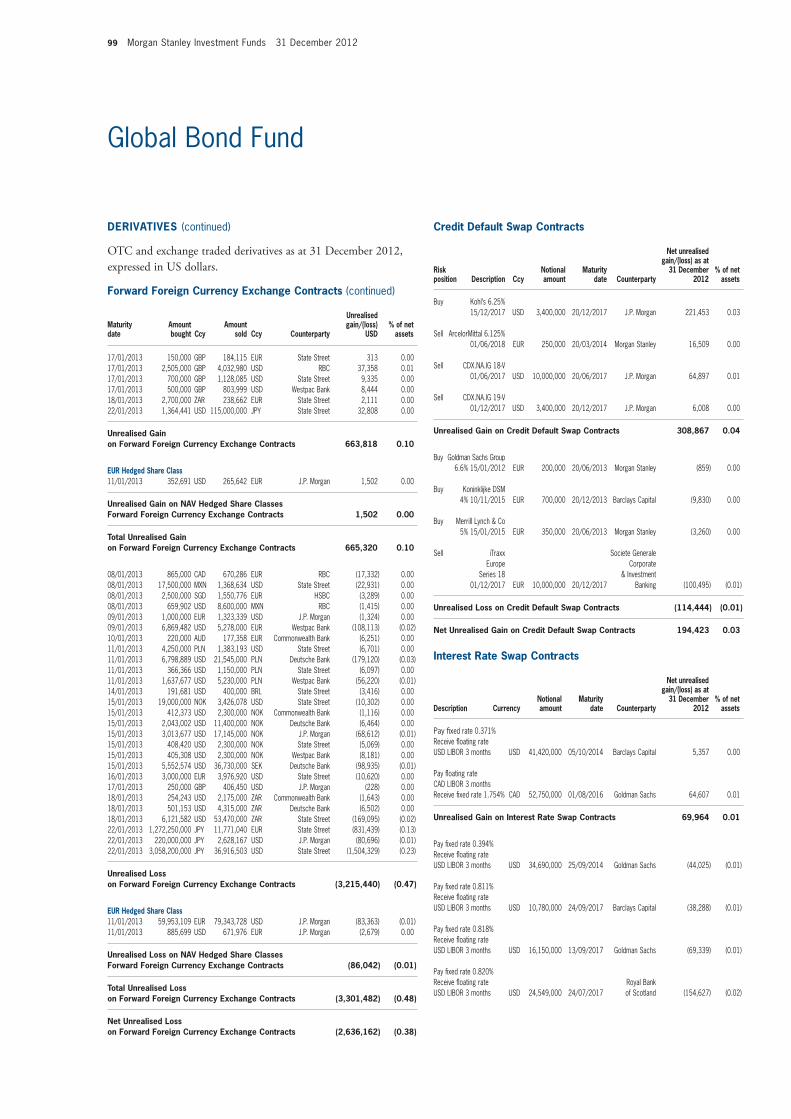
99 Morgan Stanley Investment Funds 31 December 2012
Global Bond Fund
17/01/2013 150,000 GBP 184,115 EUR State Street 313 0.00 17/01/2013 2,505,000 GBP 4,032,980 USD RBC 37,358 0.01 17/01/2013 700,000 GBP 1,128,085 USD State Street 9,335 0.00 17/01/2013 500,000 GBP 803,999 USD Westpac Bank 8,444 0.00 18/01/2013 2,700,000 ZAR 238,662 EUR State Street 2,111 0.00 22/01/2013 1,364,441 USD 115,000,000 JPY State Street 32,808 0.00
Unrealised Gain on forward foreign Currency exchange Contracts 663,818 0.10
eUr hedged Share Class 11/01/2013 352,691 USD 265,642 EUR J.P. Morgan 1,502 0.00
Unrealised Gain on nav hedged Share Classes forward foreign Currency exchange Contracts 1,502 0.00
total Unrealised Gain on forward foreign Currency exchange Contracts 665,320 0.10
08/01/2013 865,000 CAD 670,286 EUR RBC (17,332) 0.00 08/01/2013 17,500,000 MXN 1,368,634 USD State Street (22,931) 0.00 08/01/2013 2,500,000 SGD 1,550,776 EUR HSBC (3,289) 0.00 08/01/2013 659,902 USD 8,600,000 MXN RBC (1,415) 0.00 09/01/2013 1,000,000 EUR 1,323,339 USD J.P. Morgan (1,324) 0.00 09/01/2013 6,869,482 USD 5,278,000 EUR Westpac Bank (108,113) (0.02)10/01/2013 220,000 AUD 177,358 EUR Commonwealth Bank (6,251) 0.00 11/01/2013 4,250,000 PLN 1,383,193 USD State Street (6,701) 0.00 11/01/2013 6,798,889 USD 21,545,000 PLN Deutsche Bank (179,120) (0.03)11/01/2013 366,366 USD 1,150,000 PLN State Street (6,097) 0.00 11/01/2013 1,637,677 USD 5,230,000 PLN Westpac Bank (56,220) (0.01)14/01/2013 191,681 USD 400,000 BRL State Street (3,416) 0.00 15/01/2013 19,000,000 NOK 3,426,078 USD State Street (10,302) 0.00 15/01/2013 412,373 USD 2,300,000 NOK Commonwealth Bank (1,116) 0.00 15/01/2013 2,043,002 USD 11,400,000 NOK Deutsche Bank (6,464) 0.00 15/01/2013 3,013,677 USD 17,145,000 NOK J.P. Morgan (68,612) (0.01)15/01/2013 408,420 USD 2,300,000 NOK State Street (5,069) 0.00 15/01/2013 405,308 USD 2,300,000 NOK Westpac Bank (8,181) 0.00 15/01/2013 5,552,574 USD 36,730,000 SEK Deutsche Bank (98,935) (0.01)16/01/2013 3,000,000 EUR 3,976,920 USD State Street (10,620) 0.00 17/01/2013 250,000 GBP 406,450 USD J.P. Morgan (228) 0.00 18/01/2013 254,243 USD 2,175,000 ZAR Commonwealth Bank (1,643) 0.00 18/01/2013 501,153 USD 4,315,000 ZAR Deutsche Bank (6,502) 0.00 18/01/2013 6,121,582 USD 53,470,000 ZAR State Street (169,095) (0.02)22/01/2013 1,272,250,000 JPY 11,771,040 EUR State Street (831,439) (0.13)22/01/2013 220,000,000 JPY 2,628,167 USD J.P. Morgan (80,696) (0.01)22/01/2013 3,058,200,000 JPY 36,916,503 USD State Street (1,504,329) (0.23)
Unrealised Loss on forward foreign Currency exchange Contracts (3,215,440) (0.47)
eUr hedged Share Class 11/01/2013 59,953,109 EUR 79,343,728 USD J.P. Morgan (83,363) (0.01)11/01/2013 885,699 USD 671,976 EUR J.P. Morgan (2,679) 0.00
Unrealised Loss on nav hedged Share Classes forward foreign Currency exchange Contracts (86,042) (0.01)
total Unrealised Loss on forward foreign Currency exchange Contracts (3,301,482) (0.48)
net Unrealised Loss on forward foreign Currency exchange Contracts (2,636,162) (0.38)
Credit Default Swap Contracts
risk position Description Ccy
notional amount
maturity date Counterparty
net unrealised gain/(loss) as at
31 December 2012
% of net assets
Buy Kohl’s 6.25% 15/12/2017 USD 3,400,000 20/12/2017 J.P. Morgan 221,453 0.03
Sell ArcelorMittal 6.125% 01/06/2018 EUR 250,000 20/03/2014 Morgan Stanley 16,509 0.00
Sell CDX.NA.IG 18-V 01/06/2017 USD 10,000,000 20/06/2017 J.P. Morgan 64,897 0.01
Sell CDX.NA.IG 19-V 01/12/2017 USD 3,400,000 20/12/2017 J.P. Morgan 6,008 0.00
Unrealised Gain on Credit Default Swap Contracts 308,867 0.04
Buy Goldman Sachs Group 6.6% 15/01/2012 EUR 200,000 20/06/2013 Morgan Stanley (859) 0.00
Buy Koninklijke DSM 4% 10/11/2015 EUR 700,000 20/12/2013 Barclays Capital (9,830) 0.00
Buy Merrill Lynch & Co 5% 15/01/2015 EUR 350,000 20/06/2013 Morgan Stanley (3,260) 0.00
Sell iTraxx Europe Series 18 01/12/2017 EUR 10,000,000 20/12/2017
Societe Generale Corporate
& Investment Banking (100,495) (0.01)
Unrealised Loss on Credit Default Swap Contracts (114,444) (0.01)
net Unrealised Gain on Credit Default Swap Contracts 194,423 0.03
interest rate Swap Contracts
Description Currencynotional amount
maturity date Counterparty
net unrealised gain/(loss) as at
31 December 2012
% of net assets
Pay fixed rate 0.371%Receive floating rate USD LIBOR 3 months USD 41,420,000 05/10/2014 Barclays Capital 5,357 0.00
Pay floating rate CAD LIBOR 3 months Receive fixed rate 1.754% CAD 52,750,000 01/08/2016 Goldman Sachs 64,607 0.01
Unrealised Gain on interest rate Swap Contracts 69,964 0.01
Pay fixed rate 0.394% Receive floating rate USD LIBOR 3 months USD 34,690,000 25/09/2014 Goldman Sachs (44,025) (0.01)
Pay fixed rate 0.811% Receive floating rate USD LIBOR 3 months USD 10,780,000 24/09/2017 Barclays Capital (38,288) (0.01)
Pay fixed rate 0.818% Receive floating rate USD LIBOR 3 months USD 16,150,000 13/09/2017 Goldman Sachs (69,339) (0.01)
Pay fixed rate 0.820% Receive floating rate USD LIBOR 3 months USD 24,549,000 24/07/2017
Royal Bank of Scotland (154,627) (0.02)
DerivativeS (continued)
OtC and exchange traded derivatives as at 31 December 2012, expressed in US dollars.
forward foreign Currency exchange Contracts (continued)
maturity date
amount bought Ccy
amount sold Ccy Counterparty
Unrealised gain/(loss)
USD% of net
assets

Morgan Stanley Investment Funds 31 December 2012 100
Global Bond Fund
DerivativeS (continued)
OtC and exchange traded derivatives as at 31 December 2012, expressed in US dollars.
interest rate Swap Contracts (continued)
Description Currencynotional amount
maturity date Counterparty
net unrealised gain/(loss) as at
31 December 2012
% of net assets
Pay fixed rate 0.830% Receive floating rate USD LIBOR 3 months USD 51,680,000 03/08/2016 Goldman Sachs (114,986) (0.01)
Unrealised Loss on interest rate Swap Contracts (421,265) (0.06)
net Unrealised Loss on interest rate Swap Contracts (351,301) (0.05)
Cash of USD 2,240,000 held as collateral by the counterparties in relation to the above OTC contracts.
total Derivatives (2,728,354) (0,39)
other assets less Liabilities 10,820,607 1.57
total net asset value 687,469,045 100.00
(1) All or part of this position is out on loan.(2) The country in brackets represents the country of incorporation of this security.(5) Variable coupon rates are those quoted as of 31 December 2012.
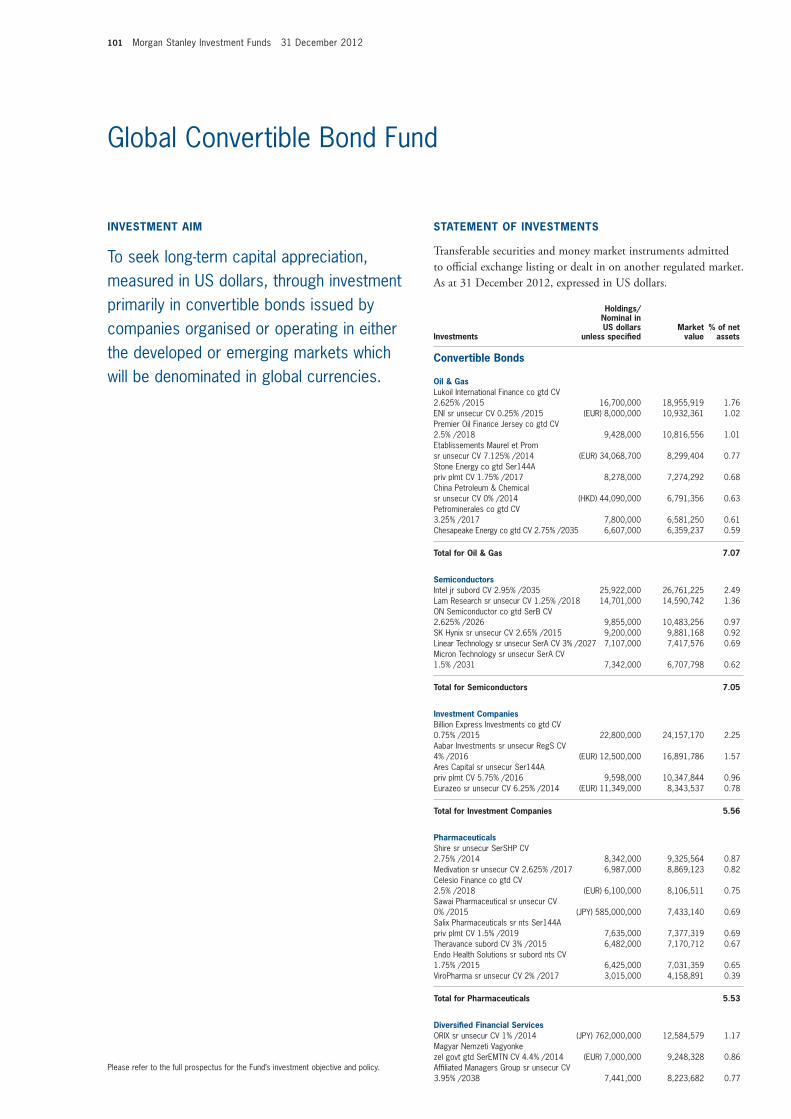
101 Morgan Stanley Investment Funds 31 December 2012
Please refer to the full prospectus for the Fund’s investment objective and policy.
Global Convertible Bond Fund
inveStment aim
To seek long-term capital appreciation, measured in US dollars, through investment primarily in convertible bonds issued by companies organised or operating in either the developed or emerging markets which will be denominated in global currencies.
Statement of inveStmentS
transferable securities and money market instruments admitted to official exchange listing or dealt in on another regulated market. as at 31 December 2012, expressed in US dollars.
investments
holdings/nominal in US dollars
unless specifiedmarket
value% of net
assets Convertible Bonds
oil & Gas Lukoil International Finance co gtd CV 2.625% /2015 16,700,000 18,955,919 1.76 ENI sr unsecur CV 0.25% /2015 (EUR) 8,000,000 10,932,361 1.02 Premier Oil Finance Jersey co gtd CV 2.5% /2018 9,428,000 10,816,556 1.01 Etablissements Maurel et Prom sr unsecur CV 7.125% /2014 (EUR) 34,068,700 8,299,404 0.77 Stone Energy co gtd Ser144A priv plmt CV 1.75% /2017 8,278,000 7,274,292 0.68 China Petroleum & Chemical sr unsecur CV 0% /2014 (HKD) 44,090,000 6,791,356 0.63 Petrominerales co gtd CV 3.25% /2017 7,800,000 6,581,250 0.61 Chesapeake Energy co gtd CV 2.75% /2035 6,607,000 6,359,237 0.59
total for oil & Gas 7.07
Semiconductors Intel jr subord CV 2.95% /2035 25,922,000 26,761,225 2.49 Lam Research sr unsecur CV 1.25% /2018 14,701,000 14,590,742 1.36 ON Semiconductor co gtd SerB CV 2.625% /2026 9,855,000 10,483,256 0.97 SK Hynix sr unsecur CV 2.65% /2015 9,200,000 9,881,168 0.92 Linear Technology sr unsecur SerA CV 3% /2027 7,107,000 7,417,576 0.69 Micron Technology sr unsecur SerA CV 1.5% /2031 7,342,000 6,707,798 0.62
total for Semiconductors 7.05
investment Companies Billion Express Investments co gtd CV 0.75% /2015 22,800,000 24,157,170 2.25 Aabar Investments sr unsecur RegS CV 4% /2016 (EUR) 12,500,000 16,891,786 1.57 Ares Capital sr unsecur Ser144A priv plmt CV 5.75% /2016 9,598,000 10,347,844 0.96 Eurazeo sr unsecur CV 6.25% /2014 (EUR) 11,349,000 8,343,537 0.78
total for investment Companies 5.56
Pharmaceuticals Shire sr unsecur SerSHP CV 2.75% /2014 8,342,000 9,325,564 0.87 Medivation sr unsecur CV 2.625% /2017 6,987,000 8,869,123 0.82 Celesio Finance co gtd CV 2.5% /2018 (EUR) 6,100,000 8,106,511 0.75 Sawai Pharmaceutical sr unsecur CV 0% /2015 (JPY) 585,000,000 7,433,140 0.69 Salix Pharmaceuticals sr nts Ser144A priv plmt CV 1.5% /2019 7,635,000 7,377,319 0.69 Theravance subord CV 3% /2015 6,482,000 7,170,712 0.67 Endo Health Solutions sr subord nts CV 1.75% /2015 6,425,000 7,031,359 0.65 ViroPharma sr unsecur CV 2% /2017 3,015,000 4,158,891 0.39
total for Pharmaceuticals 5.53
Diversified financial ServicesORIX sr unsecur CV 1% /2014 (JPY) 762,000,000 12,584,579 1.17 Magyar Nemzeti Vagyonke zel govt gtd SerEMTN CV 4.4% /2014 (EUR) 7,000,000 9,248,328 0.86 Affiliated Managers Group sr unsecur CV 3.95% /2038 7,441,000 8,223,682 0.77

Morgan Stanley Investment Funds 31 December 2012 102
Global Convertible Bond Fund
investments
holdings/nominal in US dollars
unless specifiedmarket
value% of net
assets
internet Priceline.com sr unsecur Ser144A priv plmt CV 1% /2018 15,568,000 16,609,110 1.54 Symantec sr unsecur SerB CV 1% 15/06/2013 10,376,000 11,037,470 1.03 WebMD Health sr unsecur CV 2.5% /2018 7,993,000 6,734,102 0.63
total for internet 3.20
holding Companies - Diversified San Miguel sr unsecur CV 2% /2014 9,400,000 9,574,417 0.89 Giant Great co gtd CV 3% /2016 7,600,000 9,133,376 0.85 Siem Industries sr secured CV 1% /2019 8,000,000 8,327,320 0.78 Noble Group sr unsecur CV 0% /2014 5,029,000 7,240,930 0.67
total for holding Companies - Diversified 3.19
health Care Insulet sr unsecur CV 3.75% /2016 7,220,000 7,863,302 0.73 HeartWare International sr unsecur CV 3.5% /2017 6,569,000 7,540,686 0.70 Qiagen Euro Finance co gtd SerEMTN CV 3.25% /2026 5,900,000 7,054,778 0.66 WellPoint sr unsecur Ser144A priv plmt CV 2.75% /2042 4,959,000 5,315,428 0.49 Volcano sr unsecur CV 1.75% /2017 5,133,000 5,170,753 0.48
total for health Care 3.06
Software Microsoft sr unsecur Ser144A priv plmt CV 0% 15/06/2013 14,774,000 14,793,797 1.38 Nuance Communications sr unsecur CV 2.75% /2031 9,327,000 10,096,477 0.94 Electronic Arts sr unsecur CV 0.75% /2016 7,974,000 7,370,368 0.68
total for Software 3.00
electrical Components & equipments SunPower sr unsecur CV 4.5% /2015 8,682,000 8,095,965 0.75 General Cable subord CV step cpn 4.5% /2029 7,519,000 7,894,950 0.74 Chaowei Power Holdings sr unsecur RegS CV 7.25% /2017 (CNH) 47,000,000 7,764,433 0.72 Nexans sr unsecur CV 2.5% /2019 (EUR) 6,000,000 5,558,610 0.52
total for electrical Components & equipments 2.73
real estate investment trusts (reits)Annaly Capital Management sr unsecur CV 5% /2015 10,254,000 10,407,810 0.97 Capital Shopping Centres Jersey co gtd CV 2.5% /2018 (GBP) 4,500,000 7,558,077 0.70 Boston Properties sr unsecur Ser144A priv plmt CV 3.625% /2014 7,017,000 7,424,863 0.69
total for real estate investment trusts (reits) 2.36
retail Aeon sr unsecur CV 0.3% 22/11/2013 (JPY) 784,000,000 10,069,465 0.94 SM Investments sr unsecur CV 1.625% /2017 7,400,000 8,669,396 0.80 361 Degrees International sr unsecur CV 4.5% /2017 5,600,000 5,164,152 0.48
total for retail 2.22
Statement of inveStmentS (continued)
transferable securities and money market instruments admitted to official exchange listing or dealt in on another regulated market. as at 31 December 2012, expressed in US dollars.
investments
holdings/nominal in US dollars
unless specifiedmarket
value% of net
assets
Diversified financial Services (continued)Power Regal Group co gtd CV 2.25% /2014 (HKD) 48,970,000 7,735,599 0.72 Magnolia Finance subord CV 4% perpetual (5) (EUR) 6,400,000 6,055,962 0.56 China Overseas Grand Oceans Finance co gtd CV step cpn 2% /2017 (HKD) 20,000,000 3,048,280 0.28
total for Diversified financial Services 4.36
real estate Swiss Prime Site sr unsecur CV 1.875% /2016 (CHF) 9,505,000 10,797,588 1.01 CapitaLand sr unsecur RegS CV 2.875% /2016 (SGD) 12,000,000 10,578,931 0.98 Agile Property Holdings sr secured CV 4% /2016 8,300,000 8,537,048 0.79 Shui On Land sr unsecur CV 4.5% /2015 (CNH) 46,900,000 7,923,423 0.74 Pyrus co gtd RegS CV 7.5% /2015 7,000,000 7,872,060 0.73
total for real estate 4.25
telecommunications KDDI sr unsecur CV 0% /2015 (JPY) 1,390,000,000 18,191,499 1.69 Softbank sr unsecur CV 1.5% 31/03/2013 (JPY) 738,000,000 12,380,457 1.15 RF Micro Devices subord nts CV 1% /2014 7,491,000 7,387,999 0.69 Anixter International sr unsecur CV 1% 15/02/2013 6,347,000 7,199,878 0.67
total for telecommunications 4.20
mining AngloGold Ashanti Holdings Finance co gtd RegS CV 3.5% /2014 9,900,000 10,268,577 0.95 Goldcorp sr unsecur CV 2% /2014 8,541,000 9,373,747 0.87 Petropavlovsk 2010 co gtd CV 4% /2015 9,000,000 8,500,230 0.79 Vedanta Resources Jersey co gtd CV 5.5% /2016 8,200,000 8,442,351 0.79 Western Areas sr unsecur CV 6.4% /2015 (AUD) 6,750,000 7,321,827 0.68
total for mining 4.08
Computers SanDisk sr unsecur CV 1.5% /2017 11,104,000 12,824,010 1.19 Cap Gemini sr unsecur CV 3.5% /2014 (EUR) 18,557,200 9,658,716 0.90 NetApp sr unsecur CV 1.75% 01/06/2013 7,296,000 8,135,551 0.76 CACI International sr sub nts CV 2.125% /2014 6,794,000 7,549,832 0.70
total for Computers 3.55
iron & SteelArcelorMittal sr unsecur CV 7.25% /2014 (EUR) 38,904,200 11,401,212 1.06 Salzgitter Finance co gtd CV 2% /2017 (EUR) 5,100,000 8,375,020 0.78 United States Steel sr unsecur CV 4% /2014 7,142,000 7,647,546 0.71 Allegheny Technologies sr unsecur CV 4.25% /2014 6,854,000 7,446,460 0.69
total for iron & Steel 3.24
Convertible Bonds (continued)
Convertible Bonds (continued)
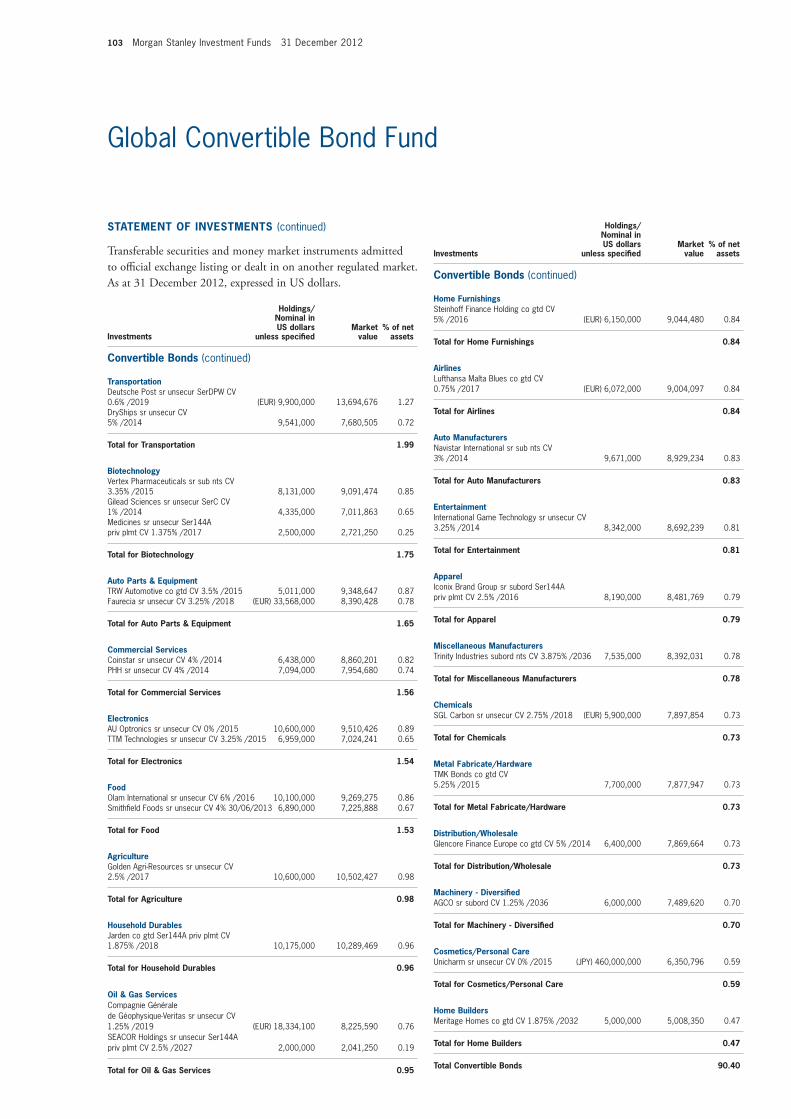
103 Morgan Stanley Investment Funds 31 December 2012
Global Convertible Bond Fund
Statement of inveStmentS (continued)
transferable securities and money market instruments admitted to official exchange listing or dealt in on another regulated market. as at 31 December 2012, expressed in US dollars.
investments
holdings/nominal in US dollars
unless specifiedmarket
value% of net
assets
transportation Deutsche Post sr unsecur SerDPW CV 0.6% /2019 (EUR) 9,900,000 13,694,676 1.27 DryShips sr unsecur CV 5% /2014 9,541,000 7,680,505 0.72
total for transportation 1.99
Biotechnology Vertex Pharmaceuticals sr sub nts CV 3.35% /2015 8,131,000 9,091,474 0.85 Gilead Sciences sr unsecur SerC CV 1% /2014 4,335,000 7,011,863 0.65 Medicines sr unsecur Ser144A priv plmt CV 1.375% /2017 2,500,000 2,721,250 0.25
total for Biotechnology 1.75
auto Parts & equipment TRW Automotive co gtd CV 3.5% /2015 5,011,000 9,348,647 0.87 Faurecia sr unsecur CV 3.25% /2018 (EUR) 33,568,000 8,390,428 0.78
total for auto Parts & equipment 1.65
Commercial Services Coinstar sr unsecur CV 4% /2014 6,438,000 8,860,201 0.82 PHH sr unsecur CV 4% /2014 7,094,000 7,954,680 0.74
total for Commercial Services 1.56
electronics AU Optronics sr unsecur CV 0% /2015 10,600,000 9,510,426 0.89 TTM Technologies sr unsecur CV 3.25% /2015 6,959,000 7,024,241 0.65
total for electronics 1.54
food Olam International sr unsecur CV 6% /2016 10,100,000 9,269,275 0.86 Smithfield Foods sr unsecur CV 4% 30/06/2013 6,890,000 7,225,888 0.67
total for food 1.53
agriculture Golden Agri-Resources sr unsecur CV 2.5% /2017 10,600,000 10,502,427 0.98
total for agriculture 0.98
household Durables Jarden co gtd Ser144A priv plmt CV 1.875% /2018 10,175,000 10,289,469 0.96
total for household Durables 0.96
oil & Gas Services Compagnie Générale de Géophysique-Veritas sr unsecur CV 1.25% /2019 (EUR) 18,334,100 8,225,590 0.76 SEACOR Holdings sr unsecur Ser144A priv plmt CV 2.5% /2027 2,000,000 2,041,250 0.19
total for oil & Gas Services 0.95
home furnishings Steinhoff Finance Holding co gtd CV 5% /2016 (EUR) 6,150,000 9,044,480 0.84
total for home furnishings 0.84
airlines Lufthansa Malta Blues co gtd CV 0.75% /2017 (EUR) 6,072,000 9,004,097 0.84
total for airlines 0.84
auto manufacturers Navistar International sr sub nts CV 3% /2014 9,671,000 8,929,234 0.83
total for auto manufacturers 0.83
entertainment International Game Technology sr unsecur CV 3.25% /2014 8,342,000 8,692,239 0.81
total for entertainment 0.81
apparel Iconix Brand Group sr subord Ser144A priv plmt CV 2.5% /2016 8,190,000 8,481,769 0.79
total for apparel 0.79
miscellaneous manufacturers Trinity Industries subord nts CV 3.875% /2036 7,535,000 8,392,031 0.78
total for miscellaneous manufacturers 0.78
Chemicals SGL Carbon sr unsecur CV 2.75% /2018 (EUR) 5,900,000 7,897,854 0.73
total for Chemicals 0.73
metal fabricate/hardware TMK Bonds co gtd CV 5.25% /2015 7,700,000 7,877,947 0.73
total for metal fabricate/hardware 0.73
Distribution/Wholesale Glencore Finance Europe co gtd CV 5% /2014 6,400,000 7,869,664 0.73
total for Distribution/Wholesale 0.73
machinery - Diversified AGCO sr subord CV 1.25% /2036 6,000,000 7,489,620 0.70
total for machinery - Diversified 0.70
Cosmetics/Personal Care Unicharm sr unsecur CV 0% /2015 (JPY) 460,000,000 6,350,796 0.59
total for Cosmetics/Personal Care 0.59
home Builders Meritage Homes co gtd CV 1.875% /2032 5,000,000 5,008,350 0.47
total for home Builders 0.47
total Convertible Bonds 90.40
investments
holdings/nominal in US dollars
unless specifiedmarket
value% of net
assets Convertible Bonds (continued)
Convertible Bonds (continued)

Morgan Stanley Investment Funds 31 December 2012 104
Global Convertible Bond Fund
equities
oil & Gas NextEra Energy Pfd Stock CV 7% 01/09/2013 205,000 10,865,000 1.01 Apache SerD Pfd Stock CV 6% 01/08/2013 178,600 8,049,502 0.75
total for oil & Gas 1.76
Banks Wells Fargo & Co. SerL Pfd Stock CV 7.5% perpetual 8,537 10,423,848 0.97
total for Banks 0.97
electric PPL Pfd Stock CV 9.5% 01/07/2013 174,650 9,076,561 0.84
total for electric 0.84
agriculture Bunge Pfd Stock CV 4.875% perpetual 81,100 8,264,090 0.77
total for agriculture 0.77
auto manufacturers General Motors SerB Pfd Stock CV 4.75% 01/12/2013 129,250 5,569,383 0.52
total for auto manufacturers 0.52
Diversified financial Services Signum Coral priv plmt 0% /2017 (3) (JPY) 12,000,000 3,299,566 0.31
total for Diversified financial Services 0.31
total for equities 5.17
mutual fund
Morgan Stanley Funds plc - US Dollar Liquidity Fund (4) 42,372,232 42,372,232 3.94
total for mutual fund 3.94
total investment Securities 1,070,046,076 99.51
DerivativeS
OtC and exchange traded derivatives as at 31 December 2012, expressed in US dollars.
forward foreign Currency exchange Contracts
maturity date
amount bought Ccy
amount sold Ccy Counterparty
Unrealised gain/(loss)
USD% of net
assets
08/01/2013 2,612,399 USD 3,185,000 SGD J.P. Morgan 4,723 0.00 08/01/2013 7,460,056 USD 9,100,000 SGD State Street 9,554 0.00 09/01/2013 4,325,000 EUR 5,617,981 USD State Street 99,734 0.01 10/01/2013 14,079,694 USD 13,499,615 AUD State Street 75,604 0.01
10/01/2013 735,503 USD 5,700,000 HKD Deutsche Bank 14 0.00 10/01/2013 2,193,573 USD 17,000,000 HKD J.P. Morgan 9 0.00 10/01/2013 14,070,540 USD 109,045,000 HKD State Street 117 0.00 22/01/2013 7,480,434 USD 6,810,000 CHF Westpac Bank 20,761 0.00 22/01/2013 70,411,853 USD 5,895,000,000 JPY J.P. Morgan 2,151,190 0.20
Unrealised Gain on forward foreign Currency exchange Contracts 2,361,706 0.22
eUr hedged Share Class 11/01/2013 2,202,286 EUR 2,903,186 USD J.P. Morgan 8,323 0.00 11/01/2013 100,963 USD 76,044 EUR J.P. Morgan 430 0.00
Unrealised Gain on nav hedged Share Classes forward foreign Currency exchange Contracts 8,753 0.00
total Unrealised Gain on forward foreign Currency exchange Contracts 2,370,459 0.22
09/01/2013 2,735,000 EUR 3,630,248 USD State Street (14,537) 0.00 09/01/2013 129,964 USD 100,000 EUR Commonwealth Bank (2,238) 0.00 09/01/2013 7,534,960 USD 5,800,000 EUR Deutsche Bank (132,727) (0.01)09/01/2013 5,706,224 USD 4,385,000 EUR J.P. Morgan (90,812) (0.01)09/01/2013 8,313,920 USD 6,400,000 EUR RBC (146,975) (0.02)09/01/2013 137,834,112 USD 106,180,000 EUR Westpac Bank (2,537,433) (0.25)10/01/2013 7,360,000 AUD 7,682,202 USD J.P. Morgan (47,163) 0.00 10/01/2013 550,000 HKD 70,970 USD Westpac Bank (2) 0.00 11/01/2013 1,113,859 USD 1,035,000 CHF Deutsche Bank (19,595) 0.00 11/01/2013 2,225,935 USD 2,065,000 CHF State Street (35,497) 0.00 17/01/2013 6,147,998 USD 3,815,000 GBP HSBC (50,939) 0.00 22/01/2013 315,000,000 JPY 3,761,014 USD State Street (113,498) (0.01)
Unrealised Loss on forward foreign Currency exchange Contracts (3,191,416) (0.30)
eUr hedged Share Class 11/01/2013 314,106,945 EUR 415,589,866 USD J.P. Morgan (328,143) (0.03)11/01/2013 258,060 USD 195,872 EUR J.P. Morgan (890) 0.00
Chf hedged Share Class 11/01/2013 19,380 CHF 21,234 USD J.P. Morgan (10) 0.00
Unrealised Loss on nav hedged Share Classes forward foreign Currency exchange Contracts (329,043) (0.03)
total Unrealised Loss on forward foreign Currency exchange Contracts (3,520,459) (0.33)
net Unrealised Loss on forward foreign Currency exchange Contracts (1,150,000) (0.11)
Cash of USD 2,550,000 held as collateral by the counterparties in relation to the above OTC contracts.
total Derivatives (1,150,000) (0.11)
other assets less Liabilities 6,439,889 0.60
total net asset value 1,075,335,965 100.00
(3) These securities are valued at their fair value. See note 2(a) within the Notes to the Financial Statements.(4) Managed by an affiliate of the Investment Adviser.(5) Variable coupon rates are those quoted as of 31 December 2012.
Statement of inveStmentS (continued)
transferable securities and money market instruments admitted to official exchange listing or dealt in on another regulated market. as at 31 December 2012, expressed in US dollars.
investments holdingsmarket
value% of net
assets
DerivativeS (continued)
OtC and exchange traded derivatives as at 31 December 2012, expressed in US dollars.
forward foreign Currency exchange Contracts (continued)
maturity date
amount bought Ccy
amount sold Ccy Counterparty
Unrealised gain/(loss)
USD% of net
assets

105 Morgan Stanley Investment Funds 31 December 2012
Please refer to the full prospectus for the Fund’s investment objective and policy.
Global Credit Fund*
inveStment aim
To provide an attractive rate of return, measured in US dollars, primarily through investment in fixed income securities of high quality issued by corporations and non-government related issuers organised or operating in both developed and emerging markets and denominated in global currencies.
Corporate Bonds
United States of americaGoldman Sachs Group sr unsecur 5.75% /2022 225,000 266,685 1.32General Electric Capital sr unsecur 3.15% /2022 250,000 256,187 1.27American International Group sr unsecur 6.4% /2020 200,000 247,837 1.23Bank of America sr unsecur 5.625% /2020 200,000 237,264 1.18Mondelez International sr unsecur 5.375% /2020 150,000 181,640 0.90Direct TV Financing co gtd 3.8% /2022 170,000 175,794 0.87Hewlett-Packard sr unsecur 2.6% /2017 175,000 171,059 0.85Comcast co gtd 5.15% /2020 125,000 149,076 0.74Enterprise Products Operating co gtd 5.25% /2020 125,000 148,547 0.74MetLife sr unsecur 6.75% /2016 125,000 148,184 0.74Wells Fargo & Co sr unsecur SerEMTN 2.625% /2022 (EUR) 100,000 137,037 0.68Citigroup unsecur 8.5% /2019 100,000 134,625 0.67JPMorgan Chase & Co sr unsecur 3.25% /2022 125,000 129,075 0.64NBCUniversal Media sr unsecur 5.95% /2041 100,000 123,153 0.61Phillips 66 co gtd 4.3% /2022 100,000 112,264 0.56Amgen sr unsecur 3.875% /2021 100,000 109,986 0.55SLM sr nts SerMTN 6.25% /2016 100,000 109,052 0.54Express Scripts Holding co gtd Ser144A priv plmt 3.9% /2022 100,000 108,327 0.54International Business Machines sr unsecur 2% /2016 100,000 103,554 0.51Cellco Partnership / Verizon Wireless Capital sr unsecur 8.5% /2018 75,000 103,335 0.51PepsiCo sr unsecur 2.75% /2022 100,000 103,264 0.51Home Depot sr unsecur 5.95% /2041 75,000 101,387 0.50Lam Research sr unsecur CV 1.25% /2018 102,000 101,235 0.50Dun & Bradstreet sr unsecur 3.25% /2017 100,000 101,178 0.50Oracle sr unsecur 1.2% /2017 100,000 100,566 0.50Costco Wholesale sr unsecur 1.7% /2019 100,000 100,418 0.50International Game Technology sr unsecur CV 3.25% /2014 96,000 100,031 0.50Microsoft sr unsecur Ser144A priv plmt CV 0% 15/06/2013 99,000 99,133 0.49Intel jr subord CV 2.95% /2035 95,000 98,076 0.49Symantec sr unsecur SerB CV 1% 15/06/2013 92,000 97,865 0.49priceline.com sr unsecur Ser144A priv plmt CV 1% /2018 91,000 97,086 0.48News America co gtd 6.15% /2041 75,000 95,853 0.48Pfizer sr unsecur 6.2% /2019 75,000 94,782 0.47Kinder Morgan Energy Partners sr unsecur 6.85% /2020 75,000 94,326 0.47Kraft Foods Group sr unsecur Ser144A priv plmt 5.375% /2020 75,000 90,268 0.45CBS co gtd 5.75% /2020 75,000 89,810 0.45CNA Financial sr unsecur 5.75% /2021 75,000 88,624 0.44Boston Scientific sr unsecur 6% /2020 75,000 87,790 0.44Gilead Sciences sr unsecur 4.5% /2021 75,000 85,870 0.43Gap sr unsecur 5.95% /2021 75,000 85,681 0.42L-3 Communications co gtd 4.75% /2020 75,000 83,477 0.41Barrick North America Finance co gtd 4.4% /2021 75,000 82,268 0.41Philip Morris International sr unsecur 4.5% /2042 75,000 82,161 0.41Genworth Financial sr unsecur 7.2% /2021 75,000 81,384 0.40Time Warner co gtd 4.9% /2042 75,000 81,001 0.40Sonoco Products sr unsecur 4.375% /2021 75,000 80,773 0.40Pioneer Natural Resources sr unsecur 3.95% /2022 75,000 79,327 0.39Intel sr unsecur 2.7% /2022 75,000 75,063 0.37Eaton co gtd Ser144A priv plmt 2.75% /2022 75,000 75,033 0.37Time Warner Cable co gtd 4.5% /2042 75,000 74,218 0.37Prudential Financial jr subord 5.625% /2043 (5) 70,000 72,435 0.36
Statement of inveStmentS
transferable securities and money market instruments admitted to official exchange listing or dealt in on another regulated market. as at 31 December 2012, expressed in US dollars.
investments
nominal in US dollars
unless specifiedmarket
value% of net
assets
* Fund commenced operations on 14 November 2012.

Morgan Stanley Investment Funds 31 December 2012 106
Global Credit Fund
Verizon Communications sr unsecur 6.4% /2038 50,000 68,163 0.34JPMorgan Chase & Co sr unsecur 6.4% /2038 50,000 67,696 0.34Waste Management co gtd 6.125% /2039 50,000 63,677 0.32Hess sr unsecur 6% /2040 50,000 61,429 0.30Wal-Mart Stores sr unsecur 5.25% /2035 50,000 60,901 0.30Lincoln National sr unsecur 6.25% /2020 50,000 60,040 0.30Marathon Petroleum sr unsecur 5.125% /2021 50,000 58,944 0.29Cigna sr unsecured 5.375% /2042 50,000 58,404 0.29CVS Caremark sr unsecur 5.75% /2017 49,000 58,329 0.29Exelon Generation sr unsecur 6.25% /2039 50,000 58,207 0.29Hartford Financial Services Group sr unsecur 5.5% /2020 50,000 57,993 0.29Williams Partners sr unsecur 5.25%/2020 50,000 57,782 0.29American Express sr unsecur Ser144A priv plmt 2.65% /2022 57,000 57,069 0.28Caterpillar sr unsecur 3.9% /2021 50,000 56,075 0.28AES sr unsecur 7.375% /2021 50,000 55,833 0.28Agilent Technologies sr unsecur 5.5% /2015 50,000 55,749 0.28Halliburton sr unsecur 4.5% /2041 50,000 55,470 0.28Occidental Petroleum sr unsecur 4.125% /2016 50,000 55,383 0.27Cisco Systems sr unsecur 3.15% /2017 50,000 54,433 0.27Bemis sr unsecur 4.5% /2021 50,000 54,408 0.27DISH DBS co gtd 5.875% /2022 50,000 54,187 0.27Boston Gas sr unsecur Ser144A priv plmt 4.487% /2042 50,000 53,563 0.27Macy’s Retail Holdings co gtd 3.875% /2022 50,000 53,500 0.27CIT Group sr unsecur 5% /2017 50,000 53,378 0.27Ecolab sr unsecur 3% /2016 50,000 53,214 0.26Weatherford International co gtd 4.5% /2022 (Bermuda) (2) 50,000 53,196 0.26PPL WEM Holdings sr unsecur Ser144A priv plmt 3.9% /2016 (United Kingdom) (2) 50,000 52,698 0.26Omnicom Group co gtd 3.625% /2022 50,000 52,481 0.26Marquette Transportation Finance secured 10.875% /2017 50,000 52,250 0.26Coca-Cola Co sr unsecur 1.65% /2018 50,000 51,491 0.26Motorola Solutions sr unsecur 3.75% /2022 50,000 51,363 0.26FMC Technologies sr unsecur 3.45% /2022 50,000 51,280 0.25CC Holdings GS V sr secured Ser144A priv plmt 3.849% /2023 50,000 51,074 0.25Tronox Finance co gtd Ser144A priv plmt 6.375% /2020 50,000 50,687 0.25UnitedHealth Group sr unsecur 2.75% /2023 50,000 50,473 0.25NetApp sr unsecur 2% /2017 50,000 49,883 0.25Schlumberger Norge co gtd Ser144A priv plmt 1.25% /2017 (Norway) (2) 50,000 49,845 0.25Realty Income sr unsecur 3.25% /2022 50,000 49,190 0.24Verizon Communications sr unsecur 8.75% /2018 32,453 45,077 0.22Exide Technologies sr secured 8.625% /2018 50,000 42,667 0.21Altria Group co gtd 10.2% /2039 25,000 42,239 0.21Yum! Brands sr unsecur 6.875% /2037 25,000 34,975 0.17Citigroup sr unsecur 6.875% /2038 25,000 33,308 0.16Plains All American Finance sr unsecur 6.7% /2036 25,000 32,268 0.16AT&T sr unsecur priv plmt 5.35% /2040 25,000 29,209 0.15Capital One Financial subord 6.15% /2016 25,000 28,674 0.14Goldman Sachs Group subord 6.75% /2037 25,000 28,409 0.14CenturyLink sr unsecur 6.45% /2021 25,000 27,679 0.14AbbVie co gtd Ser144A priv plmt 4.4% /2042 25,000 26,752 0.13Tesoro co gtd 5.375% /2022 25,000 26,750 0.13Williams Companies sr unsecur 3.7% /2023 25,000 25,403 0.13Intel sr unsecur 2.7% /2022 25,000 25,021 0.12ACMP Finance co gtd 4.875% /2023 15,000 15,300 0.08
total for United States of america 42.23
United KingdomInterContinental Hotels Group co gtd SerEMTN 3.875% /2022 (GBP) 100,000 165,049 0.82Vodafone Group sr unsecur 5.45% /2019 125,000 152,370 0.76Imperial Tobacco Finance co gtd SerEMTN 4.5% /2018 (EUR) 100,000 151,291 0.75Barclays Bank subord SerEMTN 6% /2021 (EUR) 100,000 150,025 0.75Barclays Bank sr unsecur 5.125% /2020 125,000 142,366 0.71G4S International Finance co gtd SerEMTN 2.625% /2018 (EUR) 100,000 132,279 0.66Lloyds TSB Bank subord SerEMTN 6.5% /2020 (EUR) 75,000 113,519 0.56Abbey National Treasury Services covered SerEMTN 3.625% /2016 (EUR) 75,000 109,181 0.54BP Capital Markets co gtd 3.245% /2022 100,000 105,522 0.52HSBC Holdings subord SerEMTN 6% /2019 (EUR) 50,000 80,089 0.40Royal Bank of Scotland sr unsecur SerEMTN 5.5% /2020 (EUR) 50,000 79,919 0.40Royal Bank of Scotland sr unsecur SerEMTN 5.375% /2019 (EUR) 50,000 79,074 0.39BAT International Finance co gtd SerEMTN 5.375% /2017 (EUR) 50,000 78,206 0.39Standard Chartered Bank subord SerEMTN 5.875% /2017 (EUR) 50,000 77,149 0.38Heathrow Funding sr secured RegS 4.6% /2018 (Jersey) (2) (EUR) 50,000 75,195 0.37HSBC Bank sr unsecur SerEMTN 3.75% /2016 (EUR) 50,000 73,182 0.36Smiths Group co gtd 4.125% /2017 (EUR) 50,000 72,566 0.36Ineos Finance sr secured RegS 9.25% /2015 (EUR) 50,000 71,294 0.35Nationwide Building Society sr unsecur SerEMTN 3.75% /2015 (EUR) 50,000 69,948 0.35Diageo Investment co gtd 2.875% /2022 (United States of America) (2) 50,000 51,736 0.26
total for United Kingdom 10.08
franceBNP Paribas bnk gtd SerBKNT 5% /2021 200,000 225,919 1.12Société Générale sr unsecur Ser144A priv plmt 5.2% /2021 200,000 221,352 1.10Crédit Agricole unsecur Ser144A priv plmt 3% /2017 200,000 205,046 1.02Credit Agricole subord SerEMTN 3.9% /2021 (EUR) 100,000 133,961 0.67BNP Paribas subord SerEMTN 5.431% /2017 (EUR) 75,000 113,400 0.56Total Capital International co gtd 2.875% /2022 100,000 104,648 0.52Schneider Electric sr unsecur Ser144A priv plmt 2.95% /2022 100,000 101,002 0.50LVMH Moet Hennessy Louis Vuitton sr unsecur Ser144A priv plmt 1.625% /2017 75,000 76,324 0.38France Telecom sr unsecur SerEMTN 4.75% /2017 (EUR) 50,000 75,362 0.37Lafarge sr unsecur SerEMTN 6.75% /2019 (EUR) 50,000 74,777 0.37Eutelsat sr unsecur 4.125% /2017 (EUR) 50,000 73,557 0.37Banque Federative du Credit Mutuel sr unsecur SerEMTN 4.375% /2016 (EUR) 50,000 73,322 0.36Crown European Holdings co gtd RegS 7.125% /2018 (EUR) 50,000 72,949 0.36Edenred sr unsecur 3.625% /2017 (EUR) 50,000 71,674 0.36AXA sr unsecur SerEMTN 4.5% /2015 (EUR) 50,000 71,092 0.35Banque PSA Finance sr unsecur SerEMTN 3.5% /2014 (EUR) 50,000 66,919 0.33
total for france 8.74
investments
nominal in US dollars
unless specifiedmarket
value% of net
assets
Statement of inveStmentS (continued)
transferable securities and money market instruments admitted to official exchange listing or dealt in on another regulated market. as at 31 December 2012, expressed in US dollars.
investments
nominal in US dollars
unless specifiedmarket
value% of net
assets
Corporate Bonds (continued)
Corporate Bonds (continued)
United States of america (continued)

107 Morgan Stanley Investment Funds 31 December 2012
Global Credit Fund
Koninklijke KPN sr unsecur SerGMTN 5.625% /2024 (EUR) 50,000 76,922 0.38ING Groep sr unsecur SerEMTN 4.75% /2017 (EUR) 50,000 75,829 0.38Ziggo Bond co gtd RegS 8% /2018 (EUR) 50,000 72,952 0.36Cooperatieve Centrale Raiffeisen-Boerenleenbank subord SerGMTN 3.75% /2020 (EUR) 50,000 70,806 0.35Aegon sr unsecur 4.625% /2015 50,000 54,663 0.27
total for netherlands 2.95
SpainAmadeus Capital Markets co gtd SerEMTN 4.875% /2016 (EUR) 100,000 144,880 0.72Telefonica Emisiones co gtd SerEMTN 4.967% /2016 (EUR) 100,000 142,904 0.71Banco Bilbao Vizcaya Argentaria covered SerEMTN 4.25% /2017 (EUR) 100,000 138,209 0.69Telefonica Emisiones co gtd SerEMTN 4.693% /2019 (EUR) 50,000 72,220 0.36BBVA Senior Finance bnk gtd SerGMTN 4.875% /2014 (EUR) 50,000 67,867 0.33
total for Spain 2.81
SwitzerlandRoche Holdings co gtd Ser144A priv plmt 6% /2019 (United States of America) (2) 125,000 156,109 0.77Credit Suisse sr unsecur SerEMTN 4.75% /2019 (EUR) 75,000 118,044 0.59Novartis Capital co gtd 2.9% /2015 (United States of America) (2) 100,000 105,292 0.52ABB Finance USA co gtd 2.875% /2022 (United States of America) (2) 100,000 102,285 0.51Credit Suisse subord 5.4% /2020 25,000 28,213 0.14
total for Switzerland 2.53
mexicoSigma Alimentos co gtd Ser144A priv plmt 5.625% /2018 150,000 170,132 0.85Banco Santander Mexico Institucion de Banca Multiple Grupo Financiero Santand sr unsecur Ser144A priv plmt 4.125% /2022 150,000 151,864 0.75Grupo Bimbo SAB co gtd Ser144A priv plmt 4.875% /2020 100,000 112,660 0.56
total for mexico 2.16
ChinaCNOOC Finance 2012 co gtd Ser144A priv plmt 3.875% /2022 (British Virgin Islands) (2) 200,000 213,354 1.06Amber Circle Funding co gtd RegS 3.25% /2022 (Cayman Islands) (2) 200,000 203,251 1.01
total for China 2.07
CanadaCanadian Oil Sands sr unsecur Ser144A priv plmt 7.75% /2019 75,000 95,882 0.48Goldcorp sr unsecur CV 2% /2014 87,000 95,483 0.47Teck Resources co gtd 6.25% /2041 50,000 58,949 0.29Kinross Gold co gtd 5.125% /2021 50,000 51,511 0.26Xstrata Finance Canada co gtd Ser144A priv plmt 4% /2022 50,000 50,786 0.25Eldorado Gold sr unsecur Ser144A priv plmt 6.125% /2020 35,000 35,700 0.18
total for Canada 1.93
investments
nominal in US dollars
unless specifiedmarket
value% of net
assets
Statement of inveStmentS (continued)
transferable securities and money market instruments admitted to official exchange listing or dealt in on another regulated market. as at 31 December 2012, expressed in US dollars.
investments
nominal in US dollars
unless specifiedmarket
value% of net
assets Corporate Bonds (continued)
Corporate Bonds (continued)
netherlands (continued)
italyTelecom Italia sr unsecur SerEMTN 6.125% /2018 (EUR) 125,000 189,326 0.94Intesa Sanpaolo sr unsecur Ser144A priv plmt 6.5% /2021 150,000 158,245 0.79UniCredit sr unsecur 4.875% /2017 (EUR) 100,000 141,941 0.70Banca Monte dei Paschi di Siena sr unsecur SerEMTN 4.5% /2014 (EUR) 100,000 132,080 0.66Enel Finance International co gtd Ser144A priv plmt 5.125% /2019 (Netherlands) (2) 100,000 105,788 0.52Telecom Italia Finance co gtd SerEMTN 7.75% /2033 (Luxembourg) (2) (EUR) 50,000 76,592 0.38Lottomatica Group co gtd 5.375% /2018 (EUR) 50,000 73,820 0.37Enel Finance International co gtd SerEMTN 5% /2022 (Netherlands) (2) (EUR) 50,000 70,739 0.35Wind Acquisition Finance secured RegS 11.75% /2017 (Luxembourg) (2) (EUR) 50,000 69,187 0.34Intesa Sanpaolo sr unsecur SerEMTN 3.75% /2016 (EUR) 50,000 68,361 0.34
total for italy 5.39
GermanyDeutsche Bank subord SerEMTN 5% /2020 (EUR) 100,000 147,235 0.73Daimler Finance North America co gtd 8.5% /2031 (United States of America) (2) 75,000 116,831 0.58Allianz Finance II co gtd SerEMTN 4.75% /2019 (Netherlands) (2) (EUR) 50,000 79,170 0.39Linde Finance co gtd 7.375% /2066 (Netherlands) (2) (5) (EUR) 50,000 77,583 0.39Volkswagen Leasing co gtd SerEMTN 2.75% /2015 (EUR) 50,000 69,345 0.34Commerzbank sr unsecur SerEMTN 5% /2014 (EUR) 50,000 69,222 0.34HeidelbergCement Finance Luxembourg co gtd 8.5% /2019 (Luxembourg) (2) (EUR) 25,000 41,280 0.20Deutsche Telekom International Finance co gtd 8.75% /2030 (Netherlands) (2) 25,000 37,633 0.19RWE jr subord 4.625% perpetual (5) (EUR) 25,000 33,704 0.17Bilfinger sr unsecur 2.375% /2019 (EUR) 10,000 13,740 0.07
total for Germany 3.40
australiaCommonwealth Bank of Australia sr unsecur Ser144A priv plmt 5% /2020 175,000 204,622 1.02Macquarie Group sr unsecur Ser144A priv plmt 6% /2020 125,000 136,036 0.67National Australia Bank subord SerEMTN 6.75% /2023 (5) (EUR) 50,000 77,892 0.39Australia & New Zealand Banking Group subord SerEMTN 5.125% /2019 (EUR) 50,000 76,888 0.38National Australia Bank sr unsecur SerEMTN 3.5% /2015 (EUR) 50,000 69,946 0.35FMG Resources August 2006 Proprietary co gtd Ser144A priv plmt 6.375% /2016 50,000 52,000 0.26
total for australia 3.07
netherlandsABN Amro Bank subord SerEMTN 6.375% /2021 (EUR) 100,000 151,625 0.76Koninklijke Philips Electronics sr unsecur 5.75% /2018 75,000 91,022 0.45
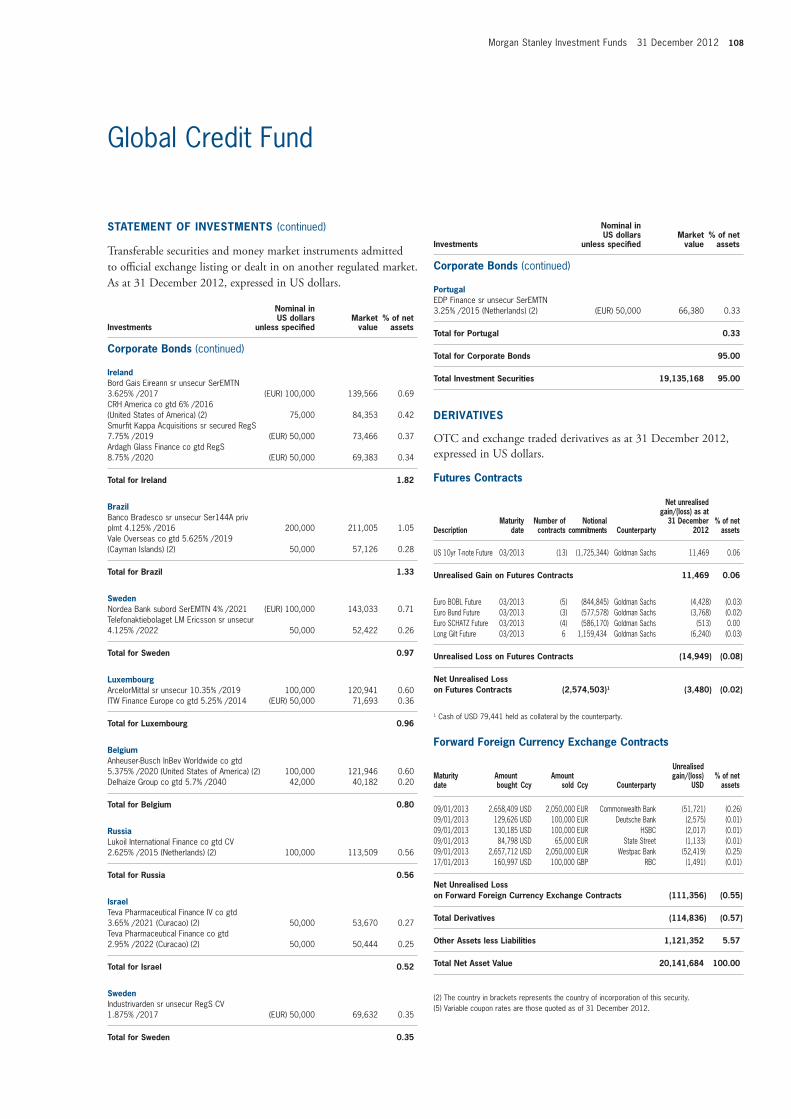
Morgan Stanley Investment Funds 31 December 2012 108
Global Credit Fund
irelandBord Gais Eireann sr unsecur SerEMTN 3.625% /2017 (EUR) 100,000 139,566 0.69CRH America co gtd 6% /2016 (United States of America) (2) 75,000 84,353 0.42Smurfit Kappa Acquisitions sr secured RegS 7.75% /2019 (EUR) 50,000 73,466 0.37Ardagh Glass Finance co gtd RegS 8.75% /2020 (EUR) 50,000 69,383 0.34
total for ireland 1.82
BrazilBanco Bradesco sr unsecur Ser144A priv plmt 4.125% /2016 200,000 211,005 1.05Vale Overseas co gtd 5.625% /2019 (Cayman Islands) (2) 50,000 57,126 0.28
total for Brazil 1.33
SwedenNordea Bank subord SerEMTN 4% /2021 (EUR) 100,000 143,033 0.71Telefonaktiebolaget LM Ericsson sr unsecur 4.125% /2022 50,000 52,422 0.26
total for Sweden 0.97
LuxembourgArcelorMittal sr unsecur 10.35% /2019 100,000 120,941 0.60ITW Finance Europe co gtd 5.25% /2014 (EUR) 50,000 71,693 0.36
total for Luxembourg 0.96
BelgiumAnheuser-Busch InBev Worldwide co gtd 5.375% /2020 (United States of America) (2) 100,000 121,946 0.60Delhaize Group co gtd 5.7% /2040 42,000 40,182 0.20
total for Belgium 0.80
russiaLukoil International Finance co gtd CV 2.625% /2015 (Netherlands) (2) 100,000 113,509 0.56
total for russia 0.56
israelTeva Pharmaceutical Finance IV co gtd 3.65% /2021 (Curacao) (2) 50,000 53,670 0.27Teva Pharmaceutical Finance co gtd 2.95% /2022 (Curacao) (2) 50,000 50,444 0.25
total for israel 0.52
SwedenIndustrivarden sr unsecur RegS CV 1.875% /2017 (EUR) 50,000 69,632 0.35
total for Sweden 0.35
PortugalEDP Finance sr unsecur SerEMTN 3.25% /2015 (Netherlands) (2) (EUR) 50,000 66,380 0.33
total for Portugal 0.33
total for Corporate Bonds 95.00
total investment Securities 19,135,168 95.00
DerivativeS
OtC and exchange traded derivatives as at 31 December 2012, expressed in US dollars.
futures Contracts
Descriptionmaturity
datenumber of contracts
notional commitments Counterparty
net unrealised gain/(loss) as at
31 December 2012
% of net assets
US 10yr T-note Future 03/2013 (13) (1,725,344) Goldman Sachs 11,469 0.06
Unrealised Gain on futures Contracts 11,469 0.06
Euro BOBL Future 03/2013 (5) (844,845) Goldman Sachs (4,428) (0.03)Euro Bund Future 03/2013 (3) (577,578) Goldman Sachs (3,768) (0.02)Euro SCHATZ Future 03/2013 (4) (586,170) Goldman Sachs (513) 0.00Long Gilt Future 03/2013 6 1,159,434 Goldman Sachs (6,240) (0.03)
Unrealised Loss on futures Contracts (14,949) (0.08)
net Unrealised Loss on futures Contracts (2,574,503)1 (3,480) (0.02)
1 Cash of USD 79,441 held as collateral by the counterparty.
forward foreign Currency exchange Contracts
maturity date
amount bought Ccy
amount sold Ccy Counterparty
Unrealised gain/(loss)
USD% of net
assets
09/01/2013 2,658,409 USD 2,050,000 EUR Commonwealth Bank (51,721) (0.26)09/01/2013 129,626 USD 100,000 EUR Deutsche Bank (2,575) (0.01)09/01/2013 130,185 USD 100,000 EUR HSBC (2,017) (0.01)09/01/2013 84,798 USD 65,000 EUR State Street (1,133) (0.01)09/01/2013 2,657,712 USD 2,050,000 EUR Westpac Bank (52,419) (0.25)17/01/2013 160,997 USD 100,000 GBP RBC (1,491) (0.01)
net Unrealised Loss on forward foreign Currency exchange Contracts (111,356) (0.55)
total Derivatives (114,836) (0.57)
other assets less Liabilities 1,121,352 5.57
total net asset value 20,141,684 100.00
(2) The country in brackets represents the country of incorporation of this security.(5) Variable coupon rates are those quoted as of 31 December 2012.
Statement of inveStmentS (continued)
transferable securities and money market instruments admitted to official exchange listing or dealt in on another regulated market. as at 31 December 2012, expressed in US dollars.
investments
nominal in US dollars
unless specifiedmarket
value% of net
assets Corporate Bonds (continued)
investments
nominal in US dollars
unless specifiedmarket
value% of net
assets Corporate Bonds (continued)

109 Morgan Stanley Investment Funds 31 December 2012
Please refer to the full prospectus for the Fund’s investment objective and policy.
Global Fixed Income Opportunities Fund
inveStment aim
To provide an attractive level of total return, measured in US dollars, through investment primarily in the global securities of corporate, government and government related issuers across a spectrum of fixed income asset classes including high yield bonds, investment-grade bonds, mortgage-backed securities, convertibles and currencies.
Corporate Bonds
United States of america Merrill Lynch & Co subord 6.11% /2037 475,000 527,882 0.41Goldman Sachs Group subord 6.75% /2037 450,000 511,362 0.40HSBC Finance sr subord 6.676% /2021 425,000 507,339 0.39Genworth Financial sr unsecur 7.2% /2021 450,000 488,302 0.38Prudential Financial jr subord 5.625% /2043 (5) 440,000 455,308 0.35Nationwide Financial Services sr unsecur Ser144A priv plmt 5.375% /2021 400,000 429,199 0.33GE Capital Trust II ltd gtd RegS 5.5% /2067 (5) (EUR) 325,000 426,700 0.33SLM sr unsecur SerMTN 8% /2020 275,000 314,313 0.25GXS Worldwide sr secured 9.75% /2015 300,000 313,875 0.24CCM Merger co gtd Ser144A priv plmt 9.125% /2019 300,000 303,000 0.24Kratos Defense & Security Solutions sr secured 10% /2017 250,000 275,000 0.21Chrysler Group Co-Issuer secured 8% /2019 250,000 274,426 0.21Tekni-Plex sr secured Ser144A priv plmt 9.75% /2019 250,000 274,375 0.21Nuveen Investments sr unsecur Ser144A priv plmt 9.125% /2017 275,000 271,562 0.21Burlington Coat Factory Warehouse co gtd 10% /2019 250,000 271,179 0.21Crown Castle International sr unsecur Ser144A priv plmt 5.25% /2023 250,000 268,437 0.21Atkore International sr secured 9.875% /2018 250,000 266,875 0.21Empire Today Finance sr secured Ser144A priv plmt 11.375% /2017 250,000 266,875 0.21Wolverine World Wide co gtd Ser144A priv plmt 6.125% /2020 250,000 263,750 0.21VWR Funding co gtd Ser144A priv plmt 7.25% /2017 250,000 263,750 0.21Rite Aid co gtd 9.5% /2017 250,000 262,085 0.20ServiceMaster co gtd 8% /2020 250,000 260,940 0.20Cequel Communications Holdings sr unsecur Ser144A priv plmt 6.375% /2020 250,000 260,625 0.20Heckmann co gtd 9.875% /2018 250,000 259,375 0.20American Gilsonite sr secured Ser144A priv plmt 11.5% /2017 250,000 258,750 0.20First Data co gtd PIK 10.55% /2015 250,000 257,187 0.20Continental Airlines 2012-3 Class C pass thru certs 6.125% /2018 250,000 251,399 0.20Bumble Bee Holdco sr nts Ser144A priv plmt PIK 9.625% /2018 (Luxembourg) (2) 250,000 249,375 0.19Taminco Acquisition sr unsecur Ser144A priv plmt PIK 9.125% /2017 250,000 247,500 0.19Chester Downs & Marina sr secured Ser144A priv plmt 9.25% /2020 250,000 246,875 0.19Viasystems sr secured Ser144A priv plmt 7.875% /2019 250,000 246,250 0.19Kindred Healthcare co gtd RegS 8.25% /2019 250,000 245,000 0.19Supervalu sr unsecur 8% /2016 250,000 237,624 0.19Marquette Transportation Finance secured 10.875% /2017 225,000 235,125 0.18Logan’s Roadhouse secured 10.75% /2017 250,000 233,817 0.18DynCorp International co gtd 10.375% /2017 250,000 231,940 0.18Infor US co gtd 9.375% /2019 200,000 225,500 0.18Building Materials Corp of America sr nts Ser144A priv plmt 6.75% /2021 200,000 222,000 0.17Rivers Pittsburgh Borrower Finance sr secured Ser144A priv plmt 9.5% /2019 200,000 218,000 0.17iGATE co gtd 9% /2016 200,000 217,500 0.17CDW Finance co gtd 8.5% /2019 200,000 217,500 0.17Navios Maritime Finance II co gtd 8.125% /2019 (Marshall Islands) (2) 250,000 216,879 0.17
Statement of inveStmentS
transferable securities and money market instruments admitted to official exchange listing or dealt in on another regulated market. as at 31 December 2012, expressed in US dollars.
investments
nominal in US dollars
unless specifiedmarket
value% of net
assets

Morgan Stanley Investment Funds 31 December 2012 110
Global Fixed Income Opportunities Fund
investments
nominal in US dollars
unless specifiedmarket
value% of net
assets
Statement of inveStmentS (continued)
transferable securities and money market instruments admitted to official exchange listing or dealt in on another regulated market. as at 31 December 2012, expressed in US dollars.
investments
nominal in US dollars
unless specifiedmarket
value% of net
assets
Clearwire Finance sr secured Ser144A priv plmt 12% /2015 200,000 216,250 0.17CCO Holdings Capital co gtd 6.5% /2021 200,000 215,800 0.17Sabre Holdings sr unsecur 8.35% /2016 200,000 215,000 0.17Consolidated Container Capital co gtd Ser144A priv plmt 10.125% /2020 200,000 214,500 0.17Community Health Systems co gtd 7.125% /2020 200,000 214,413 0.17Armored Autogroup co gtd 9.25% /2018 250,000 213,125 0.17Dycom Investments co gtd Ser144A priv plmt 7.125% /2021 200,000 212,000 0.17Albea Beauty Holdings sr secured Ser144A priv plmt 8.375% /2019 (Luxembourg) (2) 200,000 212,000 0.17Jaguar Holding sr unsecur Ser144A priv plmt PIK 9.375 /2017 200,000 211,000 0.16Terex co gtd 6% /2021 200,000 210,500 0.16IMS Health sr unsecur Ser144A priv plmt 6% /2020 200,000 210,000 0.16Vanguard Health Holding Co II co gtd 8% /2018 200,000 209,100 0.16Crestwood Midstream Finance co gtd 7.75% /2019 200,000 208,500 0.16Prince Mineral Holding sr secured Ser144A priv plmt 11.5% /2019 200,000 208,000 0.16JB Poindexter & Co sr unsecur Ser144A priv plmt 9% /2022 200,000 207,750 0.16Pretium Packaging Finance secured 11.5% /2016 200,000 207,250 0.16Kenan Advantage Group sr unsecur Ser144A priv plmt 8.375% /2018 200,000 206,000 0.16Sabine Pass sr secured Ser144A priv plmt 6.5% /2020 200,000 204,500 0.16Access Midstream Partners co gtd 4.875% /2023 200,000 204,000 0.16Tronox Finance co gtd Ser144A priv plmt 6.375% /2020 200,000 202,750 0.16inVentiv Health sr secured Ser144A priv plmt 9% /2018 200,000 202,500 0.16Sequa co gtd Ser144A priv plmt 7% /2017 200,000 202,250 0.16INTCOMEX secured 13.25% /2014 193,000 200,720 0.16Avaya sr secured Ser144A priv plmt 7% /2019 200,000 188,000 0.15Knowledge Universe Education co gtd Ser144A priv plmt 7.75% /2015 200,000 187,000 0.15CNO Financial Group sr secured Ser144A priv plmt 6.375% /2020 175,000 182,875 0.14Exide Technologies sr secured 8.625% /2018 200,000 170,670 0.13Sealed Air co gtd Ser144A priv plmt 8.125% /2019 150,000 169,875 0.13Commercial Barge Line secured 12.5% /2017 150,000 166,500 0.13Emergency Medical Services co gtd 8.125% /2019 150,000 165,469 0.13CommScope co gtd Ser144A priv plmt 8.25% /2019 150,000 165,000 0.13Level 3 Financing co gtd 8.125% /2019 150,000 164,625 0.13Quality Distribution Capital secured 9.875% /2018 150,000 163,125 0.13Ameristar Casinos co gtd 7.5% /2021 150,000 162,589 0.13Levi Strauss & Co sr unsecur 6.875% /2022 150,000 161,625 0.13Spectrum Brands co gtd Ser144A priv plmt 6.75% /2020 150,000 161,625 0.13Graton Economic Development Authority sr secured Ser144A priv plmt 9.625% /2019 150,000 161,437 0.13Kennedy-Wilson co gtd Ser144A priv plmt 8.75% /2019 150,000 160,500 0.12Tesoro co gtd 5.375% /2022 150,000 160,500 0.12Mead Products Brands co gtd Ser144A priv plmt 6.75% /2020 150,000 158,250 0.12Penn Virginia co gtd 10.375% /2016 150,000 157,585 0.12Kraton Polymers Capital co gtd 6.75% /2019 150,000 155,812 0.12Scientific Games International co gtd Ser144A priv plmt 6.25% /2020 150,000 155,063 0.12
Northern Oil and Gas co gtd 8% /2020 150,000 153,750 0.12US Foods sr unsecur Ser144A priv plmt 8.5% /2019 150,000 153,469 0.12priceline.com sr unsecur Ser144A priv plmt CV 1% /2018 128,000 136,560 0.11WMG Acquisition sr secured RegS 6.25% /2021 (EUR) 100,000 135,387 0.11Caesars Entertainment Operating secured 10% /2018 200,000 133,403 0.10WellPoint sr unsecur Ser144A priv plmt CV 2.75% /2042 124,000 132,913 0.10Northern Tier Finance sr secured Ser144A priv plmt 7.125% /2020 125,000 130,000 0.10E*TRADE Financial sr unsecur 6.375% /2019 125,000 128,419 0.10Annaly Capital Management sr unsecur CV 5% /2015 123,000 124,845 0.10Jarden co gtd Ser144A priv plmt CV 1.875% /2018 121,000 122,361 0.10CSC Holdings sr unsecur 8.625% /2019 100,000 119,685 0.09DISH DBS co gtd 6.75% /2021 100,000 114,615 0.09Realogy sr secured Ser144A priv plmt 7.625% /2020 100,000 114,000 0.09Denbury Resources co gtd 8.25% /2020 100,000 113,000 0.09MGM Resorts International co gtd Ser144A priv plmt 8.625% /2019 100,000 111,750 0.09AES sr unsecur 7.375% /2021 100,000 111,667 0.09Smithfield Foods sr unsecur 6.625% /2022 100,000 110,704 0.09Harron Communications sr nts Ser144A priv plmt 9.125% /2020 100,000 110,000 0.09Host Hotels & Resorts sr unsecur 5.25% /2022 100,000 110,000 0.09Freescale Semiconductor sr secured Ser144A priv plmt 9.25% /2018 100,000 109,750 0.09Lam Research sr unsecur CV 1.25% /2018 110,000 109,175 0.08Dana Holding sr unsecur 6.5% /2019 100,000 107,250 0.08Kennedy-Wilson co gtd 8.75% /2019 100,000 107,000 0.08WMG Acquisition sr secured Ser144A priv plmt 6% /2021 100,000 106,000 0.08Crosstex Energy Finance co gtd Ser144A priv plmt 7.125% /2022 100,000 104,750 0.08Monitronics International co gtd 9.125% /2020 100,000 103,500 0.08FMG Resources August 2006 Proprietary co gtd Ser144A priv plmt 6.875% /2022 (Australia) (2) 100,000 102,875 0.08FMG Resources August 2006 Proprietary co gtd Ser144A priv plmt 6.875% /2022 (Australia) (2) 100,000 102,875 0.07SanDisk sr unsecur CV 1.5% /2017 71,000 81,998 0.06Ares Capital sr unsecur CV 5.75% /2016 71,000 76,708 0.06General Cable subord CV step cpn 4.5% /2029 73,000 76,650 0.06Affiliated Managers Group sr unsecur CV 3.95% /2038 67,000 74,047 0.06International Game Technology sr unsecur CV 3.25% /2014 68,000 70,855 0.06Smithfield Foods sr unsecur CV 4% 30/06/2013 66,000 69,218 0.05Intel jr subord CV 2.95% /2035 64,000 66,072 0.05Symantec sr unsecur SerB CV 1% 15/06/2013 52,000 55,315 0.04Spectrum Brands Escrow sr unsecur Ser144A priv plmt 6.625% /2022 50,000 53,875 0.04Royal Caribbean Cruises sr unsecur 5.25% /2022 (Liberia) (2) 50,000 53,076 0.04
total for United States of america 18.99
Germany Brenntag Finance co gtd 5.5% /2018 (Netherlands) (2) (EUR) 350,000 528,061 0.41KfW - Kreditanstalt fuer Wiederaufbau govt gtd SerMTN 6% /2017 (AUD) 450,000 511,299 0.40Allianz Finance II co gtd SerEMTN 5.75% /2041 (Netherlands) (2) (5) (EUR) 300,000 455,858 0.35Muenchener Rueckversicherungs subord SerEMTN 6.25% /2042 (EUR) 200,000 320,874 0.24Commerzbank subord SerEMTN 7.75% /2021 (EUR) 200,000 284,793 0.22
Corporate Bonds (continued)
United States of america (continued)
Corporate Bonds (continued)
United States of america (continued)

111 Morgan Stanley Investment Funds 31 December 2012
Global Fixed Income Opportunities Fund
investments
nominal in US dollars
unless specifiedmarket
value% of net
assets
Odebrecht Finance co gtd Ser144A priv plmt 6% /2023 (Cayman Islands) (2) 294,000 340,914 0.27
total for Brazil 1.90
indonesia PT Perusahaan Listrik Negara sr unsecur RegS 5.5% /2021 1,000,000 1,132,940 0.88Pertamina Persero sr unsecur Ser144A priv plmt 4.875% /2022 800,000 877,360 0.69
total for indonesia 1.57
france Crédit Agricole subord SerEMTN 5.875% /2019 (EUR) 300,000 454,100 0.35Société Générale sr unsecur Ser144A priv plmt 5.2% /2021 400,000 442,704 0.35AXA subord SerEMTN 5.25% /2040 (5) (EUR) 300,000 415,267 0.32Europcar Groupe secured RegS 11.5% /2017 (EUR) 240,000 335,863 0.26Lafarge sr unsecur SerEMTN 6.75% /2019 (EUR) 175,000 261,718 0.21
total for france 1.49
mexico Petroleos Mexicanos co gtd 4.875% /2022 1,350,000 1,525,709 1.19Cemex Finance sr secured Ser144A priv plmt 9.375% /2022 (United States of America) (2) 250,000 282,802 0.22
total for mexico 1.41
Luxembourg ArcelorMittal sr unsecur 10.35% /2019 380,000 459,574 0.35Ardagh Packaging Finance sr secured RegS 7.375% /2017 (Ireland) (2) (EUR) 200,000 289,791 0.22DH Services Luxembourg co gtd Ser144A priv plmt 7.75% /2020 250,000 251,250 0.20Gategroup Finance Luxembourg co gtd RegS 6.75% /2019 (EUR) 150,000 212,005 0.17Silver II US Holdings co gtd Ser144A priv plmt 7.75% /2020 200,000 208,000 0.16Albea Beauty Holdings sr secured RegS 8.75% /2019 (EUR) 100,000 139,676 0.11ArcelorMittal sr unsecur CV 7.25% /2014 (EUR) 441,700 129,444 0.10
total for Luxembourg 1.31
Spain Banco Bilbao Vizcaya Argentaria covered 3.625% /2017 (EUR) 300,000 405,161 0.31Santander International Debt bnk gtd SerEMTN 3.381% /2015 (EUR) 300,000 400,188 0.31Gas Natural Capital Markets co gtd SerEMTN 4.375% /2016 (EUR) 250,000 354,833 0.28Telefonica Emisiones co gtd SerEMTN 4.967% /2016 (EUR) 200,000 285,809 0.22Nara Cable Funding sr secured Ser144A priv plmt 8.875% /2018 (Ireland) (2) 200,000 200,000 0.16
total for Spain 1.28
russia Vnesheconombank Via VEB Finance sr unsecur Ser144A priv plmt 6.025% /2022 (Ireland) (2) 800,000 930,824 0.72Russian Standard Finance subord Ser144A priv plmt 10.75% /2018 (Luxembourg) (2) 300,000 314,250 0.24Vimpel Communications Via VIP Finance Ireland OJSC unsecur RegS LPN 7.748% /2021 (Ireland) (2) 205,000 237,792 0.19
FAGE USA Dairy Industry co gtd 9.875% /2020 (United States of America) (2) 250,000 271,250 0.21HeidelbergCement Finance Luxembourg co gtd SerEMTN 9.5% /2018 (Luxembourg) (2) (EUR) 150,000 255,450 0.20Celesio Finance co gtd SerEMTN 4% /2016 (Netherlands) (2) (EUR) 145,000 200,925 0.17HeidelbergCement Finance co gtd 8% /2017 (Netherlands) (2) (EUR) 100,000 155,735 0.12Techem sr secured RegS 6.125% /2019 (EUR) 100,000 142,877 0.11Aabar Investments sr unsecur RegS CV 4% /2016 (United Arab Emirates) (2) (EUR) 100,000 135,134 0.11Celesio Finance co gtd CV 2.5% /2018 (Netherlands) (2) (EUR) 100,000 132,894 0.10
total for Germany 2.64
italy Intesa Sanpaolo sr unsecur Ser144A priv plmt 6.5% /2021 525,000 553,859 0.43Enel Finance International co gtd Ser144A priv plmt 5.125% /2019 (Netherlands) (2) 465,000 491,914 0.38UniCredit sr unsecur 4.875% /2017 (EUR) 300,000 425,822 0.33Telecom Italia Finance co gtd SerEMTN 7.75% /2033 (Luxembourg) (2) (EUR) 200,000 306,370 0.24Fiat Industrial Finance Europe co gtd SerEMTN 6.25% /2018 (Luxembourg) (2) (EUR) 200,000 297,042 0.23Davide Campari-Milano sr unsecur 4.5% /2019 (EUR) 200,000 278,142 0.22Wind Acquisition Finance secured RegS 11.75% /2017 (Luxembourg) (2) (EUR) 150,000 207,560 0.16Banca Monte dei Paschi di Siena sr unsecur SerEMTN 4.5% /2014 (EUR) 100,000 132,080 0.11
total for italy 2.10
United Kingdom Lloyds TSB Bank subord SerEMTN 6.5% /2020 (EUR) 300,000 454,078 0.35Jaguar Land Rover co gtd RegS 8.25% /2020 (GBP) 250,000 451,628 0.35Barclays Bank subord SerEMTN 6% /2021 (EUR) 300,000 450,076 0.35Priory Group No 3 sr secured RegS 7% /2018 (GBP) 200,000 345,781 0.27Standard Chartered sub nts SerEMTN 3.625% /2022 (EUR) 150,000 203,411 0.16CEVA Group sr secured Ser144A priv plmt 8.375% /2017 175,000 175,000 0.14GKN Holdings sr unsecur SerEMTN 5.375% /2022 (GBP) 100,000 168,200 0.13Ineos Group Holdings secured RegS 7.875% /2016 (Luxembourg) (2) (EUR) 100,000 131,773 0.10Ineos Finance sr secured RegS 9.25% /2015 (EUR) 75,000 106,941 0.08Ineos Finance sr secured Ser144A priv plmt 7.5% /2020 80,000 84,000 0.07
total for United Kingdom 2.00
Brazil Banco Nacional de Desenvolvimento Economico e Social sr unsecur RegS 5.5% /2020 800,000 942,452 0.73Petrobras International Finance co gtd SerEMTN 4.875% /2018 (Cayman Islands) (2) (EUR) 500,000 738,546 0.58Fibria Overseas Finance co gtd RegS 6.75% /2021 (Cayman Islands) (2) 375,000 415,819 0.32
Statement of inveStmentS (continued)
transferable securities and money market instruments admitted to official exchange listing or dealt in on another regulated market. as at 31 December 2012, expressed in US dollars.
investments
nominal in US dollars
unless specifiedmarket
value% of net
assets Corporate Bonds (continued)
Germany (continued)
Corporate Bonds (continued)
Brazil (continued)
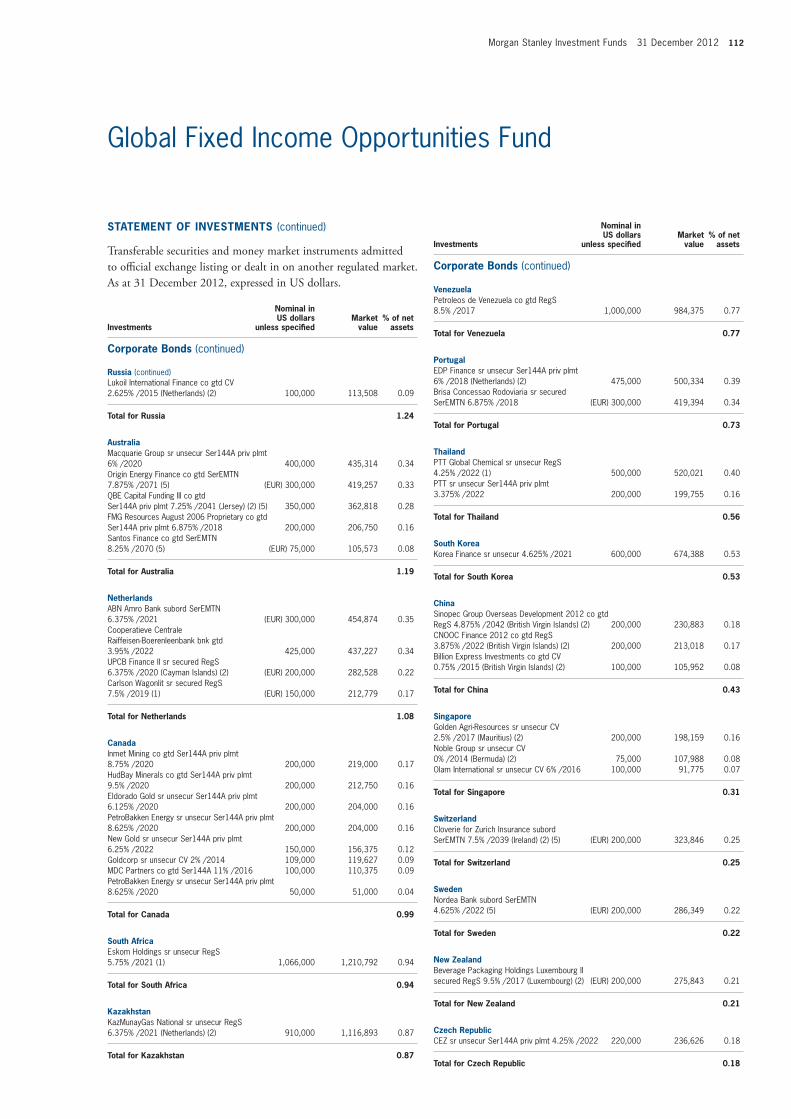
Morgan Stanley Investment Funds 31 December 2012 112
Global Fixed Income Opportunities Fund
investments
nominal in US dollars
unless specifiedmarket
value% of net
assets
Statement of inveStmentS (continued)
transferable securities and money market instruments admitted to official exchange listing or dealt in on another regulated market. as at 31 December 2012, expressed in US dollars.
investments
nominal in US dollars
unless specifiedmarket
value% of net
assets Corporate Bonds (continued)
russia (continued)
Corporate Bonds (continued)
Lukoil International Finance co gtd CV 2.625% /2015 (Netherlands) (2) 100,000 113,508 0.09
total for russia 1.24
australia Macquarie Group sr unsecur Ser144A priv plmt 6% /2020 400,000 435,314 0.34Origin Energy Finance co gtd SerEMTN 7.875% /2071 (5) (EUR) 300,000 419,257 0.33QBE Capital Funding III co gtd Ser144A priv plmt 7.25% /2041 (Jersey) (2) (5) 350,000 362,818 0.28FMG Resources August 2006 Proprietary co gtd Ser144A priv plmt 6.875% /2018 200,000 206,750 0.16Santos Finance co gtd SerEMTN 8.25% /2070 (5) (EUR) 75,000 105,573 0.08
total for australia 1.19
netherlands ABN Amro Bank subord SerEMTN 6.375% /2021 (EUR) 300,000 454,874 0.35Cooperatieve Centrale Raiffeisen-Boerenleenbank bnk gtd 3.95% /2022 425,000 437,227 0.34UPCB Finance II sr secured RegS 6.375% /2020 (Cayman Islands) (2) (EUR) 200,000 282,528 0.22Carlson Wagonlit sr secured RegS 7.5% /2019 (1) (EUR) 150,000 212,779 0.17
total for netherlands 1.08
Canada Inmet Mining co gtd Ser144A priv plmt 8.75% /2020 200,000 219,000 0.17HudBay Minerals co gtd Ser144A priv plmt 9.5% /2020 200,000 212,750 0.16Eldorado Gold sr unsecur Ser144A priv plmt 6.125% /2020 200,000 204,000 0.16PetroBakken Energy sr unsecur Ser144A priv plmt 8.625% /2020 200,000 204,000 0.16New Gold sr unsecur Ser144A priv plmt 6.25% /2022 150,000 156,375 0.12Goldcorp sr unsecur CV 2% /2014 109,000 119,627 0.09MDC Partners co gtd Ser144A 11% /2016 100,000 110,375 0.09PetroBakken Energy sr unsecur Ser144A priv plmt 8.625% /2020 50,000 51,000 0.04
total for Canada 0.99
South africa Eskom Holdings sr unsecur RegS 5.75% /2021 (1) 1,066,000 1,210,792 0.94
total for South africa 0.94
Kazakhstan KazMunayGas National sr unsecur RegS 6.375% /2021 (Netherlands) (2) 910,000 1,116,893 0.87
total for Kazakhstan 0.87
venezuela Petroleos de Venezuela co gtd RegS 8.5% /2017 1,000,000 984,375 0.77
total for venezuela 0.77
Portugal EDP Finance sr unsecur Ser144A priv plmt 6% /2018 (Netherlands) (2) 475,000 500,334 0.39Brisa Concessao Rodoviaria sr secured SerEMTN 6.875% /2018 (EUR) 300,000 419,394 0.34
total for Portugal 0.73
thailand PTT Global Chemical sr unsecur RegS 4.25% /2022 (1) 500,000 520,021 0.40PTT sr unsecur Ser144A priv plmt 3.375% /2022 200,000 199,755 0.16
total for thailand 0.56
South Korea Korea Finance sr unsecur 4.625% /2021 600,000 674,388 0.53
total for South Korea 0.53
China Sinopec Group Overseas Development 2012 co gtd RegS 4.875% /2042 (British Virgin Islands) (2) 200,000 230,883 0.18CNOOC Finance 2012 co gtd RegS 3.875% /2022 (British Virgin Islands) (2) 200,000 213,018 0.17Billion Express Investments co gtd CV 0.75% /2015 (British Virgin Islands) (2) 100,000 105,952 0.08
total for China 0.43
Singapore Golden Agri-Resources sr unsecur CV 2.5% /2017 (Mauritius) (2) 200,000 198,159 0.16Noble Group sr unsecur CV 0% /2014 (Bermuda) (2) 75,000 107,988 0.08Olam International sr unsecur CV 6% /2016 100,000 91,775 0.07
total for Singapore 0.31
Switzerland Cloverie for Zurich Insurance subord SerEMTN 7.5% /2039 (Ireland) (2) (5) (EUR) 200,000 323,846 0.25
total for Switzerland 0.25
Sweden Nordea Bank subord SerEMTN 4.625% /2022 (5) (EUR) 200,000 286,349 0.22
total for Sweden 0.22
new Zealand Beverage Packaging Holdings Luxembourg II secured RegS 9.5% /2017 (Luxembourg) (2) (EUR) 200,000 275,843 0.21
total for new Zealand 0.21
Czech republic CEZ sr unsecur Ser144A priv plmt 4.25% /2022 220,000 236,626 0.18
total for Czech republic 0.18

113 Morgan Stanley Investment Funds 31 December 2012
Global Fixed Income Opportunities Fund
investments
nominal in US dollars
unless specifiedmarket
value% of net
assets
Brazil Federal Republic of Brazil sr unsecur 8.5% /2024 (BRL) 5,000,000 2,988,534 2.33
total for Brazil 2.33
australia Government of Australia sr unsecur 5.25% /2019 (AUD) 2,100,000 2,464,973 1.92
total for australia 1.92
mexico Mexican Bonos 7.5% /2027 (MXN) 17,000,000 1,526,495 1.19Mexican Bonos 5% /2017 (MXN) 3,000,000 229,797 0.18
total for mexico 1.37
Colombia Republic of Colombia sr unsecur 7.75% /2021 (COP) 2,340,000,000 1,689,581 1.31
total for Colombia 1.31
russia Russian Foreign Bond - Eurobond sr unsecur Ser144A priv plmt 4.5% /2022 1,000,000 1,146,075 0.89Russian Foreign Bond - Eurobond sr unsecur RegS 4.5% /2022 400,000 458,050 0.36
total for russia 1.25
Japan Government of Japan sr unsecur 1.7% /2033 (JPY) 140,000,000 1,601,764 1.25
total for Japan 1.25
Canada Government of Canada 3.25% /2021 (CAD) 800,000 900,868 0.70Government of Canada 3.75% /2019 (CAD) 600,000 683,531 0.53
total for Canada 1.23
South africa Republic of South Africa 7.75% /2023 (ZAR) 7,200,000 909,109 0.71Republic of South Africa sr unsecur 7.25% /2020 (ZAR) 4,000,000 497,339 0.39
total for South africa 1.10
Peru Republic of Peru sr unsecur RegS 8.2% /2026 (PEN) 2,200,000 1,210,358 0.94
total for Peru 0.94
Spain Government of Spain 3% /2015 (EUR) 900,000 1,188,535 0.93
total for Spain 0.93
norway Government of Norway 2% /2023 (NOK) 6,000,000 1,069,133 0.83
total for norway 0.83
india Bharat Petroleum sr unsecur RegS 4.625% /2022 200,000 204,432 0.16
total for india 0.16
Qatar Qtel International Finance co gtd RegS 3.25% /2023 (Bermuda) (2) 200,000 200,278 0.16
total for Qatar 0.16
Greece DryShips sr unsecur CV 5% /2014 (Marshall Islands) (2) 225,000 181,125 0.14
total for Greece 0.14
ireland Ardagh Glass Finance co gtd RegS 7.125% /2017 (EUR) 125,000 170,529 0.13
total for ireland 0.13
United arab emirates Pyrus co gtd RegS CV 7.5% /2015 (Cayman Islands) (2) 100,000 112,458 0.09
total for United arab emirates 0.09
total for Corporate Bonds 45.87
Government Bonds
Poland Government of Poland 5.5% /2019 (PLN) 6,000,000 2,200,590 1.71Government of Poland sr unsecur 5% /2022 1,000,000 1,184,265 0.92Government of Poland 5.75% /2021 (PLN) 2,300,000 865,520 0.68Government of Poland sr unsecur 3% /2023 500,000 500,875 0.39
total for Poland 3.70
italy Italy Buoni Poliennali Del Tesoro 4% /2020 (EUR) 3,500,000 4,655,462 3.62
total for italy 3.62
United States of america US Treasury 3.5% /2039 3,500,000 3,969,766 3.09
total for United States of america 3.09
United Kingdom UK Treasury 4.25% /2039 (GBP) 1,260,000 2,496,768 1.94UK Treasury 1.75% /2022 (GBP) 700,000 1,130,261 0.88
total for United Kingdom 2.82
Germany Bundesrepublik Deutschland 4.25% /2039 (EUR) 1,500,000 2,839,156 2.21Bundesrepublik Deutschland 4.75% /2034 (EUR) 300,000 580,217 0.45
total for Germany 2.66
Statement of inveStmentS (continued)
transferable securities and money market instruments admitted to official exchange listing or dealt in on another regulated market. as at 31 December 2012, expressed in US dollars.
investments
nominal in US dollars
unless specifiedmarket
value% of net
assets Corporate Bonds (continued)
Government Bonds (continued)

Morgan Stanley Investment Funds 31 December 2012 114
Global Fixed Income Opportunities Fund
investments
holdings/nominal in US dollars
unless specifiedmarket
value% of net
assets
Statement of inveStmentS (continued)
transferable securities and money market instruments admitted to official exchange listing or dealt in on another regulated market. as at 31 December 2012, expressed in US dollars.
investments
nominal in US dollars
unless specifiedmarket
value% of net
assets Government Bonds (continued)
mortgage and asset Backed Securities (continued)
United States of america (continued)
new Zealand Government of New Zealand sr unsecur 6% /2021 (NZD) 600,000 587,880 0.46
total for new Zealand 0.46
Bolivia Bolivian Government International Bond unsecur RegS 4.875% /2022 560,000 548,800 0.43
total for Bolivia 0.43
mongolia Mongolia Government International Bond sr unsecur RegS 5.125% /2022 320,000 313,000 0.24
total for mongolia 0.24
total for Government Bonds 31.48
mortgage and asset Backed Securities
United States of america RALI Trust 2006-QS8 A1 6% /2036 1,392,237 1,097,673 0.85Banc of America Funding 2006-G 2A4 0.501% /2036 (5) 1,005,000 839,657 0.65Indymac Index Mortgage Loan Trust 2005-AR23 2A1 2.648% /2035 (5) 1,127,480 834,088 0.65Banc of America Funding 2006-8T2 A6 step cpn 6.049% /2036 1,018,662 821,331 0.64CSMC Mortgage-Backed Trust 2007-3 1A1A 5.837% /2037 (5) 1,052,364 619,559 0.48GSAA Trust 4.751% /2034 (5) 591,267 588,736 0.46JP Morgan Alternative Loan Trust 2006-S3 A3A step cpn 6% /2036 630,073 583,456 0.45WaMu Mortgage Pass Through Certificates 2007-OA4 1A 0.936% /2047 (5) 683,905 564,416 0.44Chase Mortgage Finance 2007-A1 11A4 2.903% /2037 (5) 587,760 518,681 0.40Countrywide Alternative Loan Trust 2007-5CB 1A12 6% /2037 632,837 510,023 0.40JP Morgan Alternative Loan Trust 2005-S1 2A9 6% /2035 562,303 498,007 0.39Countrywide Alternative Loan Trust 2007-5CB 1A31 5.5% /2037 607,465 476,063 0.37Citigroup Mortgage Loan Trust 2005-WF1 step cpn A4 5.53% /2034 480,000 459,876 0.36Harborview Mortgage Loan Trust 2006-7 2A1A 0.41% /2046 (5) 623,779 457,621 0.36First Horizon Alternative Mortgage Securities 2006-FA3 A9 6% /2036 515,601 452,871 0.35First Horizon Alternative Mortgage Securities 2006-FA3 A2 6% /2036 515,601 452,871 0.35First Horizon Alternative Mortgage Securities 2006-FA3 A13 6% /2036 515,601 452,871 0.35Banc of America Alternative Loan Trust 2006-4 5CB1 6.5% /2046 576,141 448,326 0.35Countrywide Alternative Loan Trust 2007-15CB A7 6% /2037 515,220 425,638 0.33Countrywide Alternative Loan Trust 2008-2R 4A1 6.25% /2037 565,571 417,052 0.32Washington Mutual Alternative Mortgage Pass-Through Certificates 2007-OA4 A1A 0.92% /2047 (5) 664,293 414,047 0.32
JP Morgan Mortgage Trust 2006-S3 1A30 6.5% /2036 419,680 380,304 0.30JP Morgan Alternative Loan Trust 2006-S1 1A19 6.5% /2036 415,528 370,054 0.29Citigroup Mortgage Loan Trust 2005-9 2A2 5.5% /2035 375,280 369,829 0.29JP Morgan Mortgage Trust 2007-A4 2A3 5.547% /2037 (5) 411,347 356,386 0.28Countrywide Alternative Loan Trust 2006-6CB 1A10 5.5% /2036 391,766 327,933 0.26Countrywide Alternative Loan Trust 2006-14CB A7 6% /2036 393,177 317,773 0.25Washington Mutual Alternative Mortgage Pass-Through Certificates 2007-OA5 A1A 1.006% /2047 (5) 431,109 294,897 0.23Lehman Mortgage Trust 2007-8 2A1 6.5% /2037 348,451 292,281 0.23RALI Trust 2006-QS16 A10 6% /2036 376,790 292,140 0.23FNMA REMICS 2012-63 HS 6.340% /2041 (5) 1,213,593 288,263 0.22Washington Mutual Alternative Mortgage Pass-Through Certificates 2007-OA3 4A1 0.93% /2047 (5) 291,759 209,918 0.16RALI Trust 2007-QS4 5A2 5.5% /2022 191,192 192,124 0.15Washington Mutual Alternative Mortgage Pass-Through Certificates 2005-10 2A6 5.5% /2035 227,561 186,682 0.15RALI Trust 2006-QS8 A3 6% /2036 195,627 154,739 0.12Countrywide Alternative Loan Trust 2006-36T2 2A5 6% /2036 197,315 143,774 0.11Countrywide Alternative Loan Trust 2007-16CB 4A1 0.610% /2037 (5) 202,208 131,969 0.10Banc of America Funding 2007-5 3A1 6% /2037 161,991 130,997 0.10WaMu Mortgage Pass Through Certificates 2005-AR15 A1A2 0.489% /2045 (5) 143,271 126,325 0.10Countrywide Alternative Loan Trust 2006-J3 1A4 6% /2036 153,807 122,405 0.10JP Morgan Mortgage Trust 2005-S3 1A21 5.5% /2036 122,143 117,226 0.09RALI Trust 2006-QS4 A2 6% /2036 132,538 103,775 0.08Countrywide Alternative Loan Trust 2006-4CB 1A1 6% /2036 128,495 100,244 0.08DBUBS Mortgage Trust 2011-LC3A A2 3.642% /2044 90,000 98,170 0.08First Horizon Alternative Mortgage Securities 2006-FA4 1A1 6% /2036 107,665 91,117 0.07RALI Trust 2007-QS2 A1 6% /2037 114,965 89,212 0.07Washington Mutual Alternative Mortgage Pass-Through Certificates 2005-AR1 A1A 0.469% /2035 (5) 115,298 80,929 0.06Structured Asset Mortgage Investments 2006-AR6 1A2 0.449% /2046 (5) 412,697 64,335 0.05Luminent Mortgage Trust 2006-6 A2A 0.38% /2046 (5) 265,667 63,726 0.05Countrywide Alternative Loan Trust 2005-86CB A4 5.5% /2036 69,816 55,598 0.04Countrywide Alternative Loan Trust 2005-86CB A11 5.5% /2036 40,577 32,313 0.03Structured Asset Mortgage Investments 2006-AR6 2A2 0.449% /2046 (5) 173,222 30,440 0.02Luminent Mortgage Trust 2006-4 A1B 0.44% /2046 (5) 275,241 20,106 0.02
total for United States of america 13.68
total for mortgage and asset Backed Securities 13.68
equities
United States of america United Technologies Pfd Stock CV 7.5% /2015 2,250 124,358 0.10Apache SerD Pfd Stock CV 6% 01/08/2013 2,180 98,253 0.08PPL Pfd Stock CV 9.5% 01/07/2013 1,815 94,326 0.07Wells Fargo & Co. SerL Pfd Stock CV 7.5% perpetual 66 80,587 0.06

115 Morgan Stanley Investment Funds 31 December 2012
Global Fixed Income Opportunities Fund
10/01/2013 1,050,796 USD 1,045,000 CAD Commonwealth Bank 1,264 0.00 10/01/2013 592,806 USD 720,000 NZD J.P. Morgan 431 0.00 14/01/2013 390,000 BRL 188,588 USD State Street 1,632 0.00 14/01/2013 400,000,000 COP 222,414 USD J.P. Morgan 3,759 0.00 14/01/2013 1,275,000,000 COP 708,601 USD State Street 12,327 0.01 14/01/2013 1,385,041,000 KRW 1,281,464 USD HSBC 16,715 0.01 14/01/2013 1,700,000 MYR 555,156 USD HSBC 295 0.00 15/01/2013 13,200,000 NOK 2,345,041 USD Deutsche Bank 28,025 0.03 15/01/2013 2,700,000 NOK 481,592 USD J.P. Morgan 3,808 0.00 17/01/2013 250,000 GBP 403,514 USD Deutsche Bank 2,707 0.00 17/01/2013 605,000 GBP 980,599 USD J.P. Morgan 2,457 0.00 17/01/2013 593,000 GBP 954,713 USD RBC 8,844 0.01 18/01/2013 2,630,000 NOK 464,921 USD Westpac Bank 7,838 0.01 18/01/2013 1,050,000 ZAR 122,970 USD State Street 561 0.00
Unrealised Gain on forward foreign Currency exchange Contracts 223,837 0.17
eUr hedged Share Class 11/01/2013 914,612 EUR 1,205,364 USD J.P. Morgan 3,788 0.00
Unrealised Gain on nav hedged Share Classes forward foreign Currency exchange Contracts 3,788 0.00
total Unrealised Gain on forward foreign Currency exchange Contracts 227,625 0.17
08/01/2013 720,000 CAD 728,931 USD J.P. Morgan (5,778) (0.01)08/01/2013 370,000 CAD 372,740 USD RBC (1,119) 0.00 08/01/2013 8,000,000 MXN 625,661 USD State Street (10,483) (0.01)08/01/2013 76,928 USD 1,005,000 MXN RBC (353) 0.00 09/01/2013 250,000 EUR 330,797 USD Deutsche Bank (293) 0.00 09/01/2013 870,000 EUR 1,154,139 USD State Street (3,986) 0.00 09/01/2013 450,000 EUR 595,309 USD Westpac Bank (402) 0.00 09/01/2013 1,094,787 USD 840,000 EUR Deutsche Bank (15,706) (0.01)09/01/2013 768,128 USD 590,000 EUR State Street (11,861) (0.01)09/01/2013 4,685,360 USD 3,600,000 EUR Westpac Bank (73,894) (0.06)10/01/2013 580,000 NZD 488,601 USD Commonwealth Bank (11,410) (0.01)10/01/2013 475,073 USD 580,000 NZD Commonwealth Bank (2,118) 0.00 11/01/2013 1,521,891 USD 4,815,000 PLN Deutsche Bank (37,594) (0.03)14/01/2013 595,806 USD 1,250,000 BRL HSBC (13,873) (0.01)14/01/2013 457,160 USD 4,450,000,000 IDR HSBC (4,456) 0.00 15/01/2013 984,890 USD 6,515,000 SEK Deutsche Bank (17,549) (0.01)16/01/2013 3,000,000 JPY 36,615 USD Westpac Bank (1,878) 0.00 17/01/2013 110,000 GBP 178,971 USD State Street (234) 0.00 17/01/2013 110,000 GBP 178,894 USD Westpac Bank (156) 0.00 18/01/2013 128,583 USD 1,100,000 ZAR Commonwealth Bank (831) 0.00 18/01/2013 124,064 USD 1,080,000 ZAR Deutsche Bank (2,997) 0.00 18/01/2013 929,056 USD 8,115,000 ZAR State Street (25,663) (0.02)22/01/2013 561,562,000 JPY 6,775,701 USD State Street (273,142) (0.22)22/01/2013 20,000,000 JPY 238,151 USD Westpac Bank (6,562) (0.01)
Unrealised Loss on forward foreign Currency exchange Contracts (522,338) (0.41)
eUr hedged Share Class 11/01/2013 34,455,963 EUR 45,598,248 USD J.P. Morgan (46,110) (0.03)
Unrealised Loss on nav hedged Share Classes forward foreign Currency exchange Contracts (46,110) (0.03)
total Unrealised Loss on forward foreign Currency exchange Contracts (568,448) (0.44)
net Unrealised Loss on forward foreign Currency exchange Contracts (340,823) (0.27)
Universal Pfd Stock CV 6.75% perpetual 69 79,695 0.06NextEra Energy Pfd Stock CV 7% 01/09/2013 1,233 65,349 0.05Stanley Black & Decker Pfd Stock CV 4.75% /2015 400 48,200 0.04
total for United States of america 0.46
total for equities 0.46
total investment Securities 117,511,208 91.49
DerivativeS
OtC and exchange traded derivatives as at 31 December 2012, expressed in US dollars.
futures Contracts
Descriptionmaturity
datenumber of contracts
notional commitments Counterparty
net unrealised gain/(loss) as at
31 December 2012
% of net assets
US 2yr T-note Future 03/2013 59 13,008,578 Goldman Sachs 7,375 0.01US 5yr T-note Future 03/2013 56 6,963,250 Goldman Sachs 3,063 0.00US 10yr T-note Future 03/2013 (29) (3,848,844) Goldman Sachs 1,053 0.00
Unrealised Gain on futures Contracts 11,491 0.01
Canada 10 Year Bond Future 03/2013 4 544,078 Goldman Sachs (3,938) 0.00
Unrealised Loss on futures Contracts (3,938) 0.00
net Unrealised Gain on futures Contracts 16,667,0621 7,553 0.01
1 Cash of USD 35,840 held as collateral by the counterparty.
forward foreign Currency exchange Contracts
maturity date
amount bought Ccy
amount sold Ccy Counterparty
Unrealised gain/(loss)
USD% of net
assets
08/01/2013 6,715,000 MXN 515,666 USD State Street 700 0.00 08/01/2013 80,000 SGD 65,424 USD Deutsche Bank 75 0.00 08/01/2013 1,825,000 SGD 1,494,079 USD HSBC 115 0.00 08/01/2013 963,763 USD 950,000 CAD RBC 9,602 0.01 09/01/2013 750,000 EUR 79,830,525 JPY Westpac Bank 67,217 0.06 09/01/2013 430,000 EUR 562,469 USD Commonwealth Bank 5,998 0.00 09/01/2013 410,000 EUR 534,622 USD Deutsche Bank 7,404 0.01 09/01/2013 425,000 EUR 556,862 USD HSBC 4,995 0.00 09/01/2013 1,040,000 EUR 1,366,176 USD J.P. Morgan 8,720 0.01 09/01/2013 200,000 EUR 258,766 USD State Street 5,637 0.00 09/01/2013 317,792 USD 240,000 EUR Commonwealth Bank 509 0.00 09/01/2013 531,090 USD 400,000 EUR J.P. Morgan 2,284 0.00 10/01/2013 207,232 CAD 200,000 AUD Commonwealth Bank 657 0.00 10/01/2013 3,200,000 NOK 570,876 USD J.P. Morgan 4,528 0.00 10/01/2013 3,355,063 USD 3,220,000 AUD Commonwealth Bank 14,733 0.01
Statement of inveStmentS (continued)
transferable securities and money market instruments admitted to official exchange listing or dealt in on another regulated market. as at 31 December 2012, expressed in US dollars.
investments holdingsmarket
value% of net
assets
forward foreign Currency exchange Contracts (continued)
maturity date
amount bought Ccy
amount sold Ccy Counterparty
Unrealised gain/(loss)
USD% of net
assets
equities (continued)
United States of america (continued)
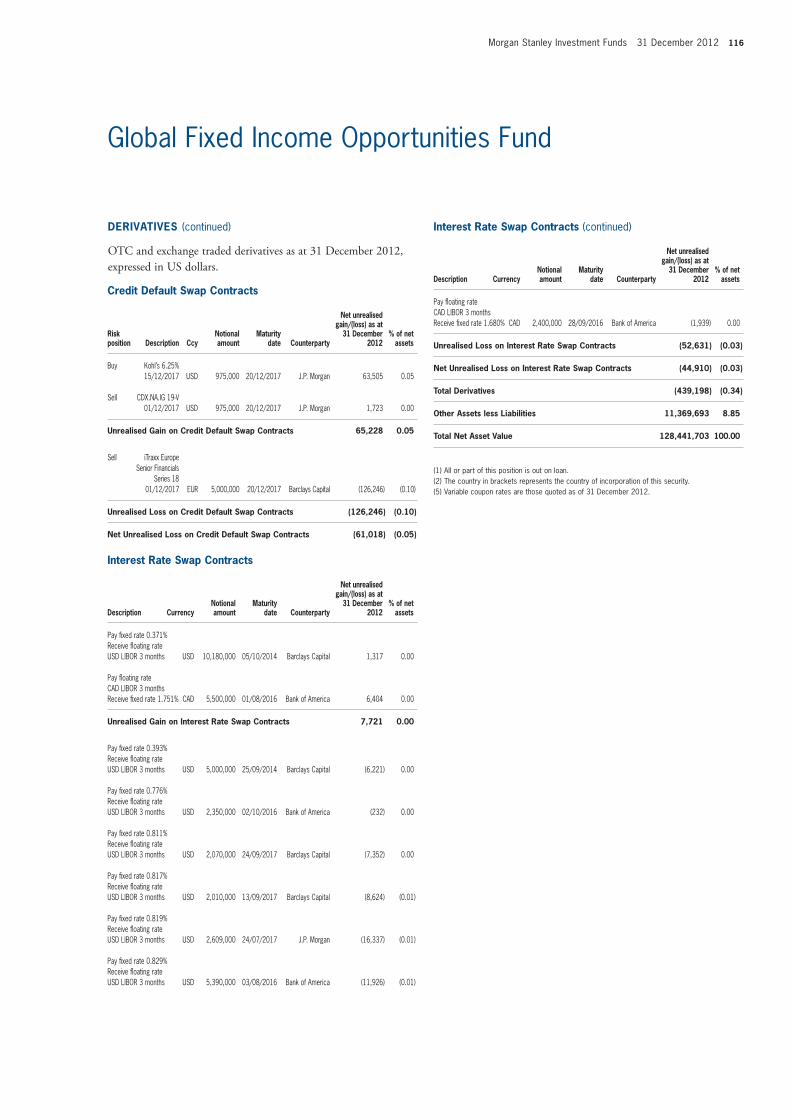
Morgan Stanley Investment Funds 31 December 2012 116
Global Fixed Income Opportunities Fund
DerivativeS (continued)
OtC and exchange traded derivatives as at 31 December 2012, expressed in US dollars.
Credit Default Swap Contracts
risk position Description Ccy
notional amount
maturity date Counterparty
net unrealised gain/(loss) as at
31 December 2012
% of net assets
Buy Kohl’s 6.25% 15/12/2017 USD 975,000 20/12/2017 J.P. Morgan 63,505 0.05
Sell CDX.NA.IG 19-V 01/12/2017 USD 975,000 20/12/2017 J.P. Morgan 1,723 0.00
Unrealised Gain on Credit Default Swap Contracts 65,228 0.05
Sell iTraxx Europe Senior Financials Series 18 01/12/2017 EUR 5,000,000 20/12/2017 Barclays Capital (126,246) (0.10)
Unrealised Loss on Credit Default Swap Contracts (126,246) (0.10)
net Unrealised Loss on Credit Default Swap Contracts (61,018) (0.05)
interest rate Swap Contracts
Description Currencynotional amount
maturity date Counterparty
net unrealised gain/(loss) as at
31 December 2012
% of net assets
Pay fixed rate 0.371% Receive floating rate USD LIBOR 3 months USD 10,180,000 05/10/2014 Barclays Capital 1,317 0.00
Pay floating rate CAD LIBOR 3 months Receive fixed rate 1.751% CAD 5,500,000 01/08/2016 Bank of America 6,404 0.00
Unrealised Gain on interest rate Swap Contracts 7,721 0.00
Pay fixed rate 0.393% Receive floating rate USD LIBOR 3 months USD 5,000,000 25/09/2014 Barclays Capital (6,221) 0.00
Pay fixed rate 0.776% Receive floating rate USD LIBOR 3 months USD 2,350,000 02/10/2016 Bank of America (232) 0.00
Pay fixed rate 0.811% Receive floating rate USD LIBOR 3 months USD 2,070,000 24/09/2017 Barclays Capital (7,352) 0.00
Pay fixed rate 0.817% Receive floating rate USD LIBOR 3 months USD 2,010,000 13/09/2017 Barclays Capital (8,624) (0.01)
Pay fixed rate 0.819% Receive floating rate USD LIBOR 3 months USD 2,609,000 24/07/2017 J.P. Morgan (16,337) (0.01)
Pay fixed rate 0.829% Receive floating rate USD LIBOR 3 months USD 5,390,000 03/08/2016 Bank of America (11,926) (0.01)
Pay floating rate CAD LIBOR 3 months Receive fixed rate 1.680% CAD 2,400,000 28/09/2016 Bank of America (1,939) 0.00
Unrealised Loss on interest rate Swap Contracts (52,631) (0.03)
net Unrealised Loss on interest rate Swap Contracts (44,910) (0.03)
total Derivatives (439,198) (0.34)
other assets less Liabilities 11,369,693 8.85
total net asset value 128,441,703 100.00
(1) All or part of this position is out on loan.(2) The country in brackets represents the country of incorporation of this security.(5) Variable coupon rates are those quoted as of 31 December 2012.
interest rate Swap Contracts (continued)
Description Currencynotional amount
maturity date Counterparty
net unrealised gain/(loss) as at
31 December 2012
% of net assets
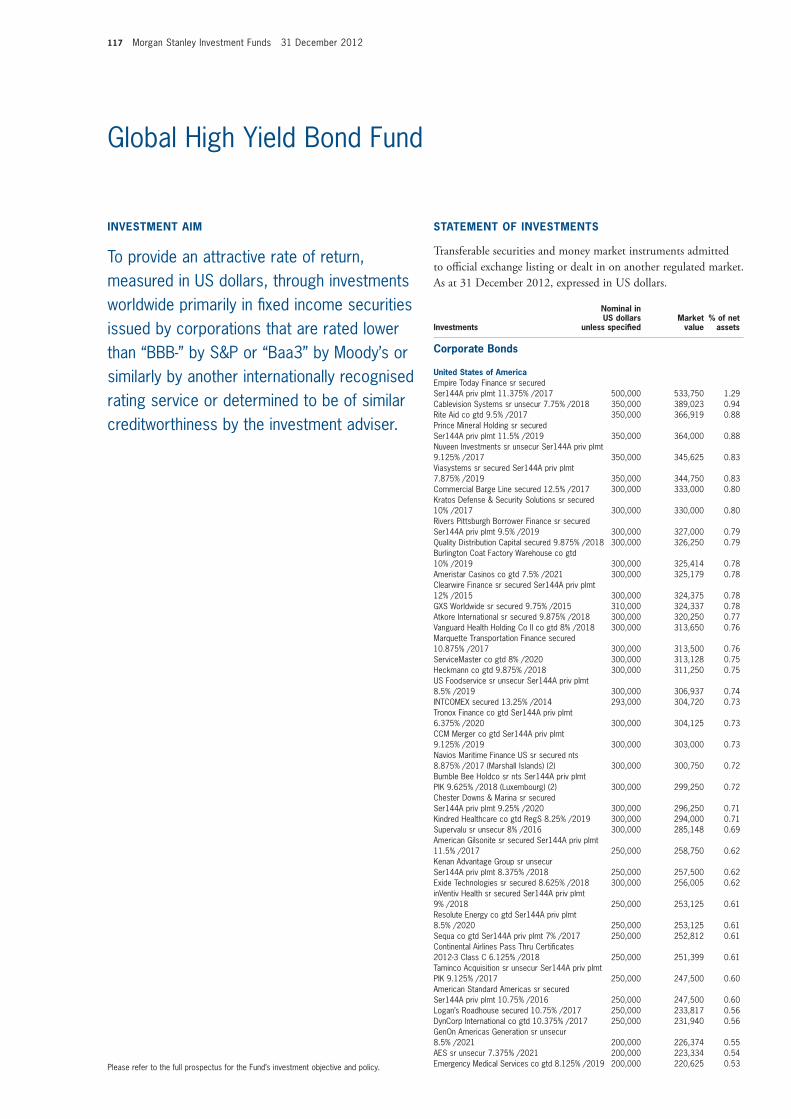
117 Morgan Stanley Investment Funds 31 December 2012
Please refer to the full prospectus for the Fund’s investment objective and policy.
Global High Yield Bond Fund
Corporate Bonds
United States of americaEmpire Today Finance sr secured Ser144A priv plmt 11.375% /2017 500,000 533,750 1.29Cablevision Systems sr unsecur 7.75% /2018 350,000 389,023 0.94Rite Aid co gtd 9.5% /2017 350,000 366,919 0.88Prince Mineral Holding sr secured Ser144A priv plmt 11.5% /2019 350,000 364,000 0.88Nuveen Investments sr unsecur Ser144A priv plmt 9.125% /2017 350,000 345,625 0.83Viasystems sr secured Ser144A priv plmt 7.875% /2019 350,000 344,750 0.83Commercial Barge Line secured 12.5% /2017 300,000 333,000 0.80Kratos Defense & Security Solutions sr secured 10% /2017 300,000 330,000 0.80Rivers Pittsburgh Borrower Finance sr secured Ser144A priv plmt 9.5% /2019 300,000 327,000 0.79Quality Distribution Capital secured 9.875% /2018 300,000 326,250 0.79Burlington Coat Factory Warehouse co gtd 10% /2019 300,000 325,414 0.78Ameristar Casinos co gtd 7.5% /2021 300,000 325,179 0.78Clearwire Finance sr secured Ser144A priv plmt 12% /2015 300,000 324,375 0.78GXS Worldwide sr secured 9.75% /2015 310,000 324,337 0.78Atkore International sr secured 9.875% /2018 300,000 320,250 0.77Vanguard Health Holding Co II co gtd 8% /2018 300,000 313,650 0.76Marquette Transportation Finance secured 10.875% /2017 300,000 313,500 0.76ServiceMaster co gtd 8% /2020 300,000 313,128 0.75Heckmann co gtd 9.875% /2018 300,000 311,250 0.75US Foodservice sr unsecur Ser144A priv plmt 8.5% /2019 300,000 306,937 0.74INTCOMEX secured 13.25% /2014 293,000 304,720 0.73Tronox Finance co gtd Ser144A priv plmt 6.375% /2020 300,000 304,125 0.73CCM Merger co gtd Ser144A priv plmt 9.125% /2019 300,000 303,000 0.73Navios Maritime Finance US sr secured nts 8.875% /2017 (Marshall Islands) (2) 300,000 300,750 0.72Bumble Bee Holdco sr nts Ser144A priv plmt PIK 9.625% /2018 (Luxembourg) (2) 300,000 299,250 0.72Chester Downs & Marina sr secured Ser144A priv plmt 9.25% /2020 300,000 296,250 0.71Kindred Healthcare co gtd RegS 8.25% /2019 300,000 294,000 0.71Supervalu sr unsecur 8% /2016 300,000 285,148 0.69American Gilsonite sr secured Ser144A priv plmt 11.5% /2017 250,000 258,750 0.62Kenan Advantage Group sr unsecur Ser144A priv plmt 8.375% /2018 250,000 257,500 0.62Exide Technologies sr secured 8.625% /2018 300,000 256,005 0.62inVentiv Health sr secured Ser144A priv plmt 9% /2018 250,000 253,125 0.61Resolute Energy co gtd Ser144A priv plmt 8.5% /2020 250,000 253,125 0.61Sequa co gtd Ser144A priv plmt 7% /2017 250,000 252,812 0.61Continental Airlines Pass Thru Certificates 2012-3 Class C 6.125% /2018 250,000 251,399 0.61Taminco Acquisition sr unsecur Ser144A priv plmt PIK 9.125% /2017 250,000 247,500 0.60American Standard Americas sr secured Ser144A priv plmt 10.75% /2016 250,000 247,500 0.60Logan’s Roadhouse secured 10.75% /2017 250,000 233,817 0.56DynCorp International co gtd 10.375% /2017 250,000 231,940 0.56GenOn Americas Generation sr unsecur 8.5% /2021 200,000 226,374 0.55AES sr unsecur 7.375% /2021 200,000 223,334 0.54Emergency Medical Services co gtd 8.125% /2019 200,000 220,625 0.53
inveStment aim
To provide an attractive rate of return, measured in US dollars, through investments worldwide primarily in fixed income securities issued by corporations that are rated lower than “BBB-” by S&P or “Baa3” by Moody’s or similarly by another internationally recognised rating service or determined to be of similar creditworthiness by the investment adviser.
Statement of inveStmentS
transferable securities and money market instruments admitted to official exchange listing or dealt in on another regulated market. as at 31 December 2012, expressed in US dollars.
investments
nominal in US dollars
unless specifiedmarket
value% of net
assets

Morgan Stanley Investment Funds 31 December 2012 118
Global High Yield Bond Fund
investments
nominal in US dollars
unless specifiedmarket
value% of net
assets
Royal Caribbean Cruises sr unsecur 5.25% /2022 (Liberia) (2) 150,000 159,228 0.38WMG Acquisition sr secured Ser144A priv plmt 6% /2021 150,000 159,000 0.38Universal Hospital Services secured Ser144A priv plmt 7.625% /2020 150,000 158,438 0.38Terex co gtd 6% /2021 150,000 157,875 0.38Crosstex Energy Finance co gtd Ser144A priv plmt 7.125% /2022 150,000 157,125 0.38Northern Tier Finance sr secured Ser144A priv plmt 7.125% /2020 150,000 156,000 0.37Kraton Polymers Capital co gtd 6.75% /2019 150,000 155,813 0.38Cleaver-Brooks sr secured Ser144A priv plmt 8.75% /2019 150,000 155,250 0.37E*TRADE Financial sr unsecur 6.375% /2019 150,000 154,103 0.37Aleris International co gtd 7.625% /2018 133,000 135,660 0.33WMG Acquisition sr secured RegS 6.25% /2021 (EUR) 100,000 135,387 0.33DISH DBS co gtd 6.75% /2021 100,000 114,615 0.28Wynn Las Vegas Capital Mortgage 7.75% /2020 100,000 114,399 0.28Sealed Air co gtd Ser144A priv plmt 8.125% /2019 100,000 113,250 0.27HCA sr secured 6.5% /2020 100,000 113,102 0.27Infor US co gtd 9.375% /2019 100,000 112,750 0.27Scientific Games International co gtd 9.25% /2019 100,000 111,995 0.27MGM Resorts International co gtd Ser144A priv plmt 8.625% /2019 100,000 111,750 0.27Academy Finance co gtd Ser144A priv plmt 9.25% /2019 100,000 111,500 0.27Choice Hotels International co gtd 5.75% /2022 100,000 111,250 0.27Building Materials Corp of America sr nts Ser144A priv plmt 6.75% /2021 100,000 111,000 0.27Smithfield Foods sr unsecur 6.625% /2022 100,000 110,704 0.27Scotts Miracle-Gro co gtd 6.625% /2020 100,000 110,250 0.26CommScope co gtd Ser144A priv plmt 8.25% /2019 100,000 110,000 0.26Harron Communications sr nts Ser144A priv plmt 9.125% /2020 100,000 110,000 0.26Tekni-Plex sr secured Ser144A priv plmt 9.75% /2019 100,000 109,750 0.26Sonic Automotive co gtd Ser144A priv plmt 7% /2022 100,000 109,500 0.26HCA sr secured 5.875% /2022 100,000 109,393 0.26Tenneco co gtd 7.75% /2018 100,000 109,000 0.26Laredo Petroleum co gtd 7.375% /2022 100,000 109,000 0.26iGATE co gtd 9% /2016 100,000 108,750 0.26Libbey Glass sr secured 6.875% /2020 100,000 108,000 0.26CCO Holdings Capital co gtd 6.5% /2021 100,000 107,900 0.26Spectrum Brands Escrow sr unsecur Ser144A priv plmt 6.625% /2022 100,000 107,750 0.26Polymer Group sr secured 7.75% /2019 100,000 107,750 0.26Easton-Bell Sports sr secured 9.75% /2016 100,000 107,635 0.26SM Energy sr unsecur 6.5% /2023 100,000 107,500 0.26Kennedy-Wilson co gtd Ser144A priv plmt 8.75% /2019 100,000 107,000 0.26Speedway Motorsports co gtd 6.75% /2019 100,000 106,500 0.26Sealy Mattress sr secured Ser144A priv plmt 10.875% /2016 100,000 106,250 0.26Neuberger Berman Finance sr unsecur Ser144A priv plmt 5.875% /2022 100,000 106,000 0.26Olin sr unsecur 5.5% /2022 100,000 104,875 0.25Crestwood Midstream Finance co gtd Ser144A priv plmt 7.75% /2019 100,000 104,250 0.25YCC Holdings / Yankee Finance sr unsecur PIK 10.25% /2016 100,000 103,760 0.25Tempur-Pedic International co gtd Ser144A priv plmt 6.875% /2020 100,000 103,375 0.25Scientific Games International co gtd Ser144A priv plmt 6.25% /2020 100,000 103,375 0.25Denbury Resources co gtd 8.25% /2020 50,000 56,500 0.14CMS Energy sr unsecur 5.05% /2022 50,000 56,117 0.14XM Satellite Radio co gtd Ser144A priv plmt 7.625% /2018 50,000 55,875 0.13
Statement of inveStmentS (continued)
transferable securities and money market instruments admitted to official exchange listing or dealt in on another regulated market. as at 31 December 2012, expressed in US dollars.
investments
nominal in US dollars
unless specifiedmarket
value% of net
assets
Chrysler Group/CG Co-Issuer secured 8% /2019 200,000 219,541 0.53Freescale Semiconductor sr secured Ser144A priv plmt 9.25% /2018 200,000 219,500 0.53Level 3 Financing co gtd 8.125% /2019 200,000 219,500 0.53Diamond Resorts sr secured 12% /2018 200,000 217,500 0.52CDW Finance co gtd 8.5% /2019 200,000 217,500 0.52Interline Brands sr unsecur Ser144A priv plmt PIK 10% /2018 200,000 217,000 0.52Hologic co gtd Ser144A priv plmt 6.25% /2020 200,000 215,750 0.52Levi Strauss & Co sr unsecur 6.875% /2022 200,000 215,500 0.52Spectrum Brands co gtd Ser144A priv plmt 6.75% /2020 200,000 215,500 0.52Graton Economic Development Authority sr secured Ser144A priv plmt 9.625% /2019 200,000 215,250 0.52Sabre Holdings sr unsecur 8.35% /2016 200,000 215,000 0.52Bristow Group co gtd 6.25% /2022 200,000 214,750 0.52Crown Castle International sr unsecur Ser144A priv plmt 5.25% /2023 200,000 214,750 0.52Consolidated Container Capital co gtd Ser144A priv plmt 10.125% /2020 200,000 214,500 0.52Community Health Systems co gtd 7.125% /2020 200,000 214,413 0.52Kennedy-Wilson co gtd 8.75% /2019 200,000 214,000 0.52SBA Telecommunications co gtd Ser144A priv plmt 5.75% /2020 200,000 213,250 0.51Jaguar Holding sr unsecur Ser144A priv plmt PIK 9.375% /2017 200,000 211,000 0.51VWR Funding co gtd Ser144A priv plmt 7.25% /2017 200,000 211,000 0.51Mead Products Brands co gtd Ser144A priv plmt 6.75% /2020 200,000 211,000 0.51Wolverine World Wide co gtd Ser144A priv plmt 6.125% /2020 200,000 211,000 0.51IMS Health sr unsecur Ser144A priv plmt 6% /2020 200,000 210,000 0.51CNO Financial Group sr secured Ser144A priv plmt 6.375% /2020 200,000 209,000 0.50Cequel Communications Holdings sr unsecur Ser144A priv plmt 6.375% /2020 200,000 208,500 0.50Targa Resources Partners Finance co gtd Ser144A priv plmt 5.25% /2023 200,000 208,000 0.50JB Poindexter & Co sr unsecur Ser144A priv plmt 9% /2022 200,000 207,750 0.50Pretium Packaging Finance secured 11.5% /2016 200,000 207,250 0.50Monitronics International co gtd 9.125% /2020 200,000 207,000 0.50First Data co gtd PIK 10.55% /2015 200,000 205,750 0.50Northern Oil and Gas co gtd 8% /2020 200,000 205,000 0.49Eagle Rock Energy Finance co gtd 8.375% /2019 200,000 205,000 0.49Sabine Pass sr secured Ser144A priv plmt 6.5% /2020 200,000 204,500 0.49ACMP Finance co gtd 4.875% /2023 200,000 204,000 0.49Crestwood Midstream Finance co gtd 7.75% /2019 188,000 195,990 0.47Avaya sr secured Ser144A priv plmt 7% /2019 200,000 188,000 0.45Knowledge Universe Education co gtd Ser144A priv plmt 7.75% /2015 200,000 187,000 0.45Armored Autogroup co gtd 9.25% /2018 200,000 170,500 0.41Caesars Entertainment Operating secured 10% /2018 250,000 166,754 0.40IDQ Holdings sr secured Ser144A priv plmt 11.5% /2017 150,000 162,375 0.39Pinnacle Foods Finance/Pinnacle Foods Finance co gtd 8.25% /2017 150,000 160,687 0.39Tesoro co gtd 5.375% /2022 150,000 160,500 0.39Griffon co gtd 7.125% /2018 150,000 160,125 0.39Nationstar Mortgage Capital co gtd Ser144A priv plmt 7.875% /2020 150,000 159,375 0.38
Corporate Bonds (continued)
United States of america (continued)
Corporate Bonds (continued)
United States of america (continued)
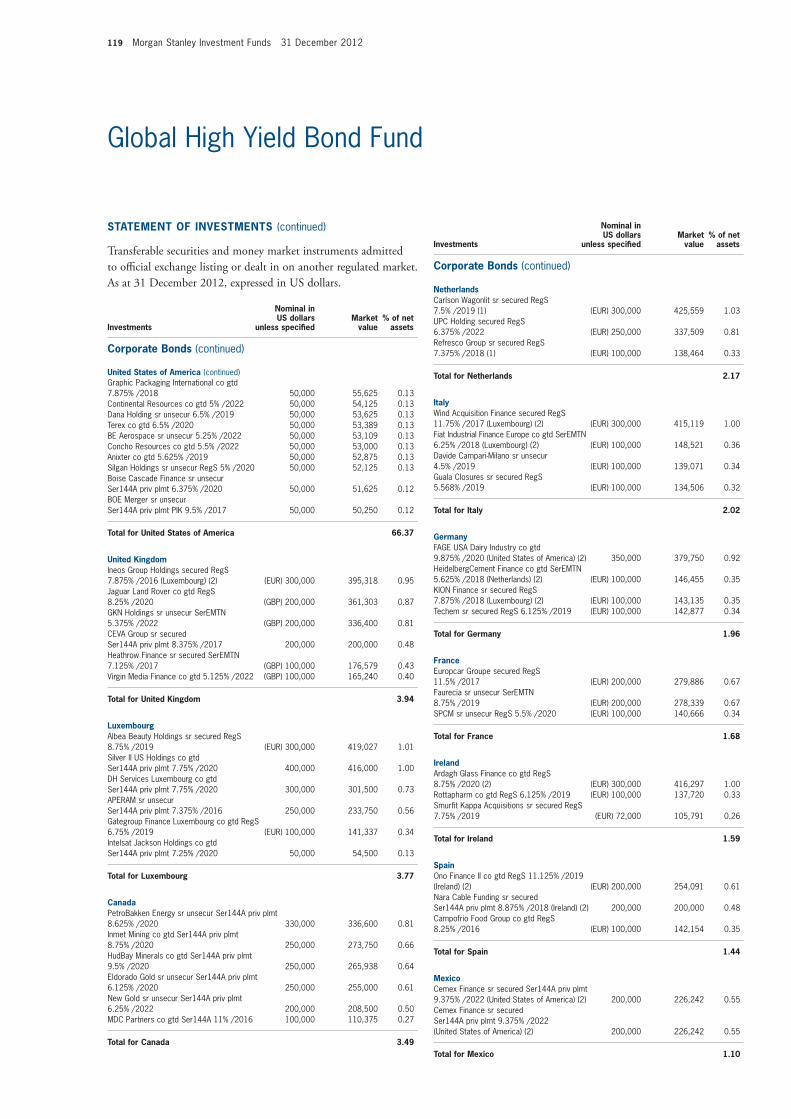
119 Morgan Stanley Investment Funds 31 December 2012
Global High Yield Bond Fund
netherlandsCarlson Wagonlit sr secured RegS 7.5% /2019 (1) (EUR) 300,000 425,559 1.03UPC Holding secured RegS 6.375% /2022 (EUR) 250,000 337,509 0.81Refresco Group sr secured RegS 7.375% /2018 (1) (EUR) 100,000 138,464 0.33
total for netherlands 2.17
italyWind Acquisition Finance secured RegS 11.75% /2017 (Luxembourg) (2) (EUR) 300,000 415,119 1.00Fiat Industrial Finance Europe co gtd SerEMTN 6.25% /2018 (Luxembourg) (2) (EUR) 100,000 148,521 0.36Davide Campari-Milano sr unsecur 4.5% /2019 (EUR) 100,000 139,071 0.34Guala Closures sr secured RegS 5.568% /2019 (EUR) 100,000 134,506 0.32
total for italy 2.02
GermanyFAGE USA Dairy Industry co gtd 9.875% /2020 (United States of America) (2) 350,000 379,750 0.92HeidelbergCement Finance co gtd SerEMTN 5.625% /2018 (Netherlands) (2) (EUR) 100,000 146,455 0.35KION Finance sr secured RegS 7.875% /2018 (Luxembourg) (2) (EUR) 100,000 143,135 0.35Techem sr secured RegS 6.125% /2019 (EUR) 100,000 142,877 0.34
total for Germany 1.96
franceEuropcar Groupe secured RegS 11.5% /2017 (EUR) 200,000 279,886 0.67Faurecia sr unsecur SerEMTN 8.75% /2019 (EUR) 200,000 278,339 0.67SPCM sr unsecur RegS 5.5% /2020 (EUR) 100,000 140,666 0.34
total for france 1.68
irelandArdagh Glass Finance co gtd RegS 8.75% /2020 (2) (EUR) 300,000 416,297 1.00Rottapharm co gtd RegS 6.125% /2019 (EUR) 100,000 137,720 0.33Smurfit Kappa Acquisitions sr secured RegS 7.75% /2019 (EUR) 72,000 105,791 0.26
total for ireland 1.59
SpainOno Finance II co gtd RegS 11.125% /2019 (Ireland) (2) (EUR) 200,000 254,091 0.61Nara Cable Funding sr secured Ser144A priv plmt 8.875% /2018 (Ireland) (2) 200,000 200,000 0.48Campofrio Food Group co gtd RegS 8.25% /2016 (EUR) 100,000 142,154 0.35
total for Spain 1.44
mexicoCemex Finance sr secured Ser144A priv plmt 9.375% /2022 (United States of America) (2) 200,000 226,242 0.55Cemex Finance sr secured Ser144A priv plmt 9.375% /2022 (United States of America) (2) 200,000 226,242 0.55
total for mexico 1.10
Statement of inveStmentS (continued)
transferable securities and money market instruments admitted to official exchange listing or dealt in on another regulated market. as at 31 December 2012, expressed in US dollars.
investments
nominal in US dollars
unless specifiedmarket
value% of net
assets
Graphic Packaging International co gtd 7.875% /2018 50,000 55,625 0.13Continental Resources co gtd 5% /2022 50,000 54,125 0.13Dana Holding sr unsecur 6.5% /2019 50,000 53,625 0.13Terex co gtd 6.5% /2020 50,000 53,389 0.13BE Aerospace sr unsecur 5.25% /2022 50,000 53,109 0.13Concho Resources co gtd 5.5% /2022 50,000 53,000 0.13Anixter co gtd 5.625% /2019 50,000 52,875 0.13Silgan Holdings sr unsecur RegS 5% /2020 50,000 52,125 0.13Boise Cascade Finance sr unsecur Ser144A priv plmt 6.375% /2020 50,000 51,625 0.12BOE Merger sr unsecur Ser144A priv plmt PIK 9.5% /2017 50,000 50,250 0.12
total for United States of america 66.37
United KingdomIneos Group Holdings secured RegS 7.875% /2016 (Luxembourg) (2) (EUR) 300,000 395,318 0.95Jaguar Land Rover co gtd RegS 8.25% /2020 (GBP) 200,000 361,303 0.87GKN Holdings sr unsecur SerEMTN 5.375% /2022 (GBP) 200,000 336,400 0.81CEVA Group sr secured Ser144A priv plmt 8.375% /2017 200,000 200,000 0.48Heathrow Finance sr secured SerEMTN 7.125% /2017 (GBP) 100,000 176,579 0.43Virgin Media Finance co gtd 5.125% /2022 (GBP) 100,000 165,240 0.40
total for United Kingdom 3.94
LuxembourgAlbea Beauty Holdings sr secured RegS 8.75% /2019 (EUR) 300,000 419,027 1.01Silver II US Holdings co gtd Ser144A priv plmt 7.75% /2020 400,000 416,000 1.00DH Services Luxembourg co gtd Ser144A priv plmt 7.75% /2020 300,000 301,500 0.73APERAM sr unsecur Ser144A priv plmt 7.375% /2016 250,000 233,750 0.56Gategroup Finance Luxembourg co gtd RegS 6.75% /2019 (EUR) 100,000 141,337 0.34Intelsat Jackson Holdings co gtd Ser144A priv plmt 7.25% /2020 50,000 54,500 0.13
total for Luxembourg 3.77
CanadaPetroBakken Energy sr unsecur Ser144A priv plmt 8.625% /2020 330,000 336,600 0.81Inmet Mining co gtd Ser144A priv plmt 8.75% /2020 250,000 273,750 0.66HudBay Minerals co gtd Ser144A priv plmt 9.5% /2020 250,000 265,938 0.64Eldorado Gold sr unsecur Ser144A priv plmt 6.125% /2020 250,000 255,000 0.61New Gold sr unsecur Ser144A priv plmt 6.25% /2022 200,000 208,500 0.50MDC Partners co gtd Ser144A 11% /2016 100,000 110,375 0.27
total for Canada 3.49
Corporate Bonds (continued)
United States of america (continued)
Corporate Bonds (continued)
investments
nominal in US dollars
unless specifiedmarket
value% of net
assets

Morgan Stanley Investment Funds 31 December 2012 120
Global High Yield Bond Fund
Corporate Bonds (continued)
Statement of inveStmentS (continued)
transferable securities and money market instruments admitted to official exchange listing or dealt in on another regulated market. as at 31 December 2012, expressed in US dollars.
investments
nominal in US dollars
unless specifiedmarket
value% of net
assets
DerivativeS
OtC and exchange traded derivatives as at 31 December 2012, expressed in US dollars.
forward foreign Currency exchange Contracts
maturity date
amount bought Ccy
amount sold Ccy Counterparty
Unrealised gain/(loss)
USD% of net
assets
09/01/2013 85,000 EUR 109,753 USD J.P. Morgan 2,618 0.01
Unrealised Gain on forward foreign Currency exchange Contracts 2,618 0.01
eUr hedged Share Class 11/01/2013 357,016 EUR 470,458 USD J.P. Morgan 1,531 0.00
Unrealised Gain on nav hedged Share Classes forward foreign Currency exchange Contracts 1,531 0.00
total Unrealised Gain on forward foreign Currency exchange Contracts 4,149 0.01
09/01/2013 3,864,416 USD 2,980,000 EUR Westpac Bank (75,187) (0.18)17/01/2013 732,537 USD 455,000 GBP RBC (6,786) (0.02)
Unrealised Loss on forward foreign Currency exchange Contracts (81,973) (0.20)
eUr hedged Share Class 11/01/2013 12,624,250 EUR 16,706,870 USD J.P. Morgan (17,118) (0.04)
Unrealised Loss on nav hedged Share Classes forward foreign Currency exchange Contracts (17,118) (0.04)
total Unrealised Loss on forward foreign Currency exchange Contracts (99,091) (0.24)
net Unrealised Loss on forward foreign Currency exchange Contracts (94,942) (0.23)
total Derivatives (94,942) (0.23)
other assets less Liabilities 2,638,385 6.36
total net asset value 41,503,266 100.00
(1) All or part of this position is out on loan.(2) The country in brackets represents the country of incorporation of this security.(5) Variable coupon rates are those quoted as of 31 December 2012.
australiaFMG Resources August 2006 Proprietary co gtd Ser144A priv plmt 6.375% /2016 250,000 260,000 0.62Origin Energy Finance co gtd SerEMTN 7.875% /2071 (5) (EUR) 100,000 139,752 0.34
total for australia 0.96
BelgiumOntex IV sr secured RegS 7.5% /2018 (Luxembourg) (2) (EUR) 200,000 282,436 0.68
total for Belgium 0.68
PortugalBrisa Concessao Rodoviaria sr secured SerEMTN 6.875% /2018 (EUR) 200,000 279,596 0.67
total for Portugal 0.67
new ZealandBeverage Packaging Holdings Luxembourg II secured RegS 9.5% /2017 (Luxembourg) (2) (EUR) 200,000 275,843 0.66
total for new Zealand 0.66
JamaicaDigicel Group sr unsecur Ser144A priv plmt 8.25% /2020 (Bermuda) (2) 200,000 221,000 0.53
total for Jamaica 0.53
GreeceDryShips sr unsecur CV 5% /2014 (Marshall Islands) (2) 250,000 201,250 0.48
total for Greece 0.48
DenmarkKabel Deutschland Holding sr unsecur RegS 6.5% /2017 (Germany) (2) (EUR) 100,000 144,792 0.36
total for Denmark 0.36
total for Corporate Bonds 93.87
total investment Securities 38,959,823 93.87
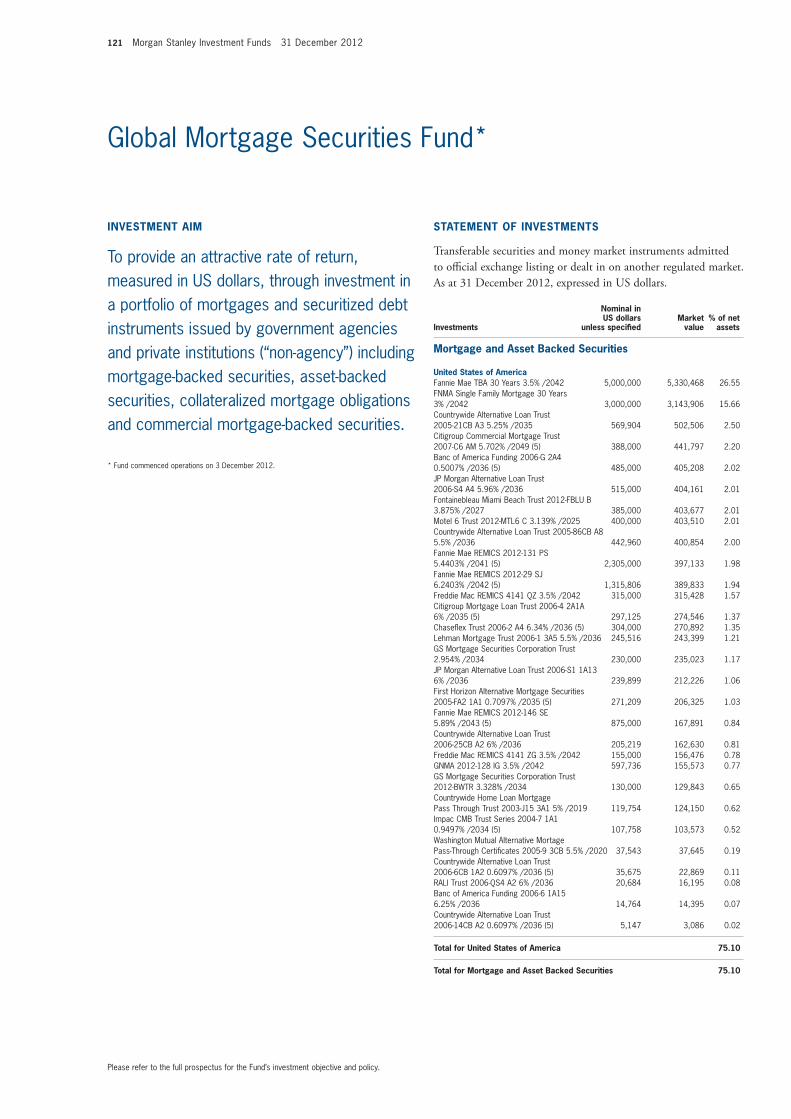
121 Morgan Stanley Investment Funds 31 December 2012
Please refer to the full prospectus for the Fund’s investment objective and policy.
Global Mortgage Securities Fund*
inveStment aim
To provide an attractive rate of return, measured in US dollars, through investment in a portfolio of mortgages and securitized debt instruments issued by government agencies and private institutions (“non-agency”) including mortgage-backed securities, asset-backed securities, collateralized mortgage obligations and commercial mortgage-backed securities.
Statement of inveStmentS
transferable securities and money market instruments admitted to official exchange listing or dealt in on another regulated market. as at 31 December 2012, expressed in US dollars.
investments
nominal in US dollars
unless specifiedmarket
value% of net
assets mortgage and asset Backed Securities
United States of america Fannie Mae TBA 30 Years 3.5% /2042 5,000,000 5,330,468 26.55 FNMA Single Family Mortgage 30 Years 3% /2042 3,000,000 3,143,906 15.66 Countrywide Alternative Loan Trust 2005-21CB A3 5.25% /2035 569,904 502,506 2.50 Citigroup Commercial Mortgage Trust 2007-C6 AM 5.702% /2049 (5) 388,000 441,797 2.20 Banc of America Funding 2006-G 2A4 0.5007% /2036 (5) 485,000 405,208 2.02 JP Morgan Alternative Loan Trust 2006-S4 A4 5.96% /2036 515,000 404,161 2.01 Fontainebleau Miami Beach Trust 2012-FBLU B 3.875% /2027 385,000 403,677 2.01 Motel 6 Trust 2012-MTL6 C 3.139% /2025 400,000 403,510 2.01 Countrywide Alternative Loan Trust 2005-86CB A8 5.5% /2036 442,960 400,854 2.00 Fannie Mae REMICS 2012-131 PS 5.4403% /2041 (5) 2,305,000 397,133 1.98 Fannie Mae REMICS 2012-29 SJ 6.2403% /2042 (5) 1,315,806 389,833 1.94 Freddie Mac REMICS 4141 QZ 3.5% /2042 315,000 315,428 1.57 Citigroup Mortgage Loan Trust 2006-4 2A1A 6% /2035 (5) 297,125 274,546 1.37 Chaseflex Trust 2006-2 A4 6.34% /2036 (5) 304,000 270,892 1.35 Lehman Mortgage Trust 2006-1 3A5 5.5% /2036 245,516 243,399 1.21 GS Mortgage Securities Corporation Trust 2.954% /2034 230,000 235,023 1.17 JP Morgan Alternative Loan Trust 2006-S1 1A13 6% /2036 239,899 212,226 1.06 First Horizon Alternative Mortgage Securities 2005-FA2 1A1 0.7097% /2035 (5) 271,209 206,325 1.03 Fannie Mae REMICS 2012-146 SE 5.89% /2043 (5) 875,000 167,891 0.84 Countrywide Alternative Loan Trust 2006-25CB A2 6% /2036 205,219 162,630 0.81 Freddie Mac REMICS 4141 ZG 3.5% /2042 155,000 156,476 0.78 GNMA 2012-128 IG 3.5% /2042 597,736 155,573 0.77 GS Mortgage Securities Corporation Trust 2012-BWTR 3.328% /2034 130,000 129,843 0.65 Countrywide Home Loan Mortgage Pass Through Trust 2003-J15 3A1 5% /2019 119,754 124,150 0.62 Impac CMB Trust Series 2004-7 1A1 0.9497% /2034 (5) 107,758 103,573 0.52 Washington Mutual Alternative Mortage Pass-Through Certificates 2005-9 3CB 5.5% /2020 37,543 37,645 0.19 Countrywide Alternative Loan Trust 2006-6CB 1A2 0.6097% /2036 (5) 35,675 22,869 0.11 RALI Trust 2006-QS4 A2 6% /2036 20,684 16,195 0.08 Banc of America Funding 2006-6 1A15 6.25% /2036 14,764 14,395 0.07 Countrywide Alternative Loan Trust 2006-14CB A2 0.6097% /2036 (5) 5,147 3,086 0.02
total for United States of america 75.10
total for mortgage and asset Backed Securities 75.10
* Fund commenced operations on 3 December 2012.

Morgan Stanley Investment Funds 31 December 2012 122
Global Mortgage Securities Fund
Statement of inveStmentS (continued)
transferable securities and money market instruments admitted to official exchange listing or dealt in on another regulated market. as at 31 December 2012, expressed in US dollars.
investments
nominal in US dollars
unless specifiedmarket
value% of net
assets Government Bonds
United States of america US Treasury 0% 21/03/2013 3,000,000 2,999,264 14.94 US Treasury 0% 7/03/2013 2,500,000 2,499,456 12.45 US Treasury 0% 14/03/2013 2,500,000 2,499,412 12.45
total for United States of america 39.84
total for Government Bonds 39.84
total investment Securities 23,073,350 114.94
DerivativeS
OtC and exchange traded derivatives as at 31 December 2012, expressed in US dollars.
futures Contracts
Descriptionmaturity
datenumber of contracts
notional commitments Counterparty
net unrealised gain/(loss) as at
31 December 2012
% of net assets
US 2yr T-note Future 03/2013 14 3,086,781 Goldman Sachs (219) 0.00US 5yr T-note Future 03/2013 (2) (248,687) Goldman Sachs (453) 0.00US 10yr T-note Future 03/2013 4 530,875 Goldman Sachs (578) (0.01)
net Unrealised Loss on futures Contracts 3,368,9691 (1,250) (0.01)
1 Cash of USD 16,747 held as collateral by the counterparty.
forward foreign Currency exchange Contracts
maturity date
amount bought Ccy
amount sold Ccy Counterparty
Unrealised gain/(loss)
USD% of net
assets
eUr hedged Share Class 11/01/2013 477,357 EUR 631,572 USD J.P. Morgan (487) 0.00
net Unrealised Loss on forward foreign Currency exchange Contracts (487) 0.00
total Derivatives (1,737) (0.01)
other assets less Liabilities (2,996,777) (14.93)
total net asset value 20,074,836 100.00
(5) Variable coupon rates are those quoted as of 31 December 2012.
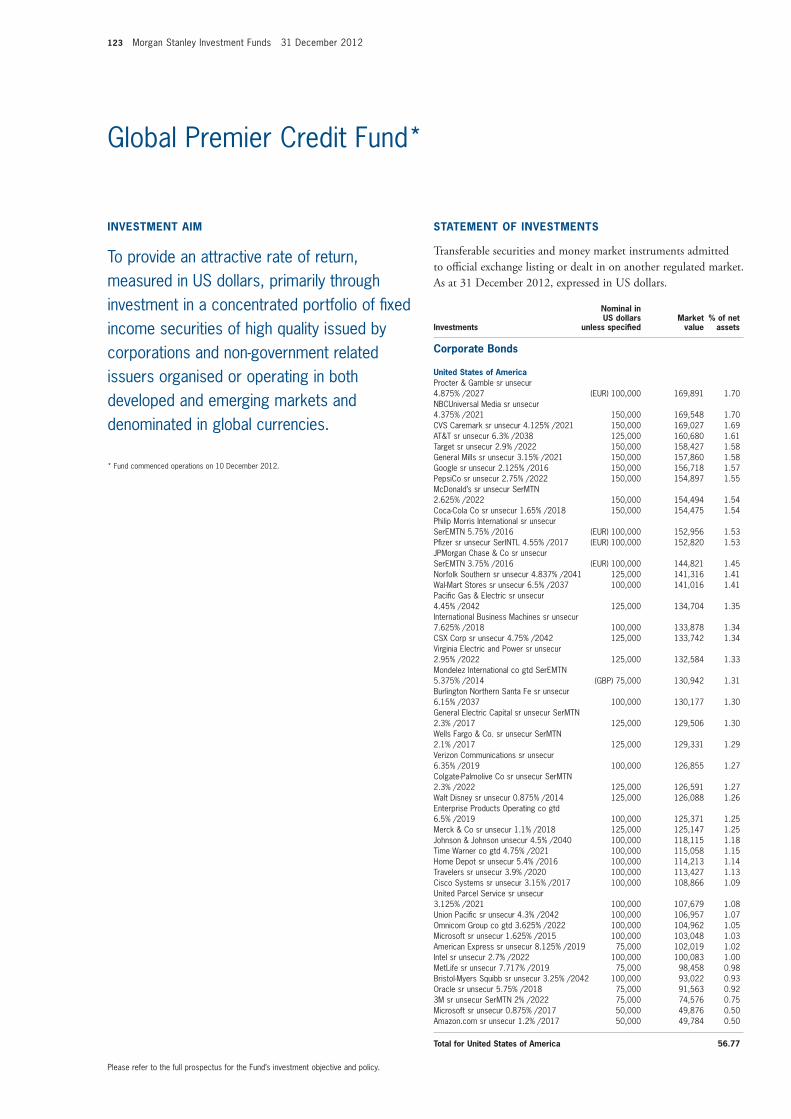
123 Morgan Stanley Investment Funds 31 December 2012
Please refer to the full prospectus for the Fund’s investment objective and policy.
Global Premier Credit Fund*
inveStment aim
To provide an attractive rate of return, measured in US dollars, primarily through investment in a concentrated portfolio of fixed income securities of high quality issued by corporations and non-government related issuers organised or operating in both developed and emerging markets and denominated in global currencies.
Statement of inveStmentS
transferable securities and money market instruments admitted to official exchange listing or dealt in on another regulated market. as at 31 December 2012, expressed in US dollars.
investments
nominal in US dollars
unless specifiedmarket
value% of net
assets Corporate Bonds
United States of americaProcter & Gamble sr unsecur 4.875% /2027 (EUR) 100,000 169,891 1.70NBCUniversal Media sr unsecur 4.375% /2021 150,000 169,548 1.70CVS Caremark sr unsecur 4.125% /2021 150,000 169,027 1.69AT&T sr unsecur 6.3% /2038 125,000 160,680 1.61Target sr unsecur 2.9% /2022 150,000 158,427 1.58General Mills sr unsecur 3.15% /2021 150,000 157,860 1.58Google sr unsecur 2.125% /2016 150,000 156,718 1.57PepsiCo sr unsecur 2.75% /2022 150,000 154,897 1.55McDonald’s sr unsecur SerMTN 2.625% /2022 150,000 154,494 1.54Coca-Cola Co sr unsecur 1.65% /2018 150,000 154,475 1.54Philip Morris International sr unsecur SerEMTN 5.75% /2016 (EUR) 100,000 152,956 1.53Pfizer sr unsecur SerINTL 4.55% /2017 (EUR) 100,000 152,820 1.53JPMorgan Chase & Co sr unsecur SerEMTN 3.75% /2016 (EUR) 100,000 144,821 1.45Norfolk Southern sr unsecur 4.837% /2041 125,000 141,316 1.41Wal-Mart Stores sr unsecur 6.5% /2037 100,000 141,016 1.41Pacific Gas & Electric sr unsecur 4.45% /2042 125,000 134,704 1.35International Business Machines sr unsecur 7.625% /2018 100,000 133,878 1.34CSX Corp sr unsecur 4.75% /2042 125,000 133,742 1.34Virginia Electric and Power sr unsecur 2.95% /2022 125,000 132,584 1.33Mondelez International co gtd SerEMTN 5.375% /2014 (GBP) 75,000 130,942 1.31Burlington Northern Santa Fe sr unsecur 6.15% /2037 100,000 130,177 1.30General Electric Capital sr unsecur SerMTN 2.3% /2017 125,000 129,506 1.30Wells Fargo & Co. sr unsecur SerMTN 2.1% /2017 125,000 129,331 1.29Verizon Communications sr unsecur 6.35% /2019 100,000 126,855 1.27Colgate-Palmolive Co sr unsecur SerMTN 2.3% /2022 125,000 126,591 1.27Walt Disney sr unsecur 0.875% /2014 125,000 126,088 1.26Enterprise Products Operating co gtd 6.5% /2019 100,000 125,371 1.25Merck & Co sr unsecur 1.1% /2018 125,000 125,147 1.25Johnson & Johnson unsecur 4.5% /2040 100,000 118,115 1.18Time Warner co gtd 4.75% /2021 100,000 115,058 1.15Home Depot sr unsecur 5.4% /2016 100,000 114,213 1.14Travelers sr unsecur 3.9% /2020 100,000 113,427 1.13Cisco Systems sr unsecur 3.15% /2017 100,000 108,866 1.09United Parcel Service sr unsecur 3.125% /2021 100,000 107,679 1.08Union Pacific sr unsecur 4.3% /2042 100,000 106,957 1.07Omnicom Group co gtd 3.625% /2022 100,000 104,962 1.05Microsoft sr unsecur 1.625% /2015 100,000 103,048 1.03American Express sr unsecur 8.125% /2019 75,000 102,019 1.02Intel sr unsecur 2.7% /2022 100,000 100,083 1.00MetLife sr unsecur 7.717% /2019 75,000 98,458 0.98Bristol-Myers Squibb sr unsecur 3.25% /2042 100,000 93,022 0.93Oracle sr unsecur 5.75% /2018 75,000 91,563 0.923M sr unsecur SerMTN 2% /2022 75,000 74,576 0.75Microsoft sr unsecur 0.875% /2017 50,000 49,876 0.50Amazon.com sr unsecur 1.2% /2017 50,000 49,784 0.50
total for United States of america 56.77
* Fund commenced operations on 10 December 2012.
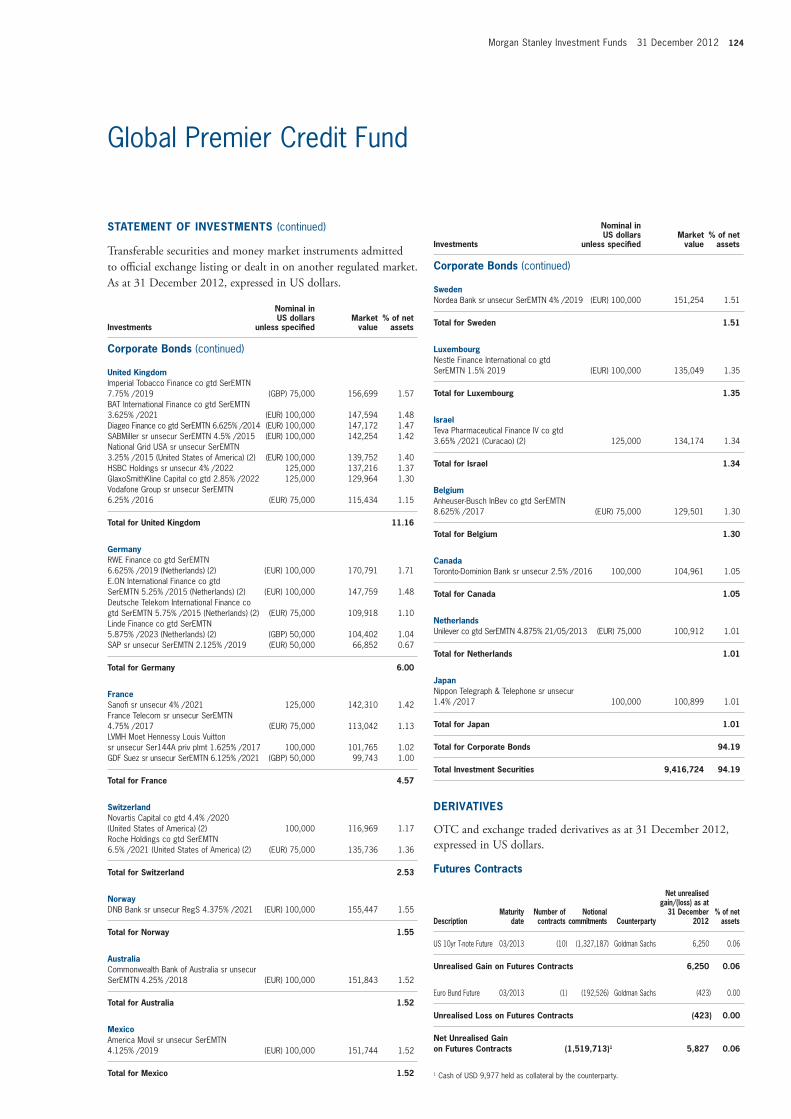
Morgan Stanley Investment Funds 31 December 2012 124
Global Premier Credit Fund
Statement of inveStmentS (continued)
transferable securities and money market instruments admitted to official exchange listing or dealt in on another regulated market. as at 31 December 2012, expressed in US dollars.
investments
nominal in US dollars
unless specifiedmarket
value% of net
assets
United KingdomImperial Tobacco Finance co gtd SerEMTN 7.75% /2019 (GBP) 75,000 156,699 1.57BAT International Finance co gtd SerEMTN 3.625% /2021 (EUR) 100,000 147,594 1.48Diageo Finance co gtd SerEMTN 6.625% /2014 (EUR) 100,000 147,172 1.47SABMiller sr unsecur SerEMTN 4.5% /2015 (EUR) 100,000 142,254 1.42National Grid USA sr unsecur SerEMTN 3.25% /2015 (United States of America) (2) (EUR) 100,000 139,752 1.40HSBC Holdings sr unsecur 4% /2022 125,000 137,216 1.37GlaxoSmithKline Capital co gtd 2.85% /2022 125,000 129,964 1.30Vodafone Group sr unsecur SerEMTN 6.25% /2016 (EUR) 75,000 115,434 1.15
total for United Kingdom 11.16
GermanyRWE Finance co gtd SerEMTN 6.625% /2019 (Netherlands) (2) (EUR) 100,000 170,791 1.71E.ON International Finance co gtd SerEMTN 5.25% /2015 (Netherlands) (2) (EUR) 100,000 147,759 1.48Deutsche Telekom International Finance co gtd SerEMTN 5.75% /2015 (Netherlands) (2) (EUR) 75,000 109,918 1.10Linde Finance co gtd SerEMTN 5.875% /2023 (Netherlands) (2) (GBP) 50,000 104,402 1.04SAP sr unsecur SerEMTN 2.125% /2019 (EUR) 50,000 66,852 0.67
total for Germany 6.00
franceSanofi sr unsecur 4% /2021 125,000 142,310 1.42France Telecom sr unsecur SerEMTN 4.75% /2017 (EUR) 75,000 113,042 1.13LVMH Moet Hennessy Louis Vuitton sr unsecur Ser144A priv plmt 1.625% /2017 100,000 101,765 1.02GDF Suez sr unsecur SerEMTN 6.125% /2021 (GBP) 50,000 99,743 1.00
total for france 4.57
SwitzerlandNovartis Capital co gtd 4.4% /2020 (United States of America) (2) 100,000 116,969 1.17Roche Holdings co gtd SerEMTN 6.5% /2021 (United States of America) (2) (EUR) 75,000 135,736 1.36
total for Switzerland 2.53
norwayDNB Bank sr unsecur RegS 4.375% /2021 (EUR) 100,000 155,447 1.55
total for norway 1.55
australiaCommonwealth Bank of Australia sr unsecur SerEMTN 4.25% /2018 (EUR) 100,000 151,843 1.52
total for australia 1.52
mexicoAmerica Movil sr unsecur SerEMTN 4.125% /2019 (EUR) 100,000 151,744 1.52
total for mexico 1.52
investments
nominal in US dollars
unless specifiedmarket
value% of net
assets
SwedenNordea Bank sr unsecur SerEMTN 4% /2019 (EUR) 100,000 151,254 1.51
total for Sweden 1.51
LuxembourgNestle Finance International co gtd SerEMTN 1.5% 2019 (EUR) 100,000 135,049 1.35
total for Luxembourg 1.35
israelTeva Pharmaceutical Finance IV co gtd 3.65% /2021 (Curacao) (2) 125,000 134,174 1.34
total for israel 1.34
BelgiumAnheuser-Busch InBev co gtd SerEMTN 8.625% /2017 (EUR) 75,000 129,501 1.30
total for Belgium 1.30
CanadaToronto-Dominion Bank sr unsecur 2.5% /2016 100,000 104,961 1.05
total for Canada 1.05
netherlandsUnilever co gtd SerEMTN 4.875% 21/05/2013 (EUR) 75,000 100,912 1.01
total for netherlands 1.01
JapanNippon Telegraph & Telephone sr unsecur 1.4% /2017 100,000 100,899 1.01
total for Japan 1.01
total for Corporate Bonds 94.19
total investment Securities 9,416,724 94.19
DerivativeS
OtC and exchange traded derivatives as at 31 December 2012, expressed in US dollars.
futures Contracts
Descriptionmaturity
datenumber of contracts
notional commitments Counterparty
net unrealised gain/(loss) as at
31 December 2012
% of net assets
US 10yr T-note Future 03/2013 (10) (1,327,187) Goldman Sachs 6,250 0.06
Unrealised Gain on futures Contracts 6,250 0.06
Euro Bund Future 03/2013 (1) (192,526) Goldman Sachs (423) 0.00
Unrealised Loss on futures Contracts (423) 0.00
net Unrealised Gain on futures Contracts (1,519,713)1 5,827 0.06
1 Cash of USD 9,977 held as collateral by the counterparty.
Corporate Bonds (continued)
Corporate Bonds (continued)

125 Morgan Stanley Investment Funds 31 December 2012
Global Premier Credit Fund
forward foreign Currency exchange Contracts
maturity date
amount bought Ccy
amount sold Ccy Counterparty
Unrealised gain/(loss)
USD% of net
assets
17/01/2013 69,928 CHF 74,982 USD J.P. Morgan 1,609 0.02 17/01/2013 464,489 GBP 747,955 USD J.P. Morgan 6,786 0.07 18/01/2013 1,841,840 EUR 2,393,812 USD J.P. Morgan 41,330 0.41
total Unrealised Gain on forward foreign Currency exchange Contracts 49,725 0.50
17/01/2013 54,420 AUD 57,087 USD J.P. Morgan (666) (0.01)17/01/2013 293,252 CAD 297,021 USD J.P. Morgan (2,543) (0.03)17/01/2013 34,466,706 JPY 418,359 USD J.P. Morgan (19,271) (0.19)17/01/2013 498,540 USD 310,000 GBP J.P. Morgan (5,174) (0.05)18/01/2013 3,049,299 USD 2,350,000 EUR J.P. Morgan (57,693) (0.58)
Unrealised Loss on forward foreign Currency exchange Contracts (85,347) (0.86)
eUr hedged Share Class 11/01/2013 230,046 EUR 304,364 USD J.P. Morgan (235) 0.00
Unrealised Loss on nav hedged Share Classes forward foreign Currency exchange Contracts (235) 0.00
total Unrealised Loss on forward foreign Currency exchange Contracts (85,582) (0.86)
net Unrealised Loss on forward foreign Currency exchange Contracts (35,857) (0.36)
total Derivatives (30,030) (0.30)
other assets less Liabilities 611,179 6.11
total net asset value 9,997,873 100.00
(2) The country in brackets represents the country of incorporation of this security.
DerivativeS (continued)
OtC and exchange traded derivatives as at 31 December 2012, expressed in US dollars.

Morgan Stanley Investment Funds 31 December 2012 126
Please refer to the full prospectus for the Fund’s investment objective and policy.
Short Maturity Euro Bond Fund
Bonds
italyItaly Buoni Poliennali Del Tesoro 3.75% /2015 16,000,000 16,541,312 3.54Italy Buoni Poliennali Del Tesoro 4.25% /2015 14,800,000 15,450,297 3.30Italy Buoni Poliennali Del Tesoro 3% /2015 13,000,000 13,212,589 2.82Italy Buoni Poliennali Del Tesoro 3% /2015 7,100,000 7,215,620 1.54Italy Buoni Poliennali Del Tesoro sr unsubord 4.25% /2014 5,000,000 5,183,390 1.11Intesa Sanpaolo sr unsecur SerEMTN 3.5% 27/11/2013 3,500,000 3,561,810 0.76UniCredit sr unsecur SerEMTN 5.25% /2014 3,000,000 3,115,276 0.67Finmeccanica Finance co gtd SerEMTN 8.125% 03/12/2013 (Luxembourg) (2) 2,700,000 2,869,560 0.61Banco Popolare covered RegS 4.75% /2016 2,300,000 2,392,768 0.51Banca Monte dei Paschi di Siena covered SerEMTN 4.875% /2016 2,200,000 2,309,523 0.49Enel Finance International co gtd SerGMTN 4.625% /2015 (Netherlands) (2) 1,600,000 1,703,646 0.36Luxottica Group co gtd 4% /2015 1,500,000 1,617,220 0.35Enel Finance International co gtd SerEMTN 4.125% /2017 (Netherlands) (1) (2) 1,500,000 1,587,895 0.34Banco Popolare sr unsecur 4% 06/04/2013 1,500,000 1,504,920 0.32Snam sr unsecur SerEMTN 2% /2015 1,280,000 1,293,674 0.28Banca Monte dei Paschi di Siena sr unsecur SerEMTN 4.5% /2014 1,200,000 1,198,974 0.26Telecom Italia sr unsecur SerEMTN 4.625% /2015 1,000,000 1,068,680 0.23FGA Capital Ireland co gtd SerEMTN 4% 28/03/2013 (Ireland) (2) 700,000 695,793 0.15Intesa Sanpaolo Bank Ireland bnk gtd SerEMTN 4% 08/08/2013 (Ireland) (2) 600,000 609,156 0.13Telecom Italia sr unsecur SerEMTN 4.5% /2017 500,000 534,583 0.11Telecom Italia sr unsecur RegS 5.125% /2016 400,000 435,288 0.09Telecom Italia sr unsecur SerEMTN 7% /2017 (1) 350,000 406,887 0.09
total for italy 18.06
franceGovernment of France OAT 3% /2015 16,000,000 17,262,072 3.69French Treasury Note BTAN nts 2% /2015 14,500,000 15,176,092 3.24Caisse d’Amortissement de la Dette Sociale unsecur SerEMTN 1.875% /2015 5,000,000 5,171,045 1.11BPCE sr unsecur SerEMTN 2% /2018 3,700,000 3,773,382 0.81BNP Paribas sr unsecur SerEMTN 5% 16/12/2013 (1) 3,000,000 3,128,418 0.67Société Générale sr unsecur SerEMTN 4% /2016 (1) 2,300,000 2,509,018 0.54AXA sr unsecur SerEMTN 4.5% /2015 2,300,000 2,473,820 0.53Agence Francaise de Developpement unsecur SerEMTN 1.102% /2015 (5) 2,400,000 2,437,373 0.52Groupe Auchan sr unsecur SerEMTN 5.125% /2014 (1) 2,000,000 2,140,520 0.46Veolia Environnement sr unsecur SerEMTN 5.25% /2014 2,000,000 2,118,598 0.45BNP Paribas Home Loan covered SerEMTN 4.125% /2014 2,000,000 2,079,312 0.44Vivendi sr unsecur SerEMTN 3.5% /2015 1,800,000 1,897,845 0.41Compagnie de Saint-Gobain sr unsecur SerEMTN 3.5% /2015 1,725,000 1,829,896 0.39BNP Paribas sr unsecur SerEMTN 0.46168% 20/12/2013 (5) 1,750,000 1,750,367 0.37Crédit Agricole sr unsecur SerEMTN 6% 24/06/2013 1,500,000 1,540,950 0.33RCI Banque sr unsecur SerEMTN 5.625% /2015 (1) 1,400,000 1,521,707 0.33
inveStment aim
To provide an attractive rate of return, measured in Euro, through market and instrument selection. This objective will be achieved by investing in high quality fixed income securities denominated in the Euro.
Statement of inveStmentS
transferable securities and money market instruments admitted to official exchange listing or dealt in on another regulated market. as at 31 December 2012, expressed in euro.
investments
nominal in euro unless
specifiedmarket
value% of net
assets
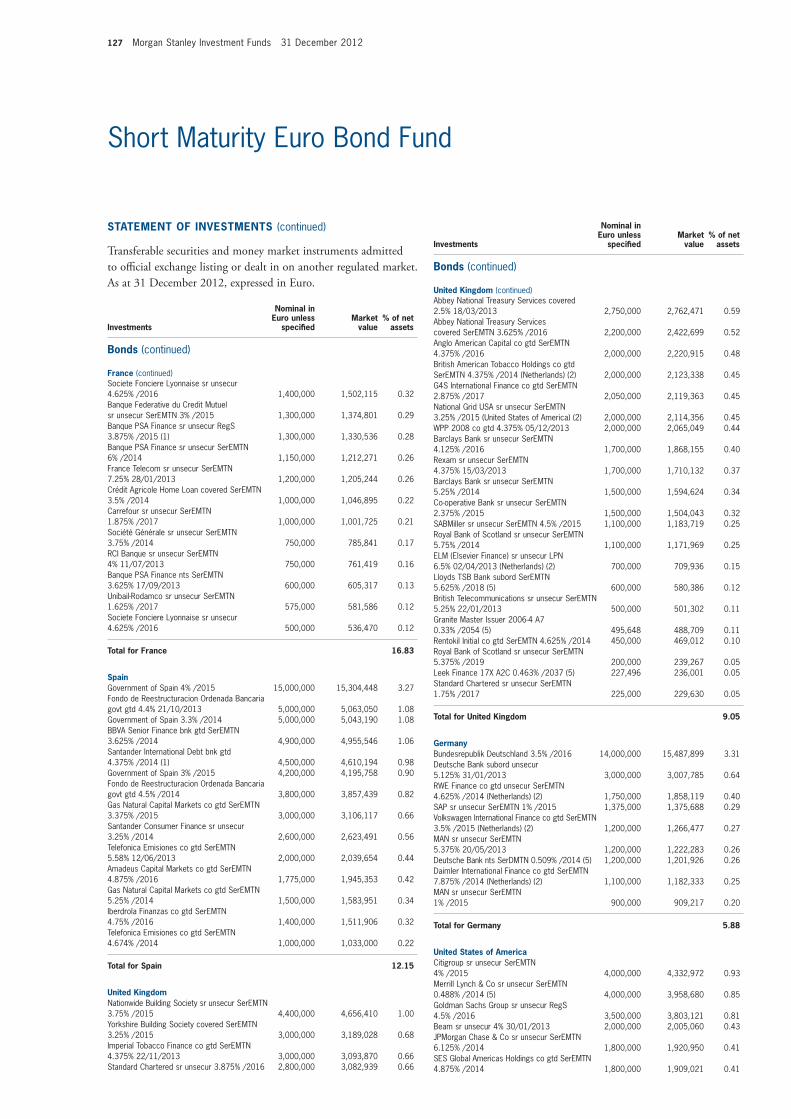
127 Morgan Stanley Investment Funds 31 December 2012
Short Maturity Euro Bond Fund
Statement of inveStmentS (continued)
transferable securities and money market instruments admitted to official exchange listing or dealt in on another regulated market. as at 31 December 2012, expressed in euro.
investments
nominal in euro unless
specifiedmarket
value% of net
assets
Societe Fonciere Lyonnaise sr unsecur 4.625% /2016 1,400,000 1,502,115 0.32Banque Federative du Credit Mutuel sr unsecur SerEMTN 3% /2015 1,300,000 1,374,801 0.29Banque PSA Finance sr unsecur RegS 3.875% /2015 (1) 1,300,000 1,330,536 0.28Banque PSA Finance sr unsecur SerEMTN 6% /2014 1,150,000 1,212,271 0.26France Telecom sr unsecur SerEMTN 7.25% 28/01/2013 1,200,000 1,205,244 0.26Crédit Agricole Home Loan covered SerEMTN 3.5% /2014 1,000,000 1,046,895 0.22Carrefour sr unsecur SerEMTN 1.875% /2017 1,000,000 1,001,725 0.21Société Générale sr unsecur SerEMTN 3.75% /2014 750,000 785,841 0.17RCI Banque sr unsecur SerEMTN 4% 11/07/2013 750,000 761,419 0.16Banque PSA Finance nts SerEMTN 3.625% 17/09/2013 600,000 605,317 0.13Unibail-Rodamco sr unsecur SerEMTN 1.625% /2017 575,000 581,586 0.12Societe Fonciere Lyonnaise sr unsecur 4.625% /2016 500,000 536,470 0.12
total for france 16.83
SpainGovernment of Spain 4% /2015 15,000,000 15,304,448 3.27Fondo de Reestructuracion Ordenada Bancaria govt gtd 4.4% 21/10/2013 5,000,000 5,063,050 1.08Government of Spain 3.3% /2014 5,000,000 5,043,190 1.08BBVA Senior Finance bnk gtd SerEMTN 3.625% /2014 4,900,000 4,955,546 1.06Santander International Debt bnk gtd 4.375% /2014 (1) 4,500,000 4,610,194 0.98Government of Spain 3% /2015 4,200,000 4,195,758 0.90Fondo de Reestructuracion Ordenada Bancaria govt gtd 4.5% /2014 3,800,000 3,857,439 0.82Gas Natural Capital Markets co gtd SerEMTN 3.375% /2015 3,000,000 3,106,117 0.66Santander Consumer Finance sr unsecur 3.25% /2014 2,600,000 2,623,491 0.56Telefonica Emisiones co gtd SerEMTN 5.58% 12/06/2013 2,000,000 2,039,654 0.44Amadeus Capital Markets co gtd SerEMTN 4.875% /2016 1,775,000 1,945,353 0.42Gas Natural Capital Markets co gtd SerEMTN 5.25% /2014 1,500,000 1,583,951 0.34Iberdrola Finanzas co gtd SerEMTN 4.75% /2016 1,400,000 1,511,906 0.32Telefonica Emisiones co gtd SerEMTN 4.674% /2014 1,000,000 1,033,000 0.22
total for Spain 12.15
United KingdomNationwide Building Society sr unsecur SerEMTN 3.75% /2015 4,400,000 4,656,410 1.00Yorkshire Building Society covered SerEMTN 3.25% /2015 3,000,000 3,189,028 0.68Imperial Tobacco Finance co gtd SerEMTN 4.375% 22/11/2013 3,000,000 3,093,870 0.66Standard Chartered sr unsecur 3.875% /2016 2,800,000 3,082,939 0.66
investments
nominal in euro unless
specifiedmarket
value% of net
assets
Abbey National Treasury Services covered 2.5% 18/03/2013 2,750,000 2,762,471 0.59Abbey National Treasury Services covered SerEMTN 3.625% /2016 2,200,000 2,422,699 0.52Anglo American Capital co gtd SerEMTN 4.375% /2016 2,000,000 2,220,915 0.48British American Tobacco Holdings co gtd SerEMTN 4.375% /2014 (Netherlands) (2) 2,000,000 2,123,338 0.45G4S International Finance co gtd SerEMTN 2.875% /2017 2,050,000 2,119,363 0.45National Grid USA sr unsecur SerEMTN 3.25% /2015 (United States of America) (2) 2,000,000 2,114,356 0.45WPP 2008 co gtd 4.375% 05/12/2013 2,000,000 2,065,049 0.44Barclays Bank sr unsecur SerEMTN 4.125% /2016 1,700,000 1,868,155 0.40Rexam sr unsecur SerEMTN 4.375% 15/03/2013 1,700,000 1,710,132 0.37Barclays Bank sr unsecur SerEMTN 5.25% /2014 1,500,000 1,594,624 0.34Co-operative Bank sr unsecur SerEMTN 2.375% /2015 1,500,000 1,504,043 0.32SABMiller sr unsecur SerEMTN 4.5% /2015 1,100,000 1,183,719 0.25Royal Bank of Scotland sr unsecur SerEMTN 5.75% /2014 1,100,000 1,171,969 0.25ELM (Elsevier Finance) sr unsecur LPN 6.5% 02/04/2013 (Netherlands) (2) 700,000 709,936 0.15Lloyds TSB Bank subord SerEMTN 5.625% /2018 (5) 600,000 580,386 0.12British Telecommunications sr unsecur SerEMTN 5.25% 22/01/2013 500,000 501,302 0.11Granite Master Issuer 2006-4 A7 0.33% /2054 (5) 495,648 488,709 0.11Rentokil Initial co gtd SerEMTN 4.625% /2014 450,000 469,012 0.10Royal Bank of Scotland sr unsecur SerEMTN 5.375% /2019 200,000 239,267 0.05Leek Finance 17X A2C 0.463% /2037 (5) 227,496 236,001 0.05Standard Chartered sr unsecur SerEMTN 1.75% /2017 225,000 229,630 0.05
total for United Kingdom 9.05
GermanyBundesrepublik Deutschland 3.5% /2016 14,000,000 15,487,899 3.31Deutsche Bank subord unsecur 5.125% 31/01/2013 3,000,000 3,007,785 0.64RWE Finance co gtd unsecur SerEMTN 4.625% /2014 (Netherlands) (2) 1,750,000 1,858,119 0.40SAP sr unsecur SerEMTN 1% /2015 1,375,000 1,375,688 0.29Volkswagen International Finance co gtd SerEMTN 3.5% /2015 (Netherlands) (2) 1,200,000 1,266,477 0.27MAN sr unsecur SerEMTN 5.375% 20/05/2013 1,200,000 1,222,283 0.26Deutsche Bank nts SerDMTN 0.509% /2014 (5) 1,200,000 1,201,926 0.26Daimler International Finance co gtd SerEMTN 7.875% /2014 (Netherlands) (2) 1,100,000 1,182,333 0.25MAN sr unsecur SerEMTN 1% /2015 900,000 909,217 0.20
total for Germany 5.88
United States of americaCitigroup sr unsecur SerEMTN 4% /2015 4,000,000 4,332,972 0.93Merrill Lynch & Co sr unsecur SerEMTN 0.488% /2014 (5) 4,000,000 3,958,680 0.85Goldman Sachs Group sr unsecur RegS 4.5% /2016 3,500,000 3,803,121 0.81Beam sr unsecur 4% 30/01/2013 2,000,000 2,005,060 0.43JPMorgan Chase & Co sr unsecur SerEMTN 6.125% /2014 1,800,000 1,920,950 0.41SES Global Americas Holdings co gtd SerEMTN 4.875% /2014 1,800,000 1,909,021 0.41
Bonds (continued)
france (continued)
Bonds (continued)
United Kingdom (continued)
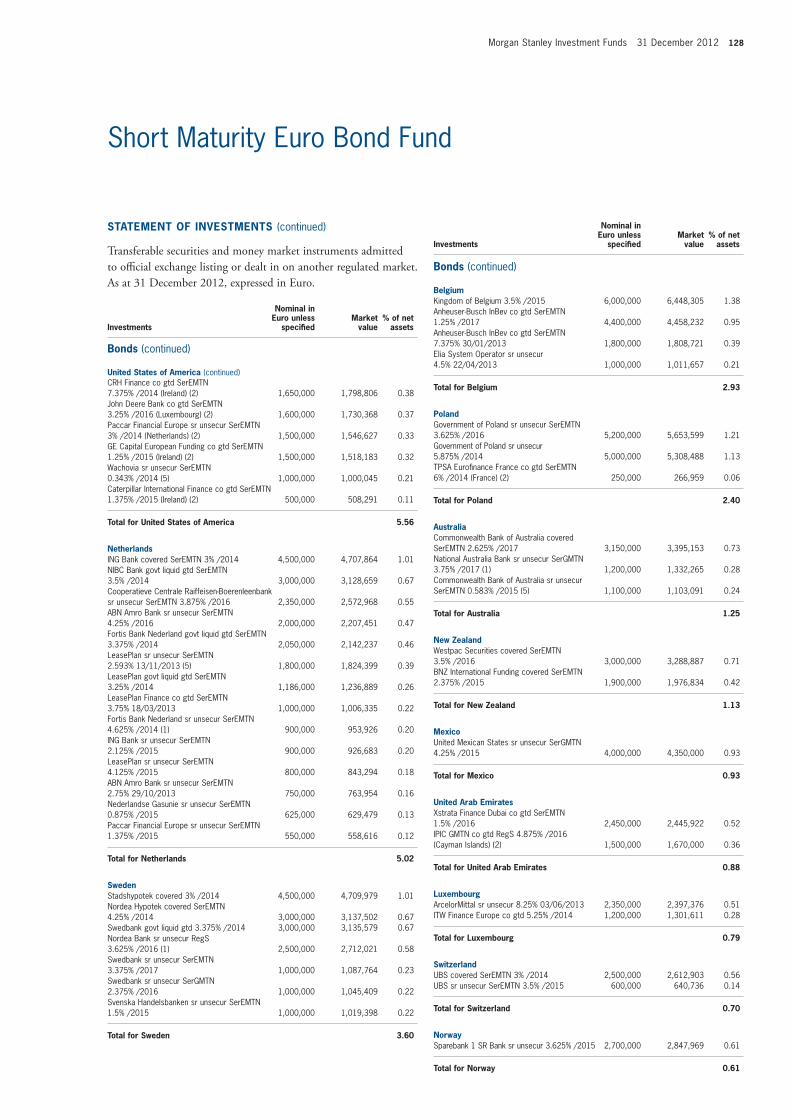
Morgan Stanley Investment Funds 31 December 2012 128
Short Maturity Euro Bond Fund
CRH Finance co gtd SerEMTN 7.375% /2014 (Ireland) (2) 1,650,000 1,798,806 0.38John Deere Bank co gtd SerEMTN 3.25% /2016 (Luxembourg) (2) 1,600,000 1,730,368 0.37Paccar Financial Europe sr unsecur SerEMTN 3% /2014 (Netherlands) (2) 1,500,000 1,546,627 0.33GE Capital European Funding co gtd SerEMTN 1.25% /2015 (Ireland) (2) 1,500,000 1,518,183 0.32Wachovia sr unsecur SerEMTN 0.343% /2014 (5) 1,000,000 1,000,045 0.21Caterpillar International Finance co gtd SerEMTN 1.375% /2015 (Ireland) (2) 500,000 508,291 0.11
total for United States of america 5.56
netherlandsING Bank covered SerEMTN 3% /2014 4,500,000 4,707,864 1.01NIBC Bank govt liquid gtd SerEMTN 3.5% /2014 3,000,000 3,128,659 0.67Cooperatieve Centrale Raiffeisen-Boerenleenbank sr unsecur SerEMTN 3.875% /2016 2,350,000 2,572,968 0.55ABN Amro Bank sr unsecur SerEMTN 4.25% /2016 2,000,000 2,207,451 0.47Fortis Bank Nederland govt liquid gtd SerEMTN 3.375% /2014 2,050,000 2,142,237 0.46LeasePlan sr unsecur SerEMTN 2.593% 13/11/2013 (5) 1,800,000 1,824,399 0.39LeasePlan govt liquid gtd SerEMTN 3.25% /2014 1,186,000 1,236,889 0.26LeasePlan Finance co gtd SerEMTN 3.75% 18/03/2013 1,000,000 1,006,335 0.22Fortis Bank Nederland sr unsecur SerEMTN 4.625% /2014 (1) 900,000 953,926 0.20ING Bank sr unsecur SerEMTN 2.125% /2015 900,000 926,683 0.20LeasePlan sr unsecur SerEMTN 4.125% /2015 800,000 843,294 0.18ABN Amro Bank sr unsecur SerEMTN 2.75% 29/10/2013 750,000 763,954 0.16Nederlandse Gasunie sr unsecur SerEMTN 0.875% /2015 625,000 629,479 0.13Paccar Financial Europe sr unsecur SerEMTN 1.375% /2015 550,000 558,616 0.12
total for netherlands 5.02
SwedenStadshypotek covered 3% /2014 4,500,000 4,709,979 1.01Nordea Hypotek covered SerEMTN 4.25% /2014 3,000,000 3,137,502 0.67Swedbank govt liquid gtd 3.375% /2014 3,000,000 3,135,579 0.67Nordea Bank sr unsecur RegS 3.625% /2016 (1) 2,500,000 2,712,021 0.58Swedbank sr unsecur SerEMTN 3.375% /2017 1,000,000 1,087,764 0.23Swedbank sr unsecur SerGMTN 2.375% /2016 1,000,000 1,045,409 0.22Svenska Handelsbanken sr unsecur SerEMTN 1.5% /2015 1,000,000 1,019,398 0.22
total for Sweden 3.60
BelgiumKingdom of Belgium 3.5% /2015 6,000,000 6,448,305 1.38Anheuser-Busch InBev co gtd SerEMTN 1.25% /2017 4,400,000 4,458,232 0.95Anheuser-Busch InBev co gtd SerEMTN 7.375% 30/01/2013 1,800,000 1,808,721 0.39Elia System Operator sr unsecur 4.5% 22/04/2013 1,000,000 1,011,657 0.21
total for Belgium 2.93
PolandGovernment of Poland sr unsecur SerEMTN 3.625% /2016 5,200,000 5,653,599 1.21Government of Poland sr unsecur 5.875% /2014 5,000,000 5,308,488 1.13TPSA Eurofinance France co gtd SerEMTN 6% /2014 (France) (2) 250,000 266,959 0.06
total for Poland 2.40
australiaCommonwealth Bank of Australia covered SerEMTN 2.625% /2017 3,150,000 3,395,153 0.73National Australia Bank sr unsecur SerGMTN 3.75% /2017 (1) 1,200,000 1,332,265 0.28Commonwealth Bank of Australia sr unsecur SerEMTN 0.583% /2015 (5) 1,100,000 1,103,091 0.24
total for australia 1.25
new ZealandWestpac Securities covered SerEMTN 3.5% /2016 3,000,000 3,288,887 0.71BNZ International Funding covered SerEMTN 2.375% /2015 1,900,000 1,976,834 0.42
total for new Zealand 1.13
mexicoUnited Mexican States sr unsecur SerGMTN 4.25% /2015 4,000,000 4,350,000 0.93
total for mexico 0.93
United arab emiratesXstrata Finance Dubai co gtd SerEMTN 1.5% /2016 2,450,000 2,445,922 0.52IPIC GMTN co gtd RegS 4.875% /2016 (Cayman Islands) (2) 1,500,000 1,670,000 0.36
total for United arab emirates 0.88
LuxembourgArcelorMittal sr unsecur 8.25% 03/06/2013 2,350,000 2,397,376 0.51ITW Finance Europe co gtd 5.25% /2014 1,200,000 1,301,611 0.28
total for Luxembourg 0.79
SwitzerlandUBS covered SerEMTN 3% /2014 2,500,000 2,612,903 0.56UBS sr unsecur SerEMTN 3.5% /2015 600,000 640,736 0.14
total for Switzerland 0.70
norwaySparebank 1 SR Bank sr unsecur 3.625% /2015 2,700,000 2,847,969 0.61
total for norway 0.61
Statement of inveStmentS (continued)
transferable securities and money market instruments admitted to official exchange listing or dealt in on another regulated market. as at 31 December 2012, expressed in euro.
investments
nominal in euro unless
specifiedmarket
value% of net
assets Bonds (continued)
United States of america (continued)
investments
nominal in euro unless
specifiedmarket
value% of net
assets
Bonds (continued)

129 Morgan Stanley Investment Funds 31 December 2012
Short Maturity Euro Bond Fund
South KoreaExport-Import Bank of Korea sr unsecur SerEMTN 5.75% 22/05/2013 1,950,000 1,990,950 0.43
total for South Korea 0.43
PortugalBanco Comercial Portugues sr unsecur SerEMTN 1.089% 28/02/2013 (1) (5) 1,700,000 1,694,518 0.36
total for Portugal 0.36
JerseyASIF III Jersey sr secured SerEMTN 4.75% 11/09/2013 250,000 255,918 0.05
total for Jersey 0.05
total for Bonds 88.61
mutual fund
Morgan Stanley Funds plc - Euro Liquidity Fund (Ireland) (2) (4) 22,603,633 22,603,633 4.83
total for mutual fund 4.83
Supra-national Bonds
European Investment Bank sr unsecur SerEMTN 0.26% /2016 (5) 7,000,000 6,997,445 1.49European Union sr unsecur SerEMTN 2.5% /2015 5,500,000 5,870,340 1.25European Union nts SerEMTN 2.75% /2016 5,000,000 5,419,275 1.16
total for Supra-national Bonds 3.90
total investment Securities 455,518,960 97.34
DerivativeS
OtC and exchange traded derivatives as at 31 December 2012, expressed in euro.
futures Contracts
Descriptionmaturity
datenumber of contracts
notional commitments Counterparty
net unrealised gain/(loss) as at
31 December 2012
% of net assets
Euro SCHATZ Future 03/2013 394 43,676,870 Goldman Sachs 21,299 0.00
Unrealised Gain on futures Contracts 21,299 0.00
Euro BOBL Future 03/2013 (455) (58,158,100) Goldman Sachs (304,850) (0.06)
Unrealised Loss on futures Contracts (304,850) (0.06)
net Unrealised Loss on futures Contracts (14,481,230)1 (283,551) (0.06)
1 Cash of EUR 664,537 held as collateral by the counterparty.
total Derivatives (283,551) (0.06)
other assets less Liabilities 12,712,539 2.72
total net asset value 467,947,948 100.00
(1) All or part of this position is out on loan.(2) The country in brackets represents the country of incorporation of this security.(4) Managed by an affiliate of the Investment Adviser.(5) Variable coupon rates are those quoted as of 31 December 2012.
Statement of inveStmentS (continued)
transferable securities and money market instruments admitted to official exchange listing or dealt in on another regulated market. as at 31 December 2012, expressed in euro.
investments
holdings/nominal in
euro unless specified
market value
% of net assets
Bonds (continued)

Morgan Stanley Investment Funds 31 December 2012 130
Please refer to the full prospectus for the Fund’s investment objective and policy.
Euro Liquidity Fund
Commercial Paper
GermanyDeutsche Bank 0% 10/01/2013 5,000,000 4,999,978 4.31 Landeskreditbank Baden-Wurttem 0% 02/01/2013 4,000,000 4,000,000 3.45
total for Germany 7.76
Sweden Nordea Bank 0% 04/01/2013 3,000,000 2,999,943 2.59 Stadshypotek 0% 07/01/2013 2,000,000 1,999,986 1.72 Stadshypotek 0% 13/03/2013 1,500,000 1,499,592 1.29
total for Sweden 5.60
norway DNB Bank 0% 16/01/2013 2,500,000 2,499,990 2.16 DNB Bank 0% 12/02/2013 2,000,000 1,999,977 1.72
total for norway 3.88
france Electricite De France 0% 07/01/2013 2,000,000 1,999,992 1.73 Electricite De France 0% 23/01/2013 2,000,000 1,999,965 1.72
total for france 3.45
United States of america GE Capital European Funding 0% 04/01/2013 2,000,000 1,999,952 1.73 GE Capital European Funding 0% 28/02/2013 2,000,000 1,999,241 1.72
total for United States of america 3.45
Japan Sumitomo Mitsui Banking 0% 06/02/2013 1,000,000 999,951 0.85
total for Japan 0.85
total for Commercial Paper 24.99
Certificates of Deposit
Sweden Skandinaviska Enskilda 0% 04/01/2013 4,000,000 3,999,989 3.45 Nordea Bank 0% 07/01/2013 2,500,000 2,499,990 2.15 Svenska Handelsbanken 0.2% 25/01/2013 500,000 500,002 0.43
total for Sweden 6.03
United States of america Wells Fargo Bank International 0.03% 22/01/2013 3,000,000 3,000,000 2.59 Wells Fargo Bank International 0.03% 23/01/2013 2,000,000 2,000,000 1.72
total for United States of america 4.31
Japan Mizuho Corporate Bank 0% 08/01/2013 1,800,000 1,799,991 1.55
total for Japan 1.55
total for Certificates of Deposit 11.89
inveStment aim
To provide liquidity and high current income, to the extent consistent with the preservation of capital, primarily by investing in high quality short-term transferable debt securities that are denominated in Euro, provided that, at the time of acquisition, their initial or residual maturity does not exceed 397 days. The Fund may also hold up to 49% of its net assets in cash and cash equivalents.
Statement of inveStmentS
transferable securities and money market instruments admitted to official exchange listing or dealt in on another regulated market. as at 31 December 2012, expressed in euro.
investments
nominal in euro unless
specifiedmarket
value% of net
assets

131 Morgan Stanley Investment Funds 31 December 2012
Euro Liquidity Fund
treasury Bill
Belgium - Sovereign Belgium (Kingdom of) 0% 17/01/2013 10,000,000 9,999,996 8.62
total for Belgium - Sovereign 8.62
total for treasury Bill 8.62
floating rate notes
netherlands Rabobank Nederland sr unsecur RegS 0.51% 14/01/2013 (5) 5,000,000 5,000,450 4.31
total for netherlands 4.31
Switzerland Credit Suisse Securities sr unsecur SerEMTN 0.816% 07/01/2013 (5) 1,000,000 1,000,104 0.86
total for Switzerland 0.86
total for floating rate notes 5.17
mutual fund
Morgan Stanley Funds plc - Euro Liquidity Fund (Ireland) (2) (4) 5,706,220 5,706,220 4.92
total for mutual fund 4.92
asset Backed Commercial Paper
United Kingdom Sheffield Receivables 0% 17/01/2013 4,000,000 3,999,867 3.45
total for United Kingdom 3.45
total for asset Backed Commercial Paper 3.45
Corporate Bonds
Germany NRW. Bank Local govt gtd 1.97% 28/01/2013 2,000,000 2,002,667 1.73
total for Germany 1.73
Canada Royal Bank of Canada sr unsecur SerEMTN 3.25% 18/01/2013 188,000 188,263 0.15
total for Canada 0.15
total for Corporate Bonds 1.88
total investment Securities 70,696,106 60.92
other assets less Liabilities 45,342,390 39.08
total net asset value 116,038,496 100.00
(2) The country in brackets represents the country of incorporation of this security.(4) Managed by an affiliate of the Investment Adviser.(5) Variable coupon rates are those quoted as of 31 December 2012.
Statement of inveStmentS (continued)
transferable securities and money market instruments admitted to official exchange listing or dealt in on another regulated market. as at 31 December 2012, expressed in euro.
investments
holdings/nominal in
euro unless specified
market value
% of net assets

Morgan Stanley Investment Funds 31 December 2012 132
Please refer to the full prospectus for the Fund’s investment objective and policy.
US Dollar Liquidity Fund
Certificates of Deposit
CanadaBank of Montreal 0.21% 14/01/2013 150,000,000 150,000,000 4.12 Canadian Imperial Bank of Commerce 0.11% 03/01/2013 80,000,000 80,000,000 2.20 Bank of Nova Scotia 0.4035% 02/07/2013 (5) 50,000,000 50,000,000 1.37 Royal Bank of Canada 0.397% 11/07/2013 (5) 50,000,000 50,000,000 1.37 Toronto-Dominion Bank 0.205% 15/02/2013 50,000,000 50,000,000 1.37 Toronto-Dominion Bank 0.31% 13/09/2013 (5) 46,000,000 46,000,000 1.26 Toronto-Dominion Bank 0.314% 26/07/2013 (5) 42,000,000 42,000,000 1.15 Toronto-Dominion Bank 0.321% 21/10/2013 (5) 36,500,000 36,500,000 1.00 Royal Bank of Canada 0.363% 30/07/2013 (5) 25,000,000 25,006,357 0.69 Royal Bank of Canada 0.365% 25/01/2013 (5) 20,000,000 20,001,171 0.55 Royal Bank of Canada 0.364% 26/07/2013 (5) 20,000,000 20,000,000 0.55 Bank of Montreal 0.3% 09/05/2013 15,000,000 15,000,000 0.41 Bank of Nova Scotia sr unsecur 0.314% 26/04/2013 (5) 15,000,000 14,999,532 0.41 Bank of Montreal 0.3% 13/05/2013 1,100,000 1,100,000 0.03
total for Canada 16.48
norway DNB Bank 0.16% 02/01/2013 180,000,000 180,000,000 4.94
total for norway 4.94
australia National Australia Bank 0.31% 09/08/2013 (5) 75,000,000 75,000,000 2.06 Westpac Banking 0.312% 27/08/2013 (5) 52,500,000 52,498,379 1.44 Westpac Banking 0.313% 04/02/2013 (5) 50,000,000 50,002,515 1.37
total for australia 4.87
Japan Sumitomo Mitsui Banking 0.16% 02/01/2013 140,000,000 140,000,000 3.84 Sumitomo Mitsui Banking 0.26% 14/03/2013 35,800,000 35,800,000 0.98
total for Japan 4.82
Germany Deutsche Bank 0.18% 10/01/2013 115,000,000 115,000,000 3.16
total for Germany 3.16
Sweden Svenska Handelsbanken 0.31% 05/06/2013 36,000,000 36,000,769 0.99 Skandinaviska Enskilda 0.28% 06/03/2013 25,000,000 25,000,000 0.68
total for Sweden 1.67
netherlands Rabobank 0.49% 08/02/2013 50,000,000 50,000,000 1.37
total for netherlands 1.37
total for Certificates of Deposit 37.31
inveStment aim
To provide liquidity and high current income, to the extent consistent with the preservation of capital, primarily by investing in high quality short-term transferable debt securities that are denominated in US dollars, provided that, at the time of acquisition, their initial or residual maturity does not exceed 397 days. The Fund may also hold up to 49% of its net assets in cash and cash equivalents.
Statement of inveStmentS
transferable securities and money market instruments admitted to official exchange listing or dealt in on another regulated market. as at 31 December 2012, expressed in US dollars.
investments
nominal in US dollars
unless specifiedmarket
value% of net
assets

133 Morgan Stanley Investment Funds 31 December 2012
US Dollar Liquidity Fund
Commercial Paper
Germany NRW. Bank 0% 11/01/2013 95,000,000 94,995,131 2.61 NRW. Bank 0% 01/02/2013 80,000,000 79,985,667 2.19 NRW. Bank 0% 09/01/2013 8,000,000 7,999,673 0.22
total for Germany 5.02
Luxembourg Banque et Caisse 0% 05/07/2013 100,000,000 99,793,000 2.74 Banque et Caisse 0% 06/02/2013 40,000,000 39,987,750 1.10 Banque et Caisse 0% 01/07/2013 38,000,000 37,924,000 1.04
total for Luxembourg 4.88
france BNP Paribas 0% 02/01/2013 175,000,000 175,000,000 4.80
total for france 4.80
Sweden Nordea Bank 0% 05/06/2013 40,700,000 40,647,383 1.12 Svenska Handelsbanken 0% 01/05/2013 36,000,000 35,964,300 0.99 Nordea Bank 0% 18/01/2013 32,500,000 32,494,150 0.89 Nordea Bank 0% 22/01/2013 32,500,000 32,492,687 0.89 Nordea Bank 0% 30/05/2013 6,000,000 5,992,600 0.16 Nordea Bank 0% 12/06/2013 5,200,000 5,193,023 0.14
total for Sweden 4.19
netherlands Rabobank USA Financial 0% 01/02/2013 98,000,000 97,957,942 2.69 ABN Amro Bank 0% 01/02/2013 21,600,000 21,594,420 0.59 Rabobank USA Financial 0% 06/03/2013 20,000,000 19,982,850 0.55 Rabobank USA Financial 0% 05/04/2013 12,000,000 11,988,375 0.33
total for netherlands 4.16
Japan Toyota Credit Puerto Rico 0% 13/02/2013 26,500,000 26,491,962 0.73 Toyota Motor Credit 0% 04/01/2013 14,400,000 14,399,864 0.40 Toyota Motor Credit 0% 08/01/2013 14,400,000 14,399,592 0.40 Toyota Motor Credit 0% 08/02/2013 13,935,000 13,931,419 0.38 Toyota Motor Credit 0% 07/01/2013 12,600,000 12,599,703 0.34
total for Japan 2.25
australia Westpac Banking 0% 02/01/2013 60,000,000 60,000,000 1.65 Westpac Banking 0.395% 03/04/2013 20,000,000 19,999,653 0.55
total for australia 2.20
Singapore DBS Bank 0% 08/01/2013 50,000,000 49,996,333 1.37 Oversea-Chinese Banking 0% 02/01/2013 11,000,000 11,000,000 0.30
total for Singapore 1.67
Statement of inveStmentS (continued)
transferable securities and money market instruments admitted to official exchange listing or dealt in on another regulated market. as at 31 December 2012, expressed in US dollars.
investments
nominal in US dollars
unless specifiedmarket
value% of net
assets
United States of america Coca-Cola Company 0% 01/05/2013 11,200,000 11,190,374 0.31 Coca-Cola Company 0% 14/05/2013 10,750,000 10,739,358 0.29 Coca-Cola Company 0% 02/05/2013 7,600,000 7,593,413 0.20
total for United States of america 0.80
total for Commercial Paper 29.97
agency
United States of america FHLB 0% 04/01/2013 105,000,000 104,999,563 2.88
total for United States of america 2.88
total for agency 2.88
Puttable floating rate note
Germany Deutsche Bank 0.708% 15/03/2013 (5) 15,000,000 15,000,000 0.42
total for Germany 0.42
total for Puttable floating rate note 0.42
total investment Securities 2,572,242,908 70.58
other assets less Liabilities 1,072,194,578 29.42
total net asset value 3,644,437,486 100.00
(5) Variable coupon rates are those quoted as of 31 December 2012.
investments
nominal in US dollars
unless specifiedmarket
value% of net
assets Commercial Paper (continued)

Morgan Stanley Investment Funds 31 December 2012 134
Please refer to the full prospectus for the Fund’s investment objective and policy.
Diversified Alpha Plus Fund
Government Bonds
Spain Government of Spain 4.75% /2014 179,100,000 184,622,817 26.16 Government of Spain 3.75% /2015 18,000,000 18,202,536 2.58 Government of Spain 3% /2015 850,000 849,141 0.12
total for Spain 28.86
france French Treasury Bill BTF 0% 18/04/2013 20,000,000 20,000,000 2.83 France Treasury Bill BTF 0% 31/01/2013 10,000,000 10,000,000 1.42 France Treasury Bill BTF 0% 17/01/2013 3,500,000 3,500,000 0.50 Government of France OAT 3.25% /2021 2,150,000 2,411,235 0.34 French Treasury Note BTAN 2.5% /2016 1,400,000 1,505,282 0.21 French Treasury Note BTAN nts 3% /2014 885,000 924,751 0.13
total for france 5.43
Belgium Kingdom of Belgium 0% 14/02/2013 25,000,000 24,999,916 3.54 Kingdom of Belgium 0% 18/04/2013 10,000,000 9,999,793 1.42
total for Belgium 4.96
United States of america US Treasury 2.75% /2018 (USD) 6,750,000 5,624,966 0.80 US Treasury 4.25% /2015 (USD) 5,700,000 4,751,655 0.67 US Treasury 3.625% /2021 (USD) 4,600,000 4,089,534 0.58 US Treasury 4.375% /2039 (USD) 3,950,000 3,899,179 0.55 US Treasury 3.125% /2017 (USD) 4,600,000 3,856,690 0.54 US Treasury 1.5% /2016 (USD) 1,250,000 980,012 0.14 US Treasury 0.25% /2015 (USD) 800,000 604,963 0.09
total for United States of america 3.37
Germany Bundesrepublik Deutschland 4.25% /2017 2,350,000 2,768,848 0.39 Bundesrepublik Deutschland 4.75% /2034 1,600,000 2,340,888 0.33 Bundesrepublik Deutschland 4.25% /2039 700,000 1,002,276 0.14 Bundesrepublik Deutschland 2.25% /2021 500,000 545,267 0.08
total for Germany 0.94
United Kingdom UK Treasury 4.25% /2036 (GBP) 1,720,000 2,586,259 0.37 UK Treasury 3.75% /2020 (GBP) 1,100,000 1,580,001 0.22 UK Treasury 1.75% /2022 (GBP) 350,000 427,504 0.06 UK Treasury 4.25% /2039 (GBP) 200,000 299,798 0.05 UK Treasury 5% /2018 (GBP) 200,000 296,468 0.04
total for United Kingdom 0.74
italy Italy Buoni Poliennali Del Tesoro 4% /2020 3,200,000 3,219,854 0.46 Italy Buoni Poliennali Del Tesoro sr unsecur 5% /2039 1,150,000 1,153,689 0.16
total for italy 0.62
inveStment aim
To seek to provide an absolute return while actively managing total portfolio risk. The Fund will invest in baskets of stocks, ETFs, bonds and derivatives, with the asset allocation based on a top-down investment approach focusing on asset class, sector, region and country selection. The Fund aims to manage downside risk and targets below market volatility.
Statement of inveStmentS
transferable securities and money market instruments admitted to official exchange listing or dealt in on another regulated market. as at 31 December 2012, expressed in euro.
investments
nominal in euro unless
specifiedmarket
value% of net
assets

135 Morgan Stanley Investment Funds 31 December 2012
Diversified Alpha Plus Fund
Statement of inveStmentS (continued)
transferable securities and money market instruments admitted to official exchange listing or dealt in on another regulated market. as at 31 December 2012, expressed in euro.
investments
holdings/nominal in
euro unless specified
market value
% of net assets
investments holdingsmarket
value% of net
assets
Canada Government of Canada 4.25% /2018 (CAD) 1,100,000 958,374 0.14 Government of Canada 3.75% /2019 (CAD) 830,000 715,281 0.10
total for Canada 0.24
australia Government of Australia sr unsecur 5.25% /2019 (AUD) 1,600,000 1,420,707 0.20
total for australia 0.20
Sweden Swedish Government 4.25% /2019 (SEK) 5,000,000 688,038 0.10
total for Sweden 0.10
total for Government Bonds 45.46
equities
United States of america Delta Air Lines 1,848,600 16,529,206 2.34 United Continental Holdings 733,200 12,950,928 1.84 Southwest Airlines 1,617,000 12,488,990 1.77 Bank of America 1,403,633 12,136,441 1.72 Citigroup 393,813 11,669,041 1.65 JPMorgan Chase & Co. 337,859 11,074,286 1.57 Alaska Air Group 150,200 4,882,327 0.69 US Airways Group ‘New’ 353,900 3,515,093 0.50 JetBlue Airways 617,000 2,644,092 0.36 Apple 1,500 594,358 0.08 United Technologies 9,400 573,558 0.08 Wal-Mart Stores 7,300 373,524 0.05 Exxon Mobil 5,000 321,878 0.05 Chevron 3,800 305,051 0.04 Halliburton 11,800 302,246 0.04 Abbott Laboratories 5,800 283,302 0.04 Procter & Gamble 5,100 258,717 0.04 General Electric 16,300 255,117 0.04 Microsoft 12,300 247,316 0.03 International Business Machines 1,600 229,979 0.03 Philip Morris International 3,500 218,775 0.03 Wells Fargo & Co 8,400 215,984 0.03 Verizon Communications 6,600 213,737 0.03 Dominion Resources 5,500 211,982 0.03 American Express 4,900 210,541 0.03 CVS Caremark 5,800 210,470 0.03 Texas Instruments 9,000 207,379 0.03 Johnson & Johnson 3,782 198,809 0.03 AT&T 7,800 197,902 0.03 Bank of New York Mellon 10,000 192,370 0.03 Oracle 7,600 190,125 0.03 Colgate-Palmolive 2,400 187,707 0.03 Pfizer 9,500 179,374 0.03 Danaher 4,300 179,035 0.03 McDonald’s 2,700 177,756 0.03 Qualcomm 3,800 174,832 0.02 ConocoPhillips 4,000 172,415 0.02 Home Depot 3,700 170,791 0.02 Automatic Data Processing 3,800 161,379 0.02 Caterpillar 2,400 159,639 0.02 Google ‘A’ 300 159,549 0.02
Comcast ‘A’ 5,700 158,246 0.02 Duke Energy 3,300 156,696 0.02 Apache 2,600 151,524 0.02 PNC Financial Services Group 3,400 147,967 0.02 Occidental Petroleum 2,600 147,492 0.02 Schlumberger (Curacao) (2) 2,800 143,947 0.02 United Parcel Service ‘B’ 2,600 143,421 0.02 PepsiCo 2,800 143,333 0.02 Cisco Systems 9,700 143,013 0.02 EI du Pont de Nemours & Co. 4,200 141,543 0.02 Costco Wholesale 1,800 132,937 0.02 Honeywell International 2,800 132,488 0.02 Praxair 1,600 131,214 0.02 Baxter International 2,600 129,436 0.02 Starbucks 3,200 127,644 0.02 Medtronic 4,100 125,550 0.02 Goldman Sachs Group 1,300 123,929 0.02 Dow Chemical 5,100 123,687 0.02 MetLife 5,000 121,678 0.02 3M 1,700 117,887 0.02 Capital One Financial 2,600 112,148 0.02 Amazon.com 600 111,909 0.02 Southern 3,500 111,731 0.02 U.S. Bancorp 4,600 109,995 0.02 Altria Group 4,600 108,221 0.02 Ford Motor 11,000 107,260 0.02 Simon Property Group 900 106,181 0.02 Coca-Cola 3,900 105,825 0.01 UnitedHealth Group 2,600 105,795 0.01 DIRECTV 2,800 104,698 0.01 Intel 6,600 102,101 0.01 Walt Disney 2,700 100,489 0.01 Deere & Co 1,500 96,461 0.01 Nike ‘B’ 2,400 92,701 0.01 EMC 4,900 92,630 0.01 Amgen 1,400 90,793 0.01 Emerson Electric 2,300 90,787 0.01 Gilead Sciences 1,600 88,440 0.01 Express Scripts Holding 2,200 88,188 0.01 Anadarko Petroleum 1,600 87,533 0.01 Mondelez International ‘A’ 4,500 85,341 0.01 Accenture ‘A’ (Ireland) (2) 1,700 84,902 0.01 News ‘A’ 4,400 82,812 0.01 National Oilwell Varco 1,600 80,222 0.01 Time Warner Cable 1,100 79,550 0.01 Yum! Brands 1,600 78,733 0.01 Boeing 1,400 78,582 0.01 Merck & Co. 2,500 76,857 0.01 Mastercard ‘A’ 200 73,414 0.01 Time Warner 2,000 71,290 0.01 Celgene 1,200 70,933 0.01 Visa ‘A’ 600 67,923 0.01 EOG Resources 700 62,908 0.01 Lowe’s Cos 2,200 58,614 0.01 Freeport-McMoRan Copper & Gold 2,300 57,834 0.01 eBay 1,500 56,917 0.01 Monsanto 800 56,784 0.01 Union Pacific 600 56,368 0.01 Biogen Idec 500 55,351 0.01 Target 1,200 53,313 0.01 Priceline.com 100 46,386 0.01 American Tower 800 46,084 0.01 Exelon 1,900 41,796 0.01 Bristol-Myers Squibb 1,600 39,576 0.01 TJX Companies 1,200 38,099 0.01 Eli Lilly & Co 1,000 36,848 0.01 Walgreen 1,200 33,460 0.00 Berkshire Hathaway ‘B’ 400 26,773 0.00 American International Group 2,100 55,537 0.01
total for United States of america 14.47
Government Bonds (continued)
equities (continued)
United States of america (continued)

Morgan Stanley Investment Funds 31 December 2012 136
Diversified Alpha Plus Fund
United Kingdom HSBC Holdings 168,713 1,341,582 0.20 Vodafone Group 504,285 957,405 0.14 Royal Dutch Shell ‘A’ 36,585 954,289 0.14 British American Tobacco 22,450 861,275 0.13 BP 162,918 850,717 0.12 GlaxoSmithKline 48,843 801,521 0.12 Royal Dutch Shell ‘B’ 28,415 759,694 0.11 BHP Billiton 24,964 653,467 0.10 Rio Tinto 14,964 645,910 0.09 Diageo 28,150 618,350 0.09 AstraZeneca 13,880 496,409 0.07 Standard Chartered 23,179 448,325 0.07 WPP (Jersey) (2) 40,282 439,699 0.06 BG Group 35,080 436,602 0.06 Unilever 14,820 431,017 0.06 Barclays 133,512 430,641 0.06 Reckitt Benckiser Group 8,801 419,646 0.06 Imperial Tobacco Group 12,682 369,928 0.05 Tesco 78,839 325,621 0.05 Anglo American 13,981 325,499 0.05 Xstrata 23,237 302,488 0.05 Rolls-Royce Holdings 26,795 287,706 0.04 Prudential 26,836 285,507 0.04 SSE 16,362 285,196 0.04 BT Group 90,465 256,988 0.04 Compass Group 25,689 228,937 0.03 Lloyds Banking Group 388,162 228,621 0.03 Experian (Jersey) (2) 17,693 213,137 0.03 Centrica 51,067 209,410 0.03 National Grid 23,217 200,629 0.03 Kingfisher 49,357 172,366 0.03 Reed Elsevier 21,175 167,105 0.02 Pearson 9,996 145,974 0.02 Tullow Oil 9,055 140,357 0.02 British Sky Broadcasting 14,579 137,453 0.02 BAE Systems 31,169 129,079 0.02 Old Mutual 56,320 123,368 0.02 Aviva 23,720 108,756 0.02 WM Morrison Supermarkets 32,703 105,724 0.02 Shire (Jersey) (2) 4,302 99,787 0.01 Marks & Spencer Group 20,274 95,274 0.01 Legal & General Group 51,516 92,201 0.01 Royal Bank of Scotland Group 22,881 91,269 0.01 Standard Life 4,829 19,713 0.00 ARM Holdings 1,655 15,624 0.00 Aggreko 716 15,314 0.00 Wolseley (Jersey) (2) 427 15,221 0.00 Next 299 13,632 0.00 Smith & Nephew 1,614 13,481 0.00 Intertek Group 350 13,333 0.00 Capita 1,334 12,380 0.00 Land Securities Group 1,199 11,990 0.00 RSA Insurance Group 7,734 11,950 0.00 Randgold Resources (Jersey) (2) 161 11,775 0.00 Intercontinental Hotels Group 560 11,750 0.00 Smiths Group 773 11,317 0.00 Whitbread 369 11,099 0.00 Carnival 370 10,724 0.00 Johnson Matthey 367 10,719 0.00 G4S 3,113 9,815 0.00 British Land 1,405 9,706 0.00 Babcock International Group 800 9,495 0.00 Resolution (Guernsey) (2) 3,104 9,443 0.00 Burberry Group 590 8,891 0.00 Associated British Foods 411 7,902 0.00
Statement of inveStmentS (continued)
transferable securities and money market instruments admitted to official exchange listing or dealt in on another regulated market. as at 31 December 2012, expressed in euro.
investments holdingsmarket
value% of net
assets
investments holdingsmarket
value% of net
assets
Weir Group 338 7,807 0.00 Serco Group 1,093 7,188 0.00 Petrofac (Jersey) (2) 359 7,162 0.00 Inmarsat 931 6,689 0.00 Hammerson 1,112 6,675 0.00 ITV 5,153 6,664 0.00 Rexam 1,215 6,512 0.00 J Sainsbury 1,483 6,291 0.00 Investec 1,033 5,380 0.00 3i Group 1,953 5,214 0.00 TUI Travel 1,461 5,073 0.00 Schroders 237 4,912 0.00 Admiral Group 343 4,891 0.00 Severn Trent 241 4,663 0.00 AMEC 374 4,611 0.00 Sage Group 1,228 4,442 0.00 Capital Shopping Centres Group 874 3,762 0.00 Segro 1,171 3,550 0.00 Man Group 3,281 3,337 0.00 Vedanta Resources 234 3,328 0.00 ICAP 862 3,253 0.00 Lonmin 289 1,010 0.00
total for United Kingdom 2.42
france Sanofi 26,945 1,923,604 0.27 Total 29,127 1,136,244 0.16 BNP Paribas 18,501 787,865 0.11 LVMH Moet Hennessy Louis Vuitton 5,133 712,460 0.10 Danone 12,996 648,565 0.10 Schneider Electric 11,498 630,435 0.09 L’Oréal 5,482 575,062 0.08 Air Liquide 5,939 564,502 0.08 Vivendi 27,373 463,972 0.08 AXA 32,993 440,457 0.06 Vinci 11,865 426,665 0.06 GDF Suez 26,221 408,392 0.06 Société Générale 13,739 389,363 0.06 European Aeronautic Defence and Space (Netherlands) (2) 12,753 376,213 0.06 Unibail-Rodamco 2,041 371,360 0.05 Compagnie Generale d’Optique Essilor International 4,786 363,832 0.05 France Telecom 41,978 350,055 0.05 Pernod-Ricard 3,853 336,906 0.05 PPR 2,325 327,476 0.05 Compagnie de Saint-Gobain 9,589 308,958 0.04 Compagnie Generale des Etablissements Michelin 4,018 287,649 0.04 Hermes International 1,040 235,352 0.03 Lafarge 4,683 225,861 0.03 Carrefour 11,564 223,706 0.03 Alstom 6,291 189,579 0.03 Renault 4,328 176,085 0.02 Bouygues 6,225 139,440 0.02 Crédit Agricole 20,434 124,320 0.02 EDF 7,742 108,233 0.02 Vallourec 2,703 106,741 0.02 Veolia Environnement 9,371 85,792 0.01 Christian Dior 100 12,825 0.00 Sodexo 183 11,661 0.00 Compagnie Générale de Géophysique-Veritas 484 10,934 0.00 AtoS 191 10,096 0.00 Technip 111 9,639 0.00 SES (Luxembourg) (2) 422 9,160 0.00 Bureau Veritas 108 9,142 0.00 Safran 236 7,692 0.00 Publicis Groupe 168 7,602 0.00 Accor 284 7,581 0.00 Groupe Eurotunnel Regd 1,234 7,207 0.00 Foncière des Regions 107 6,773 0.00 Thales 254 6,666 0.00 Legrand 203 6,471 0.00
equities (continued)
equities (continued)
United Kingdom (continued)

137 Morgan Stanley Investment Funds 31 December 2012
Diversified Alpha Plus Fund
Statement of inveStmentS (continued)
transferable securities and money market instruments admitted to official exchange listing or dealt in on another regulated market. as at 31 December 2012, expressed in euro.
investments holdingsmarket
value% of net
assets
investments holdingsmarket
value% of net
assets
Gecina 75 6,367 0.00 Société Télévision Française 1 671 5,938 0.00 Société BIC 59 5,329 0.00 STMicroelectronics (Netherlands) (2) 906 4,863 0.00 Casino Guichard Perrachon 67 4,831 0.00 JC Decaux 266 4,784 0.00 Alcatel-Lucent 4,635 4,649 0.00 Dassault Systèmes 55 4,633 0.00 Klepierre 150 4,503 0.00 Cap Gemini 133 4,370 0.00 Aeroports de Paris 72 4,203 0.00 Edenred 168 3,914 0.00 Eutelsat Communications 128 3,213 0.00 ICADE 42 2,811 0.00 Peugeot 375 2,052 0.00
total for france 1.93
Germany Siemens Regd 16,526 1,358,437 0.19 BASF 18,490 1,315,564 0.19 Bayer Regd 15,875 1,141,254 0.16 SAP 18,120 1,099,703 0.16 Allianz Regd 9,187 962,798 0.14 Daimler Regd 18,926 782,022 0.11 Deutsche Bank Regd 21,126 696,102 0.10 Muenchener Rueckversicherungs Regd 4,276 581,536 0.09 Volkswagen Pfd 3,109 535,214 0.08 Linde 4,026 531,432 0.08 E.ON 36,816 518,737 0.08 Deutsche Telekom Regd 60,150 516,989 0.07 Bayerische Motoren Werke 7,025 512,333 0.07 Deutsche Boerse 6,918 319,681 0.05 Adidas 4,604 309,987 0.04 Deutsche Post Regd 18,499 307,083 0.04 RWE 8,720 272,413 0.04 Henkel & Co Pfd 3,890 241,958 0.03 Fresenius Medical Care & Co 4,416 231,001 0.03 HeidelbergCement 3,269 149,818 0.02 Infineon Technologies 23,700 145,257 0.02 ThyssenKrupp 5,904 104,855 0.02 K+S Regd 2,897 101,395 0.01 Metro 2,817 59,157 0.01 Fresenius & Co. 170 14,807 0.00 Continental 136 11,912 0.00 Lanxess 155 10,272 0.00 Merck 96 9,584 0.00 Deutsche Lufthansa Regd 624 8,886 0.00 Volkswagen 49 7,975 0.00 Beiersdorf 127 7,859 0.00 Porsche Automobil Holding Pfd 109 6,725 0.00 TUI 823 6,460 0.00 Qiagen (Netherlands) (2) 462 6,352 0.00 Celesio 482 6,288 0.00 Henkel & Co 116 6,024 0.00 Fraport Frankfurt Airport Services Worldwide 131 5,755 0.00 ProSiebenSat.1 Media Pfd 220 4,686 0.00 Commerzbank 3,267 4,685 0.00 Kabel Deutschland Holding 76 4,299 0.00 Suedzucker 117 3,626 0.00 Salzgitter 72 2,839 0.00 Axel Springer 59 1,905 0.00
total for Germany 1.83
Japan Toyota Motor 10,900 380,081 0.06 Sumitomo Mitsui Financial Group 8,100 219,823 0.03 Honda Motor 6,400 174,916 0.03 Tokio Marine Holdings 7,300 151,293 0.02 Takeda Pharmaceutical 4,000 134,747 0.02 Canon 4,500 130,556 0.02 Nippon Steel & Sumitomo Metal 68,170 124,494 0.02 Mizuho Financial Group 87,900 120,297 0.02 Sumitomo Electric Industries 13,700 117,688 0.02 Mitsubishi Estate 6,000 107,139 0.02 KDDI 1,900 101,132 0.02 Hitachi 23,000 100,927 0.02 Sumitomo Realty & Development 4,000 99,225 0.02 Nippon Telegraph & Telephone 3,100 98,435 0.02 Fanuc 700 97,002 0.02 Softbank 3,500 95,758 0.02 Seven & I Holdings 4,300 91,673 0.02 Mitsui Fudosan 5,000 90,994 0.02 Mitsubishi Heavy Industries 25,000 90,433 0.02 Japan Tobacco 4,200 89,622 0.02 Denso 3,400 87,923 0.02 NTT DoCoMo 81 87,795 0.02 Kubota 10,000 85,951 0.02 Astellas Pharma 2,500 84,676 0.02 East Japan Railway 1,700 82,919 0.01 Komatsu 4,200 79,699 0.01 Nissan Motor 10,600 74,751 0.01 Mitsui & Co. 6,500 72,644 0.01 Osaka Gas 25,000 68,660 0.01 Asahi Kasei 15,000 66,307 0.01 Mitsubishi Electric 10,000 63,683 0.01 Suzuki Motor 3,200 62,511 0.01 Nomura Holdings 14,300 62,447 0.01 Daiwa Securities Group 15,000 61,918 0.01 Central Japan Railway 1,000 61,188 0.01 Mitsubishi 4,100 58,793 0.01 Dai Nippon Printing 10,000 58,686 0.01 Toshiba 19,000 55,597 0.01 Shin-Etsu Chemical 1,200 54,661 0.01 Bridgestone 2,800 54,263 0.01 SMC 400 54,226 0.01 Kyocera 800 54,148 0.01 Aeon 6,200 53,508 0.01 Murata Manufacturing 1,200 52,763 0.01 Toray Industries 11,000 50,478 0.01 Sumitomo Mitsui Trust Holdings 18,860 49,440 0.01 Keyence 220 45,835 0.01 Secom 1,200 45,396 0.01 Tokyo Gas 13,000 44,907 0.01 Kirin Holdings 5,000 44,196 0.01 Kyushu Electric Power 5,100 43,783 0.01 Kao 2,100 41,314 0.01 NEC 26,000 41,067 0.01 Tohoku Electric Power 5,800 40,697 0.01 Panasonic 8,900 40,447 0.01 Daiichi Sankyo 3,500 40,413 0.01 Nintendo 500 39,991 0.01 FUJIFILM Holdings 2,600 38,982 0.01 Itochu 4,900 38,752 0.01 Daiwa House Industry 3,000 38,710 0.01 Fast Retailing 200 38,159 0.01 Eisai 1,200 37,734 0.01 Sony 4,400 36,669 0.01 Oriental Land 400 36,657 0.01 JX Holdings 8,610 36,240 0.01 Fujitsu 11,000 34,488 0.00 MS&AD Insurance Group Holdings 2,300 34,091 0.00 Kintetsu 11,000 34,035 0.00 Asahi Group Holdings 2,100 33,726 0.00 Terumo 1,100 32,621 0.00 Sumitomo 3,400 32,589 0.00 Marubeni 6,000 32,084 0.00
equities (continued)
france (continued)
equities (continued)
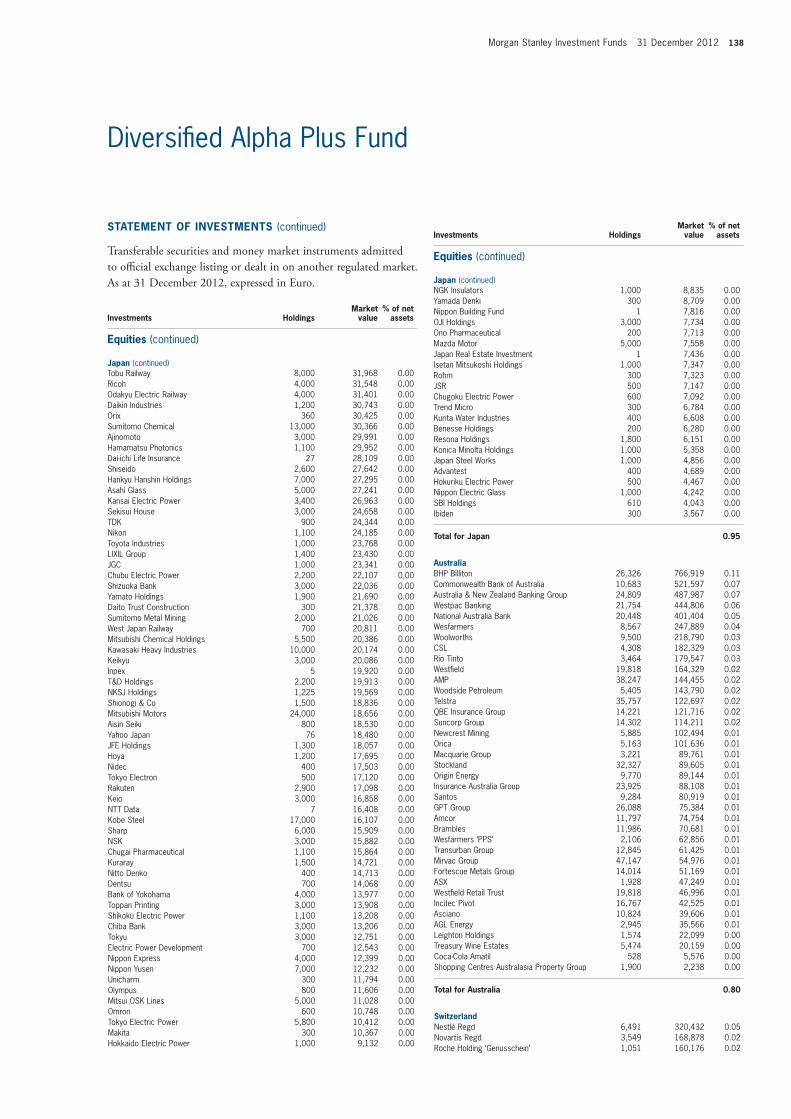
Morgan Stanley Investment Funds 31 December 2012 138
Diversified Alpha Plus Fund
Statement of inveStmentS (continued)
transferable securities and money market instruments admitted to official exchange listing or dealt in on another regulated market. as at 31 December 2012, expressed in euro.
investments holdingsmarket
value% of net
assets
Tobu Railway 8,000 31,968 0.00 Ricoh 4,000 31,548 0.00 Odakyu Electric Railway 4,000 31,401 0.00 Daikin Industries 1,200 30,743 0.00 Orix 360 30,425 0.00 Sumitomo Chemical 13,000 30,366 0.00 Ajinomoto 3,000 29,991 0.00 Hamamatsu Photonics 1,100 29,952 0.00 Dai-ichi Life Insurance 27 28,109 0.00 Shiseido 2,600 27,642 0.00 Hankyu Hanshin Holdings 7,000 27,295 0.00 Asahi Glass 5,000 27,241 0.00 Kansai Electric Power 3,400 26,963 0.00 Sekisui House 3,000 24,658 0.00 TDK 900 24,344 0.00 Nikon 1,100 24,185 0.00 Toyota Industries 1,000 23,768 0.00 LIXIL Group 1,400 23,430 0.00 JGC 1,000 23,341 0.00 Chubu Electric Power 2,200 22,107 0.00 Shizuoka Bank 3,000 22,036 0.00 Yamato Holdings 1,900 21,690 0.00 Daito Trust Construction 300 21,378 0.00 Sumitomo Metal Mining 2,000 21,026 0.00 West Japan Railway 700 20,811 0.00 Mitsubishi Chemical Holdings 5,500 20,386 0.00 Kawasaki Heavy Industries 10,000 20,174 0.00 Keikyu 3,000 20,086 0.00 Inpex 5 19,920 0.00 T&D Holdings 2,200 19,913 0.00 NKSJ Holdings 1,225 19,569 0.00 Shionogi & Co 1,500 18,836 0.00 Mitsubishi Motors 24,000 18,656 0.00 Aisin Seiki 800 18,530 0.00 Yahoo Japan 76 18,480 0.00 JFE Holdings 1,300 18,057 0.00 Hoya 1,200 17,695 0.00 Nidec 400 17,503 0.00 Tokyo Electron 500 17,120 0.00 Rakuten 2,900 17,098 0.00 Keio 3,000 16,858 0.00 NTT Data 7 16,408 0.00 Kobe Steel 17,000 16,107 0.00 Sharp 6,000 15,909 0.00 NSK 3,000 15,882 0.00 Chugai Pharmaceutical 1,100 15,864 0.00 Kuraray 1,500 14,721 0.00 Nitto Denko 400 14,713 0.00 Dentsu 700 14,068 0.00 Bank of Yokohama 4,000 13,977 0.00 Toppan Printing 3,000 13,908 0.00 Shikoku Electric Power 1,100 13,208 0.00 Chiba Bank 3,000 13,206 0.00 Tokyu 3,000 12,751 0.00 Electric Power Development 700 12,543 0.00 Nippon Express 4,000 12,399 0.00 Nippon Yusen 7,000 12,232 0.00 Unicharm 300 11,794 0.00 Olympus 800 11,606 0.00 Mitsui OSK Lines 5,000 11,028 0.00 Omron 600 10,748 0.00 Tokyo Electric Power 5,800 10,412 0.00 Makita 300 10,367 0.00 Hokkaido Electric Power 1,000 9,132 0.00
investments holdingsmarket
value% of net
assets
NGK Insulators 1,000 8,835 0.00 Yamada Denki 300 8,709 0.00 Nippon Building Fund 1 7,816 0.00 OJI Holdings 3,000 7,734 0.00 Ono Pharmaceutical 200 7,713 0.00 Mazda Motor 5,000 7,558 0.00 Japan Real Estate Investment 1 7,436 0.00 Isetan Mitsukoshi Holdings 1,000 7,347 0.00 Rohm 300 7,323 0.00 JSR 500 7,147 0.00 Chugoku Electric Power 600 7,092 0.00 Trend Micro 300 6,784 0.00 Kurita Water Industries 400 6,608 0.00 Benesse Holdings 200 6,280 0.00 Resona Holdings 1,800 6,151 0.00 Konica Minolta Holdings 1,000 5,358 0.00 Japan Steel Works 1,000 4,856 0.00 Advantest 400 4,689 0.00 Hokuriku Electric Power 500 4,467 0.00 Nippon Electric Glass 1,000 4,242 0.00 SBI Holdings 610 4,043 0.00 Ibiden 300 3,567 0.00
total for Japan 0.95
australia BHP Billiton 26,326 766,919 0.11 Commonwealth Bank of Australia 10,683 521,597 0.07 Australia & New Zealand Banking Group 24,809 487,987 0.07 Westpac Banking 21,754 444,806 0.06 National Australia Bank 20,448 401,404 0.05 Wesfarmers 8,567 247,889 0.04 Woolworths 9,500 218,790 0.03 CSL 4,308 182,329 0.03 Rio Tinto 3,464 179,547 0.03 Westfield 19,818 164,329 0.02 AMP 38,247 144,455 0.02 Woodside Petroleum 5,405 143,790 0.02 Telstra 35,757 122,697 0.02 QBE Insurance Group 14,221 121,716 0.02 Suncorp Group 14,302 114,211 0.02 Newcrest Mining 5,885 102,494 0.01 Orica 5,163 101,636 0.01 Macquarie Group 3,221 89,761 0.01 Stockland 32,327 89,605 0.01 Origin Energy 9,770 89,144 0.01 Insurance Australia Group 23,925 88,108 0.01 Santos 9,284 80,919 0.01 GPT Group 26,088 75,384 0.01 Amcor 11,797 74,754 0.01 Brambles 11,986 70,681 0.01 Wesfarmers ‘PPS’ 2,106 62,856 0.01 Transurban Group 12,845 61,425 0.01 Mirvac Group 47,147 54,976 0.01 Fortescue Metals Group 14,014 51,169 0.01 ASX 1,928 47,249 0.01 Westfield Retail Trust 19,818 46,996 0.01 Incitec Pivot 16,767 42,525 0.01 Asciano 10,824 39,606 0.01 AGL Energy 2,945 35,566 0.01 Leighton Holdings 1,574 22,099 0.00 Treasury Wine Estates 5,474 20,159 0.00 Coca-Cola Amatil 528 5,576 0.00 Shopping Centres Australasia Property Group 1,900 2,238 0.00
total for australia 0.80
SwitzerlandNestlé Regd 6,491 320,432 0.05 Novartis Regd 3,549 168,878 0.02 Roche Holding ‘Genusschein’ 1,051 160,176 0.02
equities (continued)
Japan (continued)
equities (continued)
Japan (continued)
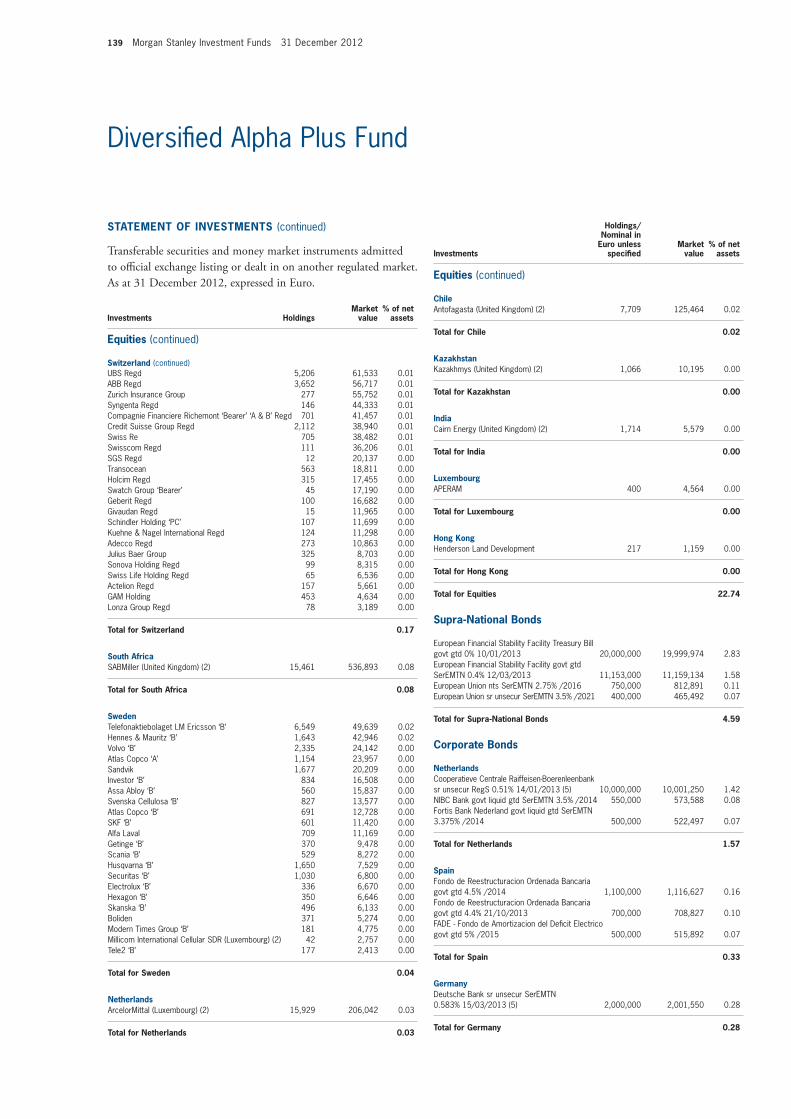
139 Morgan Stanley Investment Funds 31 December 2012
Diversified Alpha Plus Fund
Statement of inveStmentS (continued)
transferable securities and money market instruments admitted to official exchange listing or dealt in on another regulated market. as at 31 December 2012, expressed in euro.
investments holdingsmarket
value% of net
assets
investments
holdings/nominal in
euro unless specified
market value
% of net assets
UBS Regd 5,206 61,533 0.01 ABB Regd 3,652 56,717 0.01 Zurich Insurance Group 277 55,752 0.01 Syngenta Regd 146 44,333 0.01 Compagnie Financiere Richemont ‘Bearer’ ‘A & B’ Regd 701 41,457 0.01 Credit Suisse Group Regd 2,112 38,940 0.01 Swiss Re 705 38,482 0.01 Swisscom Regd 111 36,206 0.01 SGS Regd 12 20,137 0.00 Transocean 563 18,811 0.00 Holcim Regd 315 17,455 0.00 Swatch Group ‘Bearer’ 45 17,190 0.00 Geberit Regd 100 16,682 0.00 Givaudan Regd 15 11,965 0.00 Schindler Holding ‘PC’ 107 11,699 0.00 Kuehne & Nagel International Regd 124 11,298 0.00 Adecco Regd 273 10,863 0.00 Julius Baer Group 325 8,703 0.00 Sonova Holding Regd 99 8,315 0.00 Swiss Life Holding Regd 65 6,536 0.00 Actelion Regd 157 5,661 0.00 GAM Holding 453 4,634 0.00 Lonza Group Regd 78 3,189 0.00
total for Switzerland 0.17
South africaSABMiller (United Kingdom) (2) 15,461 536,893 0.08
total for South africa 0.08
SwedenTelefonaktiebolaget LM Ericsson ‘B’ 6,549 49,639 0.02 Hennes & Mauritz ‘B’ 1,643 42,946 0.02 Volvo ‘B’ 2,335 24,142 0.00 Atlas Copco ‘A’ 1,154 23,957 0.00 Sandvik 1,677 20,209 0.00 Investor ‘B’ 834 16,508 0.00 Assa Abloy ‘B’ 560 15,837 0.00 Svenska Cellulosa ‘B’ 827 13,577 0.00 Atlas Copco ‘B’ 691 12,728 0.00 SKF ‘B’ 601 11,420 0.00 Alfa Laval 709 11,169 0.00 Getinge ‘B’ 370 9,478 0.00 Scania ‘B’ 529 8,272 0.00 Husqvarna ‘B’ 1,650 7,529 0.00 Securitas ‘B’ 1,030 6,800 0.00 Electrolux ‘B’ 336 6,670 0.00 Hexagon ‘B’ 350 6,646 0.00 Skanska ‘B’ 496 6,133 0.00 Boliden 371 5,274 0.00 Modern Times Group ‘B’ 181 4,775 0.00 Millicom International Cellular SDR (Luxembourg) (2) 42 2,757 0.00 Tele2 ‘B’ 177 2,413 0.00
total for Sweden 0.04
netherlandsArcelorMittal (Luxembourg) (2) 15,929 206,042 0.03
total for netherlands 0.03
ChileAntofagasta (United Kingdom) (2) 7,709 125,464 0.02
total for Chile 0.02
KazakhstanKazakhmys (United Kingdom) (2) 1,066 10,195 0.00
total for Kazakhstan 0.00
indiaCairn Energy (United Kingdom) (2) 1,714 5,579 0.00
total for india 0.00
LuxembourgAPERAM 400 4,564 0.00
total for Luxembourg 0.00
hong KongHenderson Land Development 217 1,159 0.00
total for hong Kong 0.00
total for equities 22.74
Supra-national Bonds
European Financial Stability Facility Treasury Bill govt gtd 0% 10/01/2013 20,000,000 19,999,974 2.83 European Financial Stability Facility govt gtd SerEMTN 0.4% 12/03/2013 11,153,000 11,159,134 1.58 European Union nts SerEMTN 2.75% /2016 750,000 812,891 0.11 European Union sr unsecur SerEMTN 3.5% /2021 400,000 465,492 0.07
total for Supra-national Bonds 4.59
Corporate Bonds
netherlandsCooperatieve Centrale Raiffeisen-Boerenleenbank sr unsecur RegS 0.51% 14/01/2013 (5) 10,000,000 10,001,250 1.42 NIBC Bank govt liquid gtd SerEMTN 3.5% /2014 550,000 573,588 0.08 Fortis Bank Nederland govt liquid gtd SerEMTN 3.375% /2014 500,000 522,497 0.07
total for netherlands 1.57
SpainFondo de Reestructuracion Ordenada Bancaria govt gtd 4.5% /2014 1,100,000 1,116,627 0.16 Fondo de Reestructuracion Ordenada Bancaria govt gtd 4.4% 21/10/2013 700,000 708,827 0.10 FADE - Fondo de Amortizacion del Deficit Electrico govt gtd 5% /2015 500,000 515,892 0.07
total for Spain 0.33
GermanyDeutsche Bank sr unsecur SerEMTN 0.583% 15/03/2013 (5) 2,000,000 2,001,550 0.28
total for Germany 0.28
equities (continued)
Switzerland (continued)
equities (continued)

Morgan Stanley Investment Funds 31 December 2012 140
Diversified Alpha Plus Fund
Statement of inveStmentS (continued)
transferable securities and money market instruments admitted to official exchange listing or dealt in on another regulated market. as at 31 December 2012, expressed in euro.
investments
holdings/nominal in
euro unless specified
market value
% of net assets
franceDexia Credit Local govt liquid gtd SerEMTN 2.625% /2014 1,500,000 1,530,197 0.22
total for france 0.22
SwedenSwedbank govt liquid gtd 3.375% /2014 500,000 522,597 0.08
total for Sweden 0.08
total for Corporate Bonds 2.48
Commercial Paper
SwedenNordea Bank 0% 04/01/2013 7,000,000 6,999,739 0.99
total for Sweden 0.99
irelandGE Capital European Funding 0% 04/01/2013 6,000,000 5,999,716 0.85
total for ireland 0.85
norwayDNB Bank 0% 16/01/2013 3,500,000 3,499,985 0.50
total for norway 0.50
total for Commercial Paper 2.34
Certificates of Deposit
irelandWells Fargo Bank 0.03% 23/01/2013 8,500,000 8,500,000 1.20
total for ireland 1.20
SwedenSvenska Handelsbanken 0.2% 25/01/2013 1,500,000 1,500,005 0.22
total for Sweden 0.22
total for Certificates of Deposit 1.42
mutual funds
Morgan Stanley Funds plc - Euro Liquidity Fund (Ireland) (2) (4) 5,272,019 5,272,019 0.75 iShares iBoxx Investment Grade Corporate Bond Fund (United States of America) (2) 9,400 863,111 0.11
total for mutual funds 0.86
total for transferable securities and money market instruments admitted to official exchange listing or dealt in on another regulated market 563,872,575 79.89
Other transferable securities and money market instruments not admitted to official exchange listing or dealt in on another regulated market. as at 31 December 2012, expressed in euro.
investments holdingsmarket
value% of net
assets equities
United KingdomRolls-Royce Holdings Pfd ‘C’ (3) 685,976 843 0.00
total for United Kingdom 0.00
total for equities 0.00
total for other transferable securities and money market instruments not admitted to official exchange listing or dealt in on another regulated market 843 0.00
total investment Securities 563,873,418 79.89
DerivativeS
OtC and exchange traded derivatives as at 31 December 2012, expressed in euro.
futures Contracts
Descriptionmaturity
datenumber of contracts
notional commitments Counterparty
net unrealised gain/(loss) as at
31 December 2012
% of net assets
AMX Index Future 01/2013 11 754,820 Goldman Sachs 1,210 0.00CAC40 10 Euro Future 01/2013 1,134 41,300,280 Goldman Sachs 236,051 0.03DAX Index Future 03/2013 401 76,375,463 Goldman Sachs 279,444 0.04FTSE 100 Index Future 03/2013 (18) (1,293,932) Goldman Sachs 8,629 0.00FTSE China A50 Future 01/2013 5,864 36,951,368 Goldman Sachs 1,903,201 0.27IBEX 35 Index Future 01/2013 503 40,597,130 Goldman Sachs 395,152 0.06MINI MSCI Emerging Markets Index Future 03/2013 618 24,870,909 Goldman Sachs 352,085 0.05S&P 500 EMINI Future 03/2013 (4,255) (225,596,152) Goldman Sachs 1,616,435 0.23S&P MIB Index Future 03/2013 525 42,798,000 Goldman Sachs 170,004 0.03US 2yr T-note Future 03/2013 2 333,580 Goldman Sachs 189 0.00US 10yr T-note Future 03/2013 (21) (2,108,352) Goldman Sachs 1,942 0.00Yen Nikkei 225 Index Future 03/2013 841 38,318,772 Goldman Sachs 3,126,210 0.44
Unrealised Gain on futures Contracts 8,090,552 1.15
Australia 10 Year Bond Future 03/2013 896 86,761,554 Goldman Sachs (470,106) (0.07)Canada 10 Year Bond Future 03/2013 40 4,115,781 Goldman Sachs (3,951) 0.00DJ Euro Stoxx 50 Index Future 03/2013 771 20,161,650 Goldman Sachs (55,898) (0.01)Euro Bund Future 03/2013 (640) (93,209,600) Goldman Sachs (519,008) (0.07)Euro Bund Future 03/2013 (13) (1,893,321) Goldman Sachs (12,350) (0.01)Euro SCHATZ Future 03/2013 (26) (2,882,230) Goldman Sachs (2,521) 0.00Long Gilt Future 03/2013 (5) (730,897) Goldman Sachs (1,007) 0.00SPI 200 Future 03/2013 (30) (2,718,429) Goldman Sachs (11,190) 0.00US 5yr T-note Future 03/2013 198 18,624,332 Goldman Sachs (9,828) 0.00
Unrealised Loss on futures Contracts (1,085,859) (0.16)
net Unrealised Gain on futures Contracts 101,530,7261 7,004,693 0.99
1 Cash of EUR 42,925,340 held as collateral by the counterparty.1 Cash of EUR 85 paid as collateral to the counterparty.
Corporate Bonds (continued)

141 Morgan Stanley Investment Funds 31 December 2012
Diversified Alpha Plus Fund
forward foreign Currency exchange Contracts
maturity date
amount bought Ccy
amount sold Ccy Counterparty
Unrealised gain/(loss)
eUr% of net
assets
08/01/2013 2,208,328 CAD 1,677,334 EUR Goldman Sachs 422 0.00 08/01/2013 1,710,565 EUR 2,205,000 CAD RBC 35,337 0.01 10/01/2013 1,451,110 EUR 1,800,000 AUD Commonwealth Bank 38,684 0.01 11/01/2013 5,650,944 PLN 1,384,333 EUR Goldman Sachs 67 0.00 15/01/2013 127,266 NOK 17,222 EUR Goldman Sachs 83 0.00 15/01/2013 6,165,715 SEK 716,032 EUR Goldman Sachs 1,542 0.00 16/01/2013 6,797,455 EUR 8,897,250 USD HSBC 67,821 0.01 16/01/2013 6,797,268 EUR 8,897,250 USD J.P. Morgan 67,634 0.01 16/01/2013 6,800,437 EUR 8,897,250 USD State Street 70,803 0.01 16/01/2013 6,798,592 EUR 8,897,250 USD Westpac Bank 68,959 0.01 16/01/2013 35,591,697 USD 26,917,728 EUR Goldman Sachs 2,847 0.00 17/01/2013 1,714,135 BRL 624,897 EUR State Street 7,077 0.00 17/01/2013 15,505,027 BRL 7,422,580 USD State Street 102,264 0.01 17/01/2013 1,415,733 EUR 1,805,278 AUD State Street 74 0.00 17/01/2013 5,265,485 EUR 4,275,000 GBP RBC 11,480 0.00 17/01/2013 1,732,552 EUR 1,409,552 GBP State Street 202 0.00 17/01/2013 1,530,449 EUR 2,018,928 USD Goldman Sachs 3,402 0.00 17/01/2013 23,192,124 EUR 30,653,726 USD State Street 6,707 0.00 17/01/2013 170,723,423 EUR 225,652,319 USD UBS 47,820 0.01 17/01/2013 4,274,969 GBP 5,222,484 EUR Goldman Sachs 31,482 0.00 17/01/2013 7,406,174 GBP 12,032,293 USD Deutsche Bank 1,430 0.00 17/01/2013 15,093,804,315 KRW 14,023,138 USD RBS 92,349 0.01 17/01/2013 36,435,234 SEK 4,171,135 EUR State Street 68,952 0.01 17/01/2013 48,307,101 SEK 7,309,512 USD State Street 92,993 0.01 17/01/2013 6,761,073 USD 6,428,483 AUD Deutsche Bank 72,767 0.01 17/01/2013 44,763,758 USD 42,565,199 AUD Mellon Bank 479,063 0.07 17/01/2013 45,069,134 USD 42,847,899 AUD State Street 488,352 0.07 17/01/2013 84,884,098 USD 83,623,993 CAD Bank of America 688,709 0.09 17/01/2013 310,085 USD 282,990 CHF UBS 101 0.00 17/01/2013 4,428,137 USD 371,795,225 JPY State Street 93,138 0.01 17/01/2013 5,510,236 USD 462,643,285 JPY UBS 115,960 0.02 22/01/2013 4,627,993 EUR 498,750,000 JPY Commonwealth Bank 260,007 0.04 22/01/2013 4,623,908 EUR 498,750,000 JPY HSBC 255,922 0.04 22/01/2013 4,622,593 EUR 498,750,000 JPY State Street 254,606 0.04 22/01/2013 4,624,461 EUR 498,750,000 JPY Westpac Bank 256,475 0.04 22/01/2013 362,140 USD 30,000,000 JPY State Street 11,161 0.00
Unrealised Gain on forward foreign Currency exchange Contracts 3,796,692 0.54
eUr hedged Share Class 11/01/2013 47,053,871 USD 35,562,378 EUR J.P. Morgan 29,508 0.00
GBP hedged Share Class 11/01/2013 97,335,635 GBP 119,547,272 EUR J.P. Morgan 87,787 0.02
Unrealised Gain on nav hedged Share Classes forward foreign Currency exchange Contracts 117,295 0.02
total Unrealised Gain on forward foreign Currency exchange Contracts 3,913,987 0.56
10/01/2013 1,805,278 AUD 1,416,649 EUR Goldman Sachs (81) 0.00 11/01/2013 1,374,689 EUR 5,655,000 PLN Deutsche Bank (10,705) 0.00 15/01/2013 18,338 EUR 135,000 NOK Deutsche Bank (19) 0.00 15/01/2013 714,913 EUR 6,185,000 SEK Deutsche Bank (4,905) 0.00 17/01/2013 10,892,036 CHF 9,029,001 EUR State Street (5,735) 0.00 17/01/2013 7,166,389 DKK 1,270,198 USD J.P. Morgan (74) 0.00 17/01/2013 1,676,852 EUR 2,208,328 CAD State Street (433) 0.00 17/01/2013 5,222,555 EUR 4,274,969 GBP State Street (31,412) 0.00 17/01/2013 12,295,975 EUR 17,386,508,979 KRW Deutsche Bank (28,132) 0.00 17/01/2013 17,219 EUR 127,266 NOK State Street (85) 0.00 17/01/2013 1,383,260 EUR 5,650,944 PLN State Street (112) 0.00 17/01/2013 715,934 EUR 6,165,715 SEK State Street (1,590) 0.00 17/01/2013 26,907,888 EUR 35,580,300 USD State Street (3,820) 0.00 17/01/2013 65,088,624 JPY 586,512 EUR State Street (16,472) 0.00
DerivativeS (continued)
OtC and exchange traded derivatives as at 31 December 2012, expressed in euro.
forward foreign Currency exchange Contracts (continued)
maturity date
amount bought Ccy
amount sold Ccy Counterparty
Unrealised gain/(loss)
eUr% of net
assets
17/01/2013 152,059,520 JPY 1,370,264 EUR Goldman Sachs (38,539) (0.01)17/01/2013 24,584,798 USD 18,602,158 EUR Deutsche Bank (7,068) 0.00 17/01/2013 3,466,958 USD 2,628,913 EUR State Street (6,626) 0.00 17/01/2013 5,565,940 USD 4,210,083 EUR Goldman Sachs (198) 0.00 17/01/2013 1,409,686 USD 4,372,223 PLN UBS (4,099) 0.00 17/01/2013 8,292,707 USD 54,807,164 SEK UBS (105,772) (0.02)22/01/2013 8,618 EUR 11,397 USD Goldman Sachs (1) 0.00 12/08/2013 521,260,635 CNY 82,752,919 USD J.P. Morgan (168,502) (0.02)12/08/2013 80,973,635 USD 521,260,635 CNY J.P. Morgan (1,174,509) (0.18)
Unrealised Loss on forward foreign Currency exchange Contracts (1,608,889) (0.23)
eUr hedged Share Class 11/01/2013 3,954,940 USD 3,001,822 EUR J.P. Morgan (10,277) 0.00
GBP hedged Share Class 11/01/2013 190,011 GBP 233,738 EUR J.P. Morgan (195) 0.00
Unrealised Loss on nav hedged Share Classes forward foreign Currency exchange Contracts (10,472) 0.00
total Unrealised Loss on forward foreign Currency exchange Contracts (1,619,361) (0.23)
net Unrealised Gain on forward foreign Currency exchange Contracts 2,294,626 0.33
total return Swap Contracts
Description Currencynotional amount Counterparty
maturity date
net unrealised gain/(loss) as at
31 December 2012
% of net assets
Equity Swap AUJPHAUMBK.I Nov 13 AUD 80,782,885 J.P. Morgan 05/11/2013 (3,663,685) (0.52)Equity Swap USNDRUFB&T.I Aug 13 USD 31,757,014 J.P. Morgan 21/08/2013 (619,185) (0.09)Equity Swap USNDRUFB&T.I Aug 13 USD 4,658,368 J.P. Morgan 26/08/2013 (90,827) (0.01)Equity Swap USNDRUHRL.I Aug 13 USD 3,650,813 J.P. Morgan 21/08/2013 (142,252) (0.02)
net Unrealised Loss on total return Swap Contracts (4,515,949) (0.64)
Cash of EUR 4,115,000 held as collateral by the counterparties in relation to the above OTC contracts.Cash of EUR 500,000 paid as collateral by the counterparty in relation to the above OTC contracts.
total Derivatives 4,783,370 0.68
other assets less Liabilities 137,114,903 19.43
total net asset value 705,771,691 100.00
(2) The country in brackets represents the country of incorporation of this security.(3) These securities are valued at their fair value. See note 2(a) within the Notes to the Financial
Statements.(4) Managed by the Investment Adviser or an affiliate.
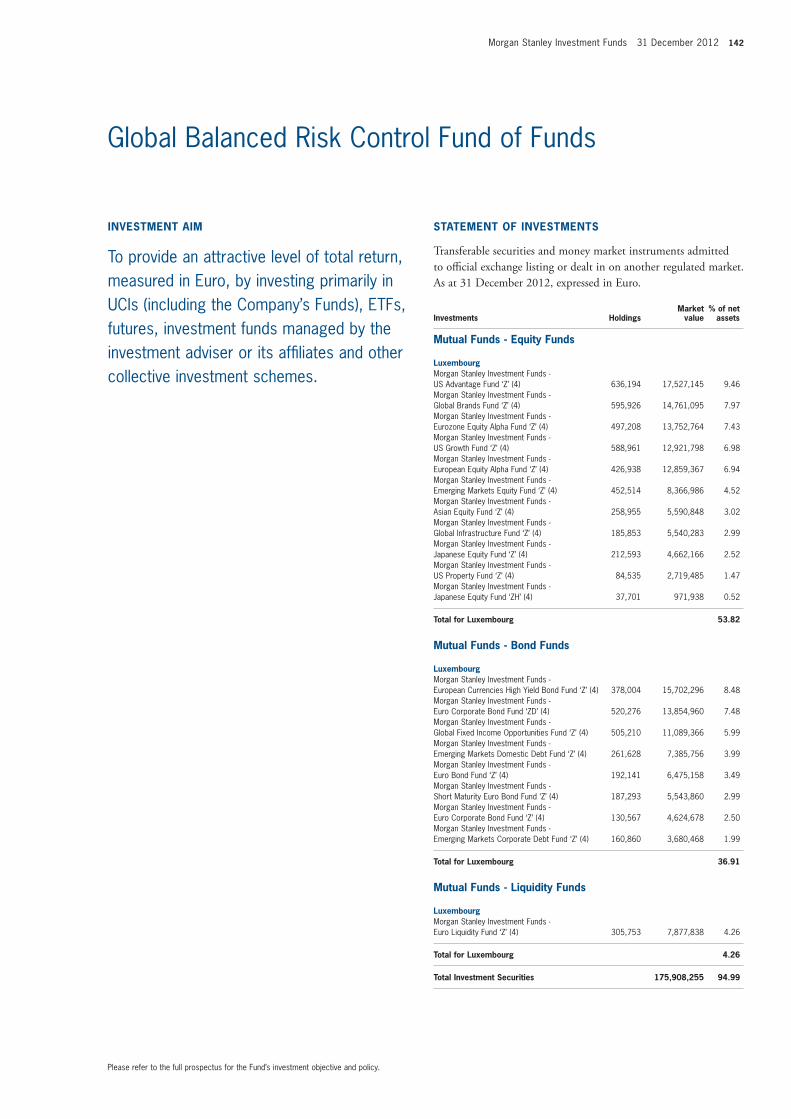
Morgan Stanley Investment Funds 31 December 2012 142
Please refer to the full prospectus for the Fund’s investment objective and policy.
Global Balanced Risk Control Fund of Funds
inveStment aim
To provide an attractive level of total return, measured in Euro, by investing primarily in UCIs (including the Company’s Funds), ETFs, futures, investment funds managed by the investment adviser or its affiliates and other collective investment schemes.
Statement of inveStmentS
transferable securities and money market instruments admitted to official exchange listing or dealt in on another regulated market. as at 31 December 2012, expressed in euro.
investments
holdingsmarket
value% of net
assets mutual funds - equity funds
Luxembourg Morgan Stanley Investment Funds - US Advantage Fund ‘Z’ (4) 636,194 17,527,145 9.46Morgan Stanley Investment Funds - Global Brands Fund ‘Z’ (4) 595,926 14,761,095 7.97Morgan Stanley Investment Funds - Eurozone Equity Alpha Fund ‘Z’ (4) 497,208 13,752,764 7.43Morgan Stanley Investment Funds - US Growth Fund ‘Z’ (4) 588,961 12,921,798 6.98Morgan Stanley Investment Funds - European Equity Alpha Fund ‘Z’ (4) 426,938 12,859,367 6.94Morgan Stanley Investment Funds - Emerging Markets Equity Fund ‘Z’ (4) 452,514 8,366,986 4.52Morgan Stanley Investment Funds - Asian Equity Fund ‘Z’ (4) 258,955 5,590,848 3.02Morgan Stanley Investment Funds - Global Infrastructure Fund ‘Z’ (4) 185,853 5,540,283 2.99Morgan Stanley Investment Funds - Japanese Equity Fund ‘Z’ (4) 212,593 4,662,166 2.52Morgan Stanley Investment Funds - US Property Fund ‘Z’ (4) 84,535 2,719,485 1.47Morgan Stanley Investment Funds - Japanese Equity Fund ‘ZH’ (4) 37,701 971,938 0.52
total for Luxembourg 53.82
mutual funds - Bond funds
Luxembourg Morgan Stanley Investment Funds - European Currencies High Yield Bond Fund ‘Z’ (4) 378,004 15,702,296 8.48Morgan Stanley Investment Funds - Euro Corporate Bond Fund ‘ZD’ (4) 520,276 13,854,960 7.48Morgan Stanley Investment Funds - Global Fixed Income Opportunities Fund ‘Z’ (4) 505,210 11,089,366 5.99Morgan Stanley Investment Funds - Emerging Markets Domestic Debt Fund ‘Z’ (4) 261,628 7,385,756 3.99Morgan Stanley Investment Funds - Euro Bond Fund ‘Z’ (4) 192,141 6,475,158 3.49Morgan Stanley Investment Funds - Short Maturity Euro Bond Fund ‘Z’ (4) 187,293 5,543,860 2.99Morgan Stanley Investment Funds - Euro Corporate Bond Fund ‘Z’ (4) 130,567 4,624,678 2.50Morgan Stanley Investment Funds - Emerging Markets Corporate Debt Fund ‘Z’ (4) 160,860 3,680,468 1.99
total for Luxembourg 36.91
mutual funds - Liquidity funds
Luxembourg Morgan Stanley Investment Funds - Euro Liquidity Fund ‘Z’ (4) 305,753 7,877,838 4.26
total for Luxembourg 4.26
total investment Securities 175,908,255 94.99

143 Morgan Stanley Investment Funds 31 December 2012
Global Balanced Risk Control Fund of Funds
DerivativeS
OtC and exchange traded derivatives as at 31 December 2012, expressed in euro.
futures Contracts
Descriptionmaturity
datenumber of contracts
notional commitments Counterparty
net unrealised gain/(loss) as at
31 December 2012
% of net assets
Nikkei 225 Index Future 03/2013 61 2,775,878 Goldman Sachs 197,723 0.11S&P 500 EMINI Future 03/2013 (268) (14,229,369) Goldman Sachs 386,981 0.21
Unrealised Gain on futures Contracts 584,704 0.32
DJ Euro Stoxx 50 Index Future 03/2013 34 889,100 Goldman Sachs (13,260) (0.01)
Unrealised Loss on futures Contracts (13,260) (0.01)
net Unrealised Gain on futures Contracts (10,564,391)1 571,444 0.31
1 Cash of EUR 735,428 held as collateral by the counterparty.1 Cash of EUR 72 paid as collateral to the counterparty.
total Derivatives 571,444 0.31
other assets less Liabilities 8,713,231 4.70
total net asset value 185,192,930 100.00
(4) Managed by the Investment Adviser or an affiliate.

Morgan Stanley Investment Funds 31 December 2012 144
Please refer to the full prospectus for the Fund’s investment objective and policy.
Absolute Return Currency Fund
inveStment aim
To seek to generate a risk managed return, measured in Euro, that has a low level of correlation to other asset classes by investing in currency pairs. The Fund seeks to outperform the Euro OverNight Index Average (EONIA) by an amount proportional to estimated ex-ante Value at Risk (VaR) of the Fund over a 1-2 year period.
Statement of inveStmentS
transferable securities and money market instruments admitted to official exchange listing or dealt in on another regulated market. as at 31 December 2012, expressed in euro.
investments holdingsmarket
value% of net
assets mutual fund
Morgan Stanley Funds plc - Euro Liquidity Fund (Ireland) (2) (4) 923,840 923,840 4.63
total for mutual fund 923,840 4.63
total investment Securities 923,840 4.63
DerivativeS
OtC and exchange traded derivatives as at 31 December 2012, expressed in euro.
futures Contracts
Descriptionmaturity
datenumber of contracts
notional commitments Counterparty
net unrealised gain/(loss) as at
31 December 2012
% of net assets
AUD Currency Future 03/2013 (18) (1,410,073) Goldman Sachs (3,865) (0.02)NZD Currency Future 03/2013 (24) (1,495,813) Goldman Sachs (15,217) (0.08)
net Unrealised Loss on futures Contracts (2,905,886)1 (19,082) (0.10)
1 Cash of EUR 157,236 held as collateral by the counterparty.
forward foreign Currency exchange Contracts
maturity date
amount bought Ccy
amount sold Ccy Counterparty
Unrealised gain/(loss)
eUr% of net
assets
03/01/2013 13,208,600 SEK 2,026,791 USD Goldman Sachs 2,694 0.01 03/01/2013 3,001,219 USD 2,874,940 AUD Barclays 12,652 0.06 03/01/2013 4,003,764 USD 3,659,000 CHF Barclays 4,787 0.02 03/01/2013 3,019,865 USD 3,638,348 NZD Barclays 13,982 0.07 03/01/2013 4,998,091 USD 6,102,000 SGD Barclays 1,977 0.01 04/01/2013 38,746,100 CZK 2,035,297 USD Bank of America 203 0.00 04/01/2013 42,495,925 NOK 7,589,642 USD State Street 34,694 0.17 04/01/2013 13,304,800 SEK 2,016,092 USD Bank of America 21,990 0.11 04/01/2013 49,954,884 SEK 7,466,585 USD Citibank 160,791 0.82 04/01/2013 1,974,957 USD 433,023,200 HUF State Street 11,401 0.06 04/01/2013 4,892,348 USD 420,374,987 JPY Barclays 23,104 0.12 04/01/2013 2,995,414 USD 252,780,000 JPY State Street 54,507 0.27
Unrealised Gain on forward foreign Currency exchange Contracts 342,782 1.72
USD hedged Share Class 11/01/2013 1,147 EUR 1,511 USD J.P. Morgan 1 0.00 11/01/2013 2,979,843 USD 2,252,227 EUR J.P. Morgan 7,790 0.04
SeK hedged Share Class 11/01/2013 8,026,563 SEK 919,135 EUR J.P. Morgan 16,440 0.08
Unrealised Gain on nav hedged Share Classes forward foreign Currency exchange Contracts 24,231 0.12
total Unrealised Gain on forward foreign Currency exchange Contracts 367,013 1.84

145 Morgan Stanley Investment Funds 31 December 2012
Absolute Return Currency Fund
03/01/2013 22,222,600 NOK 3,996,978 USD State Street (3,052) (0.02)03/01/2013 6,102,000 SGD 4,998,321 USD Barclays (2,150) (0.01)03/01/2013 3,981,154 USD 22,222,600 NOK State Street (8,951) (0.04)03/01/2013 2,027,134 USD 13,208,600 SEK Goldman Sachs (2,435) (0.01)03/01/2013 1,997,215 USD 17,112,577 ZAR UBS (14,761) (0.07)04/01/2013 433,023,200 HUF 1,988,534 USD State Street (21,699) (0.11)04/01/2013 420,374,987 JPY 4,993,633 USD Barclays (99,927) (0.50)04/01/2013 252,780,000 JPY 3,003,636 USD State Street (60,743) (0.30)04/01/2013 2,001,455 USD 38,746,100 CZK Bank of America (25,872) (0.13)04/01/2013 7,495,685 USD 42,495,925 NOK State Street (105,959) (0.53)04/01/2013 1,990,732 USD 13,304,800 SEK Bank of America (41,225) (0.21)04/01/2013 7,520,637 USD 49,954,884 SEK Citibank (119,794) (0.61)01/02/2013 2,007,080 USD 17,112,577 ZAR UBS (752) 0.00 01/02/2013 17,112,577 ZAR 2,008,283 USD UBS (161) 0.00
Unrealised Loss on forward foreign Currency exchange Contracts (507,481) (2.54)
USD hedged Share Class 11/01/2013 713,796 EUR 945,080 USD J.P. Morgan (2,987) (0.01)11/01/2013 128 USD 97 EUR J.P. Morgan - 0.00
SeK hedged Share Class 11/01/2013 36,590 EUR 318,244 SEK J.P. Morgan (504) 0.00
Unrealised Loss on nav hedged Share Classes forward foreign Currency exchange Contracts (3,491) (0.01)
total Unrealised Loss on forward foreign Currency exchange Contracts (510,972) (2.55)
net Unrealised Loss on forward foreign Currency exchange Contracts (143,959) (0.71)
total Derivatives (163,041) (0.81)
other assets less Liabilities 19,192,385 96.18
total net asset value 19,953,184 100.00
(2) The country in brackets represents the country of incorporation of this security.(4) Managed by the Investment Adviser or an affiliate.
forward foreign Currency exchange Contracts (continued)
maturity date
amount bought Ccy
amount sold Ccy Counterparty
Unrealised gain/(loss)
eUr% of net
assets
DerivativeS (continued)
OtC and exchange traded derivatives as at 31 December 2012, expressed in euro.

Morgan Stanley Investment Funds 31 December 2012 146
The accompanying notes are an integral part of these financial statements.
Statement of assets and liabilitiesAs at 31 December 2012
asianequityfund
asia-Pacific equity
fund
asian Property
fund
Combinedtotals of all
funds +
USD USD USD USD
assetsInvestment securities - at cost 207,924,090 103,021,194 449,342,298 29,975,597,272 Unrealised appreciation/(depreciation) 35,471,018 8,093,791 115,252,073 2,543,871,549
Investment securities 243,395,108 111,114,985 564,594,371 32,519,468,821
Repurchase agreements - - - 972,350,000 Cash at banks 377,037 252,715 72,161 434,695,222 Time deposits - - - 188,282,448 Receivables for subscriptions 1,160,491 30,423 1,322,603 110,344,586 Receivables for investments sold 1,582,105 525,082 1,223,019 59,107,735 Unrealised gain on forward foreign currency exchange contracts 33,829 12,509 2,060 14,405,836 Unrealised gain on futures contracts - - - 12,712,024 Unrealised gain on credit default swap contracts - - - 1,337,396 Unrealised gain on interest rate swap contracts - - - 161,354 Accrued income and other receivables 299,607 133,691 1,598,776 178,492,466
total assets 246,848,177 112,069,405 568,812,990 34,491,357,888
LiabilitiesPayables for investments purchased 1,391,419 1,047,627 685,868 112,454,300 Payables for redemptions 229,406 - 828,441 80,842,560 Unrealised loss on forward foreign currency exchange contracts 652 1,611 471 13,042,636 Unrealised loss on interest rate swap contracts - - - 10,424,876 Unrealised loss on total return swap contracts - - - 5,969,768 Unrealised loss on futures contracts - - - 4,316,048 Unrealised loss on credit default swap contracts - - - 3,572,206 Bank overdrafts - 26,127 - 70,139 Distributions payable - - - 28,734 Other payables and accrued expenses 463,447 164,554 945,407 47,048,370
total liabilities 2,084,924 1,239,919 2,460,187 277,769,637
net asset value 244,763,253 110,829,486 566,352,803 34,213,588,251
+ Represents the combined totals of all Morgan Stanley Investment Funds.
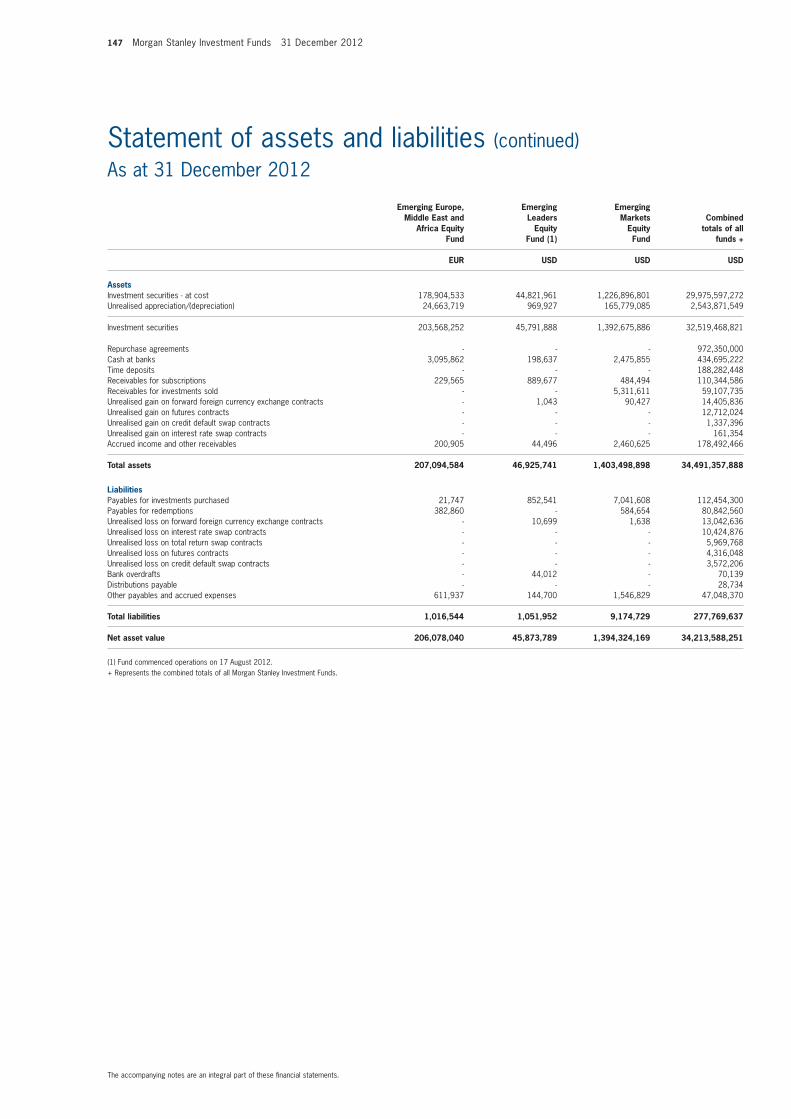
147 Morgan Stanley Investment Funds 31 December 2012
The accompanying notes are an integral part of these financial statements.
Statement of assets and liabilities (continued)As at 31 December 2012
emerging europe,middle east and
africa equityfund
emerging Leaders
equity fund (1)
emergingmarkets
equityfund
Combinedtotals of all
funds +
eUr USD USD USD
assetsInvestment securities - at cost 178,904,533 44,821,961 1,226,896,801 29,975,597,272 Unrealised appreciation/(depreciation) 24,663,719 969,927 165,779,085 2,543,871,549
Investment securities 203,568,252 45,791,888 1,392,675,886 32,519,468,821
Repurchase agreements - - - 972,350,000 Cash at banks 3,095,862 198,637 2,475,855 434,695,222 Time deposits - - - 188,282,448 Receivables for subscriptions 229,565 889,677 484,494 110,344,586 Receivables for investments sold - - 5,311,611 59,107,735 Unrealised gain on forward foreign currency exchange contracts - 1,043 90,427 14,405,836 Unrealised gain on futures contracts - - - 12,712,024 Unrealised gain on credit default swap contracts - - - 1,337,396 Unrealised gain on interest rate swap contracts - - - 161,354 Accrued income and other receivables 200,905 44,496 2,460,625 178,492,466
total assets 207,094,584 46,925,741 1,403,498,898 34,491,357,888
LiabilitiesPayables for investments purchased 21,747 852,541 7,041,608 112,454,300 Payables for redemptions 382,860 - 584,654 80,842,560 Unrealised loss on forward foreign currency exchange contracts - 10,699 1,638 13,042,636Unrealised loss on interest rate swap contracts - - - 10,424,876 Unrealised loss on total return swap contracts - - - 5,969,768 Unrealised loss on futures contracts - - - 4,316,048 Unrealised loss on credit default swap contracts - - - 3,572,206 Bank overdrafts - 44,012 - 70,139 Distributions payable - - - 28,734 Other payables and accrued expenses 611,937 144,700 1,546,829 47,048,370
total liabilities 1,016,544 1,051,952 9,174,729 277,769,637
net asset value 206,078,040 45,873,789 1,394,324,169 34,213,588,251
(1) Fund commenced operations on 17 August 2012.+ Represents the combined totals of all Morgan Stanley Investment Funds.
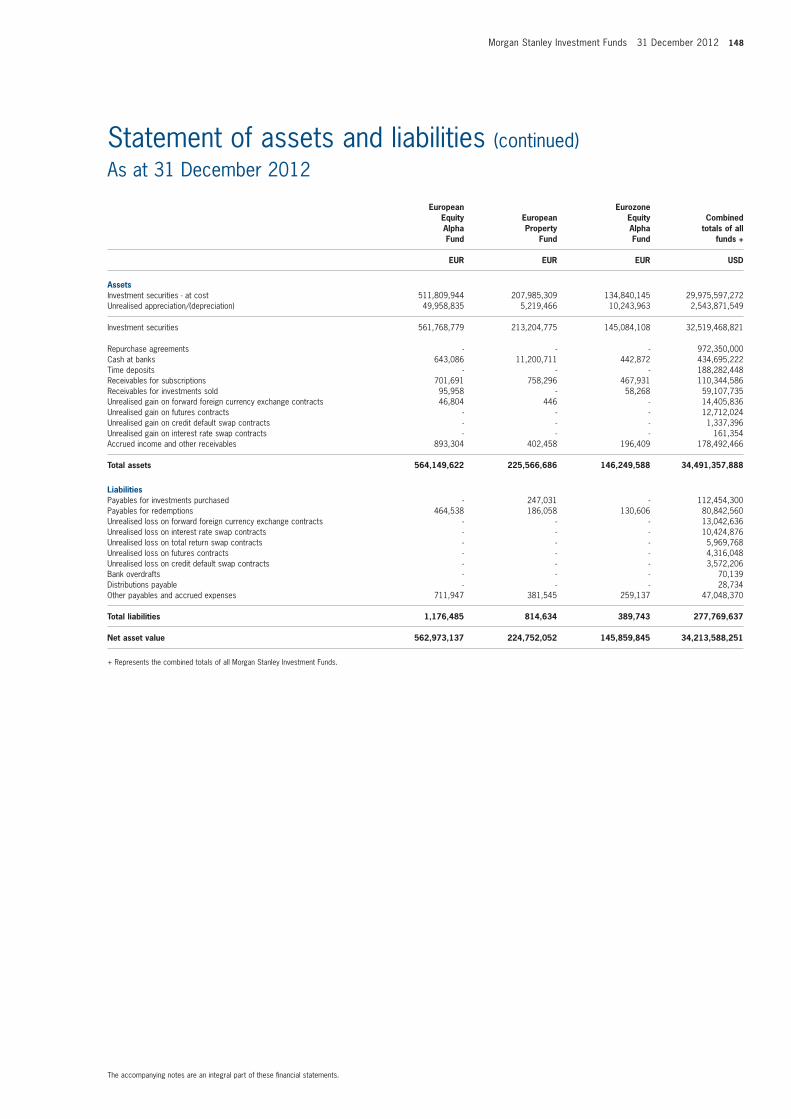
Morgan Stanley Investment Funds 31 December 2012 148
The accompanying notes are an integral part of these financial statements.
Statement of assets and liabilities (continued)As at 31 December 2012
europeanequityalphafund
europeanProperty
fund
eurozoneequityalphafund
Combinedtotals of all
funds +
eUr eUr eUr USD
assetsInvestment securities - at cost 511,809,944 207,985,309 134,840,145 29,975,597,272 Unrealised appreciation/(depreciation) 49,958,835 5,219,466 10,243,963 2,543,871,549
Investment securities 561,768,779 213,204,775 145,084,108 32,519,468,821
Repurchase agreements - - - 972,350,000 Cash at banks 643,086 11,200,711 442,872 434,695,222 Time deposits - - - 188,282,448 Receivables for subscriptions 701,691 758,296 467,931 110,344,586 Receivables for investments sold 95,958 - 58,268 59,107,735 Unrealised gain on forward foreign currency exchange contracts 46,804 446 - 14,405,836 Unrealised gain on futures contracts - - - 12,712,024 Unrealised gain on credit default swap contracts - - - 1,337,396 Unrealised gain on interest rate swap contracts - - - 161,354 Accrued income and other receivables 893,304 402,458 196,409 178,492,466
total assets 564,149,622 225,566,686 146,249,588 34,491,357,888
LiabilitiesPayables for investments purchased - 247,031 - 112,454,300 Payables for redemptions 464,538 186,058 130,606 80,842,560 Unrealised loss on forward foreign currency exchange contracts - - - 13,042,636 Unrealised loss on interest rate swap contracts - - - 10,424,876 Unrealised loss on total return swap contracts - - - 5,969,768 Unrealised loss on futures contracts - - - 4,316,048 Unrealised loss on credit default swap contracts - - - 3,572,206 Bank overdrafts - - - 70,139 Distributions payable - - - 28,734 Other payables and accrued expenses 711,947 381,545 259,137 47,048,370
total liabilities 1,176,485 814,634 389,743 277,769,637
net asset value 562,973,137 224,752,052 145,859,845 34,213,588,251
+ Represents the combined totals of all Morgan Stanley Investment Funds.
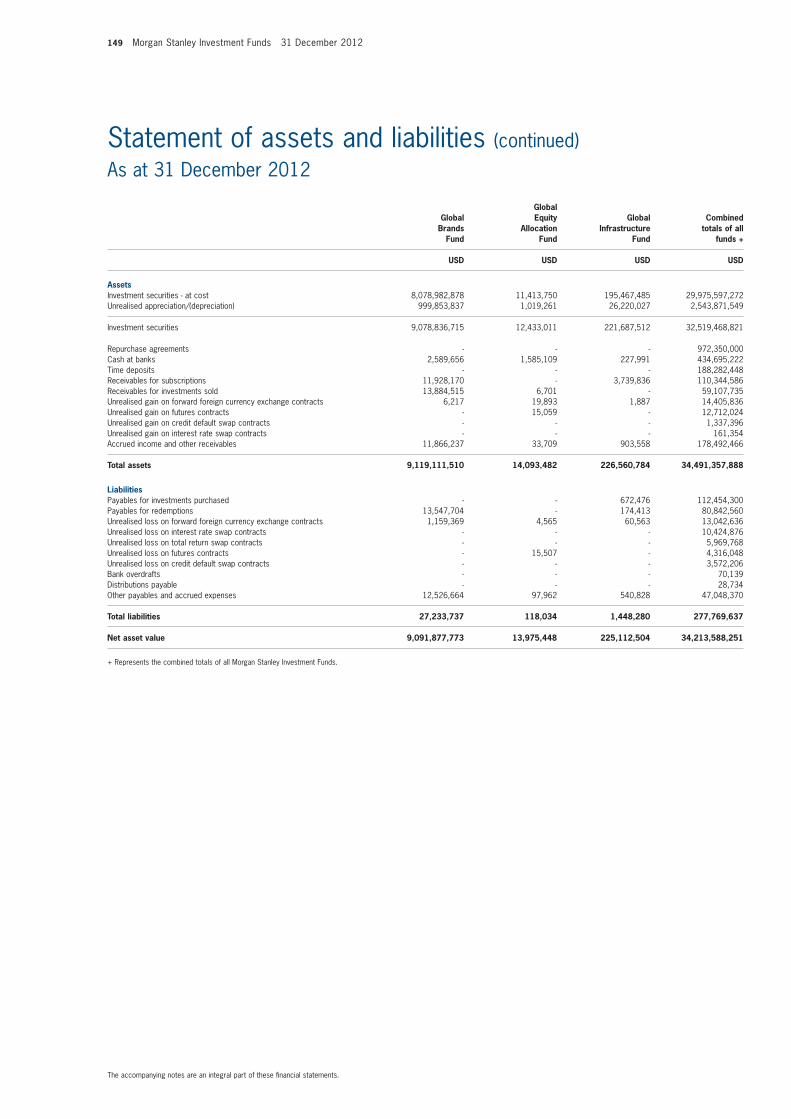
149 Morgan Stanley Investment Funds 31 December 2012
The accompanying notes are an integral part of these financial statements.
Statement of assets and liabilities (continued)As at 31 December 2012
GlobalBrands
fund
Globalequity
allocation fund
Globalinfrastructure
fund
Combinedtotals of all
funds +
USD USD USD USD
assetsInvestment securities - at cost 8,078,982,878 11,413,750 195,467,485 29,975,597,272 Unrealised appreciation/(depreciation) 999,853,837 1,019,261 26,220,027 2,543,871,549
Investment securities 9,078,836,715 12,433,011 221,687,512 32,519,468,821
Repurchase agreements - - - 972,350,000 Cash at banks 2,589,656 1,585,109 227,991 434,695,222 Time deposits - - - 188,282,448 Receivables for subscriptions 11,928,170 - 3,739,836 110,344,586 Receivables for investments sold 13,884,515 6,701 - 59,107,735 Unrealised gain on forward foreign currency exchange contracts 6,217 19,893 1,887 14,405,836 Unrealised gain on futures contracts - 15,059 - 12,712,024 Unrealised gain on credit default swap contracts - - - 1,337,396 Unrealised gain on interest rate swap contracts - - - 161,354 Accrued income and other receivables 11,866,237 33,709 903,558 178,492,466
total assets 9,119,111,510 14,093,482 226,560,784 34,491,357,888
LiabilitiesPayables for investments purchased - - 672,476 112,454,300 Payables for redemptions 13,547,704 - 174,413 80,842,560 Unrealised loss on forward foreign currency exchange contracts 1,159,369 4,565 60,563 13,042,636 Unrealised loss on interest rate swap contracts - - - 10,424,876 Unrealised loss on total return swap contracts - - - 5,969,768 Unrealised loss on futures contracts - 15,507 - 4,316,048 Unrealised loss on credit default swap contracts - - - 3,572,206 Bank overdrafts - - - 70,139 Distributions payable - - - 28,734 Other payables and accrued expenses 12,526,664 97,962 540,828 47,048,370
total liabilities 27,233,737 118,034 1,448,280 277,769,637
net asset value 9,091,877,773 13,975,448 225,112,504 34,213,588,251
+ Represents the combined totals of all Morgan Stanley Investment Funds.

Morgan Stanley Investment Funds 31 December 2012 150
The accompanying notes are an integral part of these financial statements.
Statement of assets and liabilities (continued)As at 31 December 2012
Globalopportunity
fund
GlobalProperty
fund
indianequityfund
Combinedtotals of all
funds +
USD USD USD USD
assetsInvestment securities - at cost 55,497,112 630,502,385 103,965,871 29,975,597,272 Unrealised appreciation/(depreciation) 1,734,475 89,938,311 14,675,852 2,543,871,549
Investment securities 57,231,587 720,440,696 118,641,723 32,519,468,821
Repurchase agreements - - - 972,350,000 Cash at banks 229,132 8,045,412 4,468,917 434,695,222 Time deposits - - - 188,282,448 Receivables for subscriptions 715,055 2,554,041 159,596 110,344,586 Receivables for investments sold - 789,079 - 59,107,735 Unrealised gain on forward foreign currency exchange contracts 45 1,870 - 14,405,836 Unrealised gain on futures contracts - - - 12,712,024 Unrealised gain on credit default swap contracts - - - 1,337,396 Unrealised gain on interest rate swap contracts - - - 161,354 Accrued income and other receivables 51,341 1,518,264 42,767 178,492,466
total assets 58,227,160 733,349,362 123,313,003 34,491,357,888
LiabilitiesPayables for investments purchased - 737,176 - 112,454,300 Payables for redemptions - 196,127 305,178 80,842,560 Unrealised loss on forward foreign currency exchange contracts 4,464 12,690 - 13,042,636 Unrealised loss on interest rate swap contracts - - - 10,424,876 Unrealised loss on total return swap contracts - - - 5,969,768 Unrealised loss on futures contracts - - - 4,316,048 Unrealised loss on credit default swap contracts - - - 3,572,206 Bank overdrafts - - - 70,139 Distributions payable - - - 28,734 Other payables and accrued expenses 180,469 944,722 441,629 47,048,370
total liabilities 184,933 1,890,715 746,807 277,769,637
net asset value 58,042,227 731,458,647 122,566,196 34,213,588,251
+ Represents the combined totals of all Morgan Stanley Investment Funds.

151 Morgan Stanley Investment Funds 31 December 2012
The accompanying notes are an integral part of these financial statements.
Statement of assets and liabilities (continued)As at 31 December 2012
Japanese equity
fund
Latinamerican
equityfund
US advantage
fund
Combinedtotals of all
funds +
JPY000’s USD USD USD
assetsInvestment securities - at cost 5,798,333 711,163,867 3,546,235,518 29,975,597,272 Unrealised appreciation/(depreciation) 818,096 136,196,607 230,289,527 2,543,871,549
Investment securities 6,616,429 847,360,474 3,776,525,045 32,519,468,821
Repurchase agreements - - - 972,350,000 Cash at banks 87,049 1,207,420 590,631 434,695,222 Time deposits - - - 188,282,448 Receivables for subscriptions 2,506 183,418 10,550,684 110,344,586 Receivables for investments sold 61,704 809,860 876,058 59,107,735 Unrealised gain on forward foreign currency exchange contracts 67,949 - 195,278 14,405,836 Unrealised gain on futures contracts - - - 12,712,024 Unrealised gain on credit default swap contracts - - - 1,337,396 Unrealised gain on interest rate swap contracts - - - 161,354 Accrued income and other receivables 7,281 1,961,645 2,074,035 178,492,466
total assets 6,842,918 851,522,817 3,790,811,731 34,491,357,888
LiabilitiesPayables for investments purchased 33,903 562,916 173,580 112,454,300 Payables for redemptions 49,094 626,628 18,410,452 80,842,560 Unrealised loss on forward foreign currency exchange contracts 4 - 626,887 13,042,636 Unrealised loss on interest rate swap contracts - - - 10,424,876 Unrealised loss on total return swap contracts - - - 5,969,768 Unrealised loss on futures contracts - - - 4,316,048 Unrealised loss on credit default swap contracts - - - 3,572,206 Bank overdrafts - - - 70,139 Distributions payable - - - 28,734 Other payables and accrued expenses 14,602 1,613,987 4,642,484 47,048,370
total liabilities 97,603 2,803,531 23,853,403 277,769,637
net asset value 6,745,315 848,719,286 3,766,958,328 34,213,588,251
+ Represents the combined totals of all Morgan Stanley Investment Funds.
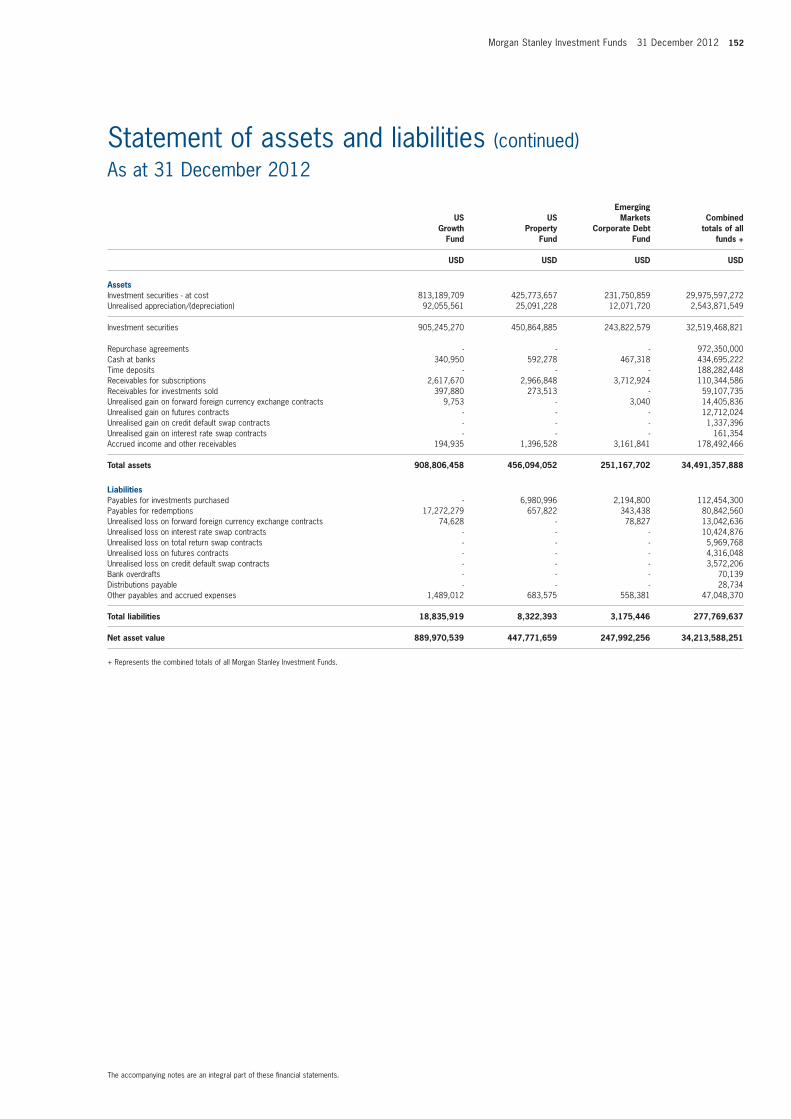
Morgan Stanley Investment Funds 31 December 2012 152
The accompanying notes are an integral part of these financial statements.
Statement of assets and liabilities (continued)As at 31 December 2012
USGrowth
fund
USProperty
fund
emergingmarkets
Corporate Debt fund
Combinedtotals of all
funds +
USD USD USD USD
assetsInvestment securities - at cost 813,189,709 425,773,657 231,750,859 29,975,597,272 Unrealised appreciation/(depreciation) 92,055,561 25,091,228 12,071,720 2,543,871,549
Investment securities 905,245,270 450,864,885 243,822,579 32,519,468,821
Repurchase agreements - - - 972,350,000 Cash at banks 340,950 592,278 467,318 434,695,222 Time deposits - - - 188,282,448 Receivables for subscriptions 2,617,670 2,966,848 3,712,924 110,344,586 Receivables for investments sold 397,880 273,513 - 59,107,735 Unrealised gain on forward foreign currency exchange contracts 9,753 - 3,040 14,405,836 Unrealised gain on futures contracts - - - 12,712,024 Unrealised gain on credit default swap contracts - - - 1,337,396 Unrealised gain on interest rate swap contracts - - - 161,354 Accrued income and other receivables 194,935 1,396,528 3,161,841 178,492,466
total assets 908,806,458 456,094,052 251,167,702 34,491,357,888
LiabilitiesPayables for investments purchased - 6,980,996 2,194,800 112,454,300 Payables for redemptions 17,272,279 657,822 343,438 80,842,560 Unrealised loss on forward foreign currency exchange contracts 74,628 - 78,827 13,042,636 Unrealised loss on interest rate swap contracts - - - 10,424,876 Unrealised loss on total return swap contracts - - - 5,969,768 Unrealised loss on futures contracts - - - 4,316,048 Unrealised loss on credit default swap contracts - - - 3,572,206 Bank overdrafts - - - 70,139 Distributions payable - - - 28,734 Other payables and accrued expenses 1,489,012 683,575 558,381 47,048,370
total liabilities 18,835,919 8,322,393 3,175,446 277,769,637
net asset value 889,970,539 447,771,659 247,992,256 34,213,588,251
+ Represents the combined totals of all Morgan Stanley Investment Funds.

153 Morgan Stanley Investment Funds 31 December 2012
The accompanying notes are an integral part of these financial statements.
Statement of assets and liabilities (continued)As at 31 December 2012
emergingmarkets
Debtfund
emergingmarkets
Domestic Debtfund
euroBondfund
Combinedtotals of all
funds +
USD USD eUr USD
assetsInvestment securities - at cost 843,686,151 826,630,030 645,260,449 29,975,597,272 Unrealised appreciation/(depreciation) 88,200,587 33,311,587 45,340,010 2,543,871,549
Investment securities 931,886,738 859,941,617 690,600,459 32,519,468,821
Repurchase agreements - - - 972,350,000 Cash at banks 627,850 5,693,811 4,750,212 434,695,222 Time deposits - - - 188,282,448 Receivables for subscriptions 20,284,858 3,467,665 1,136,284 110,344,586 Receivables for investments sold - - - 59,107,735 Unrealised gain on forward foreign currency exchange contracts 132,713 443,257 - 14,405,836 Unrealised gain on futures contracts - - 9,600 12,712,024 Unrealised gain on credit default swap contracts - - - 1,337,396 Unrealised gain on interest rate swap contracts - - - 161,354 Accrued income and other receivables 13,608,068 13,142,127 13,108,069 178,492,466
total assets 966,540,227 882,688,477 709,604,624 34,491,357,888
LiabilitiesPayables for investments purchased 15,475,657 5,883,942 - 112,454,300 Payables for redemptions 3,744,534 1,291,779 189,585 80,842,560 Unrealised loss on forward foreign currency exchange contracts 177,477 129,008 - 13,042,636 Unrealised loss on interest rate swap contracts - - - 10,424,876 Unrealised loss on total return swap contracts - - - 5,969,768 Unrealised loss on futures contracts - - 61,598 4,316,048 Unrealised loss on credit default swap contracts - - 287,818 3,572,206 Bank overdrafts - - - 70,139 Distributions payable - - - 28,734 Other payables and accrued expenses 1,723,760 1,680,564 665,143 47,048,370
total liabilities 21,121,428 8,985,293 1,204,144 277,769,637
net asset value 945,418,799 873,703,184 708,400,480 34,213,588,251
+ Represents the combined totals of all Morgan Stanley Investment Funds.
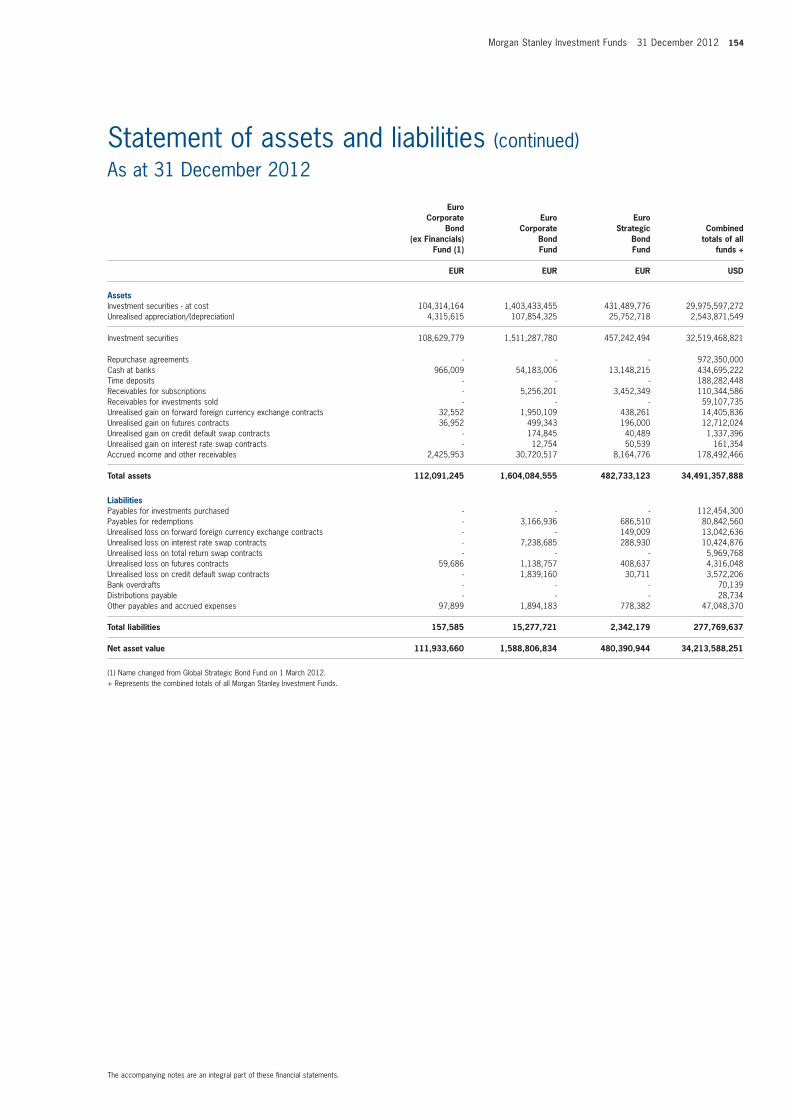
Morgan Stanley Investment Funds 31 December 2012 154
The accompanying notes are an integral part of these financial statements.
Statement of assets and liabilities (continued)As at 31 December 2012
euroCorporate
Bond(ex financials)
fund (1)
euroCorporate
Bondfund
euroStrategic
Bondfund
Combinedtotals of all
funds +
eUr eUr eUr USD
assetsInvestment securities - at cost 104,314,164 1,403,433,455 431,489,776 29,975,597,272 Unrealised appreciation/(depreciation) 4,315,615 107,854,325 25,752,718 2,543,871,549
Investment securities 108,629,779 1,511,287,780 457,242,494 32,519,468,821
Repurchase agreements - - - 972,350,000 Cash at banks 966,009 54,183,006 13,148,215 434,695,222 Time deposits - - - 188,282,448 Receivables for subscriptions - 5,256,201 3,452,349 110,344,586 Receivables for investments sold - - - 59,107,735 Unrealised gain on forward foreign currency exchange contracts 32,552 1,950,109 438,261 14,405,836 Unrealised gain on futures contracts 36,952 499,343 196,000 12,712,024 Unrealised gain on credit default swap contracts - 174,845 40,489 1,337,396 Unrealised gain on interest rate swap contracts - 12,754 50,539 161,354 Accrued income and other receivables 2,425,953 30,720,517 8,164,776 178,492,466
total assets 112,091,245 1,604,084,555 482,733,123 34,491,357,888
LiabilitiesPayables for investments purchased - - - 112,454,300 Payables for redemptions - 3,166,936 686,510 80,842,560 Unrealised loss on forward foreign currency exchange contracts - - 149,009 13,042,636 Unrealised loss on interest rate swap contracts - 7,238,685 288,930 10,424,876 Unrealised loss on total return swap contracts - - - 5,969,768 Unrealised loss on futures contracts 59,686 1,138,757 408,637 4,316,048 Unrealised loss on credit default swap contracts - 1,839,160 30,711 3,572,206 Bank overdrafts - - - 70,139 Distributions payable - - - 28,734 Other payables and accrued expenses 97,899 1,894,183 778,382 47,048,370
total liabilities 157,585 15,277,721 2,342,179 277,769,637
net asset value 111,933,660 1,588,806,834 480,390,944 34,213,588,251
(1) Name changed from Global Strategic Bond Fund on 1 March 2012.+ Represents the combined totals of all Morgan Stanley Investment Funds.

155 Morgan Stanley Investment Funds 31 December 2012
The accompanying notes are an integral part of these financial statements.
Statement of assets and liabilities (continued)As at 31 December 2012
european Currencies high
Yield Bondfund
GlobalBondfund
GlobalConvertible
Bondfund
Combinedtotals of all
funds +
eUr USD USD USD
assetsInvestment securities - at cost 537,217,315 655,909,099 1,065,532,985 29,975,597,272 Unrealised appreciation/(depreciation) 25,775,224 23,467,693 4,513,091 2,543,871,549
Investment securities 562,992,539 679,376,792 1,070,046,076 32,519,468,821
Repurchase agreements - - - 972,350,000 Cash at banks 38,146,799 6,018,969 2,816,403 434,695,222 Time deposits - 28,307,408 - 188,282,448 Receivables for subscriptions 3,624,501 2,576,774 1,371,807 110,344,586 Receivables for investments sold - - - 59,107,735 Unrealised gain on forward foreign currency exchange contracts 323,384 665,320 2,370,459 14,405,836 Unrealised gain on futures contracts 4,810 186,584 - 12,712,024 Unrealised gain on credit default swap contracts 513,374 308,867 - 1,337,396 Unrealised gain on interest rate swap contracts - 69,964 - 161,354 Accrued income and other receivables 11,184,491 8,305,815 4,960,833 178,492,466
total assets 616,789,898 725,816,493 1,081,565,578 34,491,357,888
LiabilitiesPayables for investments purchased - 31,057,004 - 112,454,300 Payables for redemptions 922,303 2,402,953 1,626,691 80,842,560 Unrealised loss on forward foreign currency exchange contracts 674 3,301,482 3,520,459 13,042,636 Unrealised loss on interest rate swap contracts - 421,265 - 10,424,876 Unrealised loss on total return swap contracts - - - 5,969,768 Unrealised loss on futures contracts 53,825 121,898 - 4,316,048 Unrealised loss on credit default swap contracts 362,502 114,444 - 3,572,206 Bank overdrafts - - - 70,139 Distributions payable - - - 28,734 Other payables and accrued expenses 776,070 928,402 1,082,463 47,048,370
total liabilities 2,115,374 38,347,448 6,229,613 277,769,637
net asset value 614,674,524 687,469,045 1,075,335,965 34,213,588,251
+ Represents the combined totals of all Morgan Stanley Investment Funds.

Morgan Stanley Investment Funds 31 December 2012 156
The accompanying notes are an integral part of these financial statements.
Statement of assets and liabilities (continued)As at 31 December 2012
GlobalCredit
fund (1)
Global fixed incomeopportunities
fund
Global highYield Bond
fund
Combinedtotals of all
funds +
USD USD USD USD
assetsInvestment securities - at cost 18,861,034 112,456,756 37,113,394 29,975,597,272 Unrealised appreciation/(depreciation) 274,134 5,054,452 1,846,429 2,543,871,549
Investment securities 19,135,168 117,511,208 38,959,823 32,519,468,821
Repurchase agreements - - - 972,350,000 Cash at banks 867,424 10,544,963 1,435,350 434,695,222 Time deposits - - - 188,282,448 Receivables for subscriptions - 5,498,902 1,086,194 110,344,586 Receivables for investments sold - - - 59,107,735 Unrealised gain on forward foreign currency exchange contracts - 227,625 4,149 14,405,836 Unrealised gain on futures contracts 11,469 11,491 - 12,712,024 Unrealised gain on credit default swap contracts - 65,228 - 1,337,396 Unrealised gain on interest rate swap contracts - 7,721 - 161,354 Accrued income and other receivables 305,498 1,759,679 773,256 178,492,466
total assets 20,319,559 135,626,817 42,258,772 34,491,357,888
LiabilitiesPayables for investments purchased - 1,132,266 - 112,454,300 Payables for redemptions - 5,042,924 486,297 80,842,560 Unrealised loss on forward foreign currency exchange contracts 111,356 568,448 99,091 13,042,636 Unrealised loss on interest rate swap contracts - 52,631 - 10,424,876 Unrealised loss on total return swap contracts - - - 5,969,768 Unrealised loss on futures contracts 14,949 3,938 - 4,316,048 Unrealised loss on credit default swap contracts - 126,246 - 3,572,206 Bank overdrafts - - - 70,139 Distributions payable - - - 28,734 Other payables and accrued expenses 51,570 258,661 170,118 47,048,370
total liabilities 177,875 7,185,114 755,506 277,769,637
net asset value 20,141,684 128,441,703 41,503,266 34,213,588,251
(1) Fund commenced operations on 14 November 2012.+ Represents the combined totals of all Morgan Stanley Investment Funds.

157 Morgan Stanley Investment Funds 31 December 2012
The accompanying notes are an integral part of these financial statements.
Statement of assets and liabilities (continued)As at 31 December 2012
GlobalmortgageSecurities
fund (1)
Global Premier
Credit fund (2)
Short maturityeuro Bond
fund
Combinedtotals of all
funds +
USD USD eUr USD
assetsInvestment securities - at cost 22,984,943 9,401,040 446,367,661 29,975,597,272 Unrealised appreciation/(depreciation) 88,407 15,684 9,151,299 2,543,871,549
Investment securities 23,073,350 9,416,724 455,518,960 32,519,468,821
Repurchase agreements - - - 972,350,000 Cash at banks 5,469,604 473,118 3,577,225 434,695,222 Time deposits - - - 188,282,448 Receivables for subscriptions - - 3,280,548 110,344,586 Receivables for investments sold 3,253,125 - - 59,107,735 Unrealised gain on forward foreign currency exchange contracts - 49,725 - 14,405,836 Unrealised gain on futures contracts - 6,250 21,299 12,712,024 Unrealised gain on credit default swap contracts - - - 1,337,396 Unrealised gain on interest rate swap contracts - - - 161,354 Accrued income and other receivables 80,324 175,167 7,682,048 178,492,466
total assets 31,876,403 10,120,984 470,080,080 34,491,357,888
LiabilitiesPayables for investments purchased 11,733,359 - - 112,454,300 Payables for redemptions - - 1,192,894 80,842,560 Unrealised loss on forward foreign currency exchange contracts 487 85,582 - 13,042,636 Unrealised loss on interest rate swap contracts - - - 10,424,876 Unrealised loss on total return swap contracts - - - 5,969,768 Unrealised loss on futures contracts 1,250 423 304,850 4,316,048 Unrealised loss on credit default swap contracts - - - 3,572,206 Bank overdrafts - - - 70,139 Distributions payable - - - 28,734 Other payables and accrued expenses 66,471 37,106 634,388 47,048,370
total liabilities 11,801,567 123,111 2,132,132 277,769,637
net asset value 20,074,836 9,997,873 467,947,948 34,213,588,251
(1) Fund commenced operations on 3 December 2012.(2) Fund commenced operations on 10 December 2012. + Represents the combined totals of all Morgan Stanley Investment Funds.
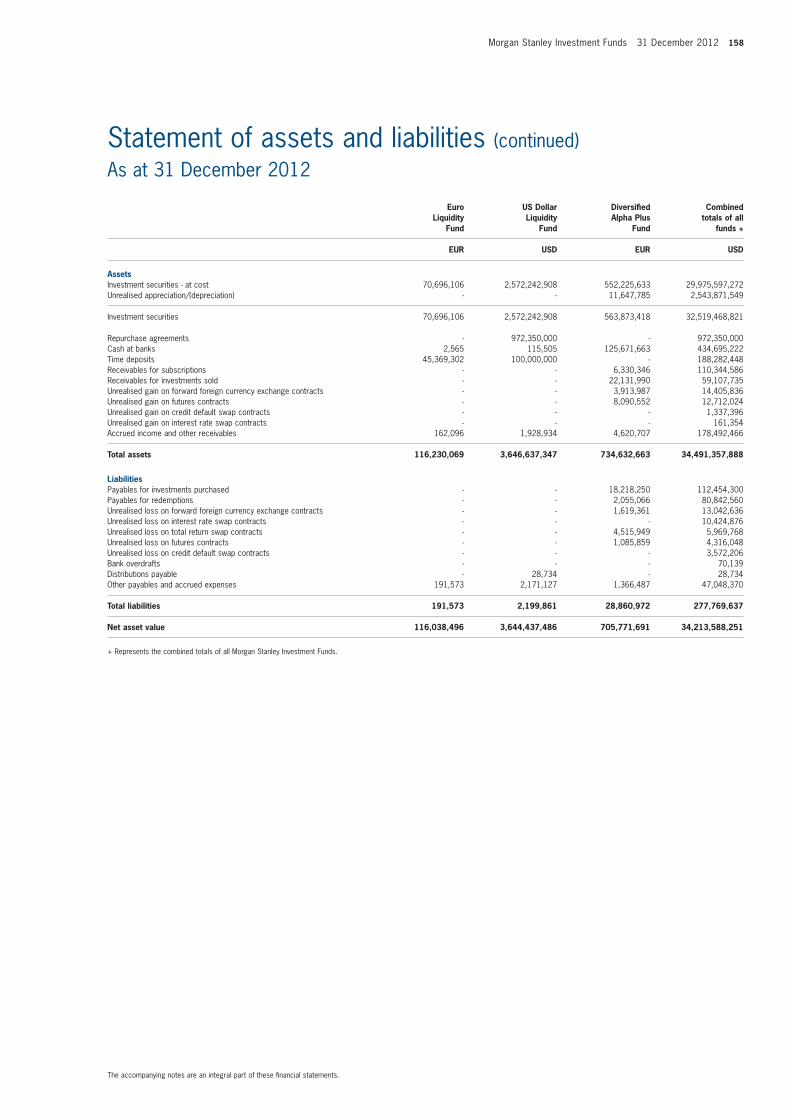
Morgan Stanley Investment Funds 31 December 2012 158
The accompanying notes are an integral part of these financial statements.
Statement of assets and liabilities (continued)As at 31 December 2012
euroLiquidity
fund
US DollarLiquidity
fund
Diversifiedalpha Plus
fund
Combinedtotals of all
funds +
eUr USD eUr USD
assetsInvestment securities - at cost 70,696,106 2,572,242,908 552,225,633 29,975,597,272 Unrealised appreciation/(depreciation) - - 11,647,785 2,543,871,549
Investment securities 70,696,106 2,572,242,908 563,873,418 32,519,468,821
Repurchase agreements - 972,350,000 - 972,350,000 Cash at banks 2,565 115,505 125,671,663 434,695,222 Time deposits 45,369,302 100,000,000 - 188,282,448 Receivables for subscriptions - - 6,330,346 110,344,586 Receivables for investments sold - - 22,131,990 59,107,735 Unrealised gain on forward foreign currency exchange contracts - - 3,913,987 14,405,836 Unrealised gain on futures contracts - - 8,090,552 12,712,024 Unrealised gain on credit default swap contracts - - - 1,337,396 Unrealised gain on interest rate swap contracts - - - 161,354 Accrued income and other receivables 162,096 1,928,934 4,620,707 178,492,466
total assets 116,230,069 3,646,637,347 734,632,663 34,491,357,888
LiabilitiesPayables for investments purchased - - 18,218,250 112,454,300 Payables for redemptions - - 2,055,066 80,842,560 Unrealised loss on forward foreign currency exchange contracts - - 1,619,361 13,042,636 Unrealised loss on interest rate swap contracts - - - 10,424,876 Unrealised loss on total return swap contracts - - 4,515,949 5,969,768 Unrealised loss on futures contracts - - 1,085,859 4,316,048 Unrealised loss on credit default swap contracts - - - 3,572,206 Bank overdrafts - - - 70,139 Distributions payable - 28,734 - 28,734 Other payables and accrued expenses 191,573 2,171,127 1,366,487 47,048,370
total liabilities 191,573 2,199,861 28,860,972 277,769,637
net asset value 116,038,496 3,644,437,486 705,771,691 34,213,588,251
+ Represents the combined totals of all Morgan Stanley Investment Funds.

159 Morgan Stanley Investment Funds 31 December 2012
The accompanying notes are an integral part of these financial statements.
Statement of assets and liabilities (continued)As at 31 December 2012
GlobalBalanced
risk Controlfund of funds
absolutereturn
Currencyfund
Combinedtotals of all
funds +
eUr eUr USD
assetsInvestment securities - at cost 170,749,553 923,840 29,975,597,272 Unrealised appreciation/(depreciation) 5,158,702 - 2,543,871,549
Investment securities 175,908,255 923,840 32,519,468,821
Repurchase agreements - - 972,350,000 Cash at banks 9,288,640 19,322,392 434,695,222 Time deposits - - 188,282,448 Receivables for subscriptions 1,865,022 33,895 110,344,586 Receivables for investments sold - - 59,107,735 Unrealised gain on forward foreign currency exchange contracts - 367,013 14,405,836 Unrealised gain on futures contracts 584,704 - 12,712,024 Unrealised gain on credit default swap contracts - - 1,337,396 Unrealised gain on interest rate swap contracts - - 161,354 Accrued income and other receivables 101,540 40,307 178,492,466
total assets 187,748,161 20,687,447 34,491,357,888
LiabilitiesPayables for investments purchased 2,163,700 - 112,454,300 Payables for redemptions 23,798 56,799 80,842,560 Unrealised loss on forward foreign currency exchange contracts - 510,972 13,042,636 Unrealised loss on interest rate swap contracts - - 10,424,876 Unrealised loss on total return swap contracts - - 5,969,768 Unrealised loss on futures contracts 13,260 19,082 4,316,048 Unrealised loss on credit default swap contracts - - 3,572,206 Bank overdrafts - - 70,139 Distributions payable - - 28,734 Other payables and accrued expenses 354,473 147,410 47,048,370
total liabilities 2,555,231 734,263 277,769,637
net asset value 185,192,930 19,953,184 34,213,588,251
+ Represents the combined totals of all Morgan Stanley Investment Funds.

Morgan Stanley Investment Funds 31 December 2012 160
Statement of changes in number of sharesFor the year ended 31 December 2012
Shares at the startof the year
number of sharesissued
number of sharesredeemed
Shares at the end of the year
Asian Equity Fund (USD)
Share Class A 1,163,094 197,423 (339,762) 1,020,755 Share Class B 1,461,701 258,788 (524,050) 1,196,439 Share Class C 12,261 - (8,696) 3,565 Share Class I 1,757,767 235,959 (169,676) 1,824,050 Share Class Z 4,840,153 2,392,567 (4,783,052) 2,449,668
Asia-Pacific Equity Fund (USD)
Share Class A 957 6,617 (1,214) 6,360 Share Class AH (EUR) 400 3,698 (2,527) 1,571 Share Class B 5,205 89,395 (15,038) 79,562 Share Class BH (EUR) 9,133 47,019 (2,996) 53,156 Share Class C 400 - - 400 Share Class N 3,095,040 1,258,711 - 4,353,751 Share Class Z 400 - - 400
Asian Property Fund (USD)
Share Class A 16,109,836 4,546,826 (7,989,227) 12,667,435 Share Class AX 1,090,966 161,826 (919,855) 332,937 Share Class B 2,800,481 470,933 (1,100,121) 2,171,293 Share Class I 10,228,996 5,378,843 (4,718,232) 10,889,607 Share Class IX 3,127,530 96,643 (1,579,904) 1,644,269 Share Class Z 323,589 1,147,464 (682,322) 788,731
Emerging Europe, Middle East and Africa Equity Fund (EUR)
Share Class A 2,331,655 214,361 (678,820) 1,867,196 Share Class AX 39,415 6,061 (2,634) 42,842 Share Class B 1,917,231 262,057 (650,942) 1,528,346 Share Class C 29,247 1,030 (5,780) 24,497 Share Class I 95,393 8,651 (52,605) 51,439 Share Class Z 132,592 263,755 (242,647) 153,700
Emerging Leaders Equity Fund (USD) (1)
Share Class A - 119,720 (1) 119,719 Share Class AH (EUR) - 98,832 (960) 97,872 Share Class B - 235,022 - 235,022 Share Class BH (EUR) - 217,507 (154) 217,353 Share Class C - 16,224 - 16,224 Share Class CH (EUR) - 320 - 320 Share Class I - 4,000 - 4,000 Share Class Z - 952,241 (6,644) 945,597
Emerging Markets Equity Fund (USD)
Share Class A 2,725,662 634,149 (894,766) 2,465,045 Share Class B 2,774,023 1,118,276 (1,472,902) 2,419,397 Share Class C 20,401 29,203 (8,802) 40,802 Share Class I 8,007,587 1,383,430 (3,048,025) 6,342,992 Share Class N 8,921,453 1,534,180 (777,613) 9,678,020 Share Class Z 12,400,756 11,898,358 (5,793,854) 18,505,260
European Equity Alpha Fund (EUR)
Share Class A 3,973,008 1,058,475 (1,213,525) 3,817,958 Share Class AX - 434 (126) 308 Share Class B 926,766 671,783 (449,933) 1,148,616 Share Class C 31,868 19,875 (15,601) 36,142 Share Class I 1,203,947 221,531 (799,103) 626,375 Share Class Z 7,236,897 9,043,790 (6,036,308) 10,244,379 Share Class ZH (GBP) 3,222,618 2,733,114 (3,657,469) 2,298,263
European Property Fund (EUR)
Share Class A 3,909,409 3,309,880 (2,841,049) 4,378,240 Share Class AX 42,599 6,148 (48,747) - Share Class B 777,408 413,547 (422,157) 768,798 Share Class I 1,235,254 2,512,424 (2,151,913) 1,595,765 Share Class IX 18,711 23,020 (2,480) 39,251 Share Class Z 2,461,777 278,170 (164,309) 2,575,638
European Small Cap Value Fund (EUR) (2)
Share Class A 155,568 91,456 (247,024) - Share Class AX 7,738 268 (8,006) - Share Class B 221,318 93,489 (314,807) -
(1) Fund commenced operations on 17 August 2012. (2) Fund merged into European Equity Alpha Fund on 26 July 2012.

161 Morgan Stanley Investment Funds 31 December 2012
Statement of changes in number of shares (continued)For the year ended 31 December 2012
Shares at the startof the year
number of sharesissued
number of sharesredeemed
Shares at the end of the year
Eurozone Equity Alpha Fund (EUR)
Share Class A 4,824,656 2,156,010 (1,673,165) 5,307,501 Share Class B 1,562,133 1,741,781 (1,460,557) 1,843,357 Share Class I 532,571 1,068,899 (1,300,748) 300,722 Share Class Z 2,077,421 2,636,245 (1,563,361) 3,150,305
Global Brands Fund (USD)
Share Class A 23,311,311 27,858,820 (15,958,502) 35,211,629 Share Class AH (CHF) 105,799 2,003,953 (432,420) 1,677,332 Share Class AH (EUR) 4,542,990 6,776,562 (3,859,985) 7,459,567 Share Class AHX (EUR) 62,425 1,081,067 (387,058) 756,434 Share Class AX 1,866,055 3,435,981 (968,320) 4,333,716 Share Class B 6,953,395 4,604,065 (3,732,325) 7,825,135 Share Class BH (EUR) 5,497,236 3,709,166 (2,980,858) 6,225,544 Share Class BHX (EUR) 150,137 431,483 (83,609) 498,011 Share Class BX 198,430 775,109 (167,457) 806,082 Share Class C 1,709,120 3,489,583 (482,785) 4,715,918 Share Class CH (EUR) 40,083 236,150 (52,722) 223,511 Share Class I 15,411,290 11,017,857 (10,718,891) 15,710,256 Share Class Z 26,611,380 57,934,134 (20,833,683) 63,711,831 Share Class ZH (EUR) 5,365,957 7,155,532 (3,436,695) 9,084,794 Share Class ZH (GBP) 250,068 3,869,598 (486,139) 3,633,527 Share Class ZX 5,918,182 4,968,289 (1,615,801) 9,270,670
Global Equity Allocation Fund (USD)
Share Class A 4,000 2,409 - 6,409 Share Class B 4,000 13,233 - 17,233 Share Class Z 472,000 - - 472,000
Global Infrastructure Fund (USD)
Share Class A 857,323 1,359,569 (686,494) 1,530,398 Share Class AH (EUR) 322,622 289,062 (307,101) 304,583 Share Class B 510,438 1,119,677 (545,136) 1,084,979 Share Class BH (EUR) 820,842 576,547 (431,282) 966,107 Share Class C 20,373 15,893 (19,677) 16,589 Share Class CH (EUR) - 320 - 320 Share Class I - 119,888 - 119,888 Share Class Z 688,602 1,845,753 (1,256,189) 1,278,166 Share Class ZH (EUR) 117,707 174,859 (84,753) 207,813
Global Opportunity Fund (USD)
Share Class A 101,434 155,419 (192,249) 64,604 Share Class AH (EUR) 21,291 4,497 (17,894) 7,894 Share Class B 50,088 248,211 (236,609) 61,690 Share Class BH (EUR) 30,728 181,831 (119,323) 93,236 Share Class C 6,000 - (5,638) 362 Share Class I - 100,975 - 100,975 Share Class Z 187,048 2,203,618 (582,044) 1,808,622
Global Property Fund (USD)
Share Class A 5,476,921 3,796,853 (4,466,668) 4,807,106 Share Class AH (EUR) 7,325 67,849 (26,671) 48,503 Share Class B 764,517 522,604 (390,619) 896,502 Share Class BH (EUR) 8,480 268,600 (24,866) 252,214 Share Class C 35,810 122,636 (24,866) 133,580 Share Class CH (EUR) 287 387 (287) 387 Share Class I 2,206,674 1,004,771 (1,097,564) 2,113,881 Share Class IX 411,215 15,169 (274,620) 151,764 Share Class Z 13,160,397 7,957,801 (3,675,433) 17,442,765
Indian Equity Fund (USD)
Share Class A 2,995,768 1,178,520 (1,468,546) 2,705,742 Share Class B 2,041,351 861,483 (1,119,925) 1,782,909 Share Class C 6,532 3,046 (3,434) 6,144 Share Class I 116,302 309,570 (374,217) 51,655 Share Class Z 55,200 129,474 (17,845) 166,829
Japanese Equity Fund (JPY)
Share Class A 144,931 227,056 (112,157) 259,830 Share Class B 75,128 23,426 (42,753) 55,801 Share Class C 10,613 1,387 (9,692) 2,308 Share Class I 91,304 4,881 (32,227) 63,958 Share Class Z 729,563 2,325,300 (1,883,736) 1,171,127 Share Class ZH (EUR) 687,556 2,161,608 (1,879,822) 969,342

Morgan Stanley Investment Funds 31 December 2012 162
Statement of changes in number of shares (continued)For the year ended 31 December 2012
Shares at the startof the year
number of sharesissued
number of sharesredeemed
Shares at the end of the year
Latin American Equity Fund (USD)
Share Class A 10,421,916 1,558,305 (2,813,023) 9,167,198 Share Class B 1,321,243 417,878 (680,650) 1,058,471 Share Class C 20,258 169,363 (41,164) 148,457 Share Class I 887,178 253,561 (214,869) 925,870 Share Class Z 70,450 1,901,112 (463,214) 1,508,348
US Advantage Fund (USD)
Share Class A 22,762,041 27,105,846 (20,033,616) 29,834,271 Share Class AH (EUR) 4,887,149 10,667,990 (8,014,395) 7,540,744 Share Class B 2,206,911 3,597,088 (1,987,703) 3,816,296 Share Class BH (EUR) 709,794 1,219,614 (990,484) 938,924 Share Class C 675,826 941,859 (286,220) 1,331,465 Share Class I 5,551,929 9,709,700 (8,169,962) 7,091,667 Share Class N - 2,167,667 - 2,167,667 Share Class Z 16,826,535 40,160,929 (18,066,806) 38,920,658 Share Class ZH (EUR) 1,617,835 9,054,053 (3,232,935) 7,438,953
US Growth Fund (USD)
Share Class A 13,590,057 5,738,366 (10,463,602) 8,864,821 Share Class AH (EUR) 2,569,206 1,373,596 (2,586,311) 1,356,491 Share Class AX 999,885 340,889 (390,945) 949,829 Share Class B 1,788,776 983,455 (1,417,964) 1,354,267 Share Class BH (EUR) 209,181 738,937 (606,991) 341,127 Share Class C 160,700 106,955 (140,111) 127,544 Share Class CH (EUR) - 320 - 320 Share Class I 3,597,315 1,705,339 (2,921,651) 2,381,003 Share Class IX 1,283,630 329,390 (309,289) 1,303,731 Share Class Z 10,018,065 6,579,126 (9,665,600) 6,931,591 Share Class ZH (EUR) 1,457,951 2,448,819 (3,563,272) 343,498
US Property Fund (USD)
Share Class A 2,797,746 5,171,574 (2,437,405) 5,531,915 Share Class AX 14,461 19,239 (33,700) - Share Class B 252,179 289,362 (149,078) 392,463 Share Class I 708,357 1,472,127 (1,499,879) 680,605 Share Class Z 469,220 3,569,193 (1,767,283) 2,271,130
Emerging Markets Corporate Debt Fund (USD)
Share Class A 13,125 2,369,477 (210,925) 2,171,677 Share Class AH (EUR) 411,488 617,038 (89,076) 939,450 Share Class AHX (EUR) 300 112,481 (3,238) 109,543 Share Class AX 1,219 246,033 (13,043) 234,209 Share Class B 92,457 1,186,784 (208,347) 1,070,894 Share Class BH (EUR) 71,678 658,511 (102,610) 627,579 Share Class BHX (EUR) 6,645 845,117 (67,549) 784,213 Share Class BX 10,278 716,354 (90,058) 636,574 Share Class C 400 146,393 (2,128) 144,665 Share Class CH (EUR) - 320 - 320 Share Class Z 1,069,675 1,014,789 (1,173,995) 910,469
Emerging Markets Debt Fund (USD)
Share Class A 1,214,286 3,138,511 (1,613,512) 2,739,285 Share Class AH (EUR) 706,219 1,175,405 (768,538) 1,113,086 Share Class AHX (EUR) 461 79,622 (12,340) 67,743 Share Class ARM - 3,793,463 (576,663) 3,216,800 Share Class AX 49,436 76,606 (13,977) 112,065 Share Class B 1,665,497 1,600,395 (973,107) 2,292,785 Share Class BH (EUR) 894,994 1,515,553 (713,311) 1,697,236 Share Class BHX (EUR) 10,230 561,918 (45,102) 527,046 Share Class BX 14,716 850,732 (108,598) 756,850 Share Class C 44,660 60,525 (31,266) 73,919 Share Class CH (EUR) - 320 - 320 Share Class I 727,517 1,179,197 (1,334,934) 571,780 Share Class NH (EUR) 400,000 - - 400,000 Share Class Z 2,404,591 5,297,787 (4,336,114) 3,366,264 Share Class ZH (EUR) 244,359 590,673 (402,280) 432,752 Share Class ZHX (GBP) 658,422 305,711 (133,346) 830,787

163 Morgan Stanley Investment Funds 31 December 2012
Shares at the startof the year
number of sharesissued
number of sharesredeemed
Shares at the end of the year
Emerging Markets Domestic Debt Fund (USD)
Share Class A 4,638,570 1,429,119 (1,971,348) 4,096,341 Share Class AH (EUR) 239,935 126,777 (214,164) 152,548 Share Class AHX (EUR) 300 29,241 (3,015) 26,526 Share Class ARM - 226,954 (67,197) 159,757 Share Class AX 1,864,697 486,066 (742,686) 1,608,077 Share Class B 6,885,140 1,996,120 (2,674,810) 6,206,450 Share Class BH (EUR) 2,168,651 549,730 (1,125,126) 1,593,255 Share Class BHX (EUR) 18,441 454,633 (92,304) 380,770 Share Class BX 25,053 863,493 (162,206) 726,340 Share Class C 419,614 123,763 (127,018) 416,359 Share Class CH (EUR) - 320 - 320 Share Class I 323,013 1,475,930 (886,587) 912,356 Share Class Z 2,539,584 3,833,439 (2,410,756) 3,962,267 Share Class ZH (EUR) 2,649,581 555,773 (810,678) 2,394,676 Share Class ZX 360,068 1,920,922 (53,791) 2,227,199
Euro Bond Fund (EUR)
Share Class A 6,940,668 7,360,368 (6,652,031) 7,649,005 Share Class B 5,351,770 2,361,966 (2,515,417) 5,198,319 Share Class C 51,374 31,811 (17,190) 65,995 Share Class I 1,253,671 6,736,665 (6,292,429) 1,697,907 Share Class IX 94,125 16,000 (110,125) - Share Class Z 18,436,077 3,596,706 (6,893,627) 15,139,156
Euro Corporate Bond (ex Financials) Fund (EUR) (1)
Share Class A - 106,114 (6,533) 99,581 Share Class AX - 2,549 - 2,549 Share Class N 1,301,966 1,576,927 - 2,878,893 Share Class Z - 2,057,063 (992,545) 1,064,518
Euro Corporate Bond Fund (EUR)
Share Class A 11,070,554 6,031,649 (7,459,113) 9,643,090 Share Class AD 8,068,275 2,101,360 (4,781,040) 5,388,595 Share Class ADX 55,834 73,909 (23,848) 105,895 Share Class AX 2,543,804 952,486 (604,816) 2,891,474 Share Class B 4,645,567 2,117,756 (2,203,134) 4,560,189 Share Class BD 3,534,003 400,379 (2,018,821) 1,915,561 Share Class BDX 589,327 795,211 (269,314) 1,115,224 Share Class BX 351,359 1,421,189 (237,773) 1,534,775 Share Class C 34,060 36,326 (18,959) 51,427 Share Class CD 26,622 2,667 (21,710) 7,579 Share Class I 2,858,339 3,723,293 (2,346,862) 4,234,770 Share Class N 651,850 - (651,850) - Share Class NX 82,402 - - 82,402 Share Class S 600,000 2,091,278 - 2,691,278 Share Class Z 11,936,158 10,923,577 (14,673,320) 8,186,415 Share Class ZD 2,412,291 3,387,018 (1,989,341) 3,809,968
Euro Strategic Bond Fund (EUR)
Share Class A 1,789,926 2,344,947 (1,261,453) 2,873,420 Share Class AD 553,944 22,444 (276,405) 299,983 Share Class ADX 260,863 25,291 (141,579) 144,575 Share Class AX 92,724 2,399,180 (45,852) 2,446,052 Share Class B 2,726,611 1,748,309 (1,069,355) 3,405,565 Share Class BD 2,443,624 126,198 (1,086,594) 1,483,228 Share Class BDX 2,158,586 513,748 (935,432) 1,736,902 Share Class BX 362,847 1,256,055 (182,432) 1,436,470 Share Class C 1,257 7,991 (3,462) 5,786 Share Class CD 29,528 1,291 (12,880) 17,939 Share Class I 245,337 2,258,418 (2,012,009) 491,746 Share Class Z 725,212 1,067,746 (848,544) 944,414 Share Class ZD 559,567 100,712 (172,476) 487,803
(1) Name changed from Global Strategic Bond Fund on 1 March 2012.
Statement of changes in number of shares (continued)For the year ended 31 December 2012

Morgan Stanley Investment Funds 31 December 2012 164
Statement of changes in number of shares (continued)For the year ended 31 December 2012
Shares at the startof the year
number of sharesissued
number of sharesredeemed
Shares at the end of the year
European Currencies High Yield Bond Fund (EUR)
Share Class A 3,598,238 5,900,351 (3,879,723) 5,618,866 Share Class AD 3,804 5,229 (4,760) 4,273 Share Class ADX 23,290 99,406 (15,418) 107,278 Share Class AX 300 60,287 (2,977) 57,610 Share Class B 10,250,723 2,977,420 (4,971,431) 8,256,712 Share Class BD 36,601 69,318 (27,500) 78,419 Share Class BDX 208,824 629,118 (96,733) 741,209 Share Class BX 8,286 1,012,978 (25,074) 996,190 Share Class C 119,773 61,570 (34,130) 147,213 Share Class CD 1,000 442 - 1,442 Share Class I 623,689 11,977,518 (4,582,681) 8,018,526 Share Class Z 3,608,532 3,173,187 (2,915,918) 3,865,801 Share Class ZD 1,000 35,431 (36,431) -
Global Bond Fund (USD)
Share Class A 2,731,350 1,436,768 (1,350,663) 2,817,455 Share Class AH (EUR) 102,553 126,444 (67,500) 161,497 Share Class AHX (EUR) 300 54,918 (7,118) 48,100 Share Class AX 42,981 92,192 (21,406) 113,767 Share Class B 2,541,645 3,467,608 (2,021,508) 3,987,745 Share Class BH (EUR) 593,558 1,539,243 (566,091) 1,566,710 Share Class BHX (EUR) 28,140 554,771 (86,548) 496,363 Share Class BX 35,409 778,405 (101,112) 712,702 Share Class C 15,403 69,235 (13,406) 71,232 Share Class CH (EUR) - 320 - 320 Share Class I 2,130,528 1,024,345 (1,427,703) 1,727,170 Share Class IX 2,737 5 (2,742) - Share Class Z 1,610,860 8,563,485 (2,275,144) 7,899,201
Global Convertible Bond Fund (USD)
Share Class A 2,352,270 726,174 (1,089,042) 1,989,402 Share Class AH (CHF) - 380 - 380 Share Class AH (EUR) 2,095,054 312,331 (884,885) 1,522,500 Share Class B 978,664 413,342 (550,771) 841,235 Share Class BH (EUR) 2,045,067 502,234 (1,129,814) 1,417,487 Share Class CH (EUR) 24,885 4,888 (11,074) 18,699 Share Class I 259,633 1,000,724 (850,970) 409,387 Share Class IH (EUR) 1,482,574 757,769 (243,914) 1,996,429 Share Class S 16,420,293 40,648 - 16,460,941 Share Class Z 1,466,062 290,570 (758,970) 997,662 Share Class ZH (CHF) - 380 - 380 Share Class ZH (EUR) 1,197,740 3,796,264 (2,551,196) 2,442,808 Share Class ZHX (EUR) 1,889,329 640,899 (709) 2,529,519
Global Credit Fund (USD) (1)
Share Class A - 4,000 - 4,000 Share Class B - 4,000 - 4,000 Share Class C - 4,000 - 4,000 Share Class I - 4,000 - 4,000 Share Class Z - 780,000 - 780,000 Share Class ZX - 4,000 - 4,000
Global Fixed Income Opportunities Fund (USD)
Share Class A 4,000 260,789 (20,436) 244,353 Share Class AH (EUR) - 134,343 (13,117) 121,226 Share Class AHX (EUR) 2,840 240,133 (2,234) 240,739 Share Class AX 4,000 75,250 (3,250) 76,000 Share Class B 21,335 648,967 (81,686) 588,616 Share Class BH (EUR) 362,380 (2,596) 359,784 Share Class BHX (EUR) 10,525 570,481 (18,970) 562,036 Share Class BX 5,663 297,558 (27,067) 276,154 Share Class C - 2,178 - 2,178 Share Class CH (EUR) - 320 - 320 Share Class CHX (EUR) - 320 - 320 Share Class Z 776,000 1,582,420 (701,447) 1,656,973
(1) Fund commenced operations on 14 November 2012.

165 Morgan Stanley Investment Funds 31 December 2012
Statement of changes in number of shares (continued)For the year ended 31 December 2012
Shares at the startof the year
number of sharesissued
number of sharesredeemed
Shares at the end of the year
Global High Yield Bond Fund (USD)
Share Class A 4,000 130,863 (42,685) 92,178 Share Class AH (EUR) - 21,191 - 21,191 Share Class AHX (EUR) 2,920 34,131 (2,771) 34,280 Share Class AX 4,000 17,546 (3,664) 17,882 Share Class B 4,000 176,321 (29,966) 150,355 Share Class BH (EUR) - 78,892 (1,031) 77,861 Share Class BHX (EUR) 2,920 318,548 (658) 320,810 Share Class BX 4,000 137,980 (729) 141,251 Share Class C - 33,718 - 33,718 Share Class CH (EUR) - 320 - 320 Share Class Z 372,000 66,752 (70,831) 367,921 Share Class ZX 4,000 - - 4,000
Global Mortgage Securities Fund (USD) (1)
Share Class A - 4,000 - 4,000 Share Class AH (EUR) - 3,080 - 3,080 Share Class AHR (EUR) - 310 - 310 Share Class AHX (EUR) - 3,080 - 3,080 Share Class B - 4,000 - 4,000 Share Class BH (EUR) - 3,080 - 3,080 Share Class BHR (EUR) - 310 - 310 Share Class BHX (EUR) - 3,080 - 3,080 Share Class C - 4,000 - 4,000 Share Class CH (EUR) - 3,080 - 3,080 Share Class CHX (EUR) - 3,080 - 3,080 Share Class I - 4,000 - 4,000 Share Class Z - 755,200 - 755,200 Share Class ZX - 4,000 - 4,000
Global Premier Credit Fund (USD) (2)
Share Class A - 4,000 - 4,000 Share Class AH (EUR) - 3,080 - 3,080 Share Class B - 4,000 - 4,000 Share Class BH (EUR) - 3,080 - 3,080 Share Class C - 4,000 - 4,000 Share Class CH (EUR) - 3,080 - 3,080 Share Class I - 4,000 - 4,000 Share Class Z - 368,000 - 368,000 Share Class ZX - 4,000 - 4,000
Short Maturity Euro Bond Fund (EUR)
Share Class A 3,833,518 7,352,976 (4,718,888) 6,467,606 Share Class B 9,106,324 3,396,085 (4,310,906) 8,191,503 Share Class C 11,335 4,518 (2,437) 13,416 Share Class I 3,838,733 3,600,881 (4,121,240) 3,318,374 Share Class Z 4,911,083 6,110,099 (6,838,965) 4,182,217
Euro Liquidity Fund (EUR)
Share Class A 5,245,429 5,008,499 (6,754,463) 3,499,465 Share Class B 5,165,018 8,214,710 (9,925,712) 3,454,016 Share Class C 54,465 6,277 (57,085) 3,657 Share Class I 3,031,139 7,052,620 (9,096,418) 987,341 Share Class Z 2,881,577 4,081,451 (6,313,976) 649,052
US Dollar Liquidity Fund (USD)
Share Class A 6,103,211 28,958,173 (19,086,341) 15,975,043 Share Class AX 331,596,020 5,654,835,429 (2,647,798,475) 3,338,632,974 Share Class B 131,194 227,183 (249,509) 108,868 Share Class BX 2,369,445 2,254,662 (3,558,921) 1,065,186 Share Class I 4,490,683 2,760,668 (3,855,993) 3,395,358 Share Class IX 55,988 4 (55,992) - Share Class Z 1,313,004 4,561,926 (3,906,147) 1,968,783
(1) Fund commenced operations on 3 December 2012.(2) Fund commenced operations on 10 December 2012.

Morgan Stanley Investment Funds 31 December 2012 166
Shares at the startof the year
number of sharesissued
number of sharesredeemed
Shares at the end of the year
Diversified Alpha Plus Fund (EUR)
Share Class A 2,950,697 2,335,610 (1,626,967) 3,659,340 Share Class AH (USD) 1,557,590 989,041 (953,566) 1,593,065 Share Class B 10,194,687 3,416,624 (3,143,928) 10,467,383 Share Class BH (USD) 92,871 1,843 (14,055) 80,659 Share Class C 99,257 51,162 (21,646) 128,773 Share Class I 181,593 191,801 (43,387) 330,007 Share Class Z 589,413 5,092,562 (1,186,383) 4,495,592 Share Class ZH (GBP) 1,042,416 2,914,918 (393,460) 3,563,874 Share Class ZH (USD) - 42,450 - 42,450
Global Balanced Risk Control Fund of Funds (EUR)
Share Class A 7,200 412,027 (97,419) 321,808 Share Class B 10,910 2,833,555 (269,345) 2,575,120 Share Class C - 320 - 320 Share Class Z - 3,970,111 (126,304) 3,843,807
Absolute Return Currency Fund (EUR)
Share Class A 395,709 129,306 (344,646) 180,369 Share Class A1 304 - - 304 Share Class AH (SEK) - 81,540 (47,592) 33,948 Share Class AH (USD) 98,191 66,297 (76,639) 87,849 Share Class B 1,007,899 71,599 (482,971) 596,527 Share Class I 2,610 - (142) 2,468 Share Class IH (USD) 47,634 - (46,517) 1,117 Share Class Z 34,957 9,936 (34,893) 10,000
Statement of changes in number of shares (continued)For the year ended 31 December 2012
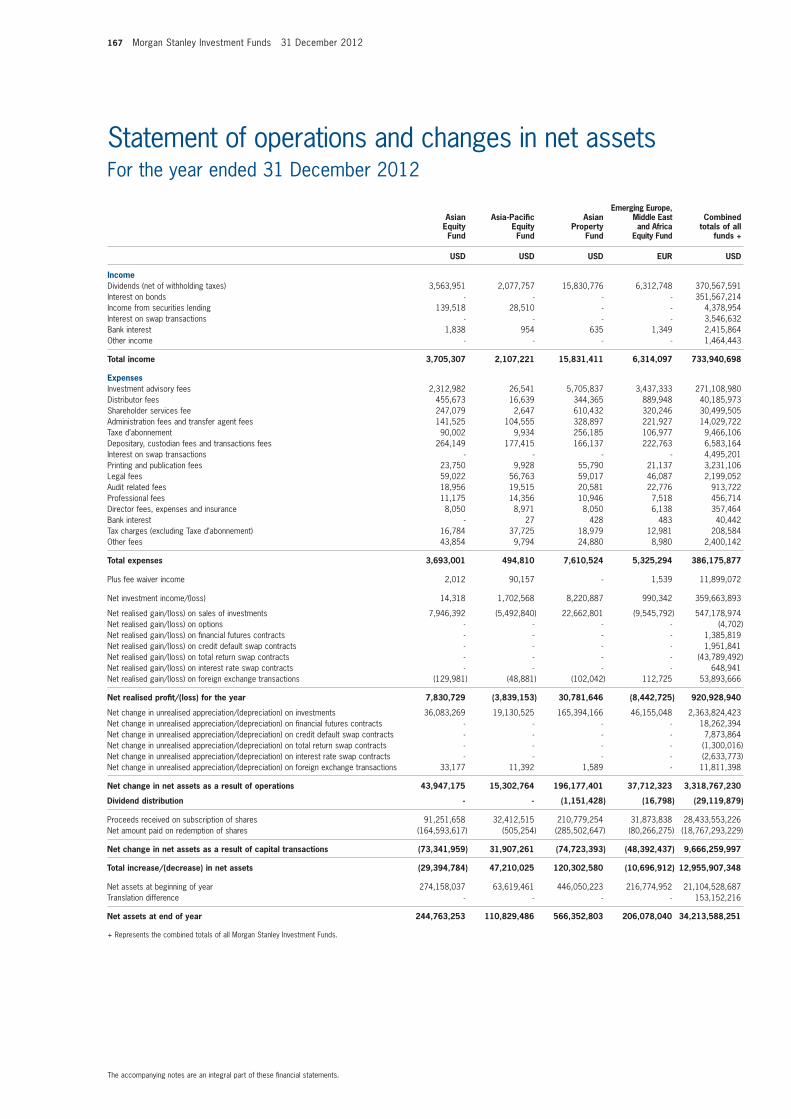
167 Morgan Stanley Investment Funds 31 December 2012
The accompanying notes are an integral part of these financial statements.
Statement of operations and changes in net assetsFor the year ended 31 December 2012
asianequityfund
asia-Pacificequity
fund
asian Property
fund
emerging europe,middle eastand africa
equity fund
Combinedtotals of all
funds +
USD USD USD eUr USD
income Dividends (net of withholding taxes) 3,563,951 2,077,757 15,830,776 6,312,748 370,567,591Interest on bonds - - - - 351,567,214Income from securities lending 139,518 28,510 - - 4,378,954Interest on swap transactions - - - - 3,546,632Bank interest 1,838 954 635 1,349 2,415,864Other income - - - - 1,464,443
total income 3,705,307 2,107,221 15,831,411 6,314,097 733,940,698
expensesInvestment advisory fees 2,312,982 26,541 5,705,837 3,437,333 271,108,980Distributor fees 455,673 16,639 344,365 889,948 40,185,973Shareholder services fee 247,079 2,647 610,432 320,246 30,499,505Administration fees and transfer agent fees 141,525 104,555 328,897 221,927 14,029,722Taxe d’abonnement 90,002 9,934 256,185 106,977 9,466,106Depositary, custodian fees and transactions fees 264,149 177,415 166,137 222,763 6,583,164Interest on swap transactions - - - - 4,495,201Printing and publication fees 23,750 9,928 55,790 21,137 3,231,106Legal fees 59,022 56,763 59,017 46,087 2,199,052Audit related fees 18,956 19,515 20,581 22,776 913,722Professional fees 11,175 14,356 10,946 7,518 456,714Director fees, expenses and insurance 8,050 8,971 8,050 6,138 357,464Bank interest - 27 428 483 40,442Tax charges (excluding Taxe d’abonnement) 16,784 37,725 18,979 12,981 208,584Other fees 43,854 9,794 24,880 8,980 2,400,142
total expenses 3,693,001 494,810 7,610,524 5,325,294 386,175,877
Plus fee waiver income 2,012 90,157 - 1,539 11,899,072
Net investment income/(loss) 14,318 1,702,568 8,220,887 990,342 359,663,893
Net realised gain/(loss) on sales of investments 7,946,392 (5,492,840) 22,662,801 (9,545,792) 547,178,974Net realised gain/(loss) on options - - - - (4,702)Net realised gain/(loss) on financial futures contracts - - - - 1,385,819Net realised gain/(loss) on credit default swap contracts - - - - 1,951,841Net realised gain/(loss) on total return swap contracts - - - - (43,789,492)Net realised gain/(loss) on interest rate swap contracts - - - - 648,941Net realised gain/(loss) on foreign exchange transactions (129,981) (48,881) (102,042) 112,725 53,893,666
net realised profit/(loss) for the year 7,830,729 (3,839,153) 30,781,646 (8,442,725) 920,928,940
Net change in unrealised appreciation/(depreciation) on investments 36,083,269 19,130,525 165,394,166 46,155,048 2,363,824,423Net change in unrealised appreciation/(depreciation) on financial futures contracts - - - - 18,262,394Net change in unrealised appreciation/(depreciation) on credit default swap contracts - - - - 7,873,864Net change in unrealised appreciation/(depreciation) on total return swap contracts - - - - (1,300,016)Net change in unrealised appreciation/(depreciation) on interest rate swap contracts - - - - (2,633,773)Net change in unrealised appreciation/(depreciation) on foreign exchange transactions 33,177 11,392 1,589 - 11,811,398
net change in net assets as a result of operations 43,947,175 15,302,764 196,177,401 37,712,323 3,318,767,230
Dividend distribution - - (1,151,428) (16,798) (29,119,879)
Proceeds received on subscription of shares 91,251,658 32,412,515 210,779,254 31,873,838 28,433,553,226Net amount paid on redemption of shares (164,593,617) (505,254) (285,502,647) (80,266,275) (18,767,293,229)
net change in net assets as a result of capital transactions (73,341,959) 31,907,261 (74,723,393) (48,392,437) 9,666,259,997
total increase/(decrease) in net assets (29,394,784) 47,210,025 120,302,580 (10,696,912) 12,955,907,348
Net assets at beginning of year 274,158,037 63,619,461 446,050,223 216,774,952 21,104,528,687Translation difference - - - - 153,152,216
net assets at end of year 244,763,253 110,829,486 566,352,803 206,078,040 34,213,588,251
+ Represents the combined totals of all Morgan Stanley Investment Funds.
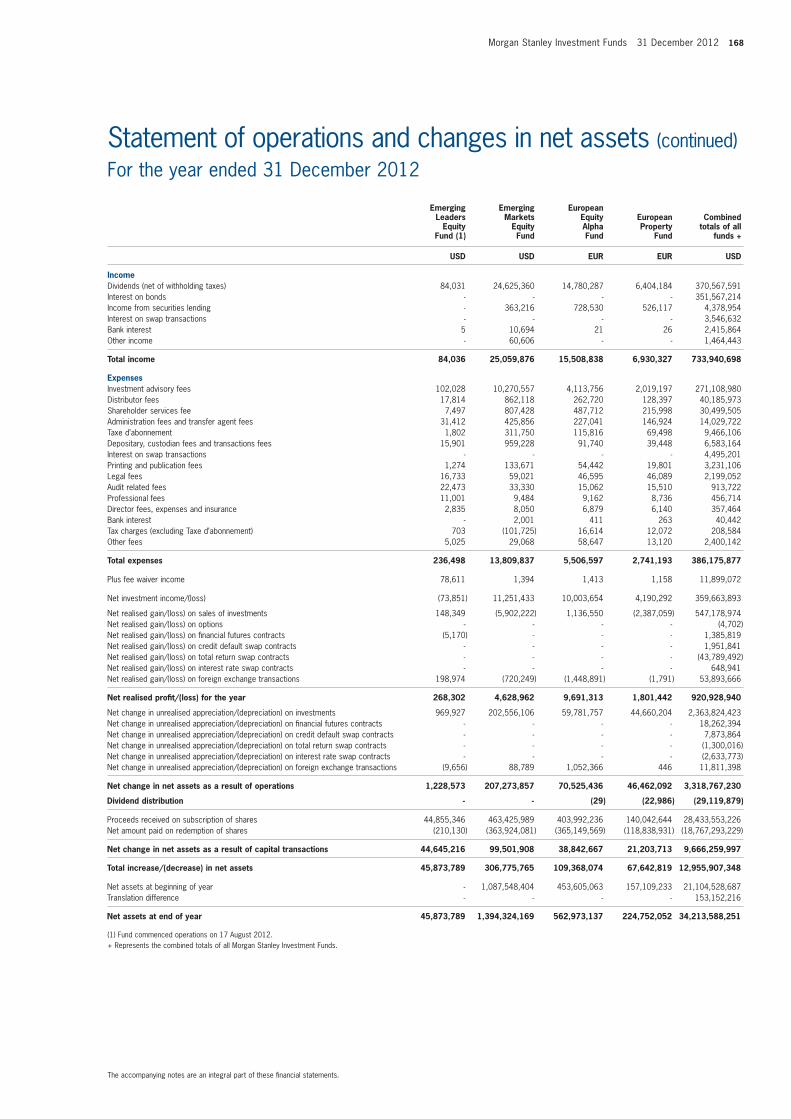
Morgan Stanley Investment Funds 31 December 2012 168
The accompanying notes are an integral part of these financial statements.
Statement of operations and changes in net assets (continued)For the year ended 31 December 2012
emerging Leaders
equity fund (1)
emergingmarkets
equityfund
europeanequityalphafund
europeanProperty
fund
Combinedtotals of all
funds +
USD USD eUr eUr USD
income Dividends (net of withholding taxes) 84,031 24,625,360 14,780,287 6,404,184 370,567,591Interest on bonds - - - - 351,567,214Income from securities lending - 363,216 728,530 526,117 4,378,954Interest on swap transactions - - - - 3,546,632Bank interest 5 10,694 21 26 2,415,864Other income - 60,606 - - 1,464,443
total income 84,036 25,059,876 15,508,838 6,930,327 733,940,698
expensesInvestment advisory fees 102,028 10,270,557 4,113,756 2,019,197 271,108,980Distributor fees 17,814 862,118 262,720 128,397 40,185,973Shareholder services fee 7,497 807,428 487,712 215,998 30,499,505Administration fees and transfer agent fees 31,412 425,856 227,041 146,924 14,029,722Taxe d’abonnement 1,802 311,750 115,816 69,498 9,466,106Depositary, custodian fees and transactions fees 15,901 959,228 91,740 39,448 6,583,164Interest on swap transactions - - - - 4,495,201Printing and publication fees 1,274 133,671 54,442 19,801 3,231,106Legal fees 16,733 59,021 46,595 46,089 2,199,052Audit related fees 22,473 33,330 15,062 15,510 913,722Professional fees 11,001 9,484 9,162 8,736 456,714Director fees, expenses and insurance 2,835 8,050 6,879 6,140 357,464Bank interest - 2,001 411 263 40,442Tax charges (excluding Taxe d’abonnement) 703 (101,725) 16,614 12,072 208,584Other fees 5,025 29,068 58,647 13,120 2,400,142
total expenses 236,498 13,809,837 5,506,597 2,741,193 386,175,877
Plus fee waiver income 78,611 1,394 1,413 1,158 11,899,072
Net investment income/(loss) (73,851) 11,251,433 10,003,654 4,190,292 359,663,893
Net realised gain/(loss) on sales of investments 148,349 (5,902,222) 1,136,550 (2,387,059) 547,178,974Net realised gain/(loss) on options - - - - (4,702)Net realised gain/(loss) on financial futures contracts (5,170) - - - 1,385,819Net realised gain/(loss) on credit default swap contracts - - - - 1,951,841Net realised gain/(loss) on total return swap contracts - - - - (43,789,492)Net realised gain/(loss) on interest rate swap contracts - - - - 648,941Net realised gain/(loss) on foreign exchange transactions 198,974 (720,249) (1,448,891) (1,791) 53,893,666
net realised profit/(loss) for the year 268,302 4,628,962 9,691,313 1,801,442 920,928,940
Net change in unrealised appreciation/(depreciation) on investments 969,927 202,556,106 59,781,757 44,660,204 2,363,824,423Net change in unrealised appreciation/(depreciation) on financial futures contracts - - - - 18,262,394Net change in unrealised appreciation/(depreciation) on credit default swap contracts - - - - 7,873,864Net change in unrealised appreciation/(depreciation) on total return swap contracts - - - - (1,300,016)Net change in unrealised appreciation/(depreciation) on interest rate swap contracts - - - - (2,633,773)Net change in unrealised appreciation/(depreciation) on foreign exchange transactions (9,656) 88,789 1,052,366 446 11,811,398
net change in net assets as a result of operations 1,228,573 207,273,857 70,525,436 46,462,092 3,318,767,230
Dividend distribution - - (29) (22,986) (29,119,879)
Proceeds received on subscription of shares 44,855,346 463,425,989 403,992,236 140,042,644 28,433,553,226Net amount paid on redemption of shares (210,130) (363,924,081) (365,149,569) (118,838,931) (18,767,293,229)
net change in net assets as a result of capital transactions 44,645,216 99,501,908 38,842,667 21,203,713 9,666,259,997
total increase/(decrease) in net assets 45,873,789 306,775,765 109,368,074 67,642,819 12,955,907,348
Net assets at beginning of year - 1,087,548,404 453,605,063 157,109,233 21,104,528,687Translation difference - - - - 153,152,216
net assets at end of year 45,873,789 1,394,324,169 562,973,137 224,752,052 34,213,588,251
(1) Fund commenced operations on 17 August 2012.+ Represents the combined totals of all Morgan Stanley Investment Funds.

169 Morgan Stanley Investment Funds 31 December 2012
The accompanying notes are an integral part of these financial statements.
Statement of operations and changes in net assets (continued)For the year ended 31 December 2012
european Small Cap
valuefund (1)
eurozoneequityalphafund
GlobalBrands
fund
Global equity
allocation fund
Combinedtotals of all
funds +
eUr eUr USD USD USD
income Dividends (net of withholding taxes) 355,822 3,199,309 185,422,076 212,603 370,567,591Interest on bonds - - - - 351,567,214Income from securities lending - 368,252 - - 4,378,954Interest on swap transactions - - - - 3,546,632Bank interest 23 - 51,716 1,085 2,415,864Other income 678 10,937 - - 1,464,443
total income 356,523 3,578,498 185,473,792 213,688 733,940,698
expensesInvestment advisory fees 129,273 1,124,140 83,657,698 77,167 271,108,980Distributor fees 41,345 108,826 8,500,225 1,751 40,185,973Shareholder services fee 12,119 120,234 8,862,293 10,570 30,499,505Administration fees and transfer agent fees 24,892 102,071 2,727,047 44,473 14,029,722Taxe d’abonnement 4,040 31,400 2,911,320 1,623 9,466,106Depositary, custodian fees and transactions fees 23,612 40,767 980,989 23,144 6,583,164Interest on swap transactions - - - - 4,495,201Printing and publication fees 1,304 14,161 893,093 1,315 3,231,106Legal fees 32,408 46,091 58,751 50,959 2,199,052Audit related fees 13,804 11,470 25,453 24,950 913,722Professional fees - 8,736 11,587 11,034 456,714Director fees, expenses and insurance 3,970 6,138 8,050 5,340 357,464Bank interest 457 429 - 336 40,442Tax charges (excluding Taxe d’abonnement) 5,185 11,584 86,765 943 208,584Other fees 10,081 19,776 794,870 18,562 2,400,142
total expenses 302,490 1,645,823 109,518,141 272,167 386,175,877
Plus fee waiver income 70,048 248 - 144,849 11,899,072
Net investment income/(loss) 124,081 1,932,923 75,955,651 86,370 359,663,893
Net realised gain/(loss) on sales of investments (886,459) (637,011) 195,885,787 121,408 547,178,974Net realised gain/(loss) on options - - - - (4,702)Net realised gain/(loss) on financial futures contracts - - - 316,271 1,385,819Net realised gain/(loss) on credit default swap contracts - - - - 1,951,841Net realised gain/(loss) on total return swap contracts - - - - (43,789,492)Net realised gain/(loss) on interest rate swap contracts - - - - 648,941Net realised gain/(loss) on foreign exchange transactions (42,704) (8,908) 24,979,295 33,725 53,893,666
net realised profit/(loss) for the year (805,082) 1,287,004 296,820,733 557,774 920,928,940
Net change in unrealised appreciation/(depreciation) on investments 2,574,015 20,917,475 548,913,568 994,198 2,363,824,423Net change in unrealised appreciation/(depreciation) on financial futures contracts - - - (40,763) 18,262,394Net change in unrealised appreciation/(depreciation) on credit default swap contracts - - - - 7,873,864Net change in unrealised appreciation/(depreciation) on total return swap contracts - - - - (1,300,016)Net change in unrealised appreciation/(depreciation) on interest rate swap contracts - - - - (2,633,773)Net change in unrealised appreciation/(depreciation) on foreign exchange transactions - - (146,428) 15,600 11,811,398
net change in net assets as a result of operations 1,768,933 22,204,479 845,587,873 1,526,809 3,318,767,230
Dividend distribution (5,086) - (7,947,630) - (29,119,879)
Proceeds received on subscription of shares 6,648,408 102,988,803 6,906,437,147 429,935 28,433,553,226Net amount paid on redemption of shares (19,745,446) (71,167,163) (3,724,443,649) - (18,767,293,229)
net change in net assets as a result of capital transactions (13,097,038) 31,821,640 3,181,993,498 429,935 9,666,259,997
total increase/(decrease) in net assets (11,333,191) 54,026,119 4,019,633,741 1,956,744 12,955,907,348
Net assets at beginning of year 11,333,191 91,833,726 5,072,244,032 12,018,704 21,104,528,687Translation difference - - - - 153,152,216
net assets at end of year - 145,859,845 9,091,877,773 13,975,448 34,213,588,251
(1) Fund merged into European Equity Alpha Fund on 26 July 2012.+ Represents the combined totals of all Morgan Stanley Investment Funds.
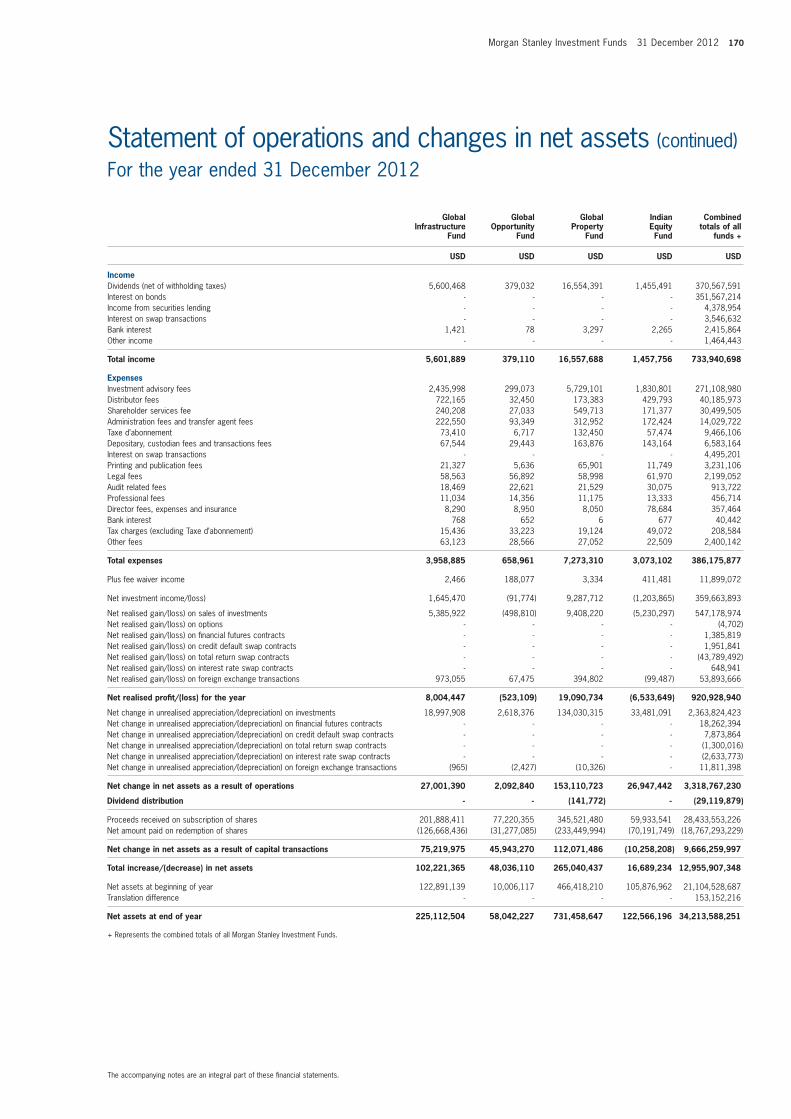
Morgan Stanley Investment Funds 31 December 2012 170
The accompanying notes are an integral part of these financial statements.
Statement of operations and changes in net assets (continued)For the year ended 31 December 2012
Globalinfrastructure
fund
Global
opportunityfund
GlobalProperty
fund
indianequityfund
Combinedtotals of all
funds +
USD USD USD USD USD
income Dividends (net of withholding taxes) 5,600,468 379,032 16,554,391 1,455,491 370,567,591Interest on bonds - - - - 351,567,214Income from securities lending - - - - 4,378,954Interest on swap transactions - - - - 3,546,632Bank interest 1,421 78 3,297 2,265 2,415,864Other income - - - - 1,464,443
total income 5,601,889 379,110 16,557,688 1,457,756 733,940,698
expensesInvestment advisory fees 2,435,998 299,073 5,729,101 1,830,801 271,108,980Distributor fees 722,165 32,450 173,383 429,793 40,185,973Shareholder services fee 240,208 27,033 549,713 171,377 30,499,505Administration fees and transfer agent fees 222,550 93,349 312,952 172,424 14,029,722Taxe d’abonnement 73,410 6,717 132,450 57,474 9,466,106Depositary, custodian fees and transactions fees 67,544 29,443 163,876 143,164 6,583,164Interest on swap transactions - - - - 4,495,201Printing and publication fees 21,327 5,636 65,901 11,749 3,231,106Legal fees 58,563 56,892 58,998 61,970 2,199,052Audit related fees 18,469 22,621 21,529 30,075 913,722Professional fees 11,034 14,356 11,175 13,333 456,714Director fees, expenses and insurance 8,290 8,950 8,050 78,684 357,464Bank interest 768 652 6 677 40,442Tax charges (excluding Taxe d’abonnement) 15,436 33,223 19,124 49,072 208,584Other fees 63,123 28,566 27,052 22,509 2,400,142
total expenses 3,958,885 658,961 7,273,310 3,073,102 386,175,877
Plus fee waiver income 2,466 188,077 3,334 411,481 11,899,072
Net investment income/(loss) 1,645,470 (91,774) 9,287,712 (1,203,865) 359,663,893
Net realised gain/(loss) on sales of investments 5,385,922 (498,810) 9,408,220 (5,230,297) 547,178,974Net realised gain/(loss) on options - - - - (4,702)Net realised gain/(loss) on financial futures contracts - - - - 1,385,819Net realised gain/(loss) on credit default swap contracts - - - - 1,951,841Net realised gain/(loss) on total return swap contracts - - - - (43,789,492)Net realised gain/(loss) on interest rate swap contracts - - - - 648,941Net realised gain/(loss) on foreign exchange transactions 973,055 67,475 394,802 (99,487) 53,893,666
net realised profit/(loss) for the year 8,004,447 (523,109) 19,090,734 (6,533,649) 920,928,940
Net change in unrealised appreciation/(depreciation) on investments 18,997,908 2,618,376 134,030,315 33,481,091 2,363,824,423Net change in unrealised appreciation/(depreciation) on financial futures contracts - - - - 18,262,394Net change in unrealised appreciation/(depreciation) on credit default swap contracts - - - - 7,873,864Net change in unrealised appreciation/(depreciation) on total return swap contracts - - - - (1,300,016)Net change in unrealised appreciation/(depreciation) on interest rate swap contracts - - - - (2,633,773)Net change in unrealised appreciation/(depreciation) on foreign exchange transactions (965) (2,427) (10,326) - 11,811,398
net change in net assets as a result of operations 27,001,390 2,092,840 153,110,723 26,947,442 3,318,767,230
Dividend distribution - - (141,772) - (29,119,879)
Proceeds received on subscription of shares 201,888,411 77,220,355 345,521,480 59,933,541 28,433,553,226Net amount paid on redemption of shares (126,668,436) (31,277,085) (233,449,994) (70,191,749) (18,767,293,229)
net change in net assets as a result of capital transactions 75,219,975 45,943,270 112,071,486 (10,258,208) 9,666,259,997
total increase/(decrease) in net assets 102,221,365 48,036,110 265,040,437 16,689,234 12,955,907,348
Net assets at beginning of year 122,891,139 10,006,117 466,418,210 105,876,962 21,104,528,687Translation difference - - - - 153,152,216
net assets at end of year 225,112,504 58,042,227 731,458,647 122,566,196 34,213,588,251
+ Represents the combined totals of all Morgan Stanley Investment Funds.

171 Morgan Stanley Investment Funds 31 December 2012
The accompanying notes are an integral part of these financial statements.
Statement of operations and changes in net assets (continued)For the year ended 31 December 2012
Japanese equity fund
Latinamerican
equityfund
US advantage
fund
USGrowth fund
Combinedtotals of all
funds +
JPY000’s USD USD USD USD
income Dividends (net of withholding taxes) 104,757 19,155,442 33,329,022 6,707,604 370,567,591Interest on bonds - - - - 351,567,214Income from securities lending - 2,030 - 1,082,940 4,378,954Interest on swap transactions - - - - 3,546,632Bank interest - 2,163 41,154 15,767 2,415,864Other income - - 14,223 990 1,464,443
total income 104,757 19,159,635 33,384,399 7,807,301 733,940,698
expensesInvestment advisory fees 40,106 12,524,283 32,136,038 12,066,096 271,108,980Distributor fees 1,375 668,550 1,672,490 652,861 40,185,973Shareholder services fee 4,264 1,158,958 3,483,166 1,310,766 30,499,505Administration fees and transfer agent fees 7,753 339,437 1,258,297 638,106 14,029,722Taxe d’abonnement 783 393,978 1,048,501 439,682 9,466,106Depositary, custodian fees and transactions fees 4,275 527,076 378,309 152,033 6,583,164Interest on swap transactions - - - - 4,495,201Printing and publication fees 566 81,993 358,421 112,498 3,231,106Legal fees 4,800 58,609 58,622 59,069 2,199,052Audit related fees 1,587 18,218 17,869 23,158 913,722Professional fees 932 11,264 11,264 11,034 456,714Director fees, expenses and insurance 659 8,050 8,050 8,050 357,464Bank interest 2 920 - 641 40,442Tax charges (excluding Taxe d’abonnement) 1,145 23,091 42,130 27,562 208,584Other fees 2,731 14,773 269,179 81,468 2,400,142
total expenses 70,978 15,829,200 40,742,336 15,583,024 386,175,877
Plus fee waiver income 8,424 - - 291 11,899,072
Net investment income/(loss) 42,203 3,330,435 (7,357,937) (7,775,432) 359,663,893
Net realised gain/(loss) on sales of investments (459,565) 33,030,860 156,095,940 49,869,562 547,178,974Net realised gain/(loss) on options - - - - (4,702)Net realised gain/(loss) on financial futures contracts - - - - 1,385,819Net realised gain/(loss) on credit default swap contracts - - - - 1,951,841Net realised gain/(loss) on total return swap contracts - - - - (43,789,492)Net realised gain/(loss) on interest rate swap contracts - - - - 648,941Net realised gain/(loss) on foreign exchange transactions 379,395 (580,388) 9,929,340 773,570 53,893,666
net realised profit/(loss) for the year (37,967) 35,780,907 158,667,343 42,867,700 920,928,940
Net change in unrealised appreciation/(depreciation) on investments 1,398,536 51,170,311 108,481,056 87,971,587 2,363,824,423Net change in unrealised appreciation/(depreciation) on financial futures contracts - - - - 18,262,394Net change in unrealised appreciation/(depreciation) on credit default swap contracts - - - - 7,873,864Net change in unrealised appreciation/(depreciation) on total return swap contracts - - - - (1,300,016)Net change in unrealised appreciation/(depreciation) on interest rate swap contracts - - - - (2,633,773)Net change in unrealised appreciation/(depreciation) on foreign exchange transactions 87,518 - (92,124) 159,951 11,811,398
net change in net assets as a result of operations 1,448,087 86,951,218 267,056,275 130,999,238 3,318,767,230
Dividend distribution - - - - (29,119,879)
Proceeds received on subscription of shares 10,527,451 245,961,905 3,913,027,011 731,895,795 28,433,553,226Net amount paid on redemption of shares (8,954,746) (261,677,431) (2,232,829,157) (1,154,233,882) (18,767,293,229)
net change in net assets as a result of capital transactions 1,572,705 (15,715,526) 1,680,197,854 (422,338,087) 9,666,259,997
total increase/(decrease) in net assets 3,020,792 71,235,692 1,947,254,129 (291,338,849) 12,955,907,348
Net assets at beginning of year 3,724,523 777,483,594 1,819,704,199 1,181,309,388 21,104,528,687Translation difference - - - - 153,152,216
net assets at end of year 6,745,315 848,719,286 3,766,958,328 889,970,539 34,213,588,251
+ Represents the combined totals of all Morgan Stanley Investment Funds.

Morgan Stanley Investment Funds 31 December 2012 172
The accompanying notes are an integral part of these financial statements.
Statement of operations and changes in net assets (continued)For the year ended 31 December 2012
USProperty
fund
emergingmarkets
Corporate Debt fund
emergingmarkets
Debtfund
emergingmarkets
Domestic Debtfund
Combinedtotals of all
funds +
USD USD USD USD USD
income Dividends (net of withholding taxes) 6,588,006 21,832 144,828 99,955 370,567,591Interest on bonds - 7,392,421 37,455,209 45,059,679 351,567,214Income from securities lending - - 2,367 - 4,378,954Interest on swap transactions - - - - 3,546,632Bank interest 2,150 - 16,372 24,330 2,415,864Other income - - - - 1,464,443
total income 6,590,156 7,414,253 37,618,776 45,183,964 733,940,698
expensesInvestment advisory fees 3,404,601 1,794,883 8,342,627 9,650,494 271,108,980Distributor fees 141,962 440,402 2,036,085 3,079,012 40,185,973Shareholder services fee 364,485 178,110 854,340 983,750 30,499,505Administration fees and transfer agent fees 192,000 176,107 541,993 456,797 14,029,722Taxe d’abonnement 124,291 58,813 269,845 294,967 9,466,106Depositary, custodian fees and transactions fees 39,143 34,530 103,036 326,892 6,583,164Interest on swap transactions - - - - 4,495,201Printing and publication fees 36,466 20,605 85,279 82,342 3,231,106Legal fees 58,590 57,335 58,856 59,051 2,199,052Audit related fees 18,365 16,724 35,106 32,328 913,722Professional fees 11,264 11,034 8,955 8,725 456,714Director fees, expenses and insurance 8,050 8,970 8,050 8,051 357,464Bank interest - 678 467 665 40,442Tax charges (excluding Taxe d’abonnement) (443,792) 10,065 20,432 21,190 208,584Other fees 10,644 36,715 117,167 97,277 2,400,142
total expenses 3,966,069 2,844,971 12,482,238 15,101,541 386,175,877
Plus fee waiver income - 2,511 593 2,450 11,899,072
Net investment income/(loss) 2,624,087 4,571,793 25,137,131 30,084,873 359,663,893
Net realised gain/(loss) on sales of investments 12,978,280 4,175,167 9,889,321 (15,176,109) 547,178,974Net realised gain/(loss) on options - - - - (4,702)Net realised gain/(loss) on financial futures contracts - - 241,223 (256,103) 1,385,819Net realised gain/(loss) on credit default swap contracts - - - - 1,951,841Net realised gain/(loss) on total return swap contracts - - - - (43,789,492)Net realised gain/(loss) on interest rate swap contracts - - - - 648,941Net realised gain/(loss) on foreign exchange transactions (29,601) 2,228,762 7,122,080 7,476,147 53,893,666
net realised profit/(loss) for the year 15,572,766 10,975,722 42,389,755 22,128,808 920,928,940
Net change in unrealised appreciation/(depreciation) on investments 10,821,778 13,677,595 75,312,562 77,489,873 2,363,824,423Net change in unrealised appreciation/(depreciation) on financial futures contracts - - (177,539) - 18,262,394Net change in unrealised appreciation/(depreciation) on credit default swap contracts - - - - 7,873,864Net change in unrealised appreciation/(depreciation) on total return swap contracts - - - - (1,300,016)Net change in unrealised appreciation/(depreciation) on interest rate swap contracts - - - - (2,633,773)Net change in unrealised appreciation/(depreciation) on foreign exchange transactions - (83,007) (25,772) 1,156,205 11,811,398
net change in net assets as a result of operations 26,394,544 24,570,310 117,499,006 100,774,886 3,318,767,230
Dividend distribution (3,529) (405,358) (3,324,079) (4,293,547) (29,119,879)
Proceeds received on subscription of shares 516,879,197 236,236,076 954,624,873 463,575,369 28,433,553,226Net amount paid on redemption of shares (293,550,874) (57,878,922) (576,888,126) (385,426,980) (18,767,293,229)
net change in net assets as a result of capital transactions 223,328,323 178,357,154 377,736,747 78,148,389 9,666,259,997
total increase/(decrease) in net assets 249,719,338 202,522,106 491,911,674 174,629,728 12,955,907,348
Net assets at beginning of year 198,052,321 45,470,150 453,507,125 699,073,456 21,104,528,687Translation difference - - - - 153,152,216
net assets at end of year 447,771,659 247,992,256 945,418,799 873,703,184 34,213,588,251
+ Represents the combined totals of all Morgan Stanley Investment Funds.

173 Morgan Stanley Investment Funds 31 December 2012
The accompanying notes are an integral part of these financial statements.
Statement of operations and changes in net assets (continued)For the year ended 31 December 2012
euroBondfund
euro Corporate Bond (ex financials) fund (1)
euroCorporate
Bondfund
euroStrategic
Bondfund
Combinedtotals of all
funds +
eUr eUr eUr eUr USD
income Dividends (net of withholding taxes) 33,035 4,936 79,716 11,304 370,567,591Interest on bonds 27,103,240 3,363,366 70,577,272 15,402,190 351,567,214Income from securities lending 125,226 - 118,902 20,139 4,378,954Interest on swap transactions 132,167 - 1,256,570 118,691 3,546,632Bank interest 3,126 - 20,332 265 2,415,864Other income - - - 81,216 1,464,443
total income 27,396,794 3,368,302 72,052,792 15,633,805 733,940,698
expensesInvestment advisory fees 3,767,053 95,147 9,673,212 2,815,230 271,108,980Distributor fees 596,759 - 2,610,965 2,035,578 40,185,973Shareholder services fee 678,564 17,021 1,781,616 524,361 30,499,505Administration fees and transfer agent fees 284,945 54,537 724,450 290,561 14,029,722Taxe d’abonnement 139,383 10,279 564,830 173,374 9,466,106Depositary, custodian fees and transactions fees 107,149 24,826 183,206 74,826 6,583,164Interest on swap transactions 86,244 - 1,229,011 585,657 4,495,201Printing and publication fees 71,112 10,847 151,100 41,291 3,231,106Legal fees 45,627 36,699 45,593 45,517 2,199,052Audit related fees 15,398 12,300 22,311 23,957 913,722Professional fees 8,736 8,486 8,736 8,736 456,714Director fees, expenses and insurance 6,140 2,560 6,138 6,107 357,464Bank interest 446 3 3,944 908 40,442Tax charges (excluding Taxe d’abonnement) 18,595 742 25,229 14,136 208,584Other fees 11,366 7,327 17,204 9,469 2,400,142
total expenses 5,837,517 280,774 17,047,545 6,649,708 386,175,877
Plus fee waiver income 95 3,040 2,583 3,855 11,899,072
Net investment income/(loss) 21,559,372 3,090,568 55,007,830 8,987,952 359,663,893
Net realised gain/(loss) on sales of investments 14,116,839 769,732 20,847,412 5,947,901 547,178,974Net realised gain/(loss) on options - - - - (4,702)Net realised gain/(loss) on financial futures contracts (890,318) (201,855) (21,279,765) (7,276,068) 1,385,819Net realised gain/(loss) on credit default swap contracts - - 630,239 (14,053) 1,951,841Net realised gain/(loss) on total return swap contracts - - - - (43,789,492)Net realised gain/(loss) on interest rate swap contracts - - - 347,888 648,941Net realised gain/(loss) on foreign exchange transactions 3,582 27,247 (7,318,089) (1,331,401) 53,893,666
net realised profit/(loss) for the year 34,789,475 3,685,692 47,887,627 6,662,219 920,928,940
Net change in unrealised appreciation/(depreciation) on investments 46,826,103 3,865,195 185,611,286 31,289,608 2,363,824,423Net change in unrealised appreciation/(depreciation) on financial futures contracts 275,909 (22,779) 5,741,331 2,352,554 18,262,394Net change in unrealised appreciation/(depreciation) on credit default swap contracts 609,125 - 3,630,336 132,878 7,873,864Net change in unrealised appreciation/(depreciation) on total return swap contracts - - - - (1,300,016)Net change in unrealised appreciation/(depreciation) on interest rate swap contracts - - (1,575,612) (167,893) (2,633,773)Net change in unrealised appreciation/(depreciation) on foreign exchange transactions - 32,552 7,669,942 916,969 11,811,398
net change in net assets as a result of operations 82,500,612 7,560,660 248,964,910 41,186,335 3,318,767,230
Dividend distribution (21,264) (119) (4,774,103) (1,460,756) (29,119,879)
Proceeds received on subscription of shares 334,192,689 97,022,703 1,112,128,250 374,903,348 28,433,553,226Net amount paid on redemption of shares (426,191,595) (25,648,253) (1,198,885,725) (251,963,264) (18,767,293,229)
net change in net assets as a result of capital transactions (91,998,906) 71,374,450 (86,757,475) 122,940,084 9,666,259,997
total increase/(decrease) in net assets (9,519,558) 78,934,991 157,433,332 162,665,663 12,955,907,348
Net assets at beginning of year 717,920,038 32,998,669 1,431,373,502 317,725,281 21,104,528,687Translation difference - - - - 153,152,216
net assets at end of year 708,400,480 111,933,660 1,588,806,834 480,390,944 34,213,588,251
(1) Name changed from Global Strategic Bond Fund on 1 March 2012.+ Represents the combined totals of all Morgan Stanley Investment Funds.
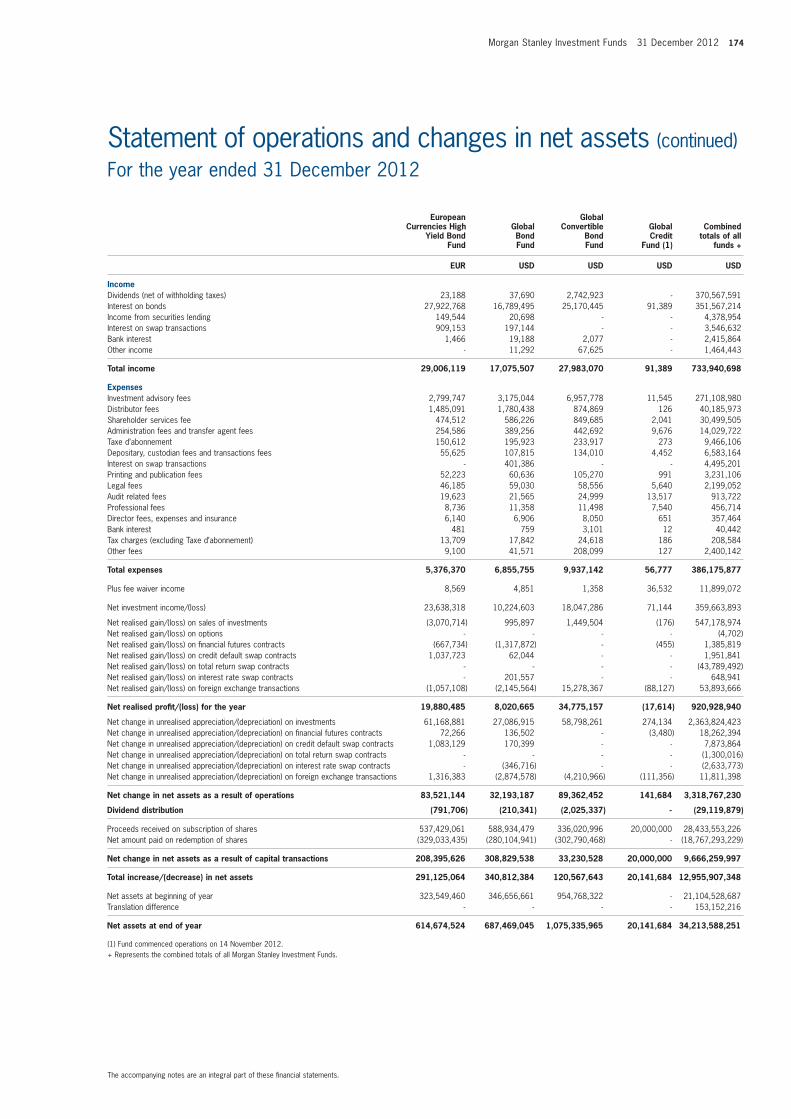
Morgan Stanley Investment Funds 31 December 2012 174
The accompanying notes are an integral part of these financial statements.
Statement of operations and changes in net assets (continued)For the year ended 31 December 2012
european Currencies high
Yield Bondfund
GlobalBondfund
GlobalConvertible
Bond fund
GlobalCredit
fund (1)
Combinedtotals of all
funds +
eUr USD USD USD USD
income Dividends (net of withholding taxes) 23,188 37,690 2,742,923 - 370,567,591Interest on bonds 27,922,768 16,789,495 25,170,445 91,389 351,567,214Income from securities lending 149,544 20,698 - - 4,378,954Interest on swap transactions 909,153 197,144 - - 3,546,632Bank interest 1,466 19,188 2,077 - 2,415,864Other income - 11,292 67,625 - 1,464,443
total income 29,006,119 17,075,507 27,983,070 91,389 733,940,698
expensesInvestment advisory fees 2,799,747 3,175,044 6,957,778 11,545 271,108,980Distributor fees 1,485,091 1,780,438 874,869 126 40,185,973Shareholder services fee 474,512 586,226 849,685 2,041 30,499,505Administration fees and transfer agent fees 254,586 389,256 442,692 9,676 14,029,722Taxe d’abonnement 150,612 195,923 233,917 273 9,466,106Depositary, custodian fees and transactions fees 55,625 107,815 134,010 4,452 6,583,164Interest on swap transactions - 401,386 - - 4,495,201Printing and publication fees 52,223 60,636 105,270 991 3,231,106Legal fees 46,185 59,030 58,556 5,640 2,199,052Audit related fees 19,623 21,565 24,999 13,517 913,722Professional fees 8,736 11,358 11,498 7,540 456,714Director fees, expenses and insurance 6,140 6,906 8,050 651 357,464Bank interest 481 759 3,101 12 40,442Tax charges (excluding Taxe d’abonnement) 13,709 17,842 24,618 186 208,584Other fees 9,100 41,571 208,099 127 2,400,142
total expenses 5,376,370 6,855,755 9,937,142 56,777 386,175,877
Plus fee waiver income 8,569 4,851 1,358 36,532 11,899,072
Net investment income/(loss) 23,638,318 10,224,603 18,047,286 71,144 359,663,893
Net realised gain/(loss) on sales of investments (3,070,714) 995,897 1,449,504 (176) 547,178,974Net realised gain/(loss) on options - - - - (4,702)Net realised gain/(loss) on financial futures contracts (667,734) (1,317,872) - (455) 1,385,819Net realised gain/(loss) on credit default swap contracts 1,037,723 62,044 - - 1,951,841Net realised gain/(loss) on total return swap contracts - - - - (43,789,492)Net realised gain/(loss) on interest rate swap contracts - 201,557 - - 648,941Net realised gain/(loss) on foreign exchange transactions (1,057,108) (2,145,564) 15,278,367 (88,127) 53,893,666
net realised profit/(loss) for the year 19,880,485 8,020,665 34,775,157 (17,614) 920,928,940
Net change in unrealised appreciation/(depreciation) on investments 61,168,881 27,086,915 58,798,261 274,134 2,363,824,423Net change in unrealised appreciation/(depreciation) on financial futures contracts 72,266 136,502 - (3,480) 18,262,394Net change in unrealised appreciation/(depreciation) on credit default swap contracts 1,083,129 170,399 - - 7,873,864Net change in unrealised appreciation/(depreciation) on total return swap contracts - - - - (1,300,016)Net change in unrealised appreciation/(depreciation) on interest rate swap contracts - (346,716) - - (2,633,773)Net change in unrealised appreciation/(depreciation) on foreign exchange transactions 1,316,383 (2,874,578) (4,210,966) (111,356) 11,811,398
net change in net assets as a result of operations 83,521,144 32,193,187 89,362,452 141,684 3,318,767,230
Dividend distribution (791,706) (210,341) (2,025,337) - (29,119,879)
Proceeds received on subscription of shares 537,429,061 588,934,479 336,020,996 20,000,000 28,433,553,226Net amount paid on redemption of shares (329,033,435) (280,104,941) (302,790,468) - (18,767,293,229)
net change in net assets as a result of capital transactions 208,395,626 308,829,538 33,230,528 20,000,000 9,666,259,997
total increase/(decrease) in net assets 291,125,064 340,812,384 120,567,643 20,141,684 12,955,907,348
Net assets at beginning of year 323,549,460 346,656,661 954,768,322 - 21,104,528,687Translation difference - - - - 153,152,216
net assets at end of year 614,674,524 687,469,045 1,075,335,965 20,141,684 34,213,588,251
(1) Fund commenced operations on 14 November 2012.+ Represents the combined totals of all Morgan Stanley Investment Funds.
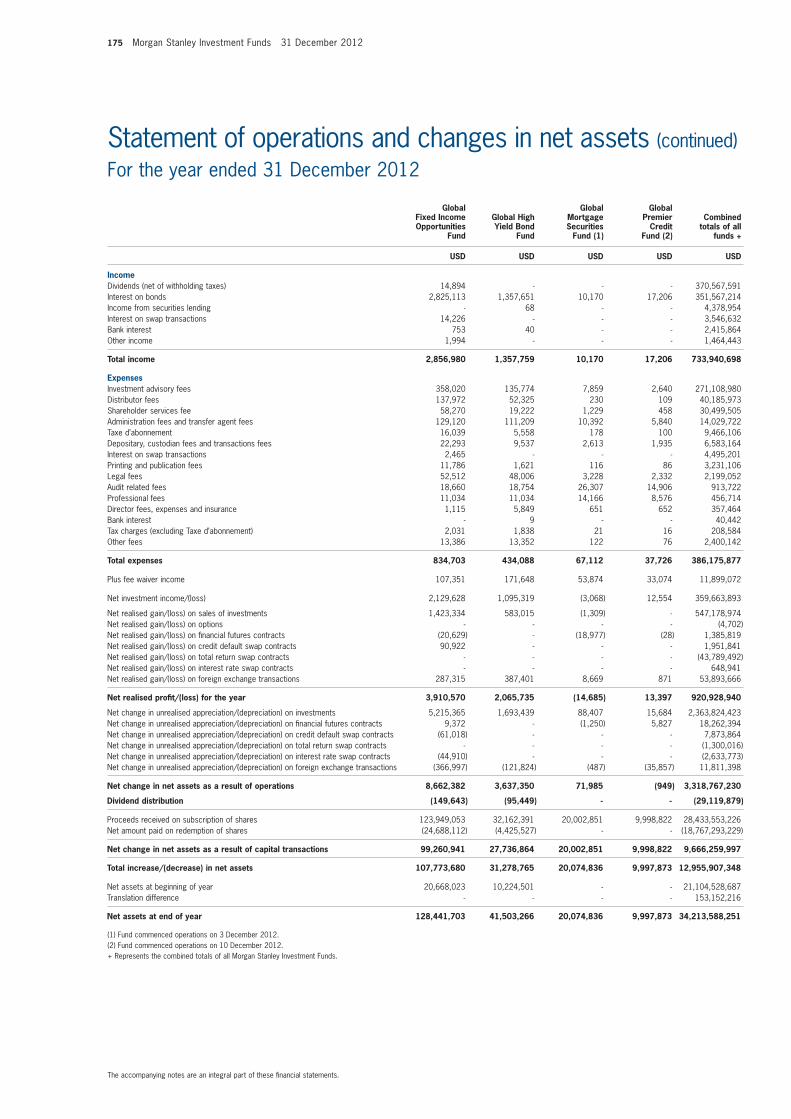
175 Morgan Stanley Investment Funds 31 December 2012
The accompanying notes are an integral part of these financial statements.
Statement of operations and changes in net assets (continued)For the year ended 31 December 2012
Globalfixed incomeopportunities
fund
Global highYield Bond
fund
GlobalmortgageSecurities
fund (1)
GlobalPremier
Creditfund (2)
Combinedtotals of all
funds +
USD USD USD USD USD
income Dividends (net of withholding taxes) 14,894 - - - 370,567,591Interest on bonds 2,825,113 1,357,651 10,170 17,206 351,567,214Income from securities lending - 68 - - 4,378,954Interest on swap transactions 14,226 - - - 3,546,632Bank interest 753 40 - - 2,415,864Other income 1,994 - - - 1,464,443
total income 2,856,980 1,357,759 10,170 17,206 733,940,698
expensesInvestment advisory fees 358,020 135,774 7,859 2,640 271,108,980Distributor fees 137,972 52,325 230 109 40,185,973Shareholder services fee 58,270 19,222 1,229 458 30,499,505Administration fees and transfer agent fees 129,120 111,209 10,392 5,840 14,029,722Taxe d’abonnement 16,039 5,558 178 100 9,466,106Depositary, custodian fees and transactions fees 22,293 9,537 2,613 1,935 6,583,164Interest on swap transactions 2,465 - - - 4,495,201Printing and publication fees 11,786 1,621 116 86 3,231,106Legal fees 52,512 48,006 3,228 2,332 2,199,052Audit related fees 18,660 18,754 26,307 14,906 913,722Professional fees 11,034 11,034 14,166 8,576 456,714Director fees, expenses and insurance 1,115 5,849 651 652 357,464Bank interest - 9 - - 40,442Tax charges (excluding Taxe d’abonnement) 2,031 1,838 21 16 208,584Other fees 13,386 13,352 122 76 2,400,142
total expenses 834,703 434,088 67,112 37,726 386,175,877
Plus fee waiver income 107,351 171,648 53,874 33,074 11,899,072
Net investment income/(loss) 2,129,628 1,095,319 (3,068) 12,554 359,663,893
Net realised gain/(loss) on sales of investments 1,423,334 583,015 (1,309) - 547,178,974Net realised gain/(loss) on options - - - - (4,702)Net realised gain/(loss) on financial futures contracts (20,629) - (18,977) (28) 1,385,819Net realised gain/(loss) on credit default swap contracts 90,922 - - - 1,951,841Net realised gain/(loss) on total return swap contracts - - - - (43,789,492)Net realised gain/(loss) on interest rate swap contracts - - - - 648,941Net realised gain/(loss) on foreign exchange transactions 287,315 387,401 8,669 871 53,893,666
net realised profit/(loss) for the year 3,910,570 2,065,735 (14,685) 13,397 920,928,940
Net change in unrealised appreciation/(depreciation) on investments 5,215,365 1,693,439 88,407 15,684 2,363,824,423Net change in unrealised appreciation/(depreciation) on financial futures contracts 9,372 - (1,250) 5,827 18,262,394Net change in unrealised appreciation/(depreciation) on credit default swap contracts (61,018) - - - 7,873,864Net change in unrealised appreciation/(depreciation) on total return swap contracts - - - - (1,300,016)Net change in unrealised appreciation/(depreciation) on interest rate swap contracts (44,910) - - - (2,633,773)Net change in unrealised appreciation/(depreciation) on foreign exchange transactions (366,997) (121,824) (487) (35,857) 11,811,398
net change in net assets as a result of operations 8,662,382 3,637,350 71,985 (949) 3,318,767,230
Dividend distribution (149,643) (95,449) - - (29,119,879)
Proceeds received on subscription of shares 123,949,053 32,162,391 20,002,851 9,998,822 28,433,553,226Net amount paid on redemption of shares (24,688,112) (4,425,527) - - (18,767,293,229)
net change in net assets as a result of capital transactions 99,260,941 27,736,864 20,002,851 9,998,822 9,666,259,997
total increase/(decrease) in net assets 107,773,680 31,278,765 20,074,836 9,997,873 12,955,907,348
Net assets at beginning of year 20,668,023 10,224,501 - - 21,104,528,687Translation difference - - - - 153,152,216
net assets at end of year 128,441,703 41,503,266 20,074,836 9,997,873 34,213,588,251
(1) Fund commenced operations on 3 December 2012.(2) Fund commenced operations on 10 December 2012. + Represents the combined totals of all Morgan Stanley Investment Funds.
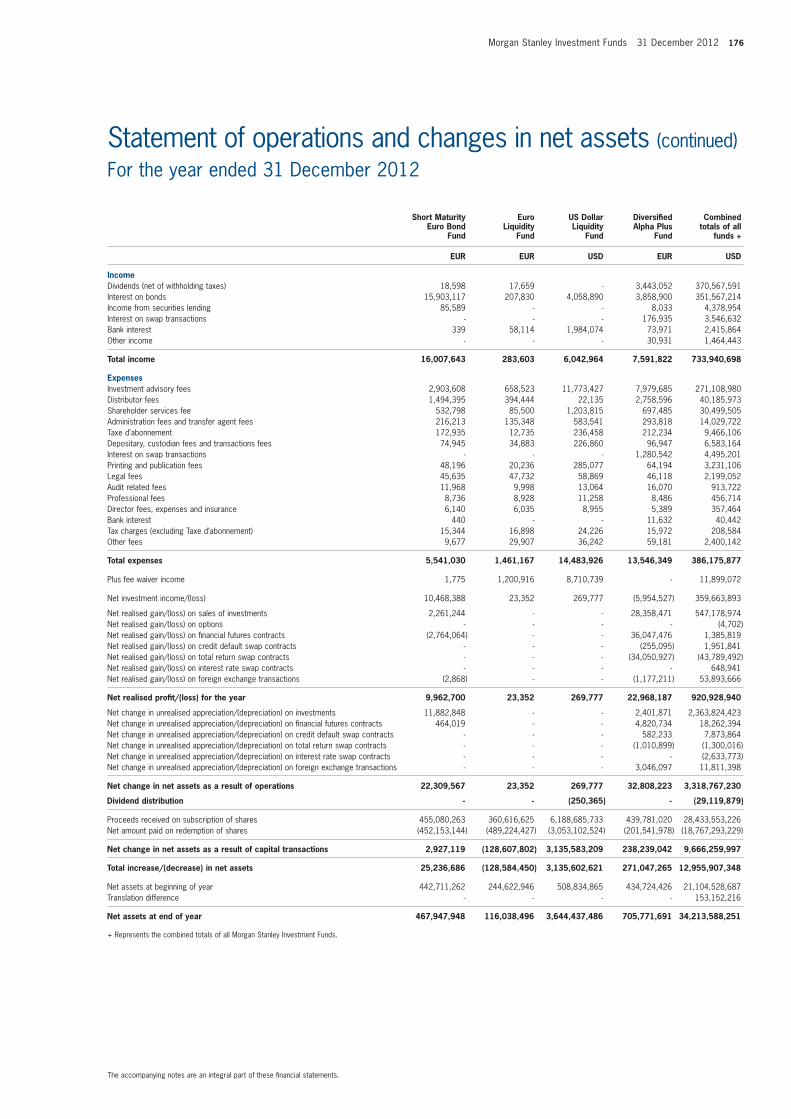
Morgan Stanley Investment Funds 31 December 2012 176
The accompanying notes are an integral part of these financial statements.
Statement of operations and changes in net assets (continued)For the year ended 31 December 2012
Short maturity
euro Bondfund
euroLiquidity
fund
US DollarLiquidity
fund
Diversifiedalpha Plus
fund
Combinedtotals of all
funds +
eUr eUr USD eUr USD
income Dividends (net of withholding taxes) 18,598 17,659 - 3,443,052 370,567,591Interest on bonds 15,903,117 207,830 4,058,890 3,858,900 351,567,214Income from securities lending 85,589 - - 8,033 4,378,954Interest on swap transactions - - - 176,935 3,546,632Bank interest 339 58,114 1,984,074 73,971 2,415,864Other income - - - 30,931 1,464,443
total income 16,007,643 283,603 6,042,964 7,591,822 733,940,698
expensesInvestment advisory fees 2,903,608 658,523 11,773,427 7,979,685 271,108,980Distributor fees 1,494,395 394,444 22,135 2,758,596 40,185,973Shareholder services fee 532,798 85,500 1,203,815 697,485 30,499,505Administration fees and transfer agent fees 216,213 135,348 583,541 293,818 14,029,722Taxe d’abonnement 172,935 12,735 236,458 212,234 9,466,106Depositary, custodian fees and transactions fees 74,945 34,883 226,860 96,947 6,583,164Interest on swap transactions - - - 1,280,542 4,495,201Printing and publication fees 48,196 20,236 285,077 64,194 3,231,106Legal fees 45,635 47,732 58,869 46,118 2,199,052Audit related fees 11,968 9,998 13,064 16,070 913,722Professional fees 8,736 8,928 11,258 8,486 456,714Director fees, expenses and insurance 6,140 6,035 8,955 5,389 357,464Bank interest 440 - - 11,632 40,442Tax charges (excluding Taxe d’abonnement) 15,344 16,898 24,226 15,972 208,584Other fees 9,677 29,907 36,242 59,181 2,400,142
total expenses 5,541,030 1,461,167 14,483,926 13,546,349 386,175,877
Plus fee waiver income 1,775 1,200,916 8,710,739 - 11,899,072
Net investment income/(loss) 10,468,388 23,352 269,777 (5,954,527) 359,663,893
Net realised gain/(loss) on sales of investments 2,261,244 - - 28,358,471 547,178,974Net realised gain/(loss) on options - - - - (4,702)Net realised gain/(loss) on financial futures contracts (2,764,064) - - 36,047,476 1,385,819Net realised gain/(loss) on credit default swap contracts - - - (255,095) 1,951,841Net realised gain/(loss) on total return swap contracts - - - (34,050,927) (43,789,492)Net realised gain/(loss) on interest rate swap contracts - - - - 648,941Net realised gain/(loss) on foreign exchange transactions (2,868) - - (1,177,211) 53,893,666
net realised profit/(loss) for the year 9,962,700 23,352 269,777 22,968,187 920,928,940
Net change in unrealised appreciation/(depreciation) on investments 11,882,848 - - 2,401,871 2,363,824,423Net change in unrealised appreciation/(depreciation) on financial futures contracts 464,019 - - 4,820,734 18,262,394Net change in unrealised appreciation/(depreciation) on credit default swap contracts - - - 582,233 7,873,864Net change in unrealised appreciation/(depreciation) on total return swap contracts - - - (1,010,899) (1,300,016)Net change in unrealised appreciation/(depreciation) on interest rate swap contracts - - - - (2,633,773)Net change in unrealised appreciation/(depreciation) on foreign exchange transactions - - - 3,046,097 11,811,398
net change in net assets as a result of operations 22,309,567 23,352 269,777 32,808,223 3,318,767,230
Dividend distribution - - (250,365) - (29,119,879)
Proceeds received on subscription of shares 455,080,263 360,616,625 6,188,685,733 439,781,020 28,433,553,226Net amount paid on redemption of shares (452,153,144) (489,224,427) (3,053,102,524) (201,541,978) (18,767,293,229)
net change in net assets as a result of capital transactions 2,927,119 (128,607,802) 3,135,583,209 238,239,042 9,666,259,997
total increase/(decrease) in net assets 25,236,686 (128,584,450) 3,135,602,621 271,047,265 12,955,907,348
Net assets at beginning of year 442,711,262 244,622,946 508,834,865 434,724,426 21,104,528,687Translation difference - - - - 153,152,216
net assets at end of year 467,947,948 116,038,496 3,644,437,486 705,771,691 34,213,588,251
+ Represents the combined totals of all Morgan Stanley Investment Funds.

177 Morgan Stanley Investment Funds 31 December 2012
The accompanying notes are an integral part of these financial statements.
Statement of operations and changes in net assets (continued)For the year ended 31 December 2012
GlobalBalanced
risk Control fund of funds
absolute return
Currency fund
Combinedtotals of all
funds +
eUr eUr USD
income Dividends (net of withholding taxes) 27 2,664 370,567,591Interest on bonds - - 351,567,214Income from securities lending - - 4,378,954Interest on swap transactions - - 3,546,632Bank interest - 22,778 2,415,864Other income 744,773 148,349 1,464,443
total income 744,800 173,791 733,940,698
expensesInvestment advisory fees 1,321,466 566,651 271,108,980Distributor fees 265,701 187,583 40,185,973Shareholder services fee 116,917 43,217 30,499,505Administration fees and transfer agent fees 61,448 105,156 14,029,722Taxe d’abonnement 496 12,302 9,466,106Depositary, custodian fees and transactions fees 42,114 28,730 6,583,164Interest on swap transactions - - 4,495,201Printing and publication fees 15,184 3,720 3,231,106Legal fees 34,545 45,312 2,199,052Audit related fees 19,229 21,186 913,722Professional fees 8,486 8,736 456,714Director fees, expenses and insurance 3,893 4,456 357,464Bank interest 228 1,856 40,442Tax charges (excluding Taxe d’abonnement) 1,388 10,651 208,584Other fees 8,865 6,012 2,400,142
total expenses 1,899,960 1,045,568 386,175,877
Plus fee waiver income 230 62,128 11,899,072
Net investment income/(loss) (1,154,930) (809,649) 359,663,893
Net realised gain/(loss) on sales of investments 5,497,158 - 547,178,974Net realised gain/(loss) on options - (3,656) (4,702)Net realised gain/(loss) on financial futures contracts (577,346) (487,092) 1,385,819Net realised gain/(loss) on credit default swap contracts - - 1,951,841Net realised gain/(loss) on total return swap contracts - - (43,789,492)Net realised gain/(loss) on interest rate swap contracts - - 648,941Net realised gain/(loss) on foreign exchange transactions (9,071) (1,008,030) 53,893,666
net realised profit/(loss) for the year 3,755,811 (2,308,427) 920,928,940
Net change in unrealised appreciation/(depreciation) on investments 5,152,866 - 2,363,824,423Net change in unrealised appreciation/(depreciation) on financial futures contracts 571,444 (19,082) 18,262,394Net change in unrealised appreciation/(depreciation) on credit default swap contracts - - 7,873,864Net change in unrealised appreciation/(depreciation) on total return swap contracts - - (1,300,016)Net change in unrealised appreciation/(depreciation) on interest rate swap contracts - - (2,633,773)Net change in unrealised appreciation/(depreciation) on foreign exchange transactions - (550,390) 11,811,398
net change in net assets as a result of operations 9,480,121 (2,877,899) 3,318,767,230
Dividend distribution - - (29,119,879)
Proceeds received on subscription of shares 188,637,632 8,670,170 28,433,553,226Net amount paid on redemption of shares (13,383,336) (24,374,506) (18,767,293,229)
net change in net assets as a result of capital transactions 175,254,296 (15,704,336) 9,666,259,997
total increase/(decrease) in net assets 184,734,417 (18,582,235) 12,955,907,348
Net assets at beginning of year 458,513 38,535,419 21,104,528,687Translation difference - - 153,152,216
net assets at end of year 185,192,930 19,953,184 34,213,588,251
+ Represents the combined totals of all Morgan Stanley Investment Funds.

Morgan Stanley Investment Funds 31 December 2012 178
Statement of share and net assets statisticsAs at
31 December 2012 31 December 2011 31 December 2010
asian equity fund (USD) - net asset value per:
Share Class A 42.94 36.25 44.21 Share Class B 36.72 31.31 38.58 Share Class C 27.33 23.28 28.65 Share Class I 47.68 39.95 48.37 Share Class Z 28.54 23.91 28.93
Net assets 244,763,253 274,158,037 618,901,089
asia-Pacific equity fund (USD) - net asset value per:
Share Class A 23.90 20.17 - Share Class AH (EUR) 23.37 19.93 - Share Class B 23.48 20.03 - Share Class BH (EUR) 22.97 19.78 - Share Class C 23.56 20.05 - Share Class N 24.61 20.43 - Share Class Z 24.21 20.29 -
Net assets 110,829,486 63,619,461 -
asian Property fund (USD) - net asset value per:
Share Class A 18.87 12.86 16.74 Share Class AX 17.86 12.35 16.24 Share Class B 16.97 11.68 15.36 Share Class I 20.93 14.16 18.30 Share Class IX 18.90 13.07 17.18 Share Class Z 32.32 21.85 28.25
Net assets 566,352,803 446,050,223 790,338,355
emerging europe, middle east and africa equity fund (eUr) - net asset value per:
Share Class A 60.12 50.36 66.55 Share Class AX 56.90 48.06 64.01 Share Class B 55.15 46.66 62.27 Share Class C 22.29 18.84 25.06 Share Class I 64.52 53.76 70.58 Share Class Z 21.01 17.51 23.03
Net assets 206,078,040 216,774,952 468,539,540
emerging Leaders equity fund (USD) (1) - net asset value per:
Share Class A 26.40 - - Share Class AH (EUR) 26.33 - - Share Class B 26.30 - - Share Class BH (EUR) 26.23 - - Share Class C 26.32 - - Share Class CH (EUR) 26.42 - - Share Class I 25.04 - -Share Class Z 26.49 - -
Net assets 45,873,789 - -
emerging markets equity fund (USD) - net asset value per:
Share Class A 38.56 32.60 40.03 Share Class B 33.59 28.68 35.58 Share Class C 24.84 21.20 26.25 Share Class I 42.18 35.44 43.27 Share Class N 51.37 42.64 51.42 Share Class Z 24.44 20.53 25.05
Net assets 1,394,324,169 1,087,548,404 1,096,025,401
european equity alpha fund (eUr) - net asset value per:
Share Class A 32.50 28.29 30.60 Share Class AX* 26.99 - - Share Class B 27.84 24.49 26.75 Share Class C 28.06 24.65 26.90 Share Class I 35.73 30.93 33.25 Share Class Z 30.12 26.05 28.00 Share Class ZH (GBP) 26.52 23.82 -
Net assets 562,973,137 453,605,063 339,399,835
(1) Fund commenced operations on 17 August 2012.* Share Class was launched during the year.
The accompanying notes are an integral part of these financial statements.
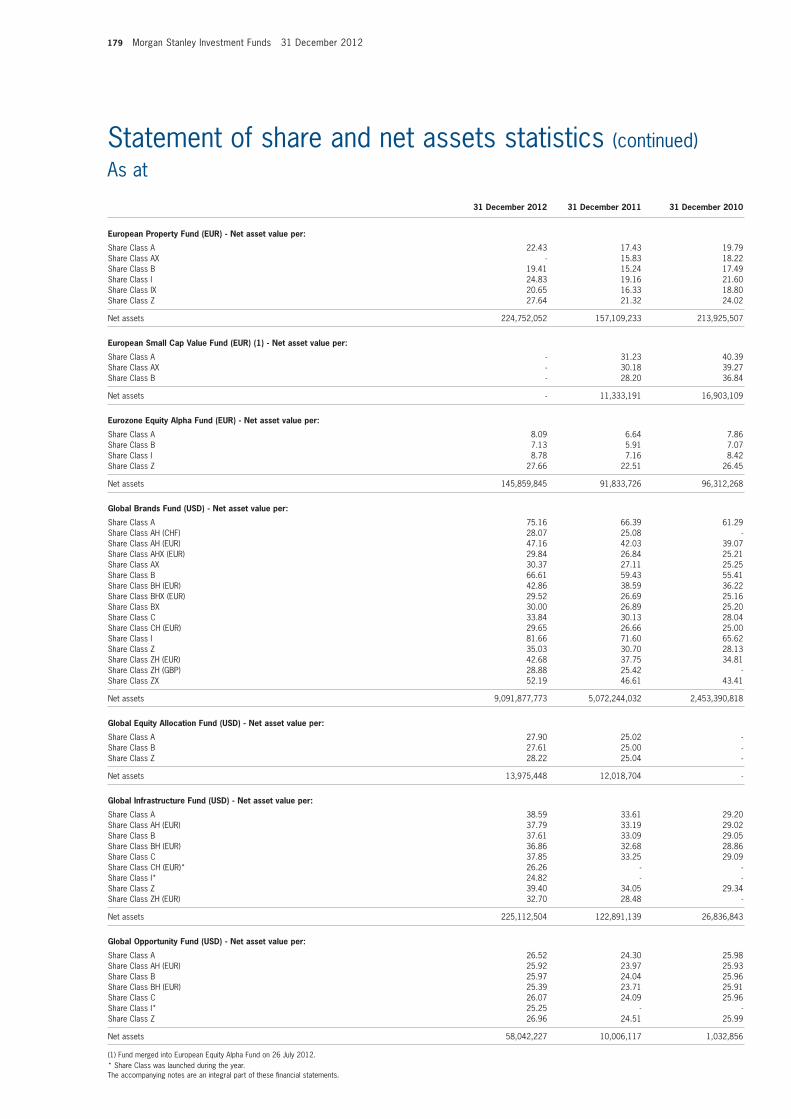
179 Morgan Stanley Investment Funds 31 December 2012
Statement of share and net assets statistics (continued)As at
31 December 2012 31 December 2011 31 December 2010
european Property fund (eUr) - net asset value per:
Share Class A 22.43 17.43 19.79 Share Class AX - 15.83 18.22 Share Class B 19.41 15.24 17.49 Share Class I 24.83 19.16 21.60 Share Class IX 20.65 16.33 18.80 Share Class Z 27.64 21.32 24.02
Net assets 224,752,052 157,109,233 213,925,507
european Small Cap value fund (eUr) (1) - net asset value per:
Share Class A - 31.23 40.39 Share Class AX - 30.18 39.27 Share Class B - 28.20 36.84
Net assets - 11,333,191 16,903,109
eurozone equity alpha fund (eUr) - net asset value per:
Share Class A 8.09 6.64 7.86 Share Class B 7.13 5.91 7.07 Share Class I 8.78 7.16 8.42 Share Class Z 27.66 22.51 26.45
Net assets 145,859,845 91,833,726 96,312,268
Global Brands fund (USD) - net asset value per:
Share Class A 75.16 66.39 61.29 Share Class AH (CHF) 28.07 25.08 - Share Class AH (EUR) 47.16 42.03 39.07 Share Class AHX (EUR) 29.84 26.84 25.21 Share Class AX 30.37 27.11 25.25 Share Class B 66.61 59.43 55.41 Share Class BH (EUR) 42.86 38.59 36.22 Share Class BHX (EUR) 29.52 26.69 25.16 Share Class BX 30.00 26.89 25.20 Share Class C 33.84 30.13 28.04 Share Class CH (EUR) 29.65 26.66 25.00 Share Class I 81.66 71.60 65.62 Share Class Z 35.03 30.70 28.13 Share Class ZH (EUR) 42.68 37.75 34.81 Share Class ZH (GBP) 28.88 25.42 - Share Class ZX 52.19 46.61 43.41
Net assets 9,091,877,773 5,072,244,032 2,453,390,818
Global equity allocation fund (USD) - net asset value per:
Share Class A 27.90 25.02 - Share Class B 27.61 25.00 - Share Class Z 28.22 25.04 -
Net assets 13,975,448 12,018,704 -
Global infrastructure fund (USD) - net asset value per:
Share Class A 38.59 33.61 29.20 Share Class AH (EUR) 37.79 33.19 29.02 Share Class B 37.61 33.09 29.05 Share Class BH (EUR) 36.86 32.68 28.86 Share Class C 37.85 33.25 29.09 Share Class CH (EUR)* 26.26 - - Share Class I* 24.82 - -Share Class Z 39.40 34.05 29.34 Share Class ZH (EUR) 32.70 28.48 -
Net assets 225,112,504 122,891,139 26,836,843
Global opportunity fund (USD) - net asset value per:
Share Class A 26.52 24.30 25.98 Share Class AH (EUR) 25.92 23.97 25.93 Share Class B 25.97 24.04 25.96 Share Class BH (EUR) 25.39 23.71 25.91 Share Class C 26.07 24.09 25.96 Share Class I* 25.25 - - Share Class Z 26.96 24.51 25.99
Net assets 58,042,227 10,006,117 1,032,856
(1) Fund merged into European Equity Alpha Fund on 26 July 2012.* Share Class was launched during the year.The accompanying notes are an integral part of these financial statements.
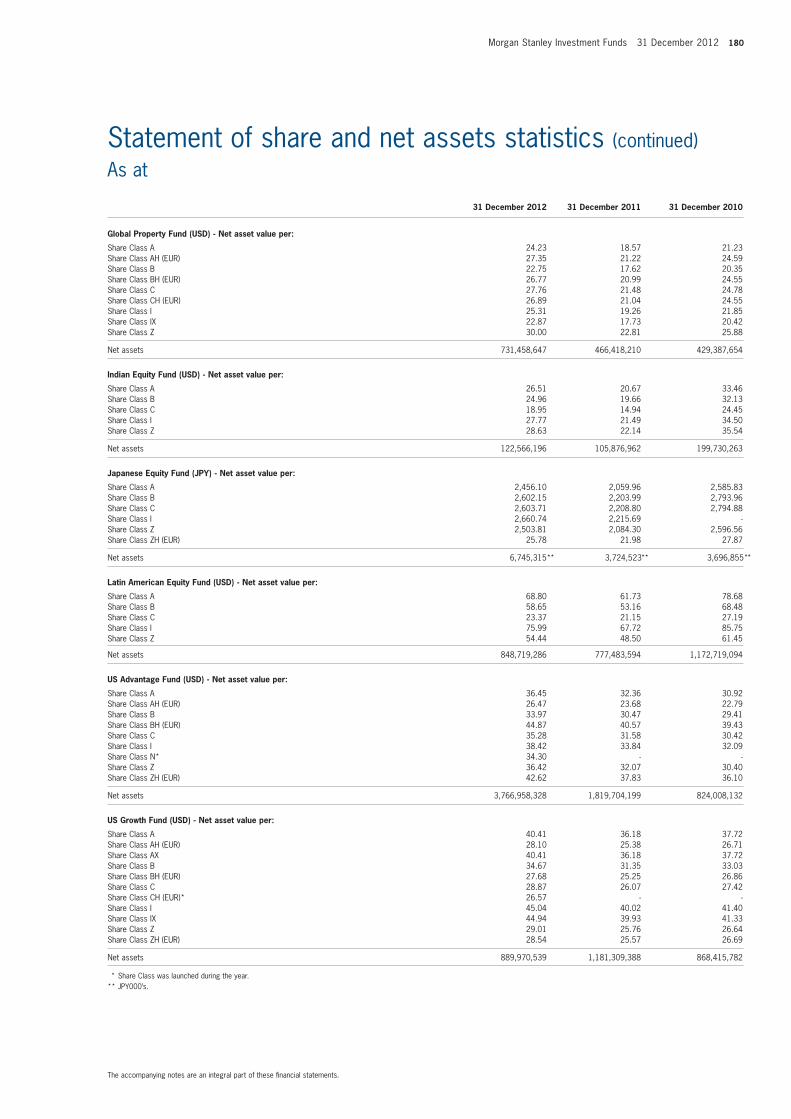
Morgan Stanley Investment Funds 31 December 2012 180
Statement of share and net assets statistics (continued)As at
31 December 2012 31 December 2011 31 December 2010
Global Property fund (USD) - net asset value per:
Share Class A 24.23 18.57 21.23 Share Class AH (EUR) 27.35 21.22 24.59 Share Class B 22.75 17.62 20.35 Share Class BH (EUR) 26.77 20.99 24.55 Share Class C 27.76 21.48 24.78 Share Class CH (EUR) 26.89 21.04 24.55 Share Class I 25.31 19.26 21.85 Share Class IX 22.87 17.73 20.42 Share Class Z 30.00 22.81 25.88
Net assets 731,458,647 466,418,210 429,387,654
indian equity fund (USD) - net asset value per:
Share Class A 26.51 20.67 33.46 Share Class B 24.96 19.66 32.13 Share Class C 18.95 14.94 24.45 Share Class I 27.77 21.49 34.50 Share Class Z 28.63 22.14 35.54
Net assets 122,566,196 105,876,962 199,730,263
Japanese equity fund (JPY) - net asset value per:
Share Class A 2,456.10 2,059.96 2,585.83 Share Class B 2,602.15 2,203.99 2,793.96 Share Class C 2,603.71 2,208.80 2,794.88 Share Class I 2,660.74 2,215.69 - Share Class Z 2,503.81 2,084.30 2,596.56 Share Class ZH (EUR) 25.78 21.98 27.87
Net assets 6,745,315** 3,724,523** 3,696,855 **
Latin american equity fund (USD) - net asset value per:
Share Class A 68.80 61.73 78.68 Share Class B 58.65 53.16 68.48 Share Class C 23.37 21.15 27.19 Share Class I 75.99 67.72 85.75 Share Class Z 54.44 48.50 61.45
Net assets 848,719,286 777,483,594 1,172,719,094
US advantage fund (USD) - net asset value per:
Share Class A 36.45 32.36 30.92 Share Class AH (EUR) 26.47 23.68 22.79 Share Class B 33.97 30.47 29.41 Share Class BH (EUR) 44.87 40.57 39.43 Share Class C 35.28 31.58 30.42 Share Class I 38.42 33.84 32.09 Share Class N* 34.30 - - Share Class Z 36.42 32.07 30.40 Share Class ZH (EUR) 42.62 37.83 36.10
Net assets 3,766,958,328 1,819,704,199 824,008,132
US Growth fund (USD) - net asset value per:
Share Class A 40.41 36.18 37.72 Share Class AH (EUR) 28.10 25.38 26.71 Share Class AX 40.41 36.18 37.72 Share Class B 34.67 31.35 33.03 Share Class BH (EUR) 27.68 25.25 26.86 Share Class C 28.87 26.07 27.42 Share Class CH (EUR)* 26.57 - - Share Class I 45.04 40.02 41.40 Share Class IX 44.94 39.93 41.33 Share Class Z 29.01 25.76 26.64 Share Class ZH (EUR) 28.54 25.57 26.69
Net assets 889,970,539 1,181,309,388 868,415,782
* Share Class was launched during the year. ** JPY000’s.
The accompanying notes are an integral part of these financial statements.
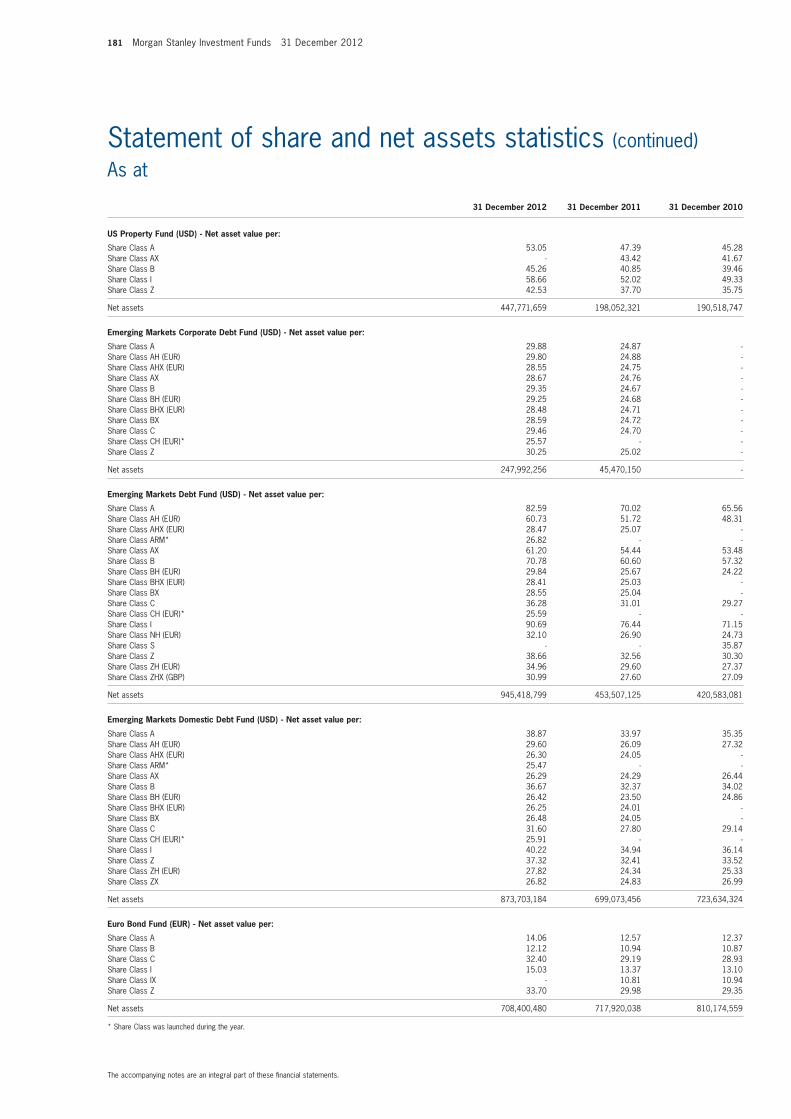
181 Morgan Stanley Investment Funds 31 December 2012
31 December 2012 31 December 2011 31 December 2010
US Property fund (USD) - net asset value per:
Share Class A 53.05 47.39 45.28 Share Class AX - 43.42 41.67 Share Class B 45.26 40.85 39.46 Share Class I 58.66 52.02 49.33 Share Class Z 42.53 37.70 35.75
Net assets 447,771,659 198,052,321 190,518,747
emerging markets Corporate Debt fund (USD) - net asset value per:
Share Class A 29.88 24.87 - Share Class AH (EUR) 29.80 24.88 - Share Class AHX (EUR) 28.55 24.75 - Share Class AX 28.67 24.76 - Share Class B 29.35 24.67 - Share Class BH (EUR) 29.25 24.68 - Share Class BHX (EUR) 28.48 24.71 - Share Class BX 28.59 24.72 - Share Class C 29.46 24.70 - Share Class CH (EUR)* 25.57 - - Share Class Z 30.25 25.02 -
Net assets 247,992,256 45,470,150 -
emerging markets Debt fund (USD) - net asset value per:
Share Class A 82.59 70.02 65.56 Share Class AH (EUR) 60.73 51.72 48.31 Share Class AHX (EUR) 28.47 25.07 - Share Class ARM* 26.82 - - Share Class AX 61.20 54.44 53.48 Share Class B 70.78 60.60 57.32 Share Class BH (EUR) 29.84 25.67 24.22 Share Class BHX (EUR) 28.41 25.03 - Share Class BX 28.55 25.04 - Share Class C 36.28 31.01 29.27 Share Class CH (EUR)* 25.59 - - Share Class I 90.69 76.44 71.15 Share Class NH (EUR) 32.10 26.90 24.73 Share Class S - - 35.87 Share Class Z 38.66 32.56 30.30 Share Class ZH (EUR) 34.96 29.60 27.37 Share Class ZHX (GBP) 30.99 27.60 27.09
Net assets 945,418,799 453,507,125 420,583,081
emerging markets Domestic Debt fund (USD) - net asset value per:
Share Class A 38.87 33.97 35.35 Share Class AH (EUR) 29.60 26.09 27.32 Share Class AHX (EUR) 26.30 24.05 - Share Class ARM* 25.47 - - Share Class AX 26.29 24.29 26.44 Share Class B 36.67 32.37 34.02 Share Class BH (EUR) 26.42 23.50 24.86 Share Class BHX (EUR) 26.25 24.01 - Share Class BX 26.48 24.05 - Share Class C 31.60 27.80 29.14 Share Class CH (EUR)* 25.91 - - Share Class I 40.22 34.94 36.14 Share Class Z 37.32 32.41 33.52 Share Class ZH (EUR) 27.82 24.34 25.33 Share Class ZX 26.82 24.83 26.99
Net assets 873,703,184 699,073,456 723,634,324
euro Bond fund (eUr) - net asset value per:
Share Class A 14.06 12.57 12.37 Share Class B 12.12 10.94 10.87 Share Class C 32.40 29.19 28.93 Share Class I 15.03 13.37 13.10 Share Class IX - 10.81 10.94 Share Class Z 33.70 29.98 29.35
Net assets 708,400,480 717,920,038 810,174,559
* Share Class was launched during the year.
Statement of share and net assets statistics (continued)As at
The accompanying notes are an integral part of these financial statements.
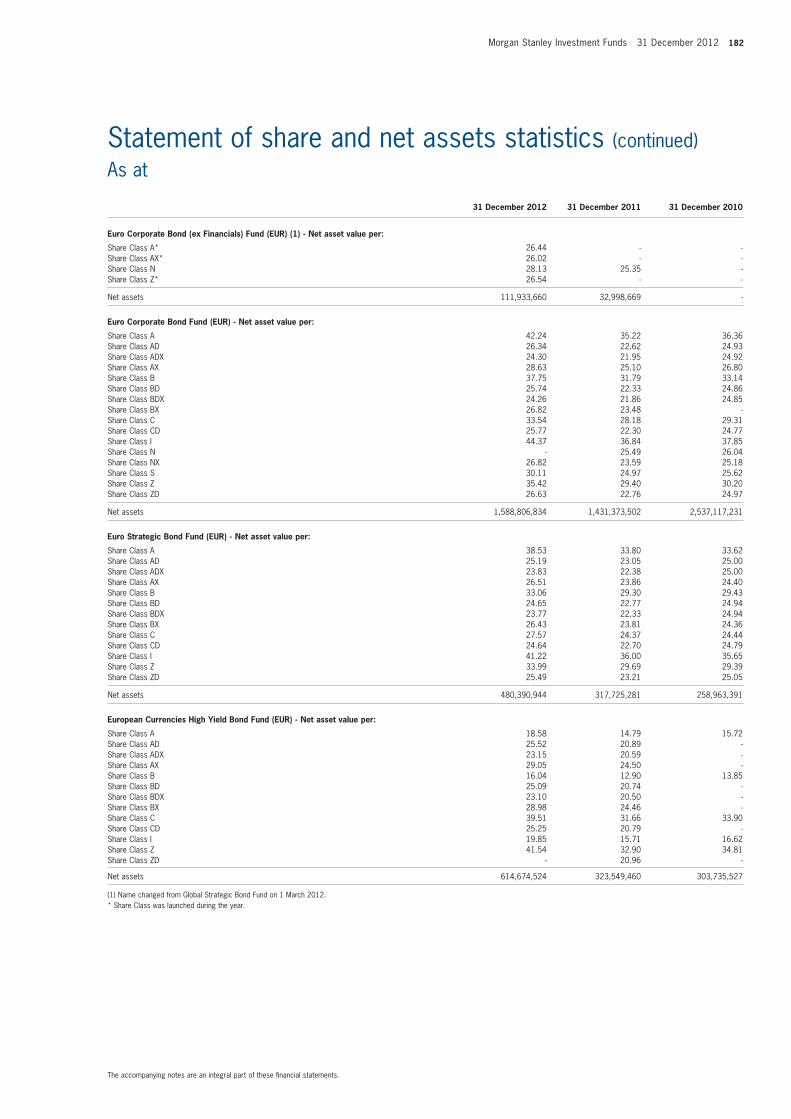
Morgan Stanley Investment Funds 31 December 2012 182
Statement of share and net assets statistics (continued)As at
31 December 2012 31 December 2011 31 December 2010
euro Corporate Bond (ex financials) fund (eUr) (1) - net asset value per:
Share Class A* 26.44 - - Share Class AX* 26.02 - - Share Class N 28.13 25.35 - Share Class Z* 26.54 - -
Net assets 111,933,660 32,998,669 -
euro Corporate Bond fund (eUr) - net asset value per:
Share Class A 42.24 35.22 36.36 Share Class AD 26.34 22.62 24.93 Share Class ADX 24.30 21.95 24.92 Share Class AX 28.63 25.10 26.80 Share Class B 37.75 31.79 33.14 Share Class BD 25.74 22.33 24.86 Share Class BDX 24.26 21.86 24.85 Share Class BX 26.82 23.48 - Share Class C 33.54 28.18 29.31 Share Class CD 25.77 22.30 24.77 Share Class I 44.37 36.84 37.85 Share Class N - 25.49 26.04 Share Class NX 26.82 23.59 25.18 Share Class S 30.11 24.97 25.62 Share Class Z 35.42 29.40 30.20 Share Class ZD 26.63 22.76 24.97
Net assets 1,588,806,834 1,431,373,502 2,537,117,231
euro Strategic Bond fund (eUr) - net asset value per:
Share Class A 38.53 33.80 33.62 Share Class AD 25.19 23.05 25.00 Share Class ADX 23.83 22.38 25.00 Share Class AX 26.51 23.86 24.40 Share Class B 33.06 29.30 29.43 Share Class BD 24.65 22.77 24.94 Share Class BDX 23.77 22.33 24.94 Share Class BX 26.43 23.81 24.36 Share Class C 27.57 24.37 24.44 Share Class CD 24.64 22.70 24.79 Share Class I 41.22 36.00 35.65 Share Class Z 33.99 29.69 29.39 Share Class ZD 25.49 23.21 25.05
Net assets 480,390,944 317,725,281 258,963,391
european Currencies high Yield Bond fund (eUr) - net asset value per:
Share Class A 18.58 14.79 15.72 Share Class AD 25.52 20.89 - Share Class ADX 23.15 20.59 - Share Class AX 29.05 24.50 - Share Class B 16.04 12.90 13.85 Share Class BD 25.09 20.74 - Share Class BDX 23.10 20.50 - Share Class BX 28.98 24.46 - Share Class C 39.51 31.66 33.90 Share Class CD 25.25 20.79 - Share Class I 19.85 15.71 16.62 Share Class Z 41.54 32.90 34.81 Share Class ZD - 20.96 -
Net assets 614,674,524 323,549,460 303,735,527
(1) Name changed from Global Strategic Bond Fund on 1 March 2012.* Share Class was launched during the year.
The accompanying notes are an integral part of these financial statements.
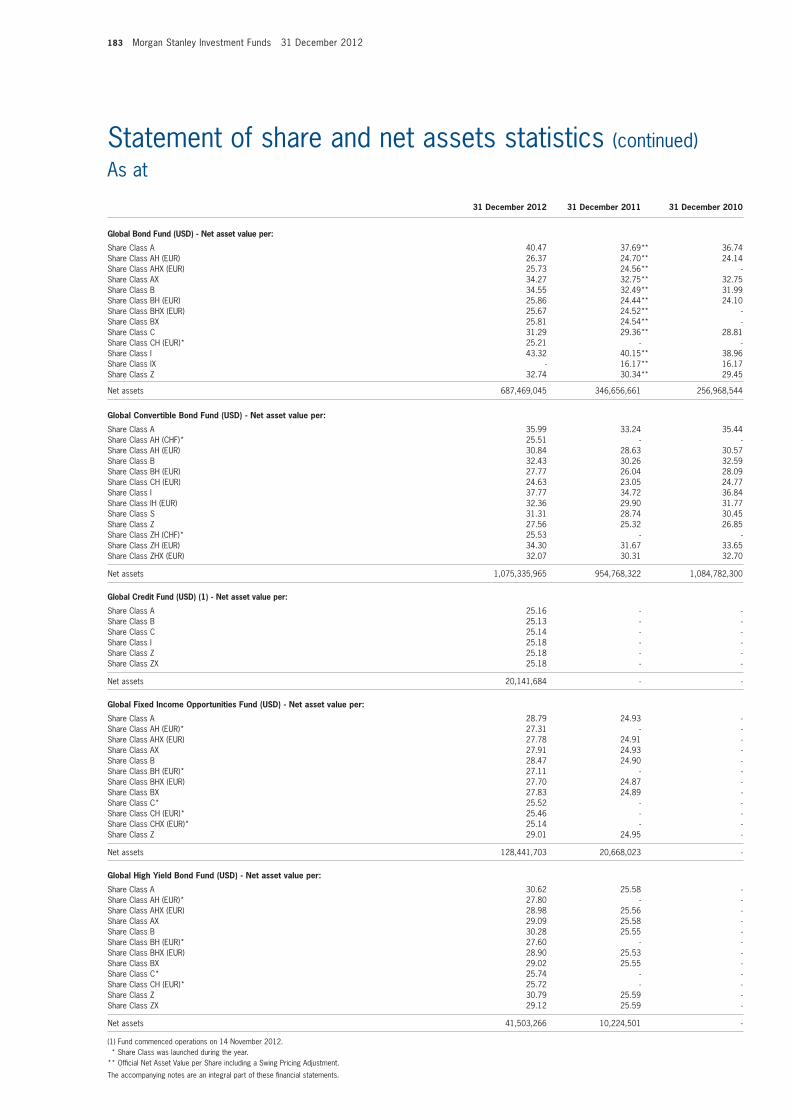
183 Morgan Stanley Investment Funds 31 December 2012
31 December 2012 31 December 2011 31 December 2010
Global Bond fund (USD) - net asset value per:
Share Class A 40.47 37.69** 36.74 Share Class AH (EUR) 26.37 24.70** 24.14 Share Class AHX (EUR) 25.73 24.56** - Share Class AX 34.27 32.75** 32.75 Share Class B 34.55 32.49** 31.99 Share Class BH (EUR) 25.86 24.44** 24.10 Share Class BHX (EUR) 25.67 24.52** - Share Class BX 25.81 24.54** - Share Class C 31.29 29.36** 28.81 Share Class CH (EUR)* 25.21 - - Share Class I 43.32 40.15** 38.96 Share Class IX - 16.17** 16.17 Share Class Z 32.74 30.34** 29.45
Net assets 687,469,045 346,656,661 256,968,544
Global Convertible Bond fund (USD) - net asset value per:
Share Class A 35.99 33.24 35.44 Share Class AH (CHF)* 25.51 - -Share Class AH (EUR) 30.84 28.63 30.57 Share Class B 32.43 30.26 32.59 Share Class BH (EUR) 27.77 26.04 28.09 Share Class CH (EUR) 24.63 23.05 24.77 Share Class I 37.77 34.72 36.84 Share Class IH (EUR) 32.36 29.90 31.77 Share Class S 31.31 28.74 30.45 Share Class Z 27.56 25.32 26.85 Share Class ZH (CHF)* 25.53 - -Share Class ZH (EUR) 34.30 31.67 33.65 Share Class ZHX (EUR) 32.07 30.31 32.70
Net assets 1,075,335,965 954,768,322 1,084,782,300
Global Credit fund (USD) (1) - net asset value per:
Share Class A 25.16 - - Share Class B 25.13 - - Share Class C 25.14 - - Share Class I 25.18 - - Share Class Z 25.18 - - Share Class ZX 25.18 - -
Net assets 20,141,684 - -
Global fixed income opportunities fund (USD) - net asset value per:
Share Class A 28.79 24.93 - Share Class AH (EUR)* 27.31 - - Share Class AHX (EUR) 27.78 24.91 - Share Class AX 27.91 24.93 - Share Class B 28.47 24.90 - Share Class BH (EUR)* 27.11 - - Share Class BHX (EUR) 27.70 24.87 - Share Class BX 27.83 24.89 - Share Class C* 25.52 - - Share Class CH (EUR)* 25.46 - - Share Class CHX (EUR)* 25.14 - -Share Class Z 29.01 24.95 -
Net assets 128,441,703 20,668,023 -
Global high Yield Bond fund (USD) - net asset value per:
Share Class A 30.62 25.58 - Share Class AH (EUR)* 27.80 - - Share Class AHX (EUR) 28.98 25.56 - Share Class AX 29.09 25.58 - Share Class B 30.28 25.55 - Share Class BH (EUR)* 27.60 - - Share Class BHX (EUR) 28.90 25.53 - Share Class BX 29.02 25.55 - Share Class C* 25.74 - - Share Class CH (EUR)* 25.72 - - Share Class Z 30.79 25.59 - Share Class ZX 29.12 25.59 -
Net assets 41,503,266 10,224,501 -
(1) Fund commenced operations on 14 November 2012. * Share Class was launched during the year.** Official Net Asset Value per Share including a Swing Pricing Adjustment.
Statement of share and net assets statistics (continued)As at
The accompanying notes are an integral part of these financial statements.
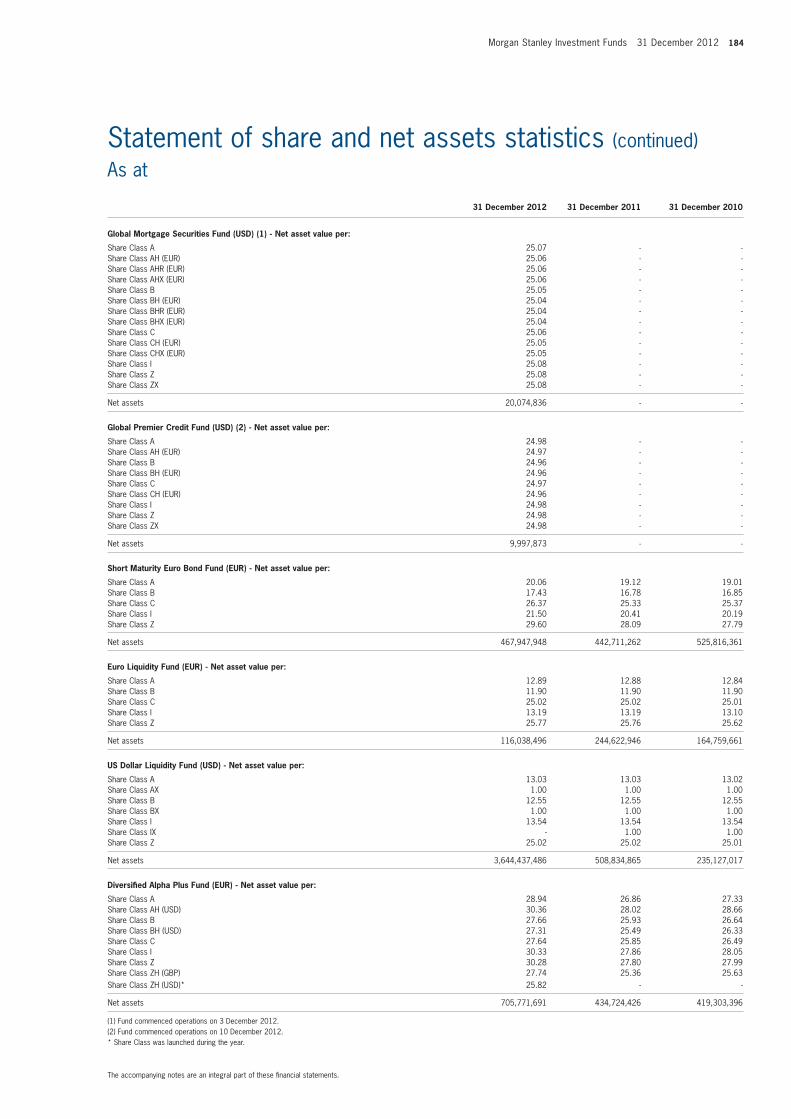
Morgan Stanley Investment Funds 31 December 2012 184
Statement of share and net assets statistics (continued)As at
31 December 2012 31 December 2011 31 December 2010
Global mortgage Securities fund (USD) (1) - net asset value per:
Share Class A 25.07 - - Share Class AH (EUR) 25.06 - - Share Class AHR (EUR) 25.06 - - Share Class AHX (EUR) 25.06 - - Share Class B 25.05 - - Share Class BH (EUR) 25.04 - - Share Class BHR (EUR) 25.04 - - Share Class BHX (EUR) 25.04 - - Share Class C 25.06 - - Share Class CH (EUR) 25.05 - - Share Class CHX (EUR) 25.05 - - Share Class I 25.08 - - Share Class Z 25.08 - - Share Class ZX 25.08 - -
Net assets 20,074,836 - -
Global Premier Credit fund (USD) (2) - net asset value per:
Share Class A 24.98 - - Share Class AH (EUR) 24.97 - - Share Class B 24.96 - - Share Class BH (EUR) 24.96 - - Share Class C 24.97 - - Share Class CH (EUR) 24.96 - - Share Class I 24.98 - - Share Class Z 24.98 - - Share Class ZX 24.98 - -
Net assets 9,997,873 - -
Short maturity euro Bond fund (eUr) - net asset value per:
Share Class A 20.06 19.12 19.01 Share Class B 17.43 16.78 16.85 Share Class C 26.37 25.33 25.37 Share Class I 21.50 20.41 20.19 Share Class Z 29.60 28.09 27.79
Net assets 467,947,948 442,711,262 525,816,361
euro Liquidity fund (eUr) - net asset value per:
Share Class A 12.89 12.88 12.84 Share Class B 11.90 11.90 11.90 Share Class C 25.02 25.02 25.01 Share Class I 13.19 13.19 13.10 Share Class Z 25.77 25.76 25.62
Net assets 116,038,496 244,622,946 164,759,661
US Dollar Liquidity fund (USD) - net asset value per:
Share Class A 13.03 13.03 13.02 Share Class AX 1.00 1.00 1.00 Share Class B 12.55 12.55 12.55 Share Class BX 1.00 1.00 1.00 Share Class I 13.54 13.54 13.54 Share Class IX - 1.00 1.00 Share Class Z 25.02 25.02 25.01
Net assets 3,644,437,486 508,834,865 235,127,017
Diversified alpha Plus fund (eUr) - net asset value per:
Share Class A 28.94 26.86 27.33 Share Class AH (USD) 30.36 28.02 28.66 Share Class B 27.66 25.93 26.64 Share Class BH (USD) 27.31 25.49 26.33 Share Class C 27.64 25.85 26.49 Share Class I 30.33 27.86 28.05 Share Class Z 30.28 27.80 27.99 Share Class ZH (GBP) 27.74 25.36 25.63 Share Class ZH (USD)* 25.82 - -
Net assets 705,771,691 434,724,426 419,303,396
(1) Fund commenced operations on 3 December 2012.(2) Fund commenced operations on 10 December 2012.* Share Class was launched during the year.
The accompanying notes are an integral part of these financial statements.

185 Morgan Stanley Investment Funds 31 December 2012
Statement of share and net assets statistics (continued)As at
31 December 2012 31 December 2011 31 December 2010
Global Balanced risk Control fund of funds (eUr) - net asset value per:
Share Class A 28.04 25.34 - Share Class B 27.74 25.30 - Share Class C* 25.60 - - Share Class Z* 27.25 - -
Net assets 185,192,930 458,513 -
absolute return Currency fund (eUr) - net asset value per:
Share Class A 23.18 25.61 25.83 Share Class A1 22.61 24.91 - Share Class AH (SEK)* 226.64 - - Share Class AH (USD) 22.81 25.25 25.75 Share Class B 21.85 24.39 24.85 Share Class I 24.25 26.50 26.46 Share Class IH (USD) 23.70 25.96 26.26 Share Class Z 23.08 25.17 -
Net assets 19,953,184 38,535,419 59,321,517
* Share Class was launched during the year.
The accompanying notes are an integral part of these financial statements.
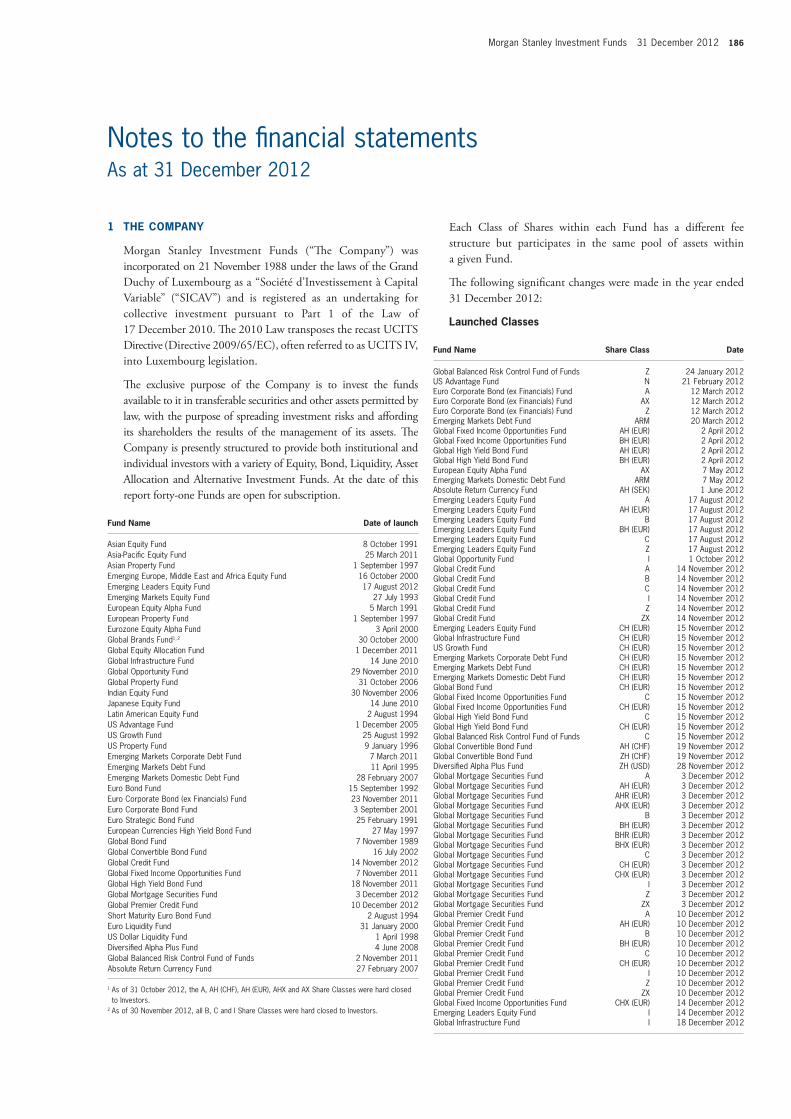
Morgan Stanley Investment Funds 31 December 2012 186
Notes to the financial statementsAs at 31 December 2012
1 the ComPanY
Morgan Stanley Investment Funds (“The Company”) was incorporated on 21 november 1988 under the laws of the grand Duchy of Luxembourg as a “Société d’Investissement à Capital variable” (“SICav”) and is registered as an undertaking for collective investment pursuant to Part 1 of the Law of 17 December 2010. The 2010 Law transposes the recast UCItS Directive (Directive 2009/65/eC), often referred to as UCItS Iv, into Luxembourg legislation.
The exclusive purpose of the Company is to invest the funds available to it in transferable securities and other assets permitted by law, with the purpose of spreading investment risks and affording its shareholders the results of the management of its assets. The Company is presently structured to provide both institutional and individual investors with a variety of equity, Bond, Liquidity, asset allocation and alternative Investment Funds. at the date of this report forty-one Funds are open for subscription.
fund name Date of launch
Asian Equity Fund 8 October 1991Asia-Pacific Equity Fund 25 March 2011Asian Property Fund 1 September 1997Emerging Europe, Middle East and Africa Equity Fund 16 October 2000Emerging Leaders Equity Fund 17 August 2012Emerging Markets Equity Fund 27 July 1993European Equity Alpha Fund 5 March 1991European Property Fund 1 September 1997Eurozone Equity Alpha Fund 3 April 2000Global Brands Fund1, 2 30 October 2000Global Equity Allocation Fund 1 December 2011Global Infrastructure Fund 14 June 2010Global Opportunity Fund 29 November 2010Global Property Fund 31 October 2006Indian Equity Fund 30 November 2006Japanese Equity Fund 14 June 2010Latin American Equity Fund 2 August 1994US Advantage Fund 1 December 2005US Growth Fund 25 August 1992US Property Fund 9 January 1996Emerging Markets Corporate Debt Fund 7 March 2011Emerging Markets Debt Fund 11 April 1995Emerging Markets Domestic Debt Fund 28 February 2007Euro Bond Fund 15 September 1992Euro Corporate Bond (ex Financials) Fund 23 November 2011Euro Corporate Bond Fund 3 September 2001Euro Strategic Bond Fund 25 February 1991European Currencies High Yield Bond Fund 27 May 1997Global Bond Fund 7 November 1989Global Convertible Bond Fund 16 July 2002Global Credit Fund 14 November 2012Global Fixed Income Opportunities Fund 7 November 2011Global High Yield Bond Fund 18 November 2011Global Mortgage Securities Fund 3 December 2012Global Premier Credit Fund 10 December 2012Short Maturity Euro Bond Fund 2 August 1994Euro Liquidity Fund 31 January 2000US Dollar Liquidity Fund 1 April 1998Diversified Alpha Plus Fund 4 June 2008Global Balanced Risk Control Fund of Funds 2 November 2011Absolute Return Currency Fund 27 February 2007
1 As of 31 October 2012, the A, AH (CHF), AH (EUR), AHX and AX Share Classes were hard closed to Investors.
2 As of 30 November 2012, all B, C and I Share Classes were hard closed to Investors.
each Class of Shares within each Fund has a different fee structure but participates in the same pool of assets within a given Fund.
The following significant changes were made in the year ended 31 December 2012:
Launched Classes
fund name Share Class Date
Global Balanced Risk Control Fund of Funds Z 24 January 2012US Advantage Fund N 21 February 2012Euro Corporate Bond (ex Financials) Fund A 12 March 2012Euro Corporate Bond (ex Financials) Fund AX 12 March 2012Euro Corporate Bond (ex Financials) Fund Z 12 March 2012Emerging Markets Debt Fund ARM 20 March 2012Global Fixed Income Opportunities Fund AH (EUR) 2 April 2012Global Fixed Income Opportunities Fund BH (EUR) 2 April 2012Global High Yield Bond Fund AH (EUR) 2 April 2012Global High Yield Bond Fund BH (EUR) 2 April 2012European Equity Alpha Fund AX 7 May 2012Emerging Markets Domestic Debt Fund ARM 7 May 2012Absolute Return Currency Fund AH (SEK) 1 June 2012Emerging Leaders Equity Fund A 17 August 2012Emerging Leaders Equity Fund AH (EUR) 17 August 2012Emerging Leaders Equity Fund B 17 August 2012Emerging Leaders Equity Fund BH (EUR) 17 August 2012Emerging Leaders Equity Fund C 17 August 2012Emerging Leaders Equity Fund Z 17 August 2012Global Opportunity Fund I 1 October 2012Global Credit Fund A 14 November 2012Global Credit Fund B 14 November 2012Global Credit Fund C 14 November 2012Global Credit Fund I 14 November 2012Global Credit Fund Z 14 November 2012Global Credit Fund ZX 14 November 2012Emerging Leaders Equity Fund CH (EUR) 15 November 2012Global Infrastructure Fund CH (EUR) 15 November 2012US Growth Fund CH (EUR) 15 November 2012Emerging Markets Corporate Debt Fund CH (EUR) 15 November 2012Emerging Markets Debt Fund CH (EUR) 15 November 2012Emerging Markets Domestic Debt Fund CH (EUR) 15 November 2012Global Bond Fund CH (EUR) 15 November 2012Global Fixed Income Opportunities Fund C 15 November 2012Global Fixed Income Opportunities Fund CH (EUR) 15 November 2012Global High Yield Bond Fund C 15 November 2012Global High Yield Bond Fund CH (EUR) 15 November 2012Global Balanced Risk Control Fund of Funds C 15 November 2012Global Convertible Bond Fund AH (CHF) 19 November 2012Global Convertible Bond Fund ZH (CHF) 19 November 2012Diversified Alpha Plus Fund ZH (USD) 28 November 2012Global Mortgage Securities Fund A 3 December 2012Global Mortgage Securities Fund AH (EUR) 3 December 2012Global Mortgage Securities Fund AHR (EUR) 3 December 2012Global Mortgage Securities Fund AHX (EUR) 3 December 2012Global Mortgage Securities Fund B 3 December 2012Global Mortgage Securities Fund BH (EUR) 3 December 2012Global Mortgage Securities Fund BHR (EUR) 3 December 2012Global Mortgage Securities Fund BHX (EUR) 3 December 2012Global Mortgage Securities Fund C 3 December 2012Global Mortgage Securities Fund CH (EUR) 3 December 2012Global Mortgage Securities Fund CHX (EUR) 3 December 2012Global Mortgage Securities Fund I 3 December 2012Global Mortgage Securities Fund Z 3 December 2012Global Mortgage Securities Fund ZX 3 December 2012Global Premier Credit Fund A 10 December 2012Global Premier Credit Fund AH (EUR) 10 December 2012Global Premier Credit Fund B 10 December 2012Global Premier Credit Fund BH (EUR) 10 December 2012Global Premier Credit Fund C 10 December 2012Global Premier Credit Fund CH (EUR) 10 December 2012Global Premier Credit Fund I 10 December 2012Global Premier Credit Fund Z 10 December 2012Global Premier Credit Fund ZX 10 December 2012Global Fixed Income Opportunities Fund CHX (EUR) 14 December 2012Emerging Leaders Equity Fund I 14 December 2012Global Infrastructure Fund I 18 December 2012
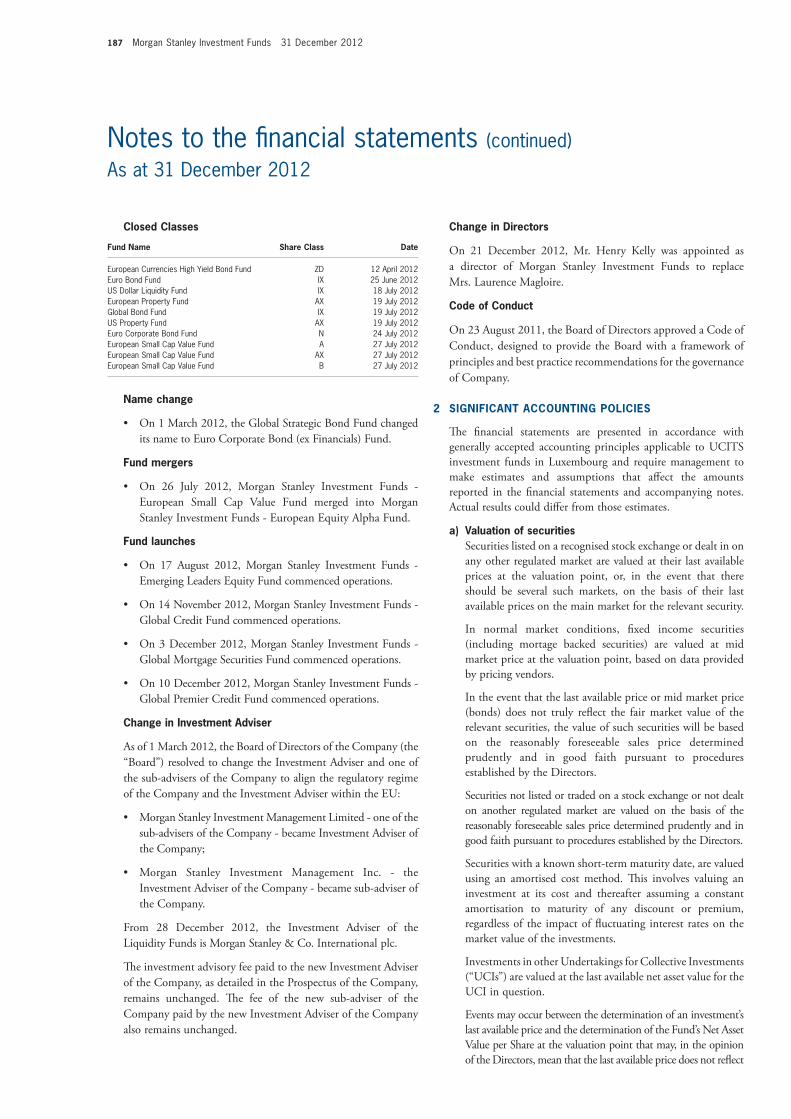
187 Morgan Stanley Investment Funds 31 December 2012
Notes to the financial statements (continued)As at 31 December 2012
Closed Classes
fund name Share Class Date
European Currencies High Yield Bond Fund ZD 12 April 2012Euro Bond Fund IX 25 June 2012US Dollar Liquidity Fund IX 18 July 2012European Property Fund AX 19 July 2012Global Bond Fund IX 19 July 2012US Property Fund AX 19 July 2012Euro Corporate Bond Fund N 24 July 2012European Small Cap Value Fund A 27 July 2012European Small Cap Value Fund AX 27 July 2012European Small Cap Value Fund B 27 July 2012
name change
• On 1 March 2012, the global Strategic Bond Fund changed its name to euro Corporate Bond (ex Financials) Fund.
fund mergers
• On 26 July 2012, Morgan Stanley Investment Funds -european Small Cap value Fund merged into Morgan Stanley Investment Funds - european equity alpha Fund.
fund launches
• On 17 august 2012, Morgan Stanley Investment Funds - emerging Leaders equity Fund commenced operations.
• On14November2012,MorganStanleyInvestmentFunds-global Credit Fund commenced operations.
• On3December2012,MorganStanley InvestmentFunds -global Mortgage Securities Fund commenced operations.
• On10December2012,MorganStanleyInvestmentFunds-global Premier Credit Fund commenced operations.
Change in investment adviser
as of 1 March 2012, the Board of Directors of the Company (the “Board”) resolved to change the Investment adviser and one of the sub-advisers of the Company to align the regulatory regime of the Company and the Investment adviser within the eU:
• Morgan Stanley Investment Management Limited - one of the sub-advisers of the Company - became Investment adviser of the Company;
• Morgan Stanley Investment Management Inc. - the Investment adviser of the Company - became sub-adviser of the Company.
From 28 December 2012, the Investment adviser of the Liquidity Funds is Morgan Stanley & Co. International plc.
The investment advisory fee paid to the new Investment adviser of the Company, as detailed in the Prospectus of the Company, remains unchanged. The fee of the new sub-adviser of the Company paid by the new Investment adviser of the Company also remains unchanged.
Change in Directors
On 21 December 2012, Mr. Henry Kelly was appointed as a director of Morgan Stanley Investment Funds to replace Mrs. Laurence Magloire.
Code of Conduct
On 23 august 2011, the Board of Directors approved a Code of Conduct, designed to provide the Board with a framework of principles and best practice recommendations for the governance of Company.
2 SiGnifiCant aCCoUntinG PoLiCieS
The financial statements are presented in accordance with generally accepted accounting principles applicable to UCItS investment funds in Luxembourg and require management to make estimates and assumptions that affect the amounts reported in the financial statements and accompanying notes. actual results could differ from those estimates.
a) valuation of securities Securities listed on a recognised stock exchange or dealt in on
any other regulated market are valued at their last available prices at the valuation point, or, in the event that there should be several such markets, on the basis of their last available prices on the main market for the relevant security.
In normal market conditions, fixed income securities (including mortage backed securities) are valued at mid market price at the valuation point, based on data provided by pricing vendors.
In the event that the last available price or mid market price (bonds) does not truly reflect the fair market value of the relevant securities, the value of such securities will be based on the reasonably foreseeable sales price determined prudently and in good faith pursuant to procedures established by the Directors.
Securities not listed or traded on a stock exchange or not dealt on another regulated market are valued on the basis of the reasonably foreseeable sales price determined prudently and in good faith pursuant to procedures established by the Directors.
Securities with a known short-term maturity date, are valued using an amortised cost method. This involves valuing an investment at its cost and thereafter assuming a constant amortisation to maturity of any discount or premium, regardless of the impact of fluctuating interest rates on the market value of the investments.
Investments in other Undertakings for Collective Investments (“UCIs”) are valued at the last available net asset value for the UCI in question.
events may occur between the determination of an investment’s last available price and the determination of the Fund’s net asset value per Share at the valuation point that may, in the opinion of the Directors, mean that the last available price does not reflect

Morgan Stanley Investment Funds 31 December 2012 188
Notes to the financial statements (continued)As at 31 December 2012
the fair market value of the investment. In such circumstances the price of such investment shall be adjusted in accordance with the procedures adopted from time to time by the Directors in their discretion. as at the date of this annual report, certain securities may be fair valued in accordance with these procedures.
If since the time of determination of the net asset value there has been a material change in the quotations in the markets on which a substantial portion of the investments attributable to an available Fund are dealt in or quoted, the Company may, in order to safeguard the interests of the shareholders and the Company, cancel the first valuation and carry out further valuations as appropriate.
b) valuation of interest rate swaps an Interest Rate Swap (“IRS”) is a bilateral agreement in which
each of the parties agree to exchange a series of interest payments (usually fixed/floating) based on a notional amount that serves as a computation basis and that is usually not exchanged.
IRS contracts are valued by reference to service data providers, market data and algorithms.
The unrealised gain/loss as at year end is recorded under “Unrealised gain/loss on interest rate swap contracts” in the Statement of assets and liabilities. The changes in such amounts are recorded under “net change in unrealised appreciation/(depreciation) on interest rate swap contracts” and the realised gain/loss under “net realised gain/(loss) on interest rate swap contracts” in the Statement of operations and changes in net assets.
c) valuation of Credit default swaps a Credit Default Swap (“CDS”) is a transaction in which two
parties enter into an agreement, whereby the buyer pays the seller a periodic payment for the specified life of the agreement. The seller makes no payments unless a credit event, relating to a predetermined reference asset, occurs. If such an event does occur, the seller will then make a payment to the buyer, and the swap contract will terminate.
CDS contracts are valued by reference to service data providers, market data and algorithms.
The unrealised gain/loss as at year end is recorded under “Unrealised gain/loss on credit default swap contracts” in the Statement of assets and liabilities. The changes in such amounts are recorded under “net change in unrealised appreciation/(depreciation) on credit default swap contracts” and the realised gain/loss under “net realised gain/(loss) on credit default swap contracts” in the Statement of operations and changes in net assets.
d) valuation of total return swaps a total Return Swap (“tRS”) is a transaction in which the
buyer receives the performance of an underlying asset and in return the buyer pays funding costs and generally, an arrangement fee. The underlying asset may be, but not limited to, a specific security, basket of securities, other instruments and index.
tRS contracts are valued by reference to the mark to market value based on the market value of the underlying asset.
The unrealised gain/loss as at year end is recorded under “Unrealised gain/loss on total return swap contracts” in the Statement of assets and liabilities. The changes in such amounts are recorded under “net change in unrealised appreciation/(depreciation) on total return swap contracts” and the realised gain/loss under “net realised gain/(loss) on total return swap contracts” in the Statement of operations and changes in net assets.
e) valuation of options Options are contractual agreements that convey the right, but
not the obligation, for the purchaser either to buy or sell a specific amount of a financial instrument at a fixed price, either at a fixed future date or at any time within a specified period.
Options are valued by reference to the expected future cash flow based on the market implied performance, spot level and the volatility of the underlying asset(s).
When securities are acquired or delivered upon exercise of an option, the acquisition cost or sale proceeds are adjusted by the amount of the premium paid. When an option is closed, the difference between the premium and the cost to close the position is recorded under “net realised gain/(loss) on options” in the Statement of operations and changes in net assets. When an option expires, the premium is accounted for as a realised gain for options written or as a realised loss for options purchased.
The unrealised gain/loss on option as at year end is recorded under “Unrealised gain/loss on options” in the Statement of assets and liabilities. The changes in such amounts are recorded under “net change in unrealised appreciation/(depreciation) on options” in the Statement of operations and changes in net assets.
f) valuation of forward foreign exchange contracts a forward foreign exchange contract is an agreement
between two parties to exchange one currency for another at a specific price and date in the future.
Open forward contracts are valued based by reference to the last available currency rates prevailing at the relevant valuation date.
The unrealised gain/loss as at year end is recorded under “Unrealised gain/loss on forward foreign currency exchange contracts” in the Statement of assets and liabilities. The changes in such amounts are recorded under “net change in unrealised appreciation/(depreciation) on foreign exchange transactions” and the realised gain/loss under “net realised gain/(loss) on foreign exchange transactions” in the Statement of operations and changes in net assets.
g) valuation of futures contracts a futures contract is a contractual agreement, to buy or sell
a particular commodity or financial instrument at a pre-determined price in the future. Futures contracts detail the quality and quantity of the underlying asset and they are standardised to facilitate trading on a futures exchange.

189 Morgan Stanley Investment Funds 31 December 2012
Notes to the financial statements (continued)As at 31 December 2012
Futures contracts are valued at the last available prices on the exchanges for which the contracts are traded on.
The unrealised gain/loss as at year end is recorded under “Unrealised gain/loss on futures contracts” in the Statement of assets and liabilities. The changes in such amounts are recorded under “net change in unrealised appreciation/(depreciation) on financial futures contracts” and the realised gain/loss under “net realised gain/(loss) on financial futures contracts” in the Statement of operations and changes in net assets.
h) income and securities transactions Dividend income is recorded on the ex dividend date.
Interest income is accrued daily. Discounts and premiums are accreted and amortised as adjustments to interest income. Income from securities lending is recorded on a cash receipts basis.
Securities transactions are accounted for on a trade date basis, on the date the securities are purchased or sold. Realised gains or losses on the sale of securities are determined on the basis of the average cost method and are recorded under “net realised gain/(loss) on investments” in the Statement of operations and changes in net assets.
i) valuation of repurchase agreements Under a repurchase agreement, the Company purchases
securities and agrees to re-sell them at a mutually agreed upon date and price. a repurchase agreement is collateralised by securities (see note 11). Repurchase agreements are valued at cost with interest accrued from the date of purchase.
j) translation of foreign currencies transactions in foreign currencies are translated into the
currency of each Fund at the last available rate of exchange prevailing in a recognised market at the date of the transactions. assets and liabilities denominated in foreign currencies are translated into the currency of each Fund at the last available rate of exchange prevailing in a recognised market at the date of the Statement of assets and liabilities.
The Combined statement of assets and liabilities is presented in US dollars at the last available rate of exchange prevailing in a recognised market at the date of the Statement of assets and liabilities, while the combined Statement of operations and changes in net assets is presented in US dollars at the average exchange rates ruling during the year.
The difference between opening net assets stated at exchange rates at the beginning of the year and their value at the end of the year is shown as “translation difference” in the Statement of operations and changes in net assets.
k) mauritian subsidiary The Indian equity Fund currently invests through Morgan
Stanley SICav (Mauritius) Ltd (the “Subsidiary”). all assets and liabilities, income and expenses of the Subsidiary are
recorded in the Statement of assets and liabilities and the Statement of operations and changes in net assets of the Indian equity Fund. all investments held by the Subsidiary are individually disclosed in the statement of investments of the Indian equity Fund.
The Subsidiary incurs and pays certain fees and expenses relating to its investment activity in India. These fees and expenses may include brokerage costs and commissions, transaction costs associated with converting currency to and from Indian Rupee to US dollars, fees incurred by its standing proxy, corporate and registration fees and taxes associated with the establishment and operation of the Subsidiary.
3 SeCUritieS LenDinG
Certain Fund’s may lend securities to qualified financial institutions, such as broker-dealers, to earn additional income. any increase or decrease in the fair value of the securities loaned that might occur and any interest earned or dividends declared on those securities during the term of the loan would remain in the Fund. Funds that lend securities, receive securities as collateral in an amount equal to or exceeding 100% of the current fair value of the loaned securities. The collateral is marked to market daily, by the securities lending agent, to ensure that a minimum of 100% collateral coverage is maintained throughout the term of the loan. Securities lending income is generated as a result of securities on loan less compensation to the administrative agent. net securities lending income is included in the Statement of operations and changes in net assets. See note 4(b) for related party disclosure on securities lending transactions.
The value of loaned securities and related collateral outstanding as at 31 December 2012 are as follows:
fund name value in USDCollateral mv
in USD
Asian Equity Fund 6,074,555 6,491,275 Asia-Pacific Equity Fund 1,839,876 1,954,376 Emerging Markets Equity Fund 25,396,273 27,095,629 European Property Fund 25,277,745 27,160,114 Eurozone Equity Alpha Fund 1,273,507 1,368,339 Latin American Equity Fund 14,018,103 14,868,056 Emerging Markets Corporate Debt Fund 12,770,521 13,946,619 Emerging Markets Debt Fund 24,031,078 26,244,215 Euro Bond Fund 58,844,575 60,705,983Euro Corporate Bond Fund 278,191,225 285,547,694 Euro Strategic Bond Fund 36,006,599 36,545,052European Currencies High Yield Bond Fund 163,011,845 166,628,863Global Bond Fund 22,611,731 23,194,976 Global Fixed Income Opportunities Fund 1,159,330 1,259,436 Global High Yield Bond Fund 339,232 359,889 Euro Corporate Bond (ex Financials) Fund (1) 7,989,408 8,475,902 Short Maturity Euro Bond Fund 20,796,126 21,320,910
total 699,631,729 723,167,328
(1) Name changed from Global Strategic Bond Fund on 1 March 2012.

Morgan Stanley Investment Funds 31 December 2012 190
Notes to the financial statements (continued)As at 31 December 2012
4 reLateD PartY tranSaCtionS anD affiLiationS
Under the terms of an investment advisory agreement, Morgan Stanley Investment Management, Limited has been appointed Investment adviser with responsibility for advising the Company within the scope of the day-to-day management of the various Funds. The Investment adviser may delegate any of its responsibilities to any other party subject to approval by the Directors and the CSSF but the Investment adviser shall remain responsible for the proper performance by such party of those responsibilities. a full list of sub-advisers can be found on page 205. The Investment adviser is entitled to receive from the Company a fee payable monthly in arrears, and calculated on the basis of the average daily net assets (before deduction of the fee) of each Fund attributable to each Class of Shares.
all expenses are paid directly by the Company and fees paid to the Investment adviser are at the following annual rates:
fund name
Class a, aD,aDX, ah,
ahX, arm,aX, B, BD,BDX, Bh,
BhX and BX
Class C, CD, Ch and CX
Class i,ih, iX,Z, ZD,
Zh, ZhX and ZX Class S
Asian Equity Fund 1.40% 2.20% 0.75% - Asia-Pacific Equity Fund 1.50% 2.30% 0.85% - Asian Property Fund 1.40% 2.20% 0.75% - Emerging Europe, Middle East and Africa Equity Fund 1.60% 2.40% 1.10% - Emerging Leaders Equity Fund1 2.00% 2.80% 1.10% - Emerging Markets Equity Fund 1.60% 2.40% 1.10% - European Equity Alpha Fund 1.20% 1.90% 0.70% - European Property Fund 1.40% 2.20% 0.75% - European Small Cap Value Fund2 1.60% 2.40% 0.95% - Eurozone Equity Alpha Fund 1.40% 2.20% 0.75% - Global Brands Fund 1.40% 2.20% 0.75% - Global Equity Allocation Fund 1.50% 2.30% 0.55%7 - Global Infrastructure Fund 1.50% 2.30% 0.85% - Global Opportunity Fund 1.60% 2.40% 0.90% - Global Property Fund 1.50% 2.30% 0.85% - Indian Equity Fund 1.60% 2.40% 0.90% - Japanese Equity Fund 1.40% 2.20% 0.75% - Latin American Equity Fund 1.60% 2.40% 1.00% - US Advantage Fund 1.40% 2.20% 0.70% - US Growth Fund 1.40% 2.20% 0.70% - US Property Fund 1.40% 2.20% 0.75% - Emerging Markets Corporate Debt Fund 1.45% 2.15% 0.95% - Emerging Markets Debt Fund 1.40% 2.10% 0.90% - Emerging Markets Domestic Debt Fund 1.40% 2.10% 0.90% - Euro Bond Fund 0.80% 1.45% 0.45% - Euro Corporate Bond (ex Financials) Fund3 0.80%8 1.45% 0.45% - Euro Corporate Bond Fund 0.80% 1.45% 0.45% 0.40%Euro Strategic Bond Fund 0.80% 1.45% 0.45% - European Currencies High Yield Bond Fund 0.85% 1.50% 0.50% - Global Bond Fund 0.80% 1.45% 0.45% - Global Convertible Bond Fund 1.00% 1.60% 0.60% 0.55%Global Credit Fund4 0.80% 1.45% 0.45% - Global Fixed Income Opportunities Fund 1.00% 1.45% 0.45% - Global High Yield Bond Fund 1.00%9 1.60% 0.60% - Global Mortgage Securities Fund5 1.00% 1.60% 0.50% - Global Premier Credit Fund6 0.80% 1.45% 0.45% - Short Maturity Euro Bond Fund 0.80% 1.45% 0.45% - Euro Liquidity Fund 0.50% 0.85% 0.20% - US Dollar Liquidity Fund 0.50% 0.85% 0.20% - Diversified Alpha Plus Fund 1.75% 2.45% 0.80% - Global Balanced Risk Control Fund of Funds 2.00% 2.70% 0.80% -
1 Fund commenced operations on 17 August 2012. 2 Fund merged into European Equity Alpha Fund on 26 July 2012. 3 Name changed from Global Strategic Bond Fund on 1 March 2012. 4 Fund commenced operations on 14 November 2012. 5 Fund commenced operations on 3 December 2012. 6 Fund commenced operations on 10 December 2012. 7 With effect from 1 February 2012, the fee rate changed from 0.85% to 0.55%. 8 With effect from 1 March 2012, the fee rate changed from 1.00% to 0.80%. 9 With effect from 1 February 2012, the fee rate changed from 0.95% to 1.00%.
fund nameClass a
and B
Class a1, ah, ahX, arm,
aX, B1, Bh, BhX and BX
Class C, Ch, ChX
and CXClass iand Z
Class ih, ihX, iX,
Zh, ZhX, ZX, i1
and Z1 Class S
Absolute Return Currency Fund 2.00% 1.75% 2.45% 1.00% 0.80% -
No investment advisory fee is payable in respect of Class “N”, “NH” and “NX” Shares.
In the case of any individual Fund or Class, the Investment adviser may choose to waive or rebate all of its fee or any portion thereof at its absolute discretion for an indefinite period, in order to reduce the impact such fee may have on the performance of the Fund or Class in instances where the net assets of the Fund or Class are of insufficient size.
Where the Funds invest into Investment Funds that are managed by the Investment adviser or its affiliates, the net management fee and any shareholder services fee of the underlying Investment Funds, are rebated to the sub-funds to avoid duplicated Management fees otherwise known as “double dipping”.
The Funds will be subject to a monthly Shareholder Service Fee at a maximum annual rate of 0.25% of the Funds’ aggregate average daily net asset value attributable to all Classes of Shares of the Funds. The current fees charged by the Company are as follows:
A, AD, ADX, AH, AHX, ARM, AX, B, BD, BDX, BH, BHX, BX, C, CD, CH, CHX, CX 0.15%+I, IH, IHX, IX, Z, ZD, ZH, ZHX, ZX 0.08%+N, NH, NHX, NX NilS, SX 0.05%
+ Except for the Liquidity Funds which charge 0.05%.
The Shareholder Service Fee will remain in force for an unlimited period and may be changed, subject to the maximum noted above, by the Company upon no less than one month’s prior written notice.
The Shareholder Service Fee is paid to Morgan Stanley Investment Management Limited (the “Distributor”) as compensation for providing certain services to shareholders. The Distributor may choose to waive all of the shareholder service fees or any portion thereof at its absolute discretion and for an indefinite period.
For the absolute Return Currency Fund Share Classes a1, aH (USD), aH (SeK), BH, IH and Z, the Investment adviser may receive a performance fee (the “Performance Fee”) as defined by the prospectus. The Performance Fee will be calculated and accrued daily and will become payable at 31 December each year. For the year under review, no performance fees have accrued and become payable.
The Distributor is also paid a distribution fee for the equity Funds, Bond Funds, asset allocation Funds and alternative Investment Funds, accrued daily and paid monthly, at the annual rate of 1.00% of the average daily net asset value of

191 Morgan Stanley Investment Funds 31 December 2012
Notes to the financial statements (continued)As at 31 December 2012
Classes B, BX, BH, BHX, BD and BDX Shares as compensation for providing distribution-related services to the Funds with respect to such Shares.
The Liquidity Funds will pay the Distributor a distribution fee, accrued daily and paid monthly, at the annual rate of 0.75% of the average daily net asset value for Classes B, BX, BH and BHX Shares.
a) Morgan Stanley Investment Management Ltd. and the sub-advisers for the Company have entered into the following types of transactions in which a connected person had a material interest:
i) transactions in relation to an investment in respect of which an affiliated firm benefited from a commission, fee, mark up or mark down; or
ii) transactions in relation to a placing and/or a new issue in which the affiliated company was a member of the underwriting syndicate.
all the transactions executed on behalf of the Company were entered into in the ordinary course of business and on normal commercial terms.
The affiliations of the Directors are as follows:
Mrs. Laurence Magloire, a Director of the Fund until 21 December 2012, is an executive Director of Morgan Stanley Investment Management Limited.
Mr. andrew Mack acts as a consultant to Morgan Stanley Investment Management Limited.
b) The total aggregate value of the transactions of the Company effected through affiliated firms is USD 1,162,105,199; such transactions represent 0.85% of the total transactions. total brokerage commission paid to affiliated firms is USD 556,699 at an average rate of commission of 0.05%.
administration fees and transfer agent fees include operational costs of Morgan Stanley Investment Management Limited amounting to USD 308,886 and of Morgan Stanley Investment Management Limited, Luxembourg Branch, amounting to USD 1,395,936.
The Company has entered into a securities lending contract with Morgan Stanley & Co. International Limited, Morgan Stanley Securities Limited, Morgan Stanley & Co Incorporated and MSDW equity Finance Service I (Cayman) Limited which is under normal commercial terms. The arrangement is exclusive in relation to certain securities.
Securities lending income is allocated to each Fund based on the demand of the securities of each Fund that may be loaned during the year.
The following Funds received securities lending income from the above named affiliates:
fund name USD
European Equity Alpha Fund 844,543 European Property Fund 606,359 Eurozone Equity Alpha Fund 433,382
1,884,284
as at 31 December 2012, the emerging Markets equity Fund invested in the Morgan Stanley growth Fund, advised by an affiliate of the Investment adviser.
as at 31 December 2012, the following Funds invested in the Morgan Stanley Funds plc - euro Liquidity Fund, advised by an affiliate of the Investment adviser:
• european equity alpha Fund • eurozone equity alpha Fund • euro Bond Fund • euro Corporate Bond (ex Financials) Fund • euro Corporate Bond Fund • euro Strategic Bond Fund • european Currencies High Yield Bond Fund • global Bond Fund • Short Maturity euro Bond Fund • euro Liquidity Fund • Diversified alpha Plus Fund • absolute Return Currency Fund
as at 31 December 2012, the following Funds invested in the Morgan Stanley Funds plc - US Dollar treasury Liquidity Fund, advised by an affiliate of the Investment adviser:
• asian Property Fund • global Brands Fund • global equity allocation Fund • global Infrastructure Fund • global Opportunity Fund • global Property Fund • US advantage Fund • US growth Fund • US Property Fund
as at 31 December 2012, the following Funds invested in the Morgan Stanley Funds plc - US Dollar Liquidity Fund, advised by an affiliate of the Investment adviser:
• asian equity Fund • asia-Pacific equity Fund • emerging europe, Middle east and africa equity Fund • emerging Leaders equity Fund • emerging Markets equity Fund • Latin american equity Fund • emerging Markets Debt Fund • emerging Markets Corporate Debt Fund • emerging Markets Domestic Debt Fund • global Convertible Bond Fund

Morgan Stanley Investment Funds 31 December 2012 192
Notes to the financial statements (continued)As at 31 December 2012
as at 31 December 2012, Morgan Stanley Investment Funds - global Balanced Risk Control Fund of Funds invested in the Funds, advised by the Investment adviser or an affiliate, detailed in note 15 on pages 195-196.
Directors’ remuneration:
The Directors of the Company who are not Directors, officers or employees of the Investment Manager or any affiliate thereof will be entitled to remuneration from the Fund, at a current rate of eUR 40,000 per annum, for their services as Directors. The Fund also bears reasonable out of pocket expenses and cost of Directors and Officers insurance. These expenses are disclosed under Directors fees, expenses and insurance in the Statement of operations and changes in net assets.
5 DiviDenD PoLiCY
The Company offers accumulating Share Classes (Class a, a1, aD, aH, aO, B, B1, BD, BH, BO, C, CD, CH, CO, I, I1, ID, IH, IO, n, nD, nH, nO, S, Z, ZD, ZH and ZO), Distributing Share Classes (aDM, aDX, aHM, aHX, aM, aOM, aOX, aX, BDX, BHX, BOX, BX, CHX, COX, CX, IHX, IOX, IX, nHX, nOX, nX, ZHX, ZOX and ZX) and Discretionary Distributing Share Classes (aHR, aR, aRM, BHR, BR, IR and IRM).
For the Distributing Share Classes of the Bond Funds, equity Funds, asset allocation Funds and alternative Investment Funds, the Company intends to declare dividends which will be equal to at least 85% of the net investment income attributable to such Classes.
For the Discretionary Distributing Share Classes of the Bond Funds, equity Funds, asset allocation Funds and alternative Investment Funds, the Company intends to declare dividends which will be set at the discretion of the Directors. The declared dividend for the Discretionary Distributing Share Classes may be in excess of the net investment income attributable to such Classes, if this is the case there will be a reduction of capital.
In the case of the Distributing Share Classes aDX, aHX, aOX, aHR, aR, aX, BDX, BHX, BOX, BHR, BR, BX, CHX, COX, CX, IHX, IR, IOX, IX, nHX, nOX, nX, SX, ZHX, ZOX, ZX of the equity, Bond, asset allocation Funds and alternative Investment Funds, such dividends, if any, will be accrued on the last Dealing Day of June and December and declared on the next Dealing Day.
In the case of the Distributing Share Classes aDX, aHX, aOX, aHR, aR, aX, BDX, BHX, BOX, BHR, BR, BX, CHX, COX, CX, IHX, IR, IOX, IX, nHX, nOX, nX, SX, ZHX, ZOX, ZX of the Bond Funds, such dividends, if any, will be accrued on the last Dealing Day of March, June, September and December and declared on the next Dealing Day.
In the case of the Distributing Share Classes aDM, aHM, aM, aRM and aOM shares of the Bond Funds, such dividends, if any, will be accrued on the last Dealing Day of the month and declare on the next Dealing Day.
During the year ended 31 December 2012, the Fund paid dividends as follows:
fund name CcyShare Class ex-Date Pay Date
record Date
Dividend per Share
equity funds Asian Property Fund USD AX 02/01/2012 05/01/2012 31/12/2011 0.094202
USD AX 02/07/2012 05/07/2012 29/06/2012 0.100967 USD IX 02/01/2012 05/01/2012 31/12/2011 0.151365 USD IX 02/07/2012 05/07/2012 29/06/2012 0.161198
European Property Fund EUR AX 02/07/2012 05/07/2012 29/06/2012 0.335634 EUR IX 02/01/2012 05/01/2012 31/12/2011 0.002545 EUR IX 02/07/2012 05/07/2012 29/06/2012 0.410507
Emerging Europe, Middle East and Africa Equity Fund
EUR AX 02/07/2012 05/07/2012 29/06/2012 0.402338
European Equity Alpha Fund EUR AX 02/07/2012 05/07/2012 29/06/2012 0.093492 European Small Cap Value Fund EUR AX 02/01/2012 05/01/2012 31/12/2011 0.258521
EUR AX 02/07/2012 05/07/2012 29/06/2012 0.423955 Global Brands Fund EUR AHX 02/07/2012 05/07/2012 29/06/2012 0.246420
USD AX 02/01/2012 05/01/2012 31/12/2011 0.035981 USD AX 02/07/2012 05/07/2012 29/06/2012 0.268317 EUR BHX 02/07/2012 05/07/2012 29/06/2012 0.117035 USD BX 02/07/2012 05/07/2012 29/06/2012 0.122414 USD ZX 02/01/2012 05/01/2012 31/12/2011 0.263220 USD ZX 02/07/2012 05/07/2012 29/06/2012 0.647156
Global Property Fund USD IX 02/01/2012 05/01/2012 31/12/2011 0.109007 USD IX 02/07/2012 05/07/2012 29/06/2012 0.233368
US Property Fund USD AX 02/01/2012 05/01/2012 31/12/2011 0.168597 USD AX 02/07/2012 05/07/2012 29/06/2012 0.032376
Bond funds Emerging Markets Corporate Debt Fund
EUR AHX 02/01/2012 05/01/2012 31/12/2011 0.203921 EUR AHX 02/04/2012 05/04/2012 30/03/2012 0.277140 EUR AHX 02/07/2012 05/07/2012 29/06/2012 0.262492 EUR AHX 01/10/2012 04/10/2012 28/09/2012 0.217904 USD AX 02/01/2012 05/01/2012 31/12/2011 0.192983 USD AX 02/04/2012 05/04/2012 30/03/2012 0.225937 USD AX 02/07/2012 05/07/2012 29/06/2012 0.319469 USD AX 01/10/2012 04/10/2012 28/09/2012 0.226858 EUR BHX 02/01/2012 05/01/2012 31/12/2011 0.164709 EUR BHX 02/04/2012 05/04/2012 30/03/2012 0.203431 EUR BHX 02/07/2012 05/07/2012 29/06/2012 0.210162 EUR BHX 01/10/2012 04/10/2012 28/09/2012 0.162402 USD BX 02/01/2012 05/01/2012 31/12/2011 0.156731 USD BX 02/04/2012 05/04/2012 30/03/2012 0.216944 USD BX 02/07/2012 05/07/2012 29/06/2012 0.198939 USD BX 01/10/2012 04/10/2012 28/09/2012 0.169226
Emerging Markets Debt Fund EUR AHX 02/01/2012 05/01/2012 31/12/2011 0.154012 EUR AHX 02/04/2012 05/04/2012 30/03/2012 0.232363 EUR AHX 02/07/2012 05/07/2012 29/06/2012 0.236003 EUR AHX 01/10/2012 04/10/2012 28/09/2012 0.203578 USD ARM 02/04/2012 05/04/2012 30/03/2012 0.049000 USD ARM 02/05/2012 07/05/2012 30/04/2012 0.093625 USD ARM 01/06/2012 06/06/2012 31/05/2012 0.117272 USD ARM 02/07/2012 05/07/2012 29/06/2012 0.113636 USD ARM 01/08/2012 06/08/2012 31/07/2012 0.117113 USD ARM 03/09/2012 06/09/2012 31/08/2012 0.107326 USD ARM 01/10/2012 04/10/2012 28/09/2012 0.103799 USD ARM 02/11/2012 07/11/2012 31/10/2012 0.140697 USD ARM 03/12/2012 06/12/2012 30/11/2012 0.115056 USD AX 02/01/2012 05/01/2012 31/12/2011 1.097954 USD AX 02/04/2012 05/04/2012 30/03/2012 0.530860 USD AX 02/07/2012 05/07/2012 29/06/2012 0.524396 USD AX 01/10/2012 04/10/2012 28/09/2012 0.481704 EUR BHX 02/01/2012 05/01/2012 31/12/2011 0.114524 EUR BHX 02/04/2012 05/04/2012 30/03/2012 0.161592 EUR BHX 02/07/2012 05/07/2012 29/06/2012 0.194685 EUR BHX 01/10/2012 04/10/2012 28/09/2012 0.149830 USD BX 02/01/2012 05/01/2012 31/12/2011 0.093820 USD BX 02/04/2012 05/04/2012 30/03/2012 0.180537 USD BX 02/07/2012 05/07/2012 29/06/2012 0.183249 USD BX 01/10/2012 04/10/2012 28/09/2012 0.162512 GBP ZHX 02/01/2012 05/01/2012 31/12/2011 0.649105 GBP ZHX 02/04/2012 05/04/2012 30/03/2012 0.304926 GBP ZHX 02/07/2012 05/07/2012 29/06/2012 0.312632 GBP ZHX 01/10/2012 04/10/2012 28/09/2012 0.278643
Emerging Markets Domestic Debt Fund
EUR AHX 02/01/2012 05/01/2012 31/12/2011 0.115943 EUR AHX 02/04/2012 05/04/2012 30/03/2012 0.308274 EUR AHX 02/07/2012 05/07/2012 29/06/2012 0.188974 EUR AHX 01/10/2012 04/10/2012 28/09/2012 0.289529 USD ARM 01/06/2012 06/06/2012 31/05/2012 0.075400
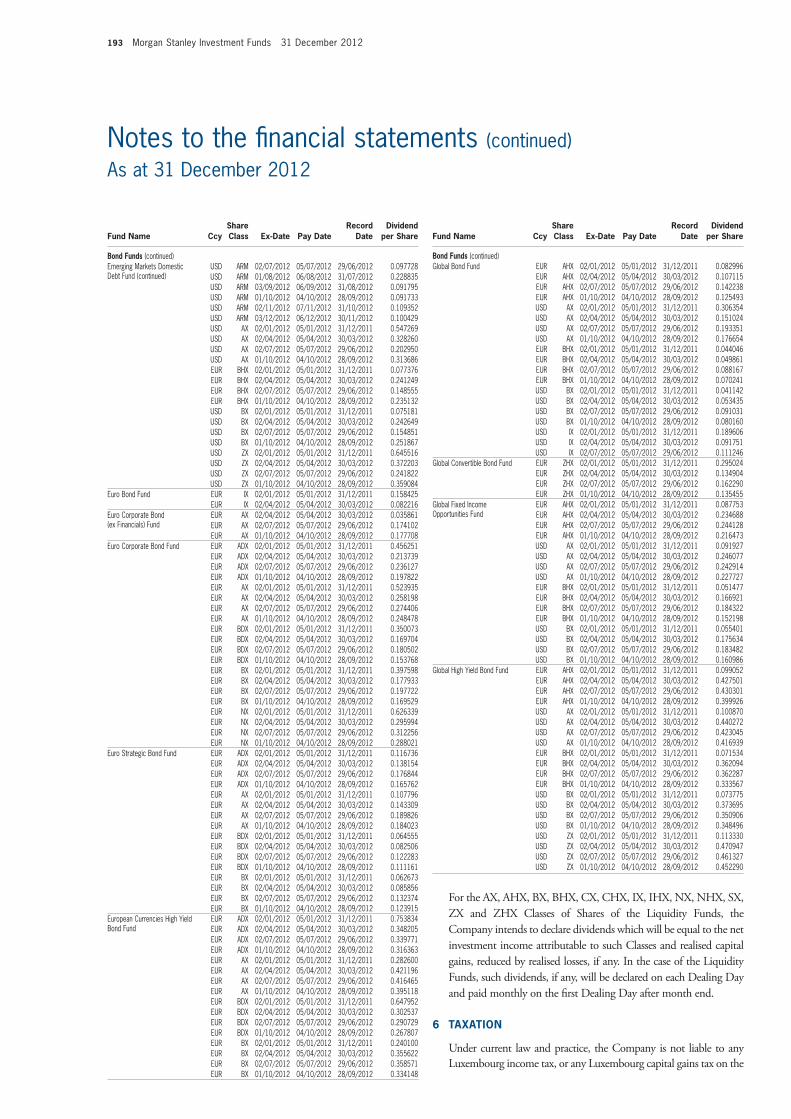
193 Morgan Stanley Investment Funds 31 December 2012
Notes to the financial statements (continued)As at 31 December 2012
fund name CcyShare Class ex-Date Pay Date
record Date
Dividend per Share
Bond funds (continued) Emerging Markets Domestic Debt Fund (continued)
USD ARM 02/07/2012 05/07/2012 29/06/2012 0.097728 USD ARM 01/08/2012 06/08/2012 31/07/2012 0.228835 USD ARM 03/09/2012 06/09/2012 31/08/2012 0.091795 USD ARM 01/10/2012 04/10/2012 28/09/2012 0.091733 USD ARM 02/11/2012 07/11/2012 31/10/2012 0.109352 USD ARM 03/12/2012 06/12/2012 30/11/2012 0.100429 USD AX 02/01/2012 05/01/2012 31/12/2011 0.547269 USD AX 02/04/2012 05/04/2012 30/03/2012 0.328260 USD AX 02/07/2012 05/07/2012 29/06/2012 0.202950 USD AX 01/10/2012 04/10/2012 28/09/2012 0.313686 EUR BHX 02/01/2012 05/01/2012 31/12/2011 0.077376 EUR BHX 02/04/2012 05/04/2012 30/03/2012 0.241249 EUR BHX 02/07/2012 05/07/2012 29/06/2012 0.148555 EUR BHX 01/10/2012 04/10/2012 28/09/2012 0.235132 USD BX 02/01/2012 05/01/2012 31/12/2011 0.075181 USD BX 02/04/2012 05/04/2012 30/03/2012 0.242649 USD BX 02/07/2012 05/07/2012 29/06/2012 0.154851 USD BX 01/10/2012 04/10/2012 28/09/2012 0.251867 USD ZX 02/01/2012 05/01/2012 31/12/2011 0.645516 USD ZX 02/04/2012 05/04/2012 30/03/2012 0.372203 USD ZX 02/07/2012 05/07/2012 29/06/2012 0.241822 USD ZX 01/10/2012 04/10/2012 28/09/2012 0.359084
Euro Bond Fund EUR IX 02/01/2012 05/01/2012 31/12/2011 0.158425 EUR IX 02/04/2012 05/04/2012 30/03/2012 0.082216
Euro Corporate Bond (ex Financials) Fund
EUR AX 02/04/2012 05/04/2012 30/03/2012 0.035861 EUR AX 02/07/2012 05/07/2012 29/06/2012 0.174102 EUR AX 01/10/2012 04/10/2012 28/09/2012 0.177708
Euro Corporate Bond Fund EUR ADX 02/01/2012 05/01/2012 31/12/2011 0.456251 EUR ADX 02/04/2012 05/04/2012 30/03/2012 0.213739 EUR ADX 02/07/2012 05/07/2012 29/06/2012 0.236127 EUR ADX 01/10/2012 04/10/2012 28/09/2012 0.197822 EUR AX 02/01/2012 05/01/2012 31/12/2011 0.523935 EUR AX 02/04/2012 05/04/2012 30/03/2012 0.258198 EUR AX 02/07/2012 05/07/2012 29/06/2012 0.274406 EUR AX 01/10/2012 04/10/2012 28/09/2012 0.248478 EUR BDX 02/01/2012 05/01/2012 31/12/2011 0.350073 EUR BDX 02/04/2012 05/04/2012 30/03/2012 0.169704 EUR BDX 02/07/2012 05/07/2012 29/06/2012 0.180502 EUR BDX 01/10/2012 04/10/2012 28/09/2012 0.153768 EUR BX 02/01/2012 05/01/2012 31/12/2011 0.397598 EUR BX 02/04/2012 05/04/2012 30/03/2012 0.177933 EUR BX 02/07/2012 05/07/2012 29/06/2012 0.197722 EUR BX 01/10/2012 04/10/2012 28/09/2012 0.169529 EUR NX 02/01/2012 05/01/2012 31/12/2011 0.626339 EUR NX 02/04/2012 05/04/2012 30/03/2012 0.295994 EUR NX 02/07/2012 05/07/2012 29/06/2012 0.312256 EUR NX 01/10/2012 04/10/2012 28/09/2012 0.288021
Euro Strategic Bond Fund EUR ADX 02/01/2012 05/01/2012 31/12/2011 0.116736 EUR ADX 02/04/2012 05/04/2012 30/03/2012 0.138154 EUR ADX 02/07/2012 05/07/2012 29/06/2012 0.176844 EUR ADX 01/10/2012 04/10/2012 28/09/2012 0.165762 EUR AX 02/01/2012 05/01/2012 31/12/2011 0.107796 EUR AX 02/04/2012 05/04/2012 30/03/2012 0.143309 EUR AX 02/07/2012 05/07/2012 29/06/2012 0.189826 EUR AX 01/10/2012 04/10/2012 28/09/2012 0.184023 EUR BDX 02/01/2012 05/01/2012 31/12/2011 0.064555 EUR BDX 02/04/2012 05/04/2012 30/03/2012 0.082506 EUR BDX 02/07/2012 05/07/2012 29/06/2012 0.122283 EUR BDX 01/10/2012 04/10/2012 28/09/2012 0.111161 EUR BX 02/01/2012 05/01/2012 31/12/2011 0.062673 EUR BX 02/04/2012 05/04/2012 30/03/2012 0.085856 EUR BX 02/07/2012 05/07/2012 29/06/2012 0.132374 EUR BX 01/10/2012 04/10/2012 28/09/2012 0.123915
European Currencies High Yield Bond Fund
EUR ADX 02/01/2012 05/01/2012 31/12/2011 0.753834 EUR ADX 02/04/2012 05/04/2012 30/03/2012 0.348205 EUR ADX 02/07/2012 05/07/2012 29/06/2012 0.339771 EUR ADX 01/10/2012 04/10/2012 28/09/2012 0.316363 EUR AX 02/01/2012 05/01/2012 31/12/2011 0.282600 EUR AX 02/04/2012 05/04/2012 30/03/2012 0.421196 EUR AX 02/07/2012 05/07/2012 29/06/2012 0.416465 EUR AX 01/10/2012 04/10/2012 28/09/2012 0.395118 EUR BDX 02/01/2012 05/01/2012 31/12/2011 0.647952 EUR BDX 02/04/2012 05/04/2012 30/03/2012 0.302537 EUR BDX 02/07/2012 05/07/2012 29/06/2012 0.290729 EUR BDX 01/10/2012 04/10/2012 28/09/2012 0.267807 EUR BX 02/01/2012 05/01/2012 31/12/2011 0.240100 EUR BX 02/04/2012 05/04/2012 30/03/2012 0.355622 EUR BX 02/07/2012 05/07/2012 29/06/2012 0.358571 EUR BX 01/10/2012 04/10/2012 28/09/2012 0.334148
fund name CcyShare Class ex-Date Pay Date
record Date
Dividend per Share
Bond funds (continued) Global Bond Fund EUR AHX 02/01/2012 05/01/2012 31/12/2011 0.082996
EUR AHX 02/04/2012 05/04/2012 30/03/2012 0.107115 EUR AHX 02/07/2012 05/07/2012 29/06/2012 0.142238 EUR AHX 01/10/2012 04/10/2012 28/09/2012 0.125493 USD AX 02/01/2012 05/01/2012 31/12/2011 0.306354 USD AX 02/04/2012 05/04/2012 30/03/2012 0.151024 USD AX 02/07/2012 05/07/2012 29/06/2012 0.193351 USD AX 01/10/2012 04/10/2012 28/09/2012 0.176654 EUR BHX 02/01/2012 05/01/2012 31/12/2011 0.044046 EUR BHX 02/04/2012 05/04/2012 30/03/2012 0.049861 EUR BHX 02/07/2012 05/07/2012 29/06/2012 0.088167 EUR BHX 01/10/2012 04/10/2012 28/09/2012 0.070241 USD BX 02/01/2012 05/01/2012 31/12/2011 0.041142 USD BX 02/04/2012 05/04/2012 30/03/2012 0.053435 USD BX 02/07/2012 05/07/2012 29/06/2012 0.091031 USD BX 01/10/2012 04/10/2012 28/09/2012 0.080160 USD IX 02/01/2012 05/01/2012 31/12/2011 0.189606 USD IX 02/04/2012 05/04/2012 30/03/2012 0.091751 USD IX 02/07/2012 05/07/2012 29/06/2012 0.111246
Global Convertible Bond Fund EUR ZHX 02/01/2012 05/01/2012 31/12/2011 0.295024 EUR ZHX 02/04/2012 05/04/2012 30/03/2012 0.134904 EUR ZHX 02/07/2012 05/07/2012 29/06/2012 0.162290 EUR ZHX 01/10/2012 04/10/2012 28/09/2012 0.135455
Global Fixed Income Opportunities Fund
EUR AHX 02/01/2012 05/01/2012 31/12/2011 0.087753 EUR AHX 02/04/2012 05/04/2012 30/03/2012 0.234688 EUR AHX 02/07/2012 05/07/2012 29/06/2012 0.244128 EUR AHX 01/10/2012 04/10/2012 28/09/2012 0.216473 USD AX 02/01/2012 05/01/2012 31/12/2011 0.091927 USD AX 02/04/2012 05/04/2012 30/03/2012 0.246077 USD AX 02/07/2012 05/07/2012 29/06/2012 0.242914 USD AX 01/10/2012 04/10/2012 28/09/2012 0.227727 EUR BHX 02/01/2012 05/01/2012 31/12/2011 0.051477 EUR BHX 02/04/2012 05/04/2012 30/03/2012 0.166921 EUR BHX 02/07/2012 05/07/2012 29/06/2012 0.184322 EUR BHX 01/10/2012 04/10/2012 28/09/2012 0.152198 USD BX 02/01/2012 05/01/2012 31/12/2011 0.055401 USD BX 02/04/2012 05/04/2012 30/03/2012 0.175634 USD BX 02/07/2012 05/07/2012 29/06/2012 0.183482 USD BX 01/10/2012 04/10/2012 28/09/2012 0.160986
Global High Yield Bond Fund EUR AHX 02/01/2012 05/01/2012 31/12/2011 0.099052 EUR AHX 02/04/2012 05/04/2012 30/03/2012 0.427501 EUR AHX 02/07/2012 05/07/2012 29/06/2012 0.430301 EUR AHX 01/10/2012 04/10/2012 28/09/2012 0.399926 USD AX 02/01/2012 05/01/2012 31/12/2011 0.100870 USD AX 02/04/2012 05/04/2012 30/03/2012 0.440272 USD AX 02/07/2012 05/07/2012 29/06/2012 0.423045 USD AX 01/10/2012 04/10/2012 28/09/2012 0.416939 EUR BHX 02/01/2012 05/01/2012 31/12/2011 0.071534 EUR BHX 02/04/2012 05/04/2012 30/03/2012 0.362094 EUR BHX 02/07/2012 05/07/2012 29/06/2012 0.362287 EUR BHX 01/10/2012 04/10/2012 28/09/2012 0.333567 USD BX 02/01/2012 05/01/2012 31/12/2011 0.073775 USD BX 02/04/2012 05/04/2012 30/03/2012 0.373695 USD BX 02/07/2012 05/07/2012 29/06/2012 0.350906 USD BX 01/10/2012 04/10/2012 28/09/2012 0.348496 USD ZX 02/01/2012 05/01/2012 31/12/2011 0.113330 USD ZX 02/04/2012 05/04/2012 30/03/2012 0.470947 USD ZX 02/07/2012 05/07/2012 29/06/2012 0.461327 USD ZX 01/10/2012 04/10/2012 28/09/2012 0.452290
For the aX, aHX, BX, BHX, CX, CHX, IX, IHX, nX, nHX, SX, ZX and ZHX Classes of Shares of the Liquidity Funds, the Company intends to declare dividends which will be equal to the net investment income attributable to such Classes and realised capital gains, reduced by realised losses, if any. In the case of the Liquidity Funds, such dividends, if any, will be declared on each Dealing Day and paid monthly on the first Dealing Day after month end.
6 taXation
Under current law and practice, the Company is not liable to any Luxembourg income tax, or any Luxembourg capital gains tax on the

Morgan Stanley Investment Funds 31 December 2012 194
Notes to the financial statements (continued)As at 31 December 2012
realised capital appreciation of the assets of the Company nor are dividends paid by the Company liable to any Luxembourg withholding tax. The Company is, however, liable to annual subscription tax in Luxembourg (“taxe d’abonnement”) calculated at the rate of 0.05% of the net asset value of the funds (except the Liquidity Funds for which the rate is 0.01% for all share class and nil for Z share class from 4rd quarter 2010). Furthermore, the Company has sought the benefit of a reduced annual tax rate of 0.01% for Class Z, ZD, ZH, ZX, ZHX, S, SX, n, nH, nX and nHX Shares. Subscription tax is not payable on the value of the assets of the Funds represented by investments in other Luxembourg undertaking for collective investment which are themselves subject to the subscription tax. This tax is payable quarterly on the basis of the net assets of the relevant Funds, calculated at the end of the quarter to which the tax relates. no stamp or other tax will be payable in Luxembourg in connection with the issue of Shares of the Company, except a once and for all tax of eUR 1,239.47 which was paid upon incorporation.
Dividends, interest and capital gains on securities held by the Company may be subject to non-recoverable withholding tax or capital gains tax in the country of origin.
7 rateS of eXChanGe
The rates of exchange used for translation into US dollars of Statement of assets and liabilities and Statement of operations and changes in net assets, including securities and foreign currency holdings, as of 31 December 2012 were:
Currency
AED 3.673 = $1.00AUD 0.963 = $1.00BRL 2.050 = $1.00CAD 0.996 = $1.00CHF 0.913 = $1.00CLP 478.800 = $1.00CNH 6.224 = $1.00COP 1,767.000 = $1.00CZK 19.013 = $1.00DKK 5.644 = $1.00DOP 40.300 = $1.00EGP 6.365 = $1.00EUR 0.756 = $1.00EUR* 0.759 = $1.00EUR** 0.778 = $1.00GBP 0.615 = $1.00HKD 7.750 = $1.00HUF 220.200 = $1.00IDR 9,636.000 = $1.00ILS 3.734 = $1.00INR 54.875 = $1.00ITL 1,464.595 = $1.00JPY 86.375 = $1.00JPY** 79.810 = $1.00KRW 1,066.210 = $1.00KWD 0.281 = $1.00MAD 8.429 = $1.00MXN 12.998 = $1.00MYR 3.058 = $1.00NGN 156.225 = $1.00NOK 5.560 = $1.00NZD 1.215 = $1.00OMR 0.385 = $1.00PEN 2.553 = $1.00PHP 41.010 = $1.00PLN 3.084 = $1.00QAR 3.641 = $1.00RON 3.363 = $1.00
Currency
RUB 30.538 = $1.00SEK 6.497 = $1.00SGD 1.221 = $1.00THB 30.590 = $1.00TRY 1.786 = $1.00TWD 29.057 = $1.00ZAR 8.480 = $1.00
* Rates of exchange used to translate Global Balanced Risk Control Fund of Funds and Absolute Return Currency Fund into US dollars in the Statement of assets and liabilities.
** Rates of exchange used to translate the Statement of operations and changes in net assets into US dollars.
8 Soft CommiSSion arranGementS
During the year the Company, its Investment adviser or its Sub-advisers did not enter into soft commission arrangements.
9 StatementS of PortfoLio ChanGeS
a statement giving the changes in the portfolio of investments for the year ended 31 December 2012 is available to shareholders, free of charge, on request from the Company’s registered office, and also from the Paying agents in countries where the company is registered to sell its Shares.
Please see list of Paying agents on page 200.
10 overDraft faCiLitY
The Company has access to a short-term credit extension facility with J.P. Morgan Bank Luxembourg S.a., primarily to facilitate the clearance of securities and foreign exchange transactions. Should such credit be extended, the Custodian shall be entitled to charge the Funds at rates to be agreed upon from time to time. In addition to any other remedies available, the Custodian shall be entitled to a right of set-off against the property of the Company to satisfy the repayment of, or reimbursement for accrued interest thereon and the Company has granted the Custodian a pledge, right of retention, lien charge and security interest in any and all property held by the Custodian for any amount owing to the Custodian from time to time under the credit extension facility.
11 rePUrChaSe aGreementS
Details of the total repurchase agreements outstanding and the related collateral at 31 December 2012 are as follows:
fund name amountmarket value
of Collateral received
US Dollar Liquidity Fund 425,350,000 USD 433,858,032 USDUS Dollar Liquidity Fund 100,000,000 USD 103,003,289 USDUS Dollar Liquidity Fund 165,000,000 USD 168,303,981 USDUS Dollar Liquidity Fund 282,000,000 USD 290,467,576 USD
The collateral received in respect of the repurchase agreements consists of transferable securities.

195 Morgan Stanley Investment Funds 31 December 2012
Notes to the financial statements (continued)As at 31 December 2012
12 LiaBiLitY of the ComPanY
The Directors shall maintain for each Fund a separate pool of assets. as between Shareholders, each pool of assets is invested for the exclusive benefit of the relevant Fund.
The assets of the Company have been segregated on a Fund by Fund basis with third party creditors only having recourse to the assets of the relevant Fund.
13 BroKer aCCoUntS
all derivative instruments, as listed within the Statements of Investments, on pages 2 to 145, all time deposits and repurchase agreements included in the Statement of assets and liabilities on pages 146 to 159, are transacted through third party brokers. In addition these brokers hold the collateral described in the above mentioned statements as applicable. The Funds are exposed to counter-party risk in respect of all amounts including collateral, due to them from such brokers.
Payments of income and settlement proceeds are at the risk of the Funds.
14 tranSaCtionS CoStS
For the year ended 31 December 2012, the Fund incurred transactions costs namely, commission and taxes relating to purchases or sale of transferable securities as follows:
fund name Currency
total transaction
Costs BPS
Asian Equity Fund USD 940,132 0.41Asia-Pacific Equity Fund USD 328,619 0.36Asian Property Fund USD 1,184,614 0.23Emerging Europe, Middle East and Africa Equity Fund EUR 551,199 0.26Emerging Leaders Equity Fund1 USD 66,739 0.35Emerging Markets Equity Fund USD 3,673,480 0.29European Equity Alpha Fund EUR 651,219 0.13European Property Fund EUR 412,429 0.22European Small Cap Value Fund2 EUR 47,288 0.33Eurozone Equity Alpha Fund EUR 126,910 0.12Global Brands Fund USD 13,104,679 0.17Global Equity Allocation Fund USD 8,114 0.06Global Infrastructure Fund USD 206,599 0.11Global Opportunity Fund USD 154,583 0.55Global Property Fund USD 956,504 0.17Indian Equity Fund USD 560,910 0.48Japanese Equity Fund JPY 14,583,194 0.30Latin American Equity Fund USD 1,723,020 0.21US Advantage Fund USD 3,173,817 0.10US Growth Fund USD 1,091,077 0.10US Property Fund USD 306,666 0.11Emerging Markets Corporate Debt Fund USD - 0.00Emerging Markets Debt Fund USD 2,808 0.00Emerging Markets Domestic Debt Fund USD 1,218 0.00Euro Bond Fund EUR 6,922 0.00Euro Corporate Bond (ex Financials) Fund3 EUR 2,316 0.00Euro Corporate Bond Fund EUR 109,119 0.01Euro Strategic Bond Fund EUR 29,405 0.01European Currencies High Yield Bond Fund EUR 2,454 0.00Global Bond Fund USD 23,403 0.00Global Convertible Bond Fund USD 46,416 0.00Global Credit Fund4 USD 122 0.00Global Fixed Income Opportunities Fund USD 1,782 0.00
fund name Currency
total transaction
Costs BPS
Global High Yield Bond Fund USD - 0.00Global Mortgage Securities Fund5 USD 227 0.00Global Premier Credit Fund6 USD 23 0.00Short Maturity Euro Bond Fund EUR 11,745 0.00Euro Liquidity Fund EUR - 0.00US Dollar Liquidity Fund USD - 0.00Diversified Alpha Plus Fund EUR 1,446,883 0.27Global Balanced Risk Control Fund of Funds EUR 6,984 0.01Absolute Return Currency Fund EUR 19,588 0.07
1 Fund commenced operations on 17 August 2012. 2 Fund merged into European Equity Alpha Fund on 26 July 2012. 3 Name changed from Global Strategic Bond Fund on 1 March 2012. 4 Fund commenced operations on 14 November 2012. 5 Fund commenced operations on 3 December 2012. 6 Fund commenced operations on 10 December 2012.
15 CroSS inveStment BetWeen fUnDS
The Company is permitted to engage in cross investment between Funds within the umbrella structure. The following information pertains to the cross-investment between Funds within the Company during the year:
as at 31 December 2012, Morgan Stanley Investment Funds - global Balanced Risk Control Fund of Funds holds the following shares of other Funds of the Company:
fund and Share Class name Shares Costmarket
valueUnrealised
Gain/(Loss)
Morgan Stanley Investment Funds - Asian Equity Fund ‘Z’ 258,955 5,468,107 5,590,848 122,741
Morgan Stanley Investment Funds - Emerging Markets Corporate Debt Fund ‘Z’ 160,860 3,476,093 3,680,468 204,375
Morgan Stanley Investment Funds - Emerging Markets Domestic Debt Fund ‘Z’ 261,628 7,423,863 7,385,756 (38,107)
Morgan Stanley Investment Funds - Emerging Markets Equity Fund ‘Z’ 452,514 8,178,420 8,366,986 188,567
Morgan Stanley Investment Funds - Euro Bond Fund ‘Z’ 192,141 6,054,566 6,475,158 420,592
Morgan Stanley Investment Funds - Euro Corporate Bond Fund ‘Z’ 130,567 4,320,030 4,624,678 304,648
Morgan Stanley Investment Funds - Euro Corporate Bond Fund ‘ZD’ 520,276 13,597,408 13,854,960 257,553
Morgan Stanley Investment Funds - Euro Liquidity Fund ‘Z’ 305,753 7,877,328 7,877,838 510
Morgan Stanley Investment Funds - European Currencies High Yield Bond Fund ‘Z’ 378,004 14,187,071 15,702,296 1,515,225
Morgan Stanley Investment Funds - European Equity Alpha Fund ‘Z’ 426,938 12,210,879 12,859,367 648,488
Morgan Stanley Investment Funds - Eurozone Equity Alpha Fund ‘Z’ 497,208 12,423,971 13,752,764 1,328,793
Morgan Stanley Investment Funds - Global Brands Fund ‘Z’ 595,926 14,727,899 14,761,095 33,196
Morgan Stanley Investment Funds - Global Fixed Income Opportunities Fund ‘Z’ 505,210 10,924,124 11,089,366 165,242
Morgan Stanley Investment Funds - Global Infrastructure Fund ‘Z’ 185,853 5,335,095 5,540,283 205,188
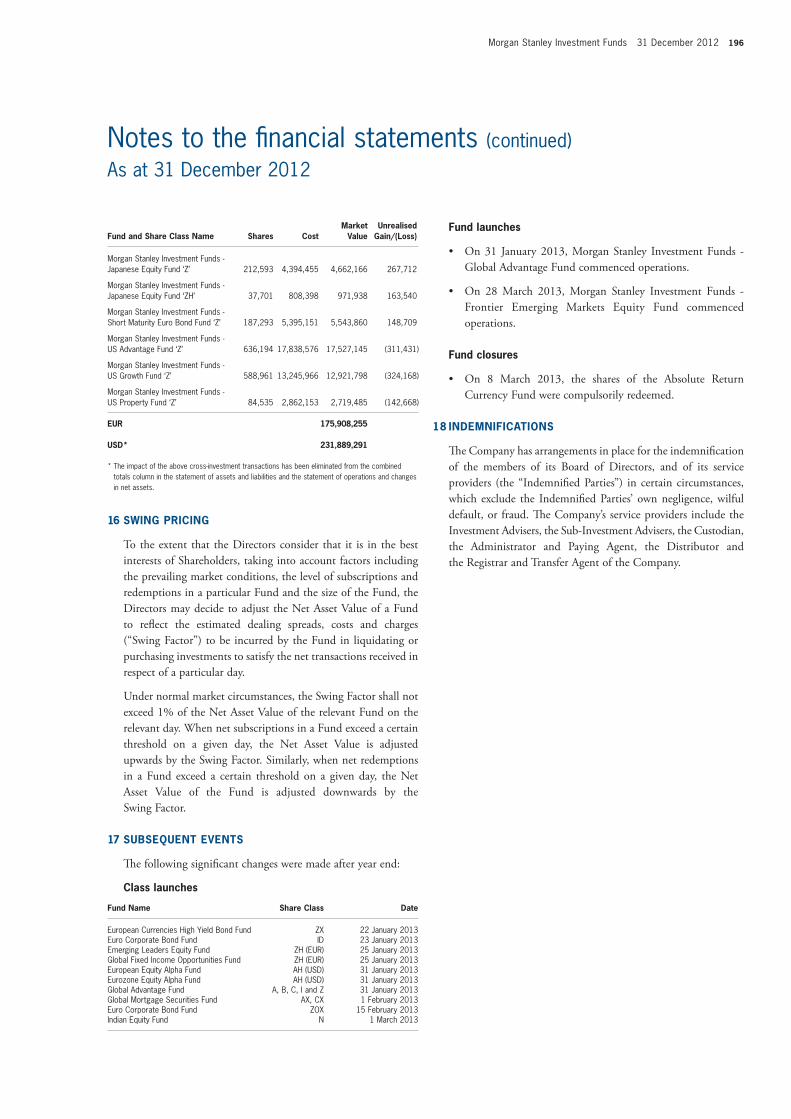
Morgan Stanley Investment Funds 31 December 2012 196
Notes to the financial statements (continued)As at 31 December 2012
fund and Share Class name Shares Costmarket
valueUnrealised
Gain/(Loss)
Morgan Stanley Investment Funds - Japanese Equity Fund ‘Z’ 212,593 4,394,455 4,662,166 267,712
Morgan Stanley Investment Funds - Japanese Equity Fund ‘ZH’ 37,701 808,398 971,938 163,540
Morgan Stanley Investment Funds - Short Maturity Euro Bond Fund ‘Z’ 187,293 5,395,151 5,543,860 148,709
Morgan Stanley Investment Funds - US Advantage Fund ‘Z’ 636,194 17,838,576 17,527,145 (311,431)
Morgan Stanley Investment Funds - US Growth Fund ‘Z’ 588,961 13,245,966 12,921,798 (324,168)
Morgan Stanley Investment Funds - US Property Fund ‘Z’ 84,535 2,862,153 2,719,485 (142,668)
eUr 175,908,255
USD* 231,889,291
* The impact of the above cross-investment transactions has been eliminated from the combined totals column in the statement of assets and liabilities and the statement of operations and changes in net assets.
16 SWinG PriCinG
to the extent that the Directors consider that it is in the best interests of Shareholders, taking into account factors including the prevailing market conditions, the level of subscriptions and redemptions in a particular Fund and the size of the Fund, the Directors may decide to adjust the net asset value of a Fund to reflect the estimated dealing spreads, costs and charges (“Swing Factor”) to be incurred by the Fund in liquidating or purchasing investments to satisfy the net transactions received in respect of a particular day.
Under normal market circumstances, the Swing Factor shall not exceed 1% of the net asset value of the relevant Fund on the relevant day. When net subscriptions in a Fund exceed a certain threshold on a given day, the net asset value is adjusted upwards by the Swing Factor. Similarly, when net redemptions in a Fund exceed a certain threshold on a given day, the net asset value of the Fund is adjusted downwards by the Swing Factor.
17 SUBSeQUent eventS
The following significant changes were made after year end:
Class launches
fund name Share Class Date
European Currencies High Yield Bond Fund ZX 22 January 2013Euro Corporate Bond Fund ID 23 January 2013Emerging Leaders Equity Fund ZH (EUR) 25 January 2013Global Fixed Income Opportunities Fund ZH (EUR) 25 January 2013European Equity Alpha Fund AH (USD) 31 January 2013Eurozone Equity Alpha Fund AH (USD) 31 January 2013Global Advantage Fund A, B, C, I and Z 31 January 2013Global Mortgage Securities Fund AX, CX 1 February 2013Euro Corporate Bond Fund ZOX 15 February 2013Indian Equity Fund N 1 March 2013
Fund launches
• On 31 January 2013, Morgan Stanley Investment Funds - global advantage Fund commenced operations.
• On 28 March 2013, Morgan Stanley Investment Funds - Frontier emerging Markets equity Fund commenced operations.
Fund closures
• On 8 March 2013, the shares of the absolute Return Currency Fund were compulsorily redeemed.
18 inDemnifiCationS
The Company has arrangements in place for the indemnification of the members of its Board of Directors, and of its service providers (the “Indemnified Parties”) in certain circumstances, which exclude the Indemnified Parties’ own negligence, wilful default, or fraud. The Company’s service providers include the Investment advisers, the Sub-Investment advisers, the Custodian, the administrator and Paying agent, the Distributor and the Registrar and transfer agent of the Company.

197 Morgan Stanley Investment Funds 31 December 2012
Independent Auditor’s Report
To the Shareholders of Morgan Stanley Investment Funds 6B, route de Trèves L-2633 Senningerberg Luxembourg
We have audited the accompanying financial statements of Morgan Stanley Investment Funds (the “SICav”) and of each of its sub-funds, which comprise the statement of assets and liabilities and the statement of investments as at 31 December 2012 and the statement of operations and changes in net assets for the year then ended, and a summary of significant accounting policies and other notes to the financial statements.
Responsibility of the Board of Directors of the SICAV for the financial statements
The Board of Directors of the SICav is responsible for the preparation and fair presentation of these financial statements in accordance with Luxembourg legal and regulatory requirements relating to the preparation and presentation of the financial statements and for such internal control as the Board of Directors of the SICav determines is necessary to enable the preparation and presentation of financial statements that are free from material misstatement, whether due to fraud or error.
Responsibility of the “réviseur d’entreprises agréé”
Our responsibility is to express an opinion on these financial statements based on our audit. We conducted our audit in accordance with International Standards on auditing as adopted for Luxembourg by the “Commission de Surveillance du Secteur Financier”. Those standards require that we comply with ethical requirements and plan and perform the audit to obtain reasonable assurance about whether the financial statements are free from material misstatement.
an audit involves performing procedures to obtain audit evidence about the amounts and disclosures in the financial statements. The procedures selected depend on the judgement of the “réviseur d’entreprises agréé”, including the assessment of the risks of material misstatement of the financial statements, whether due to fraud or error. In making those risk assessments, the “réviseur d’entreprises agréé” considers internal control relevant to the entity’s preparation and fair presentation of the financial statements in order to design audit procedures that are appropriate in the circumstances, but not for the purpose of expressing an opinion on the effectiveness of the entity’s internal control. an audit also includes evaluating the appropriateness of accounting policies used and the reasonableness of accounting estimates made by the Board of Directors of the SICav, as well as evaluating the overall presentation of the financial statements.
We believe that the audit evidence we have obtained is sufficient and appropriate to provide a basis for our audit opinion.
Opinion
In our opinion, the financial statements give a true and fair view of the financial position of Morgan Stanley Investment Funds and of each of its sub-funds as of 31 December 2012 and of the results of their operations and changes in their net assets for the year then ended in accordance with Luxembourg legal and regulatory requirements relating to the preparation and presentation of the financial statements.
Other matter
Supplementary information included in the annual report has been reviewed in the context of our mandate but has not been subject to specific audit procedures carried out in accordance with the standards described above. Consequently, we express no opinion on such information. However, we have no observation to make concerning such information in the context of the financial statements taken as a whole.
eRnSt & YOUng Société anonyme Cabinet de révision agréé
M. Ferguson
Luxembourg, 15 april 2013

Morgan Stanley Investment Funds 31 December 2012 198
Directors and service providers
DireCtorS
Michael Griffin non-executive DirectorDublinIreland
William Jones non-executive DirectorLuxembourg
andrew mack non-executive DirectorLondonUnited Kingdom
Laurence Magloire executive DirectorMorgan Stanley Investment Management Limited Luxembourg(until 21 December 2012)
Henry Kelly non-executive DirectorLuxembourg(from 21 December 2012)
DiriGeantS
Bryan Greener executive DirectorMorgan Stanley Investment Management Limited LondonUnited Kingdom
Laurence Magloireexecutive DirectorMorgan Stanley Investment Management Limited Luxembourg
DireCtorS of morGan StanLeY SiCav (maUritiUS) LimiteD (the “SUBSiDiarY”)
Deven Coopoosamy DirectorBusiness Development CIM global Business Companies Republic of Mauritius
William Jones non-executive DirectorLuxembourg
Andrew Mack non-executive DirectorLondonUnited Kingdom
Laurence magloire non-executive DirectorMorgan Stanley Investment Management Limited Luxembourg
Abdool Azize Owasil Director Fund administration CIM global Business Companies Republic of Mauritius
inveStment aDviSer
morgan Stanley investment management Limited25 Cabot Square Canary Wharf London e14 4QaUnited Kingdom
morgan Stanley & Co. international plc25 Cabot Square Canary Wharf London e14 4QaUnited Kingdom(for Liquidity Funds from 28 December 2012)
inveStment SUB-aDviSerS
morgan Stanley investment management inc.522 Fifth avenue new York, nY 10036USa
morgan Stanley investment management Company23 Church Street 16-01 Capital Square Singapore, 049481
reGiStereD offiCe
6B, route de trèves 2633 Senningerberg Luxembourg
DiStriBUtor
Morgan Stanley Investment Management Limited25 Cabot Square Canary Wharf London e14 4QaUnited Kingdom
CUStoDian BanK
J.P. Morgan Bank Luxembourg S.A.european Bank and Business Centre 6C, route de trèves 2633 Senningerberg Luxembourg
aDminiStrator anD PaYinG aGent
J.P. Morgan Bank Luxembourg S.A.european Bank and Business Centre 6C, route de trèves 2633 Senningerberg Luxembourg
DomiCiLiarY aGent
Morgan Stanley Investment Management Limited, Luxembourg Brancheuropean Bank and Business Centre 6B, route de trèves 2633 Senningerberg Luxembourg

199 Morgan Stanley Investment Funds 31 December 2012
Directors and service providers (continued)
aDminiStrator of the SUBSiDiarY
multiConsult LimitedRogers House 5, President John Kennedy Street Port Louis Republic of Mauritius(until 31 December 2012)
Cim fund Services Ltd. 33, edith Cavell Street Port Louis Republic of Mauritius(from 1 January 2013)
reGiStrar anD tranSfer aGent
rBC investor Services Bank S.a.14, rue Porte de France 4360 esch-sur-alzette Luxembourg
inDePenDent aUDitor
ernst & Young S.a. 7, rue gabriel Lippmann Parc d’activité Syrdall 2 5365 Munsbach Luxembourg
aUDitor of the SUBSiDiarY
ernst & Young 9th Floor nexteracom tower ICybercity ebene Republic of Mauritius
LeGaL aDviSer
arendt & medernach 14, rue erasme 2082 LuxembourgLuxembourg

Morgan Stanley Investment Funds 31 December 2012 200
aUStria
meinl Bank aktiengesellschaft Bauernmarkt 2 Postfach 99 1014 viennaaustria
BeLGiUm
rBC investor Services Belgium S.a. 11, Place Rogier 1210 BrusselsBelgium
DenmarK
nordea Bank Denmark a/S Strandgade 3 0900 Copenhagen CDenmark
franCe
Caceis 1/3 Place valhubert 75013 ParisFrance
GermanY
morgan Stanley Bank aG Junghofstrasse 13-15 60311 Frankfurt am Maingermany
GreeCe
alpha Bank 40, Stadiou Street 102 52 athensgreece
honG KonG
morgan Stanley asia Limited 30th Floor Three exchange Square Central Hong Kong
ireLanD
J.P. morgan administration Services (ireland) LimitedJP Morgan House International Financial Services Centre Dublin 1Ireland
itaLY
rBC investor Services italia S.p.a.via vittor Pisani, 26 21124 MilanItaly
Banca Sella holding S.p.a. Piazza gaudenzio Sella, 113900 Biella Italy
iccrea Banca S.p.a. via Lucrezia Romana, 41-47 00178 RomeItaly
State Street Bank S.p.a. via Ferrante aporti, 10 20125 MilanItaly
Société Générale Securities Services S.p.a.MaC 2 via Benigno Crespi, 19/a 20159 MilanItaly
allianz Bank financial advisors S.p.a.Piazzale Lodi, 3 20137 MilanItaly
monte dei Paschi di Siena S.p.a.Piazza Salimbeni, 3 53100 SienaItaly
BnP Paribas Securities Services Succursale di milano via ansperto, 5 20123 MilanItaly
all funds Bank S.a. italian Branch via Santa Margherita, 7 20121 MilanItaly
SPain
every distributor registered in Spain act as paying agents forthe Company and a list of them are available at www.cnmv.com
SWitZerLanD
rBC investor Services Bank S.a.esch-sur-alzette Zurich Branch Badenerstrasse 567 8048 ZurichSwitzerland
morgan Stanley & Co international PLC LondonZurich Branch Bahnhofstrasse 92 8001 ZurichSwitzerland
UniteD KinGDom
morgan Stanley investmentmanagement Limited25 Cabot Square London e14 4QaUnited Kingdom
Paying and information agentsCopies of the Financial Reports of the Company can be obtained from the following Paying and Information Agents.

201 Morgan Stanley Investment Funds 31 December 2012
Appendix 1: Fund expense ratios (audited)As at 31 December 2012
The following figures show the total expenses charged to each Class of each Fund open as at 31 December 2012, calculated net of any fee waivers and expressed as a percentage of average net assets for the period. For further information in relation to the expenses charged to the Funds, please refer to pages 167 to 177. For details of changes to the Investment advisory Fees during the year, please refer to note 4.
fund name total expense ratio (%)
Asian Equity Fund A - USD 1.90Asian Equity Fund B - USD 2.91Asian Equity Fund C - USD 2.75Asian Equity Fund I - USD 1.15Asian Equity Fund Z - USD 1.09Asia-Pacific Equity Fund A - USD 2.05Asia-Pacific Equity Fund AH - EUR 2.15Asia-Pacific Equity Fund B - USD 3.05Asia-Pacific Equity Fund BH - EUR 3.15Asia-Pacific Equity Fund C - USD 2.85Asia-Pacific Equity Fund N - USD 0.36Asia-Pacific Equity Fund Z - USD 1.29Asian Property Fund A - USD 1.74Asian Property Fund AX - USD 1.78Asian Property Fund B - USD 2.75Asian Property Fund I - USD 0.99Asian Property Fund IX - USD 1.01Asian Property Fund Z - USD 0.96Emerging Europe, Middle East and Africa Equity Fund A - EUR 2.08Emerging Europe, Middle East and Africa Equity Fund AX - EUR 2.12Emerging Europe, Middle East and Africa Equity Fund B - EUR 3.06Emerging Europe, Middle East and Africa Equity Fund C - EUR 2.95Emerging Europe, Middle East and Africa Equity Fund I - EUR 1.53Emerging Europe, Middle East and Africa Equity Fund Z - EUR 1.53Emerging Leaders Equity Fund A - USD1, 2 2.55Emerging Leaders Equity Fund AH - EUR1, 2 2.65Emerging Leaders Equity Fund B - USD1, 2 3.55Emerging Leaders Equity Fund BH - EUR1, 2 3.65Emerging Leaders Equity Fund C - USD1, 2 3.35Emerging Leaders Equity Fund CH - EUR1, 2 3.45Emerging Leaders Equity Fund I - USD1, 2 1.58Emerging Leaders Equity Fund Z - USD1, 2 1.54Emerging Markets Equity Fund A - USD 1.96Emerging Markets Equity Fund B - USD 2.96Emerging Markets Equity Fund C - USD 2.95Emerging Markets Equity Fund I - USD 1.36Emerging Markets Equity Fund N - USD 0.12Emerging Markets Equity Fund Z - USD 1.31European Equity Alpha Fund A - EUR 1.51European Equity Alpha Fund AX - EUR1 1.75European Equity Alpha Fund B - EUR 2.52European Equity Alpha Fund C - EUR 2.40European Equity Alpha Fund I - EUR 0.92European Equity Alpha Fund Z - EUR 0.87European Equity Alpha Fund ZH - GBP 0.94European Property Fund A - EUR 1.76European Property Fund B - EUR 2.79European Property Fund I - EUR 1.03European Property Fund IX - EUR 1.23European Property Fund Z - EUR 0.97Eurozone Equity Alpha Fund A - EUR 1.84Eurozone Equity Alpha Fund B - EUR 2.89Eurozone Equity Alpha Fund I - EUR 1.18Eurozone Equity Alpha Fund Z - EUR 1.05Global Brands Fund A - USD 1.67Global Brands Fund AH - CHF 1.74Global Brands Fund AH - EUR 1.73Global Brands Fund AHX - EUR 1.75Global Brands Fund AX - USD 1.68Global Brands Fund B - USD 2.68Global Brands Fund BH - EUR 2.73Global Brands Fund BHX - EUR 2.77Global Brands Fund BX - USD 2.70Global Brands Fund C - USD 2.47Global Brands Fund CH - EUR 2.59Global Brands Fund I - USD 0.94Global Brands Fund Z - USD 0.89Global Brands Fund ZH - EUR 0.96Global Brands Fund ZH - GBP 0.97Global Brands Fund ZX - USD 0.92Global Equity Allocation Fund A - USD 2.00Global Equity Allocation Fund B - USD 3.00Global Equity Allocation Fund Z - USD 0.94Global Infrastructure Fund A - USD 1.95Global Infrastructure Fund AH - EUR 2.07Global Infrastructure Fund B - USD 2.97
fund name total expense ratio (%)
Global Infrastructure Fund BH - EUR 3.01Global Infrastructure Fund C - USD 2.80Global Infrastructure Fund CH - EUR1 2.90Global Infrastructure Fund I - USD1 1.28Global Infrastructure Fund Z - USD 1.17Global Infrastructure Fund ZH - EUR 1.24Global Opportunity Fund A - USD 2.10Global Opportunity Fund AH - EUR 2.20Global Opportunity Fund B - USD 3.10Global Opportunity Fund BH - EUR 3.20Global Opportunity Fund C - USD 2.90Global Opportunity Fund I - USD1 1.33Global Opportunity Fund Z - USD 1.29Global Property Fund A - USD 1.84Global Property Fund AH - EUR 2.10Global Property Fund B - USD 2.87Global Property Fund BH - EUR 3.09Global Property Fund C - USD 2.77Global Property Fund CH - EUR 2.90Global Property Fund I - USD 1.10Global Property Fund IX - USD 1.15Global Property Fund Z - USD 1.05Indian Equity Fund A - USD 1.95Indian Equity Fund B - USD 2.95Indian Equity Fund C - USD 3.05Indian Equity Fund I - USD 1.18Indian Equity Fund Z - USD 1.14Japanese Equity Fund A - JPY 1.90Japanese Equity Fund B - JPY 2.90Japanese Equity Fund C - JPY 2.70Japanese Equity Fund I - JPY 1.18Japanese Equity Fund Z - JPY 1.14Japanese Equity Fund ZH - EUR 1.24Latin American Equity Fund A - USD 1.94Latin American Equity Fund B - USD 2.97Latin American Equity Fund C - USD 2.84Latin American Equity Fund I - USD 1.27Latin American Equity Fund Z - USD 1.22US Advantage Fund A - USD 1.69US Advantage Fund AH - EUR 1.72US Advantage Fund B - USD 2.71US Advantage Fund BH - EUR 2.75US Advantage Fund C - USD 2.49US Advantage Fund I - USD 0.90US Advantage Fund N - USD1 0.07US Advantage Fund Z - USD 0.85US Advantage Fund ZH - EUR 0.91US Growth Fund A - USD 1.71US Growth Fund AH - EUR 1.76US Growth Fund AX - USD 1.70US Growth Fund B - USD 2.73US Growth Fund BH - EUR 2.80US Growth Fund C - USD 2.55US Growth Fund CH - EUR1 2.80US Growth Fund I - USD 0.92US Growth Fund IX - USD 0.93US Growth Fund Z - USD 0.89US Growth Fund ZH - EUR 0.94US Property Fund A - USD 1.74US Property Fund B - USD 2.78US Property Fund I - USD 1.02US Property Fund Z - USD 0.97Emerging Markets Corporate Debt Fund A - USD 1.86Emerging Markets Corporate Debt Fund AH - EUR 1.95Emerging Markets Corporate Debt Fund AHX - EUR 2.05Emerging Markets Corporate Debt Fund AX - USD 2.00Emerging Markets Corporate Debt Fund B - USD 2.93Emerging Markets Corporate Debt Fund BH - EUR 3.00Emerging Markets Corporate Debt Fund BHX - EUR 3.00Emerging Markets Corporate Debt Fund BX - USD 2.91Emerging Markets Corporate Debt Fund C - USD 2.65Emerging Markets Corporate Debt Fund CH - EUR1 2.75Emerging Markets Corporate Debt Fund Z - USD 1.30Emerging Markets Debt Fund A - USD 1.72Emerging Markets Debt Fund AH - EUR 1.78Emerging Markets Debt Fund AHX - EUR 2.00
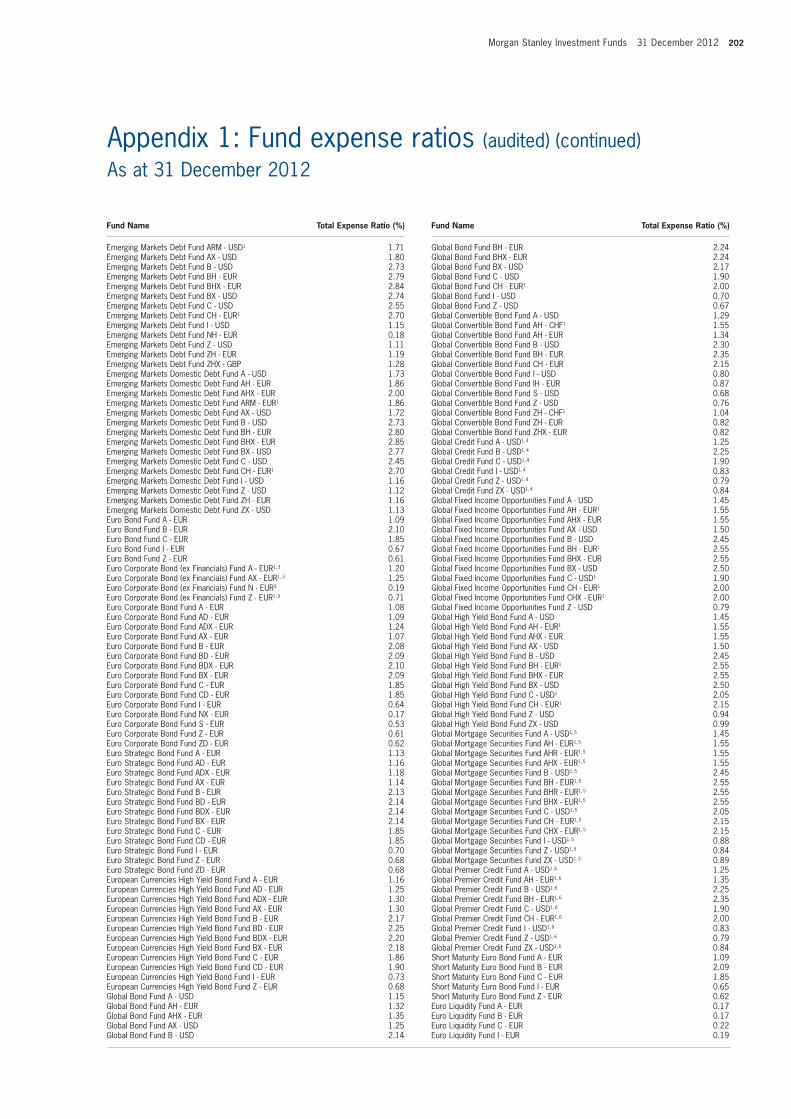
Morgan Stanley Investment Funds 31 December 2012 202
Appendix 1: Fund expense ratios (audited) (continued)As at 31 December 2012
fund name total expense ratio (%)
Emerging Markets Debt Fund ARM - USD1 1.71Emerging Markets Debt Fund AX - USD 1.80Emerging Markets Debt Fund B - USD 2.73Emerging Markets Debt Fund BH - EUR 2.79Emerging Markets Debt Fund BHX - EUR 2.84Emerging Markets Debt Fund BX - USD 2.74Emerging Markets Debt Fund C - USD 2.55Emerging Markets Debt Fund CH - EUR1 2.70Emerging Markets Debt Fund I - USD 1.15Emerging Markets Debt Fund NH - EUR 0.18Emerging Markets Debt Fund Z - USD 1.11Emerging Markets Debt Fund ZH - EUR 1.19Emerging Markets Debt Fund ZHX - GBP 1.28Emerging Markets Domestic Debt Fund A - USD 1.73Emerging Markets Domestic Debt Fund AH - EUR 1.86Emerging Markets Domestic Debt Fund AHX - EUR 2.00Emerging Markets Domestic Debt Fund ARM - EUR1 1.86Emerging Markets Domestic Debt Fund AX - USD 1.72Emerging Markets Domestic Debt Fund B - USD 2.73Emerging Markets Domestic Debt Fund BH - EUR 2.80Emerging Markets Domestic Debt Fund BHX - EUR 2.85Emerging Markets Domestic Debt Fund BX - USD 2.77Emerging Markets Domestic Debt Fund C - USD 2.45Emerging Markets Domestic Debt Fund CH - EUR1 2.70Emerging Markets Domestic Debt Fund I - USD 1.16Emerging Markets Domestic Debt Fund Z - USD 1.12Emerging Markets Domestic Debt Fund ZH - EUR 1.16Emerging Markets Domestic Debt Fund ZX - USD 1.13Euro Bond Fund A - EUR 1.09Euro Bond Fund B - EUR 2.10Euro Bond Fund C - EUR 1.85Euro Bond Fund I - EUR 0.67Euro Bond Fund Z - EUR 0.61Euro Corporate Bond (ex Financials) Fund A - EUR1, 3 1.20Euro Corporate Bond (ex Financials) Fund AX - EUR1, 3 1.25Euro Corporate Bond (ex Financials) Fund N - EUR3 0.19Euro Corporate Bond (ex Financials) Fund Z - EUR1, 3 0.71Euro Corporate Bond Fund A - EUR 1.08Euro Corporate Bond Fund AD - EUR 1.09Euro Corporate Bond Fund ADX - EUR 1.24Euro Corporate Bond Fund AX - EUR 1.07Euro Corporate Bond Fund B - EUR 2.08Euro Corporate Bond Fund BD - EUR 2.09Euro Corporate Bond Fund BDX - EUR 2.10Euro Corporate Bond Fund BX - EUR 2.09Euro Corporate Bond Fund C - EUR 1.85Euro Corporate Bond Fund CD - EUR 1.85Euro Corporate Bond Fund I - EUR 0.64Euro Corporate Bond Fund NX - EUR 0.17Euro Corporate Bond Fund S - EUR 0.53Euro Corporate Bond Fund Z - EUR 0.61Euro Corporate Bond Fund ZD - EUR 0.62Euro Strategic Bond Fund A - EUR 1.13Euro Strategic Bond Fund AD - EUR 1.16Euro Strategic Bond Fund ADX - EUR 1.18Euro Strategic Bond Fund AX - EUR 1.14Euro Strategic Bond Fund B - EUR 2.13Euro Strategic Bond Fund BD - EUR 2.14Euro Strategic Bond Fund BDX - EUR 2.14Euro Strategic Bond Fund BX - EUR 2.14Euro Strategic Bond Fund C - EUR 1.85Euro Strategic Bond Fund CD - EUR 1.85Euro Strategic Bond Fund I - EUR 0.70Euro Strategic Bond Fund Z - EUR 0.68Euro Strategic Bond Fund ZD - EUR 0.68European Currencies High Yield Bond Fund A - EUR 1.16European Currencies High Yield Bond Fund AD - EUR 1.25European Currencies High Yield Bond Fund ADX - EUR 1.30European Currencies High Yield Bond Fund AX - EUR 1.30European Currencies High Yield Bond Fund B - EUR 2.17European Currencies High Yield Bond Fund BD - EUR 2.25European Currencies High Yield Bond Fund BDX - EUR 2.20European Currencies High Yield Bond Fund BX - EUR 2.18European Currencies High Yield Bond Fund C - EUR 1.86European Currencies High Yield Bond Fund CD - EUR 1.90European Currencies High Yield Bond Fund I - EUR 0.73European Currencies High Yield Bond Fund Z - EUR 0.68Global Bond Fund A - USD 1.15Global Bond Fund AH - EUR 1.32Global Bond Fund AHX - EUR 1.35Global Bond Fund AX - USD 1.25Global Bond Fund B - USD 2.14
fund name total expense ratio (%)
Global Bond Fund BH - EUR 2.24Global Bond Fund BHX - EUR 2.24Global Bond Fund BX - USD 2.17Global Bond Fund C - USD 1.90Global Bond Fund CH - EUR1 2.00Global Bond Fund I - USD 0.70Global Bond Fund Z - USD 0.67Global Convertible Bond Fund A - USD 1.29Global Convertible Bond Fund AH - CHF1 1.55Global Convertible Bond Fund AH - EUR 1.34Global Convertible Bond Fund B - USD 2.30Global Convertible Bond Fund BH - EUR 2.35Global Convertible Bond Fund CH - EUR 2.15Global Convertible Bond Fund I - USD 0.80Global Convertible Bond Fund IH - EUR 0.87Global Convertible Bond Fund S - USD 0.68Global Convertible Bond Fund Z - USD 0.76Global Convertible Bond Fund ZH - CHF1 1.04Global Convertible Bond Fund ZH - EUR 0.82Global Convertible Bond Fund ZHX - EUR 0.82Global Credit Fund A - USD1, 4 1.25Global Credit Fund B - USD1, 4 2.25Global Credit Fund C - USD1, 4 1.90Global Credit Fund I - USD1, 4 0.83Global Credit Fund Z - USD1, 4 0.79Global Credit Fund ZX - USD1, 4 0.84Global Fixed Income Opportunities Fund A - USD 1.45Global Fixed Income Opportunities Fund AH - EUR1 1.55Global Fixed Income Opportunities Fund AHX - EUR 1.55Global Fixed Income Opportunities Fund AX - USD 1.50Global Fixed Income Opportunities Fund B - USD 2.45Global Fixed Income Opportunities Fund BH - EUR1 2.55Global Fixed Income Opportunities Fund BHX - EUR 2.55Global Fixed Income Opportunities Fund BX - USD 2.50Global Fixed Income Opportunities Fund C - USD1 1.90Global Fixed Income Opportunities Fund CH - EUR1 2.00Global Fixed Income Opportunities Fund CHX - EUR1 2.00Global Fixed Income Opportunities Fund Z - USD 0.79Global High Yield Bond Fund A - USD 1.45Global High Yield Bond Fund AH - EUR1 1.55Global High Yield Bond Fund AHX - EUR 1.55Global High Yield Bond Fund AX - USD 1.50Global High Yield Bond Fund B - USD 2.45Global High Yield Bond Fund BH - EUR1 2.55Global High Yield Bond Fund BHX - EUR 2.55Global High Yield Bond Fund BX - USD 2.50Global High Yield Bond Fund C - USD1 2.05Global High Yield Bond Fund CH - EUR1 2.15Global High Yield Bond Fund Z - USD 0.94Global High Yield Bond Fund ZX - USD 0.99Global Mortgage Securities Fund A - USD1, 5 1.45Global Mortgage Securities Fund AH - EUR1, 5 1.55Global Mortgage Securities Fund AHR - EUR1, 5 1.55Global Mortgage Securities Fund AHX - EUR1, 5 1.55Global Mortgage Securities Fund B - USD1, 5 2.45Global Mortgage Securities Fund BH - EUR1, 5 2.55Global Mortgage Securities Fund BHR - EUR1, 5 2.55Global Mortgage Securities Fund BHX - EUR1, 5 2.55Global Mortgage Securities Fund C - USD1, 5 2.05Global Mortgage Securities Fund CH - EUR1, 5 2.15Global Mortgage Securities Fund CHX - EUR1, 5 2.15Global Mortgage Securities Fund I - USD1, 5 0.88Global Mortgage Securities Fund Z - USD1, 5 0.84Global Mortgage Securities Fund ZX - USD1, 5 0.89Global Premier Credit Fund A - USD1, 6 1.25Global Premier Credit Fund AH - EUR1, 6 1.35Global Premier Credit Fund B - USD1, 6 2.25Global Premier Credit Fund BH - EUR1, 6 2.35Global Premier Credit Fund C - USD1, 6 1.90Global Premier Credit Fund CH - EUR1, 6 2.00Global Premier Credit Fund I - USD1, 6 0.83Global Premier Credit Fund Z - USD1, 6 0.79Global Premier Credit Fund ZX - USD1, 6 0.84Short Maturity Euro Bond Fund A - EUR 1.09Short Maturity Euro Bond Fund B - EUR 2.09Short Maturity Euro Bond Fund C - EUR 1.85Short Maturity Euro Bond Fund I - EUR 0.65Short Maturity Euro Bond Fund Z - EUR 0.62Euro Liquidity Fund A - EUR 0.17Euro Liquidity Fund B - EUR 0.17Euro Liquidity Fund C - EUR 0.22Euro Liquidity Fund I - EUR 0.19
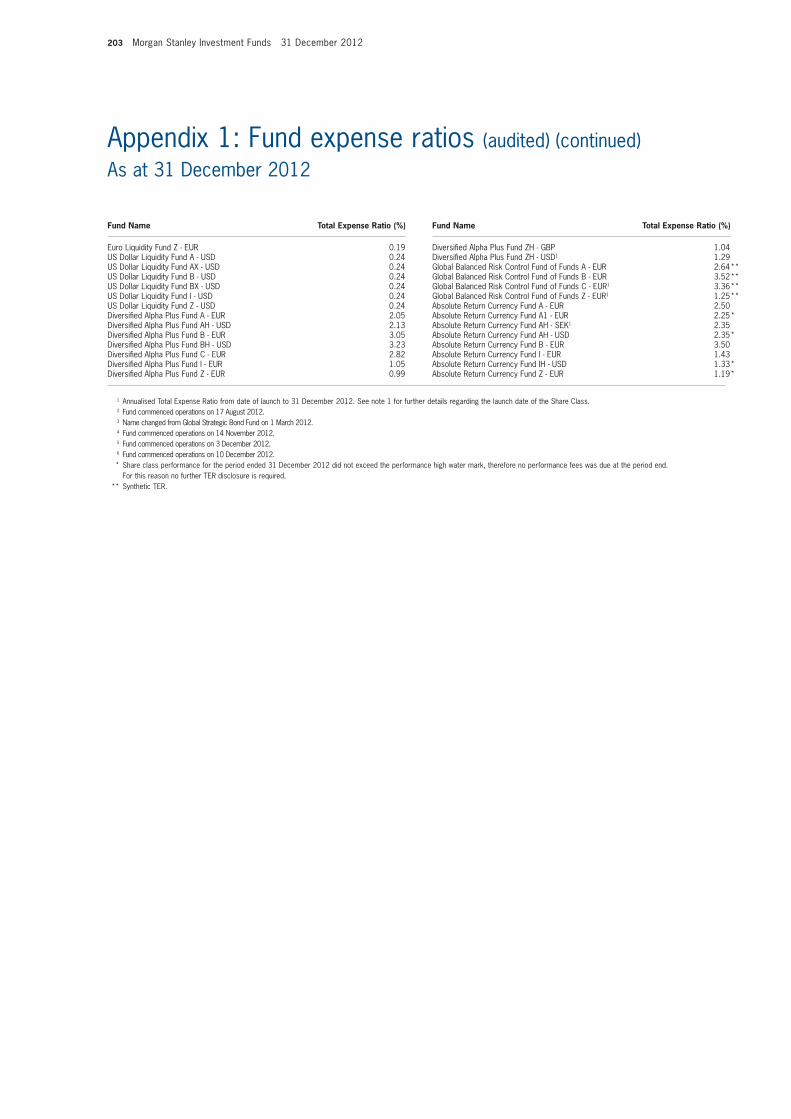
203 Morgan Stanley Investment Funds 31 December 2012
Appendix 1: Fund expense ratios (audited) (continued)As at 31 December 2012
1 Annualised Total Expense Ratio from date of launch to 31 December 2012. See note 1 for further details regarding the launch date of the Share Class. 2 Fund commenced operations on 17 August 2012. 3 Name changed from Global Strategic Bond Fund on 1 March 2012. 4 Fund commenced operations on 14 November 2012. 5 Fund commenced operations on 3 December 2012. 6 Fund commenced operations on 10 December 2012. * Share class performance for the period ended 31 December 2012 did not exceed the performance high water mark, therefore no performance fees was due at the period end.
For this reason no further TER disclosure is required. ** Synthetic TER.
fund name total expense ratio (%)
Euro Liquidity Fund Z - EUR 0.19US Dollar Liquidity Fund A - USD 0.24US Dollar Liquidity Fund AX - USD 0.24US Dollar Liquidity Fund B - USD 0.24US Dollar Liquidity Fund BX - USD 0.24US Dollar Liquidity Fund I - USD 0.24US Dollar Liquidity Fund Z - USD 0.24Diversified Alpha Plus Fund A - EUR 2.05Diversified Alpha Plus Fund AH - USD 2.13Diversified Alpha Plus Fund B - EUR 3.05Diversified Alpha Plus Fund BH - USD 3.23Diversified Alpha Plus Fund C - EUR 2.82Diversified Alpha Plus Fund I - EUR 1.05Diversified Alpha Plus Fund Z - EUR 0.99
fund name total expense ratio (%)
Diversified Alpha Plus Fund ZH - GBP 1.04Diversified Alpha Plus Fund ZH - USD1 1.29Global Balanced Risk Control Fund of Funds A - EUR 2.64**Global Balanced Risk Control Fund of Funds B - EUR 3.52**Global Balanced Risk Control Fund of Funds C - EUR1 3.36**Global Balanced Risk Control Fund of Funds Z - EUR1 1.25**Absolute Return Currency Fund A - EUR 2.50Absolute Return Currency Fund A1 - EUR 2.25*Absolute Return Currency Fund AH - SEK1 2.35Absolute Return Currency Fund AH - USD 2.35*Absolute Return Currency Fund B - EUR 3.50Absolute Return Currency Fund I - EUR 1.43Absolute Return Currency Fund IH - USD 1.33*Absolute Return Currency Fund Z - EUR 1.19*

Morgan Stanley Investment Funds 31 December 2012 204
Appendix 2: Portfolio turnover rate (unaudited)As at 31 December 2012
equity fundsAsian Equity Fund 89.90 Asia-Pacific Equity Fund 154.03 Asian Property Fund 46.15 Emerging Europe, Middle East and Africa Equity Fund 94.28 Emerging Leaders Equity Fund (1) 70.34 Emerging Markets Equity Fund 87.37 European Equity Alpha Fund (2) (17.61)European Property Fund (41.02)Eurozone Equity Alpha Fund 41.04 Global Brands Fund (7.84)Global Equity Allocation Fund 80.96 Global Infrastructure Fund (24.65)Global Opportunity Fund 89.48 Global Property Fund 23.38 Indian Equity Fund 86.39 Japanese Equity Fund (122.28) Latin American Equity Fund 62.11 US Advantage Fund (2.05)US Growth Fund 1.32 US Property Fund (50.09)
Bond fundsEmerging Markets Corporate Debt Fund 329.86 Emerging Markets Debt Fund (21.35)Emerging Markets Domestic Debt Fund 7.00
Bond funds (continued)Euro Bond Fund 37.79 Euro Corporate Bond (ex Financials) Fund (3) 83.95 Euro Corporate Bond Fund 25.73Euro Strategic Bond Fund 35.13 European Currencies High Yield Bond Fund (60.71)Global Bond Fund 223.94 Global Convertible Bond Fund 175.97 Global Credit Fund (4) (4.03)Global Fixed Income Opportunities Fund 74.93 Global High Yield Bond Fund 235.20 Global Mortgage Securities Fund (5) 7.50 Global Premier Credit Fund (6) (6.98)Short Maturity Euro Bond Fund 80.98
Liquidity fundsEuro Liquidity Fund (480.79)US Dollar Liquidity Fund (384.68)
asset allocation fundsDiversified Alpha Plus Fund 129.79 Global Balanced Risk Control Fund of Funds 13.11
alternative investment fundsAbsolute Return Currency Fund (100.17)
fund name Portfolio turnover rate (%) fund name Portfolio turnover rate (%)
(1) Fund commenced operations on 17 August 2012.(2) European Small Cap Value Fund merged into European Equity Alpha Fund on 26 July 2012.(3) Name changed from Global Strategic Bond Fund on 1 March 2012.(4) Fund commenced operations on 14 November 2012.(5) Fund commenced operations on 3 December 2012.(6) Fund commenced operations on 10 December 2012.
The portfolio turnover data has been computed as follows:
Total of Securities transactions (purchases and sales)* – Total transactions of funds units (subscriptions and redemptions) x 100Average net assets
* Purchases and sales exclude securities having maturity dates at acquisition of one year or less.
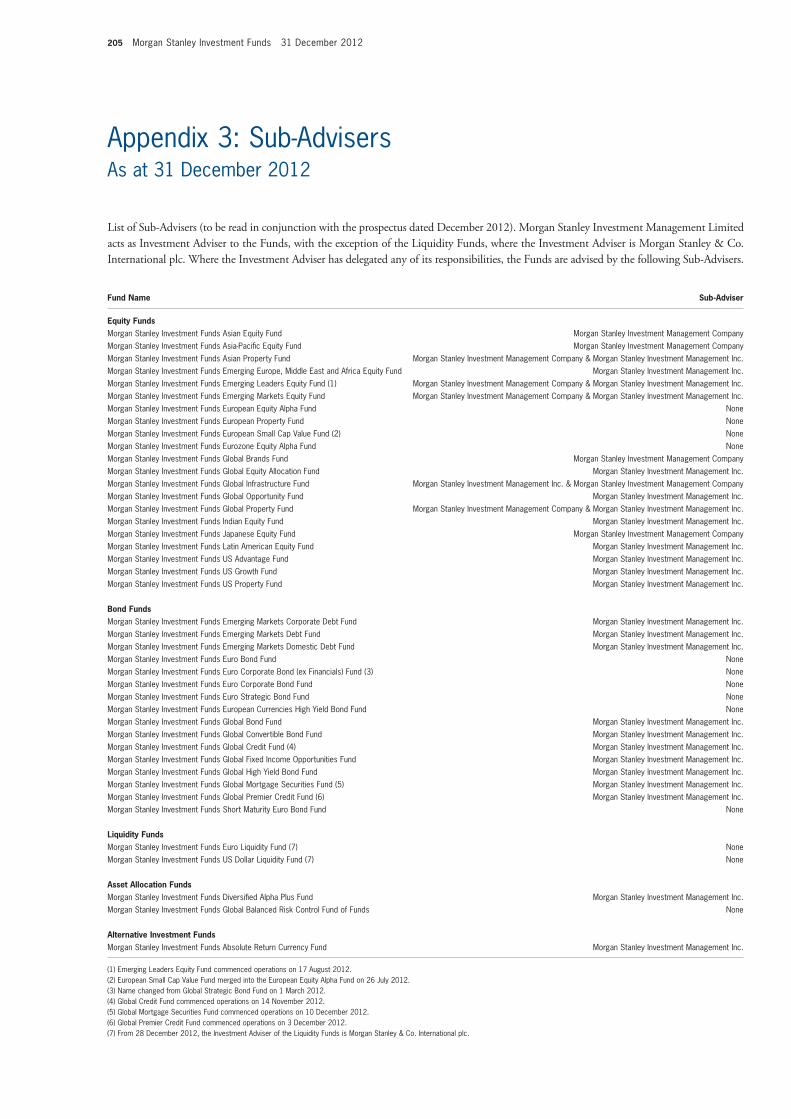
205 Morgan Stanley Investment Funds 31 December 2012
Appendix 3: Sub-AdvisersAs at 31 December 2012
List of Sub-advisers (to be read in conjunction with the prospectus dated December 2012). Morgan Stanley Investment Management Limited acts as Investment adviser to the Funds, with the exception of the Liquidity Funds, where the Investment adviser is Morgan Stanley & Co. International plc. Where the Investment adviser has delegated any of its responsibilities, the Funds are advised by the following Sub-advisers.
equity fundsMorgan Stanley Investment Funds Asian Equity Fund Morgan Stanley Investment Management CompanyMorgan Stanley Investment Funds Asia-Pacific Equity Fund Morgan Stanley Investment Management CompanyMorgan Stanley Investment Funds Asian Property Fund Morgan Stanley Investment Management Company & Morgan Stanley Investment Management Inc.Morgan Stanley Investment Funds Emerging Europe, Middle East and Africa Equity Fund Morgan Stanley Investment Management Inc.Morgan Stanley Investment Funds Emerging Leaders Equity Fund (1) Morgan Stanley Investment Management Company & Morgan Stanley Investment Management Inc.Morgan Stanley Investment Funds Emerging Markets Equity Fund Morgan Stanley Investment Management Company & Morgan Stanley Investment Management Inc.Morgan Stanley Investment Funds European Equity Alpha Fund NoneMorgan Stanley Investment Funds European Property Fund NoneMorgan Stanley Investment Funds European Small Cap Value Fund (2) NoneMorgan Stanley Investment Funds Eurozone Equity Alpha Fund NoneMorgan Stanley Investment Funds Global Brands Fund Morgan Stanley Investment Management Company Morgan Stanley Investment Funds Global Equity Allocation Fund Morgan Stanley Investment Management Inc.Morgan Stanley Investment Funds Global Infrastructure Fund Morgan Stanley Investment Management Inc. & Morgan Stanley Investment Management CompanyMorgan Stanley Investment Funds Global Opportunity Fund Morgan Stanley Investment Management Inc.Morgan Stanley Investment Funds Global Property Fund Morgan Stanley Investment Management Company & Morgan Stanley Investment Management Inc.Morgan Stanley Investment Funds Indian Equity Fund Morgan Stanley Investment Management Inc.Morgan Stanley Investment Funds Japanese Equity Fund Morgan Stanley Investment Management Company Morgan Stanley Investment Funds Latin American Equity Fund Morgan Stanley Investment Management Inc.Morgan Stanley Investment Funds US Advantage Fund Morgan Stanley Investment Management Inc.Morgan Stanley Investment Funds US Growth Fund Morgan Stanley Investment Management Inc.Morgan Stanley Investment Funds US Property Fund Morgan Stanley Investment Management Inc.
Bond fundsMorgan Stanley Investment Funds Emerging Markets Corporate Debt Fund Morgan Stanley Investment Management Inc.Morgan Stanley Investment Funds Emerging Markets Debt Fund Morgan Stanley Investment Management Inc.Morgan Stanley Investment Funds Emerging Markets Domestic Debt Fund Morgan Stanley Investment Management Inc.Morgan Stanley Investment Funds Euro Bond Fund NoneMorgan Stanley Investment Funds Euro Corporate Bond (ex Financials) Fund (3) NoneMorgan Stanley Investment Funds Euro Corporate Bond Fund NoneMorgan Stanley Investment Funds Euro Strategic Bond Fund NoneMorgan Stanley Investment Funds European Currencies High Yield Bond Fund NoneMorgan Stanley Investment Funds Global Bond Fund Morgan Stanley Investment Management Inc. Morgan Stanley Investment Funds Global Convertible Bond Fund Morgan Stanley Investment Management Inc. Morgan Stanley Investment Funds Global Credit Fund (4) Morgan Stanley Investment Management Inc. Morgan Stanley Investment Funds Global Fixed Income Opportunities Fund Morgan Stanley Investment Management Inc. Morgan Stanley Investment Funds Global High Yield Bond Fund Morgan Stanley Investment Management Inc. Morgan Stanley Investment Funds Global Mortgage Securities Fund (5) Morgan Stanley Investment Management Inc. Morgan Stanley Investment Funds Global Premier Credit Fund (6) Morgan Stanley Investment Management Inc. Morgan Stanley Investment Funds Short Maturity Euro Bond Fund None
Liquidity fundsMorgan Stanley Investment Funds Euro Liquidity Fund (7) NoneMorgan Stanley Investment Funds US Dollar Liquidity Fund (7) None
asset allocation fundsMorgan Stanley Investment Funds Diversified Alpha Plus Fund Morgan Stanley Investment Management Inc.Morgan Stanley Investment Funds Global Balanced Risk Control Fund of Funds None
alternative investment fundsMorgan Stanley Investment Funds Absolute Return Currency Fund Morgan Stanley Investment Management Inc.
fund name Sub-adviser
(1) Emerging Leaders Equity Fund commenced operations on 17 August 2012.(2) European Small Cap Value Fund merged into the European Equity Alpha Fund on 26 July 2012.(3) Name changed from Global Strategic Bond Fund on 1 March 2012.(4) Global Credit Fund commenced operations on 14 November 2012.(5) Global Mortgage Securities Fund commenced operations on 10 December 2012.(6) Global Premier Credit Fund commenced operations on 3 December 2012.(7) From 28 December 2012, the Investment Adviser of the Liquidity Funds is Morgan Stanley & Co. International plc.
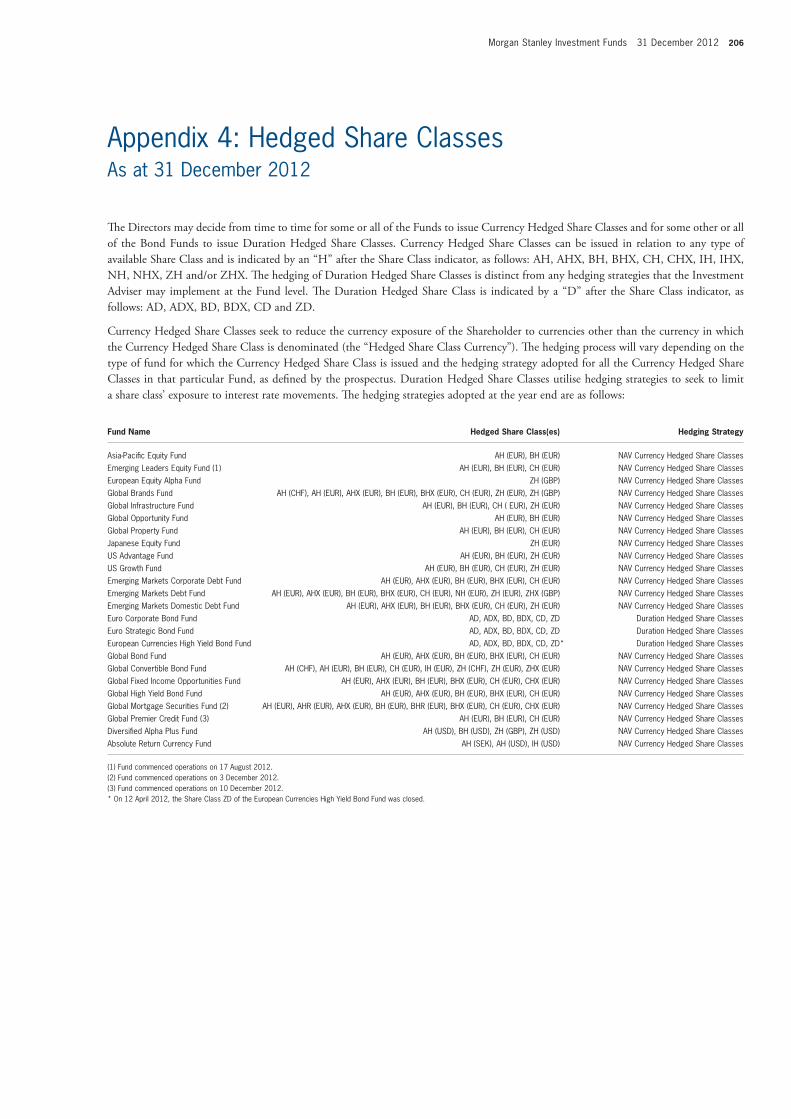
Morgan Stanley Investment Funds 31 December 2012 206
Appendix 4: Hedged Share Classes As at 31 December 2012
The Directors may decide from time to time for some or all of the Funds to issue Currency Hedged Share Classes and for some other or all of the Bond Funds to issue Duration Hedged Share Classes. Currency Hedged Share Classes can be issued in relation to any type of available Share Class and is indicated by an “H” after the Share Class indicator, as follows: aH, aHX, BH, BHX, CH, CHX, IH, IHX, nH, nHX, ZH and/or ZHX. The hedging of Duration Hedged Share Classes is distinct from any hedging strategies that the Investment adviser may implement at the Fund level. The Duration Hedged Share Class is indicated by a “D” after the Share Class indicator, as follows: aD, aDX, BD, BDX, CD and ZD.
Currency Hedged Share Classes seek to reduce the currency exposure of the Shareholder to currencies other than the currency in which the Currency Hedged Share Class is denominated (the “Hedged Share Class Currency”). The hedging process will vary depending on the type of fund for which the Currency Hedged Share Class is issued and the hedging strategy adopted for all the Currency Hedged Share Classes in that particular Fund, as defined by the prospectus. Duration Hedged Share Classes utilise hedging strategies to seek to limit a share class’ exposure to interest rate movements. The hedging strategies adopted at the year end are as follows:
fund name hedged Share Class(es) hedging Strategy
Asia-Pacific Equity Fund AH (EUR), BH (EUR) NAV Currency Hedged Share ClassesEmerging Leaders Equity Fund (1) AH (EUR), BH (EUR), CH (EUR) NAV Currency Hedged Share ClassesEuropean Equity Alpha Fund ZH (GBP) NAV Currency Hedged Share ClassesGlobal Brands Fund AH (CHF), AH (EUR), AHX (EUR), BH (EUR), BHX (EUR), CH (EUR), ZH (EUR), ZH (GBP) NAV Currency Hedged Share ClassesGlobal Infrastructure Fund AH (EUR), BH (EUR), CH ( EUR), ZH (EUR) NAV Currency Hedged Share ClassesGlobal Opportunity Fund AH (EUR), BH (EUR) NAV Currency Hedged Share ClassesGlobal Property Fund AH (EUR), BH (EUR), CH (EUR) NAV Currency Hedged Share ClassesJapanese Equity Fund ZH (EUR) NAV Currency Hedged Share ClassesUS Advantage Fund AH (EUR), BH (EUR), ZH (EUR) NAV Currency Hedged Share ClassesUS Growth Fund AH (EUR), BH (EUR), CH (EUR), ZH (EUR) NAV Currency Hedged Share ClassesEmerging Markets Corporate Debt Fund AH (EUR), AHX (EUR), BH (EUR), BHX (EUR), CH (EUR) NAV Currency Hedged Share ClassesEmerging Markets Debt Fund AH (EUR), AHX (EUR), BH (EUR), BHX (EUR), CH (EUR), NH (EUR), ZH (EUR), ZHX (GBP) NAV Currency Hedged Share ClassesEmerging Markets Domestic Debt Fund AH (EUR), AHX (EUR), BH (EUR), BHX (EUR), CH (EUR), ZH (EUR) NAV Currency Hedged Share ClassesEuro Corporate Bond Fund AD, ADX, BD, BDX, CD, ZD Duration Hedged Share ClassesEuro Strategic Bond Fund AD, ADX, BD, BDX, CD, ZD Duration Hedged Share ClassesEuropean Currencies High Yield Bond Fund AD, ADX, BD, BDX, CD, ZD* Duration Hedged Share ClassesGlobal Bond Fund AH (EUR), AHX (EUR), BH (EUR), BHX (EUR), CH (EUR) NAV Currency Hedged Share ClassesGlobal Convertible Bond Fund AH (CHF), AH (EUR), BH (EUR), CH (EUR), IH (EUR), ZH (CHF), ZH (EUR), ZHX (EUR) NAV Currency Hedged Share ClassesGlobal Fixed Income Opportunities Fund AH (EUR), AHX (EUR), BH (EUR), BHX (EUR), CH (EUR), CHX (EUR) NAV Currency Hedged Share ClassesGlobal High Yield Bond Fund AH (EUR), AHX (EUR), BH (EUR), BHX (EUR), CH (EUR) NAV Currency Hedged Share ClassesGlobal Mortgage Securities Fund (2) AH (EUR), AHR (EUR), AHX (EUR), BH (EUR), BHR (EUR), BHX (EUR), CH (EUR), CHX (EUR) NAV Currency Hedged Share ClassesGlobal Premier Credit Fund (3) AH (EUR), BH (EUR), CH (EUR) NAV Currency Hedged Share ClassesDiversified Alpha Plus Fund AH (USD), BH (USD), ZH (GBP), ZH (USD) NAV Currency Hedged Share ClassesAbsolute Return Currency Fund AH (SEK), AH (USD), IH (USD) NAV Currency Hedged Share Classes
(1) Fund commenced operations on 17 August 2012.(2) Fund commenced operations on 3 December 2012.(3) Fund commenced operations on 10 December 2012.* On 12 April 2012, the Share Class ZD of the European Currencies High Yield Bond Fund was closed.

207 Morgan Stanley Investment Funds 31 December 2012
Appendix 5: Performance Summary (unaudited)As at 31 December 2012
Share Class
31 Dec 2012Year to Date %
31 Dec 2011Year to Date %
31 Dec 2010Year to Date %
asian equity fund A 18.46 (18.00) 17.80B 17.28 (18.84) 16.63C 17.40 (18.74) 16.80I 19.35 (17.41) 18.70
Z 19.36 (17.35) 18.71asia-Pacific equity fund A 18.49 (19.32) n/a
AH (EUR) 17.25 (20.28) n/aB 17.22 (19.88) n/a
BH (EUR) 16.11 (20.90) n/aC 17.51 (19.80) n/aN 20.46 (18.28) n/aZ 19.32 (18.84) n/a
asian Property fund A 46.73 (23.18) 15.05AX 46.73 (23.26) 15.10B 45.29 (23.96) 13.86I 47.81 (22.62) 15.97
IX 47.83 (22.68) 15.90Z 47.92 (22.65) 15.97
emerging europe, middle east and africa equity fund
A 19.38 (24.33) 32.12AX 19.30 (24.42) 31.98B 18.20 (25.07) 30.85C 18.31 (24.82) 31.14I 20.01 (23.83) 32.92
Z 19.99 (23.97) 32.97emerging Leaders equity fund (1)
A* 5.60 n/a n/aAH (EUR)* 5.30 n/a n/a
B* 5.20 n/a n/aBH (EUR)* 4.91 n/a n/a
C* 5.28 n/a n/aCH (EUR)* 5.69 n/a n/a
I* 0.16 n/a n/aZ* 5.96 n/a n/a
emerging markets equity fund A 18.28 (18.56) 17.12B 17.12 (19.39) 15.93C 17.17 (19.24) 16.25I 19.02 (18.10) 17.84
N 20.47 (17.08) 19.25Z 19.05 (18.04) 17.83
european equity alpha fund A 14.88 (7.55) 16.17AX* 8.36 n/a n/aB 13.68 (8.45) 15.00C 13.83 (8.36) 15.30I 15.52 (6.98) 16.71
Z 15.62 (6.96) 16.91ZH (GBP) 11.34 (4.72) n/a
european Property fund A 28.69 (11.93) 12.25AX n/a (12.25) 11.98B 27.36 (12.86) 11.12I 29.59 (11.30) 13.15
IX 29.32 (11.58) 12.92Z 29.64 (11.24) 13.20
european Small Cap value fund (2)
A n/a (22.68) 20.68AX n/a (22.68) 20.66B n/a (23.45) 19.46
eurozone equity alpha fund A 21.84 (15.52) 10.55B 20.64 (16.41) 9.27I 22.63 (14.96) 11.52
Z 22.88 (14.90) 11.18Global Brands fund A 13.21 8.32 11.76
AH (EUR) 12.20 7.58 10.84AH (CHF) 11.94 0.33 n/a
AHX (EUR) 12.12 7.29 0.84AX 13.22 8.25 1.00B 12.08 7.26 10.67
BH (EUR) 11.07 6.54 9.76BHX (EUR) 11.05 6.42 0.64
BX 12.04 7.08 0.80C 12.31 7.45 10.74
CH (EUR) 11.20 6.61 n/aI 14.05 9.11 12.59
Z 14.10 9.14 12.66ZH (EUR) 13.06 8.44 11.61ZH (GBP) 13.61 1.66 n/a
ZX 14.08 9.14 12.82
Share Class
31 Dec 2012Year to Date %
31 Dec 2011Year to Date %
31 Dec 2010Year to Date %
Global equity allocation fund A 11.51 0.08 n/aB 10.44 - n/aZ 12.70 0.16 n/a
Global infrastructure fund A 14.82 15.10 16.80AH (EUR) 13.85 14.36 16.08
B 13.66 13.91 16.20BH (EUR) 12.80 13.24 15.44
C 13.83 14.30 16.36CH (EUR)* 5.06 n/a n/a
I* (0.72) n/a n/aZ 15.71 16.05 17.36
ZH (EUR) 14.83 13.92 n/aGlobal opportunity fund A 9.14 (6.47) 3.92
AH (EUR) 8.12 (7.54) 3.76B 8.03 (7.40) 3.84
BH (EUR) 7.07 (8.48) 3.64C 8.22 (7.20) 3.84I* 1.00 n/a n/a
Z 10.00 (5.69) 3.96Global Property fund A 30.48 (12.53) 15.88
AH (EUR) 28.91 (13.69) (1.64)B 29.11 (13.42) 14.71
BH (EUR) 27.54 (14.52) (1.80)C 29.24 (13.32) 14.88
CH (EUR) 27.82 (14.30) (1.80)I 31.41 (11.85) 16.72
IX 31.30 (11.94) 16.74Z 31.52 (11.86) 16.84
indian equity fund A 28.25 (38.22) 24.25B 26.96 (38.81) 23.01C 26.84 (38.90) (2.20)I 29.22 (37.71) 25.23
Z 29.31 (37.70) 25.27Japanese equity fund A 19.23 (20.34) 3.43
B 18.07 (21.12) 11.76C 17.88 (20.97) 11.80I 20.09 (11.37) n/a
Z 20.13 (19.73) 3.86ZH (EUR) 17.29 (21.13) 11.48
Latin american equity fund A 11.45 (21.54) 16.05B 10.33 (22.37) 14.88C 10.50 (22.21) 15.02I 12.21 (21.03) 16.84
Z 12.25 (21.07) 16.89US advantage fund A 12.64 4.66 16.59
AH (EUR) 11.78 3.91 15.98B 11.49 3.60 15.47
BH (EUR) 10.61 2.89 14.79C 11.72 3.81 15.49I 13.53 5.45 17.50
N* 3.75 n/a n/aZ 13.56 5.49 17.57
ZH (EUR) 12.66 4.80 16.83US Growth fund A 11.69 (4.08) 19.03
AH (EUR) 10.73 (4.99) 18.03AX 11.69 (4.08) 19.03B 10.59 (5.09) 17.84
BH (EUR) 9.62 (5.98) 7.44C 10.74 (4.92) 17.99
CH (EUR)* 6.30 n/a n/aI 12.54 (3.33) 19.97
IX 12.55 (3.39) 19.94Z 12.62 (3.30) 20.00
ZH (EUR) 11.62 (4.20) 18.94US Property fund A 11.94 4.66 26.73
AX n/a 4.34 26.33B 10.80 3.52 25.47I 12.76 5.45 27.67
Z 12.81 5.45 27.54emerging markets Corporate Debt fund
A 20.14 (0.52) n/aAH (EUR) 19.79 (0.47) n/a
AHX (EUR) 19.66 (0.99) n/aAX 20.12 (0.96) n/aB 18.97 (1.32) n/a
BH (EUR) 18.53 (1.30) n/aBHX (EUR) 18.57 (1.14) n/a

Morgan Stanley Investment Funds 31 December 2012 208
Appendix 5: Performance Summary (unaudited) (continued)As at 31 December 2012
Share Class
31 Dec 2012Year to Date %
31 Dec 2011Year to Date %
31 Dec 2010Year to Date %
emerging markets Corporate Debt fund (continued)
BX 18.98 (1.12) n/aC 19.27 (1.20) n/a
CH (EUR)* 2.27 n/a n/aZ 20.90 0.08 n/a
emerging markets Debt fund A 17.95 6.80 8.67AH (EUR) 17.42 7.05 8.27
AHX (EUR) 17.16 0.27 n/aARM* 7.28 n/a n/a
AX 17.85 6.65 8.55B 16.80 5.72 7.60
BH (EUR) 16.26 5.98 (3.12)BHX (EUR) 16.19 0.12 n/a
BX 16.72 0.16 n/aC 16.99 5.94 7.85
CH (EUR)* 2.37 n/a n/aI 18.64 7.43 9.33
NH (EUR) 19.32 8.78 (1.08)S n/a n/a 9.59Z 18.73 7.46 9.39
ZH (EUR) 18.12 8.14 9.48ZHX (GBP) 18.61 7.50 8.67
emerging markets Domestic Debt fund
A 14.42 (3.90) 13.67AH (EUR) 13.46 (4.52) 9.31
AHX (EUR) 13.33 (3.79) n/aARM* 1.88 n/a n/a
AX 14.47 (3.91) 13.37B 13.28 (4.85) 12.54
BH (EUR) 12.44 (5.45) (0.56)BHX (EUR) 12.40 (3.95) n/a
BX 13.28 (3.80) n/aC 13.67 (4.60) 12.81
CH (EUR)* 3.64 n/a n/aI 15.11 (3.32) 14.29
Z 15.15 (3.31) 14.36ZH (EUR) 14.28 (3.92) 2.52
ZX 15.14 (3.37) 9.26euro Bond fund A 11.85 1.62 2.91
B 10.79 0.64 1.87C 11.00 0.90 2.15I 12.42 2.06 3.39
IX n/a 1.95 3.22Z 12.41 2.15 3.38
euro Corporate Bond (ex financials) fund (3)
A* 5.76 n/a n/aAX* 5.69 n/a n/aN 10.97 1.40 n/aZ* 6.16 n/a n/a
euro Corporate Bond fund A 19.93 (3.14) 3.30AD 16.45 (9.27) (0.28)
ADX 16.26 (9.42) (0.32)AX 19.94 (3.07) 3.27B 18.75 (4.07) 2.25
BD 15.27 (10.18) (0.56)BDX 15.27 (10.24) (0.60)
BX 18.74 (5.72) n/aC 19.02 (3.86) 2.48
CD 15.56 (9.97) (0.92)I 20.44 (2.67) 3.70
N n/a (2.11) 4.33NX 21.04 (2.09) 2.78
S 20.58 (2.54) 2.48Z 20.48 (2.65) 3.74
ZD 17.00 (8.85) (0.12)euro Strategic Bond fund A 13.99 0.54 3.99
AD 9.28 (7.80) n/aADX 9.28 (7.81) n/a
AX 13.92 0.32 (2.40)B 12.83 (0.44) 2.97
BD 8.26 (8.70) (0.24)BDX 8.22 (8.67) (0.24)
BX 12.82 (0.45) (2.56)C 13.13 (0.29) (2.24)
CD 8.55 (8.43) (0.84)I 14.50 0.98 4.45
Z 14.48 1.02 4.44ZD 9.82 (7.35) 0.20
Share Class
31 Dec 2012Year to Date %
31 Dec 2011Year to Date %
31 Dec 2010Year to Date %
european Currencies high Yield Bond fund
A 25.63 (5.92) 14.33AD 22.16 (16.44) n/a
ADX 22.19 (16.46) n/aAX 25.56 (2.00) n/aB 24.34 (6.86) 13.25
BD 20.97 (17.04) n/aBDX 21.04 (17.03) n/a
BX 24.40 (2.16) n/aC 24.79 (6.61) 13.53
CD 21.45 (16.84) n/aI 26.35 (5.48) 14.78
Z 26.26 (5.49) 14.88ZD n/a (16.16) n/a
Global Bond fund A 7.38 2.59 6.28AH (EUR) 6.76 2.31 (3.44)
AHX (EUR) 6.69 (1.76) n/aAX 7.28 2.36 6.02B 6.34 1.56 5.20
BH (EUR) 5.83 1.43 (3.60)BHX (EUR) 5.77 (1.91) n/a
BX 6.29 (1.84) n/aC 6.57 1.91 5.61
CH (EUR)* 0.85 n/a n/aI 7.90 3.05 6.71
IX n/a 2.83 6.49Z 7.91 3.02 6.78
Global Convertible Bond fund A 8.27 (6.21) 8.31AH (CHF)* 2.04 n/a n/aAH (EUR) 7.72 (6.35) 7.87
B 7.17 (7.15) 7.24BH (EUR) 6.64 (7.30) 6.81CH (EUR) 6.86 (6.94) 7.18
I 8.78 (5.75) 8.87IH (EUR) 8.23 (5.89) 8.36
S 8.94 (5.62) 8.98Z 8.85 (5.70) 7.40
ZH (CHF)* 2.11 n/a n/aZH (EUR) 8.30 (5.88) 8.44
ZHX (EUR) 8.31 (5.77) 8.45Global Credit fund (4) A* 0.64 n/a n/a
B* 0.52 n/a n/aC* 0.56 n/a n/aI* 0.72 n/a n/a
Z* 0.72 n/a n/aZX* 0.72 n/a n/a
Global fixed income opportunities fund
A 15.48 (0.28) n/aAH (EUR)* 9.23 n/a n/a
AHX (EUR) 14.90 (0.37) n/aAX 15.46 (0.28) n/aB 14.34 (0.40) n/a
BH (EUR)* 8.45 n/a n/aBHX (EUR) 13.78 (0.53) n/a
BX 14.29 (0.44) n/aC* 2.08 n/a n/a
CH (EUR)* 1.85 n/a n/aCHX (EUR)* 0.55 n/a n/a
Z 16.27 (0.20) n/aGlobal high Yield Bond fund A 19.70 2.32 n/a
AH (EUR)* 11.20 n/a n/aAHX (EUR) 19.19 2.25 n/a
AX 19.64 2.32 n/aB 18.51 2.20 n/a
BH (EUR)* 10.41 n/a n/aBHX (EUR) 18.00 2.12 n/a
BX 18.65 2.20 n/aC* 2.96 n/a n/a
CH (EUR)* 2.88 n/a n/aZ 20.32 2.36 n/a
ZX 19.69 2.36 n/aGlobal mortgage Securities fund (5)
A * 0.28 n/a n/aAH (EUR) * 0.25 n/a n/a
AHR (EUR) * 0.25 n/a n/aAHX (EUR)* 0.25 n/a n/a
B* 0.20 n/a n/aBH (EUR)* 0.16 n/a n/a
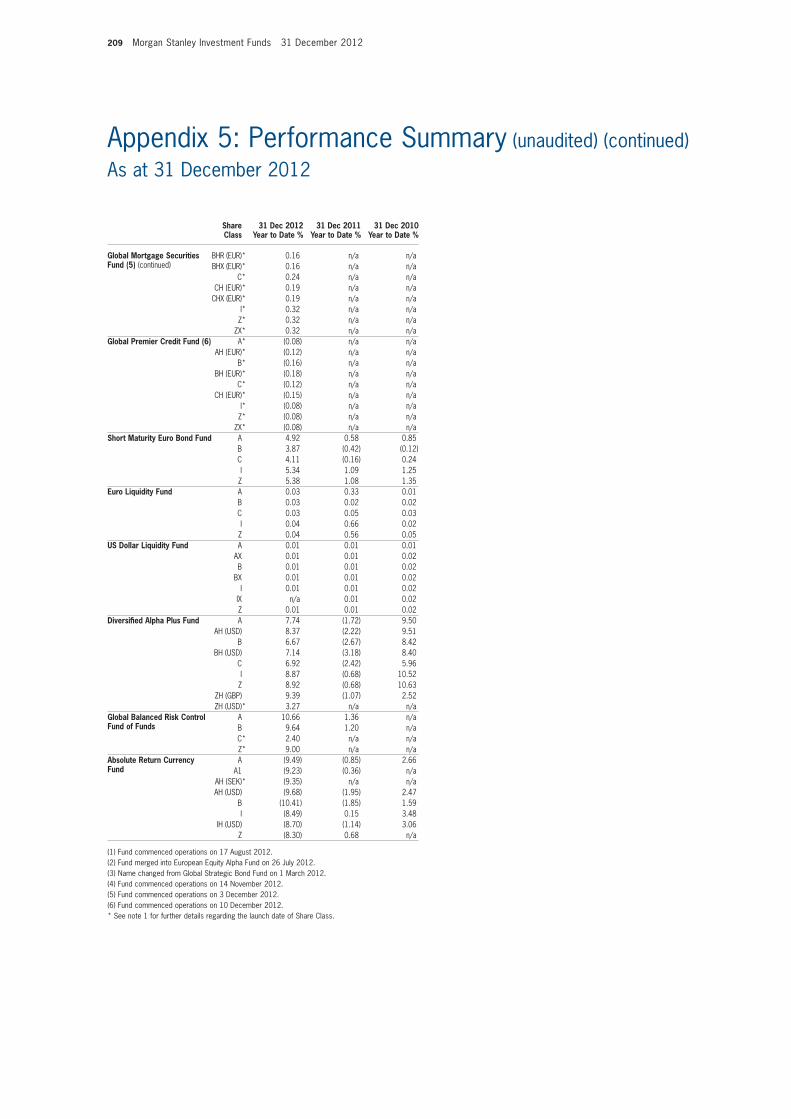
209 Morgan Stanley Investment Funds 31 December 2012
Appendix 5: Performance Summary (unaudited) (continued)As at 31 December 2012
Share Class
31 Dec 2012Year to Date %
31 Dec 2011Year to Date %
31 Dec 2010Year to Date %
Global mortgage Securities fund (5) (continued)
BHR (EUR)* 0.16 n/a n/aBHX (EUR)* 0.16 n/a n/a
C* 0.24 n/a n/aCH (EUR)* 0.19 n/a n/a
CHX (EUR)* 0.19 n/a n/aI* 0.32 n/a n/a
Z* 0.32 n/a n/aZX* 0.32 n/a n/a
Global Premier Credit fund (6) A * (0.08) n/a n/aAH (EUR) * (0.12) n/a n/a
B * (0.16) n/a n/aBH (EUR) * (0.18) n/a n/a
C * (0.12) n/a n/aCH (EUR) * (0.15) n/a n/a
I * (0.08) n/a n/aZ * (0.08) n/a n/a
ZX * (0.08) n/a n/aShort maturity euro Bond fund A 4.92 0.58 0.85
B 3.87 (0.42) (0.12)C 4.11 (0.16) 0.24I 5.34 1.09 1.25
Z 5.38 1.08 1.35euro Liquidity fund A 0.03 0.33 0.01
B 0.03 0.02 0.02C 0.03 0.05 0.03I 0.04 0.66 0.02
Z 0.04 0.56 0.05US Dollar Liquidity fund A 0.01 0.01 0.01
AX 0.01 0.01 0.02B 0.01 0.01 0.02
BX 0.01 0.01 0.02I 0.01 0.01 0.02
IX n/a 0.01 0.02Z 0.01 0.01 0.02
Diversified alpha Plus fund A 7.74 (1.72) 9.50AH (USD) 8.37 (2.22) 9.51
B 6.67 (2.67) 8.42BH (USD) 7.14 (3.18) 8.40
C 6.92 (2.42) 5.96I 8.87 (0.68) 10.52
Z 8.92 (0.68) 10.63ZH (GBP) 9.39 (1.07) 2.52ZH (USD)* 3.27 n/a n/a
Global Balanced risk Control fund of funds
A 10.66 1.36 n/aB 9.64 1.20 n/aC* 2.40 n/a n/aZ* 9.00 n/a n/a
absolute return Currency fund
A (9.49) (0.85) 2.66A1 (9.23) (0.36) n/a
AH (SEK)* (9.35) n/a n/aAH (USD) (9.68) (1.95) 2.47
B (10.41) (1.85) 1.59I (8.49) 0.15 3.48
IH (USD) (8.70) (1.14) 3.06Z (8.30) 0.68 n/a
(1) Fund commenced operations on 17 August 2012.(2) Fund merged into European Equity Alpha Fund on 26 July 2012.(3) Name changed from Global Strategic Bond Fund on 1 March 2012.(4) Fund commenced operations on 14 November 2012.(5) Fund commenced operations on 3 December 2012.(6) Fund commenced operations on 10 December 2012.* See note 1 for further details regarding the launch date of Share Class.

Morgan Stanley Investment Funds 31 December 2012 210
Appendix 6: Risk Measurement and Global Exposure (unaudited)As at 31 December 2012
as per eSMa/10-788 “guidelines on Risk Measurement and the Calculation of global exposure and Counterparty Risk for UCItS” on annual report disclosure requirements, the global exposure table below outlines the following information:
• each Fund’s approach to measuring global exposure.
• Where the Fund is using relative vaR to measure global exposure the reference portfolio is provided.
• Lowest, average and highest relative vaR or absolute vaR for each Fund measuring global exposure on the vaR approach (note these numbers are actual vaR and relative vaR numbers and do not represent utilisation levels of the regulatory limit).
• Relevant regulatory limit for the Funds global exposure approach for Funds using vaR approach.
• average leverage is given at the Fund level where the Fund uses the vaR approach to measure global exposure.
• Leverage is calculated using the commitment approach as laid out in eMSa/10-788.
Global exposure
fund nameasset Class risk
model type
Global exposure
methodology (1)
regulatory Limit Lowest average highest
average Leverage
(Commitment approach)
average Leverage
(Sum of notionals) (2) reference Portfolio
Emerging Markets Corporate Debt Fund
Fixed Income Relative VaR 200% 112% 138% 158% 17% 66% JPM CEMBI Broad Diversified
Emerging Markets Debt Fund Fixed Income Relative VaR 200% 97% 110% 123% 15% 49% JPM EM Bond Index Global
Emerging Markets Domestic Debt Fund
Fixed Income Relative VaR 200% 89% 100% 111% 22% 46% JPM GBI - EM Global Diversified Index
Euro Bond Fund Fixed Income Relative VaR 200% 88% 92% 95% 7% 7% Barclays Capital Euro-Aggregate Index
Euro Corporate Bond (ex Financials) Fund
Fixed Income Relative VaR 200% 87% 94% 103% 14% 21% Barclays Capital Euro-Aggregate Corporate ex Financials Index
Euro Corporate Bond Fund Fixed Income Relative VaR 200% 115% 143% 168% 48% 87% Barclays Capital Euro-Aggregate Corporate Index
Euro Strategic Bond Fund Fixed Income Relative VaR 200% 91% 96% 102% 71% 88% Barclays Capital Euro-Aggregate Index
European Currencies High Yield Bond Fund
Fixed Income Relative VaR 200% 108% 117% 124% 4% 21% BofA ML European Currency High Yield 3% Constrained Ex-Sub Financials Index
Global Bond Fund Fixed Income Relative VaR 200% 97% 103% 115% 84% 142% Barclays Capital Global Aggregate Index
Global Convertible Bond Fund Fixed Income Relative VaR 200% 87% 108% 124% 12% 100% UBS Convertible Focus (USD hedged) Index
Global Credit Fund (3) Fixed Income Relative VaR 200% 73% 77% 79% 15% 57% Barclays Global Credit Index
Global Fixed Income Opportunities Fund
Fixed Income Relative VaR 200% 94% 113% 141% 47% 151% Barclays Capital Global Aggregate Index
Global High Yield Bond Fund Fixed Income Relative VaR 200% 81% 97% 110% 13% 79% Barclays Global HY Corporate Index
Global Mortgage Securities Fund (4) Fixed Income Absolute VaR 20% 0% 1% 1% 61% 69% -
Global Premier Credit Fund (5) Fixed Income Relative VaR 200% 91% 92% 94% 25% 90% Barclays Global Credit Index
Short Maturity Euro Bond Fund Fixed Income Relative VaR 200% 55% 69% 79% 18% 19% Barclays Capital Euro-Aggregate: Treasury 1-3 Years
Diversified Alpha Plus Fund (6) Alternative Absolute VaR 20% 4% 5% 6% 146% 365% -
Diversified Alpha Plus Fund (7) Alternative Relative VaR 200% 46% 93% 162% 146% 365% 60% MSCI All Country World Index, 30% Barclays Capital Euro-Aggregate
Index, 5% S&P GSCI Light Energy Index and 5% EONIA
Global Balanced Risk Control Fund of Funds
Alternative Absolute VaR 20% 3% 4% 8% 6% 10% -
Absolute Return Currency Fund Alternative Absolute VaR 20% 0% 5% 10% 208% 406% -
(1) Liquidity funds use the commitment approach and as of April 2012, all Equity funds were moved to the Commitment methodology for calculation of Global Exposure. Funds which use the commitment approach may not exceed global exposure of 100% of the Net Asset Value.
(2) Data presented for month of December 2012 only.(3) Global Credit Fund was launched on 14 November 2012.(4) Global Mortgage Securities Fund was launched on 3 December 2012.(5) Global Premier Credit Fund was launched on 10 December 2012.(6) Changed from Relative VaR approach to Absolute VaR approach in December 2012 prospectus, data represented is 03/09/2012 - 31/12/2012.(7) Relative VaR approach is represented for the period 03/01/2012 - 31/08/2012.

211 Morgan Stanley Investment Funds 31 December 2012
The Risk Criteria table below, indicates the risk model type and inputs for the vaR calculation based on asset class, which is also displayed in the global exposure table above:
asset Class risk model Calculation model Confidence interval holding Period Length of Data history
Fixed Income Parametric 99th percentile 20 days Weekly and monthly observations with a 6 month half life, using more than 24 months data as per the regulation
Alternative Monte Carlo 99th percentile 20 days Minimum one year history which can be longer depending on risk factor
FX Fund Parametric 99th percentile 20 days 3 years daily data with a 3M decay
Appendix 6: Risk Measurement and Global Exposure (unaudited) (continued)As at 31 December 2012


www.morganstanleyinvestmentfunds.com
CN G
R AR
SIC
AV 1
2UCITS DO NOT HAVE A GUARANTEED RETURN AND PAST PERFORMANCE DOES NOT GUARANTEE FUTURE RETURNS