société d’investissement morgan stanley à capital variable ...€¦ · morgan stanley...
TRANSCRIPT
Morgan Stanley Investment Funds
Société d’Investissement à Capital Variableincorporated under the laws of Luxembourg
Semi-Annual ReportJune 30, 2017
INVESTMENT MANAGEMENT
R.C.S. Luxembourg: B-29. 192

Morgan Stanley Investment Funds 30 June 2017
Table of contents
1 Shareholders’ information
SCHEDULE OF INVESTMENTS
Equity Funds
2 Asia Opportunity Fund
4 Asian Equity Fund
6 Asia-Pacifi c Equity Fund
9 Asian Property Fund
11 Breakout Nations Fund
14 Emerging Europe, Middle East and Africa Equity Fund
16 Emerging Leaders Equity Fund
19 Emerging Markets Equity Fund
22 European Champions Fund
24 European Equity Alpha Fund
26 European Property Fund
28 Eurozone Equity Alpha Fund
30 Frontier Emerging Markets Equity Fund
33 Global Active Factor Equity Fund
35 Global Advantage Fund
37 Global Brands Fund
39 Global Brands Equity Income Fund
42 Global Discovery Fund
44 Global Infrastructure Fund
47 Global Opportunity Fund
50 Global Property Fund
54 Global Quality Fund
56 Indian Equity Fund
59 International Equity (ex US) Fund
62 Japanese Equity Fund
65 Latin American Equity Fund
67 US Active Factor Equity Fund
70 US Advantage Fund
73 US Growth Fund
75 US Insight Fund
77 US Property Fund
Bond Funds
79 Absolute Return Fixed Income Fund
86 Asian Fixed Income Opportunities Fund
89 Emerging Markets Corporate Debt Fund
94 Emerging Markets Debt Fund
99 Emerging Markets Domestic Debt Fund
103 Emerging Markets Fixed Income Opportunities Fund
108 Euro Bond Fund
114 Euro Corporate Bond Fund
122 Euro Strategic Bond Fund
133 European Currencies High Yield Bond Fund
139 Global Bond Fund
149 Global Buy and Hold 2020 Bond Fund
154 Global Buy and Maintain Bond Fund
158 Global Convertible Bond Fund
163 Global Credit Fund
171 Global Fixed Income Opportunities Fund
185 Global High Yield Bond Fund
192 Global Mortgage Securities Fund
202 Global Premier Credit Fund
206 Short Maturity Euro Bond Fund
212 US Dollar Corporate Bond Fund
218 US Dollar High Yield Bond Fund
225 US Dollar Short Duration Bond Fund
232 US Dollar Short Duration High Yield Bond Fund
Liquidity Funds
237 US Dollar Liquidity Fund
Asset Allocation Funds
238 Diversifi ed Alpha Plus Fund
245 Global Balanced Defensive Fund
255 Global Balanced Fund
265 Global Balanced Income Fund
273 Global Balanced Risk Control Fund of Funds
275 Global Multi-Asset Income Fund
291 Global Multi-Asset Opportunities Fund*
Alternative Investment Funds
298 Liquid Alpha Capture Fund
STATEMENTS AND NOTES
301 Statement of assets and liabilities
317 Statement of changes in number of shares
327 Statement of operations and changes in net assets
343 Statement of share and net assets statistics
357 Notes to the fi nancial statements
OTHER INFORMATION
374 Directors and service providers
376 Paying and information agents
377 Appendix 1: Fund expense ratios (unaudited)
382 Appendix 2: Portfolio turnover rate (unaudited)
383 Appendix 3: Sub-Advisers
385 Appendix 4: Hedged Share Classes
387 Appendix 5: Remuneration Policy of the Management Company (unaudited)
388 Appendix 6: Securities Financing Transactions (unaudited)
* Formerly known as Diversifi ed Alpha Plus Low Volatility Fund prior to 20 June 2017.
1 Morgan Stanley Investment Funds 30 June 2017
The annual general meeting of shareholders of Morgan Stanley Investment Funds (the “Company”) is held at the registered offi ce of the Company and will be held on the second Tuesday of the month of May at 10.30 am, or if such day is not a bank business day on the following bank business day.
Notices of all general meetings are sent by mail to all registered shareholders at their registered address at least 8 days prior to the meeting. Such notices will indicate the time and place of the meeting as well as the conditions of admission thereto. Said notices will also contain the agenda and requirements of Luxembourg law with regard to the necessary quorum and majorities at the meeting. To the extent required by law, further notices will be published in the Mémorial and in one Luxembourg newspaper.
Audited fi nancial statements in respect of the preceding fi nancial period are made available at the registered offi ce of the Company and are available to shareholders upon request. In addition, unaudited semi-annual reports are also made available at the registered offi ce.
Th e annual and semi-annual reports are also available on the Company’s web-site (www.morganstanleyinvestmentfunds.com).
Th e Company’s fi nancial year end is 31 December.
Any other notices relevant to the Company are also published in a Luxembourg newspaper or mailed to aff ected shareholders.
Th e net asset value per share of each Class of Share is available on each dealing day during Luxembourg business hours at the registered offi ce of the Company. Net asset value per share information is also available from market information providers, such as Bloomberg and Morningstar, as well as being available at www.morganstanleyinvestmentfunds.com.
No subscriptions can be received on the basis of fi nancial reports alone. Subscriptions are only valid if made on the basis of the current prospectus and the latest Key Investor Information Document.
Carnegie Fund Services S.A., 11, rue du Général-Dufour, 1204 Geneva, web: carnegie-fund-services-ch, is the representative in Switzerland and Banque Cantonale de Genève, 17, quai de l’Ile, 1204 Geneva is the paying agent in Switzerland. Th e Prospectus, the latest Key Investor Information Document, the Articles and the annual and semi-annual reports of the Company may be obtained free of charge from the representative in Switzerland.
Th e net asset value per share of each Class of Share is available on www.fundinfo.com.
A list of purchases and sales (securities transactions) carried out by the Company during the reporting period may be obtained free of charge from the representative in Switzerland.
Th e investment objectives set out in this annual report are summaries only. Th e complete investment objectives and policies for each Fund are set out in the Company’s current prospectus.
Shareholders’ information
Morgan Stanley Investment Funds 30 June 2017 2
The accompanying notes are an integral part of these fi nancial statements.
Please refer to the full prospectus for the Fund’s investment objective and policy.
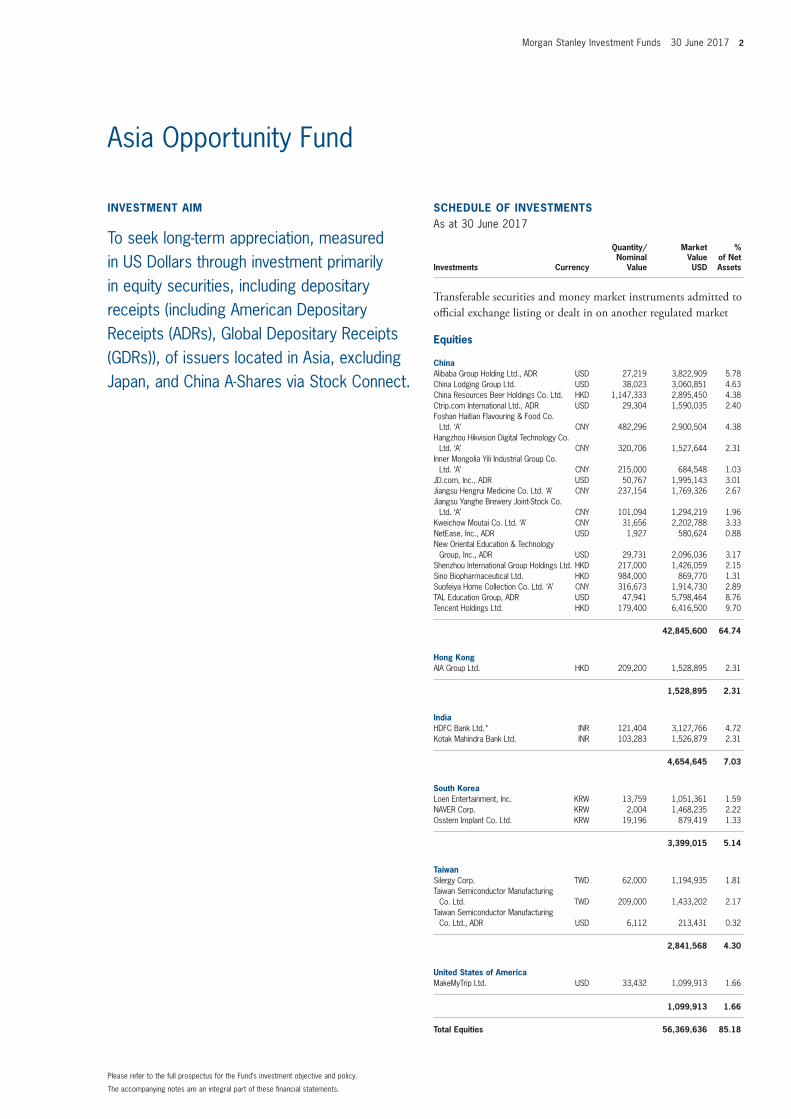
Asia Opportunity Fund
SCHEDULE OF INVESTMENTSAs at 30 June 2017
Investments Currency
Quantity/Nominal
Value
Market Value USD
% of Net Assets
Transferable securities and money market instruments admitted to offi cial exchange listing or dealt in on another regulated market
Equities
ChinaAlibaba Group Holding Ltd., ADR USD 27,219 3,822,909 5.78 China Lodging Group Ltd. USD 38,023 3,060,851 4.63 China Resources Beer Holdings Co. Ltd. HKD 1,147,333 2,895,450 4.38 Ctrip.com International Ltd., ADR USD 29,304 1,590,035 2.40 Foshan Haitian Flavouring & Food Co.
Ltd. ‘A’ CNY 482,296 2,900,504 4.38 Hangzhou Hikvision Digital Technology Co.
Ltd. ‘A’ CNY 320,706 1,527,644 2.31 Inner Mongolia Yili Industrial Group Co.
Ltd. ‘A’ CNY 215,000 684,548 1.03 JD.com, Inc., ADR USD 50,767 1,995,143 3.01 Jiangsu Hengrui Medicine Co. Ltd. ‘A’ CNY 237,154 1,769,326 2.67 Jiangsu Yanghe Brewery Joint-Stock Co.
Ltd. ‘A’ CNY 101,094 1,294,219 1.96 Kweichow Moutai Co. Ltd. ‘A’ CNY 31,656 2,202,788 3.33 NetEase, Inc., ADR USD 1,927 580,624 0.88 New Oriental Education & Technology
Group, Inc., ADR USD 29,731 2,096,036 3.17 Shenzhou International Group Holdings Ltd. HKD 217,000 1,426,059 2.15 Sino Biopharmaceutical Ltd. HKD 984,000 869,770 1.31 Suofeiya Home Collection Co. Ltd. ‘A’ CNY 316,673 1,914,730 2.89 TAL Education Group, ADR USD 47,941 5,798,464 8.76 Tencent Holdings Ltd. HKD 179,400 6,416,500 9.70
42,845,600 64.74
Hong KongAIA Group Ltd. HKD 209,200 1,528,895 2.31
1,528,895 2.31
India HDFC Bank Ltd.* INR 121,404 3,127,766 4.72 Kotak Mahindra Bank Ltd. INR 103,283 1,526,879 2.31
4,654,645 7.03
South KoreaLoen Entertainment, Inc. KRW 13,759 1,051,361 1.59 NAVER Corp. KRW 2,004 1,468,235 2.22 Osstem Implant Co. Ltd. KRW 19,196 879,419 1.33
3,399,015 5.14
TaiwanSilergy Corp. TWD 62,000 1,194,935 1.81 Taiwan Semiconductor Manufacturing
Co. Ltd. TWD 209,000 1,433,202 2.17 Taiwan Semiconductor Manufacturing
Co. Ltd., ADR USD 6,112 213,431 0.32
2,841,568 4.30
United States of AmericaMakeMyTrip Ltd. USD 33,432 1,099,913 1.66
1,099,913 1.66
Total Equities 56,369,636 85.18
INVESTMENT AIM
To seek long-term appreciation, measured in US Dollars through investment primarily in equity securities, including depositary receipts (including American Depositary Receipts (ADRs), Global Depositary Receipts (GDRs)), of issuers located in Asia, excluding Japan, and China A-Shares via Stock Connect.
3 Morgan Stanley Investment Funds 30 June 2017
The accompanying notes are an integral part of these fi nancial statements.
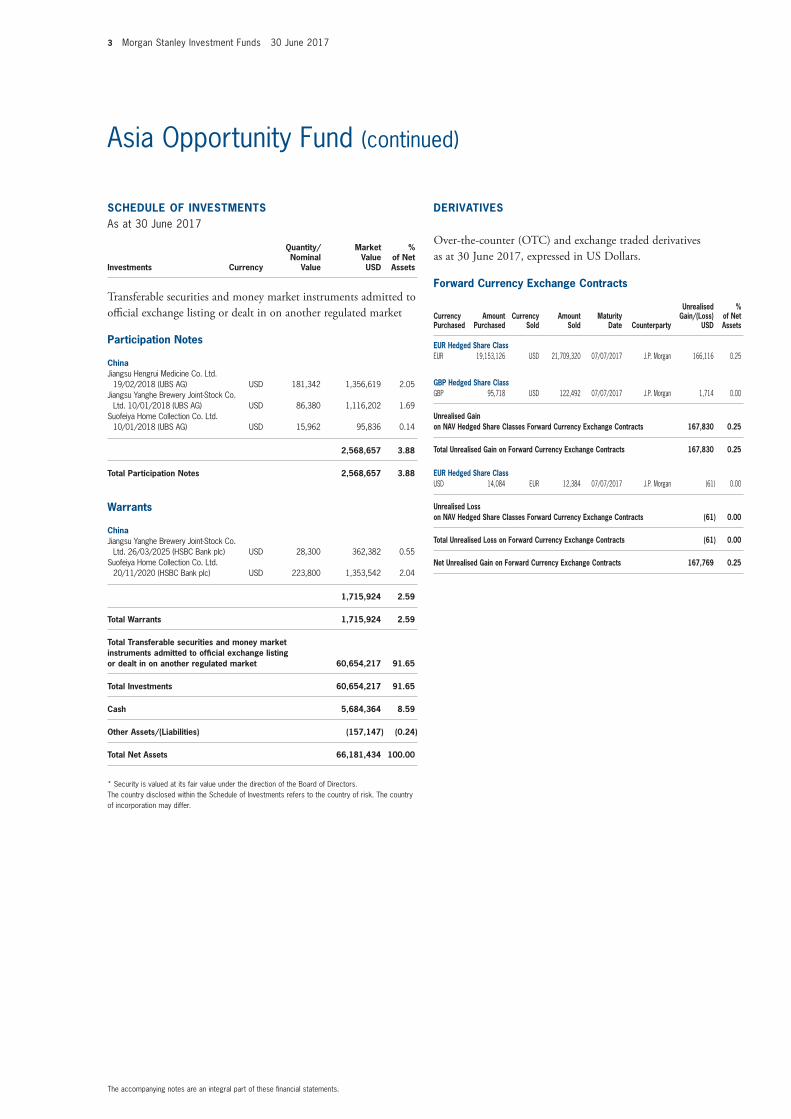
Asia Opportunity Fund (continued)
SCHEDULE OF INVESTMENTSAs at 30 June 2017
Investments Currency
Quantity/Nominal
Value
Market Value USD
% of Net Assets
Transferable securities and money market instruments admitted to offi cial exchange listing or dealt in on another regulated market
Participation Notes
ChinaJiangsu Hengrui Medicine Co. Ltd.
19/02/2018 (UBS AG) USD 181,342 1,356,619 2.05 Jiangsu Yanghe Brewery Joint-Stock Co.
Ltd. 10/01/2018 (UBS AG) USD 86,380 1,116,202 1.69 Suofeiya Home Collection Co. Ltd.
10/01/2018 (UBS AG) USD 15,962 95,836 0.14
2,568,657 3.88
Total Participation Notes 2,568,657 3.88
Warrants
ChinaJiangsu Yanghe Brewery Joint-Stock Co.
Ltd. 26/03/2025 (HSBC Bank plc) USD 28,300 362,382 0.55 Suofeiya Home Collection Co. Ltd.
20/11/2020 (HSBC Bank plc) USD 223,800 1,353,542 2.04
1,715,924 2.59
Total Warrants 1,715,924 2.59
Total Transferable securities and money market instruments admitted to offi cial exchange listing or dealt in on another regulated market 60,654,217 91.65
Total Investments 60,654,217 91.65
Cash 5,684,364 8.59
Other Assets/(Liabilities) (157,147) (0.24)
Total Net Assets 66,181,434 100.00
* Security is valued at its fair value under the direction of the Board of Directors.The country disclosed within the Schedule of Investments refers to the country of risk. The country of incorporation may differ.
Forward Currency Exchange Contracts
Currency Purchased
Amount Purchased
Currency Sold
Amount Sold
Maturity Date Counterparty
Unrealised Gain/(Loss)
USD
% of Net Assets
EUR Hedged Share ClassEUR 19,153,126 USD 21,709,320 07/07/2017 J.P. Morgan 166,116 0.25
GBP Hedged Share ClassGBP 95,718 USD 122,492 07/07/2017 J.P. Morgan 1,714 0.00
Unrealised Gain on NAV Hedged Share Classes Forward Currency Exchange Contracts 167,830 0.25
Total Unrealised Gain on Forward Currency Exchange Contracts 167,830 0.25
EUR Hedged Share ClassUSD 14,084 EUR 12,384 07/07/2017 J.P. Morgan (61) 0.00
Unrealised Loss on NAV Hedged Share Classes Forward Currency Exchange Contracts (61) 0.00
Total Unrealised Loss on Forward Currency Exchange Contracts (61) 0.00
Net Unrealised Gain on Forward Currency Exchange Contracts 167,769 0.25
DERIVATIVES
Over-the-counter (OTC) and exchange traded derivatives as at 30 June 2017, expressed in US Dollars.
Morgan Stanley Investment Funds 30 June 2017 4
The accompanying notes are an integral part of these fi nancial statements.
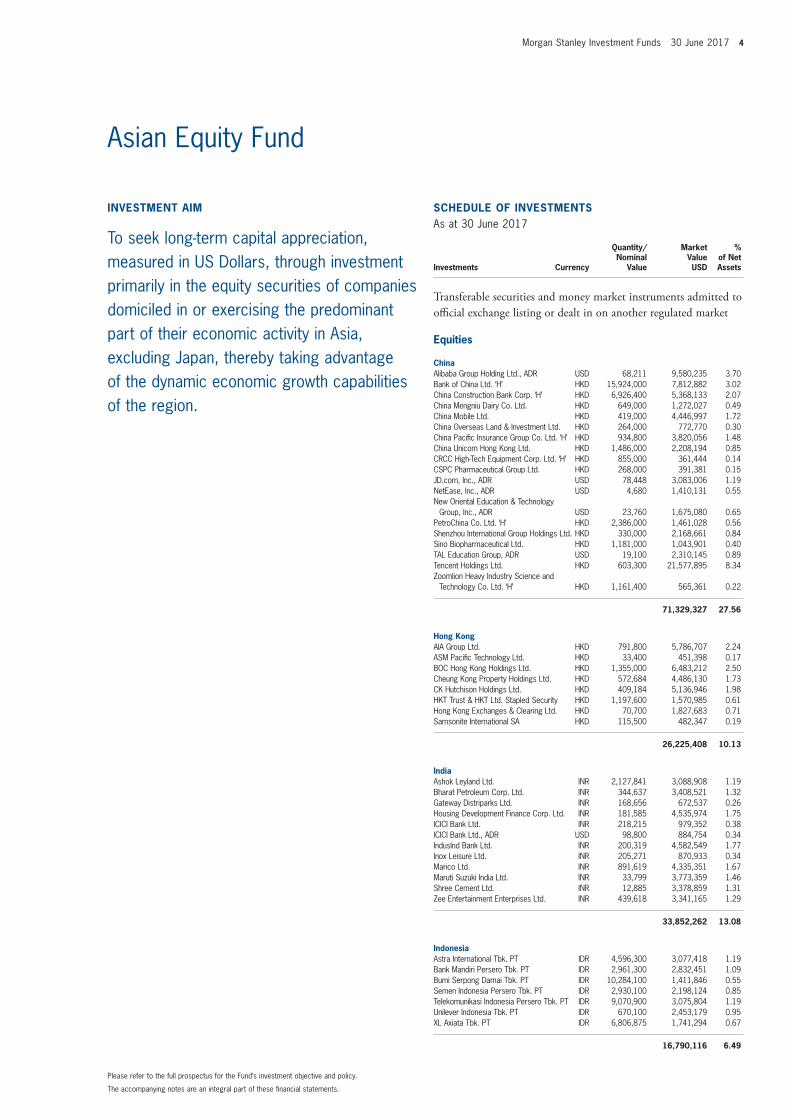
Please refer to the full prospectus for the Fund’s investment objective and policy.
Asian Equity Fund
INVESTMENT AIM
To seek long-term capital appreciation, measured in US Dollars, through investment primarily in the equity securities of companies domiciled in or exercising the predominant part of their economic activity in Asia, excluding Japan, thereby taking advantage of the dynamic economic growth capabilities of the region.
SCHEDULE OF INVESTMENTSAs at 30 June 2017
Investments Currency
Quantity/Nominal
Value
Market Value USD
% of Net Assets
Transferable securities and money market instruments admitted to offi cial exchange listing or dealt in on another regulated market
Equities
ChinaAlibaba Group Holding Ltd., ADR USD 68,211 9,580,235 3.70 Bank of China Ltd. ‘H’ HKD 15,924,000 7,812,882 3.02 China Construction Bank Corp. ‘H’ HKD 6,926,400 5,368,133 2.07 China Mengniu Dairy Co. Ltd. HKD 649,000 1,272,027 0.49 China Mobile Ltd. HKD 419,000 4,446,997 1.72 China Overseas Land & Investment Ltd. HKD 264,000 772,770 0.30 China Pacifi c Insurance Group Co. Ltd. ‘H’ HKD 934,800 3,820,056 1.48 China Unicom Hong Kong Ltd. HKD 1,486,000 2,208,194 0.85 CRCC High-Tech Equipment Corp. Ltd. ‘H’ HKD 855,000 361,444 0.14 CSPC Pharmaceutical Group Ltd. HKD 268,000 391,381 0.15 JD.com, Inc., ADR USD 78,448 3,083,006 1.19 NetEase, Inc., ADR USD 4,680 1,410,131 0.55 New Oriental Education & Technology
Group, Inc., ADR USD 23,760 1,675,080 0.65 PetroChina Co. Ltd. ‘H’ HKD 2,386,000 1,461,028 0.56 Shenzhou International Group Holdings Ltd. HKD 330,000 2,168,661 0.84 Sino Biopharmaceutical Ltd. HKD 1,181,000 1,043,901 0.40 TAL Education Group, ADR USD 19,100 2,310,145 0.89 Tencent Holdings Ltd. HKD 603,300 21,577,895 8.34 Zoomlion Heavy Industry Science and
Technology Co. Ltd. ‘H’ HKD 1,161,400 565,361 0.22
71,329,327 27.56
Hong KongAIA Group Ltd. HKD 791,800 5,786,707 2.24 ASM Pacifi c Technology Ltd. HKD 33,400 451,398 0.17 BOC Hong Kong Holdings Ltd. HKD 1,355,000 6,483,212 2.50 Cheung Kong Property Holdings Ltd. HKD 572,684 4,486,130 1.73 CK Hutchison Holdings Ltd. HKD 409,184 5,136,946 1.98 HKT Trust & HKT Ltd. Stapled Security HKD 1,197,600 1,570,985 0.61 Hong Kong Exchanges & Clearing Ltd. HKD 70,700 1,827,683 0.71 Samsonite International SA HKD 115,500 482,347 0.19
26,225,408 10.13
IndiaAshok Leyland Ltd. INR 2,127,841 3,088,908 1.19 Bharat Petroleum Corp. Ltd. INR 344,637 3,408,521 1.32 Gateway Distriparks Ltd. INR 168,656 672,537 0.26 Housing Development Finance Corp. Ltd. INR 181,585 4,535,974 1.75 ICICI Bank Ltd. INR 218,215 979,352 0.38 ICICI Bank Ltd., ADR USD 98,800 884,754 0.34 IndusInd Bank Ltd. INR 200,319 4,582,549 1.77 Inox Leisure Ltd. INR 205,271 870,933 0.34 Marico Ltd. INR 891,619 4,335,351 1.67 Maruti Suzuki India Ltd. INR 33,799 3,773,359 1.46 Shree Cement Ltd. INR 12,885 3,378,859 1.31 Zee Entertainment Enterprises Ltd. INR 439,618 3,341,165 1.29
33,852,262 13.08
IndonesiaAstra International Tbk. PT IDR 4,596,300 3,077,418 1.19 Bank Mandiri Persero Tbk. PT IDR 2,961,300 2,832,451 1.09 Bumi Serpong Damai Tbk. PT IDR 10,284,100 1,411,846 0.55 Semen Indonesia Persero Tbk. PT IDR 2,930,100 2,198,124 0.85 Telekomunikasi Indonesia Persero Tbk. PT IDR 9,070,900 3,075,804 1.19 Unilever Indonesia Tbk. PT IDR 670,100 2,453,179 0.95 XL Axiata Tbk. PT IDR 6,806,875 1,741,294 0.67
16,790,116 6.49
5 Morgan Stanley Investment Funds 30 June 2017
The accompanying notes are an integral part of these fi nancial statements.
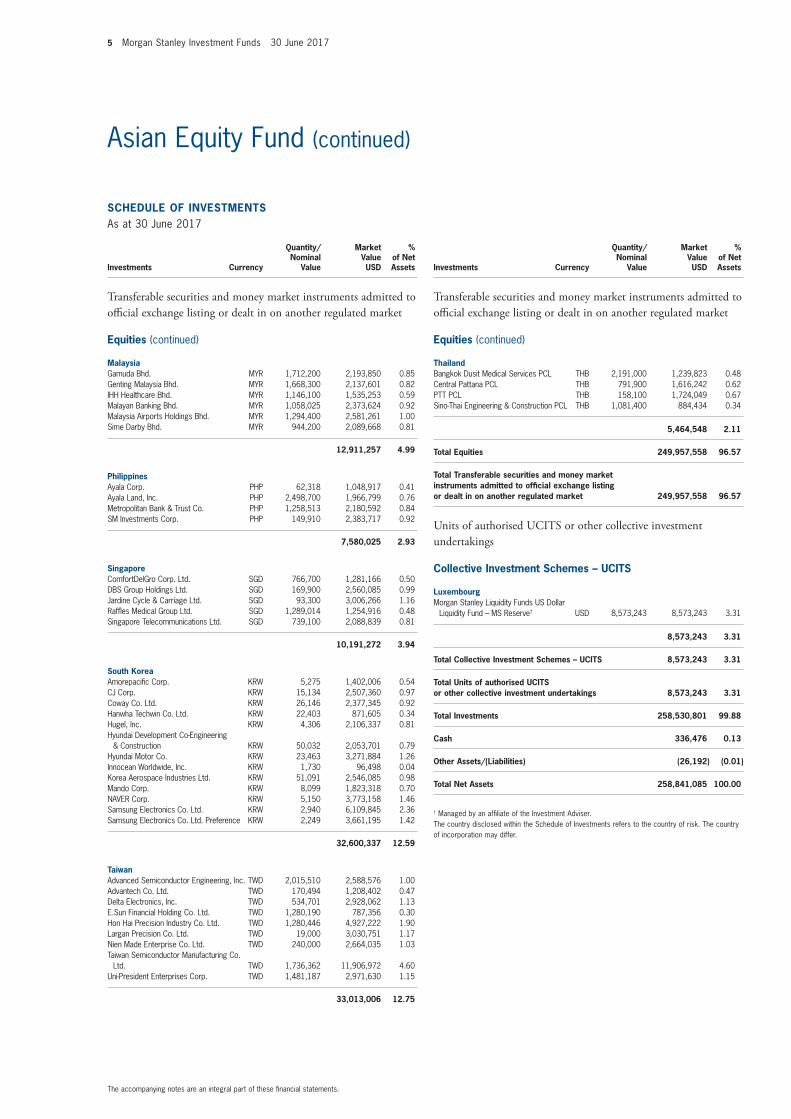
Asian Equity Fund (continued)
SCHEDULE OF INVESTMENTSAs at 30 June 2017
Investments Currency
Quantity/Nominal
Value
Market Value USD
% of Net Assets
Transferable securities and money market instruments admitted to offi cial exchange listing or dealt in on another regulated market
Equities (continued)
MalaysiaGamuda Bhd. MYR 1,712,200 2,193,850 0.85 Genting Malaysia Bhd. MYR 1,668,300 2,137,601 0.82 IHH Healthcare Bhd. MYR 1,146,100 1,535,253 0.59 Malayan Banking Bhd. MYR 1,058,025 2,373,624 0.92 Malaysia Airports Holdings Bhd. MYR 1,294,400 2,581,261 1.00 Sime Darby Bhd. MYR 944,200 2,089,668 0.81
12,911,257 4.99
PhilippinesAyala Corp. PHP 62,318 1,048,917 0.41 Ayala Land, Inc. PHP 2,498,700 1,966,799 0.76 Metropolitan Bank & Trust Co. PHP 1,258,513 2,180,592 0.84 SM Investments Corp. PHP 149,910 2,383,717 0.92
7,580,025 2.93
SingaporeComfortDelGro Corp. Ltd. SGD 766,700 1,281,166 0.50 DBS Group Holdings Ltd. SGD 169,900 2,560,085 0.99 Jardine Cycle & Carriage Ltd. SGD 93,300 3,006,266 1.16 Raffl es Medical Group Ltd. SGD 1,289,014 1,254,916 0.48 Singapore Telecommunications Ltd. SGD 739,100 2,088,839 0.81
10,191,272 3.94
South KoreaAmorepacifi c Corp. KRW 5,275 1,402,006 0.54 CJ Corp. KRW 15,134 2,507,360 0.97 Coway Co. Ltd. KRW 26,146 2,377,345 0.92 Hanwha Techwin Co. Ltd. KRW 22,403 871,605 0.34 Hugel, Inc. KRW 4,306 2,106,337 0.81 Hyundai Development Co-Engineering
& Construction KRW 50,032 2,053,701 0.79 Hyundai Motor Co. KRW 23,463 3,271,884 1.26 Innocean Worldwide, Inc. KRW 1,730 96,498 0.04 Korea Aerospace Industries Ltd. KRW 51,091 2,546,085 0.98 Mando Corp. KRW 8,099 1,823,318 0.70 NAVER Corp. KRW 5,150 3,773,158 1.46 Samsung Electronics Co. Ltd. KRW 2,940 6,109,845 2.36 Samsung Electronics Co. Ltd. Preference KRW 2,249 3,661,195 1.42
32,600,337 12.59
TaiwanAdvanced Semiconductor Engineering, Inc. TWD 2,015,510 2,588,576 1.00 Advantech Co. Ltd. TWD 170,494 1,208,402 0.47 Delta Electronics, Inc. TWD 534,701 2,928,062 1.13 E.Sun Financial Holding Co. Ltd. TWD 1,280,190 787,356 0.30 Hon Hai Precision Industry Co. Ltd. TWD 1,280,446 4,927,222 1.90 Largan Precision Co. Ltd. TWD 19,000 3,030,751 1.17 Nien Made Enterprise Co. Ltd. TWD 240,000 2,664,035 1.03 Taiwan Semiconductor Manufacturing Co.
Ltd. TWD 1,736,362 11,906,972 4.60 Uni-President Enterprises Corp. TWD 1,481,187 2,971,630 1.15
33,013,006 12.75
SCHEDULE OF INVESTMENTSAs at 30 June 2017
Investments Currency
Quantity/Nominal
Value
Market Value USD
% of Net Assets
Transferable securities and money market instruments admitted to offi cial exchange listing or dealt in on another regulated market
Equities (continued)
ThailandBangkok Dusit Medical Services PCL THB 2,191,000 1,239,823 0.48 Central Pattana PCL THB 791,900 1,616,242 0.62 PTT PCL THB 158,100 1,724,049 0.67 Sino-Thai Engineering & Construction PCL THB 1,081,400 884,434 0.34
5,464,548 2.11
Total Equities 249,957,558 96.57
Total Transferable securities and money market instruments admitted to offi cial exchange listing or dealt in on another regulated market 249,957,558 96.57
Units of authorised UCITS or other collective investment undertakings
Collective Investment Schemes – UCITS
LuxembourgMorgan Stanley Liquidity Funds US Dollar
Liquidity Fund – MS Reserve† USD 8,573,243 8,573,243 3.31
8,573,243 3.31
Total Collective Investment Schemes – UCITS 8,573,243 3.31
Total Units of authorised UCITS or other collective investment undertakings 8,573,243 3.31
Total Investments 258,530,801 99.88
Cash 336,476 0.13
Other Assets/(Liabilities) (26,192) (0.01)
Total Net Assets 258,841,085 100.00
† Managed by an affi liate of the Investment Adviser.The country disclosed within the Schedule of Investments refers to the country of risk. The country of incorporation may differ.
Morgan Stanley Investment Funds 30 June 2017 6
The accompanying notes are an integral part of these fi nancial statements.
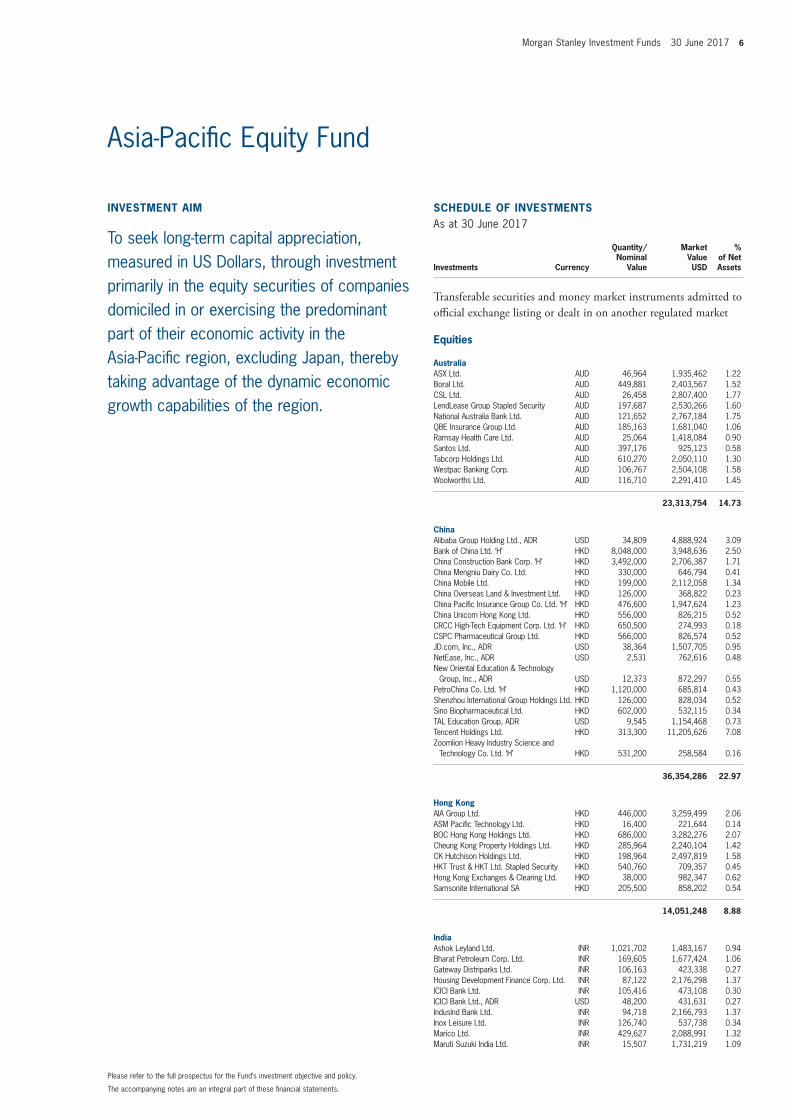
Please refer to the full prospectus for the Fund’s investment objective and policy.
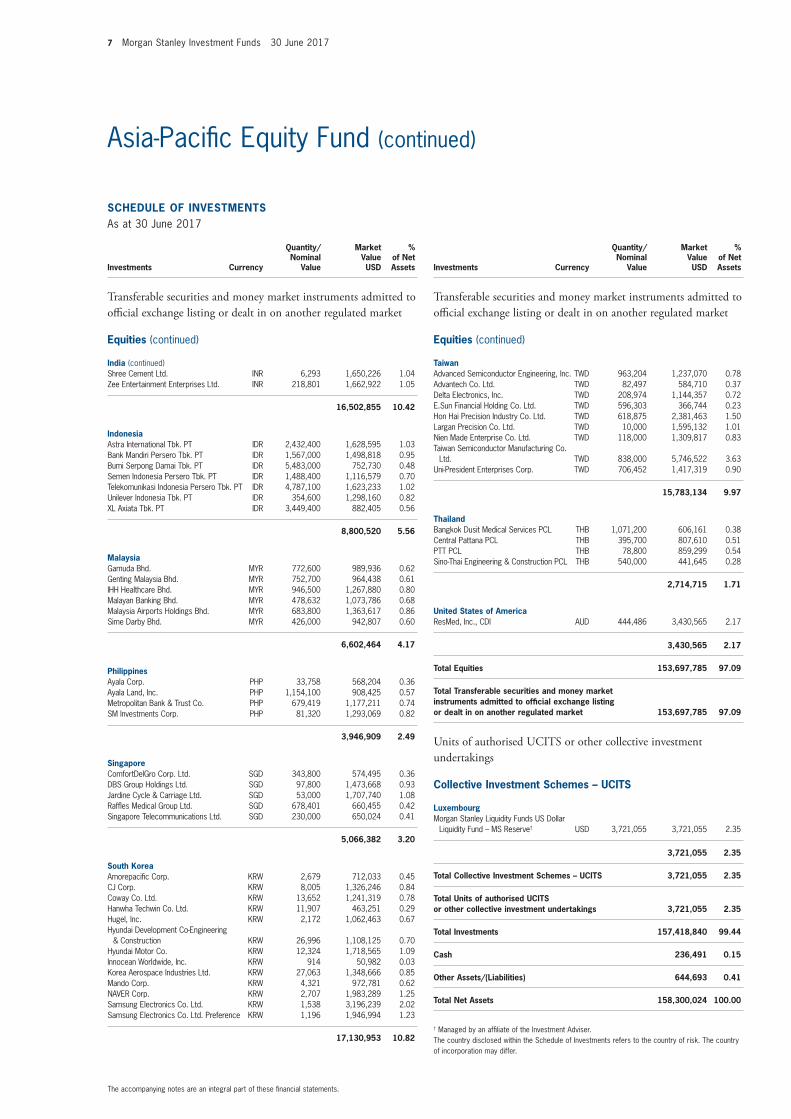
INVESTMENT AIM
To seek long-term capital appreciation, measured in US Dollars, through investment primarily in the equity securities of companies domiciled in or exercising the predominant part of their economic activity in the Asia-Pacifi c region, excluding Japan, thereby taking advantage of the dynamic economic growth capabilities of the region.
SCHEDULE OF INVESTMENTSAs at 30 June 2017
Investments Currency
Quantity/Nominal
Value
Market Value USD
% of Net Assets
Transferable securities and money market instruments admitted to offi cial exchange listing or dealt in on another regulated market
Equities
AustraliaASX Ltd. AUD 46,964 1,935,462 1.22 Boral Ltd. AUD 449,881 2,403,567 1.52 CSL Ltd. AUD 26,458 2,807,400 1.77 LendLease Group Stapled Security AUD 197,687 2,530,266 1.60 National Australia Bank Ltd. AUD 121,652 2,767,184 1.75 QBE Insurance Group Ltd. AUD 185,163 1,681,040 1.06 Ramsay Health Care Ltd. AUD 25,064 1,418,084 0.90 Santos Ltd. AUD 397,176 925,123 0.58 Tabcorp Holdings Ltd. AUD 610,270 2,050,110 1.30 Westpac Banking Corp. AUD 106,767 2,504,108 1.58 Woolworths Ltd. AUD 116,710 2,291,410 1.45
23,313,754 14.73
ChinaAlibaba Group Holding Ltd., ADR USD 34,809 4,888,924 3.09 Bank of China Ltd. ‘H’ HKD 8,048,000 3,948,636 2.50 China Construction Bank Corp. ‘H’ HKD 3,492,000 2,706,387 1.71 China Mengniu Dairy Co. Ltd. HKD 330,000 646,794 0.41 China Mobile Ltd. HKD 199,000 2,112,058 1.34 China Overseas Land & Investment Ltd. HKD 126,000 368,822 0.23 China Pacifi c Insurance Group Co. Ltd. ‘H’ HKD 476,600 1,947,624 1.23 China Unicom Hong Kong Ltd. HKD 556,000 826,215 0.52 CRCC High-Tech Equipment Corp. Ltd. ‘H’ HKD 650,500 274,993 0.18 CSPC Pharmaceutical Group Ltd. HKD 566,000 826,574 0.52 JD.com, Inc., ADR USD 38,364 1,507,705 0.95 NetEase, Inc., ADR USD 2,531 762,616 0.48 New Oriental Education & Technology
Group, Inc., ADR USD 12,373 872,297 0.55 PetroChina Co. Ltd. ‘H’ HKD 1,120,000 685,814 0.43 Shenzhou International Group Holdings Ltd. HKD 126,000 828,034 0.52 Sino Biopharmaceutical Ltd. HKD 602,000 532,115 0.34 TAL Education Group, ADR USD 9,545 1,154,468 0.73 Tencent Holdings Ltd. HKD 313,300 11,205,626 7.08 Zoomlion Heavy Industry Science and
Technology Co. Ltd. ‘H’ HKD 531,200 258,584 0.16
36,354,286 22.97
Hong KongAIA Group Ltd. HKD 446,000 3,259,499 2.06 ASM Pacifi c Technology Ltd. HKD 16,400 221,644 0.14 BOC Hong Kong Holdings Ltd. HKD 686,000 3,282,276 2.07 Cheung Kong Property Holdings Ltd. HKD 285,964 2,240,104 1.42 CK Hutchison Holdings Ltd. HKD 198,964 2,497,819 1.58 HKT Trust & HKT Ltd. Stapled Security HKD 540,760 709,357 0.45 Hong Kong Exchanges & Clearing Ltd. HKD 38,000 982,347 0.62 Samsonite International SA HKD 205,500 858,202 0.54
14,051,248 8.88
IndiaAshok Leyland Ltd. INR 1,021,702 1,483,167 0.94 Bharat Petroleum Corp. Ltd. INR 169,605 1,677,424 1.06 Gateway Distriparks Ltd. INR 106,163 423,338 0.27 Housing Development Finance Corp. Ltd. INR 87,122 2,176,298 1.37 ICICI Bank Ltd. INR 105,416 473,108 0.30 ICICI Bank Ltd., ADR USD 48,200 431,631 0.27 IndusInd Bank Ltd. INR 94,718 2,166,793 1.37 Inox Leisure Ltd. INR 126,740 537,738 0.34 Marico Ltd. INR 429,627 2,088,991 1.32 Maruti Suzuki India Ltd. INR 15,507 1,731,219 1.09
Asia-Pacifi c Equity Fund
7 Morgan Stanley Investment Funds 30 June 2017
The accompanying notes are an integral part of these fi nancial statements.
Asia-Pacifi c Equity Fund (continued)
SCHEDULE OF INVESTMENTSAs at 30 June 2017
Investments Currency
Quantity/Nominal
Value
Market Value USD
% of Net Assets
Transferable securities and money market instruments admitted to offi cial exchange listing or dealt in on another regulated market
Equities (continued)
India (continued)Shree Cement Ltd. INR 6,293 1,650,226 1.04 Zee Entertainment Enterprises Ltd. INR 218,801 1,662,922 1.05
16,502,855 10.42
IndonesiaAstra International Tbk. PT IDR 2,432,400 1,628,595 1.03 Bank Mandiri Persero Tbk. PT IDR 1,567,000 1,498,818 0.95 Bumi Serpong Damai Tbk. PT IDR 5,483,000 752,730 0.48 Semen Indonesia Persero Tbk. PT IDR 1,488,400 1,116,579 0.70 Telekomunikasi Indonesia Persero Tbk. PT IDR 4,787,100 1,623,233 1.02 Unilever Indonesia Tbk. PT IDR 354,600 1,298,160 0.82 XL Axiata Tbk. PT IDR 3,449,400 882,405 0.56
8,800,520 5.56
MalaysiaGamuda Bhd. MYR 772,600 989,936 0.62 Genting Malaysia Bhd. MYR 752,700 964,438 0.61 IHH Healthcare Bhd. MYR 946,500 1,267,880 0.80 Malayan Banking Bhd. MYR 478,632 1,073,786 0.68 Malaysia Airports Holdings Bhd. MYR 683,800 1,363,617 0.86 Sime Darby Bhd. MYR 426,000 942,807 0.60
6,602,464 4.17
PhilippinesAyala Corp. PHP 33,758 568,204 0.36 Ayala Land, Inc. PHP 1,154,100 908,425 0.57 Metropolitan Bank & Trust Co. PHP 679,419 1,177,211 0.74 SM Investments Corp. PHP 81,320 1,293,069 0.82
3,946,909 2.49
SingaporeComfortDelGro Corp. Ltd. SGD 343,800 574,495 0.36 DBS Group Holdings Ltd. SGD 97,800 1,473,668 0.93 Jardine Cycle & Carriage Ltd. SGD 53,000 1,707,740 1.08 Raffl es Medical Group Ltd. SGD 678,401 660,455 0.42 Singapore Telecommunications Ltd. SGD 230,000 650,024 0.41
5,066,382 3.20
South KoreaAmorepacifi c Corp. KRW 2,679 712,033 0.45 CJ Corp. KRW 8,005 1,326,246 0.84 Coway Co. Ltd. KRW 13,652 1,241,319 0.78 Hanwha Techwin Co. Ltd. KRW 11,907 463,251 0.29 Hugel, Inc. KRW 2,172 1,062,463 0.67 Hyundai Development Co-Engineering
& Construction KRW 26,996 1,108,125 0.70 Hyundai Motor Co. KRW 12,324 1,718,565 1.09 Innocean Worldwide, Inc. KRW 914 50,982 0.03 Korea Aerospace Industries Ltd. KRW 27,063 1,348,666 0.85 Mando Corp. KRW 4,321 972,781 0.62 NAVER Corp. KRW 2,707 1,983,289 1.25 Samsung Electronics Co. Ltd. KRW 1,538 3,196,239 2.02 Samsung Electronics Co. Ltd. Preference KRW 1,196 1,946,994 1.23
17,130,953 10.82
SCHEDULE OF INVESTMENTSAs at 30 June 2017
Investments Currency
Quantity/Nominal
Value
Market Value USD
% of Net Assets
Transferable securities and money market instruments admitted to offi cial exchange listing or dealt in on another regulated market
Equities (continued)
TaiwanAdvanced Semiconductor Engineering, Inc. TWD 963,204 1,237,070 0.78 Advantech Co. Ltd. TWD 82,497 584,710 0.37 Delta Electronics, Inc. TWD 208,974 1,144,357 0.72 E.Sun Financial Holding Co. Ltd. TWD 596,303 366,744 0.23 Hon Hai Precision Industry Co. Ltd. TWD 618,875 2,381,463 1.50 Largan Precision Co. Ltd. TWD 10,000 1,595,132 1.01 Nien Made Enterprise Co. Ltd. TWD 118,000 1,309,817 0.83 Taiwan Semiconductor Manufacturing Co.
Ltd. TWD 838,000 5,746,522 3.63 Uni-President Enterprises Corp. TWD 706,452 1,417,319 0.90
15,783,134 9.97
ThailandBangkok Dusit Medical Services PCL THB 1,071,200 606,161 0.38 Central Pattana PCL THB 395,700 807,610 0.51 PTT PCL THB 78,800 859,299 0.54 Sino-Thai Engineering & Construction PCL THB 540,000 441,645 0.28
2,714,715 1.71
United States of AmericaResMed, Inc., CDI AUD 444,486 3,430,565 2.17
3,430,565 2.17
Total Equities 153,697,785 97.09
Total Transferable securities and money market instruments admitted to offi cial exchange listing or dealt in on another regulated market 153,697,785 97.09
Units of authorised UCITS or other collective investment undertakings
Collective Investment Schemes – UCITS
LuxembourgMorgan Stanley Liquidity Funds US Dollar
Liquidity Fund – MS Reserve† USD 3,721,055 3,721,055 2.35
3,721,055 2.35
Total Collective Investment Schemes – UCITS 3,721,055 2.35
Total Units of authorised UCITS or other collective investment undertakings 3,721,055 2.35
Total Investments 157,418,840 99.44
Cash 236,491 0.15
Other Assets/(Liabilities) 644,693 0.41
Total Net Assets 158,300,024 100.00
† Managed by an affi liate of the Investment Adviser.The country disclosed within the Schedule of Investments refers to the country of risk. The country of incorporation may differ.
Morgan Stanley Investment Funds 30 June 2017 8
The accompanying notes are an integral part of these fi nancial statements.
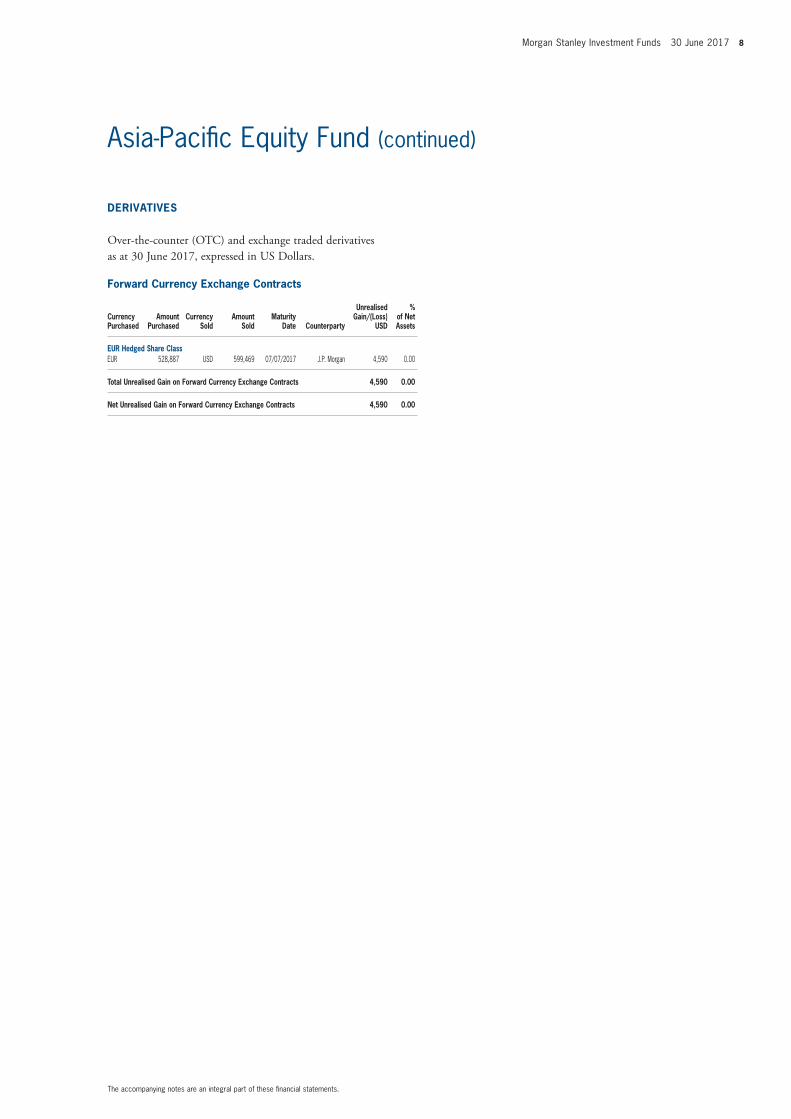
Asia-Pacifi c Equity Fund (continued)
Forward Currency Exchange Contracts
Currency Purchased
Amount Purchased
Currency Sold
Amount Sold
Maturity Date Counterparty
Unrealised Gain/(Loss)
USD
% of Net Assets
EUR Hedged Share ClassEUR 528,887 USD 599,469 07/07/2017 J.P. Morgan 4,590 0.00
Total Unrealised Gain on Forward Currency Exchange Contracts 4,590 0.00
Net Unrealised Gain on Forward Currency Exchange Contracts 4,590 0.00
DERIVATIVES
Over-the-counter (OTC) and exchange traded derivatives as at 30 June 2017, expressed in US Dollars.
9 Morgan Stanley Investment Funds 30 June 2017
The accompanying notes are an integral part of these fi nancial statements.
Please refer to the full prospectus for the Fund’s investment objective and policy.
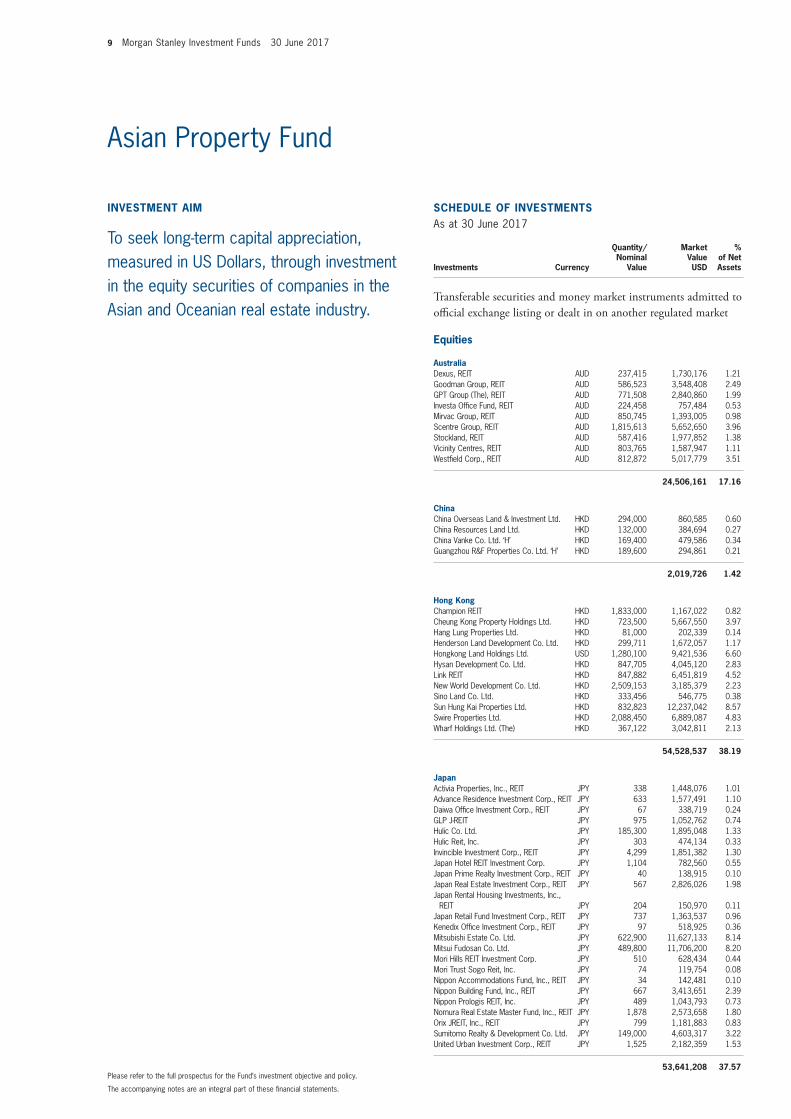
INVESTMENT AIM
To seek long-term capital appreciation, measured in US Dollars, through investment in the equity securities of companies in the Asian and Oceanian real estate industry.
SCHEDULE OF INVESTMENTSAs at 30 June 2017
Investments Currency
Quantity/Nominal
Value
Market Value USD
% of Net Assets
Transferable securities and money market instruments admitted to offi cial exchange listing or dealt in on another regulated market
Equities
AustraliaDexus, REIT AUD 237,415 1,730,176 1.21 Goodman Group, REIT AUD 586,523 3,548,408 2.49 GPT Group (The), REIT AUD 771,508 2,840,860 1.99 Investa Offi ce Fund, REIT AUD 224,458 757,484 0.53 Mirvac Group, REIT AUD 850,745 1,393,005 0.98 Scentre Group, REIT AUD 1,815,613 5,652,650 3.96 Stockland, REIT AUD 587,416 1,977,852 1.38 Vicinity Centres, REIT AUD 803,765 1,587,947 1.11 Westfi eld Corp., REIT AUD 812,872 5,017,779 3.51
24,506,161 17.16
ChinaChina Overseas Land & Investment Ltd. HKD 294,000 860,585 0.60 China Resources Land Ltd. HKD 132,000 384,694 0.27 China Vanke Co. Ltd. ‘H’ HKD 169,400 479,586 0.34 Guangzhou R&F Properties Co. Ltd. ‘H’ HKD 189,600 294,861 0.21
2,019,726 1.42
Hong KongChampion REIT HKD 1,833,000 1,167,022 0.82 Cheung Kong Property Holdings Ltd. HKD 723,500 5,667,550 3.97 Hang Lung Properties Ltd. HKD 81,000 202,339 0.14 Henderson Land Development Co. Ltd. HKD 299,711 1,672,057 1.17 Hongkong Land Holdings Ltd. USD 1,280,100 9,421,536 6.60 Hysan Development Co. Ltd. HKD 847,705 4,045,120 2.83 Link REIT HKD 847,882 6,451,819 4.52 New World Development Co. Ltd. HKD 2,509,153 3,185,379 2.23 Sino Land Co. Ltd. HKD 333,456 546,775 0.38 Sun Hung Kai Properties Ltd. HKD 832,823 12,237,042 8.57 Swire Properties Ltd. HKD 2,088,450 6,889,087 4.83 Wharf Holdings Ltd. (The) HKD 367,122 3,042,811 2.13
54,528,537 38.19
JapanActivia Properties, Inc., REIT JPY 338 1,448,076 1.01 Advance Residence Investment Corp., REIT JPY 633 1,577,491 1.10 Daiwa Offi ce Investment Corp., REIT JPY 67 338,719 0.24 GLP J-REIT JPY 975 1,052,762 0.74 Hulic Co. Ltd. JPY 185,300 1,895,048 1.33 Hulic Reit, Inc. JPY 303 474,134 0.33 Invincible Investment Corp., REIT JPY 4,299 1,851,382 1.30 Japan Hotel REIT Investment Corp. JPY 1,104 782,560 0.55 Japan Prime Realty Investment Corp., REIT JPY 40 138,915 0.10 Japan Real Estate Investment Corp., REIT JPY 567 2,826,026 1.98 Japan Rental Housing Investments, Inc.,
REIT JPY 204 150,970 0.11 Japan Retail Fund Investment Corp., REIT JPY 737 1,363,537 0.96 Kenedix Offi ce Investment Corp., REIT JPY 97 518,925 0.36 Mitsubishi Estate Co. Ltd. JPY 622,900 11,627,133 8.14 Mitsui Fudosan Co. Ltd. JPY 489,800 11,706,200 8.20 Mori Hills REIT Investment Corp. JPY 510 628,434 0.44 Mori Trust Sogo Reit, Inc. JPY 74 119,754 0.08 Nippon Accommodations Fund, Inc., REIT JPY 34 142,481 0.10 Nippon Building Fund, Inc., REIT JPY 667 3,413,651 2.39 Nippon Prologis REIT, Inc. JPY 489 1,043,793 0.73 Nomura Real Estate Master Fund, Inc., REIT JPY 1,878 2,573,658 1.80 Orix JREIT, Inc., REIT JPY 799 1,181,883 0.83 Sumitomo Realty & Development Co. Ltd. JPY 149,000 4,603,317 3.22 United Urban Investment Corp., REIT JPY 1,525 2,182,359 1.53
53,641,208 37.57
Asian Property Fund
Morgan Stanley Investment Funds 30 June 2017 10
The accompanying notes are an integral part of these fi nancial statements.
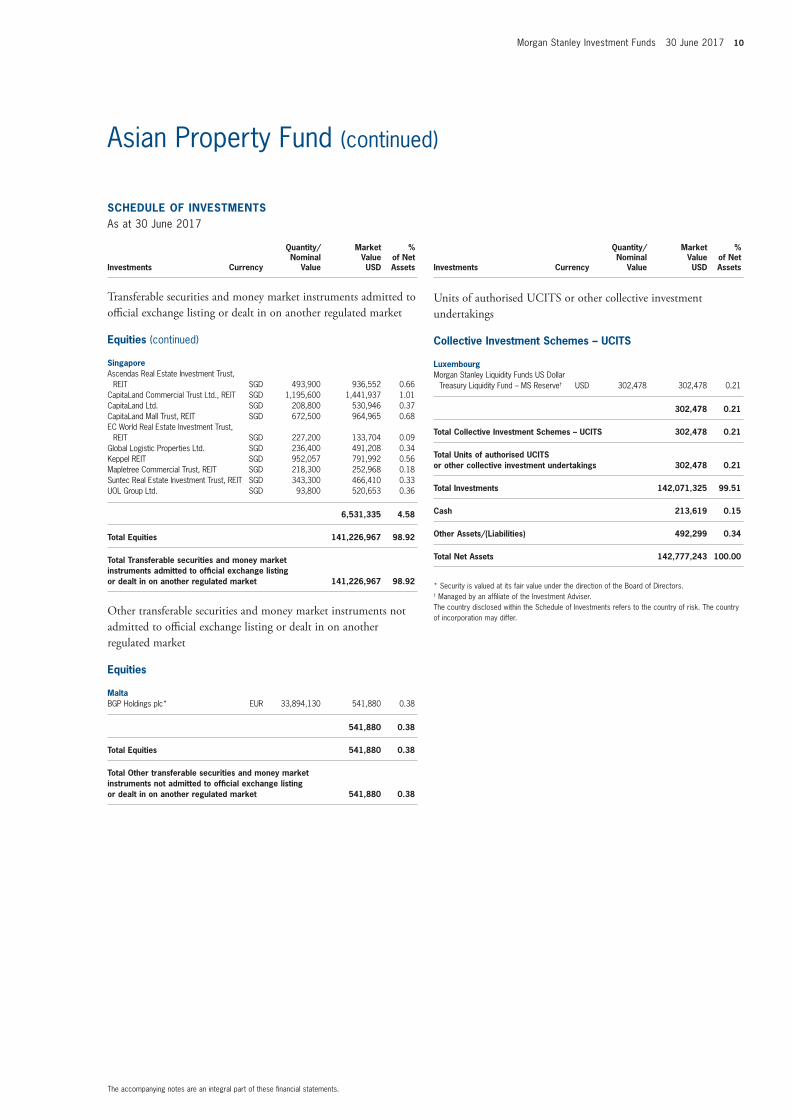
Asian Property Fund (continued)
SCHEDULE OF INVESTMENTSAs at 30 June 2017
Investments Currency
Quantity/Nominal
Value
Market Value USD
% of Net Assets
Transferable securities and money market instruments admitted to offi cial exchange listing or dealt in on another regulated market
Equities (continued)
SingaporeAscendas Real Estate Investment Trust,
REIT SGD 493,900 936,552 0.66 CapitaLand Commercial Trust Ltd., REIT SGD 1,195,600 1,441,937 1.01 CapitaLand Ltd. SGD 208,800 530,946 0.37 CapitaLand Mall Trust, REIT SGD 672,500 964,965 0.68 EC World Real Estate Investment Trust,
REIT SGD 227,200 133,704 0.09 Global Logistic Properties Ltd. SGD 236,400 491,208 0.34 Keppel REIT SGD 952,057 791,992 0.56 Mapletree Commercial Trust, REIT SGD 218,300 252,968 0.18 Suntec Real Estate Investment Trust, REIT SGD 343,300 466,410 0.33 UOL Group Ltd. SGD 93,800 520,653 0.36
6,531,335 4.58
Total Equities 141,226,967 98.92
Total Transferable securities and money market instruments admitted to offi cial exchange listing or dealt in on another regulated market 141,226,967 98.92
Other transferable securities and money market instruments not admitted to offi cial exchange listing or dealt in on another regulated market
Equities
MaltaBGP Holdings plc* EUR 33,894,130 541,880 0.38
541,880 0.38
Total Equities 541,880 0.38
Total Other transferable securities and money market instruments not admitted to offi cial exchange listing or dealt in on another regulated market 541,880 0.38
SCHEDULE OF INVESTMENTSAs at 30 June 2017
Investments Currency
Quantity/Nominal
Value
Market Value USD
% of Net Assets
Units of authorised UCITS or other collective investment undertakings
Collective Investment Schemes – UCITS
LuxembourgMorgan Stanley Liquidity Funds US Dollar
Treasury Liquidity Fund – MS Reserve† USD 302,478 302,478 0.21
302,478 0.21
Total Collective Investment Schemes – UCITS 302,478 0.21
Total Units of authorised UCITS or other collective investment undertakings 302,478 0.21
Total Investments 142,071,325 99.51
Cash 213,619 0.15
Other Assets/(Liabilities) 492,299 0.34
Total Net Assets 142,777,243 100.00
* Security is valued at its fair value under the direction of the Board of Directors.† Managed by an affi liate of the Investment Adviser.The country disclosed within the Schedule of Investments refers to the country of risk. The country of incorporation may differ.
11 Morgan Stanley Investment Funds 30 June 2017
The accompanying notes are an integral part of these fi nancial statements.
Please refer to the full prospectus for the Fund’s investment objective and policy.
SCHEDULE OF INVESTMENTSAs at 30 June 2017
Investments Currency
Quantity/Nominal
Value
Market Value USD
% of Net Assets
Transferable securities and money market instruments admitted to offi cial exchange listing or dealt in on another regulated market
Equities
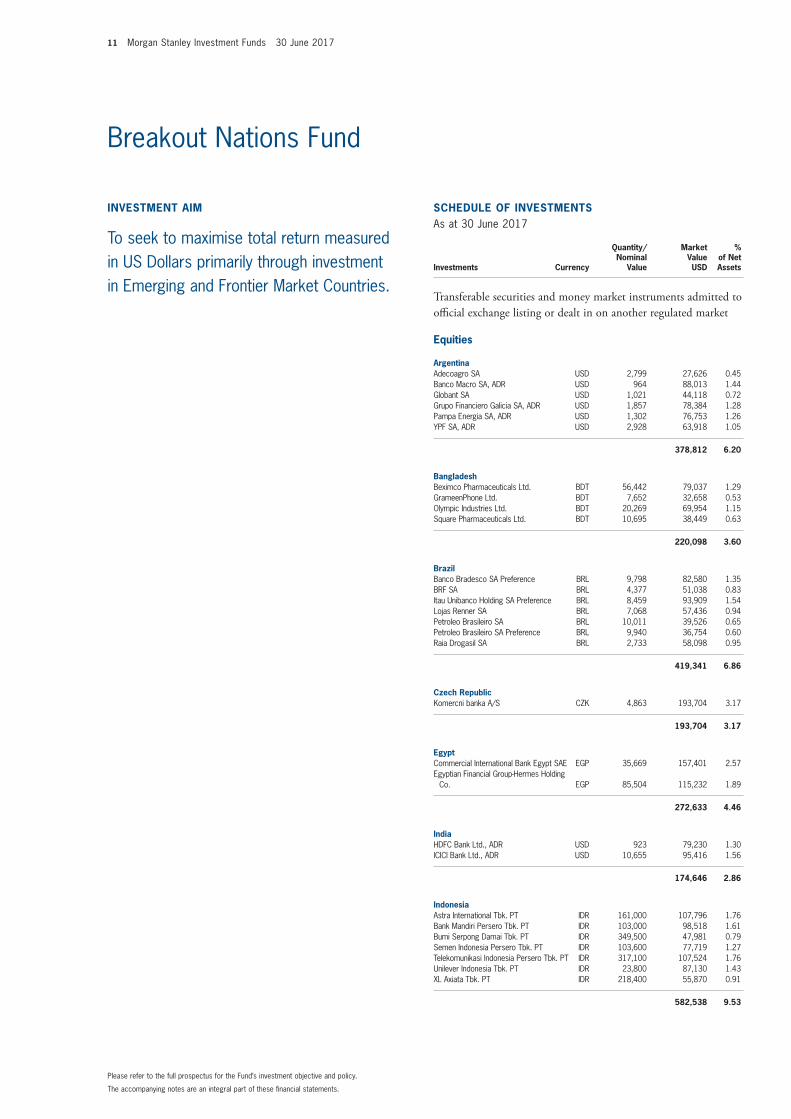
ArgentinaAdecoagro SA USD 2,799 27,626 0.45 Banco Macro SA, ADR USD 964 88,013 1.44 Globant SA USD 1,021 44,118 0.72 Grupo Financiero Galicia SA, ADR USD 1,857 78,384 1.28 Pampa Energia SA, ADR USD 1,302 76,753 1.26 YPF SA, ADR USD 2,928 63,918 1.05
378,812 6.20
BangladeshBeximco Pharmaceuticals Ltd. BDT 56,442 79,037 1.29 GrameenPhone Ltd. BDT 7,652 32,658 0.53 Olympic Industries Ltd. BDT 20,269 69,954 1.15 Square Pharmaceuticals Ltd. BDT 10,695 38,449 0.63
220,098 3.60
BrazilBanco Bradesco SA Preference BRL 9,798 82,580 1.35 BRF SA BRL 4,377 51,038 0.83 Itau Unibanco Holding SA Preference BRL 8,459 93,909 1.54 Lojas Renner SA BRL 7,068 57,436 0.94 Petroleo Brasileiro SA BRL 10,011 39,526 0.65 Petroleo Brasileiro SA Preference BRL 9,940 36,754 0.60 Raia Drogasil SA BRL 2,733 58,098 0.95
419,341 6.86
Czech RepublicKomercni banka A/S CZK 4,863 193,704 3.17
193,704 3.17
EgyptCommercial International Bank Egypt SAE EGP 35,669 157,401 2.57 Egyptian Financial Group-Hermes Holding
Co. EGP 85,504 115,232 1.89
272,633 4.46
IndiaHDFC Bank Ltd., ADR USD 923 79,230 1.30 ICICI Bank Ltd., ADR USD 10,655 95,416 1.56
174,646 2.86
IndonesiaAstra International Tbk. PT IDR 161,000 107,796 1.76 Bank Mandiri Persero Tbk. PT IDR 103,000 98,518 1.61 Bumi Serpong Damai Tbk. PT IDR 349,500 47,981 0.79 Semen Indonesia Persero Tbk. PT IDR 103,600 77,719 1.27 Telekomunikasi Indonesia Persero Tbk. PT IDR 317,100 107,524 1.76 Unilever Indonesia Tbk. PT IDR 23,800 87,130 1.43 XL Axiata Tbk. PT IDR 218,400 55,870 0.91
582,538 9.53
INVESTMENT AIM
To seek to maximise total return measured in US Dollars primarily through investment in Emerging and Frontier Market Countries.
Breakout Nations Fund
Morgan Stanley Investment Funds 30 June 2017 12
The accompanying notes are an integral part of these fi nancial statements.
Breakout Nations Fund (continued)
SCHEDULE OF INVESTMENTSAs at 30 June 2017
Investments Currency
Quantity/Nominal
Value
Market Value USD
% of Net Assets
Transferable securities and money market instruments admitted to offi cial exchange listing or dealt in on another regulated market
Equities (continued)
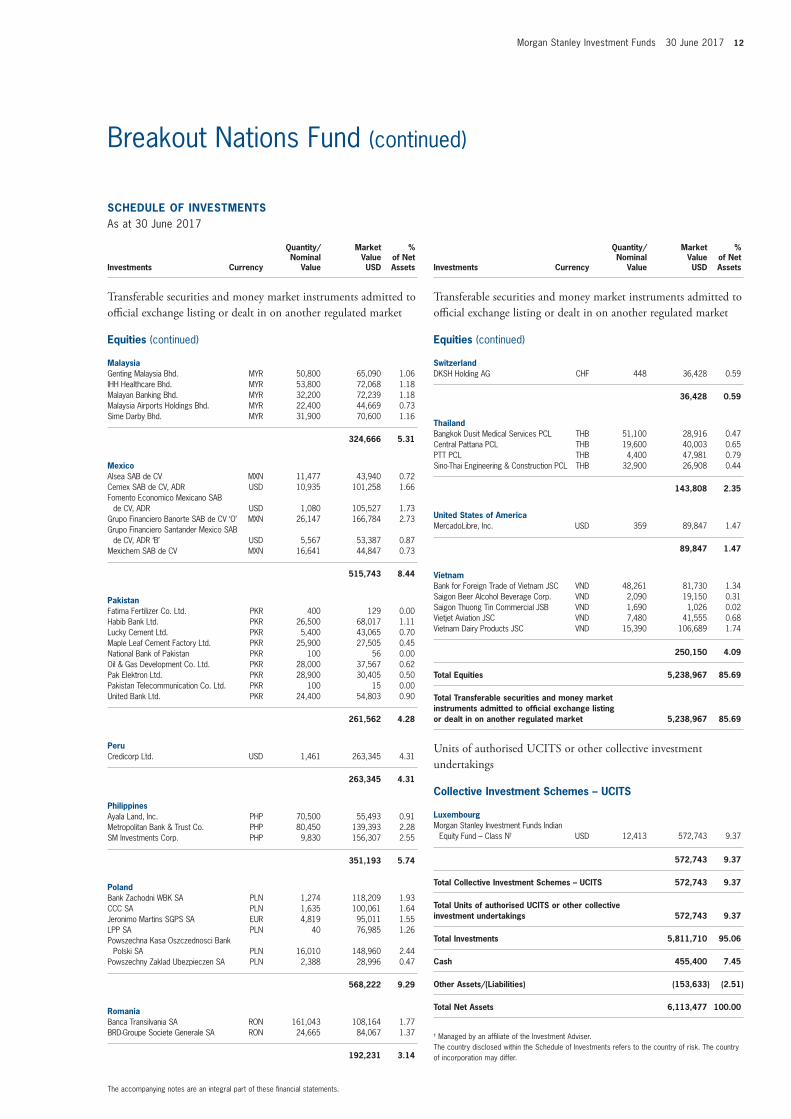
MalaysiaGenting Malaysia Bhd. MYR 50,800 65,090 1.06 IHH Healthcare Bhd. MYR 53,800 72,068 1.18 Malayan Banking Bhd. MYR 32,200 72,239 1.18 Malaysia Airports Holdings Bhd. MYR 22,400 44,669 0.73 Sime Darby Bhd. MYR 31,900 70,600 1.16
324,666 5.31
MexicoAlsea SAB de CV MXN 11,477 43,940 0.72 Cemex SAB de CV, ADR USD 10,935 101,258 1.66 Fomento Economico Mexicano SAB
de CV, ADR USD 1,080 105,527 1.73 Grupo Financiero Banorte SAB de CV ‘O’ MXN 26,147 166,784 2.73 Grupo Financiero Santander Mexico SAB
de CV, ADR ‘B’ USD 5,567 53,387 0.87 Mexichem SAB de CV MXN 16,641 44,847 0.73
515,743 8.44
PakistanFatima Fertilizer Co. Ltd. PKR 400 129 0.00 Habib Bank Ltd. PKR 26,500 68,017 1.11 Lucky Cement Ltd. PKR 5,400 43,065 0.70 Maple Leaf Cement Factory Ltd. PKR 25,900 27,505 0.45 National Bank of Pakistan PKR 100 56 0.00 Oil & Gas Development Co. Ltd. PKR 28,000 37,567 0.62 Pak Elektron Ltd. PKR 28,900 30,405 0.50 Pakistan Telecommunication Co. Ltd. PKR 100 15 0.00 United Bank Ltd. PKR 24,400 54,803 0.90
261,562 4.28
PeruCredicorp Ltd. USD 1,461 263,345 4.31
263,345 4.31
PhilippinesAyala Land, Inc. PHP 70,500 55,493 0.91 Metropolitan Bank & Trust Co. PHP 80,450 139,393 2.28 SM Investments Corp. PHP 9,830 156,307 2.55
351,193 5.74
PolandBank Zachodni WBK SA PLN 1,274 118,209 1.93 CCC SA PLN 1,635 100,061 1.64 Jeronimo Martins SGPS SA EUR 4,819 95,011 1.55 LPP SA PLN 40 76,985 1.26 Powszechna Kasa Oszczednosci Bank
Polski SA PLN 16,010 148,960 2.44 Powszechny Zaklad Ubezpieczen SA PLN 2,388 28,996 0.47
568,222 9.29
RomaniaBanca Transilvania SA RON 161,043 108,164 1.77 BRD-Groupe Societe Generale SA RON 24,665 84,067 1.37
192,231 3.14
SCHEDULE OF INVESTMENTSAs at 30 June 2017
Investments Currency
Quantity/Nominal
Value
Market Value USD
% of Net Assets
Transferable securities and money market instruments admitted to offi cial exchange listing or dealt in on another regulated market
Equities (continued)
SwitzerlandDKSH Holding AG CHF 448 36,428 0.59
36,428 0.59
ThailandBangkok Dusit Medical Services PCL THB 51,100 28,916 0.47 Central Pattana PCL THB 19,600 40,003 0.65 PTT PCL THB 4,400 47,981 0.79 Sino-Thai Engineering & Construction PCL THB 32,900 26,908 0.44
143,808 2.35
United States of AmericaMercadoLibre, Inc. USD 359 89,847 1.47
89,847 1.47
VietnamBank for Foreign Trade of Vietnam JSC VND 48,261 81,730 1.34 Saigon Beer Alcohol Beverage Corp. VND 2,090 19,150 0.31 Saigon Thuong Tin Commercial JSB VND 1,690 1,026 0.02 Vietjet Aviation JSC VND 7,480 41,555 0.68 Vietnam Dairy Products JSC VND 15,390 106,689 1.74
250,150 4.09
Total Equities 5,238,967 85.69
Total Transferable securities and money market instruments admitted to offi cial exchange listing or dealt in on another regulated market 5,238,967 85.69
Units of authorised UCITS or other collective investment undertakings
Collective Investment Schemes – UCITS
LuxembourgMorgan Stanley Investment Funds Indian
Equity Fund – Class N† USD 12,413 572,743 9.37
572,743 9.37
Total Collective Investment Schemes – UCITS 572,743 9.37
Total Units of authorised UCITS or other collective investment undertakings 572,743 9.37
Total Investments 5,811,710 95.06
Cash 455,400 7.45
Other Assets/(Liabilities) (153,633) (2.51)
Total Net Assets 6,113,477 100.00
† Managed by an affi liate of the Investment Adviser.The country disclosed within the Schedule of Investments refers to the country of risk. The country of incorporation may differ.
13 Morgan Stanley Investment Funds 30 June 2017
The accompanying notes are an integral part of these fi nancial statements.
Breakout Nations Fund (continued)
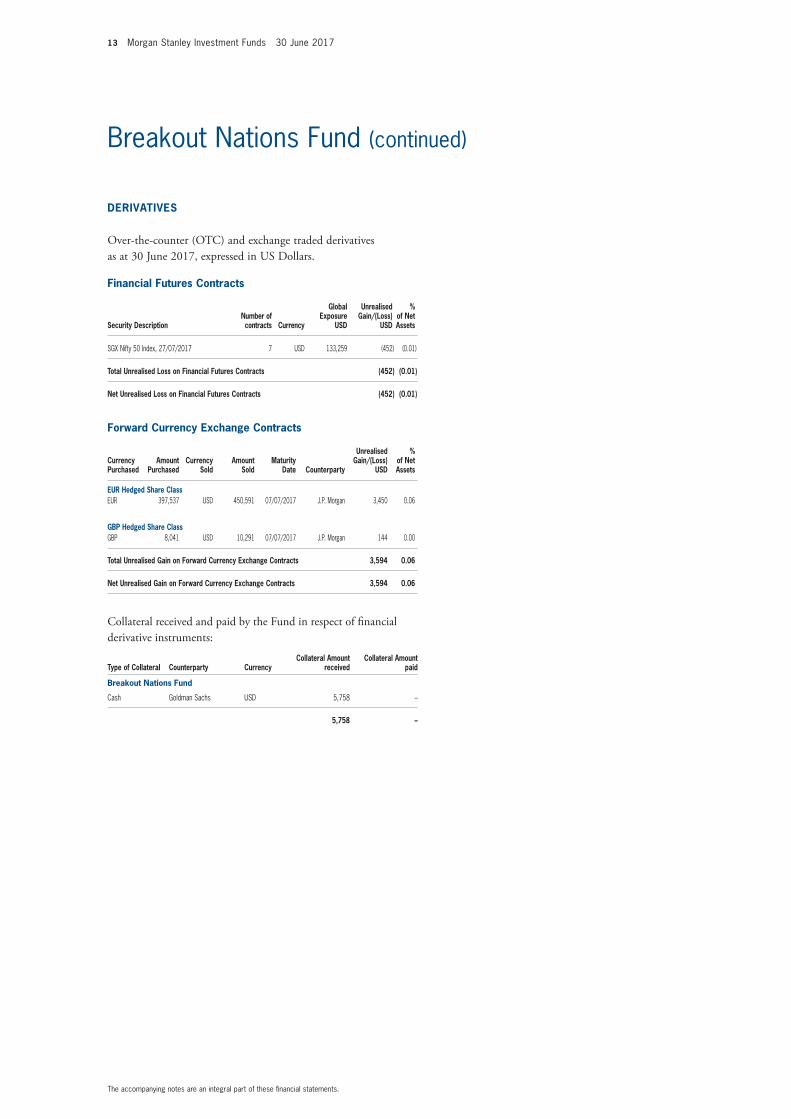
Financial Futures Contracts
Security DescriptionNumber of contracts Currency
Global Exposure
USD
Unrealised Gain/(Loss)
USD
% of Net Assets
SGX Nifty 50 Index, 27/07/2017 7 USD 133,259 (452) (0.01)
Total Unrealised Loss on Financial Futures Contracts (452) (0.01)
Net Unrealised Loss on Financial Futures Contracts (452) (0.01)
Forward Currency Exchange Contracts
Currency Purchased
Amount Purchased
Currency Sold
Amount Sold
Maturity Date Counterparty
Unrealised Gain/(Loss)
USD
% of Net Assets
EUR Hedged Share ClassEUR 397,537 USD 450,591 07/07/2017 J.P. Morgan 3,450 0.06
GBP Hedged Share ClassGBP 8,041 USD 10,291 07/07/2017 J.P. Morgan 144 0.00
Total Unrealised Gain on Forward Currency Exchange Contracts 3,594 0.06
Net Unrealised Gain on Forward Currency Exchange Contracts 3,594 0.06
Collateral received and paid by the Fund in respect of fi nancial derivative instruments:
Type of Collateral Counterparty CurrencyCollateral Amount
receivedCollateral Amount
paid
Breakout Nations Fund
Cash Goldman Sachs USD 5,758 –
5,758 –
DERIVATIVES
Over-the-counter (OTC) and exchange traded derivatives as at 30 June 2017, expressed in US Dollars.
Morgan Stanley Investment Funds 30 June 2017 14
The accompanying notes are an integral part of these fi nancial statements.
Please refer to the full prospectus for the Fund’s investment objective and policy.
SCHEDULE OF INVESTMENTSAs at 30 June 2017
Investments Currency
Quantity/Nominal
Value
Market Value EUR
% of Net Assets
Transferable securities and money market instruments admitted to offi cial exchange listing or dealt in on another regulated market
Equities
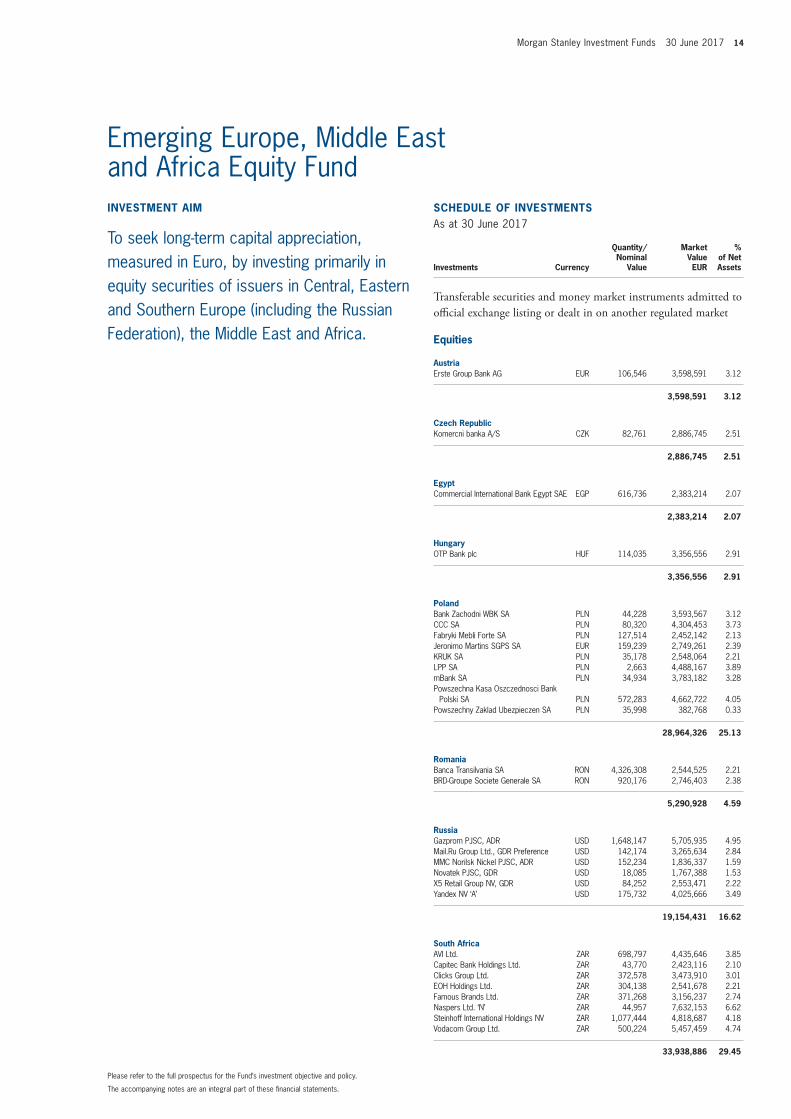
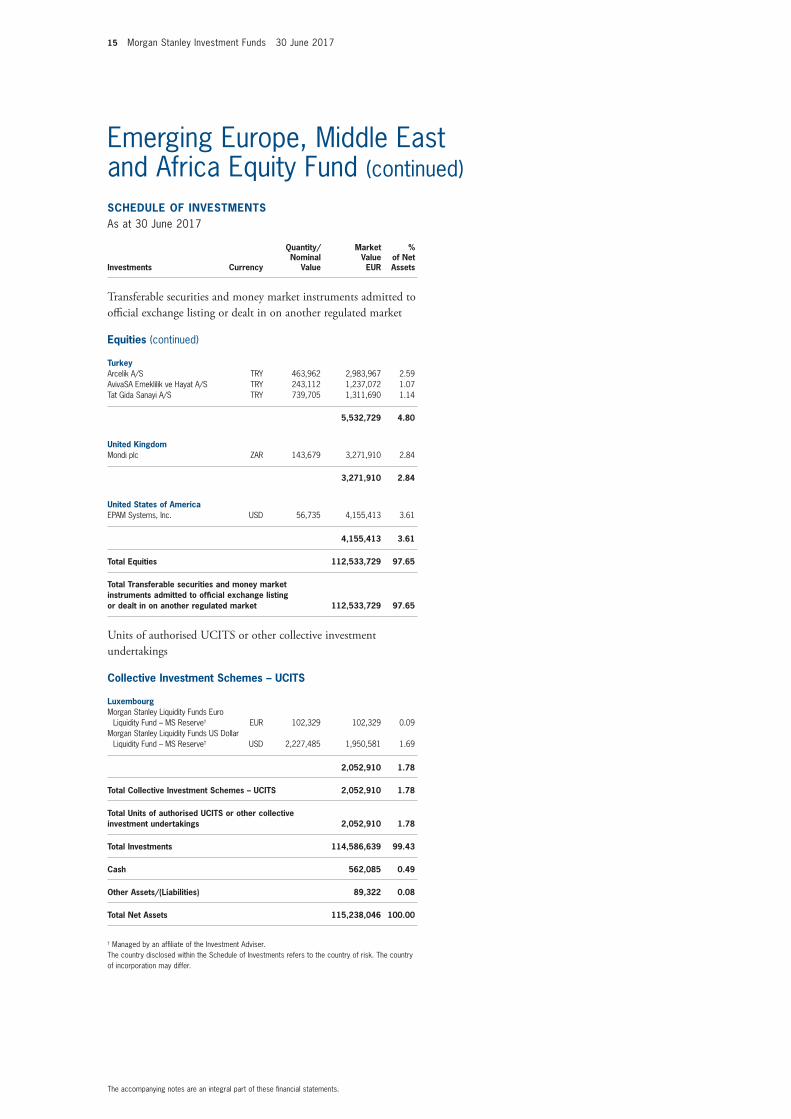
AustriaErste Group Bank AG EUR 106,546 3,598,591 3.12
3,598,591 3.12
Czech RepublicKomercni banka A/S CZK 82,761 2,886,745 2.51
2,886,745 2.51
EgyptCommercial International Bank Egypt SAE EGP 616,736 2,383,214 2.07
2,383,214 2.07
HungaryOTP Bank plc HUF 114,035 3,356,556 2.91
3,356,556 2.91
PolandBank Zachodni WBK SA PLN 44,228 3,593,567 3.12 CCC SA PLN 80,320 4,304,453 3.73 Fabryki Mebli Forte SA PLN 127,514 2,452,142 2.13 Jeronimo Martins SGPS SA EUR 159,239 2,749,261 2.39 KRUK SA PLN 35,178 2,548,064 2.21 LPP SA PLN 2,663 4,488,167 3.89 mBank SA PLN 34,934 3,783,182 3.28 Powszechna Kasa Oszczednosci Bank
Polski SA PLN 572,283 4,662,722 4.05 Powszechny Zaklad Ubezpieczen SA PLN 35,998 382,768 0.33
28,964,326 25.13
RomaniaBanca Transilvania SA RON 4,326,308 2,544,525 2.21 BRD-Groupe Societe Generale SA RON 920,176 2,746,403 2.38
5,290,928 4.59
RussiaGazprom PJSC, ADR USD 1,648,147 5,705,935 4.95 Mail.Ru Group Ltd., GDR Preference USD 142,174 3,265,634 2.84 MMC Norilsk Nickel PJSC, ADR USD 152,234 1,836,337 1.59 Novatek PJSC, GDR USD 18,085 1,767,388 1.53 X5 Retail Group NV, GDR USD 84,252 2,553,471 2.22 Yandex NV ‘A’ USD 175,732 4,025,666 3.49
19,154,431 16.62
South AfricaAVI Ltd. ZAR 698,797 4,435,646 3.85 Capitec Bank Holdings Ltd. ZAR 43,770 2,423,116 2.10 Clicks Group Ltd. ZAR 372,578 3,473,910 3.01 EOH Holdings Ltd. ZAR 304,138 2,541,678 2.21 Famous Brands Ltd. ZAR 371,268 3,156,237 2.74 Naspers Ltd. ‘N’ ZAR 44,957 7,632,153 6.62 Steinhoff International Holdings NV ZAR 1,077,444 4,818,687 4.18 Vodacom Group Ltd. ZAR 500,224 5,457,459 4.74
33,938,886 29.45
INVESTMENT AIM
To seek long-term capital appreciation, measured in Euro, by investing primarily in equity securities of issuers in Central, Eastern and Southern Europe (including the Russian Federation), the Middle East and Africa.
Emerging Europe, Middle East and Africa Equity Fund
15 Morgan Stanley Investment Funds 30 June 2017
The accompanying notes are an integral part of these fi nancial statements.
(continued)
SCHEDULE OF INVESTMENTSAs at 30 June 2017
Investments Currency
Quantity/Nominal
Value
Market Value EUR
% of Net Assets
Transferable securities and money market instruments admitted to offi cial exchange listing or dealt in on another regulated market
Equities (continued)
TurkeyArcelik A/S TRY 463,962 2,983,967 2.59 AvivaSA Emeklilik ve Hayat A/S TRY 243,112 1,237,072 1.07 Tat Gida Sanayi A/S TRY 739,705 1,311,690 1.14
5,532,729 4.80
United KingdomMondi plc ZAR 143,679 3,271,910 2.84
3,271,910 2.84
United States of AmericaEPAM Systems, Inc. USD 56,735 4,155,413 3.61
4,155,413 3.61
Total Equities 112,533,729 97.65
Total Transferable securities and money market instruments admitted to offi cial exchange listing or dealt in on another regulated market 112,533,729 97.65
Units of authorised UCITS or other collective investment undertakings
Collective Investment Schemes – UCITS
LuxembourgMorgan Stanley Liquidity Funds Euro
Liquidity Fund – MS Reserve† EUR 102,329 102,329 0.09 Morgan Stanley Liquidity Funds US Dollar
Liquidity Fund – MS Reserve† USD 2,227,485 1,950,581 1.69
2,052,910 1.78
Total Collective Investment Schemes – UCITS 2,052,910 1.78
Total Units of authorised UCITS or other collective investment undertakings 2,052,910 1.78
Total Investments 114,586,639 99.43
Cash 562,085 0.49
Other Assets/(Liabilities) 89,322 0.08
Total Net Assets 115,238,046 100.00
† Managed by an affi liate of the Investment Adviser.The country disclosed within the Schedule of Investments refers to the country of risk. The country of incorporation may differ.
Emerging Europe, Middle East and Africa Equity Fund (continued)
Morgan Stanley Investment Funds 30 June 2017 16
The accompanying notes are an integral part of these fi nancial statements.
Please refer to the full prospectus for the Fund’s investment objective and policy.
SCHEDULE OF INVESTMENTSAs at 30 June 2017
Investments Currency
Quantity/Nominal
Value
Market Value USD
% of Net Assets
Transferable securities and money market instruments admitted to offi cial exchange listing or dealt in on another regulated market
Equities
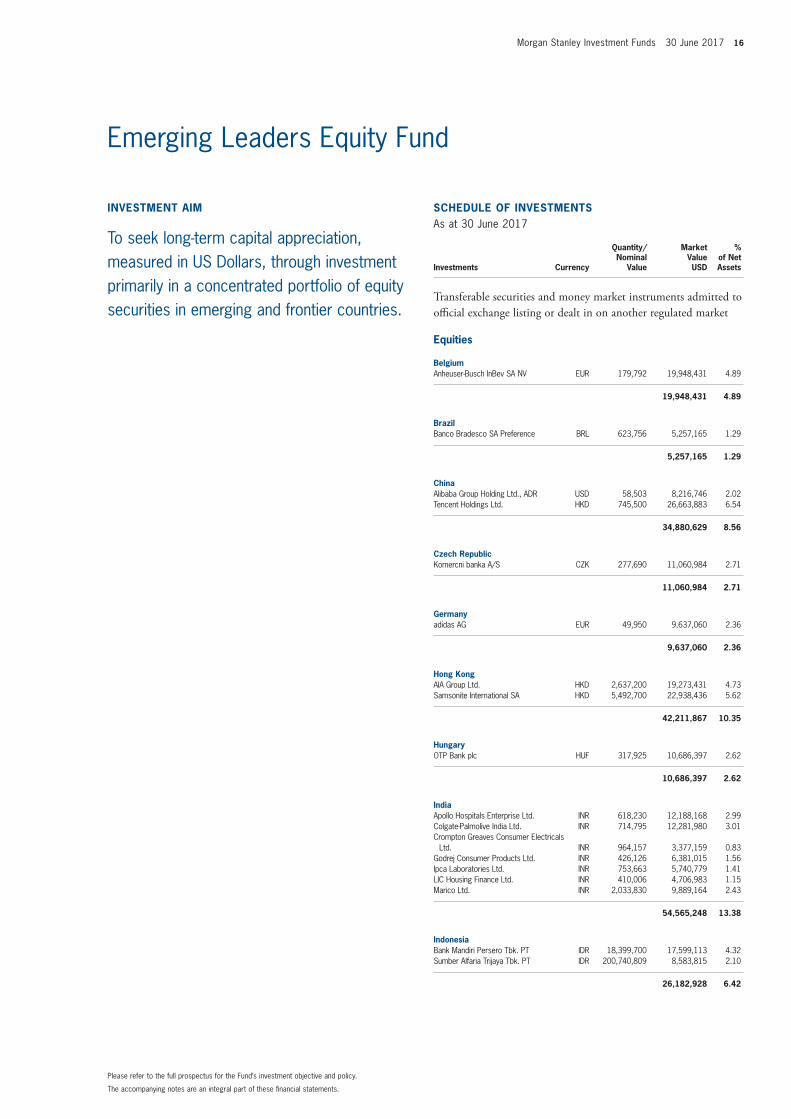
BelgiumAnheuser-Busch InBev SA NV EUR 179,792 19,948,431 4.89
19,948,431 4.89
BrazilBanco Bradesco SA Preference BRL 623,756 5,257,165 1.29
5,257,165 1.29
ChinaAlibaba Group Holding Ltd., ADR USD 58,503 8,216,746 2.02 Tencent Holdings Ltd. HKD 745,500 26,663,883 6.54
34,880,629 8.56
Czech RepublicKomercni banka A/S CZK 277,690 11,060,984 2.71
11,060,984 2.71
Germanyadidas AG EUR 49,950 9,637,060 2.36
9,637,060 2.36
Hong KongAIA Group Ltd. HKD 2,637,200 19,273,431 4.73 Samsonite International SA HKD 5,492,700 22,938,436 5.62
42,211,867 10.35
HungaryOTP Bank plc HUF 317,925 10,686,397 2.62
10,686,397 2.62
IndiaApollo Hospitals Enterprise Ltd. INR 618,230 12,188,168 2.99 Colgate-Palmolive India Ltd. INR 714,795 12,281,980 3.01 Crompton Greaves Consumer Electricals
Ltd. INR 964,157 3,377,159 0.83 Godrej Consumer Products Ltd. INR 426,126 6,381,015 1.56 Ipca Laboratories Ltd. INR 753,663 5,740,779 1.41 LIC Housing Finance Ltd. INR 410,006 4,706,983 1.15 Marico Ltd. INR 2,033,830 9,889,164 2.43
54,565,248 13.38
IndonesiaBank Mandiri Persero Tbk. PT IDR 18,399,700 17,599,113 4.32 Sumber Alfaria Trijaya Tbk. PT IDR 200,740,809 8,583,815 2.10
26,182,928 6.42
INVESTMENT AIM
To seek long-term capital appreciation, measured in US Dollars, through investment primarily in a concentrated portfolio of equity securities in emerging and frontier countries.
Emerging Leaders Equity Fund
17 Morgan Stanley Investment Funds 30 June 2017
The accompanying notes are an integral part of these fi nancial statements.
Emerging Leaders Equity Fund (continued)
SCHEDULE OF INVESTMENTSAs at 30 June 2017
Investments Currency
Quantity/Nominal
Value
Market Value USD
% of Net Assets
Transferable securities and money market instruments admitted to offi cial exchange listing or dealt in on another regulated market
Equities (continued)
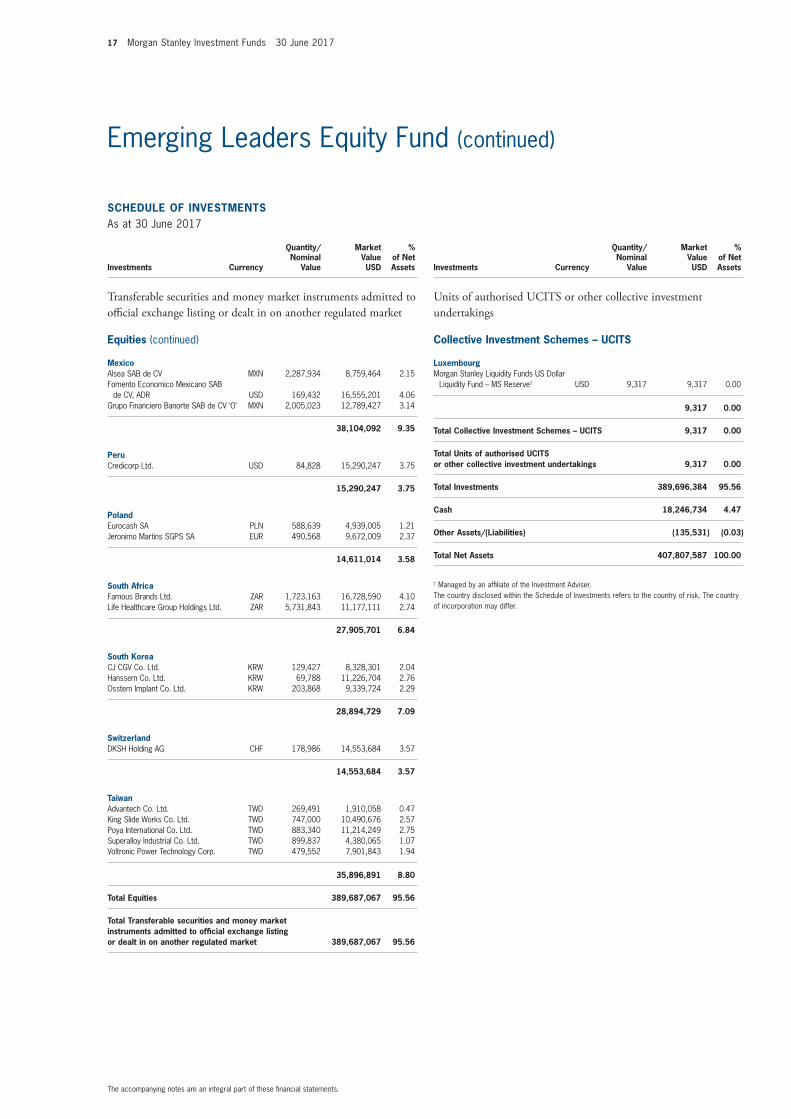
MexicoAlsea SAB de CV MXN 2,287,934 8,759,464 2.15 Fomento Economico Mexicano SAB
de CV, ADR USD 169,432 16,555,201 4.06 Grupo Financiero Banorte SAB de CV ‘O’ MXN 2,005,023 12,789,427 3.14
38,104,092 9.35
PeruCredicorp Ltd. USD 84,828 15,290,247 3.75
15,290,247 3.75
PolandEurocash SA PLN 588,639 4,939,005 1.21 Jeronimo Martins SGPS SA EUR 490,568 9,672,009 2.37
14,611,014 3.58
South AfricaFamous Brands Ltd. ZAR 1,723,163 16,728,590 4.10 Life Healthcare Group Holdings Ltd. ZAR 5,731,843 11,177,111 2.74
27,905,701 6.84
South KoreaCJ CGV Co. Ltd. KRW 129,427 8,328,301 2.04 Hanssem Co. Ltd. KRW 69,788 11,226,704 2.76 Osstem Implant Co. Ltd. KRW 203,868 9,339,724 2.29
28,894,729 7.09
SwitzerlandDKSH Holding AG CHF 178,986 14,553,684 3.57
14,553,684 3.57
TaiwanAdvantech Co. Ltd. TWD 269,491 1,910,058 0.47 King Slide Works Co. Ltd. TWD 747,000 10,490,676 2.57 Poya International Co. Ltd. TWD 883,340 11,214,249 2.75 Superalloy Industrial Co. Ltd. TWD 899,837 4,380,065 1.07 Voltronic Power Technology Corp. TWD 479,552 7,901,843 1.94
35,896,891 8.80
Total Equities 389,687,067 95.56
Total Transferable securities and money market instruments admitted to offi cial exchange listing or dealt in on another regulated market 389,687,067 95.56
SCHEDULE OF INVESTMENTSAs at 30 June 2017
Investments Currency
Quantity/Nominal
Value
Market Value USD
% of Net Assets
Units of authorised UCITS or other collective investment undertakings
Collective Investment Schemes – UCITS
LuxembourgMorgan Stanley Liquidity Funds US Dollar
Liquidity Fund – MS Reserve† USD 9,317 9,317 0.00
9,317 0.00
Total Collective Investment Schemes – UCITS 9,317 0.00
Total Units of authorised UCITS or other collective investment undertakings 9,317 0.00
Total Investments 389,696,384 95.56
Cash 18,246,734 4.47
Other Assets/(Liabilities) (135,531) (0.03)
Total Net Assets 407,807,587 100.00
† Managed by an affi liate of the Investment Adviser.The country disclosed within the Schedule of Investments refers to the country of risk. The country of incorporation may differ.
Morgan Stanley Investment Funds 30 June 2017 18
The accompanying notes are an integral part of these fi nancial statements.
Emerging Leaders Equity Fund (continued)
Forward Currency Exchange Contracts
Currency Purchased
Amount Purchased
Currency Sold
Amount Sold
Maturity Date Counterparty
Unrealised Gain/(Loss)
USD
% of Net Assets
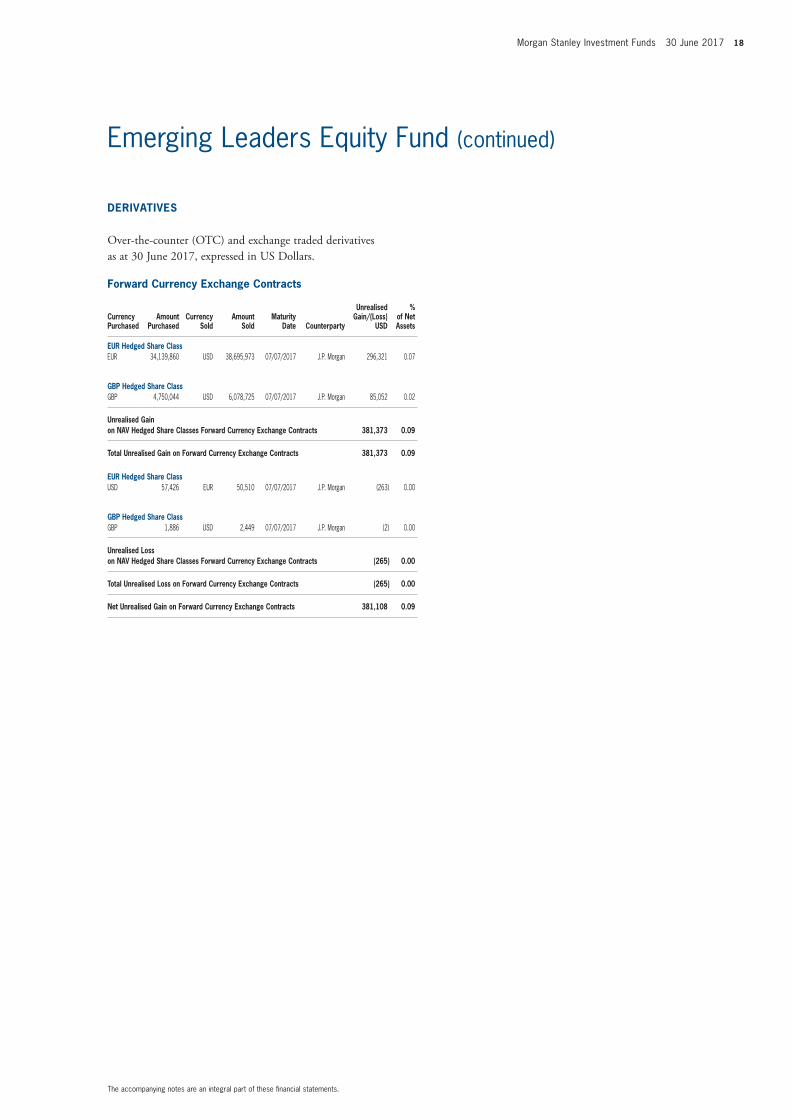
EUR Hedged Share ClassEUR 34,139,860 USD 38,695,973 07/07/2017 J.P. Morgan 296,321 0.07
GBP Hedged Share ClassGBP 4,750,044 USD 6,078,725 07/07/2017 J.P. Morgan 85,052 0.02
Unrealised Gain on NAV Hedged Share Classes Forward Currency Exchange Contracts 381,373 0.09
Total Unrealised Gain on Forward Currency Exchange Contracts 381,373 0.09
EUR Hedged Share ClassUSD 57,426 EUR 50,510 07/07/2017 J.P. Morgan (263) 0.00
GBP Hedged Share ClassGBP 1,886 USD 2,449 07/07/2017 J.P. Morgan (2) 0.00
Unrealised Loss on NAV Hedged Share Classes Forward Currency Exchange Contracts (265) 0.00
Total Unrealised Loss on Forward Currency Exchange Contracts (265) 0.00
Net Unrealised Gain on Forward Currency Exchange Contracts 381,108 0.09
DERIVATIVES
Over-the-counter (OTC) and exchange traded derivatives as at 30 June 2017, expressed in US Dollars.
19 Morgan Stanley Investment Funds 30 June 2017
The accompanying notes are an integral part of these fi nancial statements.
Please refer to the full prospectus for the Fund’s investment objective and policy.
SCHEDULE OF INVESTMENTSAs at 30 June 2017
Investments Currency
Quantity/Nominal
Value
Market Value USD
% of Net Assets
Transferable securities and money market instruments admitted to offi cial exchange listing or dealt in on another regulated market
Equities
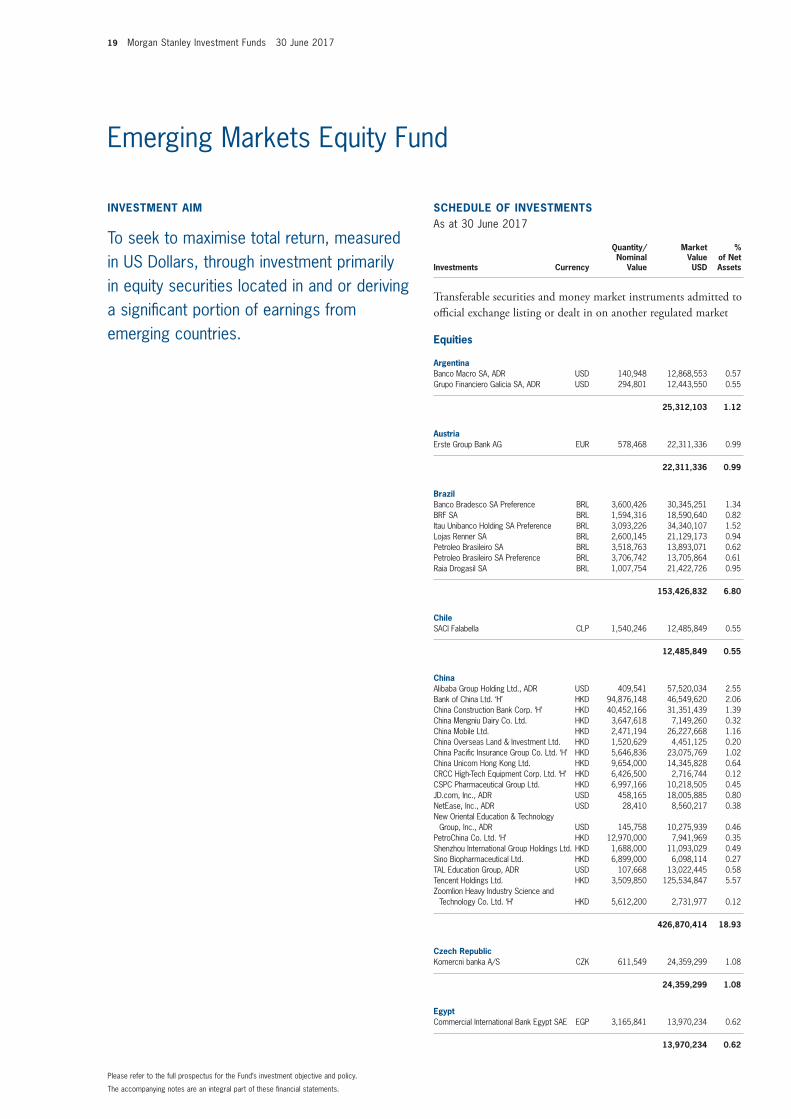
ArgentinaBanco Macro SA, ADR USD 140,948 12,868,553 0.57 Grupo Financiero Galicia SA, ADR USD 294,801 12,443,550 0.55
25,312,103 1.12
AustriaErste Group Bank AG EUR 578,468 22,311,336 0.99
22,311,336 0.99
BrazilBanco Bradesco SA Preference BRL 3,600,426 30,345,251 1.34 BRF SA BRL 1,594,316 18,590,640 0.82 Itau Unibanco Holding SA Preference BRL 3,093,226 34,340,107 1.52 Lojas Renner SA BRL 2,600,145 21,129,173 0.94 Petroleo Brasileiro SA BRL 3,518,763 13,893,071 0.62 Petroleo Brasileiro SA Preference BRL 3,706,742 13,705,864 0.61 Raia Drogasil SA BRL 1,007,754 21,422,726 0.95
153,426,832 6.80
ChileSACI Falabella CLP 1,540,246 12,485,849 0.55
12,485,849 0.55
ChinaAlibaba Group Holding Ltd., ADR USD 409,541 57,520,034 2.55 Bank of China Ltd. ‘H’ HKD 94,876,148 46,549,620 2.06 China Construction Bank Corp. ‘H’ HKD 40,452,166 31,351,439 1.39 China Mengniu Dairy Co. Ltd. HKD 3,647,618 7,149,260 0.32 China Mobile Ltd. HKD 2,471,194 26,227,668 1.16 China Overseas Land & Investment Ltd. HKD 1,520,629 4,451,125 0.20 China Pacifi c Insurance Group Co. Ltd. ‘H’ HKD 5,646,836 23,075,769 1.02 China Unicom Hong Kong Ltd. HKD 9,654,000 14,345,828 0.64 CRCC High-Tech Equipment Corp. Ltd. ‘H’ HKD 6,426,500 2,716,744 0.12 CSPC Pharmaceutical Group Ltd. HKD 6,997,166 10,218,505 0.45 JD.com, Inc., ADR USD 458,165 18,005,885 0.80 NetEase, Inc., ADR USD 28,410 8,560,217 0.38 New Oriental Education & Technology
Group, Inc., ADR USD 145,758 10,275,939 0.46 PetroChina Co. Ltd. ‘H’ HKD 12,970,000 7,941,969 0.35 Shenzhou International Group Holdings Ltd. HKD 1,688,000 11,093,029 0.49 Sino Biopharmaceutical Ltd. HKD 6,899,000 6,098,114 0.27 TAL Education Group, ADR USD 107,668 13,022,445 0.58 Tencent Holdings Ltd. HKD 3,509,850 125,534,847 5.57 Zoomlion Heavy Industry Science and
Technology Co. Ltd. ‘H’ HKD 5,612,200 2,731,977 0.12
426,870,414 18.93
Czech RepublicKomercni banka A/S CZK 611,549 24,359,299 1.08
24,359,299 1.08
EgyptCommercial International Bank Egypt SAE EGP 3,165,841 13,970,234 0.62
13,970,234 0.62
INVESTMENT AIM
To seek to maximise total return, measured in US Dollars, through investment primarily in equity securities located in and or deriving a signifi cant portion of earnings from emerging countries.
Emerging Markets Equity Fund
Morgan Stanley Investment Funds 30 June 2017 20
The accompanying notes are an integral part of these fi nancial statements.
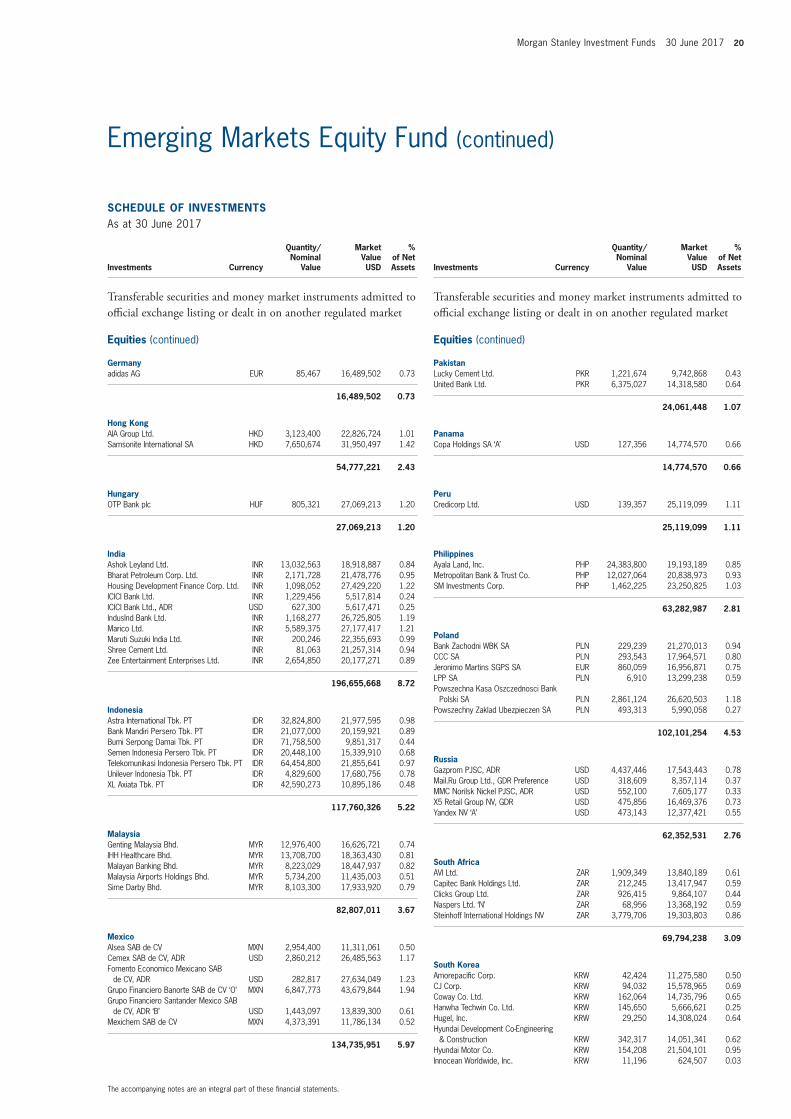
Emerging Markets Equity Fund (continued)
SCHEDULE OF INVESTMENTSAs at 30 June 2017
Investments Currency
Quantity/Nominal
Value
Market Value USD
% of Net Assets
Transferable securities and money market instruments admitted to offi cial exchange listing or dealt in on another regulated market
Equities (continued)
Germanyadidas AG EUR 85,467 16,489,502 0.73
16,489,502 0.73
Hong KongAIA Group Ltd. HKD 3,123,400 22,826,724 1.01 Samsonite International SA HKD 7,650,674 31,950,497 1.42
54,777,221 2.43
HungaryOTP Bank plc HUF 805,321 27,069,213 1.20
27,069,213 1.20
IndiaAshok Leyland Ltd. INR 13,032,563 18,918,887 0.84 Bharat Petroleum Corp. Ltd. INR 2,171,728 21,478,776 0.95 Housing Development Finance Corp. Ltd. INR 1,098,052 27,429,220 1.22 ICICI Bank Ltd. INR 1,229,456 5,517,814 0.24 ICICI Bank Ltd., ADR USD 627,300 5,617,471 0.25 IndusInd Bank Ltd. INR 1,168,277 26,725,805 1.19 Marico Ltd. INR 5,589,375 27,177,417 1.21 Maruti Suzuki India Ltd. INR 200,246 22,355,693 0.99 Shree Cement Ltd. INR 81,063 21,257,314 0.94 Zee Entertainment Enterprises Ltd. INR 2,654,850 20,177,271 0.89
196,655,668 8.72
IndonesiaAstra International Tbk. PT IDR 32,824,800 21,977,595 0.98 Bank Mandiri Persero Tbk. PT IDR 21,077,000 20,159,921 0.89 Bumi Serpong Damai Tbk. PT IDR 71,758,500 9,851,317 0.44 Semen Indonesia Persero Tbk. PT IDR 20,448,100 15,339,910 0.68 Telekomunikasi Indonesia Persero Tbk. PT IDR 64,454,800 21,855,641 0.97 Unilever Indonesia Tbk. PT IDR 4,829,600 17,680,756 0.78 XL Axiata Tbk. PT IDR 42,590,273 10,895,186 0.48
117,760,326 5.22
MalaysiaGenting Malaysia Bhd. MYR 12,976,400 16,626,721 0.74 IHH Healthcare Bhd. MYR 13,708,700 18,363,430 0.81 Malayan Banking Bhd. MYR 8,223,029 18,447,937 0.82 Malaysia Airports Holdings Bhd. MYR 5,734,200 11,435,003 0.51 Sime Darby Bhd. MYR 8,103,300 17,933,920 0.79
82,807,011 3.67
MexicoAlsea SAB de CV MXN 2,954,400 11,311,061 0.50 Cemex SAB de CV, ADR USD 2,860,212 26,485,563 1.17 Fomento Economico Mexicano SAB
de CV, ADR USD 282,817 27,634,049 1.23 Grupo Financiero Banorte SAB de CV ‘O’ MXN 6,847,773 43,679,844 1.94 Grupo Financiero Santander Mexico SAB
de CV, ADR ‘B’ USD 1,443,097 13,839,300 0.61 Mexichem SAB de CV MXN 4,373,391 11,786,134 0.52
134,735,951 5.97
SCHEDULE OF INVESTMENTSAs at 30 June 2017
Investments Currency
Quantity/Nominal
Value
Market Value USD
% of Net Assets
Transferable securities and money market instruments admitted to offi cial exchange listing or dealt in on another regulated market
Equities (continued)
PakistanLucky Cement Ltd. PKR 1,221,674 9,742,868 0.43 United Bank Ltd. PKR 6,375,027 14,318,580 0.64
24,061,448 1.07
PanamaCopa Holdings SA ‘A’ USD 127,356 14,774,570 0.66
14,774,570 0.66
PeruCredicorp Ltd. USD 139,357 25,119,099 1.11
25,119,099 1.11
PhilippinesAyala Land, Inc. PHP 24,383,800 19,193,189 0.85 Metropolitan Bank & Trust Co. PHP 12,027,064 20,838,973 0.93 SM Investments Corp. PHP 1,462,225 23,250,825 1.03
63,282,987 2.81
PolandBank Zachodni WBK SA PLN 229,239 21,270,013 0.94 CCC SA PLN 293,543 17,964,571 0.80 Jeronimo Martins SGPS SA EUR 860,059 16,956,871 0.75 LPP SA PLN 6,910 13,299,238 0.59 Powszechna Kasa Oszczednosci Bank
Polski SA PLN 2,861,124 26,620,503 1.18 Powszechny Zaklad Ubezpieczen SA PLN 493,313 5,990,058 0.27
102,101,254 4.53
RussiaGazprom PJSC, ADR USD 4,437,446 17,543,443 0.78 Mail.Ru Group Ltd., GDR Preference USD 318,609 8,357,114 0.37 MMC Norilsk Nickel PJSC, ADR USD 552,100 7,605,177 0.33 X5 Retail Group NV, GDR USD 475,856 16,469,376 0.73 Yandex NV ‘A’ USD 473,143 12,377,421 0.55
62,352,531 2.76
South AfricaAVI Ltd. ZAR 1,909,349 13,840,189 0.61 Capitec Bank Holdings Ltd. ZAR 212,245 13,417,947 0.59 Clicks Group Ltd. ZAR 926,415 9,864,107 0.44 Naspers Ltd. ‘N’ ZAR 68,956 13,368,192 0.59 Steinhoff International Holdings NV ZAR 3,779,706 19,303,803 0.86
69,794,238 3.09
South KoreaAmorepacifi c Corp. KRW 42,424 11,275,580 0.50 CJ Corp. KRW 94,032 15,578,965 0.69 Coway Co. Ltd. KRW 162,064 14,735,796 0.65 Hanwha Techwin Co. Ltd. KRW 145,650 5,666,621 0.25 Hugel, Inc. KRW 29,250 14,308,024 0.64 Hyundai Development Co-Engineering
& Construction KRW 342,317 14,051,341 0.62 Hyundai Motor Co. KRW 154,208 21,504,101 0.95 Innocean Worldwide, Inc. KRW 11,196 624,507 0.03
21 Morgan Stanley Investment Funds 30 June 2017
The accompanying notes are an integral part of these fi nancial statements.
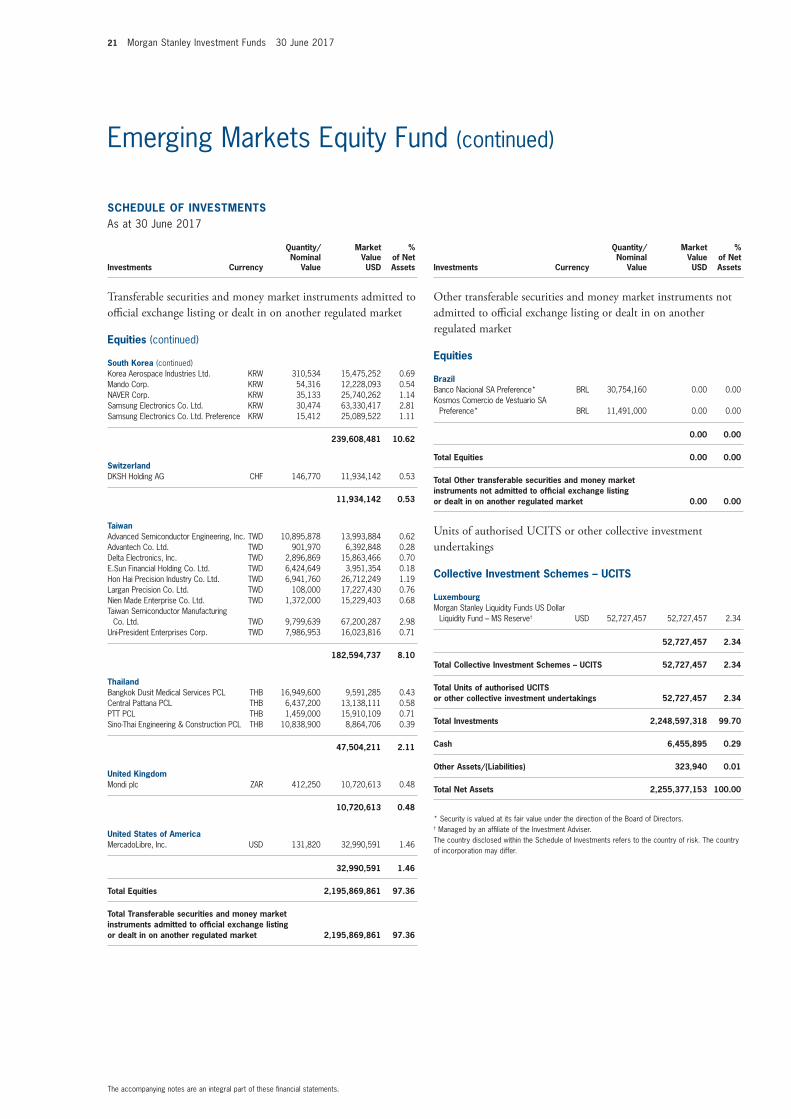
Emerging Markets Equity Fund (continued)
SCHEDULE OF INVESTMENTSAs at 30 June 2017
Investments Currency
Quantity/Nominal
Value
Market Value USD
% of Net Assets
Transferable securities and money market instruments admitted to offi cial exchange listing or dealt in on another regulated market
Equities (continued)
South Korea (continued)Korea Aerospace Industries Ltd. KRW 310,534 15,475,252 0.69 Mando Corp. KRW 54,316 12,228,093 0.54 NAVER Corp. KRW 35,133 25,740,262 1.14 Samsung Electronics Co. Ltd. KRW 30,474 63,330,417 2.81 Samsung Electronics Co. Ltd. Preference KRW 15,412 25,089,522 1.11
239,608,481 10.62
SwitzerlandDKSH Holding AG CHF 146,770 11,934,142 0.53
11,934,142 0.53
TaiwanAdvanced Semiconductor Engineering, Inc. TWD 10,895,878 13,993,884 0.62 Advantech Co. Ltd. TWD 901,970 6,392,848 0.28 Delta Electronics, Inc. TWD 2,896,869 15,863,466 0.70 E.Sun Financial Holding Co. Ltd. TWD 6,424,649 3,951,354 0.18 Hon Hai Precision Industry Co. Ltd. TWD 6,941,760 26,712,249 1.19 Largan Precision Co. Ltd. TWD 108,000 17,227,430 0.76 Nien Made Enterprise Co. Ltd. TWD 1,372,000 15,229,403 0.68 Taiwan Semiconductor Manufacturing
Co. Ltd. TWD 9,799,639 67,200,287 2.98 Uni-President Enterprises Corp. TWD 7,986,953 16,023,816 0.71
182,594,737 8.10
ThailandBangkok Dusit Medical Services PCL THB 16,949,600 9,591,285 0.43 Central Pattana PCL THB 6,437,200 13,138,111 0.58 PTT PCL THB 1,459,000 15,910,109 0.71 Sino-Thai Engineering & Construction PCL THB 10,838,900 8,864,706 0.39
47,504,211 2.11
United KingdomMondi plc ZAR 412,250 10,720,613 0.48
10,720,613 0.48
United States of AmericaMercadoLibre, Inc. USD 131,820 32,990,591 1.46
32,990,591 1.46
Total Equities 2,195,869,861 97.36
Total Transferable securities and money market instruments admitted to offi cial exchange listing or dealt in on another regulated market 2,195,869,861 97.36
SCHEDULE OF INVESTMENTSAs at 30 June 2017
Investments Currency
Quantity/Nominal
Value
Market Value USD
% of Net Assets
Other transferable securities and money market instruments not admitted to offi cial exchange listing or dealt in on another regulated market
Equities
BrazilBanco Nacional SA Preference* BRL 30,754,160 0.00 0.00 Kosmos Comercio de Vestuario SA
Preference* BRL 11,491,000 0.00 0.00
0.00 0.00
Total Equities 0.00 0.00
Total Other transferable securities and money market instruments not admitted to offi cial exchange listing or dealt in on another regulated market 0.00 0.00
Units of authorised UCITS or other collective investment undertakings
Collective Investment Schemes – UCITS
LuxembourgMorgan Stanley Liquidity Funds US Dollar
Liquidity Fund – MS Reserve† USD 52,727,457 52,727,457 2.34
52,727,457 2.34
Total Collective Investment Schemes – UCITS 52,727,457 2.34
Total Units of authorised UCITS or other collective investment undertakings 52,727,457 2.34
Total Investments 2,248,597,318 99.70
Cash 6,455,895 0.29
Other Assets/(Liabilities) 323,940 0.01
Total Net Assets 2,255,377,153 100.00
* Security is valued at its fair value under the direction of the Board of Directors.† Managed by an affi liate of the Investment Adviser.The country disclosed within the Schedule of Investments refers to the country of risk. The country of incorporation may differ.
Morgan Stanley Investment Funds 30 June 2017 22
The accompanying notes are an integral part of these fi nancial statements.
Please refer to the full prospectus for the Fund’s investment objective and policy.
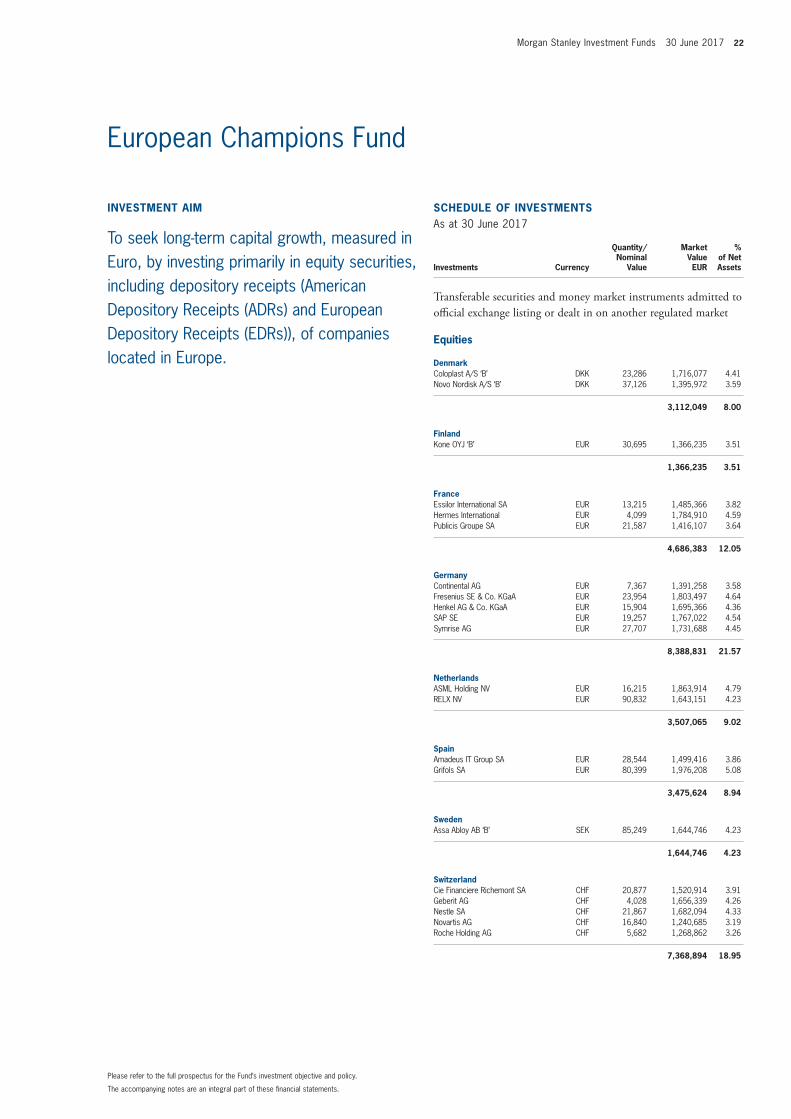
INVESTMENT AIM
To seek long-term capital growth, measured in Euro, by investing primarily in equity securities, including depository receipts (American Depository Receipts (ADRs) and European Depository Receipts (EDRs)), of companies located in Europe.
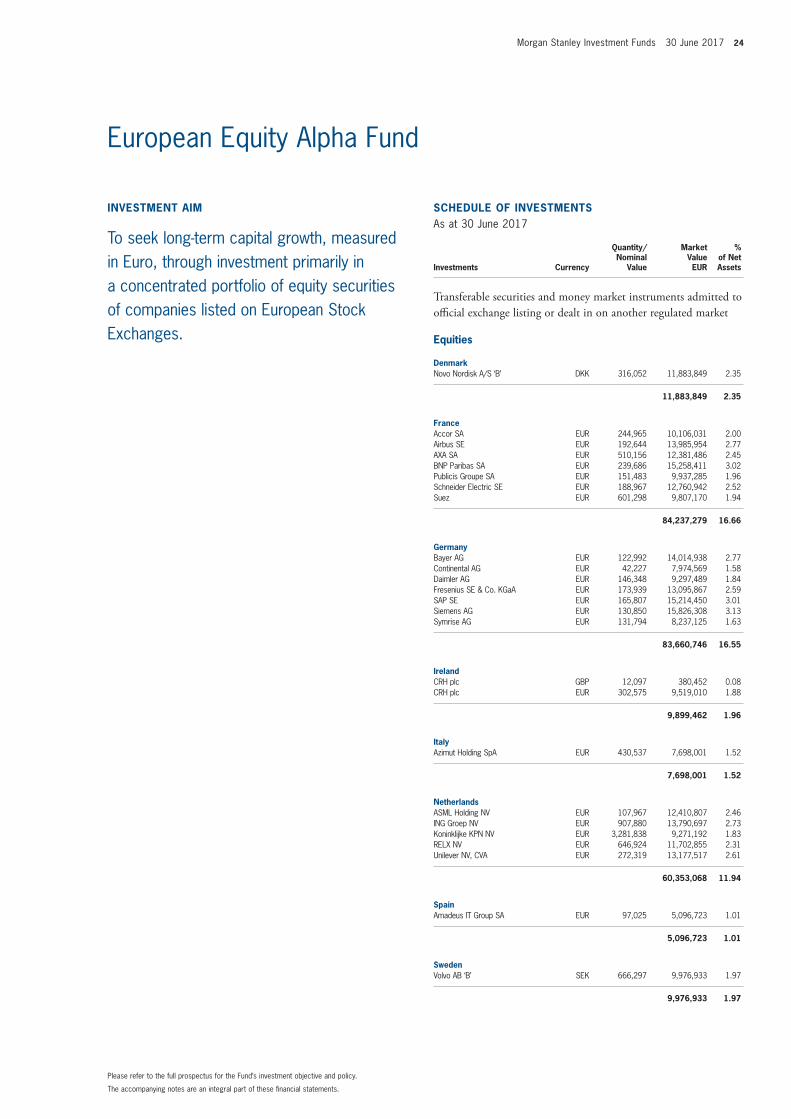
SCHEDULE OF INVESTMENTSAs at 30 June 2017
Investments Currency
Quantity/Nominal
Value
Market Value EUR
% of Net Assets
Transferable securities and money market instruments admitted to offi cial exchange listing or dealt in on another regulated market
Equities
DenmarkColoplast A/S ‘B’ DKK 23,286 1,716,077 4.41 Novo Nordisk A/S ‘B’ DKK 37,126 1,395,972 3.59
3,112,049 8.00
FinlandKone OYJ ‘B’ EUR 30,695 1,366,235 3.51
1,366,235 3.51
FranceEssilor International SA EUR 13,215 1,485,366 3.82 Hermes International EUR 4,099 1,784,910 4.59 Publicis Groupe SA EUR 21,587 1,416,107 3.64
4,686,383 12.05
GermanyContinental AG EUR 7,367 1,391,258 3.58 Fresenius SE & Co. KGaA EUR 23,954 1,803,497 4.64 Henkel AG & Co. KGaA EUR 15,904 1,695,366 4.36 SAP SE EUR 19,257 1,767,022 4.54 Symrise AG EUR 27,707 1,731,688 4.45
8,388,831 21.57
NetherlandsASML Holding NV EUR 16,215 1,863,914 4.79 RELX NV EUR 90,832 1,643,151 4.23
3,507,065 9.02
SpainAmadeus IT Group SA EUR 28,544 1,499,416 3.86 Grifols SA EUR 80,399 1,976,208 5.08
3,475,624 8.94
SwedenAssa Abloy AB ‘B’ SEK 85,249 1,644,746 4.23
1,644,746 4.23
SwitzerlandCie Financiere Richemont SA CHF 20,877 1,520,914 3.91 Geberit AG CHF 4,028 1,656,339 4.26 Nestle SA CHF 21,867 1,682,094 4.33 Novartis AG CHF 16,840 1,240,685 3.19 Roche Holding AG CHF 5,682 1,268,862 3.26
7,368,894 18.95
European Champions Fund
23 Morgan Stanley Investment Funds 30 June 2017
The accompanying notes are an integral part of these fi nancial statements.
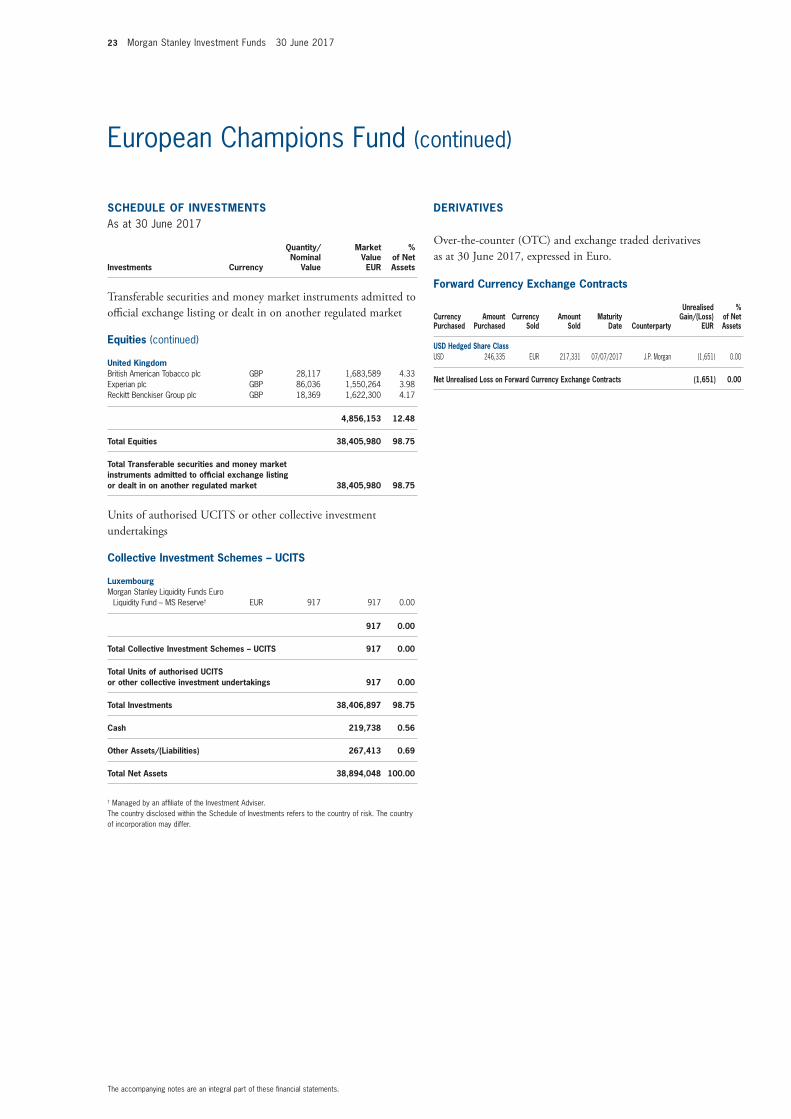
European Champions Fund (continued)
SCHEDULE OF INVESTMENTSAs at 30 June 2017
Investments Currency
Quantity/Nominal
Value
Market Value EUR
% of Net Assets
Transferable securities and money market instruments admitted to offi cial exchange listing or dealt in on another regulated market
Equities (continued)
United KingdomBritish American Tobacco plc GBP 28,117 1,683,589 4.33 Experian plc GBP 86,036 1,550,264 3.98 Reckitt Benckiser Group plc GBP 18,369 1,622,300 4.17
4,856,153 12.48
Total Equities 38,405,980 98.75
Total Transferable securities and money market instruments admitted to offi cial exchange listing or dealt in on another regulated market 38,405,980 98.75
Units of authorised UCITS or other collective investment undertakings
Collective Investment Schemes – UCITS
LuxembourgMorgan Stanley Liquidity Funds Euro
Liquidity Fund – MS Reserve† EUR 917 917 0.00
917 0.00
Total Collective Investment Schemes – UCITS 917 0.00
Total Units of authorised UCITS or other collective investment undertakings 917 0.00
Total Investments 38,406,897 98.75
Cash 219,738 0.56
Other Assets/(Liabilities) 267,413 0.69
Total Net Assets 38,894,048 100.00
† Managed by an affi liate of the Investment Adviser.The country disclosed within the Schedule of Investments refers to the country of risk. The country of incorporation may differ.
Forward Currency Exchange Contracts
Currency Purchased
Amount Purchased
Currency Sold
Amount Sold
Maturity Date Counterparty
Unrealised Gain/(Loss)
EUR
% of Net Assets
USD Hedged Share ClassUSD 246,335 EUR 217,331 07/07/2017 J.P. Morgan (1,651) 0.00
Net Unrealised Loss on Forward Currency Exchange Contracts (1,651) 0.00
DERIVATIVES
Over-the-counter (OTC) and exchange traded derivatives as at 30 June 2017, expressed in Euro.
Morgan Stanley Investment Funds 30 June 2017 24
The accompanying notes are an integral part of these fi nancial statements.
Please refer to the full prospectus for the Fund’s investment objective and policy.
SCHEDULE OF INVESTMENTSAs at 30 June 2017
Investments Currency
Quantity/Nominal
Value
Market Value EUR
% of Net Assets
Transferable securities and money market instruments admitted to offi cial exchange listing or dealt in on another regulated market
Equities
DenmarkNovo Nordisk A/S ‘B’ DKK 316,052 11,883,849 2.35
11,883,849 2.35
FranceAccor SA EUR 244,965 10,106,031 2.00 Airbus SE EUR 192,644 13,985,954 2.77 AXA SA EUR 510,156 12,381,486 2.45 BNP Paribas SA EUR 239,686 15,258,411 3.02 Publicis Groupe SA EUR 151,483 9,937,285 1.96 Schneider Electric SE EUR 188,967 12,760,942 2.52 Suez EUR 601,298 9,807,170 1.94
84,237,279 16.66
GermanyBayer AG EUR 122,992 14,014,938 2.77 Continental AG EUR 42,227 7,974,569 1.58 Daimler AG EUR 146,348 9,297,489 1.84 Fresenius SE & Co. KGaA EUR 173,939 13,095,867 2.59 SAP SE EUR 165,807 15,214,450 3.01 Siemens AG EUR 130,850 15,826,308 3.13 Symrise AG EUR 131,794 8,237,125 1.63
83,660,746 16.55
IrelandCRH plc GBP 12,097 380,452 0.08 CRH plc EUR 302,575 9,519,010 1.88
9,899,462 1.96
ItalyAzimut Holding SpA EUR 430,537 7,698,001 1.52
7,698,001 1.52
NetherlandsASML Holding NV EUR 107,967 12,410,807 2.46 ING Groep NV EUR 907,880 13,790,697 2.73 Koninklijke KPN NV EUR 3,281,838 9,271,192 1.83 RELX NV EUR 646,924 11,702,855 2.31 Unilever NV, CVA EUR 272,319 13,177,517 2.61
60,353,068 11.94
SpainAmadeus IT Group SA EUR 97,025 5,096,723 1.01
5,096,723 1.01
SwedenVolvo AB ‘B’ SEK 666,297 9,976,933 1.97
9,976,933 1.97
INVESTMENT AIM
To seek long-term capital growth, measured in Euro, through investment primarily in a concentrated portfolio of equity securities of companies listed on European Stock Exchanges.
European Equity Alpha Fund
25 Morgan Stanley Investment Funds 30 June 2017
The accompanying notes are an integral part of these fi nancial statements.
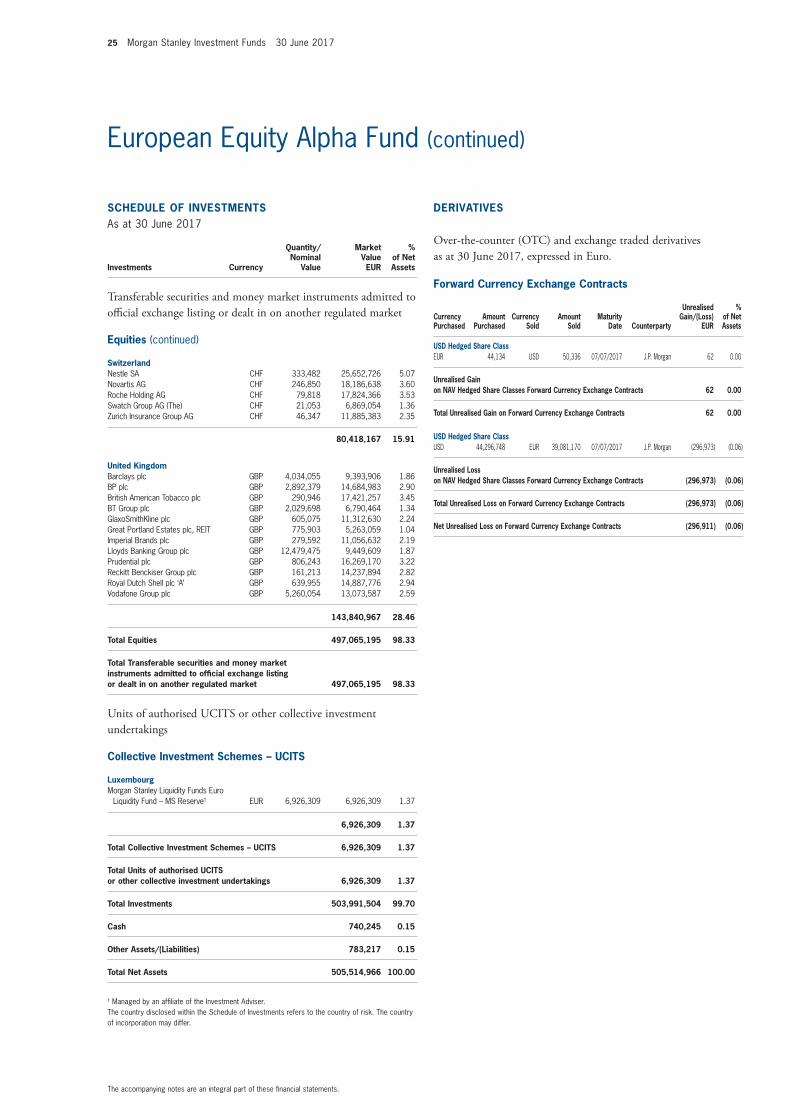
European Equity Alpha Fund (continued)
SCHEDULE OF INVESTMENTSAs at 30 June 2017
Investments Currency
Quantity/Nominal
Value
Market Value EUR
% of Net Assets
Transferable securities and money market instruments admitted to offi cial exchange listing or dealt in on another regulated market
Equities (continued)
SwitzerlandNestle SA CHF 333,482 25,652,726 5.07 Novartis AG CHF 246,850 18,186,638 3.60 Roche Holding AG CHF 79,818 17,824,366 3.53 Swatch Group AG (The) CHF 21,053 6,869,054 1.36 Zurich Insurance Group AG CHF 46,347 11,885,383 2.35
80,418,167 15.91
United KingdomBarclays plc GBP 4,034,055 9,393,906 1.86 BP plc GBP 2,892,379 14,684,983 2.90 British American Tobacco plc GBP 290,946 17,421,257 3.45 BT Group plc GBP 2,029,698 6,790,464 1.34 GlaxoSmithKline plc GBP 605,075 11,312,630 2.24 Great Portland Estates plc, REIT GBP 775,903 5,263,059 1.04 Imperial Brands plc GBP 279,592 11,056,632 2.19 Lloyds Banking Group plc GBP 12,479,475 9,449,609 1.87 Prudential plc GBP 806,243 16,269,170 3.22 Reckitt Benckiser Group plc GBP 161,213 14,237,894 2.82 Royal Dutch Shell plc ‘A’ GBP 639,955 14,887,776 2.94 Vodafone Group plc GBP 5,260,054 13,073,587 2.59
143,840,967 28.46
Total Equities 497,065,195 98.33
Total Transferable securities and money market instruments admitted to offi cial exchange listing or dealt in on another regulated market 497,065,195 98.33
Units of authorised UCITS or other collective investment undertakings
Collective Investment Schemes – UCITS
LuxembourgMorgan Stanley Liquidity Funds Euro
Liquidity Fund – MS Reserve† EUR 6,926,309 6,926,309 1.37
6,926,309 1.37
Total Collective Investment Schemes – UCITS 6,926,309 1.37
Total Units of authorised UCITS or other collective investment undertakings 6,926,309 1.37
Total Investments 503,991,504 99.70
Cash 740,245 0.15
Other Assets/(Liabilities) 783,217 0.15
Total Net Assets 505,514,966 100.00
† Managed by an affi liate of the Investment Adviser.The country disclosed within the Schedule of Investments refers to the country of risk. The country of incorporation may differ.
Forward Currency Exchange Contracts
Currency Purchased
Amount Purchased
Currency Sold
Amount Sold
Maturity Date Counterparty
Unrealised Gain/(Loss)
EUR
% of Net Assets
USD Hedged Share ClassEUR 44,134 USD 50,336 07/07/2017 J.P. Morgan 62 0.00
Unrealised Gain on NAV Hedged Share Classes Forward Currency Exchange Contracts 62 0.00
Total Unrealised Gain on Forward Currency Exchange Contracts 62 0.00
USD Hedged Share ClassUSD 44,296,748 EUR 39,081,170 07/07/2017 J.P. Morgan (296,973) (0.06)
Unrealised Loss on NAV Hedged Share Classes Forward Currency Exchange Contracts (296,973) (0.06)
Total Unrealised Loss on Forward Currency Exchange Contracts (296,973) (0.06)
Net Unrealised Loss on Forward Currency Exchange Contracts (296,911) (0.06)
DERIVATIVES
Over-the-counter (OTC) and exchange traded derivatives as at 30 June 2017, expressed in Euro.
Morgan Stanley Investment Funds 30 June 2017 26
The accompanying notes are an integral part of these fi nancial statements.
Please refer to the full prospectus for the Fund’s investment objective and policy.
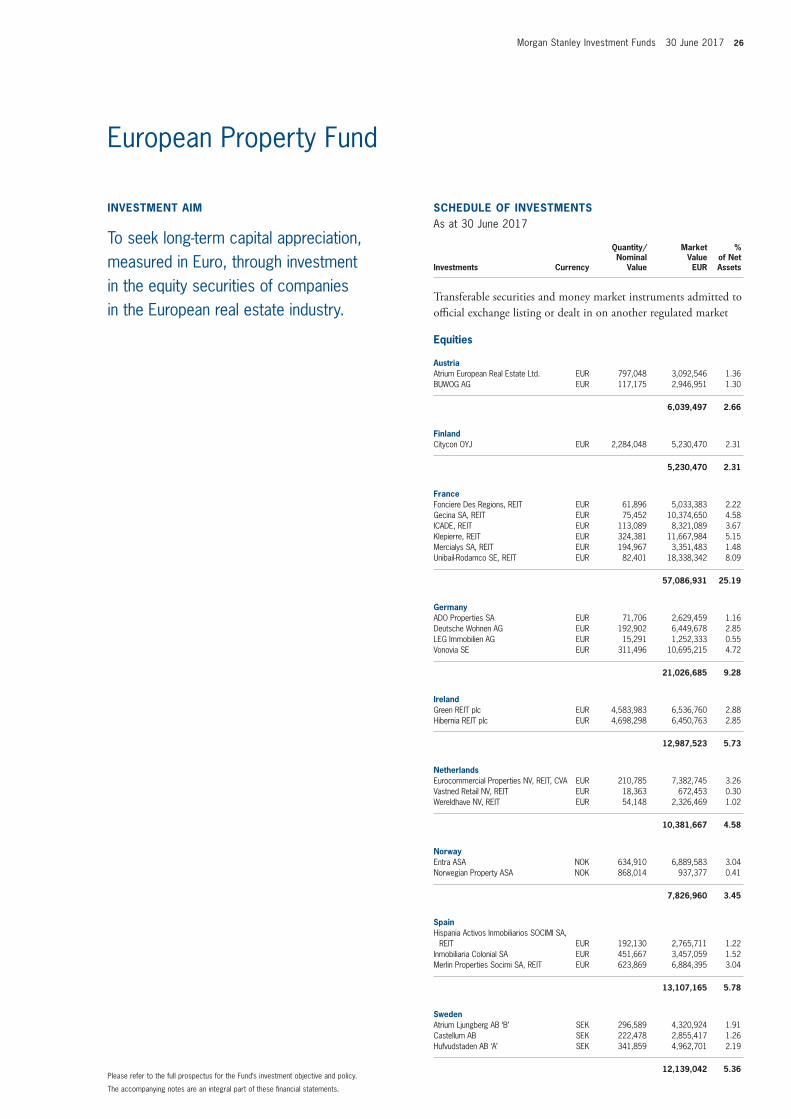
INVESTMENT AIM
To seek long-term capital appreciation, measured in Euro, through investment in the equity securities of companies in the European real estate industry.
SCHEDULE OF INVESTMENTSAs at 30 June 2017
Investments Currency
Quantity/Nominal
Value
Market Value EUR
% of Net Assets
Transferable securities and money market instruments admitted to offi cial exchange listing or dealt in on another regulated market
Equities
AustriaAtrium European Real Estate Ltd. EUR 797,048 3,092,546 1.36 BUWOG AG EUR 117,175 2,946,951 1.30
6,039,497 2.66
FinlandCitycon OYJ EUR 2,284,048 5,230,470 2.31
5,230,470 2.31
FranceFonciere Des Regions, REIT EUR 61,896 5,033,383 2.22 Gecina SA, REIT EUR 75,452 10,374,650 4.58 ICADE, REIT EUR 113,089 8,321,089 3.67 Klepierre, REIT EUR 324,381 11,667,984 5.15 Mercialys SA, REIT EUR 194,967 3,351,483 1.48 Unibail-Rodamco SE, REIT EUR 82,401 18,338,342 8.09
57,086,931 25.19
GermanyADO Properties SA EUR 71,706 2,629,459 1.16 Deutsche Wohnen AG EUR 192,902 6,449,678 2.85 LEG Immobilien AG EUR 15,291 1,252,333 0.55 Vonovia SE EUR 311,496 10,695,215 4.72
21,026,685 9.28
IrelandGreen REIT plc EUR 4,583,983 6,536,760 2.88 Hibernia REIT plc EUR 4,698,298 6,450,763 2.85
12,987,523 5.73
NetherlandsEurocommercial Properties NV, REIT, CVA EUR 210,785 7,382,745 3.26 Vastned Retail NV, REIT EUR 18,363 672,453 0.30 Wereldhave NV, REIT EUR 54,148 2,326,469 1.02
10,381,667 4.58
NorwayEntra ASA NOK 634,910 6,889,583 3.04 Norwegian Property ASA NOK 868,014 937,377 0.41
7,826,960 3.45
SpainHispania Activos Inmobiliarios SOCIMI SA,
REIT EUR 192,130 2,765,711 1.22 Inmobiliaria Colonial SA EUR 451,667 3,457,059 1.52 Merlin Properties Socimi SA, REIT EUR 623,869 6,884,395 3.04
13,107,165 5.78
SwedenAtrium Ljungberg AB ‘B’ SEK 296,589 4,320,924 1.91 Castellum AB SEK 222,478 2,855,417 1.26 Hufvudstaden AB ‘A’ SEK 341,859 4,962,701 2.19
12,139,042 5.36
European Property Fund
27 Morgan Stanley Investment Funds 30 June 2017
The accompanying notes are an integral part of these fi nancial statements.
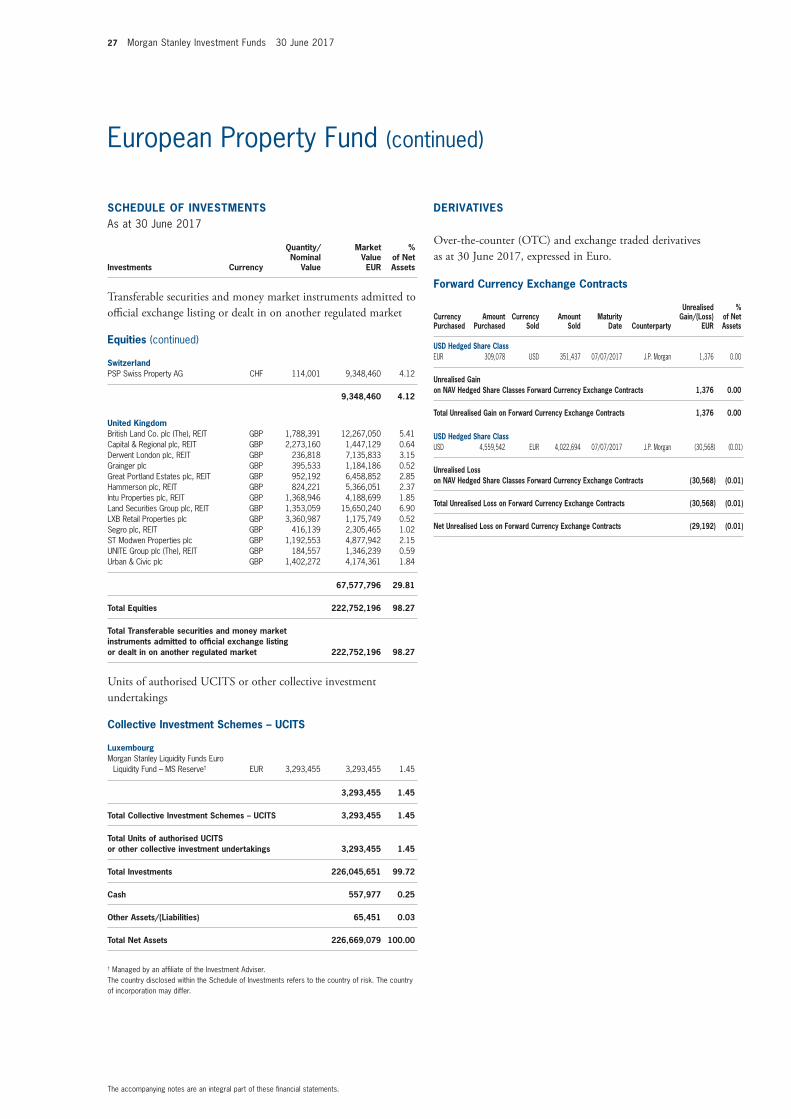
European Property Fund (continued)
SCHEDULE OF INVESTMENTSAs at 30 June 2017
Investments Currency
Quantity/Nominal
Value
Market Value EUR
% of Net Assets
Transferable securities and money market instruments admitted to offi cial exchange listing or dealt in on another regulated market
Equities (continued)
SwitzerlandPSP Swiss Property AG CHF 114,001 9,348,460 4.12
9,348,460 4.12
United KingdomBritish Land Co. plc (The), REIT GBP 1,788,391 12,267,050 5.41 Capital & Regional plc, REIT GBP 2,273,160 1,447,129 0.64 Derwent London plc, REIT GBP 236,818 7,135,833 3.15 Grainger plc GBP 395,533 1,184,186 0.52 Great Portland Estates plc, REIT GBP 952,192 6,458,852 2.85 Hammerson plc, REIT GBP 824,221 5,366,051 2.37 Intu Properties plc, REIT GBP 1,368,946 4,188,699 1.85 Land Securities Group plc, REIT GBP 1,353,059 15,650,240 6.90 LXB Retail Properties plc GBP 3,360,987 1,175,749 0.52 Segro plc, REIT GBP 416,139 2,305,465 1.02 ST Modwen Properties plc GBP 1,192,553 4,877,942 2.15 UNITE Group plc (The), REIT GBP 184,557 1,346,239 0.59 Urban & Civic plc GBP 1,402,272 4,174,361 1.84
67,577,796 29.81
Total Equities 222,752,196 98.27
Total Transferable securities and money market instruments admitted to offi cial exchange listing or dealt in on another regulated market 222,752,196 98.27
Units of authorised UCITS or other collective investment undertakings
Collective Investment Schemes – UCITS
LuxembourgMorgan Stanley Liquidity Funds Euro
Liquidity Fund – MS Reserve† EUR 3,293,455 3,293,455 1.45
3,293,455 1.45
Total Collective Investment Schemes – UCITS 3,293,455 1.45
Total Units of authorised UCITS or other collective investment undertakings 3,293,455 1.45
Total Investments 226,045,651 99.72
Cash 557,977 0.25
Other Assets/(Liabilities) 65,451 0.03
Total Net Assets 226,669,079 100.00
† Managed by an affi liate of the Investment Adviser.The country disclosed within the Schedule of Investments refers to the country of risk. The country of incorporation may differ.
Forward Currency Exchange Contracts
Currency Purchased
Amount Purchased
Currency Sold
Amount Sold
Maturity Date Counterparty
Unrealised Gain/(Loss)
EUR
% of Net Assets
USD Hedged Share ClassEUR 309,078 USD 351,437 07/07/2017 J.P. Morgan 1,376 0.00
Unrealised Gain on NAV Hedged Share Classes Forward Currency Exchange Contracts 1,376 0.00
Total Unrealised Gain on Forward Currency Exchange Contracts 1,376 0.00
USD Hedged Share ClassUSD 4,559,542 EUR 4,022,694 07/07/2017 J.P. Morgan (30,568) (0.01)
Unrealised Loss on NAV Hedged Share Classes Forward Currency Exchange Contracts (30,568) (0.01)
Total Unrealised Loss on Forward Currency Exchange Contracts (30,568) (0.01)
Net Unrealised Loss on Forward Currency Exchange Contracts (29,192) (0.01)
DERIVATIVES
Over-the-counter (OTC) and exchange traded derivatives as at 30 June 2017, expressed in Euro.
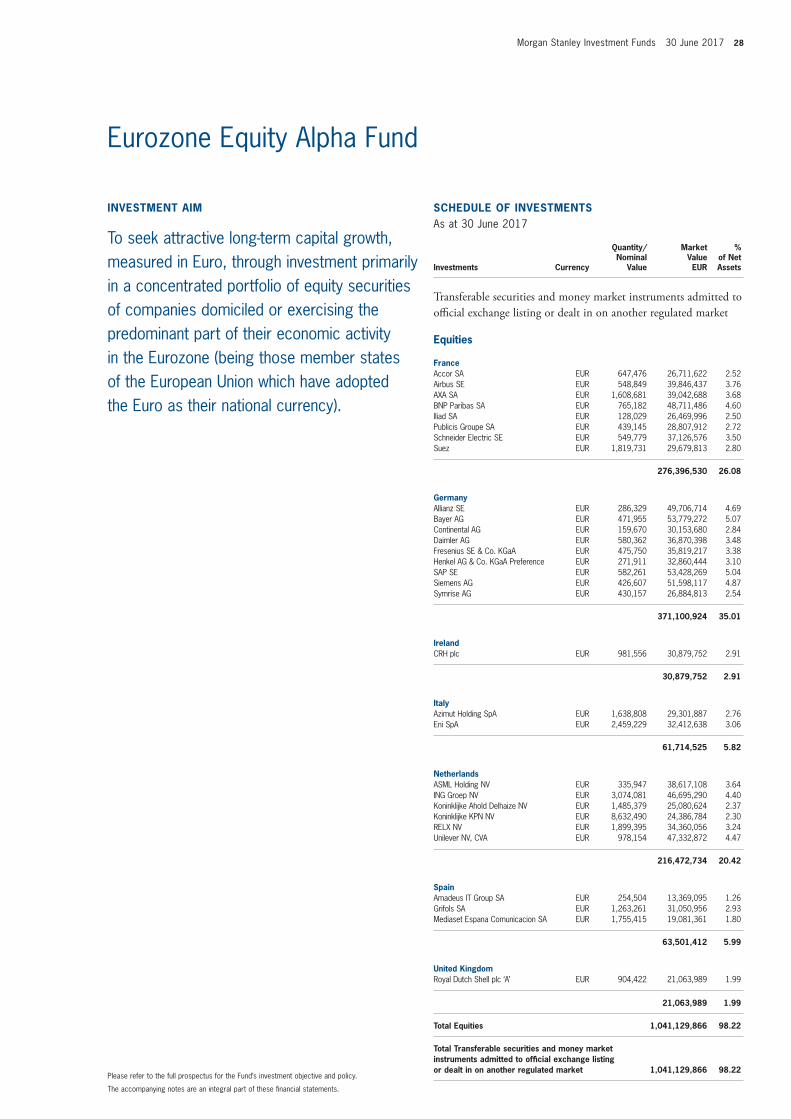
Morgan Stanley Investment Funds 30 June 2017 28
The accompanying notes are an integral part of these fi nancial statements.
Please refer to the full prospectus for the Fund’s investment objective and policy.
INVESTMENT AIM
To seek attractive long-term capital growth, measured in Euro, through investment primarily in a concentrated portfolio of equity securities of companies domiciled or exercising the predominant part of their economic activity in the Eurozone (being those member states of the European Union which have adopted the Euro as their national currency).
SCHEDULE OF INVESTMENTSAs at 30 June 2017
Investments Currency
Quantity/Nominal
Value
Market Value EUR
% of Net Assets
Transferable securities and money market instruments admitted to offi cial exchange listing or dealt in on another regulated market
Equities
FranceAccor SA EUR 647,476 26,711,622 2.52 Airbus SE EUR 548,849 39,846,437 3.76 AXA SA EUR 1,608,681 39,042,688 3.68 BNP Paribas SA EUR 765,182 48,711,486 4.60 Iliad SA EUR 128,029 26,469,996 2.50 Publicis Groupe SA EUR 439,145 28,807,912 2.72 Schneider Electric SE EUR 549,779 37,126,576 3.50 Suez EUR 1,819,731 29,679,813 2.80
276,396,530 26.08
GermanyAllianz SE EUR 286,329 49,706,714 4.69 Bayer AG EUR 471,955 53,779,272 5.07 Continental AG EUR 159,670 30,153,680 2.84 Daimler AG EUR 580,362 36,870,398 3.48 Fresenius SE & Co. KGaA EUR 475,750 35,819,217 3.38 Henkel AG & Co. KGaA Preference EUR 271,911 32,860,444 3.10 SAP SE EUR 582,261 53,428,269 5.04 Siemens AG EUR 426,607 51,598,117 4.87 Symrise AG EUR 430,157 26,884,813 2.54
371,100,924 35.01
IrelandCRH plc EUR 981,556 30,879,752 2.91
30,879,752 2.91
ItalyAzimut Holding SpA EUR 1,638,808 29,301,887 2.76 Eni SpA EUR 2,459,229 32,412,638 3.06
61,714,525 5.82
NetherlandsASML Holding NV EUR 335,947 38,617,108 3.64 ING Groep NV EUR 3,074,081 46,695,290 4.40 Koninklijke Ahold Delhaize NV EUR 1,485,379 25,080,624 2.37 Koninklijke KPN NV EUR 8,632,490 24,386,784 2.30 RELX NV EUR 1,899,395 34,360,056 3.24 Unilever NV, CVA EUR 978,154 47,332,872 4.47
216,472,734 20.42
SpainAmadeus IT Group SA EUR 254,504 13,369,095 1.26 Grifols SA EUR 1,263,261 31,050,956 2.93 Mediaset Espana Comunicacion SA EUR 1,755,415 19,081,361 1.80
63,501,412 5.99
United KingdomRoyal Dutch Shell plc ‘A’ EUR 904,422 21,063,989 1.99
21,063,989 1.99
Total Equities 1,041,129,866 98.22
Total Transferable securities and money market instruments admitted to offi cial exchange listing or dealt in on another regulated market 1,041,129,866 98.22
Eurozone Equity Alpha Fund
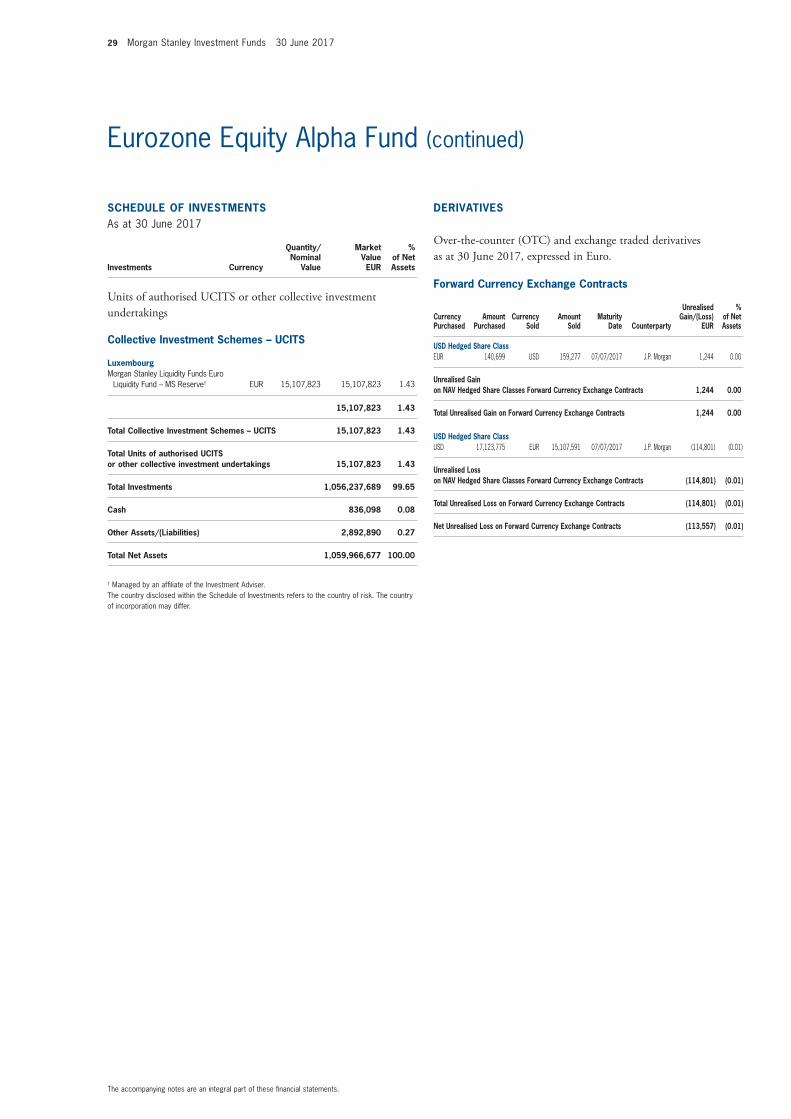
29 Morgan Stanley Investment Funds 30 June 2017
The accompanying notes are an integral part of these fi nancial statements.
Eurozone Equity Alpha Fund (continued)
SCHEDULE OF INVESTMENTSAs at 30 June 2017
Investments Currency
Quantity/Nominal
Value
Market Value EUR
% of Net Assets
Units of authorised UCITS or other collective investment undertakings
Collective Investment Schemes – UCITS
LuxembourgMorgan Stanley Liquidity Funds Euro
Liquidity Fund – MS Reserve† EUR 15,107,823 15,107,823 1.43
15,107,823 1.43
Total Collective Investment Schemes – UCITS 15,107,823 1.43
Total Units of authorised UCITS or other collective investment undertakings 15,107,823 1.43
Total Investments 1,056,237,689 99.65
Cash 836,098 0.08
Other Assets/(Liabilities) 2,892,890 0.27
Total Net Assets 1,059,966,677 100.00
† Managed by an affi liate of the Investment Adviser.The country disclosed within the Schedule of Investments refers to the country of risk. The country of incorporation may differ.
Forward Currency Exchange Contracts
Currency Purchased
Amount Purchased
Currency Sold
Amount Sold
Maturity Date Counterparty
Unrealised Gain/(Loss)
EUR
% of Net Assets
USD Hedged Share ClassEUR 140,699 USD 159,277 07/07/2017 J.P. Morgan 1,244 0.00
Unrealised Gain on NAV Hedged Share Classes Forward Currency Exchange Contracts 1,244 0.00
Total Unrealised Gain on Forward Currency Exchange Contracts 1,244 0.00
USD Hedged Share ClassUSD 17,123,775 EUR 15,107,591 07/07/2017 J.P. Morgan (114,801) (0.01)
Unrealised Loss on NAV Hedged Share Classes Forward Currency Exchange Contracts (114,801) (0.01)
Total Unrealised Loss on Forward Currency Exchange Contracts (114,801) (0.01)
Net Unrealised Loss on Forward Currency Exchange Contracts (113,557) (0.01)
DERIVATIVES
Over-the-counter (OTC) and exchange traded derivatives as at 30 June 2017, expressed in Euro.
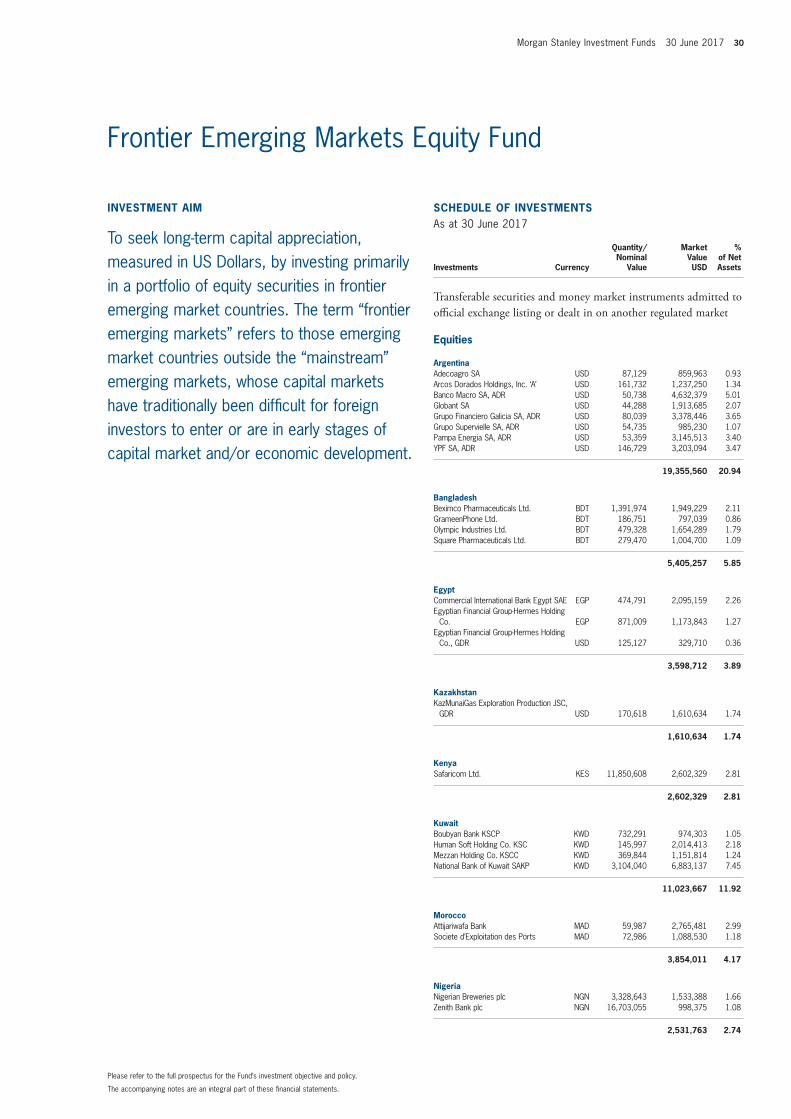
Morgan Stanley Investment Funds 30 June 2017 30
The accompanying notes are an integral part of these fi nancial statements.
Please refer to the full prospectus for the Fund’s investment objective and policy.
INVESTMENT AIM
To seek long-term capital appreciation, measured in US Dollars, by investing primarily in a portfolio of equity securities in frontier emerging market countries. The term “frontier emerging markets” refers to those emerging market countries outside the “mainstream” emerging markets, whose capital markets have traditionally been diffi cult for foreign investors to enter or are in early stages of capital market and/or economic development.
SCHEDULE OF INVESTMENTSAs at 30 June 2017
Investments Currency
Quantity/Nominal
Value
Market Value USD
% of Net Assets
Transferable securities and money market instruments admitted to offi cial exchange listing or dealt in on another regulated market
Equities
ArgentinaAdecoagro SA USD 87,129 859,963 0.93 Arcos Dorados Holdings, Inc. ‘A’ USD 161,732 1,237,250 1.34 Banco Macro SA, ADR USD 50,738 4,632,379 5.01 Globant SA USD 44,288 1,913,685 2.07 Grupo Financiero Galicia SA, ADR USD 80,039 3,378,446 3.65 Grupo Supervielle SA, ADR USD 54,735 985,230 1.07 Pampa Energia SA, ADR USD 53,359 3,145,513 3.40 YPF SA, ADR USD 146,729 3,203,094 3.47
19,355,560 20.94
BangladeshBeximco Pharmaceuticals Ltd. BDT 1,391,974 1,949,229 2.11 GrameenPhone Ltd. BDT 186,751 797,039 0.86 Olympic Industries Ltd. BDT 479,328 1,654,289 1.79 Square Pharmaceuticals Ltd. BDT 279,470 1,004,700 1.09
5,405,257 5.85
EgyptCommercial International Bank Egypt SAE EGP 474,791 2,095,159 2.26 Egyptian Financial Group-Hermes Holding
Co. EGP 871,009 1,173,843 1.27 Egyptian Financial Group-Hermes Holding
Co., GDR USD 125,127 329,710 0.36
3,598,712 3.89
KazakhstanKazMunaiGas Exploration Production JSC,
GDR USD 170,618 1,610,634 1.74
1,610,634 1.74
KenyaSafaricom Ltd. KES 11,850,608 2,602,329 2.81
2,602,329 2.81
KuwaitBoubyan Bank KSCP KWD 732,291 974,303 1.05 Human Soft Holding Co. KSC KWD 145,997 2,014,413 2.18 Mezzan Holding Co. KSCC KWD 369,844 1,151,814 1.24 National Bank of Kuwait SAKP KWD 3,104,040 6,883,137 7.45
11,023,667 11.92
MoroccoAttijariwafa Bank MAD 59,987 2,765,481 2.99 Societe d’Exploitation des Ports MAD 72,986 1,088,530 1.18
3,854,011 4.17
NigeriaNigerian Breweries plc NGN 3,328,643 1,533,388 1.66 Zenith Bank plc NGN 16,703,055 998,375 1.08
2,531,763 2.74
Frontier Emerging Markets Equity Fund
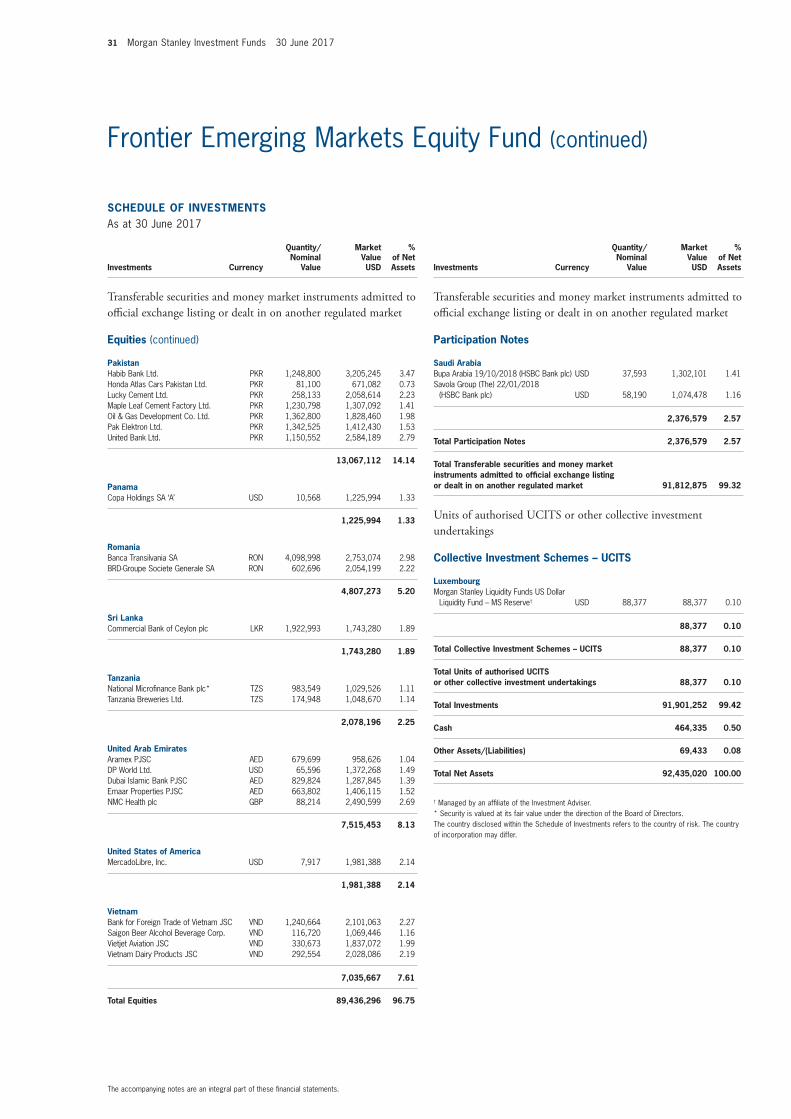
31 Morgan Stanley Investment Funds 30 June 2017
The accompanying notes are an integral part of these fi nancial statements.
Frontier Emerging Markets Equity Fund (continued)
SCHEDULE OF INVESTMENTSAs at 30 June 2017
Investments Currency
Quantity/Nominal
Value
Market Value USD
% of Net Assets
Transferable securities and money market instruments admitted to offi cial exchange listing or dealt in on another regulated market
Equities (continued)
PakistanHabib Bank Ltd. PKR 1,248,800 3,205,245 3.47 Honda Atlas Cars Pakistan Ltd. PKR 81,100 671,082 0.73 Lucky Cement Ltd. PKR 258,133 2,058,614 2.23 Maple Leaf Cement Factory Ltd. PKR 1,230,798 1,307,092 1.41 Oil & Gas Development Co. Ltd. PKR 1,362,800 1,828,460 1.98 Pak Elektron Ltd. PKR 1,342,525 1,412,430 1.53 United Bank Ltd. PKR 1,150,552 2,584,189 2.79
13,067,112 14.14
PanamaCopa Holdings SA ‘A’ USD 10,568 1,225,994 1.33
1,225,994 1.33
RomaniaBanca Transilvania SA RON 4,098,998 2,753,074 2.98 BRD-Groupe Societe Generale SA RON 602,696 2,054,199 2.22
4,807,273 5.20
Sri LankaCommercial Bank of Ceylon plc LKR 1,922,993 1,743,280 1.89
1,743,280 1.89
TanzaniaNational Microfi nance Bank plc* TZS 983,549 1,029,526 1.11 Tanzania Breweries Ltd. TZS 174,948 1,048,670 1.14
2,078,196 2.25
United Arab EmiratesAramex PJSC AED 679,699 958,626 1.04 DP World Ltd. USD 65,596 1,372,268 1.49 Dubai Islamic Bank PJSC AED 829,824 1,287,845 1.39 Emaar Properties PJSC AED 663,802 1,406,115 1.52 NMC Health plc GBP 88,214 2,490,599 2.69
7,515,453 8.13
United States of AmericaMercadoLibre, Inc. USD 7,917 1,981,388 2.14
1,981,388 2.14
VietnamBank for Foreign Trade of Vietnam JSC VND 1,240,664 2,101,063 2.27 Saigon Beer Alcohol Beverage Corp. VND 116,720 1,069,446 1.16 Vietjet Aviation JSC VND 330,673 1,837,072 1.99 Vietnam Dairy Products JSC VND 292,554 2,028,086 2.19
7,035,667 7.61
Total Equities 89,436,296 96.75
SCHEDULE OF INVESTMENTSAs at 30 June 2017
Investments Currency
Quantity/Nominal
Value
Market Value USD
% of Net Assets
Transferable securities and money market instruments admitted to offi cial exchange listing or dealt in on another regulated market
Participation Notes
Saudi ArabiaBupa Arabia 19/10/2018 (HSBC Bank plc) USD 37,593 1,302,101 1.41 Savola Group (The) 22/01/2018
(HSBC Bank plc) USD 58,190 1,074,478 1.16
2,376,579 2.57
Total Participation Notes 2,376,579 2.57
Total Transferable securities and money market instruments admitted to offi cial exchange listing or dealt in on another regulated market 91,812,875 99.32
Units of authorised UCITS or other collective investment undertakings
Collective Investment Schemes – UCITS
LuxembourgMorgan Stanley Liquidity Funds US Dollar
Liquidity Fund – MS Reserve† USD 88,377 88,377 0.10
88,377 0.10
Total Collective Investment Schemes – UCITS 88,377 0.10
Total Units of authorised UCITS or other collective investment undertakings 88,377 0.10
Total Investments 91,901,252 99.42
Cash 464,335 0.50
Other Assets/(Liabilities) 69,433 0.08
Total Net Assets 92,435,020 100.00
† Managed by an affi liate of the Investment Adviser.* Security is valued at its fair value under the direction of the Board of Directors.The country disclosed within the Schedule of Investments refers to the country of risk. The country of incorporation may differ.
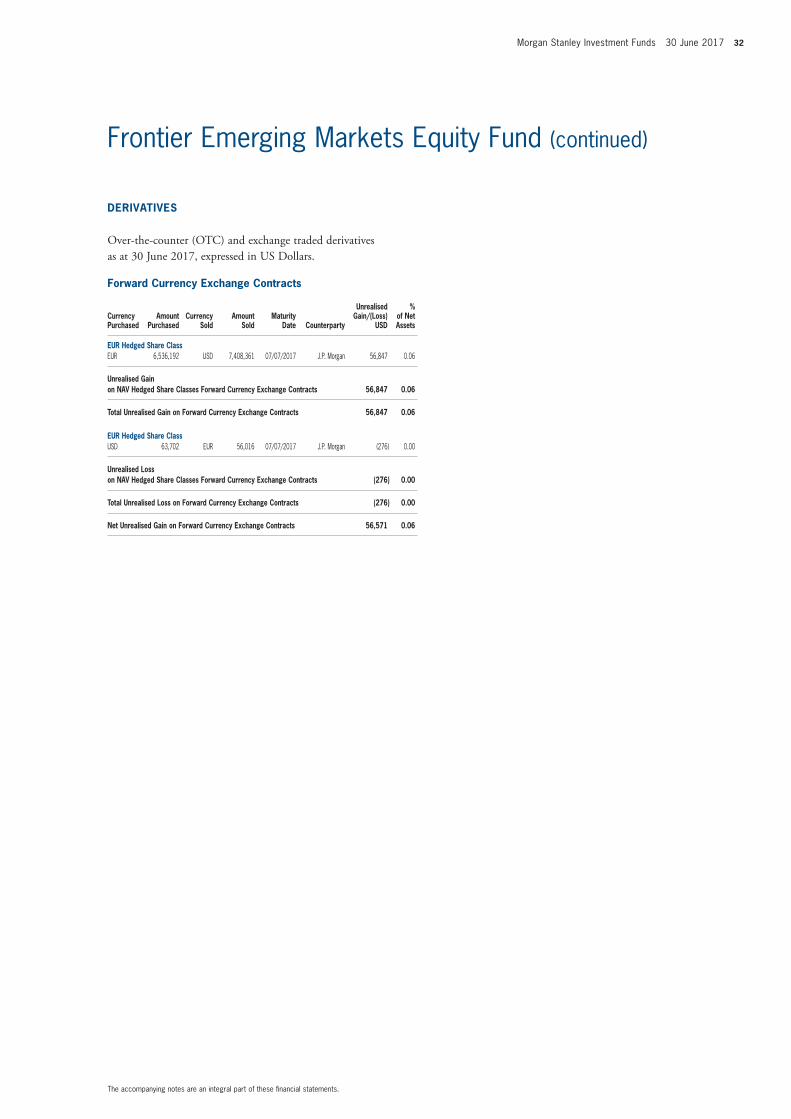
Morgan Stanley Investment Funds 30 June 2017 32
The accompanying notes are an integral part of these fi nancial statements.
Frontier Emerging Markets Equity Fund (continued)
Forward Currency Exchange Contracts
Currency Purchased
Amount Purchased
Currency Sold
Amount Sold
Maturity Date Counterparty
Unrealised Gain/(Loss)
USD
% of Net Assets
EUR Hedged Share ClassEUR 6,536,192 USD 7,408,361 07/07/2017 J.P. Morgan 56,847 0.06
Unrealised Gain on NAV Hedged Share Classes Forward Currency Exchange Contracts 56,847 0.06
Total Unrealised Gain on Forward Currency Exchange Contracts 56,847 0.06
EUR Hedged Share ClassUSD 63,702 EUR 56,016 07/07/2017 J.P. Morgan (276) 0.00
Unrealised Loss on NAV Hedged Share Classes Forward Currency Exchange Contracts (276) 0.00
Total Unrealised Loss on Forward Currency Exchange Contracts (276) 0.00
Net Unrealised Gain on Forward Currency Exchange Contracts 56,571 0.06
DERIVATIVES
Over-the-counter (OTC) and exchange traded derivatives as at 30 June 2017, expressed in US Dollars.
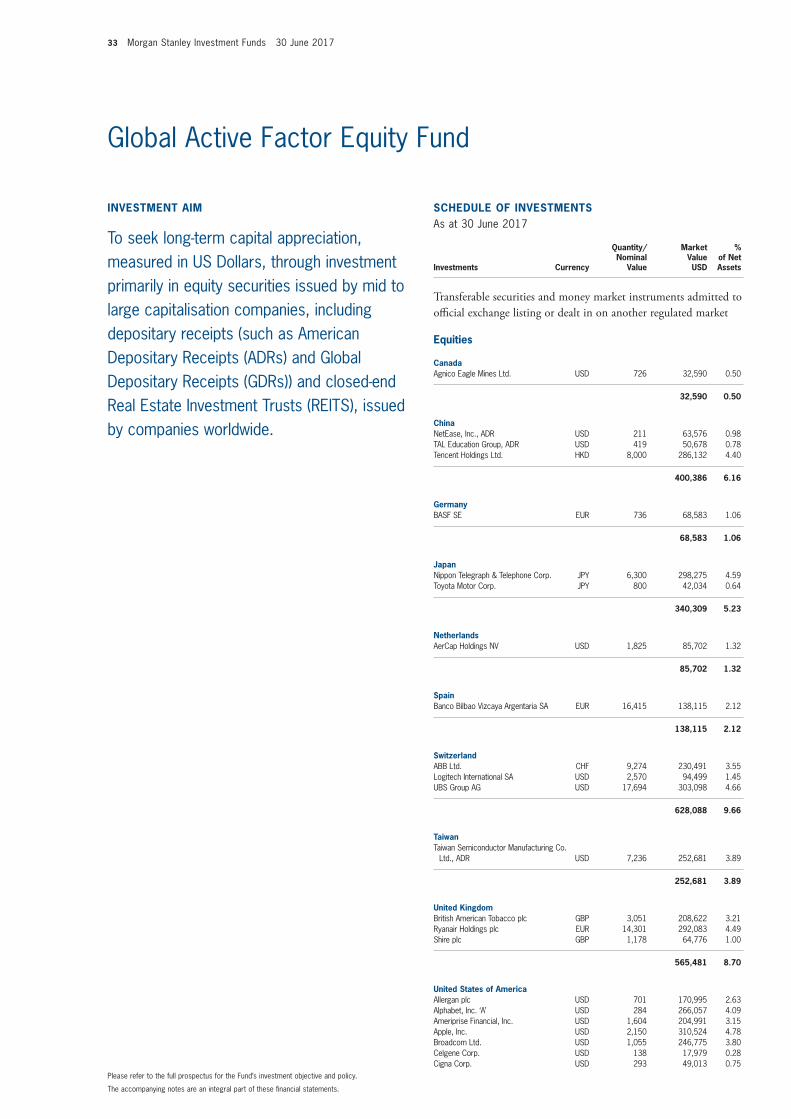
33 Morgan Stanley Investment Funds 30 June 2017
The accompanying notes are an integral part of these fi nancial statements.
Please refer to the full prospectus for the Fund’s investment objective and policy.
Global Active Factor Equity Fund
INVESTMENT AIM
To seek long-term capital appreciation, measured in US Dollars, through investment primarily in equity securities issued by mid to large capitalisation companies, including depositary receipts (such as American Depositary Receipts (ADRs) and Global Depositary Receipts (GDRs)) and closed-end Real Estate Investment Trusts (REITS), issued by companies worldwide.
SCHEDULE OF INVESTMENTSAs at 30 June 2017
Investments Currency
Quantity/Nominal
Value
Market Value USD
% of Net Assets
Transferable securities and money market instruments admitted to offi cial exchange listing or dealt in on another regulated market
Equities
CanadaAgnico Eagle Mines Ltd. USD 726 32,590 0.50
32,590 0.50
ChinaNetEase, Inc., ADR USD 211 63,576 0.98 TAL Education Group, ADR USD 419 50,678 0.78 Tencent Holdings Ltd. HKD 8,000 286,132 4.40
400,386 6.16
GermanyBASF SE EUR 736 68,583 1.06
68,583 1.06
JapanNippon Telegraph & Telephone Corp. JPY 6,300 298,275 4.59 Toyota Motor Corp. JPY 800 42,034 0.64
340,309 5.23
NetherlandsAerCap Holdings NV USD 1,825 85,702 1.32
85,702 1.32
SpainBanco Bilbao Vizcaya Argentaria SA EUR 16,415 138,115 2.12
138,115 2.12
SwitzerlandABB Ltd. CHF 9,274 230,491 3.55 Logitech International SA USD 2,570 94,499 1.45 UBS Group AG USD 17,694 303,098 4.66
628,088 9.66
TaiwanTaiwan Semiconductor Manufacturing Co.
Ltd., ADR USD 7,236 252,681 3.89
252,681 3.89
United KingdomBritish American Tobacco plc GBP 3,051 208,622 3.21 Ryanair Holdings plc EUR 14,301 292,083 4.49 Shire plc GBP 1,178 64,776 1.00
565,481 8.70
United States of AmericaAllergan plc USD 701 170,995 2.63 Alphabet, Inc. ‘A’ USD 284 266,057 4.09 Ameriprise Financial, Inc. USD 1,604 204,991 3.15 Apple, Inc. USD 2,150 310,524 4.78 Broadcom Ltd. USD 1,055 246,775 3.80 Celgene Corp. USD 138 17,979 0.28 Cigna Corp. USD 293 49,013 0.75
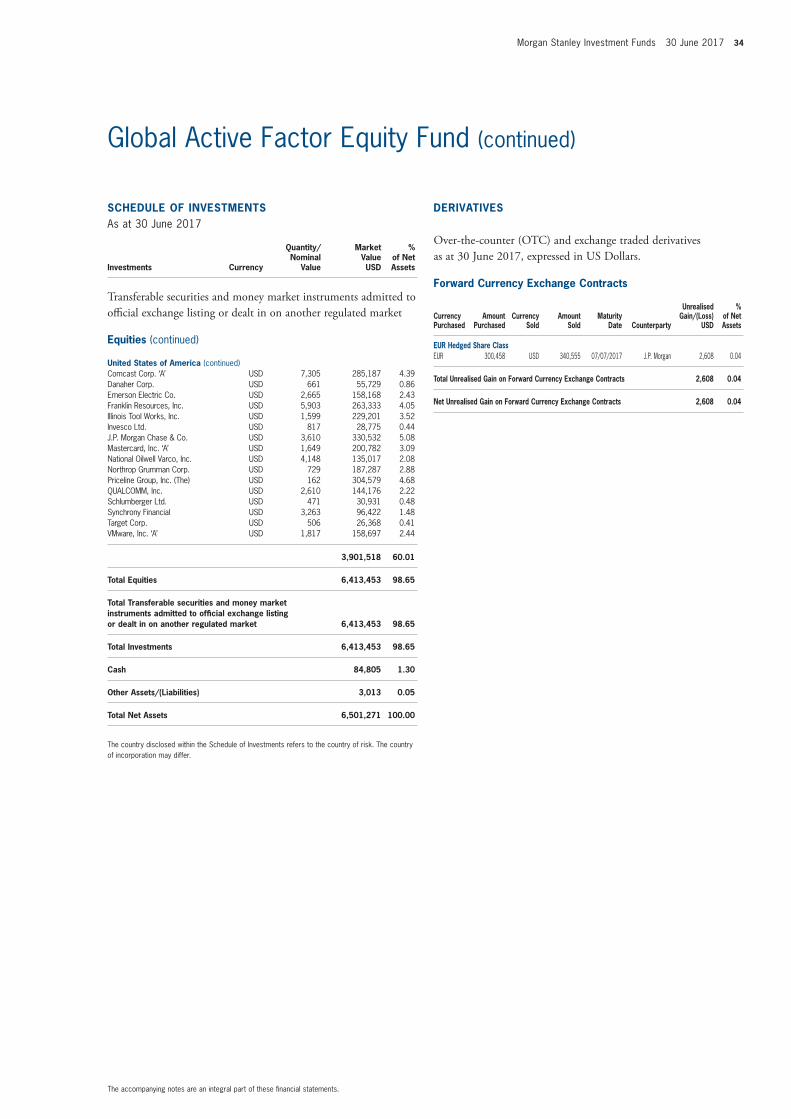
Morgan Stanley Investment Funds 30 June 2017 34
The accompanying notes are an integral part of these fi nancial statements.
Global Active Factor Equity Fund (continued)
SCHEDULE OF INVESTMENTSAs at 30 June 2017
Investments Currency
Quantity/Nominal
Value
Market Value USD
% of Net Assets
Transferable securities and money market instruments admitted to offi cial exchange listing or dealt in on another regulated market
Equities (continued)
United States of America (continued)Comcast Corp. ‘A’ USD 7,305 285,187 4.39 Danaher Corp. USD 661 55,729 0.86 Emerson Electric Co. USD 2,665 158,168 2.43 Franklin Resources, Inc. USD 5,903 263,333 4.05 Illinois Tool Works, Inc. USD 1,599 229,201 3.52 Invesco Ltd. USD 817 28,775 0.44 J.P. Morgan Chase & Co. USD 3,610 330,532 5.08 Mastercard, Inc. ‘A’ USD 1,649 200,782 3.09 National Oilwell Varco, Inc. USD 4,148 135,017 2.08 Northrop Grumman Corp. USD 729 187,287 2.88 Priceline Group, Inc. (The) USD 162 304,579 4.68 QUALCOMM, Inc. USD 2,610 144,176 2.22 Schlumberger Ltd. USD 471 30,931 0.48 Synchrony Financial USD 3,263 96,422 1.48 Target Corp. USD 506 26,368 0.41 VMware, Inc. ‘A’ USD 1,817 158,697 2.44
3,901,518 60.01
Total Equities 6,413,453 98.65
Total Transferable securities and money market instruments admitted to offi cial exchange listing or dealt in on another regulated market 6,413,453 98.65
Total Investments 6,413,453 98.65
Cash 84,805 1.30
Other Assets/(Liabilities) 3,013 0.05
Total Net Assets 6,501,271 100.00
The country disclosed within the Schedule of Investments refers to the country of risk. The country of incorporation may differ.
Forward Currency Exchange Contracts
Currency Purchased
Amount Purchased
Currency Sold
Amount Sold
Maturity Date Counterparty
Unrealised Gain/(Loss)
USD
% of Net Assets
EUR Hedged Share ClassEUR 300,458 USD 340,555 07/07/2017 J.P. Morgan 2,608 0.04
Total Unrealised Gain on Forward Currency Exchange Contracts 2,608 0.04
Net Unrealised Gain on Forward Currency Exchange Contracts 2,608 0.04
DERIVATIVES
Over-the-counter (OTC) and exchange traded derivatives as at 30 June 2017, expressed in US Dollars.
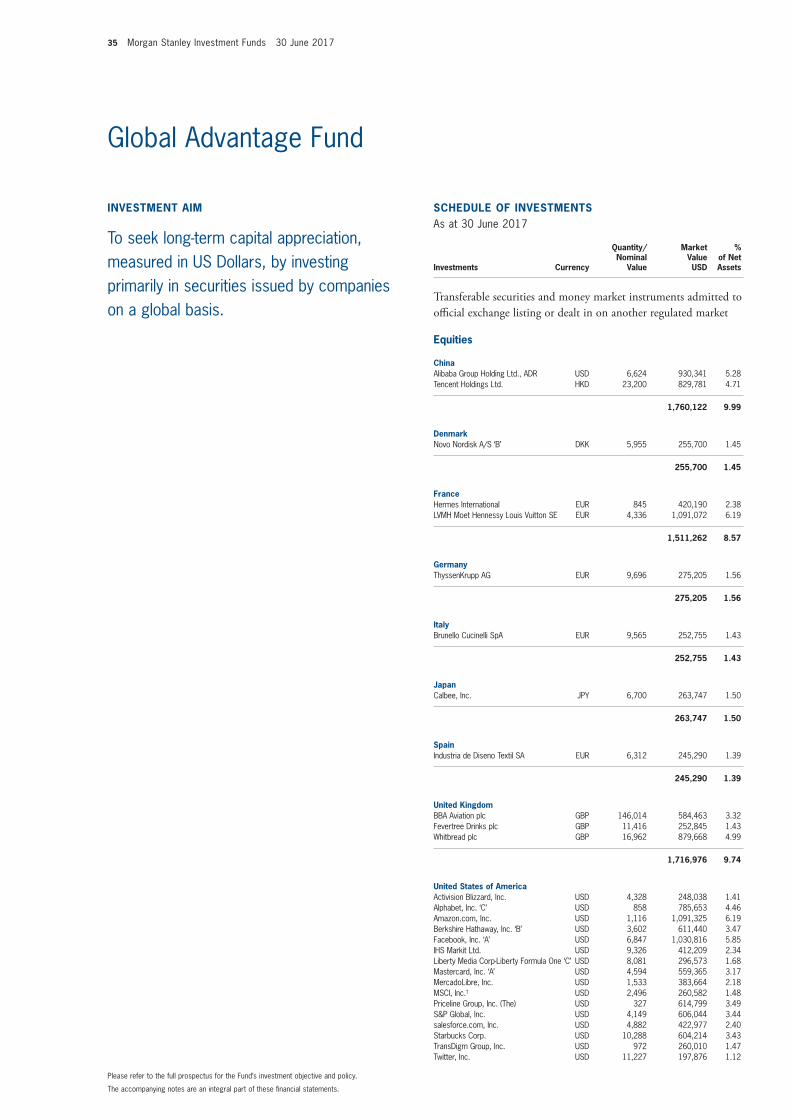
35 Morgan Stanley Investment Funds 30 June 2017
The accompanying notes are an integral part of these fi nancial statements.
Please refer to the full prospectus for the Fund’s investment objective and policy.
INVESTMENT AIM
To seek long-term capital appreciation, measured in US Dollars, by investing primarily in securities issued by companies on a global basis.
SCHEDULE OF INVESTMENTSAs at 30 June 2017
Investments Currency
Quantity/Nominal
Value
Market Value USD
% of Net Assets
Transferable securities and money market instruments admitted to offi cial exchange listing or dealt in on another regulated market
Equities
ChinaAlibaba Group Holding Ltd., ADR USD 6,624 930,341 5.28 Tencent Holdings Ltd. HKD 23,200 829,781 4.71
1,760,122 9.99
DenmarkNovo Nordisk A/S ‘B’ DKK 5,955 255,700 1.45
255,700 1.45
FranceHermes International EUR 845 420,190 2.38 LVMH Moet Hennessy Louis Vuitton SE EUR 4,336 1,091,072 6.19
1,511,262 8.57
GermanyThyssenKrupp AG EUR 9,696 275,205 1.56
275,205 1.56
ItalyBrunello Cucinelli SpA EUR 9,565 252,755 1.43
252,755 1.43
JapanCalbee, Inc. JPY 6,700 263,747 1.50
263,747 1.50
SpainIndustria de Diseno Textil SA EUR 6,312 245,290 1.39
245,290 1.39
United KingdomBBA Aviation plc GBP 146,014 584,463 3.32 Fevertree Drinks plc GBP 11,416 252,845 1.43 Whitbread plc GBP 16,962 879,668 4.99
1,716,976 9.74
United States of AmericaActivision Blizzard, Inc. USD 4,328 248,038 1.41 Alphabet, Inc. ‘C’ USD 858 785,653 4.46 Amazon.com, Inc. USD 1,116 1,091,325 6.19 Berkshire Hathaway, Inc. ‘B’ USD 3,602 611,440 3.47 Facebook, Inc. ‘A’ USD 6,847 1,030,816 5.85 IHS Markit Ltd. USD 9,326 412,209 2.34 Liberty Media Corp-Liberty Formula One ‘C’ USD 8,081 296,573 1.68 Mastercard, Inc. ‘A’ USD 4,594 559,365 3.17 MercadoLibre, Inc. USD 1,533 383,664 2.18 MSCI, Inc.† USD 2,496 260,582 1.48 Priceline Group, Inc. (The) USD 327 614,799 3.49 S&P Global, Inc. USD 4,149 606,044 3.44 salesforce.com, Inc. USD 4,882 422,977 2.40 Starbucks Corp. USD 10,288 604,214 3.43 TransDigm Group, Inc. USD 972 260,010 1.47 Twitter, Inc. USD 11,227 197,876 1.12
Global Advantage Fund
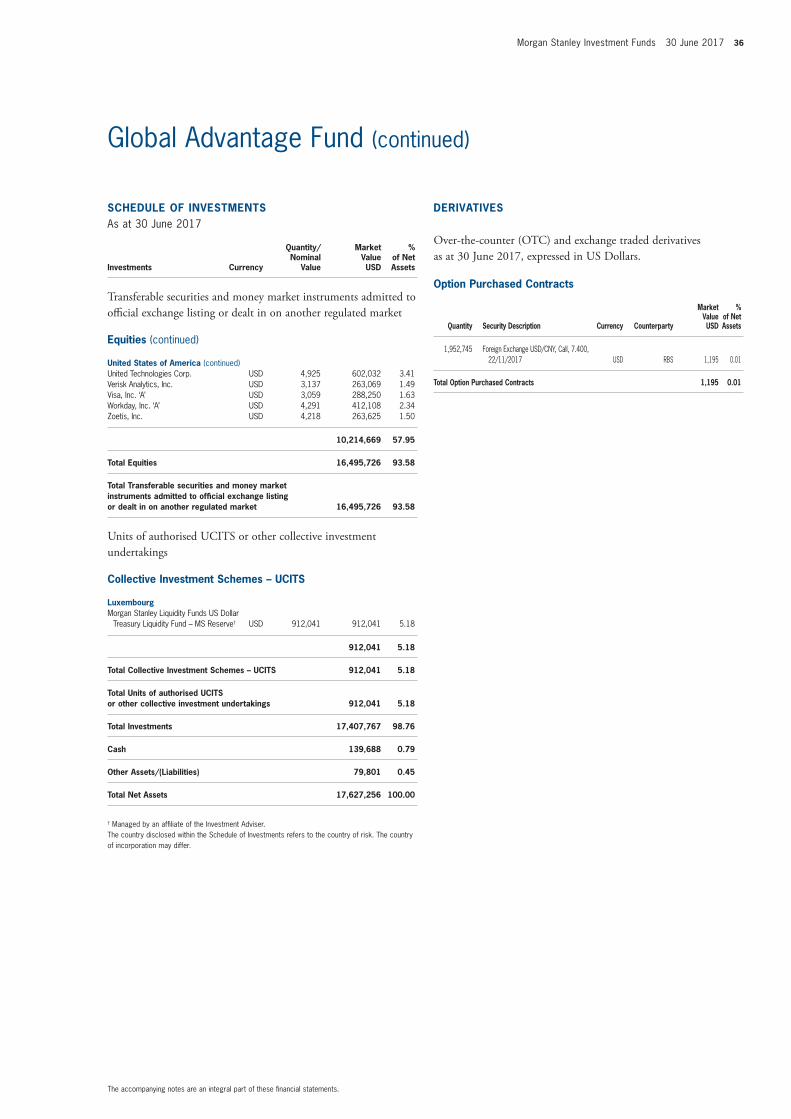
Morgan Stanley Investment Funds 30 June 2017 36
The accompanying notes are an integral part of these fi nancial statements.
Global Advantage Fund (continued)
SCHEDULE OF INVESTMENTSAs at 30 June 2017
Investments Currency
Quantity/Nominal
Value
Market Value USD
% of Net Assets
Transferable securities and money market instruments admitted to offi cial exchange listing or dealt in on another regulated market
Equities (continued)
United States of America (continued)United Technologies Corp. USD 4,925 602,032 3.41 Verisk Analytics, Inc. USD 3,137 263,069 1.49 Visa, Inc. ‘A’ USD 3,059 288,250 1.63 Workday, Inc. ‘A’ USD 4,291 412,108 2.34 Zoetis, Inc. USD 4,218 263,625 1.50
10,214,669 57.95
Total Equities 16,495,726 93.58
Total Transferable securities and money market instruments admitted to offi cial exchange listing or dealt in on another regulated market 16,495,726 93.58
Units of authorised UCITS or other collective investment undertakings
Collective Investment Schemes – UCITS
LuxembourgMorgan Stanley Liquidity Funds US Dollar
Treasury Liquidity Fund – MS Reserve† USD 912,041 912,041 5.18
912,041 5.18
Total Collective Investment Schemes – UCITS 912,041 5.18
Total Units of authorised UCITS or other collective investment undertakings 912,041 5.18
Total Investments 17,407,767 98.76
Cash 139,688 0.79
Other Assets/(Liabilities) 79,801 0.45
Total Net Assets 17,627,256 100.00
† Managed by an affi liate of the Investment Adviser.The country disclosed within the Schedule of Investments refers to the country of risk. The country of incorporation may differ.
Option Purchased Contracts
Quantity Security Description Currency Counterparty
Market Value USD
% of Net Assets
1,952,745 Foreign Exchange USD/CNY, Call, 7.400, 22/11/2017 USD RBS 1,195 0.01
Total Option Purchased Contracts 1,195 0.01
DERIVATIVES
Over-the-counter (OTC) and exchange traded derivatives as at 30 June 2017, expressed in US Dollars.
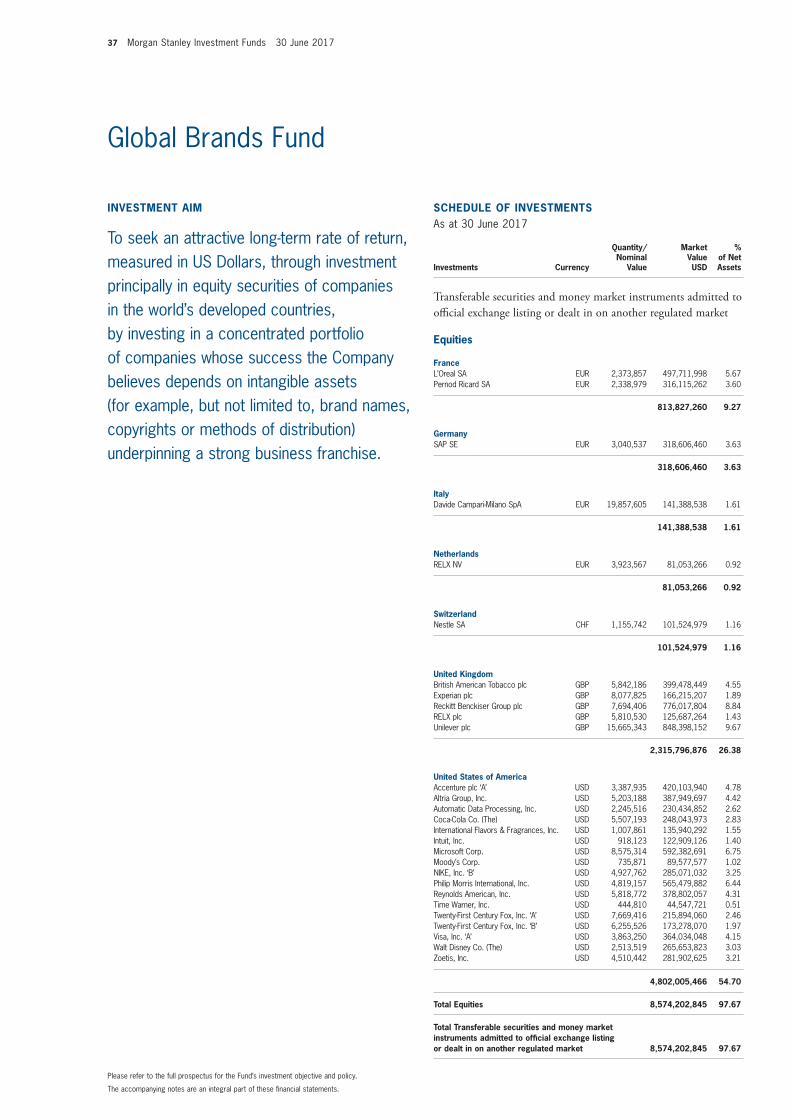
37 Morgan Stanley Investment Funds 30 June 2017
The accompanying notes are an integral part of these fi nancial statements.
Please refer to the full prospectus for the Fund’s investment objective and policy.
INVESTMENT AIM
To seek an attractive long-term rate of return, measured in US Dollars, through investment principally in equity securities of companies in the world’s developed countries, by investing in a concentrated portfolio of companies whose success the Company believes depends on intangible assets (for example, but not limited to, brand names, copyrights or methods of distribution) underpinning a strong business franchise.
SCHEDULE OF INVESTMENTSAs at 30 June 2017
Investments Currency
Quantity/Nominal
Value
Market Value USD
% of Net Assets
Transferable securities and money market instruments admitted to offi cial exchange listing or dealt in on another regulated market
Equities
FranceL’Oreal SA EUR 2,373,857 497,711,998 5.67 Pernod Ricard SA EUR 2,338,979 316,115,262 3.60
813,827,260 9.27
GermanySAP SE EUR 3,040,537 318,606,460 3.63
318,606,460 3.63
ItalyDavide Campari-Milano SpA EUR 19,857,605 141,388,538 1.61
141,388,538 1.61
NetherlandsRELX NV EUR 3,923,567 81,053,266 0.92
81,053,266 0.92
SwitzerlandNestle SA CHF 1,155,742 101,524,979 1.16
101,524,979 1.16
United KingdomBritish American Tobacco plc GBP 5,842,186 399,478,449 4.55 Experian plc GBP 8,077,825 166,215,207 1.89 Reckitt Benckiser Group plc GBP 7,694,406 776,017,804 8.84 RELX plc GBP 5,810,530 125,687,264 1.43 Unilever plc GBP 15,665,343 848,398,152 9.67
2,315,796,876 26.38
United States of AmericaAccenture plc ‘A’ USD 3,387,935 420,103,940 4.78 Altria Group, Inc. USD 5,203,188 387,949,697 4.42 Automatic Data Processing, Inc. USD 2,245,516 230,434,852 2.62 Coca-Cola Co. (The) USD 5,507,193 248,043,973 2.83 International Flavors & Fragrances, Inc. USD 1,007,861 135,940,292 1.55 Intuit, Inc. USD 918,123 122,909,126 1.40 Microsoft Corp. USD 8,575,314 592,382,691 6.75 Moody’s Corp. USD 735,871 89,577,577 1.02 NIKE, Inc. ‘B’ USD 4,927,762 285,071,032 3.25 Philip Morris International, Inc. USD 4,819,157 565,479,882 6.44 Reynolds American, Inc. USD 5,818,772 378,802,057 4.31 Time Warner, Inc. USD 444,810 44,547,721 0.51 Twenty-First Century Fox, Inc. ‘A’ USD 7,669,416 215,894,060 2.46 Twenty-First Century Fox, Inc. ‘B’ USD 6,255,526 173,278,070 1.97 Visa, Inc. ‘A’ USD 3,863,250 364,034,048 4.15 Walt Disney Co. (The) USD 2,513,519 265,653,823 3.03 Zoetis, Inc. USD 4,510,442 281,902,625 3.21
4,802,005,466 54.70
Total Equities 8,574,202,845 97.67
Total Transferable securities and money market instruments admitted to offi cial exchange listing or dealt in on another regulated market 8,574,202,845 97.67
Global Brands Fund
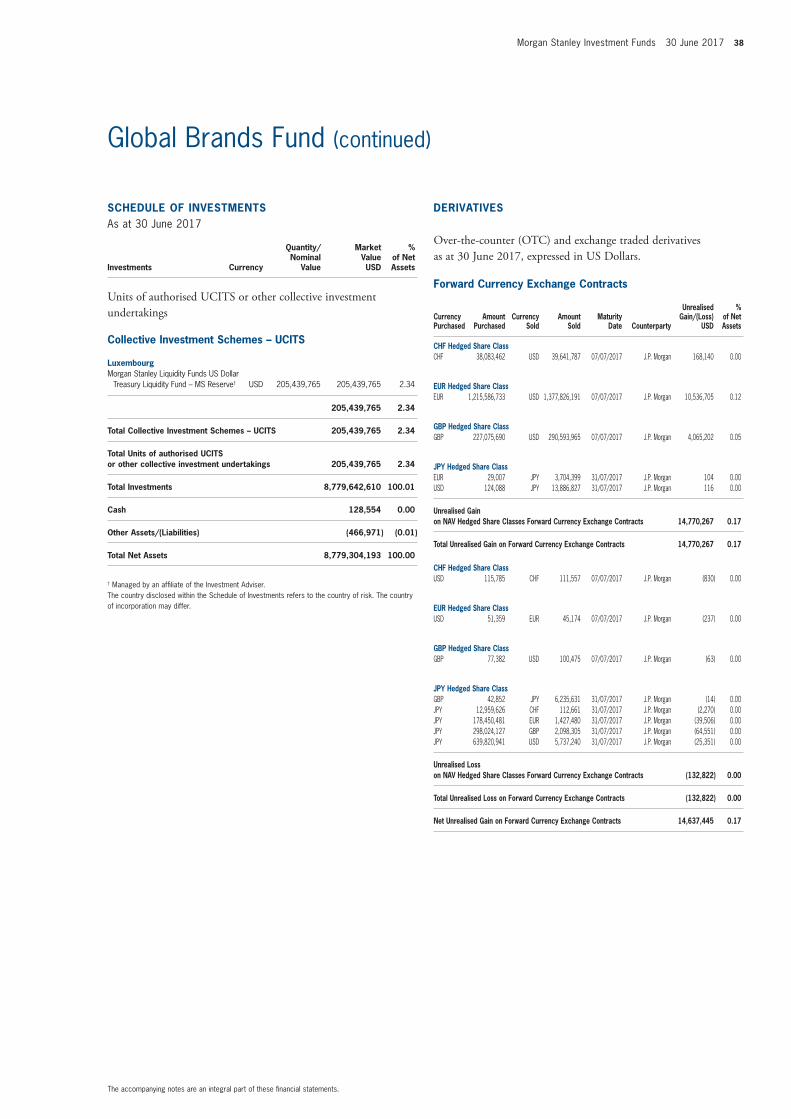
Morgan Stanley Investment Funds 30 June 2017 38
The accompanying notes are an integral part of these fi nancial statements.
Global Brands Fund (continued)
Forward Currency Exchange Contracts
Currency Purchased
Amount Purchased
Currency Sold
Amount Sold
Maturity Date Counterparty
Unrealised Gain/(Loss)
USD
% of Net Assets
CHF Hedged Share ClassCHF 38,083,462 USD 39,641,787 07/07/2017 J.P. Morgan 168,140 0.00
EUR Hedged Share ClassEUR 1,215,586,733 USD 1,377,826,191 07/07/2017 J.P. Morgan 10,536,705 0.12
GBP Hedged Share ClassGBP 227,075,690 USD 290,593,965 07/07/2017 J.P. Morgan 4,065,202 0.05
JPY Hedged Share ClassEUR 29,007 JPY 3,704,399 31/07/2017 J.P. Morgan 104 0.00 USD 124,088 JPY 13,886,827 31/07/2017 J.P. Morgan 116 0.00
Unrealised Gain on NAV Hedged Share Classes Forward Currency Exchange Contracts 14,770,267 0.17
Total Unrealised Gain on Forward Currency Exchange Contracts 14,770,267 0.17
CHF Hedged Share ClassUSD 115,785 CHF 111,557 07/07/2017 J.P. Morgan (830) 0.00
EUR Hedged Share ClassUSD 51,359 EUR 45,174 07/07/2017 J.P. Morgan (237) 0.00
GBP Hedged Share ClassGBP 77,382 USD 100,475 07/07/2017 J.P. Morgan (63) 0.00
JPY Hedged Share ClassGBP 42,852 JPY 6,235,631 31/07/2017 J.P. Morgan (14) 0.00 JPY 12,959,626 CHF 112,661 31/07/2017 J.P. Morgan (2,270) 0.00 JPY 178,450,481 EUR 1,427,480 31/07/2017 J.P. Morgan (39,506) 0.00 JPY 298,024,127 GBP 2,098,305 31/07/2017 J.P. Morgan (64,551) 0.00 JPY 639,820,941 USD 5,737,240 31/07/2017 J.P. Morgan (25,351) 0.00
Unrealised Loss on NAV Hedged Share Classes Forward Currency Exchange Contracts (132,822) 0.00
Total Unrealised Loss on Forward Currency Exchange Contracts (132,822) 0.00
Net Unrealised Gain on Forward Currency Exchange Contracts 14,637,445 0.17
SCHEDULE OF INVESTMENTSAs at 30 June 2017
Investments Currency
Quantity/Nominal
Value
Market Value USD
% of Net Assets
Units of authorised UCITS or other collective investment undertakings
Collective Investment Schemes – UCITS
LuxembourgMorgan Stanley Liquidity Funds US Dollar
Treasury Liquidity Fund – MS Reserve† USD 205,439,765 205,439,765 2.34
205,439,765 2.34
Total Collective Investment Schemes – UCITS 205,439,765 2.34
Total Units of authorised UCITS or other collective investment undertakings 205,439,765 2.34
Total Investments 8,779,642,610 100.01
Cash 128,554 0.00
Other Assets/(Liabilities) (466,971) (0.01)
Total Net Assets 8,779,304,193 100.00
† Managed by an affi liate of the Investment Adviser.The country disclosed within the Schedule of Investments refers to the country of risk. The country of incorporation may differ.
DERIVATIVES
Over-the-counter (OTC) and exchange traded derivatives as at 30 June 2017, expressed in US Dollars.
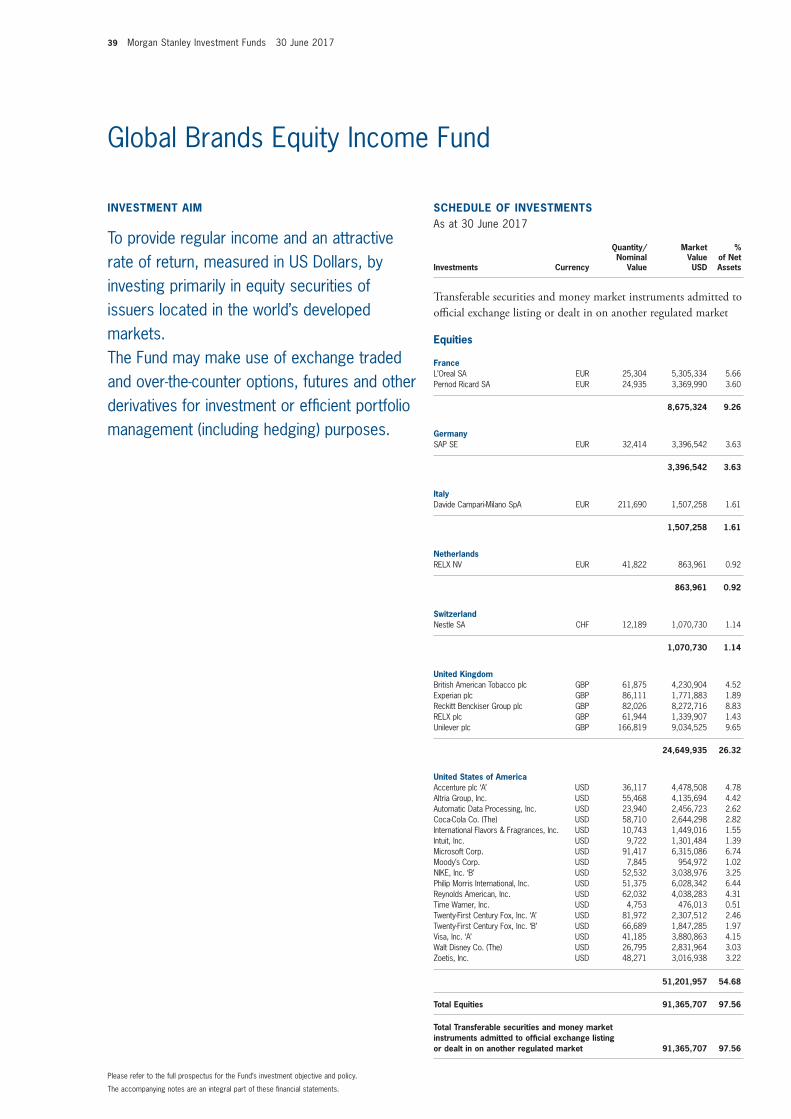
39 Morgan Stanley Investment Funds 30 June 2017
The accompanying notes are an integral part of these fi nancial statements.
Please refer to the full prospectus for the Fund’s investment objective and policy.
SCHEDULE OF INVESTMENTSAs at 30 June 2017
Investments Currency
Quantity/Nominal
Value
Market Value USD
% of Net Assets
Transferable securities and money market instruments admitted to offi cial exchange listing or dealt in on another regulated market
Equities
FranceL’Oreal SA EUR 25,304 5,305,334 5.66 Pernod Ricard SA EUR 24,935 3,369,990 3.60
8,675,324 9.26
GermanySAP SE EUR 32,414 3,396,542 3.63
3,396,542 3.63
ItalyDavide Campari-Milano SpA EUR 211,690 1,507,258 1.61
1,507,258 1.61
NetherlandsRELX NV EUR 41,822 863,961 0.92
863,961 0.92
SwitzerlandNestle SA CHF 12,189 1,070,730 1.14
1,070,730 1.14
United KingdomBritish American Tobacco plc GBP 61,875 4,230,904 4.52 Experian plc GBP 86,111 1,771,883 1.89 Reckitt Benckiser Group plc GBP 82,026 8,272,716 8.83 RELX plc GBP 61,944 1,339,907 1.43 Unilever plc GBP 166,819 9,034,525 9.65
24,649,935 26.32
United States of AmericaAccenture plc ‘A’ USD 36,117 4,478,508 4.78 Altria Group, Inc. USD 55,468 4,135,694 4.42 Automatic Data Processing, Inc. USD 23,940 2,456,723 2.62 Coca-Cola Co. (The) USD 58,710 2,644,298 2.82 International Flavors & Fragrances, Inc. USD 10,743 1,449,016 1.55 Intuit, Inc. USD 9,722 1,301,484 1.39 Microsoft Corp. USD 91,417 6,315,086 6.74 Moody’s Corp. USD 7,845 954,972 1.02 NIKE, Inc. ‘B’ USD 52,532 3,038,976 3.25 Philip Morris International, Inc. USD 51,375 6,028,342 6.44 Reynolds American, Inc. USD 62,032 4,038,283 4.31 Time Warner, Inc. USD 4,753 476,013 0.51 Twenty-First Century Fox, Inc. ‘A’ USD 81,972 2,307,512 2.46 Twenty-First Century Fox, Inc. ‘B’ USD 66,689 1,847,285 1.97 Visa, Inc. ‘A’ USD 41,185 3,880,863 4.15 Walt Disney Co. (The) USD 26,795 2,831,964 3.03 Zoetis, Inc. USD 48,271 3,016,938 3.22
51,201,957 54.68
Total Equities 91,365,707 97.56
Total Transferable securities and money market instruments admitted to offi cial exchange listing or dealt in on another regulated market 91,365,707 97.56
INVESTMENT AIM
To provide regular income and an attractive rate of return, measured in US Dollars, by investing primarily in equity securities of issuers located in the world’s developed markets.The Fund may make use of exchange traded and over-the-counter options, futures and other derivatives for investment or effi cient portfolio management (including hedging) purposes.
Global Brands Equity Income Fund
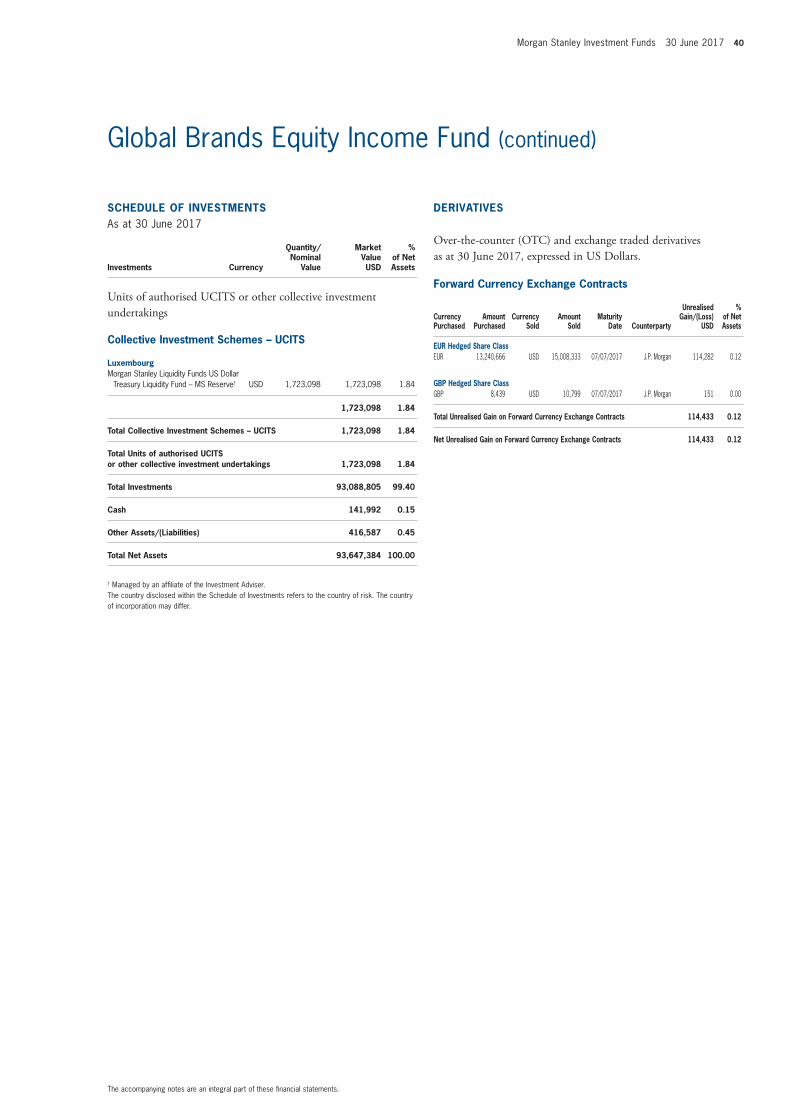
Morgan Stanley Investment Funds 30 June 2017 40
The accompanying notes are an integral part of these fi nancial statements.
Global Brands Equity Income Fund (continued)
Forward Currency Exchange Contracts
Currency Purchased
Amount Purchased
Currency Sold
Amount Sold
Maturity Date Counterparty
Unrealised Gain/(Loss)
USD
% of Net Assets
EUR Hedged Share ClassEUR 13,240,666 USD 15,008,333 07/07/2017 J.P. Morgan 114,282 0.12
GBP Hedged Share ClassGBP 8,439 USD 10,799 07/07/2017 J.P. Morgan 151 0.00
Total Unrealised Gain on Forward Currency Exchange Contracts 114,433 0.12
Net Unrealised Gain on Forward Currency Exchange Contracts 114,433 0.12
SCHEDULE OF INVESTMENTSAs at 30 June 2017
Investments Currency
Quantity/Nominal
Value
Market Value USD
% of Net Assets
Units of authorised UCITS or other collective investment undertakings
Collective Investment Schemes – UCITS
LuxembourgMorgan Stanley Liquidity Funds US Dollar
Treasury Liquidity Fund – MS Reserve† USD 1,723,098 1,723,098 1.84
1,723,098 1.84
Total Collective Investment Schemes – UCITS 1,723,098 1.84
Total Units of authorised UCITS or other collective investment undertakings 1,723,098 1.84
Total Investments 93,088,805 99.40
Cash 141,992 0.15
Other Assets/(Liabilities) 416,587 0.45
Total Net Assets 93,647,384 100.00
† Managed by an affi liate of the Investment Adviser.The country disclosed within the Schedule of Investments refers to the country of risk. The country of incorporation may differ.
DERIVATIVES
Over-the-counter (OTC) and exchange traded derivatives as at 30 June 2017, expressed in US Dollars.
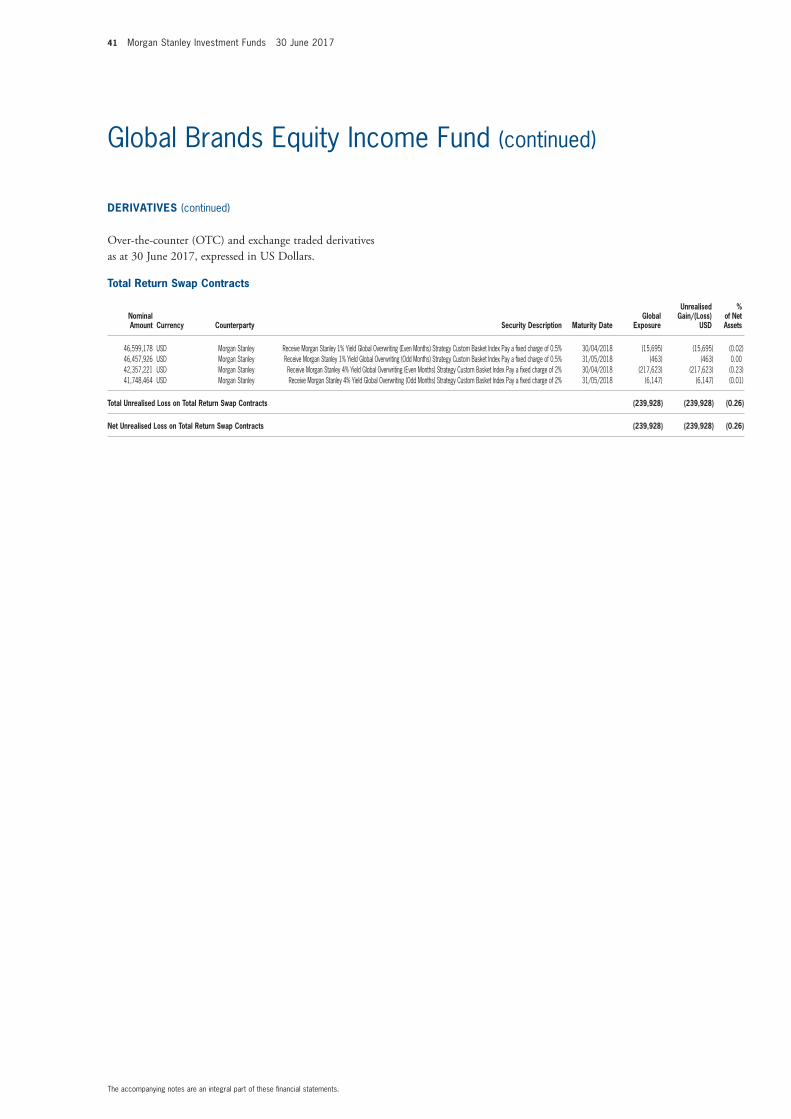
41 Morgan Stanley Investment Funds 30 June 2017
The accompanying notes are an integral part of these fi nancial statements.
Global Brands Equity Income Fund (continued)
Total Return Swap Contracts
Nominal Amount Currency Counterparty Security Description Maturity Date
Global Exposure
Unrealised Gain/(Loss)
USD
% of Net Assets
46,599,178 USD Morgan Stanley Receive Morgan Stanley 1% Yield Global Overwriting (Even Months) Strategy Custom Basket Index Pay a fi xed charge of 0.5% 30/04/2018 (15,695) (15,695) (0.02) 46,457,926 USD Morgan Stanley Receive Morgan Stanley 1% Yield Global Overwriting (Odd Months) Strategy Custom Basket Index Pay a fi xed charge of 0.5% 31/05/2018 (463) (463) 0.0042,357,221 USD Morgan Stanley Receive Morgan Stanley 4% Yield Global Overwriting (Even Months) Strategy Custom Basket Index Pay a fi xed charge of 2% 30/04/2018 (217,623) (217,623) (0.23) 41,748,464 USD Morgan Stanley Receive Morgan Stanley 4% Yield Global Overwriting (Odd Months) Strategy Custom Basket Index Pay a fi xed charge of 2% 31/05/2018 (6,147) (6,147) (0.01)
Total Unrealised Loss on Total Return Swap Contracts (239,928) (239,928) (0.26)
Net Unrealised Loss on Total Return Swap Contracts (239,928) (239,928) (0.26)
DERIVATIVES (continued)
Over-the-counter (OTC) and exchange traded derivatives as at 30 June 2017, expressed in US Dollars.
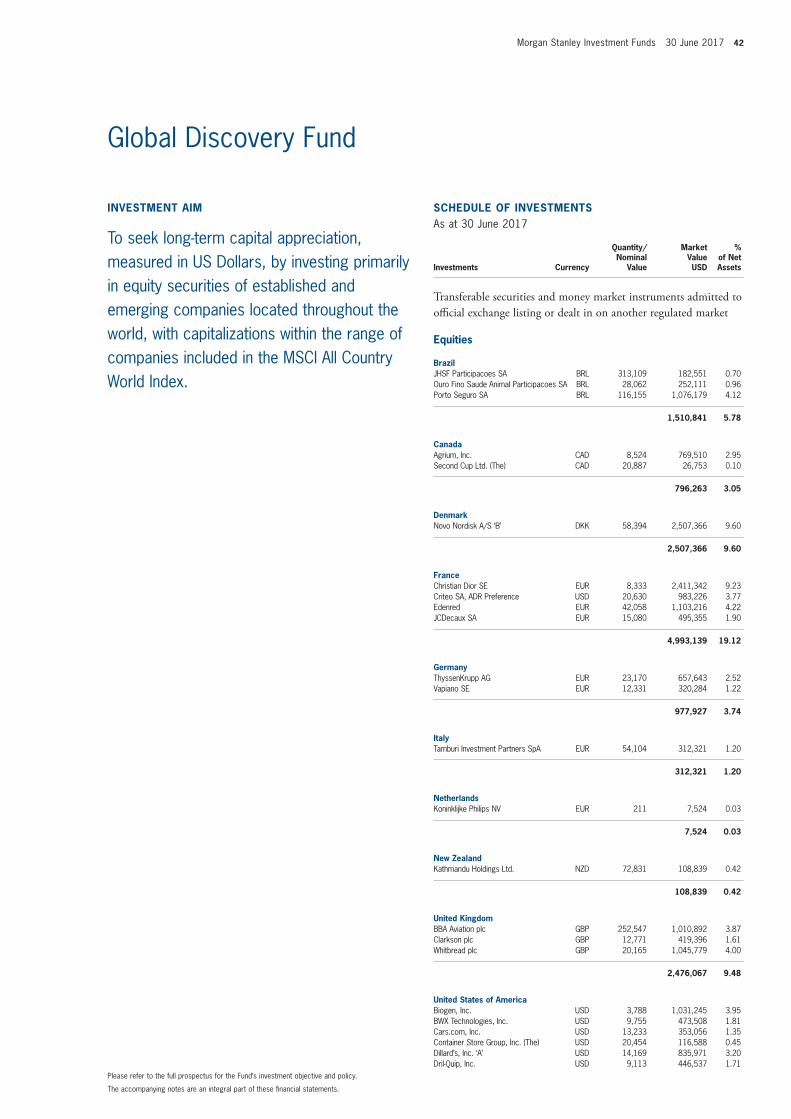
Morgan Stanley Investment Funds 30 June 2017 42
The accompanying notes are an integral part of these fi nancial statements.
Please refer to the full prospectus for the Fund’s investment objective and policy.
INVESTMENT AIM
To seek long-term capital appreciation, measured in US Dollars, by investing primarily in equity securities of established and emerging companies located throughout the world, with capitalizations within the range of companies included in the MSCI All Country World Index.
SCHEDULE OF INVESTMENTSAs at 30 June 2017
Investments Currency
Quantity/Nominal
Value
Market Value USD
% of Net Assets
Transferable securities and money market instruments admitted to offi cial exchange listing or dealt in on another regulated market
Equities
BrazilJHSF Participacoes SA BRL 313,109 182,551 0.70 Ouro Fino Saude Animal Participacoes SA BRL 28,062 252,111 0.96 Porto Seguro SA BRL 116,155 1,076,179 4.12
1,510,841 5.78
CanadaAgrium, Inc. CAD 8,524 769,510 2.95 Second Cup Ltd. (The) CAD 20,887 26,753 0.10
796,263 3.05
DenmarkNovo Nordisk A/S ‘B’ DKK 58,394 2,507,366 9.60
2,507,366 9.60
FranceChristian Dior SE EUR 8,333 2,411,342 9.23 Criteo SA, ADR Preference USD 20,630 983,226 3.77 Edenred EUR 42,058 1,103,216 4.22 JCDecaux SA EUR 15,080 495,355 1.90
4,993,139 19.12
GermanyThyssenKrupp AG EUR 23,170 657,643 2.52 Vapiano SE EUR 12,331 320,284 1.22
977,927 3.74
ItalyTamburi Investment Partners SpA EUR 54,104 312,321 1.20
312,321 1.20
NetherlandsKoninklijke Philips NV EUR 211 7,524 0.03
7,524 0.03
New ZealandKathmandu Holdings Ltd. NZD 72,831 108,839 0.42
108,839 0.42
United KingdomBBA Aviation plc GBP 252,547 1,010,892 3.87 Clarkson plc GBP 12,771 419,396 1.61 Whitbread plc GBP 20,165 1,045,779 4.00
2,476,067 9.48
United States of AmericaBiogen, Inc. USD 3,788 1,031,245 3.95 BWX Technologies, Inc. USD 9,755 473,508 1.81 Cars.com, Inc. USD 13,233 353,056 1.35 Container Store Group, Inc. (The) USD 20,454 116,588 0.45 Dillard’s, Inc. ‘A’ USD 14,169 835,971 3.20 Dril-Quip, Inc. USD 9,113 446,537 1.71
Global Discovery Fund
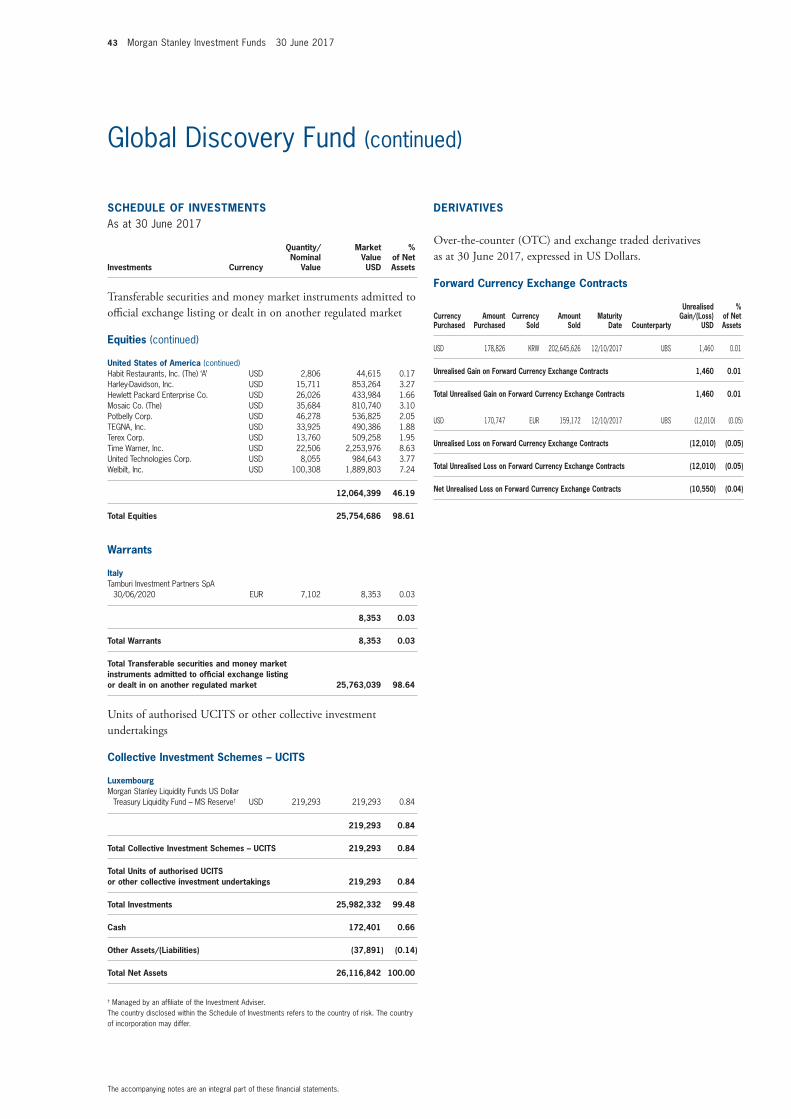
43 Morgan Stanley Investment Funds 30 June 2017
The accompanying notes are an integral part of these fi nancial statements.
Global Discovery Fund (continued)
SCHEDULE OF INVESTMENTSAs at 30 June 2017
Investments Currency
Quantity/Nominal
Value
Market Value USD
% of Net Assets
Transferable securities and money market instruments admitted to offi cial exchange listing or dealt in on another regulated market
Equities (continued)
United States of America (continued)Habit Restaurants, Inc. (The) ‘A’ USD 2,806 44,615 0.17 Harley-Davidson, Inc. USD 15,711 853,264 3.27 Hewlett Packard Enterprise Co. USD 26,026 433,984 1.66 Mosaic Co. (The) USD 35,684 810,740 3.10 Potbelly Corp. USD 46,278 536,825 2.05 TEGNA, Inc. USD 33,925 490,386 1.88 Terex Corp. USD 13,760 509,258 1.95 Time Warner, Inc. USD 22,506 2,253,976 8.63 United Technologies Corp. USD 8,055 984,643 3.77 Welbilt, Inc. USD 100,308 1,889,803 7.24
12,064,399 46.19
Total Equities 25,754,686 98.61
Warrants
ItalyTamburi Investment Partners SpA
30/06/2020 EUR 7,102 8,353 0.03
8,353 0.03
Total Warrants 8,353 0.03
Total Transferable securities and money market instruments admitted to offi cial exchange listing or dealt in on another regulated market 25,763,039 98.64
Units of authorised UCITS or other collective investment undertakings
Collective Investment Schemes – UCITS
LuxembourgMorgan Stanley Liquidity Funds US Dollar
Treasury Liquidity Fund – MS Reserve† USD 219,293 219,293 0.84
219,293 0.84
Total Collective Investment Schemes – UCITS 219,293 0.84
Total Units of authorised UCITS or other collective investment undertakings 219,293 0.84
Total Investments 25,982,332 99.48
Cash 172,401 0.66
Other Assets/(Liabilities) (37,891) (0.14)
Total Net Assets 26,116,842 100.00
† Managed by an affi liate of the Investment Adviser.The country disclosed within the Schedule of Investments refers to the country of risk. The country of incorporation may differ.
Forward Currency Exchange Contracts
Currency Purchased
Amount Purchased
Currency Sold
Amount Sold
Maturity Date Counterparty
Unrealised Gain/(Loss)
USD
% of Net Assets
USD 178,826 KRW 202,645,626 12/10/2017 UBS 1,460 0.01
Unrealised Gain on Forward Currency Exchange Contracts 1,460 0.01
Total Unrealised Gain on Forward Currency Exchange Contracts 1,460 0.01
USD 170,747 EUR 159,172 12/10/2017 UBS (12,010) (0.05)
Unrealised Loss on Forward Currency Exchange Contracts (12,010) (0.05)
Total Unrealised Loss on Forward Currency Exchange Contracts (12,010) (0.05)
Net Unrealised Loss on Forward Currency Exchange Contracts (10,550) (0.04)
DERIVATIVES
Over-the-counter (OTC) and exchange traded derivatives as at 30 June 2017, expressed in US Dollars.
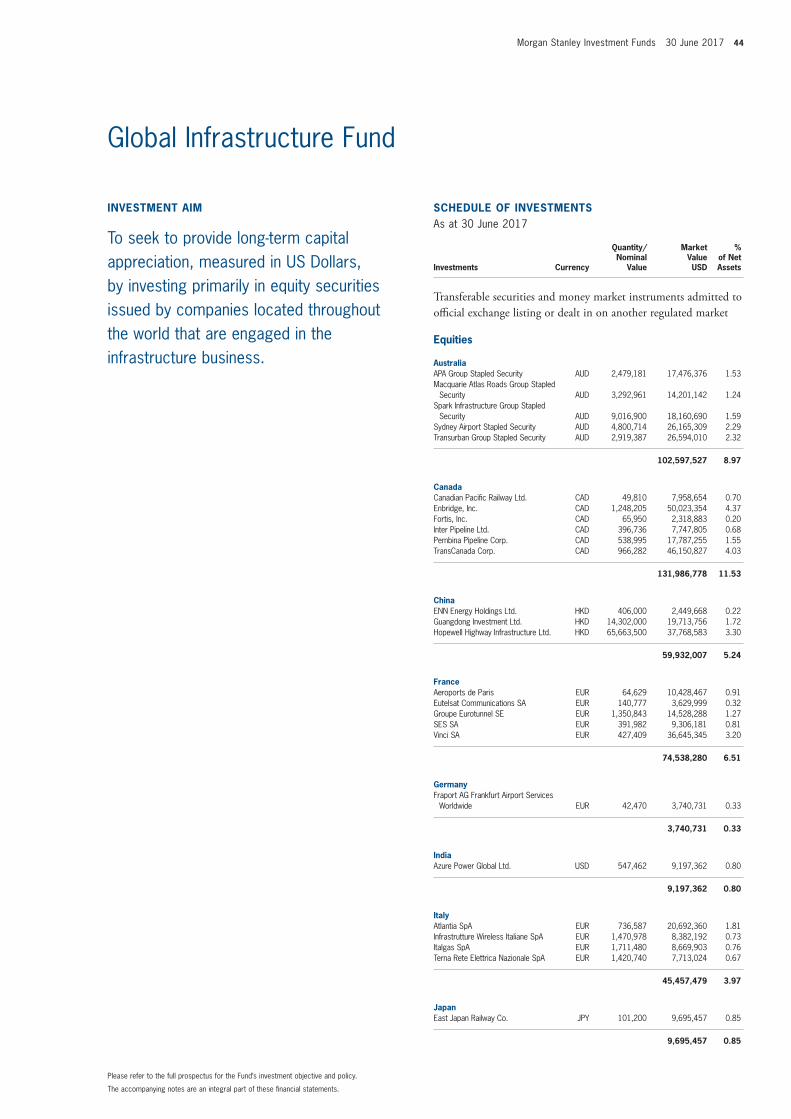
Morgan Stanley Investment Funds 30 June 2017 44
The accompanying notes are an integral part of these fi nancial statements.
Please refer to the full prospectus for the Fund’s investment objective and policy.
INVESTMENT AIM
To seek to provide long-term capital appreciation, measured in US Dollars, by investing primarily in equity securities issued by companies located throughout the world that are engaged in the infrastructure business.
SCHEDULE OF INVESTMENTSAs at 30 June 2017
Investments Currency
Quantity/Nominal
Value
Market Value USD
% of Net Assets
Transferable securities and money market instruments admitted to offi cial exchange listing or dealt in on another regulated market
Equities
AustraliaAPA Group Stapled Security AUD 2,479,181 17,476,376 1.53 Macquarie Atlas Roads Group Stapled
Security AUD 3,292,961 14,201,142 1.24 Spark Infrastructure Group Stapled
Security AUD 9,016,900 18,160,690 1.59 Sydney Airport Stapled Security AUD 4,800,714 26,165,309 2.29 Transurban Group Stapled Security AUD 2,919,387 26,594,010 2.32
102,597,527 8.97
CanadaCanadian Pacifi c Railway Ltd. CAD 49,810 7,958,654 0.70 Enbridge, Inc. CAD 1,248,205 50,023,354 4.37 Fortis, Inc. CAD 65,950 2,318,883 0.20 Inter Pipeline Ltd. CAD 396,736 7,747,805 0.68 Pembina Pipeline Corp. CAD 538,995 17,787,255 1.55 TransCanada Corp. CAD 966,282 46,150,827 4.03
131,986,778 11.53
ChinaENN Energy Holdings Ltd. HKD 406,000 2,449,668 0.22 Guangdong Investment Ltd. HKD 14,302,000 19,713,756 1.72 Hopewell Highway Infrastructure Ltd. HKD 65,663,500 37,768,583 3.30
59,932,007 5.24
FranceAeroports de Paris EUR 64,629 10,428,467 0.91 Eutelsat Communications SA EUR 140,777 3,629,999 0.32 Groupe Eurotunnel SE EUR 1,350,843 14,528,288 1.27 SES SA EUR 391,982 9,306,181 0.81 Vinci SA EUR 427,409 36,645,345 3.20
74,538,280 6.51
GermanyFraport AG Frankfurt Airport Services
Worldwide EUR 42,470 3,740,731 0.33
3,740,731 0.33
IndiaAzure Power Global Ltd. USD 547,462 9,197,362 0.80
9,197,362 0.80
ItalyAtlantia SpA EUR 736,587 20,692,360 1.81 Infrastrutture Wireless Italiane SpA EUR 1,470,978 8,382,192 0.73 Italgas SpA EUR 1,711,480 8,669,903 0.76 Terna Rete Elettrica Nazionale SpA EUR 1,420,740 7,713,024 0.67
45,457,479 3.97
JapanEast Japan Railway Co. JPY 101,200 9,695,457 0.85
9,695,457 0.85
Global Infrastructure Fund
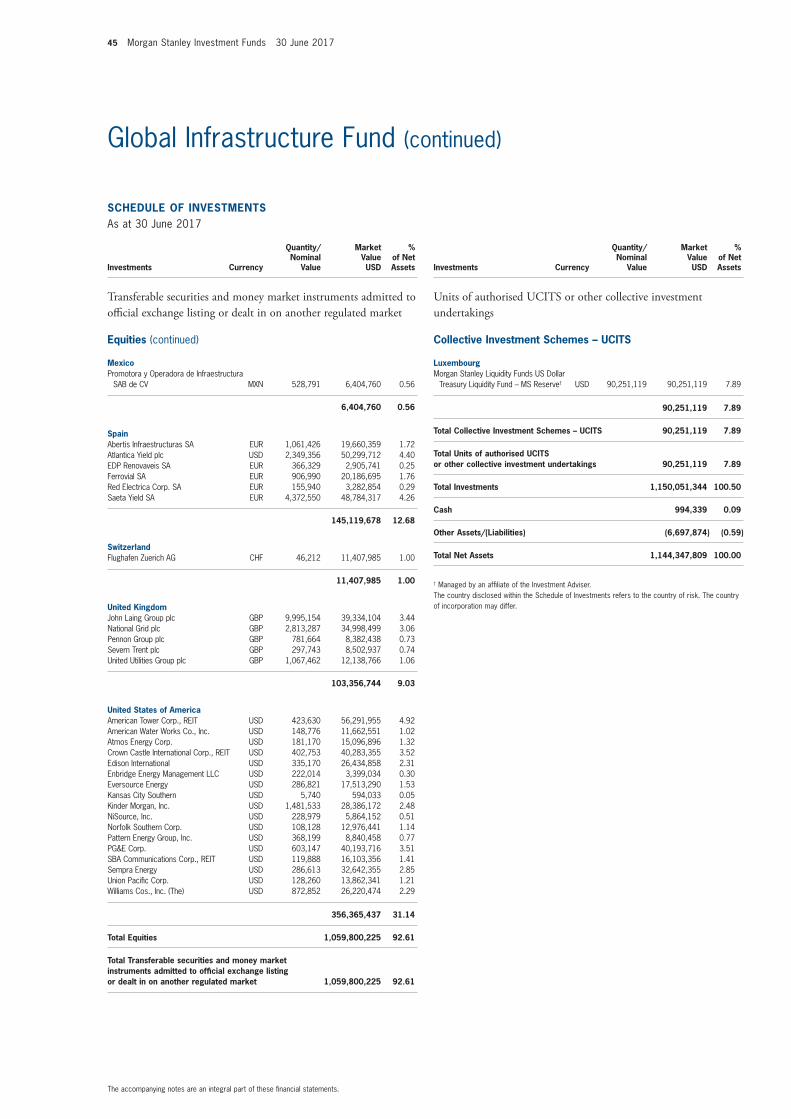
45 Morgan Stanley Investment Funds 30 June 2017
The accompanying notes are an integral part of these fi nancial statements.
Global Infrastructure Fund (continued)
SCHEDULE OF INVESTMENTSAs at 30 June 2017
Investments Currency
Quantity/Nominal
Value
Market Value USD
% of Net Assets
Transferable securities and money market instruments admitted to offi cial exchange listing or dealt in on another regulated market
Equities (continued)
MexicoPromotora y Operadora de Infraestructura
SAB de CV MXN 528,791 6,404,760 0.56
6,404,760 0.56
SpainAbertis Infraestructuras SA EUR 1,061,426 19,660,359 1.72 Atlantica Yield plc USD 2,349,356 50,299,712 4.40 EDP Renovaveis SA EUR 366,329 2,905,741 0.25 Ferrovial SA EUR 906,990 20,186,695 1.76 Red Electrica Corp. SA EUR 155,940 3,282,854 0.29 Saeta Yield SA EUR 4,372,550 48,784,317 4.26
145,119,678 12.68
SwitzerlandFlughafen Zuerich AG CHF 46,212 11,407,985 1.00
11,407,985 1.00
United KingdomJohn Laing Group plc GBP 9,995,154 39,334,104 3.44 National Grid plc GBP 2,813,287 34,998,499 3.06 Pennon Group plc GBP 781,664 8,382,438 0.73 Severn Trent plc GBP 297,743 8,502,937 0.74 United Utilities Group plc GBP 1,067,462 12,138,766 1.06
103,356,744 9.03
United States of AmericaAmerican Tower Corp., REIT USD 423,630 56,291,955 4.92 American Water Works Co., Inc. USD 148,776 11,662,551 1.02 Atmos Energy Corp. USD 181,170 15,096,896 1.32 Crown Castle International Corp., REIT USD 402,753 40,283,355 3.52 Edison International USD 335,170 26,434,858 2.31 Enbridge Energy Management LLC USD 222,014 3,399,034 0.30 Eversource Energy USD 286,821 17,513,290 1.53 Kansas City Southern USD 5,740 594,033 0.05 Kinder Morgan, Inc. USD 1,481,533 28,386,172 2.48 NiSource, Inc. USD 228,979 5,864,152 0.51 Norfolk Southern Corp. USD 108,128 12,976,441 1.14 Pattern Energy Group, Inc. USD 368,199 8,840,458 0.77 PG&E Corp. USD 603,147 40,193,716 3.51 SBA Communications Corp., REIT USD 119,888 16,103,356 1.41 Sempra Energy USD 286,613 32,642,355 2.85 Union Pacifi c Corp. USD 128,260 13,862,341 1.21 Williams Cos., Inc. (The) USD 872,852 26,220,474 2.29
356,365,437 31.14
Total Equities 1,059,800,225 92.61
Total Transferable securities and money market instruments admitted to offi cial exchange listing or dealt in on another regulated market 1,059,800,225 92.61
SCHEDULE OF INVESTMENTSAs at 30 June 2017
Investments Currency
Quantity/Nominal
Value
Market Value USD
% of Net Assets
Units of authorised UCITS or other collective investment undertakings
Collective Investment Schemes – UCITS
LuxembourgMorgan Stanley Liquidity Funds US Dollar
Treasury Liquidity Fund – MS Reserve† USD 90,251,119 90,251,119 7.89
90,251,119 7.89
Total Collective Investment Schemes – UCITS 90,251,119 7.89
Total Units of authorised UCITS or other collective investment undertakings 90,251,119 7.89
Total Investments 1,150,051,344 100.50
Cash 994,339 0.09
Other Assets/(Liabilities) (6,697,874) (0.59)
Total Net Assets 1,144,347,809 100.00
† Managed by an affi liate of the Investment Adviser.The country disclosed within the Schedule of Investments refers to the country of risk. The country of incorporation may differ.
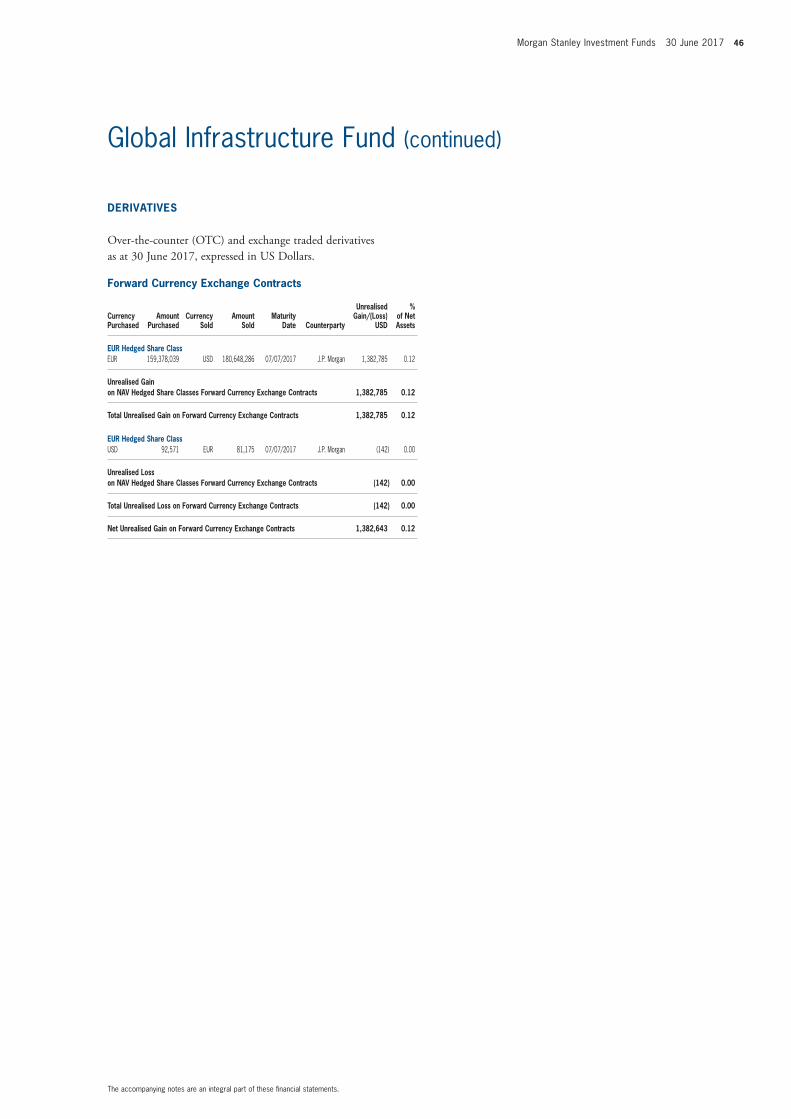
Morgan Stanley Investment Funds 30 June 2017 46
The accompanying notes are an integral part of these fi nancial statements.
Global Infrastructure Fund (continued)
Forward Currency Exchange Contracts
Currency Purchased
Amount Purchased
Currency Sold
Amount Sold
Maturity Date Counterparty
Unrealised Gain/(Loss)
USD
% of Net Assets
EUR Hedged Share ClassEUR 159,378,039 USD 180,648,286 07/07/2017 J.P. Morgan 1,382,785 0.12
Unrealised Gain on NAV Hedged Share Classes Forward Currency Exchange Contracts 1,382,785 0.12
Total Unrealised Gain on Forward Currency Exchange Contracts 1,382,785 0.12
EUR Hedged Share ClassUSD 92,571 EUR 81,175 07/07/2017 J.P. Morgan (142) 0.00
Unrealised Loss on NAV Hedged Share Classes Forward Currency Exchange Contracts (142) 0.00
Total Unrealised Loss on Forward Currency Exchange Contracts (142) 0.00
Net Unrealised Gain on Forward Currency Exchange Contracts 1,382,643 0.12
DERIVATIVES
Over-the-counter (OTC) and exchange traded derivatives as at 30 June 2017, expressed in US Dollars.

47 Morgan Stanley Investment Funds 30 June 2017
The accompanying notes are an integral part of these fi nancial statements.
Please refer to the full prospectus for the Fund’s investment objective and policy.
INVESTMENT AIM
To seek long-term capital appreciation measured in US Dollars through investment primarily in growth-oriented equity securities on a global basis. The investment process will emphasize a bottom-up stock selection process, seeking attractive investments on an individual company basis.
SCHEDULE OF INVESTMENTSAs at 30 June 2017
Investments Currency
Quantity/Nominal
Value
Market Value USD
% of Net Assets
Transferable securities and money market instruments admitted to offi cial exchange listing or dealt in on another regulated market
Equities
ArgentinaGlobant SA USD 591,267 25,548,647 1.14
25,548,647 1.14
BelgiumAnheuser-Busch InBev SA NV EUR 272,148 30,195,591 1.35
30,195,591 1.35
ChinaAlibaba Group Holding Ltd., ADR USD 330,679 46,443,866 2.08 China Resources Beer Holdings Co. Ltd. HKD 17,349,999 43,785,066 1.96 Foshan Haitian Flavouring & Food Co. Ltd. ‘A’ CNY 4,572,957 27,501,539 1.23 Jiangsu Hengrui Medicine Co. Ltd. ‘A’ CNY 3,233,500 24,124,049 1.08 Jiangsu Yanghe Brewery Joint-Stock Co.
Ltd. ‘A’ CNY 1,238,912 15,860,719 0.71 Suofeiya Home Collection Co. Ltd. ‘A’ CNY 5,274,872 31,893,960 1.42 TAL Education Group, ADR USD 1,124,404 135,996,664 6.08 Tencent Holdings Ltd. HKD 2,540,400 90,861,069 4.06
416,466,932 18.62
DenmarkDSV A/S DKK 1,519,739 93,285,779 4.17
93,285,779 4.17
FranceChristian Dior SE EUR 5,183 1,499,818 0.07 Christian Dior SE EUR 181,249 52,448,504 2.34 Hermes International EUR 173,626 86,338,388 3.86
140,286,710 6.27
IndiaHDFC Bank Ltd.* INR 1,944,928 50,107,747 2.24
50,107,747 2.24
JapanCalbee, Inc. JPY 1,482,700 58,366,729 2.61 Keyence Corp. JPY 82,600 36,337,961 1.63 Nihon M&A Center, Inc. JPY 581,700 21,316,811 0.95
116,021,501 5.19
South AfricaNaspers Ltd. ‘N’ ZAR 229,320 44,457,245 1.99
44,457,245 1.99
South KoreaLoen Entertainment, Inc. KRW 213,826 16,339,007 0.73
16,339,007 0.73
Global Opportunity Fund
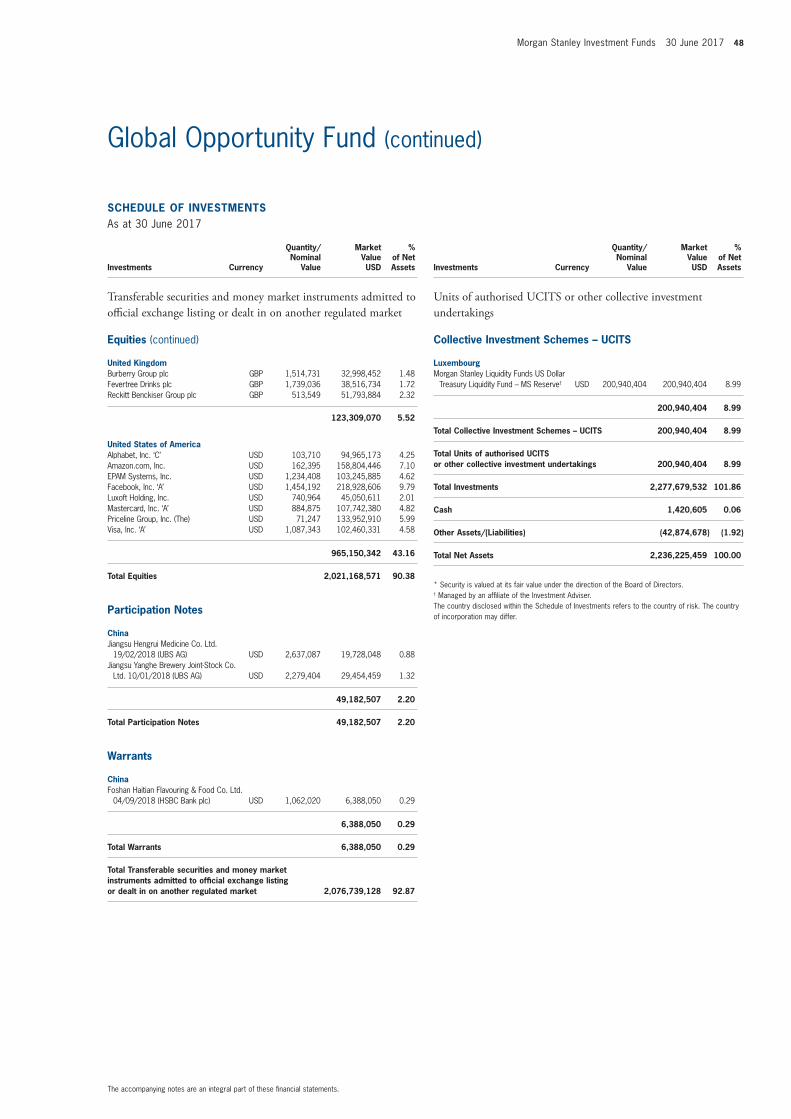
Morgan Stanley Investment Funds 30 June 2017 48
The accompanying notes are an integral part of these fi nancial statements.
Global Opportunity Fund (continued)
SCHEDULE OF INVESTMENTSAs at 30 June 2017
Investments Currency
Quantity/Nominal
Value
Market Value USD
% of Net Assets
Transferable securities and money market instruments admitted to offi cial exchange listing or dealt in on another regulated market
Equities (continued)
United KingdomBurberry Group plc GBP 1,514,731 32,998,452 1.48 Fevertree Drinks plc GBP 1,739,036 38,516,734 1.72 Reckitt Benckiser Group plc GBP 513,549 51,793,884 2.32
123,309,070 5.52
United States of AmericaAlphabet, Inc. ‘C’ USD 103,710 94,965,173 4.25 Amazon.com, Inc. USD 162,395 158,804,446 7.10 EPAM Systems, Inc. USD 1,234,408 103,245,885 4.62 Facebook, Inc. ‘A’ USD 1,454,192 218,928,606 9.79 Luxoft Holding, Inc. USD 740,964 45,050,611 2.01 Mastercard, Inc. ‘A’ USD 884,875 107,742,380 4.82 Priceline Group, Inc. (The) USD 71,247 133,952,910 5.99 Visa, Inc. ‘A’ USD 1,087,343 102,460,331 4.58
965,150,342 43.16
Total Equities 2,021,168,571 90.38
Participation Notes
ChinaJiangsu Hengrui Medicine Co. Ltd.
19/02/2018 (UBS AG) USD 2,637,087 19,728,048 0.88 Jiangsu Yanghe Brewery Joint-Stock Co.
Ltd. 10/01/2018 (UBS AG) USD 2,279,404 29,454,459 1.32
49,182,507 2.20
Total Participation Notes 49,182,507 2.20
Warrants
ChinaFoshan Haitian Flavouring & Food Co. Ltd.
04/09/2018 (HSBC Bank plc) USD 1,062,020 6,388,050 0.29
6,388,050 0.29
Total Warrants 6,388,050 0.29
Total Transferable securities and money market instruments admitted to offi cial exchange listing or dealt in on another regulated market 2,076,739,128 92.87
SCHEDULE OF INVESTMENTSAs at 30 June 2017
Investments Currency
Quantity/Nominal
Value
Market Value USD
% of Net Assets
Units of authorised UCITS or other collective investment undertakings
Collective Investment Schemes – UCITS
LuxembourgMorgan Stanley Liquidity Funds US Dollar
Treasury Liquidity Fund – MS Reserve† USD 200,940,404 200,940,404 8.99
200,940,404 8.99
Total Collective Investment Schemes – UCITS 200,940,404 8.99
Total Units of authorised UCITS or other collective investment undertakings 200,940,404 8.99
Total Investments 2,277,679,532 101.86
Cash 1,420,605 0.06
Other Assets/(Liabilities) (42,874,678) (1.92)
Total Net Assets 2,236,225,459 100.00
* Security is valued at its fair value under the direction of the Board of Directors.† Managed by an affi liate of the Investment Adviser.The country disclosed within the Schedule of Investments refers to the country of risk. The country of incorporation may differ.
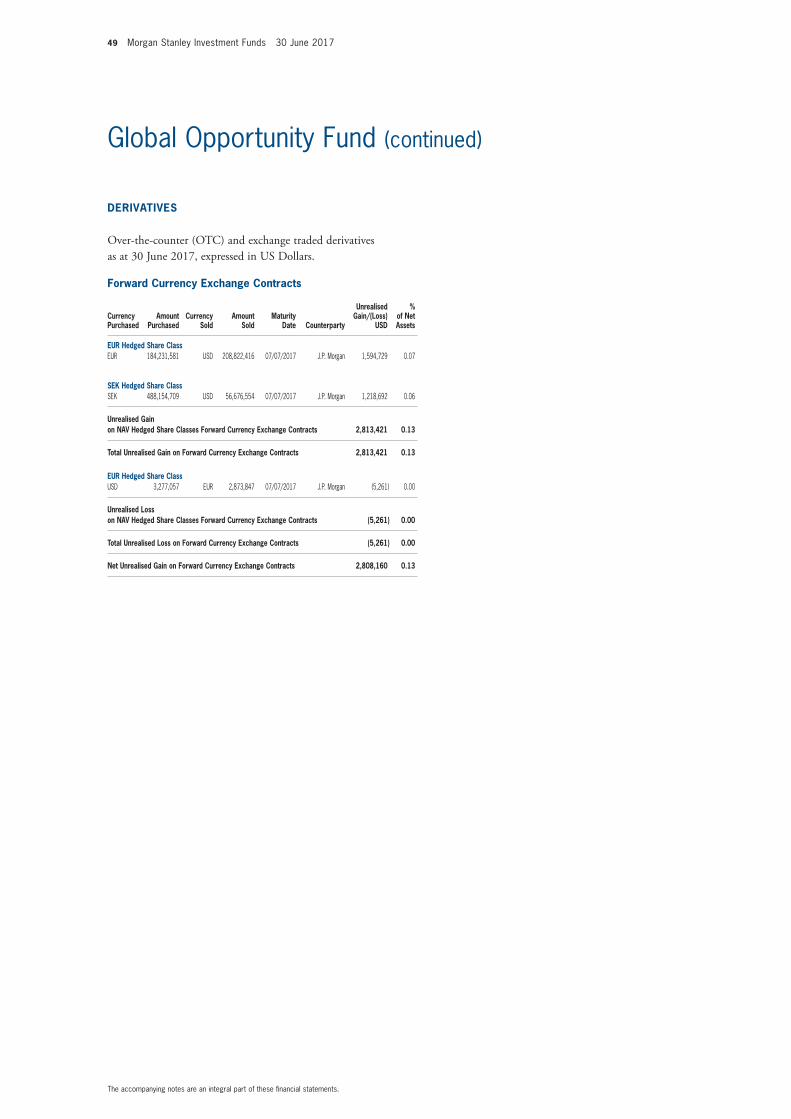
49 Morgan Stanley Investment Funds 30 June 2017
The accompanying notes are an integral part of these fi nancial statements.
Global Opportunity Fund (continued)
Forward Currency Exchange Contracts
Currency Purchased
Amount Purchased
Currency Sold
Amount Sold
Maturity Date Counterparty
Unrealised Gain/(Loss)
USD
% of Net Assets
EUR Hedged Share ClassEUR 184,231,581 USD 208,822,416 07/07/2017 J.P. Morgan 1,594,729 0.07
SEK Hedged Share ClassSEK 488,154,709 USD 56,676,554 07/07/2017 J.P. Morgan 1,218,692 0.06
Unrealised Gain on NAV Hedged Share Classes Forward Currency Exchange Contracts 2,813,421 0.13
Total Unrealised Gain on Forward Currency Exchange Contracts 2,813,421 0.13
EUR Hedged Share ClassUSD 3,277,057 EUR 2,873,847 07/07/2017 J.P. Morgan (5,261) 0.00
Unrealised Loss on NAV Hedged Share Classes Forward Currency Exchange Contracts (5,261) 0.00
Total Unrealised Loss on Forward Currency Exchange Contracts (5,261) 0.00
Net Unrealised Gain on Forward Currency Exchange Contracts 2,808,160 0.13
DERIVATIVES
Over-the-counter (OTC) and exchange traded derivatives as at 30 June 2017, expressed in US Dollars.
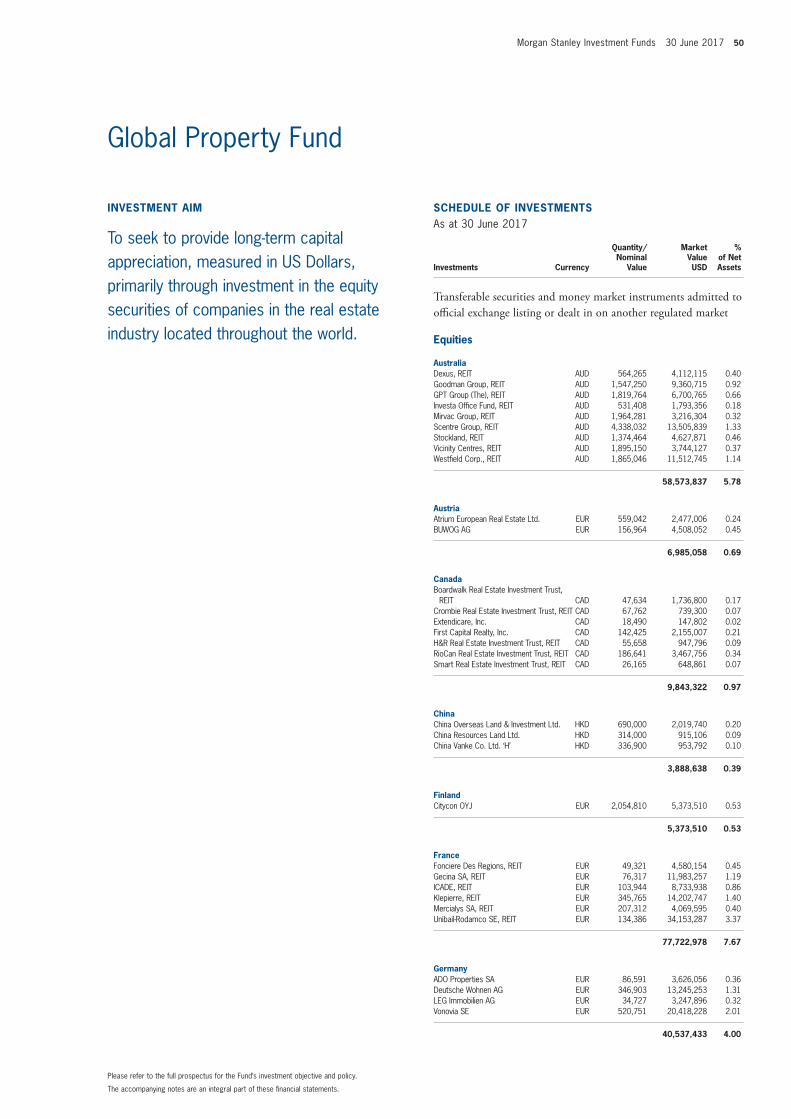
Morgan Stanley Investment Funds 30 June 2017 50
The accompanying notes are an integral part of these fi nancial statements.
Please refer to the full prospectus for the Fund’s investment objective and policy.
INVESTMENT AIM
To seek to provide long-term capital appreciation, measured in US Dollars, primarily through investment in the equity securities of companies in the real estate industry located throughout the world.
SCHEDULE OF INVESTMENTSAs at 30 June 2017
Investments Currency
Quantity/Nominal
Value
Market Value USD
% of Net Assets
Transferable securities and money market instruments admitted to offi cial exchange listing or dealt in on another regulated market
Equities
AustraliaDexus, REIT AUD 564,265 4,112,115 0.40 Goodman Group, REIT AUD 1,547,250 9,360,715 0.92 GPT Group (The), REIT AUD 1,819,764 6,700,765 0.66 Investa Offi ce Fund, REIT AUD 531,408 1,793,356 0.18 Mirvac Group, REIT AUD 1,964,281 3,216,304 0.32 Scentre Group, REIT AUD 4,338,032 13,505,839 1.33 Stockland, REIT AUD 1,374,464 4,627,871 0.46 Vicinity Centres, REIT AUD 1,895,150 3,744,127 0.37 Westfi eld Corp., REIT AUD 1,865,046 11,512,745 1.14
58,573,837 5.78
AustriaAtrium European Real Estate Ltd. EUR 559,042 2,477,006 0.24 BUWOG AG EUR 156,964 4,508,052 0.45
6,985,058 0.69
CanadaBoardwalk Real Estate Investment Trust,
REIT CAD 47,634 1,736,800 0.17 Crombie Real Estate Investment Trust, REIT CAD 67,762 739,300 0.07 Extendicare, Inc. CAD 18,490 147,802 0.02 First Capital Realty, Inc. CAD 142,425 2,155,007 0.21 H&R Real Estate Investment Trust, REIT CAD 55,658 947,796 0.09 RioCan Real Estate Investment Trust, REIT CAD 186,641 3,467,756 0.34 Smart Real Estate Investment Trust, REIT CAD 26,165 648,861 0.07
9,843,322 0.97
ChinaChina Overseas Land & Investment Ltd. HKD 690,000 2,019,740 0.20 China Resources Land Ltd. HKD 314,000 915,106 0.09 China Vanke Co. Ltd. ‘H’ HKD 336,900 953,792 0.10
3,888,638 0.39
FinlandCitycon OYJ EUR 2,054,810 5,373,510 0.53
5,373,510 0.53
FranceFonciere Des Regions, REIT EUR 49,321 4,580,154 0.45 Gecina SA, REIT EUR 76,317 11,983,257 1.19 ICADE, REIT EUR 103,944 8,733,938 0.86 Klepierre, REIT EUR 345,765 14,202,747 1.40 Mercialys SA, REIT EUR 207,312 4,069,595 0.40 Unibail-Rodamco SE, REIT EUR 134,386 34,153,287 3.37
77,722,978 7.67
GermanyADO Properties SA EUR 86,591 3,626,056 0.36 Deutsche Wohnen AG EUR 346,903 13,245,253 1.31 LEG Immobilien AG EUR 34,727 3,247,896 0.32 Vonovia SE EUR 520,751 20,418,228 2.01
40,537,433 4.00
Global Property Fund
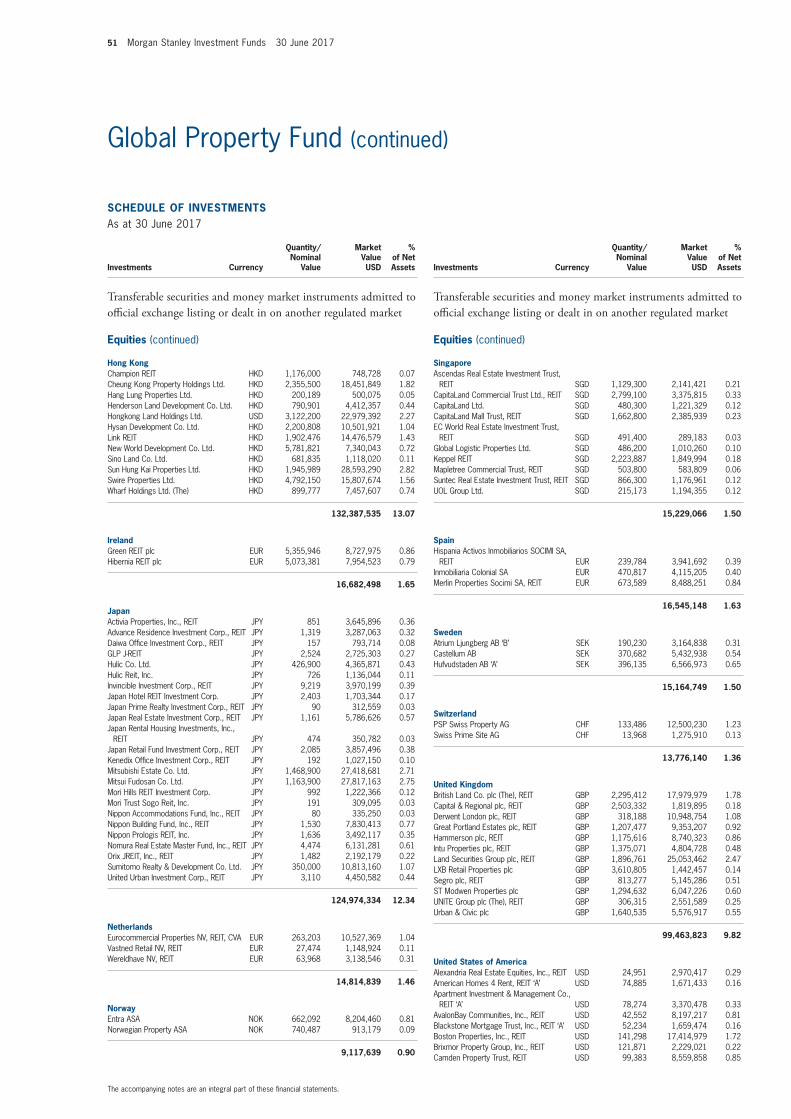
51 Morgan Stanley Investment Funds 30 June 2017
The accompanying notes are an integral part of these fi nancial statements.
Global Property Fund (continued)
SCHEDULE OF INVESTMENTSAs at 30 June 2017
Investments Currency
Quantity/Nominal
Value
Market Value USD
% of Net Assets
Transferable securities and money market instruments admitted to offi cial exchange listing or dealt in on another regulated market
Equities (continued)
Hong KongChampion REIT HKD 1,176,000 748,728 0.07 Cheung Kong Property Holdings Ltd. HKD 2,355,500 18,451,849 1.82 Hang Lung Properties Ltd. HKD 200,189 500,075 0.05 Henderson Land Development Co. Ltd. HKD 790,901 4,412,357 0.44 Hongkong Land Holdings Ltd. USD 3,122,200 22,979,392 2.27 Hysan Development Co. Ltd. HKD 2,200,808 10,501,921 1.04 Link REIT HKD 1,902,476 14,476,579 1.43 New World Development Co. Ltd. HKD 5,781,821 7,340,043 0.72 Sino Land Co. Ltd. HKD 681,835 1,118,020 0.11 Sun Hung Kai Properties Ltd. HKD 1,945,989 28,593,290 2.82 Swire Properties Ltd. HKD 4,792,150 15,807,674 1.56 Wharf Holdings Ltd. (The) HKD 899,777 7,457,607 0.74
132,387,535 13.07
IrelandGreen REIT plc EUR 5,355,946 8,727,975 0.86 Hibernia REIT plc EUR 5,073,381 7,954,523 0.79
16,682,498 1.65
JapanActivia Properties, Inc., REIT JPY 851 3,645,896 0.36 Advance Residence Investment Corp., REIT JPY 1,319 3,287,063 0.32 Daiwa Offi ce Investment Corp., REIT JPY 157 793,714 0.08 GLP J-REIT JPY 2,524 2,725,303 0.27 Hulic Co. Ltd. JPY 426,900 4,365,871 0.43 Hulic Reit, Inc. JPY 726 1,136,044 0.11 Invincible Investment Corp., REIT JPY 9,219 3,970,199 0.39 Japan Hotel REIT Investment Corp. JPY 2,403 1,703,344 0.17 Japan Prime Realty Investment Corp., REIT JPY 90 312,559 0.03 Japan Real Estate Investment Corp., REIT JPY 1,161 5,786,626 0.57 Japan Rental Housing Investments, Inc.,
REIT JPY 474 350,782 0.03 Japan Retail Fund Investment Corp., REIT JPY 2,085 3,857,496 0.38 Kenedix Offi ce Investment Corp., REIT JPY 192 1,027,150 0.10 Mitsubishi Estate Co. Ltd. JPY 1,468,900 27,418,681 2.71 Mitsui Fudosan Co. Ltd. JPY 1,163,900 27,817,163 2.75 Mori Hills REIT Investment Corp. JPY 992 1,222,366 0.12 Mori Trust Sogo Reit, Inc. JPY 191 309,095 0.03 Nippon Accommodations Fund, Inc., REIT JPY 80 335,250 0.03 Nippon Building Fund, Inc., REIT JPY 1,530 7,830,413 0.77 Nippon Prologis REIT, Inc. JPY 1,636 3,492,117 0.35 Nomura Real Estate Master Fund, Inc., REIT JPY 4,474 6,131,281 0.61 Orix JREIT, Inc., REIT JPY 1,482 2,192,179 0.22 Sumitomo Realty & Development Co. Ltd. JPY 350,000 10,813,160 1.07 United Urban Investment Corp., REIT JPY 3,110 4,450,582 0.44
124,974,334 12.34
NetherlandsEurocommercial Properties NV, REIT, CVA EUR 263,203 10,527,369 1.04 Vastned Retail NV, REIT EUR 27,474 1,148,924 0.11 Wereldhave NV, REIT EUR 63,968 3,138,546 0.31
14,814,839 1.46
NorwayEntra ASA NOK 662,092 8,204,460 0.81 Norwegian Property ASA NOK 740,487 913,179 0.09
9,117,639 0.90
SCHEDULE OF INVESTMENTSAs at 30 June 2017
Investments Currency
Quantity/Nominal
Value
Market Value USD
% of Net Assets
Transferable securities and money market instruments admitted to offi cial exchange listing or dealt in on another regulated market
Equities (continued)
SingaporeAscendas Real Estate Investment Trust,
REIT SGD 1,129,300 2,141,421 0.21 CapitaLand Commercial Trust Ltd., REIT SGD 2,799,100 3,375,815 0.33 CapitaLand Ltd. SGD 480,300 1,221,329 0.12 CapitaLand Mall Trust, REIT SGD 1,662,800 2,385,939 0.23 EC World Real Estate Investment Trust,
REIT SGD 491,400 289,183 0.03 Global Logistic Properties Ltd. SGD 486,200 1,010,260 0.10 Keppel REIT SGD 2,223,887 1,849,994 0.18 Mapletree Commercial Trust, REIT SGD 503,800 583,809 0.06 Suntec Real Estate Investment Trust, REIT SGD 866,300 1,176,961 0.12 UOL Group Ltd. SGD 215,173 1,194,355 0.12
15,229,066 1.50
SpainHispania Activos Inmobiliarios SOCIMI SA,
REIT EUR 239,784 3,941,692 0.39 Inmobiliaria Colonial SA EUR 470,817 4,115,205 0.40 Merlin Properties Socimi SA, REIT EUR 673,589 8,488,251 0.84
16,545,148 1.63
SwedenAtrium Ljungberg AB ‘B’ SEK 190,230 3,164,838 0.31 Castellum AB SEK 370,682 5,432,938 0.54 Hufvudstaden AB ‘A’ SEK 396,135 6,566,973 0.65
15,164,749 1.50
SwitzerlandPSP Swiss Property AG CHF 133,486 12,500,230 1.23 Swiss Prime Site AG CHF 13,968 1,275,910 0.13
13,776,140 1.36
United KingdomBritish Land Co. plc (The), REIT GBP 2,295,412 17,979,979 1.78 Capital & Regional plc, REIT GBP 2,503,332 1,819,895 0.18 Derwent London plc, REIT GBP 318,188 10,948,754 1.08 Great Portland Estates plc, REIT GBP 1,207,477 9,353,207 0.92 Hammerson plc, REIT GBP 1,175,616 8,740,323 0.86 Intu Properties plc, REIT GBP 1,375,071 4,804,728 0.48 Land Securities Group plc, REIT GBP 1,896,761 25,053,462 2.47 LXB Retail Properties plc GBP 3,610,805 1,442,457 0.14 Segro plc, REIT GBP 813,277 5,145,286 0.51 ST Modwen Properties plc GBP 1,294,632 6,047,226 0.60 UNITE Group plc (The), REIT GBP 306,315 2,551,589 0.25 Urban & Civic plc GBP 1,640,535 5,576,917 0.55
99,463,823 9.82
United States of AmericaAlexandria Real Estate Equities, Inc., REIT USD 24,951 2,970,417 0.29 American Homes 4 Rent, REIT ‘A’ USD 74,885 1,671,433 0.16 Apartment Investment & Management Co.,
REIT ‘A’ USD 78,274 3,370,478 0.33 AvalonBay Communities, Inc., REIT USD 42,552 8,197,217 0.81 Blackstone Mortgage Trust, Inc., REIT ‘A’ USD 52,234 1,659,474 0.16 Boston Properties, Inc., REIT USD 141,298 17,414,979 1.72 Brixmor Property Group, Inc., REIT USD 121,871 2,229,021 0.22 Camden Property Trust, REIT USD 99,383 8,559,858 0.85
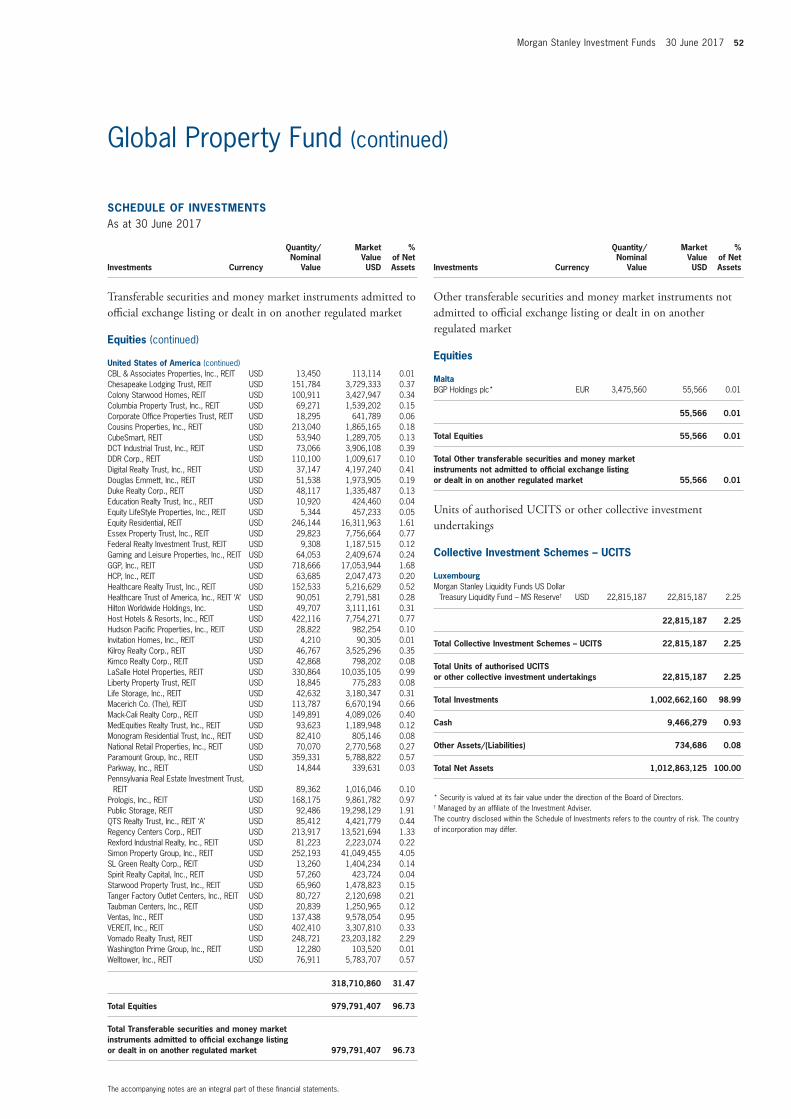
Morgan Stanley Investment Funds 30 June 2017 52
The accompanying notes are an integral part of these fi nancial statements.
Global Property Fund (continued)
SCHEDULE OF INVESTMENTSAs at 30 June 2017
Investments Currency
Quantity/Nominal
Value
Market Value USD
% of Net Assets
Transferable securities and money market instruments admitted to offi cial exchange listing or dealt in on another regulated market
Equities (continued)
United States of America (continued)CBL & Associates Properties, Inc., REIT USD 13,450 113,114 0.01 Chesapeake Lodging Trust, REIT USD 151,784 3,729,333 0.37 Colony Starwood Homes, REIT USD 100,911 3,427,947 0.34 Columbia Property Trust, Inc., REIT USD 69,271 1,539,202 0.15 Corporate Offi ce Properties Trust, REIT USD 18,295 641,789 0.06 Cousins Properties, Inc., REIT USD 213,040 1,865,165 0.18 CubeSmart, REIT USD 53,940 1,289,705 0.13 DCT Industrial Trust, Inc., REIT USD 73,066 3,906,108 0.39 DDR Corp., REIT USD 110,100 1,009,617 0.10 Digital Realty Trust, Inc., REIT USD 37,147 4,197,240 0.41 Douglas Emmett, Inc., REIT USD 51,538 1,973,905 0.19 Duke Realty Corp., REIT USD 48,117 1,335,487 0.13 Education Realty Trust, Inc., REIT USD 10,920 424,460 0.04 Equity LifeStyle Properties, Inc., REIT USD 5,344 457,233 0.05 Equity Residential, REIT USD 246,144 16,311,963 1.61 Essex Property Trust, Inc., REIT USD 29,823 7,756,664 0.77 Federal Realty Investment Trust, REIT USD 9,308 1,187,515 0.12 Gaming and Leisure Properties, Inc., REIT USD 64,053 2,409,674 0.24 GGP, Inc., REIT USD 718,666 17,053,944 1.68 HCP, Inc., REIT USD 63,685 2,047,473 0.20 Healthcare Realty Trust, Inc., REIT USD 152,533 5,216,629 0.52 Healthcare Trust of America, Inc., REIT ‘A’ USD 90,051 2,791,581 0.28 Hilton Worldwide Holdings, Inc. USD 49,707 3,111,161 0.31 Host Hotels & Resorts, Inc., REIT USD 422,116 7,754,271 0.77 Hudson Pacifi c Properties, Inc., REIT USD 28,822 982,254 0.10 Invitation Homes, Inc., REIT USD 4,210 90,305 0.01 Kilroy Realty Corp., REIT USD 46,767 3,525,296 0.35 Kimco Realty Corp., REIT USD 42,868 798,202 0.08 LaSalle Hotel Properties, REIT USD 330,864 10,035,105 0.99 Liberty Property Trust, REIT USD 18,845 775,283 0.08 Life Storage, Inc., REIT USD 42,632 3,180,347 0.31 Macerich Co. (The), REIT USD 113,787 6,670,194 0.66 Mack-Cali Realty Corp., REIT USD 149,891 4,089,026 0.40 MedEquities Realty Trust, Inc., REIT USD 93,623 1,189,948 0.12 Monogram Residential Trust, Inc., REIT USD 82,410 805,146 0.08 National Retail Properties, Inc., REIT USD 70,070 2,770,568 0.27 Paramount Group, Inc., REIT USD 359,331 5,788,822 0.57 Parkway, Inc., REIT USD 14,844 339,631 0.03 Pennsylvania Real Estate Investment Trust,
REIT USD 89,362 1,016,046 0.10 Prologis, Inc., REIT USD 168,175 9,861,782 0.97 Public Storage, REIT USD 92,486 19,298,129 1.91 QTS Realty Trust, Inc., REIT ‘A’ USD 85,412 4,421,779 0.44 Regency Centers Corp., REIT USD 213,917 13,521,694 1.33 Rexford Industrial Realty, Inc., REIT USD 81,223 2,223,074 0.22 Simon Property Group, Inc., REIT USD 252,193 41,049,455 4.05 SL Green Realty Corp., REIT USD 13,260 1,404,234 0.14 Spirit Realty Capital, Inc., REIT USD 57,260 423,724 0.04 Starwood Property Trust, Inc., REIT USD 65,960 1,478,823 0.15 Tanger Factory Outlet Centers, Inc., REIT USD 80,727 2,120,698 0.21 Taubman Centers, Inc., REIT USD 20,839 1,250,965 0.12 Ventas, Inc., REIT USD 137,438 9,578,054 0.95 VEREIT, Inc., REIT USD 402,410 3,307,810 0.33 Vornado Realty Trust, REIT USD 248,721 23,203,182 2.29 Washington Prime Group, Inc., REIT USD 12,280 103,520 0.01 Welltower, Inc., REIT USD 76,911 5,783,707 0.57
318,710,860 31.47
Total Equities 979,791,407 96.73
Total Transferable securities and money market instruments admitted to offi cial exchange listing or dealt in on another regulated market 979,791,407 96.73
SCHEDULE OF INVESTMENTSAs at 30 June 2017
Investments Currency
Quantity/Nominal
Value
Market Value USD
% of Net Assets
Other transferable securities and money market instruments not admitted to offi cial exchange listing or dealt in on another regulated market
Equities
MaltaBGP Holdings plc* EUR 3,475,560 55,566 0.01
55,566 0.01
Total Equities 55,566 0.01
Total Other transferable securities and money market instruments not admitted to offi cial exchange listing or dealt in on another regulated market 55,566 0.01
Units of authorised UCITS or other collective investment undertakings
Collective Investment Schemes – UCITS
LuxembourgMorgan Stanley Liquidity Funds US Dollar
Treasury Liquidity Fund – MS Reserve† USD 22,815,187 22,815,187 2.25
22,815,187 2.25
Total Collective Investment Schemes – UCITS 22,815,187 2.25
Total Units of authorised UCITS or other collective investment undertakings 22,815,187 2.25
Total Investments 1,002,662,160 98.99
Cash 9,466,279 0.93
Other Assets/(Liabilities) 734,686 0.08
Total Net Assets 1,012,863,125 100.00
* Security is valued at its fair value under the direction of the Board of Directors.† Managed by an affi liate of the Investment Adviser.The country disclosed within the Schedule of Investments refers to the country of risk. The country of incorporation may differ.
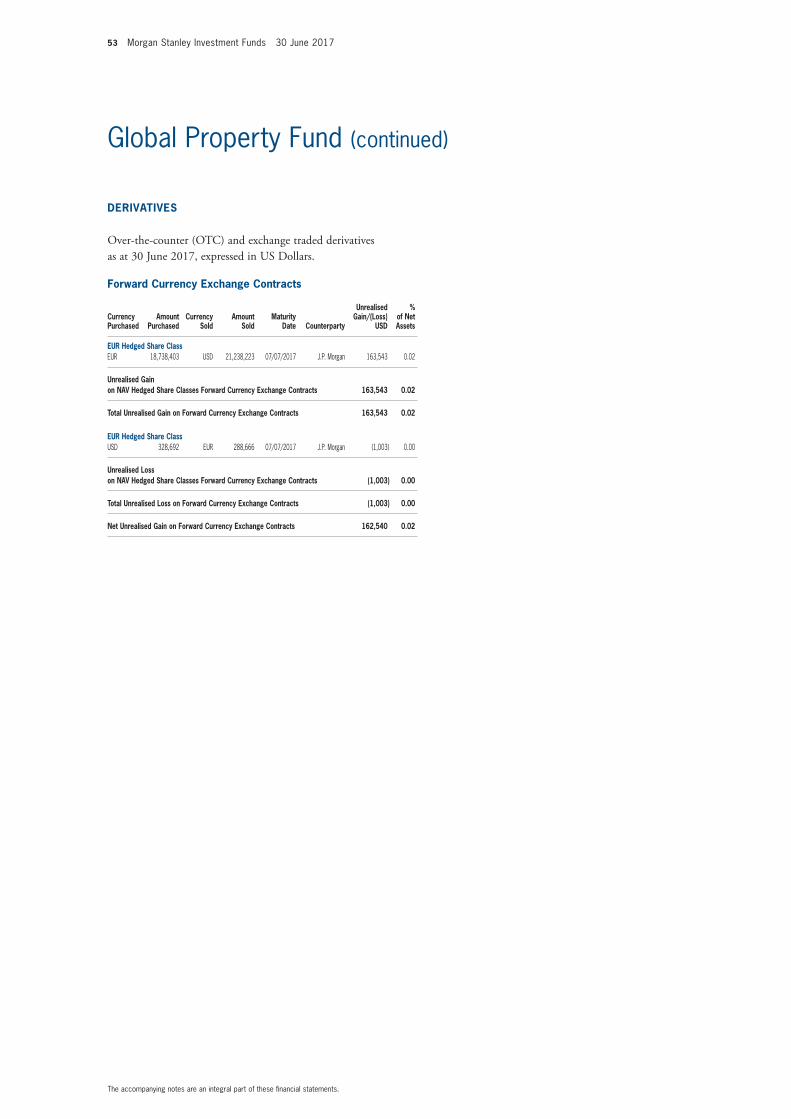
53 Morgan Stanley Investment Funds 30 June 2017
The accompanying notes are an integral part of these fi nancial statements.
Global Property Fund (continued)
Forward Currency Exchange Contracts
Currency Purchased
Amount Purchased
Currency Sold
Amount Sold
Maturity Date Counterparty
Unrealised Gain/(Loss)
USD
% of Net Assets
EUR Hedged Share ClassEUR 18,738,403 USD 21,238,223 07/07/2017 J.P. Morgan 163,543 0.02
Unrealised Gain on NAV Hedged Share Classes Forward Currency Exchange Contracts 163,543 0.02
Total Unrealised Gain on Forward Currency Exchange Contracts 163,543 0.02
EUR Hedged Share ClassUSD 328,692 EUR 288,666 07/07/2017 J.P. Morgan (1,003) 0.00
Unrealised Loss on NAV Hedged Share Classes Forward Currency Exchange Contracts (1,003) 0.00
Total Unrealised Loss on Forward Currency Exchange Contracts (1,003) 0.00
Net Unrealised Gain on Forward Currency Exchange Contracts 162,540 0.02
DERIVATIVES
Over-the-counter (OTC) and exchange traded derivatives as at 30 June 2017, expressed in US Dollars.
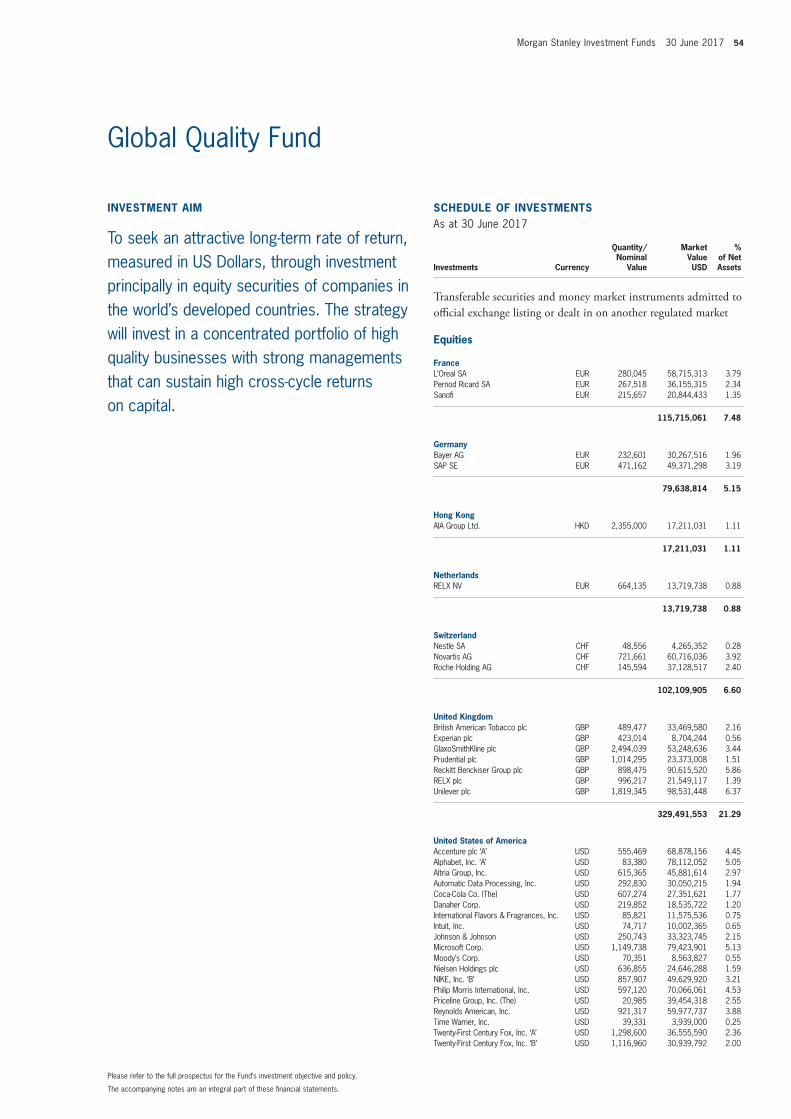
Morgan Stanley Investment Funds 30 June 2017 54
The accompanying notes are an integral part of these fi nancial statements.
Please refer to the full prospectus for the Fund’s investment objective and policy.
INVESTMENT AIM
To seek an attractive long-term rate of return, measured in US Dollars, through investment principally in equity securities of companies in the world’s developed countries. The strategy will invest in a concentrated portfolio of high quality businesses with strong managements that can sustain high cross-cycle returns on capital.
SCHEDULE OF INVESTMENTSAs at 30 June 2017
Investments Currency
Quantity/Nominal
Value
Market Value USD
% of Net Assets
Transferable securities and money market instruments admitted to offi cial exchange listing or dealt in on another regulated market
Equities
FranceL’Oreal SA EUR 280,045 58,715,313 3.79 Pernod Ricard SA EUR 267,518 36,155,315 2.34 Sanofi EUR 215,657 20,844,433 1.35
115,715,061 7.48
GermanyBayer AG EUR 232,601 30,267,516 1.96 SAP SE EUR 471,162 49,371,298 3.19
79,638,814 5.15
Hong KongAIA Group Ltd. HKD 2,355,000 17,211,031 1.11
17,211,031 1.11
NetherlandsRELX NV EUR 664,135 13,719,738 0.88
13,719,738 0.88
SwitzerlandNestle SA CHF 48,556 4,265,352 0.28 Novartis AG CHF 721,661 60,716,036 3.92 Roche Holding AG CHF 145,594 37,128,517 2.40
102,109,905 6.60
United KingdomBritish American Tobacco plc GBP 489,477 33,469,580 2.16 Experian plc GBP 423,014 8,704,244 0.56 GlaxoSmithKline plc GBP 2,494,039 53,248,636 3.44 Prudential plc GBP 1,014,295 23,373,008 1.51 Reckitt Benckiser Group plc GBP 898,475 90,615,520 5.86 RELX plc GBP 996,217 21,549,117 1.39 Unilever plc GBP 1,819,345 98,531,448 6.37
329,491,553 21.29
United States of AmericaAccenture plc ‘A’ USD 555,469 68,878,156 4.45 Alphabet, Inc. ‘A’ USD 83,380 78,112,052 5.05 Altria Group, Inc. USD 615,365 45,881,614 2.97 Automatic Data Processing, Inc. USD 292,830 30,050,215 1.94 Coca-Cola Co. (The) USD 607,274 27,351,621 1.77 Danaher Corp. USD 219,852 18,535,722 1.20 International Flavors & Fragrances, Inc. USD 85,821 11,575,536 0.75 Intuit, Inc. USD 74,717 10,002,365 0.65 Johnson & Johnson USD 250,743 33,323,745 2.15 Microsoft Corp. USD 1,149,738 79,423,901 5.13 Moody’s Corp. USD 70,351 8,563,827 0.55 Nielsen Holdings plc USD 636,855 24,646,288 1.59 NIKE, Inc. ‘B’ USD 857,907 49,629,920 3.21 Philip Morris International, Inc. USD 597,120 70,066,061 4.53 Priceline Group, Inc. (The) USD 20,985 39,454,318 2.55 Reynolds American, Inc. USD 921,317 59,977,737 3.88 Time Warner, Inc. USD 39,331 3,939,000 0.25 Twenty-First Century Fox, Inc. ‘A’ USD 1,298,600 36,555,590 2.36 Twenty-First Century Fox, Inc. ‘B’ USD 1,116,960 30,939,792 2.00
Global Quality Fund
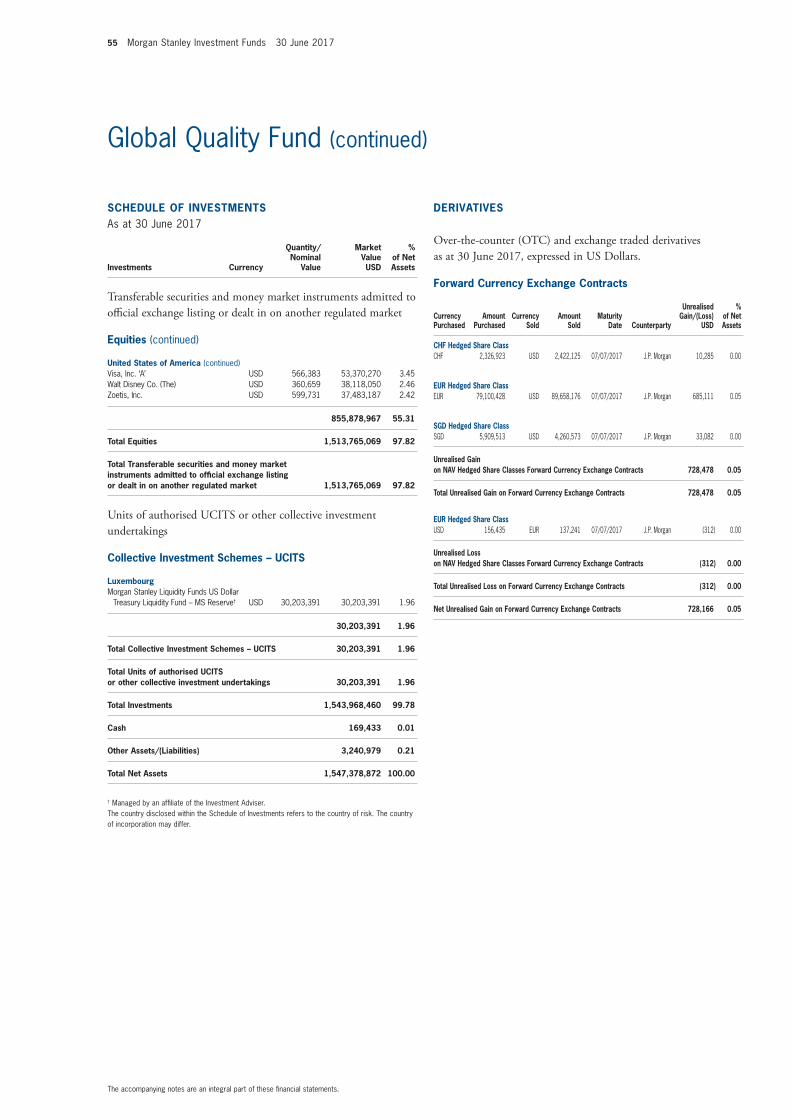
55 Morgan Stanley Investment Funds 30 June 2017
The accompanying notes are an integral part of these fi nancial statements.
Global Quality Fund (continued)
SCHEDULE OF INVESTMENTSAs at 30 June 2017
Investments Currency
Quantity/Nominal
Value
Market Value USD
% of Net Assets
Transferable securities and money market instruments admitted to offi cial exchange listing or dealt in on another regulated market
Equities (continued)
United States of America (continued)Visa, Inc. ‘A’ USD 566,383 53,370,270 3.45 Walt Disney Co. (The) USD 360,659 38,118,050 2.46 Zoetis, Inc. USD 599,731 37,483,187 2.42
855,878,967 55.31
Total Equities 1,513,765,069 97.82
Total Transferable securities and money market instruments admitted to offi cial exchange listing or dealt in on another regulated market 1,513,765,069 97.82
Units of authorised UCITS or other collective investment undertakings
Collective Investment Schemes – UCITS
LuxembourgMorgan Stanley Liquidity Funds US Dollar
Treasury Liquidity Fund – MS Reserve† USD 30,203,391 30,203,391 1.96
30,203,391 1.96
Total Collective Investment Schemes – UCITS 30,203,391 1.96
Total Units of authorised UCITS or other collective investment undertakings 30,203,391 1.96
Total Investments 1,543,968,460 99.78
Cash 169,433 0.01
Other Assets/(Liabilities) 3,240,979 0.21
Total Net Assets 1,547,378,872 100.00
† Managed by an affi liate of the Investment Adviser.The country disclosed within the Schedule of Investments refers to the country of risk. The country of incorporation may differ.
Forward Currency Exchange Contracts
Currency Purchased
Amount Purchased
Currency Sold
Amount Sold
Maturity Date Counterparty
Unrealised Gain/(Loss)
USD
% of Net Assets
CHF Hedged Share ClassCHF 2,326,923 USD 2,422,125 07/07/2017 J.P. Morgan 10,285 0.00
EUR Hedged Share ClassEUR 79,100,428 USD 89,658,176 07/07/2017 J.P. Morgan 685,111 0.05
SGD Hedged Share ClassSGD 5,909,513 USD 4,260,573 07/07/2017 J.P. Morgan 33,082 0.00
Unrealised Gain on NAV Hedged Share Classes Forward Currency Exchange Contracts 728,478 0.05
Total Unrealised Gain on Forward Currency Exchange Contracts 728,478 0.05
EUR Hedged Share ClassUSD 156,435 EUR 137,241 07/07/2017 J.P. Morgan (312) 0.00
Unrealised Loss on NAV Hedged Share Classes Forward Currency Exchange Contracts (312) 0.00
Total Unrealised Loss on Forward Currency Exchange Contracts (312) 0.00
Net Unrealised Gain on Forward Currency Exchange Contracts 728,166 0.05
DERIVATIVES
Over-the-counter (OTC) and exchange traded derivatives as at 30 June 2017, expressed in US Dollars.
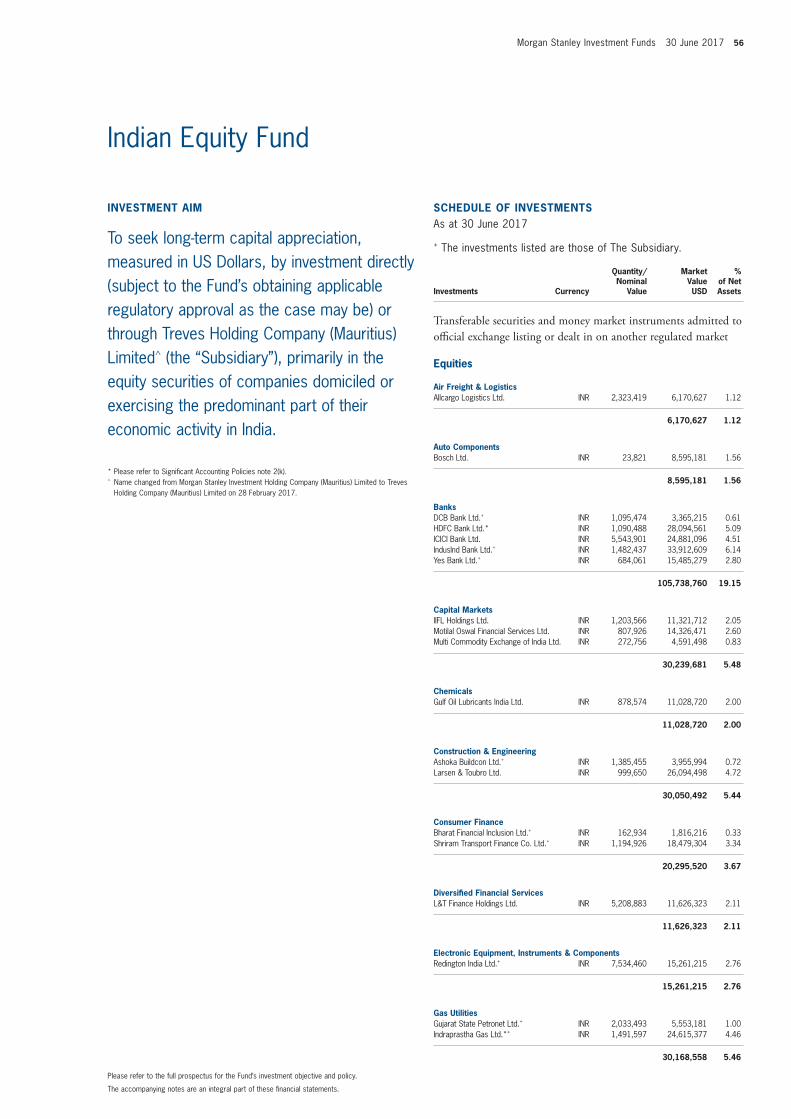
Morgan Stanley Investment Funds 30 June 2017 56
The accompanying notes are an integral part of these fi nancial statements.
Please refer to the full prospectus for the Fund’s investment objective and policy.
INVESTMENT AIM
To seek long-term capital appreciation, measured in US Dollars, by investment directly (subject to the Fund’s obtaining applicable regulatory approval as the case may be) or through Treves Holding Company (Mauritius) Limited^ (the “Subsidiary”), primarily in the equity securities of companies domiciled or exercising the predominant part of their economic activity in India.
* Please refer to Signifi cant Accounting Policies note 2(k).^ Name changed from Morgan Stanley Investment Holding Company (Mauritius) Limited to Treves
Holding Company (Mauritius) Limited on 28 February 2017.
SCHEDULE OF INVESTMENTSAs at 30 June 2017
+ The investments listed are those of The Subsidiary.
Investments Currency
Quantity/Nominal
Value
Market Value USD
% of Net Assets
Transferable securities and money market instruments admitted to offi cial exchange listing or dealt in on another regulated market
Equities
Air Freight & LogisticsAllcargo Logistics Ltd. INR 2,323,419 6,170,627 1.12
6,170,627 1.12
Auto ComponentsBosch Ltd. INR 23,821 8,595,181 1.56
8,595,181 1.56
BanksDCB Bank Ltd.+ INR 1,095,474 3,365,215 0.61 HDFC Bank Ltd.* INR 1,090,488 28,094,561 5.09 ICICI Bank Ltd. INR 5,543,901 24,881,096 4.51 IndusInd Bank Ltd.+ INR 1,482,437 33,912,609 6.14 Yes Bank Ltd.+ INR 684,061 15,485,279 2.80
105,738,760 19.15
Capital MarketsIIFL Holdings Ltd. INR 1,203,566 11,321,712 2.05 Motilal Oswal Financial Services Ltd. INR 807,926 14,326,471 2.60 Multi Commodity Exchange of India Ltd. INR 272,756 4,591,498 0.83
30,239,681 5.48
ChemicalsGulf Oil Lubricants India Ltd. INR 878,574 11,028,720 2.00
11,028,720 2.00
Construction & EngineeringAshoka Buildcon Ltd.+ INR 1,385,455 3,955,994 0.72 Larsen & Toubro Ltd. INR 999,650 26,094,498 4.72
30,050,492 5.44
Consumer FinanceBharat Financial Inclusion Ltd.+ INR 162,934 1,816,216 0.33 Shriram Transport Finance Co. Ltd.+ INR 1,194,926 18,479,304 3.34
20,295,520 3.67
Diversifi ed Financial ServicesL&T Finance Holdings Ltd. INR 5,208,883 11,626,323 2.11
11,626,323 2.11
Electronic Equipment, Instruments & ComponentsRedington India Ltd.+ INR 7,534,460 15,261,215 2.76
15,261,215 2.76
Gas UtilitiesGujarat State Petronet Ltd.+ INR 2,033,493 5,553,181 1.00 Indraprastha Gas Ltd.*+ INR 1,491,597 24,615,377 4.46
30,168,558 5.46
Indian Equity Fund
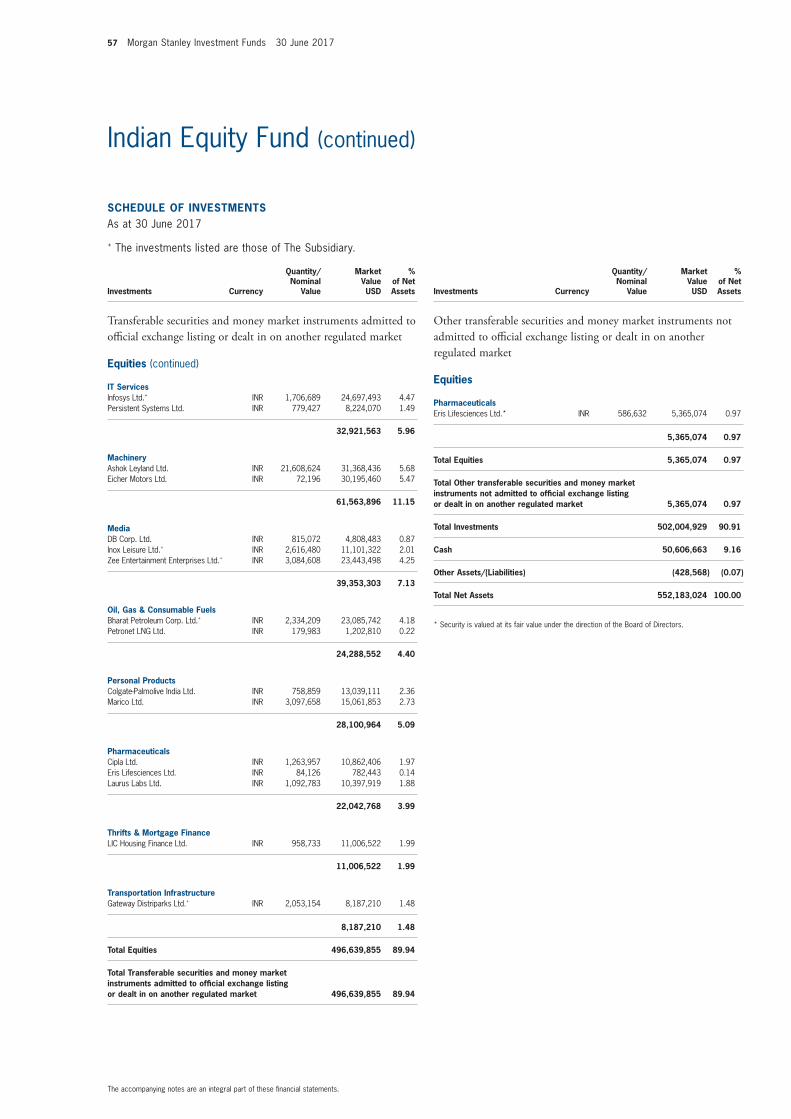
57 Morgan Stanley Investment Funds 30 June 2017
The accompanying notes are an integral part of these fi nancial statements.
Indian Equity Fund (continued)
SCHEDULE OF INVESTMENTSAs at 30 June 2017
+ The investments listed are those of The Subsidiary.
Investments Currency
Quantity/Nominal
Value
Market Value USD
% of Net Assets
Transferable securities and money market instruments admitted to offi cial exchange listing or dealt in on another regulated market
Equities (continued)
IT ServicesInfosys Ltd.+ INR 1,706,689 24,697,493 4.47 Persistent Systems Ltd. INR 779,427 8,224,070 1.49
32,921,563 5.96
MachineryAshok Leyland Ltd. INR 21,608,624 31,368,436 5.68 Eicher Motors Ltd. INR 72,196 30,195,460 5.47
61,563,896 11.15
MediaDB Corp. Ltd. INR 815,072 4,808,483 0.87 Inox Leisure Ltd.+ INR 2,616,480 11,101,322 2.01 Zee Entertainment Enterprises Ltd.+ INR 3,084,608 23,443,498 4.25
39,353,303 7.13
Oil, Gas & Consumable FuelsBharat Petroleum Corp. Ltd.+ INR 2,334,209 23,085,742 4.18 Petronet LNG Ltd. INR 179,983 1,202,810 0.22
24,288,552 4.40
Personal ProductsColgate-Palmolive India Ltd. INR 758,859 13,039,111 2.36 Marico Ltd. INR 3,097,658 15,061,853 2.73
28,100,964 5.09
PharmaceuticalsCipla Ltd. INR 1,263,957 10,862,406 1.97 Eris Lifesciences Ltd. INR 84,126 782,443 0.14 Laurus Labs Ltd. INR 1,092,783 10,397,919 1.88
22,042,768 3.99
Thrifts & Mortgage FinanceLIC Housing Finance Ltd. INR 958,733 11,006,522 1.99
11,006,522 1.99
Transportation InfrastructureGateway Distriparks Ltd.+ INR 2,053,154 8,187,210 1.48
8,187,210 1.48
Total Equities 496,639,855 89.94
Total Transferable securities and money market instruments admitted to offi cial exchange listing or dealt in on another regulated market 496,639,855 89.94
SCHEDULE OF INVESTMENTSAs at 30 June 2017
Investments Currency
Quantity/Nominal
Value
Market Value USD
% of Net Assets
Other transferable securities and money market instruments not admitted to offi cial exchange listing or dealt in on another regulated market
Equities
PharmaceuticalsEris Lifesciences Ltd.* INR 586,632 5,365,074 0.97
5,365,074 0.97
Total Equities 5,365,074 0.97
Total Other transferable securities and money market instruments not admitted to offi cial exchange listing or dealt in on another regulated market 5,365,074 0.97
Total Investments 502,004,929 90.91
Cash 50,606,663 9.16
Other Assets/(Liabilities) (428,568) (0.07)
Total Net Assets 552,183,024 100.00
* Security is valued at its fair value under the direction of the Board of Directors.
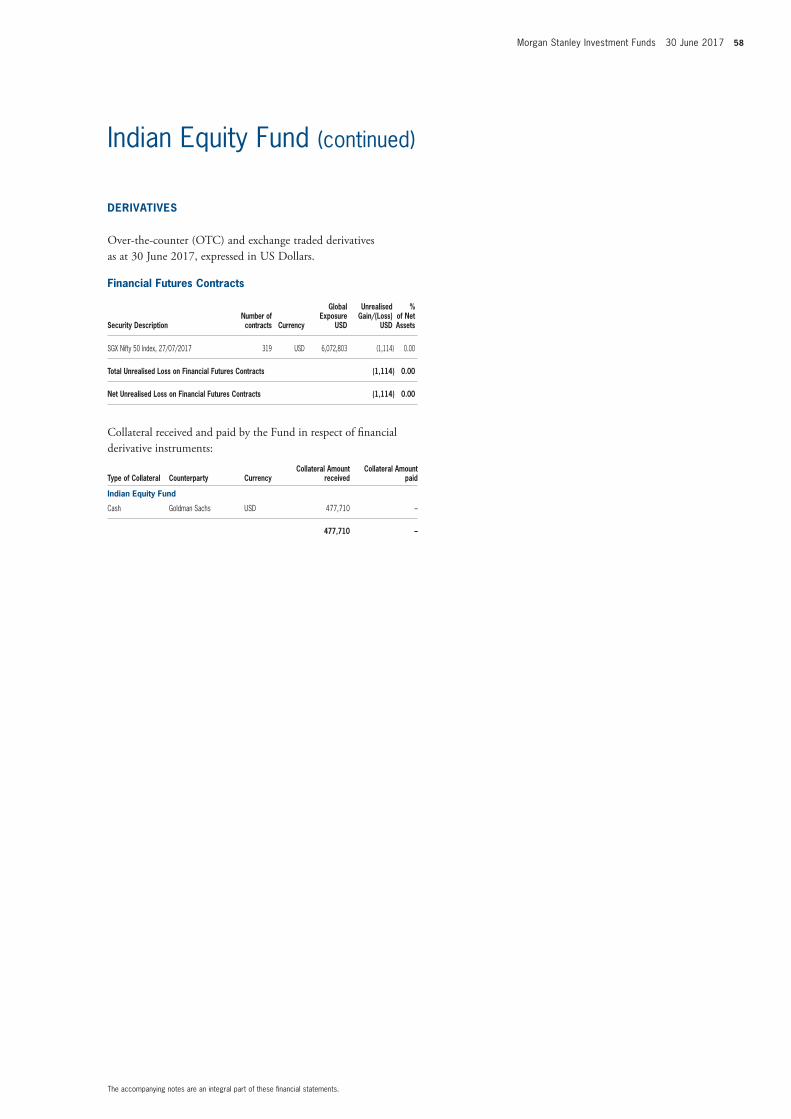
Morgan Stanley Investment Funds 30 June 2017 58
The accompanying notes are an integral part of these fi nancial statements.
Indian Equity Fund (continued)
Financial Futures Contracts
Security DescriptionNumber of contracts Currency
Global Exposure
USD
Unrealised Gain/(Loss)
USD
% of Net Assets
SGX Nifty 50 Index, 27/07/2017 319 USD 6,072,803 (1,114) 0.00
Total Unrealised Loss on Financial Futures Contracts (1,114) 0.00
Net Unrealised Loss on Financial Futures Contracts (1,114) 0.00
Collateral received and paid by the Fund in respect of fi nancial derivative instruments:
Type of Collateral Counterparty CurrencyCollateral Amount
receivedCollateral Amount
paid
Indian Equity Fund
Cash Goldman Sachs USD 477,710 –
477,710 –
DERIVATIVES
Over-the-counter (OTC) and exchange traded derivatives as at 30 June 2017, expressed in US Dollars.
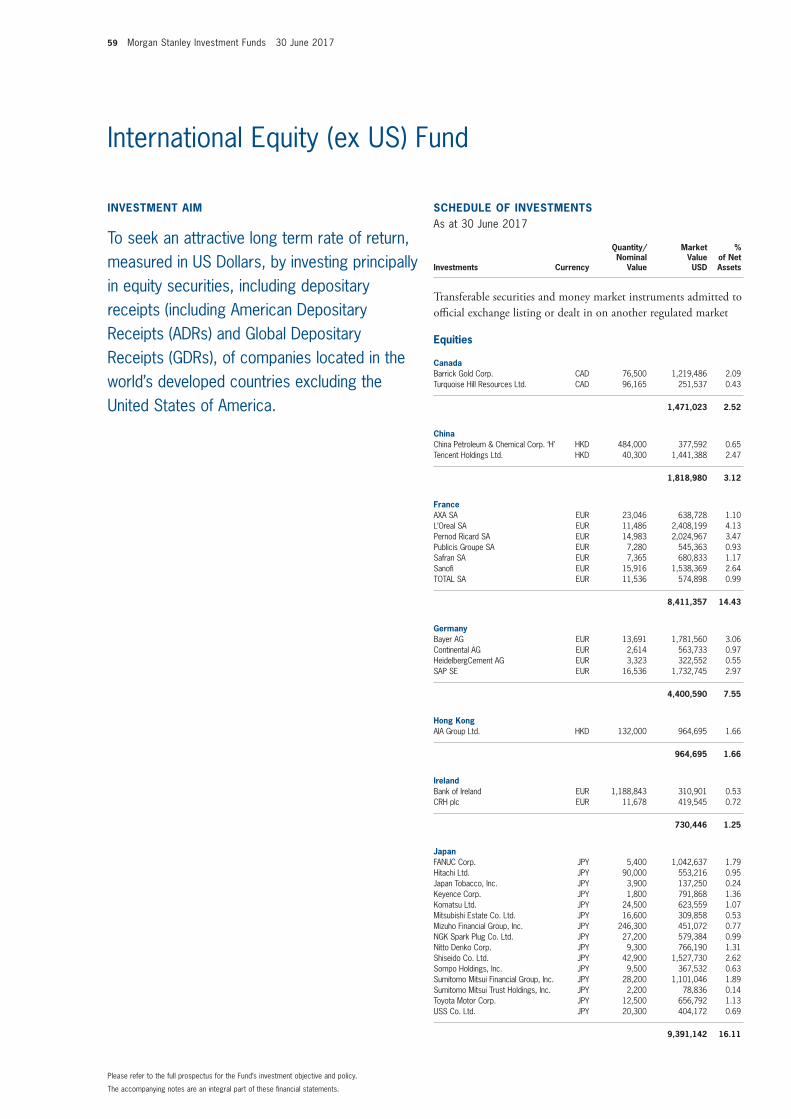
59 Morgan Stanley Investment Funds 30 June 2017
The accompanying notes are an integral part of these fi nancial statements.
Please refer to the full prospectus for the Fund’s investment objective and policy.
INVESTMENT AIM
To seek an attractive long term rate of return, measured in US Dollars, by investing principally in equity securities, including depositary receipts (including American Depositary Receipts (ADRs) and Global Depositary Receipts (GDRs), of companies located in the world’s developed countries excluding the United States of America.
SCHEDULE OF INVESTMENTSAs at 30 June 2017
Investments Currency
Quantity/Nominal
Value
Market Value USD
% of Net Assets
Transferable securities and money market instruments admitted to offi cial exchange listing or dealt in on another regulated market
Equities
CanadaBarrick Gold Corp. CAD 76,500 1,219,486 2.09 Turquoise Hill Resources Ltd. CAD 96,165 251,537 0.43
1,471,023 2.52
ChinaChina Petroleum & Chemical Corp. ‘H’ HKD 484,000 377,592 0.65 Tencent Holdings Ltd. HKD 40,300 1,441,388 2.47
1,818,980 3.12
FranceAXA SA EUR 23,046 638,728 1.10 L’Oreal SA EUR 11,486 2,408,199 4.13 Pernod Ricard SA EUR 14,983 2,024,967 3.47 Publicis Groupe SA EUR 7,280 545,363 0.93 Safran SA EUR 7,365 680,833 1.17 Sanofi EUR 15,916 1,538,369 2.64 TOTAL SA EUR 11,536 574,898 0.99
8,411,357 14.43
GermanyBayer AG EUR 13,691 1,781,560 3.06 Continental AG EUR 2,614 563,733 0.97 HeidelbergCement AG EUR 3,323 322,552 0.55 SAP SE EUR 16,536 1,732,745 2.97
4,400,590 7.55
Hong KongAIA Group Ltd. HKD 132,000 964,695 1.66
964,695 1.66
IrelandBank of Ireland EUR 1,188,843 310,901 0.53 CRH plc EUR 11,678 419,545 0.72
730,446 1.25
JapanFANUC Corp. JPY 5,400 1,042,637 1.79 Hitachi Ltd. JPY 90,000 553,216 0.95 Japan Tobacco, Inc. JPY 3,900 137,250 0.24 Keyence Corp. JPY 1,800 791,868 1.36 Komatsu Ltd. JPY 24,500 623,559 1.07 Mitsubishi Estate Co. Ltd. JPY 16,600 309,858 0.53 Mizuho Financial Group, Inc. JPY 246,300 451,072 0.77 NGK Spark Plug Co. Ltd. JPY 27,200 579,384 0.99 Nitto Denko Corp. JPY 9,300 766,190 1.31 Shiseido Co. Ltd. JPY 42,900 1,527,730 2.62 Sompo Holdings, Inc. JPY 9,500 367,532 0.63 Sumitomo Mitsui Financial Group, Inc. JPY 28,200 1,101,046 1.89 Sumitomo Mitsui Trust Holdings, Inc. JPY 2,200 78,836 0.14 Toyota Motor Corp. JPY 12,500 656,792 1.13 USS Co. Ltd. JPY 20,300 404,172 0.69
9,391,142 16.11
International Equity (ex US) Fund
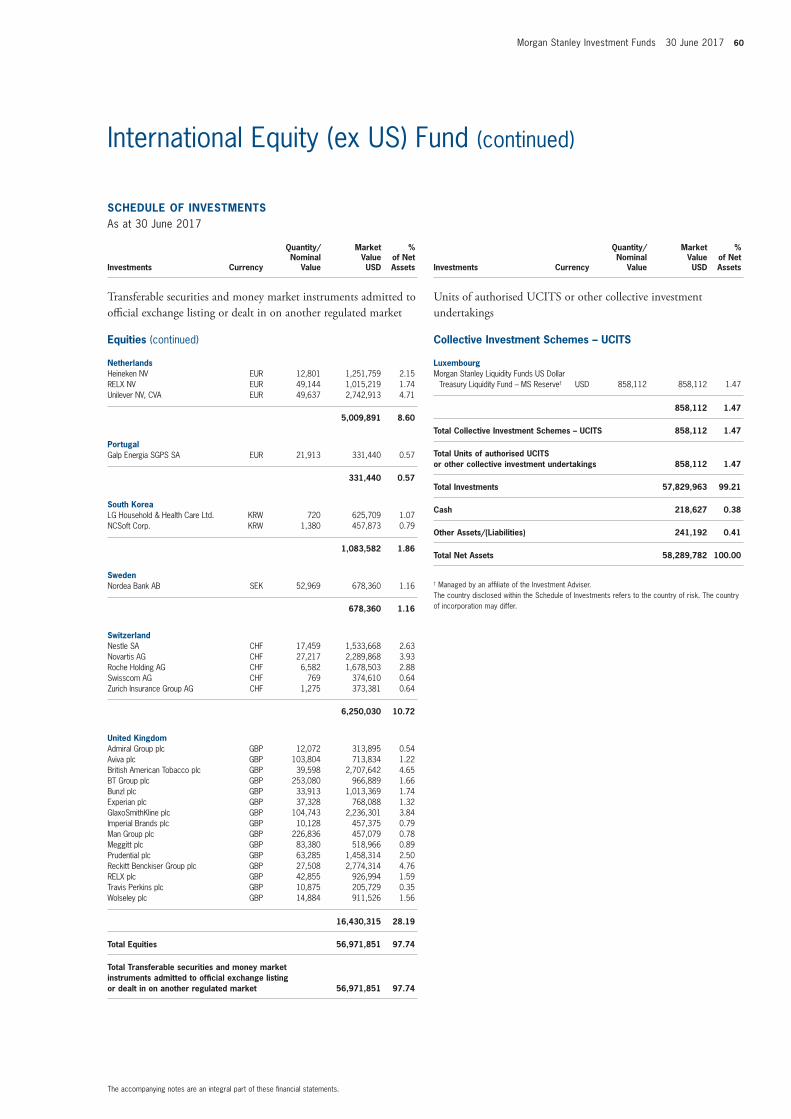
Morgan Stanley Investment Funds 30 June 2017 60
The accompanying notes are an integral part of these fi nancial statements.
International Equity (ex US) Fund (continued)
SCHEDULE OF INVESTMENTSAs at 30 June 2017
Investments Currency
Quantity/Nominal
Value
Market Value USD
% of Net Assets
Transferable securities and money market instruments admitted to offi cial exchange listing or dealt in on another regulated market
Equities (continued)
NetherlandsHeineken NV EUR 12,801 1,251,759 2.15 RELX NV EUR 49,144 1,015,219 1.74 Unilever NV, CVA EUR 49,637 2,742,913 4.71
5,009,891 8.60
PortugalGalp Energia SGPS SA EUR 21,913 331,440 0.57
331,440 0.57
South KoreaLG Household & Health Care Ltd. KRW 720 625,709 1.07 NCSoft Corp. KRW 1,380 457,873 0.79
1,083,582 1.86
SwedenNordea Bank AB SEK 52,969 678,360 1.16
678,360 1.16
SwitzerlandNestle SA CHF 17,459 1,533,668 2.63 Novartis AG CHF 27,217 2,289,868 3.93 Roche Holding AG CHF 6,582 1,678,503 2.88 Swisscom AG CHF 769 374,610 0.64 Zurich Insurance Group AG CHF 1,275 373,381 0.64
6,250,030 10.72
United KingdomAdmiral Group plc GBP 12,072 313,895 0.54 Aviva plc GBP 103,804 713,834 1.22 British American Tobacco plc GBP 39,598 2,707,642 4.65 BT Group plc GBP 253,080 966,889 1.66 Bunzl plc GBP 33,913 1,013,369 1.74 Experian plc GBP 37,328 768,088 1.32 GlaxoSmithKline plc GBP 104,743 2,236,301 3.84 Imperial Brands plc GBP 10,128 457,375 0.79 Man Group plc GBP 226,836 457,079 0.78 Meggitt plc GBP 83,380 518,966 0.89 Prudential plc GBP 63,285 1,458,314 2.50 Reckitt Benckiser Group plc GBP 27,508 2,774,314 4.76 RELX plc GBP 42,855 926,994 1.59 Travis Perkins plc GBP 10,875 205,729 0.35 Wolseley plc GBP 14,884 911,526 1.56
16,430,315 28.19
Total Equities 56,971,851 97.74
Total Transferable securities and money market instruments admitted to offi cial exchange listing or dealt in on another regulated market 56,971,851 97.74
SCHEDULE OF INVESTMENTSAs at 30 June 2017
Investments Currency
Quantity/Nominal
Value
Market Value USD
% of Net Assets
Units of authorised UCITS or other collective investment undertakings
Collective Investment Schemes – UCITS
LuxembourgMorgan Stanley Liquidity Funds US Dollar
Treasury Liquidity Fund – MS Reserve† USD 858,112 858,112 1.47
858,112 1.47
Total Collective Investment Schemes – UCITS 858,112 1.47
Total Units of authorised UCITS or other collective investment undertakings 858,112 1.47
Total Investments 57,829,963 99.21
Cash 218,627 0.38
Other Assets/(Liabilities) 241,192 0.41
Total Net Assets 58,289,782 100.00
† Managed by an affi liate of the Investment Adviser.The country disclosed within the Schedule of Investments refers to the country of risk. The country of incorporation may differ.
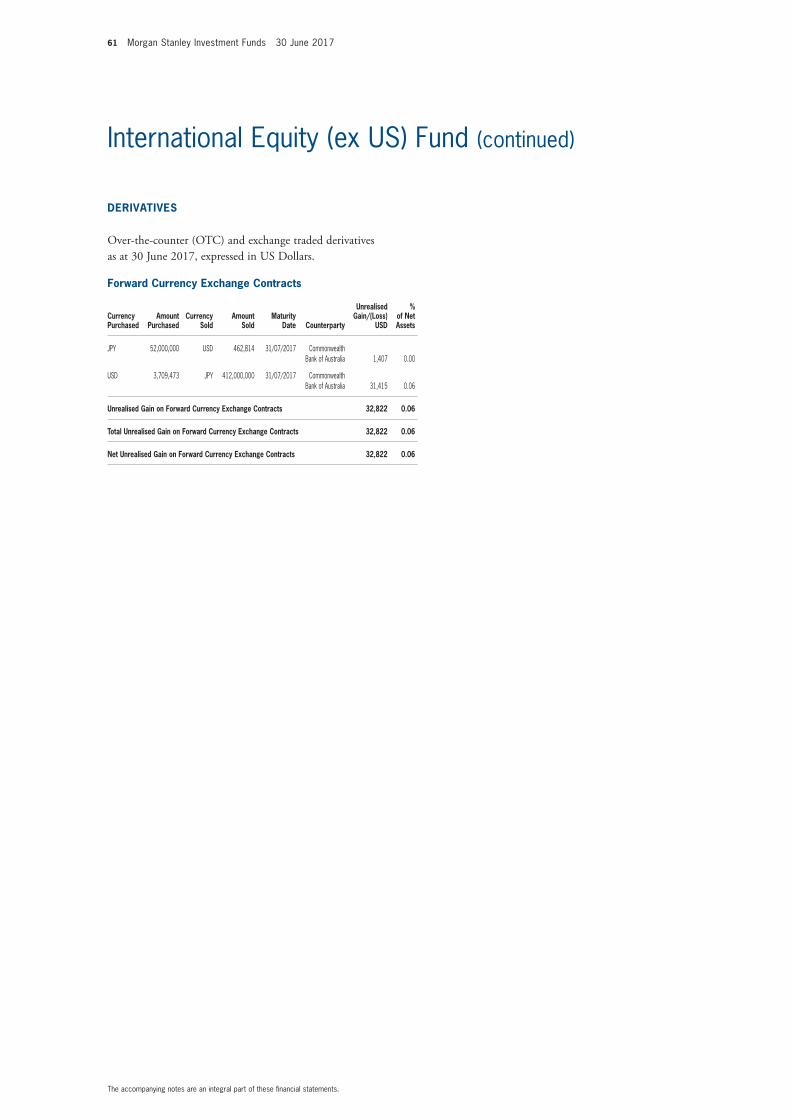
61 Morgan Stanley Investment Funds 30 June 2017
The accompanying notes are an integral part of these fi nancial statements.
International Equity (ex US) Fund (continued)
Forward Currency Exchange Contracts
Currency Purchased
Amount Purchased
Currency Sold
Amount Sold
Maturity Date Counterparty
Unrealised Gain/(Loss)
USD
% of Net Assets
JPY 52,000,000 USD 462,814 31/07/2017 Commonwealth Bank of Australia 1,407 0.00
USD 3,709,473 JPY 412,000,000 31/07/2017 Commonwealth Bank of Australia 31,415 0.06
Unrealised Gain on Forward Currency Exchange Contracts 32,822 0.06
Total Unrealised Gain on Forward Currency Exchange Contracts 32,822 0.06
Net Unrealised Gain on Forward Currency Exchange Contracts 32,822 0.06
DERIVATIVES
Over-the-counter (OTC) and exchange traded derivatives as at 30 June 2017, expressed in US Dollars.
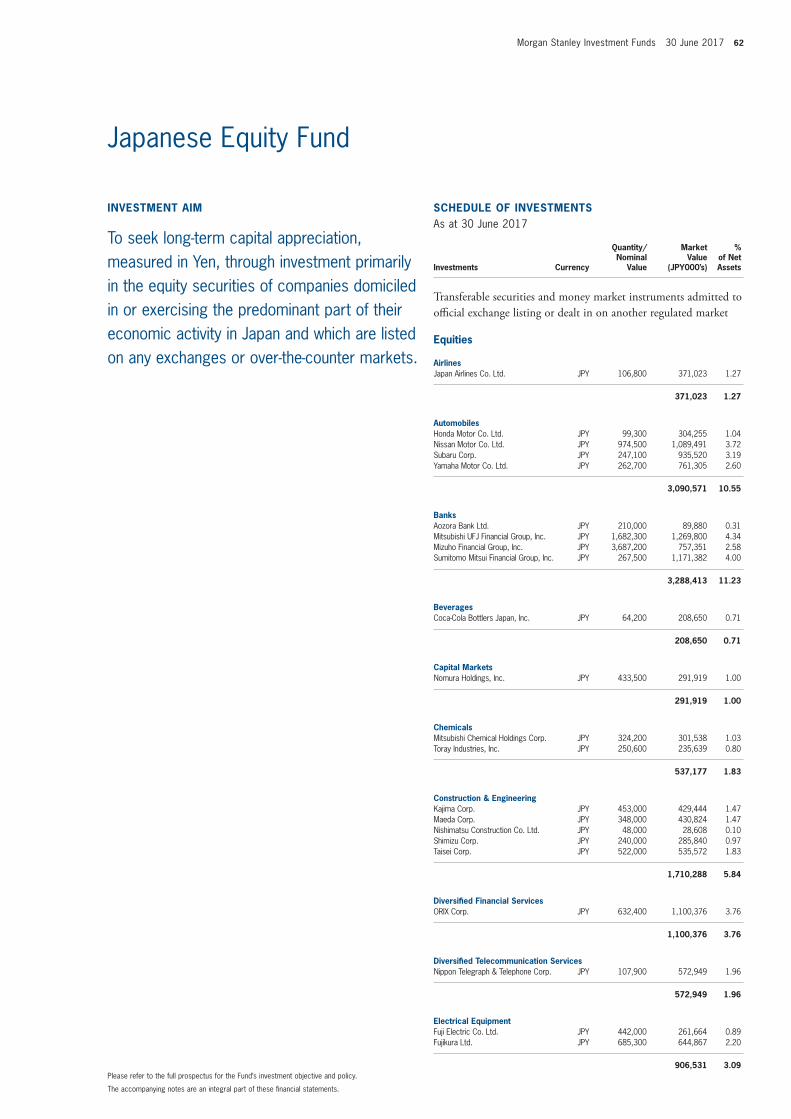
Morgan Stanley Investment Funds 30 June 2017 62
The accompanying notes are an integral part of these fi nancial statements.
Please refer to the full prospectus for the Fund’s investment objective and policy.
INVESTMENT AIM
To seek long-term capital appreciation, measured in Yen, through investment primarily in the equity securities of companies domiciled in or exercising the predominant part of their economic activity in Japan and which are listed on any exchanges or over-the-counter markets.
SCHEDULE OF INVESTMENTSAs at 30 June 2017
Investments Currency
Quantity/Nominal
Value
Market Value
(JPY000’s)
% of Net Assets
Transferable securities and money market instruments admitted to offi cial exchange listing or dealt in on another regulated market
Equities
AirlinesJapan Airlines Co. Ltd. JPY 106,800 371,023 1.27
371,023 1.27
AutomobilesHonda Motor Co. Ltd. JPY 99,300 304,255 1.04 Nissan Motor Co. Ltd. JPY 974,500 1,089,491 3.72 Subaru Corp. JPY 247,100 935,520 3.19 Yamaha Motor Co. Ltd. JPY 262,700 761,305 2.60
3,090,571 10.55
BanksAozora Bank Ltd. JPY 210,000 89,880 0.31 Mitsubishi UFJ Financial Group, Inc. JPY 1,682,300 1,269,800 4.34 Mizuho Financial Group, Inc. JPY 3,687,200 757,351 2.58 Sumitomo Mitsui Financial Group, Inc. JPY 267,500 1,171,382 4.00
3,288,413 11.23
BeveragesCoca-Cola Bottlers Japan, Inc. JPY 64,200 208,650 0.71
208,650 0.71
Capital MarketsNomura Holdings, Inc. JPY 433,500 291,919 1.00
291,919 1.00
ChemicalsMitsubishi Chemical Holdings Corp. JPY 324,200 301,538 1.03 Toray Industries, Inc. JPY 250,600 235,639 0.80
537,177 1.83
Construction & EngineeringKajima Corp. JPY 453,000 429,444 1.47 Maeda Corp. JPY 348,000 430,824 1.47 Nishimatsu Construction Co. Ltd. JPY 48,000 28,608 0.10 Shimizu Corp. JPY 240,000 285,840 0.97 Taisei Corp. JPY 522,000 535,572 1.83
1,710,288 5.84
Diversifi ed Financial ServicesORIX Corp. JPY 632,400 1,100,376 3.76
1,100,376 3.76
Diversifi ed Telecommunication ServicesNippon Telegraph & Telephone Corp. JPY 107,900 572,949 1.96
572,949 1.96
Electrical EquipmentFuji Electric Co. Ltd. JPY 442,000 261,664 0.89 Fujikura Ltd. JPY 685,300 644,867 2.20
906,531 3.09
Japanese Equity Fund
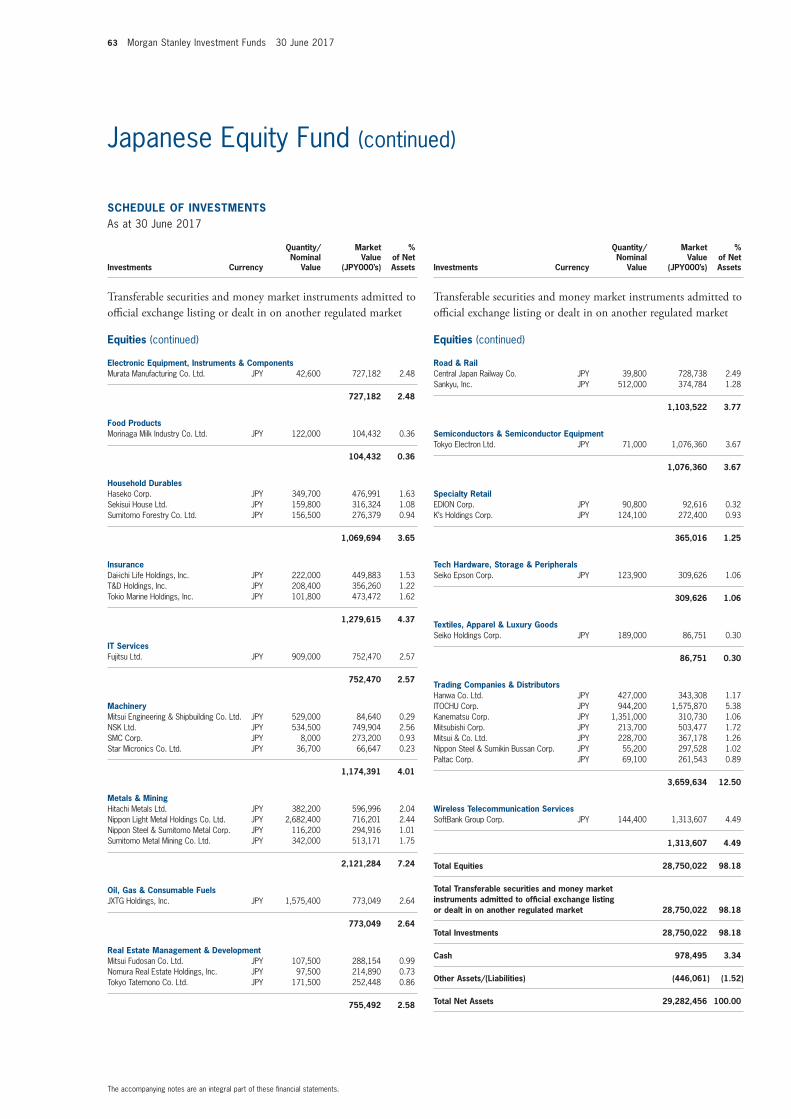
63 Morgan Stanley Investment Funds 30 June 2017
The accompanying notes are an integral part of these fi nancial statements.
Japanese Equity Fund (continued)
SCHEDULE OF INVESTMENTSAs at 30 June 2017
Investments Currency
Quantity/Nominal
Value
Market Value
(JPY000’s)
% of Net Assets
Transferable securities and money market instruments admitted to offi cial exchange listing or dealt in on another regulated market
Equities (continued)
Electronic Equipment, Instruments & ComponentsMurata Manufacturing Co. Ltd. JPY 42,600 727,182 2.48
727,182 2.48
Food ProductsMorinaga Milk Industry Co. Ltd. JPY 122,000 104,432 0.36
104,432 0.36
Household DurablesHaseko Corp. JPY 349,700 476,991 1.63 Sekisui House Ltd. JPY 159,800 316,324 1.08 Sumitomo Forestry Co. Ltd. JPY 156,500 276,379 0.94
1,069,694 3.65
InsuranceDai-ichi Life Holdings, Inc. JPY 222,000 449,883 1.53 T&D Holdings, Inc. JPY 208,400 356,260 1.22 Tokio Marine Holdings, Inc. JPY 101,800 473,472 1.62
1,279,615 4.37
IT ServicesFujitsu Ltd. JPY 909,000 752,470 2.57
752,470 2.57
MachineryMitsui Engineering & Shipbuilding Co. Ltd. JPY 529,000 84,640 0.29 NSK Ltd. JPY 534,500 749,904 2.56 SMC Corp. JPY 8,000 273,200 0.93 Star Micronics Co. Ltd. JPY 36,700 66,647 0.23
1,174,391 4.01
Metals & MiningHitachi Metals Ltd. JPY 382,200 596,996 2.04 Nippon Light Metal Holdings Co. Ltd. JPY 2,682,400 716,201 2.44 Nippon Steel & Sumitomo Metal Corp. JPY 116,200 294,916 1.01 Sumitomo Metal Mining Co. Ltd. JPY 342,000 513,171 1.75
2,121,284 7.24
Oil, Gas & Consumable FuelsJXTG Holdings, Inc. JPY 1,575,400 773,049 2.64
773,049 2.64
Real Estate Management & DevelopmentMitsui Fudosan Co. Ltd. JPY 107,500 288,154 0.99 Nomura Real Estate Holdings, Inc. JPY 97,500 214,890 0.73 Tokyo Tatemono Co. Ltd. JPY 171,500 252,448 0.86
755,492 2.58
SCHEDULE OF INVESTMENTSAs at 30 June 2017
Investments Currency
Quantity/Nominal
Value
Market Value
(JPY000’s)
% of Net Assets
Transferable securities and money market instruments admitted to offi cial exchange listing or dealt in on another regulated market
Equities (continued)
Road & RailCentral Japan Railway Co. JPY 39,800 728,738 2.49 Sankyu, Inc. JPY 512,000 374,784 1.28
1,103,522 3.77
Semiconductors & Semiconductor EquipmentTokyo Electron Ltd. JPY 71,000 1,076,360 3.67
1,076,360 3.67
Specialty RetailEDION Corp. JPY 90,800 92,616 0.32 K’s Holdings Corp. JPY 124,100 272,400 0.93
365,016 1.25
Tech Hardware, Storage & PeripheralsSeiko Epson Corp. JPY 123,900 309,626 1.06
309,626 1.06
Textiles, Apparel & Luxury GoodsSeiko Holdings Corp. JPY 189,000 86,751 0.30
86,751 0.30
Trading Companies & DistributorsHanwa Co. Ltd. JPY 427,000 343,308 1.17 ITOCHU Corp. JPY 944,200 1,575,870 5.38 Kanematsu Corp. JPY 1,351,000 310,730 1.06 Mitsubishi Corp. JPY 213,700 503,477 1.72 Mitsui & Co. Ltd. JPY 228,700 367,178 1.26 Nippon Steel & Sumikin Bussan Corp. JPY 55,200 297,528 1.02 Paltac Corp. JPY 69,100 261,543 0.89
3,659,634 12.50
Wireless Telecommunication ServicesSoftBank Group Corp. JPY 144,400 1,313,607 4.49
1,313,607 4.49
Total Equities 28,750,022 98.18
Total Transferable securities and money market instruments admitted to offi cial exchange listing or dealt in on another regulated market 28,750,022 98.18
Total Investments 28,750,022 98.18
Cash 978,495 3.34
Other Assets/(Liabilities) (446,061) (1.52)
Total Net Assets 29,282,456 100.00
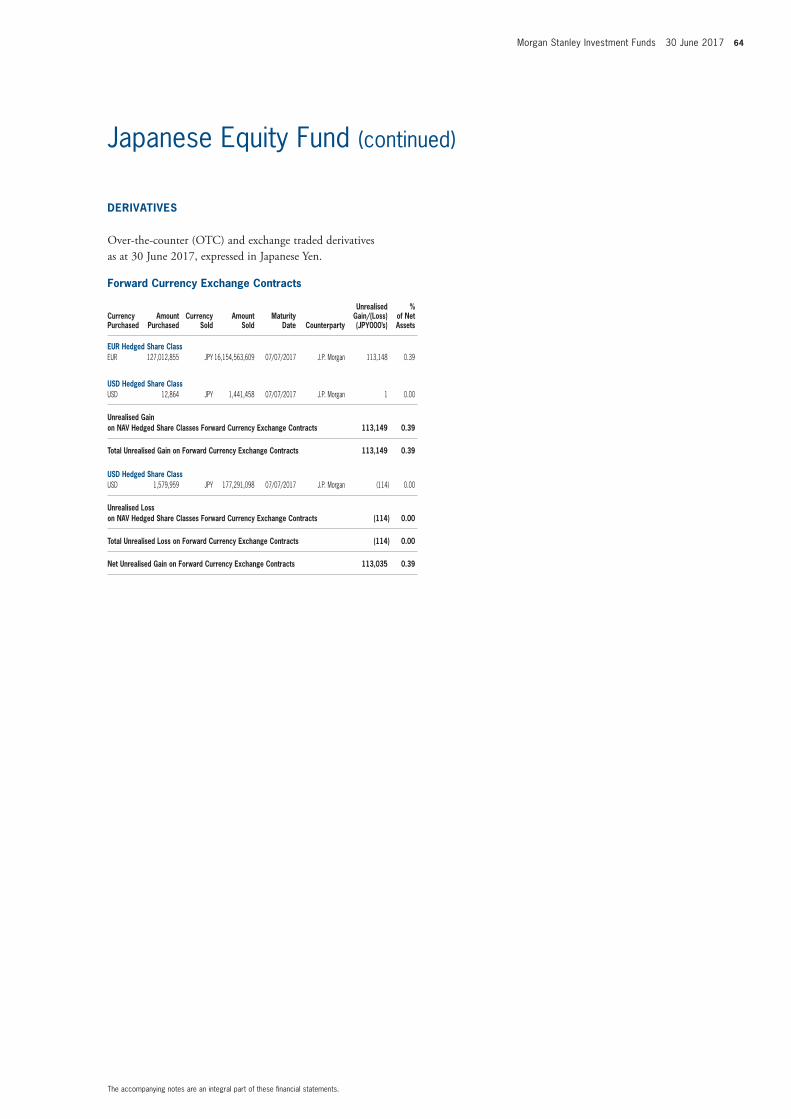
Morgan Stanley Investment Funds 30 June 2017 64
The accompanying notes are an integral part of these fi nancial statements.
Japanese Equity Fund (continued)
Forward Currency Exchange Contracts
Currency Purchased
Amount Purchased
Currency Sold
Amount Sold
Maturity Date Counterparty
Unrealised Gain/(Loss) (JPY000’s)
% of Net Assets
EUR Hedged Share ClassEUR 127,012,855 JPY 16,154,563,609 07/07/2017 J.P. Morgan 113,148 0.39
USD Hedged Share ClassUSD 12,864 JPY 1,441,458 07/07/2017 J.P. Morgan 1 0.00
Unrealised Gain on NAV Hedged Share Classes Forward Currency Exchange Contracts 113,149 0.39
Total Unrealised Gain on Forward Currency Exchange Contracts 113,149 0.39
USD Hedged Share ClassUSD 1,579,959 JPY 177,291,098 07/07/2017 J.P. Morgan (114) 0.00
Unrealised Loss on NAV Hedged Share Classes Forward Currency Exchange Contracts (114) 0.00
Total Unrealised Loss on Forward Currency Exchange Contracts (114) 0.00
Net Unrealised Gain on Forward Currency Exchange Contracts 113,035 0.39
DERIVATIVES
Over-the-counter (OTC) and exchange traded derivatives as at 30 June 2017, expressed in Japanese Yen.
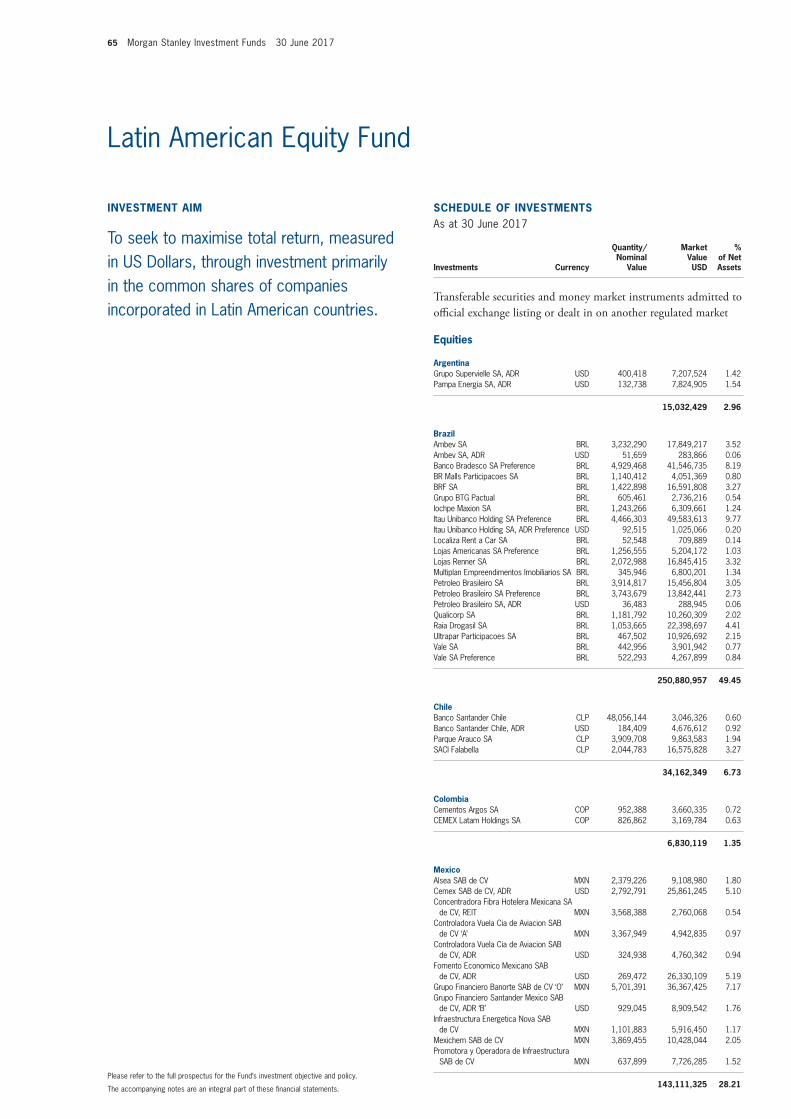
65 Morgan Stanley Investment Funds 30 June 2017
The accompanying notes are an integral part of these fi nancial statements.
Please refer to the full prospectus for the Fund’s investment objective and policy.
INVESTMENT AIM
To seek to maximise total return, measured in US Dollars, through investment primarily in the common shares of companies incorporated in Latin American countries.
SCHEDULE OF INVESTMENTSAs at 30 June 2017
Investments Currency
Quantity/Nominal
Value
Market Value USD
% of Net Assets
Transferable securities and money market instruments admitted to offi cial exchange listing or dealt in on another regulated market
Equities
ArgentinaGrupo Supervielle SA, ADR USD 400,418 7,207,524 1.42 Pampa Energia SA, ADR USD 132,738 7,824,905 1.54
15,032,429 2.96
BrazilAmbev SA BRL 3,232,290 17,849,217 3.52 Ambev SA, ADR USD 51,659 283,866 0.06 Banco Bradesco SA Preference BRL 4,929,468 41,546,735 8.19 BR Malls Participacoes SA BRL 1,140,412 4,051,369 0.80 BRF SA BRL 1,422,898 16,591,808 3.27 Grupo BTG Pactual BRL 605,461 2,736,216 0.54 Iochpe Maxion SA BRL 1,243,266 6,309,661 1.24 Itau Unibanco Holding SA Preference BRL 4,466,303 49,583,613 9.77 Itau Unibanco Holding SA, ADR Preference USD 92,515 1,025,066 0.20 Localiza Rent a Car SA BRL 52,548 709,889 0.14 Lojas Americanas SA Preference BRL 1,256,555 5,204,172 1.03 Lojas Renner SA BRL 2,072,988 16,845,415 3.32 Multiplan Empreendimentos Imobiliarios SA BRL 345,946 6,800,201 1.34 Petroleo Brasileiro SA BRL 3,914,817 15,456,804 3.05 Petroleo Brasileiro SA Preference BRL 3,743,679 13,842,441 2.73 Petroleo Brasileiro SA, ADR USD 36,483 288,945 0.06 Qualicorp SA BRL 1,181,792 10,260,309 2.02 Raia Drogasil SA BRL 1,053,665 22,398,697 4.41 Ultrapar Participacoes SA BRL 467,502 10,926,692 2.15 Vale SA BRL 442,956 3,901,942 0.77 Vale SA Preference BRL 522,293 4,267,899 0.84
250,880,957 49.45
ChileBanco Santander Chile CLP 48,056,144 3,046,326 0.60 Banco Santander Chile, ADR USD 184,409 4,676,612 0.92 Parque Arauco SA CLP 3,909,708 9,863,583 1.94 SACI Falabella CLP 2,044,783 16,575,828 3.27
34,162,349 6.73
ColombiaCementos Argos SA COP 952,388 3,660,335 0.72 CEMEX Latam Holdings SA COP 826,862 3,169,784 0.63
6,830,119 1.35
MexicoAlsea SAB de CV MXN 2,379,226 9,108,980 1.80 Cemex SAB de CV, ADR USD 2,792,791 25,861,245 5.10 Concentradora Fibra Hotelera Mexicana SA
de CV, REIT MXN 3,568,388 2,760,068 0.54 Controladora Vuela Cia de Aviacion SAB
de CV ‘A’ MXN 3,367,949 4,942,835 0.97 Controladora Vuela Cia de Aviacion SAB
de CV, ADR USD 324,938 4,760,342 0.94 Fomento Economico Mexicano SAB
de CV, ADR USD 269,472 26,330,109 5.19 Grupo Financiero Banorte SAB de CV ‘O’ MXN 5,701,391 36,367,425 7.17 Grupo Financiero Santander Mexico SAB
de CV, ADR ‘B’ USD 929,045 8,909,542 1.76 Infraestructura Energetica Nova SAB
de CV MXN 1,101,883 5,916,450 1.17 Mexichem SAB de CV MXN 3,869,455 10,428,044 2.05 Promotora y Operadora de Infraestructura
SAB de CV MXN 637,899 7,726,285 1.52
143,111,325 28.21
Latin American Equity Fund
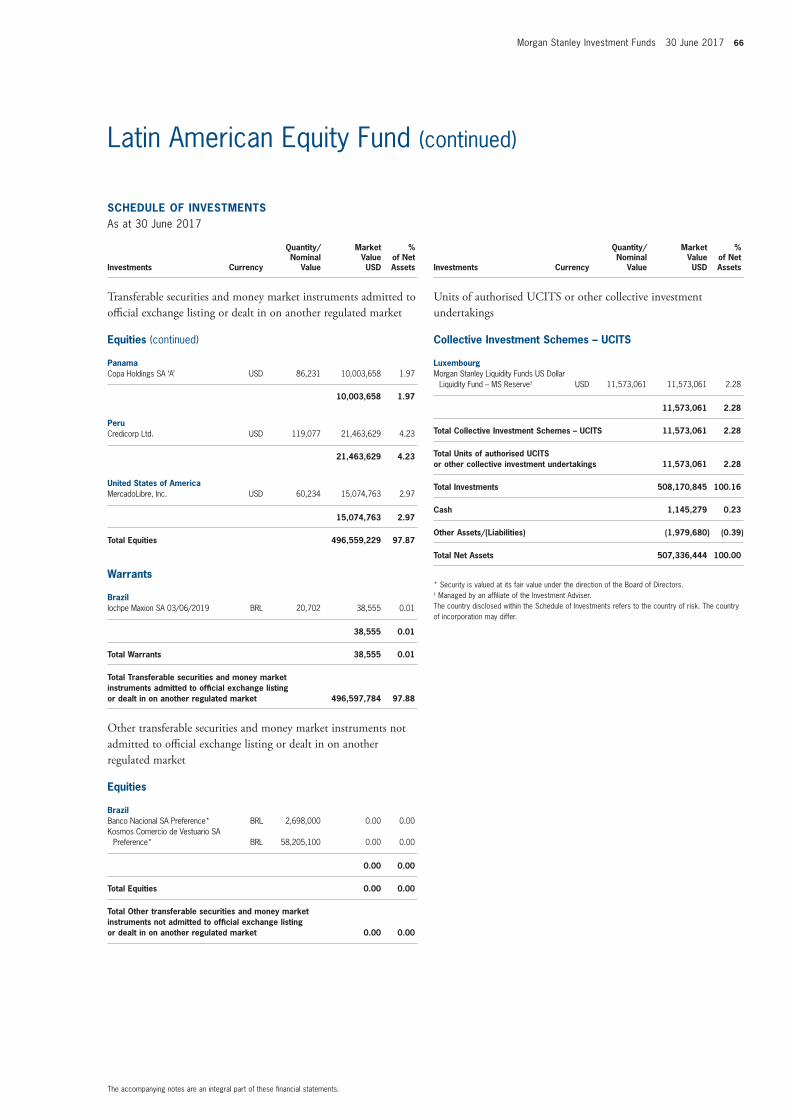
Morgan Stanley Investment Funds 30 June 2017 66
The accompanying notes are an integral part of these fi nancial statements.
Latin American Equity Fund (continued)
SCHEDULE OF INVESTMENTSAs at 30 June 2017
Investments Currency
Quantity/Nominal
Value
Market Value USD
% of Net Assets
Transferable securities and money market instruments admitted to offi cial exchange listing or dealt in on another regulated market
Equities (continued)
PanamaCopa Holdings SA ‘A’ USD 86,231 10,003,658 1.97
10,003,658 1.97
PeruCredicorp Ltd. USD 119,077 21,463,629 4.23
21,463,629 4.23
United States of AmericaMercadoLibre, Inc. USD 60,234 15,074,763 2.97
15,074,763 2.97
Total Equities 496,559,229 97.87
Warrants
BrazilIochpe Maxion SA 03/06/2019 BRL 20,702 38,555 0.01
38,555 0.01
Total Warrants 38,555 0.01
Total Transferable securities and money market instruments admitted to offi cial exchange listing or dealt in on another regulated market 496,597,784 97.88
Other transferable securities and money market instruments not admitted to offi cial exchange listing or dealt in on another regulated market
Equities
BrazilBanco Nacional SA Preference* BRL 2,698,000 0.00 0.00 Kosmos Comercio de Vestuario SA
Preference* BRL 58,205,100 0.00 0.00
0.00 0.00
Total Equities 0.00 0.00
Total Other transferable securities and money market instruments not admitted to offi cial exchange listing or dealt in on another regulated market 0.00 0.00
SCHEDULE OF INVESTMENTSAs at 30 June 2017
Investments Currency
Quantity/Nominal
Value
Market Value USD
% of Net Assets
Units of authorised UCITS or other collective investment undertakings
Collective Investment Schemes – UCITS
LuxembourgMorgan Stanley Liquidity Funds US Dollar
Liquidity Fund – MS Reserve† USD 11,573,061 11,573,061 2.28
11,573,061 2.28
Total Collective Investment Schemes – UCITS 11,573,061 2.28
Total Units of authorised UCITS or other collective investment undertakings 11,573,061 2.28
Total Investments 508,170,845 100.16
Cash 1,145,279 0.23
Other Assets/(Liabilities) (1,979,680) (0.39)
Total Net Assets 507,336,444 100.00
* Security is valued at its fair value under the direction of the Board of Directors.† Managed by an affi liate of the Investment Adviser.The country disclosed within the Schedule of Investments refers to the country of risk. The country of incorporation may differ.
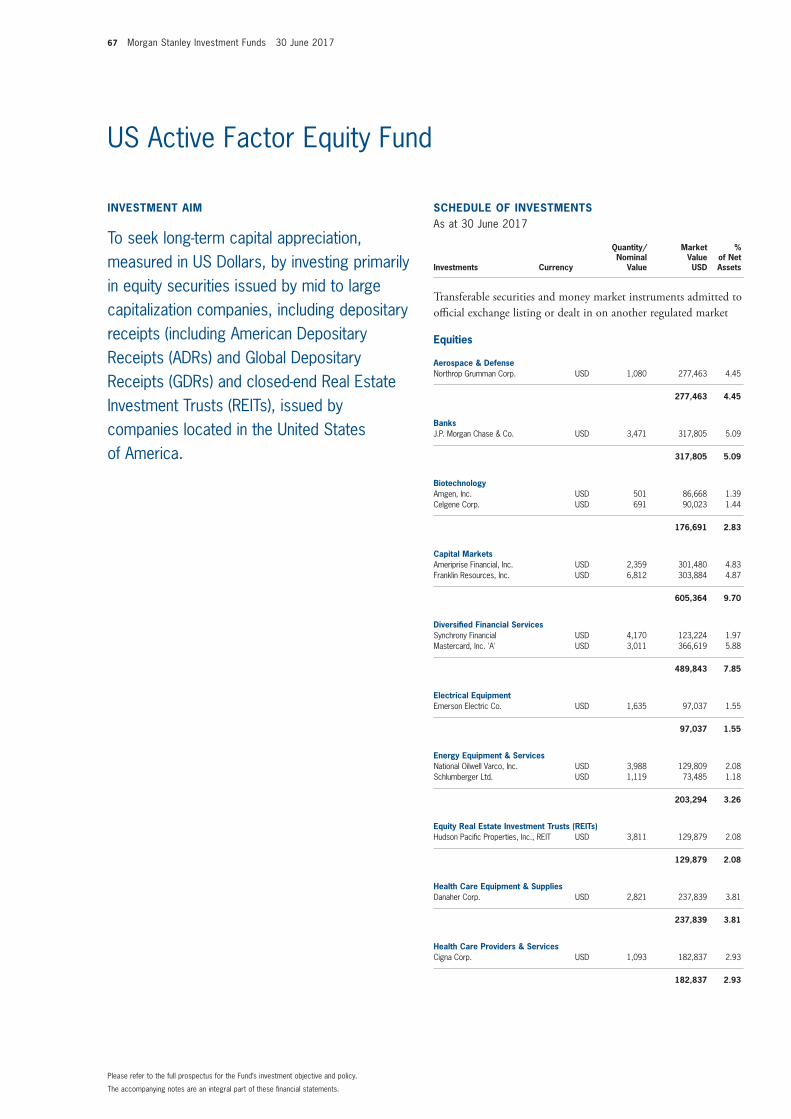
67 Morgan Stanley Investment Funds 30 June 2017
The accompanying notes are an integral part of these fi nancial statements.
Please refer to the full prospectus for the Fund’s investment objective and policy.
US Active Factor Equity Fund
INVESTMENT AIM
To seek long-term capital appreciation, measured in US Dollars, by investing primarily in equity securities issued by mid to large capitalization companies, including depositary receipts (including American Depositary Receipts (ADRs) and Global Depositary Receipts (GDRs) and closed-end Real Estate Investment Trusts (REITs), issued by companies located in the United States of America.
SCHEDULE OF INVESTMENTSAs at 30 June 2017
Investments Currency
Quantity/Nominal
Value
Market Value USD
% of Net Assets
Transferable securities and money market instruments admitted to offi cial exchange listing or dealt in on another regulated market
Equities
Aerospace & DefenseNorthrop Grumman Corp. USD 1,080 277,463 4.45
277,463 4.45
BanksJ.P. Morgan Chase & Co. USD 3,471 317,805 5.09
317,805 5.09
BiotechnologyAmgen, Inc. USD 501 86,668 1.39 Celgene Corp. USD 691 90,023 1.44
176,691 2.83
Capital MarketsAmeriprise Financial, Inc. USD 2,359 301,480 4.83 Franklin Resources, Inc. USD 6,812 303,884 4.87
605,364 9.70
Diversifi ed Financial ServicesSynchrony Financial USD 4,170 123,224 1.97 Mastercard, Inc. 'A' USD 3,011 366,619 5.88
489,843 7.85
Electrical EquipmentEmerson Electric Co. USD 1,635 97,037 1.55
97,037 1.55
Energy Equipment & ServicesNational Oilwell Varco, Inc. USD 3,988 129,809 2.08 Schlumberger Ltd. USD 1,119 73,485 1.18
203,294 3.26
Equity Real Estate Investment Trusts (REITs)Hudson Pacifi c Properties, Inc., REIT USD 3,811 129,879 2.08
129,879 2.08
Health Care Equipment & SuppliesDanaher Corp. USD 2,821 237,839 3.81
237,839 3.81
Health Care Providers & ServicesCigna Corp. USD 1,093 182,837 2.93
182,837 2.93
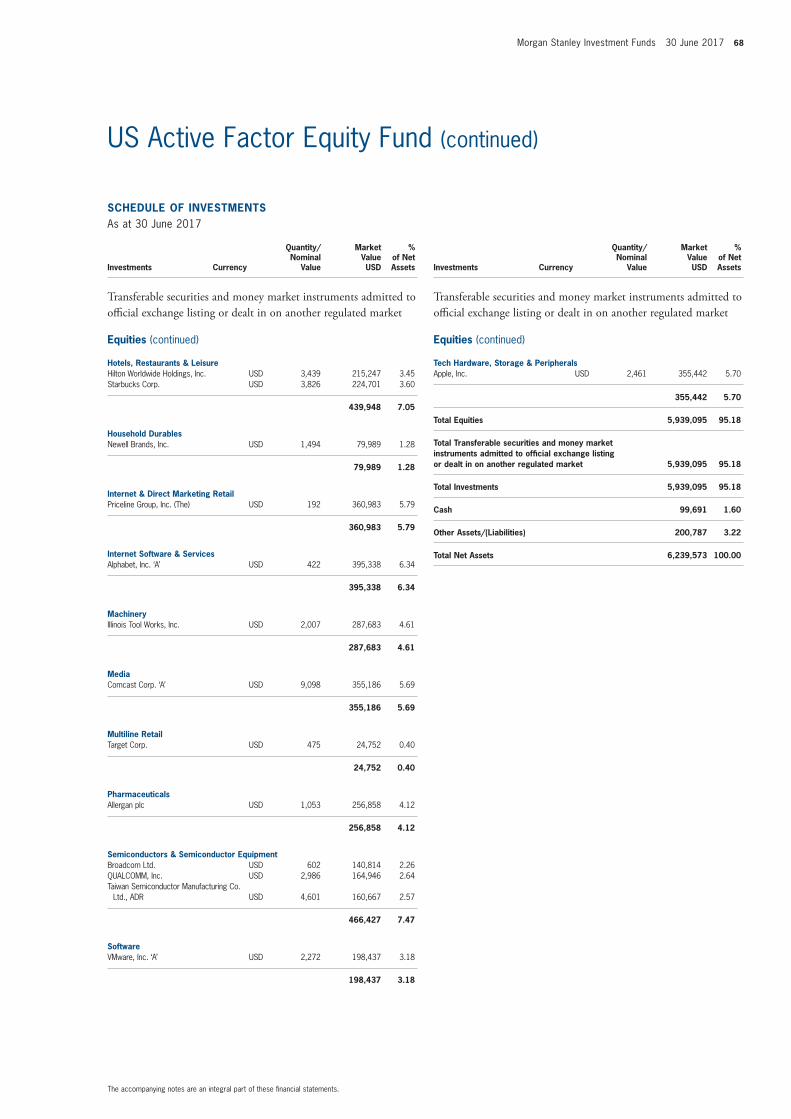
Morgan Stanley Investment Funds 30 June 2017 68
The accompanying notes are an integral part of these fi nancial statements.
US Active Factor Equity Fund (continued)
SCHEDULE OF INVESTMENTSAs at 30 June 2017
Investments Currency
Quantity/Nominal
Value
Market Value USD
% of Net Assets
Transferable securities and money market instruments admitted to offi cial exchange listing or dealt in on another regulated market
Equities (continued)
Hotels, Restaurants & LeisureHilton Worldwide Holdings, Inc. USD 3,439 215,247 3.45 Starbucks Corp. USD 3,826 224,701 3.60
439,948 7.05
Household DurablesNewell Brands, Inc. USD 1,494 79,989 1.28
79,989 1.28
Internet & Direct Marketing RetailPriceline Group, Inc. (The) USD 192 360,983 5.79
360,983 5.79
Internet Software & ServicesAlphabet, Inc. ‘A’ USD 422 395,338 6.34
395,338 6.34
MachineryIllinois Tool Works, Inc. USD 2,007 287,683 4.61
287,683 4.61
MediaComcast Corp. ‘A’ USD 9,098 355,186 5.69
355,186 5.69
Multiline RetailTarget Corp. USD 475 24,752 0.40
24,752 0.40
PharmaceuticalsAllergan plc USD 1,053 256,858 4.12
256,858 4.12
Semiconductors & Semiconductor EquipmentBroadcom Ltd. USD 602 140,814 2.26 QUALCOMM, Inc. USD 2,986 164,946 2.64 Taiwan Semiconductor Manufacturing Co.
Ltd., ADR USD 4,601 160,667 2.57
466,427 7.47
SoftwareVMware, Inc. ‘A’ USD 2,272 198,437 3.18
198,437 3.18
SCHEDULE OF INVESTMENTSAs at 30 June 2017
Investments Currency
Quantity/Nominal
Value
Market Value USD
% of Net Assets
Transferable securities and money market instruments admitted to offi cial exchange listing or dealt in on another regulated market
Equities (continued)
Tech Hardware, Storage & PeripheralsApple, Inc. USD 2,461 355,442 5.70
355,442 5.70
Total Equities 5,939,095 95.18
Total Transferable securities and money marketinstruments admitted to offi cial exchange listing or dealt in on another regulated market 5,939,095 95.18
Total Investments 5,939,095 95.18
Cash 99,691 1.60
Other Assets/(Liabilities) 200,787 3.22
Total Net Assets 6,239,573 100.00
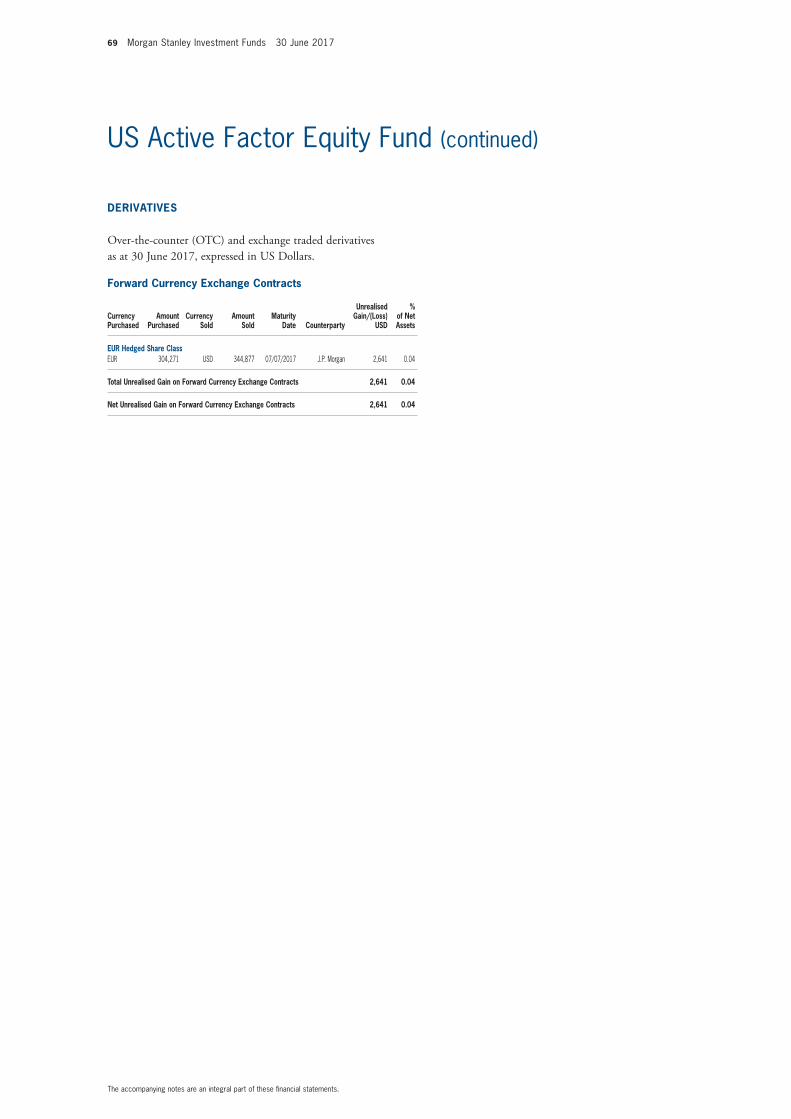
69 Morgan Stanley Investment Funds 30 June 2017
The accompanying notes are an integral part of these fi nancial statements.
US Active Factor Equity Fund (continued)
Forward Currency Exchange Contracts
Currency Purchased
Amount Purchased
Currency Sold
Amount Sold
Maturity Date Counterparty
Unrealised Gain/(Loss)
USD
% of Net Assets
EUR Hedged Share ClassEUR 304,271 USD 344,877 07/07/2017 J.P. Morgan 2,641 0.04
Total Unrealised Gain on Forward Currency Exchange Contracts 2,641 0.04
Net Unrealised Gain on Forward Currency Exchange Contracts 2,641 0.04
DERIVATIVES
Over-the-counter (OTC) and exchange traded derivatives as at 30 June 2017, expressed in US Dollars.
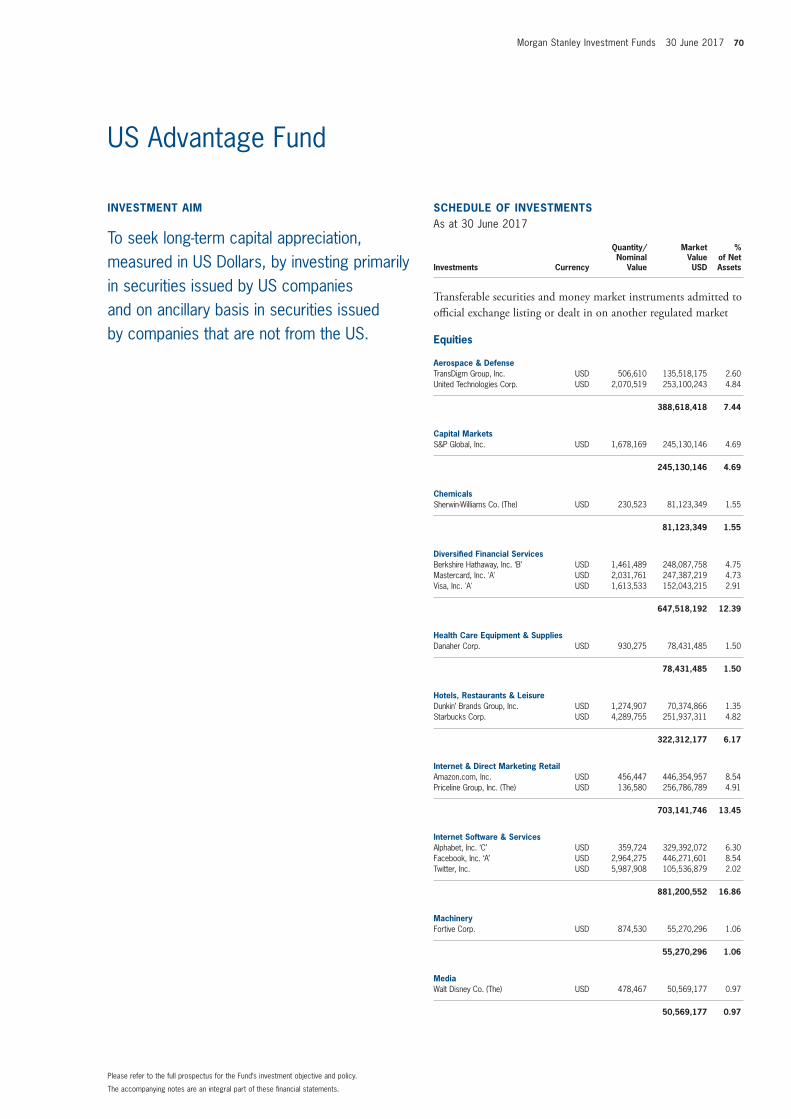
Morgan Stanley Investment Funds 30 June 2017 70
The accompanying notes are an integral part of these fi nancial statements.
Please refer to the full prospectus for the Fund’s investment objective and policy.
INVESTMENT AIM
To seek long-term capital appreciation, measured in US Dollars, by investing primarily in securities issued by US companies and on ancillary basis in securities issued by companies that are not from the US.
US Advantage Fund
SCHEDULE OF INVESTMENTSAs at 30 June 2017
Investments Currency
Quantity/Nominal
Value
Market Value USD
% of Net Assets
Transferable securities and money market instruments admitted to offi cial exchange listing or dealt in on another regulated market
Equities
Aerospace & DefenseTransDigm Group, Inc. USD 506,610 135,518,175 2.60 United Technologies Corp. USD 2,070,519 253,100,243 4.84
388,618,418 7.44
Capital MarketsS&P Global, Inc. USD 1,678,169 245,130,146 4.69
245,130,146 4.69
ChemicalsSherwin-Williams Co. (The) USD 230,523 81,123,349 1.55
81,123,349 1.55
Diversifi ed Financial ServicesBerkshire Hathaway, Inc. ‘B’ USD 1,461,489 248,087,758 4.75 Mastercard, Inc. 'A' USD 2,031,761 247,387,219 4.73 Visa, Inc. 'A' USD 1,613,533 152,043,215 2.91
647,518,192 12.39
Health Care Equipment & SuppliesDanaher Corp. USD 930,275 78,431,485 1.50
78,431,485 1.50
Hotels, Restaurants & LeisureDunkin’ Brands Group, Inc. USD 1,274,907 70,374,866 1.35 Starbucks Corp. USD 4,289,755 251,937,311 4.82
322,312,177 6.17
Internet & Direct Marketing RetailAmazon.com, Inc. USD 456,447 446,354,957 8.54 Priceline Group, Inc. (The) USD 136,580 256,786,789 4.91
703,141,746 13.45
Internet Software & ServicesAlphabet, Inc. ‘C’ USD 359,724 329,392,072 6.30 Facebook, Inc. ‘A’ USD 2,964,275 446,271,601 8.54 Twitter, Inc. USD 5,987,908 105,536,879 2.02
881,200,552 16.86
MachineryFortive Corp. USD 874,530 55,270,296 1.06
55,270,296 1.06
MediaWalt Disney Co. (The) USD 478,467 50,569,177 0.97
50,569,177 0.97
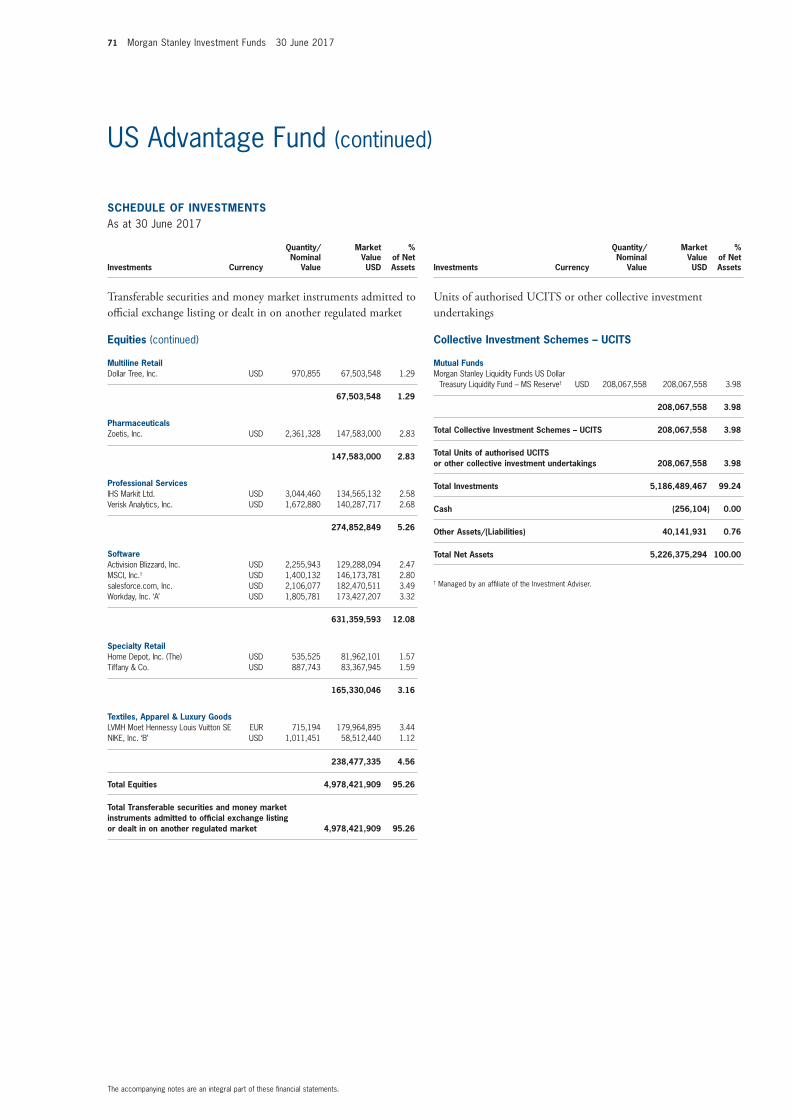
71 Morgan Stanley Investment Funds 30 June 2017
The accompanying notes are an integral part of these fi nancial statements.
US Advantage Fund (continued)
SCHEDULE OF INVESTMENTSAs at 30 June 2017
Investments Currency
Quantity/Nominal
Value
Market Value USD
% of Net Assets
Transferable securities and money market instruments admitted to offi cial exchange listing or dealt in on another regulated market
Equities (continued)
Multiline RetailDollar Tree, Inc. USD 970,855 67,503,548 1.29
67,503,548 1.29
PharmaceuticalsZoetis, Inc. USD 2,361,328 147,583,000 2.83
147,583,000 2.83
Professional ServicesIHS Markit Ltd. USD 3,044,460 134,565,132 2.58 Verisk Analytics, Inc. USD 1,672,880 140,287,717 2.68
274,852,849 5.26
SoftwareActivision Blizzard, Inc. USD 2,255,943 129,288,094 2.47 MSCI, Inc.† USD 1,400,132 146,173,781 2.80 salesforce.com, Inc. USD 2,106,077 182,470,511 3.49 Workday, Inc. ‘A’ USD 1,805,781 173,427,207 3.32
631,359,593 12.08
Specialty RetailHome Depot, Inc. (The) USD 535,525 81,962,101 1.57 Tiffany & Co. USD 887,743 83,367,945 1.59
165,330,046 3.16
Textiles, Apparel & Luxury GoodsLVMH Moet Hennessy Louis Vuitton SE EUR 715,194 179,964,895 3.44 NIKE, Inc. ‘B’ USD 1,011,451 58,512,440 1.12
238,477,335 4.56
Total Equities 4,978,421,909 95.26
Total Transferable securities and money market instruments admitted to offi cial exchange listing or dealt in on another regulated market 4,978,421,909 95.26
SCHEDULE OF INVESTMENTSAs at 30 June 2017
Investments Currency
Quantity/Nominal
Value
Market Value USD
% of Net Assets
Units of authorised UCITS or other collective investment undertakings
Collective Investment Schemes – UCITS
Mutual FundsMorgan Stanley Liquidity Funds US Dollar
Treasury Liquidity Fund – MS Reserve† USD 208,067,558 208,067,558 3.98
208,067,558 3.98
Total Collective Investment Schemes – UCITS 208,067,558 3.98
Total Units of authorised UCITS or other collective investment undertakings 208,067,558 3.98
Total Investments 5,186,489,467 99.24
Cash (256,104) 0.00
Other Assets/(Liabilities) 40,141,931 0.76
Total Net Assets 5,226,375,294 100.00
† Managed by an affi liate of the Investment Adviser.
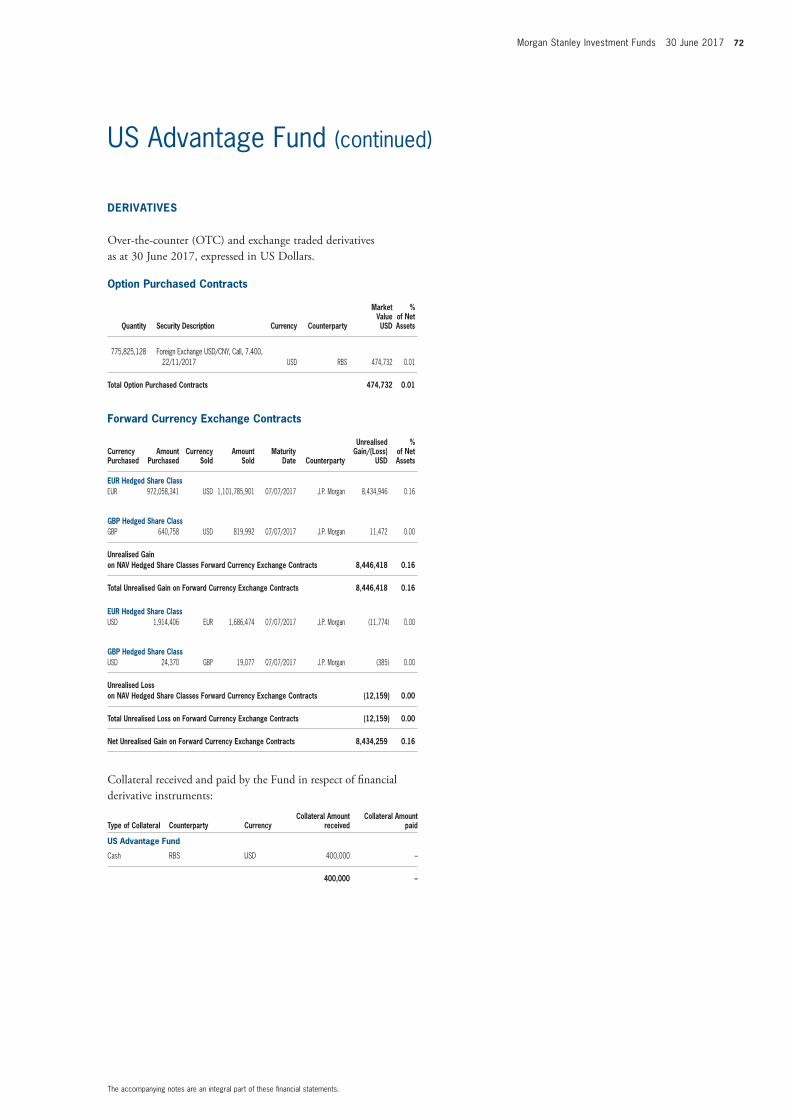
Morgan Stanley Investment Funds 30 June 2017 72
The accompanying notes are an integral part of these fi nancial statements.
US Advantage Fund (continued)
Option Purchased Contracts
Quantity Security Description Currency Counterparty
Market Value USD
% of Net Assets
775,825,128 Foreign Exchange USD/CNY, Call, 7.400, 22/11/2017 USD RBS 474,732 0.01
Total Option Purchased Contracts 474,732 0.01
Forward Currency Exchange Contracts
Currency Purchased
Amount Purchased
Currency Sold
Amount Sold
Maturity Date Counterparty
Unrealised Gain/(Loss)
USD
% of Net Assets
EUR Hedged Share ClassEUR 972,058,341 USD 1,101,785,901 07/07/2017 J.P. Morgan 8,434,946 0.16
GBP Hedged Share ClassGBP 640,758 USD 819,992 07/07/2017 J.P. Morgan 11,472 0.00
Unrealised Gain on NAV Hedged Share Classes Forward Currency Exchange Contracts 8,446,418 0.16
Total Unrealised Gain on Forward Currency Exchange Contracts 8,446,418 0.16
EUR Hedged Share ClassUSD 1,914,406 EUR 1,686,474 07/07/2017 J.P. Morgan (11,774) 0.00
GBP Hedged Share ClassUSD 24,370 GBP 19,077 07/07/2017 J.P. Morgan (385) 0.00
Unrealised Loss on NAV Hedged Share Classes Forward Currency Exchange Contracts (12,159) 0.00
Total Unrealised Loss on Forward Currency Exchange Contracts (12,159) 0.00
Net Unrealised Gain on Forward Currency Exchange Contracts 8,434,259 0.16
Collateral received and paid by the Fund in respect of fi nancial derivative instruments:
Type of Collateral Counterparty CurrencyCollateral Amount
receivedCollateral Amount
paid
US Advantage Fund
Cash RBS USD 400,000 –
400,000 –
DERIVATIVES
Over-the-counter (OTC) and exchange traded derivatives as at 30 June 2017, expressed in US Dollars.
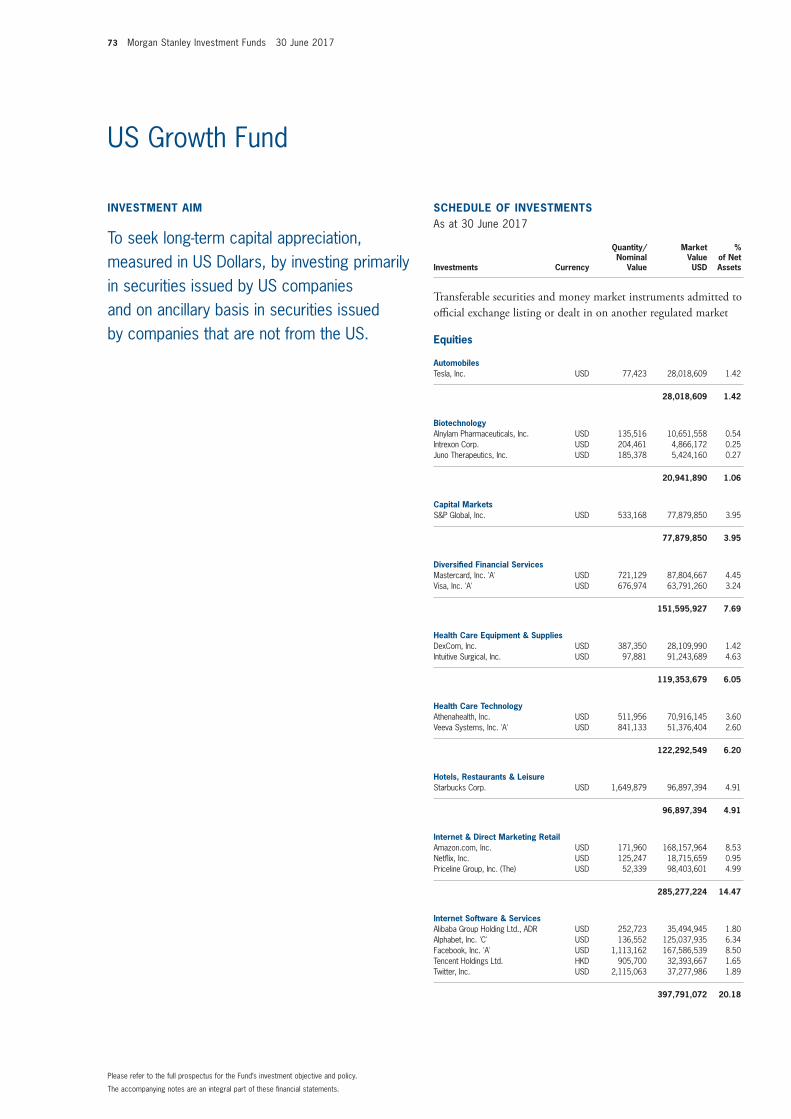
73 Morgan Stanley Investment Funds 30 June 2017
The accompanying notes are an integral part of these fi nancial statements.
Please refer to the full prospectus for the Fund’s investment objective and policy.
INVESTMENT AIM
To seek long-term capital appreciation, measured in US Dollars, by investing primarily in securities issued by US companies and on ancillary basis in securities issued by companies that are not from the US.
SCHEDULE OF INVESTMENTSAs at 30 June 2017
Investments Currency
Quantity/Nominal
Value
Market Value USD
% of Net Assets
Transferable securities and money market instruments admitted to offi cial exchange listing or dealt in on another regulated market
Equities
AutomobilesTesla, Inc. USD 77,423 28,018,609 1.42
28,018,609 1.42
BiotechnologyAlnylam Pharmaceuticals, Inc. USD 135,516 10,651,558 0.54 Intrexon Corp. USD 204,461 4,866,172 0.25 Juno Therapeutics, Inc. USD 185,378 5,424,160 0.27
20,941,890 1.06
Capital MarketsS&P Global, Inc. USD 533,168 77,879,850 3.95
77,879,850 3.95
Diversifi ed Financial ServicesMastercard, Inc. 'A' USD 721,129 87,804,667 4.45 Visa, Inc. 'A' USD 676,974 63,791,260 3.24
151,595,927 7.69
Health Care Equipment & SuppliesDexCom, Inc. USD 387,350 28,109,990 1.42 Intuitive Surgical, Inc. USD 97,881 91,243,689 4.63
119,353,679 6.05
Health Care TechnologyAthenahealth, Inc. USD 511,956 70,916,145 3.60 Veeva Systems, Inc. 'A' USD 841,133 51,376,404 2.60
122,292,549 6.20
Hotels, Restaurants & LeisureStarbucks Corp. USD 1,649,879 96,897,394 4.91
96,897,394 4.91
Internet & Direct Marketing RetailAmazon.com, Inc. USD 171,960 168,157,964 8.53 Netfl ix, Inc. USD 125,247 18,715,659 0.95 Priceline Group, Inc. (The) USD 52,339 98,403,601 4.99
285,277,224 14.47
Internet Software & ServicesAlibaba Group Holding Ltd., ADR USD 252,723 35,494,945 1.80 Alphabet, Inc. 'C' USD 136,552 125,037,935 6.34 Facebook, Inc. 'A' USD 1,113,162 167,586,539 8.50 Tencent Holdings Ltd. HKD 905,700 32,393,667 1.65 Twitter, Inc. USD 2,115,063 37,277,986 1.89
397,791,072 20.18
US Growth Fund
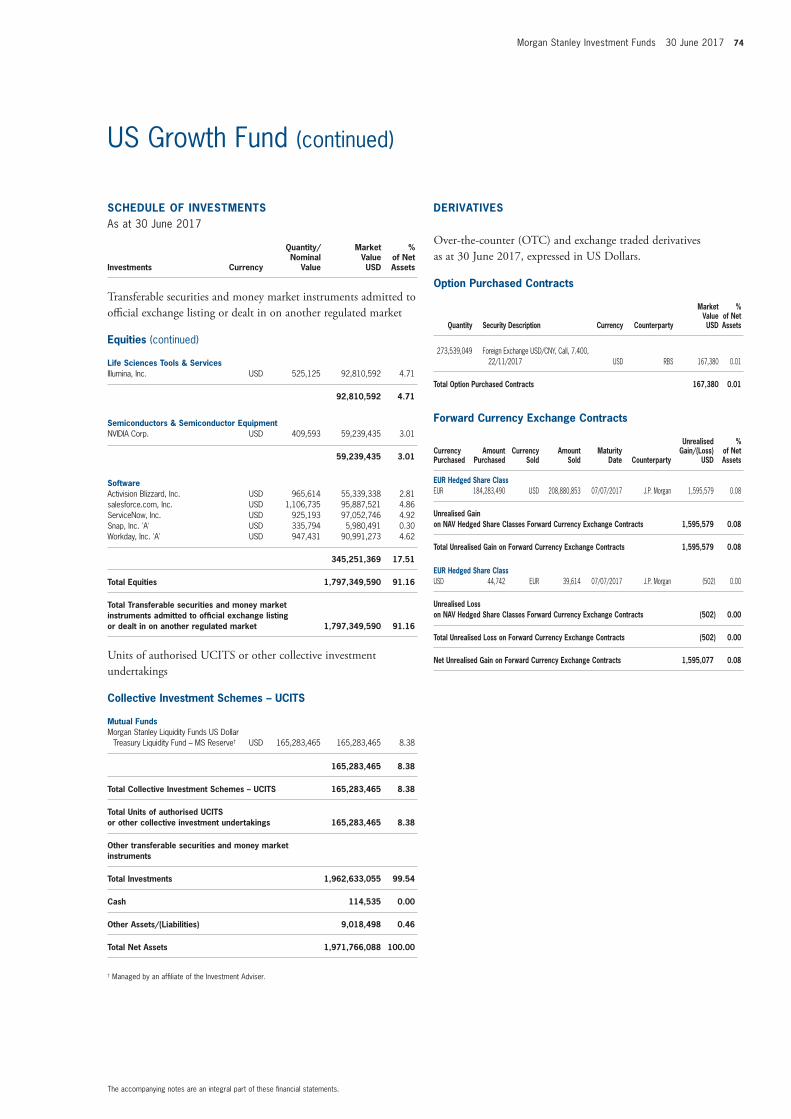
Morgan Stanley Investment Funds 30 June 2017 74
The accompanying notes are an integral part of these fi nancial statements.
US Growth Fund (continued)
SCHEDULE OF INVESTMENTSAs at 30 June 2017
Investments Currency
Quantity/Nominal
Value
Market Value USD
% of Net Assets
Transferable securities and money market instruments admitted to offi cial exchange listing or dealt in on another regulated market
Equities (continued)
Life Sciences Tools & ServicesIllumina, Inc. USD 525,125 92,810,592 4.71
92,810,592 4.71
Semiconductors & Semiconductor EquipmentNVIDIA Corp. USD 409,593 59,239,435 3.01
59,239,435 3.01
SoftwareActivision Blizzard, Inc. USD 965,614 55,339,338 2.81 salesforce.com, Inc. USD 1,106,735 95,887,521 4.86 ServiceNow, Inc. USD 925,193 97,052,746 4.92 Snap, Inc. 'A' USD 335,794 5,980,491 0.30 Workday, Inc. 'A' USD 947,431 90,991,273 4.62
345,251,369 17.51
Total Equities 1,797,349,590 91.16
Total Transferable securities and money market instruments admitted to offi cial exchange listing or dealt in on another regulated market 1,797,349,590 91.16
Units of authorised UCITS or other collective investment undertakings
Collective Investment Schemes – UCITS
Mutual FundsMorgan Stanley Liquidity Funds US Dollar
Treasury Liquidity Fund – MS Reserve† USD 165,283,465 165,283,465 8.38
165,283,465 8.38
Total Collective Investment Schemes – UCITS 165,283,465 8.38
Total Units of authorised UCITS or other collective investment undertakings 165,283,465 8.38
Other transferable securities and money market instruments
Total Investments 1,962,633,055 99.54
Cash 114,535 0.00
Other Assets/(Liabilities) 9,018,498 0.46
Total Net Assets 1,971,766,088 100.00
† Managed by an affi liate of the Investment Adviser.
Option Purchased Contracts
Quantity Security Description Currency Counterparty
Market Value USD
% of Net Assets
273,539,049 Foreign Exchange USD/CNY, Call, 7.400, 22/11/2017 USD RBS 167,380 0.01
Total Option Purchased Contracts 167,380 0.01
Forward Currency Exchange Contracts
Currency Purchased
Amount Purchased
Currency Sold
Amount Sold
Maturity Date Counterparty
Unrealised Gain/(Loss)
USD
% of Net Assets
EUR Hedged Share ClassEUR 184,283,490 USD 208,880,853 07/07/2017 J.P. Morgan 1,595,579 0.08
Unrealised Gain on NAV Hedged Share Classes Forward Currency Exchange Contracts 1,595,579 0.08
Total Unrealised Gain on Forward Currency Exchange Contracts 1,595,579 0.08
EUR Hedged Share ClassUSD 44,742 EUR 39,614 07/07/2017 J.P. Morgan (502) 0.00
Unrealised Loss on NAV Hedged Share Classes Forward Currency Exchange Contracts (502) 0.00
Total Unrealised Loss on Forward Currency Exchange Contracts (502) 0.00
Net Unrealised Gain on Forward Currency Exchange Contracts 1,595,077 0.08
DERIVATIVES
Over-the-counter (OTC) and exchange traded derivatives as at 30 June 2017, expressed in US Dollars.
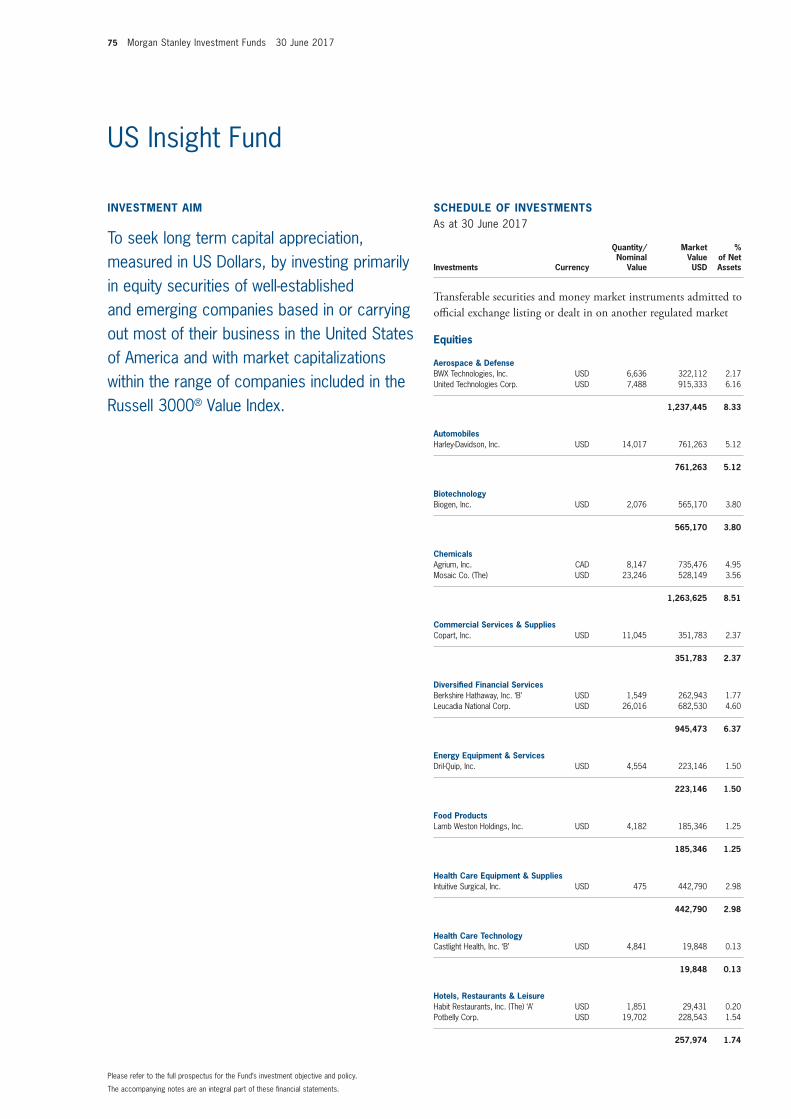
75 Morgan Stanley Investment Funds 30 June 2017
The accompanying notes are an integral part of these fi nancial statements.
Please refer to the full prospectus for the Fund’s investment objective and policy.
INVESTMENT AIM
To seek long term capital appreciation, measured in US Dollars, by investing primarily in equity securities of well-established and emerging companies based in or carrying out most of their business in the United States of America and with market capitalizations within the range of companies included in the Russell 3000® Value Index.
SCHEDULE OF INVESTMENTSAs at 30 June 2017
Investments Currency
Quantity/Nominal
Value
Market Value USD
% of Net Assets
Transferable securities and money market instruments admitted to offi cial exchange listing or dealt in on another regulated market
Equities
Aerospace & DefenseBWX Technologies, Inc. USD 6,636 322,112 2.17 United Technologies Corp. USD 7,488 915,333 6.16
1,237,445 8.33
AutomobilesHarley-Davidson, Inc. USD 14,017 761,263 5.12
761,263 5.12
BiotechnologyBiogen, Inc. USD 2,076 565,170 3.80
565,170 3.80
ChemicalsAgrium, Inc. CAD 8,147 735,476 4.95 Mosaic Co. (The) USD 23,246 528,149 3.56
1,263,625 8.51
Commercial Services & SuppliesCopart, Inc. USD 11,045 351,783 2.37
351,783 2.37
Diversifi ed Financial ServicesBerkshire Hathaway, Inc. ‘B’ USD 1,549 262,943 1.77 Leucadia National Corp. USD 26,016 682,530 4.60
945,473 6.37
Energy Equipment & ServicesDril-Quip, Inc. USD 4,554 223,146 1.50
223,146 1.50
Food ProductsLamb Weston Holdings, Inc. USD 4,182 185,346 1.25
185,346 1.25
Health Care Equipment & SuppliesIntuitive Surgical, Inc. USD 475 442,790 2.98
442,790 2.98
Health Care TechnologyCastlight Health, Inc. ‘B’ USD 4,841 19,848 0.13
19,848 0.13
Hotels, Restaurants & LeisureHabit Restaurants, Inc. (The) ‘A’ USD 1,851 29,431 0.20 Potbelly Corp. USD 19,702 228,543 1.54
257,974 1.74
US Insight Fund
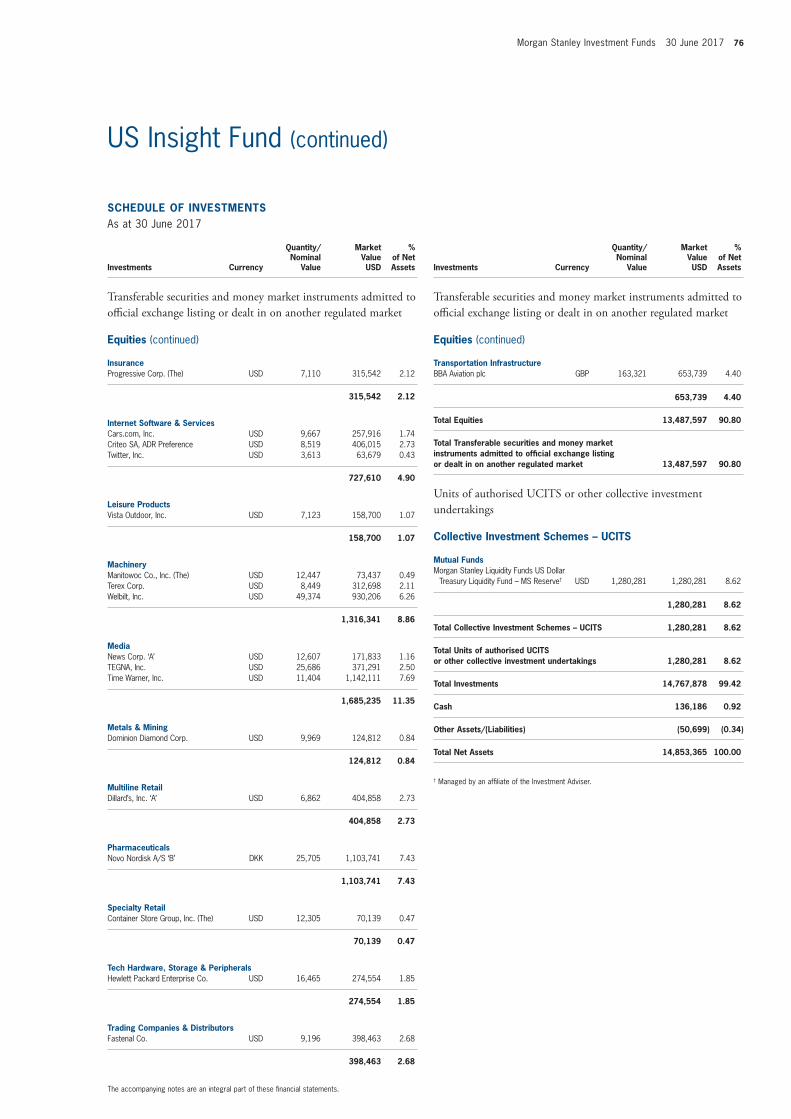
Morgan Stanley Investment Funds 30 June 2017 76
The accompanying notes are an integral part of these fi nancial statements.
US Insight Fund (continued)
SCHEDULE OF INVESTMENTSAs at 30 June 2017
Investments Currency
Quantity/Nominal
Value
Market Value USD
% of Net Assets
Transferable securities and money market instruments admitted to offi cial exchange listing or dealt in on another regulated market
Equities (continued)
InsuranceProgressive Corp. (The) USD 7,110 315,542 2.12
315,542 2.12
Internet Software & ServicesCars.com, Inc. USD 9,667 257,916 1.74 Criteo SA, ADR Preference USD 8,519 406,015 2.73 Twitter, Inc. USD 3,613 63,679 0.43
727,610 4.90
Leisure ProductsVista Outdoor, Inc. USD 7,123 158,700 1.07
158,700 1.07
MachineryManitowoc Co., Inc. (The) USD 12,447 73,437 0.49 Terex Corp. USD 8,449 312,698 2.11 Welbilt, Inc. USD 49,374 930,206 6.26
1,316,341 8.86
MediaNews Corp. ‘A’ USD 12,607 171,833 1.16 TEGNA, Inc. USD 25,686 371,291 2.50 Time Warner, Inc. USD 11,404 1,142,111 7.69
1,685,235 11.35
Metals & MiningDominion Diamond Corp. USD 9,969 124,812 0.84
124,812 0.84
Multiline RetailDillard’s, Inc. ‘A’ USD 6,862 404,858 2.73
404,858 2.73
PharmaceuticalsNovo Nordisk A/S ‘B’ DKK 25,705 1,103,741 7.43
1,103,741 7.43
Specialty RetailContainer Store Group, Inc. (The) USD 12,305 70,139 0.47
70,139 0.47
Tech Hardware, Storage & PeripheralsHewlett Packard Enterprise Co. USD 16,465 274,554 1.85
274,554 1.85
Trading Companies & DistributorsFastenal Co. USD 9,196 398,463 2.68
398,463 2.68
SCHEDULE OF INVESTMENTSAs at 30 June 2017
Investments Currency
Quantity/Nominal
Value
Market Value USD
% of Net Assets
Transferable securities and money market instruments admitted to offi cial exchange listing or dealt in on another regulated market
Equities (continued)
Transportation InfrastructureBBA Aviation plc GBP 163,321 653,739 4.40
653,739 4.40
Total Equities 13,487,597 90.80
Total Transferable securities and money market instruments admitted to offi cial exchange listing or dealt in on another regulated market 13,487,597 90.80
Units of authorised UCITS or other collective investment undertakings
Collective Investment Schemes – UCITS
Mutual FundsMorgan Stanley Liquidity Funds US Dollar
Treasury Liquidity Fund – MS Reserve† USD 1,280,281 1,280,281 8.62
1,280,281 8.62
Total Collective Investment Schemes – UCITS 1,280,281 8.62
Total Units of authorised UCITS or other collective investment undertakings 1,280,281 8.62
Total Investments 14,767,878 99.42
Cash 136,186 0.92
Other Assets/(Liabilities) (50,699) (0.34)
Total Net Assets 14,853,365 100.00
† Managed by an affi liate of the Investment Adviser.
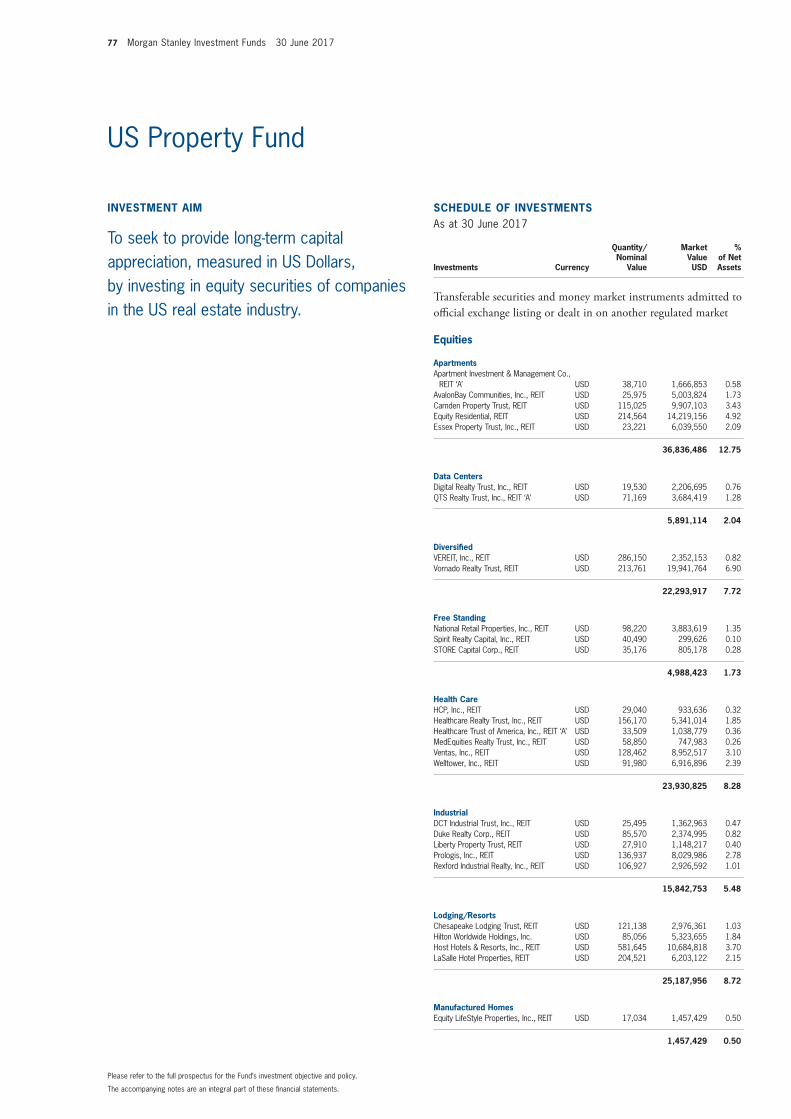
77 Morgan Stanley Investment Funds 30 June 2017
The accompanying notes are an integral part of these fi nancial statements.
Please refer to the full prospectus for the Fund’s investment objective and policy.
INVESTMENT AIM
To seek to provide long-term capital appreciation, measured in US Dollars, by investing in equity securities of companies in the US real estate industry.
SCHEDULE OF INVESTMENTSAs at 30 June 2017
Investments Currency
Quantity/Nominal
Value
Market Value USD
% of Net Assets
Transferable securities and money market instruments admitted to offi cial exchange listing or dealt in on another regulated market
Equities
ApartmentsApartment Investment & Management Co.,
REIT ‘A’ USD 38,710 1,666,853 0.58 AvalonBay Communities, Inc., REIT USD 25,975 5,003,824 1.73 Camden Property Trust, REIT USD 115,025 9,907,103 3.43 Equity Residential, REIT USD 214,564 14,219,156 4.92 Essex Property Trust, Inc., REIT USD 23,221 6,039,550 2.09
36,836,486 12.75
Data CentersDigital Realty Trust, Inc., REIT USD 19,530 2,206,695 0.76 QTS Realty Trust, Inc., REIT ‘A’ USD 71,169 3,684,419 1.28
5,891,114 2.04
Diversifi edVEREIT, Inc., REIT USD 286,150 2,352,153 0.82 Vornado Realty Trust, REIT USD 213,761 19,941,764 6.90
22,293,917 7.72
Free StandingNational Retail Properties, Inc., REIT USD 98,220 3,883,619 1.35 Spirit Realty Capital, Inc., REIT USD 40,490 299,626 0.10 STORE Capital Corp., REIT USD 35,176 805,178 0.28
4,988,423 1.73
Health CareHCP, Inc., REIT USD 29,040 933,636 0.32 Healthcare Realty Trust, Inc., REIT USD 156,170 5,341,014 1.85 Healthcare Trust of America, Inc., REIT ‘A’ USD 33,509 1,038,779 0.36 MedEquities Realty Trust, Inc., REIT USD 58,850 747,983 0.26 Ventas, Inc., REIT USD 128,462 8,952,517 3.10 Welltower, Inc., REIT USD 91,980 6,916,896 2.39
23,930,825 8.28
IndustrialDCT Industrial Trust, Inc., REIT USD 25,495 1,362,963 0.47 Duke Realty Corp., REIT USD 85,570 2,374,995 0.82 Liberty Property Trust, REIT USD 27,910 1,148,217 0.40 Prologis, Inc., REIT USD 136,937 8,029,986 2.78 Rexford Industrial Realty, Inc., REIT USD 106,927 2,926,592 1.01
15,842,753 5.48
Lodging/ResortsChesapeake Lodging Trust, REIT USD 121,138 2,976,361 1.03 Hilton Worldwide Holdings, Inc. USD 85,056 5,323,655 1.84 Host Hotels & Resorts, Inc., REIT USD 581,645 10,684,818 3.70 LaSalle Hotel Properties, REIT USD 204,521 6,203,122 2.15
25,187,956 8.72
Manufactured HomesEquity LifeStyle Properties, Inc., REIT USD 17,034 1,457,429 0.50
1,457,429 0.50
US Property Fund
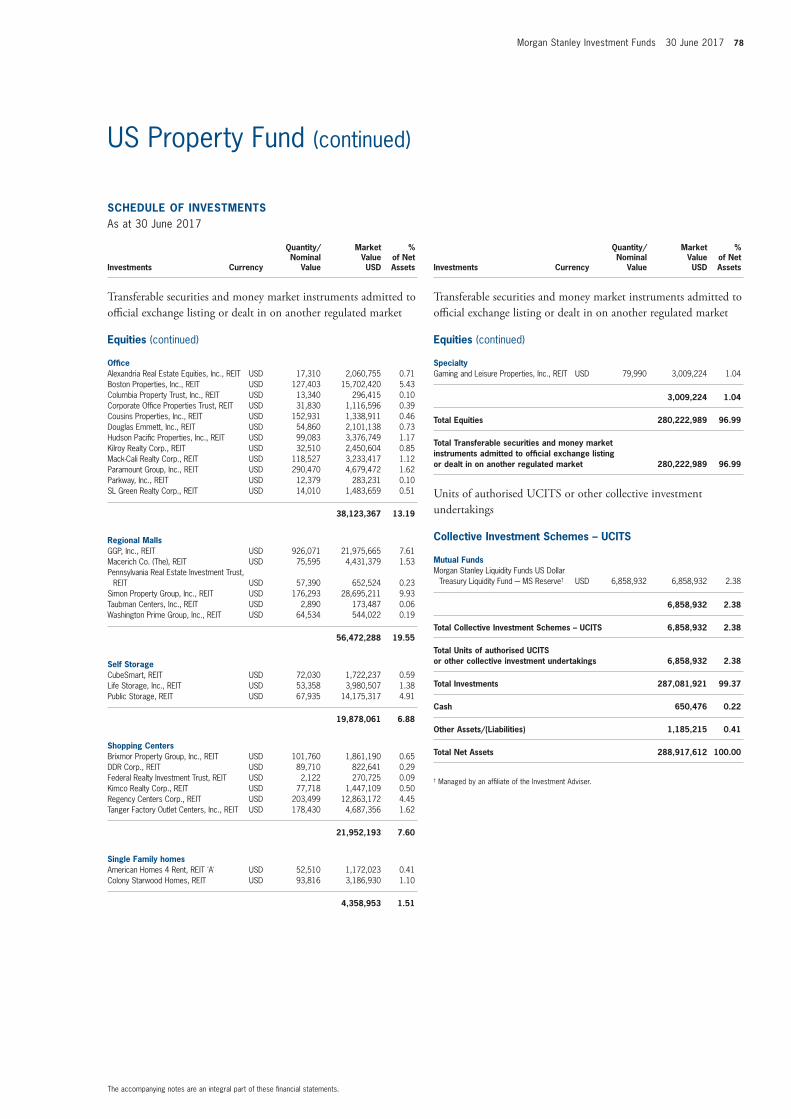
Morgan Stanley Investment Funds 30 June 2017 78
The accompanying notes are an integral part of these fi nancial statements.
US Property Fund (continued)
SCHEDULE OF INVESTMENTSAs at 30 June 2017
Investments Currency
Quantity/Nominal
Value
Market Value USD
% of Net Assets
Transferable securities and money market instruments admitted to offi cial exchange listing or dealt in on another regulated market
Equities (continued)
Offi ceAlexandria Real Estate Equities, Inc., REIT USD 17,310 2,060,755 0.71 Boston Properties, Inc., REIT USD 127,403 15,702,420 5.43 Columbia Property Trust, Inc., REIT USD 13,340 296,415 0.10 Corporate Offi ce Properties Trust, REIT USD 31,830 1,116,596 0.39 Cousins Properties, Inc., REIT USD 152,931 1,338,911 0.46 Douglas Emmett, Inc., REIT USD 54,860 2,101,138 0.73 Hudson Pacifi c Properties, Inc., REIT USD 99,083 3,376,749 1.17 Kilroy Realty Corp., REIT USD 32,510 2,450,604 0.85 Mack-Cali Realty Corp., REIT USD 118,527 3,233,417 1.12 Paramount Group, Inc., REIT USD 290,470 4,679,472 1.62 Parkway, Inc., REIT USD 12,379 283,231 0.10 SL Green Realty Corp., REIT USD 14,010 1,483,659 0.51
38,123,367 13.19
Regional MallsGGP, Inc., REIT USD 926,071 21,975,665 7.61 Macerich Co. (The), REIT USD 75,595 4,431,379 1.53 Pennsylvania Real Estate Investment Trust,
REIT USD 57,390 652,524 0.23 Simon Property Group, Inc., REIT USD 176,293 28,695,211 9.93 Taubman Centers, Inc., REIT USD 2,890 173,487 0.06 Washington Prime Group, Inc., REIT USD 64,534 544,022 0.19
56,472,288 19.55
Self StorageCubeSmart, REIT USD 72,030 1,722,237 0.59 Life Storage, Inc., REIT USD 53,358 3,980,507 1.38 Public Storage, REIT USD 67,935 14,175,317 4.91
19,878,061 6.88
Shopping CentersBrixmor Property Group, Inc., REIT USD 101,760 1,861,190 0.65 DDR Corp., REIT USD 89,710 822,641 0.29 Federal Realty Investment Trust, REIT USD 2,122 270,725 0.09 Kimco Realty Corp., REIT USD 77,718 1,447,109 0.50 Regency Centers Corp., REIT USD 203,499 12,863,172 4.45 Tanger Factory Outlet Centers, Inc., REIT USD 178,430 4,687,356 1.62
21,952,193 7.60
Single Family homesAmerican Homes 4 Rent, REIT 'A' USD 52,510 1,172,023 0.41 Colony Starwood Homes, REIT USD 93,816 3,186,930 1.10
4,358,953 1.51
SCHEDULE OF INVESTMENTSAs at 30 June 2017
Investments Currency
Quantity/Nominal
Value
Market Value USD
% of Net Assets
Transferable securities and money market instruments admitted to offi cial exchange listing or dealt in on another regulated market
Equities (continued)
SpecialtyGaming and Leisure Properties, Inc., REIT USD 79,990 3,009,224 1.04
3,009,224 1.04
Total Equities 280,222,989 96.99
Total Transferable securities and money market instruments admitted to offi cial exchange listing or dealt in on another regulated market 280,222,989 96.99
Units of authorised UCITS or other collective investment undertakings
Collective Investment Schemes – UCITS
Mutual FundsMorgan Stanley Liquidity Funds US Dollar
Treasury Liquidity Fund -– MS Reserve† USD 6,858,932 6,858,932 2.38
6,858,932 2.38
Total Collective Investment Schemes – UCITS 6,858,932 2.38
Total Units of authorised UCITS or other collective investment undertakings 6,858,932 2.38
Total Investments 287,081,921 99.37
Cash 650,476 0.22
Other Assets/(Liabilities) 1,185,215 0.41
Total Net Assets 288,917,612 100.00
† Managed by an affi liate of the Investment Adviser.
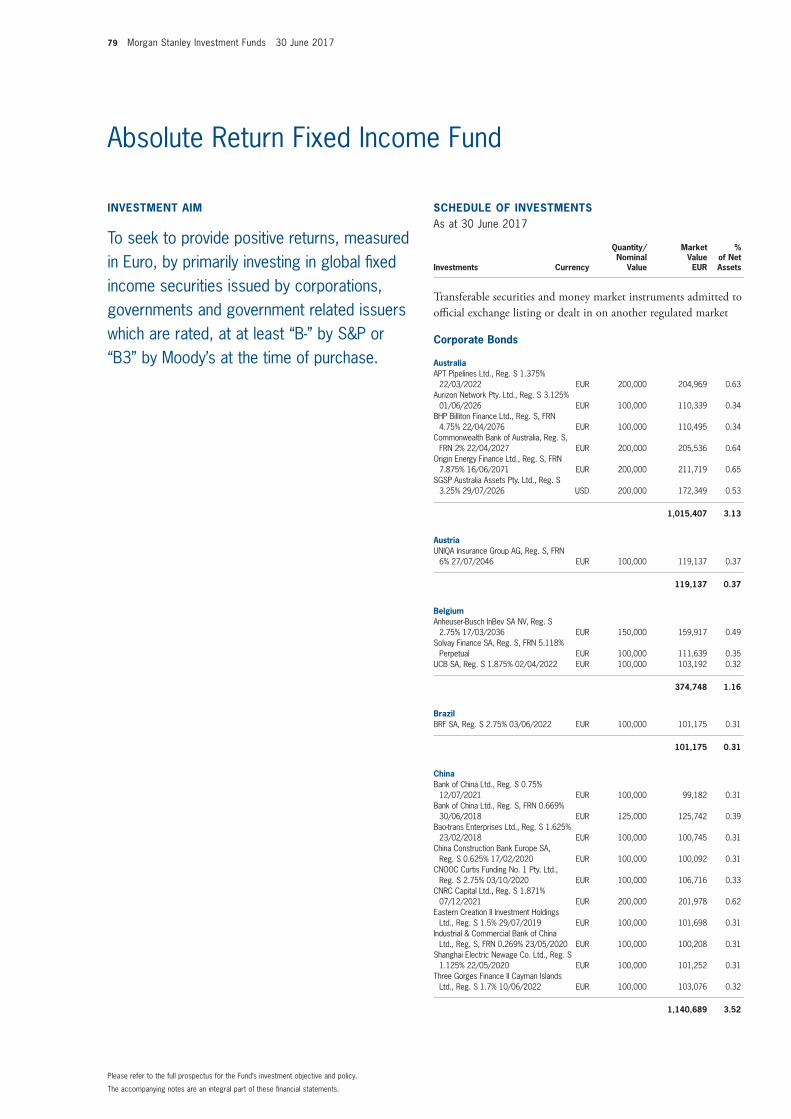
79 Morgan Stanley Investment Funds 30 June 2017
The accompanying notes are an integral part of these fi nancial statements.
Please refer to the full prospectus for the Fund’s investment objective and policy.
INVESTMENT AIM
To seek to provide positive returns, measured in Euro, by primarily investing in global fi xed income securities issued by corporations, governments and government related issuers which are rated, at at least “B-” by S&P or “B3” by Moody’s at the time of purchase.
SCHEDULE OF INVESTMENTSAs at 30 June 2017
Investments Currency
Quantity/Nominal
Value
Market Value EUR
% of Net Assets
Transferable securities and money market instruments admitted to offi cial exchange listing or dealt in on another regulated market
Corporate Bonds
AustraliaAPT Pipelines Ltd., Reg. S 1.375%
22/03/2022 EUR 200,000 204,969 0.63 Aurizon Network Pty. Ltd., Reg. S 3.125%
01/06/2026 EUR 100,000 110,339 0.34 BHP Billiton Finance Ltd., Reg. S, FRN
4.75% 22/04/2076 EUR 100,000 110,495 0.34 Commonwealth Bank of Australia, Reg. S,
FRN 2% 22/04/2027 EUR 200,000 205,536 0.64 Origin Energy Finance Ltd., Reg. S, FRN
7.875% 16/06/2071 EUR 200,000 211,719 0.65 SGSP Australia Assets Pty. Ltd., Reg. S
3.25% 29/07/2026 USD 200,000 172,349 0.53
1,015,407 3.13
AustriaUNIQA Insurance Group AG, Reg. S, FRN
6% 27/07/2046 EUR 100,000 119,137 0.37
119,137 0.37
BelgiumAnheuser-Busch InBev SA NV, Reg. S
2.75% 17/03/2036 EUR 150,000 159,917 0.49 Solvay Finance SA, Reg. S, FRN 5.118%
Perpetual EUR 100,000 111,639 0.35 UCB SA, Reg. S 1.875% 02/04/2022 EUR 100,000 103,192 0.32
374,748 1.16
BrazilBRF SA, Reg. S 2.75% 03/06/2022 EUR 100,000 101,175 0.31
101,175 0.31
ChinaBank of China Ltd., Reg. S 0.75%
12/07/2021 EUR 100,000 99,182 0.31 Bank of China Ltd., Reg. S, FRN 0.669%
30/06/2018 EUR 125,000 125,742 0.39 Bao-trans Enterprises Ltd., Reg. S 1.625%
23/02/2018 EUR 100,000 100,745 0.31 China Construction Bank Europe SA,
Reg. S 0.625% 17/02/2020 EUR 100,000 100,092 0.31 CNOOC Curtis Funding No. 1 Pty. Ltd.,
Reg. S 2.75% 03/10/2020 EUR 100,000 106,716 0.33 CNRC Capital Ltd., Reg. S 1.871%
07/12/2021 EUR 200,000 201,978 0.62 Eastern Creation II Investment Holdings
Ltd., Reg. S 1.5% 29/07/2019 EUR 100,000 101,698 0.31 Industrial & Commercial Bank of China
Ltd., Reg. S, FRN 0.269% 23/05/2020 EUR 100,000 100,208 0.31 Shanghai Electric Newage Co. Ltd., Reg. S
1.125% 22/05/2020 EUR 100,000 101,252 0.31 Three Gorges Finance II Cayman Islands
Ltd., Reg. S 1.7% 10/06/2022 EUR 100,000 103,076 0.32
1,140,689 3.52
Absolute Return Fixed Income Fund
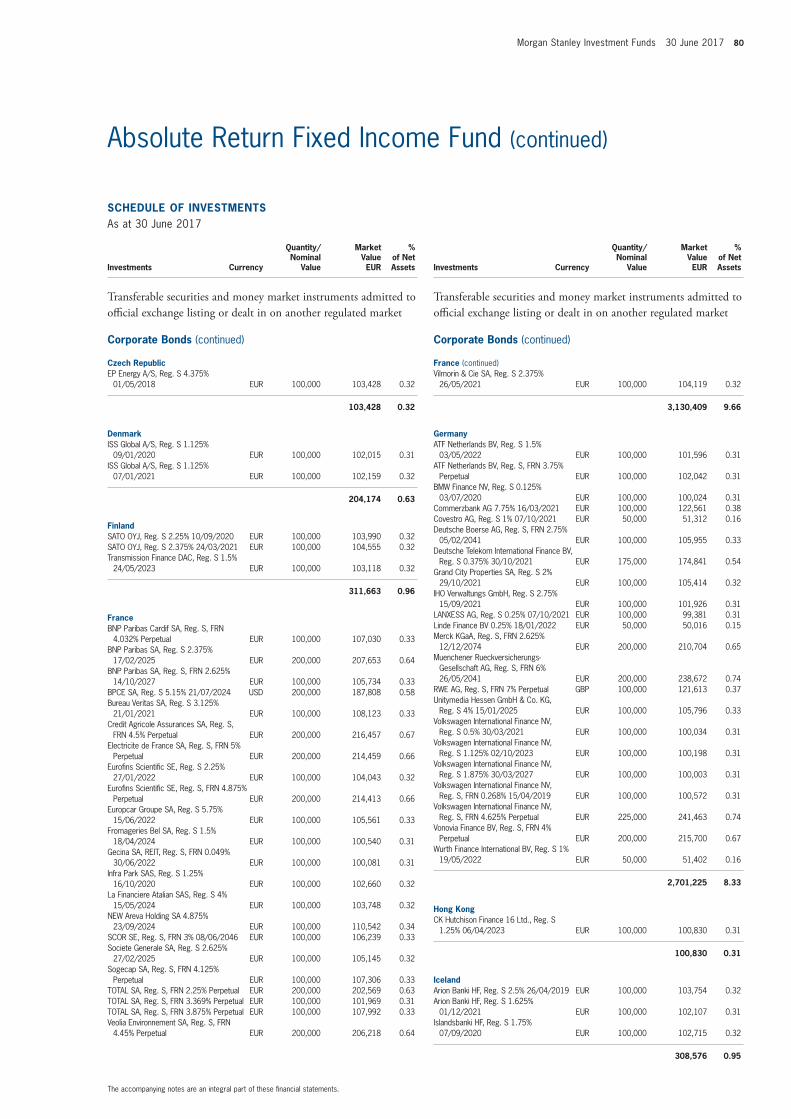
Morgan Stanley Investment Funds 30 June 2017 80
The accompanying notes are an integral part of these fi nancial statements.
Absolute Return Fixed Income Fund (continued)
SCHEDULE OF INVESTMENTSAs at 30 June 2017
Investments Currency
Quantity/Nominal
Value
Market Value EUR
% of Net Assets
Transferable securities and money market instruments admitted to offi cial exchange listing or dealt in on another regulated market
Corporate Bonds (continued)
Czech RepublicEP Energy A/S, Reg. S 4.375%
01/05/2018 EUR 100,000 103,428 0.32
103,428 0.32
DenmarkISS Global A/S, Reg. S 1.125%
09/01/2020 EUR 100,000 102,015 0.31 ISS Global A/S, Reg. S 1.125%
07/01/2021 EUR 100,000 102,159 0.32
204,174 0.63
FinlandSATO OYJ, Reg. S 2.25% 10/09/2020 EUR 100,000 103,990 0.32 SATO OYJ, Reg. S 2.375% 24/03/2021 EUR 100,000 104,555 0.32 Transmission Finance DAC, Reg. S 1.5%
24/05/2023 EUR 100,000 103,118 0.32
311,663 0.96
FranceBNP Paribas Cardif SA, Reg. S, FRN
4.032% Perpetual EUR 100,000 107,030 0.33 BNP Paribas SA, Reg. S 2.375%
17/02/2025 EUR 200,000 207,653 0.64 BNP Paribas SA, Reg. S, FRN 2.625%
14/10/2027 EUR 100,000 105,734 0.33 BPCE SA, Reg. S 5.15% 21/07/2024 USD 200,000 187,808 0.58 Bureau Veritas SA, Reg. S 3.125%
21/01/2021 EUR 100,000 108,123 0.33 Credit Agricole Assurances SA, Reg. S,
FRN 4.5% Perpetual EUR 200,000 216,457 0.67 Electricite de France SA, Reg. S, FRN 5%
Perpetual EUR 200,000 214,459 0.66 Eurofi ns Scientifi c SE, Reg. S 2.25%
27/01/2022 EUR 100,000 104,043 0.32 Eurofi ns Scientifi c SE, Reg. S, FRN 4.875%
Perpetual EUR 200,000 214,413 0.66 Europcar Groupe SA, Reg. S 5.75%
15/06/2022 EUR 100,000 105,561 0.33 Fromageries Bel SA, Reg. S 1.5%
18/04/2024 EUR 100,000 100,540 0.31 Gecina SA, REIT, Reg. S, FRN 0.049%
30/06/2022 EUR 100,000 100,081 0.31 Infra Park SAS, Reg. S 1.25%
16/10/2020 EUR 100,000 102,660 0.32 La Financiere Atalian SAS, Reg. S 4%
15/05/2024 EUR 100,000 103,748 0.32 NEW Areva Holding SA 4.875%
23/09/2024 EUR 100,000 110,542 0.34 SCOR SE, Reg. S, FRN 3% 08/06/2046 EUR 100,000 106,239 0.33 Societe Generale SA, Reg. S 2.625%
27/02/2025 EUR 100,000 105,145 0.32 Sogecap SA, Reg. S, FRN 4.125%
Perpetual EUR 100,000 107,306 0.33 TOTAL SA, Reg. S, FRN 2.25% Perpetual EUR 200,000 202,569 0.63 TOTAL SA, Reg. S, FRN 3.369% Perpetual EUR 100,000 101,969 0.31 TOTAL SA, Reg. S, FRN 3.875% Perpetual EUR 100,000 107,992 0.33 Veolia Environnement SA, Reg. S, FRN
4.45% Perpetual EUR 200,000 206,218 0.64
SCHEDULE OF INVESTMENTSAs at 30 June 2017
Investments Currency
Quantity/Nominal
Value
Market Value EUR
% of Net Assets
Transferable securities and money market instruments admitted to offi cial exchange listing or dealt in on another regulated market
Corporate Bonds (continued)
France (continued)Vilmorin & Cie SA, Reg. S 2.375%
26/05/2021 EUR 100,000 104,119 0.32
3,130,409 9.66
GermanyATF Netherlands BV, Reg. S 1.5%
03/05/2022 EUR 100,000 101,596 0.31 ATF Netherlands BV, Reg. S, FRN 3.75%
Perpetual EUR 100,000 102,042 0.31 BMW Finance NV, Reg. S 0.125%
03/07/2020 EUR 100,000 100,024 0.31 Commerzbank AG 7.75% 16/03/2021 EUR 100,000 122,561 0.38 Covestro AG, Reg. S 1% 07/10/2021 EUR 50,000 51,312 0.16 Deutsche Boerse AG, Reg. S, FRN 2.75%
05/02/2041 EUR 100,000 105,955 0.33 Deutsche Telekom International Finance BV,
Reg. S 0.375% 30/10/2021 EUR 175,000 174,841 0.54 Grand City Properties SA, Reg. S 2%
29/10/2021 EUR 100,000 105,414 0.32 IHO Verwaltungs GmbH, Reg. S 2.75%
15/09/2021 EUR 100,000 101,926 0.31 LANXESS AG, Reg. S 0.25% 07/10/2021 EUR 100,000 99,381 0.31 Linde Finance BV 0.25% 18/01/2022 EUR 50,000 50,016 0.15 Merck KGaA, Reg. S, FRN 2.625%
12/12/2074 EUR 200,000 210,704 0.65 Muenchener Rueckversicherungs-
Gesellschaft AG, Reg. S, FRN 6% 26/05/2041 EUR 200,000 238,672 0.74
RWE AG, Reg. S, FRN 7% Perpetual GBP 100,000 121,613 0.37 Unitymedia Hessen GmbH & Co. KG,
Reg. S 4% 15/01/2025 EUR 100,000 105,796 0.33 Volkswagen International Finance NV,
Reg. S 0.5% 30/03/2021 EUR 100,000 100,034 0.31 Volkswagen International Finance NV,
Reg. S 1.125% 02/10/2023 EUR 100,000 100,198 0.31 Volkswagen International Finance NV,
Reg. S 1.875% 30/03/2027 EUR 100,000 100,003 0.31 Volkswagen International Finance NV,
Reg. S, FRN 0.268% 15/04/2019 EUR 100,000 100,572 0.31 Volkswagen International Finance NV,
Reg. S, FRN 4.625% Perpetual EUR 225,000 241,463 0.74 Vonovia Finance BV, Reg. S, FRN 4%
Perpetual EUR 200,000 215,700 0.67 Wurth Finance International BV, Reg. S 1%
19/05/2022 EUR 50,000 51,402 0.16
2,701,225 8.33
Hong KongCK Hutchison Finance 16 Ltd., Reg. S
1.25% 06/04/2023 EUR 100,000 100,830 0.31
100,830 0.31
IcelandArion Banki HF, Reg. S 2.5% 26/04/2019 EUR 100,000 103,754 0.32 Arion Banki HF, Reg. S 1.625%
01/12/2021 EUR 100,000 102,107 0.31 Islandsbanki HF, Reg. S 1.75%
07/09/2020 EUR 100,000 102,715 0.32
308,576 0.95
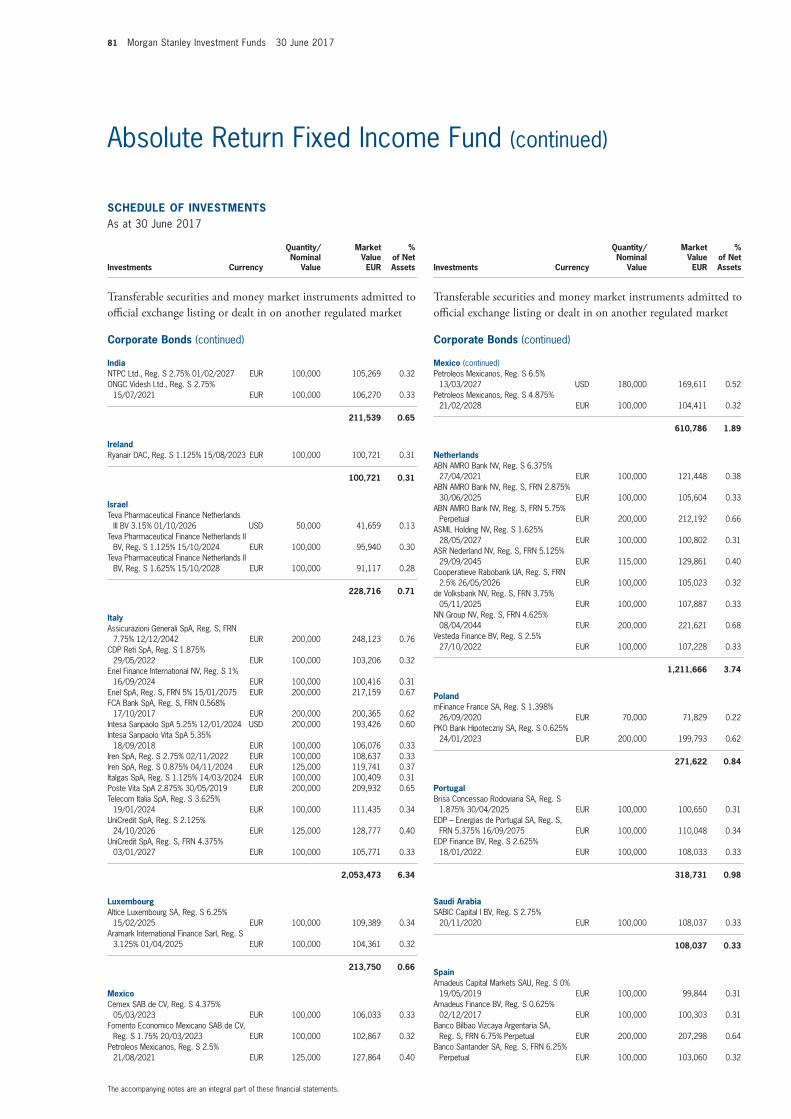
81 Morgan Stanley Investment Funds 30 June 2017
The accompanying notes are an integral part of these fi nancial statements.
Absolute Return Fixed Income Fund (continued)
SCHEDULE OF INVESTMENTSAs at 30 June 2017
Investments Currency
Quantity/Nominal
Value
Market Value EUR
% of Net Assets
Transferable securities and money market instruments admitted to offi cial exchange listing or dealt in on another regulated market
Corporate Bonds (continued)
IndiaNTPC Ltd., Reg. S 2.75% 01/02/2027 EUR 100,000 105,269 0.32 ONGC Videsh Ltd., Reg. S 2.75%
15/07/2021 EUR 100,000 106,270 0.33
211,539 0.65
IrelandRyanair DAC, Reg. S 1.125% 15/08/2023 EUR 100,000 100,721 0.31
100,721 0.31
IsraelTeva Pharmaceutical Finance Netherlands
III BV 3.15% 01/10/2026 USD 50,000 41,659 0.13 Teva Pharmaceutical Finance Netherlands II
BV, Reg. S 1.125% 15/10/2024 EUR 100,000 95,940 0.30 Teva Pharmaceutical Finance Netherlands II
BV, Reg. S 1.625% 15/10/2028 EUR 100,000 91,117 0.28
228,716 0.71
ItalyAssicurazioni Generali SpA, Reg. S, FRN
7.75% 12/12/2042 EUR 200,000 248,123 0.76 CDP Reti SpA, Reg. S 1.875%
29/05/2022 EUR 100,000 103,206 0.32 Enel Finance International NV, Reg. S 1%
16/09/2024 EUR 100,000 100,416 0.31 Enel SpA, Reg. S, FRN 5% 15/01/2075 EUR 200,000 217,159 0.67 FCA Bank SpA, Reg. S, FRN 0.568%
17/10/2017 EUR 200,000 200,365 0.62 Intesa Sanpaolo SpA 5.25% 12/01/2024 USD 200,000 193,426 0.60 Intesa Sanpaolo Vita SpA 5.35%
18/09/2018 EUR 100,000 106,076 0.33 Iren SpA, Reg. S 2.75% 02/11/2022 EUR 100,000 108,637 0.33 Iren SpA, Reg. S 0.875% 04/11/2024 EUR 125,000 119,741 0.37 Italgas SpA, Reg. S 1.125% 14/03/2024 EUR 100,000 100,409 0.31 Poste Vita SpA 2.875% 30/05/2019 EUR 200,000 209,932 0.65 Telecom Italia SpA, Reg. S 3.625%
19/01/2024 EUR 100,000 111,435 0.34 UniCredit SpA, Reg. S 2.125%
24/10/2026 EUR 125,000 128,777 0.40 UniCredit SpA, Reg. S, FRN 4.375%
03/01/2027 EUR 100,000 105,771 0.33
2,053,473 6.34
LuxembourgAltice Luxembourg SA, Reg. S 6.25%
15/02/2025 EUR 100,000 109,389 0.34 Aramark International Finance Sarl, Reg. S
3.125% 01/04/2025 EUR 100,000 104,361 0.32
213,750 0.66
MexicoCemex SAB de CV, Reg. S 4.375%
05/03/2023 EUR 100,000 106,033 0.33 Fomento Economico Mexicano SAB de CV,
Reg. S 1.75% 20/03/2023 EUR 100,000 102,867 0.32 Petroleos Mexicanos, Reg. S 2.5%
21/08/2021 EUR 125,000 127,864 0.40
SCHEDULE OF INVESTMENTSAs at 30 June 2017
Investments Currency
Quantity/Nominal
Value
Market Value EUR
% of Net Assets
Transferable securities and money market instruments admitted to offi cial exchange listing or dealt in on another regulated market
Corporate Bonds (continued)
Mexico (continued)Petroleos Mexicanos, Reg. S 6.5%
13/03/2027 USD 180,000 169,611 0.52 Petroleos Mexicanos, Reg. S 4.875%
21/02/2028 EUR 100,000 104,411 0.32
610,786 1.89
NetherlandsABN AMRO Bank NV, Reg. S 6.375%
27/04/2021 EUR 100,000 121,448 0.38 ABN AMRO Bank NV, Reg. S, FRN 2.875%
30/06/2025 EUR 100,000 105,604 0.33 ABN AMRO Bank NV, Reg. S, FRN 5.75%
Perpetual EUR 200,000 212,192 0.66 ASML Holding NV, Reg. S 1.625%
28/05/2027 EUR 100,000 100,802 0.31 ASR Nederland NV, Reg. S, FRN 5.125%
29/09/2045 EUR 115,000 129,861 0.40 Cooperatieve Rabobank UA, Reg. S, FRN
2.5% 26/05/2026 EUR 100,000 105,023 0.32 de Volksbank NV, Reg. S, FRN 3.75%
05/11/2025 EUR 100,000 107,887 0.33 NN Group NV, Reg. S, FRN 4.625%
08/04/2044 EUR 200,000 221,621 0.68 Vesteda Finance BV, Reg. S 2.5%
27/10/2022 EUR 100,000 107,228 0.33
1,211,666 3.74
PolandmFinance France SA, Reg. S 1.398%
26/09/2020 EUR 70,000 71,829 0.22 PKO Bank Hipoteczny SA, Reg. S 0.625%
24/01/2023 EUR 200,000 199,793 0.62
271,622 0.84
PortugalBrisa Concessao Rodoviaria SA, Reg. S
1.875% 30/04/2025 EUR 100,000 100,650 0.31 EDP – Energias de Portugal SA, Reg. S,
FRN 5.375% 16/09/2075 EUR 100,000 110,048 0.34 EDP Finance BV, Reg. S 2.625%
18/01/2022 EUR 100,000 108,033 0.33
318,731 0.98
Saudi ArabiaSABIC Capital I BV, Reg. S 2.75%
20/11/2020 EUR 100,000 108,037 0.33
108,037 0.33
SpainAmadeus Capital Markets SAU, Reg. S 0%
19/05/2019 EUR 100,000 99,844 0.31 Amadeus Finance BV, Reg. S 0.625%
02/12/2017 EUR 100,000 100,303 0.31 Banco Bilbao Vizcaya Argentaria SA,
Reg. S, FRN 6.75% Perpetual EUR 200,000 207,298 0.64 Banco Santander SA, Reg. S, FRN 6.25%
Perpetual EUR 100,000 103,060 0.32
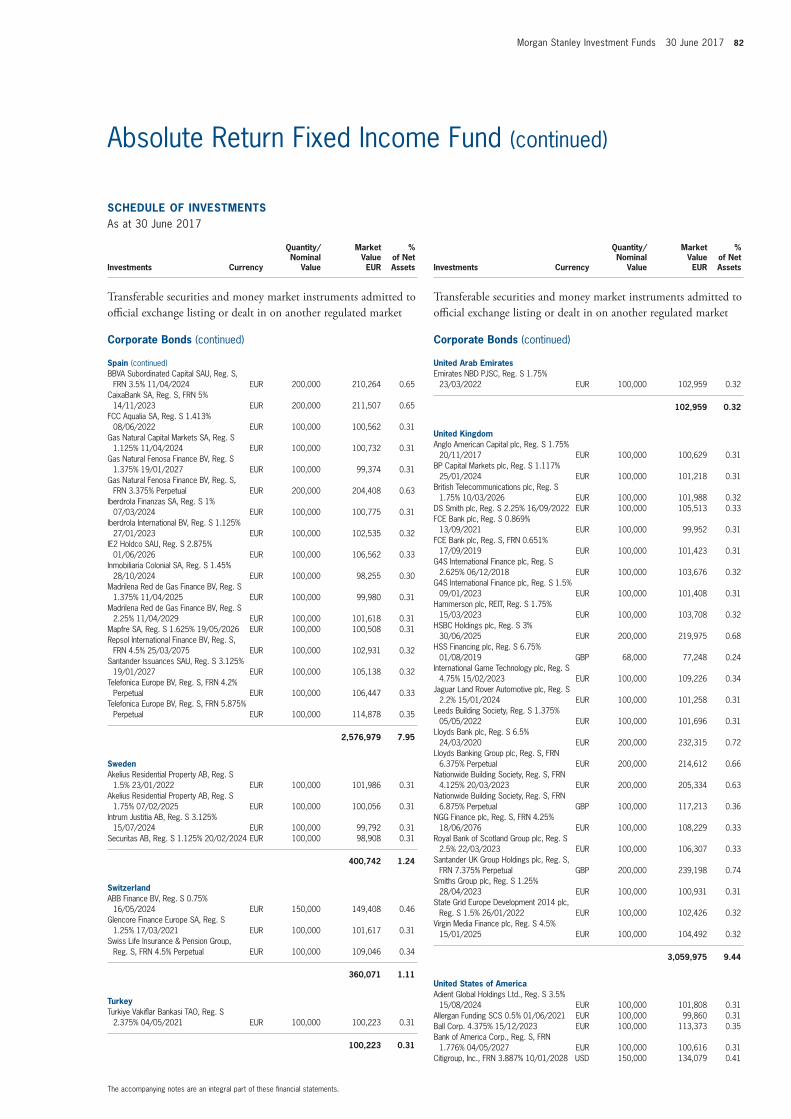
Morgan Stanley Investment Funds 30 June 2017 82
The accompanying notes are an integral part of these fi nancial statements.
Absolute Return Fixed Income Fund (continued)
SCHEDULE OF INVESTMENTSAs at 30 June 2017
Investments Currency
Quantity/Nominal
Value
Market Value EUR
% of Net Assets
Transferable securities and money market instruments admitted to offi cial exchange listing or dealt in on another regulated market
Corporate Bonds (continued)
Spain (continued)BBVA Subordinated Capital SAU, Reg. S,
FRN 3.5% 11/04/2024 EUR 200,000 210,264 0.65 CaixaBank SA, Reg. S, FRN 5%
14/11/2023 EUR 200,000 211,507 0.65 FCC Aqualia SA, Reg. S 1.413%
08/06/2022 EUR 100,000 100,562 0.31 Gas Natural Capital Markets SA, Reg. S
1.125% 11/04/2024 EUR 100,000 100,732 0.31 Gas Natural Fenosa Finance BV, Reg. S
1.375% 19/01/2027 EUR 100,000 99,374 0.31 Gas Natural Fenosa Finance BV, Reg. S,
FRN 3.375% Perpetual EUR 200,000 204,408 0.63 Iberdrola Finanzas SA, Reg. S 1%
07/03/2024 EUR 100,000 100,775 0.31 Iberdrola International BV, Reg. S 1.125%
27/01/2023 EUR 100,000 102,535 0.32 IE2 Holdco SAU, Reg. S 2.875%
01/06/2026 EUR 100,000 106,562 0.33 Inmobiliaria Colonial SA, Reg. S 1.45%
28/10/2024 EUR 100,000 98,255 0.30 Madrilena Red de Gas Finance BV, Reg. S
1.375% 11/04/2025 EUR 100,000 99,980 0.31 Madrilena Red de Gas Finance BV, Reg. S
2.25% 11/04/2029 EUR 100,000 101,618 0.31 Mapfre SA, Reg. S 1.625% 19/05/2026 EUR 100,000 100,508 0.31 Repsol International Finance BV, Reg. S,
FRN 4.5% 25/03/2075 EUR 100,000 102,931 0.32 Santander Issuances SAU, Reg. S 3.125%
19/01/2027 EUR 100,000 105,138 0.32 Telefonica Europe BV, Reg. S, FRN 4.2%
Perpetual EUR 100,000 106,447 0.33 Telefonica Europe BV, Reg. S, FRN 5.875%
Perpetual EUR 100,000 114,878 0.35
2,576,979 7.95
SwedenAkelius Residential Property AB, Reg. S
1.5% 23/01/2022 EUR 100,000 101,986 0.31 Akelius Residential Property AB, Reg. S
1.75% 07/02/2025 EUR 100,000 100,056 0.31 Intrum Justitia AB, Reg. S 3.125%
15/07/2024 EUR 100,000 99,792 0.31 Securitas AB, Reg. S 1.125% 20/02/2024 EUR 100,000 98,908 0.31
400,742 1.24
SwitzerlandABB Finance BV, Reg. S 0.75%
16/05/2024 EUR 150,000 149,408 0.46 Glencore Finance Europe SA, Reg. S
1.25% 17/03/2021 EUR 100,000 101,617 0.31 Swiss Life Insurance & Pension Group,
Reg. S, FRN 4.5% Perpetual EUR 100,000 109,046 0.34
360,071 1.11
TurkeyTurkiye Vakifl ar Bankasi TAO, Reg. S
2.375% 04/05/2021 EUR 100,000 100,223 0.31
100,223 0.31
SCHEDULE OF INVESTMENTSAs at 30 June 2017
Investments Currency
Quantity/Nominal
Value
Market Value EUR
% of Net Assets
Transferable securities and money market instruments admitted to offi cial exchange listing or dealt in on another regulated market
Corporate Bonds (continued)
United Arab EmiratesEmirates NBD PJSC, Reg. S 1.75%
23/03/2022 EUR 100,000 102,959 0.32
102,959 0.32
United KingdomAnglo American Capital plc, Reg. S 1.75%
20/11/2017 EUR 100,000 100,629 0.31 BP Capital Markets plc, Reg. S 1.117%
25/01/2024 EUR 100,000 101,218 0.31 British Telecommunications plc, Reg. S
1.75% 10/03/2026 EUR 100,000 101,988 0.32 DS Smith plc, Reg. S 2.25% 16/09/2022 EUR 100,000 105,513 0.33 FCE Bank plc, Reg. S 0.869%
13/09/2021 EUR 100,000 99,952 0.31 FCE Bank plc, Reg. S, FRN 0.651%
17/09/2019 EUR 100,000 101,423 0.31 G4S International Finance plc, Reg. S
2.625% 06/12/2018 EUR 100,000 103,676 0.32 G4S International Finance plc, Reg. S 1.5%
09/01/2023 EUR 100,000 101,408 0.31 Hammerson plc, REIT, Reg. S 1.75%
15/03/2023 EUR 100,000 103,708 0.32 HSBC Holdings plc, Reg. S 3%
30/06/2025 EUR 200,000 219,975 0.68 HSS Financing plc, Reg. S 6.75%
01/08/2019 GBP 68,000 77,248 0.24 International Game Technology plc, Reg. S
4.75% 15/02/2023 EUR 100,000 109,226 0.34 Jaguar Land Rover Automotive plc, Reg. S
2.2% 15/01/2024 EUR 100,000 101,258 0.31 Leeds Building Society, Reg. S 1.375%
05/05/2022 EUR 100,000 101,696 0.31 Lloyds Bank plc, Reg. S 6.5%
24/03/2020 EUR 200,000 232,315 0.72 Lloyds Banking Group plc, Reg. S, FRN
6.375% Perpetual EUR 200,000 214,612 0.66 Nationwide Building Society, Reg. S, FRN
4.125% 20/03/2023 EUR 200,000 205,334 0.63 Nationwide Building Society, Reg. S, FRN
6.875% Perpetual GBP 100,000 117,213 0.36 NGG Finance plc, Reg. S, FRN 4.25%
18/06/2076 EUR 100,000 108,229 0.33 Royal Bank of Scotland Group plc, Reg. S
2.5% 22/03/2023 EUR 100,000 106,307 0.33 Santander UK Group Holdings plc, Reg. S,
FRN 7.375% Perpetual GBP 200,000 239,198 0.74 Smiths Group plc, Reg. S 1.25%
28/04/2023 EUR 100,000 100,931 0.31 State Grid Europe Development 2014 plc,
Reg. S 1.5% 26/01/2022 EUR 100,000 102,426 0.32 Virgin Media Finance plc, Reg. S 4.5%
15/01/2025 EUR 100,000 104,492 0.32
3,059,975 9.44
United States of AmericaAdient Global Holdings Ltd., Reg. S 3.5%
15/08/2024 EUR 100,000 101,808 0.31 Allergan Funding SCS 0.5% 01/06/2021 EUR 100,000 99,860 0.31 Ball Corp. 4.375% 15/12/2023 EUR 100,000 113,373 0.35 Bank of America Corp., Reg. S, FRN
1.776% 04/05/2027 EUR 100,000 100,616 0.31 Citigroup, Inc., FRN 3.887% 10/01/2028 USD 150,000 134,079 0.41
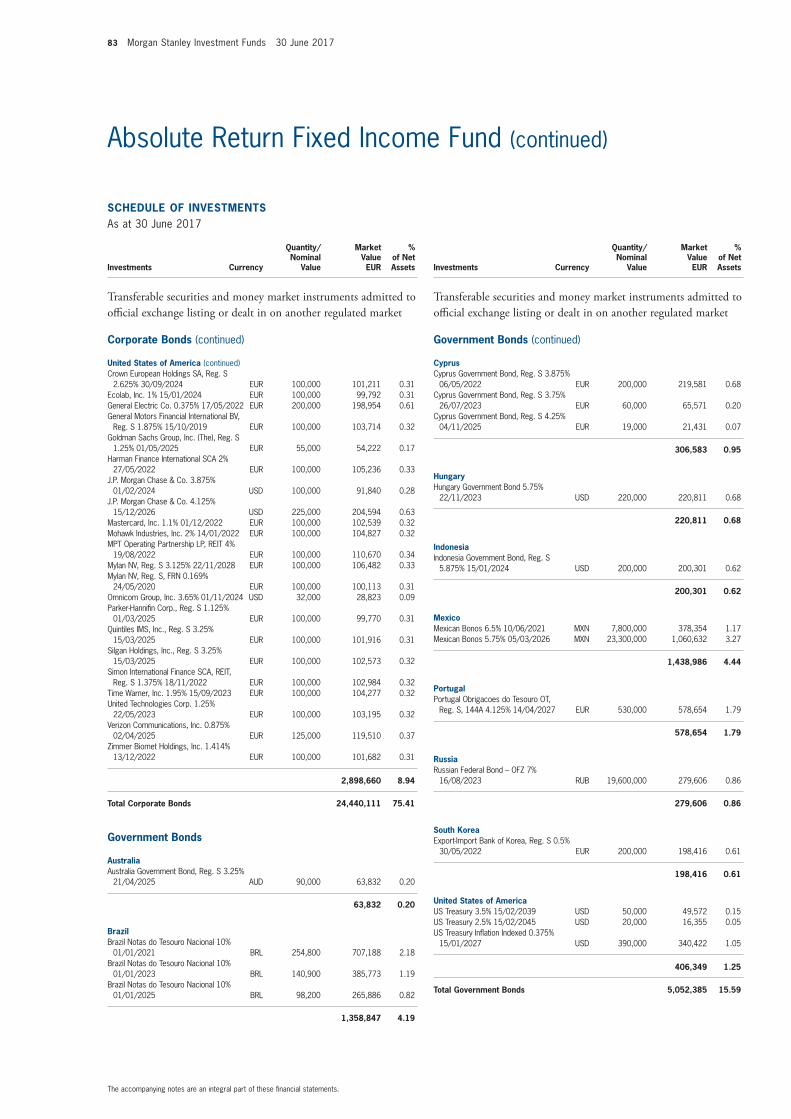
83 Morgan Stanley Investment Funds 30 June 2017
The accompanying notes are an integral part of these fi nancial statements.
Absolute Return Fixed Income Fund (continued)
SCHEDULE OF INVESTMENTSAs at 30 June 2017
Investments Currency
Quantity/Nominal
Value
Market Value EUR
% of Net Assets
Transferable securities and money market instruments admitted to offi cial exchange listing or dealt in on another regulated market
Corporate Bonds (continued)
United States of America (continued)Crown European Holdings SA, Reg. S
2.625% 30/09/2024 EUR 100,000 101,211 0.31 Ecolab, Inc. 1% 15/01/2024 EUR 100,000 99,792 0.31 General Electric Co. 0.375% 17/05/2022 EUR 200,000 198,954 0.61 General Motors Financial International BV,
Reg. S 1.875% 15/10/2019 EUR 100,000 103,714 0.32 Goldman Sachs Group, Inc. (The), Reg. S
1.25% 01/05/2025 EUR 55,000 54,222 0.17 Harman Finance International SCA 2%
27/05/2022 EUR 100,000 105,236 0.33 J.P. Morgan Chase & Co. 3.875%
01/02/2024 USD 100,000 91,840 0.28 J.P. Morgan Chase & Co. 4.125%
15/12/2026 USD 225,000 204,594 0.63 Mastercard, Inc. 1.1% 01/12/2022 EUR 100,000 102,539 0.32 Mohawk Industries, Inc. 2% 14/01/2022 EUR 100,000 104,827 0.32 MPT Operating Partnership LP, REIT 4%
19/08/2022 EUR 100,000 110,670 0.34 Mylan NV, Reg. S 3.125% 22/11/2028 EUR 100,000 106,482 0.33 Mylan NV, Reg. S, FRN 0.169%
24/05/2020 EUR 100,000 100,113 0.31 Omnicom Group, Inc. 3.65% 01/11/2024 USD 32,000 28,823 0.09 Parker-Hannifi n Corp., Reg. S 1.125%
01/03/2025 EUR 100,000 99,770 0.31 Quintiles IMS, Inc., Reg. S 3.25%
15/03/2025 EUR 100,000 101,916 0.31 Silgan Holdings, Inc., Reg. S 3.25%
15/03/2025 EUR 100,000 102,573 0.32 Simon International Finance SCA, REIT,
Reg. S 1.375% 18/11/2022 EUR 100,000 102,984 0.32 Time Warner, Inc. 1.95% 15/09/2023 EUR 100,000 104,277 0.32 United Technologies Corp. 1.25%
22/05/2023 EUR 100,000 103,195 0.32 Verizon Communications, Inc. 0.875%
02/04/2025 EUR 125,000 119,510 0.37 Zimmer Biomet Holdings, Inc. 1.414%
13/12/2022 EUR 100,000 101,682 0.31
2,898,660 8.94
Total Corporate Bonds 24,440,111 75.41
Government Bonds
AustraliaAustralia Government Bond, Reg. S 3.25%
21/04/2025 AUD 90,000 63,832 0.20
63,832 0.20
BrazilBrazil Notas do Tesouro Nacional 10%
01/01/2021 BRL 254,800 707,188 2.18 Brazil Notas do Tesouro Nacional 10%
01/01/2023 BRL 140,900 385,773 1.19 Brazil Notas do Tesouro Nacional 10%
01/01/2025 BRL 98,200 265,886 0.82
1,358,847 4.19
SCHEDULE OF INVESTMENTSAs at 30 June 2017
Investments Currency
Quantity/Nominal
Value
Market Value EUR
% of Net Assets
Transferable securities and money market instruments admitted to offi cial exchange listing or dealt in on another regulated market
Government Bonds (continued)
CyprusCyprus Government Bond, Reg. S 3.875%
06/05/2022 EUR 200,000 219,581 0.68 Cyprus Government Bond, Reg. S 3.75%
26/07/2023 EUR 60,000 65,571 0.20 Cyprus Government Bond, Reg. S 4.25%
04/11/2025 EUR 19,000 21,431 0.07
306,583 0.95
HungaryHungary Government Bond 5.75%
22/11/2023 USD 220,000 220,811 0.68
220,811 0.68
IndonesiaIndonesia Government Bond, Reg. S
5.875% 15/01/2024 USD 200,000 200,301 0.62
200,301 0.62
MexicoMexican Bonos 6.5% 10/06/2021 MXN 7,800,000 378,354 1.17 Mexican Bonos 5.75% 05/03/2026 MXN 23,300,000 1,060,632 3.27
1,438,986 4.44
PortugalPortugal Obrigacoes do Tesouro OT,
Reg. S, 144A 4.125% 14/04/2027 EUR 530,000 578,654 1.79
578,654 1.79
RussiaRussian Federal Bond – OFZ 7%
16/08/2023 RUB 19,600,000 279,606 0.86
279,606 0.86
South KoreaExport-Import Bank of Korea, Reg. S 0.5%
30/05/2022 EUR 200,000 198,416 0.61
198,416 0.61
United States of AmericaUS Treasury 3.5% 15/02/2039 USD 50,000 49,572 0.15 US Treasury 2.5% 15/02/2045 USD 20,000 16,355 0.05 US Treasury Infl ation Indexed 0.375%
15/01/2027 USD 390,000 340,422 1.05
406,349 1.25
Total Government Bonds 5,052,385 15.59
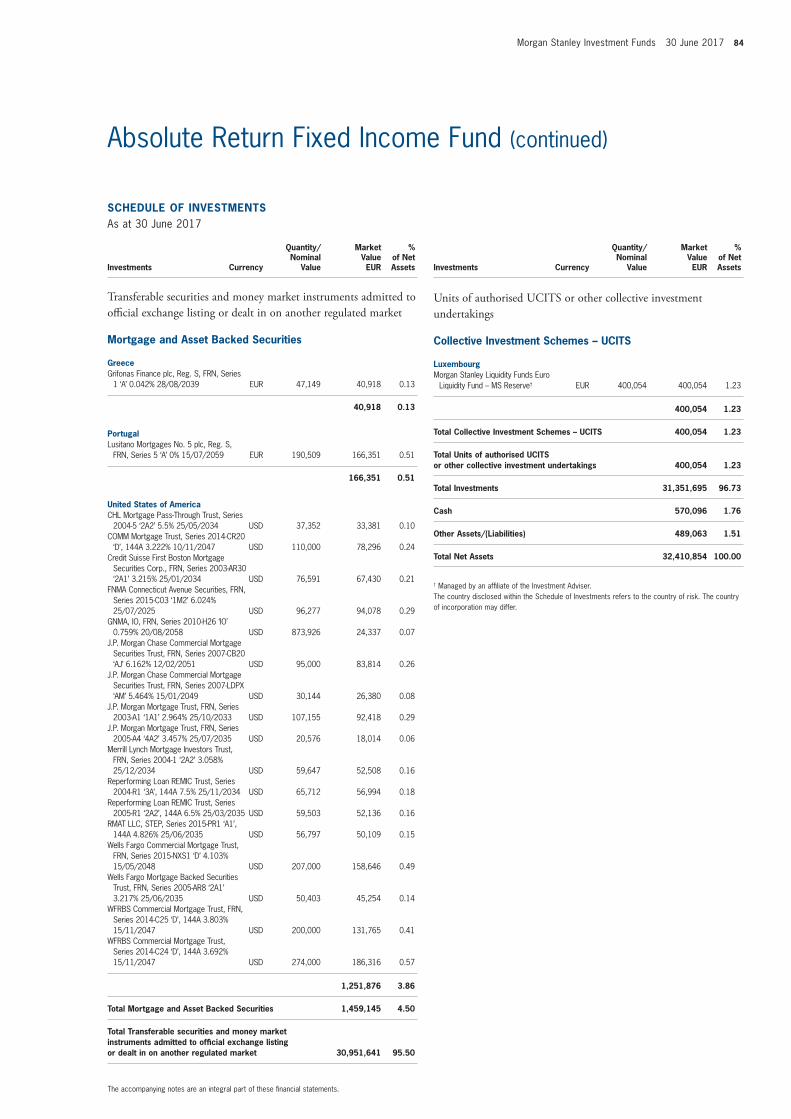
Morgan Stanley Investment Funds 30 June 2017 84
The accompanying notes are an integral part of these fi nancial statements.
Absolute Return Fixed Income Fund (continued)
SCHEDULE OF INVESTMENTSAs at 30 June 2017
Investments Currency
Quantity/Nominal
Value
Market Value EUR
% of Net Assets
Transferable securities and money market instruments admitted to offi cial exchange listing or dealt in on another regulated market
Mortgage and Asset Backed Securities
GreeceGrifonas Finance plc, Reg. S, FRN, Series
1 ‘A’ 0.042% 28/08/2039 EUR 47,149 40,918 0.13
40,918 0.13
PortugalLusitano Mortgages No. 5 plc, Reg. S,
FRN, Series 5 ‘A’ 0% 15/07/2059 EUR 190,509 166,351 0.51
166,351 0.51
United States of AmericaCHL Mortgage Pass-Through Trust, Series
2004-5 ‘2A2’ 5.5% 25/05/2034 USD 37,352 33,381 0.10 COMM Mortgage Trust, Series 2014-CR20
‘D’, 144A 3.222% 10/11/2047 USD 110,000 78,296 0.24 Credit Suisse First Boston Mortgage
Securities Corp., FRN, Series 2003-AR30 ‘2A1’ 3.215% 25/01/2034 USD 76,591 67,430 0.21
FNMA Connecticut Avenue Securities, FRN, Series 2015-C03 ‘1M2’ 6.024% 25/07/2025 USD 96,277 94,078 0.29
GNMA, IO, FRN, Series 2010-H26 ‘IO’ 0.759% 20/08/2058 USD 873,926 24,337 0.07
J.P. Morgan Chase Commercial Mortgage Securities Trust, FRN, Series 2007-CB20 ‘AJ’ 6.162% 12/02/2051 USD 95,000 83,814 0.26
J.P. Morgan Chase Commercial Mortgage Securities Trust, FRN, Series 2007-LDPX ‘AM’ 5.464% 15/01/2049 USD 30,144 26,380 0.08
J.P. Morgan Mortgage Trust, FRN, Series 2003-A1 ‘1A1’ 2.964% 25/10/2033 USD 107,155 92,418 0.29
J.P. Morgan Mortgage Trust, FRN, Series 2005-A4 ‘4A2’ 3.457% 25/07/2035 USD 20,576 18,014 0.06
Merrill Lynch Mortgage Investors Trust, FRN, Series 2004-1 ‘2A2’ 3.058% 25/12/2034 USD 59,647 52,508 0.16
Reperforming Loan REMIC Trust, Series 2004-R1 ‘3A’, 144A 7.5% 25/11/2034 USD 65,712 56,994 0.18
Reperforming Loan REMIC Trust, Series 2005-R1 ‘2A2’, 144A 6.5% 25/03/2035 USD 59,503 52,136 0.16
RMAT LLC, STEP, Series 2015-PR1 ‘A1’, 144A 4.826% 25/06/2035 USD 56,797 50,109 0.15
Wells Fargo Commercial Mortgage Trust, FRN, Series 2015-NXS1 ‘D’ 4.103% 15/05/2048 USD 207,000 158,646 0.49
Wells Fargo Mortgage Backed Securities Trust, FRN, Series 2005-AR8 ‘2A1’ 3.217% 25/06/2035 USD 50,403 45,254 0.14
WFRBS Commercial Mortgage Trust, FRN, Series 2014-C25 ‘D’, 144A 3.803% 15/11/2047 USD 200,000 131,765 0.41
WFRBS Commercial Mortgage Trust, Series 2014-C24 ‘D’, 144A 3.692% 15/11/2047 USD 274,000 186,316 0.57
1,251,876 3.86
Total Mortgage and Asset Backed Securities 1,459,145 4.50
Total Transferable securities and money market instruments admitted to offi cial exchange listing or dealt in on another regulated market 30,951,641 95.50
SCHEDULE OF INVESTMENTSAs at 30 June 2017
Investments Currency
Quantity/Nominal
Value
Market Value EUR
% of Net Assets
Units of authorised UCITS or other collective investment undertakings
Collective Investment Schemes – UCITS
LuxembourgMorgan Stanley Liquidity Funds Euro
Liquidity Fund – MS Reserve† EUR 400,054 400,054 1.23
400,054 1.23
Total Collective Investment Schemes – UCITS 400,054 1.23
Total Units of authorised UCITS or other collective investment undertakings 400,054 1.23
Total Investments 31,351,695 96.73
Cash 570,096 1.76
Other Assets/(Liabilities) 489,063 1.51
Total Net Assets 32,410,854 100.00
† Managed by an affi liate of the Investment Adviser.The country disclosed within the Schedule of Investments refers to the country of risk. The country of incorporation may differ.
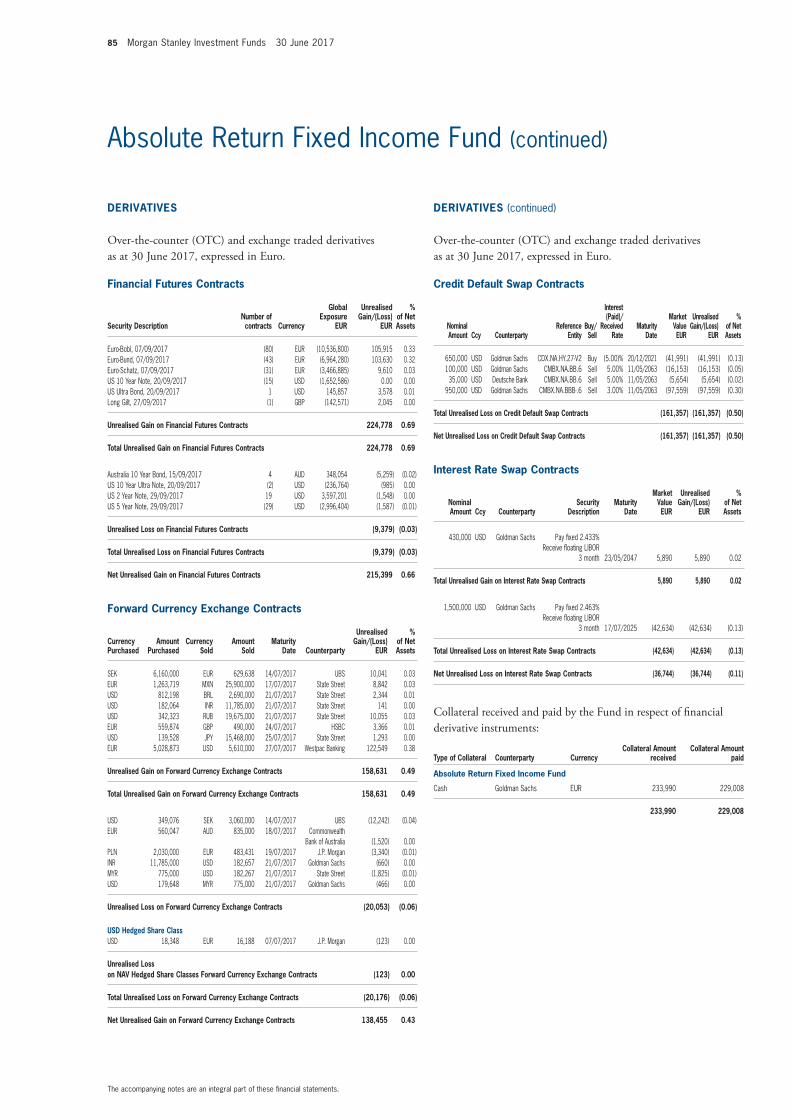
85 Morgan Stanley Investment Funds 30 June 2017
The accompanying notes are an integral part of these fi nancial statements.
Absolute Return Fixed Income Fund (continued)
Financial Futures Contracts
Security DescriptionNumber of contracts Currency
Global Exposure
EUR
Unrealised Gain/(Loss)
EUR
% of Net Assets
Euro-Bobl, 07/09/2017 (80) EUR (10,536,800) 105,915 0.33 Euro-Bund, 07/09/2017 (43) EUR (6,964,280) 103,630 0.32 Euro-Schatz, 07/09/2017 (31) EUR (3,466,885) 9,610 0.03 US 10 Year Note, 20/09/2017 (15) USD (1,652,586) 0.00 0.00 US Ultra Bond, 20/09/2017 1 USD 145,857 3,578 0.01 Long Gilt, 27/09/2017 (1) GBP (142,571) 2,045 0.00
Unrealised Gain on Financial Futures Contracts 224,778 0.69
Total Unrealised Gain on Financial Futures Contracts 224,778 0.69
Australia 10 Year Bond, 15/09/2017 4 AUD 348,054 (5,259) (0.02) US 10 Year Ultra Note, 20/09/2017 (2) USD (236,764) (985) 0.00 US 2 Year Note, 29/09/2017 19 USD 3,597,201 (1,548) 0.00 US 5 Year Note, 29/09/2017 (29) USD (2,996,404) (1,587) (0.01)
Unrealised Loss on Financial Futures Contracts (9,379) (0.03)
Total Unrealised Loss on Financial Futures Contracts (9,379) (0.03)
Net Unrealised Gain on Financial Futures Contracts 215,399 0.66
Forward Currency Exchange Contracts
Currency Purchased
Amount Purchased
Currency Sold
Amount Sold
Maturity Date Counterparty
Unrealised Gain/(Loss)
EUR
% of Net Assets
SEK 6,160,000 EUR 629,638 14/07/2017 UBS 10,041 0.03 EUR 1,263,719 MXN 25,900,000 17/07/2017 State Street 8,842 0.03 USD 812,198 BRL 2,690,000 21/07/2017 State Street 2,344 0.01 USD 182,064 INR 11,785,000 21/07/2017 State Street 141 0.00 USD 342,323 RUB 19,675,000 21/07/2017 State Street 10,055 0.03 EUR 559,874 GBP 490,000 24/07/2017 HSBC 3,366 0.01 USD 139,528 JPY 15,468,000 25/07/2017 State Street 1,293 0.00 EUR 5,028,873 USD 5,610,000 27/07/2017 Westpac Banking 122,549 0.38
Unrealised Gain on Forward Currency Exchange Contracts 158,631 0.49
Total Unrealised Gain on Forward Currency Exchange Contracts 158,631 0.49
USD 349,076 SEK 3,060,000 14/07/2017 UBS (12,242) (0.04) EUR 560,047 AUD 835,000 18/07/2017 Commonwealth
Bank of Australia (1,520) 0.00 PLN 2,030,000 EUR 483,431 19/07/2017 J.P. Morgan (3,340) (0.01) INR 11,785,000 USD 182,657 21/07/2017 Goldman Sachs (660) 0.00 MYR 775,000 USD 182,267 21/07/2017 State Street (1,825) (0.01) USD 179,648 MYR 775,000 21/07/2017 Goldman Sachs (466) 0.00
Unrealised Loss on Forward Currency Exchange Contracts (20,053) (0.06)
USD Hedged Share ClassUSD 18,348 EUR 16,188 07/07/2017 J.P. Morgan (123) 0.00
Unrealised Loss on NAV Hedged Share Classes Forward Currency Exchange Contracts (123) 0.00
Total Unrealised Loss on Forward Currency Exchange Contracts (20,176) (0.06)
Net Unrealised Gain on Forward Currency Exchange Contracts 138,455 0.43
Credit Default Swap Contracts
Nominal Amount Ccy Counterparty
Reference Entity
Buy/Sell
Interest (Paid)/
Received Rate
Maturity Date
Market Value EUR
Unrealised Gain/(Loss)
EUR
% of Net Assets
650,000 USD Goldman Sachs CDX.NA.HY.27-V2 Buy (5.00)% 20/12/2021 (41,991) (41,991) (0.13) 100,000 USD Goldman Sachs CMBX.NA.BB.6 Sell 5.00% 11/05/2063 (16,153) (16,153) (0.05) 35,000 USD Deutsche Bank CMBX.NA.BB.6 Sell 5.00% 11/05/2063 (5,654) (5,654) (0.02)
950,000 USD Goldman Sachs CMBX.NA.BBB-.6 Sell 3.00% 11/05/2063 (97,559) (97,559) (0.30)
Total Unrealised Loss on Credit Default Swap Contracts (161,357) (161,357) (0.50)
Net Unrealised Loss on Credit Default Swap Contracts (161,357) (161,357) (0.50)
Interest Rate Swap Contracts
Nominal Amount Ccy Counterparty
Security Description
Maturity Date
Market Value EUR
Unrealised Gain/(Loss)
EUR
% of Net Assets
430,000 USD Goldman Sachs Pay fi xed 2.433% Receive fl oating LIBOR
3 month 23/05/2047 5,890 5,890 0.02
Total Unrealised Gain on Interest Rate Swap Contracts 5,890 5,890 0.02
1,500,000 USD Goldman Sachs Pay fi xed 2.463% Receive fl oating LIBOR
3 month 17/07/2025 (42,634) (42,634) (0.13)
Total Unrealised Loss on Interest Rate Swap Contracts (42,634) (42,634) (0.13)
Net Unrealised Loss on Interest Rate Swap Contracts (36,744) (36,744) (0.11)
Collateral received and paid by the Fund in respect of fi nancial derivative instruments:
Type of Collateral Counterparty CurrencyCollateral Amount
receivedCollateral Amount
paid
Absolute Return Fixed Income Fund
Cash Goldman Sachs EUR 233,990 229,008
233,990 229,008
DERIVATIVES
Over-the-counter (OTC) and exchange traded derivatives as at 30 June 2017, expressed in Euro.
DERIVATIVES (continued)
Over-the-counter (OTC) and exchange traded derivatives as at 30 June 2017, expressed in Euro.
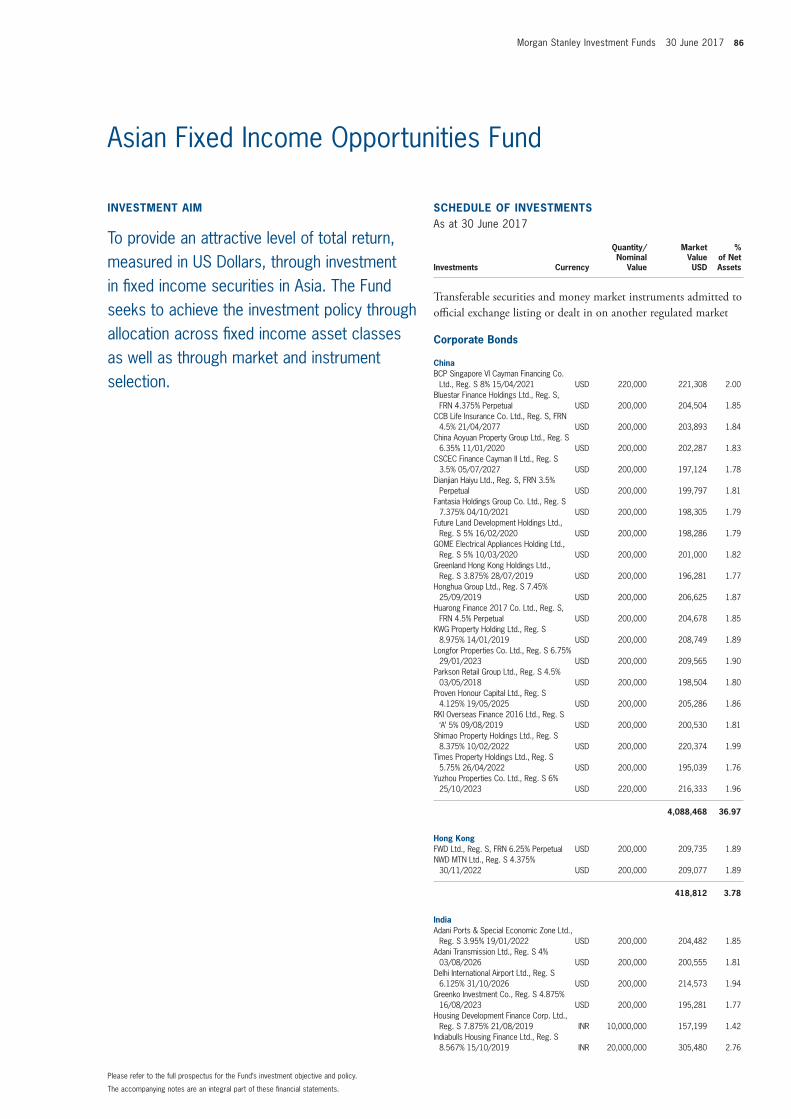
Morgan Stanley Investment Funds 30 June 2017 86
The accompanying notes are an integral part of these fi nancial statements.
Please refer to the full prospectus for the Fund’s investment objective and policy.
INVESTMENT AIM
To provide an attractive level of total return, measured in US Dollars, through investment in fi xed income securities in Asia. The Fund seeks to achieve the investment policy through allocation across fi xed income asset classes as well as through market and instrument selection.
SCHEDULE OF INVESTMENTSAs at 30 June 2017
Investments Currency
Quantity/Nominal
Value
Market Value USD
% of Net Assets
Transferable securities and money market instruments admitted to offi cial exchange listing or dealt in on another regulated market
Corporate Bonds
ChinaBCP Singapore VI Cayman Financing Co.
Ltd., Reg. S 8% 15/04/2021 USD 220,000 221,308 2.00 Bluestar Finance Holdings Ltd., Reg. S,
FRN 4.375% Perpetual USD 200,000 204,504 1.85 CCB Life Insurance Co. Ltd., Reg. S, FRN
4.5% 21/04/2077 USD 200,000 203,893 1.84 China Aoyuan Property Group Ltd., Reg. S
6.35% 11/01/2020 USD 200,000 202,287 1.83 CSCEC Finance Cayman II Ltd., Reg. S
3.5% 05/07/2027 USD 200,000 197,124 1.78 Dianjian Haiyu Ltd., Reg. S, FRN 3.5%
Perpetual USD 200,000 199,797 1.81 Fantasia Holdings Group Co. Ltd., Reg. S
7.375% 04/10/2021 USD 200,000 198,305 1.79 Future Land Development Holdings Ltd.,
Reg. S 5% 16/02/2020 USD 200,000 198,286 1.79 GOME Electrical Appliances Holding Ltd.,
Reg. S 5% 10/03/2020 USD 200,000 201,000 1.82 Greenland Hong Kong Holdings Ltd.,
Reg. S 3.875% 28/07/2019 USD 200,000 196,281 1.77 Honghua Group Ltd., Reg. S 7.45%
25/09/2019 USD 200,000 206,625 1.87 Huarong Finance 2017 Co. Ltd., Reg. S,
FRN 4.5% Perpetual USD 200,000 204,678 1.85 KWG Property Holding Ltd., Reg. S
8.975% 14/01/2019 USD 200,000 208,749 1.89 Longfor Properties Co. Ltd., Reg. S 6.75%
29/01/2023 USD 200,000 209,565 1.90 Parkson Retail Group Ltd., Reg. S 4.5%
03/05/2018 USD 200,000 198,504 1.80 Proven Honour Capital Ltd., Reg. S
4.125% 19/05/2025 USD 200,000 205,286 1.86 RKI Overseas Finance 2016 Ltd., Reg. S
‘A’ 5% 09/08/2019 USD 200,000 200,530 1.81 Shimao Property Holdings Ltd., Reg. S
8.375% 10/02/2022 USD 200,000 220,374 1.99 Times Property Holdings Ltd., Reg. S
5.75% 26/04/2022 USD 200,000 195,039 1.76 Yuzhou Properties Co. Ltd., Reg. S 6%
25/10/2023 USD 220,000 216,333 1.96
4,088,468 36.97
Hong KongFWD Ltd., Reg. S, FRN 6.25% Perpetual USD 200,000 209,735 1.89 NWD MTN Ltd., Reg. S 4.375%
30/11/2022 USD 200,000 209,077 1.89
418,812 3.78
IndiaAdani Ports & Special Economic Zone Ltd.,
Reg. S 3.95% 19/01/2022 USD 200,000 204,482 1.85 Adani Transmission Ltd., Reg. S 4%
03/08/2026 USD 200,000 200,555 1.81 Delhi International Airport Ltd., Reg. S
6.125% 31/10/2026 USD 200,000 214,573 1.94 Greenko Investment Co., Reg. S 4.875%
16/08/2023 USD 200,000 195,281 1.77 Housing Development Finance Corp. Ltd.,
Reg. S 7.875% 21/08/2019 INR 10,000,000 157,199 1.42 Indiabulls Housing Finance Ltd., Reg. S
8.567% 15/10/2019 INR 20,000,000 305,480 2.76
Asian Fixed Income Opportunities Fund
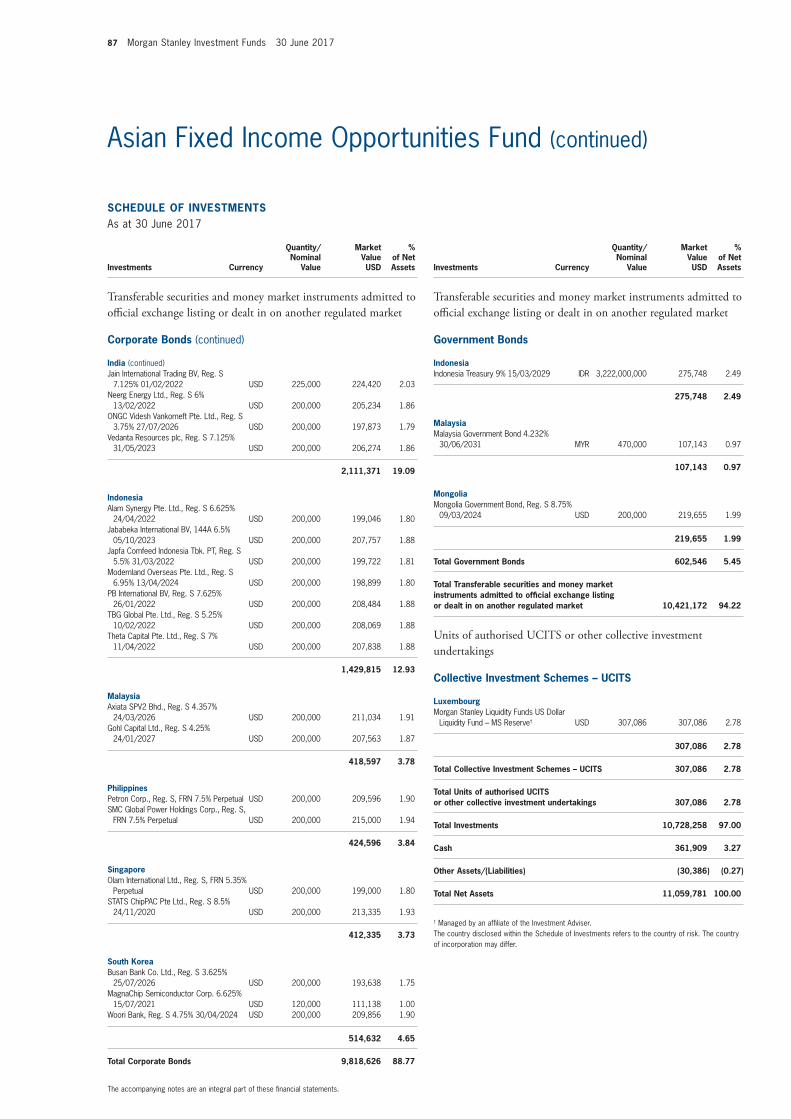
87 Morgan Stanley Investment Funds 30 June 2017
The accompanying notes are an integral part of these fi nancial statements.
Asian Fixed Income Opportunities Fund (continued)
SCHEDULE OF INVESTMENTSAs at 30 June 2017
Investments Currency
Quantity/Nominal
Value
Market Value USD
% of Net Assets
Transferable securities and money market instruments admitted to offi cial exchange listing or dealt in on another regulated market
Corporate Bonds (continued)
India (continued)Jain International Trading BV, Reg. S
7.125% 01/02/2022 USD 225,000 224,420 2.03 Neerg Energy Ltd., Reg. S 6%
13/02/2022 USD 200,000 205,234 1.86 ONGC Videsh Vankorneft Pte. Ltd., Reg. S
3.75% 27/07/2026 USD 200,000 197,873 1.79 Vedanta Resources plc, Reg. S 7.125%
31/05/2023 USD 200,000 206,274 1.86
2,111,371 19.09
IndonesiaAlam Synergy Pte. Ltd., Reg. S 6.625%
24/04/2022 USD 200,000 199,046 1.80 Jababeka International BV, 144A 6.5%
05/10/2023 USD 200,000 207,757 1.88 Japfa Comfeed Indonesia Tbk. PT, Reg. S
5.5% 31/03/2022 USD 200,000 199,722 1.81 Modernland Overseas Pte. Ltd., Reg. S
6.95% 13/04/2024 USD 200,000 198,899 1.80 PB International BV, Reg. S 7.625%
26/01/2022 USD 200,000 208,484 1.88 TBG Global Pte. Ltd., Reg. S 5.25%
10/02/2022 USD 200,000 208,069 1.88 Theta Capital Pte. Ltd., Reg. S 7%
11/04/2022 USD 200,000 207,838 1.88
1,429,815 12.93
MalaysiaAxiata SPV2 Bhd., Reg. S 4.357%
24/03/2026 USD 200,000 211,034 1.91 Gohl Capital Ltd., Reg. S 4.25%
24/01/2027 USD 200,000 207,563 1.87
418,597 3.78
PhilippinesPetron Corp., Reg. S, FRN 7.5% Perpetual USD 200,000 209,596 1.90 SMC Global Power Holdings Corp., Reg. S,
FRN 7.5% Perpetual USD 200,000 215,000 1.94
424,596 3.84
SingaporeOlam International Ltd., Reg. S, FRN 5.35%
Perpetual USD 200,000 199,000 1.80 STATS ChipPAC Pte Ltd., Reg. S 8.5%
24/11/2020 USD 200,000 213,335 1.93
412,335 3.73
South KoreaBusan Bank Co. Ltd., Reg. S 3.625%
25/07/2026 USD 200,000 193,638 1.75 MagnaChip Semiconductor Corp. 6.625%
15/07/2021 USD 120,000 111,138 1.00 Woori Bank, Reg. S 4.75% 30/04/2024 USD 200,000 209,856 1.90
514,632 4.65
Total Corporate Bonds 9,818,626 88.77
SCHEDULE OF INVESTMENTSAs at 30 June 2017
Investments Currency
Quantity/Nominal
Value
Market Value USD
% of Net Assets
Transferable securities and money market instruments admitted to offi cial exchange listing or dealt in on another regulated market
Government Bonds
IndonesiaIndonesia Treasury 9% 15/03/2029 IDR 3,222,000,000 275,748 2.49
275,748 2.49
MalaysiaMalaysia Government Bond 4.232%
30/06/2031 MYR 470,000 107,143 0.97
107,143 0.97
MongoliaMongolia Government Bond, Reg. S 8.75%
09/03/2024 USD 200,000 219,655 1.99
219,655 1.99
Total Government Bonds 602,546 5.45
Total Transferable securities and money market instruments admitted to offi cial exchange listing or dealt in on another regulated market 10,421,172 94.22
Units of authorised UCITS or other collective investment undertakings
Collective Investment Schemes – UCITS
LuxembourgMorgan Stanley Liquidity Funds US Dollar
Liquidity Fund – MS Reserve† USD 307,086 307,086 2.78
307,086 2.78
Total Collective Investment Schemes – UCITS 307,086 2.78
Total Units of authorised UCITS or other collective investment undertakings 307,086 2.78
Total Investments 10,728,258 97.00
Cash 361,909 3.27
Other Assets/(Liabilities) (30,386) (0.27)
Total Net Assets 11,059,781 100.00
† Managed by an affi liate of the Investment Adviser.The country disclosed within the Schedule of Investments refers to the country of risk. The country of incorporation may differ.
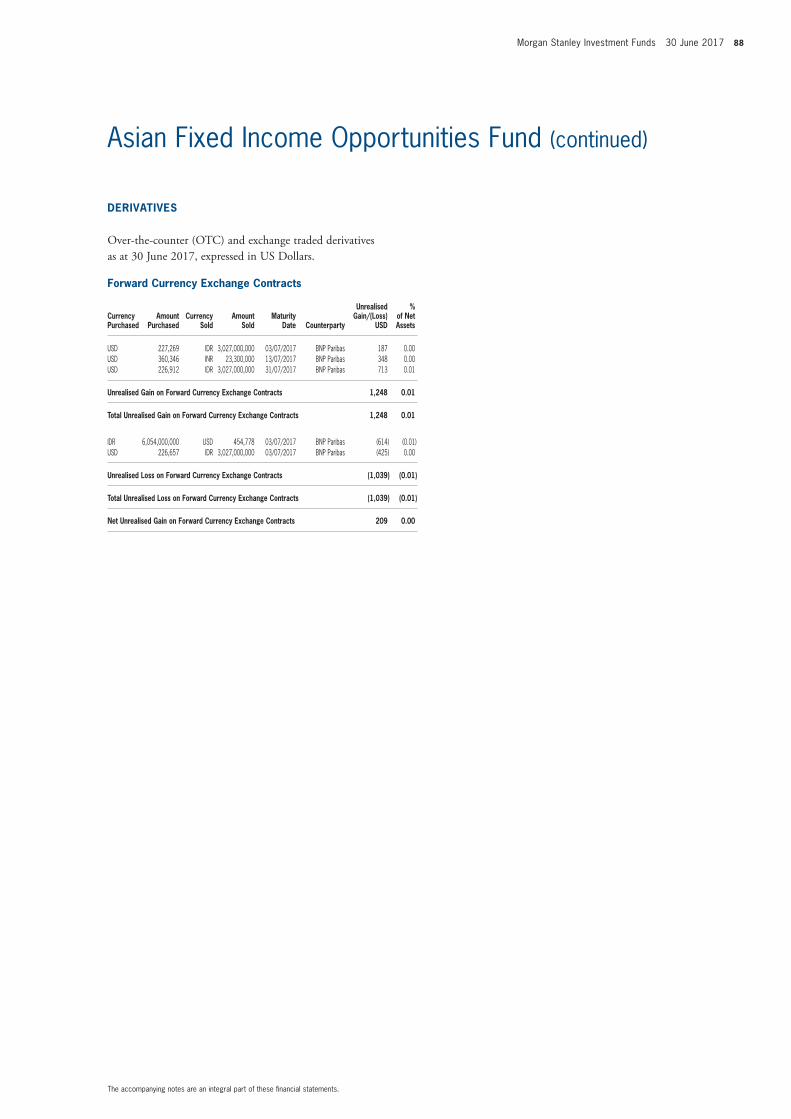
Morgan Stanley Investment Funds 30 June 2017 88
The accompanying notes are an integral part of these fi nancial statements.
Asian Fixed Income Opportunities Fund (continued)
Forward Currency Exchange Contracts
Currency Purchased
Amount Purchased
Currency Sold
Amount Sold
Maturity Date Counterparty
Unrealised Gain/(Loss)
USD
% of Net Assets
USD 227,269 IDR 3,027,000,000 03/07/2017 BNP Paribas 187 0.00 USD 360,346 INR 23,300,000 13/07/2017 BNP Paribas 348 0.00 USD 226,912 IDR 3,027,000,000 31/07/2017 BNP Paribas 713 0.01
Unrealised Gain on Forward Currency Exchange Contracts 1,248 0.01
Total Unrealised Gain on Forward Currency Exchange Contracts 1,248 0.01
IDR 6,054,000,000 USD 454,778 03/07/2017 BNP Paribas (614) (0.01) USD 226,657 IDR 3,027,000,000 03/07/2017 BNP Paribas (425) 0.00
Unrealised Loss on Forward Currency Exchange Contracts (1,039) (0.01)
Total Unrealised Loss on Forward Currency Exchange Contracts (1,039) (0.01)
Net Unrealised Gain on Forward Currency Exchange Contracts 209 0.00
DERIVATIVES
Over-the-counter (OTC) and exchange traded derivatives as at 30 June 2017, expressed in US Dollars.
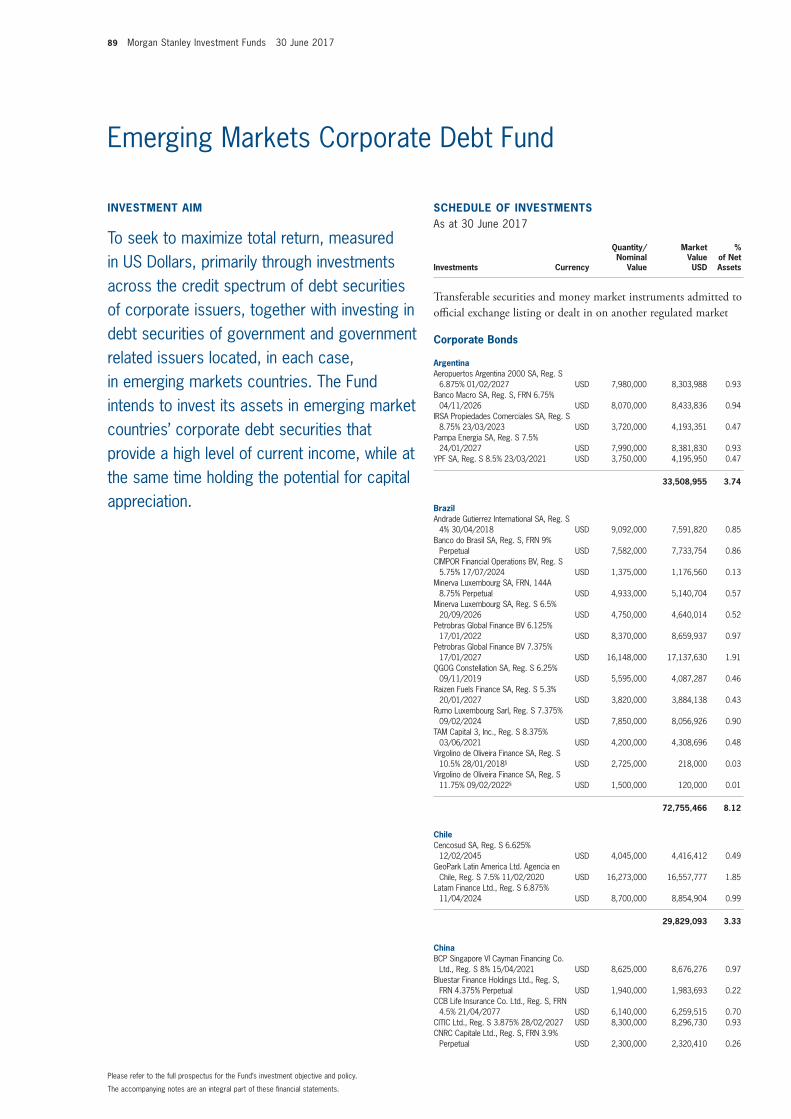
89 Morgan Stanley Investment Funds 30 June 2017
The accompanying notes are an integral part of these fi nancial statements.
Please refer to the full prospectus for the Fund’s investment objective and policy.
INVESTMENT AIM
To seek to maximize total return, measured in US Dollars, primarily through investments across the credit spectrum of debt securities of corporate issuers, together with investing in debt securities of government and government related issuers located, in each case, in emerging markets countries. The Fund intends to invest its assets in emerging market countries’ corporate debt securities that provide a high level of current income, while at the same time holding the potential for capital appreciation.
SCHEDULE OF INVESTMENTSAs at 30 June 2017
Investments Currency
Quantity/Nominal
Value
Market Value USD
% of Net Assets
Transferable securities and money market instruments admitted to offi cial exchange listing or dealt in on another regulated market
Corporate Bonds
ArgentinaAeropuertos Argentina 2000 SA, Reg. S
6.875% 01/02/2027 USD 7,980,000 8,303,988 0.93 Banco Macro SA, Reg. S, FRN 6.75%
04/11/2026 USD 8,070,000 8,433,836 0.94 IRSA Propiedades Comerciales SA, Reg. S
8.75% 23/03/2023 USD 3,720,000 4,193,351 0.47 Pampa Energia SA, Reg. S 7.5%
24/01/2027 USD 7,990,000 8,381,830 0.93 YPF SA, Reg. S 8.5% 23/03/2021 USD 3,750,000 4,195,950 0.47
33,508,955 3.74
BrazilAndrade Gutierrez International SA, Reg. S
4% 30/04/2018 USD 9,092,000 7,591,820 0.85 Banco do Brasil SA, Reg. S, FRN 9%
Perpetual USD 7,582,000 7,733,754 0.86 CIMPOR Financial Operations BV, Reg. S
5.75% 17/07/2024 USD 1,375,000 1,176,560 0.13 Minerva Luxembourg SA, FRN, 144A
8.75% Perpetual USD 4,933,000 5,140,704 0.57 Minerva Luxembourg SA, Reg. S 6.5%
20/09/2026 USD 4,750,000 4,640,014 0.52 Petrobras Global Finance BV 6.125%
17/01/2022 USD 8,370,000 8,659,937 0.97 Petrobras Global Finance BV 7.375%
17/01/2027 USD 16,148,000 17,137,630 1.91 QGOG Constellation SA, Reg. S 6.25%
09/11/2019 USD 5,595,000 4,087,287 0.46 Raizen Fuels Finance SA, Reg. S 5.3%
20/01/2027 USD 3,820,000 3,884,138 0.43 Rumo Luxembourg Sarl, Reg. S 7.375%
09/02/2024 USD 7,850,000 8,056,926 0.90 TAM Capital 3, Inc., Reg. S 8.375%
03/06/2021 USD 4,200,000 4,308,696 0.48 Virgolino de Oliveira Finance SA, Reg. S
10.5% 28/01/2018§ USD 2,725,000 218,000 0.03 Virgolino de Oliveira Finance SA, Reg. S
11.75% 09/02/2022§ USD 1,500,000 120,000 0.01
72,755,466 8.12
ChileCencosud SA, Reg. S 6.625%
12/02/2045 USD 4,045,000 4,416,412 0.49 GeoPark Latin America Ltd. Agencia en
Chile, Reg. S 7.5% 11/02/2020 USD 16,273,000 16,557,777 1.85 Latam Finance Ltd., Reg. S 6.875%
11/04/2024 USD 8,700,000 8,854,904 0.99
29,829,093 3.33
ChinaBCP Singapore VI Cayman Financing Co.
Ltd., Reg. S 8% 15/04/2021 USD 8,625,000 8,676,276 0.97 Bluestar Finance Holdings Ltd., Reg. S,
FRN 4.375% Perpetual USD 1,940,000 1,983,693 0.22 CCB Life Insurance Co. Ltd., Reg. S, FRN
4.5% 21/04/2077 USD 6,140,000 6,259,515 0.70 CITIC Ltd., Reg. S 3.875% 28/02/2027 USD 8,300,000 8,296,730 0.93 CNRC Capitale Ltd., Reg. S, FRN 3.9%
Perpetual USD 2,300,000 2,320,410 0.26
Emerging Markets Corporate Debt Fund
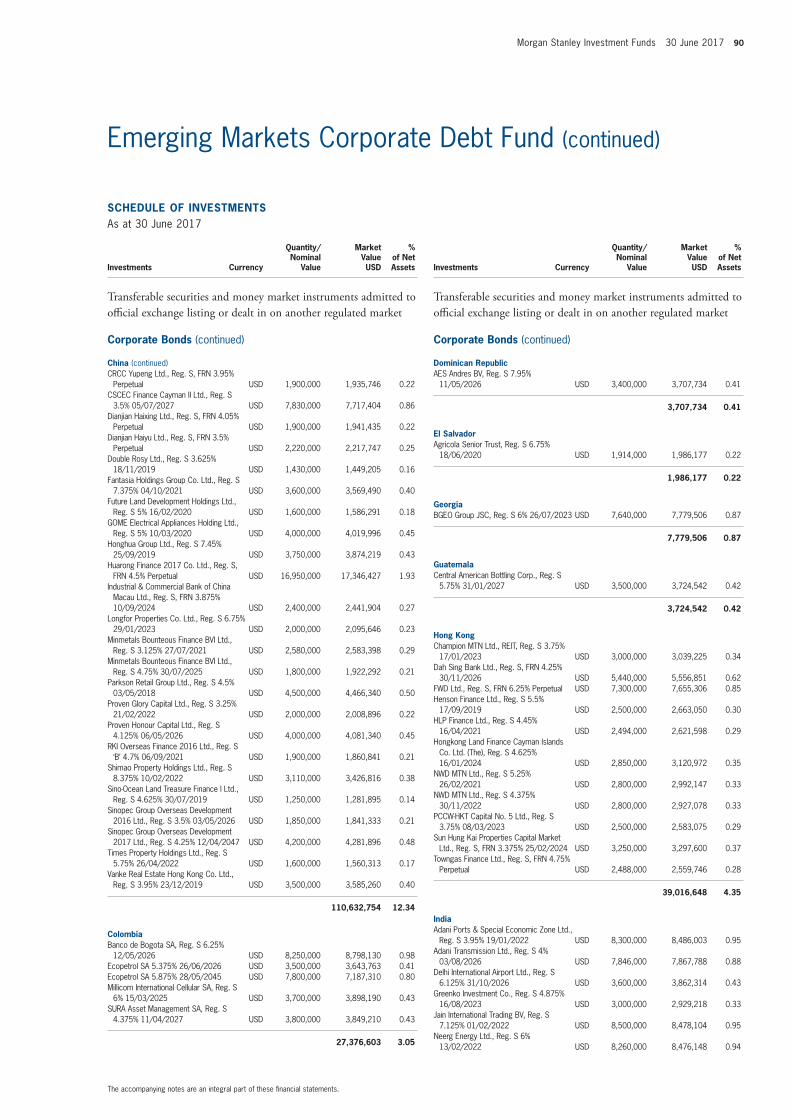
Morgan Stanley Investment Funds 30 June 2017 90
The accompanying notes are an integral part of these fi nancial statements.
Emerging Markets Corporate Debt Fund (continued)
SCHEDULE OF INVESTMENTSAs at 30 June 2017
Investments Currency
Quantity/Nominal
Value
Market Value USD
% of Net Assets
Transferable securities and money market instruments admitted to offi cial exchange listing or dealt in on another regulated market
Corporate Bonds (continued)
China (continued)CRCC Yupeng Ltd., Reg. S, FRN 3.95%
Perpetual USD 1,900,000 1,935,746 0.22 CSCEC Finance Cayman II Ltd., Reg. S
3.5% 05/07/2027 USD 7,830,000 7,717,404 0.86 Dianjian Haixing Ltd., Reg. S, FRN 4.05%
Perpetual USD 1,900,000 1,941,435 0.22 Dianjian Haiyu Ltd., Reg. S, FRN 3.5%
Perpetual USD 2,220,000 2,217,747 0.25 Double Rosy Ltd., Reg. S 3.625%
18/11/2019 USD 1,430,000 1,449,205 0.16 Fantasia Holdings Group Co. Ltd., Reg. S
7.375% 04/10/2021 USD 3,600,000 3,569,490 0.40 Future Land Development Holdings Ltd.,
Reg. S 5% 16/02/2020 USD 1,600,000 1,586,291 0.18 GOME Electrical Appliances Holding Ltd.,
Reg. S 5% 10/03/2020 USD 4,000,000 4,019,996 0.45 Honghua Group Ltd., Reg. S 7.45%
25/09/2019 USD 3,750,000 3,874,219 0.43 Huarong Finance 2017 Co. Ltd., Reg. S,
FRN 4.5% Perpetual USD 16,950,000 17,346,427 1.93 Industrial & Commercial Bank of China
Macau Ltd., Reg. S, FRN 3.875% 10/09/2024 USD 2,400,000 2,441,904 0.27
Longfor Properties Co. Ltd., Reg. S 6.75% 29/01/2023 USD 2,000,000 2,095,646 0.23
Minmetals Bounteous Finance BVI Ltd., Reg. S 3.125% 27/07/2021 USD 2,580,000 2,583,398 0.29
Minmetals Bounteous Finance BVI Ltd., Reg. S 4.75% 30/07/2025 USD 1,800,000 1,922,292 0.21
Parkson Retail Group Ltd., Reg. S 4.5% 03/05/2018 USD 4,500,000 4,466,340 0.50
Proven Glory Capital Ltd., Reg. S 3.25% 21/02/2022 USD 2,000,000 2,008,896 0.22
Proven Honour Capital Ltd., Reg. S 4.125% 06/05/2026 USD 4,000,000 4,081,340 0.45
RKI Overseas Finance 2016 Ltd., Reg. S ‘B’ 4.7% 06/09/2021 USD 1,900,000 1,860,841 0.21
Shimao Property Holdings Ltd., Reg. S 8.375% 10/02/2022 USD 3,110,000 3,426,816 0.38
Sino-Ocean Land Treasure Finance I Ltd., Reg. S 4.625% 30/07/2019 USD 1,250,000 1,281,895 0.14
Sinopec Group Overseas Development 2016 Ltd., Reg. S 3.5% 03/05/2026 USD 1,850,000 1,841,333 0.21
Sinopec Group Overseas Development 2017 Ltd., Reg. S 4.25% 12/04/2047 USD 4,200,000 4,281,896 0.48
Times Property Holdings Ltd., Reg. S 5.75% 26/04/2022 USD 1,600,000 1,560,313 0.17
Vanke Real Estate Hong Kong Co. Ltd., Reg. S 3.95% 23/12/2019 USD 3,500,000 3,585,260 0.40
110,632,754 12.34
ColombiaBanco de Bogota SA, Reg. S 6.25%
12/05/2026 USD 8,250,000 8,798,130 0.98 Ecopetrol SA 5.375% 26/06/2026 USD 3,500,000 3,643,763 0.41 Ecopetrol SA 5.875% 28/05/2045 USD 7,800,000 7,187,310 0.80 Millicom International Cellular SA, Reg. S
6% 15/03/2025 USD 3,700,000 3,898,190 0.43 SURA Asset Management SA, Reg. S
4.375% 11/04/2027 USD 3,800,000 3,849,210 0.43
27,376,603 3.05
SCHEDULE OF INVESTMENTSAs at 30 June 2017
Investments Currency
Quantity/Nominal
Value
Market Value USD
% of Net Assets
Transferable securities and money market instruments admitted to offi cial exchange listing or dealt in on another regulated market
Corporate Bonds (continued)
Dominican RepublicAES Andres BV, Reg. S 7.95%
11/05/2026 USD 3,400,000 3,707,734 0.41
3,707,734 0.41
El SalvadorAgricola Senior Trust, Reg. S 6.75%
18/06/2020 USD 1,914,000 1,986,177 0.22
1,986,177 0.22
GeorgiaBGEO Group JSC, Reg. S 6% 26/07/2023 USD 7,640,000 7,779,506 0.87
7,779,506 0.87
GuatemalaCentral American Bottling Corp., Reg. S
5.75% 31/01/2027 USD 3,500,000 3,724,542 0.42
3,724,542 0.42
Hong KongChampion MTN Ltd., REIT, Reg. S 3.75%
17/01/2023 USD 3,000,000 3,039,225 0.34 Dah Sing Bank Ltd., Reg. S, FRN 4.25%
30/11/2026 USD 5,440,000 5,556,851 0.62 FWD Ltd., Reg. S, FRN 6.25% Perpetual USD 7,300,000 7,655,306 0.85 Henson Finance Ltd., Reg. S 5.5%
17/09/2019 USD 2,500,000 2,663,050 0.30 HLP Finance Ltd., Reg. S 4.45%
16/04/2021 USD 2,494,000 2,621,598 0.29 Hongkong Land Finance Cayman Islands
Co. Ltd. (The), Reg. S 4.625% 16/01/2024 USD 2,850,000 3,120,972 0.35
NWD MTN Ltd., Reg. S 5.25% 26/02/2021 USD 2,800,000 2,992,147 0.33
NWD MTN Ltd., Reg. S 4.375% 30/11/2022 USD 2,800,000 2,927,078 0.33
PCCW-HKT Capital No. 5 Ltd., Reg. S 3.75% 08/03/2023 USD 2,500,000 2,583,075 0.29
Sun Hung Kai Properties Capital Market Ltd., Reg. S, FRN 3.375% 25/02/2024 USD 3,250,000 3,297,600 0.37
Towngas Finance Ltd., Reg. S, FRN 4.75% Perpetual USD 2,488,000 2,559,746 0.28
39,016,648 4.35
IndiaAdani Ports & Special Economic Zone Ltd.,
Reg. S 3.95% 19/01/2022 USD 8,300,000 8,486,003 0.95 Adani Transmission Ltd., Reg. S 4%
03/08/2026 USD 7,846,000 7,867,788 0.88 Delhi International Airport Ltd., Reg. S
6.125% 31/10/2026 USD 3,600,000 3,862,314 0.43 Greenko Investment Co., Reg. S 4.875%
16/08/2023 USD 3,000,000 2,929,218 0.33 Jain International Trading BV, Reg. S
7.125% 01/02/2022 USD 8,500,000 8,478,104 0.95 Neerg Energy Ltd., Reg. S 6%
13/02/2022 USD 8,260,000 8,476,148 0.94
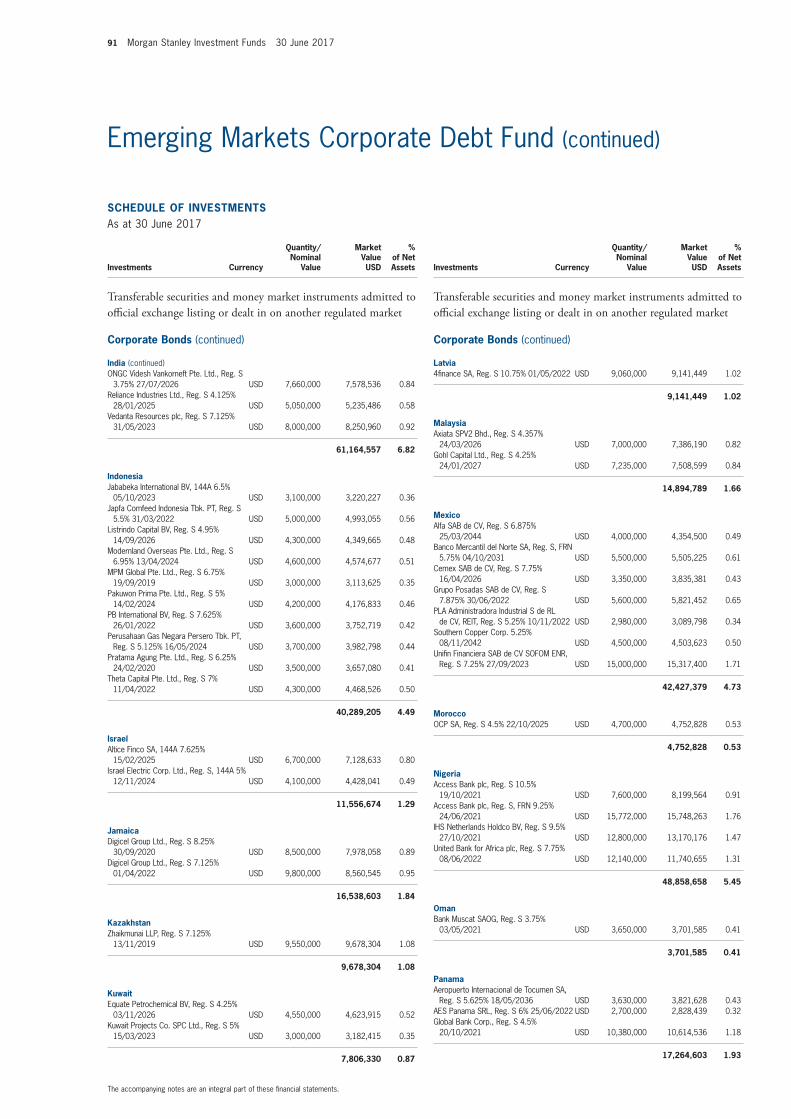
91 Morgan Stanley Investment Funds 30 June 2017
The accompanying notes are an integral part of these fi nancial statements.
Emerging Markets Corporate Debt Fund (continued)
SCHEDULE OF INVESTMENTSAs at 30 June 2017
Investments Currency
Quantity/Nominal
Value
Market Value USD
% of Net Assets
Transferable securities and money market instruments admitted to offi cial exchange listing or dealt in on another regulated market
Corporate Bonds (continued)
India (continued)ONGC Videsh Vankorneft Pte. Ltd., Reg. S
3.75% 27/07/2026 USD 7,660,000 7,578,536 0.84 Reliance Industries Ltd., Reg. S 4.125%
28/01/2025 USD 5,050,000 5,235,486 0.58 Vedanta Resources plc, Reg. S 7.125%
31/05/2023 USD 8,000,000 8,250,960 0.92
61,164,557 6.82
IndonesiaJababeka International BV, 144A 6.5%
05/10/2023 USD 3,100,000 3,220,227 0.36 Japfa Comfeed Indonesia Tbk. PT, Reg. S
5.5% 31/03/2022 USD 5,000,000 4,993,055 0.56 Listrindo Capital BV, Reg. S 4.95%
14/09/2026 USD 4,300,000 4,349,665 0.48 Modernland Overseas Pte. Ltd., Reg. S
6.95% 13/04/2024 USD 4,600,000 4,574,677 0.51 MPM Global Pte. Ltd., Reg. S 6.75%
19/09/2019 USD 3,000,000 3,113,625 0.35 Pakuwon Prima Pte. Ltd., Reg. S 5%
14/02/2024 USD 4,200,000 4,176,833 0.46 PB International BV, Reg. S 7.625%
26/01/2022 USD 3,600,000 3,752,719 0.42 Perusahaan Gas Negara Persero Tbk. PT,
Reg. S 5.125% 16/05/2024 USD 3,700,000 3,982,798 0.44 Pratama Agung Pte. Ltd., Reg. S 6.25%
24/02/2020 USD 3,500,000 3,657,080 0.41 Theta Capital Pte. Ltd., Reg. S 7%
11/04/2022 USD 4,300,000 4,468,526 0.50
40,289,205 4.49
IsraelAltice Finco SA, 144A 7.625%
15/02/2025 USD 6,700,000 7,128,633 0.80 Israel Electric Corp. Ltd., Reg. S, 144A 5%
12/11/2024 USD 4,100,000 4,428,041 0.49
11,556,674 1.29
JamaicaDigicel Group Ltd., Reg. S 8.25%
30/09/2020 USD 8,500,000 7,978,058 0.89 Digicel Group Ltd., Reg. S 7.125%
01/04/2022 USD 9,800,000 8,560,545 0.95
16,538,603 1.84
KazakhstanZhaikmunai LLP, Reg. S 7.125%
13/11/2019 USD 9,550,000 9,678,304 1.08
9,678,304 1.08
KuwaitEquate Petrochemical BV, Reg. S 4.25%
03/11/2026 USD 4,550,000 4,623,915 0.52 Kuwait Projects Co. SPC Ltd., Reg. S 5%
15/03/2023 USD 3,000,000 3,182,415 0.35
7,806,330 0.87
SCHEDULE OF INVESTMENTSAs at 30 June 2017
Investments Currency
Quantity/Nominal
Value
Market Value USD
% of Net Assets
Transferable securities and money market instruments admitted to offi cial exchange listing or dealt in on another regulated market
Corporate Bonds (continued)
Latvia4fi nance SA, Reg. S 10.75% 01/05/2022 USD 9,060,000 9,141,449 1.02
9,141,449 1.02
MalaysiaAxiata SPV2 Bhd., Reg. S 4.357%
24/03/2026 USD 7,000,000 7,386,190 0.82 Gohl Capital Ltd., Reg. S 4.25%
24/01/2027 USD 7,235,000 7,508,599 0.84
14,894,789 1.66
MexicoAlfa SAB de CV, Reg. S 6.875%
25/03/2044 USD 4,000,000 4,354,500 0.49 Banco Mercantil del Norte SA, Reg. S, FRN
5.75% 04/10/2031 USD 5,500,000 5,505,225 0.61 Cemex SAB de CV, Reg. S 7.75%
16/04/2026 USD 3,350,000 3,835,381 0.43 Grupo Posadas SAB de CV, Reg. S
7.875% 30/06/2022 USD 5,600,000 5,821,452 0.65 PLA Administradora Industrial S de RL
de CV, REIT, Reg. S 5.25% 10/11/2022 USD 2,980,000 3,089,798 0.34 Southern Copper Corp. 5.25%
08/11/2042 USD 4,500,000 4,503,623 0.50 Unifi n Financiera SAB de CV SOFOM ENR,
Reg. S 7.25% 27/09/2023 USD 15,000,000 15,317,400 1.71
42,427,379 4.73
MoroccoOCP SA, Reg. S 4.5% 22/10/2025 USD 4,700,000 4,752,828 0.53
4,752,828 0.53
NigeriaAccess Bank plc, Reg. S 10.5%
19/10/2021 USD 7,600,000 8,199,564 0.91 Access Bank plc, Reg. S, FRN 9.25%
24/06/2021 USD 15,772,000 15,748,263 1.76 IHS Netherlands Holdco BV, Reg. S 9.5%
27/10/2021 USD 12,800,000 13,170,176 1.47 United Bank for Africa plc, Reg. S 7.75%
08/06/2022 USD 12,140,000 11,740,655 1.31
48,858,658 5.45
OmanBank Muscat SAOG, Reg. S 3.75%
03/05/2021 USD 3,650,000 3,701,585 0.41
3,701,585 0.41
PanamaAeropuerto Internacional de Tocumen SA,
Reg. S 5.625% 18/05/2036 USD 3,630,000 3,821,628 0.43 AES Panama SRL, Reg. S 6% 25/06/2022 USD 2,700,000 2,828,439 0.32 Global Bank Corp., Reg. S 4.5%
20/10/2021 USD 10,380,000 10,614,536 1.18
17,264,603 1.93
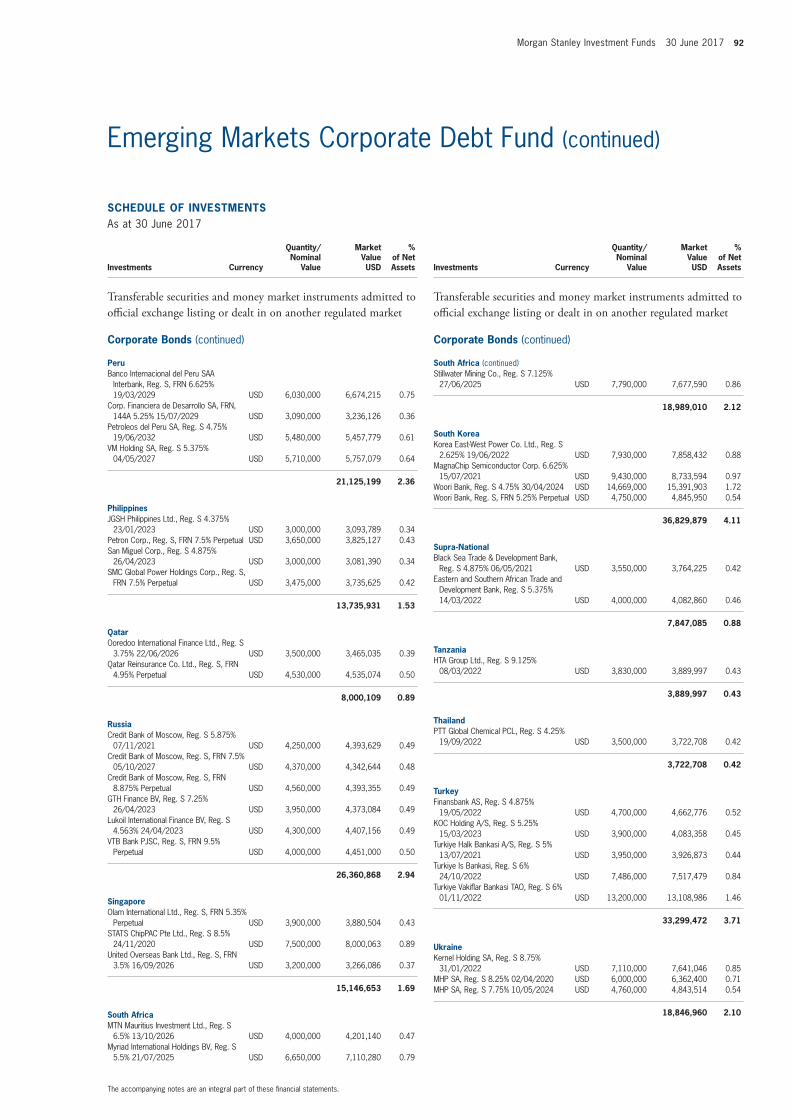
Morgan Stanley Investment Funds 30 June 2017 92
The accompanying notes are an integral part of these fi nancial statements.
Emerging Markets Corporate Debt Fund (continued)
SCHEDULE OF INVESTMENTSAs at 30 June 2017
Investments Currency
Quantity/Nominal
Value
Market Value USD
% of Net Assets
Transferable securities and money market instruments admitted to offi cial exchange listing or dealt in on another regulated market
Corporate Bonds (continued)
PeruBanco Internacional del Peru SAA
Interbank, Reg. S, FRN 6.625% 19/03/2029 USD 6,030,000 6,674,215 0.75
Corp. Financiera de Desarrollo SA, FRN, 144A 5.25% 15/07/2029 USD 3,090,000 3,236,126 0.36
Petroleos del Peru SA, Reg. S 4.75% 19/06/2032 USD 5,480,000 5,457,779 0.61
VM Holding SA, Reg. S 5.375% 04/05/2027 USD 5,710,000 5,757,079 0.64
21,125,199 2.36
PhilippinesJGSH Philippines Ltd., Reg. S 4.375%
23/01/2023 USD 3,000,000 3,093,789 0.34 Petron Corp., Reg. S, FRN 7.5% Perpetual USD 3,650,000 3,825,127 0.43 San Miguel Corp., Reg. S 4.875%
26/04/2023 USD 3,000,000 3,081,390 0.34 SMC Global Power Holdings Corp., Reg. S,
FRN 7.5% Perpetual USD 3,475,000 3,735,625 0.42
13,735,931 1.53
QatarOoredoo International Finance Ltd., Reg. S
3.75% 22/06/2026 USD 3,500,000 3,465,035 0.39 Qatar Reinsurance Co. Ltd., Reg. S, FRN
4.95% Perpetual USD 4,530,000 4,535,074 0.50
8,000,109 0.89
RussiaCredit Bank of Moscow, Reg. S 5.875%
07/11/2021 USD 4,250,000 4,393,629 0.49 Credit Bank of Moscow, Reg. S, FRN 7.5%
05/10/2027 USD 4,370,000 4,342,644 0.48 Credit Bank of Moscow, Reg. S, FRN
8.875% Perpetual USD 4,560,000 4,393,355 0.49 GTH Finance BV, Reg. S 7.25%
26/04/2023 USD 3,950,000 4,373,084 0.49 Lukoil International Finance BV, Reg. S
4.563% 24/04/2023 USD 4,300,000 4,407,156 0.49 VTB Bank PJSC, Reg. S, FRN 9.5%
Perpetual USD 4,000,000 4,451,000 0.50
26,360,868 2.94
SingaporeOlam International Ltd., Reg. S, FRN 5.35%
Perpetual USD 3,900,000 3,880,504 0.43 STATS ChipPAC Pte Ltd., Reg. S 8.5%
24/11/2020 USD 7,500,000 8,000,063 0.89 United Overseas Bank Ltd., Reg. S, FRN
3.5% 16/09/2026 USD 3,200,000 3,266,086 0.37
15,146,653 1.69
South AfricaMTN Mauritius Investment Ltd., Reg. S
6.5% 13/10/2026 USD 4,000,000 4,201,140 0.47 Myriad International Holdings BV, Reg. S
5.5% 21/07/2025 USD 6,650,000 7,110,280 0.79
SCHEDULE OF INVESTMENTSAs at 30 June 2017
Investments Currency
Quantity/Nominal
Value
Market Value USD
% of Net Assets
Transferable securities and money market instruments admitted to offi cial exchange listing or dealt in on another regulated market
Corporate Bonds (continued)
South Africa (continued)Stillwater Mining Co., Reg. S 7.125%
27/06/2025 USD 7,790,000 7,677,590 0.86
18,989,010 2.12
South KoreaKorea East-West Power Co. Ltd., Reg. S
2.625% 19/06/2022 USD 7,930,000 7,858,432 0.88 MagnaChip Semiconductor Corp. 6.625%
15/07/2021 USD 9,430,000 8,733,594 0.97 Woori Bank, Reg. S 4.75% 30/04/2024 USD 14,669,000 15,391,903 1.72 Woori Bank, Reg. S, FRN 5.25% Perpetual USD 4,750,000 4,845,950 0.54
36,829,879 4.11
Supra-NationalBlack Sea Trade & Development Bank,
Reg. S 4.875% 06/05/2021 USD 3,550,000 3,764,225 0.42 Eastern and Southern African Trade and
Development Bank, Reg. S 5.375% 14/03/2022 USD 4,000,000 4,082,860 0.46
7,847,085 0.88
TanzaniaHTA Group Ltd., Reg. S 9.125%
08/03/2022 USD 3,830,000 3,889,997 0.43
3,889,997 0.43
ThailandPTT Global Chemical PCL, Reg. S 4.25%
19/09/2022 USD 3,500,000 3,722,708 0.42
3,722,708 0.42
TurkeyFinansbank AS, Reg. S 4.875%
19/05/2022 USD 4,700,000 4,662,776 0.52 KOC Holding A/S, Reg. S 5.25%
15/03/2023 USD 3,900,000 4,083,358 0.45 Turkiye Halk Bankasi A/S, Reg. S 5%
13/07/2021 USD 3,950,000 3,926,873 0.44 Turkiye Is Bankasi, Reg. S 6%
24/10/2022 USD 7,486,000 7,517,479 0.84 Turkiye Vakifl ar Bankasi TAO, Reg. S 6%
01/11/2022 USD 13,200,000 13,108,986 1.46
33,299,472 3.71
UkraineKernel Holding SA, Reg. S 8.75%
31/01/2022 USD 7,110,000 7,641,046 0.85 MHP SA, Reg. S 8.25% 02/04/2020 USD 6,000,000 6,362,400 0.71 MHP SA, Reg. S 7.75% 10/05/2024 USD 4,760,000 4,843,514 0.54
18,846,960 2.10
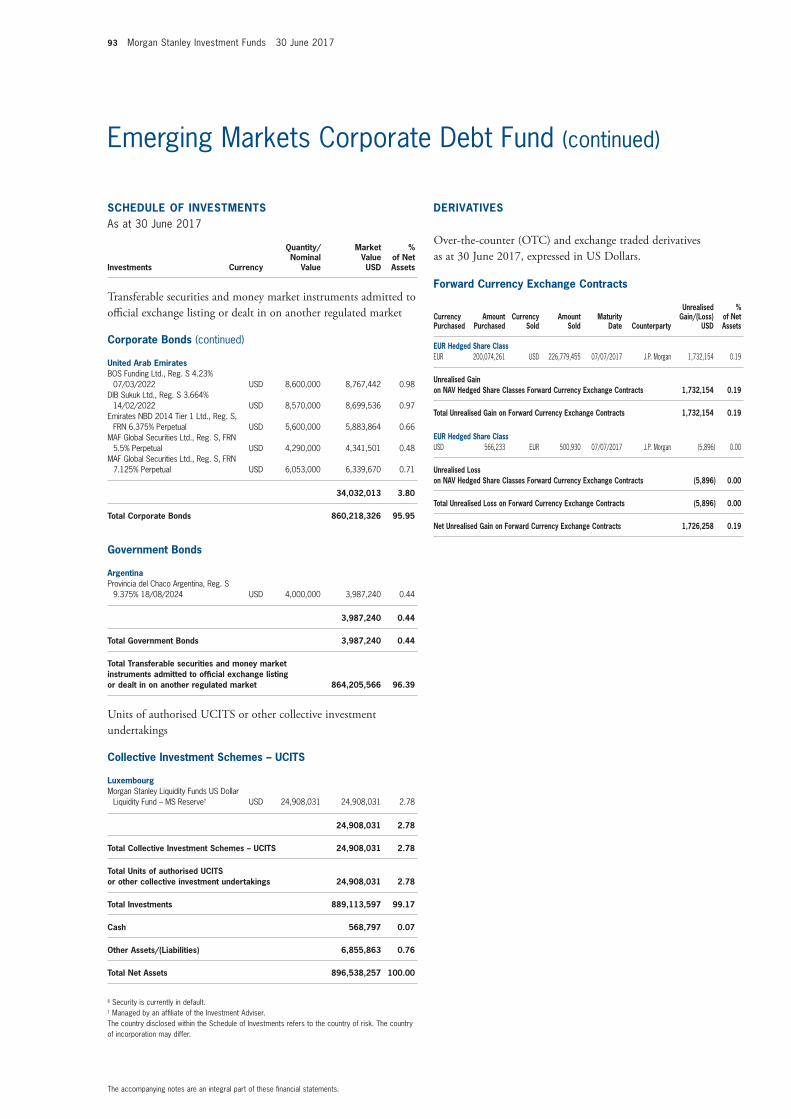
93 Morgan Stanley Investment Funds 30 June 2017
The accompanying notes are an integral part of these fi nancial statements.
Emerging Markets Corporate Debt Fund (continued)
SCHEDULE OF INVESTMENTSAs at 30 June 2017
Investments Currency
Quantity/Nominal
Value
Market Value USD
% of Net Assets
Transferable securities and money market instruments admitted to offi cial exchange listing or dealt in on another regulated market
Corporate Bonds (continued)
United Arab EmiratesBOS Funding Ltd., Reg. S 4.23%
07/03/2022 USD 8,600,000 8,767,442 0.98 DIB Sukuk Ltd., Reg. S 3.664%
14/02/2022 USD 8,570,000 8,699,536 0.97 Emirates NBD 2014 Tier 1 Ltd., Reg. S,
FRN 6.375% Perpetual USD 5,600,000 5,883,864 0.66 MAF Global Securities Ltd., Reg. S, FRN
5.5% Perpetual USD 4,290,000 4,341,501 0.48 MAF Global Securities Ltd., Reg. S, FRN
7.125% Perpetual USD 6,053,000 6,339,670 0.71
34,032,013 3.80
Total Corporate Bonds 860,218,326 95.95
Government Bonds
ArgentinaProvincia del Chaco Argentina, Reg. S
9.375% 18/08/2024 USD 4,000,000 3,987,240 0.44
3,987,240 0.44
Total Government Bonds 3,987,240 0.44
Total Transferable securities and money market instruments admitted to offi cial exchange listing or dealt in on another regulated market 864,205,566 96.39
Units of authorised UCITS or other collective investment undertakings
Collective Investment Schemes – UCITS
LuxembourgMorgan Stanley Liquidity Funds US Dollar
Liquidity Fund – MS Reserve† USD 24,908,031 24,908,031 2.78
24,908,031 2.78
Total Collective Investment Schemes – UCITS 24,908,031 2.78
Total Units of authorised UCITS or other collective investment undertakings 24,908,031 2.78
Total Investments 889,113,597 99.17
Cash 568,797 0.07
Other Assets/(Liabilities) 6,855,863 0.76
Total Net Assets 896,538,257 100.00
§ Security is currently in default.† Managed by an affi liate of the Investment Adviser.The country disclosed within the Schedule of Investments refers to the country of risk. The country of incorporation may differ.
Forward Currency Exchange Contracts
Currency Purchased
Amount Purchased
Currency Sold
Amount Sold
Maturity Date Counterparty
Unrealised Gain/(Loss)
USD
% of Net Assets
EUR Hedged Share ClassEUR 200,074,261 USD 226,779,455 07/07/2017 J.P. Morgan 1,732,154 0.19
Unrealised Gain on NAV Hedged Share Classes Forward Currency Exchange Contracts 1,732,154 0.19
Total Unrealised Gain on Forward Currency Exchange Contracts 1,732,154 0.19
EUR Hedged Share ClassUSD 566,233 EUR 500,930 07/07/2017 J.P. Morgan (5,896) 0.00
Unrealised Loss on NAV Hedged Share Classes Forward Currency Exchange Contracts (5,896) 0.00
Total Unrealised Loss on Forward Currency Exchange Contracts (5,896) 0.00
Net Unrealised Gain on Forward Currency Exchange Contracts 1,726,258 0.19
DERIVATIVES
Over-the-counter (OTC) and exchange traded derivatives as at 30 June 2017, expressed in US Dollars.
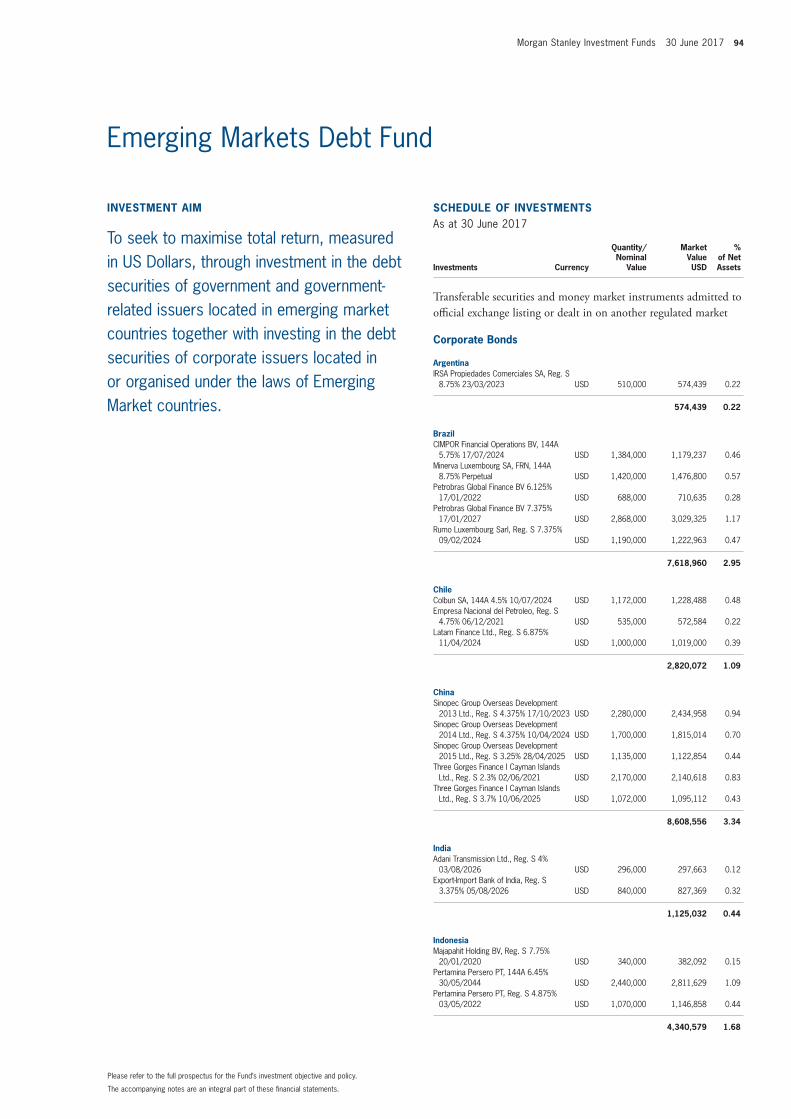
Morgan Stanley Investment Funds 30 June 2017 94
The accompanying notes are an integral part of these fi nancial statements.
Please refer to the full prospectus for the Fund’s investment objective and policy.
INVESTMENT AIM
To seek to maximise total return, measured in US Dollars, through investment in the debt securities of government and government-related issuers located in emerging market countries together with investing in the debt securities of corporate issuers located in or organised under the laws of Emerging Market countries.
SCHEDULE OF INVESTMENTSAs at 30 June 2017
Investments Currency
Quantity/Nominal
Value
Market Value USD
% of Net Assets
Transferable securities and money market instruments admitted to offi cial exchange listing or dealt in on another regulated market
Corporate Bonds
ArgentinaIRSA Propiedades Comerciales SA, Reg. S
8.75% 23/03/2023 USD 510,000 574,439 0.22
574,439 0.22
BrazilCIMPOR Financial Operations BV, 144A
5.75% 17/07/2024 USD 1,384,000 1,179,237 0.46 Minerva Luxembourg SA, FRN, 144A
8.75% Perpetual USD 1,420,000 1,476,800 0.57 Petrobras Global Finance BV 6.125%
17/01/2022 USD 688,000 710,635 0.28 Petrobras Global Finance BV 7.375%
17/01/2027 USD 2,868,000 3,029,325 1.17 Rumo Luxembourg Sarl, Reg. S 7.375%
09/02/2024 USD 1,190,000 1,222,963 0.47
7,618,960 2.95
ChileColbun SA, 144A 4.5% 10/07/2024 USD 1,172,000 1,228,488 0.48 Empresa Nacional del Petroleo, Reg. S
4.75% 06/12/2021 USD 535,000 572,584 0.22 Latam Finance Ltd., Reg. S 6.875%
11/04/2024 USD 1,000,000 1,019,000 0.39
2,820,072 1.09
ChinaSinopec Group Overseas Development
2013 Ltd., Reg. S 4.375% 17/10/2023 USD 2,280,000 2,434,958 0.94 Sinopec Group Overseas Development
2014 Ltd., Reg. S 4.375% 10/04/2024 USD 1,700,000 1,815,014 0.70 Sinopec Group Overseas Development
2015 Ltd., Reg. S 3.25% 28/04/2025 USD 1,135,000 1,122,854 0.44 Three Gorges Finance I Cayman Islands
Ltd., Reg. S 2.3% 02/06/2021 USD 2,170,000 2,140,618 0.83 Three Gorges Finance I Cayman Islands
Ltd., Reg. S 3.7% 10/06/2025 USD 1,072,000 1,095,112 0.43
8,608,556 3.34
IndiaAdani Transmission Ltd., Reg. S 4%
03/08/2026 USD 296,000 297,663 0.12 Export-Import Bank of India, Reg. S
3.375% 05/08/2026 USD 840,000 827,369 0.32
1,125,032 0.44
IndonesiaMajapahit Holding BV, Reg. S 7.75%
20/01/2020 USD 340,000 382,092 0.15 Pertamina Persero PT, 144A 6.45%
30/05/2044 USD 2,440,000 2,811,629 1.09 Pertamina Persero PT, Reg. S 4.875%
03/05/2022 USD 1,070,000 1,146,858 0.44
4,340,579 1.68
Emerging Markets Debt Fund
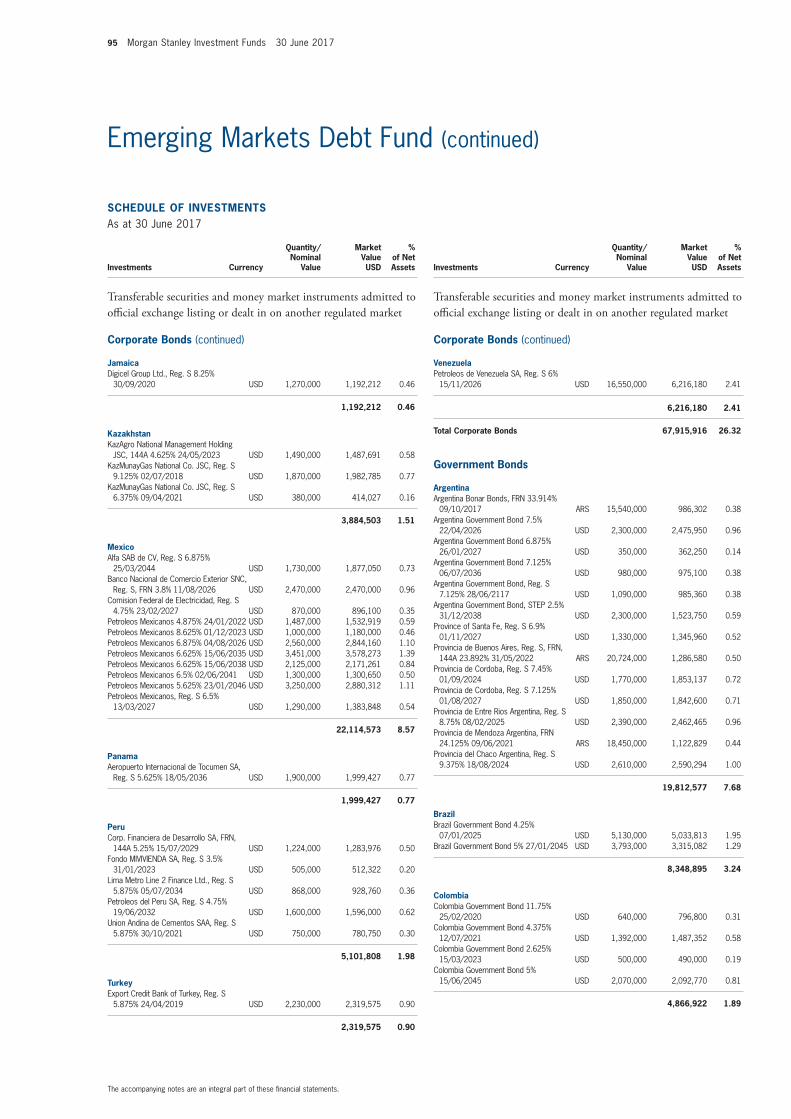
95 Morgan Stanley Investment Funds 30 June 2017
The accompanying notes are an integral part of these fi nancial statements.
Emerging Markets Debt Fund (continued)
SCHEDULE OF INVESTMENTSAs at 30 June 2017
Investments Currency
Quantity/Nominal
Value
Market Value USD
% of Net Assets
Transferable securities and money market instruments admitted to offi cial exchange listing or dealt in on another regulated market
Corporate Bonds (continued)
JamaicaDigicel Group Ltd., Reg. S 8.25%
30/09/2020 USD 1,270,000 1,192,212 0.46
1,192,212 0.46
KazakhstanKazAgro National Management Holding
JSC, 144A 4.625% 24/05/2023 USD 1,490,000 1,487,691 0.58 KazMunayGas National Co. JSC, Reg. S
9.125% 02/07/2018 USD 1,870,000 1,982,785 0.77 KazMunayGas National Co. JSC, Reg. S
6.375% 09/04/2021 USD 380,000 414,027 0.16
3,884,503 1.51
MexicoAlfa SAB de CV, Reg. S 6.875%
25/03/2044 USD 1,730,000 1,877,050 0.73 Banco Nacional de Comercio Exterior SNC,
Reg. S, FRN 3.8% 11/08/2026 USD 2,470,000 2,470,000 0.96 Comision Federal de Electricidad, Reg. S
4.75% 23/02/2027 USD 870,000 896,100 0.35 Petroleos Mexicanos 4.875% 24/01/2022 USD 1,487,000 1,532,919 0.59 Petroleos Mexicanos 8.625% 01/12/2023 USD 1,000,000 1,180,000 0.46 Petroleos Mexicanos 6.875% 04/08/2026 USD 2,560,000 2,844,160 1.10 Petroleos Mexicanos 6.625% 15/06/2035 USD 3,451,000 3,578,273 1.39 Petroleos Mexicanos 6.625% 15/06/2038 USD 2,125,000 2,171,261 0.84 Petroleos Mexicanos 6.5% 02/06/2041 USD 1,300,000 1,300,650 0.50 Petroleos Mexicanos 5.625% 23/01/2046 USD 3,250,000 2,880,312 1.11 Petroleos Mexicanos, Reg. S 6.5%
13/03/2027 USD 1,290,000 1,383,848 0.54
22,114,573 8.57
PanamaAeropuerto Internacional de Tocumen SA,
Reg. S 5.625% 18/05/2036 USD 1,900,000 1,999,427 0.77
1,999,427 0.77
PeruCorp. Financiera de Desarrollo SA, FRN,
144A 5.25% 15/07/2029 USD 1,224,000 1,283,976 0.50 Fondo MIVIVIENDA SA, Reg. S 3.5%
31/01/2023 USD 505,000 512,322 0.20 Lima Metro Line 2 Finance Ltd., Reg. S
5.875% 05/07/2034 USD 868,000 928,760 0.36 Petroleos del Peru SA, Reg. S 4.75%
19/06/2032 USD 1,600,000 1,596,000 0.62 Union Andina de Cementos SAA, Reg. S
5.875% 30/10/2021 USD 750,000 780,750 0.30
5,101,808 1.98
TurkeyExport Credit Bank of Turkey, Reg. S
5.875% 24/04/2019 USD 2,230,000 2,319,575 0.90
2,319,575 0.90
SCHEDULE OF INVESTMENTSAs at 30 June 2017
Investments Currency
Quantity/Nominal
Value
Market Value USD
% of Net Assets
Transferable securities and money market instruments admitted to offi cial exchange listing or dealt in on another regulated market
Corporate Bonds (continued)
VenezuelaPetroleos de Venezuela SA, Reg. S 6%
15/11/2026 USD 16,550,000 6,216,180 2.41
6,216,180 2.41
Total Corporate Bonds 67,915,916 26.32
Government Bonds
ArgentinaArgentina Bonar Bonds, FRN 33.914%
09/10/2017 ARS 15,540,000 986,302 0.38 Argentina Government Bond 7.5%
22/04/2026 USD 2,300,000 2,475,950 0.96 Argentina Government Bond 6.875%
26/01/2027 USD 350,000 362,250 0.14 Argentina Government Bond 7.125%
06/07/2036 USD 980,000 975,100 0.38 Argentina Government Bond, Reg. S
7.125% 28/06/2117 USD 1,090,000 985,360 0.38 Argentina Government Bond, STEP 2.5%
31/12/2038 USD 2,300,000 1,523,750 0.59 Province of Santa Fe, Reg. S 6.9%
01/11/2027 USD 1,330,000 1,345,960 0.52 Provincia de Buenos Aires, Reg. S, FRN,
144A 23.892% 31/05/2022 ARS 20,724,000 1,286,580 0.50 Provincia de Cordoba, Reg. S 7.45%
01/09/2024 USD 1,770,000 1,853,137 0.72 Provincia de Cordoba, Reg. S 7.125%
01/08/2027 USD 1,850,000 1,842,600 0.71 Provincia de Entre Rios Argentina, Reg. S
8.75% 08/02/2025 USD 2,390,000 2,462,465 0.96 Provincia de Mendoza Argentina, FRN
24.125% 09/06/2021 ARS 18,450,000 1,122,829 0.44 Provincia del Chaco Argentina, Reg. S
9.375% 18/08/2024 USD 2,610,000 2,590,294 1.00
19,812,577 7.68
BrazilBrazil Government Bond 4.25%
07/01/2025 USD 5,130,000 5,033,813 1.95 Brazil Government Bond 5% 27/01/2045 USD 3,793,000 3,315,082 1.29
8,348,895 3.24
ColombiaColombia Government Bond 11.75%
25/02/2020 USD 640,000 796,800 0.31 Colombia Government Bond 4.375%
12/07/2021 USD 1,392,000 1,487,352 0.58 Colombia Government Bond 2.625%
15/03/2023 USD 500,000 490,000 0.19 Colombia Government Bond 5%
15/06/2045 USD 2,070,000 2,092,770 0.81
4,866,922 1.89
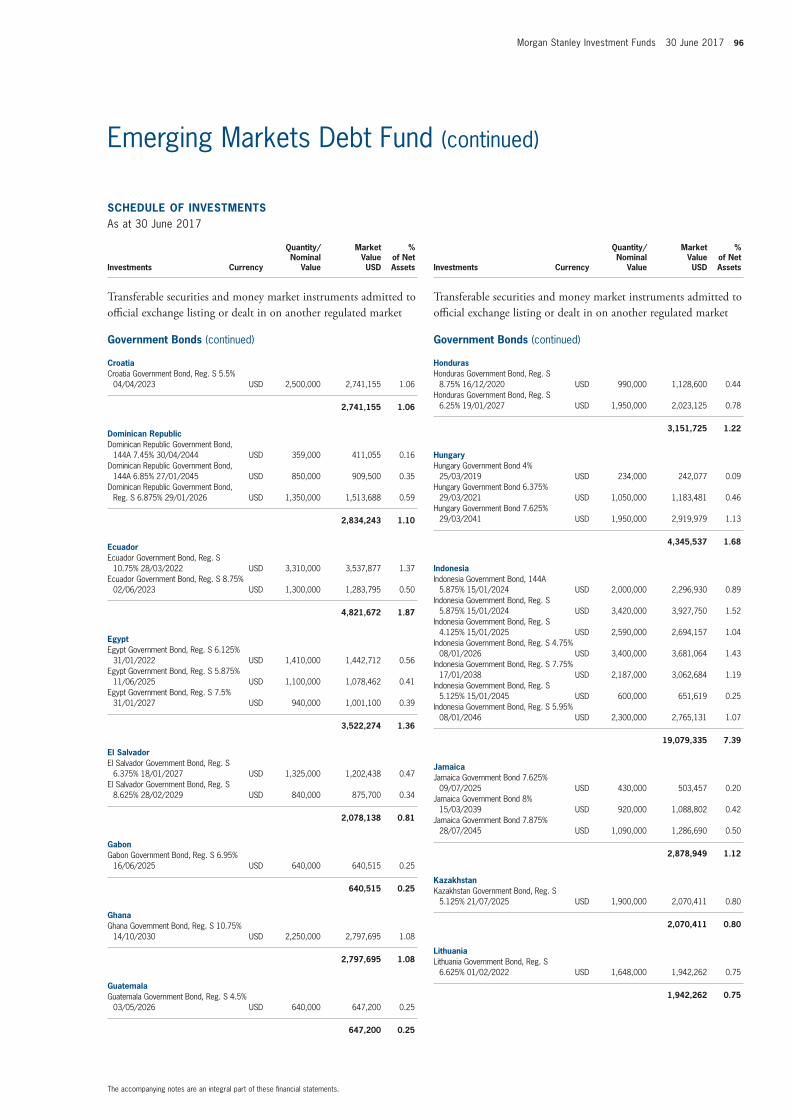
Morgan Stanley Investment Funds 30 June 2017 96
The accompanying notes are an integral part of these fi nancial statements.
Emerging Markets Debt Fund (continued)
SCHEDULE OF INVESTMENTSAs at 30 June 2017
Investments Currency
Quantity/Nominal
Value
Market Value USD
% of Net Assets
Transferable securities and money market instruments admitted to offi cial exchange listing or dealt in on another regulated market
Government Bonds (continued)
CroatiaCroatia Government Bond, Reg. S 5.5%
04/04/2023 USD 2,500,000 2,741,155 1.06
2,741,155 1.06
Dominican RepublicDominican Republic Government Bond,
144A 7.45% 30/04/2044 USD 359,000 411,055 0.16 Dominican Republic Government Bond,
144A 6.85% 27/01/2045 USD 850,000 909,500 0.35 Dominican Republic Government Bond,
Reg. S 6.875% 29/01/2026 USD 1,350,000 1,513,688 0.59
2,834,243 1.10
EcuadorEcuador Government Bond, Reg. S
10.75% 28/03/2022 USD 3,310,000 3,537,877 1.37 Ecuador Government Bond, Reg. S 8.75%
02/06/2023 USD 1,300,000 1,283,795 0.50
4,821,672 1.87
EgyptEgypt Government Bond, Reg. S 6.125%
31/01/2022 USD 1,410,000 1,442,712 0.56 Egypt Government Bond, Reg. S 5.875%
11/06/2025 USD 1,100,000 1,078,462 0.41 Egypt Government Bond, Reg. S 7.5%
31/01/2027 USD 940,000 1,001,100 0.39
3,522,274 1.36
El SalvadorEl Salvador Government Bond, Reg. S
6.375% 18/01/2027 USD 1,325,000 1,202,438 0.47 El Salvador Government Bond, Reg. S
8.625% 28/02/2029 USD 840,000 875,700 0.34
2,078,138 0.81
GabonGabon Government Bond, Reg. S 6.95%
16/06/2025 USD 640,000 640,515 0.25
640,515 0.25
GhanaGhana Government Bond, Reg. S 10.75%
14/10/2030 USD 2,250,000 2,797,695 1.08
2,797,695 1.08
GuatemalaGuatemala Government Bond, Reg. S 4.5%
03/05/2026 USD 640,000 647,200 0.25
647,200 0.25
SCHEDULE OF INVESTMENTSAs at 30 June 2017
Investments Currency
Quantity/Nominal
Value
Market Value USD
% of Net Assets
Transferable securities and money market instruments admitted to offi cial exchange listing or dealt in on another regulated market
Government Bonds (continued)
HondurasHonduras Government Bond, Reg. S
8.75% 16/12/2020 USD 990,000 1,128,600 0.44 Honduras Government Bond, Reg. S
6.25% 19/01/2027 USD 1,950,000 2,023,125 0.78
3,151,725 1.22
HungaryHungary Government Bond 4%
25/03/2019 USD 234,000 242,077 0.09 Hungary Government Bond 6.375%
29/03/2021 USD 1,050,000 1,183,481 0.46 Hungary Government Bond 7.625%
29/03/2041 USD 1,950,000 2,919,979 1.13
4,345,537 1.68
IndonesiaIndonesia Government Bond, 144A
5.875% 15/01/2024 USD 2,000,000 2,296,930 0.89 Indonesia Government Bond, Reg. S
5.875% 15/01/2024 USD 3,420,000 3,927,750 1.52 Indonesia Government Bond, Reg. S
4.125% 15/01/2025 USD 2,590,000 2,694,157 1.04 Indonesia Government Bond, Reg. S 4.75%
08/01/2026 USD 3,400,000 3,681,064 1.43 Indonesia Government Bond, Reg. S 7.75%
17/01/2038 USD 2,187,000 3,062,684 1.19 Indonesia Government Bond, Reg. S
5.125% 15/01/2045 USD 600,000 651,619 0.25 Indonesia Government Bond, Reg. S 5.95%
08/01/2046 USD 2,300,000 2,765,131 1.07
19,079,335 7.39
JamaicaJamaica Government Bond 7.625%
09/07/2025 USD 430,000 503,457 0.20 Jamaica Government Bond 8%
15/03/2039 USD 920,000 1,088,802 0.42 Jamaica Government Bond 7.875%
28/07/2045 USD 1,090,000 1,286,690 0.50
2,878,949 1.12
KazakhstanKazakhstan Government Bond, Reg. S
5.125% 21/07/2025 USD 1,900,000 2,070,411 0.80
2,070,411 0.80
LithuaniaLithuania Government Bond, Reg. S
6.625% 01/02/2022 USD 1,648,000 1,942,262 0.75
1,942,262 0.75
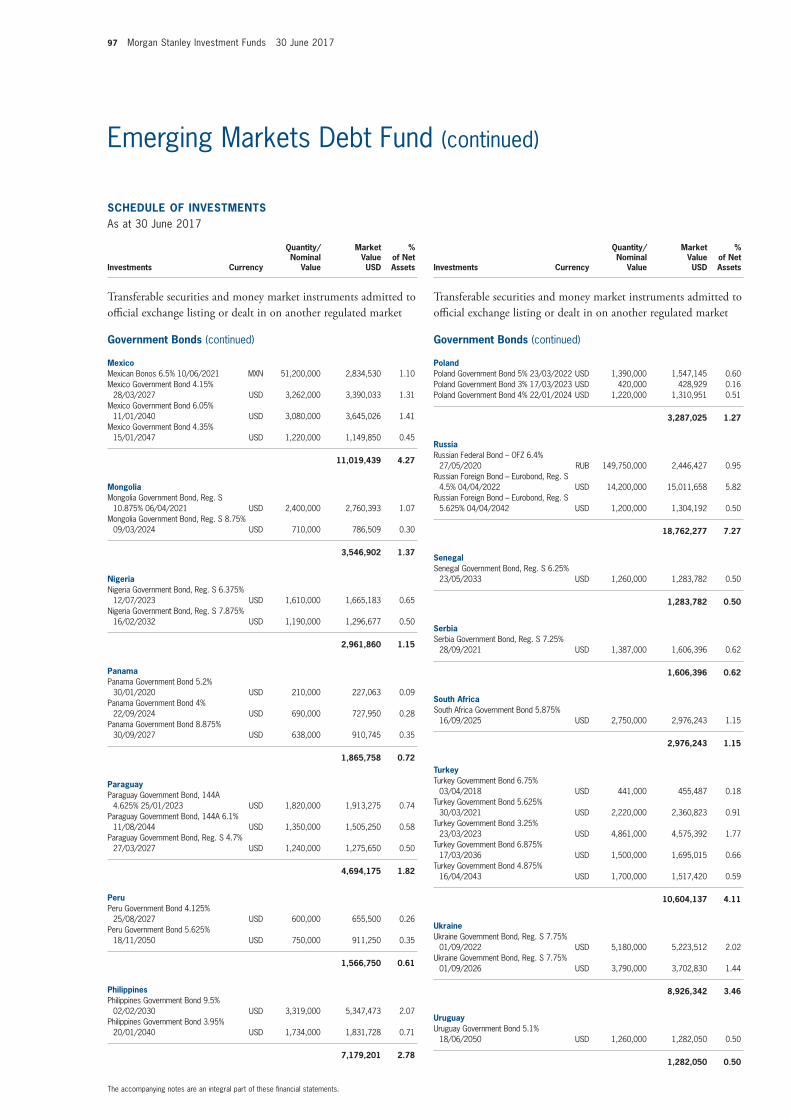
97 Morgan Stanley Investment Funds 30 June 2017
The accompanying notes are an integral part of these fi nancial statements.
Emerging Markets Debt Fund (continued)
SCHEDULE OF INVESTMENTSAs at 30 June 2017
Investments Currency
Quantity/Nominal
Value
Market Value USD
% of Net Assets
Transferable securities and money market instruments admitted to offi cial exchange listing or dealt in on another regulated market
Government Bonds (continued)
MexicoMexican Bonos 6.5% 10/06/2021 MXN 51,200,000 2,834,530 1.10 Mexico Government Bond 4.15%
28/03/2027 USD 3,262,000 3,390,033 1.31 Mexico Government Bond 6.05%
11/01/2040 USD 3,080,000 3,645,026 1.41 Mexico Government Bond 4.35%
15/01/2047 USD 1,220,000 1,149,850 0.45
11,019,439 4.27
MongoliaMongolia Government Bond, Reg. S
10.875% 06/04/2021 USD 2,400,000 2,760,393 1.07 Mongolia Government Bond, Reg. S 8.75%
09/03/2024 USD 710,000 786,509 0.30
3,546,902 1.37
NigeriaNigeria Government Bond, Reg. S 6.375%
12/07/2023 USD 1,610,000 1,665,183 0.65 Nigeria Government Bond, Reg. S 7.875%
16/02/2032 USD 1,190,000 1,296,677 0.50
2,961,860 1.15
PanamaPanama Government Bond 5.2%
30/01/2020 USD 210,000 227,063 0.09 Panama Government Bond 4%
22/09/2024 USD 690,000 727,950 0.28 Panama Government Bond 8.875%
30/09/2027 USD 638,000 910,745 0.35
1,865,758 0.72
ParaguayParaguay Government Bond, 144A
4.625% 25/01/2023 USD 1,820,000 1,913,275 0.74 Paraguay Government Bond, 144A 6.1%
11/08/2044 USD 1,350,000 1,505,250 0.58 Paraguay Government Bond, Reg. S 4.7%
27/03/2027 USD 1,240,000 1,275,650 0.50
4,694,175 1.82
PeruPeru Government Bond 4.125%
25/08/2027 USD 600,000 655,500 0.26 Peru Government Bond 5.625%
18/11/2050 USD 750,000 911,250 0.35
1,566,750 0.61
PhilippinesPhilippines Government Bond 9.5%
02/02/2030 USD 3,319,000 5,347,473 2.07 Philippines Government Bond 3.95%
20/01/2040 USD 1,734,000 1,831,728 0.71
7,179,201 2.78
SCHEDULE OF INVESTMENTSAs at 30 June 2017
Investments Currency
Quantity/Nominal
Value
Market Value USD
% of Net Assets
Transferable securities and money market instruments admitted to offi cial exchange listing or dealt in on another regulated market
Government Bonds (continued)
PolandPoland Government Bond 5% 23/03/2022 USD 1,390,000 1,547,145 0.60 Poland Government Bond 3% 17/03/2023 USD 420,000 428,929 0.16 Poland Government Bond 4% 22/01/2024 USD 1,220,000 1,310,951 0.51
3,287,025 1.27
RussiaRussian Federal Bond – OFZ 6.4%
27/05/2020 RUB 149,750,000 2,446,427 0.95 Russian Foreign Bond – Eurobond, Reg. S
4.5% 04/04/2022 USD 14,200,000 15,011,658 5.82 Russian Foreign Bond – Eurobond, Reg. S
5.625% 04/04/2042 USD 1,200,000 1,304,192 0.50
18,762,277 7.27
SenegalSenegal Government Bond, Reg. S 6.25%
23/05/2033 USD 1,260,000 1,283,782 0.50
1,283,782 0.50
SerbiaSerbia Government Bond, Reg. S 7.25%
28/09/2021 USD 1,387,000 1,606,396 0.62
1,606,396 0.62
South AfricaSouth Africa Government Bond 5.875%
16/09/2025 USD 2,750,000 2,976,243 1.15
2,976,243 1.15
TurkeyTurkey Government Bond 6.75%
03/04/2018 USD 441,000 455,487 0.18 Turkey Government Bond 5.625%
30/03/2021 USD 2,220,000 2,360,823 0.91 Turkey Government Bond 3.25%
23/03/2023 USD 4,861,000 4,575,392 1.77 Turkey Government Bond 6.875%
17/03/2036 USD 1,500,000 1,695,015 0.66 Turkey Government Bond 4.875%
16/04/2043 USD 1,700,000 1,517,420 0.59
10,604,137 4.11
UkraineUkraine Government Bond, Reg. S 7.75%
01/09/2022 USD 5,180,000 5,223,512 2.02 Ukraine Government Bond, Reg. S 7.75%
01/09/2026 USD 3,790,000 3,702,830 1.44
8,926,342 3.46
UruguayUruguay Government Bond 5.1%
18/06/2050 USD 1,260,000 1,282,050 0.50
1,282,050 0.50
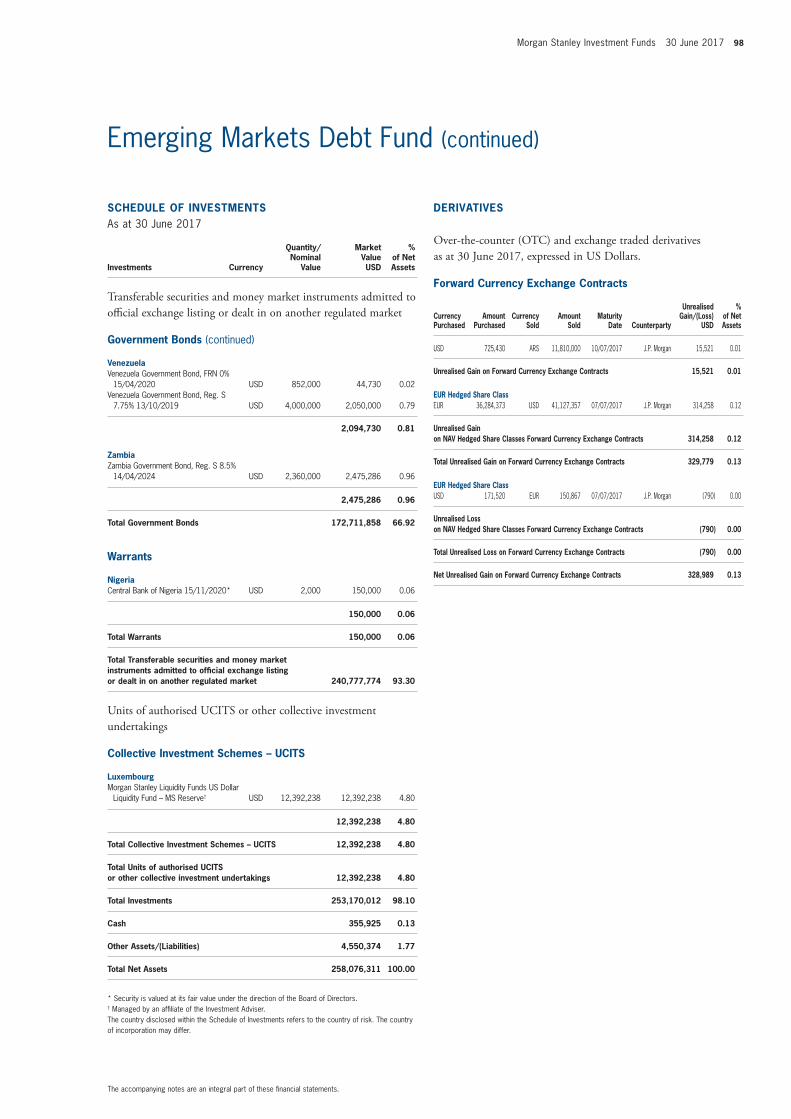
Morgan Stanley Investment Funds 30 June 2017 98
The accompanying notes are an integral part of these fi nancial statements.
Emerging Markets Debt Fund (continued)
SCHEDULE OF INVESTMENTSAs at 30 June 2017
Investments Currency
Quantity/Nominal
Value
Market Value USD
% of Net Assets
Transferable securities and money market instruments admitted to offi cial exchange listing or dealt in on another regulated market
Government Bonds (continued)
VenezuelaVenezuela Government Bond, FRN 0%
15/04/2020 USD 852,000 44,730 0.02 Venezuela Government Bond, Reg. S
7.75% 13/10/2019 USD 4,000,000 2,050,000 0.79
2,094,730 0.81
ZambiaZambia Government Bond, Reg. S 8.5%
14/04/2024 USD 2,360,000 2,475,286 0.96
2,475,286 0.96
Total Government Bonds 172,711,858 66.92
Warrants
NigeriaCentral Bank of Nigeria 15/11/2020* USD 2,000 150,000 0.06
150,000 0.06
Total Warrants 150,000 0.06
Total Transferable securities and money market instruments admitted to offi cial exchange listing or dealt in on another regulated market 240,777,774 93.30
Units of authorised UCITS or other collective investment undertakings
Collective Investment Schemes – UCITS
LuxembourgMorgan Stanley Liquidity Funds US Dollar
Liquidity Fund – MS Reserve† USD 12,392,238 12,392,238 4.80
12,392,238 4.80
Total Collective Investment Schemes – UCITS 12,392,238 4.80
Total Units of authorised UCITS or other collective investment undertakings 12,392,238 4.80
Total Investments 253,170,012 98.10
Cash 355,925 0.13
Other Assets/(Liabilities) 4,550,374 1.77
Total Net Assets 258,076,311 100.00
* Security is valued at its fair value under the direction of the Board of Directors.† Managed by an affi liate of the Investment Adviser.The country disclosed within the Schedule of Investments refers to the country of risk. The country of incorporation may differ.
Forward Currency Exchange Contracts
Currency Purchased
Amount Purchased
Currency Sold
Amount Sold
Maturity Date Counterparty
Unrealised Gain/(Loss)
USD
% of Net Assets
USD 725,430 ARS 11,810,000 10/07/2017 J.P. Morgan 15,521 0.01
Unrealised Gain on Forward Currency Exchange Contracts 15,521 0.01
EUR Hedged Share ClassEUR 36,284,373 USD 41,127,357 07/07/2017 J.P. Morgan 314,258 0.12
Unrealised Gain on NAV Hedged Share Classes Forward Currency Exchange Contracts 314,258 0.12
Total Unrealised Gain on Forward Currency Exchange Contracts 329,779 0.13
EUR Hedged Share ClassUSD 171,520 EUR 150,867 07/07/2017 J.P. Morgan (790) 0.00
Unrealised Loss on NAV Hedged Share Classes Forward Currency Exchange Contracts (790) 0.00
Total Unrealised Loss on Forward Currency Exchange Contracts (790) 0.00
Net Unrealised Gain on Forward Currency Exchange Contracts 328,989 0.13
DERIVATIVES
Over-the-counter (OTC) and exchange traded derivatives as at 30 June 2017, expressed in US Dollars.
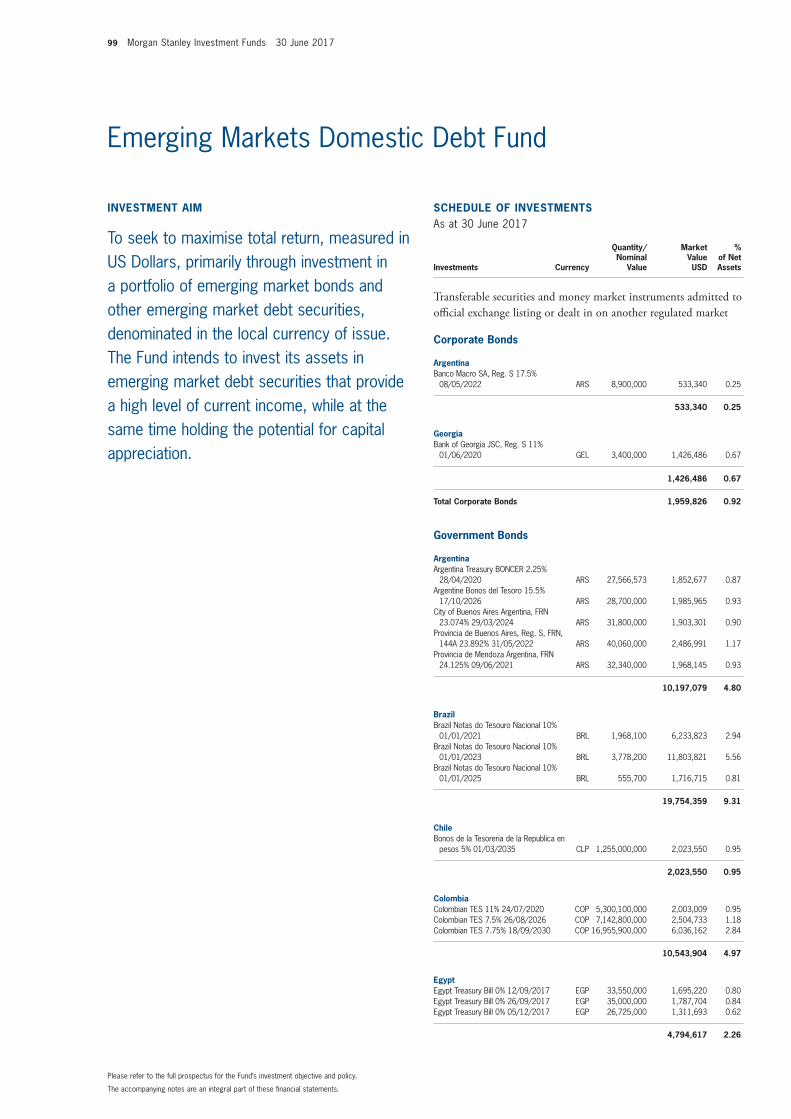
99 Morgan Stanley Investment Funds 30 June 2017
The accompanying notes are an integral part of these fi nancial statements.
Please refer to the full prospectus for the Fund’s investment objective and policy.
SCHEDULE OF INVESTMENTSAs at 30 June 2017
Investments Currency
Quantity/Nominal
Value
Market Value USD
% of Net Assets
Transferable securities and money market instruments admitted to offi cial exchange listing or dealt in on another regulated market
Corporate Bonds
ArgentinaBanco Macro SA, Reg. S 17.5%
08/05/2022 ARS 8,900,000 533,340 0.25
533,340 0.25
GeorgiaBank of Georgia JSC, Reg. S 11%
01/06/2020 GEL 3,400,000 1,426,486 0.67
1,426,486 0.67
Total Corporate Bonds 1,959,826 0.92
Government Bonds
ArgentinaArgentina Treasury BONCER 2.25%
28/04/2020 ARS 27,566,573 1,852,677 0.87 Argentine Bonos del Tesoro 15.5%
17/10/2026 ARS 28,700,000 1,985,965 0.93 City of Buenos Aires Argentina, FRN
23.074% 29/03/2024 ARS 31,800,000 1,903,301 0.90 Provincia de Buenos Aires, Reg. S, FRN,
144A 23.892% 31/05/2022 ARS 40,060,000 2,486,991 1.17 Provincia de Mendoza Argentina, FRN
24.125% 09/06/2021 ARS 32,340,000 1,968,145 0.93
10,197,079 4.80
BrazilBrazil Notas do Tesouro Nacional 10%
01/01/2021 BRL 1,968,100 6,233,823 2.94 Brazil Notas do Tesouro Nacional 10%
01/01/2023 BRL 3,778,200 11,803,821 5.56 Brazil Notas do Tesouro Nacional 10%
01/01/2025 BRL 555,700 1,716,715 0.81
19,754,359 9.31
ChileBonos de la Tesoreria de la Republica en
pesos 5% 01/03/2035 CLP 1,255,000,000 2,023,550 0.95
2,023,550 0.95
ColombiaColombian TES 11% 24/07/2020 COP 5,300,100,000 2,003,009 0.95 Colombian TES 7.5% 26/08/2026 COP 7,142,800,000 2,504,733 1.18 Colombian TES 7.75% 18/09/2030 COP 16,955,900,000 6,036,162 2.84
10,543,904 4.97
EgyptEgypt Treasury Bill 0% 12/09/2017 EGP 33,550,000 1,695,220 0.80 Egypt Treasury Bill 0% 26/09/2017 EGP 35,000,000 1,787,704 0.84 Egypt Treasury Bill 0% 05/12/2017 EGP 26,725,000 1,311,693 0.62
4,794,617 2.26
INVESTMENT AIM
To seek to maximise total return, measured in US Dollars, primarily through investment in a portfolio of emerging market bonds and other emerging market debt securities, denominated in the local currency of issue. The Fund intends to invest its assets in emerging market debt securities that provide a high level of current income, while at the same time holding the potential for capital appreciation.
Emerging Markets Domestic Debt Fund
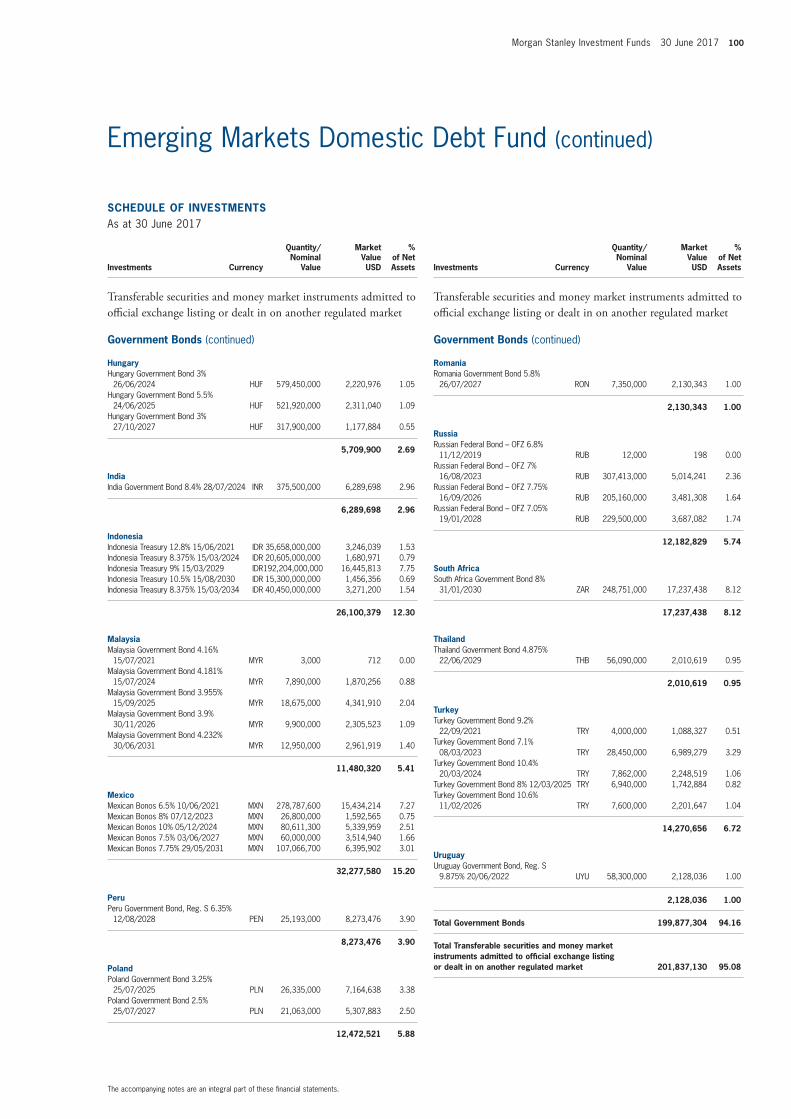
Morgan Stanley Investment Funds 30 June 2017 100
The accompanying notes are an integral part of these fi nancial statements.
Emerging Markets Domestic Debt Fund (continued)
SCHEDULE OF INVESTMENTSAs at 30 June 2017
Investments Currency
Quantity/Nominal
Value
Market Value USD
% of Net Assets
Transferable securities and money market instruments admitted to offi cial exchange listing or dealt in on another regulated market
Government Bonds (continued)
HungaryHungary Government Bond 3%
26/06/2024 HUF 579,450,000 2,220,976 1.05 Hungary Government Bond 5.5%
24/06/2025 HUF 521,920,000 2,311,040 1.09 Hungary Government Bond 3%
27/10/2027 HUF 317,900,000 1,177,884 0.55
5,709,900 2.69
IndiaIndia Government Bond 8.4% 28/07/2024 INR 375,500,000 6,289,698 2.96
6,289,698 2.96
IndonesiaIndonesia Treasury 12.8% 15/06/2021 IDR 35,658,000,000 3,246,039 1.53 Indonesia Treasury 8.375% 15/03/2024 IDR 20,605,000,000 1,680,971 0.79 Indonesia Treasury 9% 15/03/2029 IDR192,204,000,000 16,445,813 7.75 Indonesia Treasury 10.5% 15/08/2030 IDR 15,300,000,000 1,456,356 0.69 Indonesia Treasury 8.375% 15/03/2034 IDR 40,450,000,000 3,271,200 1.54
26,100,379 12.30
MalaysiaMalaysia Government Bond 4.16%
15/07/2021 MYR 3,000 712 0.00 Malaysia Government Bond 4.181%
15/07/2024 MYR 7,890,000 1,870,256 0.88 Malaysia Government Bond 3.955%
15/09/2025 MYR 18,675,000 4,341,910 2.04 Malaysia Government Bond 3.9%
30/11/2026 MYR 9,900,000 2,305,523 1.09 Malaysia Government Bond 4.232%
30/06/2031 MYR 12,950,000 2,961,919 1.40
11,480,320 5.41
MexicoMexican Bonos 6.5% 10/06/2021 MXN 278,787,600 15,434,214 7.27 Mexican Bonos 8% 07/12/2023 MXN 26,800,000 1,592,565 0.75 Mexican Bonos 10% 05/12/2024 MXN 80,611,300 5,339,959 2.51 Mexican Bonos 7.5% 03/06/2027 MXN 60,000,000 3,514,940 1.66 Mexican Bonos 7.75% 29/05/2031 MXN 107,066,700 6,395,902 3.01
32,277,580 15.20
PeruPeru Government Bond, Reg. S 6.35%
12/08/2028 PEN 25,193,000 8,273,476 3.90
8,273,476 3.90
PolandPoland Government Bond 3.25%
25/07/2025 PLN 26,335,000 7,164,638 3.38 Poland Government Bond 2.5%
25/07/2027 PLN 21,063,000 5,307,883 2.50
12,472,521 5.88
SCHEDULE OF INVESTMENTSAs at 30 June 2017
Investments Currency
Quantity/Nominal
Value
Market Value USD
% of Net Assets
Transferable securities and money market instruments admitted to offi cial exchange listing or dealt in on another regulated market
Government Bonds (continued)
RomaniaRomania Government Bond 5.8%
26/07/2027 RON 7,350,000 2,130,343 1.00
2,130,343 1.00
RussiaRussian Federal Bond – OFZ 6.8%
11/12/2019 RUB 12,000 198 0.00 Russian Federal Bond – OFZ 7%
16/08/2023 RUB 307,413,000 5,014,241 2.36 Russian Federal Bond – OFZ 7.75%
16/09/2026 RUB 205,160,000 3,481,308 1.64 Russian Federal Bond – OFZ 7.05%
19/01/2028 RUB 229,500,000 3,687,082 1.74
12,182,829 5.74
South AfricaSouth Africa Government Bond 8%
31/01/2030 ZAR 248,751,000 17,237,438 8.12
17,237,438 8.12
ThailandThailand Government Bond 4.875%
22/06/2029 THB 56,090,000 2,010,619 0.95
2,010,619 0.95
TurkeyTurkey Government Bond 9.2%
22/09/2021 TRY 4,000,000 1,088,327 0.51 Turkey Government Bond 7.1%
08/03/2023 TRY 28,450,000 6,989,279 3.29 Turkey Government Bond 10.4%
20/03/2024 TRY 7,862,000 2,248,519 1.06 Turkey Government Bond 8% 12/03/2025 TRY 6,940,000 1,742,884 0.82 Turkey Government Bond 10.6%
11/02/2026 TRY 7,600,000 2,201,647 1.04
14,270,656 6.72
UruguayUruguay Government Bond, Reg. S
9.875% 20/06/2022 UYU 58,300,000 2,128,036 1.00
2,128,036 1.00
Total Government Bonds 199,877,304 94.16
Total Transferable securities and money market instruments admitted to offi cial exchange listing or dealt in on another regulated market 201,837,130 95.08
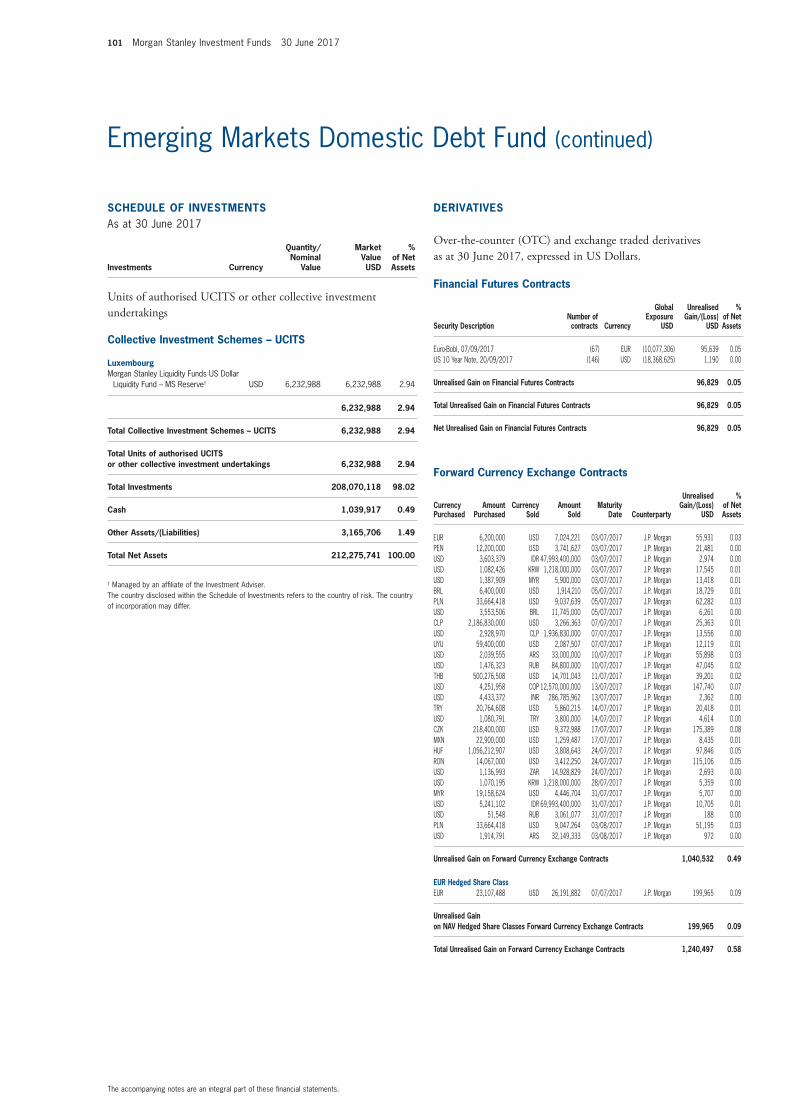
101 Morgan Stanley Investment Funds 30 June 2017
The accompanying notes are an integral part of these fi nancial statements.
Emerging Markets Domestic Debt Fund (continued)
SCHEDULE OF INVESTMENTSAs at 30 June 2017
Investments Currency
Quantity/Nominal
Value
Market Value USD
% of Net Assets
Units of authorised UCITS or other collective investment undertakings
Collective Investment Schemes – UCITS
LuxembourgMorgan Stanley Liquidity Funds US Dollar
Liquidity Fund – MS Reserve† USD 6,232,988 6,232,988 2.94
6,232,988 2.94
Total Collective Investment Schemes – UCITS 6,232,988 2.94
Total Units of authorised UCITS or other collective investment undertakings 6,232,988 2.94
Total Investments 208,070,118 98.02
Cash 1,039,917 0.49
Other Assets/(Liabilities) 3,165,706 1.49
Total Net Assets 212,275,741 100.00
† Managed by an affi liate of the Investment Adviser.The country disclosed within the Schedule of Investments refers to the country of risk. The country of incorporation may differ.
Financial Futures Contracts
Security DescriptionNumber of contracts Currency
Global Exposure
USD
Unrealised Gain/(Loss)
USD
% of Net Assets
Euro-Bobl, 07/09/2017 (67) EUR (10,077,306) 95,639 0.05 US 10 Year Note, 20/09/2017 (146) USD (18,368,625) 1,190 0.00
Unrealised Gain on Financial Futures Contracts 96,829 0.05
Total Unrealised Gain on Financial Futures Contracts 96,829 0.05
Net Unrealised Gain on Financial Futures Contracts 96,829 0.05
Forward Currency Exchange Contracts (continued)
Currency Purchased
Amount Purchased
Currency Sold
Amount Sold
Maturity Date Counterparty
Unrealised Gain/(Loss)
USD
% of Net Assets
EUR 6,200,000 USD 7,024,221 03/07/2017 J.P. Morgan 55,931 0.03 PEN 12,200,000 USD 3,741,627 03/07/2017 J.P. Morgan 21,481 0.00 USD 3,603,379 IDR 47,993,400,000 03/07/2017 J.P. Morgan 2,974 0.00 USD 1,082,426 KRW 1,218,000,000 03/07/2017 J.P. Morgan 17,545 0.01 USD 1,387,909 MYR 5,900,000 03/07/2017 J.P. Morgan 13,418 0.01 BRL 6,400,000 USD 1,914,210 05/07/2017 J.P. Morgan 18,729 0.01 PLN 33,664,418 USD 9,037,639 05/07/2017 J.P. Morgan 62,282 0.03 USD 3,553,506 BRL 11,745,000 05/07/2017 J.P. Morgan 6,261 0.00 CLP 2,186,830,000 USD 3,266,363 07/07/2017 J.P. Morgan 25,363 0.01 USD 2,928,970 CLP 1,936,830,000 07/07/2017 J.P. Morgan 13,556 0.00 UYU 59,400,000 USD 2,087,507 07/07/2017 J.P. Morgan 12,119 0.01 USD 2,039,555 ARS 33,000,000 10/07/2017 J.P. Morgan 55,898 0.03 USD 1,476,323 RUB 84,800,000 10/07/2017 J.P. Morgan 47,045 0.02 THB 500,276,508 USD 14,701,043 11/07/2017 J.P. Morgan 39,201 0.02 USD 4,251,958 COP 12,570,000,000 13/07/2017 J.P. Morgan 147,740 0.07 USD 4,433,372 INR 286,785,962 13/07/2017 J.P. Morgan 2,362 0.00 TRY 20,764,608 USD 5,860,215 14/07/2017 J.P. Morgan 20,418 0.01 USD 1,080,791 TRY 3,800,000 14/07/2017 J.P. Morgan 4,614 0.00 CZK 218,400,000 USD 9,372,988 17/07/2017 J.P. Morgan 175,389 0.08 MXN 22,900,000 USD 1,259,487 17/07/2017 J.P. Morgan 8,435 0.01 HUF 1,056,212,907 USD 3,808,643 24/07/2017 J.P. Morgan 97,846 0.05 RON 14,067,000 USD 3,412,250 24/07/2017 J.P. Morgan 115,106 0.05 USD 1,136,993 ZAR 14,928,829 24/07/2017 J.P. Morgan 2,693 0.00 USD 1,070,195 KRW 1,218,000,000 28/07/2017 J.P. Morgan 5,359 0.00 MYR 19,158,624 USD 4,446,704 31/07/2017 J.P. Morgan 5,707 0.00 USD 5,241,102 IDR 69,993,400,000 31/07/2017 J.P. Morgan 10,705 0.01 USD 51,548 RUB 3,061,077 31/07/2017 J.P. Morgan 188 0.00 PLN 33,664,418 USD 9,047,264 03/08/2017 J.P. Morgan 51,195 0.03 USD 1,914,791 ARS 32,149,333 03/08/2017 J.P. Morgan 972 0.00
Unrealised Gain on Forward Currency Exchange Contracts 1,040,532 0.49
EUR Hedged Share ClassEUR 23,107,488 USD 26,191,882 07/07/2017 J.P. Morgan 199,965 0.09
Unrealised Gain on NAV Hedged Share Classes Forward Currency Exchange Contracts 199,965 0.09
Total Unrealised Gain on Forward Currency Exchange Contracts 1,240,497 0.58
DERIVATIVES
Over-the-counter (OTC) and exchange traded derivatives as at 30 June 2017, expressed in US Dollars.
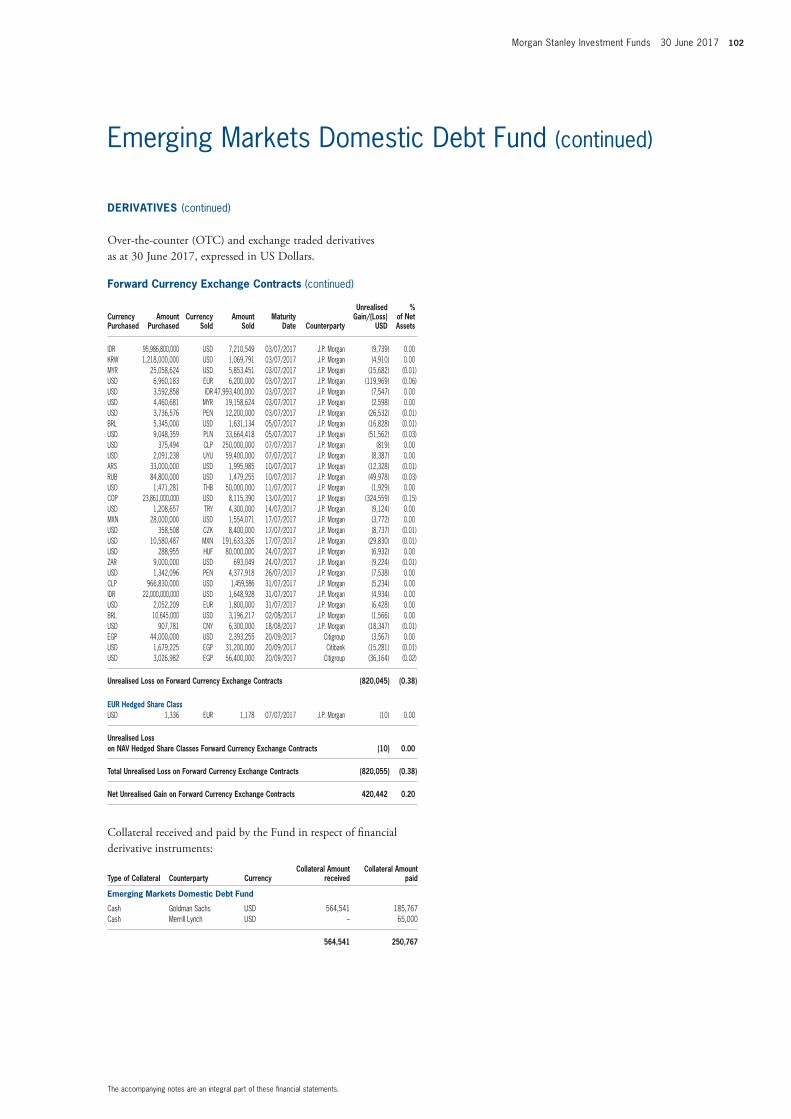
Morgan Stanley Investment Funds 30 June 2017 102
The accompanying notes are an integral part of these fi nancial statements.
Emerging Markets Domestic Debt Fund (continued)
Forward Currency Exchange Contracts (continued)
Currency Purchased
Amount Purchased
Currency Sold
Amount Sold
Maturity Date Counterparty
Unrealised Gain/(Loss)
USD
% of Net Assets
IDR 95,986,800,000 USD 7,210,549 03/07/2017 J.P. Morgan (9,739) 0.00 KRW 1,218,000,000 USD 1,069,791 03/07/2017 J.P. Morgan (4,910) 0.00 MYR 25,058,624 USD 5,853,451 03/07/2017 J.P. Morgan (15,682) (0.01) USD 6,960,183 EUR 6,200,000 03/07/2017 J.P. Morgan (119,969) (0.06) USD 3,592,858 IDR 47,993,400,000 03/07/2017 J.P. Morgan (7,547) 0.00 USD 4,460,681 MYR 19,158,624 03/07/2017 J.P. Morgan (2,598) 0.00 USD 3,736,576 PEN 12,200,000 03/07/2017 J.P. Morgan (26,532) (0.01) BRL 5,345,000 USD 1,631,134 05/07/2017 J.P. Morgan (16,828) (0.01) USD 9,048,359 PLN 33,664,418 05/07/2017 J.P. Morgan (51,562) (0.03) USD 375,494 CLP 250,000,000 07/07/2017 J.P. Morgan (819) 0.00 USD 2,091,238 UYU 59,400,000 07/07/2017 J.P. Morgan (8,387) 0.00 ARS 33,000,000 USD 1,995,985 10/07/2017 J.P. Morgan (12,328) (0.01) RUB 84,800,000 USD 1,479,255 10/07/2017 J.P. Morgan (49,978) (0.03) USD 1,471,281 THB 50,000,000 11/07/2017 J.P. Morgan (1,929) 0.00 COP 23,861,000,000 USD 8,115,390 13/07/2017 J.P. Morgan (324,559) (0.15) USD 1,208,657 TRY 4,300,000 14/07/2017 J.P. Morgan (9,124) 0.00 MXN 28,000,000 USD 1,554,071 17/07/2017 J.P. Morgan (3,772) 0.00 USD 358,508 CZK 8,400,000 17/07/2017 J.P. Morgan (8,737) (0.01) USD 10,580,487 MXN 191,633,326 17/07/2017 J.P. Morgan (29,830) (0.01) USD 288,955 HUF 80,000,000 24/07/2017 J.P. Morgan (6,932) 0.00 ZAR 9,000,000 USD 693,049 24/07/2017 J.P. Morgan (9,224) (0.01) USD 1,342,096 PEN 4,377,918 26/07/2017 J.P. Morgan (7,538) 0.00 CLP 966,830,000 USD 1,459,586 31/07/2017 J.P. Morgan (5,234) 0.00 IDR 22,000,000,000 USD 1,648,928 31/07/2017 J.P. Morgan (4,934) 0.00 USD 2,052,209 EUR 1,800,000 31/07/2017 J.P. Morgan (6,428) 0.00 BRL 10,645,000 USD 3,196,217 02/08/2017 J.P. Morgan (1,566) 0.00 USD 907,781 CNY 6,300,000 18/08/2017 J.P. Morgan (18,347) (0.01) EGP 44,000,000 USD 2,393,255 20/09/2017 Citigroup (3,567) 0.00 USD 1,679,225 EGP 31,200,000 20/09/2017 Citibank (15,281) (0.01) USD 3,026,982 EGP 56,400,000 20/09/2017 Citigroup (36,164) (0.02)
Unrealised Loss on Forward Currency Exchange Contracts (820,045) (0.38)
EUR Hedged Share ClassUSD 1,336 EUR 1,178 07/07/2017 J.P. Morgan (10) 0.00
Unrealised Loss on NAV Hedged Share Classes Forward Currency Exchange Contracts (10) 0.00
Total Unrealised Loss on Forward Currency Exchange Contracts (820,055) (0.38)
Net Unrealised Gain on Forward Currency Exchange Contracts 420,442 0.20
Collateral received and paid by the Fund in respect of fi nancial derivative instruments:
Type of Collateral Counterparty CurrencyCollateral Amount
receivedCollateral Amount
paid
Emerging Markets Domestic Debt Fund
Cash Goldman Sachs USD 564,541 185,767Cash Merrill Lynch USD – 65,000
564,541 250,767
DERIVATIVES (continued)
Over-the-counter (OTC) and exchange traded derivatives as at 30 June 2017, expressed in US Dollars.
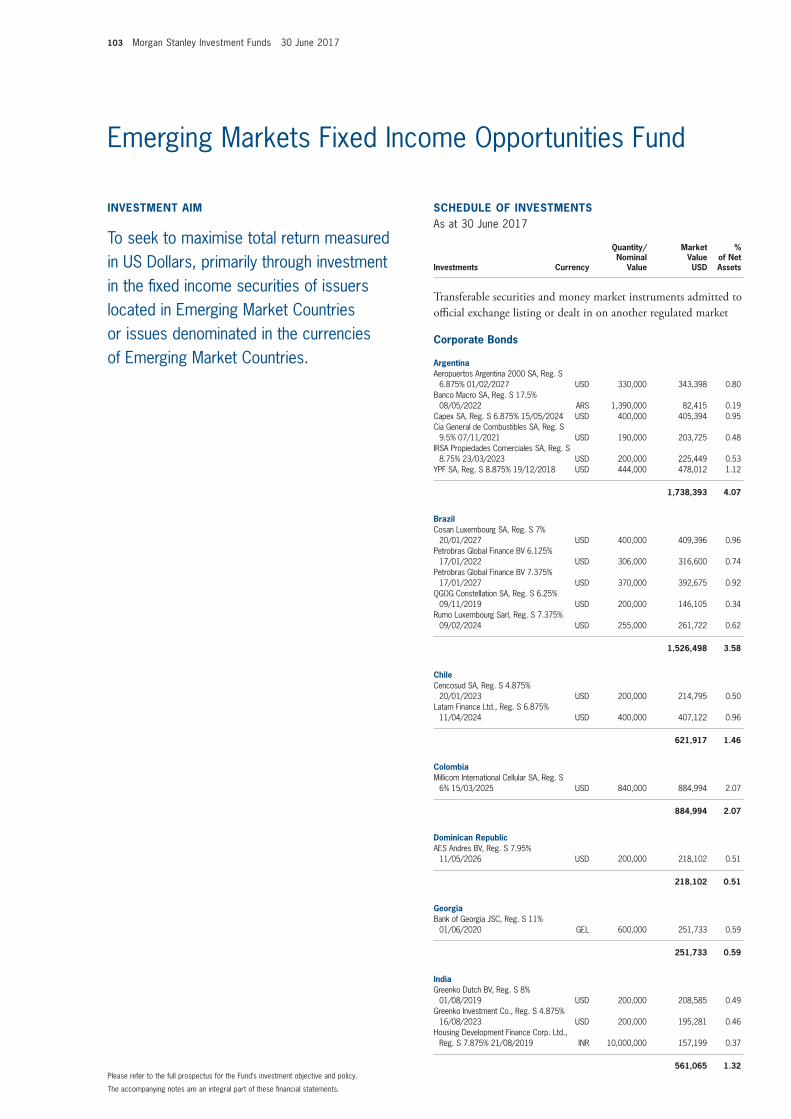
103 Morgan Stanley Investment Funds 30 June 2017
The accompanying notes are an integral part of these fi nancial statements.
Please refer to the full prospectus for the Fund’s investment objective and policy.
INVESTMENT AIM
To seek to maximise total return measured in US Dollars, primarily through investment in the fi xed income securities of issuers located in Emerging Market Countries or issues denominated in the currencies of Emerging Market Countries.
SCHEDULE OF INVESTMENTSAs at 30 June 2017
Investments Currency
Quantity/Nominal
Value
Market Value USD
% of Net Assets
Transferable securities and money market instruments admitted to offi cial exchange listing or dealt in on another regulated market
Corporate Bonds
ArgentinaAeropuertos Argentina 2000 SA, Reg. S
6.875% 01/02/2027 USD 330,000 343,398 0.80 Banco Macro SA, Reg. S 17.5%
08/05/2022 ARS 1,390,000 82,415 0.19 Capex SA, Reg. S 6.875% 15/05/2024 USD 400,000 405,394 0.95 Cia General de Combustibles SA, Reg. S
9.5% 07/11/2021 USD 190,000 203,725 0.48 IRSA Propiedades Comerciales SA, Reg. S
8.75% 23/03/2023 USD 200,000 225,449 0.53 YPF SA, Reg. S 8.875% 19/12/2018 USD 444,000 478,012 1.12
1,738,393 4.07
BrazilCosan Luxembourg SA, Reg. S 7%
20/01/2027 USD 400,000 409,396 0.96 Petrobras Global Finance BV 6.125%
17/01/2022 USD 306,000 316,600 0.74 Petrobras Global Finance BV 7.375%
17/01/2027 USD 370,000 392,675 0.92 QGOG Constellation SA, Reg. S 6.25%
09/11/2019 USD 200,000 146,105 0.34 Rumo Luxembourg Sarl, Reg. S 7.375%
09/02/2024 USD 255,000 261,722 0.62
1,526,498 3.58
ChileCencosud SA, Reg. S 4.875%
20/01/2023 USD 200,000 214,795 0.50 Latam Finance Ltd., Reg. S 6.875%
11/04/2024 USD 400,000 407,122 0.96
621,917 1.46
ColombiaMillicom International Cellular SA, Reg. S
6% 15/03/2025 USD 840,000 884,994 2.07
884,994 2.07
Dominican RepublicAES Andres BV, Reg. S 7.95%
11/05/2026 USD 200,000 218,102 0.51
218,102 0.51
GeorgiaBank of Georgia JSC, Reg. S 11%
01/06/2020 GEL 600,000 251,733 0.59
251,733 0.59
IndiaGreenko Dutch BV, Reg. S 8%
01/08/2019 USD 200,000 208,585 0.49 Greenko Investment Co., Reg. S 4.875%
16/08/2023 USD 200,000 195,281 0.46 Housing Development Finance Corp. Ltd.,
Reg. S 7.875% 21/08/2019 INR 10,000,000 157,199 0.37
561,065 1.32
Emerging Markets Fixed Income Opportunities Fund
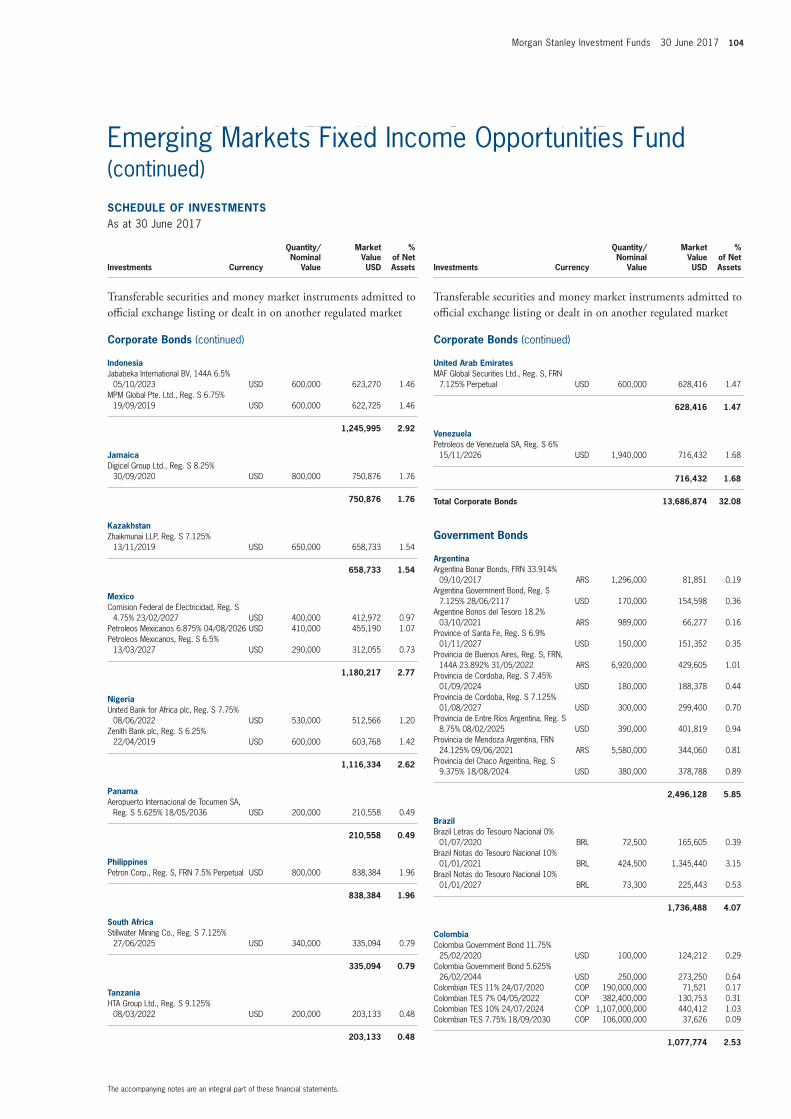
Morgan Stanley Investment Funds 30 June 2017 104
The accompanying notes are an integral part of these fi nancial statements.
Emerging Markets Fixed Income Opportunities Fund (continued)
SCHEDULE OF INVESTMENTSAs at 30 June 2017
Investments Currency
Quantity/Nominal
Value
Market Value USD
% of Net Assets
Transferable securities and money market instruments admitted to offi cial exchange listing or dealt in on another regulated market
Corporate Bonds (continued)
IndonesiaJababeka International BV, 144A 6.5%
05/10/2023 USD 600,000 623,270 1.46 MPM Global Pte. Ltd., Reg. S 6.75%
19/09/2019 USD 600,000 622,725 1.46
1,245,995 2.92
JamaicaDigicel Group Ltd., Reg. S 8.25%
30/09/2020 USD 800,000 750,876 1.76
750,876 1.76
KazakhstanZhaikmunai LLP, Reg. S 7.125%
13/11/2019 USD 650,000 658,733 1.54
658,733 1.54
MexicoComision Federal de Electricidad, Reg. S
4.75% 23/02/2027 USD 400,000 412,972 0.97 Petroleos Mexicanos 6.875% 04/08/2026 USD 410,000 455,190 1.07 Petroleos Mexicanos, Reg. S 6.5%
13/03/2027 USD 290,000 312,055 0.73
1,180,217 2.77
NigeriaUnited Bank for Africa plc, Reg. S 7.75%
08/06/2022 USD 530,000 512,566 1.20 Zenith Bank plc, Reg. S 6.25%
22/04/2019 USD 600,000 603,768 1.42
1,116,334 2.62
PanamaAeropuerto Internacional de Tocumen SA,
Reg. S 5.625% 18/05/2036 USD 200,000 210,558 0.49
210,558 0.49
PhilippinesPetron Corp., Reg. S, FRN 7.5% Perpetual USD 800,000 838,384 1.96
838,384 1.96
South AfricaStillwater Mining Co., Reg. S 7.125%
27/06/2025 USD 340,000 335,094 0.79
335,094 0.79
TanzaniaHTA Group Ltd., Reg. S 9.125%
08/03/2022 USD 200,000 203,133 0.48
203,133 0.48
SCHEDULE OF INVESTMENTSAs at 30 June 2017
Investments Currency
Quantity/Nominal
Value
Market Value USD
% of Net Assets
Transferable securities and money market instruments admitted to offi cial exchange listing or dealt in on another regulated market
Corporate Bonds (continued)
United Arab EmiratesMAF Global Securities Ltd., Reg. S, FRN
7.125% Perpetual USD 600,000 628,416 1.47
628,416 1.47
VenezuelaPetroleos de Venezuela SA, Reg. S 6%
15/11/2026 USD 1,940,000 716,432 1.68
716,432 1.68
Total Corporate Bonds 13,686,874 32.08
Government Bonds
ArgentinaArgentina Bonar Bonds, FRN 33.914%
09/10/2017 ARS 1,296,000 81,851 0.19 Argentina Government Bond, Reg. S
7.125% 28/06/2117 USD 170,000 154,598 0.36 Argentine Bonos del Tesoro 18.2%
03/10/2021 ARS 989,000 66,277 0.16 Province of Santa Fe, Reg. S 6.9%
01/11/2027 USD 150,000 151,352 0.35 Provincia de Buenos Aires, Reg. S, FRN,
144A 23.892% 31/05/2022 ARS 6,920,000 429,605 1.01 Provincia de Cordoba, Reg. S 7.45%
01/09/2024 USD 180,000 188,378 0.44 Provincia de Cordoba, Reg. S 7.125%
01/08/2027 USD 300,000 299,400 0.70 Provincia de Entre Rios Argentina, Reg. S
8.75% 08/02/2025 USD 390,000 401,819 0.94 Provincia de Mendoza Argentina, FRN
24.125% 09/06/2021 ARS 5,580,000 344,060 0.81 Provincia del Chaco Argentina, Reg. S
9.375% 18/08/2024 USD 380,000 378,788 0.89
2,496,128 5.85
BrazilBrazil Letras do Tesouro Nacional 0%
01/07/2020 BRL 72,500 165,605 0.39 Brazil Notas do Tesouro Nacional 10%
01/01/2021 BRL 424,500 1,345,440 3.15 Brazil Notas do Tesouro Nacional 10%
01/01/2027 BRL 73,300 225,443 0.53
1,736,488 4.07
ColombiaColombia Government Bond 11.75%
25/02/2020 USD 100,000 124,212 0.29 Colombia Government Bond 5.625%
26/02/2044 USD 250,000 273,250 0.64 Colombian TES 11% 24/07/2020 COP 190,000,000 71,521 0.17 Colombian TES 7% 04/05/2022 COP 382,400,000 130,753 0.31 Colombian TES 10% 24/07/2024 COP 1,107,000,000 440,412 1.03 Colombian TES 7.75% 18/09/2030 COP 106,000,000 37,626 0.09
1,077,774 2.53
Emerging Markets Fixed Income Opportunities Fund (continued)
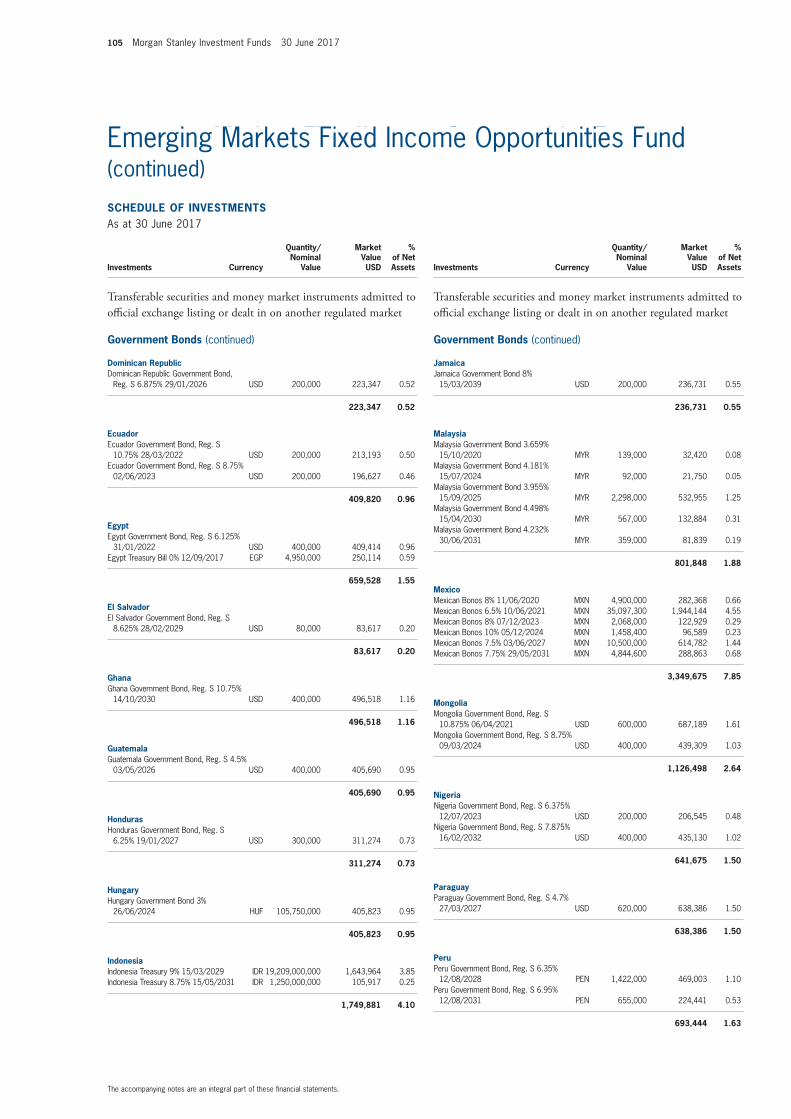
105 Morgan Stanley Investment Funds 30 June 2017
The accompanying notes are an integral part of these fi nancial statements.
Emerging Markets Fixed Income Opportunities Fund (continued)
SCHEDULE OF INVESTMENTSAs at 30 June 2017
Investments Currency
Quantity/Nominal
Value
Market Value USD
% of Net Assets
Transferable securities and money market instruments admitted to offi cial exchange listing or dealt in on another regulated market
Government Bonds (continued)
Dominican RepublicDominican Republic Government Bond,
Reg. S 6.875% 29/01/2026 USD 200,000 223,347 0.52
223,347 0.52
EcuadorEcuador Government Bond, Reg. S
10.75% 28/03/2022 USD 200,000 213,193 0.50 Ecuador Government Bond, Reg. S 8.75%
02/06/2023 USD 200,000 196,627 0.46
409,820 0.96
EgyptEgypt Government Bond, Reg. S 6.125%
31/01/2022 USD 400,000 409,414 0.96 Egypt Treasury Bill 0% 12/09/2017 EGP 4,950,000 250,114 0.59
659,528 1.55
El SalvadorEl Salvador Government Bond, Reg. S
8.625% 28/02/2029 USD 80,000 83,617 0.20
83,617 0.20
GhanaGhana Government Bond, Reg. S 10.75%
14/10/2030 USD 400,000 496,518 1.16
496,518 1.16
GuatemalaGuatemala Government Bond, Reg. S 4.5%
03/05/2026 USD 400,000 405,690 0.95
405,690 0.95
HondurasHonduras Government Bond, Reg. S
6.25% 19/01/2027 USD 300,000 311,274 0.73
311,274 0.73
HungaryHungary Government Bond 3%
26/06/2024 HUF 105,750,000 405,823 0.95
405,823 0.95
IndonesiaIndonesia Treasury 9% 15/03/2029 IDR 19,209,000,000 1,643,964 3.85 Indonesia Treasury 8.75% 15/05/2031 IDR 1,250,000,000 105,917 0.25
1,749,881 4.10
SCHEDULE OF INVESTMENTSAs at 30 June 2017
Investments Currency
Quantity/Nominal
Value
Market Value USD
% of Net Assets
Transferable securities and money market instruments admitted to offi cial exchange listing or dealt in on another regulated market
Government Bonds (continued)
JamaicaJamaica Government Bond 8%
15/03/2039 USD 200,000 236,731 0.55
236,731 0.55
MalaysiaMalaysia Government Bond 3.659%
15/10/2020 MYR 139,000 32,420 0.08 Malaysia Government Bond 4.181%
15/07/2024 MYR 92,000 21,750 0.05 Malaysia Government Bond 3.955%
15/09/2025 MYR 2,298,000 532,955 1.25 Malaysia Government Bond 4.498%
15/04/2030 MYR 567,000 132,884 0.31 Malaysia Government Bond 4.232%
30/06/2031 MYR 359,000 81,839 0.19
801,848 1.88
MexicoMexican Bonos 8% 11/06/2020 MXN 4,900,000 282,368 0.66 Mexican Bonos 6.5% 10/06/2021 MXN 35,097,300 1,944,144 4.55 Mexican Bonos 8% 07/12/2023 MXN 2,068,000 122,929 0.29 Mexican Bonos 10% 05/12/2024 MXN 1,458,400 96,589 0.23 Mexican Bonos 7.5% 03/06/2027 MXN 10,500,000 614,782 1.44 Mexican Bonos 7.75% 29/05/2031 MXN 4,844,600 288,863 0.68
3,349,675 7.85
MongoliaMongolia Government Bond, Reg. S
10.875% 06/04/2021 USD 600,000 687,189 1.61 Mongolia Government Bond, Reg. S 8.75%
09/03/2024 USD 400,000 439,309 1.03
1,126,498 2.64
NigeriaNigeria Government Bond, Reg. S 6.375%
12/07/2023 USD 200,000 206,545 0.48 Nigeria Government Bond, Reg. S 7.875%
16/02/2032 USD 400,000 435,130 1.02
641,675 1.50
ParaguayParaguay Government Bond, Reg. S 4.7%
27/03/2027 USD 620,000 638,386 1.50
638,386 1.50
PeruPeru Government Bond, Reg. S 6.35%
12/08/2028 PEN 1,422,000 469,003 1.10 Peru Government Bond, Reg. S 6.95%
12/08/2031 PEN 655,000 224,441 0.53
693,444 1.63
Emerging Markets Fixed Income Opportunities Fund (continued)
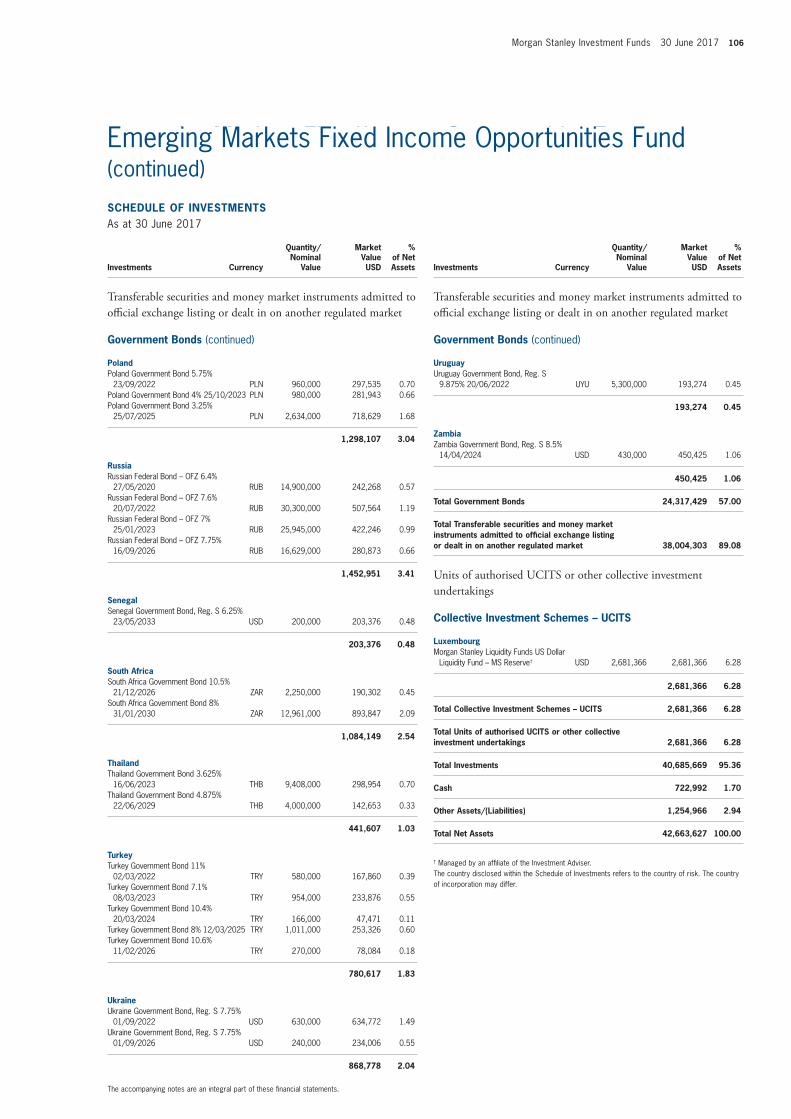
Morgan Stanley Investment Funds 30 June 2017 106
The accompanying notes are an integral part of these fi nancial statements.
Emerging Markets Fixed Income Opportunities Fund (continued)
SCHEDULE OF INVESTMENTSAs at 30 June 2017
Investments Currency
Quantity/Nominal
Value
Market Value USD
% of Net Assets
Transferable securities and money market instruments admitted to offi cial exchange listing or dealt in on another regulated market
Government Bonds (continued)
PolandPoland Government Bond 5.75%
23/09/2022 PLN 960,000 297,535 0.70 Poland Government Bond 4% 25/10/2023 PLN 980,000 281,943 0.66 Poland Government Bond 3.25%
25/07/2025 PLN 2,634,000 718,629 1.68
1,298,107 3.04
RussiaRussian Federal Bond – OFZ 6.4%
27/05/2020 RUB 14,900,000 242,268 0.57 Russian Federal Bond – OFZ 7.6%
20/07/2022 RUB 30,300,000 507,564 1.19 Russian Federal Bond – OFZ 7%
25/01/2023 RUB 25,945,000 422,246 0.99 Russian Federal Bond – OFZ 7.75%
16/09/2026 RUB 16,629,000 280,873 0.66
1,452,951 3.41
SenegalSenegal Government Bond, Reg. S 6.25%
23/05/2033 USD 200,000 203,376 0.48
203,376 0.48
South AfricaSouth Africa Government Bond 10.5%
21/12/2026 ZAR 2,250,000 190,302 0.45 South Africa Government Bond 8%
31/01/2030 ZAR 12,961,000 893,847 2.09
1,084,149 2.54
ThailandThailand Government Bond 3.625%
16/06/2023 THB 9,408,000 298,954 0.70 Thailand Government Bond 4.875%
22/06/2029 THB 4,000,000 142,653 0.33
441,607 1.03
TurkeyTurkey Government Bond 11%
02/03/2022 TRY 580,000 167,860 0.39 Turkey Government Bond 7.1%
08/03/2023 TRY 954,000 233,876 0.55 Turkey Government Bond 10.4%
20/03/2024 TRY 166,000 47,471 0.11 Turkey Government Bond 8% 12/03/2025 TRY 1,011,000 253,326 0.60 Turkey Government Bond 10.6%
11/02/2026 TRY 270,000 78,084 0.18
780,617 1.83
UkraineUkraine Government Bond, Reg. S 7.75%
01/09/2022 USD 630,000 634,772 1.49 Ukraine Government Bond, Reg. S 7.75%
01/09/2026 USD 240,000 234,006 0.55
868,778 2.04
Emerging Markets Fixed Income Opportunities Fund (continued)
SCHEDULE OF INVESTMENTSAs at 30 June 2017
Investments Currency
Quantity/Nominal
Value
Market Value USD
% of Net Assets
Transferable securities and money market instruments admitted to offi cial exchange listing or dealt in on another regulated market
Government Bonds (continued)
UruguayUruguay Government Bond, Reg. S
9.875% 20/06/2022 UYU 5,300,000 193,274 0.45
193,274 0.45
ZambiaZambia Government Bond, Reg. S 8.5%
14/04/2024 USD 430,000 450,425 1.06
450,425 1.06
Total Government Bonds 24,317,429 57.00
Total Transferable securities and money market instruments admitted to offi cial exchange listing or dealt in on another regulated market 38,004,303 89.08
Units of authorised UCITS or other collective investment undertakings
Collective Investment Schemes – UCITS
LuxembourgMorgan Stanley Liquidity Funds US Dollar
Liquidity Fund – MS Reserve† USD 2,681,366 2,681,366 6.28
2,681,366 6.28
Total Collective Investment Schemes – UCITS 2,681,366 6.28
Total Units of authorised UCITS or other collective investment undertakings 2,681,366 6.28
Total Investments 40,685,669 95.36
Cash 722,992 1.70
Other Assets/(Liabilities) 1,254,966 2.94
Total Net Assets 42,663,627 100.00
† Managed by an affi liate of the Investment Adviser.The country disclosed within the Schedule of Investments refers to the country of risk. The country of incorporation may differ.
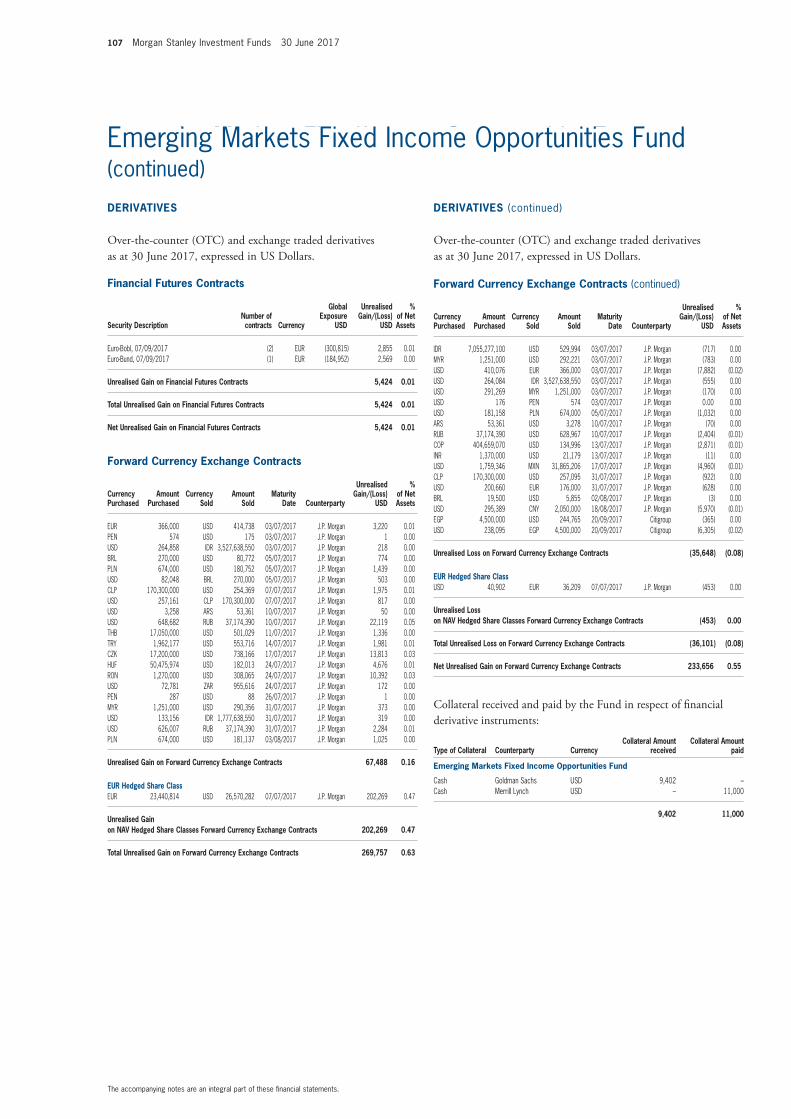
107 Morgan Stanley Investment Funds 30 June 2017
The accompanying notes are an integral part of these fi nancial statements.
Emerging Markets Fixed Income Opportunities Fund (continued)
Financial Futures Contracts
Security DescriptionNumber of contracts Currency
Global Exposure
USD
Unrealised Gain/(Loss)
USD
% of Net Assets
Euro-Bobl, 07/09/2017 (2) EUR (300,815) 2,855 0.01 Euro-Bund, 07/09/2017 (1) EUR (184,952) 2,569 0.00
Unrealised Gain on Financial Futures Contracts 5,424 0.01
Total Unrealised Gain on Financial Futures Contracts 5,424 0.01
Net Unrealised Gain on Financial Futures Contracts 5,424 0.01
Forward Currency Exchange Contracts (continued)
Currency Purchased
Amount Purchased
Currency Sold
Amount Sold
Maturity Date Counterparty
Unrealised Gain/(Loss)
USD
% of Net Assets
EUR 366,000 USD 414,738 03/07/2017 J.P. Morgan 3,220 0.01 PEN 574 USD 175 03/07/2017 J.P. Morgan 1 0.00 USD 264,858 IDR 3,527,638,550 03/07/2017 J.P. Morgan 218 0.00 BRL 270,000 USD 80,772 05/07/2017 J.P. Morgan 774 0.00 PLN 674,000 USD 180,752 05/07/2017 J.P. Morgan 1,439 0.00 USD 82,048 BRL 270,000 05/07/2017 J.P. Morgan 503 0.00 CLP 170,300,000 USD 254,369 07/07/2017 J.P. Morgan 1,975 0.01 USD 257,161 CLP 170,300,000 07/07/2017 J.P. Morgan 817 0.00 USD 3,258 ARS 53,361 10/07/2017 J.P. Morgan 50 0.00 USD 648,682 RUB 37,174,390 10/07/2017 J.P. Morgan 22,119 0.05 THB 17,050,000 USD 501,029 11/07/2017 J.P. Morgan 1,336 0.00 TRY 1,962,177 USD 553,716 14/07/2017 J.P. Morgan 1,981 0.01 CZK 17,200,000 USD 738,166 17/07/2017 J.P. Morgan 13,813 0.03 HUF 50,475,974 USD 182,013 24/07/2017 J.P. Morgan 4,676 0.01 RON 1,270,000 USD 308,065 24/07/2017 J.P. Morgan 10,392 0.03 USD 72,781 ZAR 955,616 24/07/2017 J.P. Morgan 172 0.00 PEN 287 USD 88 26/07/2017 J.P. Morgan 1 0.00 MYR 1,251,000 USD 290,356 31/07/2017 J.P. Morgan 373 0.00 USD 133,156 IDR 1,777,638,550 31/07/2017 J.P. Morgan 319 0.00 USD 626,007 RUB 37,174,390 31/07/2017 J.P. Morgan 2,284 0.01 PLN 674,000 USD 181,137 03/08/2017 J.P. Morgan 1,025 0.00
Unrealised Gain on Forward Currency Exchange Contracts 67,488 0.16
EUR Hedged Share ClassEUR 23,440,814 USD 26,570,282 07/07/2017 J.P. Morgan 202,269 0.47
Unrealised Gain on NAV Hedged Share Classes Forward Currency Exchange Contracts 202,269 0.47
Total Unrealised Gain on Forward Currency Exchange Contracts 269,757 0.63
Emerging Markets Fixed Income Opportunities Fund (continued)
Forward Currency Exchange Contracts (continued)
Currency Purchased
Amount Purchased
Currency Sold
Amount Sold
Maturity Date Counterparty
Unrealised Gain/(Loss)
USD
% of Net Assets
IDR 7,055,277,100 USD 529,994 03/07/2017 J.P. Morgan (717) 0.00 MYR 1,251,000 USD 292,221 03/07/2017 J.P. Morgan (783) 0.00 USD 410,076 EUR 366,000 03/07/2017 J.P. Morgan (7,882) (0.02) USD 264,084 IDR 3,527,638,550 03/07/2017 J.P. Morgan (555) 0.00 USD 291,269 MYR 1,251,000 03/07/2017 J.P. Morgan (170) 0.00 USD 176 PEN 574 03/07/2017 J.P. Morgan 0.00 0.00 USD 181,158 PLN 674,000 05/07/2017 J.P. Morgan (1,032) 0.00 ARS 53,361 USD 3,278 10/07/2017 J.P. Morgan (70) 0.00 RUB 37,174,390 USD 628,967 10/07/2017 J.P. Morgan (2,404) (0.01) COP 404,659,070 USD 134,996 13/07/2017 J.P. Morgan (2,871) (0.01) INR 1,370,000 USD 21,179 13/07/2017 J.P. Morgan (11) 0.00 USD 1,759,346 MXN 31,865,206 17/07/2017 J.P. Morgan (4,960) (0.01) CLP 170,300,000 USD 257,095 31/07/2017 J.P. Morgan (922) 0.00 USD 200,660 EUR 176,000 31/07/2017 J.P. Morgan (628) 0.00 BRL 19,500 USD 5,855 02/08/2017 J.P. Morgan (3) 0.00 USD 295,389 CNY 2,050,000 18/08/2017 J.P. Morgan (5,970) (0.01) EGP 4,500,000 USD 244,765 20/09/2017 Citigroup (365) 0.00 USD 238,095 EGP 4,500,000 20/09/2017 Citigroup (6,305) (0.02)
Unrealised Loss on Forward Currency Exchange Contracts (35,648) (0.08)
EUR Hedged Share ClassUSD 40,902 EUR 36,209 07/07/2017 J.P. Morgan (453) 0.00
Unrealised Loss on NAV Hedged Share Classes Forward Currency Exchange Contracts (453) 0.00
Total Unrealised Loss on Forward Currency Exchange Contracts (36,101) (0.08)
Net Unrealised Gain on Forward Currency Exchange Contracts 233,656 0.55
Collateral received and paid by the Fund in respect of fi nancial derivative instruments:
Type of Collateral Counterparty CurrencyCollateral Amount
receivedCollateral Amount
paid
Emerging Markets Fixed Income Opportunities Fund
Cash Goldman Sachs USD 9,402 –Cash Merrill Lynch USD – 11,000
9,402 11,000
DERIVATIVES
Over-the-counter (OTC) and exchange traded derivatives as at 30 June 2017, expressed in US Dollars.
DERIVATIVES (continued)
Over-the-counter (OTC) and exchange traded derivatives as at 30 June 2017, expressed in US Dollars.
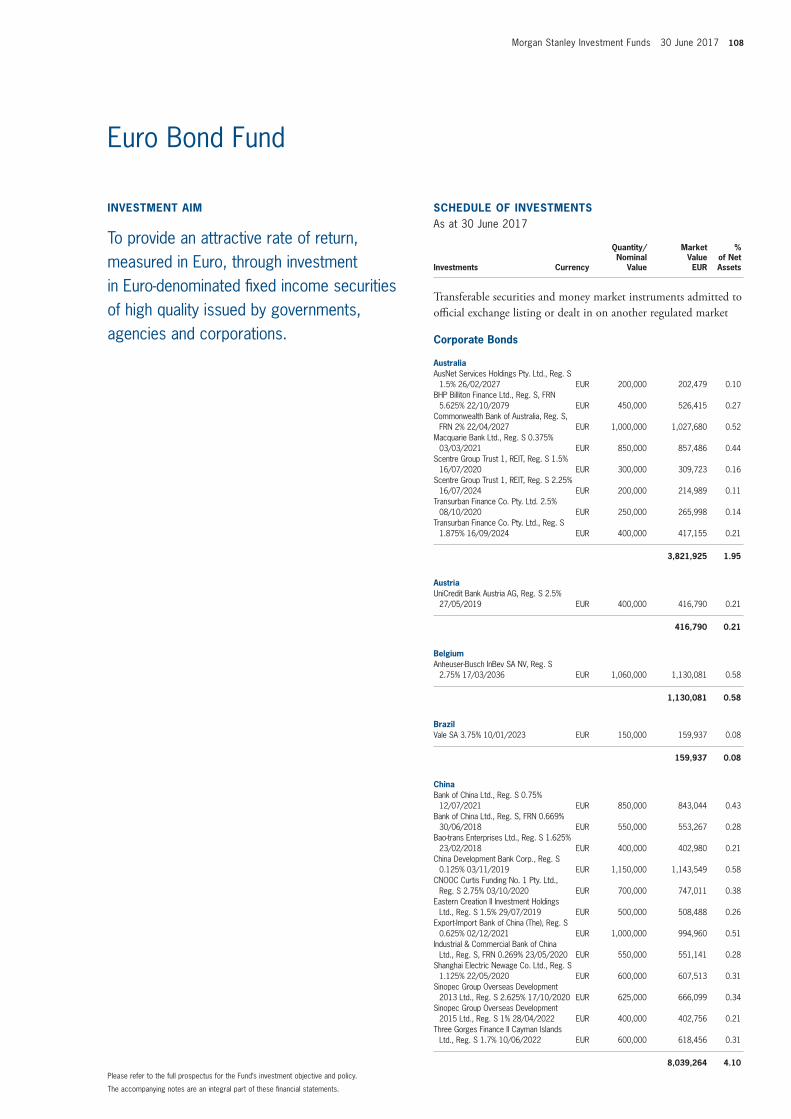
Morgan Stanley Investment Funds 30 June 2017 108
The accompanying notes are an integral part of these fi nancial statements.
Please refer to the full prospectus for the Fund’s investment objective and policy.
INVESTMENT AIM
To provide an attractive rate of return, measured in Euro, through investment in Euro-denominated fi xed income securities of high quality issued by governments, agencies and corporations.
SCHEDULE OF INVESTMENTSAs at 30 June 2017
Investments Currency
Quantity/Nominal
Value
Market Value EUR
% of Net Assets
Transferable securities and money market instruments admitted to offi cial exchange listing or dealt in on another regulated market
Corporate Bonds
AustraliaAusNet Services Holdings Pty. Ltd., Reg. S
1.5% 26/02/2027 EUR 200,000 202,479 0.10 BHP Billiton Finance Ltd., Reg. S, FRN
5.625% 22/10/2079 EUR 450,000 526,415 0.27 Commonwealth Bank of Australia, Reg. S,
FRN 2% 22/04/2027 EUR 1,000,000 1,027,680 0.52 Macquarie Bank Ltd., Reg. S 0.375%
03/03/2021 EUR 850,000 857,486 0.44 Scentre Group Trust 1, REIT, Reg. S 1.5%
16/07/2020 EUR 300,000 309,723 0.16 Scentre Group Trust 1, REIT, Reg. S 2.25%
16/07/2024 EUR 200,000 214,989 0.11 Transurban Finance Co. Pty. Ltd. 2.5%
08/10/2020 EUR 250,000 265,998 0.14 Transurban Finance Co. Pty. Ltd., Reg. S
1.875% 16/09/2024 EUR 400,000 417,155 0.21
3,821,925 1.95
AustriaUniCredit Bank Austria AG, Reg. S 2.5%
27/05/2019 EUR 400,000 416,790 0.21
416,790 0.21
BelgiumAnheuser-Busch InBev SA NV, Reg. S
2.75% 17/03/2036 EUR 1,060,000 1,130,081 0.58
1,130,081 0.58
BrazilVale SA 3.75% 10/01/2023 EUR 150,000 159,937 0.08
159,937 0.08
ChinaBank of China Ltd., Reg. S 0.75%
12/07/2021 EUR 850,000 843,044 0.43 Bank of China Ltd., Reg. S, FRN 0.669%
30/06/2018 EUR 550,000 553,267 0.28 Bao-trans Enterprises Ltd., Reg. S 1.625%
23/02/2018 EUR 400,000 402,980 0.21 China Development Bank Corp., Reg. S
0.125% 03/11/2019 EUR 1,150,000 1,143,549 0.58 CNOOC Curtis Funding No. 1 Pty. Ltd.,
Reg. S 2.75% 03/10/2020 EUR 700,000 747,011 0.38 Eastern Creation II Investment Holdings
Ltd., Reg. S 1.5% 29/07/2019 EUR 500,000 508,488 0.26 Export-Import Bank of China (The), Reg. S
0.625% 02/12/2021 EUR 1,000,000 994,960 0.51 Industrial & Commercial Bank of China
Ltd., Reg. S, FRN 0.269% 23/05/2020 EUR 550,000 551,141 0.28 Shanghai Electric Newage Co. Ltd., Reg. S
1.125% 22/05/2020 EUR 600,000 607,513 0.31 Sinopec Group Overseas Development
2013 Ltd., Reg. S 2.625% 17/10/2020 EUR 625,000 666,099 0.34 Sinopec Group Overseas Development
2015 Ltd., Reg. S 1% 28/04/2022 EUR 400,000 402,756 0.21 Three Gorges Finance II Cayman Islands
Ltd., Reg. S 1.7% 10/06/2022 EUR 600,000 618,456 0.31
8,039,264 4.10
Euro Bond Fund
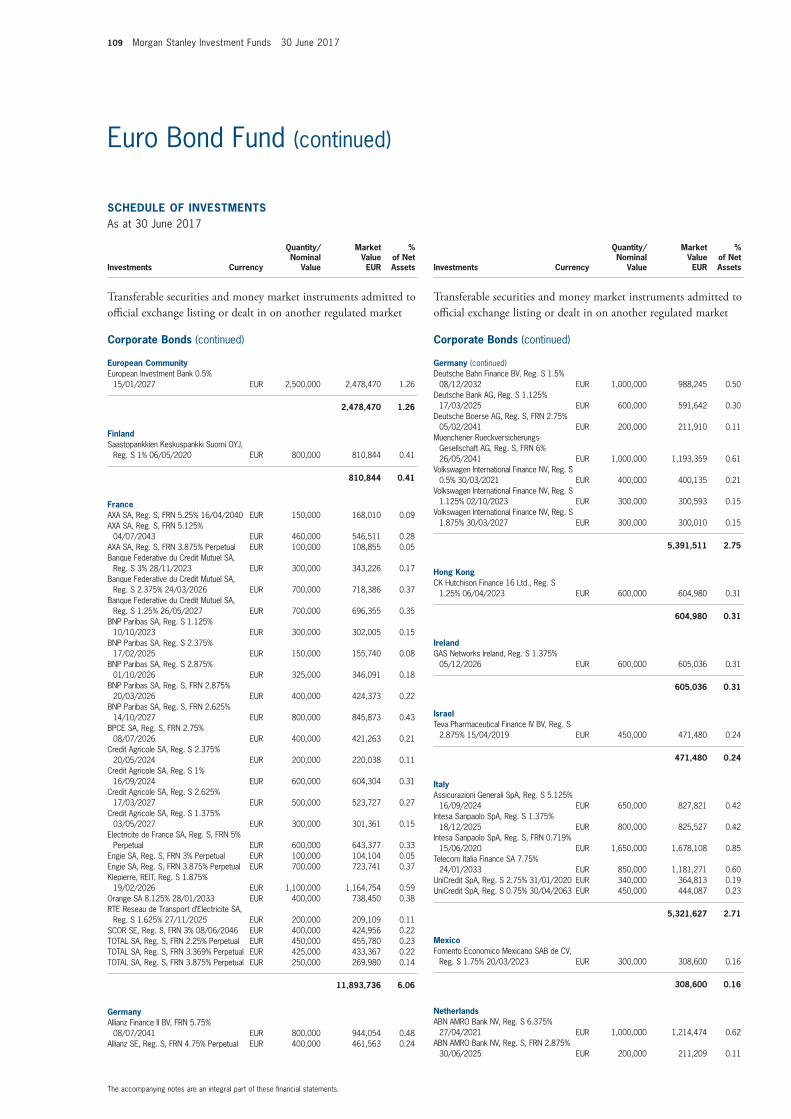
109 Morgan Stanley Investment Funds 30 June 2017
The accompanying notes are an integral part of these fi nancial statements.
Euro Bond Fund (continued)
SCHEDULE OF INVESTMENTSAs at 30 June 2017
Investments Currency
Quantity/Nominal
Value
Market Value EUR
% of Net Assets
Transferable securities and money market instruments admitted to offi cial exchange listing or dealt in on another regulated market
Corporate Bonds (continued)
European CommunityEuropean Investment Bank 0.5%
15/01/2027 EUR 2,500,000 2,478,470 1.26
2,478,470 1.26
FinlandSaastopankkien Keskuspankki Suomi OYJ,
Reg. S 1% 06/05/2020 EUR 800,000 810,844 0.41
810,844 0.41
FranceAXA SA, Reg. S, FRN 5.25% 16/04/2040 EUR 150,000 168,010 0.09 AXA SA, Reg. S, FRN 5.125%
04/07/2043 EUR 460,000 546,511 0.28 AXA SA, Reg. S, FRN 3.875% Perpetual EUR 100,000 108,855 0.05 Banque Federative du Credit Mutuel SA,
Reg. S 3% 28/11/2023 EUR 300,000 343,226 0.17 Banque Federative du Credit Mutuel SA,
Reg. S 2.375% 24/03/2026 EUR 700,000 718,386 0.37 Banque Federative du Credit Mutuel SA,
Reg. S 1.25% 26/05/2027 EUR 700,000 696,355 0.35 BNP Paribas SA, Reg. S 1.125%
10/10/2023 EUR 300,000 302,005 0.15 BNP Paribas SA, Reg. S 2.375%
17/02/2025 EUR 150,000 155,740 0.08 BNP Paribas SA, Reg. S 2.875%
01/10/2026 EUR 325,000 346,091 0.18 BNP Paribas SA, Reg. S, FRN 2.875%
20/03/2026 EUR 400,000 424,373 0.22 BNP Paribas SA, Reg. S, FRN 2.625%
14/10/2027 EUR 800,000 845,873 0.43 BPCE SA, Reg. S, FRN 2.75%
08/07/2026 EUR 400,000 421,263 0.21 Credit Agricole SA, Reg. S 2.375%
20/05/2024 EUR 200,000 220,038 0.11 Credit Agricole SA, Reg. S 1%
16/09/2024 EUR 600,000 604,304 0.31 Credit Agricole SA, Reg. S 2.625%
17/03/2027 EUR 500,000 523,727 0.27 Credit Agricole SA, Reg. S 1.375%
03/05/2027 EUR 300,000 301,361 0.15 Electricite de France SA, Reg. S, FRN 5%
Perpetual EUR 600,000 643,377 0.33 Engie SA, Reg. S, FRN 3% Perpetual EUR 100,000 104,104 0.05 Engie SA, Reg. S, FRN 3.875% Perpetual EUR 700,000 723,741 0.37 Klepierre, REIT, Reg. S 1.875%
19/02/2026 EUR 1,100,000 1,164,754 0.59 Orange SA 8.125% 28/01/2033 EUR 400,000 738,450 0.38 RTE Reseau de Transport d’Electricite SA,
Reg. S 1.625% 27/11/2025 EUR 200,000 209,109 0.11 SCOR SE, Reg. S, FRN 3% 08/06/2046 EUR 400,000 424,956 0.22 TOTAL SA, Reg. S, FRN 2.25% Perpetual EUR 450,000 455,780 0.23 TOTAL SA, Reg. S, FRN 3.369% Perpetual EUR 425,000 433,367 0.22 TOTAL SA, Reg. S, FRN 3.875% Perpetual EUR 250,000 269,980 0.14
11,893,736 6.06
GermanyAllianz Finance II BV, FRN 5.75%
08/07/2041 EUR 800,000 944,054 0.48 Allianz SE, Reg. S, FRN 4.75% Perpetual EUR 400,000 461,563 0.24
SCHEDULE OF INVESTMENTSAs at 30 June 2017
Investments Currency
Quantity/Nominal
Value
Market Value EUR
% of Net Assets
Transferable securities and money market instruments admitted to offi cial exchange listing or dealt in on another regulated market
Corporate Bonds (continued)
Germany (continued)Deutsche Bahn Finance BV, Reg. S 1.5%
08/12/2032 EUR 1,000,000 988,245 0.50 Deutsche Bank AG, Reg. S 1.125%
17/03/2025 EUR 600,000 591,642 0.30 Deutsche Boerse AG, Reg. S, FRN 2.75%
05/02/2041 EUR 200,000 211,910 0.11 Muenchener Rueckversicherungs-
Gesellschaft AG, Reg. S, FRN 6% 26/05/2041 EUR 1,000,000 1,193,359 0.61
Volkswagen International Finance NV, Reg. S 0.5% 30/03/2021 EUR 400,000 400,135 0.21
Volkswagen International Finance NV, Reg. S 1.125% 02/10/2023 EUR 300,000 300,593 0.15
Volkswagen International Finance NV, Reg. S 1.875% 30/03/2027 EUR 300,000 300,010 0.15
5,391,511 2.75
Hong KongCK Hutchison Finance 16 Ltd., Reg. S
1.25% 06/04/2023 EUR 600,000 604,980 0.31
604,980 0.31
IrelandGAS Networks Ireland, Reg. S 1.375%
05/12/2026 EUR 600,000 605,036 0.31
605,036 0.31
IsraelTeva Pharmaceutical Finance IV BV, Reg. S
2.875% 15/04/2019 EUR 450,000 471,480 0.24
471,480 0.24
ItalyAssicurazioni Generali SpA, Reg. S 5.125%
16/09/2024 EUR 650,000 827,821 0.42 Intesa Sanpaolo SpA, Reg. S 1.375%
18/12/2025 EUR 800,000 825,527 0.42 Intesa Sanpaolo SpA, Reg. S, FRN 0.719%
15/06/2020 EUR 1,650,000 1,678,108 0.85 Telecom Italia Finance SA 7.75%
24/01/2033 EUR 850,000 1,181,271 0.60 UniCredit SpA, Reg. S 2.75% 31/01/2020 EUR 340,000 364,813 0.19 UniCredit SpA, Reg. S 0.75% 30/04/2063 EUR 450,000 444,087 0.23
5,321,627 2.71
MexicoFomento Economico Mexicano SAB de CV,
Reg. S 1.75% 20/03/2023 EUR 300,000 308,600 0.16
308,600 0.16
NetherlandsABN AMRO Bank NV, Reg. S 6.375%
27/04/2021 EUR 1,000,000 1,214,474 0.62 ABN AMRO Bank NV, Reg. S, FRN 2.875%
30/06/2025 EUR 200,000 211,209 0.11
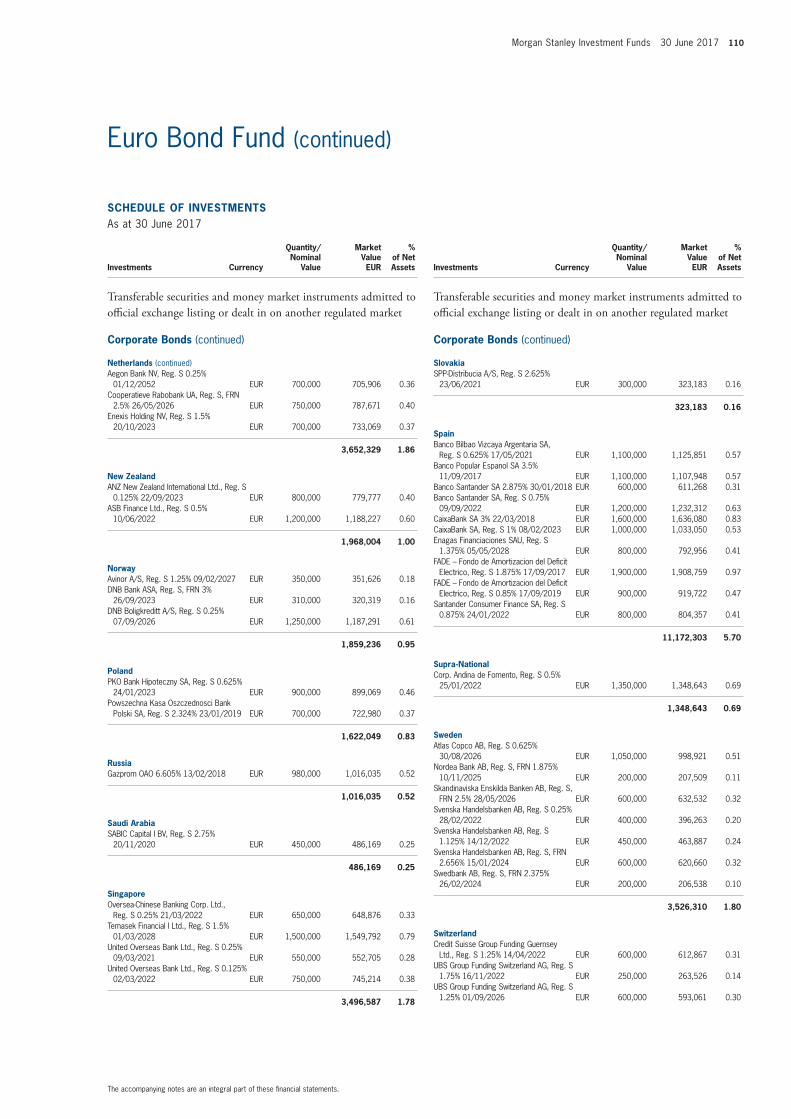
Morgan Stanley Investment Funds 30 June 2017 110
The accompanying notes are an integral part of these fi nancial statements.
Euro Bond Fund (continued)
SCHEDULE OF INVESTMENTSAs at 30 June 2017
Investments Currency
Quantity/Nominal
Value
Market Value EUR
% of Net Assets
Transferable securities and money market instruments admitted to offi cial exchange listing or dealt in on another regulated market
Corporate Bonds (continued)
Netherlands (continued)Aegon Bank NV, Reg. S 0.25%
01/12/2052 EUR 700,000 705,906 0.36 Cooperatieve Rabobank UA, Reg. S, FRN
2.5% 26/05/2026 EUR 750,000 787,671 0.40 Enexis Holding NV, Reg. S 1.5%
20/10/2023 EUR 700,000 733,069 0.37
3,652,329 1.86
New ZealandANZ New Zealand International Ltd., Reg. S
0.125% 22/09/2023 EUR 800,000 779,777 0.40 ASB Finance Ltd., Reg. S 0.5%
10/06/2022 EUR 1,200,000 1,188,227 0.60
1,968,004 1.00
NorwayAvinor A/S, Reg. S 1.25% 09/02/2027 EUR 350,000 351,626 0.18 DNB Bank ASA, Reg. S, FRN 3%
26/09/2023 EUR 310,000 320,319 0.16 DNB Boligkreditt A/S, Reg. S 0.25%
07/09/2026 EUR 1,250,000 1,187,291 0.61
1,859,236 0.95
PolandPKO Bank Hipoteczny SA, Reg. S 0.625%
24/01/2023 EUR 900,000 899,069 0.46 Powszechna Kasa Oszczednosci Bank
Polski SA, Reg. S 2.324% 23/01/2019 EUR 700,000 722,980 0.37
1,622,049 0.83
RussiaGazprom OAO 6.605% 13/02/2018 EUR 980,000 1,016,035 0.52
1,016,035 0.52
Saudi ArabiaSABIC Capital I BV, Reg. S 2.75%
20/11/2020 EUR 450,000 486,169 0.25
486,169 0.25
SingaporeOversea-Chinese Banking Corp. Ltd.,
Reg. S 0.25% 21/03/2022 EUR 650,000 648,876 0.33 Temasek Financial I Ltd., Reg. S 1.5%
01/03/2028 EUR 1,500,000 1,549,792 0.79 United Overseas Bank Ltd., Reg. S 0.25%
09/03/2021 EUR 550,000 552,705 0.28 United Overseas Bank Ltd., Reg. S 0.125%
02/03/2022 EUR 750,000 745,214 0.38
3,496,587 1.78
SCHEDULE OF INVESTMENTSAs at 30 June 2017
Investments Currency
Quantity/Nominal
Value
Market Value EUR
% of Net Assets
Transferable securities and money market instruments admitted to offi cial exchange listing or dealt in on another regulated market
Corporate Bonds (continued)
SlovakiaSPP-Distribucia A/S, Reg. S 2.625%
23/06/2021 EUR 300,000 323,183 0.16
323,183 0.16
SpainBanco Bilbao Vizcaya Argentaria SA,
Reg. S 0.625% 17/05/2021 EUR 1,100,000 1,125,851 0.57 Banco Popular Espanol SA 3.5%
11/09/2017 EUR 1,100,000 1,107,948 0.57 Banco Santander SA 2.875% 30/01/2018 EUR 600,000 611,268 0.31 Banco Santander SA, Reg. S 0.75%
09/09/2022 EUR 1,200,000 1,232,312 0.63 CaixaBank SA 3% 22/03/2018 EUR 1,600,000 1,636,080 0.83 CaixaBank SA, Reg. S 1% 08/02/2023 EUR 1,000,000 1,033,050 0.53 Enagas Financiaciones SAU, Reg. S
1.375% 05/05/2028 EUR 800,000 792,956 0.41 FADE – Fondo de Amortizacion del Defi cit
Electrico, Reg. S 1.875% 17/09/2017 EUR 1,900,000 1,908,759 0.97 FADE – Fondo de Amortizacion del Defi cit
Electrico, Reg. S 0.85% 17/09/2019 EUR 900,000 919,722 0.47 Santander Consumer Finance SA, Reg. S
0.875% 24/01/2022 EUR 800,000 804,357 0.41
11,172,303 5.70
Supra-NationalCorp. Andina de Fomento, Reg. S 0.5%
25/01/2022 EUR 1,350,000 1,348,643 0.69
1,348,643 0.69
SwedenAtlas Copco AB, Reg. S 0.625%
30/08/2026 EUR 1,050,000 998,921 0.51 Nordea Bank AB, Reg. S, FRN 1.875%
10/11/2025 EUR 200,000 207,509 0.11 Skandinaviska Enskilda Banken AB, Reg. S,
FRN 2.5% 28/05/2026 EUR 600,000 632,532 0.32 Svenska Handelsbanken AB, Reg. S 0.25%
28/02/2022 EUR 400,000 396,263 0.20 Svenska Handelsbanken AB, Reg. S
1.125% 14/12/2022 EUR 450,000 463,887 0.24 Svenska Handelsbanken AB, Reg. S, FRN
2.656% 15/01/2024 EUR 600,000 620,660 0.32 Swedbank AB, Reg. S, FRN 2.375%
26/02/2024 EUR 200,000 206,538 0.10
3,526,310 1.80
SwitzerlandCredit Suisse Group Funding Guernsey
Ltd., Reg. S 1.25% 14/04/2022 EUR 600,000 612,867 0.31 UBS Group Funding Switzerland AG, Reg. S
1.75% 16/11/2022 EUR 250,000 263,526 0.14 UBS Group Funding Switzerland AG, Reg. S
1.25% 01/09/2026 EUR 600,000 593,061 0.30
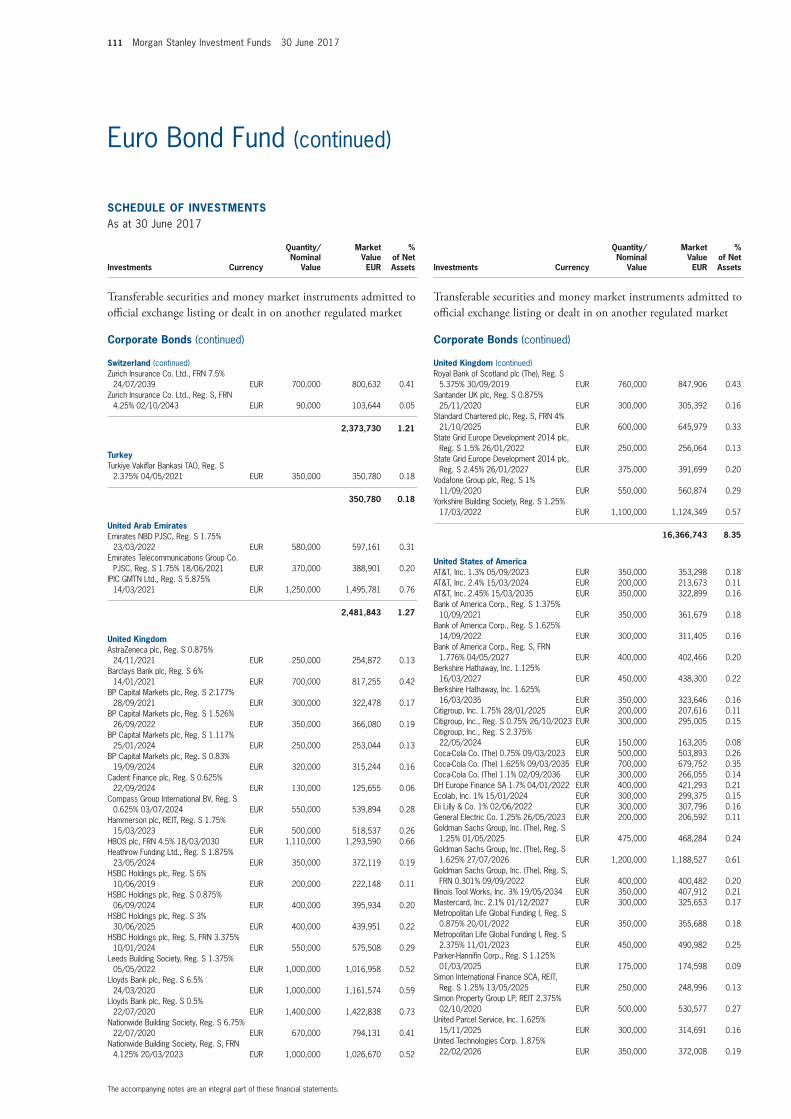
111 Morgan Stanley Investment Funds 30 June 2017
The accompanying notes are an integral part of these fi nancial statements.
Euro Bond Fund (continued)
SCHEDULE OF INVESTMENTSAs at 30 June 2017
Investments Currency
Quantity/Nominal
Value
Market Value EUR
% of Net Assets
Transferable securities and money market instruments admitted to offi cial exchange listing or dealt in on another regulated market
Corporate Bonds (continued)
Switzerland (continued)Zurich Insurance Co. Ltd., FRN 7.5%
24/07/2039 EUR 700,000 800,632 0.41 Zurich Insurance Co. Ltd., Reg. S, FRN
4.25% 02/10/2043 EUR 90,000 103,644 0.05
2,373,730 1.21
TurkeyTurkiye Vakifl ar Bankasi TAO, Reg. S
2.375% 04/05/2021 EUR 350,000 350,780 0.18
350,780 0.18
United Arab EmiratesEmirates NBD PJSC, Reg. S 1.75%
23/03/2022 EUR 580,000 597,161 0.31 Emirates Telecommunications Group Co.
PJSC, Reg. S 1.75% 18/06/2021 EUR 370,000 388,901 0.20 IPIC GMTN Ltd., Reg. S 5.875%
14/03/2021 EUR 1,250,000 1,495,781 0.76
2,481,843 1.27
United KingdomAstraZeneca plc, Reg. S 0.875%
24/11/2021 EUR 250,000 254,872 0.13 Barclays Bank plc, Reg. S 6%
14/01/2021 EUR 700,000 817,255 0.42 BP Capital Markets plc, Reg. S 2.177%
28/09/2021 EUR 300,000 322,478 0.17 BP Capital Markets plc, Reg. S 1.526%
26/09/2022 EUR 350,000 366,080 0.19 BP Capital Markets plc, Reg. S 1.117%
25/01/2024 EUR 250,000 253,044 0.13 BP Capital Markets plc, Reg. S 0.83%
19/09/2024 EUR 320,000 315,244 0.16 Cadent Finance plc, Reg. S 0.625%
22/09/2024 EUR 130,000 125,655 0.06 Compass Group International BV, Reg. S
0.625% 03/07/2024 EUR 550,000 539,894 0.28 Hammerson plc, REIT, Reg. S 1.75%
15/03/2023 EUR 500,000 518,537 0.26 HBOS plc, FRN 4.5% 18/03/2030 EUR 1,110,000 1,293,590 0.66 Heathrow Funding Ltd., Reg. S 1.875%
23/05/2024 EUR 350,000 372,119 0.19 HSBC Holdings plc, Reg. S 6%
10/06/2019 EUR 200,000 222,148 0.11 HSBC Holdings plc, Reg. S 0.875%
06/09/2024 EUR 400,000 395,934 0.20 HSBC Holdings plc, Reg. S 3%
30/06/2025 EUR 400,000 439,951 0.22 HSBC Holdings plc, Reg. S, FRN 3.375%
10/01/2024 EUR 550,000 575,508 0.29 Leeds Building Society, Reg. S 1.375%
05/05/2022 EUR 1,000,000 1,016,958 0.52 Lloyds Bank plc, Reg. S 6.5%
24/03/2020 EUR 1,000,000 1,161,574 0.59 Lloyds Bank plc, Reg. S 0.5%
22/07/2020 EUR 1,400,000 1,422,838 0.73 Nationwide Building Society, Reg. S 6.75%
22/07/2020 EUR 670,000 794,131 0.41 Nationwide Building Society, Reg. S, FRN
4.125% 20/03/2023 EUR 1,000,000 1,026,670 0.52
SCHEDULE OF INVESTMENTSAs at 30 June 2017
Investments Currency
Quantity/Nominal
Value
Market Value EUR
% of Net Assets
Transferable securities and money market instruments admitted to offi cial exchange listing or dealt in on another regulated market
Corporate Bonds (continued)
United Kingdom (continued)Royal Bank of Scotland plc (The), Reg. S
5.375% 30/09/2019 EUR 760,000 847,906 0.43 Santander UK plc, Reg. S 0.875%
25/11/2020 EUR 300,000 305,392 0.16 Standard Chartered plc, Reg. S, FRN 4%
21/10/2025 EUR 600,000 645,979 0.33 State Grid Europe Development 2014 plc,
Reg. S 1.5% 26/01/2022 EUR 250,000 256,064 0.13 State Grid Europe Development 2014 plc,
Reg. S 2.45% 26/01/2027 EUR 375,000 391,699 0.20 Vodafone Group plc, Reg. S 1%
11/09/2020 EUR 550,000 560,874 0.29 Yorkshire Building Society, Reg. S 1.25%
17/03/2022 EUR 1,100,000 1,124,349 0.57
16,366,743 8.35
United States of AmericaAT&T, Inc. 1.3% 05/09/2023 EUR 350,000 353,298 0.18 AT&T, Inc. 2.4% 15/03/2024 EUR 200,000 213,673 0.11 AT&T, Inc. 2.45% 15/03/2035 EUR 350,000 322,899 0.16 Bank of America Corp., Reg. S 1.375%
10/09/2021 EUR 350,000 361,679 0.18 Bank of America Corp., Reg. S 1.625%
14/09/2022 EUR 300,000 311,405 0.16 Bank of America Corp., Reg. S, FRN
1.776% 04/05/2027 EUR 400,000 402,466 0.20 Berkshire Hathaway, Inc. 1.125%
16/03/2027 EUR 450,000 438,300 0.22 Berkshire Hathaway, Inc. 1.625%
16/03/2035 EUR 350,000 323,646 0.16 Citigroup, Inc. 1.75% 28/01/2025 EUR 200,000 207,616 0.11 Citigroup, Inc., Reg. S 0.75% 26/10/2023 EUR 300,000 295,005 0.15 Citigroup, Inc., Reg. S 2.375%
22/05/2024 EUR 150,000 163,205 0.08 Coca-Cola Co. (The) 0.75% 09/03/2023 EUR 500,000 503,893 0.26 Coca-Cola Co. (The) 1.625% 09/03/2035 EUR 700,000 679,752 0.35 Coca-Cola Co. (The) 1.1% 02/09/2036 EUR 300,000 266,055 0.14 DH Europe Finance SA 1.7% 04/01/2022 EUR 400,000 421,293 0.21 Ecolab, Inc. 1% 15/01/2024 EUR 300,000 299,375 0.15 Eli Lilly & Co. 1% 02/06/2022 EUR 300,000 307,796 0.16 General Electric Co. 1.25% 26/05/2023 EUR 200,000 206,592 0.11 Goldman Sachs Group, Inc. (The), Reg. S
1.25% 01/05/2025 EUR 475,000 468,284 0.24 Goldman Sachs Group, Inc. (The), Reg. S
1.625% 27/07/2026 EUR 1,200,000 1,188,527 0.61 Goldman Sachs Group, Inc. (The), Reg. S,
FRN 0.301% 09/09/2022 EUR 400,000 400,482 0.20 Illinois Tool Works, Inc. 3% 19/05/2034 EUR 350,000 407,912 0.21 Mastercard, Inc. 2.1% 01/12/2027 EUR 300,000 325,653 0.17 Metropolitan Life Global Funding I, Reg. S
0.875% 20/01/2022 EUR 350,000 355,688 0.18 Metropolitan Life Global Funding I, Reg. S
2.375% 11/01/2023 EUR 450,000 490,982 0.25 Parker-Hannifi n Corp., Reg. S 1.125%
01/03/2025 EUR 175,000 174,598 0.09 Simon International Finance SCA, REIT,
Reg. S 1.25% 13/05/2025 EUR 250,000 248,996 0.13 Simon Property Group LP, REIT 2.375%
02/10/2020 EUR 500,000 530,577 0.27 United Parcel Service, Inc. 1.625%
15/11/2025 EUR 300,000 314,691 0.16 United Technologies Corp. 1.875%
22/02/2026 EUR 350,000 372,008 0.19
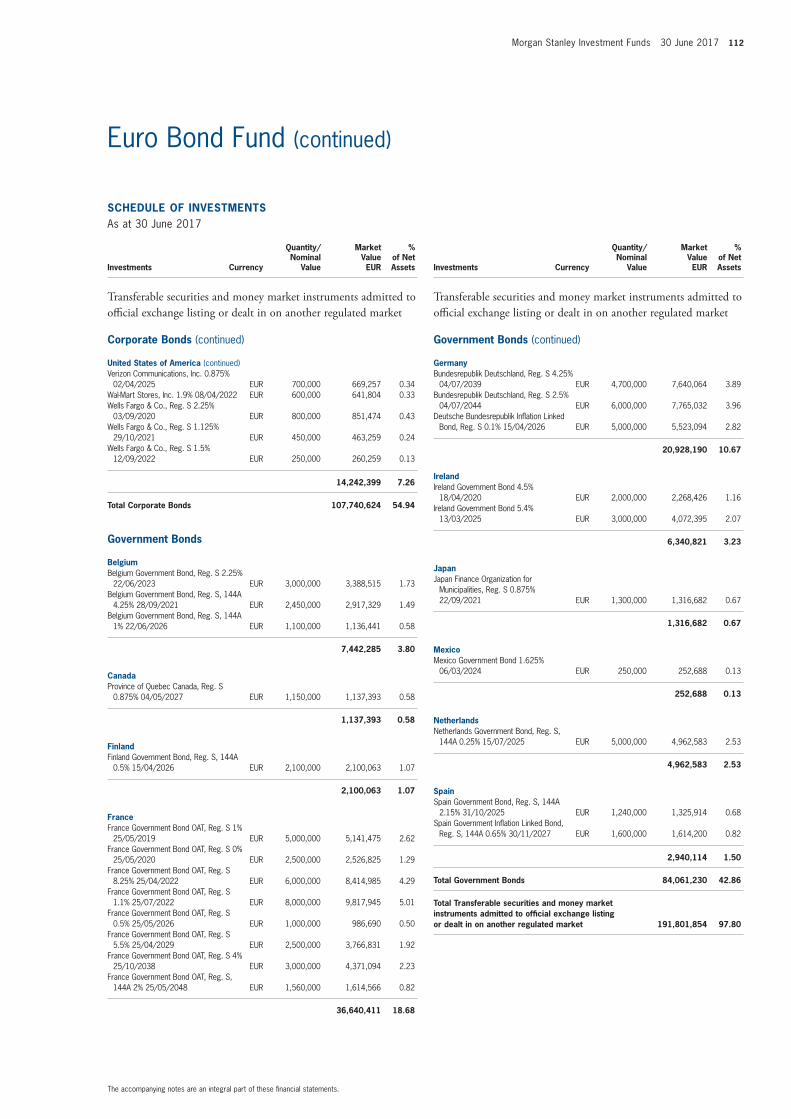
Morgan Stanley Investment Funds 30 June 2017 112
The accompanying notes are an integral part of these fi nancial statements.
Euro Bond Fund (continued)
SCHEDULE OF INVESTMENTSAs at 30 June 2017
Investments Currency
Quantity/Nominal
Value
Market Value EUR
% of Net Assets
Transferable securities and money market instruments admitted to offi cial exchange listing or dealt in on another regulated market
Corporate Bonds (continued)
United States of America (continued)Verizon Communications, Inc. 0.875%
02/04/2025 EUR 700,000 669,257 0.34 Wal-Mart Stores, Inc. 1.9% 08/04/2022 EUR 600,000 641,804 0.33 Wells Fargo & Co., Reg. S 2.25%
03/09/2020 EUR 800,000 851,474 0.43 Wells Fargo & Co., Reg. S 1.125%
29/10/2021 EUR 450,000 463,259 0.24 Wells Fargo & Co., Reg. S 1.5%
12/09/2022 EUR 250,000 260,259 0.13
14,242,399 7.26
Total Corporate Bonds 107,740,624 54.94
Government Bonds
BelgiumBelgium Government Bond, Reg. S 2.25%
22/06/2023 EUR 3,000,000 3,388,515 1.73 Belgium Government Bond, Reg. S, 144A
4.25% 28/09/2021 EUR 2,450,000 2,917,329 1.49 Belgium Government Bond, Reg. S, 144A
1% 22/06/2026 EUR 1,100,000 1,136,441 0.58
7,442,285 3.80
CanadaProvince of Quebec Canada, Reg. S
0.875% 04/05/2027 EUR 1,150,000 1,137,393 0.58
1,137,393 0.58
FinlandFinland Government Bond, Reg. S, 144A
0.5% 15/04/2026 EUR 2,100,000 2,100,063 1.07
2,100,063 1.07
FranceFrance Government Bond OAT, Reg. S 1%
25/05/2019 EUR 5,000,000 5,141,475 2.62 France Government Bond OAT, Reg. S 0%
25/05/2020 EUR 2,500,000 2,526,825 1.29 France Government Bond OAT, Reg. S
8.25% 25/04/2022 EUR 6,000,000 8,414,985 4.29 France Government Bond OAT, Reg. S
1.1% 25/07/2022 EUR 8,000,000 9,817,945 5.01 France Government Bond OAT, Reg. S
0.5% 25/05/2026 EUR 1,000,000 986,690 0.50 France Government Bond OAT, Reg. S
5.5% 25/04/2029 EUR 2,500,000 3,766,831 1.92 France Government Bond OAT, Reg. S 4%
25/10/2038 EUR 3,000,000 4,371,094 2.23 France Government Bond OAT, Reg. S,
144A 2% 25/05/2048 EUR 1,560,000 1,614,566 0.82
36,640,411 18.68
SCHEDULE OF INVESTMENTSAs at 30 June 2017
Investments Currency
Quantity/Nominal
Value
Market Value EUR
% of Net Assets
Transferable securities and money market instruments admitted to offi cial exchange listing or dealt in on another regulated market
Government Bonds (continued)
GermanyBundesrepublik Deutschland, Reg. S 4.25%
04/07/2039 EUR 4,700,000 7,640,064 3.89 Bundesrepublik Deutschland, Reg. S 2.5%
04/07/2044 EUR 6,000,000 7,765,032 3.96 Deutsche Bundesrepublik Infl ation Linked
Bond, Reg. S 0.1% 15/04/2026 EUR 5,000,000 5,523,094 2.82
20,928,190 10.67
IrelandIreland Government Bond 4.5%
18/04/2020 EUR 2,000,000 2,268,426 1.16 Ireland Government Bond 5.4%
13/03/2025 EUR 3,000,000 4,072,395 2.07
6,340,821 3.23
JapanJapan Finance Organization for
Municipalities, Reg. S 0.875% 22/09/2021 EUR 1,300,000 1,316,682 0.67
1,316,682 0.67
MexicoMexico Government Bond 1.625%
06/03/2024 EUR 250,000 252,688 0.13
252,688 0.13
NetherlandsNetherlands Government Bond, Reg. S,
144A 0.25% 15/07/2025 EUR 5,000,000 4,962,583 2.53
4,962,583 2.53
SpainSpain Government Bond, Reg. S, 144A
2.15% 31/10/2025 EUR 1,240,000 1,325,914 0.68 Spain Government Infl ation Linked Bond,
Reg. S, 144A 0.65% 30/11/2027 EUR 1,600,000 1,614,200 0.82
2,940,114 1.50
Total Government Bonds 84,061,230 42.86
Total Transferable securities and money market instruments admitted to offi cial exchange listing or dealt in on another regulated market 191,801,854 97.80
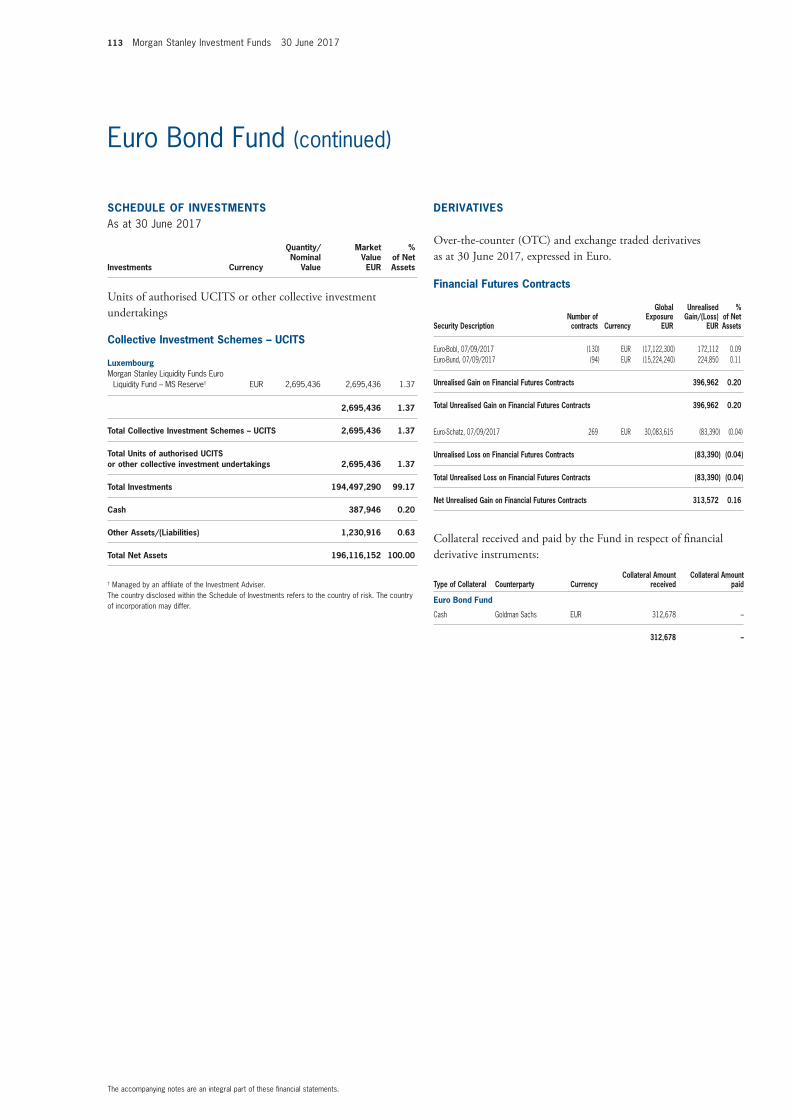
113 Morgan Stanley Investment Funds 30 June 2017
The accompanying notes are an integral part of these fi nancial statements.
Euro Bond Fund (continued)
SCHEDULE OF INVESTMENTSAs at 30 June 2017
Investments Currency
Quantity/Nominal
Value
Market Value EUR
% of Net Assets
Units of authorised UCITS or other collective investment undertakings
Collective Investment Schemes – UCITS
LuxembourgMorgan Stanley Liquidity Funds Euro
Liquidity Fund – MS Reserve† EUR 2,695,436 2,695,436 1.37
2,695,436 1.37
Total Collective Investment Schemes – UCITS 2,695,436 1.37
Total Units of authorised UCITS or other collective investment undertakings 2,695,436 1.37
Total Investments 194,497,290 99.17
Cash 387,946 0.20
Other Assets/(Liabilities) 1,230,916 0.63
Total Net Assets 196,116,152 100.00
† Managed by an affi liate of the Investment Adviser.The country disclosed within the Schedule of Investments refers to the country of risk. The country of incorporation may differ.
Financial Futures Contracts
Security DescriptionNumber of contracts Currency
Global Exposure
EUR
Unrealised Gain/(Loss)
EUR
% of Net Assets
Euro-Bobl, 07/09/2017 (130) EUR (17,122,300) 172,112 0.09 Euro-Bund, 07/09/2017 (94) EUR (15,224,240) 224,850 0.11
Unrealised Gain on Financial Futures Contracts 396,962 0.20
Total Unrealised Gain on Financial Futures Contracts 396,962 0.20
Euro-Schatz, 07/09/2017 269 EUR 30,083,615 (83,390) (0.04)
Unrealised Loss on Financial Futures Contracts (83,390) (0.04)
Total Unrealised Loss on Financial Futures Contracts (83,390) (0.04)
Net Unrealised Gain on Financial Futures Contracts 313,572 0.16
Collateral received and paid by the Fund in respect of fi nancial derivative instruments:
Type of Collateral Counterparty CurrencyCollateral Amount
receivedCollateral Amount
paid
Euro Bond Fund
Cash Goldman Sachs EUR 312,678 –
312,678 –
DERIVATIVES
Over-the-counter (OTC) and exchange traded derivatives as at 30 June 2017, expressed in Euro.
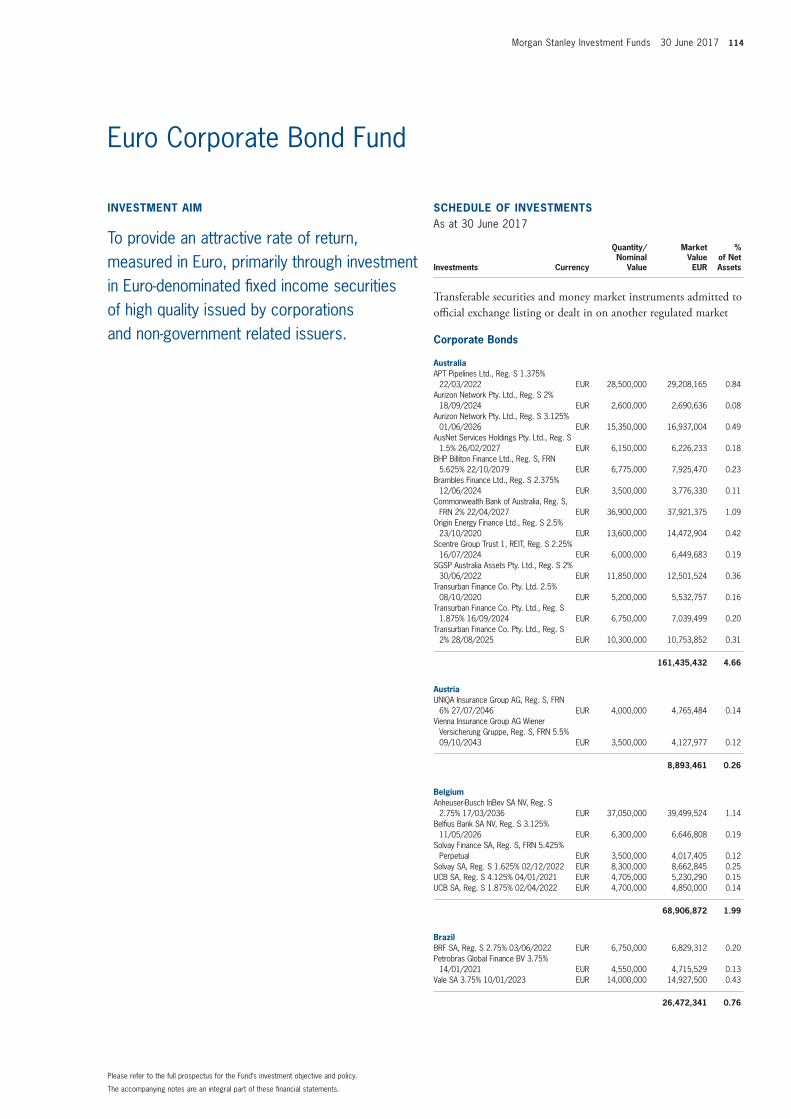
Morgan Stanley Investment Funds 30 June 2017 114
The accompanying notes are an integral part of these fi nancial statements.
Please refer to the full prospectus for the Fund’s investment objective and policy.
INVESTMENT AIM
To provide an attractive rate of return, measured in Euro, primarily through investment in Euro-denominated fi xed income securities of high quality issued by corporations and non-government related issuers.
SCHEDULE OF INVESTMENTSAs at 30 June 2017
Investments Currency
Quantity/Nominal
Value
Market Value EUR
% of Net Assets
Transferable securities and money market instruments admitted to offi cial exchange listing or dealt in on another regulated market
Corporate Bonds
AustraliaAPT Pipelines Ltd., Reg. S 1.375%
22/03/2022 EUR 28,500,000 29,208,165 0.84 Aurizon Network Pty. Ltd., Reg. S 2%
18/09/2024 EUR 2,600,000 2,690,636 0.08 Aurizon Network Pty. Ltd., Reg. S 3.125%
01/06/2026 EUR 15,350,000 16,937,004 0.49 AusNet Services Holdings Pty. Ltd., Reg. S
1.5% 26/02/2027 EUR 6,150,000 6,226,233 0.18 BHP Billiton Finance Ltd., Reg. S, FRN
5.625% 22/10/2079 EUR 6,775,000 7,925,470 0.23 Brambles Finance Ltd., Reg. S 2.375%
12/06/2024 EUR 3,500,000 3,776,330 0.11 Commonwealth Bank of Australia, Reg. S,
FRN 2% 22/04/2027 EUR 36,900,000 37,921,375 1.09 Origin Energy Finance Ltd., Reg. S 2.5%
23/10/2020 EUR 13,600,000 14,472,904 0.42 Scentre Group Trust 1, REIT, Reg. S 2.25%
16/07/2024 EUR 6,000,000 6,449,683 0.19 SGSP Australia Assets Pty. Ltd., Reg. S 2%
30/06/2022 EUR 11,850,000 12,501,524 0.36 Transurban Finance Co. Pty. Ltd. 2.5%
08/10/2020 EUR 5,200,000 5,532,757 0.16 Transurban Finance Co. Pty. Ltd., Reg. S
1.875% 16/09/2024 EUR 6,750,000 7,039,499 0.20 Transurban Finance Co. Pty. Ltd., Reg. S
2% 28/08/2025 EUR 10,300,000 10,753,852 0.31
161,435,432 4.66
AustriaUNIQA Insurance Group AG, Reg. S, FRN
6% 27/07/2046 EUR 4,000,000 4,765,484 0.14 Vienna Insurance Group AG Wiener
Versicherung Gruppe, Reg. S, FRN 5.5% 09/10/2043 EUR 3,500,000 4,127,977 0.12
8,893,461 0.26
BelgiumAnheuser-Busch InBev SA NV, Reg. S
2.75% 17/03/2036 EUR 37,050,000 39,499,524 1.14 Belfi us Bank SA NV, Reg. S 3.125%
11/05/2026 EUR 6,300,000 6,646,808 0.19 Solvay Finance SA, Reg. S, FRN 5.425%
Perpetual EUR 3,500,000 4,017,405 0.12 Solvay SA, Reg. S 1.625% 02/12/2022 EUR 8,300,000 8,662,845 0.25 UCB SA, Reg. S 4.125% 04/01/2021 EUR 4,705,000 5,230,290 0.15 UCB SA, Reg. S 1.875% 02/04/2022 EUR 4,700,000 4,850,000 0.14
68,906,872 1.99
BrazilBRF SA, Reg. S 2.75% 03/06/2022 EUR 6,750,000 6,829,312 0.20 Petrobras Global Finance BV 3.75%
14/01/2021 EUR 4,550,000 4,715,529 0.13 Vale SA 3.75% 10/01/2023 EUR 14,000,000 14,927,500 0.43
26,472,341 0.76
Euro Corporate Bond Fund
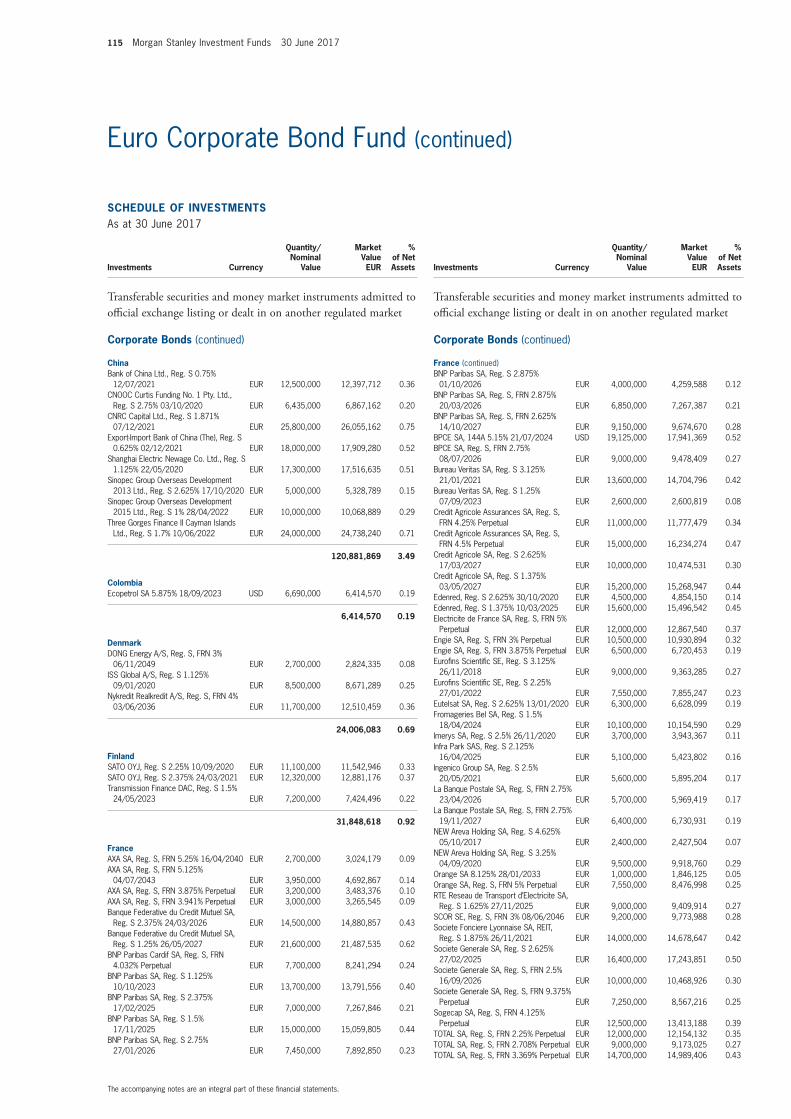
115 Morgan Stanley Investment Funds 30 June 2017
The accompanying notes are an integral part of these fi nancial statements.
Euro Corporate Bond Fund (continued)
SCHEDULE OF INVESTMENTSAs at 30 June 2017
Investments Currency
Quantity/Nominal
Value
Market Value EUR
% of Net Assets
Transferable securities and money market instruments admitted to offi cial exchange listing or dealt in on another regulated market
Corporate Bonds (continued)
ChinaBank of China Ltd., Reg. S 0.75%
12/07/2021 EUR 12,500,000 12,397,712 0.36 CNOOC Curtis Funding No. 1 Pty. Ltd.,
Reg. S 2.75% 03/10/2020 EUR 6,435,000 6,867,162 0.20 CNRC Capital Ltd., Reg. S 1.871%
07/12/2021 EUR 25,800,000 26,055,162 0.75 Export-Import Bank of China (The), Reg. S
0.625% 02/12/2021 EUR 18,000,000 17,909,280 0.52 Shanghai Electric Newage Co. Ltd., Reg. S
1.125% 22/05/2020 EUR 17,300,000 17,516,635 0.51 Sinopec Group Overseas Development
2013 Ltd., Reg. S 2.625% 17/10/2020 EUR 5,000,000 5,328,789 0.15 Sinopec Group Overseas Development
2015 Ltd., Reg. S 1% 28/04/2022 EUR 10,000,000 10,068,889 0.29 Three Gorges Finance II Cayman Islands
Ltd., Reg. S 1.7% 10/06/2022 EUR 24,000,000 24,738,240 0.71
120,881,869 3.49
ColombiaEcopetrol SA 5.875% 18/09/2023 USD 6,690,000 6,414,570 0.19
6,414,570 0.19
DenmarkDONG Energy A/S, Reg. S, FRN 3%
06/11/2049 EUR 2,700,000 2,824,335 0.08 ISS Global A/S, Reg. S 1.125%
09/01/2020 EUR 8,500,000 8,671,289 0.25 Nykredit Realkredit A/S, Reg. S, FRN 4%
03/06/2036 EUR 11,700,000 12,510,459 0.36
24,006,083 0.69
FinlandSATO OYJ, Reg. S 2.25% 10/09/2020 EUR 11,100,000 11,542,946 0.33 SATO OYJ, Reg. S 2.375% 24/03/2021 EUR 12,320,000 12,881,176 0.37 Transmission Finance DAC, Reg. S 1.5%
24/05/2023 EUR 7,200,000 7,424,496 0.22
31,848,618 0.92
FranceAXA SA, Reg. S, FRN 5.25% 16/04/2040 EUR 2,700,000 3,024,179 0.09 AXA SA, Reg. S, FRN 5.125%
04/07/2043 EUR 3,950,000 4,692,867 0.14 AXA SA, Reg. S, FRN 3.875% Perpetual EUR 3,200,000 3,483,376 0.10 AXA SA, Reg. S, FRN 3.941% Perpetual EUR 3,000,000 3,265,545 0.09 Banque Federative du Credit Mutuel SA,
Reg. S 2.375% 24/03/2026 EUR 14,500,000 14,880,857 0.43 Banque Federative du Credit Mutuel SA,
Reg. S 1.25% 26/05/2027 EUR 21,600,000 21,487,535 0.62 BNP Paribas Cardif SA, Reg. S, FRN
4.032% Perpetual EUR 7,700,000 8,241,294 0.24 BNP Paribas SA, Reg. S 1.125%
10/10/2023 EUR 13,700,000 13,791,556 0.40 BNP Paribas SA, Reg. S 2.375%
17/02/2025 EUR 7,000,000 7,267,846 0.21 BNP Paribas SA, Reg. S 1.5%
17/11/2025 EUR 15,000,000 15,059,805 0.44 BNP Paribas SA, Reg. S 2.75%
27/01/2026 EUR 7,450,000 7,892,850 0.23
SCHEDULE OF INVESTMENTSAs at 30 June 2017
Investments Currency
Quantity/Nominal
Value
Market Value EUR
% of Net Assets
Transferable securities and money market instruments admitted to offi cial exchange listing or dealt in on another regulated market
Corporate Bonds (continued)
France (continued)BNP Paribas SA, Reg. S 2.875%
01/10/2026 EUR 4,000,000 4,259,588 0.12 BNP Paribas SA, Reg. S, FRN 2.875%
20/03/2026 EUR 6,850,000 7,267,387 0.21 BNP Paribas SA, Reg. S, FRN 2.625%
14/10/2027 EUR 9,150,000 9,674,670 0.28 BPCE SA, 144A 5.15% 21/07/2024 USD 19,125,000 17,941,369 0.52 BPCE SA, Reg. S, FRN 2.75%
08/07/2026 EUR 9,000,000 9,478,409 0.27 Bureau Veritas SA, Reg. S 3.125%
21/01/2021 EUR 13,600,000 14,704,796 0.42 Bureau Veritas SA, Reg. S 1.25%
07/09/2023 EUR 2,600,000 2,600,819 0.08 Credit Agricole Assurances SA, Reg. S,
FRN 4.25% Perpetual EUR 11,000,000 11,777,479 0.34 Credit Agricole Assurances SA, Reg. S,
FRN 4.5% Perpetual EUR 15,000,000 16,234,274 0.47 Credit Agricole SA, Reg. S 2.625%
17/03/2027 EUR 10,000,000 10,474,531 0.30 Credit Agricole SA, Reg. S 1.375%
03/05/2027 EUR 15,200,000 15,268,947 0.44 Edenred, Reg. S 2.625% 30/10/2020 EUR 4,500,000 4,854,150 0.14 Edenred, Reg. S 1.375% 10/03/2025 EUR 15,600,000 15,496,542 0.45 Electricite de France SA, Reg. S, FRN 5%
Perpetual EUR 12,000,000 12,867,540 0.37 Engie SA, Reg. S, FRN 3% Perpetual EUR 10,500,000 10,930,894 0.32 Engie SA, Reg. S, FRN 3.875% Perpetual EUR 6,500,000 6,720,453 0.19 Eurofi ns Scientifi c SE, Reg. S 3.125%
26/11/2018 EUR 9,000,000 9,363,285 0.27 Eurofi ns Scientifi c SE, Reg. S 2.25%
27/01/2022 EUR 7,550,000 7,855,247 0.23 Eutelsat SA, Reg. S 2.625% 13/01/2020 EUR 6,300,000 6,628,099 0.19 Fromageries Bel SA, Reg. S 1.5%
18/04/2024 EUR 10,100,000 10,154,590 0.29 Imerys SA, Reg. S 2.5% 26/11/2020 EUR 3,700,000 3,943,367 0.11 Infra Park SAS, Reg. S 2.125%
16/04/2025 EUR 5,100,000 5,423,802 0.16 Ingenico Group SA, Reg. S 2.5%
20/05/2021 EUR 5,600,000 5,895,204 0.17 La Banque Postale SA, Reg. S, FRN 2.75%
23/04/2026 EUR 5,700,000 5,969,419 0.17 La Banque Postale SA, Reg. S, FRN 2.75%
19/11/2027 EUR 6,400,000 6,730,931 0.19 NEW Areva Holding SA, Reg. S 4.625%
05/10/2017 EUR 2,400,000 2,427,504 0.07 NEW Areva Holding SA, Reg. S 3.25%
04/09/2020 EUR 9,500,000 9,918,760 0.29 Orange SA 8.125% 28/01/2033 EUR 1,000,000 1,846,125 0.05 Orange SA, Reg. S, FRN 5% Perpetual EUR 7,550,000 8,476,998 0.25 RTE Reseau de Transport d’Electricite SA,
Reg. S 1.625% 27/11/2025 EUR 9,000,000 9,409,914 0.27 SCOR SE, Reg. S, FRN 3% 08/06/2046 EUR 9,200,000 9,773,988 0.28 Societe Fonciere Lyonnaise SA, REIT,
Reg. S 1.875% 26/11/2021 EUR 14,000,000 14,678,647 0.42 Societe Generale SA, Reg. S 2.625%
27/02/2025 EUR 16,400,000 17,243,851 0.50 Societe Generale SA, Reg. S, FRN 2.5%
16/09/2026 EUR 10,000,000 10,468,926 0.30 Societe Generale SA, Reg. S, FRN 9.375%
Perpetual EUR 7,250,000 8,567,216 0.25 Sogecap SA, Reg. S, FRN 4.125%
Perpetual EUR 12,500,000 13,413,188 0.39 TOTAL SA, Reg. S, FRN 2.25% Perpetual EUR 12,000,000 12,154,132 0.35 TOTAL SA, Reg. S, FRN 2.708% Perpetual EUR 9,000,000 9,173,025 0.27 TOTAL SA, Reg. S, FRN 3.369% Perpetual EUR 14,700,000 14,989,406 0.43
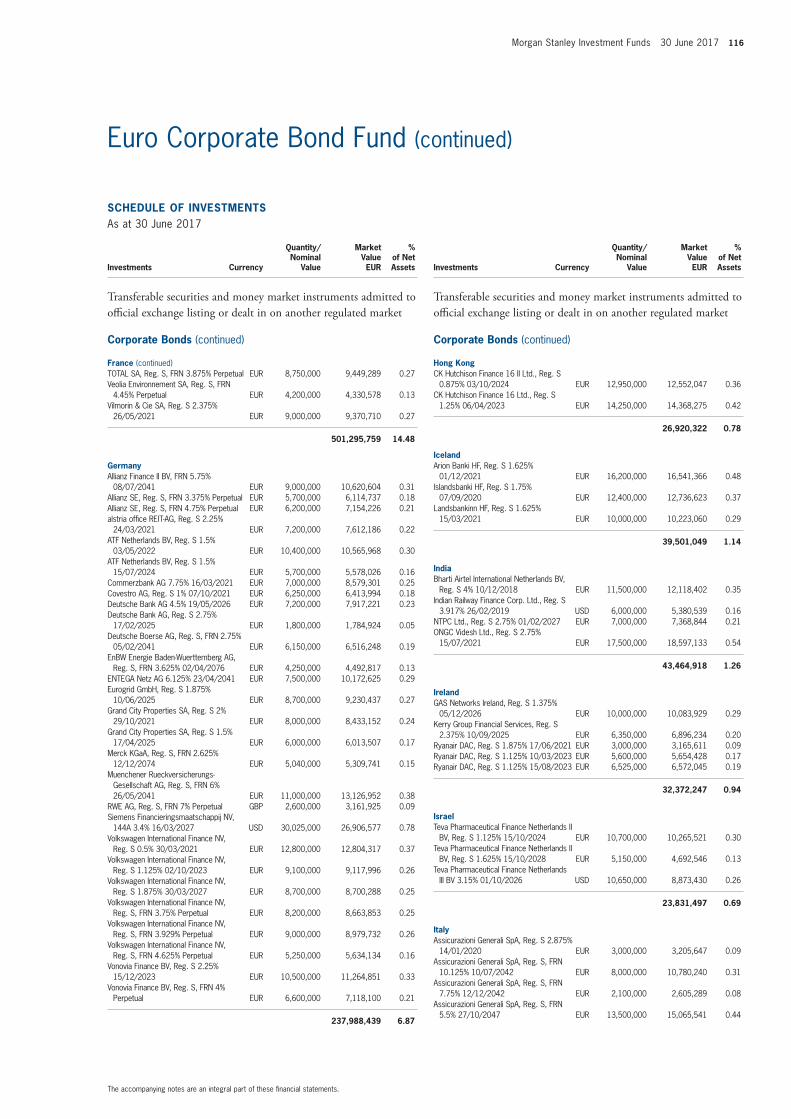
Morgan Stanley Investment Funds 30 June 2017 116
The accompanying notes are an integral part of these fi nancial statements.
Euro Corporate Bond Fund (continued)
SCHEDULE OF INVESTMENTSAs at 30 June 2017
Investments Currency
Quantity/Nominal
Value
Market Value EUR
% of Net Assets
Transferable securities and money market instruments admitted to offi cial exchange listing or dealt in on another regulated market
Corporate Bonds (continued)
France (continued)TOTAL SA, Reg. S, FRN 3.875% Perpetual EUR 8,750,000 9,449,289 0.27 Veolia Environnement SA, Reg. S, FRN
4.45% Perpetual EUR 4,200,000 4,330,578 0.13 Vilmorin & Cie SA, Reg. S 2.375%
26/05/2021 EUR 9,000,000 9,370,710 0.27
501,295,759 14.48
GermanyAllianz Finance II BV, FRN 5.75%
08/07/2041 EUR 9,000,000 10,620,604 0.31 Allianz SE, Reg. S, FRN 3.375% Perpetual EUR 5,700,000 6,114,737 0.18 Allianz SE, Reg. S, FRN 4.75% Perpetual EUR 6,200,000 7,154,226 0.21 alstria offi ce REIT-AG, Reg. S 2.25%
24/03/2021 EUR 7,200,000 7,612,186 0.22 ATF Netherlands BV, Reg. S 1.5%
03/05/2022 EUR 10,400,000 10,565,968 0.30 ATF Netherlands BV, Reg. S 1.5%
15/07/2024 EUR 5,700,000 5,578,026 0.16 Commerzbank AG 7.75% 16/03/2021 EUR 7,000,000 8,579,301 0.25 Covestro AG, Reg. S 1% 07/10/2021 EUR 6,250,000 6,413,994 0.18 Deutsche Bank AG 4.5% 19/05/2026 EUR 7,200,000 7,917,221 0.23 Deutsche Bank AG, Reg. S 2.75%
17/02/2025 EUR 1,800,000 1,784,924 0.05 Deutsche Boerse AG, Reg. S, FRN 2.75%
05/02/2041 EUR 6,150,000 6,516,248 0.19 EnBW Energie Baden-Wuerttemberg AG,
Reg. S, FRN 3.625% 02/04/2076 EUR 4,250,000 4,492,817 0.13 ENTEGA Netz AG 6.125% 23/04/2041 EUR 7,500,000 10,172,625 0.29 Eurogrid GmbH, Reg. S 1.875%
10/06/2025 EUR 8,700,000 9,230,437 0.27 Grand City Properties SA, Reg. S 2%
29/10/2021 EUR 8,000,000 8,433,152 0.24 Grand City Properties SA, Reg. S 1.5%
17/04/2025 EUR 6,000,000 6,013,507 0.17 Merck KGaA, Reg. S, FRN 2.625%
12/12/2074 EUR 5,040,000 5,309,741 0.15 Muenchener Rueckversicherungs-
Gesellschaft AG, Reg. S, FRN 6% 26/05/2041 EUR 11,000,000 13,126,952 0.38
RWE AG, Reg. S, FRN 7% Perpetual GBP 2,600,000 3,161,925 0.09 Siemens Financieringsmaatschappij NV,
144A 3.4% 16/03/2027 USD 30,025,000 26,906,577 0.78 Volkswagen International Finance NV,
Reg. S 0.5% 30/03/2021 EUR 12,800,000 12,804,317 0.37 Volkswagen International Finance NV,
Reg. S 1.125% 02/10/2023 EUR 9,100,000 9,117,996 0.26 Volkswagen International Finance NV,
Reg. S 1.875% 30/03/2027 EUR 8,700,000 8,700,288 0.25 Volkswagen International Finance NV,
Reg. S, FRN 3.75% Perpetual EUR 8,200,000 8,663,853 0.25 Volkswagen International Finance NV,
Reg. S, FRN 3.929% Perpetual EUR 9,000,000 8,979,732 0.26 Volkswagen International Finance NV,
Reg. S, FRN 4.625% Perpetual EUR 5,250,000 5,634,134 0.16 Vonovia Finance BV, Reg. S 2.25%
15/12/2023 EUR 10,500,000 11,264,851 0.33 Vonovia Finance BV, Reg. S, FRN 4%
Perpetual EUR 6,600,000 7,118,100 0.21
237,988,439 6.87
SCHEDULE OF INVESTMENTSAs at 30 June 2017
Investments Currency
Quantity/Nominal
Value
Market Value EUR
% of Net Assets
Transferable securities and money market instruments admitted to offi cial exchange listing or dealt in on another regulated market
Corporate Bonds (continued)
Hong KongCK Hutchison Finance 16 II Ltd., Reg. S
0.875% 03/10/2024 EUR 12,950,000 12,552,047 0.36 CK Hutchison Finance 16 Ltd., Reg. S
1.25% 06/04/2023 EUR 14,250,000 14,368,275 0.42
26,920,322 0.78
IcelandArion Banki HF, Reg. S 1.625%
01/12/2021 EUR 16,200,000 16,541,366 0.48 Islandsbanki HF, Reg. S 1.75%
07/09/2020 EUR 12,400,000 12,736,623 0.37 Landsbankinn HF, Reg. S 1.625%
15/03/2021 EUR 10,000,000 10,223,060 0.29
39,501,049 1.14
IndiaBharti Airtel International Netherlands BV,
Reg. S 4% 10/12/2018 EUR 11,500,000 12,118,402 0.35 Indian Railway Finance Corp. Ltd., Reg. S
3.917% 26/02/2019 USD 6,000,000 5,380,539 0.16 NTPC Ltd., Reg. S 2.75% 01/02/2027 EUR 7,000,000 7,368,844 0.21 ONGC Videsh Ltd., Reg. S 2.75%
15/07/2021 EUR 17,500,000 18,597,133 0.54
43,464,918 1.26
IrelandGAS Networks Ireland, Reg. S 1.375%
05/12/2026 EUR 10,000,000 10,083,929 0.29 Kerry Group Financial Services, Reg. S
2.375% 10/09/2025 EUR 6,350,000 6,896,234 0.20 Ryanair DAC, Reg. S 1.875% 17/06/2021 EUR 3,000,000 3,165,611 0.09 Ryanair DAC, Reg. S 1.125% 10/03/2023 EUR 5,600,000 5,654,428 0.17 Ryanair DAC, Reg. S 1.125% 15/08/2023 EUR 6,525,000 6,572,045 0.19
32,372,247 0.94
IsraelTeva Pharmaceutical Finance Netherlands II
BV, Reg. S 1.125% 15/10/2024 EUR 10,700,000 10,265,521 0.30 Teva Pharmaceutical Finance Netherlands II
BV, Reg. S 1.625% 15/10/2028 EUR 5,150,000 4,692,546 0.13 Teva Pharmaceutical Finance Netherlands
III BV 3.15% 01/10/2026 USD 10,650,000 8,873,430 0.26
23,831,497 0.69
ItalyAssicurazioni Generali SpA, Reg. S 2.875%
14/01/2020 EUR 3,000,000 3,205,647 0.09 Assicurazioni Generali SpA, Reg. S, FRN
10.125% 10/07/2042 EUR 8,000,000 10,780,240 0.31 Assicurazioni Generali SpA, Reg. S, FRN
7.75% 12/12/2042 EUR 2,100,000 2,605,289 0.08 Assicurazioni Generali SpA, Reg. S, FRN
5.5% 27/10/2047 EUR 13,500,000 15,065,541 0.44
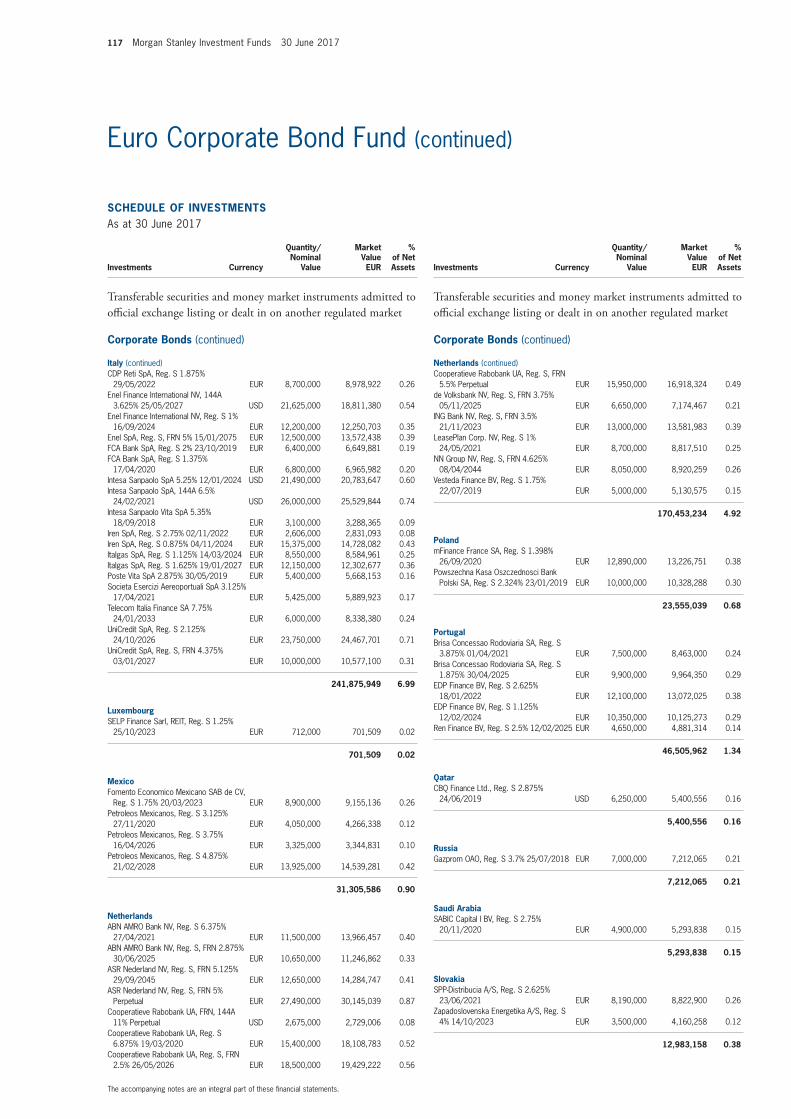
117 Morgan Stanley Investment Funds 30 June 2017
The accompanying notes are an integral part of these fi nancial statements.
Euro Corporate Bond Fund (continued)
SCHEDULE OF INVESTMENTSAs at 30 June 2017
Investments Currency
Quantity/Nominal
Value
Market Value EUR
% of Net Assets
Transferable securities and money market instruments admitted to offi cial exchange listing or dealt in on another regulated market
Corporate Bonds (continued)
Italy (continued)CDP Reti SpA, Reg. S 1.875%
29/05/2022 EUR 8,700,000 8,978,922 0.26 Enel Finance International NV, 144A
3.625% 25/05/2027 USD 21,625,000 18,811,380 0.54 Enel Finance International NV, Reg. S 1%
16/09/2024 EUR 12,200,000 12,250,703 0.35 Enel SpA, Reg. S, FRN 5% 15/01/2075 EUR 12,500,000 13,572,438 0.39 FCA Bank SpA, Reg. S 2% 23/10/2019 EUR 6,400,000 6,649,881 0.19 FCA Bank SpA, Reg. S 1.375%
17/04/2020 EUR 6,800,000 6,965,982 0.20 Intesa Sanpaolo SpA 5.25% 12/01/2024 USD 21,490,000 20,783,647 0.60 Intesa Sanpaolo SpA, 144A 6.5%
24/02/2021 USD 26,000,000 25,529,844 0.74 Intesa Sanpaolo Vita SpA 5.35%
18/09/2018 EUR 3,100,000 3,288,365 0.09 Iren SpA, Reg. S 2.75% 02/11/2022 EUR 2,606,000 2,831,093 0.08 Iren SpA, Reg. S 0.875% 04/11/2024 EUR 15,375,000 14,728,082 0.43 Italgas SpA, Reg. S 1.125% 14/03/2024 EUR 8,550,000 8,584,961 0.25 Italgas SpA, Reg. S 1.625% 19/01/2027 EUR 12,150,000 12,302,677 0.36 Poste Vita SpA 2.875% 30/05/2019 EUR 5,400,000 5,668,153 0.16 Societa Esercizi Aereoportuali SpA 3.125%
17/04/2021 EUR 5,425,000 5,889,923 0.17 Telecom Italia Finance SA 7.75%
24/01/2033 EUR 6,000,000 8,338,380 0.24 UniCredit SpA, Reg. S 2.125%
24/10/2026 EUR 23,750,000 24,467,701 0.71 UniCredit SpA, Reg. S, FRN 4.375%
03/01/2027 EUR 10,000,000 10,577,100 0.31
241,875,949 6.99
LuxembourgSELP Finance Sarl, REIT, Reg. S 1.25%
25/10/2023 EUR 712,000 701,509 0.02
701,509 0.02
MexicoFomento Economico Mexicano SAB de CV,
Reg. S 1.75% 20/03/2023 EUR 8,900,000 9,155,136 0.26 Petroleos Mexicanos, Reg. S 3.125%
27/11/2020 EUR 4,050,000 4,266,338 0.12 Petroleos Mexicanos, Reg. S 3.75%
16/04/2026 EUR 3,325,000 3,344,831 0.10 Petroleos Mexicanos, Reg. S 4.875%
21/02/2028 EUR 13,925,000 14,539,281 0.42
31,305,586 0.90
NetherlandsABN AMRO Bank NV, Reg. S 6.375%
27/04/2021 EUR 11,500,000 13,966,457 0.40 ABN AMRO Bank NV, Reg. S, FRN 2.875%
30/06/2025 EUR 10,650,000 11,246,862 0.33 ASR Nederland NV, Reg. S, FRN 5.125%
29/09/2045 EUR 12,650,000 14,284,747 0.41 ASR Nederland NV, Reg. S, FRN 5%
Perpetual EUR 27,490,000 30,145,039 0.87 Cooperatieve Rabobank UA, FRN, 144A
11% Perpetual USD 2,675,000 2,729,006 0.08 Cooperatieve Rabobank UA, Reg. S
6.875% 19/03/2020 EUR 15,400,000 18,108,783 0.52 Cooperatieve Rabobank UA, Reg. S, FRN
2.5% 26/05/2026 EUR 18,500,000 19,429,222 0.56
SCHEDULE OF INVESTMENTSAs at 30 June 2017
Investments Currency
Quantity/Nominal
Value
Market Value EUR
% of Net Assets
Transferable securities and money market instruments admitted to offi cial exchange listing or dealt in on another regulated market
Corporate Bonds (continued)
Netherlands (continued)Cooperatieve Rabobank UA, Reg. S, FRN
5.5% Perpetual EUR 15,950,000 16,918,324 0.49 de Volksbank NV, Reg. S, FRN 3.75%
05/11/2025 EUR 6,650,000 7,174,467 0.21 ING Bank NV, Reg. S, FRN 3.5%
21/11/2023 EUR 13,000,000 13,581,983 0.39 LeasePlan Corp. NV, Reg. S 1%
24/05/2021 EUR 8,700,000 8,817,510 0.25 NN Group NV, Reg. S, FRN 4.625%
08/04/2044 EUR 8,050,000 8,920,259 0.26 Vesteda Finance BV, Reg. S 1.75%
22/07/2019 EUR 5,000,000 5,130,575 0.15
170,453,234 4.92
PolandmFinance France SA, Reg. S 1.398%
26/09/2020 EUR 12,890,000 13,226,751 0.38 Powszechna Kasa Oszczednosci Bank
Polski SA, Reg. S 2.324% 23/01/2019 EUR 10,000,000 10,328,288 0.30
23,555,039 0.68
PortugalBrisa Concessao Rodoviaria SA, Reg. S
3.875% 01/04/2021 EUR 7,500,000 8,463,000 0.24 Brisa Concessao Rodoviaria SA, Reg. S
1.875% 30/04/2025 EUR 9,900,000 9,964,350 0.29 EDP Finance BV, Reg. S 2.625%
18/01/2022 EUR 12,100,000 13,072,025 0.38 EDP Finance BV, Reg. S 1.125%
12/02/2024 EUR 10,350,000 10,125,273 0.29 Ren Finance BV, Reg. S 2.5% 12/02/2025 EUR 4,650,000 4,881,314 0.14
46,505,962 1.34
QatarCBQ Finance Ltd., Reg. S 2.875%
24/06/2019 USD 6,250,000 5,400,556 0.16
5,400,556 0.16
RussiaGazprom OAO, Reg. S 3.7% 25/07/2018 EUR 7,000,000 7,212,065 0.21
7,212,065 0.21
Saudi ArabiaSABIC Capital I BV, Reg. S 2.75%
20/11/2020 EUR 4,900,000 5,293,838 0.15
5,293,838 0.15
SlovakiaSPP-Distribucia A/S, Reg. S 2.625%
23/06/2021 EUR 8,190,000 8,822,900 0.26 Zapadoslovenska Energetika A/S, Reg. S
4% 14/10/2023 EUR 3,500,000 4,160,258 0.12
12,983,158 0.38
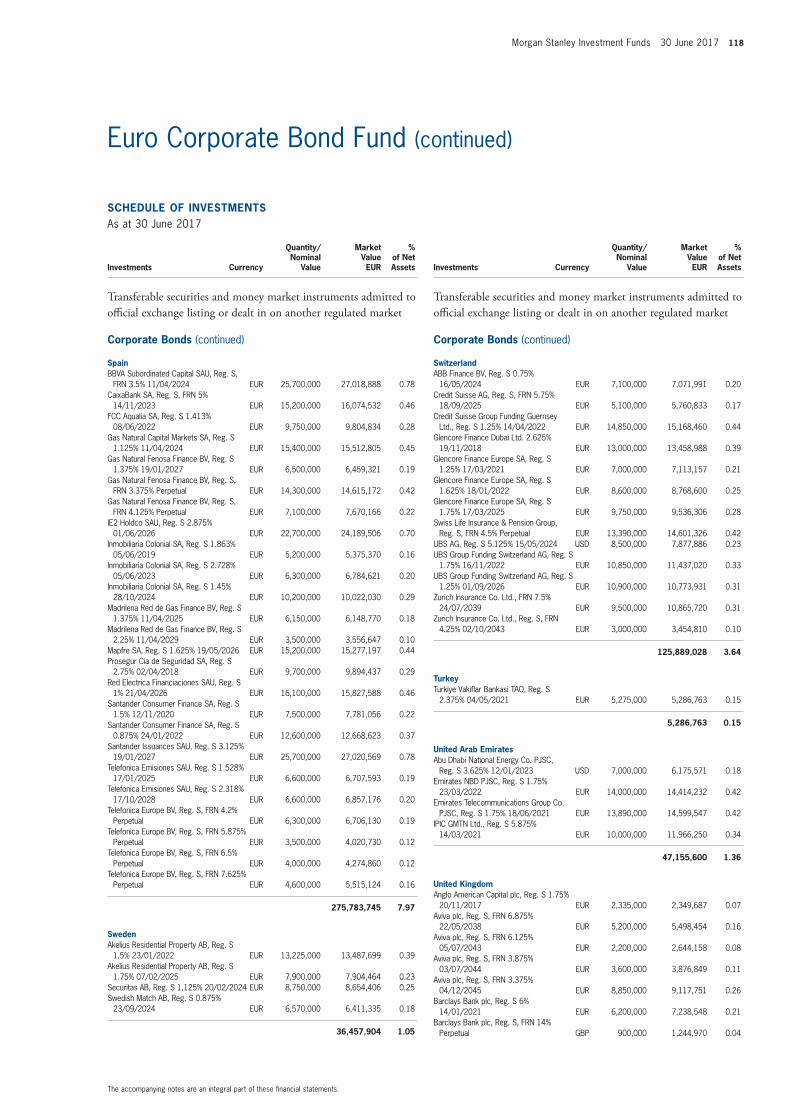
Morgan Stanley Investment Funds 30 June 2017 118
The accompanying notes are an integral part of these fi nancial statements.
Euro Corporate Bond Fund (continued)
SCHEDULE OF INVESTMENTSAs at 30 June 2017
Investments Currency
Quantity/Nominal
Value
Market Value EUR
% of Net Assets
Transferable securities and money market instruments admitted to offi cial exchange listing or dealt in on another regulated market
Corporate Bonds (continued)
SpainBBVA Subordinated Capital SAU, Reg. S,
FRN 3.5% 11/04/2024 EUR 25,700,000 27,018,888 0.78 CaixaBank SA, Reg. S, FRN 5%
14/11/2023 EUR 15,200,000 16,074,532 0.46 FCC Aqualia SA, Reg. S 1.413%
08/06/2022 EUR 9,750,000 9,804,834 0.28 Gas Natural Capital Markets SA, Reg. S
1.125% 11/04/2024 EUR 15,400,000 15,512,805 0.45 Gas Natural Fenosa Finance BV, Reg. S
1.375% 19/01/2027 EUR 6,500,000 6,459,321 0.19 Gas Natural Fenosa Finance BV, Reg. S,
FRN 3.375% Perpetual EUR 14,300,000 14,615,172 0.42 Gas Natural Fenosa Finance BV, Reg. S,
FRN 4.125% Perpetual EUR 7,100,000 7,670,166 0.22 IE2 Holdco SAU, Reg. S 2.875%
01/06/2026 EUR 22,700,000 24,189,506 0.70 Inmobiliaria Colonial SA, Reg. S 1.863%
05/06/2019 EUR 5,200,000 5,375,370 0.16 Inmobiliaria Colonial SA, Reg. S 2.728%
05/06/2023 EUR 6,300,000 6,784,621 0.20 Inmobiliaria Colonial SA, Reg. S 1.45%
28/10/2024 EUR 10,200,000 10,022,030 0.29 Madrilena Red de Gas Finance BV, Reg. S
1.375% 11/04/2025 EUR 6,150,000 6,148,770 0.18 Madrilena Red de Gas Finance BV, Reg. S
2.25% 11/04/2029 EUR 3,500,000 3,556,647 0.10 Mapfre SA, Reg. S 1.625% 19/05/2026 EUR 15,200,000 15,277,197 0.44 Prosegur Cia de Seguridad SA, Reg. S
2.75% 02/04/2018 EUR 9,700,000 9,894,437 0.29 Red Electrica Financiaciones SAU, Reg. S
1% 21/04/2026 EUR 16,100,000 15,827,588 0.46 Santander Consumer Finance SA, Reg. S
1.5% 12/11/2020 EUR 7,500,000 7,781,056 0.22 Santander Consumer Finance SA, Reg. S
0.875% 24/01/2022 EUR 12,600,000 12,668,623 0.37 Santander Issuances SAU, Reg. S 3.125%
19/01/2027 EUR 25,700,000 27,020,569 0.78 Telefonica Emisiones SAU, Reg. S 1.528%
17/01/2025 EUR 6,600,000 6,707,593 0.19 Telefonica Emisiones SAU, Reg. S 2.318%
17/10/2028 EUR 6,600,000 6,857,176 0.20 Telefonica Europe BV, Reg. S, FRN 4.2%
Perpetual EUR 6,300,000 6,706,130 0.19 Telefonica Europe BV, Reg. S, FRN 5.875%
Perpetual EUR 3,500,000 4,020,730 0.12 Telefonica Europe BV, Reg. S, FRN 6.5%
Perpetual EUR 4,000,000 4,274,860 0.12 Telefonica Europe BV, Reg. S, FRN 7.625%
Perpetual EUR 4,600,000 5,515,124 0.16
275,783,745 7.97
SwedenAkelius Residential Property AB, Reg. S
1.5% 23/01/2022 EUR 13,225,000 13,487,699 0.39 Akelius Residential Property AB, Reg. S
1.75% 07/02/2025 EUR 7,900,000 7,904,464 0.23 Securitas AB, Reg. S 1.125% 20/02/2024 EUR 8,750,000 8,654,406 0.25 Swedish Match AB, Reg. S 0.875%
23/09/2024 EUR 6,570,000 6,411,335 0.18
36,457,904 1.05
SCHEDULE OF INVESTMENTSAs at 30 June 2017
Investments Currency
Quantity/Nominal
Value
Market Value EUR
% of Net Assets
Transferable securities and money market instruments admitted to offi cial exchange listing or dealt in on another regulated market
Corporate Bonds (continued)
SwitzerlandABB Finance BV, Reg. S 0.75%
16/05/2024 EUR 7,100,000 7,071,991 0.20 Credit Suisse AG, Reg. S, FRN 5.75%
18/09/2025 EUR 5,100,000 5,760,833 0.17 Credit Suisse Group Funding Guernsey
Ltd., Reg. S 1.25% 14/04/2022 EUR 14,850,000 15,168,460 0.44 Glencore Finance Dubai Ltd. 2.625%
19/11/2018 EUR 13,000,000 13,458,988 0.39 Glencore Finance Europe SA, Reg. S
1.25% 17/03/2021 EUR 7,000,000 7,113,157 0.21 Glencore Finance Europe SA, Reg. S
1.625% 18/01/2022 EUR 8,600,000 8,768,600 0.25 Glencore Finance Europe SA, Reg. S
1.75% 17/03/2025 EUR 9,750,000 9,536,306 0.28 Swiss Life Insurance & Pension Group,
Reg. S, FRN 4.5% Perpetual EUR 13,390,000 14,601,326 0.42 UBS AG, Reg. S 5.125% 15/05/2024 USD 8,500,000 7,877,886 0.23 UBS Group Funding Switzerland AG, Reg. S
1.75% 16/11/2022 EUR 10,850,000 11,437,020 0.33 UBS Group Funding Switzerland AG, Reg. S
1.25% 01/09/2026 EUR 10,900,000 10,773,931 0.31 Zurich Insurance Co. Ltd., FRN 7.5%
24/07/2039 EUR 9,500,000 10,865,720 0.31 Zurich Insurance Co. Ltd., Reg. S, FRN
4.25% 02/10/2043 EUR 3,000,000 3,454,810 0.10
125,889,028 3.64
TurkeyTurkiye Vakifl ar Bankasi TAO, Reg. S
2.375% 04/05/2021 EUR 5,275,000 5,286,763 0.15
5,286,763 0.15
United Arab EmiratesAbu Dhabi National Energy Co. PJSC,
Reg. S 3.625% 12/01/2023 USD 7,000,000 6,175,571 0.18 Emirates NBD PJSC, Reg. S 1.75%
23/03/2022 EUR 14,000,000 14,414,232 0.42 Emirates Telecommunications Group Co.
PJSC, Reg. S 1.75% 18/06/2021 EUR 13,890,000 14,599,547 0.42 IPIC GMTN Ltd., Reg. S 5.875%
14/03/2021 EUR 10,000,000 11,966,250 0.34
47,155,600 1.36
United KingdomAnglo American Capital plc, Reg. S 1.75%
20/11/2017 EUR 2,335,000 2,349,687 0.07 Aviva plc, Reg. S, FRN 6.875%
22/05/2038 EUR 5,200,000 5,498,454 0.16 Aviva plc, Reg. S, FRN 6.125%
05/07/2043 EUR 2,200,000 2,644,158 0.08 Aviva plc, Reg. S, FRN 3.875%
03/07/2044 EUR 3,600,000 3,876,849 0.11 Aviva plc, Reg. S, FRN 3.375%
04/12/2045 EUR 8,850,000 9,117,751 0.26 Barclays Bank plc, Reg. S 6%
14/01/2021 EUR 6,200,000 7,238,548 0.21 Barclays Bank plc, Reg. S, FRN 14%
Perpetual GBP 900,000 1,244,970 0.04
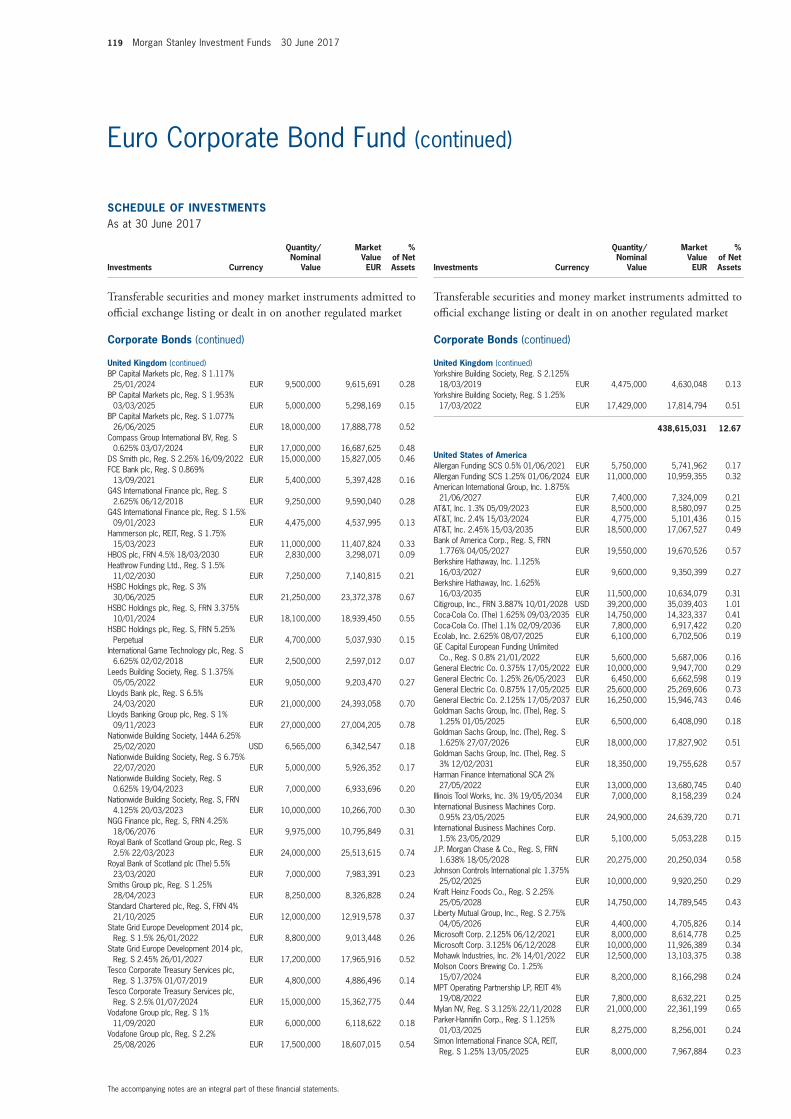
119 Morgan Stanley Investment Funds 30 June 2017
The accompanying notes are an integral part of these fi nancial statements.
Euro Corporate Bond Fund (continued)
SCHEDULE OF INVESTMENTSAs at 30 June 2017
Investments Currency
Quantity/Nominal
Value
Market Value EUR
% of Net Assets
Transferable securities and money market instruments admitted to offi cial exchange listing or dealt in on another regulated market
Corporate Bonds (continued)
United Kingdom (continued)BP Capital Markets plc, Reg. S 1.117%
25/01/2024 EUR 9,500,000 9,615,691 0.28 BP Capital Markets plc, Reg. S 1.953%
03/03/2025 EUR 5,000,000 5,298,169 0.15 BP Capital Markets plc, Reg. S 1.077%
26/06/2025 EUR 18,000,000 17,888,778 0.52 Compass Group International BV, Reg. S
0.625% 03/07/2024 EUR 17,000,000 16,687,625 0.48 DS Smith plc, Reg. S 2.25% 16/09/2022 EUR 15,000,000 15,827,005 0.46 FCE Bank plc, Reg. S 0.869%
13/09/2021 EUR 5,400,000 5,397,428 0.16 G4S International Finance plc, Reg. S
2.625% 06/12/2018 EUR 9,250,000 9,590,040 0.28 G4S International Finance plc, Reg. S 1.5%
09/01/2023 EUR 4,475,000 4,537,995 0.13 Hammerson plc, REIT, Reg. S 1.75%
15/03/2023 EUR 11,000,000 11,407,824 0.33 HBOS plc, FRN 4.5% 18/03/2030 EUR 2,830,000 3,298,071 0.09 Heathrow Funding Ltd., Reg. S 1.5%
11/02/2030 EUR 7,250,000 7,140,815 0.21 HSBC Holdings plc, Reg. S 3%
30/06/2025 EUR 21,250,000 23,372,378 0.67 HSBC Holdings plc, Reg. S, FRN 3.375%
10/01/2024 EUR 18,100,000 18,939,450 0.55 HSBC Holdings plc, Reg. S, FRN 5.25%
Perpetual EUR 4,700,000 5,037,930 0.15 International Game Technology plc, Reg. S
6.625% 02/02/2018 EUR 2,500,000 2,597,012 0.07 Leeds Building Society, Reg. S 1.375%
05/05/2022 EUR 9,050,000 9,203,470 0.27 Lloyds Bank plc, Reg. S 6.5%
24/03/2020 EUR 21,000,000 24,393,058 0.70 Lloyds Banking Group plc, Reg. S 1%
09/11/2023 EUR 27,000,000 27,004,205 0.78 Nationwide Building Society, 144A 6.25%
25/02/2020 USD 6,565,000 6,342,547 0.18 Nationwide Building Society, Reg. S 6.75%
22/07/2020 EUR 5,000,000 5,926,352 0.17 Nationwide Building Society, Reg. S
0.625% 19/04/2023 EUR 7,000,000 6,933,696 0.20 Nationwide Building Society, Reg. S, FRN
4.125% 20/03/2023 EUR 10,000,000 10,266,700 0.30 NGG Finance plc, Reg. S, FRN 4.25%
18/06/2076 EUR 9,975,000 10,795,849 0.31 Royal Bank of Scotland Group plc, Reg. S
2.5% 22/03/2023 EUR 24,000,000 25,513,615 0.74 Royal Bank of Scotland plc (The) 5.5%
23/03/2020 EUR 7,000,000 7,983,391 0.23 Smiths Group plc, Reg. S 1.25%
28/04/2023 EUR 8,250,000 8,326,828 0.24 Standard Chartered plc, Reg. S, FRN 4%
21/10/2025 EUR 12,000,000 12,919,578 0.37 State Grid Europe Development 2014 plc,
Reg. S 1.5% 26/01/2022 EUR 8,800,000 9,013,448 0.26 State Grid Europe Development 2014 plc,
Reg. S 2.45% 26/01/2027 EUR 17,200,000 17,965,916 0.52 Tesco Corporate Treasury Services plc,
Reg. S 1.375% 01/07/2019 EUR 4,800,000 4,886,496 0.14 Tesco Corporate Treasury Services plc,
Reg. S 2.5% 01/07/2024 EUR 15,000,000 15,362,775 0.44 Vodafone Group plc, Reg. S 1%
11/09/2020 EUR 6,000,000 6,118,622 0.18 Vodafone Group plc, Reg. S 2.2%
25/08/2026 EUR 17,500,000 18,607,015 0.54
SCHEDULE OF INVESTMENTSAs at 30 June 2017
Investments Currency
Quantity/Nominal
Value
Market Value EUR
% of Net Assets
Transferable securities and money market instruments admitted to offi cial exchange listing or dealt in on another regulated market
Corporate Bonds (continued)
United Kingdom (continued)Yorkshire Building Society, Reg. S 2.125%
18/03/2019 EUR 4,475,000 4,630,048 0.13 Yorkshire Building Society, Reg. S 1.25%
17/03/2022 EUR 17,429,000 17,814,794 0.51
438,615,031 12.67
United States of AmericaAllergan Funding SCS 0.5% 01/06/2021 EUR 5,750,000 5,741,962 0.17 Allergan Funding SCS 1.25% 01/06/2024 EUR 11,000,000 10,959,355 0.32 American International Group, Inc. 1.875%
21/06/2027 EUR 7,400,000 7,324,009 0.21 AT&T, Inc. 1.3% 05/09/2023 EUR 8,500,000 8,580,097 0.25 AT&T, Inc. 2.4% 15/03/2024 EUR 4,775,000 5,101,436 0.15 AT&T, Inc. 2.45% 15/03/2035 EUR 18,500,000 17,067,527 0.49 Bank of America Corp., Reg. S, FRN
1.776% 04/05/2027 EUR 19,550,000 19,670,526 0.57 Berkshire Hathaway, Inc. 1.125%
16/03/2027 EUR 9,600,000 9,350,399 0.27 Berkshire Hathaway, Inc. 1.625%
16/03/2035 EUR 11,500,000 10,634,079 0.31 Citigroup, Inc., FRN 3.887% 10/01/2028 USD 39,200,000 35,039,403 1.01 Coca-Cola Co. (The) 1.625% 09/03/2035 EUR 14,750,000 14,323,337 0.41 Coca-Cola Co. (The) 1.1% 02/09/2036 EUR 7,800,000 6,917,422 0.20 Ecolab, Inc. 2.625% 08/07/2025 EUR 6,100,000 6,702,506 0.19 GE Capital European Funding Unlimited
Co., Reg. S 0.8% 21/01/2022 EUR 5,600,000 5,687,006 0.16 General Electric Co. 0.375% 17/05/2022 EUR 10,000,000 9,947,700 0.29 General Electric Co. 1.25% 26/05/2023 EUR 6,450,000 6,662,598 0.19 General Electric Co. 0.875% 17/05/2025 EUR 25,600,000 25,269,606 0.73 General Electric Co. 2.125% 17/05/2037 EUR 16,250,000 15,946,743 0.46 Goldman Sachs Group, Inc. (The), Reg. S
1.25% 01/05/2025 EUR 6,500,000 6,408,090 0.18 Goldman Sachs Group, Inc. (The), Reg. S
1.625% 27/07/2026 EUR 18,000,000 17,827,902 0.51 Goldman Sachs Group, Inc. (The), Reg. S
3% 12/02/2031 EUR 18,350,000 19,755,628 0.57 Harman Finance International SCA 2%
27/05/2022 EUR 13,000,000 13,680,745 0.40 Illinois Tool Works, Inc. 3% 19/05/2034 EUR 7,000,000 8,158,239 0.24 International Business Machines Corp.
0.95% 23/05/2025 EUR 24,900,000 24,639,720 0.71 International Business Machines Corp.
1.5% 23/05/2029 EUR 5,100,000 5,053,228 0.15 J.P. Morgan Chase & Co., Reg. S, FRN
1.638% 18/05/2028 EUR 20,275,000 20,250,034 0.58 Johnson Controls International plc 1.375%
25/02/2025 EUR 10,000,000 9,920,250 0.29 Kraft Heinz Foods Co., Reg. S 2.25%
25/05/2028 EUR 14,750,000 14,789,545 0.43 Liberty Mutual Group, Inc., Reg. S 2.75%
04/05/2026 EUR 4,400,000 4,705,826 0.14 Microsoft Corp. 2.125% 06/12/2021 EUR 8,000,000 8,614,778 0.25 Microsoft Corp. 3.125% 06/12/2028 EUR 10,000,000 11,926,389 0.34 Mohawk Industries, Inc. 2% 14/01/2022 EUR 12,500,000 13,103,375 0.38 Molson Coors Brewing Co. 1.25%
15/07/2024 EUR 8,200,000 8,166,298 0.24 MPT Operating Partnership LP, REIT 4%
19/08/2022 EUR 7,800,000 8,632,221 0.25 Mylan NV, Reg. S 3.125% 22/11/2028 EUR 21,000,000 22,361,199 0.65 Parker-Hannifi n Corp., Reg. S 1.125%
01/03/2025 EUR 8,275,000 8,256,001 0.24 Simon International Finance SCA, REIT,
Reg. S 1.25% 13/05/2025 EUR 8,000,000 7,967,884 0.23
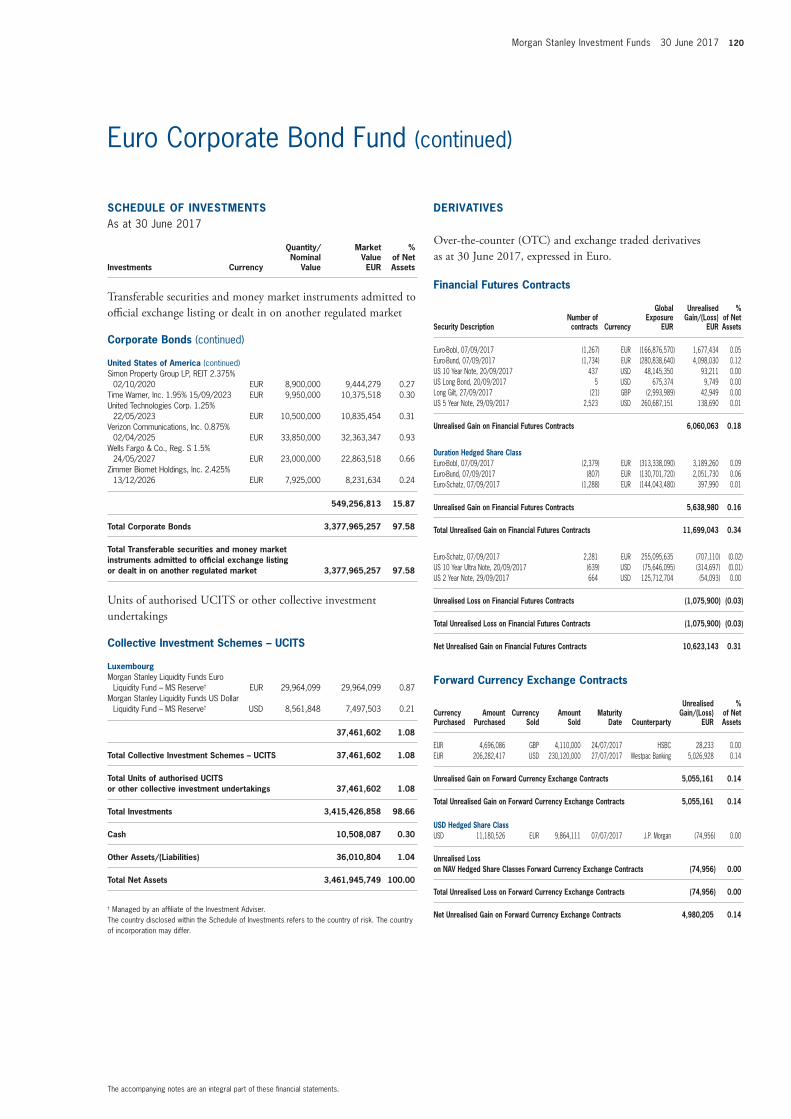
Morgan Stanley Investment Funds 30 June 2017 120
The accompanying notes are an integral part of these fi nancial statements.
Euro Corporate Bond Fund (continued)
SCHEDULE OF INVESTMENTSAs at 30 June 2017
Investments Currency
Quantity/Nominal
Value
Market Value EUR
% of Net Assets
Transferable securities and money market instruments admitted to offi cial exchange listing or dealt in on another regulated market
Corporate Bonds (continued)
United States of America (continued)Simon Property Group LP, REIT 2.375%
02/10/2020 EUR 8,900,000 9,444,279 0.27 Time Warner, Inc. 1.95% 15/09/2023 EUR 9,950,000 10,375,518 0.30 United Technologies Corp. 1.25%
22/05/2023 EUR 10,500,000 10,835,454 0.31 Verizon Communications, Inc. 0.875%
02/04/2025 EUR 33,850,000 32,363,347 0.93 Wells Fargo & Co., Reg. S 1.5%
24/05/2027 EUR 23,000,000 22,863,518 0.66 Zimmer Biomet Holdings, Inc. 2.425%
13/12/2026 EUR 7,925,000 8,231,634 0.24
549,256,813 15.87
Total Corporate Bonds 3,377,965,257 97.58
Total Transferable securities and money market instruments admitted to offi cial exchange listing or dealt in on another regulated market 3,377,965,257 97.58
Units of authorised UCITS or other collective investment undertakings
Collective Investment Schemes – UCITS
LuxembourgMorgan Stanley Liquidity Funds Euro
Liquidity Fund – MS Reserve† EUR 29,964,099 29,964,099 0.87 Morgan Stanley Liquidity Funds US Dollar
Liquidity Fund – MS Reserve† USD 8,561,848 7,497,503 0.21
37,461,602 1.08
Total Collective Investment Schemes – UCITS 37,461,602 1.08
Total Units of authorised UCITS or other collective investment undertakings 37,461,602 1.08
Total Investments 3,415,426,858 98.66
Cash 10,508,087 0.30
Other Assets/(Liabilities) 36,010,804 1.04
Total Net Assets 3,461,945,749 100.00
† Managed by an affi liate of the Investment Adviser.The country disclosed within the Schedule of Investments refers to the country of risk. The country of incorporation may differ.
Financial Futures Contracts
Security DescriptionNumber of contracts Currency
Global Exposure
EUR
Unrealised Gain/(Loss)
EUR
% of Net Assets
Euro-Bobl, 07/09/2017 (1,267) EUR (166,876,570) 1,677,434 0.05 Euro-Bund, 07/09/2017 (1,734) EUR (280,838,640) 4,098,030 0.12 US 10 Year Note, 20/09/2017 437 USD 48,145,350 93,211 0.00 US Long Bond, 20/09/2017 5 USD 675,374 9,749 0.00 Long Gilt, 27/09/2017 (21) GBP (2,993,989) 42,949 0.00 US 5 Year Note, 29/09/2017 2,523 USD 260,687,151 138,690 0.01
Unrealised Gain on Financial Futures Contracts 6,060,063 0.18
Duration Hedged Share ClassEuro-Bobl, 07/09/2017 (2,379) EUR (313,338,090) 3,189,260 0.09 Euro-Bund, 07/09/2017 (807) EUR (130,701,720) 2,051,730 0.06 Euro-Schatz, 07/09/2017 (1,288) EUR (144,043,480) 397,990 0.01
Unrealised Gain on Financial Futures Contracts 5,638,980 0.16
Total Unrealised Gain on Financial Futures Contracts 11,699,043 0.34
Euro-Schatz, 07/09/2017 2,281 EUR 255,095,635 (707,110) (0.02) US 10 Year Ultra Note, 20/09/2017 (639) USD (75,646,095) (314,697) (0.01) US 2 Year Note, 29/09/2017 664 USD 125,712,704 (54,093) 0.00
Unrealised Loss on Financial Futures Contracts (1,075,900) (0.03)
Total Unrealised Loss on Financial Futures Contracts (1,075,900) (0.03)
Net Unrealised Gain on Financial Futures Contracts 10,623,143 0.31
Forward Currency Exchange Contracts
Currency Purchased
Amount Purchased
Currency Sold
Amount Sold
Maturity Date Counterparty
Unrealised Gain/(Loss)
EUR
% of Net Assets
EUR 4,696,086 GBP 4,110,000 24/07/2017 HSBC 28,233 0.00 EUR 206,282,417 USD 230,120,000 27/07/2017 Westpac Banking 5,026,928 0.14
Unrealised Gain on Forward Currency Exchange Contracts 5,055,161 0.14
Total Unrealised Gain on Forward Currency Exchange Contracts 5,055,161 0.14
USD Hedged Share ClassUSD 11,180,526 EUR 9,864,111 07/07/2017 J.P. Morgan (74,956) 0.00
Unrealised Loss on NAV Hedged Share Classes Forward Currency Exchange Contracts (74,956) 0.00
Total Unrealised Loss on Forward Currency Exchange Contracts (74,956) 0.00
Net Unrealised Gain on Forward Currency Exchange Contracts 4,980,205 0.14
DERIVATIVES
Over-the-counter (OTC) and exchange traded derivatives as at 30 June 2017, expressed in Euro.
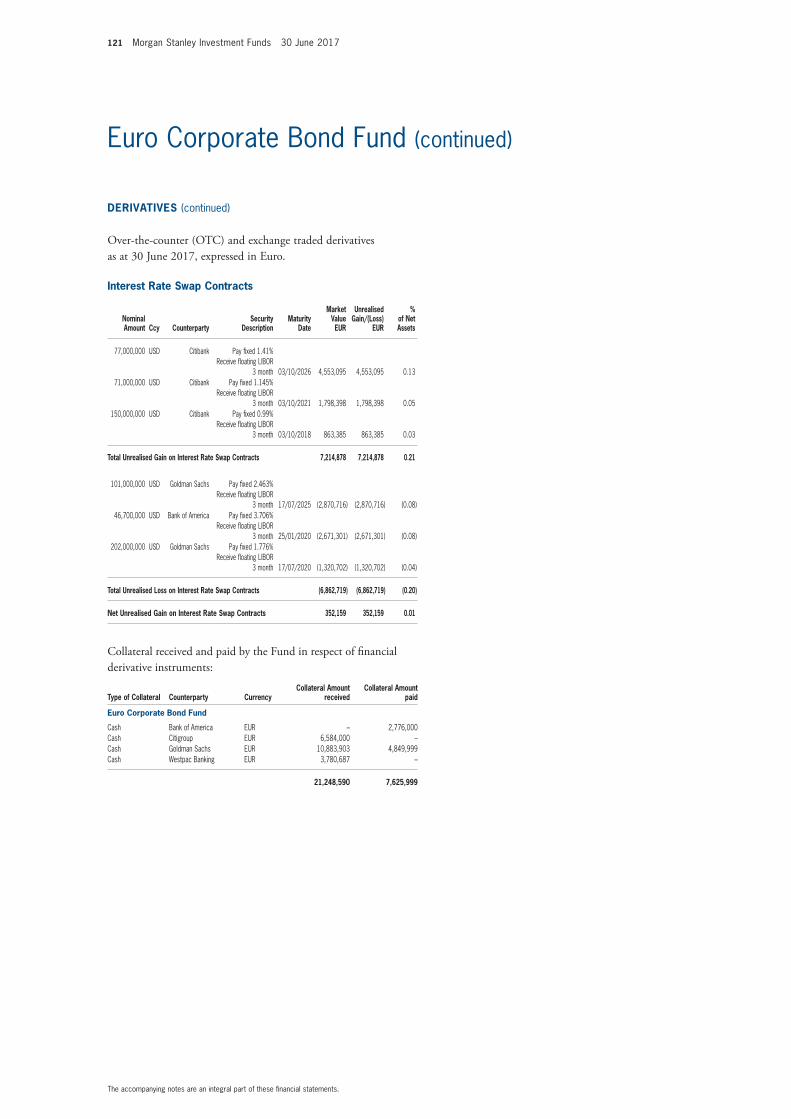
121 Morgan Stanley Investment Funds 30 June 2017
The accompanying notes are an integral part of these fi nancial statements.
Euro Corporate Bond Fund (continued)
Interest Rate Swap Contracts
Nominal Amount Ccy Counterparty
Security Description
Maturity Date
Market Value EUR
Unrealised Gain/(Loss)
EUR
% of Net Assets
77,000,000 USD Citibank Pay fi xed 1.41% Receive fl oating LIBOR
3 month 03/10/2026 4,553,095 4,553,095 0.13 71,000,000 USD Citibank Pay fi xed 1.145%
Receive fl oating LIBOR 3 month 03/10/2021 1,798,398 1,798,398 0.05
150,000,000 USD Citibank Pay fi xed 0.99% Receive fl oating LIBOR
3 month 03/10/2018 863,385 863,385 0.03
Total Unrealised Gain on Interest Rate Swap Contracts 7,214,878 7,214,878 0.21
101,000,000 USD Goldman Sachs Pay fi xed 2.463% Receive fl oating LIBOR
3 month 17/07/2025 (2,870,716) (2,870,716) (0.08) 46,700,000 USD Bank of America Pay fi xed 3.706%
Receive fl oating LIBOR 3 month 25/01/2020 (2,671,301) (2,671,301) (0.08)
202,000,000 USD Goldman Sachs Pay fi xed 1.776% Receive fl oating LIBOR
3 month 17/07/2020 (1,320,702) (1,320,702) (0.04)
Total Unrealised Loss on Interest Rate Swap Contracts (6,862,719) (6,862,719) (0.20)
Net Unrealised Gain on Interest Rate Swap Contracts 352,159 352,159 0.01
Collateral received and paid by the Fund in respect of fi nancial derivative instruments:
Type of Collateral Counterparty CurrencyCollateral Amount
receivedCollateral Amount
paid
Euro Corporate Bond Fund
Cash Bank of America EUR – 2,776,000Cash Citigroup EUR 6,584,000 –Cash Goldman Sachs EUR 10,883,903 4,849,999Cash Westpac Banking EUR 3,780,687 –
21,248,590 7,625,999
DERIVATIVES (continued)
Over-the-counter (OTC) and exchange traded derivatives as at 30 June 2017, expressed in Euro.
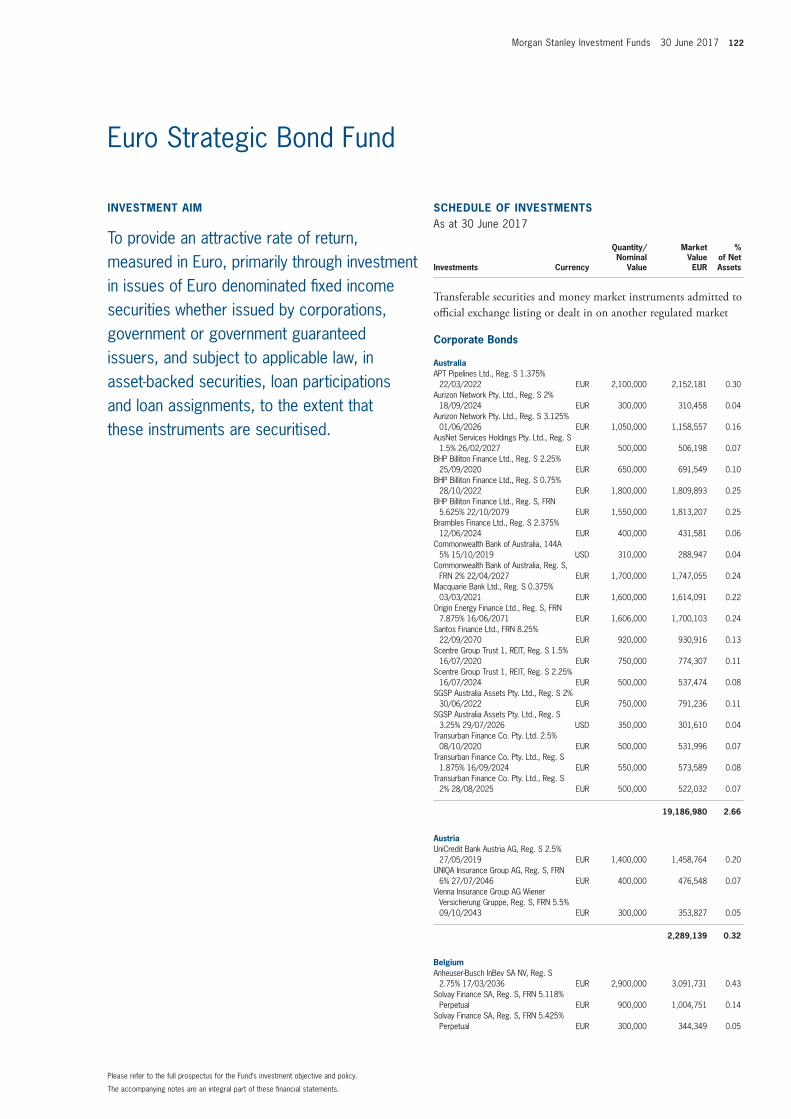
Morgan Stanley Investment Funds 30 June 2017 122
The accompanying notes are an integral part of these fi nancial statements.
Please refer to the full prospectus for the Fund’s investment objective and policy.
INVESTMENT AIM
To provide an attractive rate of return, measured in Euro, primarily through investment in issues of Euro denominated fi xed income securities whether issued by corporations, government or government guaranteed issuers, and subject to applicable law, in asset-backed securities, loan participations and loan assignments, to the extent that these instruments are securitised.
SCHEDULE OF INVESTMENTSAs at 30 June 2017
Investments Currency
Quantity/Nominal
Value
Market Value EUR
% of Net Assets
Transferable securities and money market instruments admitted to offi cial exchange listing or dealt in on another regulated market
Corporate Bonds
AustraliaAPT Pipelines Ltd., Reg. S 1.375%
22/03/2022 EUR 2,100,000 2,152,181 0.30 Aurizon Network Pty. Ltd., Reg. S 2%
18/09/2024 EUR 300,000 310,458 0.04 Aurizon Network Pty. Ltd., Reg. S 3.125%
01/06/2026 EUR 1,050,000 1,158,557 0.16 AusNet Services Holdings Pty. Ltd., Reg. S
1.5% 26/02/2027 EUR 500,000 506,198 0.07 BHP Billiton Finance Ltd., Reg. S 2.25%
25/09/2020 EUR 650,000 691,549 0.10 BHP Billiton Finance Ltd., Reg. S 0.75%
28/10/2022 EUR 1,800,000 1,809,893 0.25 BHP Billiton Finance Ltd., Reg. S, FRN
5.625% 22/10/2079 EUR 1,550,000 1,813,207 0.25 Brambles Finance Ltd., Reg. S 2.375%
12/06/2024 EUR 400,000 431,581 0.06 Commonwealth Bank of Australia, 144A
5% 15/10/2019 USD 310,000 288,947 0.04 Commonwealth Bank of Australia, Reg. S,
FRN 2% 22/04/2027 EUR 1,700,000 1,747,055 0.24 Macquarie Bank Ltd., Reg. S 0.375%
03/03/2021 EUR 1,600,000 1,614,091 0.22 Origin Energy Finance Ltd., Reg. S, FRN
7.875% 16/06/2071 EUR 1,606,000 1,700,103 0.24 Santos Finance Ltd., FRN 8.25%
22/09/2070 EUR 920,000 930,916 0.13 Scentre Group Trust 1, REIT, Reg. S 1.5%
16/07/2020 EUR 750,000 774,307 0.11 Scentre Group Trust 1, REIT, Reg. S 2.25%
16/07/2024 EUR 500,000 537,474 0.08 SGSP Australia Assets Pty. Ltd., Reg. S 2%
30/06/2022 EUR 750,000 791,236 0.11 SGSP Australia Assets Pty. Ltd., Reg. S
3.25% 29/07/2026 USD 350,000 301,610 0.04 Transurban Finance Co. Pty. Ltd. 2.5%
08/10/2020 EUR 500,000 531,996 0.07 Transurban Finance Co. Pty. Ltd., Reg. S
1.875% 16/09/2024 EUR 550,000 573,589 0.08 Transurban Finance Co. Pty. Ltd., Reg. S
2% 28/08/2025 EUR 500,000 522,032 0.07
19,186,980 2.66
AustriaUniCredit Bank Austria AG, Reg. S 2.5%
27/05/2019 EUR 1,400,000 1,458,764 0.20 UNIQA Insurance Group AG, Reg. S, FRN
6% 27/07/2046 EUR 400,000 476,548 0.07 Vienna Insurance Group AG Wiener
Versicherung Gruppe, Reg. S, FRN 5.5% 09/10/2043 EUR 300,000 353,827 0.05
2,289,139 0.32
BelgiumAnheuser-Busch InBev SA NV, Reg. S
2.75% 17/03/2036 EUR 2,900,000 3,091,731 0.43 Solvay Finance SA, Reg. S, FRN 5.118%
Perpetual EUR 900,000 1,004,751 0.14 Solvay Finance SA, Reg. S, FRN 5.425%
Perpetual EUR 300,000 344,349 0.05
Euro Strategic Bond Fund
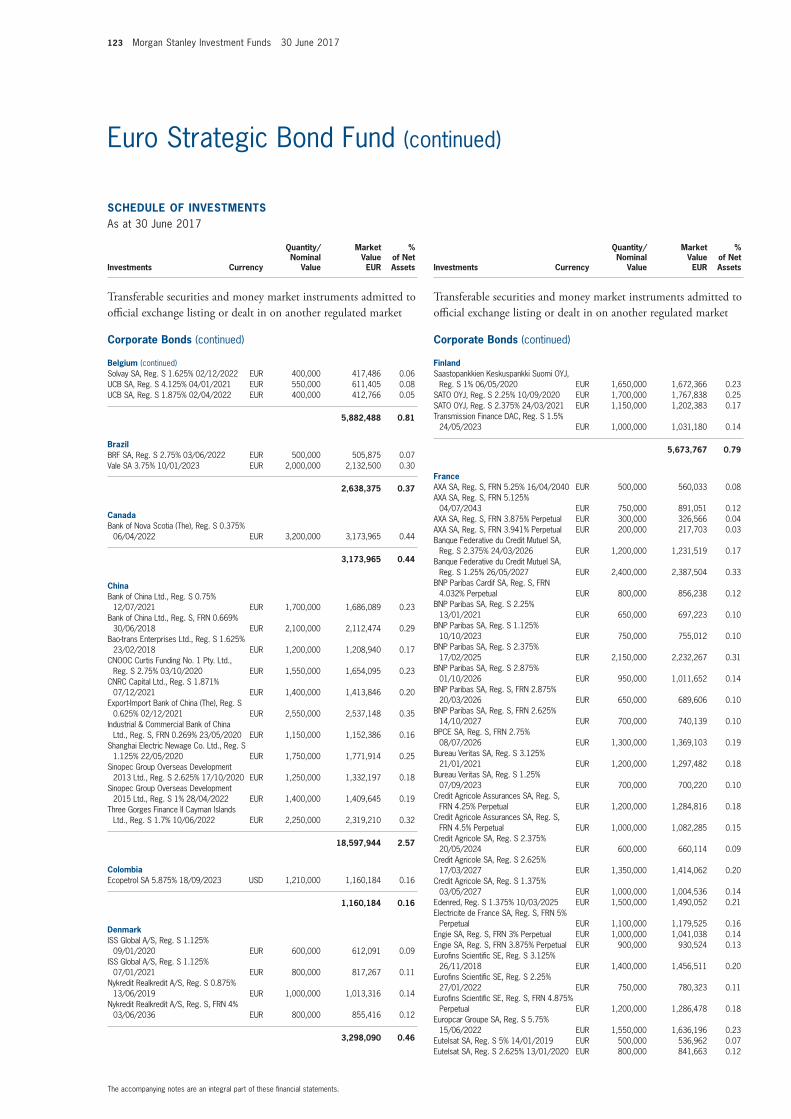
123 Morgan Stanley Investment Funds 30 June 2017
The accompanying notes are an integral part of these fi nancial statements.
Euro Strategic Bond Fund (continued)
SCHEDULE OF INVESTMENTSAs at 30 June 2017
Investments Currency
Quantity/Nominal
Value
Market Value EUR
% of Net Assets
Transferable securities and money market instruments admitted to offi cial exchange listing or dealt in on another regulated market
Corporate Bonds (continued)
Belgium (continued)Solvay SA, Reg. S 1.625% 02/12/2022 EUR 400,000 417,486 0.06 UCB SA, Reg. S 4.125% 04/01/2021 EUR 550,000 611,405 0.08 UCB SA, Reg. S 1.875% 02/04/2022 EUR 400,000 412,766 0.05
5,882,488 0.81
BrazilBRF SA, Reg. S 2.75% 03/06/2022 EUR 500,000 505,875 0.07 Vale SA 3.75% 10/01/2023 EUR 2,000,000 2,132,500 0.30
2,638,375 0.37
CanadaBank of Nova Scotia (The), Reg. S 0.375%
06/04/2022 EUR 3,200,000 3,173,965 0.44
3,173,965 0.44
ChinaBank of China Ltd., Reg. S 0.75%
12/07/2021 EUR 1,700,000 1,686,089 0.23 Bank of China Ltd., Reg. S, FRN 0.669%
30/06/2018 EUR 2,100,000 2,112,474 0.29 Bao-trans Enterprises Ltd., Reg. S 1.625%
23/02/2018 EUR 1,200,000 1,208,940 0.17 CNOOC Curtis Funding No. 1 Pty. Ltd.,
Reg. S 2.75% 03/10/2020 EUR 1,550,000 1,654,095 0.23 CNRC Capital Ltd., Reg. S 1.871%
07/12/2021 EUR 1,400,000 1,413,846 0.20 Export-Import Bank of China (The), Reg. S
0.625% 02/12/2021 EUR 2,550,000 2,537,148 0.35 Industrial & Commercial Bank of China
Ltd., Reg. S, FRN 0.269% 23/05/2020 EUR 1,150,000 1,152,386 0.16 Shanghai Electric Newage Co. Ltd., Reg. S
1.125% 22/05/2020 EUR 1,750,000 1,771,914 0.25 Sinopec Group Overseas Development
2013 Ltd., Reg. S 2.625% 17/10/2020 EUR 1,250,000 1,332,197 0.18 Sinopec Group Overseas Development
2015 Ltd., Reg. S 1% 28/04/2022 EUR 1,400,000 1,409,645 0.19 Three Gorges Finance II Cayman Islands
Ltd., Reg. S 1.7% 10/06/2022 EUR 2,250,000 2,319,210 0.32
18,597,944 2.57
ColombiaEcopetrol SA 5.875% 18/09/2023 USD 1,210,000 1,160,184 0.16
1,160,184 0.16
DenmarkISS Global A/S, Reg. S 1.125%
09/01/2020 EUR 600,000 612,091 0.09 ISS Global A/S, Reg. S 1.125%
07/01/2021 EUR 800,000 817,267 0.11 Nykredit Realkredit A/S, Reg. S 0.875%
13/06/2019 EUR 1,000,000 1,013,316 0.14 Nykredit Realkredit A/S, Reg. S, FRN 4%
03/06/2036 EUR 800,000 855,416 0.12
3,298,090 0.46
SCHEDULE OF INVESTMENTSAs at 30 June 2017
Investments Currency
Quantity/Nominal
Value
Market Value EUR
% of Net Assets
Transferable securities and money market instruments admitted to offi cial exchange listing or dealt in on another regulated market
Corporate Bonds (continued)
FinlandSaastopankkien Keskuspankki Suomi OYJ,
Reg. S 1% 06/05/2020 EUR 1,650,000 1,672,366 0.23 SATO OYJ, Reg. S 2.25% 10/09/2020 EUR 1,700,000 1,767,838 0.25 SATO OYJ, Reg. S 2.375% 24/03/2021 EUR 1,150,000 1,202,383 0.17 Transmission Finance DAC, Reg. S 1.5%
24/05/2023 EUR 1,000,000 1,031,180 0.14
5,673,767 0.79
FranceAXA SA, Reg. S, FRN 5.25% 16/04/2040 EUR 500,000 560,033 0.08 AXA SA, Reg. S, FRN 5.125%
04/07/2043 EUR 750,000 891,051 0.12 AXA SA, Reg. S, FRN 3.875% Perpetual EUR 300,000 326,566 0.04 AXA SA, Reg. S, FRN 3.941% Perpetual EUR 200,000 217,703 0.03 Banque Federative du Credit Mutuel SA,
Reg. S 2.375% 24/03/2026 EUR 1,200,000 1,231,519 0.17 Banque Federative du Credit Mutuel SA,
Reg. S 1.25% 26/05/2027 EUR 2,400,000 2,387,504 0.33 BNP Paribas Cardif SA, Reg. S, FRN
4.032% Perpetual EUR 800,000 856,238 0.12 BNP Paribas SA, Reg. S 2.25%
13/01/2021 EUR 650,000 697,223 0.10 BNP Paribas SA, Reg. S 1.125%
10/10/2023 EUR 750,000 755,012 0.10 BNP Paribas SA, Reg. S 2.375%
17/02/2025 EUR 2,150,000 2,232,267 0.31 BNP Paribas SA, Reg. S 2.875%
01/10/2026 EUR 950,000 1,011,652 0.14 BNP Paribas SA, Reg. S, FRN 2.875%
20/03/2026 EUR 650,000 689,606 0.10 BNP Paribas SA, Reg. S, FRN 2.625%
14/10/2027 EUR 700,000 740,139 0.10 BPCE SA, Reg. S, FRN 2.75%
08/07/2026 EUR 1,300,000 1,369,103 0.19 Bureau Veritas SA, Reg. S 3.125%
21/01/2021 EUR 1,200,000 1,297,482 0.18 Bureau Veritas SA, Reg. S 1.25%
07/09/2023 EUR 700,000 700,220 0.10 Credit Agricole Assurances SA, Reg. S,
FRN 4.25% Perpetual EUR 1,200,000 1,284,816 0.18 Credit Agricole Assurances SA, Reg. S,
FRN 4.5% Perpetual EUR 1,000,000 1,082,285 0.15 Credit Agricole SA, Reg. S 2.375%
20/05/2024 EUR 600,000 660,114 0.09 Credit Agricole SA, Reg. S 2.625%
17/03/2027 EUR 1,350,000 1,414,062 0.20 Credit Agricole SA, Reg. S 1.375%
03/05/2027 EUR 1,000,000 1,004,536 0.14 Edenred, Reg. S 1.375% 10/03/2025 EUR 1,500,000 1,490,052 0.21 Electricite de France SA, Reg. S, FRN 5%
Perpetual EUR 1,100,000 1,179,525 0.16 Engie SA, Reg. S, FRN 3% Perpetual EUR 1,000,000 1,041,038 0.14 Engie SA, Reg. S, FRN 3.875% Perpetual EUR 900,000 930,524 0.13 Eurofi ns Scientifi c SE, Reg. S 3.125%
26/11/2018 EUR 1,400,000 1,456,511 0.20 Eurofi ns Scientifi c SE, Reg. S 2.25%
27/01/2022 EUR 750,000 780,323 0.11 Eurofi ns Scientifi c SE, Reg. S, FRN 4.875%
Perpetual EUR 1,200,000 1,286,478 0.18 Europcar Groupe SA, Reg. S 5.75%
15/06/2022 EUR 1,550,000 1,636,196 0.23 Eutelsat SA, Reg. S 5% 14/01/2019 EUR 500,000 536,962 0.07 Eutelsat SA, Reg. S 2.625% 13/01/2020 EUR 800,000 841,663 0.12
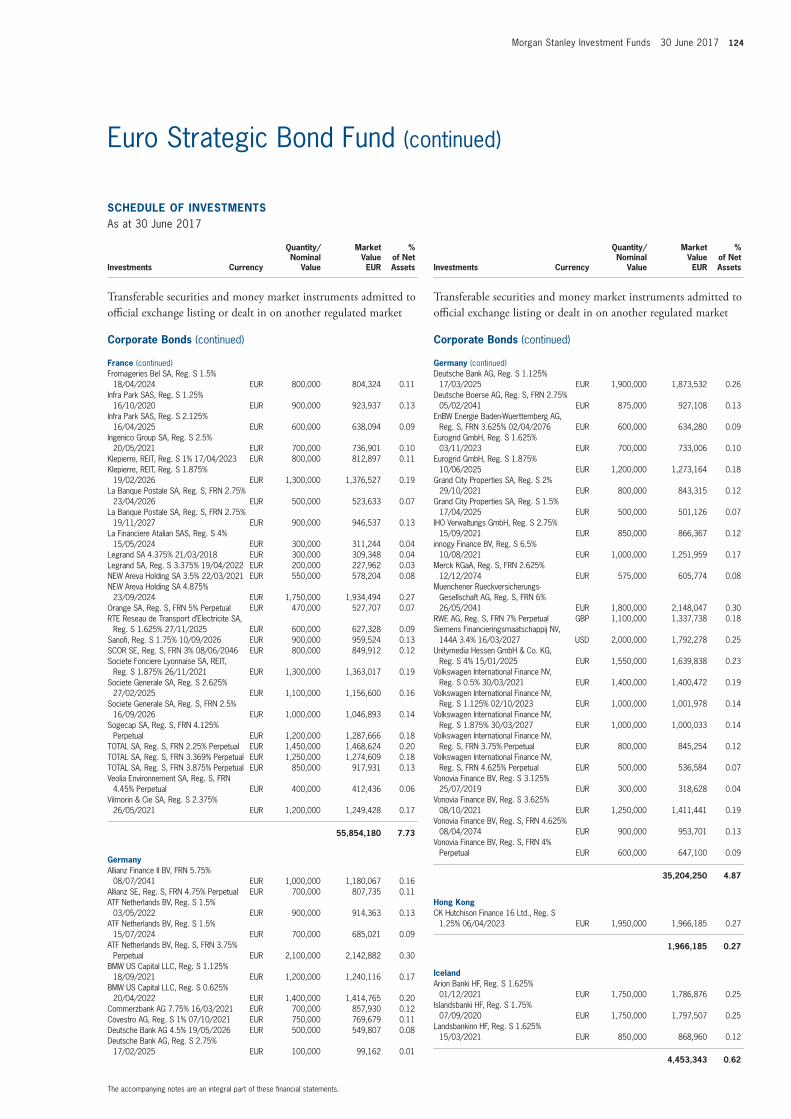
Morgan Stanley Investment Funds 30 June 2017 124
The accompanying notes are an integral part of these fi nancial statements.
Euro Strategic Bond Fund (continued)
SCHEDULE OF INVESTMENTSAs at 30 June 2017
Investments Currency
Quantity/Nominal
Value
Market Value EUR
% of Net Assets
Transferable securities and money market instruments admitted to offi cial exchange listing or dealt in on another regulated market
Corporate Bonds (continued)
France (continued)Fromageries Bel SA, Reg. S 1.5%
18/04/2024 EUR 800,000 804,324 0.11 Infra Park SAS, Reg. S 1.25%
16/10/2020 EUR 900,000 923,937 0.13 Infra Park SAS, Reg. S 2.125%
16/04/2025 EUR 600,000 638,094 0.09 Ingenico Group SA, Reg. S 2.5%
20/05/2021 EUR 700,000 736,901 0.10 Klepierre, REIT, Reg. S 1% 17/04/2023 EUR 800,000 812,897 0.11 Klepierre, REIT, Reg. S 1.875%
19/02/2026 EUR 1,300,000 1,376,527 0.19 La Banque Postale SA, Reg. S, FRN 2.75%
23/04/2026 EUR 500,000 523,633 0.07 La Banque Postale SA, Reg. S, FRN 2.75%
19/11/2027 EUR 900,000 946,537 0.13 La Financiere Atalian SAS, Reg. S 4%
15/05/2024 EUR 300,000 311,244 0.04 Legrand SA 4.375% 21/03/2018 EUR 300,000 309,348 0.04 Legrand SA, Reg. S 3.375% 19/04/2022 EUR 200,000 227,962 0.03 NEW Areva Holding SA 3.5% 22/03/2021 EUR 550,000 578,204 0.08 NEW Areva Holding SA 4.875%
23/09/2024 EUR 1,750,000 1,934,494 0.27 Orange SA, Reg. S, FRN 5% Perpetual EUR 470,000 527,707 0.07 RTE Reseau de Transport d’Electricite SA,
Reg. S 1.625% 27/11/2025 EUR 600,000 627,328 0.09 Sanofi , Reg. S 1.75% 10/09/2026 EUR 900,000 959,524 0.13 SCOR SE, Reg. S, FRN 3% 08/06/2046 EUR 800,000 849,912 0.12 Societe Fonciere Lyonnaise SA, REIT,
Reg. S 1.875% 26/11/2021 EUR 1,300,000 1,363,017 0.19 Societe Generale SA, Reg. S 2.625%
27/02/2025 EUR 1,100,000 1,156,600 0.16 Societe Generale SA, Reg. S, FRN 2.5%
16/09/2026 EUR 1,000,000 1,046,893 0.14 Sogecap SA, Reg. S, FRN 4.125%
Perpetual EUR 1,200,000 1,287,666 0.18 TOTAL SA, Reg. S, FRN 2.25% Perpetual EUR 1,450,000 1,468,624 0.20 TOTAL SA, Reg. S, FRN 3.369% Perpetual EUR 1,250,000 1,274,609 0.18 TOTAL SA, Reg. S, FRN 3.875% Perpetual EUR 850,000 917,931 0.13 Veolia Environnement SA, Reg. S, FRN
4.45% Perpetual EUR 400,000 412,436 0.06 Vilmorin & Cie SA, Reg. S 2.375%
26/05/2021 EUR 1,200,000 1,249,428 0.17
55,854,180 7.73
GermanyAllianz Finance II BV, FRN 5.75%
08/07/2041 EUR 1,000,000 1,180,067 0.16 Allianz SE, Reg. S, FRN 4.75% Perpetual EUR 700,000 807,735 0.11 ATF Netherlands BV, Reg. S 1.5%
03/05/2022 EUR 900,000 914,363 0.13 ATF Netherlands BV, Reg. S 1.5%
15/07/2024 EUR 700,000 685,021 0.09 ATF Netherlands BV, Reg. S, FRN 3.75%
Perpetual EUR 2,100,000 2,142,882 0.30 BMW US Capital LLC, Reg. S 1.125%
18/09/2021 EUR 1,200,000 1,240,116 0.17 BMW US Capital LLC, Reg. S 0.625%
20/04/2022 EUR 1,400,000 1,414,765 0.20 Commerzbank AG 7.75% 16/03/2021 EUR 700,000 857,930 0.12 Covestro AG, Reg. S 1% 07/10/2021 EUR 750,000 769,679 0.11 Deutsche Bank AG 4.5% 19/05/2026 EUR 500,000 549,807 0.08 Deutsche Bank AG, Reg. S 2.75%
17/02/2025 EUR 100,000 99,162 0.01
SCHEDULE OF INVESTMENTSAs at 30 June 2017
Investments Currency
Quantity/Nominal
Value
Market Value EUR
% of Net Assets
Transferable securities and money market instruments admitted to offi cial exchange listing or dealt in on another regulated market
Corporate Bonds (continued)
Germany (continued)Deutsche Bank AG, Reg. S 1.125%
17/03/2025 EUR 1,900,000 1,873,532 0.26 Deutsche Boerse AG, Reg. S, FRN 2.75%
05/02/2041 EUR 875,000 927,108 0.13 EnBW Energie Baden-Wuerttemberg AG,
Reg. S, FRN 3.625% 02/04/2076 EUR 600,000 634,280 0.09 Eurogrid GmbH, Reg. S 1.625%
03/11/2023 EUR 700,000 733,006 0.10 Eurogrid GmbH, Reg. S 1.875%
10/06/2025 EUR 1,200,000 1,273,164 0.18 Grand City Properties SA, Reg. S 2%
29/10/2021 EUR 800,000 843,315 0.12 Grand City Properties SA, Reg. S 1.5%
17/04/2025 EUR 500,000 501,126 0.07 IHO Verwaltungs GmbH, Reg. S 2.75%
15/09/2021 EUR 850,000 866,367 0.12 innogy Finance BV, Reg. S 6.5%
10/08/2021 EUR 1,000,000 1,251,959 0.17 Merck KGaA, Reg. S, FRN 2.625%
12/12/2074 EUR 575,000 605,774 0.08 Muenchener Rueckversicherungs-
Gesellschaft AG, Reg. S, FRN 6% 26/05/2041 EUR 1,800,000 2,148,047 0.30
RWE AG, Reg. S, FRN 7% Perpetual GBP 1,100,000 1,337,738 0.18 Siemens Financieringsmaatschappij NV,
144A 3.4% 16/03/2027 USD 2,000,000 1,792,278 0.25 Unitymedia Hessen GmbH & Co. KG,
Reg. S 4% 15/01/2025 EUR 1,550,000 1,639,838 0.23 Volkswagen International Finance NV,
Reg. S 0.5% 30/03/2021 EUR 1,400,000 1,400,472 0.19 Volkswagen International Finance NV,
Reg. S 1.125% 02/10/2023 EUR 1,000,000 1,001,978 0.14 Volkswagen International Finance NV,
Reg. S 1.875% 30/03/2027 EUR 1,000,000 1,000,033 0.14 Volkswagen International Finance NV,
Reg. S, FRN 3.75% Perpetual EUR 800,000 845,254 0.12 Volkswagen International Finance NV,
Reg. S, FRN 4.625% Perpetual EUR 500,000 536,584 0.07 Vonovia Finance BV, Reg. S 3.125%
25/07/2019 EUR 300,000 318,628 0.04 Vonovia Finance BV, Reg. S 3.625%
08/10/2021 EUR 1,250,000 1,411,441 0.19 Vonovia Finance BV, Reg. S, FRN 4.625%
08/04/2074 EUR 900,000 953,701 0.13 Vonovia Finance BV, Reg. S, FRN 4%
Perpetual EUR 600,000 647,100 0.09
35,204,250 4.87
Hong KongCK Hutchison Finance 16 Ltd., Reg. S
1.25% 06/04/2023 EUR 1,950,000 1,966,185 0.27
1,966,185 0.27
IcelandArion Banki HF, Reg. S 1.625%
01/12/2021 EUR 1,750,000 1,786,876 0.25 Islandsbanki HF, Reg. S 1.75%
07/09/2020 EUR 1,750,000 1,797,507 0.25 Landsbankinn HF, Reg. S 1.625%
15/03/2021 EUR 850,000 868,960 0.12
4,453,343 0.62
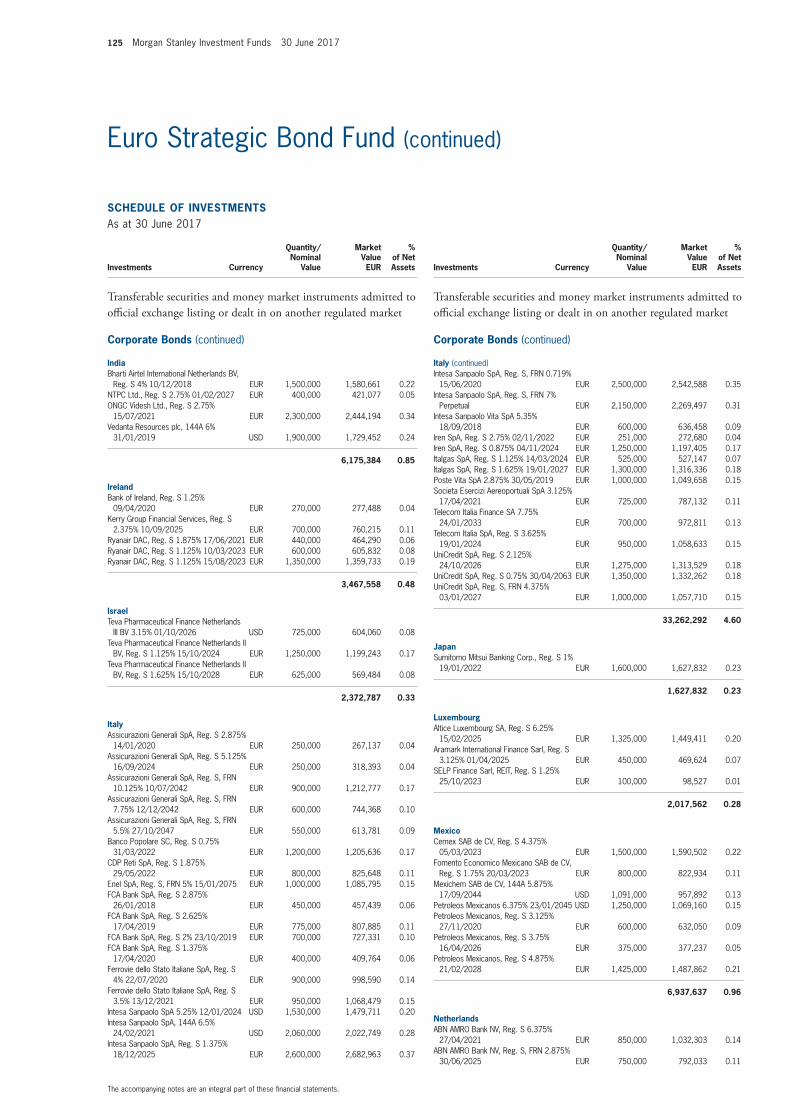
125 Morgan Stanley Investment Funds 30 June 2017
The accompanying notes are an integral part of these fi nancial statements.
Euro Strategic Bond Fund (continued)
SCHEDULE OF INVESTMENTSAs at 30 June 2017
Investments Currency
Quantity/Nominal
Value
Market Value EUR
% of Net Assets
Transferable securities and money market instruments admitted to offi cial exchange listing or dealt in on another regulated market
Corporate Bonds (continued)
IndiaBharti Airtel International Netherlands BV,
Reg. S 4% 10/12/2018 EUR 1,500,000 1,580,661 0.22 NTPC Ltd., Reg. S 2.75% 01/02/2027 EUR 400,000 421,077 0.05 ONGC Videsh Ltd., Reg. S 2.75%
15/07/2021 EUR 2,300,000 2,444,194 0.34 Vedanta Resources plc, 144A 6%
31/01/2019 USD 1,900,000 1,729,452 0.24
6,175,384 0.85
IrelandBank of Ireland, Reg. S 1.25%
09/04/2020 EUR 270,000 277,488 0.04 Kerry Group Financial Services, Reg. S
2.375% 10/09/2025 EUR 700,000 760,215 0.11 Ryanair DAC, Reg. S 1.875% 17/06/2021 EUR 440,000 464,290 0.06 Ryanair DAC, Reg. S 1.125% 10/03/2023 EUR 600,000 605,832 0.08 Ryanair DAC, Reg. S 1.125% 15/08/2023 EUR 1,350,000 1,359,733 0.19
3,467,558 0.48
IsraelTeva Pharmaceutical Finance Netherlands
III BV 3.15% 01/10/2026 USD 725,000 604,060 0.08 Teva Pharmaceutical Finance Netherlands II
BV, Reg. S 1.125% 15/10/2024 EUR 1,250,000 1,199,243 0.17 Teva Pharmaceutical Finance Netherlands II
BV, Reg. S 1.625% 15/10/2028 EUR 625,000 569,484 0.08
2,372,787 0.33
ItalyAssicurazioni Generali SpA, Reg. S 2.875%
14/01/2020 EUR 250,000 267,137 0.04 Assicurazioni Generali SpA, Reg. S 5.125%
16/09/2024 EUR 250,000 318,393 0.04 Assicurazioni Generali SpA, Reg. S, FRN
10.125% 10/07/2042 EUR 900,000 1,212,777 0.17 Assicurazioni Generali SpA, Reg. S, FRN
7.75% 12/12/2042 EUR 600,000 744,368 0.10 Assicurazioni Generali SpA, Reg. S, FRN
5.5% 27/10/2047 EUR 550,000 613,781 0.09 Banco Popolare SC, Reg. S 0.75%
31/03/2022 EUR 1,200,000 1,205,636 0.17 CDP Reti SpA, Reg. S 1.875%
29/05/2022 EUR 800,000 825,648 0.11 Enel SpA, Reg. S, FRN 5% 15/01/2075 EUR 1,000,000 1,085,795 0.15 FCA Bank SpA, Reg. S 2.875%
26/01/2018 EUR 450,000 457,439 0.06 FCA Bank SpA, Reg. S 2.625%
17/04/2019 EUR 775,000 807,885 0.11 FCA Bank SpA, Reg. S 2% 23/10/2019 EUR 700,000 727,331 0.10 FCA Bank SpA, Reg. S 1.375%
17/04/2020 EUR 400,000 409,764 0.06 Ferrovie dello Stato Italiane SpA, Reg. S
4% 22/07/2020 EUR 900,000 998,590 0.14 Ferrovie dello Stato Italiane SpA, Reg. S
3.5% 13/12/2021 EUR 950,000 1,068,479 0.15 Intesa Sanpaolo SpA 5.25% 12/01/2024 USD 1,530,000 1,479,711 0.20 Intesa Sanpaolo SpA, 144A 6.5%
24/02/2021 USD 2,060,000 2,022,749 0.28 Intesa Sanpaolo SpA, Reg. S 1.375%
18/12/2025 EUR 2,600,000 2,682,963 0.37
SCHEDULE OF INVESTMENTSAs at 30 June 2017
Investments Currency
Quantity/Nominal
Value
Market Value EUR
% of Net Assets
Transferable securities and money market instruments admitted to offi cial exchange listing or dealt in on another regulated market
Corporate Bonds (continued)
Italy (continued)Intesa Sanpaolo SpA, Reg. S, FRN 0.719%
15/06/2020 EUR 2,500,000 2,542,588 0.35 Intesa Sanpaolo SpA, Reg. S, FRN 7%
Perpetual EUR 2,150,000 2,269,497 0.31 Intesa Sanpaolo Vita SpA 5.35%
18/09/2018 EUR 600,000 636,458 0.09 Iren SpA, Reg. S 2.75% 02/11/2022 EUR 251,000 272,680 0.04 Iren SpA, Reg. S 0.875% 04/11/2024 EUR 1,250,000 1,197,405 0.17 Italgas SpA, Reg. S 1.125% 14/03/2024 EUR 525,000 527,147 0.07 Italgas SpA, Reg. S 1.625% 19/01/2027 EUR 1,300,000 1,316,336 0.18 Poste Vita SpA 2.875% 30/05/2019 EUR 1,000,000 1,049,658 0.15 Societa Esercizi Aereoportuali SpA 3.125%
17/04/2021 EUR 725,000 787,132 0.11 Telecom Italia Finance SA 7.75%
24/01/2033 EUR 700,000 972,811 0.13 Telecom Italia SpA, Reg. S 3.625%
19/01/2024 EUR 950,000 1,058,633 0.15 UniCredit SpA, Reg. S 2.125%
24/10/2026 EUR 1,275,000 1,313,529 0.18 UniCredit SpA, Reg. S 0.75% 30/04/2063 EUR 1,350,000 1,332,262 0.18 UniCredit SpA, Reg. S, FRN 4.375%
03/01/2027 EUR 1,000,000 1,057,710 0.15
33,262,292 4.60
JapanSumitomo Mitsui Banking Corp., Reg. S 1%
19/01/2022 EUR 1,600,000 1,627,832 0.23
1,627,832 0.23
LuxembourgAltice Luxembourg SA, Reg. S 6.25%
15/02/2025 EUR 1,325,000 1,449,411 0.20 Aramark International Finance Sarl, Reg. S
3.125% 01/04/2025 EUR 450,000 469,624 0.07 SELP Finance Sarl, REIT, Reg. S 1.25%
25/10/2023 EUR 100,000 98,527 0.01
2,017,562 0.28
MexicoCemex SAB de CV, Reg. S 4.375%
05/03/2023 EUR 1,500,000 1,590,502 0.22 Fomento Economico Mexicano SAB de CV,
Reg. S 1.75% 20/03/2023 EUR 800,000 822,934 0.11 Mexichem SAB de CV, 144A 5.875%
17/09/2044 USD 1,091,000 957,892 0.13 Petroleos Mexicanos 6.375% 23/01/2045 USD 1,250,000 1,069,160 0.15 Petroleos Mexicanos, Reg. S 3.125%
27/11/2020 EUR 600,000 632,050 0.09 Petroleos Mexicanos, Reg. S 3.75%
16/04/2026 EUR 375,000 377,237 0.05 Petroleos Mexicanos, Reg. S 4.875%
21/02/2028 EUR 1,425,000 1,487,862 0.21
6,937,637 0.96
NetherlandsABN AMRO Bank NV, Reg. S 6.375%
27/04/2021 EUR 850,000 1,032,303 0.14 ABN AMRO Bank NV, Reg. S, FRN 2.875%
30/06/2025 EUR 750,000 792,033 0.11
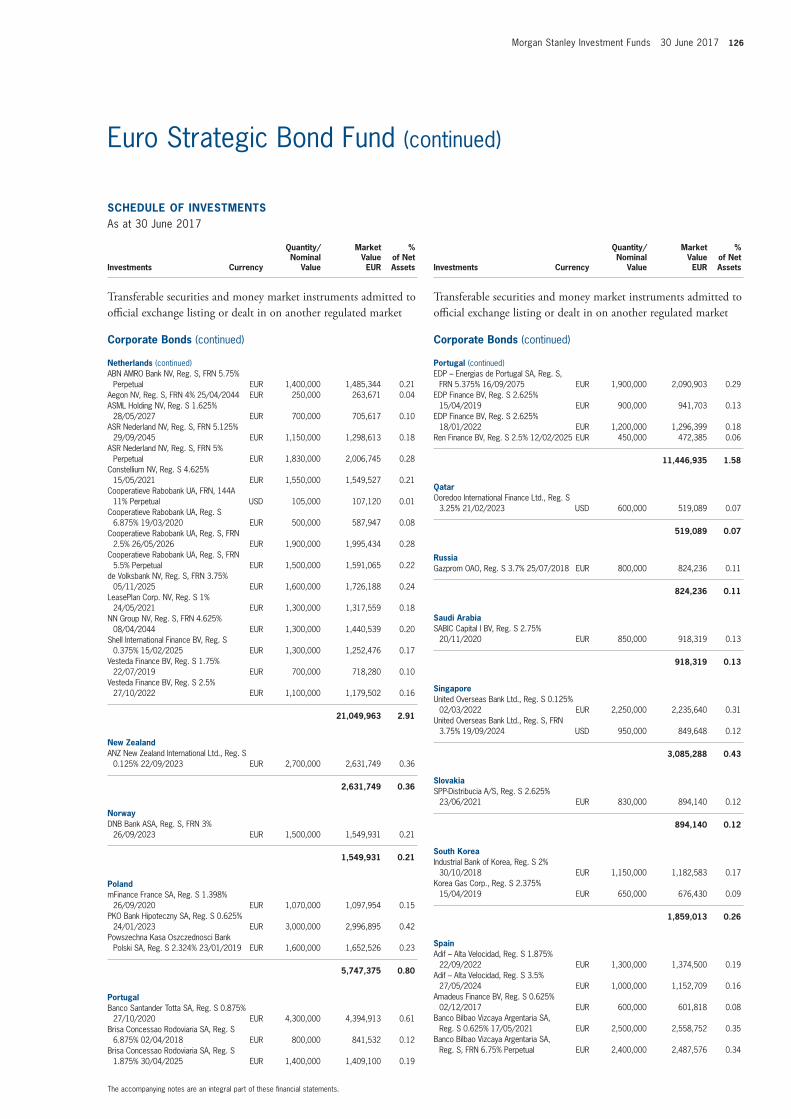
Morgan Stanley Investment Funds 30 June 2017 126
The accompanying notes are an integral part of these fi nancial statements.
Euro Strategic Bond Fund (continued)
SCHEDULE OF INVESTMENTSAs at 30 June 2017
Investments Currency
Quantity/Nominal
Value
Market Value EUR
% of Net Assets
Transferable securities and money market instruments admitted to offi cial exchange listing or dealt in on another regulated market
Corporate Bonds (continued)
Netherlands (continued)ABN AMRO Bank NV, Reg. S, FRN 5.75%
Perpetual EUR 1,400,000 1,485,344 0.21 Aegon NV, Reg. S, FRN 4% 25/04/2044 EUR 250,000 263,671 0.04 ASML Holding NV, Reg. S 1.625%
28/05/2027 EUR 700,000 705,617 0.10 ASR Nederland NV, Reg. S, FRN 5.125%
29/09/2045 EUR 1,150,000 1,298,613 0.18 ASR Nederland NV, Reg. S, FRN 5%
Perpetual EUR 1,830,000 2,006,745 0.28 Constellium NV, Reg. S 4.625%
15/05/2021 EUR 1,550,000 1,549,527 0.21 Cooperatieve Rabobank UA, FRN, 144A
11% Perpetual USD 105,000 107,120 0.01 Cooperatieve Rabobank UA, Reg. S
6.875% 19/03/2020 EUR 500,000 587,947 0.08 Cooperatieve Rabobank UA, Reg. S, FRN
2.5% 26/05/2026 EUR 1,900,000 1,995,434 0.28 Cooperatieve Rabobank UA, Reg. S, FRN
5.5% Perpetual EUR 1,500,000 1,591,065 0.22 de Volksbank NV, Reg. S, FRN 3.75%
05/11/2025 EUR 1,600,000 1,726,188 0.24 LeasePlan Corp. NV, Reg. S 1%
24/05/2021 EUR 1,300,000 1,317,559 0.18 NN Group NV, Reg. S, FRN 4.625%
08/04/2044 EUR 1,300,000 1,440,539 0.20 Shell International Finance BV, Reg. S
0.375% 15/02/2025 EUR 1,300,000 1,252,476 0.17 Vesteda Finance BV, Reg. S 1.75%
22/07/2019 EUR 700,000 718,280 0.10 Vesteda Finance BV, Reg. S 2.5%
27/10/2022 EUR 1,100,000 1,179,502 0.16
21,049,963 2.91
New ZealandANZ New Zealand International Ltd., Reg. S
0.125% 22/09/2023 EUR 2,700,000 2,631,749 0.36
2,631,749 0.36
NorwayDNB Bank ASA, Reg. S, FRN 3%
26/09/2023 EUR 1,500,000 1,549,931 0.21
1,549,931 0.21
PolandmFinance France SA, Reg. S 1.398%
26/09/2020 EUR 1,070,000 1,097,954 0.15 PKO Bank Hipoteczny SA, Reg. S 0.625%
24/01/2023 EUR 3,000,000 2,996,895 0.42 Powszechna Kasa Oszczednosci Bank
Polski SA, Reg. S 2.324% 23/01/2019 EUR 1,600,000 1,652,526 0.23
5,747,375 0.80
PortugalBanco Santander Totta SA, Reg. S 0.875%
27/10/2020 EUR 4,300,000 4,394,913 0.61 Brisa Concessao Rodoviaria SA, Reg. S
6.875% 02/04/2018 EUR 800,000 841,532 0.12 Brisa Concessao Rodoviaria SA, Reg. S
1.875% 30/04/2025 EUR 1,400,000 1,409,100 0.19
SCHEDULE OF INVESTMENTSAs at 30 June 2017
Investments Currency
Quantity/Nominal
Value
Market Value EUR
% of Net Assets
Transferable securities and money market instruments admitted to offi cial exchange listing or dealt in on another regulated market
Corporate Bonds (continued)
Portugal (continued)EDP – Energias de Portugal SA, Reg. S,
FRN 5.375% 16/09/2075 EUR 1,900,000 2,090,903 0.29 EDP Finance BV, Reg. S 2.625%
15/04/2019 EUR 900,000 941,703 0.13 EDP Finance BV, Reg. S 2.625%
18/01/2022 EUR 1,200,000 1,296,399 0.18 Ren Finance BV, Reg. S 2.5% 12/02/2025 EUR 450,000 472,385 0.06
11,446,935 1.58
QatarOoredoo International Finance Ltd., Reg. S
3.25% 21/02/2023 USD 600,000 519,089 0.07
519,089 0.07
RussiaGazprom OAO, Reg. S 3.7% 25/07/2018 EUR 800,000 824,236 0.11
824,236 0.11
Saudi ArabiaSABIC Capital I BV, Reg. S 2.75%
20/11/2020 EUR 850,000 918,319 0.13
918,319 0.13
SingaporeUnited Overseas Bank Ltd., Reg. S 0.125%
02/03/2022 EUR 2,250,000 2,235,640 0.31 United Overseas Bank Ltd., Reg. S, FRN
3.75% 19/09/2024 USD 950,000 849,648 0.12
3,085,288 0.43
SlovakiaSPP-Distribucia A/S, Reg. S 2.625%
23/06/2021 EUR 830,000 894,140 0.12
894,140 0.12
South KoreaIndustrial Bank of Korea, Reg. S 2%
30/10/2018 EUR 1,150,000 1,182,583 0.17 Korea Gas Corp., Reg. S 2.375%
15/04/2019 EUR 650,000 676,430 0.09
1,859,013 0.26
SpainAdif – Alta Velocidad, Reg. S 1.875%
22/09/2022 EUR 1,300,000 1,374,500 0.19 Adif – Alta Velocidad, Reg. S 3.5%
27/05/2024 EUR 1,000,000 1,152,709 0.16 Amadeus Finance BV, Reg. S 0.625%
02/12/2017 EUR 600,000 601,818 0.08 Banco Bilbao Vizcaya Argentaria SA,
Reg. S 0.625% 17/05/2021 EUR 2,500,000 2,558,752 0.35 Banco Bilbao Vizcaya Argentaria SA,
Reg. S, FRN 6.75% Perpetual EUR 2,400,000 2,487,576 0.34
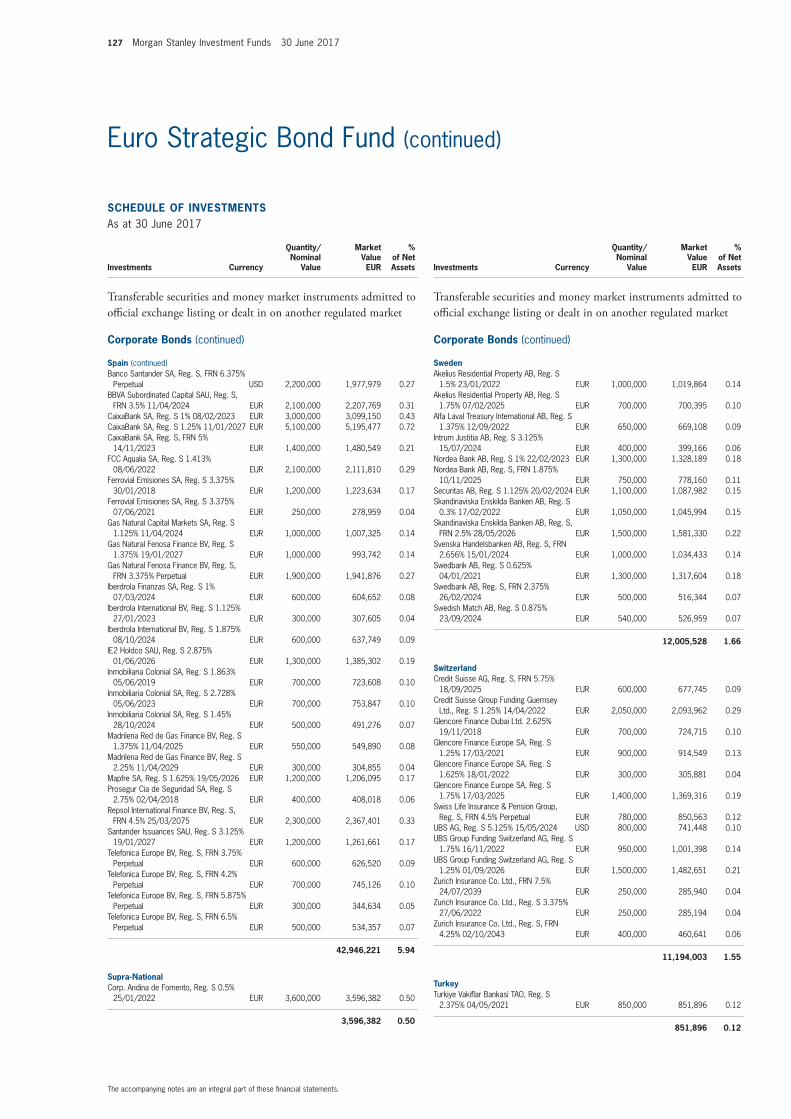
127 Morgan Stanley Investment Funds 30 June 2017
The accompanying notes are an integral part of these fi nancial statements.
Euro Strategic Bond Fund (continued)
SCHEDULE OF INVESTMENTSAs at 30 June 2017
Investments Currency
Quantity/Nominal
Value
Market Value EUR
% of Net Assets
Transferable securities and money market instruments admitted to offi cial exchange listing or dealt in on another regulated market
Corporate Bonds (continued)
Spain (continued)Banco Santander SA, Reg. S, FRN 6.375%
Perpetual USD 2,200,000 1,977,979 0.27 BBVA Subordinated Capital SAU, Reg. S,
FRN 3.5% 11/04/2024 EUR 2,100,000 2,207,769 0.31 CaixaBank SA, Reg. S 1% 08/02/2023 EUR 3,000,000 3,099,150 0.43 CaixaBank SA, Reg. S 1.25% 11/01/2027 EUR 5,100,000 5,195,477 0.72 CaixaBank SA, Reg. S, FRN 5%
14/11/2023 EUR 1,400,000 1,480,549 0.21 FCC Aqualia SA, Reg. S 1.413%
08/06/2022 EUR 2,100,000 2,111,810 0.29 Ferrovial Emisiones SA, Reg. S 3.375%
30/01/2018 EUR 1,200,000 1,223,634 0.17 Ferrovial Emisiones SA, Reg. S 3.375%
07/06/2021 EUR 250,000 278,959 0.04 Gas Natural Capital Markets SA, Reg. S
1.125% 11/04/2024 EUR 1,000,000 1,007,325 0.14 Gas Natural Fenosa Finance BV, Reg. S
1.375% 19/01/2027 EUR 1,000,000 993,742 0.14 Gas Natural Fenosa Finance BV, Reg. S,
FRN 3.375% Perpetual EUR 1,900,000 1,941,876 0.27 Iberdrola Finanzas SA, Reg. S 1%
07/03/2024 EUR 600,000 604,652 0.08 Iberdrola International BV, Reg. S 1.125%
27/01/2023 EUR 300,000 307,605 0.04 Iberdrola International BV, Reg. S 1.875%
08/10/2024 EUR 600,000 637,749 0.09 IE2 Holdco SAU, Reg. S 2.875%
01/06/2026 EUR 1,300,000 1,385,302 0.19 Inmobiliaria Colonial SA, Reg. S 1.863%
05/06/2019 EUR 700,000 723,608 0.10 Inmobiliaria Colonial SA, Reg. S 2.728%
05/06/2023 EUR 700,000 753,847 0.10 Inmobiliaria Colonial SA, Reg. S 1.45%
28/10/2024 EUR 500,000 491,276 0.07 Madrilena Red de Gas Finance BV, Reg. S
1.375% 11/04/2025 EUR 550,000 549,890 0.08 Madrilena Red de Gas Finance BV, Reg. S
2.25% 11/04/2029 EUR 300,000 304,855 0.04 Mapfre SA, Reg. S 1.625% 19/05/2026 EUR 1,200,000 1,206,095 0.17 Prosegur Cia de Seguridad SA, Reg. S
2.75% 02/04/2018 EUR 400,000 408,018 0.06 Repsol International Finance BV, Reg. S,
FRN 4.5% 25/03/2075 EUR 2,300,000 2,367,401 0.33 Santander Issuances SAU, Reg. S 3.125%
19/01/2027 EUR 1,200,000 1,261,661 0.17 Telefonica Europe BV, Reg. S, FRN 3.75%
Perpetual EUR 600,000 626,520 0.09 Telefonica Europe BV, Reg. S, FRN 4.2%
Perpetual EUR 700,000 745,126 0.10 Telefonica Europe BV, Reg. S, FRN 5.875%
Perpetual EUR 300,000 344,634 0.05 Telefonica Europe BV, Reg. S, FRN 6.5%
Perpetual EUR 500,000 534,357 0.07
42,946,221 5.94
Supra-NationalCorp. Andina de Fomento, Reg. S 0.5%
25/01/2022 EUR 3,600,000 3,596,382 0.50
3,596,382 0.50
SCHEDULE OF INVESTMENTSAs at 30 June 2017
Investments Currency
Quantity/Nominal
Value
Market Value EUR
% of Net Assets
Transferable securities and money market instruments admitted to offi cial exchange listing or dealt in on another regulated market
Corporate Bonds (continued)
SwedenAkelius Residential Property AB, Reg. S
1.5% 23/01/2022 EUR 1,000,000 1,019,864 0.14 Akelius Residential Property AB, Reg. S
1.75% 07/02/2025 EUR 700,000 700,395 0.10 Alfa Laval Treasury International AB, Reg. S
1.375% 12/09/2022 EUR 650,000 669,108 0.09 Intrum Justitia AB, Reg. S 3.125%
15/07/2024 EUR 400,000 399,166 0.06 Nordea Bank AB, Reg. S 1% 22/02/2023 EUR 1,300,000 1,328,189 0.18 Nordea Bank AB, Reg. S, FRN 1.875%
10/11/2025 EUR 750,000 778,160 0.11 Securitas AB, Reg. S 1.125% 20/02/2024 EUR 1,100,000 1,087,982 0.15 Skandinaviska Enskilda Banken AB, Reg. S
0.3% 17/02/2022 EUR 1,050,000 1,045,994 0.15 Skandinaviska Enskilda Banken AB, Reg. S,
FRN 2.5% 28/05/2026 EUR 1,500,000 1,581,330 0.22 Svenska Handelsbanken AB, Reg. S, FRN
2.656% 15/01/2024 EUR 1,000,000 1,034,433 0.14 Swedbank AB, Reg. S 0.625%
04/01/2021 EUR 1,300,000 1,317,604 0.18 Swedbank AB, Reg. S, FRN 2.375%
26/02/2024 EUR 500,000 516,344 0.07 Swedish Match AB, Reg. S 0.875%
23/09/2024 EUR 540,000 526,959 0.07
12,005,528 1.66
SwitzerlandCredit Suisse AG, Reg. S, FRN 5.75%
18/09/2025 EUR 600,000 677,745 0.09 Credit Suisse Group Funding Guernsey
Ltd., Reg. S 1.25% 14/04/2022 EUR 2,050,000 2,093,962 0.29 Glencore Finance Dubai Ltd. 2.625%
19/11/2018 EUR 700,000 724,715 0.10 Glencore Finance Europe SA, Reg. S
1.25% 17/03/2021 EUR 900,000 914,549 0.13 Glencore Finance Europe SA, Reg. S
1.625% 18/01/2022 EUR 300,000 305,881 0.04 Glencore Finance Europe SA, Reg. S
1.75% 17/03/2025 EUR 1,400,000 1,369,316 0.19 Swiss Life Insurance & Pension Group,
Reg. S, FRN 4.5% Perpetual EUR 780,000 850,563 0.12 UBS AG, Reg. S 5.125% 15/05/2024 USD 800,000 741,448 0.10 UBS Group Funding Switzerland AG, Reg. S
1.75% 16/11/2022 EUR 950,000 1,001,398 0.14 UBS Group Funding Switzerland AG, Reg. S
1.25% 01/09/2026 EUR 1,500,000 1,482,651 0.21 Zurich Insurance Co. Ltd., FRN 7.5%
24/07/2039 EUR 250,000 285,940 0.04 Zurich Insurance Co. Ltd., Reg. S 3.375%
27/06/2022 EUR 250,000 285,194 0.04 Zurich Insurance Co. Ltd., Reg. S, FRN
4.25% 02/10/2043 EUR 400,000 460,641 0.06
11,194,003 1.55
TurkeyTurkiye Vakifl ar Bankasi TAO, Reg. S
2.375% 04/05/2021 EUR 850,000 851,896 0.12
851,896 0.12
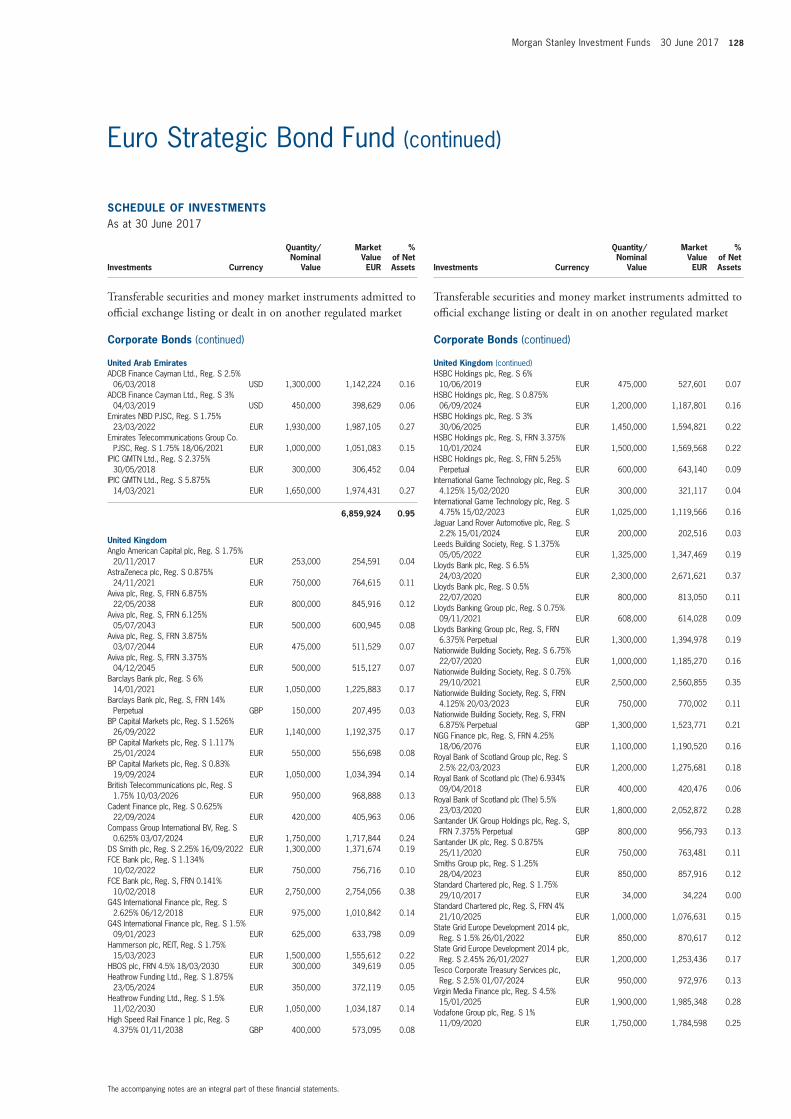
Morgan Stanley Investment Funds 30 June 2017 128
The accompanying notes are an integral part of these fi nancial statements.
Euro Strategic Bond Fund (continued)
SCHEDULE OF INVESTMENTSAs at 30 June 2017
Investments Currency
Quantity/Nominal
Value
Market Value EUR
% of Net Assets
Transferable securities and money market instruments admitted to offi cial exchange listing or dealt in on another regulated market
Corporate Bonds (continued)
United Arab EmiratesADCB Finance Cayman Ltd., Reg. S 2.5%
06/03/2018 USD 1,300,000 1,142,224 0.16 ADCB Finance Cayman Ltd., Reg. S 3%
04/03/2019 USD 450,000 398,629 0.06 Emirates NBD PJSC, Reg. S 1.75%
23/03/2022 EUR 1,930,000 1,987,105 0.27 Emirates Telecommunications Group Co.
PJSC, Reg. S 1.75% 18/06/2021 EUR 1,000,000 1,051,083 0.15 IPIC GMTN Ltd., Reg. S 2.375%
30/05/2018 EUR 300,000 306,452 0.04 IPIC GMTN Ltd., Reg. S 5.875%
14/03/2021 EUR 1,650,000 1,974,431 0.27
6,859,924 0.95
United KingdomAnglo American Capital plc, Reg. S 1.75%
20/11/2017 EUR 253,000 254,591 0.04 AstraZeneca plc, Reg. S 0.875%
24/11/2021 EUR 750,000 764,615 0.11 Aviva plc, Reg. S, FRN 6.875%
22/05/2038 EUR 800,000 845,916 0.12 Aviva plc, Reg. S, FRN 6.125%
05/07/2043 EUR 500,000 600,945 0.08 Aviva plc, Reg. S, FRN 3.875%
03/07/2044 EUR 475,000 511,529 0.07 Aviva plc, Reg. S, FRN 3.375%
04/12/2045 EUR 500,000 515,127 0.07 Barclays Bank plc, Reg. S 6%
14/01/2021 EUR 1,050,000 1,225,883 0.17 Barclays Bank plc, Reg. S, FRN 14%
Perpetual GBP 150,000 207,495 0.03 BP Capital Markets plc, Reg. S 1.526%
26/09/2022 EUR 1,140,000 1,192,375 0.17 BP Capital Markets plc, Reg. S 1.117%
25/01/2024 EUR 550,000 556,698 0.08 BP Capital Markets plc, Reg. S 0.83%
19/09/2024 EUR 1,050,000 1,034,394 0.14 British Telecommunications plc, Reg. S
1.75% 10/03/2026 EUR 950,000 968,888 0.13 Cadent Finance plc, Reg. S 0.625%
22/09/2024 EUR 420,000 405,963 0.06 Compass Group International BV, Reg. S
0.625% 03/07/2024 EUR 1,750,000 1,717,844 0.24 DS Smith plc, Reg. S 2.25% 16/09/2022 EUR 1,300,000 1,371,674 0.19 FCE Bank plc, Reg. S 1.134%
10/02/2022 EUR 750,000 756,716 0.10 FCE Bank plc, Reg. S, FRN 0.141%
10/02/2018 EUR 2,750,000 2,754,056 0.38 G4S International Finance plc, Reg. S
2.625% 06/12/2018 EUR 975,000 1,010,842 0.14 G4S International Finance plc, Reg. S 1.5%
09/01/2023 EUR 625,000 633,798 0.09 Hammerson plc, REIT, Reg. S 1.75%
15/03/2023 EUR 1,500,000 1,555,612 0.22 HBOS plc, FRN 4.5% 18/03/2030 EUR 300,000 349,619 0.05 Heathrow Funding Ltd., Reg. S 1.875%
23/05/2024 EUR 350,000 372,119 0.05 Heathrow Funding Ltd., Reg. S 1.5%
11/02/2030 EUR 1,050,000 1,034,187 0.14 High Speed Rail Finance 1 plc, Reg. S
4.375% 01/11/2038 GBP 400,000 573,095 0.08
SCHEDULE OF INVESTMENTSAs at 30 June 2017
Investments Currency
Quantity/Nominal
Value
Market Value EUR
% of Net Assets
Transferable securities and money market instruments admitted to offi cial exchange listing or dealt in on another regulated market
Corporate Bonds (continued)
United Kingdom (continued)HSBC Holdings plc, Reg. S 6%
10/06/2019 EUR 475,000 527,601 0.07 HSBC Holdings plc, Reg. S 0.875%
06/09/2024 EUR 1,200,000 1,187,801 0.16 HSBC Holdings plc, Reg. S 3%
30/06/2025 EUR 1,450,000 1,594,821 0.22 HSBC Holdings plc, Reg. S, FRN 3.375%
10/01/2024 EUR 1,500,000 1,569,568 0.22 HSBC Holdings plc, Reg. S, FRN 5.25%
Perpetual EUR 600,000 643,140 0.09 International Game Technology plc, Reg. S
4.125% 15/02/2020 EUR 300,000 321,117 0.04 International Game Technology plc, Reg. S
4.75% 15/02/2023 EUR 1,025,000 1,119,566 0.16 Jaguar Land Rover Automotive plc, Reg. S
2.2% 15/01/2024 EUR 200,000 202,516 0.03 Leeds Building Society, Reg. S 1.375%
05/05/2022 EUR 1,325,000 1,347,469 0.19 Lloyds Bank plc, Reg. S 6.5%
24/03/2020 EUR 2,300,000 2,671,621 0.37 Lloyds Bank plc, Reg. S 0.5%
22/07/2020 EUR 800,000 813,050 0.11 Lloyds Banking Group plc, Reg. S 0.75%
09/11/2021 EUR 608,000 614,028 0.09 Lloyds Banking Group plc, Reg. S, FRN
6.375% Perpetual EUR 1,300,000 1,394,978 0.19 Nationwide Building Society, Reg. S 6.75%
22/07/2020 EUR 1,000,000 1,185,270 0.16 Nationwide Building Society, Reg. S 0.75%
29/10/2021 EUR 2,500,000 2,560,855 0.35 Nationwide Building Society, Reg. S, FRN
4.125% 20/03/2023 EUR 750,000 770,002 0.11 Nationwide Building Society, Reg. S, FRN
6.875% Perpetual GBP 1,300,000 1,523,771 0.21 NGG Finance plc, Reg. S, FRN 4.25%
18/06/2076 EUR 1,100,000 1,190,520 0.16 Royal Bank of Scotland Group plc, Reg. S
2.5% 22/03/2023 EUR 1,200,000 1,275,681 0.18 Royal Bank of Scotland plc (The) 6.934%
09/04/2018 EUR 400,000 420,476 0.06 Royal Bank of Scotland plc (The) 5.5%
23/03/2020 EUR 1,800,000 2,052,872 0.28 Santander UK Group Holdings plc, Reg. S,
FRN 7.375% Perpetual GBP 800,000 956,793 0.13 Santander UK plc, Reg. S 0.875%
25/11/2020 EUR 750,000 763,481 0.11 Smiths Group plc, Reg. S 1.25%
28/04/2023 EUR 850,000 857,916 0.12 Standard Chartered plc, Reg. S 1.75%
29/10/2017 EUR 34,000 34,224 0.00 Standard Chartered plc, Reg. S, FRN 4%
21/10/2025 EUR 1,000,000 1,076,631 0.15 State Grid Europe Development 2014 plc,
Reg. S 1.5% 26/01/2022 EUR 850,000 870,617 0.12 State Grid Europe Development 2014 plc,
Reg. S 2.45% 26/01/2027 EUR 1,200,000 1,253,436 0.17 Tesco Corporate Treasury Services plc,
Reg. S 2.5% 01/07/2024 EUR 950,000 972,976 0.13 Virgin Media Finance plc, Reg. S 4.5%
15/01/2025 EUR 1,900,000 1,985,348 0.28 Vodafone Group plc, Reg. S 1%
11/09/2020 EUR 1,750,000 1,784,598 0.25
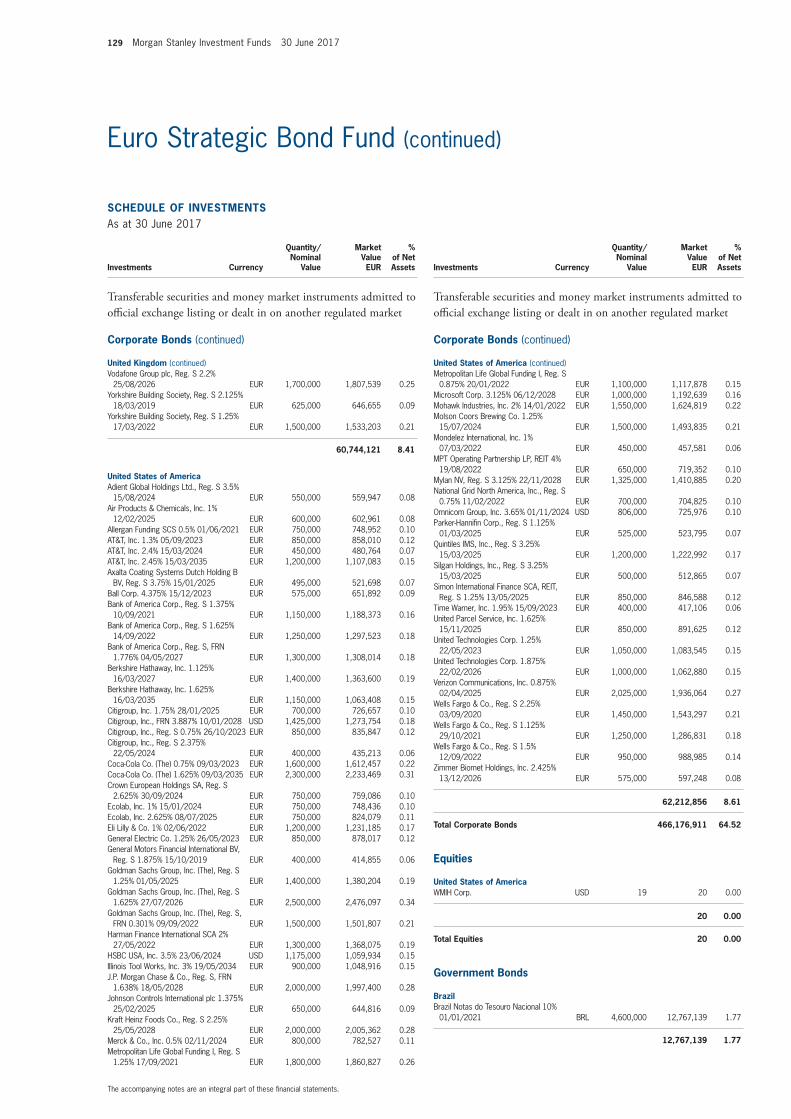
129 Morgan Stanley Investment Funds 30 June 2017
The accompanying notes are an integral part of these fi nancial statements.
Euro Strategic Bond Fund (continued)
SCHEDULE OF INVESTMENTSAs at 30 June 2017
Investments Currency
Quantity/Nominal
Value
Market Value EUR
% of Net Assets
Transferable securities and money market instruments admitted to offi cial exchange listing or dealt in on another regulated market
Corporate Bonds (continued)
United Kingdom (continued)Vodafone Group plc, Reg. S 2.2%
25/08/2026 EUR 1,700,000 1,807,539 0.25 Yorkshire Building Society, Reg. S 2.125%
18/03/2019 EUR 625,000 646,655 0.09 Yorkshire Building Society, Reg. S 1.25%
17/03/2022 EUR 1,500,000 1,533,203 0.21
60,744,121 8.41
United States of AmericaAdient Global Holdings Ltd., Reg. S 3.5%
15/08/2024 EUR 550,000 559,947 0.08 Air Products & Chemicals, Inc. 1%
12/02/2025 EUR 600,000 602,961 0.08 Allergan Funding SCS 0.5% 01/06/2021 EUR 750,000 748,952 0.10 AT&T, Inc. 1.3% 05/09/2023 EUR 850,000 858,010 0.12 AT&T, Inc. 2.4% 15/03/2024 EUR 450,000 480,764 0.07 AT&T, Inc. 2.45% 15/03/2035 EUR 1,200,000 1,107,083 0.15 Axalta Coating Systems Dutch Holding B
BV, Reg. S 3.75% 15/01/2025 EUR 495,000 521,698 0.07 Ball Corp. 4.375% 15/12/2023 EUR 575,000 651,892 0.09 Bank of America Corp., Reg. S 1.375%
10/09/2021 EUR 1,150,000 1,188,373 0.16 Bank of America Corp., Reg. S 1.625%
14/09/2022 EUR 1,250,000 1,297,523 0.18 Bank of America Corp., Reg. S, FRN
1.776% 04/05/2027 EUR 1,300,000 1,308,014 0.18 Berkshire Hathaway, Inc. 1.125%
16/03/2027 EUR 1,400,000 1,363,600 0.19 Berkshire Hathaway, Inc. 1.625%
16/03/2035 EUR 1,150,000 1,063,408 0.15 Citigroup, Inc. 1.75% 28/01/2025 EUR 700,000 726,657 0.10 Citigroup, Inc., FRN 3.887% 10/01/2028 USD 1,425,000 1,273,754 0.18 Citigroup, Inc., Reg. S 0.75% 26/10/2023 EUR 850,000 835,847 0.12 Citigroup, Inc., Reg. S 2.375%
22/05/2024 EUR 400,000 435,213 0.06 Coca-Cola Co. (The) 0.75% 09/03/2023 EUR 1,600,000 1,612,457 0.22 Coca-Cola Co. (The) 1.625% 09/03/2035 EUR 2,300,000 2,233,469 0.31 Crown European Holdings SA, Reg. S
2.625% 30/09/2024 EUR 750,000 759,086 0.10 Ecolab, Inc. 1% 15/01/2024 EUR 750,000 748,436 0.10 Ecolab, Inc. 2.625% 08/07/2025 EUR 750,000 824,079 0.11 Eli Lilly & Co. 1% 02/06/2022 EUR 1,200,000 1,231,185 0.17 General Electric Co. 1.25% 26/05/2023 EUR 850,000 878,017 0.12 General Motors Financial International BV,
Reg. S 1.875% 15/10/2019 EUR 400,000 414,855 0.06 Goldman Sachs Group, Inc. (The), Reg. S
1.25% 01/05/2025 EUR 1,400,000 1,380,204 0.19 Goldman Sachs Group, Inc. (The), Reg. S
1.625% 27/07/2026 EUR 2,500,000 2,476,097 0.34 Goldman Sachs Group, Inc. (The), Reg. S,
FRN 0.301% 09/09/2022 EUR 1,500,000 1,501,807 0.21 Harman Finance International SCA 2%
27/05/2022 EUR 1,300,000 1,368,075 0.19 HSBC USA, Inc. 3.5% 23/06/2024 USD 1,175,000 1,059,934 0.15 Illinois Tool Works, Inc. 3% 19/05/2034 EUR 900,000 1,048,916 0.15 J.P. Morgan Chase & Co., Reg. S, FRN
1.638% 18/05/2028 EUR 2,000,000 1,997,400 0.28 Johnson Controls International plc 1.375%
25/02/2025 EUR 650,000 644,816 0.09 Kraft Heinz Foods Co., Reg. S 2.25%
25/05/2028 EUR 2,000,000 2,005,362 0.28 Merck & Co., Inc. 0.5% 02/11/2024 EUR 800,000 782,527 0.11 Metropolitan Life Global Funding I, Reg. S
1.25% 17/09/2021 EUR 1,800,000 1,860,827 0.26
SCHEDULE OF INVESTMENTSAs at 30 June 2017
Investments Currency
Quantity/Nominal
Value
Market Value EUR
% of Net Assets
Transferable securities and money market instruments admitted to offi cial exchange listing or dealt in on another regulated market
Corporate Bonds (continued)
United States of America (continued)Metropolitan Life Global Funding I, Reg. S
0.875% 20/01/2022 EUR 1,100,000 1,117,878 0.15 Microsoft Corp. 3.125% 06/12/2028 EUR 1,000,000 1,192,639 0.16 Mohawk Industries, Inc. 2% 14/01/2022 EUR 1,550,000 1,624,819 0.22 Molson Coors Brewing Co. 1.25%
15/07/2024 EUR 1,500,000 1,493,835 0.21 Mondelez International, Inc. 1%
07/03/2022 EUR 450,000 457,581 0.06 MPT Operating Partnership LP, REIT 4%
19/08/2022 EUR 650,000 719,352 0.10 Mylan NV, Reg. S 3.125% 22/11/2028 EUR 1,325,000 1,410,885 0.20 National Grid North America, Inc., Reg. S
0.75% 11/02/2022 EUR 700,000 704,825 0.10 Omnicom Group, Inc. 3.65% 01/11/2024 USD 806,000 725,976 0.10 Parker-Hannifi n Corp., Reg. S 1.125%
01/03/2025 EUR 525,000 523,795 0.07 Quintiles IMS, Inc., Reg. S 3.25%
15/03/2025 EUR 1,200,000 1,222,992 0.17 Silgan Holdings, Inc., Reg. S 3.25%
15/03/2025 EUR 500,000 512,865 0.07 Simon International Finance SCA, REIT,
Reg. S 1.25% 13/05/2025 EUR 850,000 846,588 0.12 Time Warner, Inc. 1.95% 15/09/2023 EUR 400,000 417,106 0.06 United Parcel Service, Inc. 1.625%
15/11/2025 EUR 850,000 891,625 0.12 United Technologies Corp. 1.25%
22/05/2023 EUR 1,050,000 1,083,545 0.15 United Technologies Corp. 1.875%
22/02/2026 EUR 1,000,000 1,062,880 0.15 Verizon Communications, Inc. 0.875%
02/04/2025 EUR 2,025,000 1,936,064 0.27 Wells Fargo & Co., Reg. S 2.25%
03/09/2020 EUR 1,450,000 1,543,297 0.21 Wells Fargo & Co., Reg. S 1.125%
29/10/2021 EUR 1,250,000 1,286,831 0.18 Wells Fargo & Co., Reg. S 1.5%
12/09/2022 EUR 950,000 988,985 0.14 Zimmer Biomet Holdings, Inc. 2.425%
13/12/2026 EUR 575,000 597,248 0.08
62,212,856 8.61
Total Corporate Bonds 466,176,911 64.52
Equities
United States of AmericaWMIH Corp. USD 19 20 0.00
20 0.00
Total Equities 20 0.00
Government Bonds
BrazilBrazil Notas do Tesouro Nacional 10%
01/01/2021 BRL 4,600,000 12,767,139 1.77
12,767,139 1.77
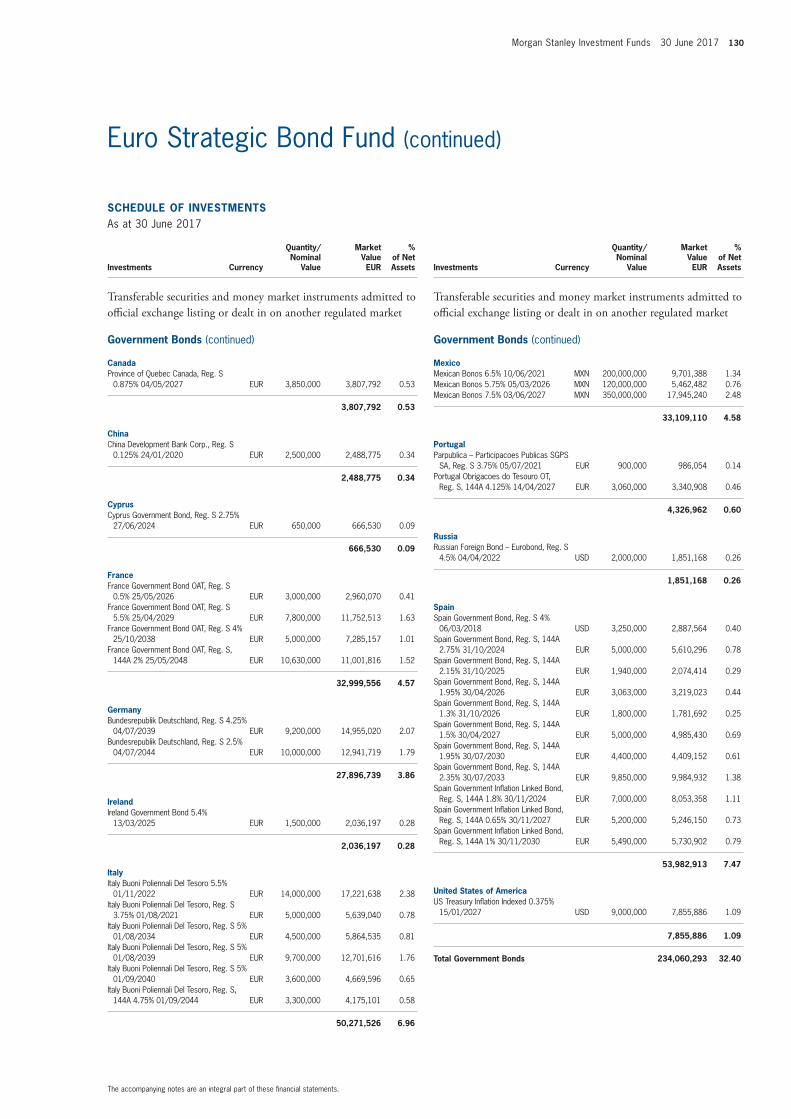
Morgan Stanley Investment Funds 30 June 2017 130
The accompanying notes are an integral part of these fi nancial statements.
Euro Strategic Bond Fund (continued)
SCHEDULE OF INVESTMENTSAs at 30 June 2017
Investments Currency
Quantity/Nominal
Value
Market Value EUR
% of Net Assets
Transferable securities and money market instruments admitted to offi cial exchange listing or dealt in on another regulated market
Government Bonds (continued)
CanadaProvince of Quebec Canada, Reg. S
0.875% 04/05/2027 EUR 3,850,000 3,807,792 0.53
3,807,792 0.53
ChinaChina Development Bank Corp., Reg. S
0.125% 24/01/2020 EUR 2,500,000 2,488,775 0.34
2,488,775 0.34
CyprusCyprus Government Bond, Reg. S 2.75%
27/06/2024 EUR 650,000 666,530 0.09
666,530 0.09
FranceFrance Government Bond OAT, Reg. S
0.5% 25/05/2026 EUR 3,000,000 2,960,070 0.41 France Government Bond OAT, Reg. S
5.5% 25/04/2029 EUR 7,800,000 11,752,513 1.63 France Government Bond OAT, Reg. S 4%
25/10/2038 EUR 5,000,000 7,285,157 1.01 France Government Bond OAT, Reg. S,
144A 2% 25/05/2048 EUR 10,630,000 11,001,816 1.52
32,999,556 4.57
GermanyBundesrepublik Deutschland, Reg. S 4.25%
04/07/2039 EUR 9,200,000 14,955,020 2.07 Bundesrepublik Deutschland, Reg. S 2.5%
04/07/2044 EUR 10,000,000 12,941,719 1.79
27,896,739 3.86
IrelandIreland Government Bond 5.4%
13/03/2025 EUR 1,500,000 2,036,197 0.28
2,036,197 0.28
ItalyItaly Buoni Poliennali Del Tesoro 5.5%
01/11/2022 EUR 14,000,000 17,221,638 2.38 Italy Buoni Poliennali Del Tesoro, Reg. S
3.75% 01/08/2021 EUR 5,000,000 5,639,040 0.78 Italy Buoni Poliennali Del Tesoro, Reg. S 5%
01/08/2034 EUR 4,500,000 5,864,535 0.81 Italy Buoni Poliennali Del Tesoro, Reg. S 5%
01/08/2039 EUR 9,700,000 12,701,616 1.76 Italy Buoni Poliennali Del Tesoro, Reg. S 5%
01/09/2040 EUR 3,600,000 4,669,596 0.65 Italy Buoni Poliennali Del Tesoro, Reg. S,
144A 4.75% 01/09/2044 EUR 3,300,000 4,175,101 0.58
50,271,526 6.96
SCHEDULE OF INVESTMENTSAs at 30 June 2017
Investments Currency
Quantity/Nominal
Value
Market Value EUR
% of Net Assets
Transferable securities and money market instruments admitted to offi cial exchange listing or dealt in on another regulated market
Government Bonds (continued)
MexicoMexican Bonos 6.5% 10/06/2021 MXN 200,000,000 9,701,388 1.34 Mexican Bonos 5.75% 05/03/2026 MXN 120,000,000 5,462,482 0.76 Mexican Bonos 7.5% 03/06/2027 MXN 350,000,000 17,945,240 2.48
33,109,110 4.58
PortugalParpublica – Participacoes Publicas SGPS
SA, Reg. S 3.75% 05/07/2021 EUR 900,000 986,054 0.14 Portugal Obrigacoes do Tesouro OT,
Reg. S, 144A 4.125% 14/04/2027 EUR 3,060,000 3,340,908 0.46
4,326,962 0.60
RussiaRussian Foreign Bond – Eurobond, Reg. S
4.5% 04/04/2022 USD 2,000,000 1,851,168 0.26
1,851,168 0.26
SpainSpain Government Bond, Reg. S 4%
06/03/2018 USD 3,250,000 2,887,564 0.40 Spain Government Bond, Reg. S, 144A
2.75% 31/10/2024 EUR 5,000,000 5,610,296 0.78 Spain Government Bond, Reg. S, 144A
2.15% 31/10/2025 EUR 1,940,000 2,074,414 0.29 Spain Government Bond, Reg. S, 144A
1.95% 30/04/2026 EUR 3,063,000 3,219,023 0.44 Spain Government Bond, Reg. S, 144A
1.3% 31/10/2026 EUR 1,800,000 1,781,692 0.25 Spain Government Bond, Reg. S, 144A
1.5% 30/04/2027 EUR 5,000,000 4,985,430 0.69 Spain Government Bond, Reg. S, 144A
1.95% 30/07/2030 EUR 4,400,000 4,409,152 0.61 Spain Government Bond, Reg. S, 144A
2.35% 30/07/2033 EUR 9,850,000 9,984,932 1.38 Spain Government Infl ation Linked Bond,
Reg. S, 144A 1.8% 30/11/2024 EUR 7,000,000 8,053,358 1.11 Spain Government Infl ation Linked Bond,
Reg. S, 144A 0.65% 30/11/2027 EUR 5,200,000 5,246,150 0.73 Spain Government Infl ation Linked Bond,
Reg. S, 144A 1% 30/11/2030 EUR 5,490,000 5,730,902 0.79
53,982,913 7.47
United States of AmericaUS Treasury Infl ation Indexed 0.375%
15/01/2027 USD 9,000,000 7,855,886 1.09
7,855,886 1.09
Total Government Bonds 234,060,293 32.40
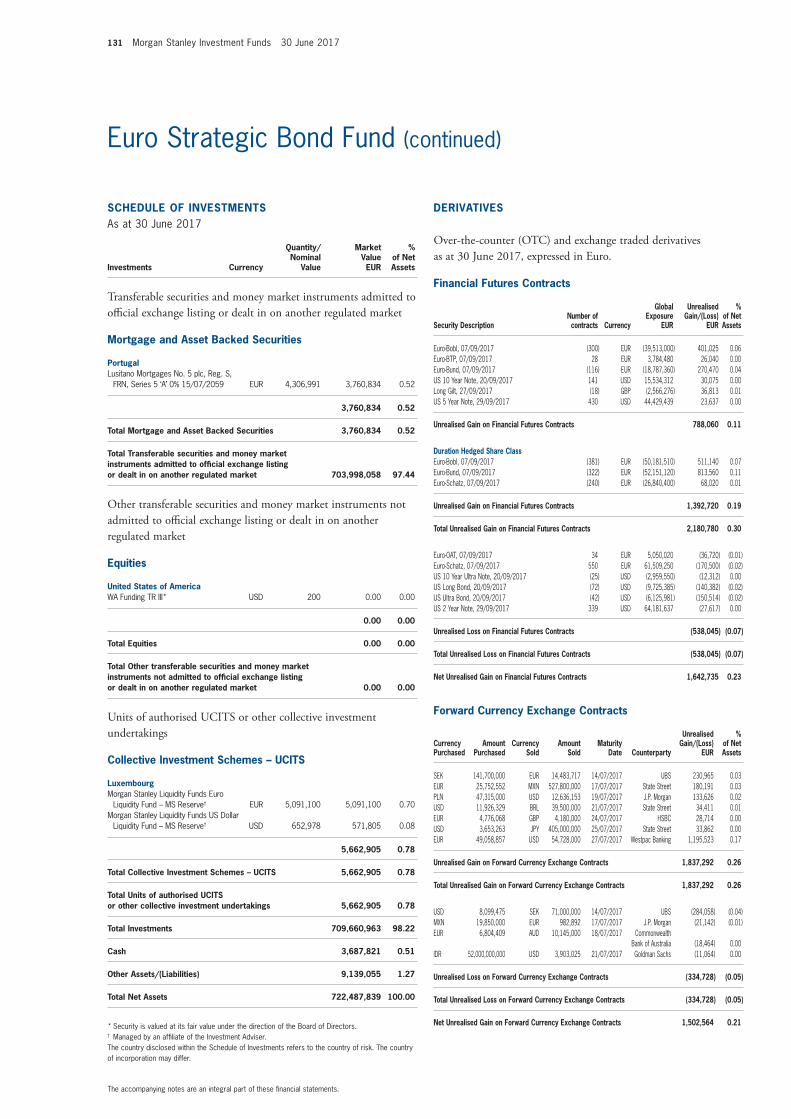
131 Morgan Stanley Investment Funds 30 June 2017
The accompanying notes are an integral part of these fi nancial statements.
Euro Strategic Bond Fund (continued)
SCHEDULE OF INVESTMENTSAs at 30 June 2017
Investments Currency
Quantity/Nominal
Value
Market Value EUR
% of Net Assets
Transferable securities and money market instruments admitted to offi cial exchange listing or dealt in on another regulated market
Mortgage and Asset Backed Securities
PortugalLusitano Mortgages No. 5 plc, Reg. S,
FRN, Series 5 ‘A’ 0% 15/07/2059 EUR 4,306,991 3,760,834 0.52
3,760,834 0.52
Total Mortgage and Asset Backed Securities 3,760,834 0.52
Total Transferable securities and money market instruments admitted to offi cial exchange listing or dealt in on another regulated market 703,998,058 97.44
Other transferable securities and money market instruments not admitted to offi cial exchange listing or dealt in on another regulated market
Equities
United States of AmericaWA Funding TR III* USD 200 0.00 0.00
0.00 0.00
Total Equities 0.00 0.00
Total Other transferable securities and money market instruments not admitted to offi cial exchange listing or dealt in on another regulated market 0.00 0.00
Units of authorised UCITS or other collective investment undertakings
Collective Investment Schemes – UCITS
LuxembourgMorgan Stanley Liquidity Funds Euro
Liquidity Fund – MS Reserve† EUR 5,091,100 5,091,100 0.70 Morgan Stanley Liquidity Funds US Dollar
Liquidity Fund – MS Reserve† USD 652,978 571,805 0.08
5,662,905 0.78
Total Collective Investment Schemes – UCITS 5,662,905 0.78
Total Units of authorised UCITS or other collective investment undertakings 5,662,905 0.78
Total Investments 709,660,963 98.22
Cash 3,687,821 0.51
Other Assets/(Liabilities) 9,139,055 1.27
Total Net Assets 722,487,839 100.00
* Security is valued at its fair value under the direction of the Board of Directors.† Managed by an affi liate of the Investment Adviser.The country disclosed within the Schedule of Investments refers to the country of risk. The country of incorporation may differ.
Financial Futures Contracts
Security DescriptionNumber of contracts Currency
Global Exposure
EUR
Unrealised Gain/(Loss)
EUR
% of Net Assets
Euro-Bobl, 07/09/2017 (300) EUR (39,513,000) 401,025 0.06 Euro-BTP, 07/09/2017 28 EUR 3,784,480 26,040 0.00 Euro-Bund, 07/09/2017 (116) EUR (18,787,360) 270,470 0.04 US 10 Year Note, 20/09/2017 141 USD 15,534,312 30,075 0.00 Long Gilt, 27/09/2017 (18) GBP (2,566,276) 36,813 0.01 US 5 Year Note, 29/09/2017 430 USD 44,429,439 23,637 0.00
Unrealised Gain on Financial Futures Contracts 788,060 0.11
Duration Hedged Share ClassEuro-Bobl, 07/09/2017 (381) EUR (50,181,510) 511,140 0.07 Euro-Bund, 07/09/2017 (322) EUR (52,151,120) 813,560 0.11 Euro-Schatz, 07/09/2017 (240) EUR (26,840,400) 68,020 0.01
Unrealised Gain on Financial Futures Contracts 1,392,720 0.19
Total Unrealised Gain on Financial Futures Contracts 2,180,780 0.30
Euro-OAT, 07/09/2017 34 EUR 5,050,020 (36,720) (0.01) Euro-Schatz, 07/09/2017 550 EUR 61,509,250 (170,500) (0.02) US 10 Year Ultra Note, 20/09/2017 (25) USD (2,959,550) (12,312) 0.00 US Long Bond, 20/09/2017 (72) USD (9,725,385) (140,382) (0.02) US Ultra Bond, 20/09/2017 (42) USD (6,125,981) (150,514) (0.02) US 2 Year Note, 29/09/2017 339 USD 64,181,637 (27,617) 0.00
Unrealised Loss on Financial Futures Contracts (538,045) (0.07)
Total Unrealised Loss on Financial Futures Contracts (538,045) (0.07)
Net Unrealised Gain on Financial Futures Contracts 1,642,735 0.23
Forward Currency Exchange Contracts (continued)
Currency Purchased
Amount Purchased
Currency Sold
Amount Sold
Maturity Date Counterparty
Unrealised Gain/(Loss)
EUR
% of Net Assets
SEK 141,700,000 EUR 14,483,717 14/07/2017 UBS 230,965 0.03 EUR 25,752,552 MXN 527,800,000 17/07/2017 State Street 180,191 0.03 PLN 47,315,000 USD 12,636,153 19/07/2017 J.P. Morgan 133,626 0.02 USD 11,926,329 BRL 39,500,000 21/07/2017 State Street 34,411 0.01 EUR 4,776,068 GBP 4,180,000 24/07/2017 HSBC 28,714 0.00 USD 3,653,263 JPY 405,000,000 25/07/2017 State Street 33,862 0.00 EUR 49,058,857 USD 54,728,000 27/07/2017 Westpac Banking 1,195,523 0.17
Unrealised Gain on Forward Currency Exchange Contracts 1,837,292 0.26
Total Unrealised Gain on Forward Currency Exchange Contracts 1,837,292 0.26
USD 8,099,475 SEK 71,000,000 14/07/2017 UBS (284,058) (0.04) MXN 19,850,000 EUR 982,892 17/07/2017 J.P. Morgan (21,142) (0.01) EUR 6,804,409 AUD 10,145,000 18/07/2017 Commonwealth
Bank of Australia (18,464) 0.00 IDR 52,000,000,000 USD 3,903,025 21/07/2017 Goldman Sachs (11,064) 0.00
Unrealised Loss on Forward Currency Exchange Contracts (334,728) (0.05)
Total Unrealised Loss on Forward Currency Exchange Contracts (334,728) (0.05)
Net Unrealised Gain on Forward Currency Exchange Contracts 1,502,564 0.21
DERIVATIVES
Over-the-counter (OTC) and exchange traded derivatives as at 30 June 2017, expressed in Euro.
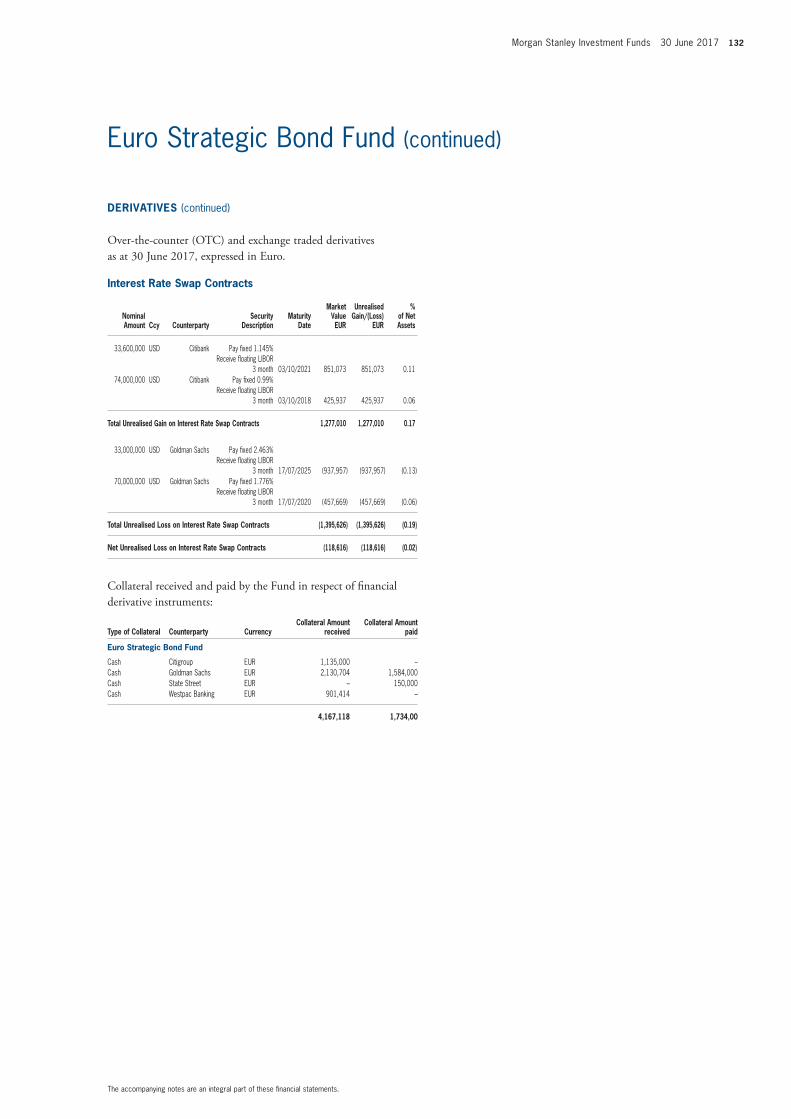
Morgan Stanley Investment Funds 30 June 2017 132
The accompanying notes are an integral part of these fi nancial statements.
Euro Strategic Bond Fund (continued)
Interest Rate Swap Contracts
Nominal Amount Ccy Counterparty
Security Description
Maturity Date
Market Value EUR
Unrealised Gain/(Loss)
EUR
% of Net Assets
33,600,000 USD Citibank Pay fi xed 1.145% Receive fl oating LIBOR
3 month 03/10/2021 851,073 851,073 0.11 74,000,000 USD Citibank Pay fi xed 0.99%
Receive fl oating LIBOR 3 month 03/10/2018 425,937 425,937 0.06
Total Unrealised Gain on Interest Rate Swap Contracts 1,277,010 1,277,010 0.17
33,000,000 USD Goldman Sachs Pay fi xed 2.463% Receive fl oating LIBOR
3 month 17/07/2025 (937,957) (937,957) (0.13) 70,000,000 USD Goldman Sachs Pay fi xed 1.776%
Receive fl oating LIBOR 3 month 17/07/2020 (457,669) (457,669) (0.06)
Total Unrealised Loss on Interest Rate Swap Contracts (1,395,626) (1,395,626) (0.19)
Net Unrealised Loss on Interest Rate Swap Contracts (118,616) (118,616) (0.02)
Collateral received and paid by the Fund in respect of fi nancial derivative instruments:
Type of Collateral Counterparty CurrencyCollateral Amount
receivedCollateral Amount
paid
Euro Strategic Bond Fund
Cash Citigroup EUR 1,135,000 –Cash Goldman Sachs EUR 2,130,704 1,584,000Cash State Street EUR – 150,000Cash Westpac Banking EUR 901,414 –
4,167,118 1,734,00
DERIVATIVES (continued)
Over-the-counter (OTC) and exchange traded derivatives as at 30 June 2017, expressed in Euro.
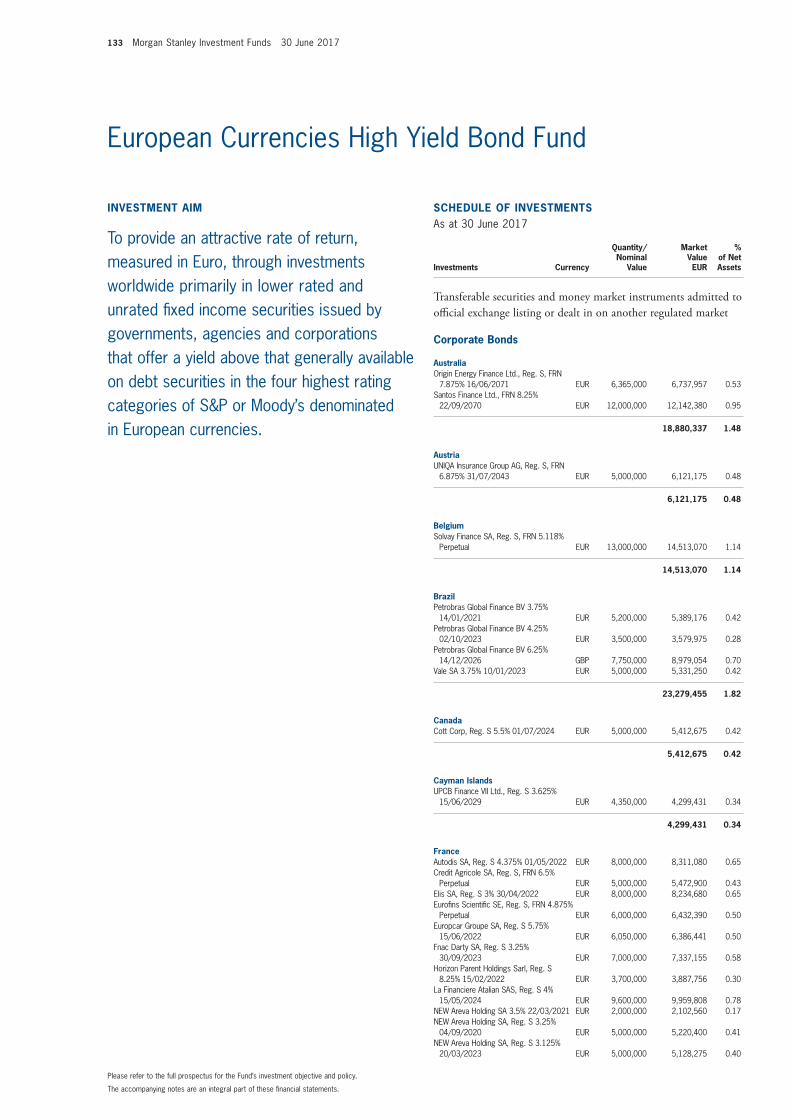
133 Morgan Stanley Investment Funds 30 June 2017
The accompanying notes are an integral part of these fi nancial statements.
Please refer to the full prospectus for the Fund’s investment objective and policy.
INVESTMENT AIM
To provide an attractive rate of return, measured in Euro, through investments worldwide primarily in lower rated and unrated fi xed income securities issued by governments, agencies and corporations that offer a yield above that generally available on debt securities in the four highest rating categories of S&P or Moody’s denominated in European currencies.
SCHEDULE OF INVESTMENTSAs at 30 June 2017
Investments Currency
Quantity/Nominal
Value
Market Value EUR
% of Net Assets
Transferable securities and money market instruments admitted to offi cial exchange listing or dealt in on another regulated market
Corporate Bonds
AustraliaOrigin Energy Finance Ltd., Reg. S, FRN
7.875% 16/06/2071 EUR 6,365,000 6,737,957 0.53Santos Finance Ltd., FRN 8.25%
22/09/2070 EUR 12,000,000 12,142,380 0.95
18,880,337 1.48
AustriaUNIQA Insurance Group AG, Reg. S, FRN
6.875% 31/07/2043 EUR 5,000,000 6,121,175 0.48
6,121,175 0.48
BelgiumSolvay Finance SA, Reg. S, FRN 5.118%
Perpetual EUR 13,000,000 14,513,070 1.14
14,513,070 1.14
BrazilPetrobras Global Finance BV 3.75%
14/01/2021 EUR 5,200,000 5,389,176 0.42Petrobras Global Finance BV 4.25%
02/10/2023 EUR 3,500,000 3,579,975 0.28Petrobras Global Finance BV 6.25%
14/12/2026 GBP 7,750,000 8,979,054 0.70Vale SA 3.75% 10/01/2023 EUR 5,000,000 5,331,250 0.42
23,279,455 1.82
CanadaCott Corp, Reg. S 5.5% 01/07/2024 EUR 5,000,000 5,412,675 0.42
5,412,675 0.42
Cayman IslandsUPCB Finance VII Ltd., Reg. S 3.625%
15/06/2029 EUR 4,350,000 4,299,431 0.34
4,299,431 0.34
FranceAutodis SA, Reg. S 4.375% 01/05/2022 EUR 8,000,000 8,311,080 0.65Credit Agricole SA, Reg. S, FRN 6.5%
Perpetual EUR 5,000,000 5,472,900 0.43Elis SA, Reg. S 3% 30/04/2022 EUR 8,000,000 8,234,680 0.65Eurofi ns Scientifi c SE, Reg. S, FRN 4.875%
Perpetual EUR 6,000,000 6,432,390 0.50Europcar Groupe SA, Reg. S 5.75%
15/06/2022 EUR 6,050,000 6,386,441 0.50Fnac Darty SA, Reg. S 3.25%
30/09/2023 EUR 7,000,000 7,337,155 0.58Horizon Parent Holdings Sarl, Reg. S
8.25% 15/02/2022 EUR 3,700,000 3,887,756 0.30La Financiere Atalian SAS, Reg. S 4%
15/05/2024 EUR 9,600,000 9,959,808 0.78NEW Areva Holding SA 3.5% 22/03/2021 EUR 2,000,000 2,102,560 0.17NEW Areva Holding SA, Reg. S 3.25%
04/09/2020 EUR 5,000,000 5,220,400 0.41NEW Areva Holding SA, Reg. S 3.125%
20/03/2023 EUR 5,000,000 5,128,275 0.40
European Currencies High Yield Bond Fund
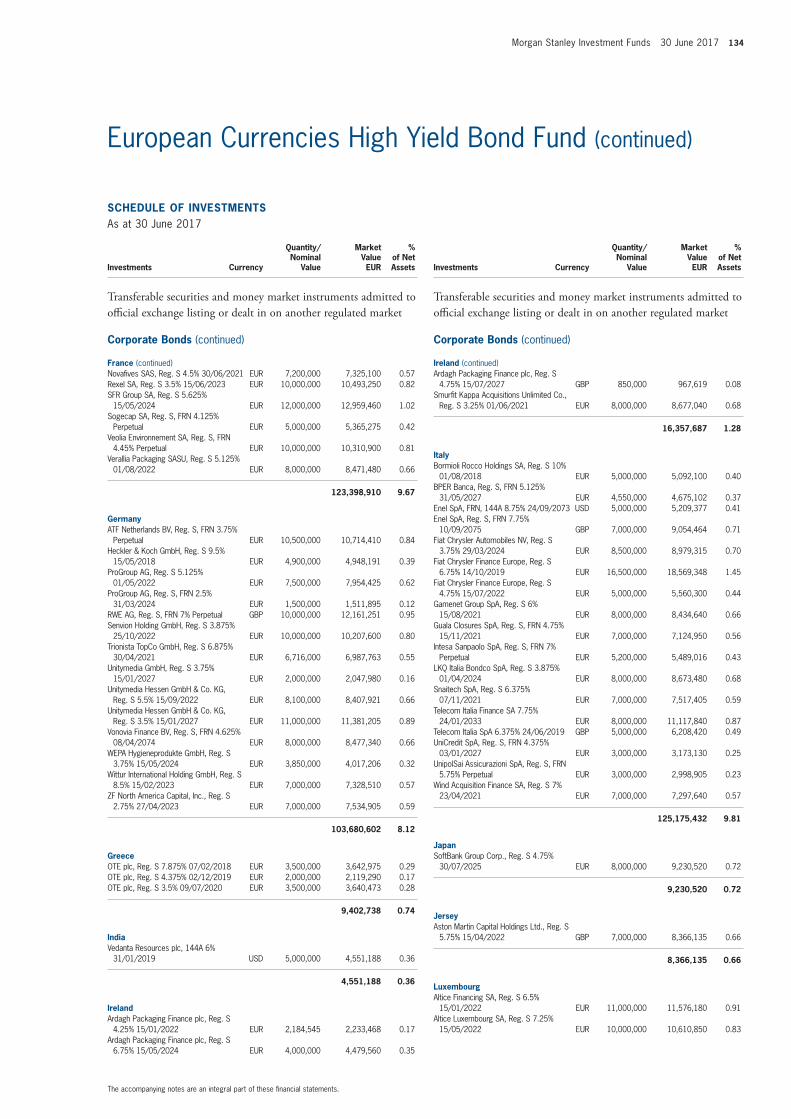
Morgan Stanley Investment Funds 30 June 2017 134
The accompanying notes are an integral part of these fi nancial statements.
European Currencies High Yield Bond Fund (continued)
SCHEDULE OF INVESTMENTSAs at 30 June 2017
Investments Currency
Quantity/Nominal
Value
Market Value EUR
% of Net Assets
Transferable securities and money market instruments admitted to offi cial exchange listing or dealt in on another regulated market
Corporate Bonds (continued)
France (continued)Novafi ves SAS, Reg. S 4.5% 30/06/2021 EUR 7,200,000 7,325,100 0.57Rexel SA, Reg. S 3.5% 15/06/2023 EUR 10,000,000 10,493,250 0.82SFR Group SA, Reg. S 5.625%
15/05/2024 EUR 12,000,000 12,959,460 1.02Sogecap SA, Reg. S, FRN 4.125%
Perpetual EUR 5,000,000 5,365,275 0.42Veolia Environnement SA, Reg. S, FRN
4.45% Perpetual EUR 10,000,000 10,310,900 0.81Verallia Packaging SASU, Reg. S 5.125%
01/08/2022 EUR 8,000,000 8,471,480 0.66
123,398,910 9.67
GermanyATF Netherlands BV, Reg. S, FRN 3.75%
Perpetual EUR 10,500,000 10,714,410 0.84Heckler & Koch GmbH, Reg. S 9.5%
15/05/2018 EUR 4,900,000 4,948,191 0.39ProGroup AG, Reg. S 5.125%
01/05/2022 EUR 7,500,000 7,954,425 0.62ProGroup AG, Reg. S, FRN 2.5%
31/03/2024 EUR 1,500,000 1,511,895 0.12RWE AG, Reg. S, FRN 7% Perpetual GBP 10,000,000 12,161,251 0.95Senvion Holding GmbH, Reg. S 3.875%
25/10/2022 EUR 10,000,000 10,207,600 0.80Trionista TopCo GmbH, Reg. S 6.875%
30/04/2021 EUR 6,716,000 6,987,763 0.55Unitymedia GmbH, Reg. S 3.75%
15/01/2027 EUR 2,000,000 2,047,980 0.16Unitymedia Hessen GmbH & Co. KG,
Reg. S 5.5% 15/09/2022 EUR 8,100,000 8,407,921 0.66Unitymedia Hessen GmbH & Co. KG,
Reg. S 3.5% 15/01/2027 EUR 11,000,000 11,381,205 0.89Vonovia Finance BV, Reg. S, FRN 4.625%
08/04/2074 EUR 8,000,000 8,477,340 0.66WEPA Hygieneprodukte GmbH, Reg. S
3.75% 15/05/2024 EUR 3,850,000 4,017,206 0.32Wittur International Holding GmbH, Reg. S
8.5% 15/02/2023 EUR 7,000,000 7,328,510 0.57ZF North America Capital, Inc., Reg. S
2.75% 27/04/2023 EUR 7,000,000 7,534,905 0.59
103,680,602 8.12
GreeceOTE plc, Reg. S 7.875% 07/02/2018 EUR 3,500,000 3,642,975 0.29OTE plc, Reg. S 4.375% 02/12/2019 EUR 2,000,000 2,119,290 0.17OTE plc, Reg. S 3.5% 09/07/2020 EUR 3,500,000 3,640,473 0.28
9,402,738 0.74
IndiaVedanta Resources plc, 144A 6%
31/01/2019 USD 5,000,000 4,551,188 0.36
4,551,188 0.36
IrelandArdagh Packaging Finance plc, Reg. S
4.25% 15/01/2022 EUR 2,184,545 2,233,468 0.17Ardagh Packaging Finance plc, Reg. S
6.75% 15/05/2024 EUR 4,000,000 4,479,560 0.35
SCHEDULE OF INVESTMENTSAs at 30 June 2017
Investments Currency
Quantity/Nominal
Value
Market Value EUR
% of Net Assets
Transferable securities and money market instruments admitted to offi cial exchange listing or dealt in on another regulated market
Corporate Bonds (continued)
Ireland (continued)Ardagh Packaging Finance plc, Reg. S
4.75% 15/07/2027 GBP 850,000 967,619 0.08Smurfi t Kappa Acquisitions Unlimited Co.,
Reg. S 3.25% 01/06/2021 EUR 8,000,000 8,677,040 0.68
16,357,687 1.28
ItalyBormioli Rocco Holdings SA, Reg. S 10%
01/08/2018 EUR 5,000,000 5,092,100 0.40BPER Banca, Reg. S, FRN 5.125%
31/05/2027 EUR 4,550,000 4,675,102 0.37Enel SpA, FRN, 144A 8.75% 24/09/2073 USD 5,000,000 5,209,377 0.41Enel SpA, Reg. S, FRN 7.75%
10/09/2075 GBP 7,000,000 9,054,464 0.71Fiat Chrysler Automobiles NV, Reg. S
3.75% 29/03/2024 EUR 8,500,000 8,979,315 0.70Fiat Chrysler Finance Europe, Reg. S
6.75% 14/10/2019 EUR 16,500,000 18,569,348 1.45Fiat Chrysler Finance Europe, Reg. S
4.75% 15/07/2022 EUR 5,000,000 5,560,300 0.44Gamenet Group SpA, Reg. S 6%
15/08/2021 EUR 8,000,000 8,434,640 0.66Guala Closures SpA, Reg. S, FRN 4.75%
15/11/2021 EUR 7,000,000 7,124,950 0.56Intesa Sanpaolo SpA, Reg. S, FRN 7%
Perpetual EUR 5,200,000 5,489,016 0.43LKQ Italia Bondco SpA, Reg. S 3.875%
01/04/2024 EUR 8,000,000 8,673,480 0.68Snaitech SpA, Reg. S 6.375%
07/11/2021 EUR 7,000,000 7,517,405 0.59Telecom Italia Finance SA 7.75%
24/01/2033 EUR 8,000,000 11,117,840 0.87Telecom Italia SpA 6.375% 24/06/2019 GBP 5,000,000 6,208,420 0.49UniCredit SpA, Reg. S, FRN 4.375%
03/01/2027 EUR 3,000,000 3,173,130 0.25UnipolSai Assicurazioni SpA, Reg. S, FRN
5.75% Perpetual EUR 3,000,000 2,998,905 0.23Wind Acquisition Finance SA, Reg. S 7%
23/04/2021 EUR 7,000,000 7,297,640 0.57
125,175,432 9.81
JapanSoftBank Group Corp., Reg. S 4.75%
30/07/2025 EUR 8,000,000 9,230,520 0.72
9,230,520 0.72
JerseyAston Martin Capital Holdings Ltd., Reg. S
5.75% 15/04/2022 GBP 7,000,000 8,366,135 0.66
8,366,135 0.66
LuxembourgAltice Financing SA, Reg. S 6.5%
15/01/2022 EUR 11,000,000 11,576,180 0.91Altice Luxembourg SA, Reg. S 7.25%
15/05/2022 EUR 10,000,000 10,610,850 0.83
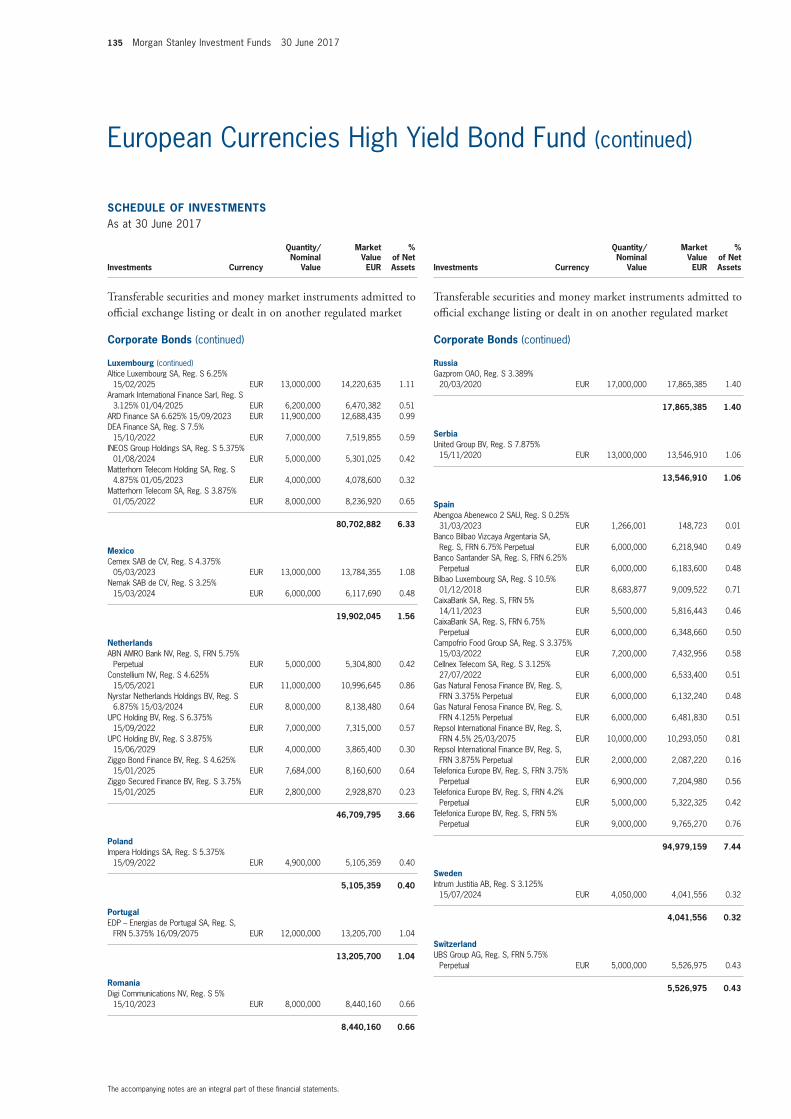
135 Morgan Stanley Investment Funds 30 June 2017
The accompanying notes are an integral part of these fi nancial statements.
European Currencies High Yield Bond Fund (continued)
SCHEDULE OF INVESTMENTSAs at 30 June 2017
Investments Currency
Quantity/Nominal
Value
Market Value EUR
% of Net Assets
Transferable securities and money market instruments admitted to offi cial exchange listing or dealt in on another regulated market
Corporate Bonds (continued)
Luxembourg (continued)Altice Luxembourg SA, Reg. S 6.25%
15/02/2025 EUR 13,000,000 14,220,635 1.11Aramark International Finance Sarl, Reg. S
3.125% 01/04/2025 EUR 6,200,000 6,470,382 0.51ARD Finance SA 6.625% 15/09/2023 EUR 11,900,000 12,688,435 0.99DEA Finance SA, Reg. S 7.5%
15/10/2022 EUR 7,000,000 7,519,855 0.59INEOS Group Holdings SA, Reg. S 5.375%
01/08/2024 EUR 5,000,000 5,301,025 0.42Matterhorn Telecom Holding SA, Reg. S
4.875% 01/05/2023 EUR 4,000,000 4,078,600 0.32Matterhorn Telecom SA, Reg. S 3.875%
01/05/2022 EUR 8,000,000 8,236,920 0.65
80,702,882 6.33
MexicoCemex SAB de CV, Reg. S 4.375%
05/03/2023 EUR 13,000,000 13,784,355 1.08Nemak SAB de CV, Reg. S 3.25%
15/03/2024 EUR 6,000,000 6,117,690 0.48
19,902,045 1.56
NetherlandsABN AMRO Bank NV, Reg. S, FRN 5.75%
Perpetual EUR 5,000,000 5,304,800 0.42Constellium NV, Reg. S 4.625%
15/05/2021 EUR 11,000,000 10,996,645 0.86Nyrstar Netherlands Holdings BV, Reg. S
6.875% 15/03/2024 EUR 8,000,000 8,138,480 0.64UPC Holding BV, Reg. S 6.375%
15/09/2022 EUR 7,000,000 7,315,000 0.57UPC Holding BV, Reg. S 3.875%
15/06/2029 EUR 4,000,000 3,865,400 0.30Ziggo Bond Finance BV, Reg. S 4.625%
15/01/2025 EUR 7,684,000 8,160,600 0.64Ziggo Secured Finance BV, Reg. S 3.75%
15/01/2025 EUR 2,800,000 2,928,870 0.23
46,709,795 3.66
PolandImpera Holdings SA, Reg. S 5.375%
15/09/2022 EUR 4,900,000 5,105,359 0.40
5,105,359 0.40
PortugalEDP – Energias de Portugal SA, Reg. S,
FRN 5.375% 16/09/2075 EUR 12,000,000 13,205,700 1.04
13,205,700 1.04
RomaniaDigi Communications NV, Reg. S 5%
15/10/2023 EUR 8,000,000 8,440,160 0.66
8,440,160 0.66
SCHEDULE OF INVESTMENTSAs at 30 June 2017
Investments Currency
Quantity/Nominal
Value
Market Value EUR
% of Net Assets
Transferable securities and money market instruments admitted to offi cial exchange listing or dealt in on another regulated market
Corporate Bonds (continued)
RussiaGazprom OAO, Reg. S 3.389%
20/03/2020 EUR 17,000,000 17,865,385 1.40
17,865,385 1.40
SerbiaUnited Group BV, Reg. S 7.875%
15/11/2020 EUR 13,000,000 13,546,910 1.06
13,546,910 1.06
SpainAbengoa Abenewco 2 SAU, Reg. S 0.25%
31/03/2023 EUR 1,266,001 148,723 0.01Banco Bilbao Vizcaya Argentaria SA,
Reg. S, FRN 6.75% Perpetual EUR 6,000,000 6,218,940 0.49Banco Santander SA, Reg. S, FRN 6.25%
Perpetual EUR 6,000,000 6,183,600 0.48Bilbao Luxembourg SA, Reg. S 10.5%
01/12/2018 EUR 8,683,877 9,009,522 0.71CaixaBank SA, Reg. S, FRN 5%
14/11/2023 EUR 5,500,000 5,816,443 0.46CaixaBank SA, Reg. S, FRN 6.75%
Perpetual EUR 6,000,000 6,348,660 0.50Campofrio Food Group SA, Reg. S 3.375%
15/03/2022 EUR 7,200,000 7,432,956 0.58Cellnex Telecom SA, Reg. S 3.125%
27/07/2022 EUR 6,000,000 6,533,400 0.51Gas Natural Fenosa Finance BV, Reg. S,
FRN 3.375% Perpetual EUR 6,000,000 6,132,240 0.48Gas Natural Fenosa Finance BV, Reg. S,
FRN 4.125% Perpetual EUR 6,000,000 6,481,830 0.51Repsol International Finance BV, Reg. S,
FRN 4.5% 25/03/2075 EUR 10,000,000 10,293,050 0.81Repsol International Finance BV, Reg. S,
FRN 3.875% Perpetual EUR 2,000,000 2,087,220 0.16Telefonica Europe BV, Reg. S, FRN 3.75%
Perpetual EUR 6,900,000 7,204,980 0.56Telefonica Europe BV, Reg. S, FRN 4.2%
Perpetual EUR 5,000,000 5,322,325 0.42Telefonica Europe BV, Reg. S, FRN 5%
Perpetual EUR 9,000,000 9,765,270 0.76
94,979,159 7.44
SwedenIntrum Justitia AB, Reg. S 3.125%
15/07/2024 EUR 4,050,000 4,041,556 0.32
4,041,556 0.32
SwitzerlandUBS Group AG, Reg. S, FRN 5.75%
Perpetual EUR 5,000,000 5,526,975 0.43
5,526,975 0.43
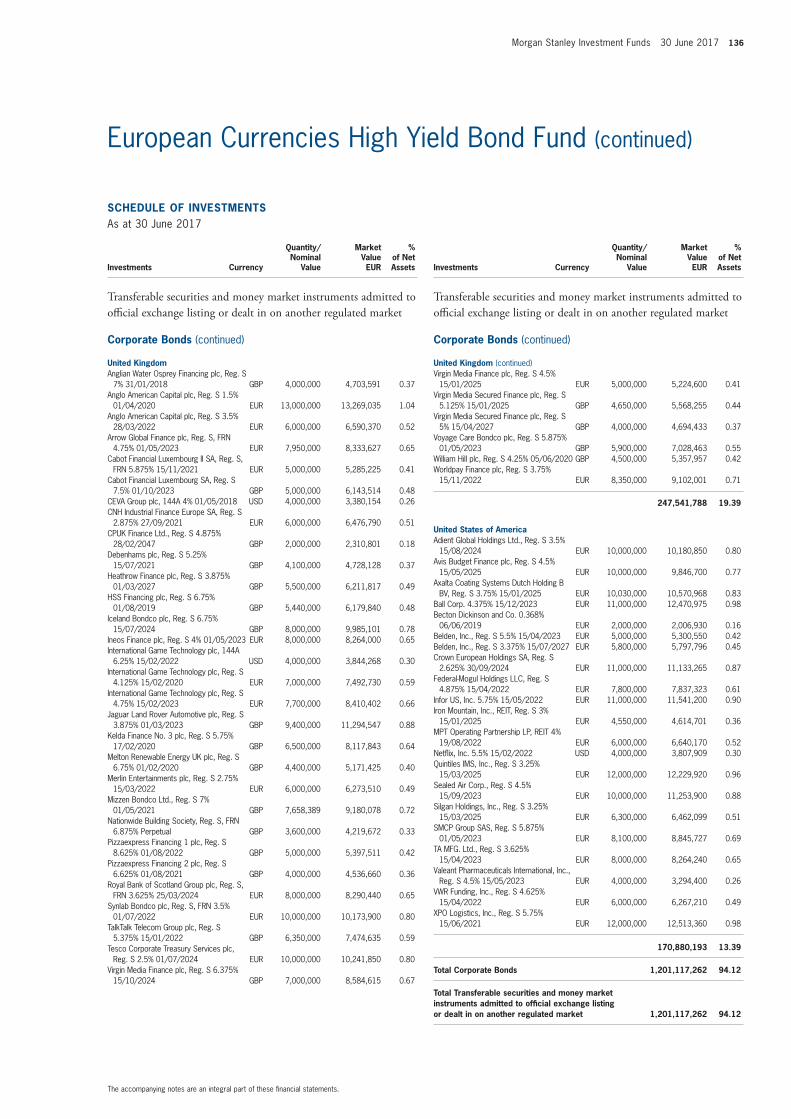
Morgan Stanley Investment Funds 30 June 2017 136
The accompanying notes are an integral part of these fi nancial statements.
European Currencies High Yield Bond Fund (continued)
SCHEDULE OF INVESTMENTSAs at 30 June 2017
Investments Currency
Quantity/Nominal
Value
Market Value EUR
% of Net Assets
Transferable securities and money market instruments admitted to offi cial exchange listing or dealt in on another regulated market
Corporate Bonds (continued)
United KingdomAnglian Water Osprey Financing plc, Reg. S
7% 31/01/2018 GBP 4,000,000 4,703,591 0.37Anglo American Capital plc, Reg. S 1.5%
01/04/2020 EUR 13,000,000 13,269,035 1.04Anglo American Capital plc, Reg. S 3.5%
28/03/2022 EUR 6,000,000 6,590,370 0.52Arrow Global Finance plc, Reg. S, FRN
4.75% 01/05/2023 EUR 7,950,000 8,333,627 0.65Cabot Financial Luxembourg II SA, Reg. S,
FRN 5.875% 15/11/2021 EUR 5,000,000 5,285,225 0.41Cabot Financial Luxembourg SA, Reg. S
7.5% 01/10/2023 GBP 5,000,000 6,143,514 0.48CEVA Group plc, 144A 4% 01/05/2018 USD 4,000,000 3,380,154 0.26CNH Industrial Finance Europe SA, Reg. S
2.875% 27/09/2021 EUR 6,000,000 6,476,790 0.51CPUK Finance Ltd., Reg. S 4.875%
28/02/2047 GBP 2,000,000 2,310,801 0.18Debenhams plc, Reg. S 5.25%
15/07/2021 GBP 4,100,000 4,728,128 0.37Heathrow Finance plc, Reg. S 3.875%
01/03/2027 GBP 5,500,000 6,211,817 0.49HSS Financing plc, Reg. S 6.75%
01/08/2019 GBP 5,440,000 6,179,840 0.48Iceland Bondco plc, Reg. S 6.75%
15/07/2024 GBP 8,000,000 9,985,101 0.78Ineos Finance plc, Reg. S 4% 01/05/2023 EUR 8,000,000 8,264,000 0.65International Game Technology plc, 144A
6.25% 15/02/2022 USD 4,000,000 3,844,268 0.30International Game Technology plc, Reg. S
4.125% 15/02/2020 EUR 7,000,000 7,492,730 0.59International Game Technology plc, Reg. S
4.75% 15/02/2023 EUR 7,700,000 8,410,402 0.66Jaguar Land Rover Automotive plc, Reg. S
3.875% 01/03/2023 GBP 9,400,000 11,294,547 0.88Kelda Finance No. 3 plc, Reg. S 5.75%
17/02/2020 GBP 6,500,000 8,117,843 0.64Melton Renewable Energy UK plc, Reg. S
6.75% 01/02/2020 GBP 4,400,000 5,171,425 0.40Merlin Entertainments plc, Reg. S 2.75%
15/03/2022 EUR 6,000,000 6,273,510 0.49Mizzen Bondco Ltd., Reg. S 7%
01/05/2021 GBP 7,658,389 9,180,078 0.72Nationwide Building Society, Reg. S, FRN
6.875% Perpetual GBP 3,600,000 4,219,672 0.33Pizzaexpress Financing 1 plc, Reg. S
8.625% 01/08/2022 GBP 5,000,000 5,397,511 0.42Pizzaexpress Financing 2 plc, Reg. S
6.625% 01/08/2021 GBP 4,000,000 4,536,660 0.36Royal Bank of Scotland Group plc, Reg. S,
FRN 3.625% 25/03/2024 EUR 8,000,000 8,290,440 0.65Synlab Bondco plc, Reg. S, FRN 3.5%
01/07/2022 EUR 10,000,000 10,173,900 0.80TalkTalk Telecom Group plc, Reg. S
5.375% 15/01/2022 GBP 6,350,000 7,474,635 0.59Tesco Corporate Treasury Services plc,
Reg. S 2.5% 01/07/2024 EUR 10,000,000 10,241,850 0.80Virgin Media Finance plc, Reg. S 6.375%
15/10/2024 GBP 7,000,000 8,584,615 0.67
SCHEDULE OF INVESTMENTSAs at 30 June 2017
Investments Currency
Quantity/Nominal
Value
Market Value EUR
% of Net Assets
Transferable securities and money market instruments admitted to offi cial exchange listing or dealt in on another regulated market
Corporate Bonds (continued)
United Kingdom (continued)Virgin Media Finance plc, Reg. S 4.5%
15/01/2025 EUR 5,000,000 5,224,600 0.41Virgin Media Secured Finance plc, Reg. S
5.125% 15/01/2025 GBP 4,650,000 5,568,255 0.44Virgin Media Secured Finance plc, Reg. S
5% 15/04/2027 GBP 4,000,000 4,694,433 0.37Voyage Care Bondco plc, Reg. S 5.875%
01/05/2023 GBP 5,900,000 7,028,463 0.55William Hill plc, Reg. S 4.25% 05/06/2020 GBP 4,500,000 5,357,957 0.42Worldpay Finance plc, Reg. S 3.75%
15/11/2022 EUR 8,350,000 9,102,001 0.71
247,541,788 19.39
United States of AmericaAdient Global Holdings Ltd., Reg. S 3.5%
15/08/2024 EUR 10,000,000 10,180,850 0.80Avis Budget Finance plc, Reg. S 4.5%
15/05/2025 EUR 10,000,000 9,846,700 0.77Axalta Coating Systems Dutch Holding B
BV, Reg. S 3.75% 15/01/2025 EUR 10,030,000 10,570,968 0.83Ball Corp. 4.375% 15/12/2023 EUR 11,000,000 12,470,975 0.98Becton Dickinson and Co. 0.368%
06/06/2019 EUR 2,000,000 2,006,930 0.16Belden, Inc., Reg. S 5.5% 15/04/2023 EUR 5,000,000 5,300,550 0.42Belden, Inc., Reg. S 3.375% 15/07/2027 EUR 5,800,000 5,797,796 0.45Crown European Holdings SA, Reg. S
2.625% 30/09/2024 EUR 11,000,000 11,133,265 0.87Federal-Mogul Holdings LLC, Reg. S
4.875% 15/04/2022 EUR 7,800,000 7,837,323 0.61Infor US, Inc. 5.75% 15/05/2022 EUR 11,000,000 11,541,200 0.90Iron Mountain, Inc., REIT, Reg. S 3%
15/01/2025 EUR 4,550,000 4,614,701 0.36MPT Operating Partnership LP, REIT 4%
19/08/2022 EUR 6,000,000 6,640,170 0.52Netfl ix, Inc. 5.5% 15/02/2022 USD 4,000,000 3,807,909 0.30Quintiles IMS, Inc., Reg. S 3.25%
15/03/2025 EUR 12,000,000 12,229,920 0.96Sealed Air Corp., Reg. S 4.5%
15/09/2023 EUR 10,000,000 11,253,900 0.88Silgan Holdings, Inc., Reg. S 3.25%
15/03/2025 EUR 6,300,000 6,462,099 0.51SMCP Group SAS, Reg. S 5.875%
01/05/2023 EUR 8,100,000 8,845,727 0.69TA MFG. Ltd., Reg. S 3.625%
15/04/2023 EUR 8,000,000 8,264,240 0.65Valeant Pharmaceuticals International, Inc.,
Reg. S 4.5% 15/05/2023 EUR 4,000,000 3,294,400 0.26VWR Funding, Inc., Reg. S 4.625%
15/04/2022 EUR 6,000,000 6,267,210 0.49XPO Logistics, Inc., Reg. S 5.75%
15/06/2021 EUR 12,000,000 12,513,360 0.98
170,880,193 13.39
Total Corporate Bonds 1,201,117,262 94.12
Total Transferable securities and money market instruments admitted to offi cial exchange listing or dealt in on another regulated market 1,201,117,262 94.12
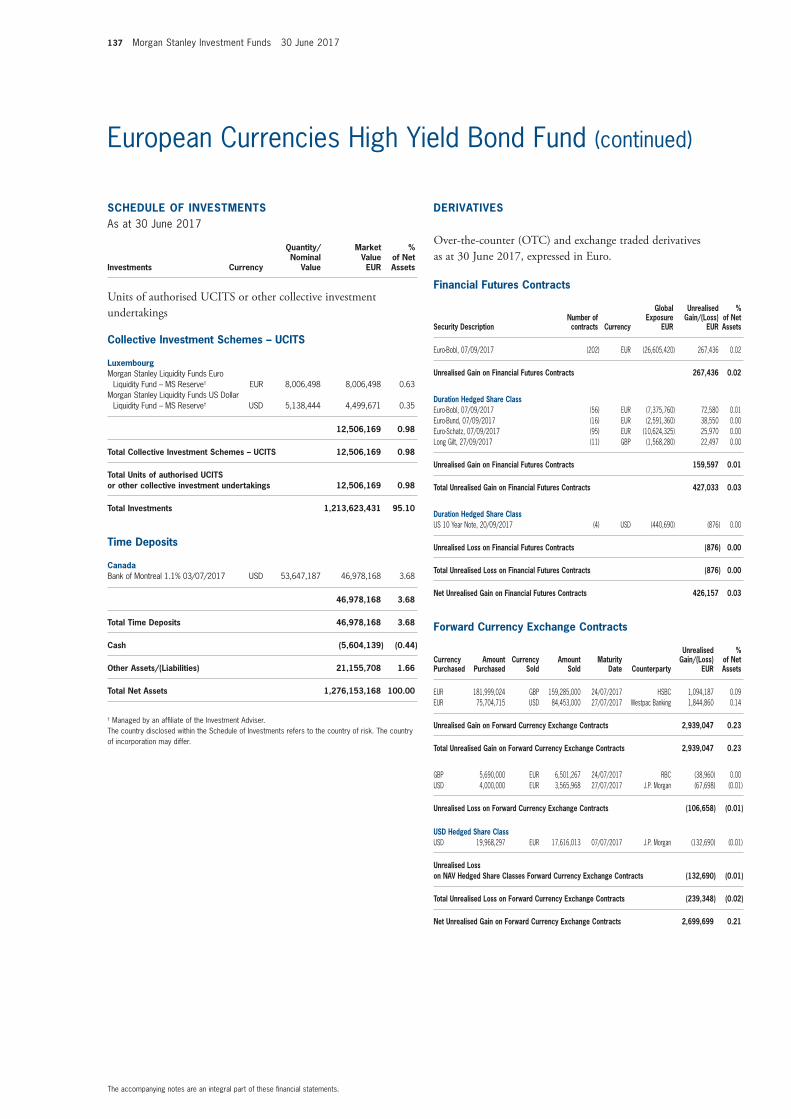
137 Morgan Stanley Investment Funds 30 June 2017
The accompanying notes are an integral part of these fi nancial statements.
European Currencies High Yield Bond Fund (continued)
SCHEDULE OF INVESTMENTSAs at 30 June 2017
Investments Currency
Quantity/Nominal
Value
Market Value EUR
% of Net Assets
Units of authorised UCITS or other collective investment undertakings
Collective Investment Schemes – UCITS
LuxembourgMorgan Stanley Liquidity Funds Euro
Liquidity Fund – MS Reserve† EUR 8,006,498 8,006,498 0.63Morgan Stanley Liquidity Funds US Dollar
Liquidity Fund – MS Reserve† USD 5,138,444 4,499,671 0.35
12,506,169 0.98
Total Collective Investment Schemes – UCITS 12,506,169 0.98
Total Units of authorised UCITS or other collective investment undertakings 12,506,169 0.98
Total Investments 1,213,623,431 95.10
Time Deposits
CanadaBank of Montreal 1.1% 03/07/2017 USD 53,647,187 46,978,168 3.68
46,978,168 3.68
Total Time Deposits 46,978,168 3.68
Cash (5,604,139) (0.44)
Other Assets/(Liabilities) 21,155,708 1.66
Total Net Assets 1,276,153,168 100.00
† Managed by an affi liate of the Investment Adviser.The country disclosed within the Schedule of Investments refers to the country of risk. The country of incorporation may differ.
Financial Futures Contracts
Security DescriptionNumber of contracts Currency
Global Exposure
EUR
Unrealised Gain/(Loss)
EUR
% of Net Assets
Euro-Bobl, 07/09/2017 (202) EUR (26,605,420) 267,436 0.02
Unrealised Gain on Financial Futures Contracts 267,436 0.02
Duration Hedged Share ClassEuro-Bobl, 07/09/2017 (56) EUR (7,375,760) 72,580 0.01 Euro-Bund, 07/09/2017 (16) EUR (2,591,360) 38,550 0.00 Euro-Schatz, 07/09/2017 (95) EUR (10,624,325) 25,970 0.00 Long Gilt, 27/09/2017 (11) GBP (1,568,280) 22,497 0.00
Unrealised Gain on Financial Futures Contracts 159,597 0.01
Total Unrealised Gain on Financial Futures Contracts 427,033 0.03
Duration Hedged Share ClassUS 10 Year Note, 20/09/2017 (4) USD (440,690) (876) 0.00
Unrealised Loss on Financial Futures Contracts (876) 0.00
Total Unrealised Loss on Financial Futures Contracts (876) 0.00
Net Unrealised Gain on Financial Futures Contracts 426,157 0.03
Forward Currency Exchange Contracts
Currency Purchased
Amount Purchased
Currency Sold
Amount Sold
Maturity Date Counterparty
Unrealised Gain/(Loss)
EUR
% of Net Assets
EUR 181,999,024 GBP 159,285,000 24/07/2017 HSBC 1,094,187 0.09 EUR 75,704,715 USD 84,453,000 27/07/2017 Westpac Banking 1,844,860 0.14
Unrealised Gain on Forward Currency Exchange Contracts 2,939,047 0.23
Total Unrealised Gain on Forward Currency Exchange Contracts 2,939,047 0.23
GBP 5,690,000 EUR 6,501,267 24/07/2017 RBC (38,960) 0.00 USD 4,000,000 EUR 3,565,968 27/07/2017 J.P. Morgan (67,698) (0.01)
Unrealised Loss on Forward Currency Exchange Contracts (106,658) (0.01)
USD Hedged Share ClassUSD 19,968,297 EUR 17,616,013 07/07/2017 J.P. Morgan (132,690) (0.01)
Unrealised Loss on NAV Hedged Share Classes Forward Currency Exchange Contracts (132,690) (0.01)
Total Unrealised Loss on Forward Currency Exchange Contracts (239,348) (0.02)
Net Unrealised Gain on Forward Currency Exchange Contracts 2,699,699 0.21
DERIVATIVES
Over-the-counter (OTC) and exchange traded derivatives as at 30 June 2017, expressed in Euro.
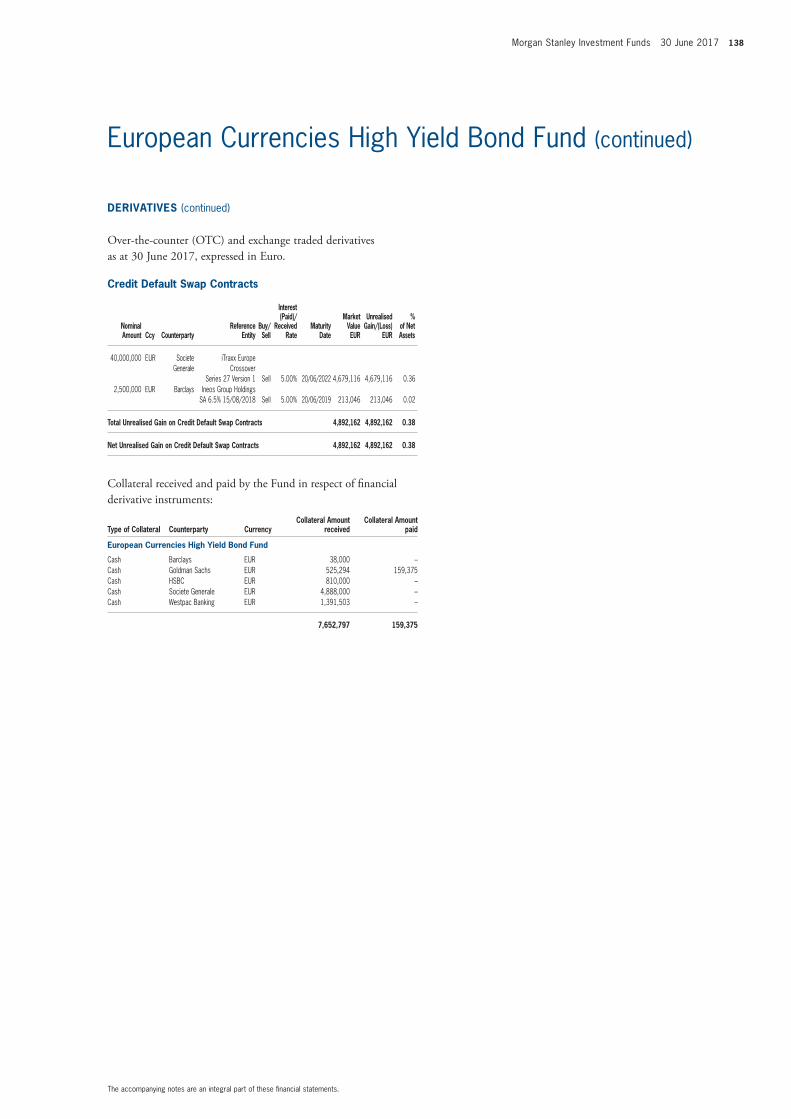
Morgan Stanley Investment Funds 30 June 2017 138
The accompanying notes are an integral part of these fi nancial statements.
European Currencies High Yield Bond Fund (continued)
Credit Default Swap Contracts
Nominal Amount Ccy Counterparty
Reference Entity
Buy/Sell
Interest (Paid)/
Received Rate
Maturity Date
Market Value EUR
Unrealised Gain/(Loss)
EUR
% of Net Assets
40,000,000 EUR Societe Generale
iTraxx Europe Crossover
Series 27 Version 1 Sell 5.00% 20/06/2022 4,679,116 4,679,116 0.36 2,500,000 EUR Barclays Ineos Group Holdings
SA 6.5% 15/08/2018 Sell 5.00% 20/06/2019 213,046 213,046 0.02
Total Unrealised Gain on Credit Default Swap Contracts 4,892,162 4,892,162 0.38
Net Unrealised Gain on Credit Default Swap Contracts 4,892,162 4,892,162 0.38
Collateral received and paid by the Fund in respect of fi nancial derivative instruments:
Type of Collateral Counterparty CurrencyCollateral Amount
receivedCollateral Amount
paid
European Currencies High Yield Bond Fund
Cash Barclays EUR 38,000 –Cash Goldman Sachs EUR 525,294 159,375Cash HSBC EUR 810,000 –Cash Societe Generale EUR 4,888,000 –Cash Westpac Banking EUR 1,391,503 –
7,652,797 159,375
DERIVATIVES (continued)
Over-the-counter (OTC) and exchange traded derivatives as at 30 June 2017, expressed in Euro.
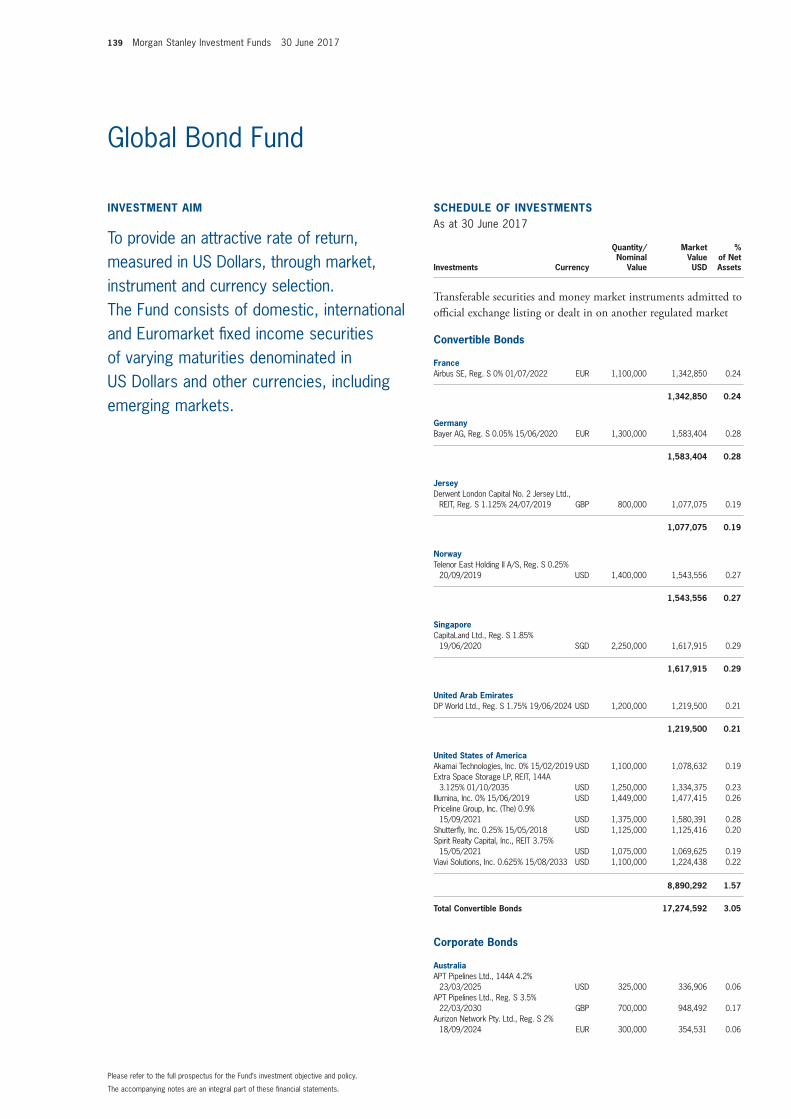
139 Morgan Stanley Investment Funds 30 June 2017
The accompanying notes are an integral part of these fi nancial statements.
Please refer to the full prospectus for the Fund’s investment objective and policy.
INVESTMENT AIM
To provide an attractive rate of return, measured in US Dollars, through market, instrument and currency selection. The Fund consists of domestic, international and Euromarket fi xed income securities of varying maturities denominated in US Dollars and other currencies, including emerging markets.
SCHEDULE OF INVESTMENTSAs at 30 June 2017
Investments Currency
Quantity/Nominal
Value
Market Value USD
% of Net Assets
Transferable securities and money market instruments admitted to offi cial exchange listing or dealt in on another regulated market
Convertible Bonds
FranceAirbus SE, Reg. S 0% 01/07/2022 EUR 1,100,000 1,342,850 0.24
1,342,850 0.24
GermanyBayer AG, Reg. S 0.05% 15/06/2020 EUR 1,300,000 1,583,404 0.28
1,583,404 0.28
JerseyDerwent London Capital No. 2 Jersey Ltd.,
REIT, Reg. S 1.125% 24/07/2019 GBP 800,000 1,077,075 0.19
1,077,075 0.19
NorwayTelenor East Holding II A/S, Reg. S 0.25%
20/09/2019 USD 1,400,000 1,543,556 0.27
1,543,556 0.27
SingaporeCapitaLand Ltd., Reg. S 1.85%
19/06/2020 SGD 2,250,000 1,617,915 0.29
1,617,915 0.29
United Arab EmiratesDP World Ltd., Reg. S 1.75% 19/06/2024 USD 1,200,000 1,219,500 0.21
1,219,500 0.21
United States of AmericaAkamai Technologies, Inc. 0% 15/02/2019 USD 1,100,000 1,078,632 0.19Extra Space Storage LP, REIT, 144A
3.125% 01/10/2035 USD 1,250,000 1,334,375 0.23Illumina, Inc. 0% 15/06/2019 USD 1,449,000 1,477,415 0.26Priceline Group, Inc. (The) 0.9%
15/09/2021 USD 1,375,000 1,580,391 0.28Shutterfl y, Inc. 0.25% 15/05/2018 USD 1,125,000 1,125,416 0.20Spirit Realty Capital, Inc., REIT 3.75%
15/05/2021 USD 1,075,000 1,069,625 0.19Viavi Solutions, Inc. 0.625% 15/08/2033 USD 1,100,000 1,224,438 0.22
8,890,292 1.57
Total Convertible Bonds 17,274,592 3.05
Corporate Bonds
AustraliaAPT Pipelines Ltd., 144A 4.2%
23/03/2025 USD 325,000 336,906 0.06APT Pipelines Ltd., Reg. S 3.5%
22/03/2030 GBP 700,000 948,492 0.17Aurizon Network Pty. Ltd., Reg. S 2%
18/09/2024 EUR 300,000 354,531 0.06
Global Bond Fund
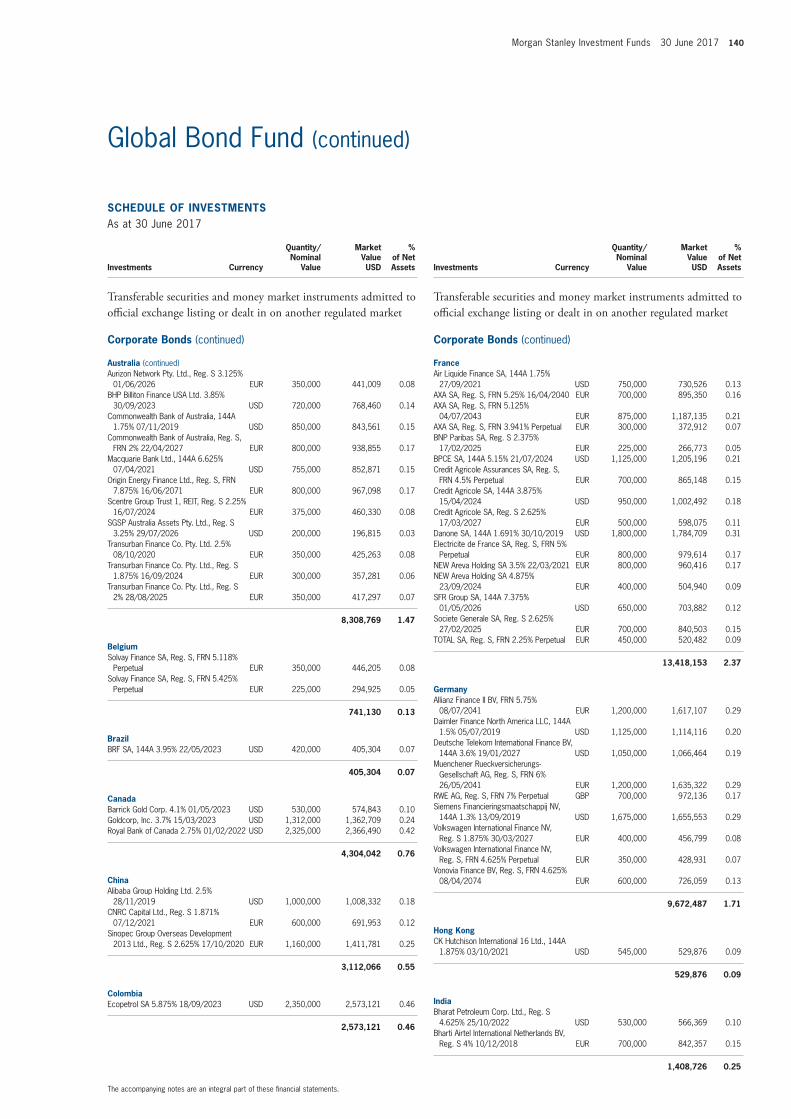
Morgan Stanley Investment Funds 30 June 2017 140
The accompanying notes are an integral part of these fi nancial statements.
Global Bond Fund (continued)
SCHEDULE OF INVESTMENTSAs at 30 June 2017
Investments Currency
Quantity/Nominal
Value
Market Value USD
% of Net Assets
Transferable securities and money market instruments admitted to offi cial exchange listing or dealt in on another regulated market
Corporate Bonds (continued)
Australia (continued)Aurizon Network Pty. Ltd., Reg. S 3.125%
01/06/2026 EUR 350,000 441,009 0.08BHP Billiton Finance USA Ltd. 3.85%
30/09/2023 USD 720,000 768,460 0.14Commonwealth Bank of Australia, 144A
1.75% 07/11/2019 USD 850,000 843,561 0.15Commonwealth Bank of Australia, Reg. S,
FRN 2% 22/04/2027 EUR 800,000 938,855 0.17Macquarie Bank Ltd., 144A 6.625%
07/04/2021 USD 755,000 852,871 0.15Origin Energy Finance Ltd., Reg. S, FRN
7.875% 16/06/2071 EUR 800,000 967,098 0.17Scentre Group Trust 1, REIT, Reg. S 2.25%
16/07/2024 EUR 375,000 460,330 0.08SGSP Australia Assets Pty. Ltd., Reg. S
3.25% 29/07/2026 USD 200,000 196,815 0.03Transurban Finance Co. Pty. Ltd. 2.5%
08/10/2020 EUR 350,000 425,263 0.08Transurban Finance Co. Pty. Ltd., Reg. S
1.875% 16/09/2024 EUR 300,000 357,281 0.06Transurban Finance Co. Pty. Ltd., Reg. S
2% 28/08/2025 EUR 350,000 417,297 0.07
8,308,769 1.47
BelgiumSolvay Finance SA, Reg. S, FRN 5.118%
Perpetual EUR 350,000 446,205 0.08Solvay Finance SA, Reg. S, FRN 5.425%
Perpetual EUR 225,000 294,925 0.05
741,130 0.13
BrazilBRF SA, 144A 3.95% 22/05/2023 USD 420,000 405,304 0.07
405,304 0.07
CanadaBarrick Gold Corp. 4.1% 01/05/2023 USD 530,000 574,843 0.10Goldcorp, Inc. 3.7% 15/03/2023 USD 1,312,000 1,362,709 0.24Royal Bank of Canada 2.75% 01/02/2022 USD 2,325,000 2,366,490 0.42
4,304,042 0.76
ChinaAlibaba Group Holding Ltd. 2.5%
28/11/2019 USD 1,000,000 1,008,332 0.18CNRC Capital Ltd., Reg. S 1.871%
07/12/2021 EUR 600,000 691,953 0.12Sinopec Group Overseas Development
2013 Ltd., Reg. S 2.625% 17/10/2020 EUR 1,160,000 1,411,781 0.25
3,112,066 0.55
ColombiaEcopetrol SA 5.875% 18/09/2023 USD 2,350,000 2,573,121 0.46
2,573,121 0.46
SCHEDULE OF INVESTMENTSAs at 30 June 2017
Investments Currency
Quantity/Nominal
Value
Market Value USD
% of Net Assets
Transferable securities and money market instruments admitted to offi cial exchange listing or dealt in on another regulated market
Corporate Bonds (continued)
FranceAir Liquide Finance SA, 144A 1.75%
27/09/2021 USD 750,000 730,526 0.13AXA SA, Reg. S, FRN 5.25% 16/04/2040 EUR 700,000 895,350 0.16AXA SA, Reg. S, FRN 5.125%
04/07/2043 EUR 875,000 1,187,135 0.21AXA SA, Reg. S, FRN 3.941% Perpetual EUR 300,000 372,912 0.07BNP Paribas SA, Reg. S 2.375%
17/02/2025 EUR 225,000 266,773 0.05BPCE SA, 144A 5.15% 21/07/2024 USD 1,125,000 1,205,196 0.21Credit Agricole Assurances SA, Reg. S,
FRN 4.5% Perpetual EUR 700,000 865,148 0.15Credit Agricole SA, 144A 3.875%
15/04/2024 USD 950,000 1,002,492 0.18Credit Agricole SA, Reg. S 2.625%
17/03/2027 EUR 500,000 598,075 0.11Danone SA, 144A 1.691% 30/10/2019 USD 1,800,000 1,784,709 0.31Electricite de France SA, Reg. S, FRN 5%
Perpetual EUR 800,000 979,614 0.17NEW Areva Holding SA 3.5% 22/03/2021 EUR 800,000 960,416 0.17NEW Areva Holding SA 4.875%
23/09/2024 EUR 400,000 504,940 0.09SFR Group SA, 144A 7.375%
01/05/2026 USD 650,000 703,882 0.12Societe Generale SA, Reg. S 2.625%
27/02/2025 EUR 700,000 840,503 0.15TOTAL SA, Reg. S, FRN 2.25% Perpetual EUR 450,000 520,482 0.09
13,418,153 2.37
GermanyAllianz Finance II BV, FRN 5.75%
08/07/2041 EUR 1,200,000 1,617,107 0.29Daimler Finance North America LLC, 144A
1.5% 05/07/2019 USD 1,125,000 1,114,116 0.20Deutsche Telekom International Finance BV,
144A 3.6% 19/01/2027 USD 1,050,000 1,066,464 0.19Muenchener Rueckversicherungs-
Gesellschaft AG, Reg. S, FRN 6% 26/05/2041 EUR 1,200,000 1,635,322 0.29
RWE AG, Reg. S, FRN 7% Perpetual GBP 700,000 972,136 0.17Siemens Financieringsmaatschappij NV,
144A 1.3% 13/09/2019 USD 1,675,000 1,655,553 0.29Volkswagen International Finance NV,
Reg. S 1.875% 30/03/2027 EUR 400,000 456,799 0.08Volkswagen International Finance NV,
Reg. S, FRN 4.625% Perpetual EUR 350,000 428,931 0.07Vonovia Finance BV, Reg. S, FRN 4.625%
08/04/2074 EUR 600,000 726,059 0.13
9,672,487 1.71
Hong KongCK Hutchison International 16 Ltd., 144A
1.875% 03/10/2021 USD 545,000 529,876 0.09
529,876 0.09
IndiaBharat Petroleum Corp. Ltd., Reg. S
4.625% 25/10/2022 USD 530,000 566,369 0.10Bharti Airtel International Netherlands BV,
Reg. S 4% 10/12/2018 EUR 700,000 842,357 0.15
1,408,726 0.25
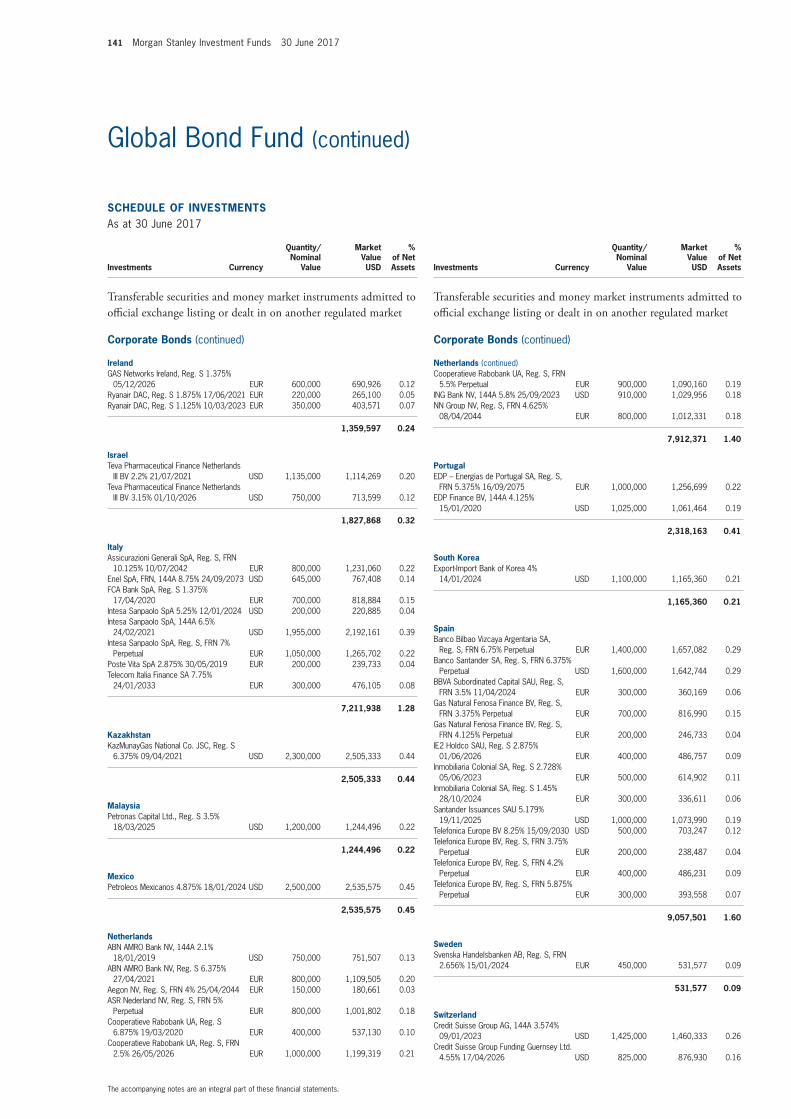
141 Morgan Stanley Investment Funds 30 June 2017
The accompanying notes are an integral part of these fi nancial statements.
Global Bond Fund (continued)
SCHEDULE OF INVESTMENTSAs at 30 June 2017
Investments Currency
Quantity/Nominal
Value
Market Value USD
% of Net Assets
Transferable securities and money market instruments admitted to offi cial exchange listing or dealt in on another regulated market
Corporate Bonds (continued)
IrelandGAS Networks Ireland, Reg. S 1.375%
05/12/2026 EUR 600,000 690,926 0.12Ryanair DAC, Reg. S 1.875% 17/06/2021 EUR 220,000 265,100 0.05Ryanair DAC, Reg. S 1.125% 10/03/2023 EUR 350,000 403,571 0.07
1,359,597 0.24
IsraelTeva Pharmaceutical Finance Netherlands
III BV 2.2% 21/07/2021 USD 1,135,000 1,114,269 0.20Teva Pharmaceutical Finance Netherlands
III BV 3.15% 01/10/2026 USD 750,000 713,599 0.12
1,827,868 0.32
ItalyAssicurazioni Generali SpA, Reg. S, FRN
10.125% 10/07/2042 EUR 800,000 1,231,060 0.22Enel SpA, FRN, 144A 8.75% 24/09/2073 USD 645,000 767,408 0.14FCA Bank SpA, Reg. S 1.375%
17/04/2020 EUR 700,000 818,884 0.15Intesa Sanpaolo SpA 5.25% 12/01/2024 USD 200,000 220,885 0.04Intesa Sanpaolo SpA, 144A 6.5%
24/02/2021 USD 1,955,000 2,192,161 0.39Intesa Sanpaolo SpA, Reg. S, FRN 7%
Perpetual EUR 1,050,000 1,265,702 0.22Poste Vita SpA 2.875% 30/05/2019 EUR 200,000 239,733 0.04Telecom Italia Finance SA 7.75%
24/01/2033 EUR 300,000 476,105 0.08
7,211,938 1.28
KazakhstanKazMunayGas National Co. JSC, Reg. S
6.375% 09/04/2021 USD 2,300,000 2,505,333 0.44
2,505,333 0.44
MalaysiaPetronas Capital Ltd., Reg. S 3.5%
18/03/2025 USD 1,200,000 1,244,496 0.22
1,244,496 0.22
MexicoPetroleos Mexicanos 4.875% 18/01/2024 USD 2,500,000 2,535,575 0.45
2,535,575 0.45
NetherlandsABN AMRO Bank NV, 144A 2.1%
18/01/2019 USD 750,000 751,507 0.13ABN AMRO Bank NV, Reg. S 6.375%
27/04/2021 EUR 800,000 1,109,505 0.20Aegon NV, Reg. S, FRN 4% 25/04/2044 EUR 150,000 180,661 0.03ASR Nederland NV, Reg. S, FRN 5%
Perpetual EUR 800,000 1,001,802 0.18Cooperatieve Rabobank UA, Reg. S
6.875% 19/03/2020 EUR 400,000 537,130 0.10Cooperatieve Rabobank UA, Reg. S, FRN
2.5% 26/05/2026 EUR 1,000,000 1,199,319 0.21
SCHEDULE OF INVESTMENTSAs at 30 June 2017
Investments Currency
Quantity/Nominal
Value
Market Value USD
% of Net Assets
Transferable securities and money market instruments admitted to offi cial exchange listing or dealt in on another regulated market
Corporate Bonds (continued)
Netherlands (continued)Cooperatieve Rabobank UA, Reg. S, FRN
5.5% Perpetual EUR 900,000 1,090,160 0.19ING Bank NV, 144A 5.8% 25/09/2023 USD 910,000 1,029,956 0.18NN Group NV, Reg. S, FRN 4.625%
08/04/2044 EUR 800,000 1,012,331 0.18
7,912,371 1.40
PortugalEDP – Energias de Portugal SA, Reg. S,
FRN 5.375% 16/09/2075 EUR 1,000,000 1,256,699 0.22EDP Finance BV, 144A 4.125%
15/01/2020 USD 1,025,000 1,061,464 0.19
2,318,163 0.41
South KoreaExport-Import Bank of Korea 4%
14/01/2024 USD 1,100,000 1,165,360 0.21
1,165,360 0.21
SpainBanco Bilbao Vizcaya Argentaria SA,
Reg. S, FRN 6.75% Perpetual EUR 1,400,000 1,657,082 0.29Banco Santander SA, Reg. S, FRN 6.375%
Perpetual USD 1,600,000 1,642,744 0.29BBVA Subordinated Capital SAU, Reg. S,
FRN 3.5% 11/04/2024 EUR 300,000 360,169 0.06Gas Natural Fenosa Finance BV, Reg. S,
FRN 3.375% Perpetual EUR 700,000 816,990 0.15Gas Natural Fenosa Finance BV, Reg. S,
FRN 4.125% Perpetual EUR 200,000 246,733 0.04IE2 Holdco SAU, Reg. S 2.875%
01/06/2026 EUR 400,000 486,757 0.09Inmobiliaria Colonial SA, Reg. S 2.728%
05/06/2023 EUR 500,000 614,902 0.11Inmobiliaria Colonial SA, Reg. S 1.45%
28/10/2024 EUR 300,000 336,611 0.06Santander Issuances SAU 5.179%
19/11/2025 USD 1,000,000 1,073,990 0.19Telefonica Europe BV 8.25% 15/09/2030 USD 500,000 703,247 0.12Telefonica Europe BV, Reg. S, FRN 3.75%
Perpetual EUR 200,000 238,487 0.04Telefonica Europe BV, Reg. S, FRN 4.2%
Perpetual EUR 400,000 486,231 0.09Telefonica Europe BV, Reg. S, FRN 5.875%
Perpetual EUR 300,000 393,558 0.07
9,057,501 1.60
SwedenSvenska Handelsbanken AB, Reg. S, FRN
2.656% 15/01/2024 EUR 450,000 531,577 0.09
531,577 0.09
SwitzerlandCredit Suisse Group AG, 144A 3.574%
09/01/2023 USD 1,425,000 1,460,333 0.26Credit Suisse Group Funding Guernsey Ltd.
4.55% 17/04/2026 USD 825,000 876,930 0.16
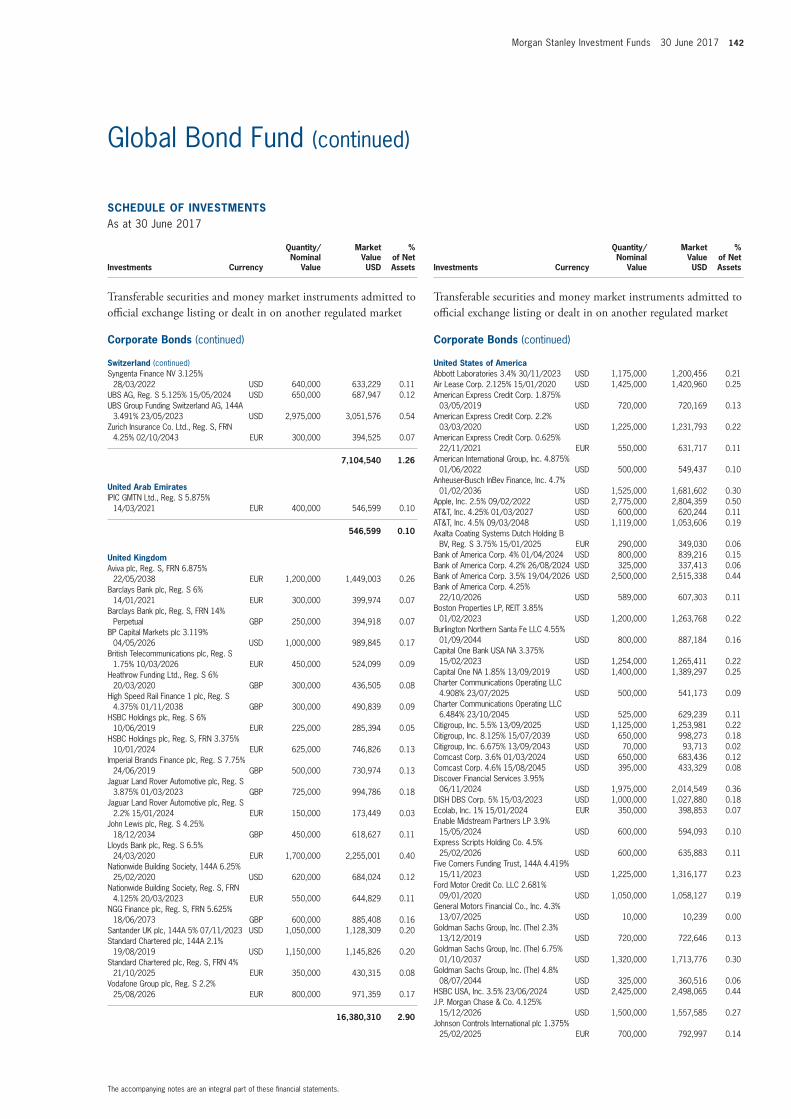
Morgan Stanley Investment Funds 30 June 2017 142
The accompanying notes are an integral part of these fi nancial statements.
Global Bond Fund (continued)
SCHEDULE OF INVESTMENTSAs at 30 June 2017
Investments Currency
Quantity/Nominal
Value
Market Value USD
% of Net Assets
Transferable securities and money market instruments admitted to offi cial exchange listing or dealt in on another regulated market
Corporate Bonds (continued)
Switzerland (continued)Syngenta Finance NV 3.125%
28/03/2022 USD 640,000 633,229 0.11UBS AG, Reg. S 5.125% 15/05/2024 USD 650,000 687,947 0.12UBS Group Funding Switzerland AG, 144A
3.491% 23/05/2023 USD 2,975,000 3,051,576 0.54Zurich Insurance Co. Ltd., Reg. S, FRN
4.25% 02/10/2043 EUR 300,000 394,525 0.07
7,104,540 1.26
United Arab EmiratesIPIC GMTN Ltd., Reg. S 5.875%
14/03/2021 EUR 400,000 546,599 0.10
546,599 0.10
United KingdomAviva plc, Reg. S, FRN 6.875%
22/05/2038 EUR 1,200,000 1,449,003 0.26Barclays Bank plc, Reg. S 6%
14/01/2021 EUR 300,000 399,974 0.07Barclays Bank plc, Reg. S, FRN 14%
Perpetual GBP 250,000 394,918 0.07BP Capital Markets plc 3.119%
04/05/2026 USD 1,000,000 989,845 0.17British Telecommunications plc, Reg. S
1.75% 10/03/2026 EUR 450,000 524,099 0.09Heathrow Funding Ltd., Reg. S 6%
20/03/2020 GBP 300,000 436,505 0.08High Speed Rail Finance 1 plc, Reg. S
4.375% 01/11/2038 GBP 300,000 490,839 0.09HSBC Holdings plc, Reg. S 6%
10/06/2019 EUR 225,000 285,394 0.05HSBC Holdings plc, Reg. S, FRN 3.375%
10/01/2024 EUR 625,000 746,826 0.13Imperial Brands Finance plc, Reg. S 7.75%
24/06/2019 GBP 500,000 730,974 0.13Jaguar Land Rover Automotive plc, Reg. S
3.875% 01/03/2023 GBP 725,000 994,786 0.18Jaguar Land Rover Automotive plc, Reg. S
2.2% 15/01/2024 EUR 150,000 173,449 0.03John Lewis plc, Reg. S 4.25%
18/12/2034 GBP 450,000 618,627 0.11Lloyds Bank plc, Reg. S 6.5%
24/03/2020 EUR 1,700,000 2,255,001 0.40Nationwide Building Society, 144A 6.25%
25/02/2020 USD 620,000 684,024 0.12Nationwide Building Society, Reg. S, FRN
4.125% 20/03/2023 EUR 550,000 644,829 0.11NGG Finance plc, Reg. S, FRN 5.625%
18/06/2073 GBP 600,000 885,408 0.16Santander UK plc, 144A 5% 07/11/2023 USD 1,050,000 1,128,309 0.20Standard Chartered plc, 144A 2.1%
19/08/2019 USD 1,150,000 1,145,826 0.20Standard Chartered plc, Reg. S, FRN 4%
21/10/2025 EUR 350,000 430,315 0.08Vodafone Group plc, Reg. S 2.2%
25/08/2026 EUR 800,000 971,359 0.17
16,380,310 2.90
SCHEDULE OF INVESTMENTSAs at 30 June 2017
Investments Currency
Quantity/Nominal
Value
Market Value USD
% of Net Assets
Transferable securities and money market instruments admitted to offi cial exchange listing or dealt in on another regulated market
Corporate Bonds (continued)
United States of AmericaAbbott Laboratories 3.4% 30/11/2023 USD 1,175,000 1,200,456 0.21Air Lease Corp. 2.125% 15/01/2020 USD 1,425,000 1,420,960 0.25American Express Credit Corp. 1.875%
03/05/2019 USD 720,000 720,169 0.13American Express Credit Corp. 2.2%
03/03/2020 USD 1,225,000 1,231,793 0.22American Express Credit Corp. 0.625%
22/11/2021 EUR 550,000 631,717 0.11American International Group, Inc. 4.875%
01/06/2022 USD 500,000 549,437 0.10Anheuser-Busch InBev Finance, Inc. 4.7%
01/02/2036 USD 1,525,000 1,681,602 0.30Apple, Inc. 2.5% 09/02/2022 USD 2,775,000 2,804,359 0.50AT&T, Inc. 4.25% 01/03/2027 USD 600,000 620,244 0.11AT&T, Inc. 4.5% 09/03/2048 USD 1,119,000 1,053,606 0.19Axalta Coating Systems Dutch Holding B
BV, Reg. S 3.75% 15/01/2025 EUR 290,000 349,030 0.06Bank of America Corp. 4% 01/04/2024 USD 800,000 839,216 0.15Bank of America Corp. 4.2% 26/08/2024 USD 325,000 337,413 0.06Bank of America Corp. 3.5% 19/04/2026 USD 2,500,000 2,515,338 0.44Bank of America Corp. 4.25%
22/10/2026 USD 589,000 607,303 0.11Boston Properties LP, REIT 3.85%
01/02/2023 USD 1,200,000 1,263,768 0.22Burlington Northern Santa Fe LLC 4.55%
01/09/2044 USD 800,000 887,184 0.16Capital One Bank USA NA 3.375%
15/02/2023 USD 1,254,000 1,265,411 0.22Capital One NA 1.85% 13/09/2019 USD 1,400,000 1,389,297 0.25Charter Communications Operating LLC
4.908% 23/07/2025 USD 500,000 541,173 0.09Charter Communications Operating LLC
6.484% 23/10/2045 USD 525,000 629,239 0.11Citigroup, Inc. 5.5% 13/09/2025 USD 1,125,000 1,253,981 0.22Citigroup, Inc. 8.125% 15/07/2039 USD 650,000 998,273 0.18Citigroup, Inc. 6.675% 13/09/2043 USD 70,000 93,713 0.02Comcast Corp. 3.6% 01/03/2024 USD 650,000 683,436 0.12Comcast Corp. 4.6% 15/08/2045 USD 395,000 433,329 0.08Discover Financial Services 3.95%
06/11/2024 USD 1,975,000 2,014,549 0.36DISH DBS Corp. 5% 15/03/2023 USD 1,000,000 1,027,880 0.18Ecolab, Inc. 1% 15/01/2024 EUR 350,000 398,853 0.07Enable Midstream Partners LP 3.9%
15/05/2024 USD 600,000 594,093 0.10Express Scripts Holding Co. 4.5%
25/02/2026 USD 600,000 635,883 0.11Five Corners Funding Trust, 144A 4.419%
15/11/2023 USD 1,225,000 1,316,177 0.23Ford Motor Credit Co. LLC 2.681%
09/01/2020 USD 1,050,000 1,058,127 0.19General Motors Financial Co., Inc. 4.3%
13/07/2025 USD 10,000 10,239 0.00Goldman Sachs Group, Inc. (The) 2.3%
13/12/2019 USD 720,000 722,646 0.13Goldman Sachs Group, Inc. (The) 6.75%
01/10/2037 USD 1,320,000 1,713,776 0.30Goldman Sachs Group, Inc. (The) 4.8%
08/07/2044 USD 325,000 360,516 0.06HSBC USA, Inc. 3.5% 23/06/2024 USD 2,425,000 2,498,065 0.44J.P. Morgan Chase & Co. 4.125%
15/12/2026 USD 1,500,000 1,557,585 0.27Johnson Controls International plc 1.375%
25/02/2025 EUR 700,000 792,997 0.14
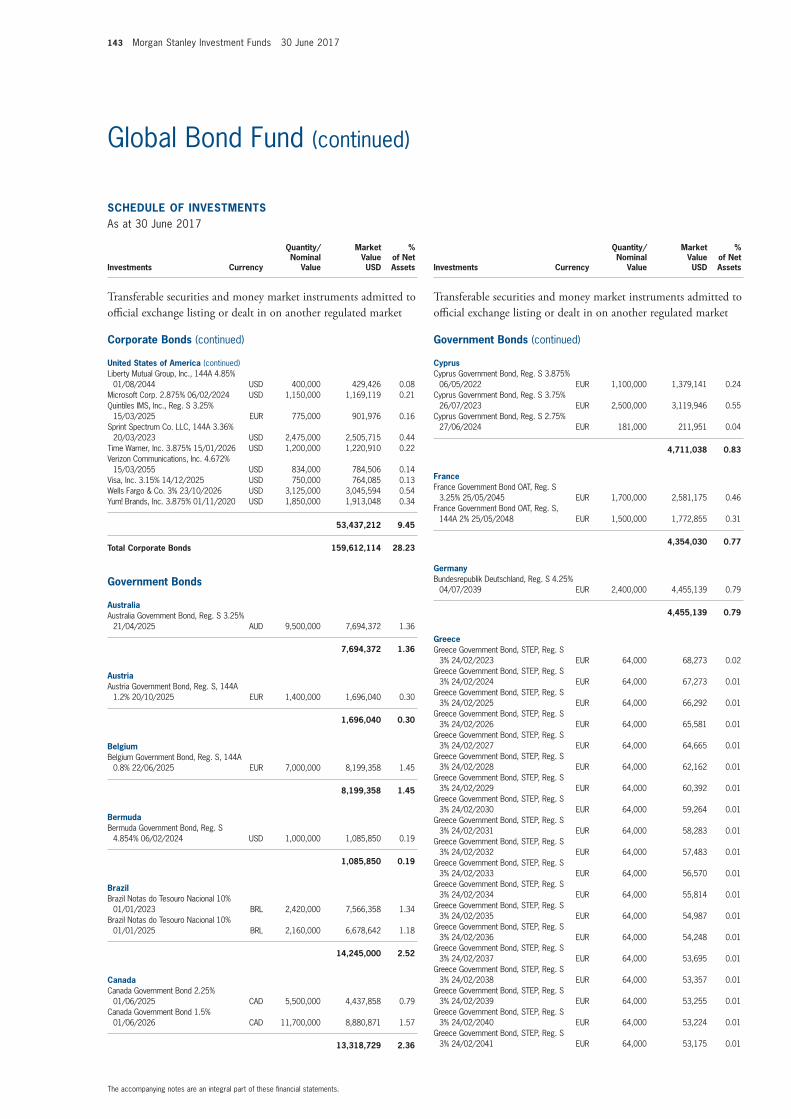
143 Morgan Stanley Investment Funds 30 June 2017
The accompanying notes are an integral part of these fi nancial statements.
Global Bond Fund (continued)
SCHEDULE OF INVESTMENTSAs at 30 June 2017
Investments Currency
Quantity/Nominal
Value
Market Value USD
% of Net Assets
Transferable securities and money market instruments admitted to offi cial exchange listing or dealt in on another regulated market
Corporate Bonds (continued)
United States of America (continued)Liberty Mutual Group, Inc., 144A 4.85%
01/08/2044 USD 400,000 429,426 0.08Microsoft Corp. 2.875% 06/02/2024 USD 1,150,000 1,169,119 0.21Quintiles IMS, Inc., Reg. S 3.25%
15/03/2025 EUR 775,000 901,976 0.16Sprint Spectrum Co. LLC, 144A 3.36%
20/03/2023 USD 2,475,000 2,505,715 0.44Time Warner, Inc. 3.875% 15/01/2026 USD 1,200,000 1,220,910 0.22Verizon Communications, Inc. 4.672%
15/03/2055 USD 834,000 784,506 0.14Visa, Inc. 3.15% 14/12/2025 USD 750,000 764,085 0.13Wells Fargo & Co. 3% 23/10/2026 USD 3,125,000 3,045,594 0.54Yum! Brands, Inc. 3.875% 01/11/2020 USD 1,850,000 1,913,048 0.34
53,437,212 9.45
Total Corporate Bonds 159,612,114 28.23
Government Bonds
AustraliaAustralia Government Bond, Reg. S 3.25%
21/04/2025 AUD 9,500,000 7,694,372 1.36
7,694,372 1.36
AustriaAustria Government Bond, Reg. S, 144A
1.2% 20/10/2025 EUR 1,400,000 1,696,040 0.30
1,696,040 0.30
BelgiumBelgium Government Bond, Reg. S, 144A
0.8% 22/06/2025 EUR 7,000,000 8,199,358 1.45
8,199,358 1.45
BermudaBermuda Government Bond, Reg. S
4.854% 06/02/2024 USD 1,000,000 1,085,850 0.19
1,085,850 0.19
BrazilBrazil Notas do Tesouro Nacional 10%
01/01/2023 BRL 2,420,000 7,566,358 1.34Brazil Notas do Tesouro Nacional 10%
01/01/2025 BRL 2,160,000 6,678,642 1.18
14,245,000 2.52
CanadaCanada Government Bond 2.25%
01/06/2025 CAD 5,500,000 4,437,858 0.79Canada Government Bond 1.5%
01/06/2026 CAD 11,700,000 8,880,871 1.57
13,318,729 2.36
SCHEDULE OF INVESTMENTSAs at 30 June 2017
Investments Currency
Quantity/Nominal
Value
Market Value USD
% of Net Assets
Transferable securities and money market instruments admitted to offi cial exchange listing or dealt in on another regulated market
Government Bonds (continued)
CyprusCyprus Government Bond, Reg. S 3.875%
06/05/2022 EUR 1,100,000 1,379,141 0.24Cyprus Government Bond, Reg. S 3.75%
26/07/2023 EUR 2,500,000 3,119,946 0.55Cyprus Government Bond, Reg. S 2.75%
27/06/2024 EUR 181,000 211,951 0.04
4,711,038 0.83
FranceFrance Government Bond OAT, Reg. S
3.25% 25/05/2045 EUR 1,700,000 2,581,175 0.46France Government Bond OAT, Reg. S,
144A 2% 25/05/2048 EUR 1,500,000 1,772,855 0.31
4,354,030 0.77
GermanyBundesrepublik Deutschland, Reg. S 4.25%
04/07/2039 EUR 2,400,000 4,455,139 0.79
4,455,139 0.79
GreeceGreece Government Bond, STEP, Reg. S
3% 24/02/2023 EUR 64,000 68,273 0.02Greece Government Bond, STEP, Reg. S
3% 24/02/2024 EUR 64,000 67,273 0.01Greece Government Bond, STEP, Reg. S
3% 24/02/2025 EUR 64,000 66,292 0.01Greece Government Bond, STEP, Reg. S
3% 24/02/2026 EUR 64,000 65,581 0.01Greece Government Bond, STEP, Reg. S
3% 24/02/2027 EUR 64,000 64,665 0.01Greece Government Bond, STEP, Reg. S
3% 24/02/2028 EUR 64,000 62,162 0.01Greece Government Bond, STEP, Reg. S
3% 24/02/2029 EUR 64,000 60,392 0.01Greece Government Bond, STEP, Reg. S
3% 24/02/2030 EUR 64,000 59,264 0.01Greece Government Bond, STEP, Reg. S
3% 24/02/2031 EUR 64,000 58,283 0.01Greece Government Bond, STEP, Reg. S
3% 24/02/2032 EUR 64,000 57,483 0.01Greece Government Bond, STEP, Reg. S
3% 24/02/2033 EUR 64,000 56,570 0.01Greece Government Bond, STEP, Reg. S
3% 24/02/2034 EUR 64,000 55,814 0.01Greece Government Bond, STEP, Reg. S
3% 24/02/2035 EUR 64,000 54,987 0.01Greece Government Bond, STEP, Reg. S
3% 24/02/2036 EUR 64,000 54,248 0.01Greece Government Bond, STEP, Reg. S
3% 24/02/2037 EUR 64,000 53,695 0.01Greece Government Bond, STEP, Reg. S
3% 24/02/2038 EUR 64,000 53,357 0.01Greece Government Bond, STEP, Reg. S
3% 24/02/2039 EUR 64,000 53,255 0.01Greece Government Bond, STEP, Reg. S
3% 24/02/2040 EUR 64,000 53,224 0.01Greece Government Bond, STEP, Reg. S
3% 24/02/2041 EUR 64,000 53,175 0.01
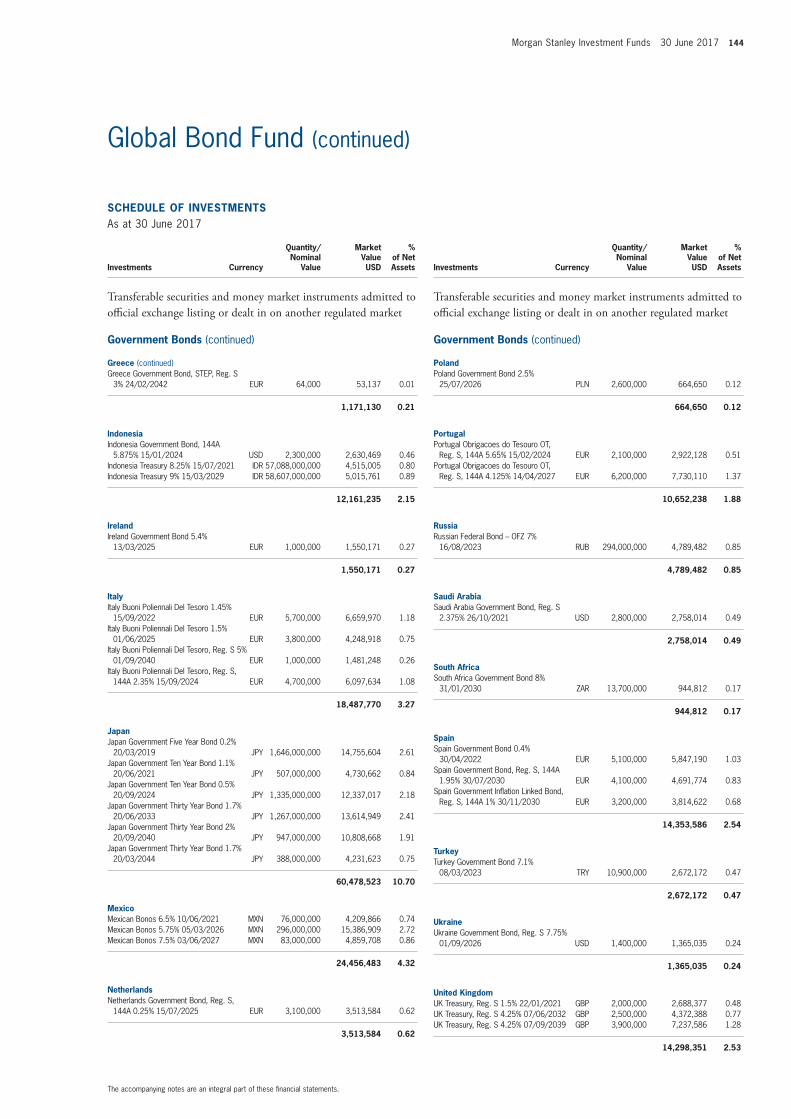
Morgan Stanley Investment Funds 30 June 2017 144
The accompanying notes are an integral part of these fi nancial statements.
Global Bond Fund (continued)
SCHEDULE OF INVESTMENTSAs at 30 June 2017
Investments Currency
Quantity/Nominal
Value
Market Value USD
% of Net Assets
Transferable securities and money market instruments admitted to offi cial exchange listing or dealt in on another regulated market
Government Bonds (continued)
Greece (continued)Greece Government Bond, STEP, Reg. S
3% 24/02/2042 EUR 64,000 53,137 0.01
1,171,130 0.21
IndonesiaIndonesia Government Bond, 144A
5.875% 15/01/2024 USD 2,300,000 2,630,469 0.46Indonesia Treasury 8.25% 15/07/2021 IDR 57,088,000,000 4,515,005 0.80Indonesia Treasury 9% 15/03/2029 IDR 58,607,000,000 5,015,761 0.89
12,161,235 2.15
IrelandIreland Government Bond 5.4%
13/03/2025 EUR 1,000,000 1,550,171 0.27
1,550,171 0.27
ItalyItaly Buoni Poliennali Del Tesoro 1.45%
15/09/2022 EUR 5,700,000 6,659,970 1.18Italy Buoni Poliennali Del Tesoro 1.5%
01/06/2025 EUR 3,800,000 4,248,918 0.75Italy Buoni Poliennali Del Tesoro, Reg. S 5%
01/09/2040 EUR 1,000,000 1,481,248 0.26Italy Buoni Poliennali Del Tesoro, Reg. S,
144A 2.35% 15/09/2024 EUR 4,700,000 6,097,634 1.08
18,487,770 3.27
JapanJapan Government Five Year Bond 0.2%
20/03/2019 JPY 1,646,000,000 14,755,604 2.61Japan Government Ten Year Bond 1.1%
20/06/2021 JPY 507,000,000 4,730,662 0.84Japan Government Ten Year Bond 0.5%
20/09/2024 JPY 1,335,000,000 12,337,017 2.18Japan Government Thirty Year Bond 1.7%
20/06/2033 JPY 1,267,000,000 13,614,949 2.41Japan Government Thirty Year Bond 2%
20/09/2040 JPY 947,000,000 10,808,668 1.91Japan Government Thirty Year Bond 1.7%
20/03/2044 JPY 388,000,000 4,231,623 0.75
60,478,523 10.70
MexicoMexican Bonos 6.5% 10/06/2021 MXN 76,000,000 4,209,866 0.74Mexican Bonos 5.75% 05/03/2026 MXN 296,000,000 15,386,909 2.72Mexican Bonos 7.5% 03/06/2027 MXN 83,000,000 4,859,708 0.86
24,456,483 4.32
NetherlandsNetherlands Government Bond, Reg. S,
144A 0.25% 15/07/2025 EUR 3,100,000 3,513,584 0.62
3,513,584 0.62
SCHEDULE OF INVESTMENTSAs at 30 June 2017
Investments Currency
Quantity/Nominal
Value
Market Value USD
% of Net Assets
Transferable securities and money market instruments admitted to offi cial exchange listing or dealt in on another regulated market
Government Bonds (continued)
PolandPoland Government Bond 2.5%
25/07/2026 PLN 2,600,000 664,650 0.12
664,650 0.12
PortugalPortugal Obrigacoes do Tesouro OT,
Reg. S, 144A 5.65% 15/02/2024 EUR 2,100,000 2,922,128 0.51Portugal Obrigacoes do Tesouro OT,
Reg. S, 144A 4.125% 14/04/2027 EUR 6,200,000 7,730,110 1.37
10,652,238 1.88
RussiaRussian Federal Bond – OFZ 7%
16/08/2023 RUB 294,000,000 4,789,482 0.85
4,789,482 0.85
Saudi ArabiaSaudi Arabia Government Bond, Reg. S
2.375% 26/10/2021 USD 2,800,000 2,758,014 0.49
2,758,014 0.49
South AfricaSouth Africa Government Bond 8%
31/01/2030 ZAR 13,700,000 944,812 0.17
944,812 0.17
SpainSpain Government Bond 0.4%
30/04/2022 EUR 5,100,000 5,847,190 1.03Spain Government Bond, Reg. S, 144A
1.95% 30/07/2030 EUR 4,100,000 4,691,774 0.83Spain Government Infl ation Linked Bond,
Reg. S, 144A 1% 30/11/2030 EUR 3,200,000 3,814,622 0.68
14,353,586 2.54
TurkeyTurkey Government Bond 7.1%
08/03/2023 TRY 10,900,000 2,672,172 0.47
2,672,172 0.47
UkraineUkraine Government Bond, Reg. S 7.75%
01/09/2026 USD 1,400,000 1,365,035 0.24
1,365,035 0.24
United KingdomUK Treasury, Reg. S 1.5% 22/01/2021 GBP 2,000,000 2,688,377 0.48UK Treasury, Reg. S 4.25% 07/06/2032 GBP 2,500,000 4,372,388 0.77UK Treasury, Reg. S 4.25% 07/09/2039 GBP 3,900,000 7,237,586 1.28
14,298,351 2.53
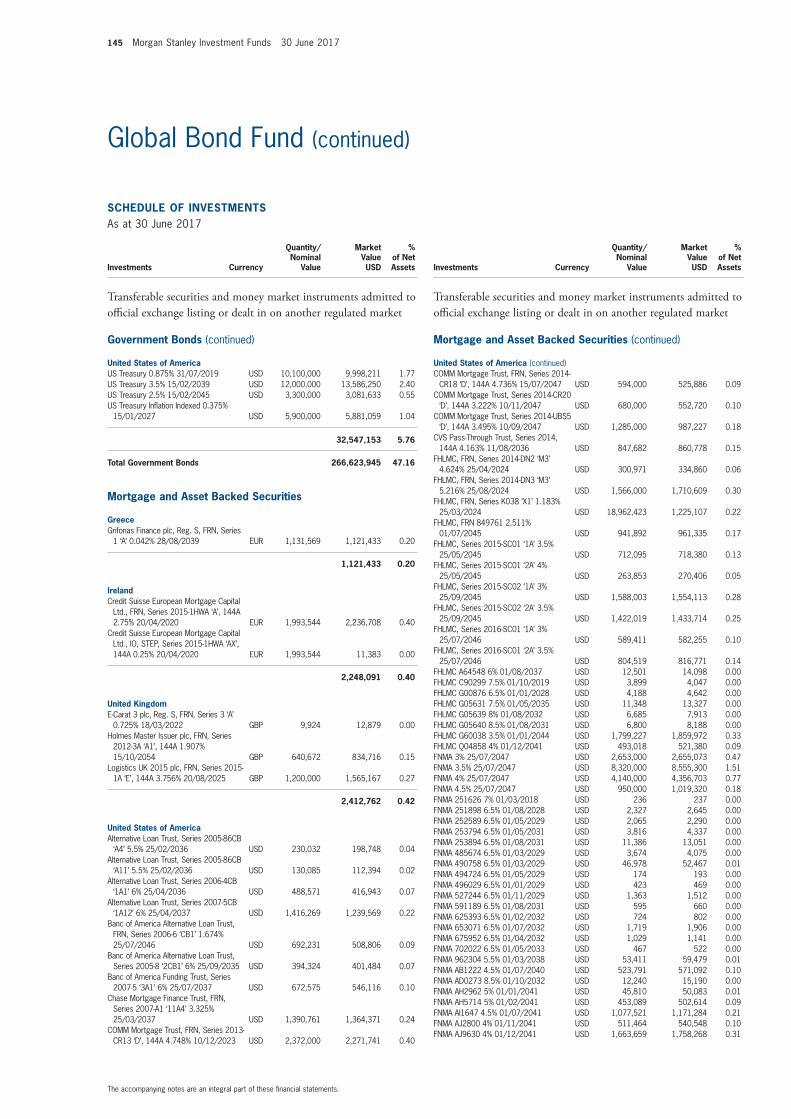
145 Morgan Stanley Investment Funds 30 June 2017
The accompanying notes are an integral part of these fi nancial statements.
Global Bond Fund (continued)
SCHEDULE OF INVESTMENTSAs at 30 June 2017
Investments Currency
Quantity/Nominal
Value
Market Value USD
% of Net Assets
Transferable securities and money market instruments admitted to offi cial exchange listing or dealt in on another regulated market
Government Bonds (continued)
United States of AmericaUS Treasury 0.875% 31/07/2019 USD 10,100,000 9,998,211 1.77US Treasury 3.5% 15/02/2039 USD 12,000,000 13,586,250 2.40US Treasury 2.5% 15/02/2045 USD 3,300,000 3,081,633 0.55US Treasury Infl ation Indexed 0.375%
15/01/2027 USD 5,900,000 5,881,059 1.04
32,547,153 5.76
Total Government Bonds 266,623,945 47.16
Mortgage and Asset Backed Securities
GreeceGrifonas Finance plc, Reg. S, FRN, Series
1 ‘A’ 0.042% 28/08/2039 EUR 1,131,569 1,121,433 0.20
1,121,433 0.20
IrelandCredit Suisse European Mortgage Capital
Ltd., FRN, Series 2015-1HWA ‘A’, 144A 2.75% 20/04/2020 EUR 1,993,544 2,236,708 0.40
Credit Suisse European Mortgage Capital Ltd., IO, STEP, Series 2015-1HWA ‘AX’, 144A 0.25% 20/04/2020 EUR 1,993,544 11,383 0.00
2,248,091 0.40
United KingdomE-Carat 3 plc, Reg. S, FRN, Series 3 ‘A’
0.725% 18/03/2022 GBP 9,924 12,879 0.00Holmes Master Issuer plc, FRN, Series
2012-3A ‘A1’, 144A 1.907% 15/10/2054 GBP 640,672 834,716 0.15
Logistics UK 2015 plc, FRN, Series 2015-1A ‘E’, 144A 3.756% 20/08/2025 GBP 1,200,000 1,565,167 0.27
2,412,762 0.42
United States of AmericaAlternative Loan Trust, Series 2005-86CB
‘A4’ 5.5% 25/02/2036 USD 230,032 198,748 0.04Alternative Loan Trust, Series 2005-86CB
‘A11’ 5.5% 25/02/2036 USD 130,085 112,394 0.02Alternative Loan Trust, Series 2006-4CB
‘1A1’ 6% 25/04/2036 USD 488,571 416,943 0.07Alternative Loan Trust, Series 2007-5CB
‘1A12’ 6% 25/04/2037 USD 1,416,269 1,239,569 0.22Banc of America Alternative Loan Trust,
FRN, Series 2006-6 ‘CB1’ 1.674% 25/07/2046 USD 692,231 508,806 0.09
Banc of America Alternative Loan Trust, Series 2005-8 ‘2CB1’ 6% 25/09/2035 USD 394,324 401,484 0.07
Banc of America Funding Trust, Series 2007-5 ‘3A1’ 6% 25/07/2037 USD 672,575 546,116 0.10
Chase Mortgage Finance Trust, FRN, Series 2007-A1 ‘11A4’ 3.325% 25/03/2037 USD 1,390,761 1,364,371 0.24
COMM Mortgage Trust, FRN, Series 2013-CR13 ‘D’, 144A 4.748% 10/12/2023 USD 2,372,000 2,271,741 0.40
SCHEDULE OF INVESTMENTSAs at 30 June 2017
Investments Currency
Quantity/Nominal
Value
Market Value USD
% of Net Assets
Transferable securities and money market instruments admitted to offi cial exchange listing or dealt in on another regulated market
Mortgage and Asset Backed Securities (continued)
United States of America (continued)COMM Mortgage Trust, FRN, Series 2014-
CR18 ‘D’, 144A 4.736% 15/07/2047 USD 594,000 525,886 0.09COMM Mortgage Trust, Series 2014-CR20
‘D’, 144A 3.222% 10/11/2047 USD 680,000 552,720 0.10COMM Mortgage Trust, Series 2014-UBS5
‘D’, 144A 3.495% 10/09/2047 USD 1,285,000 987,227 0.18CVS Pass-Through Trust, Series 2014,
144A 4.163% 11/08/2036 USD 847,682 860,778 0.15FHLMC, FRN, Series 2014-DN2 ‘M3’
4.624% 25/04/2024 USD 300,971 334,860 0.06FHLMC, FRN, Series 2014-DN3 ‘M3’
5.216% 25/08/2024 USD 1,566,000 1,710,609 0.30FHLMC, FRN, Series K038 ‘X1’ 1.183%
25/03/2024 USD 18,962,423 1,225,107 0.22FHLMC, FRN 849761 2.511%
01/07/2045 USD 941,892 961,335 0.17FHLMC, Series 2015-SC01 ‘1A’ 3.5%
25/05/2045 USD 712,095 718,380 0.13FHLMC, Series 2015-SC01 ‘2A’ 4%
25/05/2045 USD 263,853 270,406 0.05FHLMC, Series 2015-SC02 ‘1A’ 3%
25/09/2045 USD 1,588,003 1,554,113 0.28FHLMC, Series 2015-SC02 ‘2A’ 3.5%
25/09/2045 USD 1,422,019 1,433,714 0.25FHLMC, Series 2016-SC01 ‘1A’ 3%
25/07/2046 USD 589,411 582,255 0.10FHLMC, Series 2016-SC01 ‘2A’ 3.5%
25/07/2046 USD 804,519 816,771 0.14FHLMC A64548 6% 01/08/2037 USD 12,501 14,098 0.00FHLMC C90299 7.5% 01/10/2019 USD 3,899 4,047 0.00FHLMC G00876 6.5% 01/01/2028 USD 4,188 4,642 0.00FHLMC G05631 7.5% 01/05/2035 USD 11,348 13,327 0.00FHLMC G05639 8% 01/08/2032 USD 6,685 7,913 0.00FHLMC G05640 8.5% 01/08/2031 USD 6,800 8,188 0.00FHLMC G60038 3.5% 01/01/2044 USD 1,799,227 1,859,972 0.33FHLMC Q04858 4% 01/12/2041 USD 493,018 521,380 0.09FNMA 3% 25/07/2047 USD 2,653,000 2,655,073 0.47FNMA 3.5% 25/07/2047 USD 8,320,000 8,555,300 1.51FNMA 4% 25/07/2047 USD 4,140,000 4,356,703 0.77FNMA 4.5% 25/07/2047 USD 950,000 1,019,320 0.18FNMA 251626 7% 01/03/2018 USD 236 237 0.00FNMA 251898 6.5% 01/08/2028 USD 2,327 2,645 0.00FNMA 252589 6.5% 01/05/2029 USD 2,065 2,290 0.00FNMA 253794 6.5% 01/05/2031 USD 3,816 4,337 0.00FNMA 253894 6.5% 01/08/2031 USD 11,386 13,051 0.00FNMA 485674 6.5% 01/03/2029 USD 3,674 4,075 0.00FNMA 490758 6.5% 01/03/2029 USD 46,978 52,467 0.01FNMA 494724 6.5% 01/05/2029 USD 174 193 0.00FNMA 496029 6.5% 01/01/2029 USD 423 469 0.00FNMA 527244 6.5% 01/11/2029 USD 1,363 1,512 0.00FNMA 591189 6.5% 01/08/2031 USD 595 660 0.00FNMA 625393 6.5% 01/02/2032 USD 724 802 0.00FNMA 653071 6.5% 01/07/2032 USD 1,719 1,906 0.00FNMA 675952 6.5% 01/04/2032 USD 1,029 1,141 0.00FNMA 702022 6.5% 01/05/2033 USD 467 522 0.00FNMA 962304 5.5% 01/03/2038 USD 53,411 59,479 0.01FNMA AB1222 4.5% 01/07/2040 USD 523,791 571,092 0.10FNMA AD0273 8.5% 01/10/2032 USD 12,240 15,190 0.00FNMA AH2962 5% 01/01/2041 USD 45,810 50,083 0.01FNMA AH5714 5% 01/02/2041 USD 453,089 502,614 0.09FNMA AI1647 4.5% 01/07/2041 USD 1,077,521 1,171,284 0.21FNMA AJ2800 4% 01/11/2041 USD 511,464 540,548 0.10FNMA AJ9630 4% 01/12/2041 USD 1,663,659 1,758,268 0.31
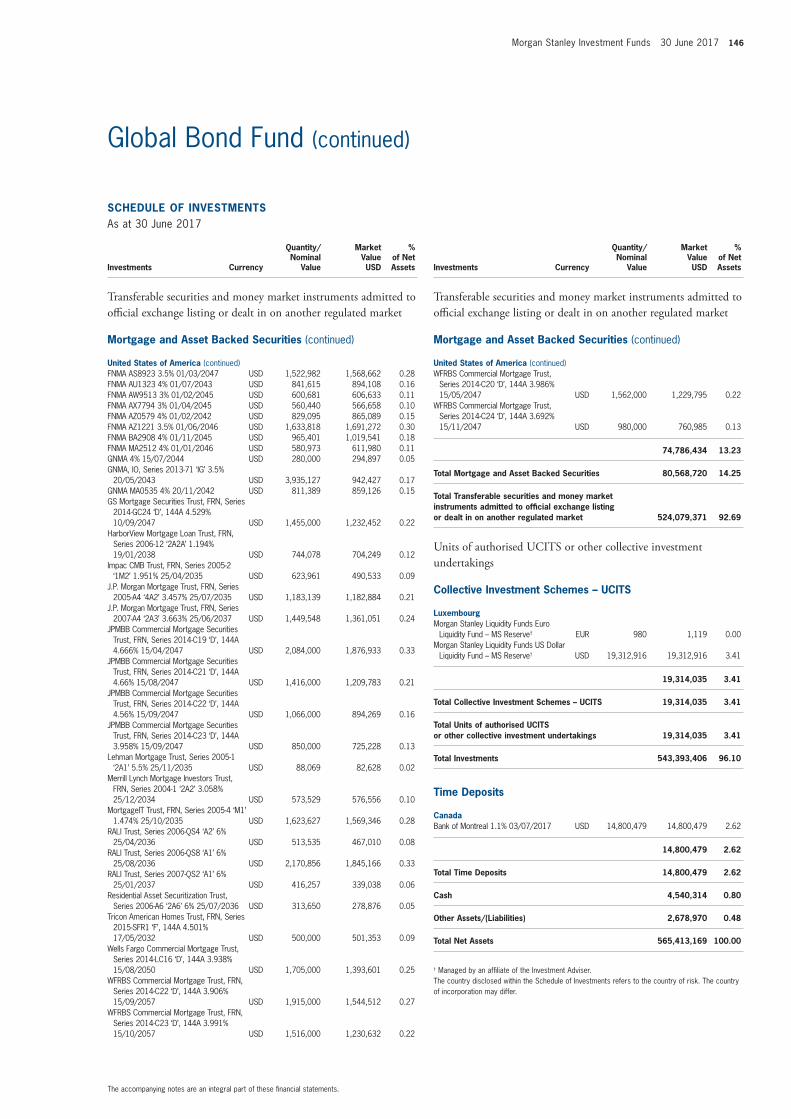
Morgan Stanley Investment Funds 30 June 2017 146
The accompanying notes are an integral part of these fi nancial statements.
Global Bond Fund (continued)
SCHEDULE OF INVESTMENTSAs at 30 June 2017
Investments Currency
Quantity/Nominal
Value
Market Value USD
% of Net Assets
Transferable securities and money market instruments admitted to offi cial exchange listing or dealt in on another regulated market
Mortgage and Asset Backed Securities (continued)
United States of America (continued)FNMA AS8923 3.5% 01/03/2047 USD 1,522,982 1,568,662 0.28FNMA AU1323 4% 01/07/2043 USD 841,615 894,108 0.16FNMA AW9513 3% 01/02/2045 USD 600,681 606,633 0.11FNMA AX7794 3% 01/04/2045 USD 560,440 566,658 0.10FNMA AZ0579 4% 01/02/2042 USD 829,095 865,089 0.15FNMA AZ1221 3.5% 01/06/2046 USD 1,633,818 1,691,272 0.30FNMA BA2908 4% 01/11/2045 USD 965,401 1,019,541 0.18FNMA MA2512 4% 01/01/2046 USD 580,973 611,980 0.11GNMA 4% 15/07/2044 USD 280,000 294,897 0.05GNMA, IO, Series 2013-71 ‘IG’ 3.5%
20/05/2043 USD 3,935,127 942,427 0.17GNMA MA0535 4% 20/11/2042 USD 811,389 859,126 0.15GS Mortgage Securities Trust, FRN, Series
2014-GC24 ‘D’, 144A 4.529% 10/09/2047 USD 1,455,000 1,232,452 0.22
HarborView Mortgage Loan Trust, FRN, Series 2006-12 ‘2A2A’ 1.194% 19/01/2038 USD 744,078 704,249 0.12
Impac CMB Trust, FRN, Series 2005-2 ‘1M2’ 1.951% 25/04/2035 USD 623,961 490,533 0.09
J.P. Morgan Mortgage Trust, FRN, Series 2005-A4 ‘4A2’ 3.457% 25/07/2035 USD 1,183,139 1,182,884 0.21
J.P. Morgan Mortgage Trust, FRN, Series 2007-A4 ‘2A3’ 3.663% 25/06/2037 USD 1,449,548 1,361,051 0.24
JPMBB Commercial Mortgage Securities Trust, FRN, Series 2014-C19 ‘D’, 144A 4.666% 15/04/2047 USD 2,084,000 1,876,933 0.33
JPMBB Commercial Mortgage Securities Trust, FRN, Series 2014-C21 ‘D’, 144A 4.66% 15/08/2047 USD 1,416,000 1,209,783 0.21
JPMBB Commercial Mortgage Securities Trust, FRN, Series 2014-C22 ‘D’, 144A 4.56% 15/09/2047 USD 1,066,000 894,269 0.16
JPMBB Commercial Mortgage Securities Trust, FRN, Series 2014-C23 ‘D’, 144A 3.958% 15/09/2047 USD 850,000 725,228 0.13
Lehman Mortgage Trust, Series 2005-1 ‘2A1’ 5.5% 25/11/2035 USD 88,069 82,628 0.02
Merrill Lynch Mortgage Investors Trust, FRN, Series 2004-1 ‘2A2’ 3.058% 25/12/2034 USD 573,529 576,556 0.10
MortgageIT Trust, FRN, Series 2005-4 ‘M1’ 1.474% 25/10/2035 USD 1,623,627 1,569,346 0.28
RALI Trust, Series 2006-QS4 ‘A2’ 6% 25/04/2036 USD 513,535 467,010 0.08
RALI Trust, Series 2006-QS8 ‘A1’ 6% 25/08/2036 USD 2,170,856 1,845,166 0.33
RALI Trust, Series 2007-QS2 ‘A1’ 6% 25/01/2037 USD 416,257 339,038 0.06
Residential Asset Securitization Trust, Series 2006-A6 ‘2A6’ 6% 25/07/2036 USD 313,650 278,876 0.05
Tricon American Homes Trust, FRN, Series 2015-SFR1 ‘F’, 144A 4.501% 17/05/2032 USD 500,000 501,353 0.09
Wells Fargo Commercial Mortgage Trust, Series 2014-LC16 ‘D’, 144A 3.938% 15/08/2050 USD 1,705,000 1,393,601 0.25
WFRBS Commercial Mortgage Trust, FRN, Series 2014-C22 ‘D’, 144A 3.906% 15/09/2057 USD 1,915,000 1,544,512 0.27
WFRBS Commercial Mortgage Trust, FRN, Series 2014-C23 ‘D’, 144A 3.991% 15/10/2057 USD 1,516,000 1,230,632 0.22
SCHEDULE OF INVESTMENTSAs at 30 June 2017
Investments Currency
Quantity/Nominal
Value
Market Value USD
% of Net Assets
Transferable securities and money market instruments admitted to offi cial exchange listing or dealt in on another regulated market
Mortgage and Asset Backed Securities (continued)
United States of America (continued)WFRBS Commercial Mortgage Trust,
Series 2014-C20 ‘D’, 144A 3.986% 15/05/2047 USD 1,562,000 1,229,795 0.22
WFRBS Commercial Mortgage Trust, Series 2014-C24 ‘D’, 144A 3.692% 15/11/2047 USD 980,000 760,985 0.13
74,786,434 13.23
Total Mortgage and Asset Backed Securities 80,568,720 14.25
Total Transferable securities and money market instruments admitted to offi cial exchange listing or dealt in on another regulated market 524,079,371 92.69
Units of authorised UCITS or other collective investment undertakings
Collective Investment Schemes – UCITS
LuxembourgMorgan Stanley Liquidity Funds Euro
Liquidity Fund – MS Reserve† EUR 980 1,119 0.00Morgan Stanley Liquidity Funds US Dollar
Liquidity Fund – MS Reserve† USD 19,312,916 19,312,916 3.41
19,314,035 3.41
Total Collective Investment Schemes – UCITS 19,314,035 3.41
Total Units of authorised UCITS or other collective investment undertakings 19,314,035 3.41
Total Investments 543,393,406 96.10
Time Deposits
CanadaBank of Montreal 1.1% 03/07/2017 USD 14,800,479 14,800,479 2.62
14,800,479 2.62
Total Time Deposits 14,800,479 2.62
Cash 4,540,314 0.80
Other Assets/(Liabilities) 2,678,970 0.48
Total Net Assets 565,413,169 100.00
† Managed by an affi liate of the Investment Adviser.The country disclosed within the Schedule of Investments refers to the country of risk. The country of incorporation may differ.
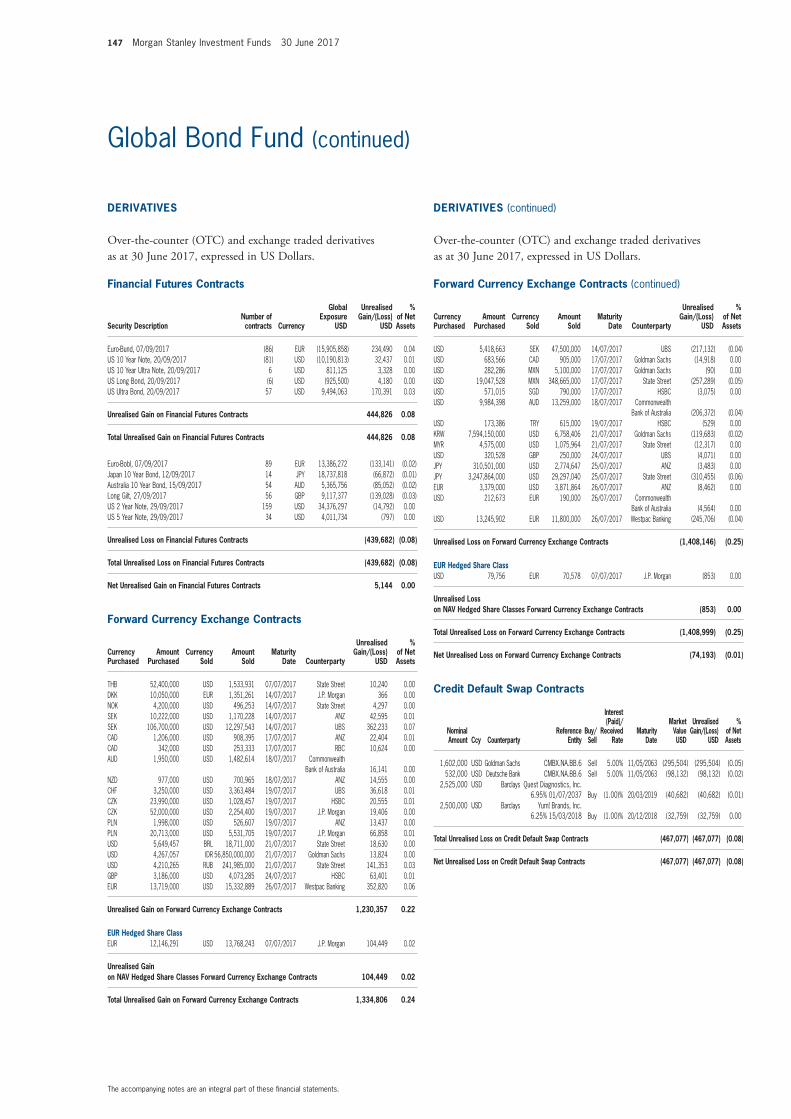
147 Morgan Stanley Investment Funds 30 June 2017
The accompanying notes are an integral part of these fi nancial statements.
Global Bond Fund (continued)
Financial Futures Contracts
Security DescriptionNumber of contracts Currency
Global Exposure
USD
Unrealised Gain/(Loss)
USD
% of Net Assets
Euro-Bund, 07/09/2017 (86) EUR (15,905,858) 234,490 0.04 US 10 Year Note, 20/09/2017 (81) USD (10,190,813) 32,437 0.01 US 10 Year Ultra Note, 20/09/2017 6 USD 811,125 3,328 0.00 US Long Bond, 20/09/2017 (6) USD (925,500) 4,180 0.00 US Ultra Bond, 20/09/2017 57 USD 9,494,063 170,391 0.03
Unrealised Gain on Financial Futures Contracts 444,826 0.08
Total Unrealised Gain on Financial Futures Contracts 444,826 0.08
Euro-Bobl, 07/09/2017 89 EUR 13,386,272 (133,141) (0.02) Japan 10 Year Bond, 12/09/2017 14 JPY 18,737,818 (66,872) (0.01) Australia 10 Year Bond, 15/09/2017 54 AUD 5,365,756 (85,052) (0.02) Long Gilt, 27/09/2017 56 GBP 9,117,377 (139,028) (0.03) US 2 Year Note, 29/09/2017 159 USD 34,376,297 (14,792) 0.00 US 5 Year Note, 29/09/2017 34 USD 4,011,734 (797) 0.00
Unrealised Loss on Financial Futures Contracts (439,682) (0.08)
Total Unrealised Loss on Financial Futures Contracts (439,682) (0.08)
Net Unrealised Gain on Financial Futures Contracts 5,144 0.00
Forward Currency Exchange Contracts (continued)
Currency Purchased
Amount Purchased
Currency Sold
Amount Sold
Maturity Date Counterparty
Unrealised Gain/(Loss)
USD
% of Net Assets
THB 52,400,000 USD 1,533,931 07/07/2017 State Street 10,240 0.00 DKK 10,050,000 EUR 1,351,261 14/07/2017 J.P. Morgan 366 0.00 NOK 4,200,000 USD 496,253 14/07/2017 State Street 4,297 0.00 SEK 10,222,000 USD 1,170,228 14/07/2017 ANZ 42,595 0.01 SEK 106,700,000 USD 12,297,543 14/07/2017 UBS 362,233 0.07 CAD 1,206,000 USD 908,395 17/07/2017 ANZ 22,404 0.01 CAD 342,000 USD 253,333 17/07/2017 RBC 10,624 0.00 AUD 1,950,000 USD 1,482,614 18/07/2017 Commonwealth
Bank of Australia 16,141 0.00 NZD 977,000 USD 700,965 18/07/2017 ANZ 14,555 0.00 CHF 3,250,000 USD 3,363,484 19/07/2017 UBS 36,618 0.01 CZK 23,990,000 USD 1,028,457 19/07/2017 HSBC 20,555 0.01 CZK 52,000,000 USD 2,254,400 19/07/2017 J.P. Morgan 19,406 0.00 PLN 1,998,000 USD 526,607 19/07/2017 ANZ 13,437 0.00 PLN 20,713,000 USD 5,531,705 19/07/2017 J.P. Morgan 66,858 0.01 USD 5,649,457 BRL 18,711,000 21/07/2017 State Street 18,630 0.00 USD 4,267,057 IDR 56,850,000,000 21/07/2017 Goldman Sachs 13,824 0.00 USD 4,210,265 RUB 241,985,000 21/07/2017 State Street 141,353 0.03 GBP 3,186,000 USD 4,073,285 24/07/2017 HSBC 63,401 0.01 EUR 13,719,000 USD 15,332,889 26/07/2017 Westpac Banking 352,820 0.06
Unrealised Gain on Forward Currency Exchange Contracts 1,230,357 0.22
EUR Hedged Share ClassEUR 12,146,291 USD 13,768,243 07/07/2017 J.P. Morgan 104,449 0.02
Unrealised Gain on NAV Hedged Share Classes Forward Currency Exchange Contracts 104,449 0.02
Total Unrealised Gain on Forward Currency Exchange Contracts 1,334,806 0.24
Forward Currency Exchange Contracts (continued)
Currency Purchased
Amount Purchased
Currency Sold
Amount Sold
Maturity Date Counterparty
Unrealised Gain/(Loss)
USD
% of Net Assets
USD 5,418,663 SEK 47,500,000 14/07/2017 UBS (217,132) (0.04) USD 683,566 CAD 905,000 17/07/2017 Goldman Sachs (14,918) 0.00 USD 282,286 MXN 5,100,000 17/07/2017 Goldman Sachs (90) 0.00 USD 19,047,528 MXN 348,665,000 17/07/2017 State Street (257,289) (0.05) USD 571,015 SGD 790,000 17/07/2017 HSBC (3,075) 0.00 USD 9,984,398 AUD 13,259,000 18/07/2017 Commonwealth
Bank of Australia (206,372) (0.04) USD 173,386 TRY 615,000 19/07/2017 HSBC (529) 0.00 KRW 7,594,150,000 USD 6,758,406 21/07/2017 Goldman Sachs (119,683) (0.02) MYR 4,575,000 USD 1,075,964 21/07/2017 State Street (12,317) 0.00 USD 320,528 GBP 250,000 24/07/2017 UBS (4,071) 0.00 JPY 310,501,000 USD 2,774,647 25/07/2017 ANZ (3,483) 0.00 JPY 3,247,864,000 USD 29,297,040 25/07/2017 State Street (310,455) (0.06) EUR 3,379,000 USD 3,871,864 26/07/2017 ANZ (8,462) 0.00 USD 212,673 EUR 190,000 26/07/2017 Commonwealth
Bank of Australia (4,564) 0.00 USD 13,245,902 EUR 11,800,000 26/07/2017 Westpac Banking (245,706) (0.04)
Unrealised Loss on Forward Currency Exchange Contracts (1,408,146) (0.25)
EUR Hedged Share ClassUSD 79,756 EUR 70,578 07/07/2017 J.P. Morgan (853) 0.00
Unrealised Loss on NAV Hedged Share Classes Forward Currency Exchange Contracts (853) 0.00
Total Unrealised Loss on Forward Currency Exchange Contracts (1,408,999) (0.25)
Net Unrealised Loss on Forward Currency Exchange Contracts (74,193) (0.01)
Credit Default Swap Contracts
Nominal Amount Ccy Counterparty
Reference Entity
Buy/Sell
Interest (Paid)/
Received Rate
Maturity Date
Market Value USD
Unrealised Gain/(Loss)
USD
% of Net Assets
1,602,000 USD Goldman Sachs CMBX.NA.BB.6 Sell 5.00% 11/05/2063 (295,504) (295,504) (0.05) 532,000 USD Deutsche Bank CMBX.NA.BB.6 Sell 5.00% 11/05/2063 (98,132) (98,132) (0.02)
2,525,000 USD Barclays Quest Diagnostics, Inc. 6.95% 01/07/2037 Buy (1.00)% 20/03/2019 (40,682) (40,682) (0.01)
2,500,000 USD Barclays Yum! Brands, Inc. 6.25% 15/03/2018 Buy (1.00)% 20/12/2018 (32,759) (32,759) 0.00
Total Unrealised Loss on Credit Default Swap Contracts (467,077) (467,077) (0.08)
Net Unrealised Loss on Credit Default Swap Contracts (467,077) (467,077) (0.08)
DERIVATIVES
Over-the-counter (OTC) and exchange traded derivatives as at 30 June 2017, expressed in US Dollars.
DERIVATIVES (continued)
Over-the-counter (OTC) and exchange traded derivatives as at 30 June 2017, expressed in US Dollars.
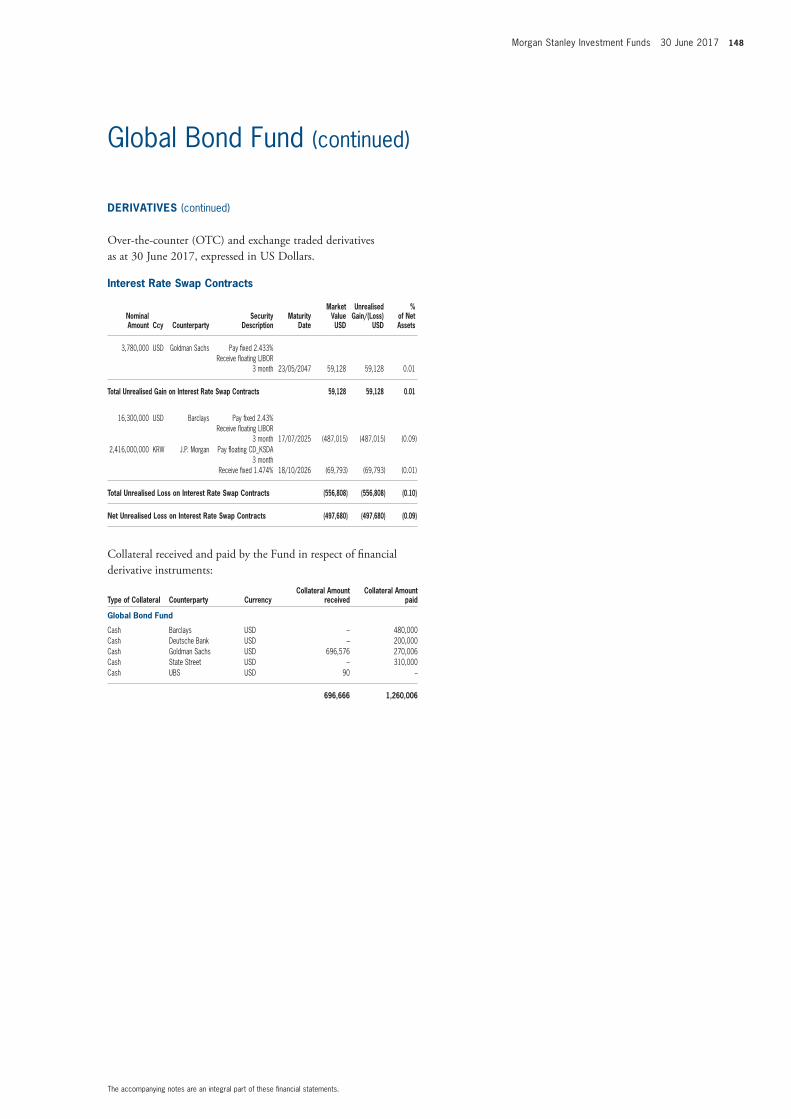
Morgan Stanley Investment Funds 30 June 2017 148
The accompanying notes are an integral part of these fi nancial statements.
Global Bond Fund (continued)
Interest Rate Swap Contracts
Nominal Amount Ccy Counterparty
Security Description
Maturity Date
Market Value USD
Unrealised Gain/(Loss)
USD
% of Net Assets
3,780,000 USD Goldman Sachs Pay fi xed 2.433% Receive fl oating LIBOR
3 month 23/05/2047 59,128 59,128 0.01
Total Unrealised Gain on Interest Rate Swap Contracts 59,128 59,128 0.01
16,300,000 USD Barclays Pay fi xed 2.43% Receive fl oating LIBOR
3 month 17/07/2025 (487,015) (487,015) (0.09) 2,416,000,000 KRW J.P. Morgan Pay fl oating CD_KSDA
3 month Receive fi xed 1.474% 18/10/2026 (69,793) (69,793) (0.01)
Total Unrealised Loss on Interest Rate Swap Contracts (556,808) (556,808) (0.10)
Net Unrealised Loss on Interest Rate Swap Contracts (497,680) (497,680) (0.09)
Collateral received and paid by the Fund in respect of fi nancial derivative instruments:
Type of Collateral Counterparty CurrencyCollateral Amount
receivedCollateral Amount
paid
Global Bond Fund
Cash Barclays USD – 480,000Cash Deutsche Bank USD – 200,000Cash Goldman Sachs USD 696,576 270,006Cash State Street USD – 310,000Cash UBS USD 90 –
696,666 1,260,006
DERIVATIVES (continued)
Over-the-counter (OTC) and exchange traded derivatives as at 30 June 2017, expressed in US Dollars.
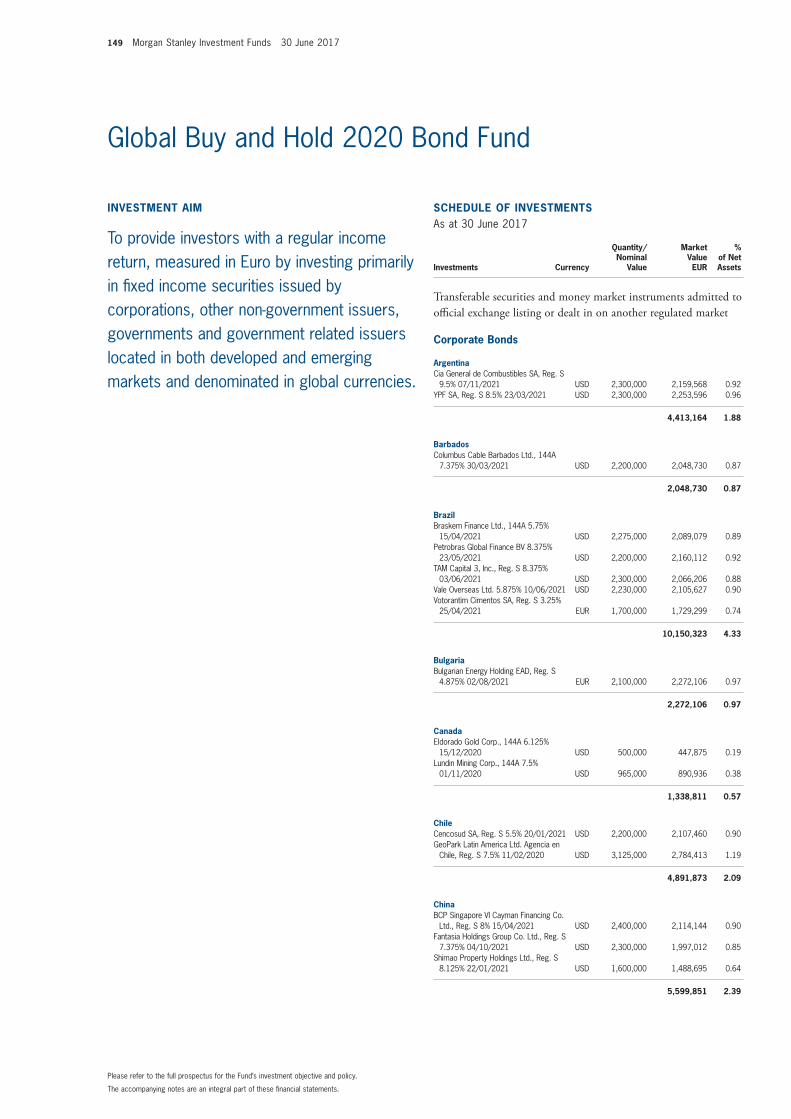
149 Morgan Stanley Investment Funds 30 June 2017
The accompanying notes are an integral part of these fi nancial statements.
Please refer to the full prospectus for the Fund’s investment objective and policy.
Global Buy and Hold 2020 Bond Fund
INVESTMENT AIM
To provide investors with a regular income return, measured in Euro by investing primarily in fi xed income securities issued by corporations, other non-government issuers, governments and government related issuers located in both developed and emerging markets and denominated in global currencies.
SCHEDULE OF INVESTMENTSAs at 30 June 2017
Investments Currency
Quantity/Nominal
Value
Market Value EUR
% of Net Assets
Transferable securities and money market instruments admitted to offi cial exchange listing or dealt in on another regulated market
Corporate Bonds
ArgentinaCia General de Combustibles SA, Reg. S
9.5% 07/11/2021 USD 2,300,000 2,159,568 0.92 YPF SA, Reg. S 8.5% 23/03/2021 USD 2,300,000 2,253,596 0.96
4,413,164 1.88
BarbadosColumbus Cable Barbados Ltd., 144A
7.375% 30/03/2021 USD 2,200,000 2,048,730 0.87
2,048,730 0.87
BrazilBraskem Finance Ltd., 144A 5.75%
15/04/2021 USD 2,275,000 2,089,079 0.89 Petrobras Global Finance BV 8.375%
23/05/2021 USD 2,200,000 2,160,112 0.92 TAM Capital 3, Inc., Reg. S 8.375%
03/06/2021 USD 2,300,000 2,066,206 0.88 Vale Overseas Ltd. 5.875% 10/06/2021 USD 2,230,000 2,105,627 0.90 Votorantim Cimentos SA, Reg. S 3.25%
25/04/2021 EUR 1,700,000 1,729,299 0.74
10,150,323 4.33
BulgariaBulgarian Energy Holding EAD, Reg. S
4.875% 02/08/2021 EUR 2,100,000 2,272,106 0.97
2,272,106 0.97
CanadaEldorado Gold Corp., 144A 6.125%
15/12/2020 USD 500,000 447,875 0.19 Lundin Mining Corp., 144A 7.5%
01/11/2020 USD 965,000 890,936 0.38
1,338,811 0.57
ChileCencosud SA, Reg. S 5.5% 20/01/2021 USD 2,200,000 2,107,460 0.90 GeoPark Latin America Ltd. Agencia en
Chile, Reg. S 7.5% 11/02/2020 USD 3,125,000 2,784,413 1.19
4,891,873 2.09
ChinaBCP Singapore VI Cayman Financing Co.
Ltd., Reg. S 8% 15/04/2021 USD 2,400,000 2,114,144 0.90 Fantasia Holdings Group Co. Ltd., Reg. S
7.375% 04/10/2021 USD 2,300,000 1,997,012 0.85 Shimao Property Holdings Ltd., Reg. S
8.125% 22/01/2021 USD 1,600,000 1,488,695 0.64
5,599,851 2.39
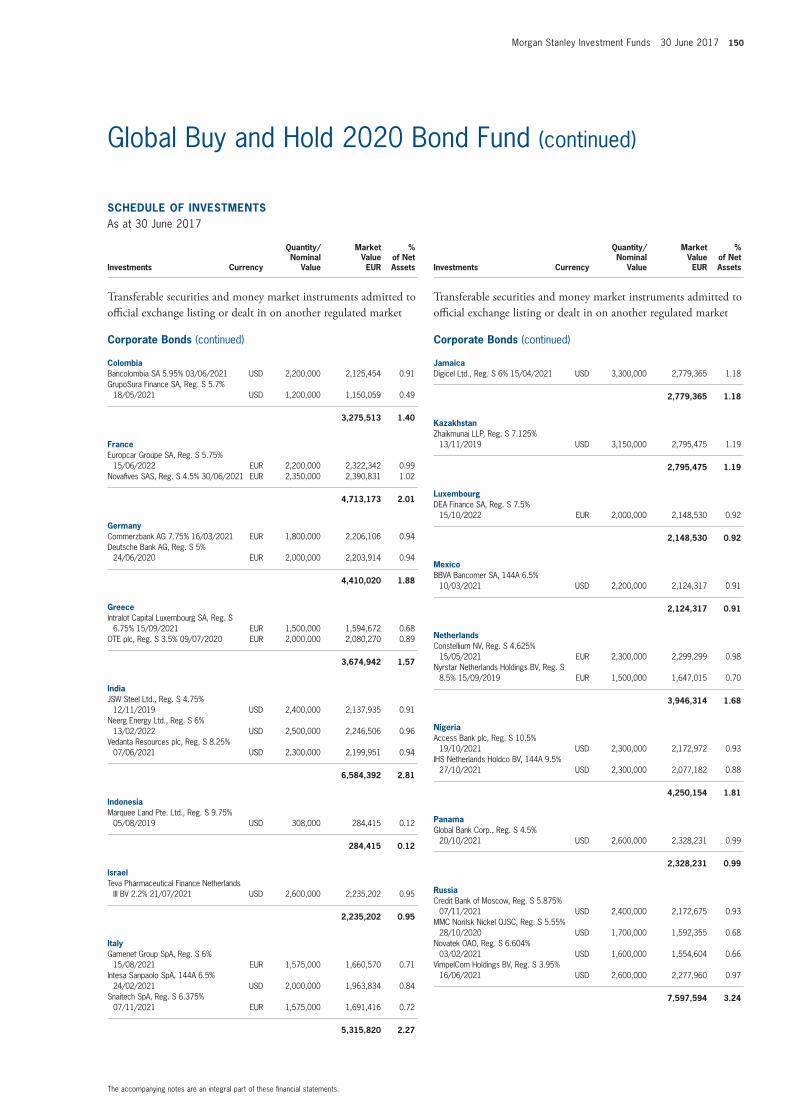
Morgan Stanley Investment Funds 30 June 2017 150
The accompanying notes are an integral part of these fi nancial statements.
Global Buy and Hold 2020 Bond Fund (continued)
SCHEDULE OF INVESTMENTSAs at 30 June 2017
Investments Currency
Quantity/Nominal
Value
Market Value EUR
% of Net Assets
Transferable securities and money market instruments admitted to offi cial exchange listing or dealt in on another regulated market
Corporate Bonds (continued)
ColombiaBancolombia SA 5.95% 03/06/2021 USD 2,200,000 2,125,454 0.91 GrupoSura Finance SA, Reg. S 5.7%
18/05/2021 USD 1,200,000 1,150,059 0.49
3,275,513 1.40
FranceEuropcar Groupe SA, Reg. S 5.75%
15/06/2022 EUR 2,200,000 2,322,342 0.99 Novafi ves SAS, Reg. S 4.5% 30/06/2021 EUR 2,350,000 2,390,831 1.02
4,713,173 2.01
GermanyCommerzbank AG 7.75% 16/03/2021 EUR 1,800,000 2,206,106 0.94 Deutsche Bank AG, Reg. S 5%
24/06/2020 EUR 2,000,000 2,203,914 0.94
4,410,020 1.88
GreeceIntralot Capital Luxembourg SA, Reg. S
6.75% 15/09/2021 EUR 1,500,000 1,594,672 0.68 OTE plc, Reg. S 3.5% 09/07/2020 EUR 2,000,000 2,080,270 0.89
3,674,942 1.57
IndiaJSW Steel Ltd., Reg. S 4.75%
12/11/2019 USD 2,400,000 2,137,935 0.91 Neerg Energy Ltd., Reg. S 6%
13/02/2022 USD 2,500,000 2,246,506 0.96 Vedanta Resources plc, Reg. S 8.25%
07/06/2021 USD 2,300,000 2,199,951 0.94
6,584,392 2.81
IndonesiaMarquee Land Pte. Ltd., Reg. S 9.75%
05/08/2019 USD 308,000 284,415 0.12
284,415 0.12
IsraelTeva Pharmaceutical Finance Netherlands
III BV 2.2% 21/07/2021 USD 2,600,000 2,235,202 0.95
2,235,202 0.95
ItalyGamenet Group SpA, Reg. S 6%
15/08/2021 EUR 1,575,000 1,660,570 0.71 Intesa Sanpaolo SpA, 144A 6.5%
24/02/2021 USD 2,000,000 1,963,834 0.84 Snaitech SpA, Reg. S 6.375%
07/11/2021 EUR 1,575,000 1,691,416 0.72
5,315,820 2.27
SCHEDULE OF INVESTMENTSAs at 30 June 2017
Investments Currency
Quantity/Nominal
Value
Market Value EUR
% of Net Assets
Transferable securities and money market instruments admitted to offi cial exchange listing or dealt in on another regulated market
Corporate Bonds (continued)
JamaicaDigicel Ltd., Reg. S 6% 15/04/2021 USD 3,300,000 2,779,365 1.18
2,779,365 1.18
KazakhstanZhaikmunai LLP, Reg. S 7.125%
13/11/2019 USD 3,150,000 2,795,475 1.19
2,795,475 1.19
LuxembourgDEA Finance SA, Reg. S 7.5%
15/10/2022 EUR 2,000,000 2,148,530 0.92
2,148,530 0.92
MexicoBBVA Bancomer SA, 144A 6.5%
10/03/2021 USD 2,200,000 2,124,317 0.91
2,124,317 0.91
NetherlandsConstellium NV, Reg. S 4.625%
15/05/2021 EUR 2,300,000 2,299,299 0.98 Nyrstar Netherlands Holdings BV, Reg. S
8.5% 15/09/2019 EUR 1,500,000 1,647,015 0.70
3,946,314 1.68
NigeriaAccess Bank plc, Reg. S 10.5%
19/10/2021 USD 2,300,000 2,172,972 0.93 IHS Netherlands Holdco BV, 144A 9.5%
27/10/2021 USD 2,300,000 2,077,182 0.88
4,250,154 1.81
PanamaGlobal Bank Corp., Reg. S 4.5%
20/10/2021 USD 2,600,000 2,328,231 0.99
2,328,231 0.99
RussiaCredit Bank of Moscow, Reg. S 5.875%
07/11/2021 USD 2,400,000 2,172,675 0.93 MMC Norilsk Nickel OJSC, Reg. S 5.55%
28/10/2020 USD 1,700,000 1,592,355 0.68 Novatek OAO, Reg. S 6.604%
03/02/2021 USD 1,600,000 1,554,604 0.66 VimpelCom Holdings BV, Reg. S 3.95%
16/06/2021 USD 2,600,000 2,277,960 0.97
7,597,594 3.24
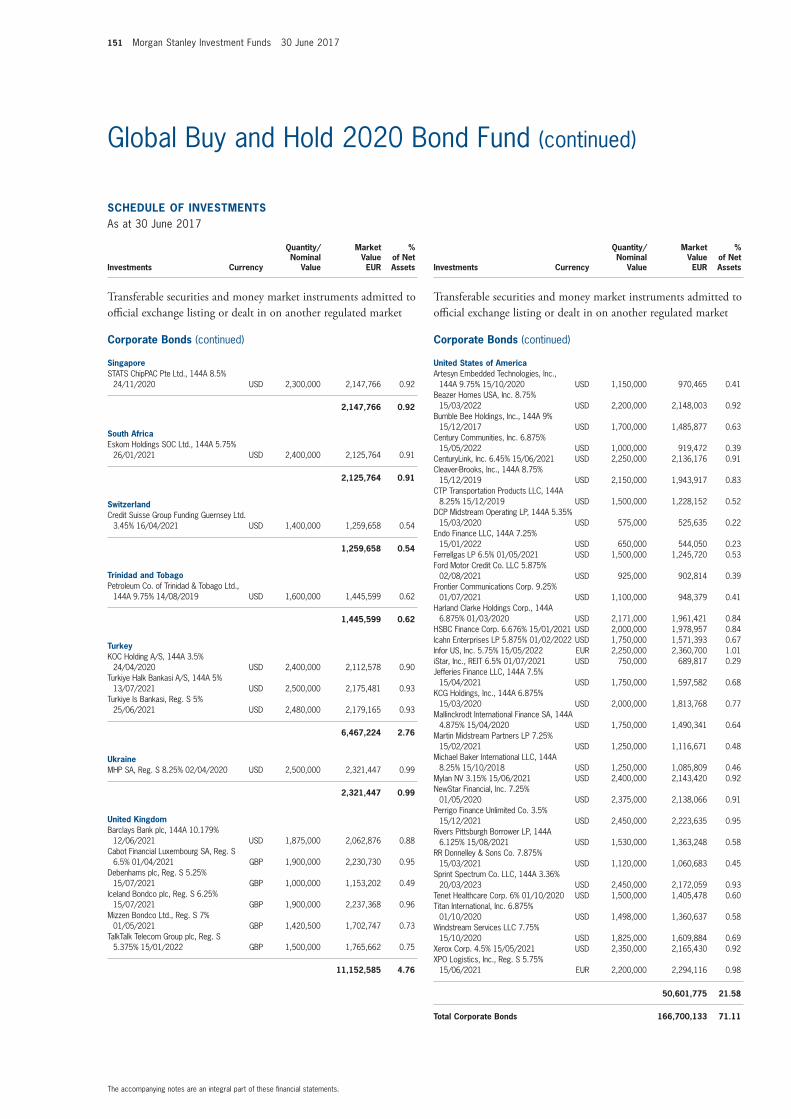
151 Morgan Stanley Investment Funds 30 June 2017
The accompanying notes are an integral part of these fi nancial statements.
Global Buy and Hold 2020 Bond Fund (continued)
SCHEDULE OF INVESTMENTSAs at 30 June 2017
Investments Currency
Quantity/Nominal
Value
Market Value EUR
% of Net Assets
Transferable securities and money market instruments admitted to offi cial exchange listing or dealt in on another regulated market
Corporate Bonds (continued)
SingaporeSTATS ChipPAC Pte Ltd., 144A 8.5%
24/11/2020 USD 2,300,000 2,147,766 0.92
2,147,766 0.92
South AfricaEskom Holdings SOC Ltd., 144A 5.75%
26/01/2021 USD 2,400,000 2,125,764 0.91
2,125,764 0.91
SwitzerlandCredit Suisse Group Funding Guernsey Ltd.
3.45% 16/04/2021 USD 1,400,000 1,259,658 0.54
1,259,658 0.54
Trinidad and TobagoPetroleum Co. of Trinidad & Tobago Ltd.,
144A 9.75% 14/08/2019 USD 1,600,000 1,445,599 0.62
1,445,599 0.62
TurkeyKOC Holding A/S, 144A 3.5%
24/04/2020 USD 2,400,000 2,112,578 0.90 Turkiye Halk Bankasi A/S, 144A 5%
13/07/2021 USD 2,500,000 2,175,481 0.93 Turkiye Is Bankasi, Reg. S 5%
25/06/2021 USD 2,480,000 2,179,165 0.93
6,467,224 2.76
UkraineMHP SA, Reg. S 8.25% 02/04/2020 USD 2,500,000 2,321,447 0.99
2,321,447 0.99
United KingdomBarclays Bank plc, 144A 10.179%
12/06/2021 USD 1,875,000 2,062,876 0.88 Cabot Financial Luxembourg SA, Reg. S
6.5% 01/04/2021 GBP 1,900,000 2,230,730 0.95 Debenhams plc, Reg. S 5.25%
15/07/2021 GBP 1,000,000 1,153,202 0.49 Iceland Bondco plc, Reg. S 6.25%
15/07/2021 GBP 1,900,000 2,237,368 0.96 Mizzen Bondco Ltd., Reg. S 7%
01/05/2021 GBP 1,420,500 1,702,747 0.73 TalkTalk Telecom Group plc, Reg. S
5.375% 15/01/2022 GBP 1,500,000 1,765,662 0.75
11,152,585 4.76
SCHEDULE OF INVESTMENTSAs at 30 June 2017
Investments Currency
Quantity/Nominal
Value
Market Value EUR
% of Net Assets
Transferable securities and money market instruments admitted to offi cial exchange listing or dealt in on another regulated market
Corporate Bonds (continued)
United States of AmericaArtesyn Embedded Technologies, Inc.,
144A 9.75% 15/10/2020 USD 1,150,000 970,465 0.41 Beazer Homes USA, Inc. 8.75%
15/03/2022 USD 2,200,000 2,148,003 0.92 Bumble Bee Holdings, Inc., 144A 9%
15/12/2017 USD 1,700,000 1,485,877 0.63 Century Communities, Inc. 6.875%
15/05/2022 USD 1,000,000 919,472 0.39 CenturyLink, Inc. 6.45% 15/06/2021 USD 2,250,000 2,136,176 0.91 Cleaver-Brooks, Inc., 144A 8.75%
15/12/2019 USD 2,150,000 1,943,917 0.83 CTP Transportation Products LLC, 144A
8.25% 15/12/2019 USD 1,500,000 1,228,152 0.52 DCP Midstream Operating LP, 144A 5.35%
15/03/2020 USD 575,000 525,635 0.22 Endo Finance LLC, 144A 7.25%
15/01/2022 USD 650,000 544,050 0.23 Ferrellgas LP 6.5% 01/05/2021 USD 1,500,000 1,245,720 0.53 Ford Motor Credit Co. LLC 5.875%
02/08/2021 USD 925,000 902,814 0.39 Frontier Communications Corp. 9.25%
01/07/2021 USD 1,100,000 948,379 0.41 Harland Clarke Holdings Corp., 144A
6.875% 01/03/2020 USD 2,171,000 1,961,421 0.84 HSBC Finance Corp. 6.676% 15/01/2021 USD 2,000,000 1,978,957 0.84 Icahn Enterprises LP 5.875% 01/02/2022 USD 1,750,000 1,571,393 0.67 Infor US, Inc. 5.75% 15/05/2022 EUR 2,250,000 2,360,700 1.01 iStar, Inc., REIT 6.5% 01/07/2021 USD 750,000 689,817 0.29 Jefferies Finance LLC, 144A 7.5%
15/04/2021 USD 1,750,000 1,597,582 0.68 KCG Holdings, Inc., 144A 6.875%
15/03/2020 USD 2,000,000 1,813,768 0.77 Mallinckrodt International Finance SA, 144A
4.875% 15/04/2020 USD 1,750,000 1,490,341 0.64 Martin Midstream Partners LP 7.25%
15/02/2021 USD 1,250,000 1,116,671 0.48 Michael Baker International LLC, 144A
8.25% 15/10/2018 USD 1,250,000 1,085,809 0.46 Mylan NV 3.15% 15/06/2021 USD 2,400,000 2,143,420 0.92 NewStar Financial, Inc. 7.25%
01/05/2020 USD 2,375,000 2,138,066 0.91 Perrigo Finance Unlimited Co. 3.5%
15/12/2021 USD 2,450,000 2,223,635 0.95 Rivers Pittsburgh Borrower LP, 144A
6.125% 15/08/2021 USD 1,530,000 1,363,248 0.58 RR Donnelley & Sons Co. 7.875%
15/03/2021 USD 1,120,000 1,060,683 0.45 Sprint Spectrum Co. LLC, 144A 3.36%
20/03/2023 USD 2,450,000 2,172,059 0.93 Tenet Healthcare Corp. 6% 01/10/2020 USD 1,500,000 1,405,478 0.60 Titan International, Inc. 6.875%
01/10/2020 USD 1,498,000 1,360,637 0.58 Windstream Services LLC 7.75%
15/10/2020 USD 1,825,000 1,609,884 0.69 Xerox Corp. 4.5% 15/05/2021 USD 2,350,000 2,165,430 0.92 XPO Logistics, Inc., Reg. S 5.75%
15/06/2021 EUR 2,200,000 2,294,116 0.98
50,601,775 21.58
Total Corporate Bonds 166,700,133 71.11
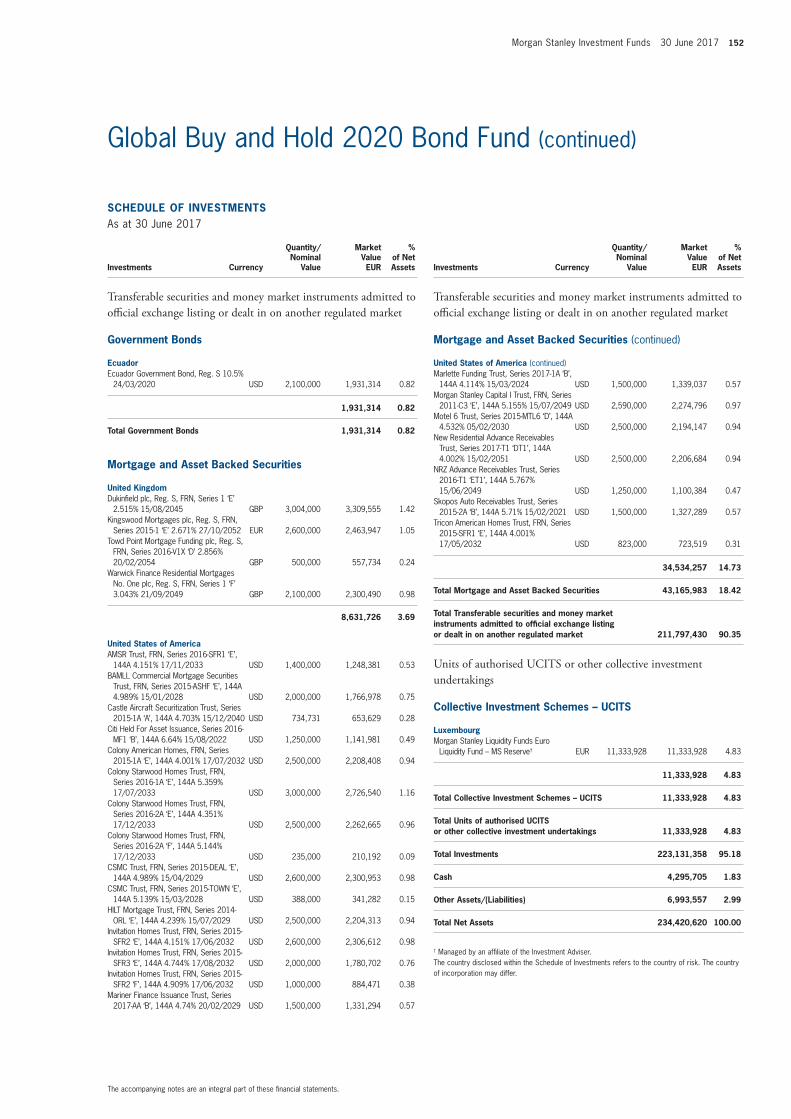
Morgan Stanley Investment Funds 30 June 2017 152
The accompanying notes are an integral part of these fi nancial statements.
Global Buy and Hold 2020 Bond Fund (continued)
SCHEDULE OF INVESTMENTSAs at 30 June 2017
Investments Currency
Quantity/Nominal
Value
Market Value EUR
% of Net Assets
Transferable securities and money market instruments admitted to offi cial exchange listing or dealt in on another regulated market
Government Bonds
EcuadorEcuador Government Bond, Reg. S 10.5%
24/03/2020 USD 2,100,000 1,931,314 0.82
1,931,314 0.82
Total Government Bonds 1,931,314 0.82
Mortgage and Asset Backed Securities
United KingdomDukinfi eld plc, Reg. S, FRN, Series 1 ‘E’
2.515% 15/08/2045 GBP 3,004,000 3,309,555 1.42 Kingswood Mortgages plc, Reg. S, FRN,
Series 2015-1 ‘E’ 2.671% 27/10/2052 EUR 2,600,000 2,463,947 1.05 Towd Point Mortgage Funding plc, Reg. S,
FRN, Series 2016-V1X ‘D’ 2.856% 20/02/2054 GBP 500,000 557,734 0.24
Warwick Finance Residential Mortgages No. One plc, Reg. S, FRN, Series 1 ‘F’ 3.043% 21/09/2049 GBP 2,100,000 2,300,490 0.98
8,631,726 3.69
United States of AmericaAMSR Trust, FRN, Series 2016-SFR1 ‘E’,
144A 4.151% 17/11/2033 USD 1,400,000 1,248,381 0.53 BAMLL Commercial Mortgage Securities
Trust, FRN, Series 2015-ASHF ‘E’, 144A 4.989% 15/01/2028 USD 2,000,000 1,766,978 0.75
Castle Aircraft Securitization Trust, Series 2015-1A ‘A’, 144A 4.703% 15/12/2040 USD 734,731 653,629 0.28
Citi Held For Asset Issuance, Series 2016-MF1 ‘B’, 144A 6.64% 15/08/2022 USD 1,250,000 1,141,981 0.49
Colony American Homes, FRN, Series 2015-1A ‘E’, 144A 4.001% 17/07/2032 USD 2,500,000 2,208,408 0.94
Colony Starwood Homes Trust, FRN, Series 2016-1A ‘E’, 144A 5.359% 17/07/2033 USD 3,000,000 2,726,540 1.16
Colony Starwood Homes Trust, FRN, Series 2016-2A ‘E’, 144A 4.351% 17/12/2033 USD 2,500,000 2,262,665 0.96
Colony Starwood Homes Trust, FRN, Series 2016-2A ‘F’, 144A 5.144% 17/12/2033 USD 235,000 210,192 0.09
CSMC Trust, FRN, Series 2015-DEAL ‘E’, 144A 4.989% 15/04/2029 USD 2,600,000 2,300,953 0.98
CSMC Trust, FRN, Series 2015-TOWN ‘E’, 144A 5.139% 15/03/2028 USD 388,000 341,282 0.15
HILT Mortgage Trust, FRN, Series 2014-ORL ‘E’, 144A 4.239% 15/07/2029 USD 2,500,000 2,204,313 0.94
Invitation Homes Trust, FRN, Series 2015-SFR2 ‘E’, 144A 4.151% 17/06/2032 USD 2,600,000 2,306,612 0.98
Invitation Homes Trust, FRN, Series 2015-SFR3 ‘E’, 144A 4.744% 17/08/2032 USD 2,000,000 1,780,702 0.76
Invitation Homes Trust, FRN, Series 2015-SFR2 ‘F’, 144A 4.909% 17/06/2032 USD 1,000,000 884,471 0.38
Mariner Finance Issuance Trust, Series 2017-AA ‘B’, 144A 4.74% 20/02/2029 USD 1,500,000 1,331,294 0.57
SCHEDULE OF INVESTMENTSAs at 30 June 2017
Investments Currency
Quantity/Nominal
Value
Market Value EUR
% of Net Assets
Transferable securities and money market instruments admitted to offi cial exchange listing or dealt in on another regulated market
Mortgage and Asset Backed Securities (continued)
United States of America (continued)Marlette Funding Trust, Series 2017-1A ‘B’,
144A 4.114% 15/03/2024 USD 1,500,000 1,339,037 0.57 Morgan Stanley Capital I Trust, FRN, Series
2011-C3 ‘E’, 144A 5.155% 15/07/2049 USD 2,590,000 2,274,796 0.97 Motel 6 Trust, Series 2015-MTL6 ‘D’, 144A
4.532% 05/02/2030 USD 2,500,000 2,194,147 0.94 New Residential Advance Receivables
Trust, Series 2017-T1 ‘DT1’, 144A 4.002% 15/02/2051 USD 2,500,000 2,206,684 0.94
NRZ Advance Receivables Trust, Series 2016-T1 ‘ET1’, 144A 5.767% 15/06/2049 USD 1,250,000 1,100,384 0.47
Skopos Auto Receivables Trust, Series 2015-2A ‘B’, 144A 5.71% 15/02/2021 USD 1,500,000 1,327,289 0.57
Tricon American Homes Trust, FRN, Series 2015-SFR1 ‘E’, 144A 4.001% 17/05/2032 USD 823,000 723,519 0.31
34,534,257 14.73
Total Mortgage and Asset Backed Securities 43,165,983 18.42
Total Transferable securities and money market instruments admitted to offi cial exchange listing or dealt in on another regulated market 211,797,430 90.35
Units of authorised UCITS or other collective investment undertakings
Collective Investment Schemes – UCITS
LuxembourgMorgan Stanley Liquidity Funds Euro
Liquidity Fund – MS Reserve† EUR 11,333,928 11,333,928 4.83
11,333,928 4.83
Total Collective Investment Schemes – UCITS 11,333,928 4.83
Total Units of authorised UCITS or other collective investment undertakings 11,333,928 4.83
Total Investments 223,131,358 95.18
Cash 4,295,705 1.83
Other Assets/(Liabilities) 6,993,557 2.99
Total Net Assets 234,420,620 100.00
† Managed by an affi liate of the Investment Adviser.The country disclosed within the Schedule of Investments refers to the country of risk. The country of incorporation may differ.
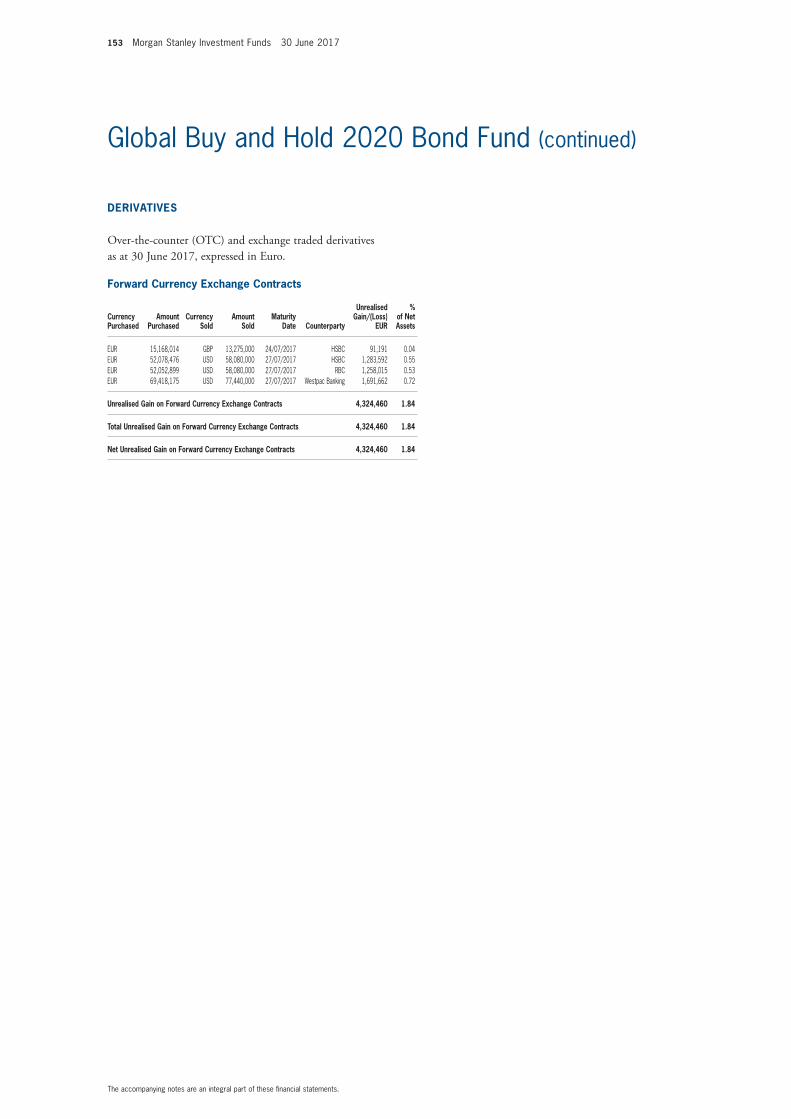
153 Morgan Stanley Investment Funds 30 June 2017
The accompanying notes are an integral part of these fi nancial statements.
Global Buy and Hold 2020 Bond Fund (continued)
Forward Currency Exchange Contracts
Currency Purchased
Amount Purchased
Currency Sold
Amount Sold
Maturity Date Counterparty
Unrealised Gain/(Loss)
EUR
% of Net Assets
EUR 15,168,014 GBP 13,275,000 24/07/2017 HSBC 91,191 0.04 EUR 52,078,476 USD 58,080,000 27/07/2017 HSBC 1,283,592 0.55 EUR 52,052,899 USD 58,080,000 27/07/2017 RBC 1,258,015 0.53 EUR 69,418,175 USD 77,440,000 27/07/2017 Westpac Banking 1,691,662 0.72
Unrealised Gain on Forward Currency Exchange Contracts 4,324,460 1.84
Total Unrealised Gain on Forward Currency Exchange Contracts 4,324,460 1.84
Net Unrealised Gain on Forward Currency Exchange Contracts 4,324,460 1.84
DERIVATIVES
Over-the-counter (OTC) and exchange traded derivatives as at 30 June 2017, expressed in Euro.
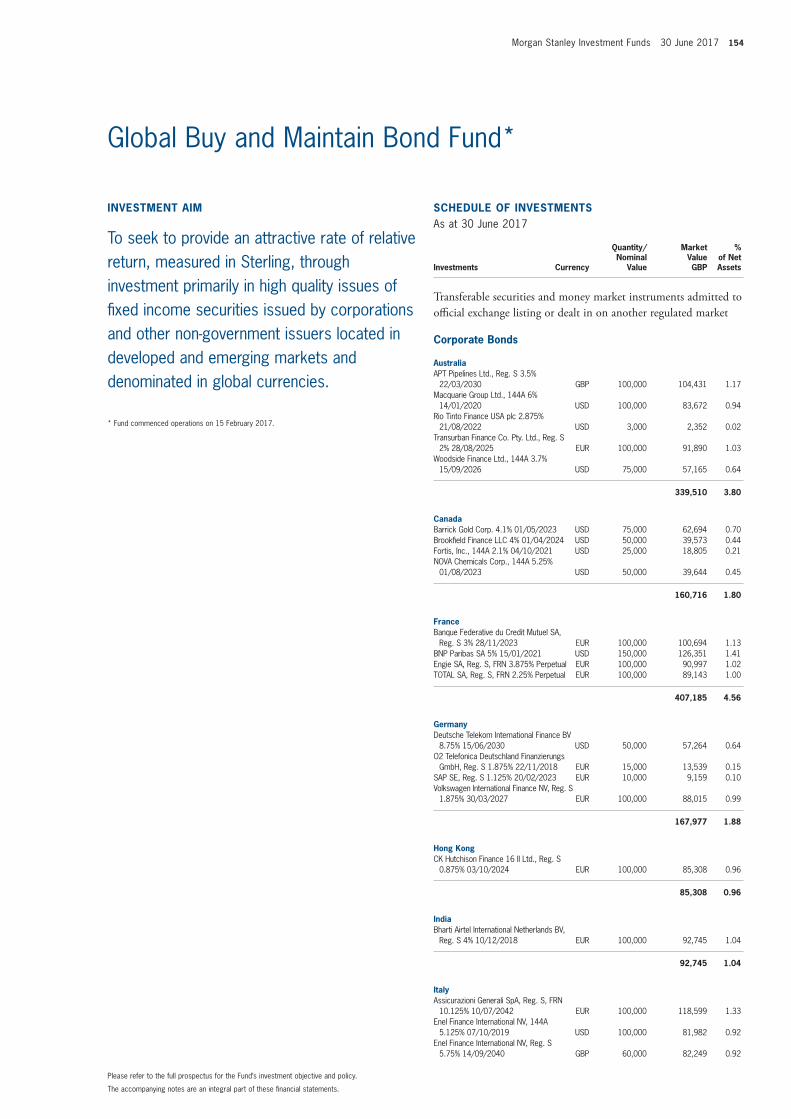
Morgan Stanley Investment Funds 30 June 2017 154
The accompanying notes are an integral part of these fi nancial statements.
Please refer to the full prospectus for the Fund’s investment objective and policy.
Global Buy and Maintain Bond Fund*
INVESTMENT AIM
To seek to provide an attractive rate of relative return, measured in Sterling, through investment primarily in high quality issues of fi xed income securities issued by corporations and other non-government issuers located in developed and emerging markets and denominated in global currencies.
SCHEDULE OF INVESTMENTSAs at 30 June 2017
Investments Currency
Quantity/Nominal
Value
Market Value GBP
% of Net Assets
Transferable securities and money market instruments admitted to offi cial exchange listing or dealt in on another regulated market
Corporate Bonds
AustraliaAPT Pipelines Ltd., Reg. S 3.5%
22/03/2030 GBP 100,000 104,431 1.17 Macquarie Group Ltd., 144A 6%
14/01/2020 USD 100,000 83,672 0.94 Rio Tinto Finance USA plc 2.875%
21/08/2022 USD 3,000 2,352 0.02 Transurban Finance Co. Pty. Ltd., Reg. S
2% 28/08/2025 EUR 100,000 91,890 1.03 Woodside Finance Ltd., 144A 3.7%
15/09/2026 USD 75,000 57,165 0.64
339,510 3.80
CanadaBarrick Gold Corp. 4.1% 01/05/2023 USD 75,000 62,694 0.70 Brookfi eld Finance LLC 4% 01/04/2024 USD 50,000 39,573 0.44 Fortis, Inc., 144A 2.1% 04/10/2021 USD 25,000 18,805 0.21 NOVA Chemicals Corp., 144A 5.25%
01/08/2023 USD 50,000 39,644 0.45
160,716 1.80
FranceBanque Federative du Credit Mutuel SA,
Reg. S 3% 28/11/2023 EUR 100,000 100,694 1.13 BNP Paribas SA 5% 15/01/2021 USD 150,000 126,351 1.41 Engie SA, Reg. S, FRN 3.875% Perpetual EUR 100,000 90,997 1.02 TOTAL SA, Reg. S, FRN 2.25% Perpetual EUR 100,000 89,143 1.00
407,185 4.56
GermanyDeutsche Telekom International Finance BV
8.75% 15/06/2030 USD 50,000 57,264 0.64 O2 Telefonica Deutschland Finanzierungs
GmbH, Reg. S 1.875% 22/11/2018 EUR 15,000 13,539 0.15 SAP SE, Reg. S 1.125% 20/02/2023 EUR 10,000 9,159 0.10 Volkswagen International Finance NV, Reg. S
1.875% 30/03/2027 EUR 100,000 88,015 0.99
167,977 1.88
Hong KongCK Hutchison Finance 16 II Ltd., Reg. S
0.875% 03/10/2024 EUR 100,000 85,308 0.96
85,308 0.96
IndiaBharti Airtel International Netherlands BV,
Reg. S 4% 10/12/2018 EUR 100,000 92,745 1.04
92,745 1.04
ItalyAssicurazioni Generali SpA, Reg. S, FRN
10.125% 10/07/2042 EUR 100,000 118,599 1.33 Enel Finance International NV, 144A
5.125% 07/10/2019 USD 100,000 81,982 0.92 Enel Finance International NV, Reg. S
5.75% 14/09/2040 GBP 60,000 82,249 0.92
* Fund commenced operations on 15 February 2017.
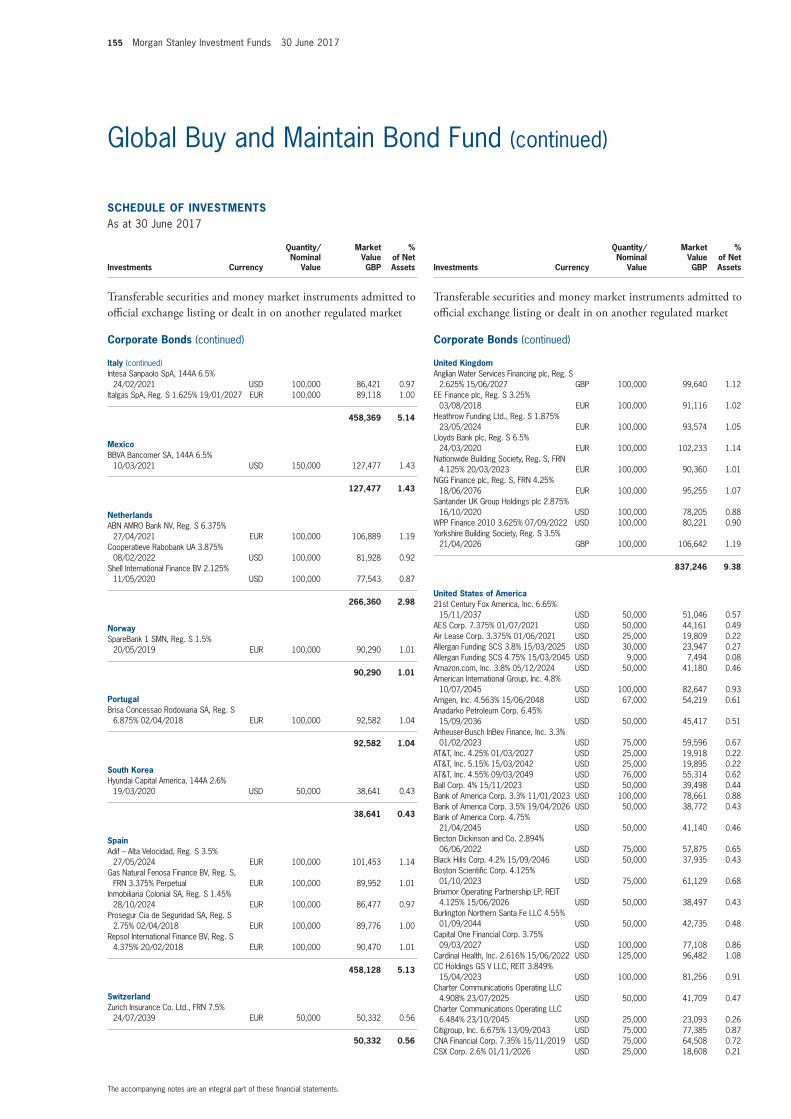
155 Morgan Stanley Investment Funds 30 June 2017
The accompanying notes are an integral part of these fi nancial statements.
Global Buy and Maintain Bond Fund (continued)
SCHEDULE OF INVESTMENTSAs at 30 June 2017
Investments Currency
Quantity/Nominal
Value
Market Value GBP
% of Net Assets
Transferable securities and money market instruments admitted to offi cial exchange listing or dealt in on another regulated market
Corporate Bonds (continued)
Italy (continued)Intesa Sanpaolo SpA, 144A 6.5%
24/02/2021 USD 100,000 86,421 0.97 Italgas SpA, Reg. S 1.625% 19/01/2027 EUR 100,000 89,118 1.00
458,369 5.14
MexicoBBVA Bancomer SA, 144A 6.5%
10/03/2021 USD 150,000 127,477 1.43
127,477 1.43
NetherlandsABN AMRO Bank NV, Reg. S 6.375%
27/04/2021 EUR 100,000 106,889 1.19 Cooperatieve Rabobank UA 3.875%
08/02/2022 USD 100,000 81,928 0.92 Shell International Finance BV 2.125%
11/05/2020 USD 100,000 77,543 0.87
266,360 2.98
NorwaySpareBank 1 SMN, Reg. S 1.5%
20/05/2019 EUR 100,000 90,290 1.01
90,290 1.01
PortugalBrisa Concessao Rodoviaria SA, Reg. S
6.875% 02/04/2018 EUR 100,000 92,582 1.04
92,582 1.04
South KoreaHyundai Capital America, 144A 2.6%
19/03/2020 USD 50,000 38,641 0.43
38,641 0.43
SpainAdif – Alta Velocidad, Reg. S 3.5%
27/05/2024 EUR 100,000 101,453 1.14 Gas Natural Fenosa Finance BV, Reg. S,
FRN 3.375% Perpetual EUR 100,000 89,952 1.01 Inmobiliaria Colonial SA, Reg. S 1.45%
28/10/2024 EUR 100,000 86,477 0.97 Prosegur Cia de Seguridad SA, Reg. S
2.75% 02/04/2018 EUR 100,000 89,776 1.00 Repsol International Finance BV, Reg. S
4.375% 20/02/2018 EUR 100,000 90,470 1.01
458,128 5.13
SwitzerlandZurich Insurance Co. Ltd., FRN 7.5%
24/07/2039 EUR 50,000 50,332 0.56
50,332 0.56
SCHEDULE OF INVESTMENTSAs at 30 June 2017
Investments Currency
Quantity/Nominal
Value
Market Value GBP
% of Net Assets
Transferable securities and money market instruments admitted to offi cial exchange listing or dealt in on another regulated market
Corporate Bonds (continued)
United KingdomAnglian Water Services Financing plc, Reg. S
2.625% 15/06/2027 GBP 100,000 99,640 1.12 EE Finance plc, Reg. S 3.25%
03/08/2018 EUR 100,000 91,116 1.02 Heathrow Funding Ltd., Reg. S 1.875%
23/05/2024 EUR 100,000 93,574 1.05 Lloyds Bank plc, Reg. S 6.5%
24/03/2020 EUR 100,000 102,233 1.14 Nationwide Building Society, Reg. S, FRN
4.125% 20/03/2023 EUR 100,000 90,360 1.01 NGG Finance plc, Reg. S, FRN 4.25%
18/06/2076 EUR 100,000 95,255 1.07 Santander UK Group Holdings plc 2.875%
16/10/2020 USD 100,000 78,205 0.88 WPP Finance 2010 3.625% 07/09/2022 USD 100,000 80,221 0.90 Yorkshire Building Society, Reg. S 3.5%
21/04/2026 GBP 100,000 106,642 1.19
837,246 9.38
United States of America21st Century Fox America, Inc. 6.65%
15/11/2037 USD 50,000 51,046 0.57 AES Corp. 7.375% 01/07/2021 USD 50,000 44,161 0.49 Air Lease Corp. 3.375% 01/06/2021 USD 25,000 19,809 0.22 Allergan Funding SCS 3.8% 15/03/2025 USD 30,000 23,947 0.27 Allergan Funding SCS 4.75% 15/03/2045 USD 9,000 7,494 0.08 Amazon.com, Inc. 3.8% 05/12/2024 USD 50,000 41,180 0.46 American International Group, Inc. 4.8%
10/07/2045 USD 100,000 82,647 0.93 Amgen, Inc. 4.563% 15/06/2048 USD 67,000 54,219 0.61 Anadarko Petroleum Corp. 6.45%
15/09/2036 USD 50,000 45,417 0.51 Anheuser-Busch InBev Finance, Inc. 3.3%
01/02/2023 USD 75,000 59,596 0.67 AT&T, Inc. 4.25% 01/03/2027 USD 25,000 19,918 0.22 AT&T, Inc. 5.15% 15/03/2042 USD 25,000 19,895 0.22 AT&T, Inc. 4.55% 09/03/2049 USD 76,000 55,314 0.62 Ball Corp. 4% 15/11/2023 USD 50,000 39,498 0.44 Bank of America Corp. 3.3% 11/01/2023 USD 100,000 78,661 0.88 Bank of America Corp. 3.5% 19/04/2026 USD 50,000 38,772 0.43 Bank of America Corp. 4.75%
21/04/2045 USD 50,000 41,140 0.46 Becton Dickinson and Co. 2.894%
06/06/2022 USD 75,000 57,875 0.65 Black Hills Corp. 4.2% 15/09/2046 USD 50,000 37,935 0.43 Boston Scientifi c Corp. 4.125%
01/10/2023 USD 75,000 61,129 0.68 Brixmor Operating Partnership LP, REIT
4.125% 15/06/2026 USD 50,000 38,497 0.43 Burlington Northern Santa Fe LLC 4.55%
01/09/2044 USD 50,000 42,735 0.48 Capital One Financial Corp. 3.75%
09/03/2027 USD 100,000 77,108 0.86 Cardinal Health, Inc. 2.616% 15/06/2022 USD 125,000 96,482 1.08 CC Holdings GS V LLC, REIT 3.849%
15/04/2023 USD 100,000 81,256 0.91 Charter Communications Operating LLC
4.908% 23/07/2025 USD 50,000 41,709 0.47 Charter Communications Operating LLC
6.484% 23/10/2045 USD 25,000 23,093 0.26 Citigroup, Inc. 6.675% 13/09/2043 USD 75,000 77,385 0.87 CNA Financial Corp. 7.35% 15/11/2019 USD 75,000 64,508 0.72 CSX Corp. 2.6% 01/11/2026 USD 25,000 18,608 0.21
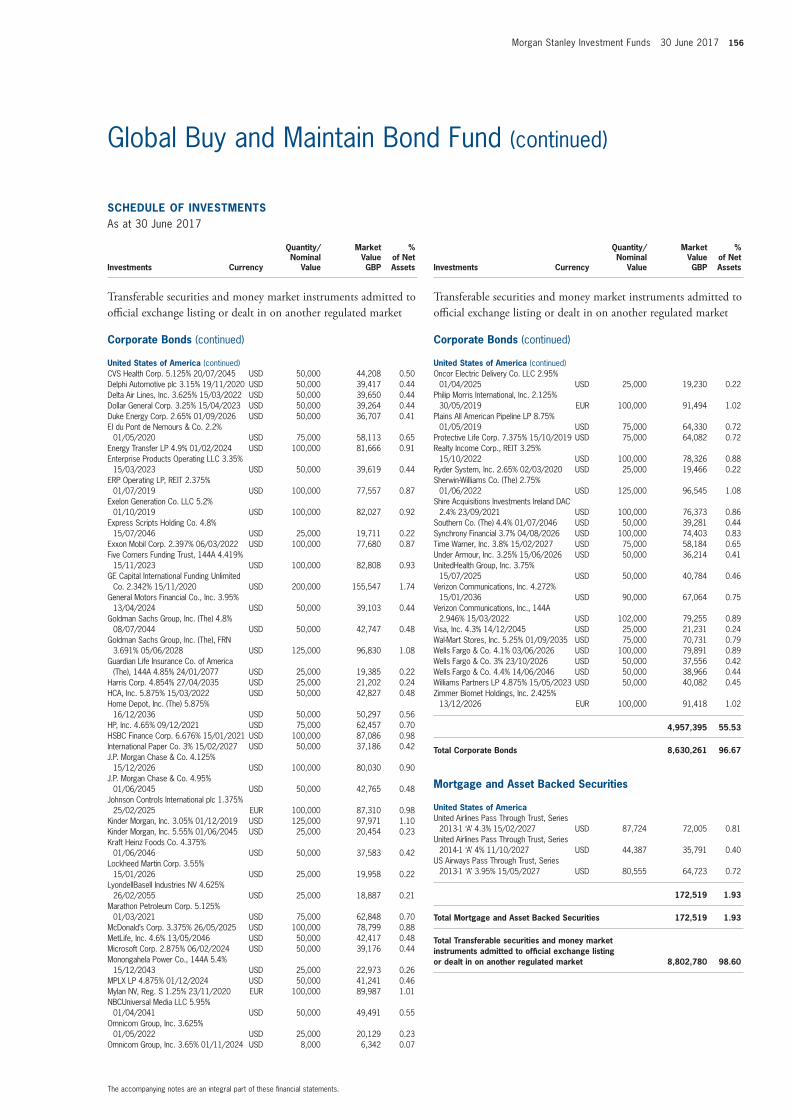
Morgan Stanley Investment Funds 30 June 2017 156
The accompanying notes are an integral part of these fi nancial statements.
Global Buy and Maintain Bond Fund (continued)
SCHEDULE OF INVESTMENTSAs at 30 June 2017
Investments Currency
Quantity/Nominal
Value
Market Value GBP
% of Net Assets
Transferable securities and money market instruments admitted to offi cial exchange listing or dealt in on another regulated market
Corporate Bonds (continued)
United States of America (continued)CVS Health Corp. 5.125% 20/07/2045 USD 50,000 44,208 0.50 Delphi Automotive plc 3.15% 19/11/2020 USD 50,000 39,417 0.44 Delta Air Lines, Inc. 3.625% 15/03/2022 USD 50,000 39,650 0.44 Dollar General Corp. 3.25% 15/04/2023 USD 50,000 39,264 0.44 Duke Energy Corp. 2.65% 01/09/2026 USD 50,000 36,707 0.41 EI du Pont de Nemours & Co. 2.2%
01/05/2020 USD 75,000 58,113 0.65 Energy Transfer LP 4.9% 01/02/2024 USD 100,000 81,666 0.91 Enterprise Products Operating LLC 3.35%
15/03/2023 USD 50,000 39,619 0.44 ERP Operating LP, REIT 2.375%
01/07/2019 USD 100,000 77,557 0.87 Exelon Generation Co. LLC 5.2%
01/10/2019 USD 100,000 82,027 0.92 Express Scripts Holding Co. 4.8%
15/07/2046 USD 25,000 19,711 0.22 Exxon Mobil Corp. 2.397% 06/03/2022 USD 100,000 77,680 0.87 Five Corners Funding Trust, 144A 4.419%
15/11/2023 USD 100,000 82,808 0.93 GE Capital International Funding Unlimited
Co. 2.342% 15/11/2020 USD 200,000 155,547 1.74 General Motors Financial Co., Inc. 3.95%
13/04/2024 USD 50,000 39,103 0.44 Goldman Sachs Group, Inc. (The) 4.8%
08/07/2044 USD 50,000 42,747 0.48 Goldman Sachs Group, Inc. (The), FRN
3.691% 05/06/2028 USD 125,000 96,830 1.08 Guardian Life Insurance Co. of America
(The), 144A 4.85% 24/01/2077 USD 25,000 19,385 0.22 Harris Corp. 4.854% 27/04/2035 USD 25,000 21,202 0.24 HCA, Inc. 5.875% 15/03/2022 USD 50,000 42,827 0.48 Home Depot, Inc. (The) 5.875%
16/12/2036 USD 50,000 50,297 0.56 HP, Inc. 4.65% 09/12/2021 USD 75,000 62,457 0.70 HSBC Finance Corp. 6.676% 15/01/2021 USD 100,000 87,086 0.98 International Paper Co. 3% 15/02/2027 USD 50,000 37,186 0.42 J.P. Morgan Chase & Co. 4.125%
15/12/2026 USD 100,000 80,030 0.90 J.P. Morgan Chase & Co. 4.95%
01/06/2045 USD 50,000 42,765 0.48 Johnson Controls International plc 1.375%
25/02/2025 EUR 100,000 87,310 0.98 Kinder Morgan, Inc. 3.05% 01/12/2019 USD 125,000 97,971 1.10 Kinder Morgan, Inc. 5.55% 01/06/2045 USD 25,000 20,454 0.23 Kraft Heinz Foods Co. 4.375%
01/06/2046 USD 50,000 37,583 0.42 Lockheed Martin Corp. 3.55%
15/01/2026 USD 25,000 19,958 0.22 LyondellBasell Industries NV 4.625%
26/02/2055 USD 25,000 18,887 0.21 Marathon Petroleum Corp. 5.125%
01/03/2021 USD 75,000 62,848 0.70 McDonald’s Corp. 3.375% 26/05/2025 USD 100,000 78,799 0.88 MetLife, Inc. 4.6% 13/05/2046 USD 50,000 42,417 0.48 Microsoft Corp. 2.875% 06/02/2024 USD 50,000 39,176 0.44 Monongahela Power Co., 144A 5.4%
15/12/2043 USD 25,000 22,973 0.26 MPLX LP 4.875% 01/12/2024 USD 50,000 41,241 0.46 Mylan NV, Reg. S 1.25% 23/11/2020 EUR 100,000 89,987 1.01 NBCUniversal Media LLC 5.95%
01/04/2041 USD 50,000 49,491 0.55 Omnicom Group, Inc. 3.625%
01/05/2022 USD 25,000 20,129 0.23 Omnicom Group, Inc. 3.65% 01/11/2024 USD 8,000 6,342 0.07
SCHEDULE OF INVESTMENTSAs at 30 June 2017
Investments Currency
Quantity/Nominal
Value
Market Value GBP
% of Net Assets
Transferable securities and money market instruments admitted to offi cial exchange listing or dealt in on another regulated market
Corporate Bonds (continued)
United States of America (continued)Oncor Electric Delivery Co. LLC 2.95%
01/04/2025 USD 25,000 19,230 0.22 Philip Morris International, Inc. 2.125%
30/05/2019 EUR 100,000 91,494 1.02 Plains All American Pipeline LP 8.75%
01/05/2019 USD 75,000 64,330 0.72 Protective Life Corp. 7.375% 15/10/2019 USD 75,000 64,082 0.72 Realty Income Corp., REIT 3.25%
15/10/2022 USD 100,000 78,326 0.88 Ryder System, Inc. 2.65% 02/03/2020 USD 25,000 19,466 0.22 Sherwin-Williams Co. (The) 2.75%
01/06/2022 USD 125,000 96,545 1.08 Shire Acquisitions Investments Ireland DAC
2.4% 23/09/2021 USD 100,000 76,373 0.86 Southern Co. (The) 4.4% 01/07/2046 USD 50,000 39,281 0.44 Synchrony Financial 3.7% 04/08/2026 USD 100,000 74,403 0.83 Time Warner, Inc. 3.8% 15/02/2027 USD 75,000 58,184 0.65 Under Armour, Inc. 3.25% 15/06/2026 USD 50,000 36,214 0.41 UnitedHealth Group, Inc. 3.75%
15/07/2025 USD 50,000 40,784 0.46 Verizon Communications, Inc. 4.272%
15/01/2036 USD 90,000 67,064 0.75 Verizon Communications, Inc., 144A
2.946% 15/03/2022 USD 102,000 79,255 0.89 Visa, Inc. 4.3% 14/12/2045 USD 25,000 21,231 0.24 Wal-Mart Stores, Inc. 5.25% 01/09/2035 USD 75,000 70,731 0.79 Wells Fargo & Co. 4.1% 03/06/2026 USD 100,000 79,891 0.89 Wells Fargo & Co. 3% 23/10/2026 USD 50,000 37,556 0.42 Wells Fargo & Co. 4.4% 14/06/2046 USD 50,000 38,966 0.44 Williams Partners LP 4.875% 15/05/2023 USD 50,000 40,082 0.45 Zimmer Biomet Holdings, Inc. 2.425%
13/12/2026 EUR 100,000 91,418 1.02
4,957,395 55.53
Total Corporate Bonds 8,630,261 96.67
Mortgage and Asset Backed Securities
United States of AmericaUnited Airlines Pass Through Trust, Series
2013-1 ‘A’ 4.3% 15/02/2027 USD 87,724 72,005 0.81 United Airlines Pass Through Trust, Series
2014-1 ‘A’ 4% 11/10/2027 USD 44,387 35,791 0.40 US Airways Pass Through Trust, Series
2013-1 ‘A’ 3.95% 15/05/2027 USD 80,555 64,723 0.72
172,519 1.93
Total Mortgage and Asset Backed Securities 172,519 1.93
Total Transferable securities and money market instruments admitted to offi cial exchange listing or dealt in on another regulated market 8,802,780 98.60
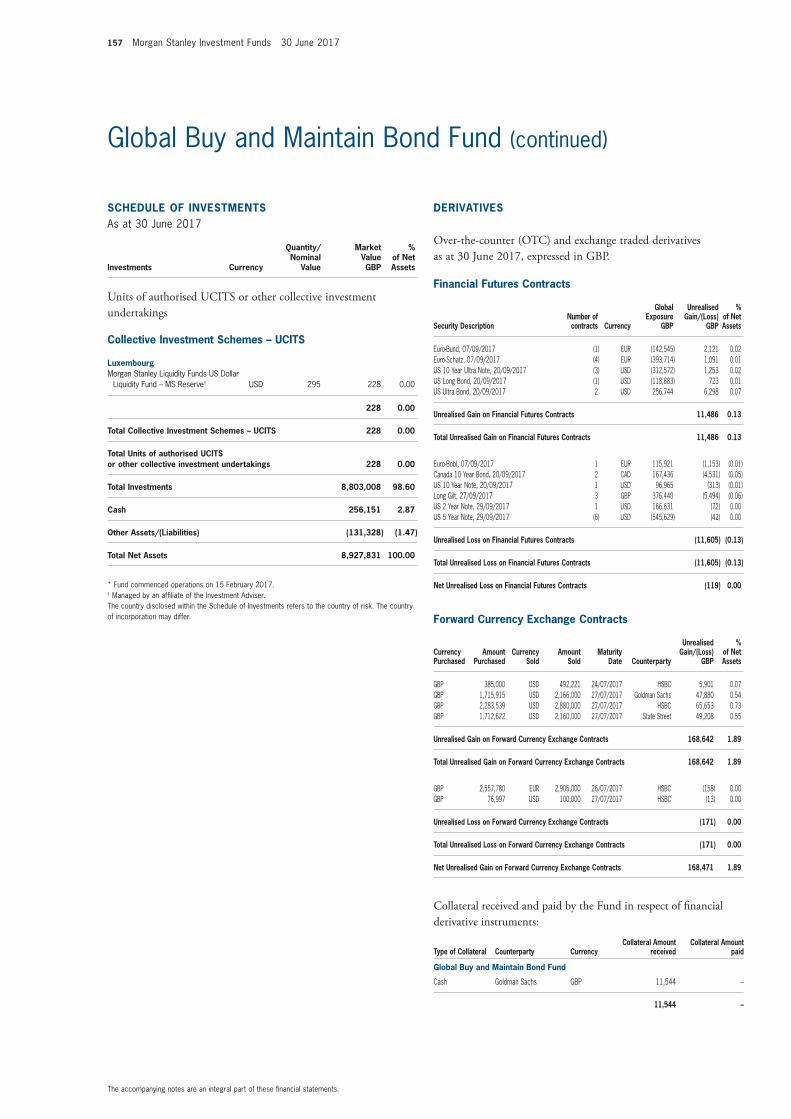
157 Morgan Stanley Investment Funds 30 June 2017
The accompanying notes are an integral part of these fi nancial statements.
Global Buy and Maintain Bond Fund (continued)
SCHEDULE OF INVESTMENTSAs at 30 June 2017
Investments Currency
Quantity/Nominal
Value
Market Value GBP
% of Net Assets
Units of authorised UCITS or other collective investment undertakings
Collective Investment Schemes – UCITS
LuxembourgMorgan Stanley Liquidity Funds US Dollar
Liquidity Fund – MS Reserve† USD 295 228 0.00
228 0.00
Total Collective Investment Schemes – UCITS 228 0.00
Total Units of authorised UCITS or other collective investment undertakings 228 0.00
Total Investments 8,803,008 98.60
Cash 256,151 2.87
Other Assets/(Liabilities) (131,328) (1.47)
Total Net Assets 8,927,831 100.00
* Fund commenced operations on 15 February 2017.† Managed by an affi liate of the Investment Adviser.The country disclosed within the Schedule of Investments refers to the country of risk. The country of incorporation may differ.
Financial Futures Contracts
Security DescriptionNumber of contracts Currency
Global Exposure
GBP
Unrealised Gain/(Loss)
GBP
% of Net Assets
Euro-Bund, 07/09/2017 (1) EUR (142,545) 2,121 0.02 Euro-Schatz, 07/09/2017 (4) EUR (393,714) 1,091 0.01 US 10 Year Ultra Note, 20/09/2017 (3) USD (312,572) 1,253 0.02 US Long Bond, 20/09/2017 (1) USD (118,883) 723 0.01 US Ultra Bond, 20/09/2017 2 USD 256,744 6,298 0.07
Unrealised Gain on Financial Futures Contracts 11,486 0.13
Total Unrealised Gain on Financial Futures Contracts 11,486 0.13
Euro-Bobl, 07/09/2017 1 EUR 115,921 (1,153) (0.01) Canada 10 Year Bond, 20/09/2017 2 CAD 167,436 (4,531) (0.05) US 10 Year Note, 20/09/2017 1 USD 96,965 (313) (0.01) Long Gilt, 27/09/2017 3 GBP 376,440 (5,494) (0.06) US 2 Year Note, 29/09/2017 1 USD 166,631 (72) 0.00 US 5 Year Note, 29/09/2017 (6) USD (545,629) (42) 0.00
Unrealised Loss on Financial Futures Contracts (11,605) (0.13)
Total Unrealised Loss on Financial Futures Contracts (11,605) (0.13)
Net Unrealised Loss on Financial Futures Contracts (119) 0.00
Forward Currency Exchange Contracts
Currency Purchased
Amount Purchased
Currency Sold
Amount Sold
Maturity Date Counterparty
Unrealised Gain/(Loss)
GBP
% of Net Assets
GBP 385,000 USD 492,221 24/07/2017 HSBC 5,901 0.07 GBP 1,715,915 USD 2,166,000 27/07/2017 Goldman Sachs 47,880 0.54 GBP 2,283,539 USD 2,880,000 27/07/2017 HSBC 65,653 0.73 GBP 1,712,622 USD 2,160,000 27/07/2017 State Street 49,208 0.55
Unrealised Gain on Forward Currency Exchange Contracts 168,642 1.89
Total Unrealised Gain on Forward Currency Exchange Contracts 168,642 1.89
GBP 2,557,780 EUR 2,905,000 26/07/2017 HSBC (158) 0.00 GBP 76,997 USD 100,000 27/07/2017 HSBC (13) 0.00
Unrealised Loss on Forward Currency Exchange Contracts (171) 0.00
Total Unrealised Loss on Forward Currency Exchange Contracts (171) 0.00
Net Unrealised Gain on Forward Currency Exchange Contracts 168,471 1.89
Collateral received and paid by the Fund in respect of fi nancial derivative instruments:
Type of Collateral Counterparty CurrencyCollateral Amount
receivedCollateral Amount
paid
Global Buy and Maintain Bond Fund
Cash Goldman Sachs GBP 11,544 –
11,544 –
DERIVATIVES
Over-the-counter (OTC) and exchange traded derivatives as at 30 June 2017, expressed in GBP.
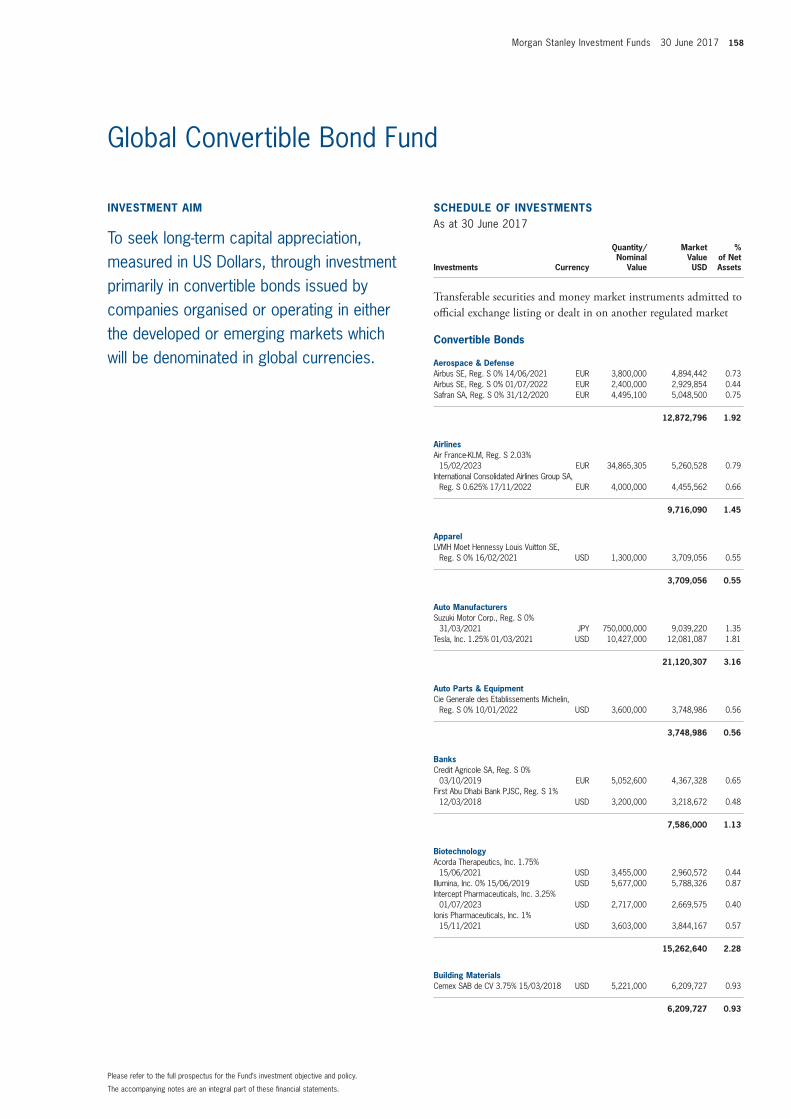
Morgan Stanley Investment Funds 30 June 2017 158
The accompanying notes are an integral part of these fi nancial statements.
Please refer to the full prospectus for the Fund’s investment objective and policy.
Global Convertible Bond Fund
INVESTMENT AIM
To seek long-term capital appreciation, measured in US Dollars, through investment primarily in convertible bonds issued by companies organised or operating in either the developed or emerging markets which will be denominated in global currencies.
SCHEDULE OF INVESTMENTSAs at 30 June 2017
Investments Currency
Quantity/Nominal
Value
Market Value USD
% of Net Assets
Transferable securities and money market instruments admitted to offi cial exchange listing or dealt in on another regulated market
Convertible Bonds
Aerospace & DefenseAirbus SE, Reg. S 0% 14/06/2021 EUR 3,800,000 4,894,442 0.73 Airbus SE, Reg. S 0% 01/07/2022 EUR 2,400,000 2,929,854 0.44 Safran SA, Reg. S 0% 31/12/2020 EUR 4,495,100 5,048,500 0.75
12,872,796 1.92
AirlinesAir France-KLM, Reg. S 2.03%
15/02/2023 EUR 34,865,305 5,260,528 0.79 International Consolidated Airlines Group SA,
Reg. S 0.625% 17/11/2022 EUR 4,000,000 4,455,562 0.66
9,716,090 1.45
ApparelLVMH Moet Hennessy Louis Vuitton SE,
Reg. S 0% 16/02/2021 USD 1,300,000 3,709,056 0.55
3,709,056 0.55
Auto ManufacturersSuzuki Motor Corp., Reg. S 0%
31/03/2021 JPY 750,000,000 9,039,220 1.35 Tesla, Inc. 1.25% 01/03/2021 USD 10,427,000 12,081,087 1.81
21,120,307 3.16
Auto Parts & EquipmentCie Generale des Etablissements Michelin,
Reg. S 0% 10/01/2022 USD 3,600,000 3,748,986 0.56
3,748,986 0.56
BanksCredit Agricole SA, Reg. S 0%
03/10/2019 EUR 5,052,600 4,367,328 0.65 First Abu Dhabi Bank PJSC, Reg. S 1%
12/03/2018 USD 3,200,000 3,218,672 0.48
7,586,000 1.13
BiotechnologyAcorda Therapeutics, Inc. 1.75%
15/06/2021 USD 3,455,000 2,960,572 0.44 Illumina, Inc. 0% 15/06/2019 USD 5,677,000 5,788,326 0.87 Intercept Pharmaceuticals, Inc. 3.25%
01/07/2023 USD 2,717,000 2,669,575 0.40 Ionis Pharmaceuticals, Inc. 1%
15/11/2021 USD 3,603,000 3,844,167 0.57
15,262,640 2.28
Building MaterialsCemex SAB de CV 3.75% 15/03/2018 USD 5,221,000 6,209,727 0.93
6,209,727 0.93
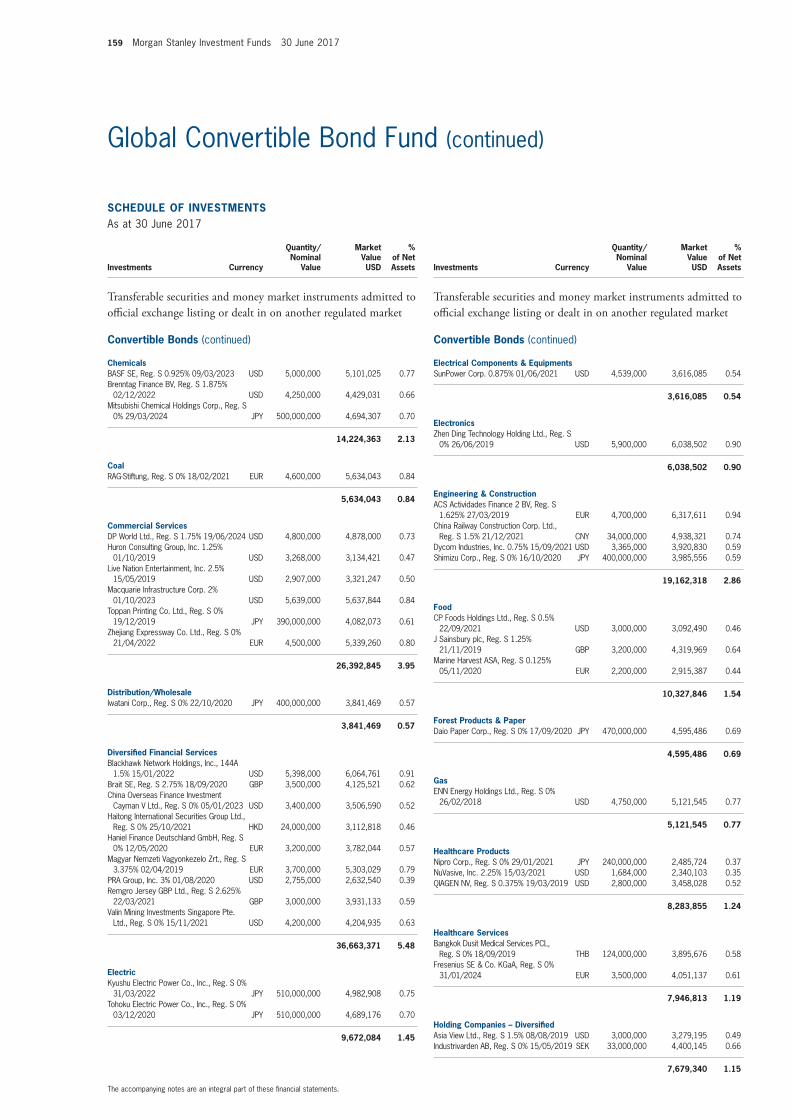
159 Morgan Stanley Investment Funds 30 June 2017
The accompanying notes are an integral part of these fi nancial statements.
Global Convertible Bond Fund (continued)
SCHEDULE OF INVESTMENTSAs at 30 June 2017
Investments Currency
Quantity/Nominal
Value
Market Value USD
% of Net Assets
Transferable securities and money market instruments admitted to offi cial exchange listing or dealt in on another regulated market
Convertible Bonds (continued)
ChemicalsBASF SE, Reg. S 0.925% 09/03/2023 USD 5,000,000 5,101,025 0.77 Brenntag Finance BV, Reg. S 1.875%
02/12/2022 USD 4,250,000 4,429,031 0.66 Mitsubishi Chemical Holdings Corp., Reg. S
0% 29/03/2024 JPY 500,000,000 4,694,307 0.70
14,224,363 2.13
CoalRAG-Stiftung, Reg. S 0% 18/02/2021 EUR 4,600,000 5,634,043 0.84
5,634,043 0.84
Commercial ServicesDP World Ltd., Reg. S 1.75% 19/06/2024 USD 4,800,000 4,878,000 0.73 Huron Consulting Group, Inc. 1.25%
01/10/2019 USD 3,268,000 3,134,421 0.47 Live Nation Entertainment, Inc. 2.5%
15/05/2019 USD 2,907,000 3,321,247 0.50 Macquarie Infrastructure Corp. 2%
01/10/2023 USD 5,639,000 5,637,844 0.84 Toppan Printing Co. Ltd., Reg. S 0%
19/12/2019 JPY 390,000,000 4,082,073 0.61 Zhejiang Expressway Co. Ltd., Reg. S 0%
21/04/2022 EUR 4,500,000 5,339,260 0.80
26,392,845 3.95
Distribution/WholesaleIwatani Corp., Reg. S 0% 22/10/2020 JPY 400,000,000 3,841,469 0.57
3,841,469 0.57
Diversifi ed Financial ServicesBlackhawk Network Holdings, Inc., 144A
1.5% 15/01/2022 USD 5,398,000 6,064,761 0.91 Brait SE, Reg. S 2.75% 18/09/2020 GBP 3,500,000 4,125,521 0.62 China Overseas Finance Investment
Cayman V Ltd., Reg. S 0% 05/01/2023 USD 3,400,000 3,506,590 0.52 Haitong International Securities Group Ltd.,
Reg. S 0% 25/10/2021 HKD 24,000,000 3,112,818 0.46 Haniel Finance Deutschland GmbH, Reg. S
0% 12/05/2020 EUR 3,200,000 3,782,044 0.57 Magyar Nemzeti Vagyonkezelo Zrt., Reg. S
3.375% 02/04/2019 EUR 3,700,000 5,303,029 0.79 PRA Group, Inc. 3% 01/08/2020 USD 2,755,000 2,632,540 0.39 Remgro Jersey GBP Ltd., Reg. S 2.625%
22/03/2021 GBP 3,000,000 3,931,133 0.59 Valin Mining Investments Singapore Pte.
Ltd., Reg. S 0% 15/11/2021 USD 4,200,000 4,204,935 0.63
36,663,371 5.48
ElectricKyushu Electric Power Co., Inc., Reg. S 0%
31/03/2022 JPY 510,000,000 4,982,908 0.75 Tohoku Electric Power Co., Inc., Reg. S 0%
03/12/2020 JPY 510,000,000 4,689,176 0.70
9,672,084 1.45
SCHEDULE OF INVESTMENTSAs at 30 June 2017
Investments Currency
Quantity/Nominal
Value
Market Value USD
% of Net Assets
Transferable securities and money market instruments admitted to offi cial exchange listing or dealt in on another regulated market
Convertible Bonds (continued)
Electrical Components & EquipmentsSunPower Corp. 0.875% 01/06/2021 USD 4,539,000 3,616,085 0.54
3,616,085 0.54
ElectronicsZhen Ding Technology Holding Ltd., Reg. S
0% 26/06/2019 USD 5,900,000 6,038,502 0.90
6,038,502 0.90
Engineering & ConstructionACS Actividades Finance 2 BV, Reg. S
1.625% 27/03/2019 EUR 4,700,000 6,317,611 0.94 China Railway Construction Corp. Ltd.,
Reg. S 1.5% 21/12/2021 CNY 34,000,000 4,938,321 0.74 Dycom Industries, Inc. 0.75% 15/09/2021 USD 3,365,000 3,920,830 0.59 Shimizu Corp., Reg. S 0% 16/10/2020 JPY 400,000,000 3,985,556 0.59
19,162,318 2.86
FoodCP Foods Holdings Ltd., Reg. S 0.5%
22/09/2021 USD 3,000,000 3,092,490 0.46 J Sainsbury plc, Reg. S 1.25%
21/11/2019 GBP 3,200,000 4,319,969 0.64 Marine Harvest ASA, Reg. S 0.125%
05/11/2020 EUR 2,200,000 2,915,387 0.44
10,327,846 1.54
Forest Products & PaperDaio Paper Corp., Reg. S 0% 17/09/2020 JPY 470,000,000 4,595,486 0.69
4,595,486 0.69
GasENN Energy Holdings Ltd., Reg. S 0%
26/02/2018 USD 4,750,000 5,121,545 0.77
5,121,545 0.77
Healthcare ProductsNipro Corp., Reg. S 0% 29/01/2021 JPY 240,000,000 2,485,724 0.37 NuVasive, Inc. 2.25% 15/03/2021 USD 1,684,000 2,340,103 0.35 QIAGEN NV, Reg. S 0.375% 19/03/2019 USD 2,800,000 3,458,028 0.52
8,283,855 1.24
Healthcare ServicesBangkok Dusit Medical Services PCL,
Reg. S 0% 18/09/2019 THB 124,000,000 3,895,676 0.58 Fresenius SE & Co. KGaA, Reg. S 0%
31/01/2024 EUR 3,500,000 4,051,137 0.61
7,946,813 1.19
Holding Companies – Diversifi edAsia View Ltd., Reg. S 1.5% 08/08/2019 USD 3,000,000 3,279,195 0.49 Industrivarden AB, Reg. S 0% 15/05/2019 SEK 33,000,000 4,400,145 0.66
7,679,340 1.15
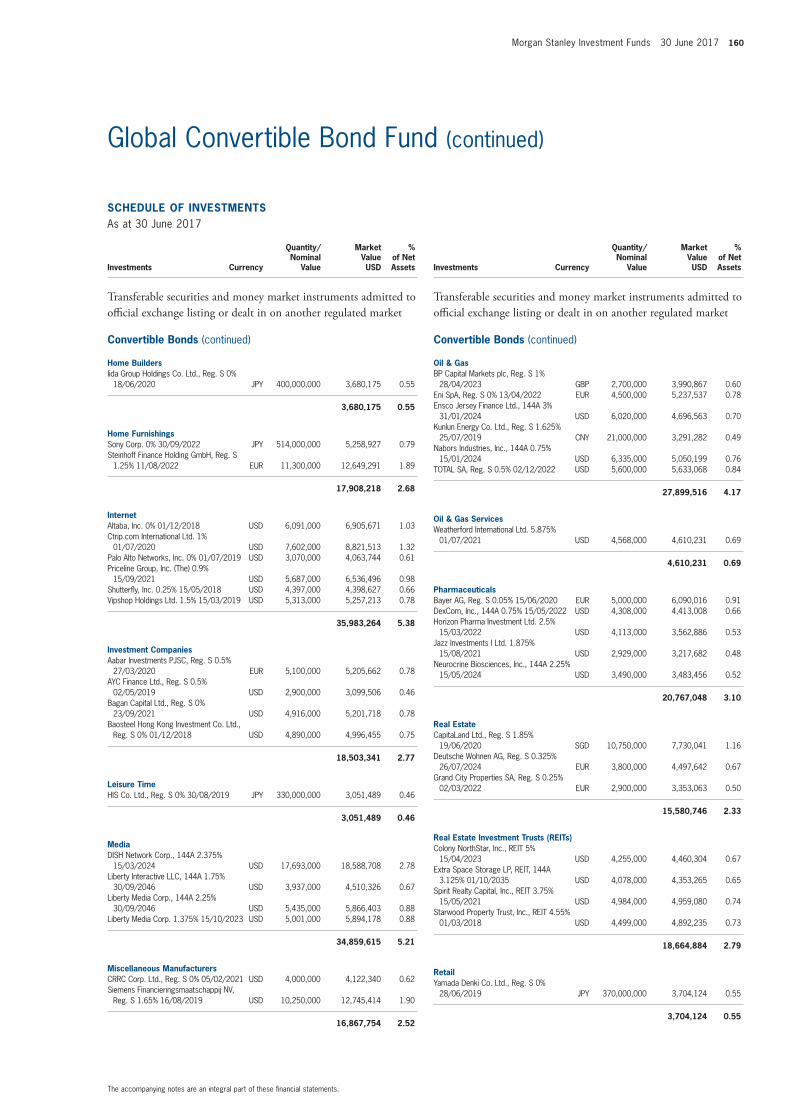
Morgan Stanley Investment Funds 30 June 2017 160
The accompanying notes are an integral part of these fi nancial statements.
Global Convertible Bond Fund (continued)
SCHEDULE OF INVESTMENTSAs at 30 June 2017
Investments Currency
Quantity/Nominal
Value
Market Value USD
% of Net Assets
Transferable securities and money market instruments admitted to offi cial exchange listing or dealt in on another regulated market
Convertible Bonds (continued)
Home BuildersIida Group Holdings Co. Ltd., Reg. S 0%
18/06/2020 JPY 400,000,000 3,680,175 0.55
3,680,175 0.55
Home FurnishingsSony Corp. 0% 30/09/2022 JPY 514,000,000 5,258,927 0.79 Steinhoff Finance Holding GmbH, Reg. S
1.25% 11/08/2022 EUR 11,300,000 12,649,291 1.89
17,908,218 2.68
InternetAltaba, Inc. 0% 01/12/2018 USD 6,091,000 6,905,671 1.03 Ctrip.com International Ltd. 1%
01/07/2020 USD 7,602,000 8,821,513 1.32 Palo Alto Networks, Inc. 0% 01/07/2019 USD 3,070,000 4,063,744 0.61 Priceline Group, Inc. (The) 0.9%
15/09/2021 USD 5,687,000 6,536,496 0.98 Shutterfl y, Inc. 0.25% 15/05/2018 USD 4,397,000 4,398,627 0.66 Vipshop Holdings Ltd. 1.5% 15/03/2019 USD 5,313,000 5,257,213 0.78
35,983,264 5.38
Investment CompaniesAabar Investments PJSC, Reg. S 0.5%
27/03/2020 EUR 5,100,000 5,205,662 0.78 AYC Finance Ltd., Reg. S 0.5%
02/05/2019 USD 2,900,000 3,099,506 0.46 Bagan Capital Ltd., Reg. S 0%
23/09/2021 USD 4,916,000 5,201,718 0.78 Baosteel Hong Kong Investment Co. Ltd.,
Reg. S 0% 01/12/2018 USD 4,890,000 4,996,455 0.75
18,503,341 2.77
Leisure TimeHIS Co. Ltd., Reg. S 0% 30/08/2019 JPY 330,000,000 3,051,489 0.46
3,051,489 0.46
MediaDISH Network Corp., 144A 2.375%
15/03/2024 USD 17,693,000 18,588,708 2.78 Liberty Interactive LLC, 144A 1.75%
30/09/2046 USD 3,937,000 4,510,326 0.67 Liberty Media Corp., 144A 2.25%
30/09/2046 USD 5,435,000 5,866,403 0.88 Liberty Media Corp. 1.375% 15/10/2023 USD 5,001,000 5,894,178 0.88
34,859,615 5.21
Miscellaneous ManufacturersCRRC Corp. Ltd., Reg. S 0% 05/02/2021 USD 4,000,000 4,122,340 0.62 Siemens Financieringsmaatschappij NV,
Reg. S 1.65% 16/08/2019 USD 10,250,000 12,745,414 1.90
16,867,754 2.52
SCHEDULE OF INVESTMENTSAs at 30 June 2017
Investments Currency
Quantity/Nominal
Value
Market Value USD
% of Net Assets
Transferable securities and money market instruments admitted to offi cial exchange listing or dealt in on another regulated market
Convertible Bonds (continued)
Oil & GasBP Capital Markets plc, Reg. S 1%
28/04/2023 GBP 2,700,000 3,990,867 0.60 Eni SpA, Reg. S 0% 13/04/2022 EUR 4,500,000 5,237,537 0.78 Ensco Jersey Finance Ltd., 144A 3%
31/01/2024 USD 6,020,000 4,696,563 0.70 Kunlun Energy Co. Ltd., Reg. S 1.625%
25/07/2019 CNY 21,000,000 3,291,282 0.49 Nabors Industries, Inc., 144A 0.75%
15/01/2024 USD 6,335,000 5,050,199 0.76 TOTAL SA, Reg. S 0.5% 02/12/2022 USD 5,600,000 5,633,068 0.84
27,899,516 4.17
Oil & Gas ServicesWeatherford International Ltd. 5.875%
01/07/2021 USD 4,568,000 4,610,231 0.69
4,610,231 0.69
PharmaceuticalsBayer AG, Reg. S 0.05% 15/06/2020 EUR 5,000,000 6,090,016 0.91 DexCom, Inc., 144A 0.75% 15/05/2022 USD 4,308,000 4,413,008 0.66 Horizon Pharma Investment Ltd. 2.5%
15/03/2022 USD 4,113,000 3,562,886 0.53 Jazz Investments I Ltd. 1.875%
15/08/2021 USD 2,929,000 3,217,682 0.48 Neurocrine Biosciences, Inc., 144A 2.25%
15/05/2024 USD 3,490,000 3,483,456 0.52
20,767,048 3.10
Real EstateCapitaLand Ltd., Reg. S 1.85%
19/06/2020 SGD 10,750,000 7,730,041 1.16 Deutsche Wohnen AG, Reg. S 0.325%
26/07/2024 EUR 3,800,000 4,497,642 0.67 Grand City Properties SA, Reg. S 0.25%
02/03/2022 EUR 2,900,000 3,353,063 0.50
15,580,746 2.33
Real Estate Investment Trusts (REITs)Colony NorthStar, Inc., REIT 5%
15/04/2023 USD 4,255,000 4,460,304 0.67 Extra Space Storage LP, REIT, 144A
3.125% 01/10/2035 USD 4,078,000 4,353,265 0.65 Spirit Realty Capital, Inc., REIT 3.75%
15/05/2021 USD 4,984,000 4,959,080 0.74 Starwood Property Trust, Inc., REIT 4.55%
01/03/2018 USD 4,499,000 4,892,235 0.73
18,664,884 2.79
RetailYamada Denki Co. Ltd., Reg. S 0%
28/06/2019 JPY 370,000,000 3,704,124 0.55
3,704,124 0.55
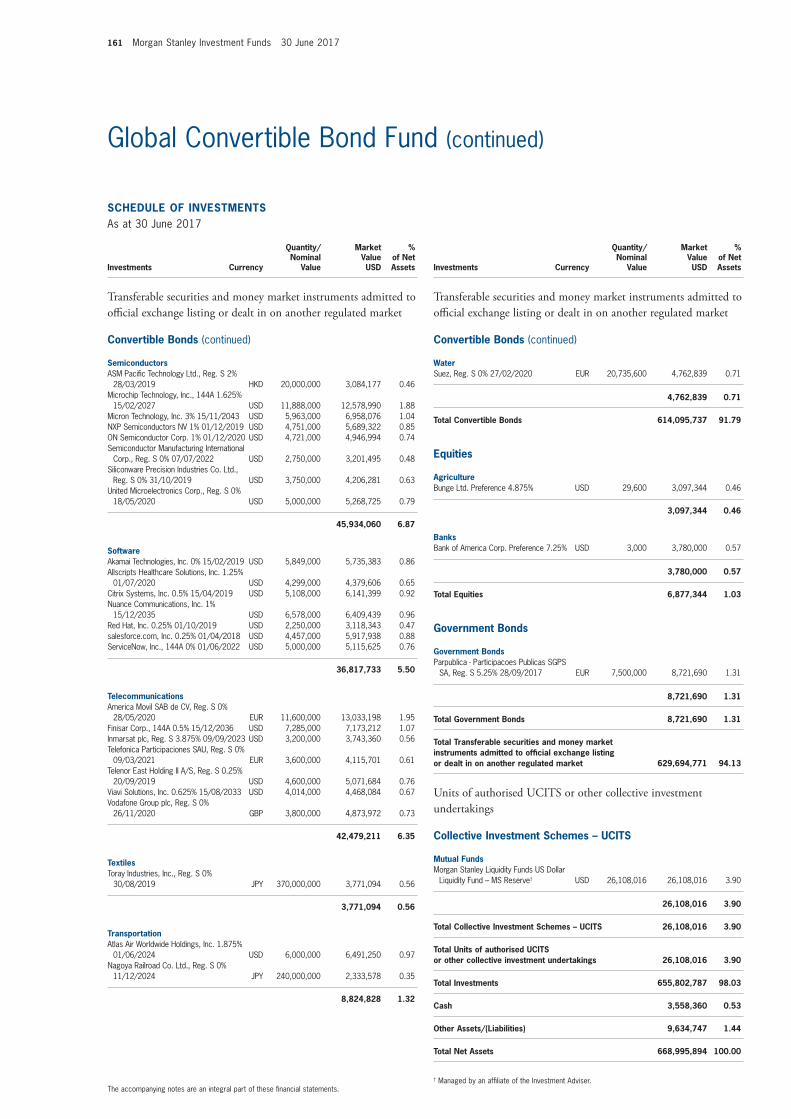
161 Morgan Stanley Investment Funds 30 June 2017
The accompanying notes are an integral part of these fi nancial statements.
Global Convertible Bond Fund (continued)
SCHEDULE OF INVESTMENTSAs at 30 June 2017
Investments Currency
Quantity/Nominal
Value
Market Value USD
% of Net Assets
Transferable securities and money market instruments admitted to offi cial exchange listing or dealt in on another regulated market
Convertible Bonds (continued)
SemiconductorsASM Pacifi c Technology Ltd., Reg. S 2%
28/03/2019 HKD 20,000,000 3,084,177 0.46 Microchip Technology, Inc., 144A 1.625%
15/02/2027 USD 11,888,000 12,578,990 1.88 Micron Technology, Inc. 3% 15/11/2043 USD 5,963,000 6,958,076 1.04 NXP Semiconductors NV 1% 01/12/2019 USD 4,751,000 5,689,322 0.85 ON Semiconductor Corp. 1% 01/12/2020 USD 4,721,000 4,946,994 0.74 Semiconductor Manufacturing International
Corp., Reg. S 0% 07/07/2022 USD 2,750,000 3,201,495 0.48 Siliconware Precision Industries Co. Ltd.,
Reg. S 0% 31/10/2019 USD 3,750,000 4,206,281 0.63 United Microelectronics Corp., Reg. S 0%
18/05/2020 USD 5,000,000 5,268,725 0.79
45,934,060 6.87
SoftwareAkamai Technologies, Inc. 0% 15/02/2019 USD 5,849,000 5,735,383 0.86 Allscripts Healthcare Solutions, Inc. 1.25%
01/07/2020 USD 4,299,000 4,379,606 0.65 Citrix Systems, Inc. 0.5% 15/04/2019 USD 5,108,000 6,141,399 0.92 Nuance Communications, Inc. 1%
15/12/2035 USD 6,578,000 6,409,439 0.96 Red Hat, Inc. 0.25% 01/10/2019 USD 2,250,000 3,118,343 0.47 salesforce.com, Inc. 0.25% 01/04/2018 USD 4,457,000 5,917,938 0.88 ServiceNow, Inc., 144A 0% 01/06/2022 USD 5,000,000 5,115,625 0.76
36,817,733 5.50
TelecommunicationsAmerica Movil SAB de CV, Reg. S 0%
28/05/2020 EUR 11,600,000 13,033,198 1.95 Finisar Corp., 144A 0.5% 15/12/2036 USD 7,285,000 7,173,212 1.07 Inmarsat plc, Reg. S 3.875% 09/09/2023 USD 3,200,000 3,743,360 0.56 Telefonica Participaciones SAU, Reg. S 0%
09/03/2021 EUR 3,600,000 4,115,701 0.61 Telenor East Holding II A/S, Reg. S 0.25%
20/09/2019 USD 4,600,000 5,071,684 0.76 Viavi Solutions, Inc. 0.625% 15/08/2033 USD 4,014,000 4,468,084 0.67 Vodafone Group plc, Reg. S 0%
26/11/2020 GBP 3,800,000 4,873,972 0.73
42,479,211 6.35
TextilesToray Industries, Inc., Reg. S 0%
30/08/2019 JPY 370,000,000 3,771,094 0.56
3,771,094 0.56
TransportationAtlas Air Worldwide Holdings, Inc. 1.875%
01/06/2024 USD 6,000,000 6,491,250 0.97 Nagoya Railroad Co. Ltd., Reg. S 0%
11/12/2024 JPY 240,000,000 2,333,578 0.35
8,824,828 1.32
SCHEDULE OF INVESTMENTSAs at 30 June 2017
Investments Currency
Quantity/Nominal
Value
Market Value USD
% of Net Assets
Transferable securities and money market instruments admitted to offi cial exchange listing or dealt in on another regulated market
Convertible Bonds (continued)
WaterSuez, Reg. S 0% 27/02/2020 EUR 20,735,600 4,762,839 0.71
4,762,839 0.71
Total Convertible Bonds 614,095,737 91.79
Equities
AgricultureBunge Ltd. Preference 4.875% USD 29,600 3,097,344 0.46
3,097,344 0.46
BanksBank of America Corp. Preference 7.25% USD 3,000 3,780,000 0.57
3,780,000 0.57
Total Equities 6,877,344 1.03
Government Bonds
Government BondsParpublica - Participacoes Publicas SGPS
SA, Reg. S 5.25% 28/09/2017 EUR 7,500,000 8,721,690 1.31
8,721,690 1.31
Total Government Bonds 8,721,690 1.31
Total Transferable securities and money market instruments admitted to offi cial exchange listing or dealt in on another regulated market 629,694,771 94.13
Units of authorised UCITS or other collective investment undertakings
Collective Investment Schemes – UCITS
Mutual FundsMorgan Stanley Liquidity Funds US Dollar
Liquidity Fund – MS Reserve† USD 26,108,016 26,108,016 3.90
26,108,016 3.90
Total Collective Investment Schemes – UCITS 26,108,016 3.90
Total Units of authorised UCITS or other collective investment undertakings 26,108,016 3.90
Total Investments 655,802,787 98.03
Cash 3,558,360 0.53
Other Assets/(Liabilities) 9,634,747 1.44
Total Net Assets 668,995,894 100.00
† Managed by an affi liate of the Investment Adviser.
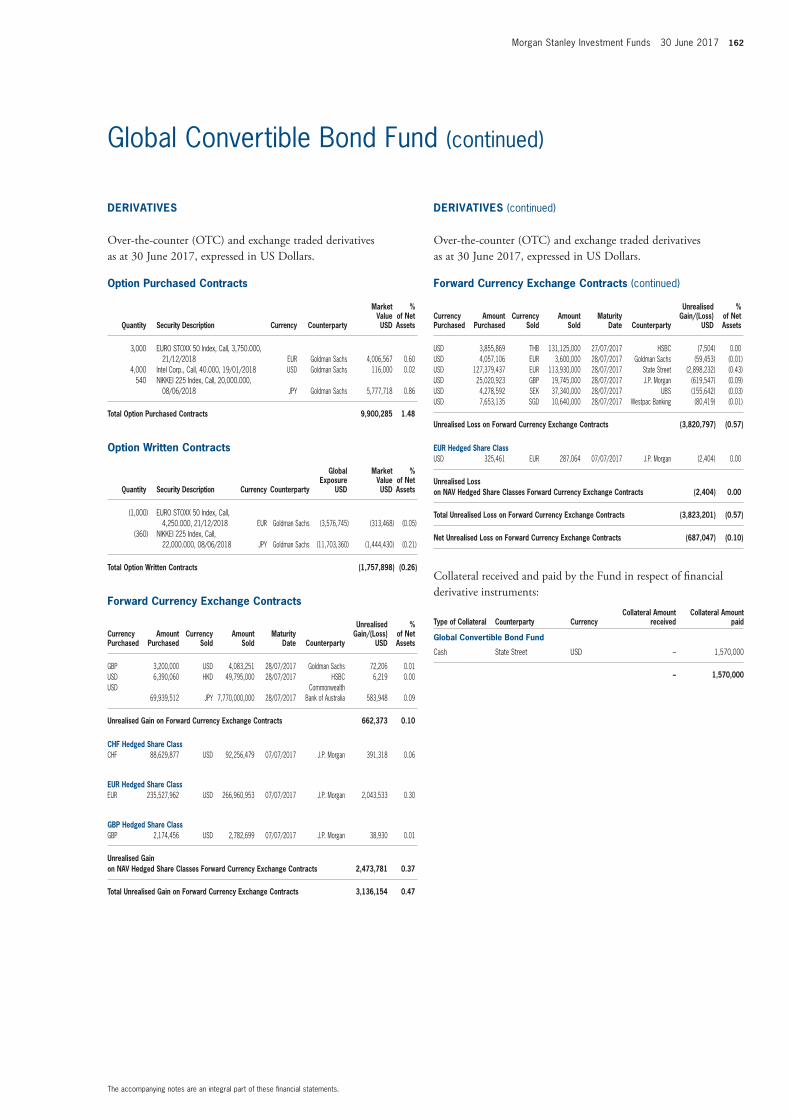
Morgan Stanley Investment Funds 30 June 2017 162
The accompanying notes are an integral part of these fi nancial statements.
Global Convertible Bond Fund (continued)
Option Purchased Contracts
Quantity Security Description Currency Counterparty
Market Value USD
% of Net Assets
3,000 EURO STOXX 50 Index, Call, 3,750.000, 21/12/2018 EUR Goldman Sachs 4,006,567 0.60
4,000 Intel Corp., Call, 40.000, 19/01/2018 USD Goldman Sachs 116,000 0.02 540 NIKKEI 225 Index, Call, 20,000.000,
08/06/2018 JPY Goldman Sachs 5,777,718 0.86
Total Option Purchased Contracts 9,900,285 1.48
Option Written Contracts
Quantity Security Description Currency Counterparty
Global Exposure
USD
Market Value USD
% of Net Assets
(1,000) EURO STOXX 50 Index, Call, 4,250.000, 21/12/2018 EUR Goldman Sachs (3,576,745) (313,468) (0.05)
(360) NIKKEI 225 Index, Call, 22,000.000, 08/06/2018 JPY Goldman Sachs (11,703,360) (1,444,430) (0.21)
Total Option Written Contracts (1,757,898) (0.26)
Forward Currency Exchange Contracts (continued)
Currency Purchased
Amount Purchased
Currency Sold
Amount Sold
Maturity Date Counterparty
Unrealised Gain/(Loss)
USD
% of Net Assets
GBP 3,200,000 USD 4,083,251 28/07/2017 Goldman Sachs 72,206 0.01 USD 6,390,060 HKD 49,795,000 28/07/2017 HSBC 6,219 0.00 USD
69,939,512 JPY 7,770,000,000 28/07/2017Commonwealth
Bank of Australia 583,948 0.09
Unrealised Gain on Forward Currency Exchange Contracts 662,373 0.10
CHF Hedged Share ClassCHF 88,629,877 USD 92,256,479 07/07/2017 J.P. Morgan 391,318 0.06
EUR Hedged Share ClassEUR 235,527,962 USD 266,960,953 07/07/2017 J.P. Morgan 2,043,533 0.30
GBP Hedged Share ClassGBP 2,174,456 USD 2,782,699 07/07/2017 J.P. Morgan 38,930 0.01
Unrealised Gain on NAV Hedged Share Classes Forward Currency Exchange Contracts 2,473,781 0.37
Total Unrealised Gain on Forward Currency Exchange Contracts 3,136,154 0.47
Forward Currency Exchange Contracts (continued)
Currency Purchased
Amount Purchased
Currency Sold
Amount Sold
Maturity Date Counterparty
Unrealised Gain/(Loss)
USD
% of Net Assets
USD 3,855,869 THB 131,125,000 27/07/2017 HSBC (7,504) 0.00 USD 4,057,106 EUR 3,600,000 28/07/2017 Goldman Sachs (59,453) (0.01) USD 127,379,437 EUR 113,930,000 28/07/2017 State Street (2,898,232) (0.43) USD 25,020,923 GBP 19,745,000 28/07/2017 J.P. Morgan (619,547) (0.09) USD 4,278,592 SEK 37,340,000 28/07/2017 UBS (155,642) (0.03) USD 7,653,135 SGD 10,640,000 28/07/2017 Westpac Banking (80,419) (0.01)
Unrealised Loss on Forward Currency Exchange Contracts (3,820,797) (0.57)
EUR Hedged Share ClassUSD 325,461 EUR 287,064 07/07/2017 J.P. Morgan (2,404) 0.00
Unrealised Loss on NAV Hedged Share Classes Forward Currency Exchange Contracts (2,404) 0.00
Total Unrealised Loss on Forward Currency Exchange Contracts (3,823,201) (0.57)
Net Unrealised Loss on Forward Currency Exchange Contracts (687,047) (0.10)
Collateral received and paid by the Fund in respect of fi nancial derivative instruments:
Type of Collateral Counterparty CurrencyCollateral Amount
receivedCollateral Amount
paid
Global Convertible Bond Fund
Cash State Street USD – 1,570,000
– 1,570,000
DERIVATIVES
Over-the-counter (OTC) and exchange traded derivatives as at 30 June 2017, expressed in US Dollars.
DERIVATIVES (continued)
Over-the-counter (OTC) and exchange traded derivatives as at 30 June 2017, expressed in US Dollars.
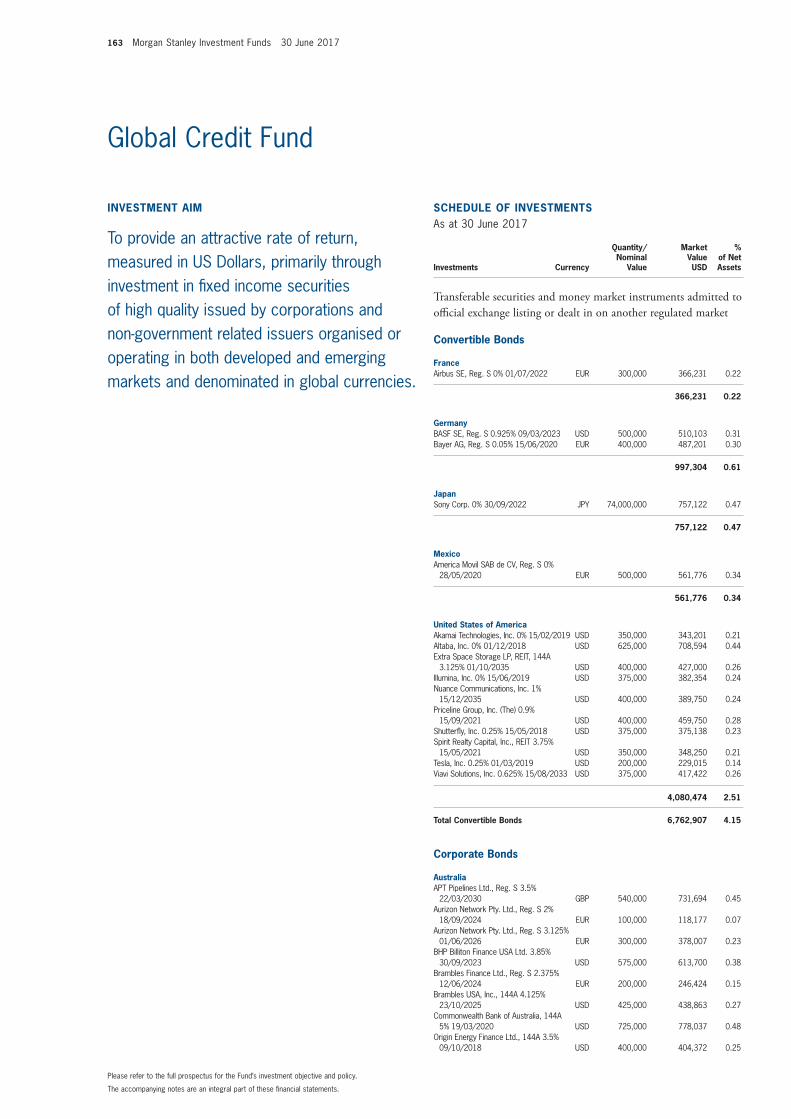
163 Morgan Stanley Investment Funds 30 June 2017
The accompanying notes are an integral part of these fi nancial statements.
Please refer to the full prospectus for the Fund’s investment objective and policy.
INVESTMENT AIM
To provide an attractive rate of return, measured in US Dollars, primarily through investment in fi xed income securities of high quality issued by corporations and non-government related issuers organised or operating in both developed and emerging markets and denominated in global currencies.
SCHEDULE OF INVESTMENTSAs at 30 June 2017
Investments Currency
Quantity/Nominal
Value
Market Value USD
% of Net Assets
Transferable securities and money market instruments admitted to offi cial exchange listing or dealt in on another regulated market
Convertible Bonds
FranceAirbus SE, Reg. S 0% 01/07/2022 EUR 300,000 366,231 0.22
366,231 0.22
GermanyBASF SE, Reg. S 0.925% 09/03/2023 USD 500,000 510,103 0.31 Bayer AG, Reg. S 0.05% 15/06/2020 EUR 400,000 487,201 0.30
997,304 0.61
JapanSony Corp. 0% 30/09/2022 JPY 74,000,000 757,122 0.47
757,122 0.47
MexicoAmerica Movil SAB de CV, Reg. S 0%
28/05/2020 EUR 500,000 561,776 0.34
561,776 0.34
United States of AmericaAkamai Technologies, Inc. 0% 15/02/2019 USD 350,000 343,201 0.21 Altaba, Inc. 0% 01/12/2018 USD 625,000 708,594 0.44 Extra Space Storage LP, REIT, 144A
3.125% 01/10/2035 USD 400,000 427,000 0.26 Illumina, Inc. 0% 15/06/2019 USD 375,000 382,354 0.24 Nuance Communications, Inc. 1%
15/12/2035 USD 400,000 389,750 0.24 Priceline Group, Inc. (The) 0.9%
15/09/2021 USD 400,000 459,750 0.28 Shutterfl y, Inc. 0.25% 15/05/2018 USD 375,000 375,138 0.23 Spirit Realty Capital, Inc., REIT 3.75%
15/05/2021 USD 350,000 348,250 0.21 Tesla, Inc. 0.25% 01/03/2019 USD 200,000 229,015 0.14 Viavi Solutions, Inc. 0.625% 15/08/2033 USD 375,000 417,422 0.26
4,080,474 2.51
Total Convertible Bonds 6,762,907 4.15
Corporate Bonds
AustraliaAPT Pipelines Ltd., Reg. S 3.5%
22/03/2030 GBP 540,000 731,694 0.45 Aurizon Network Pty. Ltd., Reg. S 2%
18/09/2024 EUR 100,000 118,177 0.07 Aurizon Network Pty. Ltd., Reg. S 3.125%
01/06/2026 EUR 300,000 378,007 0.23 BHP Billiton Finance USA Ltd. 3.85%
30/09/2023 USD 575,000 613,700 0.38 Brambles Finance Ltd., Reg. S 2.375%
12/06/2024 EUR 200,000 246,424 0.15 Brambles USA, Inc., 144A 4.125%
23/10/2025 USD 425,000 438,863 0.27 Commonwealth Bank of Australia, 144A
5% 19/03/2020 USD 725,000 778,037 0.48 Origin Energy Finance Ltd., 144A 3.5%
09/10/2018 USD 400,000 404,372 0.25
Global Credit Fund
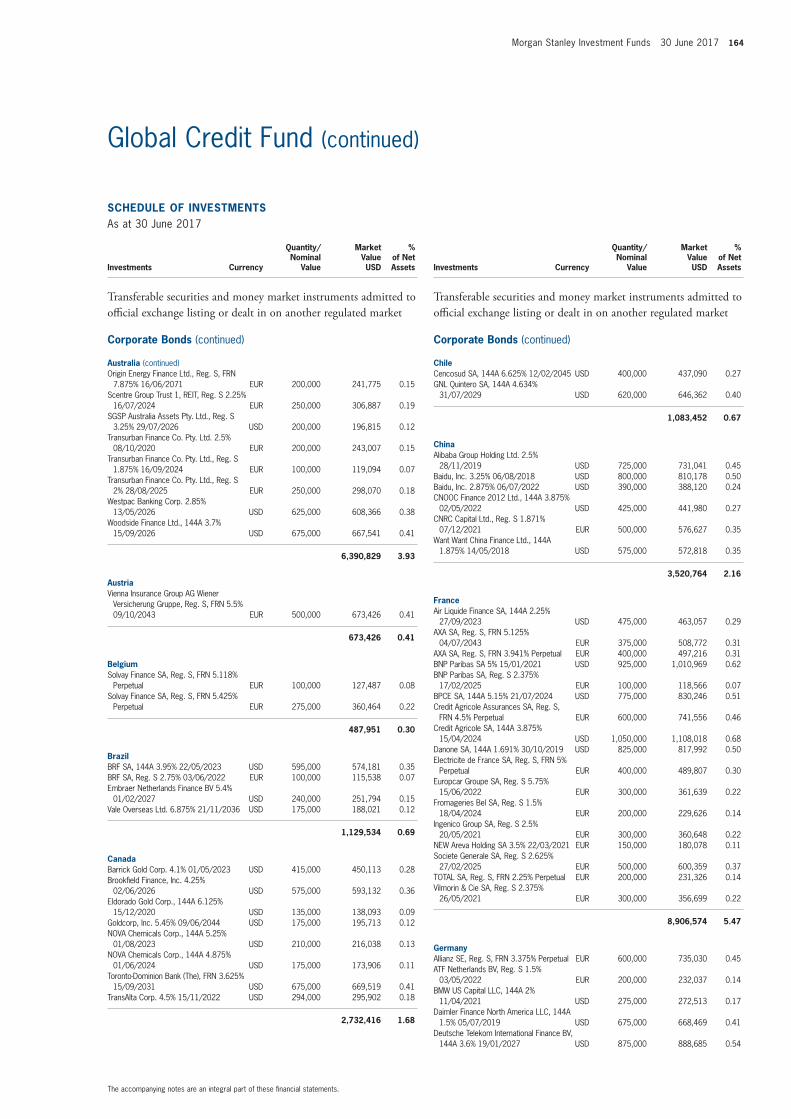
Morgan Stanley Investment Funds 30 June 2017 164
The accompanying notes are an integral part of these fi nancial statements.
Global Credit Fund (continued)
SCHEDULE OF INVESTMENTSAs at 30 June 2017
Investments Currency
Quantity/Nominal
Value
Market Value USD
% of Net Assets
Transferable securities and money market instruments admitted to offi cial exchange listing or dealt in on another regulated market
Corporate Bonds (continued)
Australia (continued)Origin Energy Finance Ltd., Reg. S, FRN
7.875% 16/06/2071 EUR 200,000 241,775 0.15 Scentre Group Trust 1, REIT, Reg. S 2.25%
16/07/2024 EUR 250,000 306,887 0.19 SGSP Australia Assets Pty. Ltd., Reg. S
3.25% 29/07/2026 USD 200,000 196,815 0.12 Transurban Finance Co. Pty. Ltd. 2.5%
08/10/2020 EUR 200,000 243,007 0.15 Transurban Finance Co. Pty. Ltd., Reg. S
1.875% 16/09/2024 EUR 100,000 119,094 0.07 Transurban Finance Co. Pty. Ltd., Reg. S
2% 28/08/2025 EUR 250,000 298,070 0.18 Westpac Banking Corp. 2.85%
13/05/2026 USD 625,000 608,366 0.38 Woodside Finance Ltd., 144A 3.7%
15/09/2026 USD 675,000 667,541 0.41
6,390,829 3.93
AustriaVienna Insurance Group AG Wiener
Versicherung Gruppe, Reg. S, FRN 5.5% 09/10/2043 EUR 500,000 673,426 0.41
673,426 0.41
BelgiumSolvay Finance SA, Reg. S, FRN 5.118%
Perpetual EUR 100,000 127,487 0.08 Solvay Finance SA, Reg. S, FRN 5.425%
Perpetual EUR 275,000 360,464 0.22
487,951 0.30
BrazilBRF SA, 144A 3.95% 22/05/2023 USD 595,000 574,181 0.35 BRF SA, Reg. S 2.75% 03/06/2022 EUR 100,000 115,538 0.07 Embraer Netherlands Finance BV 5.4%
01/02/2027 USD 240,000 251,794 0.15 Vale Overseas Ltd. 6.875% 21/11/2036 USD 175,000 188,021 0.12
1,129,534 0.69
CanadaBarrick Gold Corp. 4.1% 01/05/2023 USD 415,000 450,113 0.28 Brookfi eld Finance, Inc. 4.25%
02/06/2026 USD 575,000 593,132 0.36 Eldorado Gold Corp., 144A 6.125%
15/12/2020 USD 135,000 138,093 0.09 Goldcorp, Inc. 5.45% 09/06/2044 USD 175,000 195,713 0.12 NOVA Chemicals Corp., 144A 5.25%
01/08/2023 USD 210,000 216,038 0.13 NOVA Chemicals Corp., 144A 4.875%
01/06/2024 USD 175,000 173,906 0.11 Toronto-Dominion Bank (The), FRN 3.625%
15/09/2031 USD 675,000 669,519 0.41 TransAlta Corp. 4.5% 15/11/2022 USD 294,000 295,902 0.18
2,732,416 1.68
SCHEDULE OF INVESTMENTSAs at 30 June 2017
Investments Currency
Quantity/Nominal
Value
Market Value USD
% of Net Assets
Transferable securities and money market instruments admitted to offi cial exchange listing or dealt in on another regulated market
Corporate Bonds (continued)
ChileCencosud SA, 144A 6.625% 12/02/2045 USD 400,000 437,090 0.27 GNL Quintero SA, 144A 4.634%
31/07/2029 USD 620,000 646,362 0.40
1,083,452 0.67
ChinaAlibaba Group Holding Ltd. 2.5%
28/11/2019 USD 725,000 731,041 0.45 Baidu, Inc. 3.25% 06/08/2018 USD 800,000 810,178 0.50 Baidu, Inc. 2.875% 06/07/2022 USD 390,000 388,120 0.24 CNOOC Finance 2012 Ltd., 144A 3.875%
02/05/2022 USD 425,000 441,980 0.27 CNRC Capital Ltd., Reg. S 1.871%
07/12/2021 EUR 500,000 576,627 0.35 Want Want China Finance Ltd., 144A
1.875% 14/05/2018 USD 575,000 572,818 0.35
3,520,764 2.16
FranceAir Liquide Finance SA, 144A 2.25%
27/09/2023 USD 475,000 463,057 0.29 AXA SA, Reg. S, FRN 5.125%
04/07/2043 EUR 375,000 508,772 0.31 AXA SA, Reg. S, FRN 3.941% Perpetual EUR 400,000 497,216 0.31 BNP Paribas SA 5% 15/01/2021 USD 925,000 1,010,969 0.62 BNP Paribas SA, Reg. S 2.375%
17/02/2025 EUR 100,000 118,566 0.07 BPCE SA, 144A 5.15% 21/07/2024 USD 775,000 830,246 0.51 Credit Agricole Assurances SA, Reg. S,
FRN 4.5% Perpetual EUR 600,000 741,556 0.46 Credit Agricole SA, 144A 3.875%
15/04/2024 USD 1,050,000 1,108,018 0.68 Danone SA, 144A 1.691% 30/10/2019 USD 825,000 817,992 0.50 Electricite de France SA, Reg. S, FRN 5%
Perpetual EUR 400,000 489,807 0.30 Europcar Groupe SA, Reg. S 5.75%
15/06/2022 EUR 300,000 361,639 0.22 Fromageries Bel SA, Reg. S 1.5%
18/04/2024 EUR 200,000 229,626 0.14 Ingenico Group SA, Reg. S 2.5%
20/05/2021 EUR 300,000 360,648 0.22 NEW Areva Holding SA 3.5% 22/03/2021 EUR 150,000 180,078 0.11 Societe Generale SA, Reg. S 2.625%
27/02/2025 EUR 500,000 600,359 0.37 TOTAL SA, Reg. S, FRN 2.25% Perpetual EUR 200,000 231,326 0.14 Vilmorin & Cie SA, Reg. S 2.375%
26/05/2021 EUR 300,000 356,699 0.22
8,906,574 5.47
GermanyAllianz SE, Reg. S, FRN 3.375% Perpetual EUR 600,000 735,030 0.45 ATF Netherlands BV, Reg. S 1.5%
03/05/2022 EUR 200,000 232,037 0.14 BMW US Capital LLC, 144A 2%
11/04/2021 USD 275,000 272,513 0.17 Daimler Finance North America LLC, 144A
1.5% 05/07/2019 USD 675,000 668,469 0.41 Deutsche Telekom International Finance BV,
144A 3.6% 19/01/2027 USD 875,000 888,685 0.54
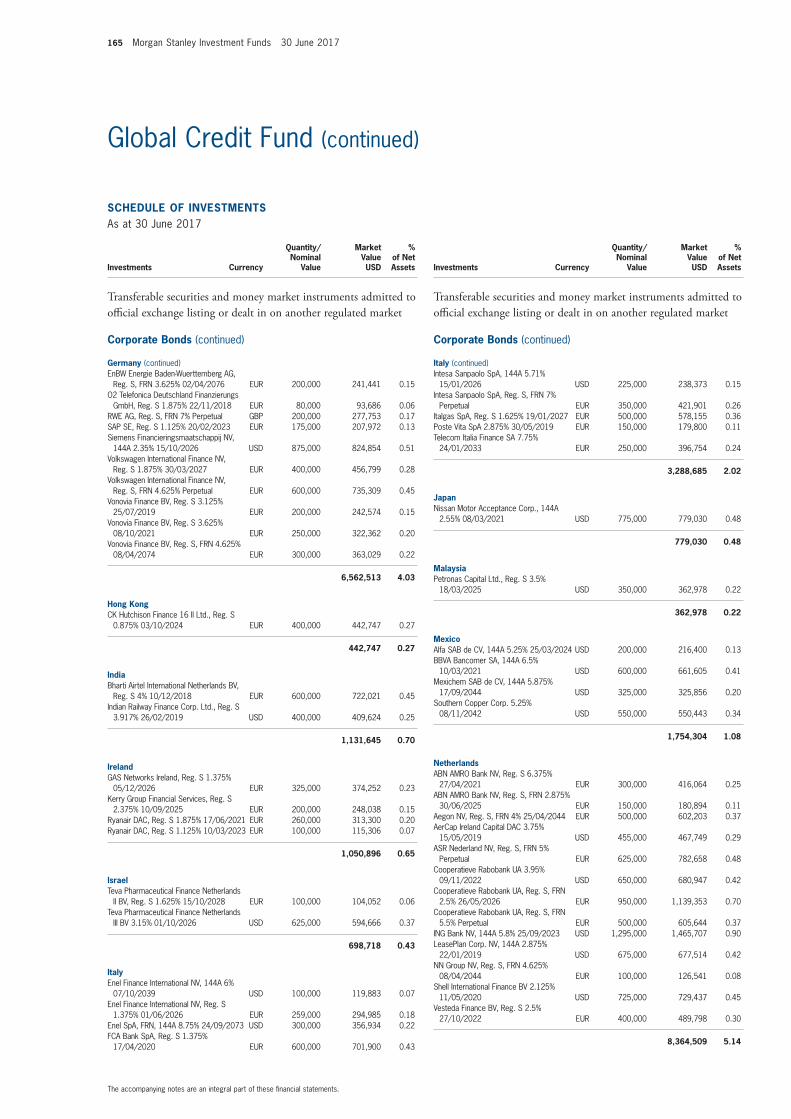
165 Morgan Stanley Investment Funds 30 June 2017
The accompanying notes are an integral part of these fi nancial statements.
Global Credit Fund (continued)
SCHEDULE OF INVESTMENTSAs at 30 June 2017
Investments Currency
Quantity/Nominal
Value
Market Value USD
% of Net Assets
Transferable securities and money market instruments admitted to offi cial exchange listing or dealt in on another regulated market
Corporate Bonds (continued)
Germany (continued)EnBW Energie Baden-Wuerttemberg AG,
Reg. S, FRN 3.625% 02/04/2076 EUR 200,000 241,441 0.15 O2 Telefonica Deutschland Finanzierungs
GmbH, Reg. S 1.875% 22/11/2018 EUR 80,000 93,686 0.06 RWE AG, Reg. S, FRN 7% Perpetual GBP 200,000 277,753 0.17 SAP SE, Reg. S 1.125% 20/02/2023 EUR 175,000 207,972 0.13 Siemens Financieringsmaatschappij NV,
144A 2.35% 15/10/2026 USD 875,000 824,854 0.51 Volkswagen International Finance NV,
Reg. S 1.875% 30/03/2027 EUR 400,000 456,799 0.28 Volkswagen International Finance NV,
Reg. S, FRN 4.625% Perpetual EUR 600,000 735,309 0.45 Vonovia Finance BV, Reg. S 3.125%
25/07/2019 EUR 200,000 242,574 0.15 Vonovia Finance BV, Reg. S 3.625%
08/10/2021 EUR 250,000 322,362 0.20 Vonovia Finance BV, Reg. S, FRN 4.625%
08/04/2074 EUR 300,000 363,029 0.22
6,562,513 4.03
Hong KongCK Hutchison Finance 16 II Ltd., Reg. S
0.875% 03/10/2024 EUR 400,000 442,747 0.27
442,747 0.27
IndiaBharti Airtel International Netherlands BV,
Reg. S 4% 10/12/2018 EUR 600,000 722,021 0.45 Indian Railway Finance Corp. Ltd., Reg. S
3.917% 26/02/2019 USD 400,000 409,624 0.25
1,131,645 0.70
IrelandGAS Networks Ireland, Reg. S 1.375%
05/12/2026 EUR 325,000 374,252 0.23 Kerry Group Financial Services, Reg. S
2.375% 10/09/2025 EUR 200,000 248,038 0.15 Ryanair DAC, Reg. S 1.875% 17/06/2021 EUR 260,000 313,300 0.20 Ryanair DAC, Reg. S 1.125% 10/03/2023 EUR 100,000 115,306 0.07
1,050,896 0.65
IsraelTeva Pharmaceutical Finance Netherlands
II BV, Reg. S 1.625% 15/10/2028 EUR 100,000 104,052 0.06 Teva Pharmaceutical Finance Netherlands
III BV 3.15% 01/10/2026 USD 625,000 594,666 0.37
698,718 0.43
ItalyEnel Finance International NV, 144A 6%
07/10/2039 USD 100,000 119,883 0.07 Enel Finance International NV, Reg. S
1.375% 01/06/2026 EUR 259,000 294,985 0.18 Enel SpA, FRN, 144A 8.75% 24/09/2073 USD 300,000 356,934 0.22 FCA Bank SpA, Reg. S 1.375%
17/04/2020 EUR 600,000 701,900 0.43
SCHEDULE OF INVESTMENTSAs at 30 June 2017
Investments Currency
Quantity/Nominal
Value
Market Value USD
% of Net Assets
Transferable securities and money market instruments admitted to offi cial exchange listing or dealt in on another regulated market
Corporate Bonds (continued)
Italy (continued)Intesa Sanpaolo SpA, 144A 5.71%
15/01/2026 USD 225,000 238,373 0.15 Intesa Sanpaolo SpA, Reg. S, FRN 7%
Perpetual EUR 350,000 421,901 0.26 Italgas SpA, Reg. S 1.625% 19/01/2027 EUR 500,000 578,155 0.36 Poste Vita SpA 2.875% 30/05/2019 EUR 150,000 179,800 0.11 Telecom Italia Finance SA 7.75%
24/01/2033 EUR 250,000 396,754 0.24
3,288,685 2.02
JapanNissan Motor Acceptance Corp., 144A
2.55% 08/03/2021 USD 775,000 779,030 0.48
779,030 0.48
MalaysiaPetronas Capital Ltd., Reg. S 3.5%
18/03/2025 USD 350,000 362,978 0.22
362,978 0.22
MexicoAlfa SAB de CV, 144A 5.25% 25/03/2024 USD 200,000 216,400 0.13 BBVA Bancomer SA, 144A 6.5%
10/03/2021 USD 600,000 661,605 0.41 Mexichem SAB de CV, 144A 5.875%
17/09/2044 USD 325,000 325,856 0.20 Southern Copper Corp. 5.25%
08/11/2042 USD 550,000 550,443 0.34
1,754,304 1.08
NetherlandsABN AMRO Bank NV, Reg. S 6.375%
27/04/2021 EUR 300,000 416,064 0.25 ABN AMRO Bank NV, Reg. S, FRN 2.875%
30/06/2025 EUR 150,000 180,894 0.11 Aegon NV, Reg. S, FRN 4% 25/04/2044 EUR 500,000 602,203 0.37 AerCap Ireland Capital DAC 3.75%
15/05/2019 USD 455,000 467,749 0.29 ASR Nederland NV, Reg. S, FRN 5%
Perpetual EUR 625,000 782,658 0.48 Cooperatieve Rabobank UA 3.95%
09/11/2022 USD 650,000 680,947 0.42 Cooperatieve Rabobank UA, Reg. S, FRN
2.5% 26/05/2026 EUR 950,000 1,139,353 0.70 Cooperatieve Rabobank UA, Reg. S, FRN
5.5% Perpetual EUR 500,000 605,644 0.37 ING Bank NV, 144A 5.8% 25/09/2023 USD 1,295,000 1,465,707 0.90 LeasePlan Corp. NV, 144A 2.875%
22/01/2019 USD 675,000 677,514 0.42 NN Group NV, Reg. S, FRN 4.625%
08/04/2044 EUR 100,000 126,541 0.08 Shell International Finance BV 2.125%
11/05/2020 USD 725,000 729,437 0.45 Vesteda Finance BV, Reg. S 2.5%
27/10/2022 EUR 400,000 489,798 0.30
8,364,509 5.14
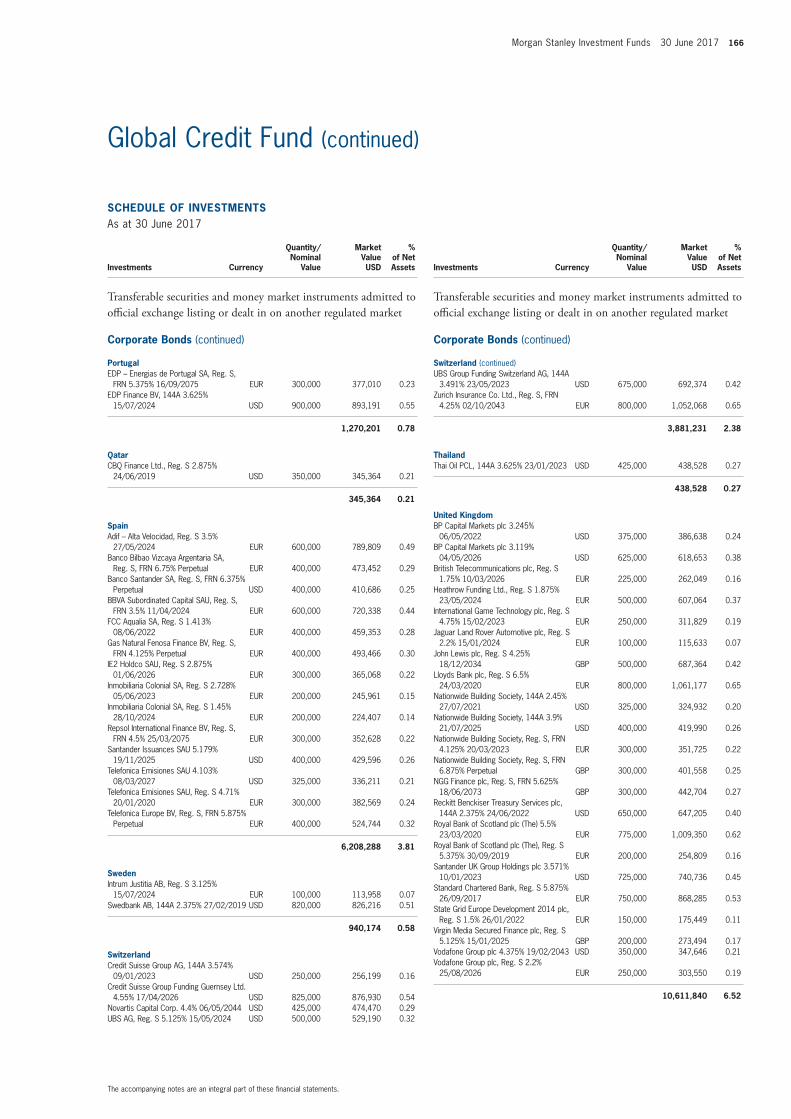
Morgan Stanley Investment Funds 30 June 2017 166
The accompanying notes are an integral part of these fi nancial statements.
Global Credit Fund (continued)
SCHEDULE OF INVESTMENTSAs at 30 June 2017
Investments Currency
Quantity/Nominal
Value
Market Value USD
% of Net Assets
Transferable securities and money market instruments admitted to offi cial exchange listing or dealt in on another regulated market
Corporate Bonds (continued)
PortugalEDP – Energias de Portugal SA, Reg. S,
FRN 5.375% 16/09/2075 EUR 300,000 377,010 0.23 EDP Finance BV, 144A 3.625%
15/07/2024 USD 900,000 893,191 0.55
1,270,201 0.78
QatarCBQ Finance Ltd., Reg. S 2.875%
24/06/2019 USD 350,000 345,364 0.21
345,364 0.21
SpainAdif – Alta Velocidad, Reg. S 3.5%
27/05/2024 EUR 600,000 789,809 0.49 Banco Bilbao Vizcaya Argentaria SA,
Reg. S, FRN 6.75% Perpetual EUR 400,000 473,452 0.29 Banco Santander SA, Reg. S, FRN 6.375%
Perpetual USD 400,000 410,686 0.25 BBVA Subordinated Capital SAU, Reg. S,
FRN 3.5% 11/04/2024 EUR 600,000 720,338 0.44 FCC Aqualia SA, Reg. S 1.413%
08/06/2022 EUR 400,000 459,353 0.28 Gas Natural Fenosa Finance BV, Reg. S,
FRN 4.125% Perpetual EUR 400,000 493,466 0.30 IE2 Holdco SAU, Reg. S 2.875%
01/06/2026 EUR 300,000 365,068 0.22 Inmobiliaria Colonial SA, Reg. S 2.728%
05/06/2023 EUR 200,000 245,961 0.15 Inmobiliaria Colonial SA, Reg. S 1.45%
28/10/2024 EUR 200,000 224,407 0.14 Repsol International Finance BV, Reg. S,
FRN 4.5% 25/03/2075 EUR 300,000 352,628 0.22 Santander Issuances SAU 5.179%
19/11/2025 USD 400,000 429,596 0.26 Telefonica Emisiones SAU 4.103%
08/03/2027 USD 325,000 336,211 0.21 Telefonica Emisiones SAU, Reg. S 4.71%
20/01/2020 EUR 300,000 382,569 0.24 Telefonica Europe BV, Reg. S, FRN 5.875%
Perpetual EUR 400,000 524,744 0.32
6,208,288 3.81
SwedenIntrum Justitia AB, Reg. S 3.125%
15/07/2024 EUR 100,000 113,958 0.07 Swedbank AB, 144A 2.375% 27/02/2019 USD 820,000 826,216 0.51
940,174 0.58
SwitzerlandCredit Suisse Group AG, 144A 3.574%
09/01/2023 USD 250,000 256,199 0.16 Credit Suisse Group Funding Guernsey Ltd.
4.55% 17/04/2026 USD 825,000 876,930 0.54 Novartis Capital Corp. 4.4% 06/05/2044 USD 425,000 474,470 0.29 UBS AG, Reg. S 5.125% 15/05/2024 USD 500,000 529,190 0.32
SCHEDULE OF INVESTMENTSAs at 30 June 2017
Investments Currency
Quantity/Nominal
Value
Market Value USD
% of Net Assets
Transferable securities and money market instruments admitted to offi cial exchange listing or dealt in on another regulated market
Corporate Bonds (continued)
Switzerland (continued)UBS Group Funding Switzerland AG, 144A
3.491% 23/05/2023 USD 675,000 692,374 0.42 Zurich Insurance Co. Ltd., Reg. S, FRN
4.25% 02/10/2043 EUR 800,000 1,052,068 0.65
3,881,231 2.38
ThailandThai Oil PCL, 144A 3.625% 23/01/2023 USD 425,000 438,528 0.27
438,528 0.27
United KingdomBP Capital Markets plc 3.245%
06/05/2022 USD 375,000 386,638 0.24 BP Capital Markets plc 3.119%
04/05/2026 USD 625,000 618,653 0.38 British Telecommunications plc, Reg. S
1.75% 10/03/2026 EUR 225,000 262,049 0.16 Heathrow Funding Ltd., Reg. S 1.875%
23/05/2024 EUR 500,000 607,064 0.37 International Game Technology plc, Reg. S
4.75% 15/02/2023 EUR 250,000 311,829 0.19 Jaguar Land Rover Automotive plc, Reg. S
2.2% 15/01/2024 EUR 100,000 115,633 0.07 John Lewis plc, Reg. S 4.25%
18/12/2034 GBP 500,000 687,364 0.42 Lloyds Bank plc, Reg. S 6.5%
24/03/2020 EUR 800,000 1,061,177 0.65 Nationwide Building Society, 144A 2.45%
27/07/2021 USD 325,000 324,932 0.20 Nationwide Building Society, 144A 3.9%
21/07/2025 USD 400,000 419,990 0.26 Nationwide Building Society, Reg. S, FRN
4.125% 20/03/2023 EUR 300,000 351,725 0.22 Nationwide Building Society, Reg. S, FRN
6.875% Perpetual GBP 300,000 401,558 0.25 NGG Finance plc, Reg. S, FRN 5.625%
18/06/2073 GBP 300,000 442,704 0.27 Reckitt Benckiser Treasury Services plc,
144A 2.375% 24/06/2022 USD 650,000 647,205 0.40 Royal Bank of Scotland plc (The) 5.5%
23/03/2020 EUR 775,000 1,009,350 0.62 Royal Bank of Scotland plc (The), Reg. S
5.375% 30/09/2019 EUR 200,000 254,809 0.16 Santander UK Group Holdings plc 3.571%
10/01/2023 USD 725,000 740,736 0.45 Standard Chartered Bank, Reg. S 5.875%
26/09/2017 EUR 750,000 868,285 0.53 State Grid Europe Development 2014 plc,
Reg. S 1.5% 26/01/2022 EUR 150,000 175,449 0.11 Virgin Media Secured Finance plc, Reg. S
5.125% 15/01/2025 GBP 200,000 273,494 0.17 Vodafone Group plc 4.375% 19/02/2043 USD 350,000 347,646 0.21 Vodafone Group plc, Reg. S 2.2%
25/08/2026 EUR 250,000 303,550 0.19
10,611,840 6.52
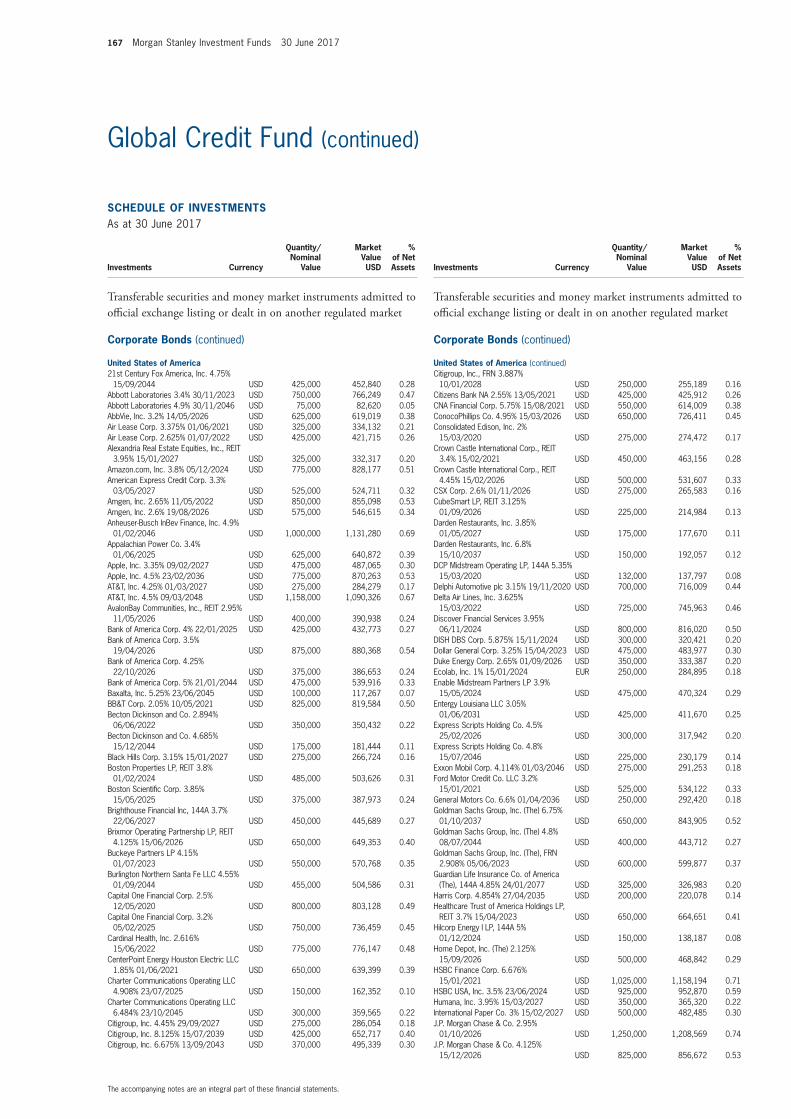
167 Morgan Stanley Investment Funds 30 June 2017
The accompanying notes are an integral part of these fi nancial statements.
Global Credit Fund (continued)
SCHEDULE OF INVESTMENTSAs at 30 June 2017
Investments Currency
Quantity/Nominal
Value
Market Value USD
% of Net Assets
Transferable securities and money market instruments admitted to offi cial exchange listing or dealt in on another regulated market
Corporate Bonds (continued)
United States of America21st Century Fox America, Inc. 4.75%
15/09/2044 USD 425,000 452,840 0.28 Abbott Laboratories 3.4% 30/11/2023 USD 750,000 766,249 0.47 Abbott Laboratories 4.9% 30/11/2046 USD 75,000 82,620 0.05 AbbVie, Inc. 3.2% 14/05/2026 USD 625,000 619,019 0.38 Air Lease Corp. 3.375% 01/06/2021 USD 325,000 334,132 0.21 Air Lease Corp. 2.625% 01/07/2022 USD 425,000 421,715 0.26 Alexandria Real Estate Equities, Inc., REIT
3.95% 15/01/2027 USD 325,000 332,317 0.20 Amazon.com, Inc. 3.8% 05/12/2024 USD 775,000 828,177 0.51 American Express Credit Corp. 3.3%
03/05/2027 USD 525,000 524,711 0.32 Amgen, Inc. 2.65% 11/05/2022 USD 850,000 855,098 0.53 Amgen, Inc. 2.6% 19/08/2026 USD 575,000 546,615 0.34 Anheuser-Busch InBev Finance, Inc. 4.9%
01/02/2046 USD 1,000,000 1,131,280 0.69 Appalachian Power Co. 3.4%
01/06/2025 USD 625,000 640,872 0.39 Apple, Inc. 3.35% 09/02/2027 USD 475,000 487,065 0.30 Apple, Inc. 4.5% 23/02/2036 USD 775,000 870,263 0.53 AT&T, Inc. 4.25% 01/03/2027 USD 275,000 284,279 0.17 AT&T, Inc. 4.5% 09/03/2048 USD 1,158,000 1,090,326 0.67 AvalonBay Communities, Inc., REIT 2.95%
11/05/2026 USD 400,000 390,938 0.24 Bank of America Corp. 4% 22/01/2025 USD 425,000 432,773 0.27 Bank of America Corp. 3.5%
19/04/2026 USD 875,000 880,368 0.54 Bank of America Corp. 4.25%
22/10/2026 USD 375,000 386,653 0.24 Bank of America Corp. 5% 21/01/2044 USD 475,000 539,916 0.33 Baxalta, Inc. 5.25% 23/06/2045 USD 100,000 117,267 0.07 BB&T Corp. 2.05% 10/05/2021 USD 825,000 819,584 0.50 Becton Dickinson and Co. 2.894%
06/06/2022 USD 350,000 350,432 0.22 Becton Dickinson and Co. 4.685%
15/12/2044 USD 175,000 181,444 0.11 Black Hills Corp. 3.15% 15/01/2027 USD 275,000 266,724 0.16 Boston Properties LP, REIT 3.8%
01/02/2024 USD 485,000 503,626 0.31 Boston Scientifi c Corp. 3.85%
15/05/2025 USD 375,000 387,973 0.24 Brighthouse Financial Inc, 144A 3.7%
22/06/2027 USD 450,000 445,689 0.27 Brixmor Operating Partnership LP, REIT
4.125% 15/06/2026 USD 650,000 649,353 0.40 Buckeye Partners LP 4.15%
01/07/2023 USD 550,000 570,768 0.35 Burlington Northern Santa Fe LLC 4.55%
01/09/2044 USD 455,000 504,586 0.31 Capital One Financial Corp. 2.5%
12/05/2020 USD 800,000 803,128 0.49 Capital One Financial Corp. 3.2%
05/02/2025 USD 750,000 736,459 0.45 Cardinal Health, Inc. 2.616%
15/06/2022 USD 775,000 776,147 0.48 CenterPoint Energy Houston Electric LLC
1.85% 01/06/2021 USD 650,000 639,399 0.39 Charter Communications Operating LLC
4.908% 23/07/2025 USD 150,000 162,352 0.10 Charter Communications Operating LLC
6.484% 23/10/2045 USD 300,000 359,565 0.22 Citigroup, Inc. 4.45% 29/09/2027 USD 275,000 286,054 0.18 Citigroup, Inc. 8.125% 15/07/2039 USD 425,000 652,717 0.40 Citigroup, Inc. 6.675% 13/09/2043 USD 370,000 495,339 0.30
SCHEDULE OF INVESTMENTSAs at 30 June 2017
Investments Currency
Quantity/Nominal
Value
Market Value USD
% of Net Assets
Transferable securities and money market instruments admitted to offi cial exchange listing or dealt in on another regulated market
Corporate Bonds (continued)
United States of America (continued)Citigroup, Inc., FRN 3.887%
10/01/2028 USD 250,000 255,189 0.16 Citizens Bank NA 2.55% 13/05/2021 USD 425,000 425,912 0.26 CNA Financial Corp. 5.75% 15/08/2021 USD 550,000 614,009 0.38 ConocoPhillips Co. 4.95% 15/03/2026 USD 650,000 726,411 0.45 Consolidated Edison, Inc. 2%
15/03/2020 USD 275,000 274,472 0.17 Crown Castle International Corp., REIT
3.4% 15/02/2021 USD 450,000 463,156 0.28 Crown Castle International Corp., REIT
4.45% 15/02/2026 USD 500,000 531,607 0.33 CSX Corp. 2.6% 01/11/2026 USD 275,000 265,583 0.16 CubeSmart LP, REIT 3.125%
01/09/2026 USD 225,000 214,984 0.13 Darden Restaurants, Inc. 3.85%
01/05/2027 USD 175,000 177,670 0.11 Darden Restaurants, Inc. 6.8%
15/10/2037 USD 150,000 192,057 0.12 DCP Midstream Operating LP, 144A 5.35%
15/03/2020 USD 132,000 137,797 0.08 Delphi Automotive plc 3.15% 19/11/2020 USD 700,000 716,009 0.44 Delta Air Lines, Inc. 3.625%
15/03/2022 USD 725,000 745,963 0.46 Discover Financial Services 3.95%
06/11/2024 USD 800,000 816,020 0.50 DISH DBS Corp. 5.875% 15/11/2024 USD 300,000 320,421 0.20 Dollar General Corp. 3.25% 15/04/2023 USD 475,000 483,977 0.30 Duke Energy Corp. 2.65% 01/09/2026 USD 350,000 333,387 0.20 Ecolab, Inc. 1% 15/01/2024 EUR 250,000 284,895 0.18 Enable Midstream Partners LP 3.9%
15/05/2024 USD 475,000 470,324 0.29 Entergy Louisiana LLC 3.05%
01/06/2031 USD 425,000 411,670 0.25 Express Scripts Holding Co. 4.5%
25/02/2026 USD 300,000 317,942 0.20 Express Scripts Holding Co. 4.8%
15/07/2046 USD 225,000 230,179 0.14 Exxon Mobil Corp. 4.114% 01/03/2046 USD 275,000 291,253 0.18 Ford Motor Credit Co. LLC 3.2%
15/01/2021 USD 525,000 534,122 0.33 General Motors Co. 6.6% 01/04/2036 USD 250,000 292,420 0.18 Goldman Sachs Group, Inc. (The) 6.75%
01/10/2037 USD 650,000 843,905 0.52 Goldman Sachs Group, Inc. (The) 4.8%
08/07/2044 USD 400,000 443,712 0.27 Goldman Sachs Group, Inc. (The), FRN
2.908% 05/06/2023 USD 600,000 599,877 0.37 Guardian Life Insurance Co. of America
(The), 144A 4.85% 24/01/2077 USD 325,000 326,983 0.20 Harris Corp. 4.854% 27/04/2035 USD 200,000 220,078 0.14 Healthcare Trust of America Holdings LP,
REIT 3.7% 15/04/2023 USD 650,000 664,651 0.41 Hilcorp Energy I LP, 144A 5%
01/12/2024 USD 150,000 138,187 0.08 Home Depot, Inc. (The) 2.125%
15/09/2026 USD 500,000 468,842 0.29 HSBC Finance Corp. 6.676%
15/01/2021 USD 1,025,000 1,158,194 0.71 HSBC USA, Inc. 3.5% 23/06/2024 USD 925,000 952,870 0.59 Humana, Inc. 3.95% 15/03/2027 USD 350,000 365,320 0.22 International Paper Co. 3% 15/02/2027 USD 500,000 482,485 0.30 J.P. Morgan Chase & Co. 2.95%
01/10/2026 USD 1,250,000 1,208,569 0.74 J.P. Morgan Chase & Co. 4.125%
15/12/2026 USD 825,000 856,672 0.53
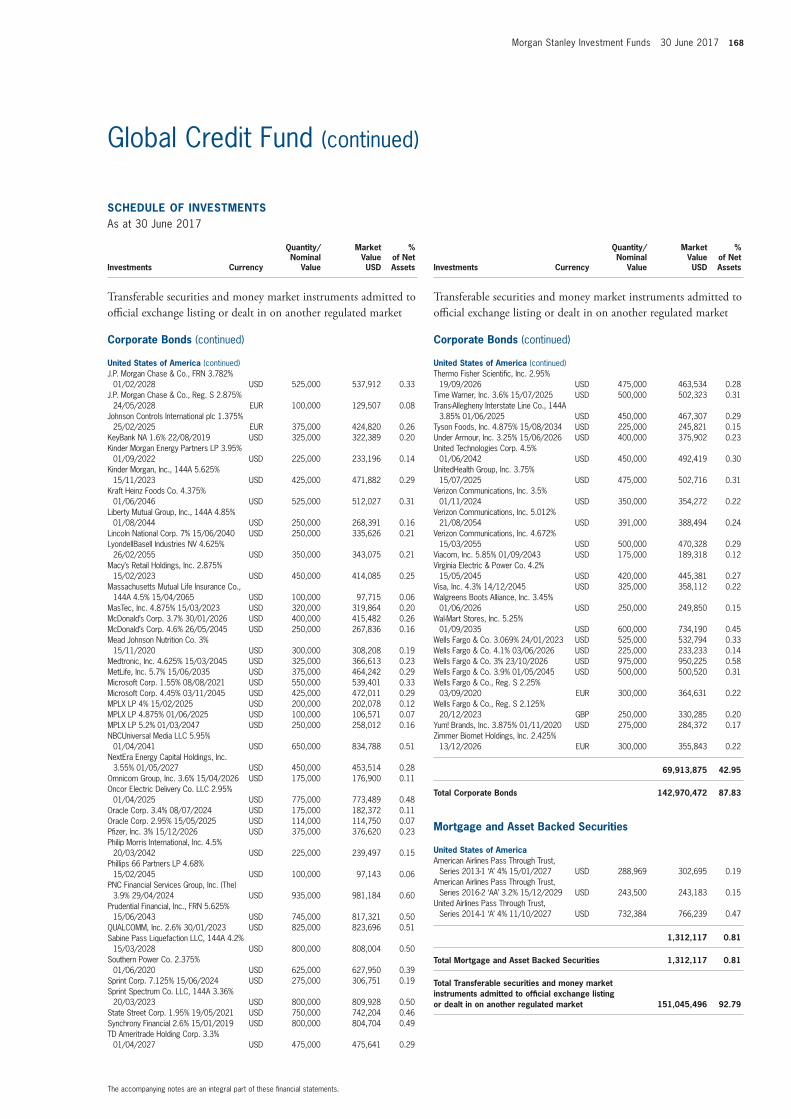
Morgan Stanley Investment Funds 30 June 2017 168
The accompanying notes are an integral part of these fi nancial statements.
Global Credit Fund (continued)
SCHEDULE OF INVESTMENTSAs at 30 June 2017
Investments Currency
Quantity/Nominal
Value
Market Value USD
% of Net Assets
Transferable securities and money market instruments admitted to offi cial exchange listing or dealt in on another regulated market
Corporate Bonds (continued)
United States of America (continued)J.P. Morgan Chase & Co., FRN 3.782%
01/02/2028 USD 525,000 537,912 0.33 J.P. Morgan Chase & Co., Reg. S 2.875%
24/05/2028 EUR 100,000 129,507 0.08 Johnson Controls International plc 1.375%
25/02/2025 EUR 375,000 424,820 0.26 KeyBank NA 1.6% 22/08/2019 USD 325,000 322,389 0.20 Kinder Morgan Energy Partners LP 3.95%
01/09/2022 USD 225,000 233,196 0.14 Kinder Morgan, Inc., 144A 5.625%
15/11/2023 USD 425,000 471,882 0.29 Kraft Heinz Foods Co. 4.375%
01/06/2046 USD 525,000 512,027 0.31 Liberty Mutual Group, Inc., 144A 4.85%
01/08/2044 USD 250,000 268,391 0.16 Lincoln National Corp. 7% 15/06/2040 USD 250,000 335,626 0.21 LyondellBasell Industries NV 4.625%
26/02/2055 USD 350,000 343,075 0.21 Macy’s Retail Holdings, Inc. 2.875%
15/02/2023 USD 450,000 414,085 0.25 Massachusetts Mutual Life Insurance Co.,
144A 4.5% 15/04/2065 USD 100,000 97,715 0.06 MasTec, Inc. 4.875% 15/03/2023 USD 320,000 319,864 0.20 McDonald’s Corp. 3.7% 30/01/2026 USD 400,000 415,482 0.26 McDonald’s Corp. 4.6% 26/05/2045 USD 250,000 267,836 0.16 Mead Johnson Nutrition Co. 3%
15/11/2020 USD 300,000 308,208 0.19 Medtronic, Inc. 4.625% 15/03/2045 USD 325,000 366,613 0.23 MetLife, Inc. 5.7% 15/06/2035 USD 375,000 464,242 0.29 Microsoft Corp. 1.55% 08/08/2021 USD 550,000 539,401 0.33 Microsoft Corp. 4.45% 03/11/2045 USD 425,000 472,011 0.29 MPLX LP 4% 15/02/2025 USD 200,000 202,078 0.12 MPLX LP 4.875% 01/06/2025 USD 100,000 106,571 0.07 MPLX LP 5.2% 01/03/2047 USD 250,000 258,012 0.16 NBCUniversal Media LLC 5.95%
01/04/2041 USD 650,000 834,788 0.51 NextEra Energy Capital Holdings, Inc.
3.55% 01/05/2027 USD 450,000 453,514 0.28 Omnicom Group, Inc. 3.6% 15/04/2026 USD 175,000 176,900 0.11 Oncor Electric Delivery Co. LLC 2.95%
01/04/2025 USD 775,000 773,489 0.48 Oracle Corp. 3.4% 08/07/2024 USD 175,000 182,372 0.11 Oracle Corp. 2.95% 15/05/2025 USD 114,000 114,750 0.07 Pfi zer, Inc. 3% 15/12/2026 USD 375,000 376,620 0.23 Philip Morris International, Inc. 4.5%
20/03/2042 USD 225,000 239,497 0.15 Phillips 66 Partners LP 4.68%
15/02/2045 USD 100,000 97,143 0.06 PNC Financial Services Group, Inc. (The)
3.9% 29/04/2024 USD 935,000 981,184 0.60 Prudential Financial, Inc., FRN 5.625%
15/06/2043 USD 745,000 817,321 0.50 QUALCOMM, Inc. 2.6% 30/01/2023 USD 825,000 823,696 0.51 Sabine Pass Liquefaction LLC, 144A 4.2%
15/03/2028 USD 800,000 808,004 0.50 Southern Power Co. 2.375%
01/06/2020 USD 625,000 627,950 0.39 Sprint Corp. 7.125% 15/06/2024 USD 275,000 306,751 0.19 Sprint Spectrum Co. LLC, 144A 3.36%
20/03/2023 USD 800,000 809,928 0.50 State Street Corp. 1.95% 19/05/2021 USD 750,000 742,204 0.46 Synchrony Financial 2.6% 15/01/2019 USD 800,000 804,704 0.49 TD Ameritrade Holding Corp. 3.3%
01/04/2027 USD 475,000 475,641 0.29
SCHEDULE OF INVESTMENTSAs at 30 June 2017
Investments Currency
Quantity/Nominal
Value
Market Value USD
% of Net Assets
Transferable securities and money market instruments admitted to offi cial exchange listing or dealt in on another regulated market
Corporate Bonds (continued)
United States of America (continued)Thermo Fisher Scientifi c, Inc. 2.95%
19/09/2026 USD 475,000 463,534 0.28 Time Warner, Inc. 3.6% 15/07/2025 USD 500,000 502,323 0.31 Trans-Allegheny Interstate Line Co., 144A
3.85% 01/06/2025 USD 450,000 467,307 0.29 Tyson Foods, Inc. 4.875% 15/08/2034 USD 225,000 245,821 0.15 Under Armour, Inc. 3.25% 15/06/2026 USD 400,000 375,902 0.23 United Technologies Corp. 4.5%
01/06/2042 USD 450,000 492,419 0.30 UnitedHealth Group, Inc. 3.75%
15/07/2025 USD 475,000 502,716 0.31 Verizon Communications, Inc. 3.5%
01/11/2024 USD 350,000 354,272 0.22 Verizon Communications, Inc. 5.012%
21/08/2054 USD 391,000 388,494 0.24 Verizon Communications, Inc. 4.672%
15/03/2055 USD 500,000 470,328 0.29 Viacom, Inc. 5.85% 01/09/2043 USD 175,000 189,318 0.12 Virginia Electric & Power Co. 4.2%
15/05/2045 USD 420,000 445,381 0.27 Visa, Inc. 4.3% 14/12/2045 USD 325,000 358,112 0.22 Walgreens Boots Alliance, Inc. 3.45%
01/06/2026 USD 250,000 249,850 0.15 Wal-Mart Stores, Inc. 5.25%
01/09/2035 USD 600,000 734,190 0.45 Wells Fargo & Co. 3.069% 24/01/2023 USD 525,000 532,794 0.33 Wells Fargo & Co. 4.1% 03/06/2026 USD 225,000 233,233 0.14 Wells Fargo & Co. 3% 23/10/2026 USD 975,000 950,225 0.58 Wells Fargo & Co. 3.9% 01/05/2045 USD 500,000 500,520 0.31 Wells Fargo & Co., Reg. S 2.25%
03/09/2020 EUR 300,000 364,631 0.22 Wells Fargo & Co., Reg. S 2.125%
20/12/2023 GBP 250,000 330,285 0.20 Yum! Brands, Inc. 3.875% 01/11/2020 USD 275,000 284,372 0.17 Zimmer Biomet Holdings, Inc. 2.425%
13/12/2026 EUR 300,000 355,843 0.22
69,913,875 42.95
Total Corporate Bonds 142,970,472 87.83
Mortgage and Asset Backed Securities
United States of AmericaAmerican Airlines Pass Through Trust,
Series 2013-1 ‘A’ 4% 15/01/2027 USD 288,969 302,695 0.19 American Airlines Pass Through Trust,
Series 2016-2 ‘AA’ 3.2% 15/12/2029 USD 243,500 243,183 0.15 United Airlines Pass Through Trust,
Series 2014-1 ‘A’ 4% 11/10/2027 USD 732,384 766,239 0.47
1,312,117 0.81
Total Mortgage and Asset Backed Securities 1,312,117 0.81
Total Transferable securities and money market instruments admitted to offi cial exchange listing or dealt in on another regulated market 151,045,496 92.79
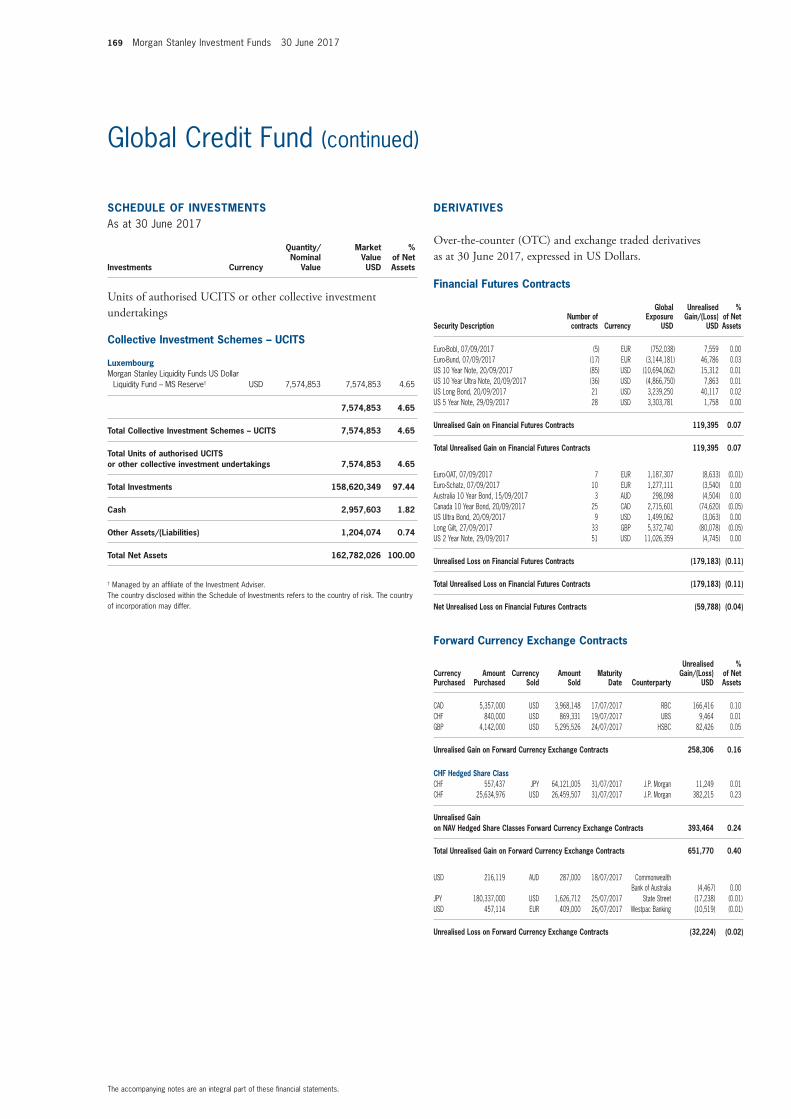
169 Morgan Stanley Investment Funds 30 June 2017
The accompanying notes are an integral part of these fi nancial statements.
Global Credit Fund (continued)
SCHEDULE OF INVESTMENTSAs at 30 June 2017
Investments Currency
Quantity/Nominal
Value
Market Value USD
% of Net Assets
Units of authorised UCITS or other collective investment undertakings
Collective Investment Schemes – UCITS
LuxembourgMorgan Stanley Liquidity Funds US Dollar
Liquidity Fund – MS Reserve† USD 7,574,853 7,574,853 4.65
7,574,853 4.65
Total Collective Investment Schemes – UCITS 7,574,853 4.65
Total Units of authorised UCITS or other collective investment undertakings 7,574,853 4.65
Total Investments 158,620,349 97.44
Cash 2,957,603 1.82
Other Assets/(Liabilities) 1,204,074 0.74
Total Net Assets 162,782,026 100.00
† Managed by an affi liate of the Investment Adviser.The country disclosed within the Schedule of Investments refers to the country of risk. The country of incorporation may differ.
Financial Futures Contracts
Security DescriptionNumber of contracts Currency
Global Exposure
USD
Unrealised Gain/(Loss)
USD
% of Net Assets
Euro-Bobl, 07/09/2017 (5) EUR (752,038) 7,559 0.00 Euro-Bund, 07/09/2017 (17) EUR (3,144,181) 46,786 0.03 US 10 Year Note, 20/09/2017 (85) USD (10,694,062) 15,312 0.01 US 10 Year Ultra Note, 20/09/2017 (36) USD (4,866,750) 7,863 0.01 US Long Bond, 20/09/2017 21 USD 3,239,250 40,117 0.02 US 5 Year Note, 29/09/2017 28 USD 3,303,781 1,758 0.00
Unrealised Gain on Financial Futures Contracts 119,395 0.07
Total Unrealised Gain on Financial Futures Contracts 119,395 0.07
Euro-OAT, 07/09/2017 7 EUR 1,187,307 (8,633) (0.01) Euro-Schatz, 07/09/2017 10 EUR 1,277,111 (3,540) 0.00 Australia 10 Year Bond, 15/09/2017 3 AUD 298,098 (4,504) 0.00 Canada 10 Year Bond, 20/09/2017 25 CAD 2,715,601 (74,620) (0.05) US Ultra Bond, 20/09/2017 9 USD 1,499,062 (3,063) 0.00 Long Gilt, 27/09/2017 33 GBP 5,372,740 (80,078) (0.05) US 2 Year Note, 29/09/2017 51 USD 11,026,359 (4,745) 0.00
Unrealised Loss on Financial Futures Contracts (179,183) (0.11)
Total Unrealised Loss on Financial Futures Contracts (179,183) (0.11)
Net Unrealised Loss on Financial Futures Contracts (59,788) (0.04)
Forward Currency Exchange Contracts (continued)
Currency Purchased
Amount Purchased
Currency Sold
Amount Sold
Maturity Date Counterparty
Unrealised Gain/(Loss)
USD
% of Net Assets
CAD 5,357,000 USD 3,968,148 17/07/2017 RBC 166,416 0.10 CHF 840,000 USD 869,331 19/07/2017 UBS 9,464 0.01 GBP 4,142,000 USD 5,295,526 24/07/2017 HSBC 82,426 0.05
Unrealised Gain on Forward Currency Exchange Contracts 258,306 0.16
CHF Hedged Share ClassCHF 557,437 JPY 64,121,005 31/07/2017 J.P. Morgan 11,249 0.01 CHF 25,634,976 USD 26,459,507 31/07/2017 J.P. Morgan 382,215 0.23
Unrealised Gain on NAV Hedged Share Classes Forward Currency Exchange Contracts 393,464 0.24
Total Unrealised Gain on Forward Currency Exchange Contracts 651,770 0.40
USD 216,119 AUD 287,000 18/07/2017 Commonwealth Bank of Australia (4,467) 0.00
JPY 180,337,000 USD 1,626,712 25/07/2017 State Street (17,238) (0.01) USD 457,114 EUR 409,000 26/07/2017 Westpac Banking (10,519) (0.01)
Unrealised Loss on Forward Currency Exchange Contracts (32,224) (0.02)
DERIVATIVES
Over-the-counter (OTC) and exchange traded derivatives as at 30 June 2017, expressed in US Dollars.
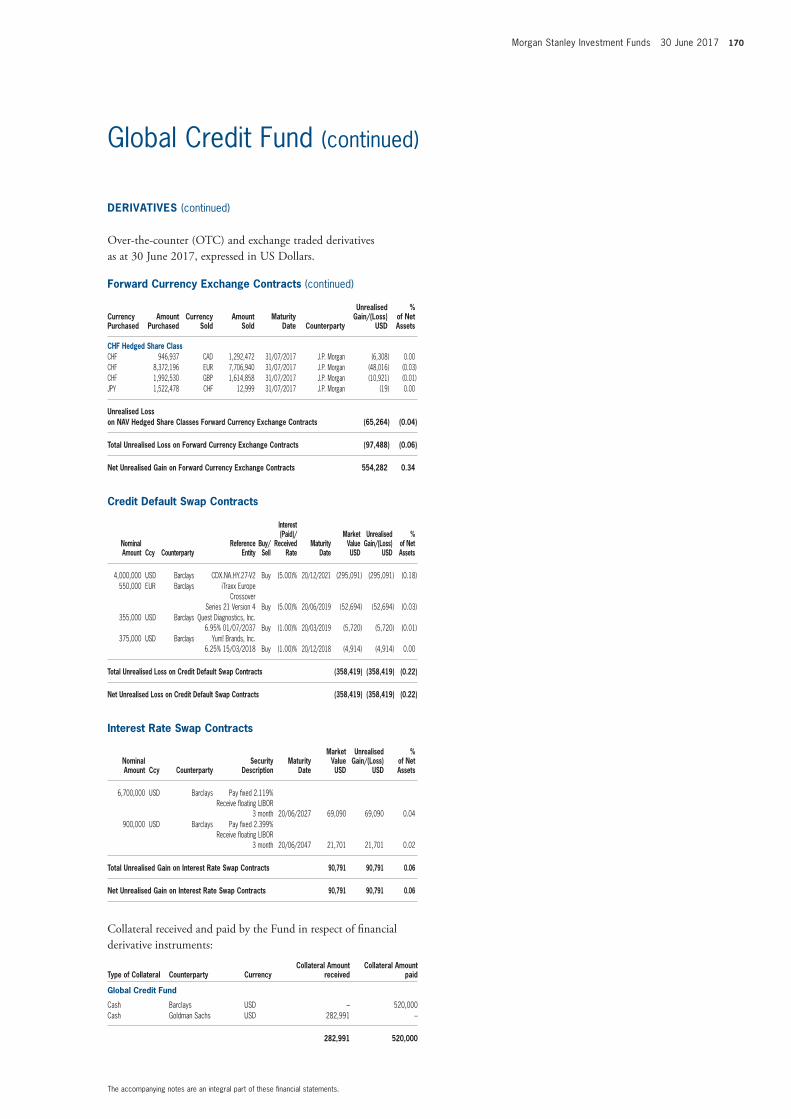
Morgan Stanley Investment Funds 30 June 2017 170
The accompanying notes are an integral part of these fi nancial statements.
Global Credit Fund (continued)
Forward Currency Exchange Contracts (continued)
Currency Purchased
Amount Purchased
Currency Sold
Amount Sold
Maturity Date Counterparty
Unrealised Gain/(Loss)
USD
% of Net Assets
CHF Hedged Share ClassCHF 946,937 CAD 1,292,472 31/07/2017 J.P. Morgan (6,308) 0.00 CHF 8,372,196 EUR 7,706,940 31/07/2017 J.P. Morgan (48,016) (0.03) CHF 1,992,530 GBP 1,614,858 31/07/2017 J.P. Morgan (10,921) (0.01) JPY 1,522,478 CHF 12,999 31/07/2017 J.P. Morgan (19) 0.00
Unrealised Loss on NAV Hedged Share Classes Forward Currency Exchange Contracts (65,264) (0.04)
Total Unrealised Loss on Forward Currency Exchange Contracts (97,488) (0.06)
Net Unrealised Gain on Forward Currency Exchange Contracts 554,282 0.34
Credit Default Swap Contracts
Nominal Amount Ccy Counterparty
Reference Entity
Buy/Sell
Interest (Paid)/
Received Rate
Maturity Date
Market Value USD
Unrealised Gain/(Loss)
USD
% of Net Assets
4,000,000 USD Barclays CDX.NA.HY.27-V2 Buy (5.00)% 20/12/2021 (295,091) (295,091) (0.18) 550,000 EUR Barclays iTraxx Europe
Crossover Series 21 Version 4 Buy (5.00)% 20/06/2019 (52,694) (52,694) (0.03)
355,000 USD Barclays Quest Diagnostics, Inc. 6.95% 01/07/2037 Buy (1.00)% 20/03/2019 (5,720) (5,720) (0.01)
375,000 USD Barclays Yum! Brands, Inc. 6.25% 15/03/2018 Buy (1.00)% 20/12/2018 (4,914) (4,914) 0.00
Total Unrealised Loss on Credit Default Swap Contracts (358,419) (358,419) (0.22)
Net Unrealised Loss on Credit Default Swap Contracts (358,419) (358,419) (0.22)
Interest Rate Swap Contracts
Nominal Amount Ccy Counterparty
Security Description
Maturity Date
Market Value USD
Unrealised Gain/(Loss)
USD
% of Net Assets
6,700,000 USD Barclays Pay fi xed 2.119% Receive fl oating LIBOR
3 month 20/06/2027 69,090 69,090 0.04 900,000 USD Barclays Pay fi xed 2.399%
Receive fl oating LIBOR 3 month 20/06/2047 21,701 21,701 0.02
Total Unrealised Gain on Interest Rate Swap Contracts 90,791 90,791 0.06
Net Unrealised Gain on Interest Rate Swap Contracts 90,791 90,791 0.06
Collateral received and paid by the Fund in respect of fi nancial derivative instruments:
Type of Collateral Counterparty CurrencyCollateral Amount
receivedCollateral Amount
paid
Global Credit Fund
Cash Barclays USD – 520,000Cash Goldman Sachs USD 282,991 –
282,991 520,000
DERIVATIVES (continued)
Over-the-counter (OTC) and exchange traded derivatives as at 30 June 2017, expressed in US Dollars.
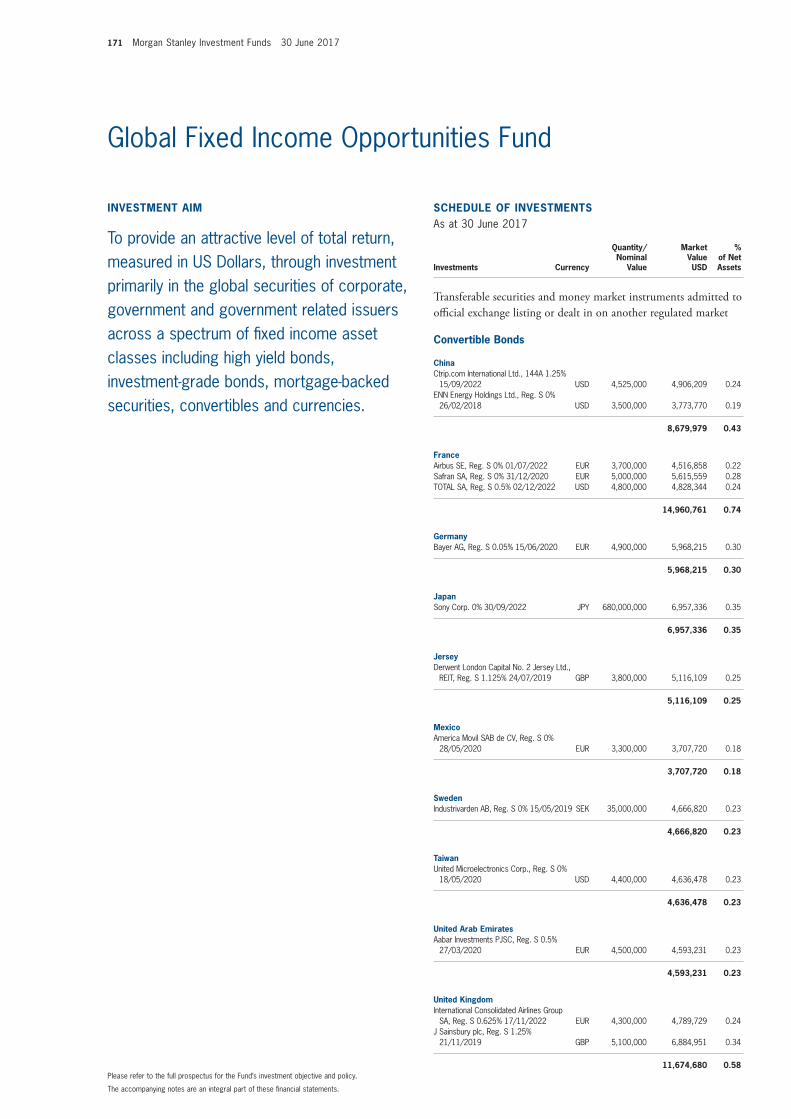
171 Morgan Stanley Investment Funds 30 June 2017
The accompanying notes are an integral part of these fi nancial statements.
Please refer to the full prospectus for the Fund’s investment objective and policy.
INVESTMENT AIM
To provide an attractive level of total return, measured in US Dollars, through investment primarily in the global securities of corporate, government and government related issuers across a spectrum of fi xed income asset classes including high yield bonds, investment-grade bonds, mortgage-backed securities, convertibles and currencies.
SCHEDULE OF INVESTMENTSAs at 30 June 2017
Investments Currency
Quantity/Nominal
Value
Market Value USD
% of Net Assets
Transferable securities and money market instruments admitted to offi cial exchange listing or dealt in on another regulated market
Convertible Bonds
ChinaCtrip.com International Ltd., 144A 1.25%
15/09/2022 USD 4,525,000 4,906,209 0.24ENN Energy Holdings Ltd., Reg. S 0%
26/02/2018 USD 3,500,000 3,773,770 0.19
8,679,979 0.43
FranceAirbus SE, Reg. S 0% 01/07/2022 EUR 3,700,000 4,516,858 0.22Safran SA, Reg. S 0% 31/12/2020 EUR 5,000,000 5,615,559 0.28TOTAL SA, Reg. S 0.5% 02/12/2022 USD 4,800,000 4,828,344 0.24
14,960,761 0.74
GermanyBayer AG, Reg. S 0.05% 15/06/2020 EUR 4,900,000 5,968,215 0.30
5,968,215 0.30
JapanSony Corp. 0% 30/09/2022 JPY 680,000,000 6,957,336 0.35
6,957,336 0.35
JerseyDerwent London Capital No. 2 Jersey Ltd.,
REIT, Reg. S 1.125% 24/07/2019 GBP 3,800,000 5,116,109 0.25
5,116,109 0.25
MexicoAmerica Movil SAB de CV, Reg. S 0%
28/05/2020 EUR 3,300,000 3,707,720 0.18
3,707,720 0.18
SwedenIndustrivarden AB, Reg. S 0% 15/05/2019 SEK 35,000,000 4,666,820 0.23
4,666,820 0.23
TaiwanUnited Microelectronics Corp., Reg. S 0%
18/05/2020 USD 4,400,000 4,636,478 0.23
4,636,478 0.23
United Arab EmiratesAabar Investments PJSC, Reg. S 0.5%
27/03/2020 EUR 4,500,000 4,593,231 0.23
4,593,231 0.23
United KingdomInternational Consolidated Airlines Group
SA, Reg. S 0.625% 17/11/2022 EUR 4,300,000 4,789,729 0.24J Sainsbury plc, Reg. S 1.25%
21/11/2019 GBP 5,100,000 6,884,951 0.34
11,674,680 0.58
Global Fixed Income Opportunities Fund

Morgan Stanley Investment Funds 30 June 2017 172
The accompanying notes are an integral part of these fi nancial statements.
Global Fixed Income Opportunities Fund (continued)
SCHEDULE OF INVESTMENTSAs at 30 June 2017
Investments Currency
Quantity/Nominal
Value
Market Value USD
% of Net Assets
Transferable securities and money market instruments admitted to offi cial exchange listing or dealt in on another regulated market
Convertible Bonds (continued)
United States of AmericaAkamai Technologies, Inc. 0% 15/02/2019 USD 3,900,000 3,824,242 0.19Allscripts Healthcare Solutions, Inc. 1.25%
01/07/2020 USD 3,925,000 3,998,594 0.20CalAtlantic Group, Inc. 0.25% 01/06/2019 USD 4,425,000 4,204,060 0.21Colony NorthStar, Inc., REIT 5%
15/04/2023 USD 5,650,000 5,922,612 0.29DexCom, Inc., 144A 0.75% 15/05/2022 USD 2,900,000 2,970,688 0.15Extra Space Storage LP, REIT, 144A
3.125% 01/10/2035 USD 6,350,000 6,778,625 0.34Illumina, Inc. 0% 15/06/2019 USD 6,575,000 6,703,936 0.33Intercept Pharmaceuticals, Inc. 3.25%
01/07/2023 USD 3,025,000 2,972,199 0.15Live Nation Entertainment, Inc. 2.5%
15/05/2019 USD 3,800,000 4,341,500 0.22Nuance Communications, Inc. 1%
15/12/2035 USD 4,800,000 4,677,000 0.23ON Semiconductor Corp. 1% 01/12/2020 USD 6,125,000 6,418,204 0.32Priceline Group, Inc. (The) 0.9%
15/09/2021 USD 4,200,000 4,827,375 0.24Shutterfl y, Inc. 0.25% 15/05/2018 USD 4,050,000 4,051,498 0.20Spirit Realty Capital, Inc., REIT 3.75%
15/05/2021 USD 3,875,000 3,855,625 0.19Starwood Property Trust, Inc., REIT 4.55%
01/03/2018 USD 4,531,000 4,927,032 0.24Tesla, Inc. 0.25% 01/03/2019 USD 2,550,000 2,919,941 0.14Viavi Solutions, Inc. 0.625% 15/08/2033 USD 3,925,000 4,369,016 0.22
77,762,147 3.86
Total Convertible Bonds 148,723,476 7.38
Corporate Bonds
AustraliaAPT Pipelines Ltd., 144A 4.2%
23/03/2025 USD 2,475,000 2,565,672 0.13APT Pipelines Ltd., Reg. S 3.5%
22/03/2030 GBP 1,000,000 1,354,988 0.07Aurizon Network Pty. Ltd., Reg. S 3.125%
01/06/2026 EUR 6,050,000 7,623,150 0.38Commonwealth Bank of Australia, Reg. S,
FRN 2% 22/04/2027 EUR 4,700,000 5,515,774 0.27Origin Energy Finance Ltd., Reg. S, FRN
7.875% 16/06/2071 EUR 5,000,000 6,044,366 0.30Santos Finance Ltd., FRN 8.25%
22/09/2070 EUR 3,150,000 3,639,854 0.18Transurban Finance Co. Pty. Ltd., 144A
3.375% 22/03/2027 USD 2,650,000 2,595,039 0.13
29,338,843 1.46
AustriaVienna Insurance Group AG Wiener
Versicherung Gruppe, Reg. S, FRN 5.5% 09/10/2043 EUR 2,200,000 2,963,076 0.15
2,963,076 0.15
SCHEDULE OF INVESTMENTSAs at 30 June 2017
Investments Currency
Quantity/Nominal
Value
Market Value USD
% of Net Assets
Transferable securities and money market instruments admitted to offi cial exchange listing or dealt in on another regulated market
Corporate Bonds (continued)
BelgiumSolvay Finance SA, Reg. S, FRN 5.118%
Perpetual EUR 3,000,000 3,824,618 0.19Solvay Finance SA, Reg. S, FRN 5.425%
Perpetual EUR 1,300,000 1,704,009 0.08
5,528,627 0.27
BrazilBanco Daycoval SA, 144A 5.75%
19/03/2019 USD 1,250,000 1,287,737 0.07BRF SA, Reg. S 2.75% 03/06/2022 EUR 2,500,000 2,888,445 0.14
4,176,182 0.21
CanadaAir Canada, 144A 7.75% 15/04/2021 USD 2,750,000 3,162,500 0.16Eldorado Gold Corp., 144A 6.125%
15/12/2020 USD 1,492,000 1,526,182 0.08IAMGOLD Corp., 144A 7% 15/04/2025 USD 3,000,000 3,105,000 0.15Lundin Mining Corp., 144A 7.5%
01/11/2020 USD 2,500,000 2,635,787 0.13
10,429,469 0.52
ChileCencosud SA, 144A 6.625% 12/02/2045 USD 1,525,000 1,666,406 0.08
1,666,406 0.08
ChinaBaidu, Inc. 2.75% 09/06/2019 USD 4,000,000 4,049,376 0.20Baidu, Inc. 2.875% 06/07/2022 USD 2,495,000 2,482,976 0.12CNRC Capital Ltd., Reg. S 1.871%
07/12/2021 EUR 4,350,000 5,016,655 0.25
11,549,007 0.57
ColombiaEcopetrol SA 5.875% 18/09/2023 USD 8,800,000 9,635,516 0.48
9,635,516 0.48
FranceAir Liquide Finance SA, 144A 1.75%
27/09/2021 USD 3,175,000 3,092,561 0.15AXA SA, Reg. S, FRN 5.125%
04/07/2043 EUR 950,000 1,288,889 0.06BPCE SA, 144A 5.15% 21/07/2024 USD 3,500,000 3,749,498 0.19Credit Agricole Assurances SA, Reg. S,
FRN 4.5% Perpetual EUR 4,500,000 5,561,668 0.28Electricite de France SA, Reg. S, FRN 5%
Perpetual EUR 4,800,000 5,877,686 0.29Eurofi ns Scientifi c SE, Reg. S, FRN 4.875%
Perpetual EUR 2,000,000 2,448,511 0.12Europcar Groupe SA, Reg. S 5.75%
15/06/2022 EUR 2,600,000 3,134,207 0.16SFR Group SA, 144A 6% 15/05/2022 USD 2,732,000 2,858,601 0.14TOTAL SA, Reg. S, FRN 2.25% Perpetual EUR 6,000,000 6,939,766 0.35
34,951,387 1.74
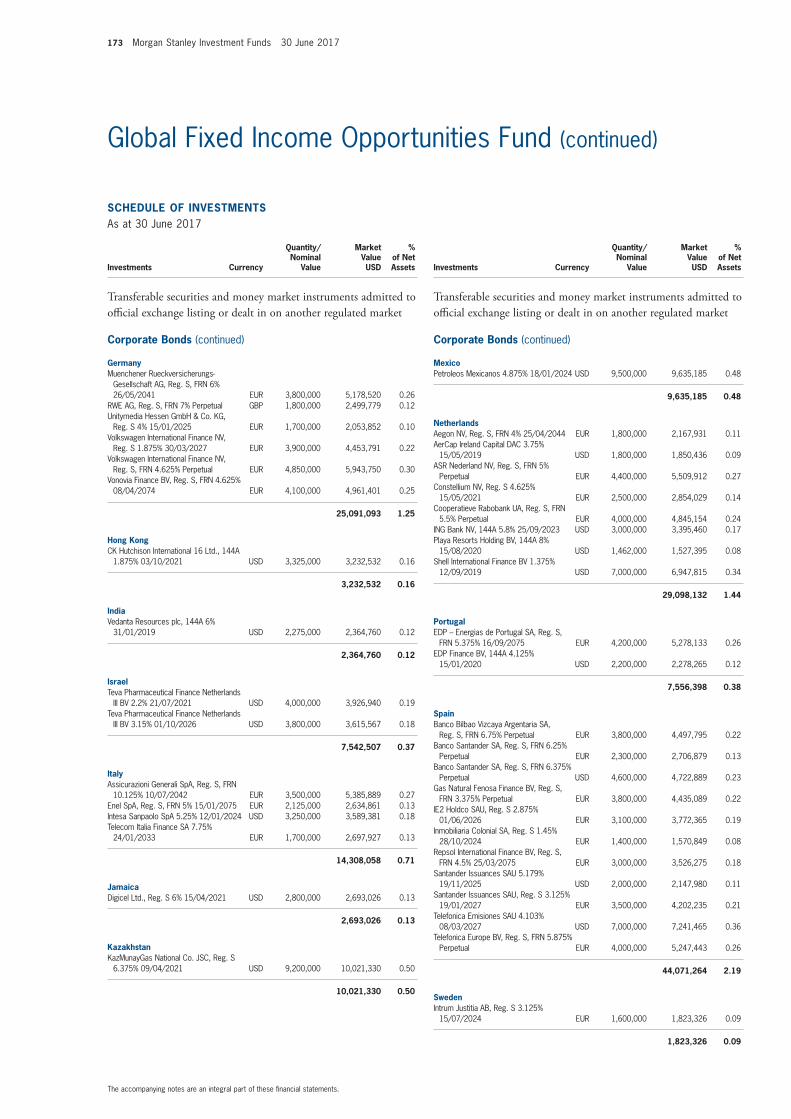
173 Morgan Stanley Investment Funds 30 June 2017
The accompanying notes are an integral part of these fi nancial statements.
Global Fixed Income Opportunities Fund (continued)
SCHEDULE OF INVESTMENTSAs at 30 June 2017
Investments Currency
Quantity/Nominal
Value
Market Value USD
% of Net Assets
Transferable securities and money market instruments admitted to offi cial exchange listing or dealt in on another regulated market
Corporate Bonds (continued)
GermanyMuenchener Rueckversicherungs-
Gesellschaft AG, Reg. S, FRN 6% 26/05/2041 EUR 3,800,000 5,178,520 0.26
RWE AG, Reg. S, FRN 7% Perpetual GBP 1,800,000 2,499,779 0.12Unitymedia Hessen GmbH & Co. KG,
Reg. S 4% 15/01/2025 EUR 1,700,000 2,053,852 0.10Volkswagen International Finance NV,
Reg. S 1.875% 30/03/2027 EUR 3,900,000 4,453,791 0.22Volkswagen International Finance NV,
Reg. S, FRN 4.625% Perpetual EUR 4,850,000 5,943,750 0.30Vonovia Finance BV, Reg. S, FRN 4.625%
08/04/2074 EUR 4,100,000 4,961,401 0.25
25,091,093 1.25
Hong KongCK Hutchison International 16 Ltd., 144A
1.875% 03/10/2021 USD 3,325,000 3,232,532 0.16
3,232,532 0.16
IndiaVedanta Resources plc, 144A 6%
31/01/2019 USD 2,275,000 2,364,760 0.12
2,364,760 0.12
IsraelTeva Pharmaceutical Finance Netherlands
III BV 2.2% 21/07/2021 USD 4,000,000 3,926,940 0.19Teva Pharmaceutical Finance Netherlands
III BV 3.15% 01/10/2026 USD 3,800,000 3,615,567 0.18
7,542,507 0.37
ItalyAssicurazioni Generali SpA, Reg. S, FRN
10.125% 10/07/2042 EUR 3,500,000 5,385,889 0.27Enel SpA, Reg. S, FRN 5% 15/01/2075 EUR 2,125,000 2,634,861 0.13Intesa Sanpaolo SpA 5.25% 12/01/2024 USD 3,250,000 3,589,381 0.18Telecom Italia Finance SA 7.75%
24/01/2033 EUR 1,700,000 2,697,927 0.13
14,308,058 0.71
JamaicaDigicel Ltd., Reg. S 6% 15/04/2021 USD 2,800,000 2,693,026 0.13
2,693,026 0.13
KazakhstanKazMunayGas National Co. JSC, Reg. S
6.375% 09/04/2021 USD 9,200,000 10,021,330 0.50
10,021,330 0.50
SCHEDULE OF INVESTMENTSAs at 30 June 2017
Investments Currency
Quantity/Nominal
Value
Market Value USD
% of Net Assets
Transferable securities and money market instruments admitted to offi cial exchange listing or dealt in on another regulated market
Corporate Bonds (continued)
MexicoPetroleos Mexicanos 4.875% 18/01/2024 USD 9,500,000 9,635,185 0.48
9,635,185 0.48
NetherlandsAegon NV, Reg. S, FRN 4% 25/04/2044 EUR 1,800,000 2,167,931 0.11AerCap Ireland Capital DAC 3.75%
15/05/2019 USD 1,800,000 1,850,436 0.09ASR Nederland NV, Reg. S, FRN 5%
Perpetual EUR 4,400,000 5,509,912 0.27Constellium NV, Reg. S 4.625%
15/05/2021 EUR 2,500,000 2,854,029 0.14Cooperatieve Rabobank UA, Reg. S, FRN
5.5% Perpetual EUR 4,000,000 4,845,154 0.24ING Bank NV, 144A 5.8% 25/09/2023 USD 3,000,000 3,395,460 0.17Playa Resorts Holding BV, 144A 8%
15/08/2020 USD 1,462,000 1,527,395 0.08Shell International Finance BV 1.375%
12/09/2019 USD 7,000,000 6,947,815 0.34
29,098,132 1.44
PortugalEDP – Energias de Portugal SA, Reg. S,
FRN 5.375% 16/09/2075 EUR 4,200,000 5,278,133 0.26EDP Finance BV, 144A 4.125%
15/01/2020 USD 2,200,000 2,278,265 0.12
7,556,398 0.38
SpainBanco Bilbao Vizcaya Argentaria SA,
Reg. S, FRN 6.75% Perpetual EUR 3,800,000 4,497,795 0.22Banco Santander SA, Reg. S, FRN 6.25%
Perpetual EUR 2,300,000 2,706,879 0.13Banco Santander SA, Reg. S, FRN 6.375%
Perpetual USD 4,600,000 4,722,889 0.23Gas Natural Fenosa Finance BV, Reg. S,
FRN 3.375% Perpetual EUR 3,800,000 4,435,089 0.22IE2 Holdco SAU, Reg. S 2.875%
01/06/2026 EUR 3,100,000 3,772,365 0.19Inmobiliaria Colonial SA, Reg. S 1.45%
28/10/2024 EUR 1,400,000 1,570,849 0.08Repsol International Finance BV, Reg. S,
FRN 4.5% 25/03/2075 EUR 3,000,000 3,526,275 0.18Santander Issuances SAU 5.179%
19/11/2025 USD 2,000,000 2,147,980 0.11Santander Issuances SAU, Reg. S 3.125%
19/01/2027 EUR 3,500,000 4,202,235 0.21Telefonica Emisiones SAU 4.103%
08/03/2027 USD 7,000,000 7,241,465 0.36Telefonica Europe BV, Reg. S, FRN 5.875%
Perpetual EUR 4,000,000 5,247,443 0.26
44,071,264 2.19
SwedenIntrum Justitia AB, Reg. S 3.125%
15/07/2024 EUR 1,600,000 1,823,326 0.09
1,823,326 0.09
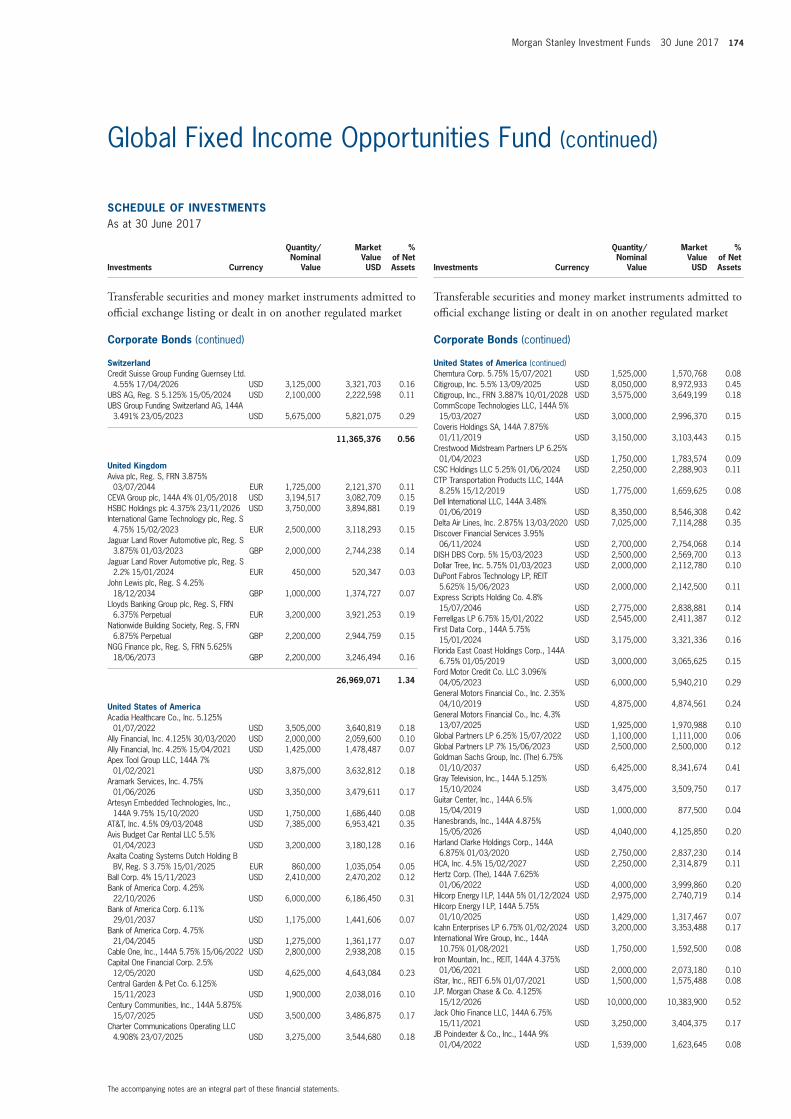
Morgan Stanley Investment Funds 30 June 2017 174
The accompanying notes are an integral part of these fi nancial statements.
Global Fixed Income Opportunities Fund (continued)
SCHEDULE OF INVESTMENTSAs at 30 June 2017
Investments Currency
Quantity/Nominal
Value
Market Value USD
% of Net Assets
Transferable securities and money market instruments admitted to offi cial exchange listing or dealt in on another regulated market
Corporate Bonds (continued)
SwitzerlandCredit Suisse Group Funding Guernsey Ltd.
4.55% 17/04/2026 USD 3,125,000 3,321,703 0.16UBS AG, Reg. S 5.125% 15/05/2024 USD 2,100,000 2,222,598 0.11UBS Group Funding Switzerland AG, 144A
3.491% 23/05/2023 USD 5,675,000 5,821,075 0.29
11,365,376 0.56
United KingdomAviva plc, Reg. S, FRN 3.875%
03/07/2044 EUR 1,725,000 2,121,370 0.11CEVA Group plc, 144A 4% 01/05/2018 USD 3,194,517 3,082,709 0.15HSBC Holdings plc 4.375% 23/11/2026 USD 3,750,000 3,894,881 0.19International Game Technology plc, Reg. S
4.75% 15/02/2023 EUR 2,500,000 3,118,293 0.15Jaguar Land Rover Automotive plc, Reg. S
3.875% 01/03/2023 GBP 2,000,000 2,744,238 0.14Jaguar Land Rover Automotive plc, Reg. S
2.2% 15/01/2024 EUR 450,000 520,347 0.03John Lewis plc, Reg. S 4.25%
18/12/2034 GBP 1,000,000 1,374,727 0.07Lloyds Banking Group plc, Reg. S, FRN
6.375% Perpetual EUR 3,200,000 3,921,253 0.19Nationwide Building Society, Reg. S, FRN
6.875% Perpetual GBP 2,200,000 2,944,759 0.15NGG Finance plc, Reg. S, FRN 5.625%
18/06/2073 GBP 2,200,000 3,246,494 0.16
26,969,071 1.34
United States of AmericaAcadia Healthcare Co., Inc. 5.125%
01/07/2022 USD 3,505,000 3,640,819 0.18Ally Financial, Inc. 4.125% 30/03/2020 USD 2,000,000 2,059,600 0.10Ally Financial, Inc. 4.25% 15/04/2021 USD 1,425,000 1,478,487 0.07Apex Tool Group LLC, 144A 7%
01/02/2021 USD 3,875,000 3,632,812 0.18Aramark Services, Inc. 4.75%
01/06/2026 USD 3,350,000 3,479,611 0.17Artesyn Embedded Technologies, Inc.,
144A 9.75% 15/10/2020 USD 1,750,000 1,686,440 0.08AT&T, Inc. 4.5% 09/03/2048 USD 7,385,000 6,953,421 0.35Avis Budget Car Rental LLC 5.5%
01/04/2023 USD 3,200,000 3,180,128 0.16Axalta Coating Systems Dutch Holding B
BV, Reg. S 3.75% 15/01/2025 EUR 860,000 1,035,054 0.05Ball Corp. 4% 15/11/2023 USD 2,410,000 2,470,202 0.12Bank of America Corp. 4.25%
22/10/2026 USD 6,000,000 6,186,450 0.31Bank of America Corp. 6.11%
29/01/2037 USD 1,175,000 1,441,606 0.07Bank of America Corp. 4.75%
21/04/2045 USD 1,275,000 1,361,177 0.07Cable One, Inc., 144A 5.75% 15/06/2022 USD 2,800,000 2,938,208 0.15Capital One Financial Corp. 2.5%
12/05/2020 USD 4,625,000 4,643,084 0.23Central Garden & Pet Co. 6.125%
15/11/2023 USD 1,900,000 2,038,016 0.10Century Communities, Inc., 144A 5.875%
15/07/2025 USD 3,500,000 3,486,875 0.17Charter Communications Operating LLC
4.908% 23/07/2025 USD 3,275,000 3,544,680 0.18
SCHEDULE OF INVESTMENTSAs at 30 June 2017
Investments Currency
Quantity/Nominal
Value
Market Value USD
% of Net Assets
Transferable securities and money market instruments admitted to offi cial exchange listing or dealt in on another regulated market
Corporate Bonds (continued)
United States of America (continued)Chemtura Corp. 5.75% 15/07/2021 USD 1,525,000 1,570,768 0.08Citigroup, Inc. 5.5% 13/09/2025 USD 8,050,000 8,972,933 0.45Citigroup, Inc., FRN 3.887% 10/01/2028 USD 3,575,000 3,649,199 0.18CommScope Technologies LLC, 144A 5%
15/03/2027 USD 3,000,000 2,996,370 0.15Coveris Holdings SA, 144A 7.875%
01/11/2019 USD 3,150,000 3,103,443 0.15Crestwood Midstream Partners LP 6.25%
01/04/2023 USD 1,750,000 1,783,574 0.09CSC Holdings LLC 5.25% 01/06/2024 USD 2,250,000 2,288,903 0.11CTP Transportation Products LLC, 144A
8.25% 15/12/2019 USD 1,775,000 1,659,625 0.08Dell International LLC, 144A 3.48%
01/06/2019 USD 8,350,000 8,546,308 0.42Delta Air Lines, Inc. 2.875% 13/03/2020 USD 7,025,000 7,114,288 0.35Discover Financial Services 3.95%
06/11/2024 USD 2,700,000 2,754,068 0.14DISH DBS Corp. 5% 15/03/2023 USD 2,500,000 2,569,700 0.13Dollar Tree, Inc. 5.75% 01/03/2023 USD 2,000,000 2,112,780 0.10DuPont Fabros Technology LP, REIT
5.625% 15/06/2023 USD 2,000,000 2,142,500 0.11Express Scripts Holding Co. 4.8%
15/07/2046 USD 2,775,000 2,838,881 0.14Ferrellgas LP 6.75% 15/01/2022 USD 2,545,000 2,411,387 0.12First Data Corp., 144A 5.75%
15/01/2024 USD 3,175,000 3,321,336 0.16Florida East Coast Holdings Corp., 144A
6.75% 01/05/2019 USD 3,000,000 3,065,625 0.15Ford Motor Credit Co. LLC 3.096%
04/05/2023 USD 6,000,000 5,940,210 0.29General Motors Financial Co., Inc. 2.35%
04/10/2019 USD 4,875,000 4,874,561 0.24General Motors Financial Co., Inc. 4.3%
13/07/2025 USD 1,925,000 1,970,988 0.10Global Partners LP 6.25% 15/07/2022 USD 1,100,000 1,111,000 0.06Global Partners LP 7% 15/06/2023 USD 2,500,000 2,500,000 0.12Goldman Sachs Group, Inc. (The) 6.75%
01/10/2037 USD 6,425,000 8,341,674 0.41Gray Television, Inc., 144A 5.125%
15/10/2024 USD 3,475,000 3,509,750 0.17Guitar Center, Inc., 144A 6.5%
15/04/2019 USD 1,000,000 877,500 0.04Hanesbrands, Inc., 144A 4.875%
15/05/2026 USD 4,040,000 4,125,850 0.20Harland Clarke Holdings Corp., 144A
6.875% 01/03/2020 USD 2,750,000 2,837,230 0.14HCA, Inc. 4.5% 15/02/2027 USD 2,250,000 2,314,879 0.11Hertz Corp. (The), 144A 7.625%
01/06/2022 USD 4,000,000 3,999,860 0.20Hilcorp Energy I LP, 144A 5% 01/12/2024 USD 2,975,000 2,740,719 0.14Hilcorp Energy I LP, 144A 5.75%
01/10/2025 USD 1,429,000 1,317,467 0.07Icahn Enterprises LP 6.75% 01/02/2024 USD 3,200,000 3,353,488 0.17International Wire Group, Inc., 144A
10.75% 01/08/2021 USD 1,750,000 1,592,500 0.08Iron Mountain, Inc., REIT, 144A 4.375%
01/06/2021 USD 2,000,000 2,073,180 0.10iStar, Inc., REIT 6.5% 01/07/2021 USD 1,500,000 1,575,488 0.08J.P. Morgan Chase & Co. 4.125%
15/12/2026 USD 10,000,000 10,383,900 0.52Jack Ohio Finance LLC, 144A 6.75%
15/11/2021 USD 3,250,000 3,404,375 0.17JB Poindexter & Co., Inc., 144A 9%
01/04/2022 USD 1,539,000 1,623,645 0.08
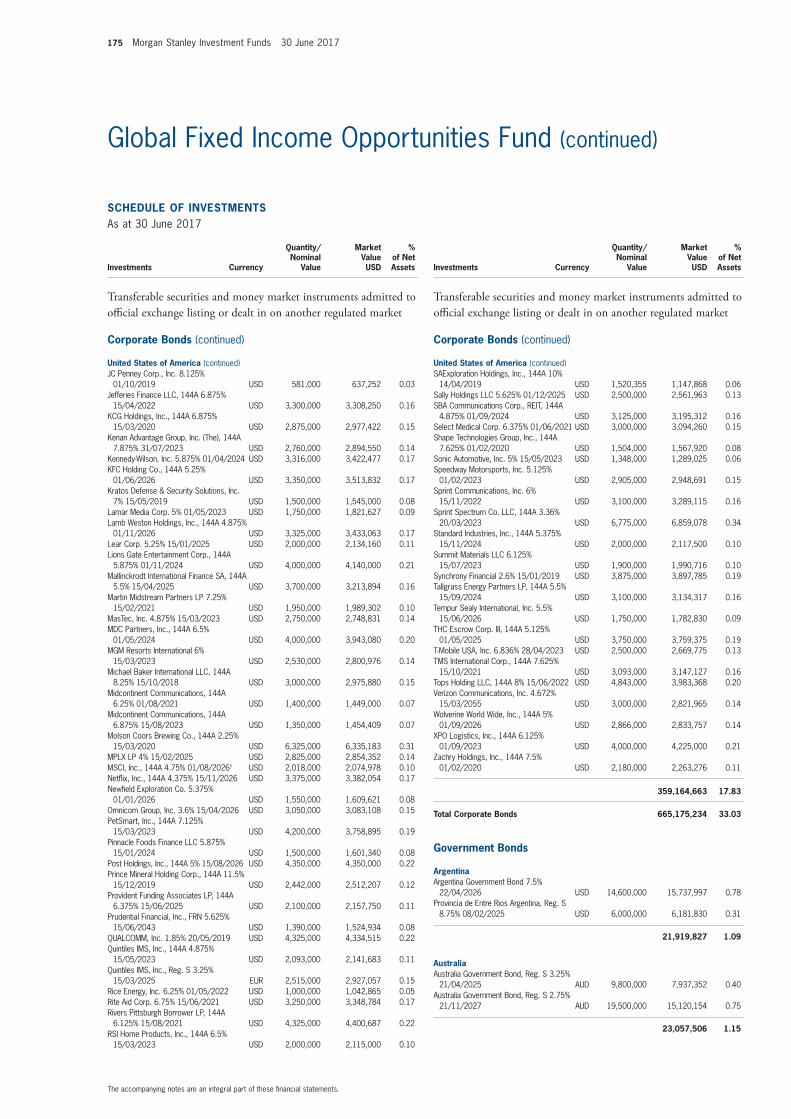
175 Morgan Stanley Investment Funds 30 June 2017
The accompanying notes are an integral part of these fi nancial statements.
Global Fixed Income Opportunities Fund (continued)
SCHEDULE OF INVESTMENTSAs at 30 June 2017
Investments Currency
Quantity/Nominal
Value
Market Value USD
% of Net Assets
Transferable securities and money market instruments admitted to offi cial exchange listing or dealt in on another regulated market
Corporate Bonds (continued)
United States of America (continued)JC Penney Corp., Inc. 8.125%
01/10/2019 USD 581,000 637,252 0.03Jefferies Finance LLC, 144A 6.875%
15/04/2022 USD 3,300,000 3,308,250 0.16KCG Holdings, Inc., 144A 6.875%
15/03/2020 USD 2,875,000 2,977,422 0.15Kenan Advantage Group, Inc. (The), 144A
7.875% 31/07/2023 USD 2,760,000 2,894,550 0.14Kennedy-Wilson, Inc. 5.875% 01/04/2024 USD 3,316,000 3,422,477 0.17KFC Holding Co., 144A 5.25%
01/06/2026 USD 3,350,000 3,513,832 0.17Kratos Defense & Security Solutions, Inc.
7% 15/05/2019 USD 1,500,000 1,545,000 0.08Lamar Media Corp. 5% 01/05/2023 USD 1,750,000 1,821,627 0.09Lamb Weston Holdings, Inc., 144A 4.875%
01/11/2026 USD 3,325,000 3,433,063 0.17Lear Corp. 5.25% 15/01/2025 USD 2,000,000 2,134,160 0.11Lions Gate Entertainment Corp., 144A
5.875% 01/11/2024 USD 4,000,000 4,140,000 0.21Mallinckrodt International Finance SA, 144A
5.5% 15/04/2025 USD 3,700,000 3,213,894 0.16Martin Midstream Partners LP 7.25%
15/02/2021 USD 1,950,000 1,989,302 0.10MasTec, Inc. 4.875% 15/03/2023 USD 2,750,000 2,748,831 0.14MDC Partners, Inc., 144A 6.5%
01/05/2024 USD 4,000,000 3,943,080 0.20MGM Resorts International 6%
15/03/2023 USD 2,530,000 2,800,976 0.14Michael Baker International LLC, 144A
8.25% 15/10/2018 USD 3,000,000 2,975,880 0.15Midcontinent Communications, 144A
6.25% 01/08/2021 USD 1,400,000 1,449,000 0.07Midcontinent Communications, 144A
6.875% 15/08/2023 USD 1,350,000 1,454,409 0.07Molson Coors Brewing Co., 144A 2.25%
15/03/2020 USD 6,325,000 6,335,183 0.31MPLX LP 4% 15/02/2025 USD 2,825,000 2,854,352 0.14MSCI, Inc., 144A 4.75% 01/08/2026† USD 2,018,000 2,074,978 0.10Netfl ix, Inc., 144A 4.375% 15/11/2026 USD 3,375,000 3,382,054 0.17Newfi eld Exploration Co. 5.375%
01/01/2026 USD 1,550,000 1,609,621 0.08Omnicom Group, Inc. 3.6% 15/04/2026 USD 3,050,000 3,083,108 0.15PetSmart, Inc., 144A 7.125%
15/03/2023 USD 4,200,000 3,758,895 0.19Pinnacle Foods Finance LLC 5.875%
15/01/2024 USD 1,500,000 1,601,340 0.08Post Holdings, Inc., 144A 5% 15/08/2026 USD 4,350,000 4,350,000 0.22Prince Mineral Holding Corp., 144A 11.5%
15/12/2019 USD 2,442,000 2,512,207 0.12Provident Funding Associates LP, 144A
6.375% 15/06/2025 USD 2,100,000 2,157,750 0.11Prudential Financial, Inc., FRN 5.625%
15/06/2043 USD 1,390,000 1,524,934 0.08QUALCOMM, Inc. 1.85% 20/05/2019 USD 4,325,000 4,334,515 0.22Quintiles IMS, Inc., 144A 4.875%
15/05/2023 USD 2,093,000 2,141,683 0.11Quintiles IMS, Inc., Reg. S 3.25%
15/03/2025 EUR 2,515,000 2,927,057 0.15Rice Energy, Inc. 6.25% 01/05/2022 USD 1,000,000 1,042,865 0.05Rite Aid Corp. 6.75% 15/06/2021 USD 3,250,000 3,348,784 0.17Rivers Pittsburgh Borrower LP, 144A
6.125% 15/08/2021 USD 4,325,000 4,400,687 0.22RSI Home Products, Inc., 144A 6.5%
15/03/2023 USD 2,000,000 2,115,000 0.10
SCHEDULE OF INVESTMENTSAs at 30 June 2017
Investments Currency
Quantity/Nominal
Value
Market Value USD
% of Net Assets
Transferable securities and money market instruments admitted to offi cial exchange listing or dealt in on another regulated market
Corporate Bonds (continued)
United States of America (continued)SAExploration Holdings, Inc., 144A 10%
14/04/2019 USD 1,520,355 1,147,868 0.06Sally Holdings LLC 5.625% 01/12/2025 USD 2,500,000 2,561,963 0.13SBA Communications Corp., REIT, 144A
4.875% 01/09/2024 USD 3,125,000 3,195,312 0.16Select Medical Corp. 6.375% 01/06/2021 USD 3,000,000 3,094,260 0.15Shape Technologies Group, Inc., 144A
7.625% 01/02/2020 USD 1,504,000 1,567,920 0.08Sonic Automotive, Inc. 5% 15/05/2023 USD 1,348,000 1,289,025 0.06Speedway Motorsports, Inc. 5.125%
01/02/2023 USD 2,905,000 2,948,691 0.15Sprint Communications, Inc. 6%
15/11/2022 USD 3,100,000 3,289,115 0.16Sprint Spectrum Co. LLC, 144A 3.36%
20/03/2023 USD 6,775,000 6,859,078 0.34Standard Industries, Inc., 144A 5.375%
15/11/2024 USD 2,000,000 2,117,500 0.10Summit Materials LLC 6.125%
15/07/2023 USD 1,900,000 1,990,716 0.10Synchrony Financial 2.6% 15/01/2019 USD 3,875,000 3,897,785 0.19Tallgrass Energy Partners LP, 144A 5.5%
15/09/2024 USD 3,100,000 3,134,317 0.16Tempur Sealy International, Inc. 5.5%
15/06/2026 USD 1,750,000 1,782,830 0.09THC Escrow Corp. III, 144A 5.125%
01/05/2025 USD 3,750,000 3,759,375 0.19T-Mobile USA, Inc. 6.836% 28/04/2023 USD 2,500,000 2,669,775 0.13TMS International Corp., 144A 7.625%
15/10/2021 USD 3,093,000 3,147,127 0.16Tops Holding LLC, 144A 8% 15/06/2022 USD 4,843,000 3,983,368 0.20Verizon Communications, Inc. 4.672%
15/03/2055 USD 3,000,000 2,821,965 0.14Wolverine World Wide, Inc., 144A 5%
01/09/2026 USD 2,866,000 2,833,757 0.14XPO Logistics, Inc., 144A 6.125%
01/09/2023 USD 4,000,000 4,225,000 0.21Zachry Holdings, Inc., 144A 7.5%
01/02/2020 USD 2,180,000 2,263,276 0.11
359,164,663 17.83
Total Corporate Bonds 665,175,234 33.03
Government Bonds
ArgentinaArgentina Government Bond 7.5%
22/04/2026 USD 14,600,000 15,737,997 0.78Provincia de Entre Rios Argentina, Reg. S
8.75% 08/02/2025 USD 6,000,000 6,181,830 0.31
21,919,827 1.09
AustraliaAustralia Government Bond, Reg. S 3.25%
21/04/2025 AUD 9,800,000 7,937,352 0.40Australia Government Bond, Reg. S 2.75%
21/11/2027 AUD 19,500,000 15,120,154 0.75
23,057,506 1.15
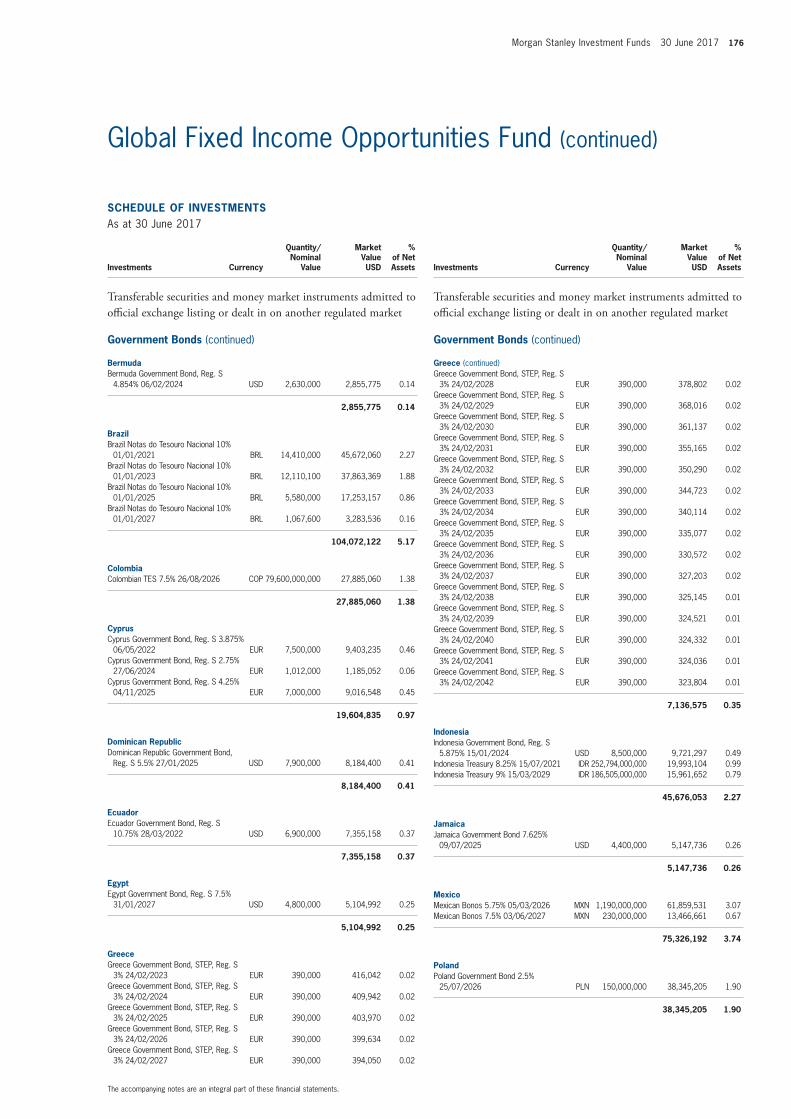
Morgan Stanley Investment Funds 30 June 2017 176
The accompanying notes are an integral part of these fi nancial statements.
Global Fixed Income Opportunities Fund (continued)
SCHEDULE OF INVESTMENTSAs at 30 June 2017
Investments Currency
Quantity/Nominal
Value
Market Value USD
% of Net Assets
Transferable securities and money market instruments admitted to offi cial exchange listing or dealt in on another regulated market
Government Bonds (continued)
BermudaBermuda Government Bond, Reg. S
4.854% 06/02/2024 USD 2,630,000 2,855,775 0.14
2,855,775 0.14
BrazilBrazil Notas do Tesouro Nacional 10%
01/01/2021 BRL 14,410,000 45,672,060 2.27Brazil Notas do Tesouro Nacional 10%
01/01/2023 BRL 12,110,100 37,863,369 1.88Brazil Notas do Tesouro Nacional 10%
01/01/2025 BRL 5,580,000 17,253,157 0.86Brazil Notas do Tesouro Nacional 10%
01/01/2027 BRL 1,067,600 3,283,536 0.16
104,072,122 5.17
ColombiaColombian TES 7.5% 26/08/2026 COP 79,600,000,000 27,885,060 1.38
27,885,060 1.38
CyprusCyprus Government Bond, Reg. S 3.875%
06/05/2022 EUR 7,500,000 9,403,235 0.46Cyprus Government Bond, Reg. S 2.75%
27/06/2024 EUR 1,012,000 1,185,052 0.06Cyprus Government Bond, Reg. S 4.25%
04/11/2025 EUR 7,000,000 9,016,548 0.45
19,604,835 0.97
Dominican RepublicDominican Republic Government Bond,
Reg. S 5.5% 27/01/2025 USD 7,900,000 8,184,400 0.41
8,184,400 0.41
EcuadorEcuador Government Bond, Reg. S
10.75% 28/03/2022 USD 6,900,000 7,355,158 0.37
7,355,158 0.37
EgyptEgypt Government Bond, Reg. S 7.5%
31/01/2027 USD 4,800,000 5,104,992 0.25
5,104,992 0.25
GreeceGreece Government Bond, STEP, Reg. S
3% 24/02/2023 EUR 390,000 416,042 0.02Greece Government Bond, STEP, Reg. S
3% 24/02/2024 EUR 390,000 409,942 0.02Greece Government Bond, STEP, Reg. S
3% 24/02/2025 EUR 390,000 403,970 0.02Greece Government Bond, STEP, Reg. S
3% 24/02/2026 EUR 390,000 399,634 0.02Greece Government Bond, STEP, Reg. S
3% 24/02/2027 EUR 390,000 394,050 0.02
SCHEDULE OF INVESTMENTSAs at 30 June 2017
Investments Currency
Quantity/Nominal
Value
Market Value USD
% of Net Assets
Transferable securities and money market instruments admitted to offi cial exchange listing or dealt in on another regulated market
Government Bonds (continued)
Greece (continued)Greece Government Bond, STEP, Reg. S
3% 24/02/2028 EUR 390,000 378,802 0.02Greece Government Bond, STEP, Reg. S
3% 24/02/2029 EUR 390,000 368,016 0.02Greece Government Bond, STEP, Reg. S
3% 24/02/2030 EUR 390,000 361,137 0.02Greece Government Bond, STEP, Reg. S
3% 24/02/2031 EUR 390,000 355,165 0.02Greece Government Bond, STEP, Reg. S
3% 24/02/2032 EUR 390,000 350,290 0.02Greece Government Bond, STEP, Reg. S
3% 24/02/2033 EUR 390,000 344,723 0.02Greece Government Bond, STEP, Reg. S
3% 24/02/2034 EUR 390,000 340,114 0.02Greece Government Bond, STEP, Reg. S
3% 24/02/2035 EUR 390,000 335,077 0.02Greece Government Bond, STEP, Reg. S
3% 24/02/2036 EUR 390,000 330,572 0.02Greece Government Bond, STEP, Reg. S
3% 24/02/2037 EUR 390,000 327,203 0.02Greece Government Bond, STEP, Reg. S
3% 24/02/2038 EUR 390,000 325,145 0.01Greece Government Bond, STEP, Reg. S
3% 24/02/2039 EUR 390,000 324,521 0.01Greece Government Bond, STEP, Reg. S
3% 24/02/2040 EUR 390,000 324,332 0.01Greece Government Bond, STEP, Reg. S
3% 24/02/2041 EUR 390,000 324,036 0.01Greece Government Bond, STEP, Reg. S
3% 24/02/2042 EUR 390,000 323,804 0.01
7,136,575 0.35
IndonesiaIndonesia Government Bond, Reg. S
5.875% 15/01/2024 USD 8,500,000 9,721,297 0.49Indonesia Treasury 8.25% 15/07/2021 IDR 252,794,000,000 19,993,104 0.99Indonesia Treasury 9% 15/03/2029 IDR 186,505,000,000 15,961,652 0.79
45,676,053 2.27
JamaicaJamaica Government Bond 7.625%
09/07/2025 USD 4,400,000 5,147,736 0.26
5,147,736 0.26
MexicoMexican Bonos 5.75% 05/03/2026 MXN 1,190,000,000 61,859,531 3.07Mexican Bonos 7.5% 03/06/2027 MXN 230,000,000 13,466,661 0.67
75,326,192 3.74
PolandPoland Government Bond 2.5%
25/07/2026 PLN 150,000,000 38,345,205 1.90
38,345,205 1.90
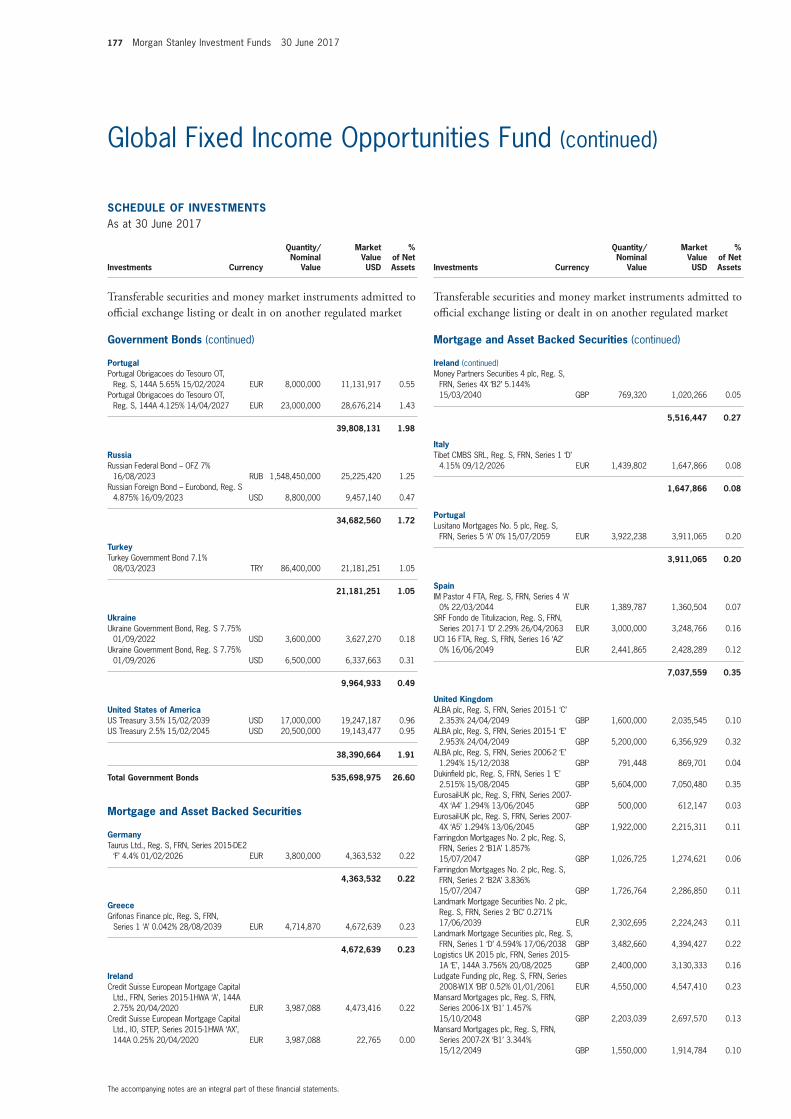
177 Morgan Stanley Investment Funds 30 June 2017
The accompanying notes are an integral part of these fi nancial statements.
Global Fixed Income Opportunities Fund (continued)
SCHEDULE OF INVESTMENTSAs at 30 June 2017
Investments Currency
Quantity/Nominal
Value
Market Value USD
% of Net Assets
Transferable securities and money market instruments admitted to offi cial exchange listing or dealt in on another regulated market
Government Bonds (continued)
PortugalPortugal Obrigacoes do Tesouro OT,
Reg. S, 144A 5.65% 15/02/2024 EUR 8,000,000 11,131,917 0.55Portugal Obrigacoes do Tesouro OT,
Reg. S, 144A 4.125% 14/04/2027 EUR 23,000,000 28,676,214 1.43
39,808,131 1.98
RussiaRussian Federal Bond – OFZ 7%
16/08/2023 RUB 1,548,450,000 25,225,420 1.25Russian Foreign Bond – Eurobond, Reg. S
4.875% 16/09/2023 USD 8,800,000 9,457,140 0.47
34,682,560 1.72
TurkeyTurkey Government Bond 7.1%
08/03/2023 TRY 86,400,000 21,181,251 1.05
21,181,251 1.05
UkraineUkraine Government Bond, Reg. S 7.75%
01/09/2022 USD 3,600,000 3,627,270 0.18Ukraine Government Bond, Reg. S 7.75%
01/09/2026 USD 6,500,000 6,337,663 0.31
9,964,933 0.49
United States of AmericaUS Treasury 3.5% 15/02/2039 USD 17,000,000 19,247,187 0.96US Treasury 2.5% 15/02/2045 USD 20,500,000 19,143,477 0.95
38,390,664 1.91
Total Government Bonds 535,698,975 26.60
Mortgage and Asset Backed Securities
GermanyTaurus Ltd., Reg. S, FRN, Series 2015-DE2
‘F’ 4.4% 01/02/2026 EUR 3,800,000 4,363,532 0.22
4,363,532 0.22
GreeceGrifonas Finance plc, Reg. S, FRN,
Series 1 ‘A’ 0.042% 28/08/2039 EUR 4,714,870 4,672,639 0.23
4,672,639 0.23
IrelandCredit Suisse European Mortgage Capital
Ltd., FRN, Series 2015-1HWA ‘A’, 144A 2.75% 20/04/2020 EUR 3,987,088 4,473,416 0.22
Credit Suisse European Mortgage Capital Ltd., IO, STEP, Series 2015-1HWA ‘AX’, 144A 0.25% 20/04/2020 EUR 3,987,088 22,765 0.00
SCHEDULE OF INVESTMENTSAs at 30 June 2017
Investments Currency
Quantity/Nominal
Value
Market Value USD
% of Net Assets
Transferable securities and money market instruments admitted to offi cial exchange listing or dealt in on another regulated market
Mortgage and Asset Backed Securities (continued)
Ireland (continued)Money Partners Securities 4 plc, Reg. S,
FRN, Series 4X ‘B2’ 5.144% 15/03/2040 GBP 769,320 1,020,266 0.05
5,516,447 0.27
ItalyTibet CMBS SRL, Reg. S, FRN, Series 1 ‘D’
4.15% 09/12/2026 EUR 1,439,802 1,647,866 0.08
1,647,866 0.08
PortugalLusitano Mortgages No. 5 plc, Reg. S,
FRN, Series 5 ‘A’ 0% 15/07/2059 EUR 3,922,238 3,911,065 0.20
3,911,065 0.20
SpainIM Pastor 4 FTA, Reg. S, FRN, Series 4 ‘A’
0% 22/03/2044 EUR 1,389,787 1,360,504 0.07SRF Fondo de Titulizacion, Reg. S, FRN,
Series 2017-1 ‘D’ 2.29% 26/04/2063 EUR 3,000,000 3,248,766 0.16UCI 16 FTA, Reg. S, FRN, Series 16 ‘A2’
0% 16/06/2049 EUR 2,441,865 2,428,289 0.12
7,037,559 0.35
United KingdomALBA plc, Reg. S, FRN, Series 2015-1 ‘C’
2.353% 24/04/2049 GBP 1,600,000 2,035,545 0.10ALBA plc, Reg. S, FRN, Series 2015-1 ‘E’
2.953% 24/04/2049 GBP 5,200,000 6,356,929 0.32ALBA plc, Reg. S, FRN, Series 2006-2 ‘E’
1.294% 15/12/2038 GBP 791,448 869,701 0.04Dukinfi eld plc, Reg. S, FRN, Series 1 ‘E’
2.515% 15/08/2045 GBP 5,604,000 7,050,480 0.35Eurosail-UK plc, Reg. S, FRN, Series 2007-
4X ‘A4’ 1.294% 13/06/2045 GBP 500,000 612,147 0.03Eurosail-UK plc, Reg. S, FRN, Series 2007-
4X ‘A5’ 1.294% 13/06/2045 GBP 1,922,000 2,215,311 0.11Farringdon Mortgages No. 2 plc, Reg. S,
FRN, Series 2 ‘B1A’ 1.857% 15/07/2047 GBP 1,026,725 1,274,621 0.06
Farringdon Mortgages No. 2 plc, Reg. S, FRN, Series 2 ‘B2A’ 3.836% 15/07/2047 GBP 1,726,764 2,286,850 0.11
Landmark Mortgage Securities No. 2 plc, Reg. S, FRN, Series 2 ‘BC’ 0.271% 17/06/2039 EUR 2,302,695 2,224,243 0.11
Landmark Mortgage Securities plc, Reg. S, FRN, Series 1 ‘D’ 4.594% 17/06/2038 GBP 3,482,660 4,394,427 0.22
Logistics UK 2015 plc, FRN, Series 2015-1A ‘E’, 144A 3.756% 20/08/2025 GBP 2,400,000 3,130,333 0.16
Ludgate Funding plc, Reg. S, FRN, Series 2008-W1X ‘BB’ 0.52% 01/01/2061 EUR 4,550,000 4,547,410 0.23
Mansard Mortgages plc, Reg. S, FRN, Series 2006-1X ‘B1’ 1.457% 15/10/2048 GBP 2,203,039 2,697,570 0.13
Mansard Mortgages plc, Reg. S, FRN, Series 2007-2X ‘B1’ 3.344% 15/12/2049 GBP 1,550,000 1,914,784 0.10
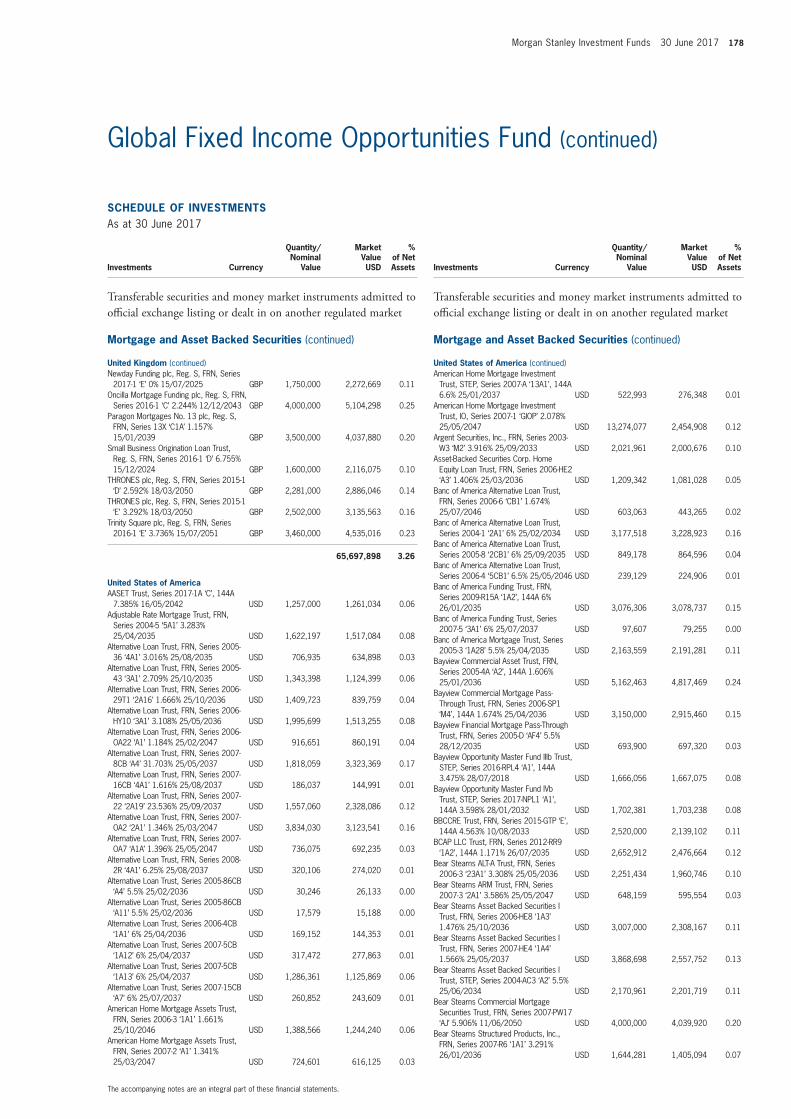
Morgan Stanley Investment Funds 30 June 2017 178
The accompanying notes are an integral part of these fi nancial statements.
Global Fixed Income Opportunities Fund (continued)
SCHEDULE OF INVESTMENTSAs at 30 June 2017
Investments Currency
Quantity/Nominal
Value
Market Value USD
% of Net Assets
Transferable securities and money market instruments admitted to offi cial exchange listing or dealt in on another regulated market
Mortgage and Asset Backed Securities (continued)
United Kingdom (continued)Newday Funding plc, Reg. S, FRN, Series
2017-1 ‘E’ 0% 15/07/2025 GBP 1,750,000 2,272,669 0.11Oncilla Mortgage Funding plc, Reg. S, FRN,
Series 2016-1 ‘C’ 2.244% 12/12/2043 GBP 4,000,000 5,104,298 0.25Paragon Mortgages No. 13 plc, Reg. S,
FRN, Series 13X ‘C1A’ 1.157% 15/01/2039 GBP 3,500,000 4,037,880 0.20
Small Business Origination Loan Trust, Reg. S, FRN, Series 2016-1 ‘D’ 6.755% 15/12/2024 GBP 1,600,000 2,116,075 0.10
THRONES plc, Reg. S, FRN, Series 2015-1 ‘D’ 2.592% 18/03/2050 GBP 2,281,000 2,886,046 0.14
THRONES plc, Reg. S, FRN, Series 2015-1 ‘E’ 3.292% 18/03/2050 GBP 2,502,000 3,135,563 0.16
Trinity Square plc, Reg. S, FRN, Series 2016-1 ‘E’ 3.736% 15/07/2051 GBP 3,460,000 4,535,016 0.23
65,697,898 3.26
United States of AmericaAASET Trust, Series 2017-1A ‘C’, 144A
7.385% 16/05/2042 USD 1,257,000 1,261,034 0.06Adjustable Rate Mortgage Trust, FRN,
Series 2004-5 ‘5A1’ 3.283% 25/04/2035 USD 1,622,197 1,517,084 0.08
Alternative Loan Trust, FRN, Series 2005-36 ‘4A1’ 3.016% 25/08/2035 USD 706,935 634,898 0.03
Alternative Loan Trust, FRN, Series 2005-43 ‘3A1’ 2.709% 25/10/2035 USD 1,343,398 1,124,399 0.06
Alternative Loan Trust, FRN, Series 2006-29T1 ‘2A16’ 1.666% 25/10/2036 USD 1,409,723 839,759 0.04
Alternative Loan Trust, FRN, Series 2006-HY10 ‘3A1’ 3.108% 25/05/2036 USD 1,995,699 1,513,255 0.08
Alternative Loan Trust, FRN, Series 2006-OA22 ‘A1’ 1.184% 25/02/2047 USD 916,651 860,191 0.04
Alternative Loan Trust, FRN, Series 2007-8CB ‘A4’ 31.703% 25/05/2037 USD 1,818,059 3,323,369 0.17
Alternative Loan Trust, FRN, Series 2007-16CB ‘4A1’ 1.616% 25/08/2037 USD 186,037 144,991 0.01
Alternative Loan Trust, FRN, Series 2007-22 ‘2A19’ 23.536% 25/09/2037 USD 1,557,060 2,328,086 0.12
Alternative Loan Trust, FRN, Series 2007-OA2 ‘2A1’ 1.346% 25/03/2047 USD 3,834,030 3,123,541 0.16
Alternative Loan Trust, FRN, Series 2007-OA7 ‘A1A’ 1.396% 25/05/2047 USD 736,075 692,235 0.03
Alternative Loan Trust, FRN, Series 2008-2R ‘4A1’ 6.25% 25/08/2037 USD 320,106 274,020 0.01
Alternative Loan Trust, Series 2005-86CB ‘A4’ 5.5% 25/02/2036 USD 30,246 26,133 0.00
Alternative Loan Trust, Series 2005-86CB ‘A11’ 5.5% 25/02/2036 USD 17,579 15,188 0.00
Alternative Loan Trust, Series 2006-4CB ‘1A1’ 6% 25/04/2036 USD 169,152 144,353 0.01
Alternative Loan Trust, Series 2007-5CB ‘1A12’ 6% 25/04/2037 USD 317,472 277,863 0.01
Alternative Loan Trust, Series 2007-5CB ‘1A13’ 6% 25/04/2037 USD 1,286,361 1,125,869 0.06
Alternative Loan Trust, Series 2007-15CB ‘A7’ 6% 25/07/2037 USD 260,852 243,609 0.01
American Home Mortgage Assets Trust, FRN, Series 2006-3 ‘1A1’ 1.661% 25/10/2046 USD 1,388,566 1,244,240 0.06
American Home Mortgage Assets Trust, FRN, Series 2007-2 ‘A1’ 1.341% 25/03/2047 USD 724,601 616,125 0.03
SCHEDULE OF INVESTMENTSAs at 30 June 2017
Investments Currency
Quantity/Nominal
Value
Market Value USD
% of Net Assets
Transferable securities and money market instruments admitted to offi cial exchange listing or dealt in on another regulated market
Mortgage and Asset Backed Securities (continued)
United States of America (continued)American Home Mortgage Investment
Trust, STEP, Series 2007-A ‘13A1’, 144A 6.6% 25/01/2037 USD 522,993 276,348 0.01
American Home Mortgage Investment Trust, IO, Series 2007-1 ‘GIOP’ 2.078% 25/05/2047 USD 13,274,077 2,454,908 0.12
Argent Securities, Inc., FRN, Series 2003-W3 ‘M2’ 3.916% 25/09/2033 USD 2,021,961 2,000,676 0.10
Asset-Backed Securities Corp. Home Equity Loan Trust, FRN, Series 2006-HE2 ‘A3’ 1.406% 25/03/2036 USD 1,209,342 1,081,028 0.05
Banc of America Alternative Loan Trust, FRN, Series 2006-6 ‘CB1’ 1.674% 25/07/2046 USD 603,063 443,265 0.02
Banc of America Alternative Loan Trust, Series 2004-1 ‘2A1’ 6% 25/02/2034 USD 3,177,518 3,228,923 0.16
Banc of America Alternative Loan Trust, Series 2005-8 ‘2CB1’ 6% 25/09/2035 USD 849,178 864,596 0.04
Banc of America Alternative Loan Trust, Series 2006-4 ‘5CB1’ 6.5% 25/05/2046 USD 239,129 224,906 0.01
Banc of America Funding Trust, FRN, Series 2009-R15A ‘1A2’, 144A 6% 26/01/2035 USD 3,076,306 3,078,737 0.15
Banc of America Funding Trust, Series 2007-5 ‘3A1’ 6% 25/07/2037 USD 97,607 79,255 0.00
Banc of America Mortgage Trust, Series 2005-3 ‘1A28’ 5.5% 25/04/2035 USD 2,163,559 2,191,281 0.11
Bayview Commercial Asset Trust, FRN, Series 2005-4A ‘A2’, 144A 1.606% 25/01/2036 USD 5,162,463 4,817,469 0.24
Bayview Commercial Mortgage Pass-Through Trust, FRN, Series 2006-SP1 ‘M4’, 144A 1.674% 25/04/2036 USD 3,150,000 2,915,460 0.15
Bayview Financial Mortgage Pass-Through Trust, FRN, Series 2005-D ‘AF4’ 5.5% 28/12/2035 USD 693,900 697,320 0.03
Bayview Opportunity Master Fund IIIb Trust, STEP, Series 2016-RPL4 ‘A1’, 144A 3.475% 28/07/2018 USD 1,666,056 1,667,075 0.08
Bayview Opportunity Master Fund IVb Trust, STEP, Series 2017-NPL1 ‘A1’, 144A 3.598% 28/01/2032 USD 1,702,381 1,703,238 0.08
BBCCRE Trust, FRN, Series 2015-GTP ‘E’, 144A 4.563% 10/08/2033 USD 2,520,000 2,139,102 0.11
BCAP LLC Trust, FRN, Series 2012-RR9 ‘1A2’, 144A 1.171% 26/07/2035 USD 2,652,912 2,476,664 0.12
Bear Stearns ALT-A Trust, FRN, Series 2006-3 ‘23A1’ 3.308% 25/05/2036 USD 2,251,434 1,960,746 0.10
Bear Stearns ARM Trust, FRN, Series 2007-3 ‘2A1’ 3.586% 25/05/2047 USD 648,159 595,554 0.03
Bear Stearns Asset Backed Securities I Trust, FRN, Series 2006-HE8 ‘1A3’ 1.476% 25/10/2036 USD 3,007,000 2,308,167 0.11
Bear Stearns Asset Backed Securities I Trust, FRN, Series 2007-HE4 ‘1A4’ 1.566% 25/05/2037 USD 3,868,698 2,557,752 0.13
Bear Stearns Asset Backed Securities I Trust, STEP, Series 2004-AC3 ‘A2’ 5.5% 25/06/2034 USD 2,170,961 2,201,719 0.11
Bear Stearns Commercial Mortgage Securities Trust, FRN, Series 2007-PW17 ‘AJ’ 5.906% 11/06/2050 USD 4,000,000 4,039,920 0.20
Bear Stearns Structured Products, Inc., FRN, Series 2007-R6 ‘1A1’ 3.291% 26/01/2036 USD 1,644,281 1,405,094 0.07
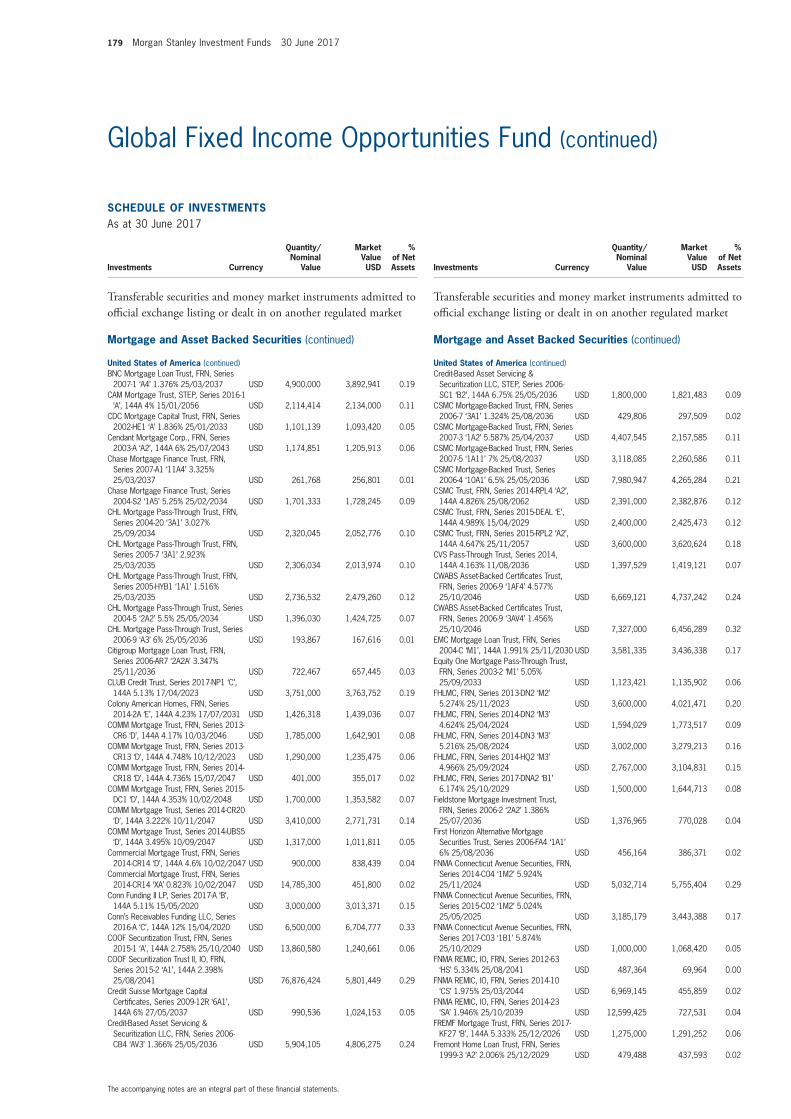
179 Morgan Stanley Investment Funds 30 June 2017
The accompanying notes are an integral part of these fi nancial statements.
Global Fixed Income Opportunities Fund (continued)
SCHEDULE OF INVESTMENTSAs at 30 June 2017
Investments Currency
Quantity/Nominal
Value
Market Value USD
% of Net Assets
Transferable securities and money market instruments admitted to offi cial exchange listing or dealt in on another regulated market
Mortgage and Asset Backed Securities (continued)
United States of America (continued)BNC Mortgage Loan Trust, FRN, Series
2007-1 ‘A4’ 1.376% 25/03/2037 USD 4,900,000 3,892,941 0.19CAM Mortgage Trust, STEP, Series 2016-1
‘A’, 144A 4% 15/01/2056 USD 2,114,414 2,134,000 0.11CDC Mortgage Capital Trust, FRN, Series
2002-HE1 ‘A’ 1.836% 25/01/2033 USD 1,101,139 1,093,420 0.05Cendant Mortgage Corp., FRN, Series
2003-A ‘A2’, 144A 6% 25/07/2043 USD 1,174,851 1,205,913 0.06Chase Mortgage Finance Trust, FRN,
Series 2007-A1 ‘11A4’ 3.325% 25/03/2037 USD 261,768 256,801 0.01
Chase Mortgage Finance Trust, Series 2004-S2 ‘1A5’ 5.25% 25/02/2034 USD 1,701,333 1,728,245 0.09
CHL Mortgage Pass-Through Trust, FRN, Series 2004-20 ‘3A1’ 3.027% 25/09/2034 USD 2,320,045 2,052,776 0.10
CHL Mortgage Pass-Through Trust, FRN, Series 2005-7 ‘3A1’ 2.923% 25/03/2035 USD 2,306,034 2,013,974 0.10
CHL Mortgage Pass-Through Trust, FRN, Series 2005-HYB1 ‘1A1’ 1.516% 25/03/2035 USD 2,736,532 2,479,260 0.12
CHL Mortgage Pass-Through Trust, Series 2004-5 ‘2A2’ 5.5% 25/05/2034 USD 1,396,030 1,424,725 0.07
CHL Mortgage Pass-Through Trust, Series 2006-9 ‘A3’ 6% 25/05/2036 USD 193,867 167,616 0.01
Citigroup Mortgage Loan Trust, FRN, Series 2006-AR7 ‘2A2A’ 3.347% 25/11/2036 USD 722,467 657,445 0.03
CLUB Credit Trust, Series 2017-NP1 ‘C’, 144A 5.13% 17/04/2023 USD 3,751,000 3,763,752 0.19
Colony American Homes, FRN, Series 2014-2A ‘E’, 144A 4.23% 17/07/2031 USD 1,426,318 1,439,036 0.07
COMM Mortgage Trust, FRN, Series 2013-CR6 ‘D’, 144A 4.17% 10/03/2046 USD 1,785,000 1,642,901 0.08
COMM Mortgage Trust, FRN, Series 2013-CR13 ‘D’, 144A 4.748% 10/12/2023 USD 1,290,000 1,235,475 0.06
COMM Mortgage Trust, FRN, Series 2014-CR18 ‘D’, 144A 4.736% 15/07/2047 USD 401,000 355,017 0.02
COMM Mortgage Trust, FRN, Series 2015-DC1 ‘D’, 144A 4.353% 10/02/2048 USD 1,700,000 1,353,582 0.07
COMM Mortgage Trust, Series 2014-CR20 ‘D’, 144A 3.222% 10/11/2047 USD 3,410,000 2,771,731 0.14
COMM Mortgage Trust, Series 2014-UBS5 ‘D’, 144A 3.495% 10/09/2047 USD 1,317,000 1,011,811 0.05
Commercial Mortgage Trust, FRN, Series 2014-CR14 ‘D’, 144A 4.6% 10/02/2047 USD 900,000 838,439 0.04
Commercial Mortgage Trust, FRN, Series 2014-CR14 ‘XA’ 0.823% 10/02/2047 USD 14,785,300 451,800 0.02
Conn Funding II LP, Series 2017-A ‘B’, 144A 5.11% 15/05/2020 USD 3,000,000 3,013,371 0.15
Conn’s Receivables Funding LLC, Series 2016-A ‘C’, 144A 12% 15/04/2020 USD 6,500,000 6,704,777 0.33
COOF Securitization Trust, FRN, Series 2015-1 ‘A’, 144A 2.758% 25/10/2040 USD 13,860,580 1,240,661 0.06
COOF Securitization Trust II, IO, FRN, Series 2015-2 ‘A1’, 144A 2.398% 25/08/2041 USD 76,876,424 5,801,449 0.29
Credit Suisse Mortgage Capital Certifi cates, Series 2009-12R ‘6A1’, 144A 6% 27/05/2037 USD 990,536 1,024,153 0.05
Credit-Based Asset Servicing & Securitization LLC, FRN, Series 2006-CB4 ‘AV3’ 1.366% 25/05/2036 USD 5,904,105 4,806,275 0.24
SCHEDULE OF INVESTMENTSAs at 30 June 2017
Investments Currency
Quantity/Nominal
Value
Market Value USD
% of Net Assets
Transferable securities and money market instruments admitted to offi cial exchange listing or dealt in on another regulated market
Mortgage and Asset Backed Securities (continued)
United States of America (continued)Credit-Based Asset Servicing &
Securitization LLC, STEP, Series 2006-SC1 ‘B2’, 144A 6.75% 25/05/2036 USD 1,800,000 1,821,483 0.09
CSMC Mortgage-Backed Trust, FRN, Series 2006-7 ‘3A1’ 1.324% 25/08/2036 USD 429,806 297,509 0.02
CSMC Mortgage-Backed Trust, FRN, Series 2007-3 ‘1A2’ 5.587% 25/04/2037 USD 4,407,545 2,157,585 0.11
CSMC Mortgage-Backed Trust, FRN, Series 2007-5 ‘1A11’ 7% 25/08/2037 USD 3,118,085 2,260,586 0.11
CSMC Mortgage-Backed Trust, Series 2006-4 ‘10A1’ 6.5% 25/05/2036 USD 7,980,947 4,265,284 0.21
CSMC Trust, FRN, Series 2014-RPL4 ‘A2’, 144A 4.826% 25/08/2062 USD 2,391,000 2,382,876 0.12
CSMC Trust, FRN, Series 2015-DEAL ‘E’, 144A 4.989% 15/04/2029 USD 2,400,000 2,425,473 0.12
CSMC Trust, FRN, Series 2015-RPL2 ‘A2’, 144A 4.647% 25/11/2057 USD 3,600,000 3,620,624 0.18
CVS Pass-Through Trust, Series 2014, 144A 4.163% 11/08/2036 USD 1,397,529 1,419,121 0.07
CWABS Asset-Backed Certifi cates Trust, FRN, Series 2006-9 ‘1AF4’ 4.577% 25/10/2046 USD 6,669,121 4,737,242 0.24
CWABS Asset-Backed Certifi cates Trust, FRN, Series 2006-9 ‘3AV4’ 1.456% 25/10/2046 USD 7,327,000 6,456,289 0.32
EMC Mortgage Loan Trust, FRN, Series 2004-C ‘M1’, 144A 1.991% 25/11/2030 USD 3,581,335 3,436,338 0.17
Equity One Mortgage Pass-Through Trust, FRN, Series 2003-2 ‘M1’ 5.05% 25/09/2033 USD 1,123,421 1,135,902 0.06
FHLMC, FRN, Series 2013-DN2 ‘M2’ 5.274% 25/11/2023 USD 3,600,000 4,021,471 0.20
FHLMC, FRN, Series 2014-DN2 ‘M3’ 4.624% 25/04/2024 USD 1,594,029 1,773,517 0.09
FHLMC, FRN, Series 2014-DN3 ‘M3’ 5.216% 25/08/2024 USD 3,002,000 3,279,213 0.16
FHLMC, FRN, Series 2014-HQ2 ‘M3’ 4.966% 25/09/2024 USD 2,767,000 3,104,831 0.15
FHLMC, FRN, Series 2017-DNA2 ‘B1’ 6.174% 25/10/2029 USD 1,500,000 1,644,713 0.08
Fieldstone Mortgage Investment Trust, FRN, Series 2006-2 ‘2A2’ 1.386% 25/07/2036 USD 1,376,965 770,028 0.04
First Horizon Alternative Mortgage Securities Trust, Series 2006-FA4 ‘1A1’ 6% 25/08/2036 USD 456,164 386,371 0.02
FNMA Connecticut Avenue Securities, FRN, Series 2014-C04 ‘1M2’ 5.924% 25/11/2024 USD 5,032,714 5,755,404 0.29
FNMA Connecticut Avenue Securities, FRN, Series 2015-C02 ‘1M2’ 5.024% 25/05/2025 USD 3,185,179 3,443,388 0.17
FNMA Connecticut Avenue Securities, FRN, Series 2017-C03 ‘1B1’ 5.874% 25/10/2029 USD 1,000,000 1,068,420 0.05
FNMA REMIC, IO, FRN, Series 2012-63 ‘HS’ 5.334% 25/08/2041 USD 487,364 69,964 0.00
FNMA REMIC, IO, FRN, Series 2014-10 ‘CS’ 1.975% 25/03/2044 USD 6,969,145 455,859 0.02
FNMA REMIC, IO, FRN, Series 2014-23 ‘SA’ 1.946% 25/10/2039 USD 12,599,425 727,531 0.04
FREMF Mortgage Trust, FRN, Series 2017-KF27 ‘B’, 144A 5.333% 25/12/2026 USD 1,275,000 1,291,252 0.06
Fremont Home Loan Trust, FRN, Series 1999-3 ‘A2’ 2.006% 25/12/2029 USD 479,488 437,593 0.02
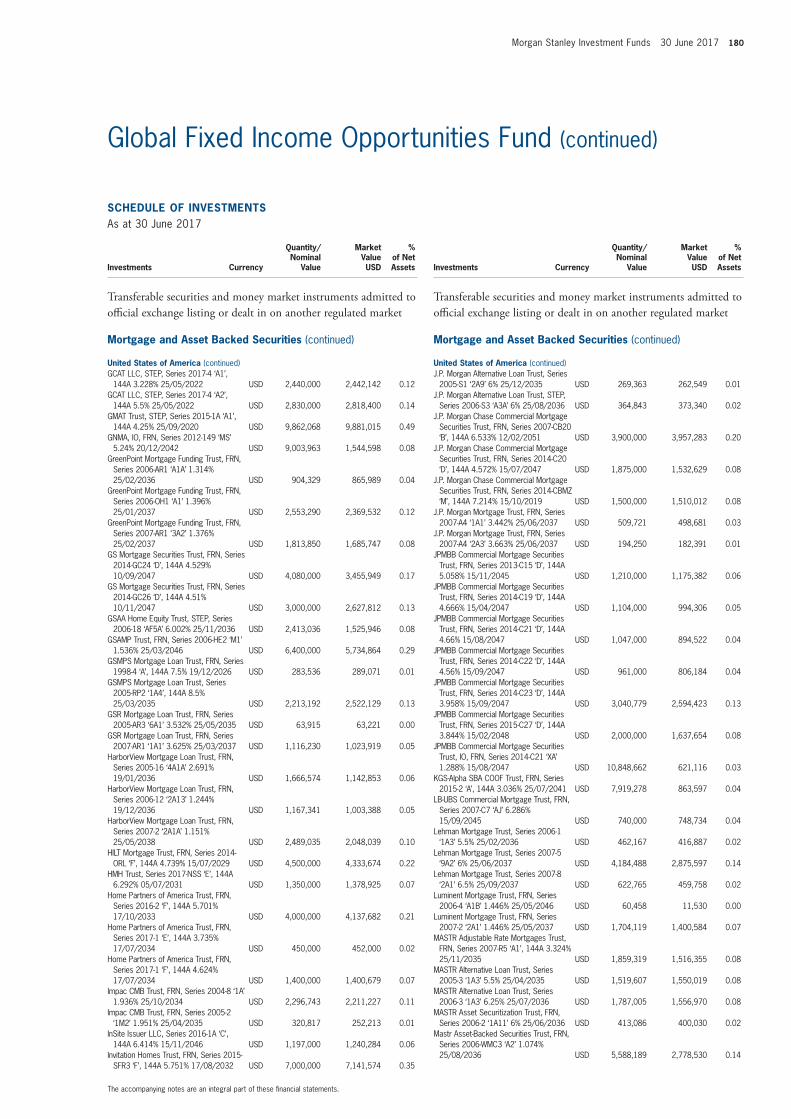
Morgan Stanley Investment Funds 30 June 2017 180
The accompanying notes are an integral part of these fi nancial statements.
Global Fixed Income Opportunities Fund (continued)
SCHEDULE OF INVESTMENTSAs at 30 June 2017
Investments Currency
Quantity/Nominal
Value
Market Value USD
% of Net Assets
Transferable securities and money market instruments admitted to offi cial exchange listing or dealt in on another regulated market
Mortgage and Asset Backed Securities (continued)
United States of America (continued)GCAT LLC, STEP, Series 2017-4 ‘A1’,
144A 3.228% 25/05/2022 USD 2,440,000 2,442,142 0.12GCAT LLC, STEP, Series 2017-4 ‘A2’,
144A 5.5% 25/05/2022 USD 2,830,000 2,818,400 0.14GMAT Trust, STEP, Series 2015-1A ‘A1’,
144A 4.25% 25/09/2020 USD 9,862,068 9,881,015 0.49GNMA, IO, FRN, Series 2012-149 ‘MS’
5.24% 20/12/2042 USD 9,003,963 1,544,598 0.08GreenPoint Mortgage Funding Trust, FRN,
Series 2006-AR1 ‘A1A’ 1.314% 25/02/2036 USD 904,329 865,989 0.04
GreenPoint Mortgage Funding Trust, FRN, Series 2006-OH1 ‘A1’ 1.396% 25/01/2037 USD 2,553,290 2,369,532 0.12
GreenPoint Mortgage Funding Trust, FRN, Series 2007-AR1 ‘3A2’ 1.376% 25/02/2037 USD 1,813,850 1,685,747 0.08
GS Mortgage Securities Trust, FRN, Series 2014-GC24 ‘D’, 144A 4.529% 10/09/2047 USD 4,080,000 3,455,949 0.17
GS Mortgage Securities Trust, FRN, Series 2014-GC26 ‘D’, 144A 4.51% 10/11/2047 USD 3,000,000 2,627,812 0.13
GSAA Home Equity Trust, STEP, Series 2006-18 ‘AF5A’ 6.002% 25/11/2036 USD 2,413,036 1,525,946 0.08
GSAMP Trust, FRN, Series 2006-HE2 ‘M1’ 1.536% 25/03/2046 USD 6,400,000 5,734,864 0.29
GSMPS Mortgage Loan Trust, FRN, Series 1998-4 ‘A’, 144A 7.5% 19/12/2026 USD 283,536 289,071 0.01
GSMPS Mortgage Loan Trust, Series 2005-RP2 ‘1A4’, 144A 8.5% 25/03/2035 USD 2,213,192 2,522,129 0.13
GSR Mortgage Loan Trust, FRN, Series 2005-AR3 ‘6A1’ 3.532% 25/05/2035 USD 63,915 63,221 0.00
GSR Mortgage Loan Trust, FRN, Series 2007-AR1 ‘1A1’ 3.625% 25/03/2037 USD 1,116,230 1,023,919 0.05
HarborView Mortgage Loan Trust, FRN, Series 2005-16 ‘4A1A’ 2.691% 19/01/2036 USD 1,666,574 1,142,853 0.06
HarborView Mortgage Loan Trust, FRN, Series 2006-12 ‘2A13’ 1.244% 19/12/2036 USD 1,167,341 1,003,388 0.05
HarborView Mortgage Loan Trust, FRN, Series 2007-2 ‘2A1A’ 1.151% 25/05/2038 USD 2,489,035 2,048,039 0.10
HILT Mortgage Trust, FRN, Series 2014-ORL ‘F’, 144A 4.739% 15/07/2029 USD 4,500,000 4,333,674 0.22
HMH Trust, Series 2017-NSS ‘E’, 144A 6.292% 05/07/2031 USD 1,350,000 1,378,925 0.07
Home Partners of America Trust, FRN, Series 2016-2 ‘F’, 144A 5.701% 17/10/2033 USD 4,000,000 4,137,682 0.21
Home Partners of America Trust, FRN, Series 2017-1 ‘E’, 144A 3.735% 17/07/2034 USD 450,000 452,000 0.02
Home Partners of America Trust, FRN, Series 2017-1 ‘F’, 144A 4.624% 17/07/2034 USD 1,400,000 1,400,679 0.07
Impac CMB Trust, FRN, Series 2004-8 ‘1A’ 1.936% 25/10/2034 USD 2,296,743 2,211,227 0.11
Impac CMB Trust, FRN, Series 2005-2 ‘1M2’ 1.951% 25/04/2035 USD 320,817 252,213 0.01
InSite Issuer LLC, Series 2016-1A ‘C’, 144A 6.414% 15/11/2046 USD 1,197,000 1,240,284 0.06
Invitation Homes Trust, FRN, Series 2015-SFR3 ‘F’, 144A 5.751% 17/08/2032 USD 7,000,000 7,141,574 0.35
SCHEDULE OF INVESTMENTSAs at 30 June 2017
Investments Currency
Quantity/Nominal
Value
Market Value USD
% of Net Assets
Transferable securities and money market instruments admitted to offi cial exchange listing or dealt in on another regulated market
Mortgage and Asset Backed Securities (continued)
United States of America (continued)J.P. Morgan Alternative Loan Trust, Series
2005-S1 ‘2A9’ 6% 25/12/2035 USD 269,363 262,549 0.01J.P. Morgan Alternative Loan Trust, STEP,
Series 2006-S3 ‘A3A’ 6% 25/08/2036 USD 364,843 373,340 0.02J.P. Morgan Chase Commercial Mortgage
Securities Trust, FRN, Series 2007-CB20 ‘B’, 144A 6.533% 12/02/2051 USD 3,900,000 3,957,283 0.20
J.P. Morgan Chase Commercial Mortgage Securities Trust, FRN, Series 2014-C20 ‘D’, 144A 4.572% 15/07/2047 USD 1,875,000 1,532,629 0.08
J.P. Morgan Chase Commercial Mortgage Securities Trust, FRN, Series 2014-CBMZ ‘M’, 144A 7.214% 15/10/2019 USD 1,500,000 1,510,012 0.08
J.P. Morgan Mortgage Trust, FRN, Series 2007-A4 ‘1A1’ 3.442% 25/06/2037 USD 509,721 498,681 0.03
J.P. Morgan Mortgage Trust, FRN, Series 2007-A4 ‘2A3’ 3.663% 25/06/2037 USD 194,250 182,391 0.01
JPMBB Commercial Mortgage Securities Trust, FRN, Series 2013-C15 ‘D’, 144A 5.058% 15/11/2045 USD 1,210,000 1,175,382 0.06
JPMBB Commercial Mortgage Securities Trust, FRN, Series 2014-C19 ‘D’, 144A 4.666% 15/04/2047 USD 1,104,000 994,306 0.05
JPMBB Commercial Mortgage Securities Trust, FRN, Series 2014-C21 ‘D’, 144A 4.66% 15/08/2047 USD 1,047,000 894,522 0.04
JPMBB Commercial Mortgage Securities Trust, FRN, Series 2014-C22 ‘D’, 144A 4.56% 15/09/2047 USD 961,000 806,184 0.04
JPMBB Commercial Mortgage Securities Trust, FRN, Series 2014-C23 ‘D’, 144A 3.958% 15/09/2047 USD 3,040,779 2,594,423 0.13
JPMBB Commercial Mortgage Securities Trust, FRN, Series 2015-C27 ‘D’, 144A 3.844% 15/02/2048 USD 2,000,000 1,637,654 0.08
JPMBB Commercial Mortgage Securities Trust, IO, FRN, Series 2014-C21 ‘XA’ 1.288% 15/08/2047 USD 10,848,662 621,116 0.03
KGS-Alpha SBA COOF Trust, FRN, Series 2015-2 ‘A’, 144A 3.036% 25/07/2041 USD 7,919,278 863,597 0.04
LB-UBS Commercial Mortgage Trust, FRN, Series 2007-C7 ‘AJ’ 6.286% 15/09/2045 USD 740,000 748,734 0.04
Lehman Mortgage Trust, Series 2006-1 ‘1A3’ 5.5% 25/02/2036 USD 462,167 416,887 0.02
Lehman Mortgage Trust, Series 2007-5 ‘9A2’ 6% 25/06/2037 USD 4,184,488 2,875,597 0.14
Lehman Mortgage Trust, Series 2007-8 ‘2A1’ 6.5% 25/09/2037 USD 622,765 459,758 0.02
Luminent Mortgage Trust, FRN, Series 2006-4 ‘A1B’ 1.446% 25/05/2046 USD 60,458 11,530 0.00
Luminent Mortgage Trust, FRN, Series 2007-2 ‘2A1’ 1.446% 25/05/2037 USD 1,704,119 1,400,584 0.07
MASTR Adjustable Rate Mortgages Trust, FRN, Series 2007-R5 ‘A1’, 144A 3.324% 25/11/2035 USD 1,859,319 1,516,355 0.08
MASTR Alternative Loan Trust, Series 2005-3 ‘1A3’ 5.5% 25/04/2035 USD 1,519,607 1,550,019 0.08
MASTR Alternative Loan Trust, Series 2006-3 ‘1A3’ 6.25% 25/07/2036 USD 1,787,005 1,556,970 0.08
MASTR Asset Securitization Trust, FRN, Series 2006-2 ‘1A11’ 6% 25/06/2036 USD 413,086 400,030 0.02
Mastr Asset-Backed Securities Trust, FRN, Series 2006-WMC3 ‘A2’ 1.074% 25/08/2036 USD 5,588,189 2,778,530 0.14
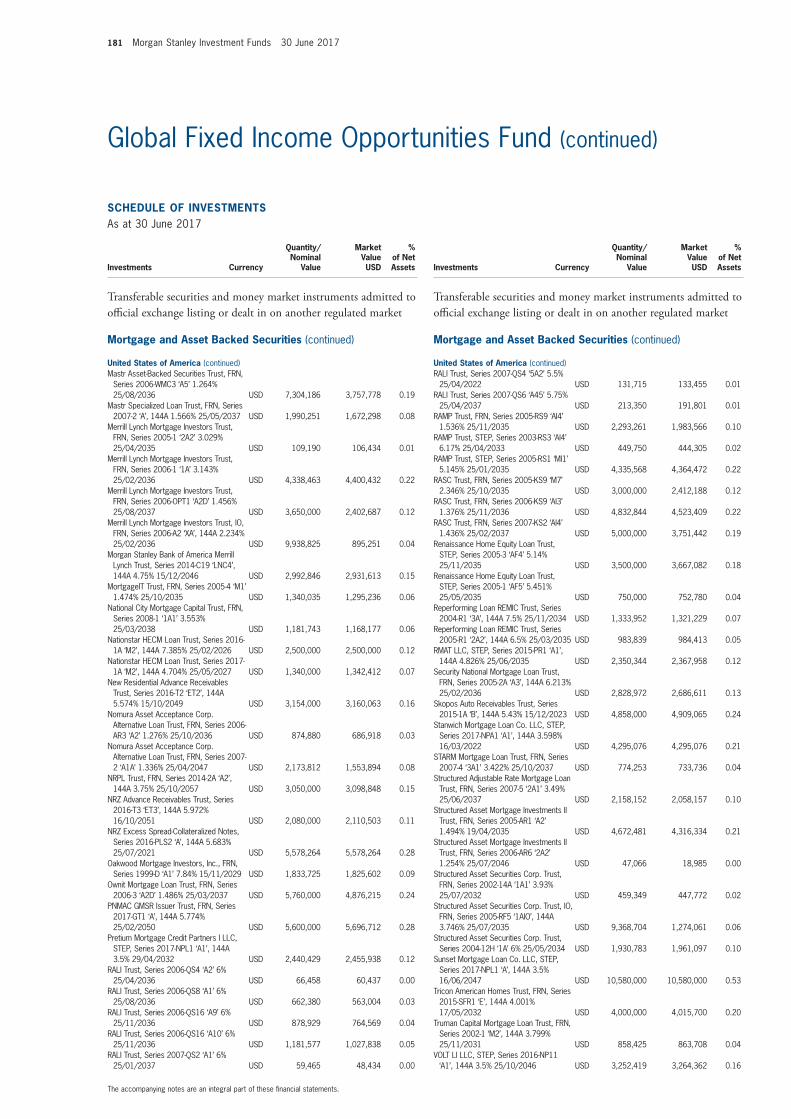
181 Morgan Stanley Investment Funds 30 June 2017
The accompanying notes are an integral part of these fi nancial statements.
Global Fixed Income Opportunities Fund (continued)
SCHEDULE OF INVESTMENTSAs at 30 June 2017
Investments Currency
Quantity/Nominal
Value
Market Value USD
% of Net Assets
Transferable securities and money market instruments admitted to offi cial exchange listing or dealt in on another regulated market
Mortgage and Asset Backed Securities (continued)
United States of America (continued)Mastr Asset-Backed Securities Trust, FRN,
Series 2006-WMC3 ‘A5’ 1.264% 25/08/2036 USD 7,304,186 3,757,778 0.19
Mastr Specialized Loan Trust, FRN, Series 2007-2 ‘A’, 144A 1.566% 25/05/2037 USD 1,990,251 1,672,298 0.08
Merrill Lynch Mortgage Investors Trust, FRN, Series 2005-1 ‘2A2’ 3.029% 25/04/2035 USD 109,190 106,434 0.01
Merrill Lynch Mortgage Investors Trust, FRN, Series 2006-1 ‘1A’ 3.143% 25/02/2036 USD 4,338,463 4,400,432 0.22
Merrill Lynch Mortgage Investors Trust, FRN, Series 2006-OPT1 ‘A2D’ 1.456% 25/08/2037 USD 3,650,000 2,402,687 0.12
Merrill Lynch Mortgage Investors Trust, IO, FRN, Series 2006-A2 ‘XA’, 144A 2.234% 25/02/2036 USD 9,938,825 895,251 0.04
Morgan Stanley Bank of America Merrill Lynch Trust, Series 2014-C19 ‘LNC4’, 144A 4.75% 15/12/2046 USD 2,992,846 2,931,613 0.15
MortgageIT Trust, FRN, Series 2005-4 ‘M1’ 1.474% 25/10/2035 USD 1,340,035 1,295,236 0.06
National City Mortgage Capital Trust, FRN, Series 2008-1 ‘1A1’ 3.553% 25/03/2038 USD 1,181,743 1,168,177 0.06
Nationstar HECM Loan Trust, Series 2016-1A ‘M2’, 144A 7.385% 25/02/2026 USD 2,500,000 2,500,000 0.12
Nationstar HECM Loan Trust, Series 2017-1A ‘M2’, 144A 4.704% 25/05/2027 USD 1,340,000 1,342,412 0.07
New Residential Advance Receivables Trust, Series 2016-T2 ‘ET2’, 144A 5.574% 15/10/2049 USD 3,154,000 3,160,063 0.16
Nomura Asset Acceptance Corp. Alternative Loan Trust, FRN, Series 2006-AR3 ‘A2’ 1.276% 25/10/2036 USD 874,880 686,918 0.03
Nomura Asset Acceptance Corp. Alternative Loan Trust, FRN, Series 2007-2 ‘A1A’ 1.336% 25/04/2047 USD 2,173,812 1,553,894 0.08
NRPL Trust, FRN, Series 2014-2A ‘A2’, 144A 3.75% 25/10/2057 USD 3,050,000 3,098,848 0.15
NRZ Advance Receivables Trust, Series 2016-T3 ‘ET3’, 144A 5.972% 16/10/2051 USD 2,080,000 2,110,503 0.11
NRZ Excess Spread-Collateralized Notes, Series 2016-PLS2 ‘A’, 144A 5.683% 25/07/2021 USD 5,578,264 5,578,264 0.28
Oakwood Mortgage Investors, Inc., FRN, Series 1999-D ‘A1’ 7.84% 15/11/2029 USD 1,833,725 1,825,602 0.09
Ownit Mortgage Loan Trust, FRN, Series 2006-3 ‘A2D’ 1.486% 25/03/2037 USD 5,760,000 4,876,215 0.24
PNMAC GMSR Issuer Trust, FRN, Series 2017-GT1 ‘A’, 144A 5.774% 25/02/2050 USD 5,600,000 5,696,712 0.28
Pretium Mortgage Credit Partners I LLC, STEP, Series 2017-NPL1 ‘A1’, 144A 3.5% 29/04/2032 USD 2,440,429 2,455,938 0.12
RALI Trust, Series 2006-QS4 ‘A2’ 6% 25/04/2036 USD 66,458 60,437 0.00
RALI Trust, Series 2006-QS8 ‘A1’ 6% 25/08/2036 USD 662,380 563,004 0.03
RALI Trust, Series 2006-QS16 ‘A9’ 6% 25/11/2036 USD 878,929 764,569 0.04
RALI Trust, Series 2006-QS16 ‘A10’ 6% 25/11/2036 USD 1,181,577 1,027,838 0.05
RALI Trust, Series 2007-QS2 ‘A1’ 6% 25/01/2037 USD 59,465 48,434 0.00
SCHEDULE OF INVESTMENTSAs at 30 June 2017
Investments Currency
Quantity/Nominal
Value
Market Value USD
% of Net Assets
Transferable securities and money market instruments admitted to offi cial exchange listing or dealt in on another regulated market
Mortgage and Asset Backed Securities (continued)
United States of America (continued)RALI Trust, Series 2007-QS4 ‘5A2’ 5.5%
25/04/2022 USD 131,715 133,455 0.01RALI Trust, Series 2007-QS6 ‘A45’ 5.75%
25/04/2037 USD 213,350 191,801 0.01RAMP Trust, FRN, Series 2005-RS9 ‘AI4’
1.536% 25/11/2035 USD 2,293,261 1,983,566 0.10RAMP Trust, STEP, Series 2003-RS3 ‘AI4’
6.17% 25/04/2033 USD 449,750 444,305 0.02RAMP Trust, STEP, Series 2005-RS1 ‘MI1’
5.145% 25/01/2035 USD 4,335,568 4,364,472 0.22RASC Trust, FRN, Series 2005-KS9 ‘M7’
2.346% 25/10/2035 USD 3,000,000 2,412,188 0.12RASC Trust, FRN, Series 2006-KS9 ‘AI3’
1.376% 25/11/2036 USD 4,832,844 4,523,409 0.22RASC Trust, FRN, Series 2007-KS2 ‘AI4’
1.436% 25/02/2037 USD 5,000,000 3,751,442 0.19Renaissance Home Equity Loan Trust,
STEP, Series 2005-3 ‘AF4’ 5.14% 25/11/2035 USD 3,500,000 3,667,082 0.18
Renaissance Home Equity Loan Trust, STEP, Series 2005-1 ‘AF5’ 5.451% 25/05/2035 USD 750,000 752,780 0.04
Reperforming Loan REMIC Trust, Series 2004-R1 ‘3A’, 144A 7.5% 25/11/2034 USD 1,333,952 1,321,229 0.07
Reperforming Loan REMIC Trust, Series 2005-R1 ‘2A2’, 144A 6.5% 25/03/2035 USD 983,839 984,413 0.05
RMAT LLC, STEP, Series 2015-PR1 ‘A1’, 144A 4.826% 25/06/2035 USD 2,350,344 2,367,958 0.12
Security National Mortgage Loan Trust, FRN, Series 2005-2A ‘A3’, 144A 6.213% 25/02/2036 USD 2,828,972 2,686,611 0.13
Skopos Auto Receivables Trust, Series 2015-1A ‘B’, 144A 5.43% 15/12/2023 USD 4,858,000 4,909,065 0.24
Stanwich Mortgage Loan Co. LLC, STEP, Series 2017-NPA1 ‘A1’, 144A 3.598% 16/03/2022 USD 4,295,076 4,295,076 0.21
STARM Mortgage Loan Trust, FRN, Series 2007-4 ‘3A1’ 3.422% 25/10/2037 USD 774,253 733,736 0.04
Structured Adjustable Rate Mortgage Loan Trust, FRN, Series 2007-5 ‘2A1’ 3.49% 25/06/2037 USD 2,158,152 2,058,157 0.10
Structured Asset Mortgage Investments II Trust, FRN, Series 2005-AR1 ‘A2’ 1.494% 19/04/2035 USD 4,672,481 4,316,334 0.21
Structured Asset Mortgage Investments II Trust, FRN, Series 2006-AR6 ‘2A2’ 1.254% 25/07/2046 USD 47,066 18,985 0.00
Structured Asset Securities Corp. Trust, FRN, Series 2002-14A ‘1A1’ 3.93% 25/07/2032 USD 459,349 447,772 0.02
Structured Asset Securities Corp. Trust, IO, FRN, Series 2005-RF5 ‘1AIO’, 144A 3.746% 25/07/2035 USD 9,368,704 1,274,061 0.06
Structured Asset Securities Corp. Trust, Series 2004-12H ‘1A’ 6% 25/05/2034 USD 1,930,783 1,961,097 0.10
Sunset Mortgage Loan Co. LLC, STEP, Series 2017-NPL1 ‘A’, 144A 3.5% 16/06/2047 USD 10,580,000 10,580,000 0.53
Tricon American Homes Trust, FRN, Series 2015-SFR1 ‘E’, 144A 4.001% 17/05/2032 USD 4,000,000 4,015,700 0.20
Truman Capital Mortgage Loan Trust, FRN, Series 2002-1 ‘M2’, 144A 3.799% 25/11/2031 USD 858,425 863,708 0.04
VOLT LI LLC, STEP, Series 2016-NP11 ‘A1’, 144A 3.5% 25/10/2046 USD 3,252,419 3,264,362 0.16
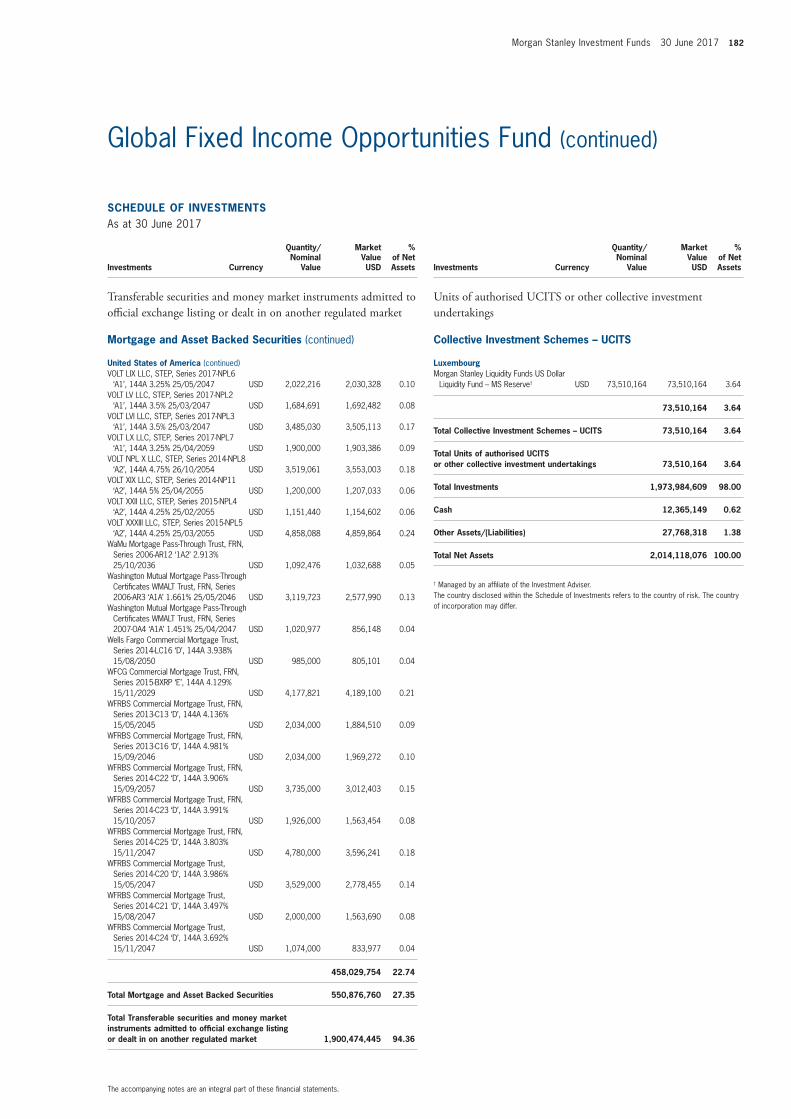
Morgan Stanley Investment Funds 30 June 2017 182
The accompanying notes are an integral part of these fi nancial statements.
Global Fixed Income Opportunities Fund (continued)
SCHEDULE OF INVESTMENTSAs at 30 June 2017
Investments Currency
Quantity/Nominal
Value
Market Value USD
% of Net Assets
Transferable securities and money market instruments admitted to offi cial exchange listing or dealt in on another regulated market
Mortgage and Asset Backed Securities (continued)
United States of America (continued)VOLT LIX LLC, STEP, Series 2017-NPL6
‘A1’, 144A 3.25% 25/05/2047 USD 2,022,216 2,030,328 0.10VOLT LV LLC, STEP, Series 2017-NPL2
‘A1’, 144A 3.5% 25/03/2047 USD 1,684,691 1,692,482 0.08VOLT LVI LLC, STEP, Series 2017-NPL3
‘A1’, 144A 3.5% 25/03/2047 USD 3,485,030 3,505,113 0.17VOLT LX LLC, STEP, Series 2017-NPL7
‘A1’, 144A 3.25% 25/04/2059 USD 1,900,000 1,903,386 0.09VOLT NPL X LLC, STEP, Series 2014-NPL8
‘A2’, 144A 4.75% 26/10/2054 USD 3,519,061 3,553,003 0.18VOLT XIX LLC, STEP, Series 2014-NP11
‘A2’, 144A 5% 25/04/2055 USD 1,200,000 1,207,033 0.06VOLT XXII LLC, STEP, Series 2015-NPL4
‘A2’, 144A 4.25% 25/02/2055 USD 1,151,440 1,154,602 0.06VOLT XXXIII LLC, STEP, Series 2015-NPL5
‘A2’, 144A 4.25% 25/03/2055 USD 4,858,088 4,859,864 0.24WaMu Mortgage Pass-Through Trust, FRN,
Series 2006-AR12 ‘1A2’ 2.913% 25/10/2036 USD 1,092,476 1,032,688 0.05
Washington Mutual Mortgage Pass-Through Certifi cates WMALT Trust, FRN, Series 2006-AR3 ‘A1A’ 1.661% 25/05/2046 USD 3,119,723 2,577,990 0.13
Washington Mutual Mortgage Pass-Through Certifi cates WMALT Trust, FRN, Series 2007-OA4 ‘A1A’ 1.451% 25/04/2047 USD 1,020,977 856,148 0.04
Wells Fargo Commercial Mortgage Trust, Series 2014-LC16 ‘D’, 144A 3.938% 15/08/2050 USD 985,000 805,101 0.04
WFCG Commercial Mortgage Trust, FRN, Series 2015-BXRP ‘E’, 144A 4.129% 15/11/2029 USD 4,177,821 4,189,100 0.21
WFRBS Commercial Mortgage Trust, FRN, Series 2013-C13 ‘D’, 144A 4.136% 15/05/2045 USD 2,034,000 1,884,510 0.09
WFRBS Commercial Mortgage Trust, FRN, Series 2013-C16 ‘D’, 144A 4.981% 15/09/2046 USD 2,034,000 1,969,272 0.10
WFRBS Commercial Mortgage Trust, FRN, Series 2014-C22 ‘D’, 144A 3.906% 15/09/2057 USD 3,735,000 3,012,403 0.15
WFRBS Commercial Mortgage Trust, FRN, Series 2014-C23 ‘D’, 144A 3.991% 15/10/2057 USD 1,926,000 1,563,454 0.08
WFRBS Commercial Mortgage Trust, FRN, Series 2014-C25 ‘D’, 144A 3.803% 15/11/2047 USD 4,780,000 3,596,241 0.18
WFRBS Commercial Mortgage Trust, Series 2014-C20 ‘D’, 144A 3.986% 15/05/2047 USD 3,529,000 2,778,455 0.14
WFRBS Commercial Mortgage Trust, Series 2014-C21 ‘D’, 144A 3.497% 15/08/2047 USD 2,000,000 1,563,690 0.08
WFRBS Commercial Mortgage Trust, Series 2014-C24 ‘D’, 144A 3.692% 15/11/2047 USD 1,074,000 833,977 0.04
458,029,754 22.74
Total Mortgage and Asset Backed Securities 550,876,760 27.35
Total Transferable securities and money market instruments admitted to offi cial exchange listing or dealt in on another regulated market 1,900,474,445 94.36
SCHEDULE OF INVESTMENTSAs at 30 June 2017
Investments Currency
Quantity/Nominal
Value
Market Value USD
% of Net Assets
Units of authorised UCITS or other collective investment undertakings
Collective Investment Schemes – UCITS
LuxembourgMorgan Stanley Liquidity Funds US Dollar
Liquidity Fund – MS Reserve† USD 73,510,164 73,510,164 3.64
73,510,164 3.64
Total Collective Investment Schemes – UCITS 73,510,164 3.64
Total Units of authorised UCITS or other collective investment undertakings 73,510,164 3.64
Total Investments 1,973,984,609 98.00
Cash 12,365,149 0.62
Other Assets/(Liabilities) 27,768,318 1.38
Total Net Assets 2,014,118,076 100.00
† Managed by an affi liate of the Investment Adviser.The country disclosed within the Schedule of Investments refers to the country of risk. The country of incorporation may differ.
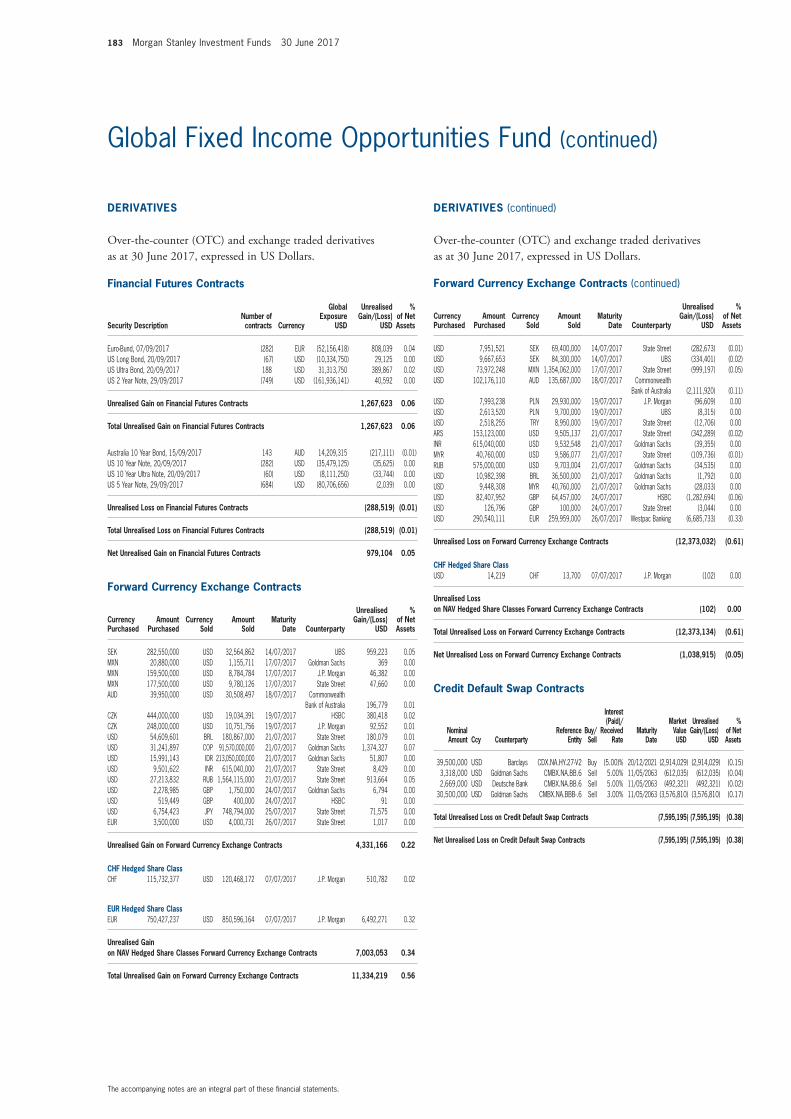
183 Morgan Stanley Investment Funds 30 June 2017
The accompanying notes are an integral part of these fi nancial statements.
Global Fixed Income Opportunities Fund (continued)
Financial Futures Contracts
Security DescriptionNumber of contracts Currency
Global Exposure
USD
Unrealised Gain/(Loss)
USD
% of Net Assets
Euro-Bund, 07/09/2017 (282) EUR (52,156,418) 808,039 0.04 US Long Bond, 20/09/2017 (67) USD (10,334,750) 29,125 0.00 US Ultra Bond, 20/09/2017 188 USD 31,313,750 389,867 0.02 US 2 Year Note, 29/09/2017 (749) USD (161,936,141) 40,592 0.00
Unrealised Gain on Financial Futures Contracts 1,267,623 0.06
Total Unrealised Gain on Financial Futures Contracts 1,267,623 0.06
Australia 10 Year Bond, 15/09/2017 143 AUD 14,209,315 (217,111) (0.01) US 10 Year Note, 20/09/2017 (282) USD (35,479,125) (35,625) 0.00 US 10 Year Ultra Note, 20/09/2017 (60) USD (8,111,250) (33,744) 0.00 US 5 Year Note, 29/09/2017 (684) USD (80,706,656) (2,039) 0.00
Unrealised Loss on Financial Futures Contracts (288,519) (0.01)
Total Unrealised Loss on Financial Futures Contracts (288,519) (0.01)
Net Unrealised Gain on Financial Futures Contracts 979,104 0.05
Forward Currency Exchange Contracts (continued)
Currency Purchased
Amount Purchased
Currency Sold
Amount Sold
Maturity Date Counterparty
Unrealised Gain/(Loss)
USD
% of Net Assets
SEK 282,550,000 USD 32,564,862 14/07/2017 UBS 959,223 0.05 MXN 20,880,000 USD 1,155,711 17/07/2017 Goldman Sachs 369 0.00 MXN 159,500,000 USD 8,784,784 17/07/2017 J.P. Morgan 46,382 0.00 MXN 177,500,000 USD 9,780,126 17/07/2017 State Street 47,660 0.00 AUD 39,950,000 USD 30,508,497 18/07/2017 Commonwealth
Bank of Australia 196,779 0.01 CZK 444,000,000 USD 19,034,391 19/07/2017 HSBC 380,418 0.02 CZK 248,000,000 USD 10,751,756 19/07/2017 J.P. Morgan 92,552 0.01 USD 54,609,601 BRL 180,867,000 21/07/2017 State Street 180,079 0.01 USD 31,241,897 COP 91,570,000,000 21/07/2017 Goldman Sachs 1,374,327 0.07 USD 15,991,143 IDR 213,050,000,000 21/07/2017 Goldman Sachs 51,807 0.00 USD 9,501,622 INR 615,040,000 21/07/2017 State Street 8,429 0.00 USD 27,213,832 RUB 1,564,115,000 21/07/2017 State Street 913,664 0.05 USD 2,278,985 GBP 1,750,000 24/07/2017 Goldman Sachs 6,794 0.00 USD 519,449 GBP 400,000 24/07/2017 HSBC 91 0.00 USD 6,754,423 JPY 748,794,000 25/07/2017 State Street 71,575 0.00 EUR 3,500,000 USD 4,000,731 26/07/2017 State Street 1,017 0.00
Unrealised Gain on Forward Currency Exchange Contracts 4,331,166 0.22
CHF Hedged Share ClassCHF 115,732,377 USD 120,468,172 07/07/2017 J.P. Morgan 510,782 0.02
EUR Hedged Share ClassEUR 750,427,237 USD 850,596,164 07/07/2017 J.P. Morgan 6,492,271 0.32
Unrealised Gain on NAV Hedged Share Classes Forward Currency Exchange Contracts 7,003,053 0.34
Total Unrealised Gain on Forward Currency Exchange Contracts 11,334,219 0.56
Forward Currency Exchange Contracts (continued)
Currency Purchased
Amount Purchased
Currency Sold
Amount Sold
Maturity Date Counterparty
Unrealised Gain/(Loss)
USD
% of Net Assets
USD 7,951,521 SEK 69,400,000 14/07/2017 State Street (282,673) (0.01) USD 9,667,653 SEK 84,300,000 14/07/2017 UBS (334,401) (0.02) USD 73,972,248 MXN 1,354,062,000 17/07/2017 State Street (999,197) (0.05) USD 102,176,110 AUD 135,687,000 18/07/2017 Commonwealth
Bank of Australia (2,111,920) (0.11) USD 7,993,238 PLN 29,930,000 19/07/2017 J.P. Morgan (96,609) 0.00 USD 2,613,520 PLN 9,700,000 19/07/2017 UBS (8,315) 0.00 USD 2,518,255 TRY 8,950,000 19/07/2017 State Street (12,706) 0.00 ARS 153,123,000 USD 9,505,137 21/07/2017 State Street (342,289) (0.02) INR 615,040,000 USD 9,532,548 21/07/2017 Goldman Sachs (39,355) 0.00 MYR 40,760,000 USD 9,586,077 21/07/2017 State Street (109,736) (0.01) RUB 575,000,000 USD 9,703,004 21/07/2017 Goldman Sachs (34,535) 0.00 USD 10,982,398 BRL 36,500,000 21/07/2017 Goldman Sachs (1,792) 0.00 USD 9,448,308 MYR 40,760,000 21/07/2017 Goldman Sachs (28,033) 0.00 USD 82,407,952 GBP 64,457,000 24/07/2017 HSBC (1,282,694) (0.06) USD 126,796 GBP 100,000 24/07/2017 State Street (3,044) 0.00 USD 290,540,111 EUR 259,959,000 26/07/2017 Westpac Banking (6,685,733) (0.33)
Unrealised Loss on Forward Currency Exchange Contracts (12,373,032) (0.61)
CHF Hedged Share ClassUSD 14,219 CHF 13,700 07/07/2017 J.P. Morgan (102) 0.00
Unrealised Loss on NAV Hedged Share Classes Forward Currency Exchange Contracts (102) 0.00
Total Unrealised Loss on Forward Currency Exchange Contracts (12,373,134) (0.61)
Net Unrealised Loss on Forward Currency Exchange Contracts (1,038,915) (0.05)
Credit Default Swap Contracts
Nominal Amount Ccy Counterparty
Reference Entity
Buy/Sell
Interest (Paid)/
Received Rate
Maturity Date
Market Value USD
Unrealised Gain/(Loss)
USD
% of Net Assets
39,500,000 USD Barclays CDX.NA.HY.27-V2 Buy (5.00)% 20/12/2021 (2,914,029) (2,914,029) (0.15) 3,318,000 USD Goldman Sachs CMBX.NA.BB.6 Sell 5.00% 11/05/2063 (612,035) (612,035) (0.04) 2,669,000 USD Deutsche Bank CMBX.NA.BB.6 Sell 5.00% 11/05/2063 (492,321) (492,321) (0.02)
30,500,000 USD Goldman Sachs CMBX.NA.BBB-.6 Sell 3.00% 11/05/2063 (3,576,810) (3,576,810) (0.17)
Total Unrealised Loss on Credit Default Swap Contracts (7,595,195) (7,595,195) (0.38)
Net Unrealised Loss on Credit Default Swap Contracts (7,595,195) (7,595,195) (0.38)
DERIVATIVES
Over-the-counter (OTC) and exchange traded derivatives as at 30 June 2017, expressed in US Dollars.
DERIVATIVES (continued)
Over-the-counter (OTC) and exchange traded derivatives as at 30 June 2017, expressed in US Dollars.
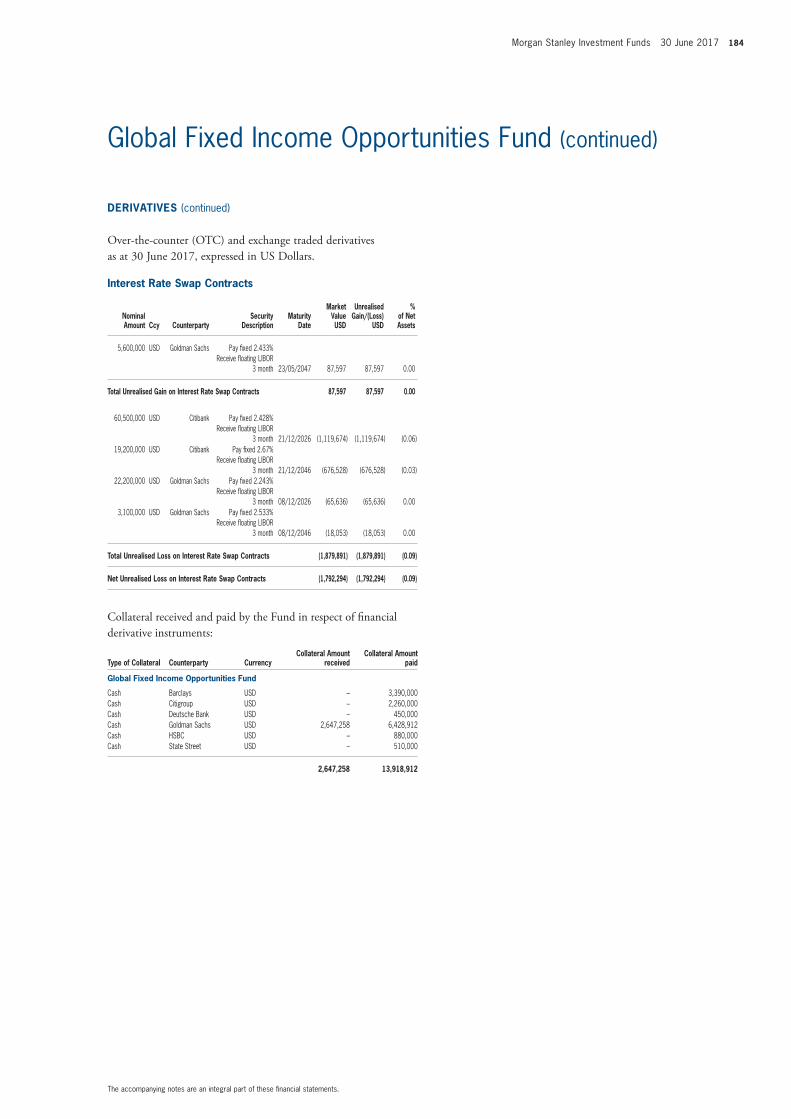
Morgan Stanley Investment Funds 30 June 2017 184
The accompanying notes are an integral part of these fi nancial statements.
Global Fixed Income Opportunities Fund (continued)
Interest Rate Swap Contracts
Nominal Amount Ccy Counterparty
Security Description
Maturity Date
Market Value USD
Unrealised Gain/(Loss)
USD
% of Net Assets
5,600,000 USD Goldman Sachs Pay fi xed 2.433% Receive fl oating LIBOR
3 month 23/05/2047 87,597 87,597 0.00
Total Unrealised Gain on Interest Rate Swap Contracts 87,597 87,597 0.00
60,500,000 USD Citibank Pay fi xed 2.428% Receive fl oating LIBOR
3 month 21/12/2026 (1,119,674) (1,119,674) (0.06) 19,200,000 USD Citibank Pay fi xed 2.67%
Receive fl oating LIBOR 3 month 21/12/2046 (676,528) (676,528) (0.03)
22,200,000 USD Goldman Sachs Pay fi xed 2.243% Receive fl oating LIBOR
3 month 08/12/2026 (65,636) (65,636) 0.00 3,100,000 USD Goldman Sachs Pay fi xed 2.533%
Receive fl oating LIBOR 3 month 08/12/2046 (18,053) (18,053) 0.00
Total Unrealised Loss on Interest Rate Swap Contracts (1,879,891) (1,879,891) (0.09)
Net Unrealised Loss on Interest Rate Swap Contracts (1,792,294) (1,792,294) (0.09)
Collateral received and paid by the Fund in respect of fi nancial derivative instruments:
Type of Collateral Counterparty CurrencyCollateral Amount
receivedCollateral Amount
paid
Global Fixed Income Opportunities Fund
Cash Barclays USD – 3,390,000Cash Citigroup USD – 2,260,000Cash Deutsche Bank USD – 450,000Cash Goldman Sachs USD 2,647,258 6,428,912Cash HSBC USD – 880,000Cash State Street USD – 510,000
2,647,258 13,918,912
DERIVATIVES (continued)
Over-the-counter (OTC) and exchange traded derivatives as at 30 June 2017, expressed in US Dollars.
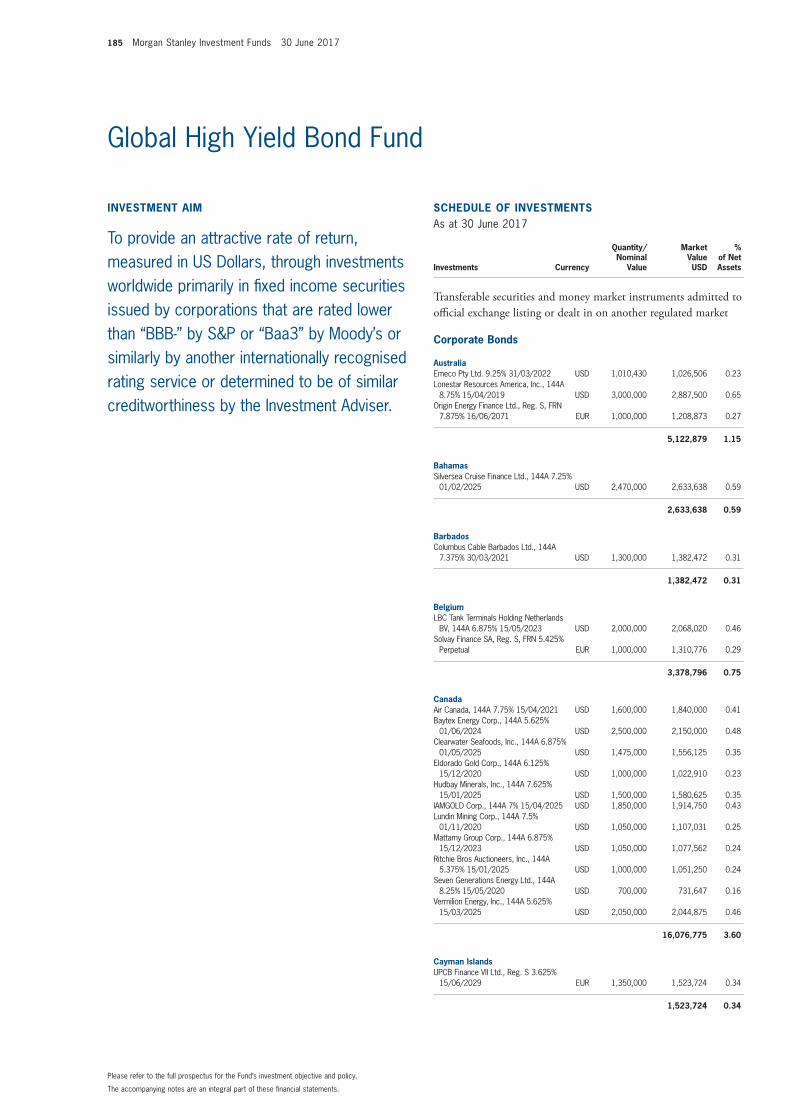
185 Morgan Stanley Investment Funds 30 June 2017
The accompanying notes are an integral part of these fi nancial statements.
Please refer to the full prospectus for the Fund’s investment objective and policy.
INVESTMENT AIM
To provide an attractive rate of return, measured in US Dollars, through investments worldwide primarily in fi xed income securities issued by corporations that are rated lower than “BBB-” by S&P or “Baa3” by Moody’s or similarly by another internationally recognised rating service or determined to be of similar creditworthiness by the Investment Adviser.
SCHEDULE OF INVESTMENTSAs at 30 June 2017
Investments Currency
Quantity/Nominal
Value
Market Value USD
% of Net Assets
Transferable securities and money market instruments admitted to offi cial exchange listing or dealt in on another regulated market
Corporate Bonds
AustraliaEmeco Pty Ltd. 9.25% 31/03/2022 USD 1,010,430 1,026,506 0.23 Lonestar Resources America, Inc., 144A
8.75% 15/04/2019 USD 3,000,000 2,887,500 0.65 Origin Energy Finance Ltd., Reg. S, FRN
7.875% 16/06/2071 EUR 1,000,000 1,208,873 0.27
5,122,879 1.15
BahamasSilversea Cruise Finance Ltd., 144A 7.25%
01/02/2025 USD 2,470,000 2,633,638 0.59
2,633,638 0.59
BarbadosColumbus Cable Barbados Ltd., 144A
7.375% 30/03/2021 USD 1,300,000 1,382,472 0.31
1,382,472 0.31
BelgiumLBC Tank Terminals Holding Netherlands
BV, 144A 6.875% 15/05/2023 USD 2,000,000 2,068,020 0.46 Solvay Finance SA, Reg. S, FRN 5.425%
Perpetual EUR 1,000,000 1,310,776 0.29
3,378,796 0.75
CanadaAir Canada, 144A 7.75% 15/04/2021 USD 1,600,000 1,840,000 0.41 Baytex Energy Corp., 144A 5.625%
01/06/2024 USD 2,500,000 2,150,000 0.48 Clearwater Seafoods, Inc., 144A 6.875%
01/05/2025 USD 1,475,000 1,556,125 0.35 Eldorado Gold Corp., 144A 6.125%
15/12/2020 USD 1,000,000 1,022,910 0.23 Hudbay Minerals, Inc., 144A 7.625%
15/01/2025 USD 1,500,000 1,580,625 0.35 IAMGOLD Corp., 144A 7% 15/04/2025 USD 1,850,000 1,914,750 0.43 Lundin Mining Corp., 144A 7.5%
01/11/2020 USD 1,050,000 1,107,031 0.25 Mattamy Group Corp., 144A 6.875%
15/12/2023 USD 1,050,000 1,077,562 0.24 Ritchie Bros Auctioneers, Inc., 144A
5.375% 15/01/2025 USD 1,000,000 1,051,250 0.24 Seven Generations Energy Ltd., 144A
8.25% 15/05/2020 USD 700,000 731,647 0.16 Vermilion Energy, Inc., 144A 5.625%
15/03/2025 USD 2,050,000 2,044,875 0.46
16,076,775 3.60
Cayman IslandsUPCB Finance VII Ltd., Reg. S 3.625%
15/06/2029 EUR 1,350,000 1,523,724 0.34
1,523,724 0.34
Global High Yield Bond Fund
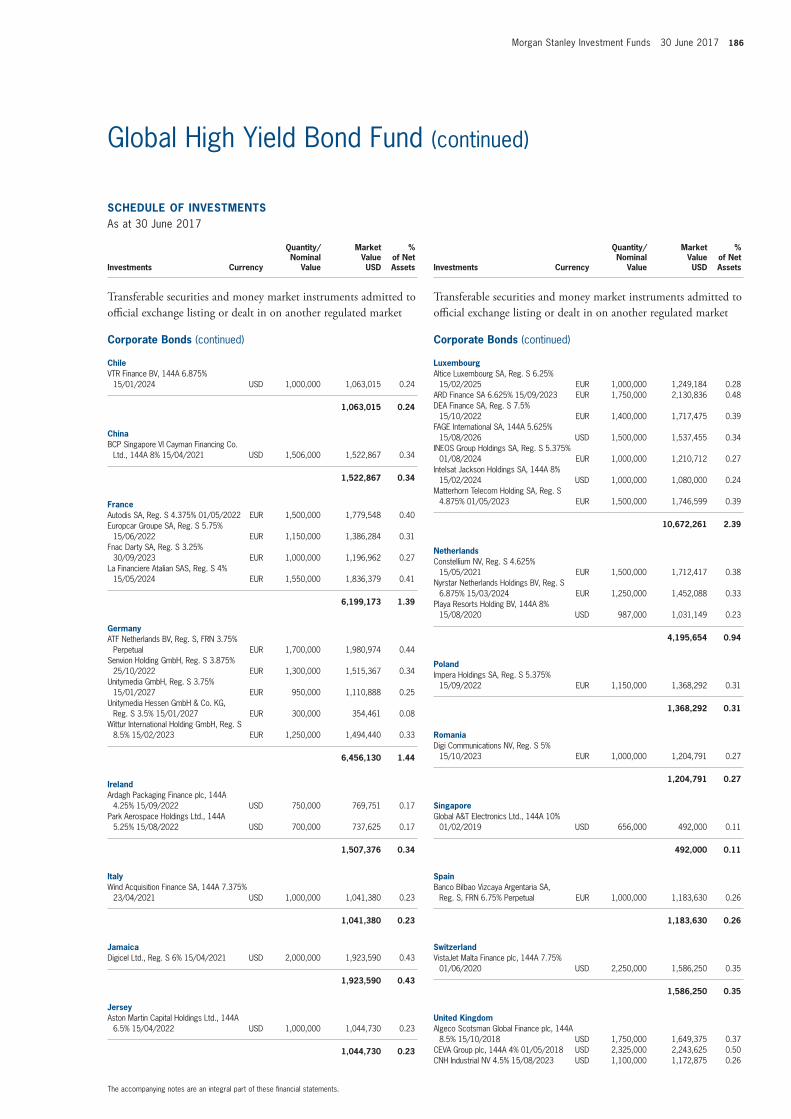
Morgan Stanley Investment Funds 30 June 2017 186
The accompanying notes are an integral part of these fi nancial statements.
Global High Yield Bond Fund (continued)
SCHEDULE OF INVESTMENTSAs at 30 June 2017
Investments Currency
Quantity/Nominal
Value
Market Value USD
% of Net Assets
Transferable securities and money market instruments admitted to offi cial exchange listing or dealt in on another regulated market
Corporate Bonds (continued)
ChileVTR Finance BV, 144A 6.875%
15/01/2024 USD 1,000,000 1,063,015 0.24
1,063,015 0.24
ChinaBCP Singapore VI Cayman Financing Co.
Ltd., 144A 8% 15/04/2021 USD 1,506,000 1,522,867 0.34
1,522,867 0.34
FranceAutodis SA, Reg. S 4.375% 01/05/2022 EUR 1,500,000 1,779,548 0.40 Europcar Groupe SA, Reg. S 5.75%
15/06/2022 EUR 1,150,000 1,386,284 0.31 Fnac Darty SA, Reg. S 3.25%
30/09/2023 EUR 1,000,000 1,196,962 0.27 La Financiere Atalian SAS, Reg. S 4%
15/05/2024 EUR 1,550,000 1,836,379 0.41
6,199,173 1.39
GermanyATF Netherlands BV, Reg. S, FRN 3.75%
Perpetual EUR 1,700,000 1,980,974 0.44 Senvion Holding GmbH, Reg. S 3.875%
25/10/2022 EUR 1,300,000 1,515,367 0.34 Unitymedia GmbH, Reg. S 3.75%
15/01/2027 EUR 950,000 1,110,888 0.25 Unitymedia Hessen GmbH & Co. KG,
Reg. S 3.5% 15/01/2027 EUR 300,000 354,461 0.08 Wittur International Holding GmbH, Reg. S
8.5% 15/02/2023 EUR 1,250,000 1,494,440 0.33
6,456,130 1.44
IrelandArdagh Packaging Finance plc, 144A
4.25% 15/09/2022 USD 750,000 769,751 0.17 Park Aerospace Holdings Ltd., 144A
5.25% 15/08/2022 USD 700,000 737,625 0.17
1,507,376 0.34
ItalyWind Acquisition Finance SA, 144A 7.375%
23/04/2021 USD 1,000,000 1,041,380 0.23
1,041,380 0.23
JamaicaDigicel Ltd., Reg. S 6% 15/04/2021 USD 2,000,000 1,923,590 0.43
1,923,590 0.43
JerseyAston Martin Capital Holdings Ltd., 144A
6.5% 15/04/2022 USD 1,000,000 1,044,730 0.23
1,044,730 0.23
SCHEDULE OF INVESTMENTSAs at 30 June 2017
Investments Currency
Quantity/Nominal
Value
Market Value USD
% of Net Assets
Transferable securities and money market instruments admitted to offi cial exchange listing or dealt in on another regulated market
Corporate Bonds (continued)
LuxembourgAltice Luxembourg SA, Reg. S 6.25%
15/02/2025 EUR 1,000,000 1,249,184 0.28 ARD Finance SA 6.625% 15/09/2023 EUR 1,750,000 2,130,836 0.48 DEA Finance SA, Reg. S 7.5%
15/10/2022 EUR 1,400,000 1,717,475 0.39 FAGE International SA, 144A 5.625%
15/08/2026 USD 1,500,000 1,537,455 0.34 INEOS Group Holdings SA, Reg. S 5.375%
01/08/2024 EUR 1,000,000 1,210,712 0.27 Intelsat Jackson Holdings SA, 144A 8%
15/02/2024 USD 1,000,000 1,080,000 0.24 Matterhorn Telecom Holding SA, Reg. S
4.875% 01/05/2023 EUR 1,500,000 1,746,599 0.39
10,672,261 2.39
NetherlandsConstellium NV, Reg. S 4.625%
15/05/2021 EUR 1,500,000 1,712,417 0.38 Nyrstar Netherlands Holdings BV, Reg. S
6.875% 15/03/2024 EUR 1,250,000 1,452,088 0.33 Playa Resorts Holding BV, 144A 8%
15/08/2020 USD 987,000 1,031,149 0.23
4,195,654 0.94
PolandImpera Holdings SA, Reg. S 5.375%
15/09/2022 EUR 1,150,000 1,368,292 0.31
1,368,292 0.31
RomaniaDigi Communications NV, Reg. S 5%
15/10/2023 EUR 1,000,000 1,204,791 0.27
1,204,791 0.27
SingaporeGlobal A&T Electronics Ltd., 144A 10%
01/02/2019 USD 656,000 492,000 0.11
492,000 0.11
SpainBanco Bilbao Vizcaya Argentaria SA,
Reg. S, FRN 6.75% Perpetual EUR 1,000,000 1,183,630 0.26
1,183,630 0.26
SwitzerlandVistaJet Malta Finance plc, 144A 7.75%
01/06/2020 USD 2,250,000 1,586,250 0.35
1,586,250 0.35
United KingdomAlgeco Scotsman Global Finance plc, 144A
8.5% 15/10/2018 USD 1,750,000 1,649,375 0.37 CEVA Group plc, 144A 4% 01/05/2018 USD 2,325,000 2,243,625 0.50 CNH Industrial NV 4.5% 15/08/2023 USD 1,100,000 1,172,875 0.26
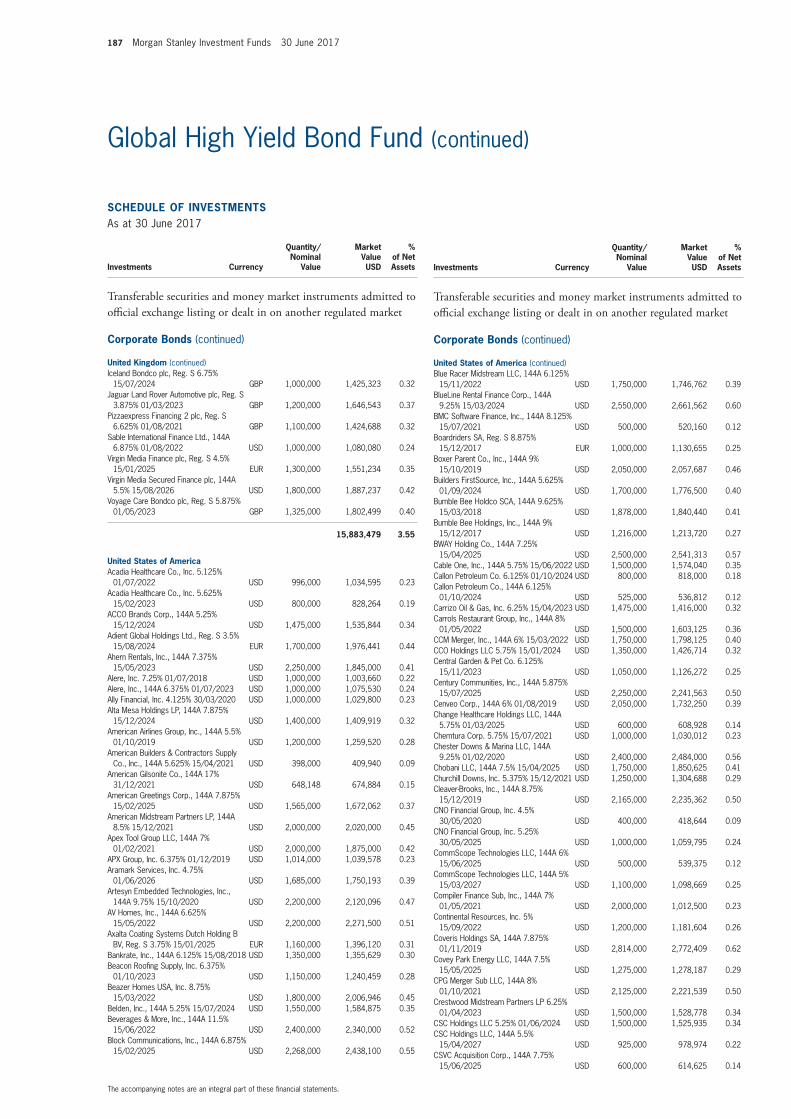
187 Morgan Stanley Investment Funds 30 June 2017
The accompanying notes are an integral part of these fi nancial statements.
Global High Yield Bond Fund (continued)
SCHEDULE OF INVESTMENTSAs at 30 June 2017
Investments Currency
Quantity/Nominal
Value
Market Value USD
% of Net Assets
Transferable securities and money market instruments admitted to offi cial exchange listing or dealt in on another regulated market
Corporate Bonds (continued)
United Kingdom (continued)Iceland Bondco plc, Reg. S 6.75%
15/07/2024 GBP 1,000,000 1,425,323 0.32 Jaguar Land Rover Automotive plc, Reg. S
3.875% 01/03/2023 GBP 1,200,000 1,646,543 0.37 Pizzaexpress Financing 2 plc, Reg. S
6.625% 01/08/2021 GBP 1,100,000 1,424,688 0.32 Sable International Finance Ltd., 144A
6.875% 01/08/2022 USD 1,000,000 1,080,080 0.24 Virgin Media Finance plc, Reg. S 4.5%
15/01/2025 EUR 1,300,000 1,551,234 0.35 Virgin Media Secured Finance plc, 144A
5.5% 15/08/2026 USD 1,800,000 1,887,237 0.42 Voyage Care Bondco plc, Reg. S 5.875%
01/05/2023 GBP 1,325,000 1,802,499 0.40
15,883,479 3.55
United States of AmericaAcadia Healthcare Co., Inc. 5.125%
01/07/2022 USD 996,000 1,034,595 0.23 Acadia Healthcare Co., Inc. 5.625%
15/02/2023 USD 800,000 828,264 0.19 ACCO Brands Corp., 144A 5.25%
15/12/2024 USD 1,475,000 1,535,844 0.34 Adient Global Holdings Ltd., Reg. S 3.5%
15/08/2024 EUR 1,700,000 1,976,441 0.44 Ahern Rentals, Inc., 144A 7.375%
15/05/2023 USD 2,250,000 1,845,000 0.41 Alere, Inc. 7.25% 01/07/2018 USD 1,000,000 1,003,660 0.22 Alere, Inc., 144A 6.375% 01/07/2023 USD 1,000,000 1,075,530 0.24 Ally Financial, Inc. 4.125% 30/03/2020 USD 1,000,000 1,029,800 0.23 Alta Mesa Holdings LP, 144A 7.875%
15/12/2024 USD 1,400,000 1,409,919 0.32 American Airlines Group, Inc., 144A 5.5%
01/10/2019 USD 1,200,000 1,259,520 0.28 American Builders & Contractors Supply
Co., Inc., 144A 5.625% 15/04/2021 USD 398,000 409,940 0.09 American Gilsonite Co., 144A 17%
31/12/2021 USD 648,148 674,884 0.15 American Greetings Corp., 144A 7.875%
15/02/2025 USD 1,565,000 1,672,062 0.37 American Midstream Partners LP, 144A
8.5% 15/12/2021 USD 2,000,000 2,020,000 0.45 Apex Tool Group LLC, 144A 7%
01/02/2021 USD 2,000,000 1,875,000 0.42 APX Group, Inc. 6.375% 01/12/2019 USD 1,014,000 1,039,578 0.23 Aramark Services, Inc. 4.75%
01/06/2026 USD 1,685,000 1,750,193 0.39 Artesyn Embedded Technologies, Inc.,
144A 9.75% 15/10/2020 USD 2,200,000 2,120,096 0.47 AV Homes, Inc., 144A 6.625%
15/05/2022 USD 2,200,000 2,271,500 0.51 Axalta Coating Systems Dutch Holding B
BV, Reg. S 3.75% 15/01/2025 EUR 1,160,000 1,396,120 0.31 Bankrate, Inc., 144A 6.125% 15/08/2018 USD 1,350,000 1,355,629 0.30 Beacon Roofi ng Supply, Inc. 6.375%
01/10/2023 USD 1,150,000 1,240,459 0.28 Beazer Homes USA, Inc. 8.75%
15/03/2022 USD 1,800,000 2,006,946 0.45 Belden, Inc., 144A 5.25% 15/07/2024 USD 1,550,000 1,584,875 0.35 Beverages & More, Inc., 144A 11.5%
15/06/2022 USD 2,400,000 2,340,000 0.52 Block Communications, Inc., 144A 6.875%
15/02/2025 USD 2,268,000 2,438,100 0.55
SCHEDULE OF INVESTMENTSAs at 30 June 2017
Investments Currency
Quantity/Nominal
Value
Market Value USD
% of Net Assets
Transferable securities and money market instruments admitted to offi cial exchange listing or dealt in on another regulated market
Corporate Bonds (continued)
United States of America (continued)Blue Racer Midstream LLC, 144A 6.125%
15/11/2022 USD 1,750,000 1,746,762 0.39 BlueLine Rental Finance Corp., 144A
9.25% 15/03/2024 USD 2,550,000 2,661,562 0.60 BMC Software Finance, Inc., 144A 8.125%
15/07/2021 USD 500,000 520,160 0.12 Boardriders SA, Reg. S 8.875%
15/12/2017 EUR 1,000,000 1,130,655 0.25 Boxer Parent Co., Inc., 144A 9%
15/10/2019 USD 2,050,000 2,057,687 0.46 Builders FirstSource, Inc., 144A 5.625%
01/09/2024 USD 1,700,000 1,776,500 0.40 Bumble Bee Holdco SCA, 144A 9.625%
15/03/2018 USD 1,878,000 1,840,440 0.41 Bumble Bee Holdings, Inc., 144A 9%
15/12/2017 USD 1,216,000 1,213,720 0.27 BWAY Holding Co., 144A 7.25%
15/04/2025 USD 2,500,000 2,541,313 0.57 Cable One, Inc., 144A 5.75% 15/06/2022 USD 1,500,000 1,574,040 0.35 Callon Petroleum Co. 6.125% 01/10/2024 USD 800,000 818,000 0.18 Callon Petroleum Co., 144A 6.125%
01/10/2024 USD 525,000 536,812 0.12 Carrizo Oil & Gas, Inc. 6.25% 15/04/2023 USD 1,475,000 1,416,000 0.32 Carrols Restaurant Group, Inc., 144A 8%
01/05/2022 USD 1,500,000 1,603,125 0.36 CCM Merger, Inc., 144A 6% 15/03/2022 USD 1,750,000 1,798,125 0.40 CCO Holdings LLC 5.75% 15/01/2024 USD 1,350,000 1,426,714 0.32 Central Garden & Pet Co. 6.125%
15/11/2023 USD 1,050,000 1,126,272 0.25 Century Communities, Inc., 144A 5.875%
15/07/2025 USD 2,250,000 2,241,563 0.50 Cenveo Corp., 144A 6% 01/08/2019 USD 2,050,000 1,732,250 0.39 Change Healthcare Holdings LLC, 144A
5.75% 01/03/2025 USD 600,000 608,928 0.14 Chemtura Corp. 5.75% 15/07/2021 USD 1,000,000 1,030,012 0.23 Chester Downs & Marina LLC, 144A
9.25% 01/02/2020 USD 2,400,000 2,484,000 0.56 Chobani LLC, 144A 7.5% 15/04/2025 USD 1,750,000 1,850,625 0.41 Churchill Downs, Inc. 5.375% 15/12/2021 USD 1,250,000 1,304,688 0.29 Cleaver-Brooks, Inc., 144A 8.75%
15/12/2019 USD 2,165,000 2,235,362 0.50 CNO Financial Group, Inc. 4.5%
30/05/2020 USD 400,000 418,644 0.09 CNO Financial Group, Inc. 5.25%
30/05/2025 USD 1,000,000 1,059,795 0.24 CommScope Technologies LLC, 144A 6%
15/06/2025 USD 500,000 539,375 0.12 CommScope Technologies LLC, 144A 5%
15/03/2027 USD 1,100,000 1,098,669 0.25 Compiler Finance Sub, Inc., 144A 7%
01/05/2021 USD 2,000,000 1,012,500 0.23 Continental Resources, Inc. 5%
15/09/2022 USD 1,200,000 1,181,604 0.26 Coveris Holdings SA, 144A 7.875%
01/11/2019 USD 2,814,000 2,772,409 0.62 Covey Park Energy LLC, 144A 7.5%
15/05/2025 USD 1,275,000 1,278,187 0.29 CPG Merger Sub LLC, 144A 8%
01/10/2021 USD 2,125,000 2,221,539 0.50 Crestwood Midstream Partners LP 6.25%
01/04/2023 USD 1,500,000 1,528,778 0.34 CSC Holdings LLC 5.25% 01/06/2024 USD 1,500,000 1,525,935 0.34 CSC Holdings LLC, 144A 5.5%
15/04/2027 USD 925,000 978,974 0.22 CSVC Acquisition Corp., 144A 7.75%
15/06/2025 USD 600,000 614,625 0.14
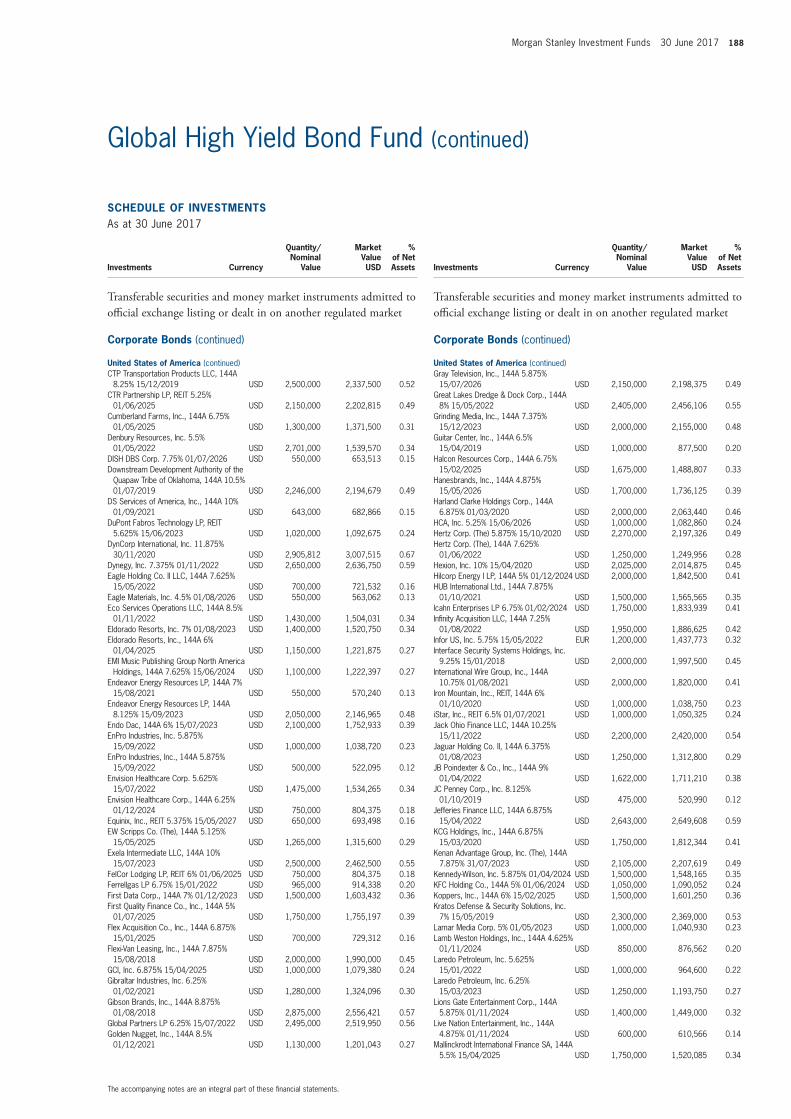
Morgan Stanley Investment Funds 30 June 2017 188
The accompanying notes are an integral part of these fi nancial statements.
Global High Yield Bond Fund (continued)
SCHEDULE OF INVESTMENTSAs at 30 June 2017
Investments Currency
Quantity/Nominal
Value
Market Value USD
% of Net Assets
Transferable securities and money market instruments admitted to offi cial exchange listing or dealt in on another regulated market
Corporate Bonds (continued)
United States of America (continued)CTP Transportation Products LLC, 144A
8.25% 15/12/2019 USD 2,500,000 2,337,500 0.52 CTR Partnership LP, REIT 5.25%
01/06/2025 USD 2,150,000 2,202,815 0.49 Cumberland Farms, Inc., 144A 6.75%
01/05/2025 USD 1,300,000 1,371,500 0.31 Denbury Resources, Inc. 5.5%
01/05/2022 USD 2,701,000 1,539,570 0.34 DISH DBS Corp. 7.75% 01/07/2026 USD 550,000 653,513 0.15 Downstream Development Authority of the
Quapaw Tribe of Oklahoma, 144A 10.5% 01/07/2019 USD 2,246,000 2,194,679 0.49
DS Services of America, Inc., 144A 10% 01/09/2021 USD 643,000 682,866 0.15
DuPont Fabros Technology LP, REIT 5.625% 15/06/2023 USD 1,020,000 1,092,675 0.24
DynCorp International, Inc. 11.875% 30/11/2020 USD 2,905,812 3,007,515 0.67
Dynegy, Inc. 7.375% 01/11/2022 USD 2,650,000 2,636,750 0.59 Eagle Holding Co. II LLC, 144A 7.625%
15/05/2022 USD 700,000 721,532 0.16 Eagle Materials, Inc. 4.5% 01/08/2026 USD 550,000 563,062 0.13 Eco Services Operations LLC, 144A 8.5%
01/11/2022 USD 1,430,000 1,504,031 0.34 Eldorado Resorts, Inc. 7% 01/08/2023 USD 1,400,000 1,520,750 0.34 Eldorado Resorts, Inc., 144A 6%
01/04/2025 USD 1,150,000 1,221,875 0.27 EMI Music Publishing Group North America
Holdings, 144A 7.625% 15/06/2024 USD 1,100,000 1,222,397 0.27 Endeavor Energy Resources LP, 144A 7%
15/08/2021 USD 550,000 570,240 0.13 Endeavor Energy Resources LP, 144A
8.125% 15/09/2023 USD 2,050,000 2,146,965 0.48 Endo Dac, 144A 6% 15/07/2023 USD 2,100,000 1,752,933 0.39 EnPro Industries, Inc. 5.875%
15/09/2022 USD 1,000,000 1,038,720 0.23 EnPro Industries, Inc., 144A 5.875%
15/09/2022 USD 500,000 522,095 0.12 Envision Healthcare Corp. 5.625%
15/07/2022 USD 1,475,000 1,534,265 0.34 Envision Healthcare Corp., 144A 6.25%
01/12/2024 USD 750,000 804,375 0.18 Equinix, Inc., REIT 5.375% 15/05/2027 USD 650,000 693,498 0.16 EW Scripps Co. (The), 144A 5.125%
15/05/2025 USD 1,265,000 1,315,600 0.29 Exela Intermediate LLC, 144A 10%
15/07/2023 USD 2,500,000 2,462,500 0.55 FelCor Lodging LP, REIT 6% 01/06/2025 USD 750,000 804,375 0.18 Ferrellgas LP 6.75% 15/01/2022 USD 965,000 914,338 0.20 First Data Corp., 144A 7% 01/12/2023 USD 1,500,000 1,603,432 0.36 First Quality Finance Co., Inc., 144A 5%
01/07/2025 USD 1,750,000 1,755,197 0.39 Flex Acquisition Co., Inc., 144A 6.875%
15/01/2025 USD 700,000 729,312 0.16 Flexi-Van Leasing, Inc., 144A 7.875%
15/08/2018 USD 2,000,000 1,990,000 0.45 GCI, Inc. 6.875% 15/04/2025 USD 1,000,000 1,079,380 0.24 Gibraltar Industries, Inc. 6.25%
01/02/2021 USD 1,280,000 1,324,096 0.30 Gibson Brands, Inc., 144A 8.875%
01/08/2018 USD 2,875,000 2,556,421 0.57 Global Partners LP 6.25% 15/07/2022 USD 2,495,000 2,519,950 0.56 Golden Nugget, Inc., 144A 8.5%
01/12/2021 USD 1,130,000 1,201,043 0.27
SCHEDULE OF INVESTMENTSAs at 30 June 2017
Investments Currency
Quantity/Nominal
Value
Market Value USD
% of Net Assets
Transferable securities and money market instruments admitted to offi cial exchange listing or dealt in on another regulated market
Corporate Bonds (continued)
United States of America (continued)Gray Television, Inc., 144A 5.875%
15/07/2026 USD 2,150,000 2,198,375 0.49 Great Lakes Dredge & Dock Corp., 144A
8% 15/05/2022 USD 2,405,000 2,456,106 0.55 Grinding Media, Inc., 144A 7.375%
15/12/2023 USD 2,000,000 2,155,000 0.48 Guitar Center, Inc., 144A 6.5%
15/04/2019 USD 1,000,000 877,500 0.20 Halcon Resources Corp., 144A 6.75%
15/02/2025 USD 1,675,000 1,488,807 0.33 Hanesbrands, Inc., 144A 4.875%
15/05/2026 USD 1,700,000 1,736,125 0.39 Harland Clarke Holdings Corp., 144A
6.875% 01/03/2020 USD 2,000,000 2,063,440 0.46 HCA, Inc. 5.25% 15/06/2026 USD 1,000,000 1,082,860 0.24 Hertz Corp. (The) 5.875% 15/10/2020 USD 2,270,000 2,197,326 0.49 Hertz Corp. (The), 144A 7.625%
01/06/2022 USD 1,250,000 1,249,956 0.28 Hexion, Inc. 10% 15/04/2020 USD 2,025,000 2,014,875 0.45 Hilcorp Energy I LP, 144A 5% 01/12/2024 USD 2,000,000 1,842,500 0.41 HUB International Ltd., 144A 7.875%
01/10/2021 USD 1,500,000 1,565,565 0.35 Icahn Enterprises LP 6.75% 01/02/2024 USD 1,750,000 1,833,939 0.41 Infi nity Acquisition LLC, 144A 7.25%
01/08/2022 USD 1,950,000 1,886,625 0.42 Infor US, Inc. 5.75% 15/05/2022 EUR 1,200,000 1,437,773 0.32 Interface Security Systems Holdings, Inc.
9.25% 15/01/2018 USD 2,000,000 1,997,500 0.45 International Wire Group, Inc., 144A
10.75% 01/08/2021 USD 2,000,000 1,820,000 0.41 Iron Mountain, Inc., REIT, 144A 6%
01/10/2020 USD 1,000,000 1,038,750 0.23 iStar, Inc., REIT 6.5% 01/07/2021 USD 1,000,000 1,050,325 0.24 Jack Ohio Finance LLC, 144A 10.25%
15/11/2022 USD 2,200,000 2,420,000 0.54 Jaguar Holding Co. II, 144A 6.375%
01/08/2023 USD 1,250,000 1,312,800 0.29 JB Poindexter & Co., Inc., 144A 9%
01/04/2022 USD 1,622,000 1,711,210 0.38 JC Penney Corp., Inc. 8.125%
01/10/2019 USD 475,000 520,990 0.12 Jefferies Finance LLC, 144A 6.875%
15/04/2022 USD 2,643,000 2,649,608 0.59 KCG Holdings, Inc., 144A 6.875%
15/03/2020 USD 1,750,000 1,812,344 0.41 Kenan Advantage Group, Inc. (The), 144A
7.875% 31/07/2023 USD 2,105,000 2,207,619 0.49 Kennedy-Wilson, Inc. 5.875% 01/04/2024 USD 1,500,000 1,548,165 0.35 KFC Holding Co., 144A 5% 01/06/2024 USD 1,050,000 1,090,052 0.24 Koppers, Inc., 144A 6% 15/02/2025 USD 1,500,000 1,601,250 0.36 Kratos Defense & Security Solutions, Inc.
7% 15/05/2019 USD 2,300,000 2,369,000 0.53 Lamar Media Corp. 5% 01/05/2023 USD 1,000,000 1,040,930 0.23 Lamb Weston Holdings, Inc., 144A 4.625%
01/11/2024 USD 850,000 876,562 0.20 Laredo Petroleum, Inc. 5.625%
15/01/2022 USD 1,000,000 964,600 0.22 Laredo Petroleum, Inc. 6.25%
15/03/2023 USD 1,250,000 1,193,750 0.27 Lions Gate Entertainment Corp., 144A
5.875% 01/11/2024 USD 1,400,000 1,449,000 0.32 Live Nation Entertainment, Inc., 144A
4.875% 01/11/2024 USD 600,000 610,566 0.14 Mallinckrodt International Finance SA, 144A
5.5% 15/04/2025 USD 1,750,000 1,520,085 0.34
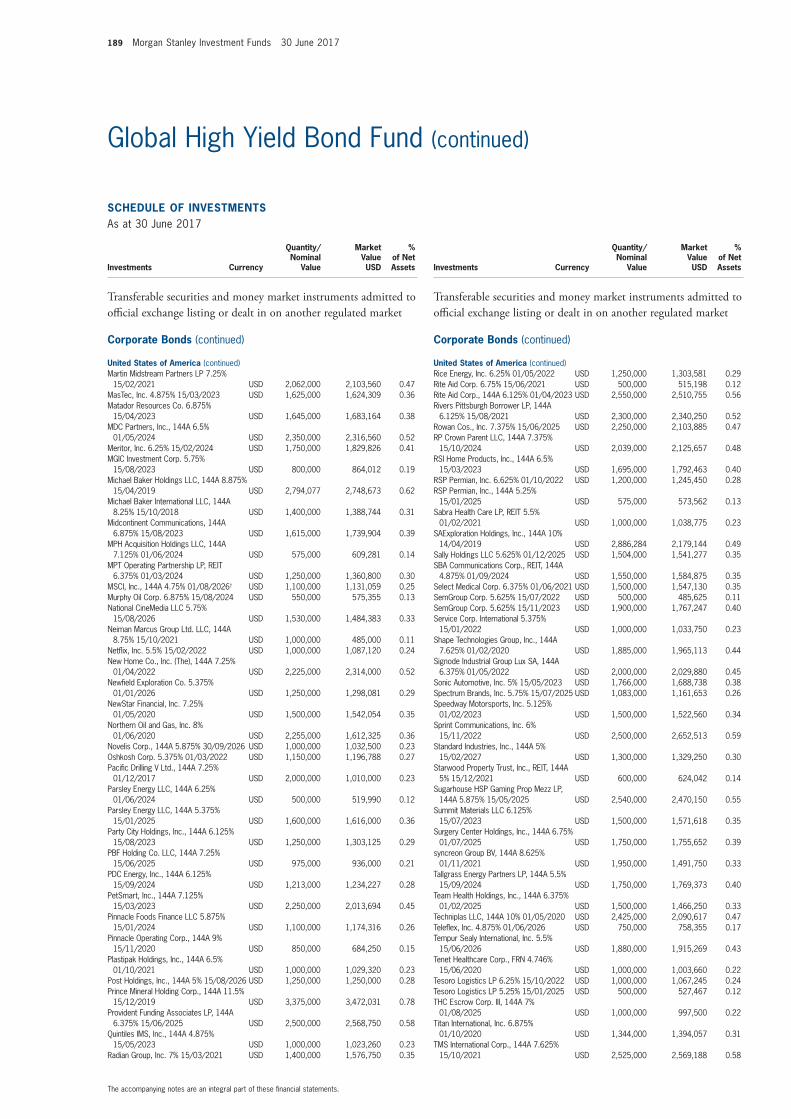
189 Morgan Stanley Investment Funds 30 June 2017
The accompanying notes are an integral part of these fi nancial statements.
Global High Yield Bond Fund (continued)
SCHEDULE OF INVESTMENTSAs at 30 June 2017
Investments Currency
Quantity/Nominal
Value
Market Value USD
% of Net Assets
Transferable securities and money market instruments admitted to offi cial exchange listing or dealt in on another regulated market
Corporate Bonds (continued)
United States of America (continued)Martin Midstream Partners LP 7.25%
15/02/2021 USD 2,062,000 2,103,560 0.47 MasTec, Inc. 4.875% 15/03/2023 USD 1,625,000 1,624,309 0.36 Matador Resources Co. 6.875%
15/04/2023 USD 1,645,000 1,683,164 0.38 MDC Partners, Inc., 144A 6.5%
01/05/2024 USD 2,350,000 2,316,560 0.52 Meritor, Inc. 6.25% 15/02/2024 USD 1,750,000 1,829,826 0.41 MGIC Investment Corp. 5.75%
15/08/2023 USD 800,000 864,012 0.19 Michael Baker Holdings LLC, 144A 8.875%
15/04/2019 USD 2,794,077 2,748,673 0.62 Michael Baker International LLC, 144A
8.25% 15/10/2018 USD 1,400,000 1,388,744 0.31 Midcontinent Communications, 144A
6.875% 15/08/2023 USD 1,615,000 1,739,904 0.39 MPH Acquisition Holdings LLC, 144A
7.125% 01/06/2024 USD 575,000 609,281 0.14 MPT Operating Partnership LP, REIT
6.375% 01/03/2024 USD 1,250,000 1,360,800 0.30 MSCI, Inc., 144A 4.75% 01/08/2026† USD 1,100,000 1,131,059 0.25 Murphy Oil Corp. 6.875% 15/08/2024 USD 550,000 575,355 0.13 National CineMedia LLC 5.75%
15/08/2026 USD 1,530,000 1,484,383 0.33 Neiman Marcus Group Ltd. LLC, 144A
8.75% 15/10/2021 USD 1,000,000 485,000 0.11 Netfl ix, Inc. 5.5% 15/02/2022 USD 1,000,000 1,087,120 0.24 New Home Co., Inc. (The), 144A 7.25%
01/04/2022 USD 2,225,000 2,314,000 0.52 Newfi eld Exploration Co. 5.375%
01/01/2026 USD 1,250,000 1,298,081 0.29 NewStar Financial, Inc. 7.25%
01/05/2020 USD 1,500,000 1,542,054 0.35 Northern Oil and Gas, Inc. 8%
01/06/2020 USD 2,255,000 1,612,325 0.36 Novelis Corp., 144A 5.875% 30/09/2026 USD 1,000,000 1,032,500 0.23 Oshkosh Corp. 5.375% 01/03/2022 USD 1,150,000 1,196,788 0.27 Pacifi c Drilling V Ltd., 144A 7.25%
01/12/2017 USD 2,000,000 1,010,000 0.23 Parsley Energy LLC, 144A 6.25%
01/06/2024 USD 500,000 519,990 0.12 Parsley Energy LLC, 144A 5.375%
15/01/2025 USD 1,600,000 1,616,000 0.36 Party City Holdings, Inc., 144A 6.125%
15/08/2023 USD 1,250,000 1,303,125 0.29 PBF Holding Co. LLC, 144A 7.25%
15/06/2025 USD 975,000 936,000 0.21 PDC Energy, Inc., 144A 6.125%
15/09/2024 USD 1,213,000 1,234,227 0.28 PetSmart, Inc., 144A 7.125%
15/03/2023 USD 2,250,000 2,013,694 0.45 Pinnacle Foods Finance LLC 5.875%
15/01/2024 USD 1,100,000 1,174,316 0.26 Pinnacle Operating Corp., 144A 9%
15/11/2020 USD 850,000 684,250 0.15 Plastipak Holdings, Inc., 144A 6.5%
01/10/2021 USD 1,000,000 1,029,320 0.23 Post Holdings, Inc., 144A 5% 15/08/2026 USD 1,250,000 1,250,000 0.28 Prince Mineral Holding Corp., 144A 11.5%
15/12/2019 USD 3,375,000 3,472,031 0.78 Provident Funding Associates LP, 144A
6.375% 15/06/2025 USD 2,500,000 2,568,750 0.58 Quintiles IMS, Inc., 144A 4.875%
15/05/2023 USD 1,000,000 1,023,260 0.23 Radian Group, Inc. 7% 15/03/2021 USD 1,400,000 1,576,750 0.35
SCHEDULE OF INVESTMENTSAs at 30 June 2017
Investments Currency
Quantity/Nominal
Value
Market Value USD
% of Net Assets
Transferable securities and money market instruments admitted to offi cial exchange listing or dealt in on another regulated market
Corporate Bonds (continued)
United States of America (continued)Rice Energy, Inc. 6.25% 01/05/2022 USD 1,250,000 1,303,581 0.29 Rite Aid Corp. 6.75% 15/06/2021 USD 500,000 515,198 0.12 Rite Aid Corp., 144A 6.125% 01/04/2023 USD 2,550,000 2,510,755 0.56 Rivers Pittsburgh Borrower LP, 144A
6.125% 15/08/2021 USD 2,300,000 2,340,250 0.52 Rowan Cos., Inc. 7.375% 15/06/2025 USD 2,250,000 2,103,885 0.47 RP Crown Parent LLC, 144A 7.375%
15/10/2024 USD 2,039,000 2,125,657 0.48 RSI Home Products, Inc., 144A 6.5%
15/03/2023 USD 1,695,000 1,792,463 0.40 RSP Permian, Inc. 6.625% 01/10/2022 USD 1,200,000 1,245,450 0.28 RSP Permian, Inc., 144A 5.25%
15/01/2025 USD 575,000 573,562 0.13 Sabra Health Care LP, REIT 5.5%
01/02/2021 USD 1,000,000 1,038,775 0.23 SAExploration Holdings, Inc., 144A 10%
14/04/2019 USD 2,886,284 2,179,144 0.49 Sally Holdings LLC 5.625% 01/12/2025 USD 1,504,000 1,541,277 0.35 SBA Communications Corp., REIT, 144A
4.875% 01/09/2024 USD 1,550,000 1,584,875 0.35 Select Medical Corp. 6.375% 01/06/2021 USD 1,500,000 1,547,130 0.35 SemGroup Corp. 5.625% 15/07/2022 USD 500,000 485,625 0.11 SemGroup Corp. 5.625% 15/11/2023 USD 1,900,000 1,767,247 0.40 Service Corp. International 5.375%
15/01/2022 USD 1,000,000 1,033,750 0.23 Shape Technologies Group, Inc., 144A
7.625% 01/02/2020 USD 1,885,000 1,965,113 0.44 Signode Industrial Group Lux SA, 144A
6.375% 01/05/2022 USD 2,000,000 2,029,880 0.45 Sonic Automotive, Inc. 5% 15/05/2023 USD 1,766,000 1,688,738 0.38 Spectrum Brands, Inc. 5.75% 15/07/2025 USD 1,083,000 1,161,653 0.26 Speedway Motorsports, Inc. 5.125%
01/02/2023 USD 1,500,000 1,522,560 0.34 Sprint Communications, Inc. 6%
15/11/2022 USD 2,500,000 2,652,513 0.59 Standard Industries, Inc., 144A 5%
15/02/2027 USD 1,300,000 1,329,250 0.30 Starwood Property Trust, Inc., REIT, 144A
5% 15/12/2021 USD 600,000 624,042 0.14 Sugarhouse HSP Gaming Prop Mezz LP,
144A 5.875% 15/05/2025 USD 2,540,000 2,470,150 0.55 Summit Materials LLC 6.125%
15/07/2023 USD 1,500,000 1,571,618 0.35 Surgery Center Holdings, Inc., 144A 6.75%
01/07/2025 USD 1,750,000 1,755,652 0.39 syncreon Group BV, 144A 8.625%
01/11/2021 USD 1,950,000 1,491,750 0.33 Tallgrass Energy Partners LP, 144A 5.5%
15/09/2024 USD 1,750,000 1,769,373 0.40 Team Health Holdings, Inc., 144A 6.375%
01/02/2025 USD 1,500,000 1,466,250 0.33 Techniplas LLC, 144A 10% 01/05/2020 USD 2,425,000 2,090,617 0.47 Telefl ex, Inc. 4.875% 01/06/2026 USD 750,000 758,355 0.17 Tempur Sealy International, Inc. 5.5%
15/06/2026 USD 1,880,000 1,915,269 0.43 Tenet Healthcare Corp., FRN 4.746%
15/06/2020 USD 1,000,000 1,003,660 0.22 Tesoro Logistics LP 6.25% 15/10/2022 USD 1,000,000 1,067,245 0.24 Tesoro Logistics LP 5.25% 15/01/2025 USD 500,000 527,467 0.12 THC Escrow Corp. III, 144A 7%
01/08/2025 USD 1,000,000 997,500 0.22 Titan International, Inc. 6.875%
01/10/2020 USD 1,344,000 1,394,057 0.31 TMS International Corp., 144A 7.625%
15/10/2021 USD 2,525,000 2,569,188 0.58
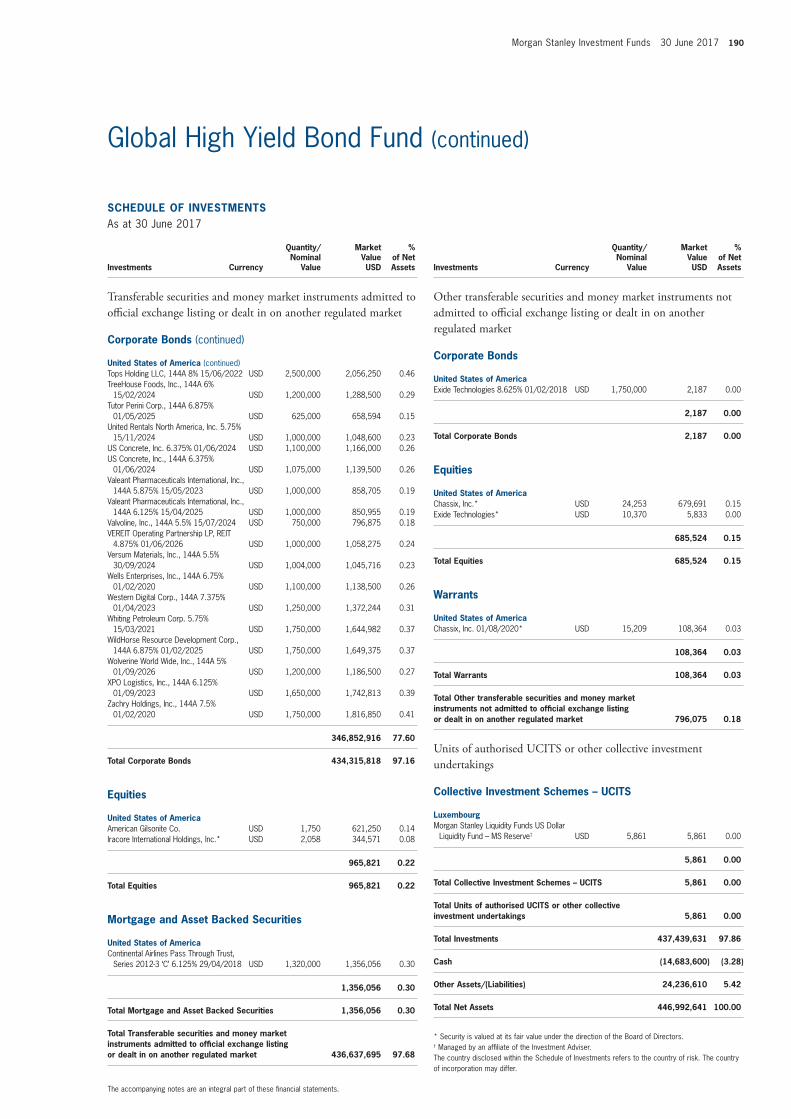
Morgan Stanley Investment Funds 30 June 2017 190
The accompanying notes are an integral part of these fi nancial statements.
Global High Yield Bond Fund (continued)
SCHEDULE OF INVESTMENTSAs at 30 June 2017
Investments Currency
Quantity/Nominal
Value
Market Value USD
% of Net Assets
Transferable securities and money market instruments admitted to offi cial exchange listing or dealt in on another regulated market
Corporate Bonds (continued)
United States of America (continued)Tops Holding LLC, 144A 8% 15/06/2022 USD 2,500,000 2,056,250 0.46 TreeHouse Foods, Inc., 144A 6%
15/02/2024 USD 1,200,000 1,288,500 0.29 Tutor Perini Corp., 144A 6.875%
01/05/2025 USD 625,000 658,594 0.15 United Rentals North America, Inc. 5.75%
15/11/2024 USD 1,000,000 1,048,600 0.23 US Concrete, Inc. 6.375% 01/06/2024 USD 1,100,000 1,166,000 0.26 US Concrete, Inc., 144A 6.375%
01/06/2024 USD 1,075,000 1,139,500 0.26 Valeant Pharmaceuticals International, Inc.,
144A 5.875% 15/05/2023 USD 1,000,000 858,705 0.19 Valeant Pharmaceuticals International, Inc.,
144A 6.125% 15/04/2025 USD 1,000,000 850,955 0.19 Valvoline, Inc., 144A 5.5% 15/07/2024 USD 750,000 796,875 0.18 VEREIT Operating Partnership LP, REIT
4.875% 01/06/2026 USD 1,000,000 1,058,275 0.24 Versum Materials, Inc., 144A 5.5%
30/09/2024 USD 1,004,000 1,045,716 0.23 Wells Enterprises, Inc., 144A 6.75%
01/02/2020 USD 1,100,000 1,138,500 0.26 Western Digital Corp., 144A 7.375%
01/04/2023 USD 1,250,000 1,372,244 0.31 Whiting Petroleum Corp. 5.75%
15/03/2021 USD 1,750,000 1,644,982 0.37 WildHorse Resource Development Corp.,
144A 6.875% 01/02/2025 USD 1,750,000 1,649,375 0.37 Wolverine World Wide, Inc., 144A 5%
01/09/2026 USD 1,200,000 1,186,500 0.27 XPO Logistics, Inc., 144A 6.125%
01/09/2023 USD 1,650,000 1,742,813 0.39 Zachry Holdings, Inc., 144A 7.5%
01/02/2020 USD 1,750,000 1,816,850 0.41
346,852,916 77.60
Total Corporate Bonds 434,315,818 97.16
Equities
United States of AmericaAmerican Gilsonite Co. USD 1,750 621,250 0.14 Iracore International Holdings, Inc.* USD 2,058 344,571 0.08
965,821 0.22
Total Equities 965,821 0.22
Mortgage and Asset Backed Securities
United States of AmericaContinental Airlines Pass Through Trust,
Series 2012-3 ‘C’ 6.125% 29/04/2018 USD 1,320,000 1,356,056 0.30
1,356,056 0.30
Total Mortgage and Asset Backed Securities 1,356,056 0.30
Total Transferable securities and money market instruments admitted to offi cial exchange listing or dealt in on another regulated market 436,637,695 97.68
SCHEDULE OF INVESTMENTSAs at 30 June 2017
Investments Currency
Quantity/Nominal
Value
Market Value USD
% of Net Assets
Other transferable securities and money market instruments not admitted to offi cial exchange listing or dealt in on another regulated market
Corporate Bonds
United States of AmericaExide Technologies 8.625% 01/02/2018 USD 1,750,000 2,187 0.00
2,187 0.00
Total Corporate Bonds 2,187 0.00
Equities
United States of AmericaChassix, Inc.* USD 24,253 679,691 0.15 Exide Technologies* USD 10,370 5,833 0.00
685,524 0.15
Total Equities 685,524 0.15
Warrants
United States of AmericaChassix, Inc. 01/08/2020* USD 15,209 108,364 0.03
108,364 0.03
Total Warrants 108,364 0.03
Total Other transferable securities and money market instruments not admitted to offi cial exchange listing or dealt in on another regulated market 796,075 0.18
Units of authorised UCITS or other collective investment undertakings
Collective Investment Schemes – UCITS
LuxembourgMorgan Stanley Liquidity Funds US Dollar
Liquidity Fund – MS Reserve† USD 5,861 5,861 0.00
5,861 0.00
Total Collective Investment Schemes – UCITS 5,861 0.00
Total Units of authorised UCITS or other collective investment undertakings 5,861 0.00
Total Investments 437,439,631 97.86
Cash (14,683,600) (3.28)
Other Assets/(Liabilities) 24,236,610 5.42
Total Net Assets 446,992,641 100.00
* Security is valued at its fair value under the direction of the Board of Directors.† Managed by an affi liate of the Investment Adviser.The country disclosed within the Schedule of Investments refers to the country of risk. The country of incorporation may differ.
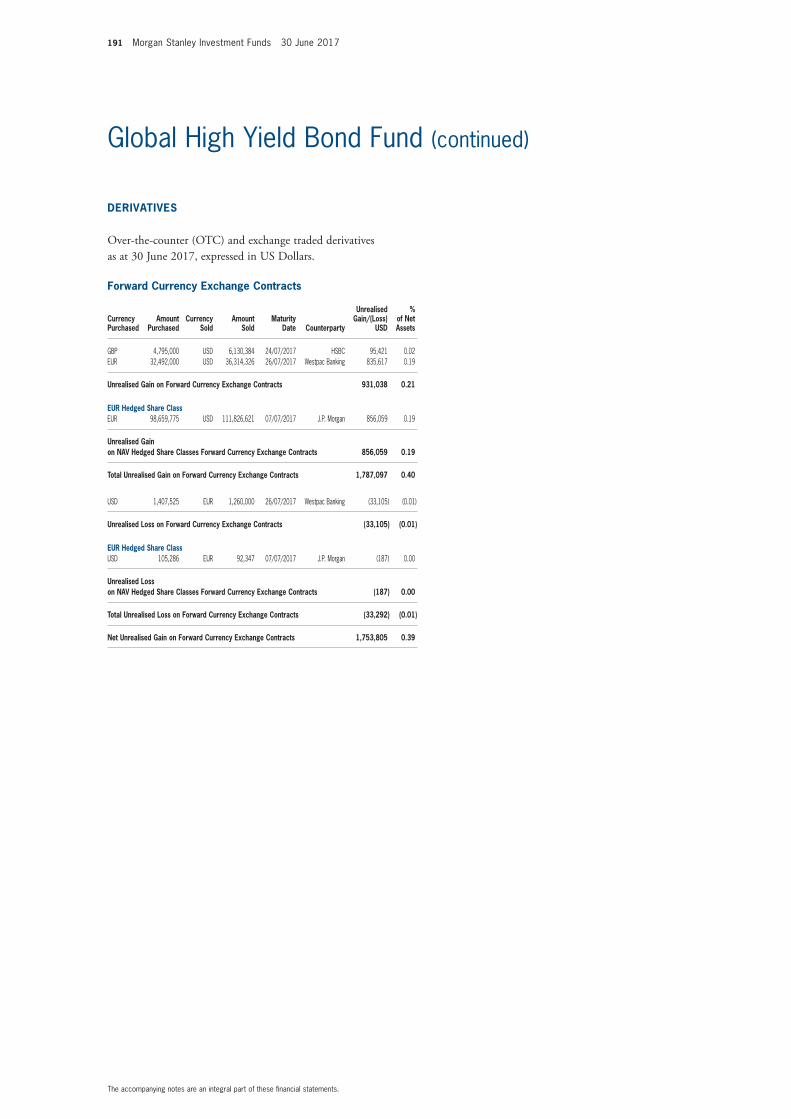
191 Morgan Stanley Investment Funds 30 June 2017
The accompanying notes are an integral part of these fi nancial statements.
Global High Yield Bond Fund (continued)
Forward Currency Exchange Contracts
Currency Purchased
Amount Purchased
Currency Sold
Amount Sold
Maturity Date Counterparty
Unrealised Gain/(Loss)
USD
% of Net Assets
GBP 4,795,000 USD 6,130,384 24/07/2017 HSBC 95,421 0.02 EUR 32,492,000 USD 36,314,326 26/07/2017 Westpac Banking 835,617 0.19
Unrealised Gain on Forward Currency Exchange Contracts 931,038 0.21
EUR Hedged Share ClassEUR 98,659,775 USD 111,826,621 07/07/2017 J.P. Morgan 856,059 0.19
Unrealised Gain on NAV Hedged Share Classes Forward Currency Exchange Contracts 856,059 0.19
Total Unrealised Gain on Forward Currency Exchange Contracts 1,787,097 0.40
USD 1,407,525 EUR 1,260,000 26/07/2017 Westpac Banking (33,105) (0.01)
Unrealised Loss on Forward Currency Exchange Contracts (33,105) (0.01)
EUR Hedged Share ClassUSD 105,286 EUR 92,347 07/07/2017 J.P. Morgan (187) 0.00
Unrealised Loss on NAV Hedged Share Classes Forward Currency Exchange Contracts (187) 0.00
Total Unrealised Loss on Forward Currency Exchange Contracts (33,292) (0.01)
Net Unrealised Gain on Forward Currency Exchange Contracts 1,753,805 0.39
DERIVATIVES
Over-the-counter (OTC) and exchange traded derivatives as at 30 June 2017, expressed in US Dollars.
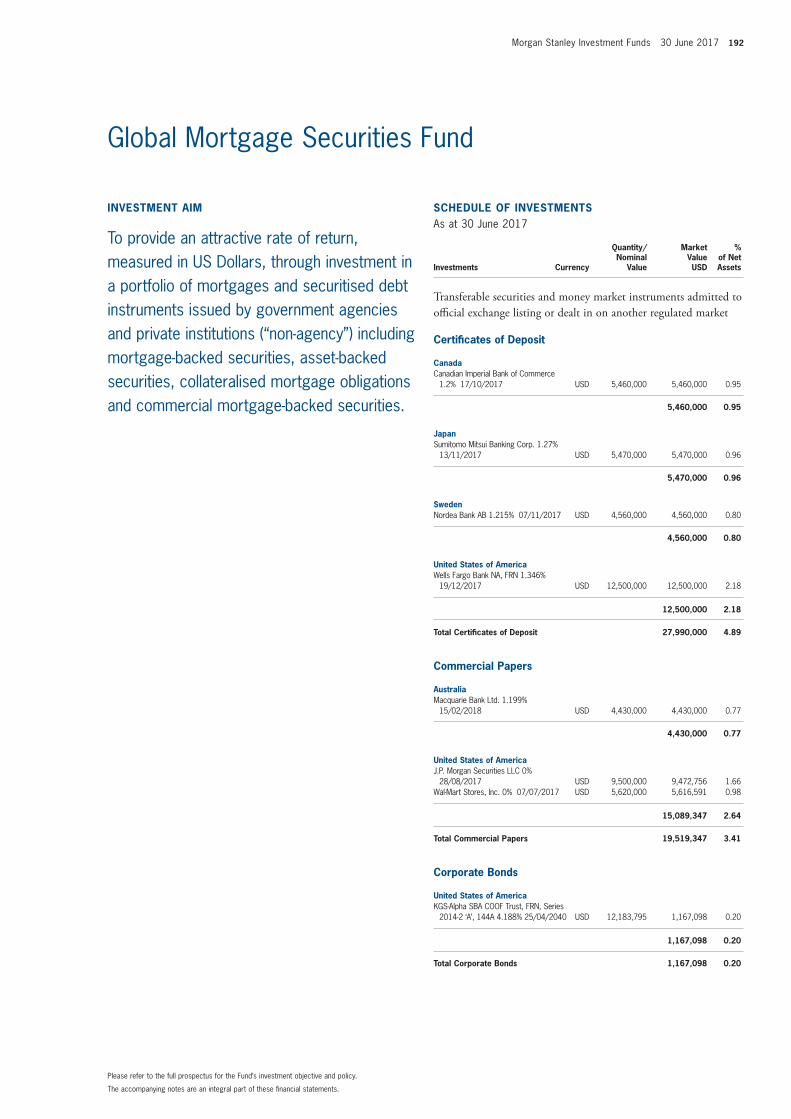
Morgan Stanley Investment Funds 30 June 2017 192
The accompanying notes are an integral part of these fi nancial statements.
Please refer to the full prospectus for the Fund’s investment objective and policy.
INVESTMENT AIM
To provide an attractive rate of return, measured in US Dollars, through investment in a portfolio of mortgages and securitised debt instruments issued by government agencies and private institutions (“non-agency”) including mortgage-backed securities, asset-backed securities, collateralised mortgage obligations and commercial mortgage-backed securities.
SCHEDULE OF INVESTMENTSAs at 30 June 2017
Investments Currency
Quantity/Nominal
Value
Market Value USD
% of Net Assets
Transferable securities and money market instruments admitted to offi cial exchange listing or dealt in on another regulated market
Certifi cates of Deposit
CanadaCanadian Imperial Bank of Commerce
1.2% 17/10/2017 USD 5,460,000 5,460,000 0.95
5,460,000 0.95
JapanSumitomo Mitsui Banking Corp. 1.27%
13/11/2017 USD 5,470,000 5,470,000 0.96
5,470,000 0.96
SwedenNordea Bank AB 1.215% 07/11/2017 USD 4,560,000 4,560,000 0.80
4,560,000 0.80
United States of AmericaWells Fargo Bank NA, FRN 1.346%
19/12/2017 USD 12,500,000 12,500,000 2.18
12,500,000 2.18
Total Certifi cates of Deposit 27,990,000 4.89
Commercial Papers
AustraliaMacquarie Bank Ltd. 1.199%
15/02/2018 USD 4,430,000 4,430,000 0.77
4,430,000 0.77
United States of AmericaJ.P. Morgan Securities LLC 0%
28/08/2017 USD 9,500,000 9,472,756 1.66 Wal-Mart Stores, Inc. 0% 07/07/2017 USD 5,620,000 5,616,591 0.98
15,089,347 2.64
Total Commercial Papers 19,519,347 3.41
Corporate Bonds
United States of AmericaKGS-Alpha SBA COOF Trust, FRN, Series
2014-2 ‘A’, 144A 4.188% 25/04/2040 USD 12,183,795 1,167,098 0.20
1,167,098 0.20
Total Corporate Bonds 1,167,098 0.20
Global Mortgage Securities Fund
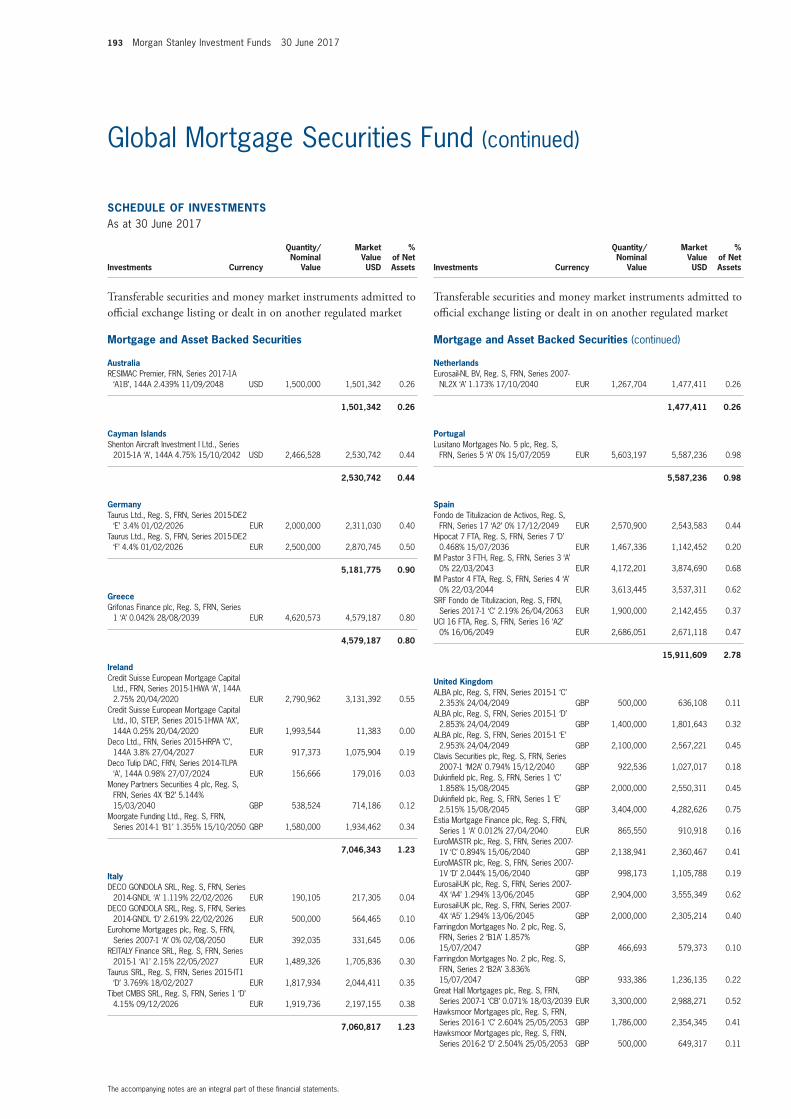
193 Morgan Stanley Investment Funds 30 June 2017
The accompanying notes are an integral part of these fi nancial statements.
Global Mortgage Securities Fund (continued)
SCHEDULE OF INVESTMENTSAs at 30 June 2017
Investments Currency
Quantity/Nominal
Value
Market Value USD
% of Net Assets
Transferable securities and money market instruments admitted to offi cial exchange listing or dealt in on another regulated market
Mortgage and Asset Backed Securities
AustraliaRESIMAC Premier, FRN, Series 2017-1A
‘A1B’, 144A 2.439% 11/09/2048 USD 1,500,000 1,501,342 0.26
1,501,342 0.26
Cayman IslandsShenton Aircraft Investment I Ltd., Series
2015-1A ‘A’, 144A 4.75% 15/10/2042 USD 2,466,528 2,530,742 0.44
2,530,742 0.44
GermanyTaurus Ltd., Reg. S, FRN, Series 2015-DE2
‘E’ 3.4% 01/02/2026 EUR 2,000,000 2,311,030 0.40 Taurus Ltd., Reg. S, FRN, Series 2015-DE2
‘F’ 4.4% 01/02/2026 EUR 2,500,000 2,870,745 0.50
5,181,775 0.90
GreeceGrifonas Finance plc, Reg. S, FRN, Series
1 ‘A’ 0.042% 28/08/2039 EUR 4,620,573 4,579,187 0.80
4,579,187 0.80
IrelandCredit Suisse European Mortgage Capital
Ltd., FRN, Series 2015-1HWA ‘A’, 144A 2.75% 20/04/2020 EUR 2,790,962 3,131,392 0.55
Credit Suisse European Mortgage Capital Ltd., IO, STEP, Series 2015-1HWA ‘AX’, 144A 0.25% 20/04/2020 EUR 1,993,544 11,383 0.00
Deco Ltd., FRN, Series 2015-HRPA ‘C’, 144A 3.8% 27/04/2027 EUR 917,373 1,075,904 0.19
Deco Tulip DAC, FRN, Series 2014-TLPA ‘A’, 144A 0.98% 27/07/2024 EUR 156,666 179,016 0.03
Money Partners Securities 4 plc, Reg. S, FRN, Series 4X ‘B2’ 5.144% 15/03/2040 GBP 538,524 714,186 0.12
Moorgate Funding Ltd., Reg. S, FRN, Series 2014-1 ‘B1’ 1.355% 15/10/2050 GBP 1,580,000 1,934,462 0.34
7,046,343 1.23
ItalyDECO GONDOLA SRL, Reg. S, FRN, Series
2014-GNDL ‘A’ 1.119% 22/02/2026 EUR 190,105 217,305 0.04 DECO GONDOLA SRL, Reg. S, FRN, Series
2014-GNDL ‘D’ 2.619% 22/02/2026 EUR 500,000 564,465 0.10 Eurohome Mortgages plc, Reg. S, FRN,
Series 2007-1 ‘A’ 0% 02/08/2050 EUR 392,035 331,645 0.06 REITALY Finance SRL, Reg. S, FRN, Series
2015-1 ‘A1’ 2.15% 22/05/2027 EUR 1,489,326 1,705,836 0.30 Taurus SRL, Reg. S, FRN, Series 2015-IT1
‘D’ 3.769% 18/02/2027 EUR 1,817,934 2,044,411 0.35 Tibet CMBS SRL, Reg. S, FRN, Series 1 ‘D’
4.15% 09/12/2026 EUR 1,919,736 2,197,155 0.38
7,060,817 1.23
SCHEDULE OF INVESTMENTSAs at 30 June 2017
Investments Currency
Quantity/Nominal
Value
Market Value USD
% of Net Assets
Transferable securities and money market instruments admitted to offi cial exchange listing or dealt in on another regulated market
Mortgage and Asset Backed Securities (continued)
NetherlandsEurosail-NL BV, Reg. S, FRN, Series 2007-
NL2X ‘A’ 1.173% 17/10/2040 EUR 1,267,704 1,477,411 0.26
1,477,411 0.26
PortugalLusitano Mortgages No. 5 plc, Reg. S,
FRN, Series 5 ‘A’ 0% 15/07/2059 EUR 5,603,197 5,587,236 0.98
5,587,236 0.98
SpainFondo de Titulizacion de Activos, Reg. S,
FRN, Series 17 ‘A2’ 0% 17/12/2049 EUR 2,570,900 2,543,583 0.44 Hipocat 7 FTA, Reg. S, FRN, Series 7 ‘D’
0.468% 15/07/2036 EUR 1,467,336 1,142,452 0.20 IM Pastor 3 FTH, Reg. S, FRN, Series 3 ‘A’
0% 22/03/2043 EUR 4,172,201 3,874,690 0.68 IM Pastor 4 FTA, Reg. S, FRN, Series 4 ‘A’
0% 22/03/2044 EUR 3,613,445 3,537,311 0.62 SRF Fondo de Titulizacion, Reg. S, FRN,
Series 2017-1 ‘C’ 2.19% 26/04/2063 EUR 1,900,000 2,142,455 0.37 UCI 16 FTA, Reg. S, FRN, Series 16 ‘A2’
0% 16/06/2049 EUR 2,686,051 2,671,118 0.47
15,911,609 2.78
United KingdomALBA plc, Reg. S, FRN, Series 2015-1 ‘C’
2.353% 24/04/2049 GBP 500,000 636,108 0.11 ALBA plc, Reg. S, FRN, Series 2015-1 ‘D’
2.853% 24/04/2049 GBP 1,400,000 1,801,643 0.32 ALBA plc, Reg. S, FRN, Series 2015-1 ‘E’
2.953% 24/04/2049 GBP 2,100,000 2,567,221 0.45 Clavis Securities plc, Reg. S, FRN, Series
2007-1 ‘M2A’ 0.794% 15/12/2040 GBP 922,536 1,027,017 0.18 Dukinfi eld plc, Reg. S, FRN, Series 1 ‘C’
1.858% 15/08/2045 GBP 2,000,000 2,550,311 0.45 Dukinfi eld plc, Reg. S, FRN, Series 1 ‘E’
2.515% 15/08/2045 GBP 3,404,000 4,282,626 0.75 Estia Mortgage Finance plc, Reg. S, FRN,
Series 1 ‘A’ 0.012% 27/04/2040 EUR 865,550 910,918 0.16 EuroMASTR plc, Reg. S, FRN, Series 2007-
1V ‘C’ 0.894% 15/06/2040 GBP 2,138,941 2,360,467 0.41 EuroMASTR plc, Reg. S, FRN, Series 2007-
1V ‘D’ 2.044% 15/06/2040 GBP 998,173 1,105,788 0.19 Eurosail-UK plc, Reg. S, FRN, Series 2007-
4X ‘A4’ 1.294% 13/06/2045 GBP 2,904,000 3,555,349 0.62 Eurosail-UK plc, Reg. S, FRN, Series 2007-
4X ‘A5’ 1.294% 13/06/2045 GBP 2,000,000 2,305,214 0.40 Farringdon Mortgages No. 2 plc, Reg. S,
FRN, Series 2 ‘B1A’ 1.857% 15/07/2047 GBP 466,693 579,373 0.10
Farringdon Mortgages No. 2 plc, Reg. S, FRN, Series 2 ‘B2A’ 3.836% 15/07/2047 GBP 933,386 1,236,135 0.22
Great Hall Mortgages plc, Reg. S, FRN, Series 2007-1 ‘CB’ 0.071% 18/03/2039 EUR 3,300,000 2,988,271 0.52
Hawksmoor Mortgages plc, Reg. S, FRN, Series 2016-1 ‘C’ 2.604% 25/05/2053 GBP 1,786,000 2,354,345 0.41
Hawksmoor Mortgages plc, Reg. S, FRN, Series 2016-2 ‘D’ 2.504% 25/05/2053 GBP 500,000 649,317 0.11
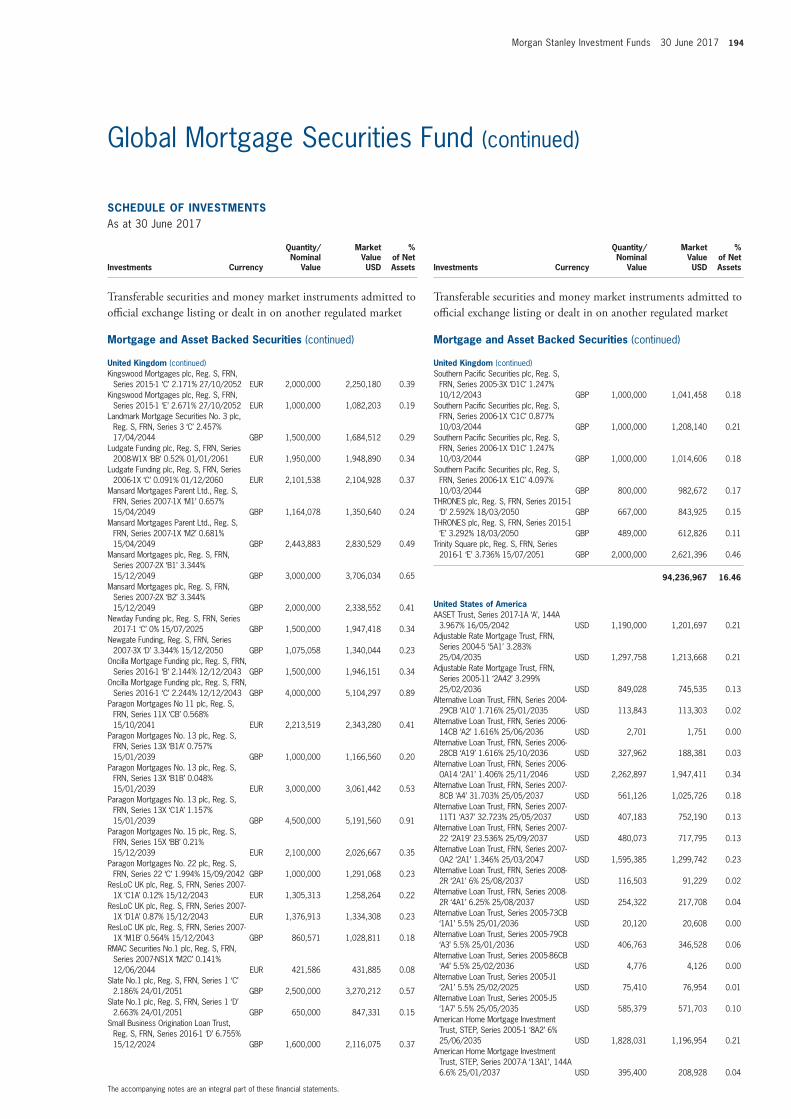
Morgan Stanley Investment Funds 30 June 2017 194
The accompanying notes are an integral part of these fi nancial statements.
Global Mortgage Securities Fund (continued)
SCHEDULE OF INVESTMENTSAs at 30 June 2017
Investments Currency
Quantity/Nominal
Value
Market Value USD
% of Net Assets
Transferable securities and money market instruments admitted to offi cial exchange listing or dealt in on another regulated market
Mortgage and Asset Backed Securities (continued)
United Kingdom (continued)Kingswood Mortgages plc, Reg. S, FRN,
Series 2015-1 ‘C’ 2.171% 27/10/2052 EUR 2,000,000 2,250,180 0.39 Kingswood Mortgages plc, Reg. S, FRN,
Series 2015-1 ‘E’ 2.671% 27/10/2052 EUR 1,000,000 1,082,203 0.19 Landmark Mortgage Securities No. 3 plc,
Reg. S, FRN, Series 3 ‘C’ 2.457% 17/04/2044 GBP 1,500,000 1,684,512 0.29
Ludgate Funding plc, Reg. S, FRN, Series 2008-W1X ‘BB’ 0.52% 01/01/2061 EUR 1,950,000 1,948,890 0.34
Ludgate Funding plc, Reg. S, FRN, Series 2006-1X ‘C’ 0.091% 01/12/2060 EUR 2,101,538 2,104,928 0.37
Mansard Mortgages Parent Ltd., Reg. S, FRN, Series 2007-1X ‘M1’ 0.657% 15/04/2049 GBP 1,164,078 1,350,640 0.24
Mansard Mortgages Parent Ltd., Reg. S, FRN, Series 2007-1X ‘M2’ 0.681% 15/04/2049 GBP 2,443,883 2,830,529 0.49
Mansard Mortgages plc, Reg. S, FRN, Series 2007-2X ‘B1’ 3.344% 15/12/2049 GBP 3,000,000 3,706,034 0.65
Mansard Mortgages plc, Reg. S, FRN, Series 2007-2X ‘B2’ 3.344% 15/12/2049 GBP 2,000,000 2,338,552 0.41
Newday Funding plc, Reg. S, FRN, Series 2017-1 ‘C’ 0% 15/07/2025 GBP 1,500,000 1,947,418 0.34
Newgate Funding, Reg. S, FRN, Series 2007-3X ‘D’ 3.344% 15/12/2050 GBP 1,075,058 1,340,044 0.23
Oncilla Mortgage Funding plc, Reg. S, FRN, Series 2016-1 ‘B’ 2.144% 12/12/2043 GBP 1,500,000 1,946,151 0.34
Oncilla Mortgage Funding plc, Reg. S, FRN, Series 2016-1 ‘C’ 2.244% 12/12/2043 GBP 4,000,000 5,104,297 0.89
Paragon Mortgages No 11 plc, Reg. S, FRN, Series 11X ‘CB’ 0.568% 15/10/2041 EUR 2,213,519 2,343,280 0.41
Paragon Mortgages No. 13 plc, Reg. S, FRN, Series 13X ‘B1A’ 0.757% 15/01/2039 GBP 1,000,000 1,166,560 0.20
Paragon Mortgages No. 13 plc, Reg. S, FRN, Series 13X ‘B1B’ 0.048% 15/01/2039 EUR 3,000,000 3,061,442 0.53
Paragon Mortgages No. 13 plc, Reg. S, FRN, Series 13X ‘C1A’ 1.157% 15/01/2039 GBP 4,500,000 5,191,560 0.91
Paragon Mortgages No. 15 plc, Reg. S, FRN, Series 15X ‘BB’ 0.21% 15/12/2039 EUR 2,100,000 2,026,667 0.35
Paragon Mortgages No. 22 plc, Reg. S, FRN, Series 22 ‘C’ 1.994% 15/09/2042 GBP 1,000,000 1,291,068 0.23
ResLoC UK plc, Reg. S, FRN, Series 2007-1X ‘C1A’ 0.12% 15/12/2043 EUR 1,305,313 1,258,264 0.22
ResLoC UK plc, Reg. S, FRN, Series 2007-1X ‘D1A’ 0.87% 15/12/2043 EUR 1,376,913 1,334,308 0.23
ResLoC UK plc, Reg. S, FRN, Series 2007-1X ‘M1B’ 0.564% 15/12/2043 GBP 860,571 1,028,811 0.18
RMAC Securities No.1 plc, Reg. S, FRN, Series 2007-NS1X ‘M2C’ 0.141% 12/06/2044 EUR 421,586 431,885 0.08
Slate No.1 plc, Reg. S, FRN, Series 1 ‘C’ 2.186% 24/01/2051 GBP 2,500,000 3,270,212 0.57
Slate No.1 plc, Reg. S, FRN, Series 1 ‘D’ 2.663% 24/01/2051 GBP 650,000 847,331 0.15
Small Business Origination Loan Trust, Reg. S, FRN, Series 2016-1 ‘D’ 6.755% 15/12/2024 GBP 1,600,000 2,116,075 0.37
SCHEDULE OF INVESTMENTSAs at 30 June 2017
Investments Currency
Quantity/Nominal
Value
Market Value USD
% of Net Assets
Transferable securities and money market instruments admitted to offi cial exchange listing or dealt in on another regulated market
Mortgage and Asset Backed Securities (continued)
United Kingdom (continued)Southern Pacifi c Securities plc, Reg. S,
FRN, Series 2005-3X ‘D1C’ 1.247% 10/12/2043 GBP 1,000,000 1,041,458 0.18
Southern Pacifi c Securities plc, Reg. S, FRN, Series 2006-1X ‘C1C’ 0.877% 10/03/2044 GBP 1,000,000 1,208,140 0.21
Southern Pacifi c Securities plc, Reg. S, FRN, Series 2006-1X ‘D1C’ 1.247% 10/03/2044 GBP 1,000,000 1,014,606 0.18
Southern Pacifi c Securities plc, Reg. S, FRN, Series 2006-1X ‘E1C’ 4.097% 10/03/2044 GBP 800,000 982,672 0.17
THRONES plc, Reg. S, FRN, Series 2015-1 ‘D’ 2.592% 18/03/2050 GBP 667,000 843,925 0.15
THRONES plc, Reg. S, FRN, Series 2015-1 ‘E’ 3.292% 18/03/2050 GBP 489,000 612,826 0.11
Trinity Square plc, Reg. S, FRN, Series 2016-1 ‘E’ 3.736% 15/07/2051 GBP 2,000,000 2,621,396 0.46
94,236,967 16.46
United States of AmericaAASET Trust, Series 2017-1A ‘A’, 144A
3.967% 16/05/2042 USD 1,190,000 1,201,697 0.21 Adjustable Rate Mortgage Trust, FRN,
Series 2004-5 ‘5A1’ 3.283% 25/04/2035 USD 1,297,758 1,213,668 0.21
Adjustable Rate Mortgage Trust, FRN, Series 2005-11 ‘2A42’ 3.299% 25/02/2036 USD 849,028 745,535 0.13
Alternative Loan Trust, FRN, Series 2004-29CB ‘A10’ 1.716% 25/01/2035 USD 113,843 113,303 0.02
Alternative Loan Trust, FRN, Series 2006-14CB ‘A2’ 1.616% 25/06/2036 USD 2,701 1,751 0.00
Alternative Loan Trust, FRN, Series 2006-28CB ‘A19’ 1.616% 25/10/2036 USD 327,962 188,381 0.03
Alternative Loan Trust, FRN, Series 2006-OA14 ‘2A1’ 1.406% 25/11/2046 USD 2,262,897 1,947,411 0.34
Alternative Loan Trust, FRN, Series 2007-8CB ‘A4’ 31.703% 25/05/2037 USD 561,126 1,025,726 0.18
Alternative Loan Trust, FRN, Series 2007-11T1 ‘A37’ 32.723% 25/05/2037 USD 407,183 752,190 0.13
Alternative Loan Trust, FRN, Series 2007-22 ‘2A19’ 23.536% 25/09/2037 USD 480,073 717,795 0.13
Alternative Loan Trust, FRN, Series 2007-OA2 ‘2A1’ 1.346% 25/03/2047 USD 1,595,385 1,299,742 0.23
Alternative Loan Trust, FRN, Series 2008-2R ‘2A1’ 6% 25/08/2037 USD 116,503 91,229 0.02
Alternative Loan Trust, FRN, Series 2008-2R ‘4A1’ 6.25% 25/08/2037 USD 254,322 217,708 0.04
Alternative Loan Trust, Series 2005-73CB ‘1A1’ 5.5% 25/01/2036 USD 20,120 20,608 0.00
Alternative Loan Trust, Series 2005-79CB ‘A3’ 5.5% 25/01/2036 USD 406,763 346,528 0.06
Alternative Loan Trust, Series 2005-86CB ‘A4’ 5.5% 25/02/2036 USD 4,776 4,126 0.00
Alternative Loan Trust, Series 2005-J1 ‘2A1’ 5.5% 25/02/2025 USD 75,410 76,954 0.01
Alternative Loan Trust, Series 2005-J5 ‘1A7’ 5.5% 25/05/2035 USD 585,379 571,703 0.10
American Home Mortgage Investment Trust, STEP, Series 2005-1 ‘8A2’ 6% 25/06/2035 USD 1,828,031 1,196,954 0.21
American Home Mortgage Investment Trust, STEP, Series 2007-A ‘13A1’, 144A 6.6% 25/01/2037 USD 395,400 208,928 0.04
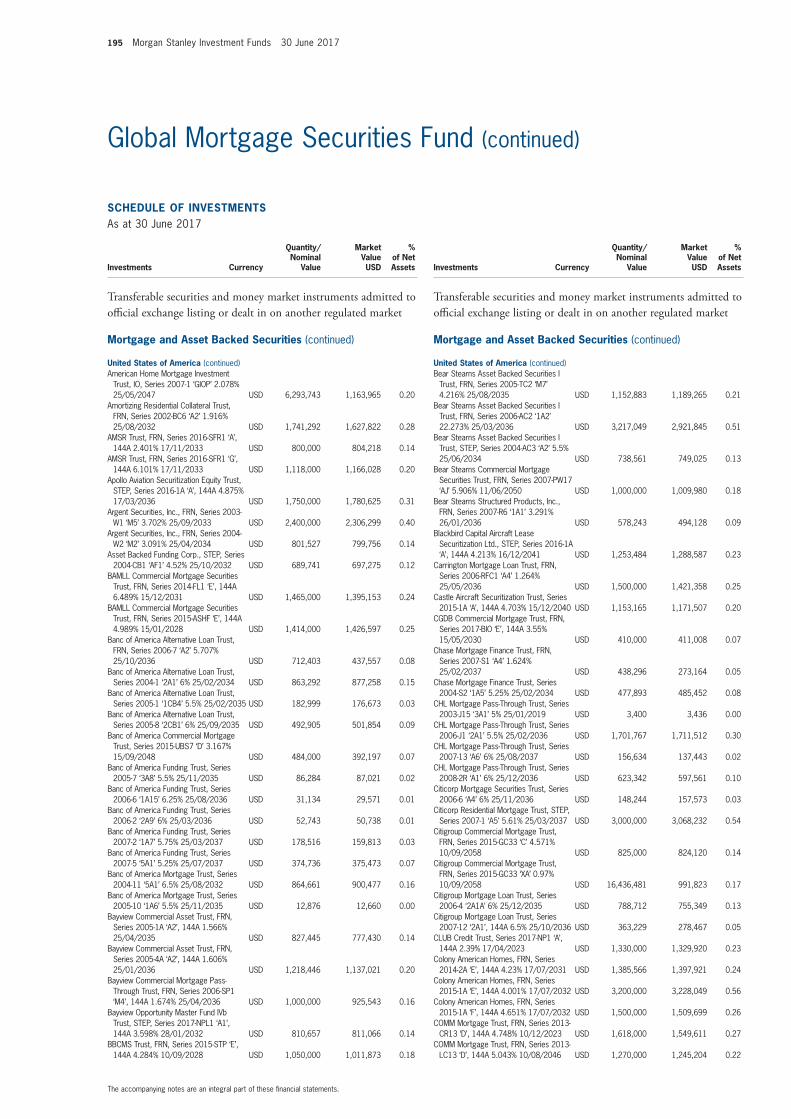
195 Morgan Stanley Investment Funds 30 June 2017
The accompanying notes are an integral part of these fi nancial statements.
Global Mortgage Securities Fund (continued)
SCHEDULE OF INVESTMENTSAs at 30 June 2017
Investments Currency
Quantity/Nominal
Value
Market Value USD
% of Net Assets
Transferable securities and money market instruments admitted to offi cial exchange listing or dealt in on another regulated market
Mortgage and Asset Backed Securities (continued)
United States of America (continued)American Home Mortgage Investment
Trust, IO, Series 2007-1 ‘GIOP’ 2.078% 25/05/2047 USD 6,293,743 1,163,965 0.20
Amortizing Residential Collateral Trust, FRN, Series 2002-BC6 ‘A2’ 1.916% 25/08/2032 USD 1,741,292 1,627,822 0.28
AMSR Trust, FRN, Series 2016-SFR1 ‘A’, 144A 2.401% 17/11/2033 USD 800,000 804,218 0.14
AMSR Trust, FRN, Series 2016-SFR1 ‘G’, 144A 6.101% 17/11/2033 USD 1,118,000 1,166,028 0.20
Apollo Aviation Securitization Equity Trust, STEP, Series 2016-1A ‘A’, 144A 4.875% 17/03/2036 USD 1,750,000 1,780,625 0.31
Argent Securities, Inc., FRN, Series 2003-W1 ‘M5’ 3.702% 25/09/2033 USD 2,400,000 2,306,299 0.40
Argent Securities, Inc., FRN, Series 2004-W2 ‘M2’ 3.091% 25/04/2034 USD 801,527 799,756 0.14
Asset Backed Funding Corp., STEP, Series 2004-CB1 ‘AF1’ 4.52% 25/10/2032 USD 689,741 697,275 0.12
BAMLL Commercial Mortgage Securities Trust, FRN, Series 2014-FL1 ‘E’, 144A 6.489% 15/12/2031 USD 1,465,000 1,395,153 0.24
BAMLL Commercial Mortgage Securities Trust, FRN, Series 2015-ASHF ‘E’, 144A 4.989% 15/01/2028 USD 1,414,000 1,426,597 0.25
Banc of America Alternative Loan Trust, FRN, Series 2006-7 ‘A2’ 5.707% 25/10/2036 USD 712,403 437,557 0.08
Banc of America Alternative Loan Trust, Series 2004-1 ‘2A1’ 6% 25/02/2034 USD 863,292 877,258 0.15
Banc of America Alternative Loan Trust, Series 2005-1 ‘1CB4’ 5.5% 25/02/2035 USD 182,999 176,673 0.03
Banc of America Alternative Loan Trust, Series 2005-8 ‘2CB1’ 6% 25/09/2035 USD 492,905 501,854 0.09
Banc of America Commercial Mortgage Trust, Series 2015-UBS7 ‘D’ 3.167% 15/09/2048 USD 484,000 392,197 0.07
Banc of America Funding Trust, Series 2005-7 ‘3A8’ 5.5% 25/11/2035 USD 86,284 87,021 0.02
Banc of America Funding Trust, Series 2006-6 ‘1A15’ 6.25% 25/08/2036 USD 31,134 29,571 0.01
Banc of America Funding Trust, Series 2006-2 ‘2A9’ 6% 25/03/2036 USD 52,743 50,738 0.01
Banc of America Funding Trust, Series 2007-2 ‘1A7’ 5.75% 25/03/2037 USD 178,516 159,813 0.03
Banc of America Funding Trust, Series 2007-5 ‘5A1’ 5.25% 25/07/2037 USD 374,736 375,473 0.07
Banc of America Mortgage Trust, Series 2004-11 ‘5A1’ 6.5% 25/08/2032 USD 864,661 900,477 0.16
Banc of America Mortgage Trust, Series 2005-10 ‘1A6’ 5.5% 25/11/2035 USD 12,876 12,660 0.00
Bayview Commercial Asset Trust, FRN, Series 2005-1A ‘A2’, 144A 1.566% 25/04/2035 USD 827,445 777,430 0.14
Bayview Commercial Asset Trust, FRN, Series 2005-4A ‘A2’, 144A 1.606% 25/01/2036 USD 1,218,446 1,137,021 0.20
Bayview Commercial Mortgage Pass-Through Trust, FRN, Series 2006-SP1 ‘M4’, 144A 1.674% 25/04/2036 USD 1,000,000 925,543 0.16
Bayview Opportunity Master Fund IVb Trust, STEP, Series 2017-NPL1 ‘A1’, 144A 3.598% 28/01/2032 USD 810,657 811,066 0.14
BBCMS Trust, FRN, Series 2015-STP ‘E’, 144A 4.284% 10/09/2028 USD 1,050,000 1,011,873 0.18
SCHEDULE OF INVESTMENTSAs at 30 June 2017
Investments Currency
Quantity/Nominal
Value
Market Value USD
% of Net Assets
Transferable securities and money market instruments admitted to offi cial exchange listing or dealt in on another regulated market
Mortgage and Asset Backed Securities (continued)
United States of America (continued)Bear Stearns Asset Backed Securities I
Trust, FRN, Series 2005-TC2 ‘M7’ 4.216% 25/08/2035 USD 1,152,883 1,189,265 0.21
Bear Stearns Asset Backed Securities I Trust, FRN, Series 2006-AC2 ‘1A2’ 22.273% 25/03/2036 USD 3,217,049 2,921,845 0.51
Bear Stearns Asset Backed Securities I Trust, STEP, Series 2004-AC3 ‘A2’ 5.5% 25/06/2034 USD 738,561 749,025 0.13
Bear Stearns Commercial Mortgage Securities Trust, FRN, Series 2007-PW17 ‘AJ’ 5.906% 11/06/2050 USD 1,000,000 1,009,980 0.18
Bear Stearns Structured Products, Inc., FRN, Series 2007-R6 ‘1A1’ 3.291% 26/01/2036 USD 578,243 494,128 0.09
Blackbird Capital Aircraft Lease Securitization Ltd., STEP, Series 2016-1A ‘A’, 144A 4.213% 16/12/2041 USD 1,253,484 1,288,587 0.23
Carrington Mortgage Loan Trust, FRN, Series 2006-RFC1 ‘A4’ 1.264% 25/05/2036 USD 1,500,000 1,421,358 0.25
Castle Aircraft Securitization Trust, Series 2015-1A ‘A’, 144A 4.703% 15/12/2040 USD 1,153,165 1,171,507 0.20
CGDB Commercial Mortgage Trust, FRN, Series 2017-BIO ‘E’, 144A 3.55% 15/05/2030 USD 410,000 411,008 0.07
Chase Mortgage Finance Trust, FRN, Series 2007-S1 ‘A4’ 1.624% 25/02/2037 USD 438,296 273,164 0.05
Chase Mortgage Finance Trust, Series 2004-S2 ‘1A5’ 5.25% 25/02/2034 USD 477,893 485,452 0.08
CHL Mortgage Pass-Through Trust, Series 2003-J15 ‘3A1’ 5% 25/01/2019 USD 3,400 3,436 0.00
CHL Mortgage Pass-Through Trust, Series 2006-J1 ‘2A1’ 5.5% 25/02/2036 USD 1,701,767 1,711,512 0.30
CHL Mortgage Pass-Through Trust, Series 2007-13 ‘A6’ 6% 25/08/2037 USD 156,634 137,443 0.02
CHL Mortgage Pass-Through Trust, Series 2008-2R ‘A1’ 6% 25/12/2036 USD 623,342 597,561 0.10
Citicorp Mortgage Securities Trust, Series 2006-6 ‘A4’ 6% 25/11/2036 USD 148,244 157,573 0.03
Citicorp Residential Mortgage Trust, STEP, Series 2007-1 ‘A5’ 5.61% 25/03/2037 USD 3,000,000 3,068,232 0.54
Citigroup Commercial Mortgage Trust, FRN, Series 2015-GC33 ‘C’ 4.571% 10/09/2058 USD 825,000 824,120 0.14
Citigroup Commercial Mortgage Trust, FRN, Series 2015-GC33 ‘XA’ 0.97% 10/09/2058 USD 16,436,481 991,823 0.17
Citigroup Mortgage Loan Trust, Series 2006-4 ‘2A1A’ 6% 25/12/2035 USD 788,712 755,349 0.13
Citigroup Mortgage Loan Trust, Series 2007-12 ‘2A1’, 144A 6.5% 25/10/2036 USD 363,229 278,467 0.05
CLUB Credit Trust, Series 2017-NP1 ‘A’, 144A 2.39% 17/04/2023 USD 1,330,000 1,329,920 0.23
Colony American Homes, FRN, Series 2014-2A ‘E’, 144A 4.23% 17/07/2031 USD 1,385,566 1,397,921 0.24
Colony American Homes, FRN, Series 2015-1A ‘E’, 144A 4.001% 17/07/2032 USD 3,200,000 3,228,049 0.56
Colony American Homes, FRN, Series 2015-1A ‘F’, 144A 4.651% 17/07/2032 USD 1,500,000 1,509,699 0.26
COMM Mortgage Trust, FRN, Series 2013-CR13 ‘D’, 144A 4.748% 10/12/2023 USD 1,618,000 1,549,611 0.27
COMM Mortgage Trust, FRN, Series 2013-LC13 ‘D’, 144A 5.043% 10/08/2046 USD 1,270,000 1,245,204 0.22
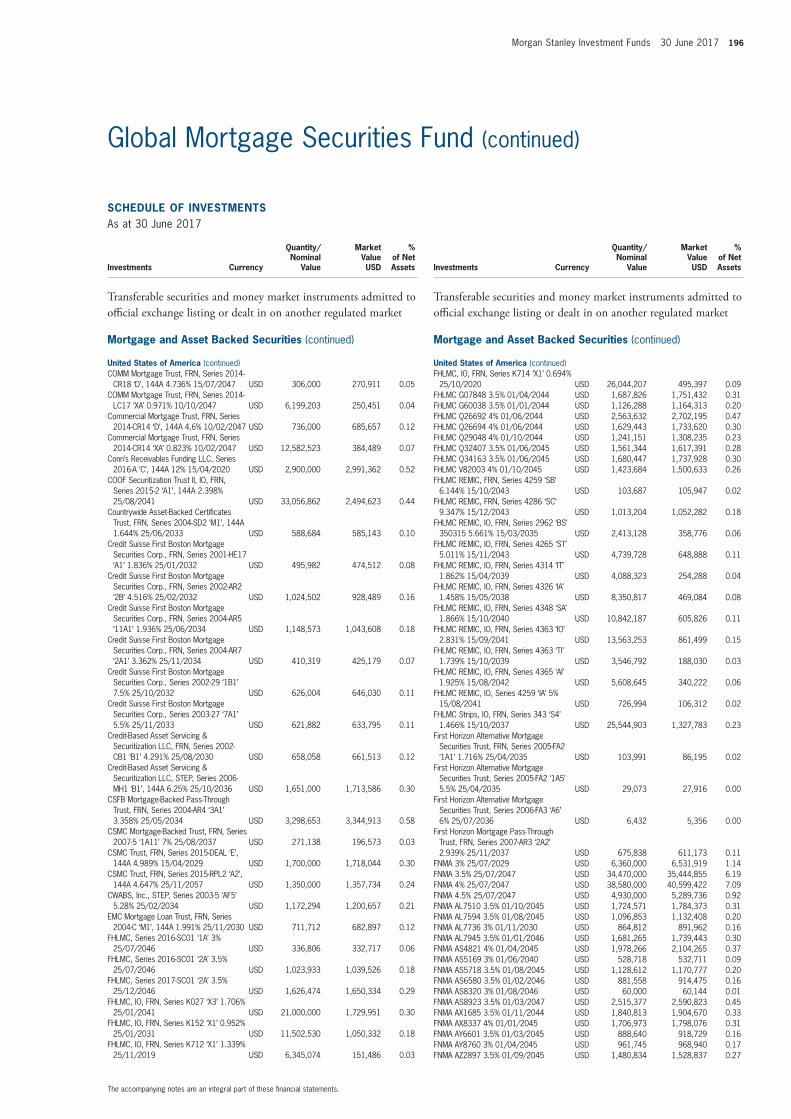
Morgan Stanley Investment Funds 30 June 2017 196
The accompanying notes are an integral part of these fi nancial statements.
Global Mortgage Securities Fund (continued)
SCHEDULE OF INVESTMENTSAs at 30 June 2017
Investments Currency
Quantity/Nominal
Value
Market Value USD
% of Net Assets
Transferable securities and money market instruments admitted to offi cial exchange listing or dealt in on another regulated market
Mortgage and Asset Backed Securities (continued)
United States of America (continued)COMM Mortgage Trust, FRN, Series 2014-
CR18 ‘D’, 144A 4.736% 15/07/2047 USD 306,000 270,911 0.05 COMM Mortgage Trust, FRN, Series 2014-
LC17 ‘XA’ 0.971% 10/10/2047 USD 6,199,203 250,451 0.04 Commercial Mortgage Trust, FRN, Series
2014-CR14 ‘D’, 144A 4.6% 10/02/2047 USD 736,000 685,657 0.12 Commercial Mortgage Trust, FRN, Series
2014-CR14 ‘XA’ 0.823% 10/02/2047 USD 12,582,523 384,489 0.07 Conn’s Receivables Funding LLC, Series
2016-A ‘C’, 144A 12% 15/04/2020 USD 2,900,000 2,991,362 0.52 COOF Securitization Trust II, IO, FRN,
Series 2015-2 ‘A1’, 144A 2.398% 25/08/2041 USD 33,056,862 2,494,623 0.44
Countrywide Asset-Backed Certifi cates Trust, FRN, Series 2004-SD2 ‘M1’, 144A 1.644% 25/06/2033 USD 588,684 585,143 0.10
Credit Suisse First Boston Mortgage Securities Corp., FRN, Series 2001-HE17 ‘A1’ 1.836% 25/01/2032 USD 495,982 474,512 0.08
Credit Suisse First Boston Mortgage Securities Corp., FRN, Series 2002-AR2 ‘2B’ 4.516% 25/02/2032 USD 1,024,502 928,489 0.16
Credit Suisse First Boston Mortgage Securities Corp., FRN, Series 2004-AR5 ‘11A1’ 1.936% 25/06/2034 USD 1,148,573 1,043,608 0.18
Credit Suisse First Boston Mortgage Securities Corp., FRN, Series 2004-AR7 ‘2A1’ 3.362% 25/11/2034 USD 410,319 425,179 0.07
Credit Suisse First Boston Mortgage Securities Corp., Series 2002-29 ‘1B1’ 7.5% 25/10/2032 USD 626,004 646,030 0.11
Credit Suisse First Boston Mortgage Securities Corp., Series 2003-27 ‘7A1’ 5.5% 25/11/2033 USD 621,882 633,795 0.11
Credit-Based Asset Servicing & Securitization LLC, FRN, Series 2002-CB1 ‘B1’ 4.291% 25/08/2030 USD 658,058 661,513 0.12
Credit-Based Asset Servicing & Securitization LLC, STEP, Series 2006-MH1 ‘B1’, 144A 6.25% 25/10/2036 USD 1,651,000 1,713,586 0.30
CSFB Mortgage-Backed Pass-Through Trust, FRN, Series 2004-AR4 ‘3A1’ 3.358% 25/05/2034 USD 3,298,653 3,344,913 0.58
CSMC Mortgage-Backed Trust, FRN, Series 2007-5 ‘1A11’ 7% 25/08/2037 USD 271,138 196,573 0.03
CSMC Trust, FRN, Series 2015-DEAL ‘E’, 144A 4.989% 15/04/2029 USD 1,700,000 1,718,044 0.30
CSMC Trust, FRN, Series 2015-RPL2 ‘A2’, 144A 4.647% 25/11/2057 USD 1,350,000 1,357,734 0.24
CWABS, Inc., STEP, Series 2003-5 ‘AF5’ 5.28% 25/02/2034 USD 1,172,294 1,200,657 0.21
EMC Mortgage Loan Trust, FRN, Series 2004-C ‘M1’, 144A 1.991% 25/11/2030 USD 711,712 682,897 0.12
FHLMC, Series 2016-SC01 ‘1A’ 3% 25/07/2046 USD 336,806 332,717 0.06
FHLMC, Series 2016-SC01 ‘2A’ 3.5% 25/07/2046 USD 1,023,933 1,039,526 0.18
FHLMC, Series 2017-SC01 ‘2A’ 3.5% 25/12/2046 USD 1,626,474 1,650,334 0.29
FHLMC, IO, FRN, Series K027 ‘X3’ 1.706% 25/01/2041 USD 21,000,000 1,729,951 0.30
FHLMC, IO, FRN, Series K152 ‘X1’ 0.952% 25/01/2031 USD 11,502,530 1,050,332 0.18
FHLMC, IO, FRN, Series K712 ‘X1’ 1.339% 25/11/2019 USD 6,345,074 151,486 0.03
SCHEDULE OF INVESTMENTSAs at 30 June 2017
Investments Currency
Quantity/Nominal
Value
Market Value USD
% of Net Assets
Transferable securities and money market instruments admitted to offi cial exchange listing or dealt in on another regulated market
Mortgage and Asset Backed Securities (continued)
United States of America (continued)FHLMC, IO, FRN, Series K714 ‘X1’ 0.694%
25/10/2020 USD 26,044,207 495,397 0.09 FHLMC G07848 3.5% 01/04/2044 USD 1,687,826 1,751,432 0.31 FHLMC G60038 3.5% 01/01/2044 USD 1,126,288 1,164,313 0.20 FHLMC Q26692 4% 01/06/2044 USD 2,563,632 2,702,195 0.47 FHLMC Q26694 4% 01/06/2044 USD 1,629,443 1,733,620 0.30 FHLMC Q29048 4% 01/10/2044 USD 1,241,151 1,308,235 0.23 FHLMC Q32407 3.5% 01/06/2045 USD 1,561,344 1,617,391 0.28 FHLMC Q34163 3.5% 01/06/2045 USD 1,680,447 1,737,928 0.30 FHLMC V82003 4% 01/10/2045 USD 1,423,684 1,500,633 0.26 FHLMC REMIC, FRN, Series 4259 ‘SB’
6.144% 15/10/2043 USD 103,687 105,947 0.02 FHLMC REMIC, FRN, Series 4286 ‘SC’
9.347% 15/12/2043 USD 1,013,204 1,052,282 0.18 FHLMC REMIC, IO, FRN, Series 2962 ‘BS’
350315 5.661% 15/03/2035 USD 2,413,128 358,776 0.06 FHLMC REMIC, IO, FRN, Series 4265 ‘ST’
5.011% 15/11/2043 USD 4,739,728 648,888 0.11 FHLMC REMIC, IO, FRN, Series 4314 ‘IT’
1.862% 15/04/2039 USD 4,088,323 254,288 0.04 FHLMC REMIC, IO, FRN, Series 4326 ‘IA’
1.458% 15/05/2038 USD 8,350,817 469,084 0.08 FHLMC REMIC, IO, FRN, Series 4348 ‘SA’
1.866% 15/10/2040 USD 10,842,187 605,826 0.11 FHLMC REMIC, IO, FRN, Series 4363 ‘IO’
2.831% 15/09/2041 USD 13,563,253 861,499 0.15 FHLMC REMIC, IO, FRN, Series 4363 ‘TI’
1.739% 15/10/2039 USD 3,546,792 188,030 0.03 FHLMC REMIC, IO, FRN, Series 4365 ‘AI’
1.925% 15/08/2042 USD 5,608,645 340,222 0.06 FHLMC REMIC, IO, Series 4259 ‘IA’ 5%
15/08/2041 USD 726,994 106,312 0.02 FHLMC Strips, IO, FRN, Series 343 ‘S4’
1.466% 15/10/2037 USD 25,544,903 1,327,783 0.23 First Horizon Alternative Mortgage
Securities Trust, FRN, Series 2005-FA2 ‘1A1’ 1.716% 25/04/2035 USD 103,991 86,195 0.02
First Horizon Alternative Mortgage Securities Trust, Series 2005-FA2 ‘1A5’ 5.5% 25/04/2035 USD 29,073 27,916 0.00
First Horizon Alternative Mortgage Securities Trust, Series 2006-FA3 ‘A6’ 6% 25/07/2036 USD 6,432 5,356 0.00
First Horizon Mortgage Pass-Through Trust, FRN, Series 2007-AR3 ‘2A2’ 2.939% 25/11/2037 USD 675,838 611,173 0.11
FNMA 3% 25/07/2029 USD 6,360,000 6,531,919 1.14 FNMA 3.5% 25/07/2047 USD 34,470,000 35,444,855 6.19 FNMA 4% 25/07/2047 USD 38,580,000 40,599,422 7.09 FNMA 4.5% 25/07/2047 USD 4,930,000 5,289,736 0.92 FNMA AL7510 3.5% 01/10/2045 USD 1,724,571 1,784,373 0.31 FNMA AL7594 3.5% 01/08/2045 USD 1,096,853 1,132,408 0.20 FNMA AL7736 3% 01/11/2030 USD 864,812 891,962 0.16 FNMA AL7945 3.5% 01/01/2046 USD 1,681,265 1,739,443 0.30 FNMA AS4821 4% 01/04/2045 USD 1,978,266 2,104,265 0.37 FNMA AS5169 3% 01/06/2040 USD 528,718 532,711 0.09 FNMA AS5718 3.5% 01/08/2045 USD 1,128,612 1,170,777 0.20 FNMA AS6580 3.5% 01/02/2046 USD 881,558 914,475 0.16 FNMA AS8320 3% 01/08/2046 USD 60,000 60,144 0.01 FNMA AS8923 3.5% 01/03/2047 USD 2,515,377 2,590,823 0.45 FNMA AX1685 3.5% 01/11/2044 USD 1,840,813 1,904,670 0.33 FNMA AX8337 4% 01/01/2045 USD 1,706,973 1,798,076 0.31 FNMA AY6601 3.5% 01/03/2045 USD 888,640 918,729 0.16 FNMA AY8760 3% 01/04/2045 USD 961,745 968,940 0.17 FNMA AZ2897 3.5% 01/09/2045 USD 1,480,834 1,528,837 0.27
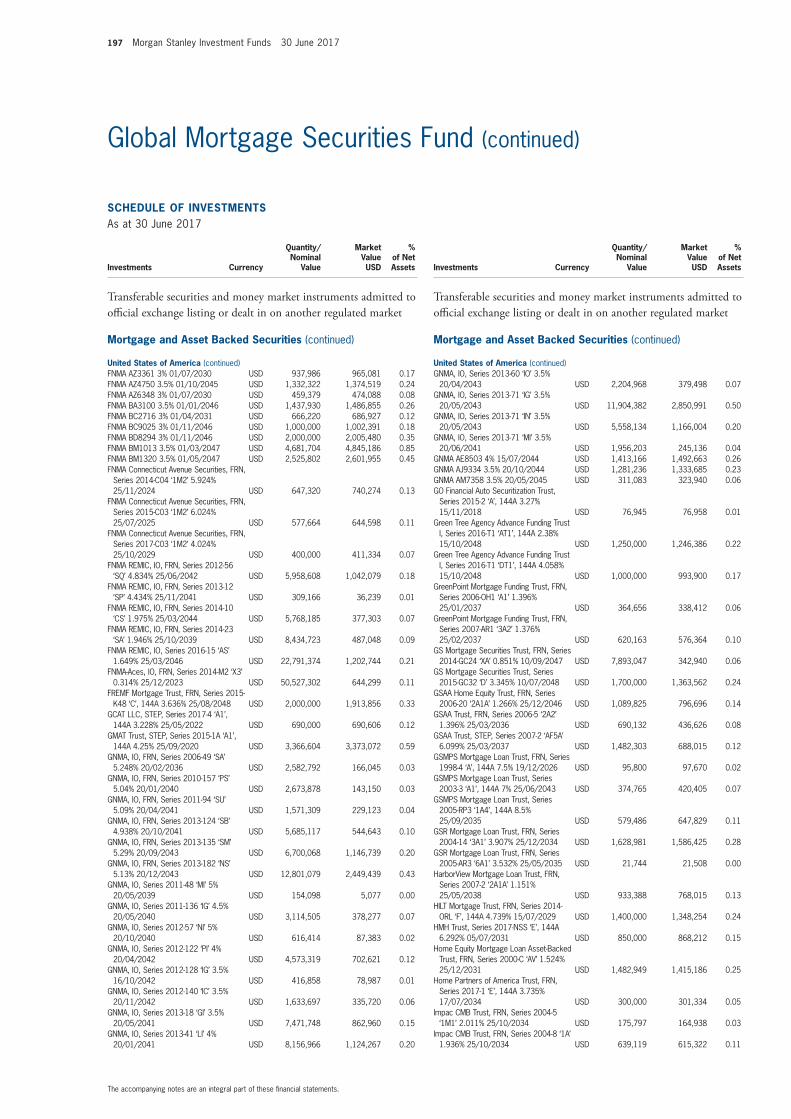
197 Morgan Stanley Investment Funds 30 June 2017
The accompanying notes are an integral part of these fi nancial statements.
Global Mortgage Securities Fund (continued)
SCHEDULE OF INVESTMENTSAs at 30 June 2017
Investments Currency
Quantity/Nominal
Value
Market Value USD
% of Net Assets
Transferable securities and money market instruments admitted to offi cial exchange listing or dealt in on another regulated market
Mortgage and Asset Backed Securities (continued)
United States of America (continued)FNMA AZ3361 3% 01/07/2030 USD 937,986 965,081 0.17 FNMA AZ4750 3.5% 01/10/2045 USD 1,332,322 1,374,519 0.24 FNMA AZ6348 3% 01/07/2030 USD 459,379 474,088 0.08 FNMA BA3100 3.5% 01/01/2046 USD 1,437,930 1,486,855 0.26 FNMA BC2716 3% 01/04/2031 USD 666,220 686,927 0.12 FNMA BC9025 3% 01/11/2046 USD 1,000,000 1,002,391 0.18 FNMA BD8294 3% 01/11/2046 USD 2,000,000 2,005,480 0.35 FNMA BM1013 3.5% 01/03/2047 USD 4,681,704 4,845,186 0.85 FNMA BM1320 3.5% 01/05/2047 USD 2,525,802 2,601,955 0.45 FNMA Connecticut Avenue Securities, FRN,
Series 2014-C04 ‘1M2’ 5.924% 25/11/2024 USD 647,320 740,274 0.13
FNMA Connecticut Avenue Securities, FRN, Series 2015-C03 ‘1M2’ 6.024% 25/07/2025 USD 577,664 644,598 0.11
FNMA Connecticut Avenue Securities, FRN, Series 2017-C03 ‘1M2’ 4.024% 25/10/2029 USD 400,000 411,334 0.07
FNMA REMIC, IO, FRN, Series 2012-56 ‘SQ’ 4.834% 25/06/2042 USD 5,958,608 1,042,079 0.18
FNMA REMIC, IO, FRN, Series 2013-12 ‘SP’ 4.434% 25/11/2041 USD 309,166 36,239 0.01
FNMA REMIC, IO, FRN, Series 2014-10 ‘CS’ 1.975% 25/03/2044 USD 5,768,185 377,303 0.07
FNMA REMIC, IO, FRN, Series 2014-23 ‘SA’ 1.946% 25/10/2039 USD 8,434,723 487,048 0.09
FNMA REMIC, IO, Series 2016-15 ‘AS’ 1.649% 25/03/2046 USD 22,791,374 1,202,744 0.21
FNMA-Aces, IO, FRN, Series 2014-M2 ‘X3’ 0.314% 25/12/2023 USD 50,527,302 644,299 0.11
FREMF Mortgage Trust, FRN, Series 2015-K48 ‘C’, 144A 3.636% 25/08/2048 USD 2,000,000 1,913,856 0.33
GCAT LLC, STEP, Series 2017-4 ‘A1’, 144A 3.228% 25/05/2022 USD 690,000 690,606 0.12
GMAT Trust, STEP, Series 2015-1A ‘A1’, 144A 4.25% 25/09/2020 USD 3,366,604 3,373,072 0.59
GNMA, IO, FRN, Series 2006-49 ‘SA’ 5.248% 20/02/2036 USD 2,582,792 166,045 0.03
GNMA, IO, FRN, Series 2010-157 ‘PS’ 5.04% 20/01/2040 USD 2,673,878 143,150 0.03
GNMA, IO, FRN, Series 2011-94 ‘SU’ 5.09% 20/04/2041 USD 1,571,309 229,123 0.04
GNMA, IO, FRN, Series 2013-124 ‘SB’ 4.938% 20/10/2041 USD 5,685,117 544,643 0.10
GNMA, IO, FRN, Series 2013-135 ‘SM’ 5.29% 20/09/2043 USD 6,700,068 1,146,739 0.20
GNMA, IO, FRN, Series 2013-182 ‘NS’ 5.13% 20/12/2043 USD 12,801,079 2,449,439 0.43
GNMA, IO, Series 2011-48 ‘MI’ 5% 20/05/2039 USD 154,098 5,077 0.00
GNMA, IO, Series 2011-136 ‘IG’ 4.5% 20/05/2040 USD 3,114,505 378,277 0.07
GNMA, IO, Series 2012-57 ‘NI’ 5% 20/10/2040 USD 616,414 87,383 0.02
GNMA, IO, Series 2012-122 ‘PI’ 4% 20/04/2042 USD 4,573,319 702,621 0.12
GNMA, IO, Series 2012-128 ‘IG’ 3.5% 16/10/2042 USD 416,858 78,987 0.01
GNMA, IO, Series 2012-140 ‘IC’ 3.5% 20/11/2042 USD 1,633,697 335,720 0.06
GNMA, IO, Series 2013-18 ‘GI’ 3.5% 20/05/2041 USD 7,471,748 862,960 0.15
GNMA, IO, Series 2013-41 ‘LI’ 4% 20/01/2041 USD 8,156,966 1,124,267 0.20
SCHEDULE OF INVESTMENTSAs at 30 June 2017
Investments Currency
Quantity/Nominal
Value
Market Value USD
% of Net Assets
Transferable securities and money market instruments admitted to offi cial exchange listing or dealt in on another regulated market
Mortgage and Asset Backed Securities (continued)
United States of America (continued)GNMA, IO, Series 2013-60 ‘IO’ 3.5%
20/04/2043 USD 2,204,968 379,498 0.07 GNMA, IO, Series 2013-71 ‘IG’ 3.5%
20/05/2043 USD 11,904,382 2,850,991 0.50 GNMA, IO, Series 2013-71 ‘IN’ 3.5%
20/05/2043 USD 5,558,134 1,166,004 0.20 GNMA, IO, Series 2013-71 ‘MI’ 3.5%
20/06/2041 USD 1,956,203 245,136 0.04 GNMA AE8503 4% 15/07/2044 USD 1,413,166 1,492,663 0.26 GNMA AJ9334 3.5% 20/10/2044 USD 1,281,236 1,333,685 0.23 GNMA AM7358 3.5% 20/05/2045 USD 311,083 323,940 0.06 GO Financial Auto Securitization Trust,
Series 2015-2 ‘A’, 144A 3.27% 15/11/2018 USD 76,945 76,958 0.01
Green Tree Agency Advance Funding Trust I, Series 2016-T1 ‘AT1’, 144A 2.38% 15/10/2048 USD 1,250,000 1,246,386 0.22
Green Tree Agency Advance Funding Trust I, Series 2016-T1 ‘DT1’, 144A 4.058% 15/10/2048 USD 1,000,000 993,900 0.17
GreenPoint Mortgage Funding Trust, FRN, Series 2006-OH1 ‘A1’ 1.396% 25/01/2037 USD 364,656 338,412 0.06
GreenPoint Mortgage Funding Trust, FRN, Series 2007-AR1 ‘3A2’ 1.376% 25/02/2037 USD 620,163 576,364 0.10
GS Mortgage Securities Trust, FRN, Series 2014-GC24 ‘XA’ 0.851% 10/09/2047 USD 7,893,047 342,940 0.06
GS Mortgage Securities Trust, Series 2015-GC32 ‘D’ 3.345% 10/07/2048 USD 1,700,000 1,363,562 0.24
GSAA Home Equity Trust, FRN, Series 2006-20 ‘2A1A’ 1.266% 25/12/2046 USD 1,089,825 796,696 0.14
GSAA Trust, FRN, Series 2006-5 ‘2A2’ 1.396% 25/03/2036 USD 690,132 436,626 0.08
GSAA Trust, STEP, Series 2007-2 ‘AF5A’ 6.099% 25/03/2037 USD 1,482,303 688,015 0.12
GSMPS Mortgage Loan Trust, FRN, Series 1998-4 ‘A’, 144A 7.5% 19/12/2026 USD 95,800 97,670 0.02
GSMPS Mortgage Loan Trust, Series 2003-3 ‘A1’, 144A 7% 25/06/2043 USD 374,765 420,405 0.07
GSMPS Mortgage Loan Trust, Series 2005-RP3 ‘1A4’, 144A 8.5% 25/09/2035 USD 579,486 647,829 0.11
GSR Mortgage Loan Trust, FRN, Series 2004-14 ‘3A1’ 3.907% 25/12/2034 USD 1,628,981 1,586,425 0.28
GSR Mortgage Loan Trust, FRN, Series 2005-AR3 ‘6A1’ 3.532% 25/05/2035 USD 21,744 21,508 0.00
HarborView Mortgage Loan Trust, FRN, Series 2007-2 ‘2A1A’ 1.151% 25/05/2038 USD 933,388 768,015 0.13
HILT Mortgage Trust, FRN, Series 2014-ORL ‘F’, 144A 4.739% 15/07/2029 USD 1,400,000 1,348,254 0.24
HMH Trust, Series 2017-NSS ‘E’, 144A 6.292% 05/07/2031 USD 850,000 868,212 0.15
Home Equity Mortgage Loan Asset-Backed Trust, FRN, Series 2000-C ‘AV’ 1.524% 25/12/2031 USD 1,482,949 1,415,186 0.25
Home Partners of America Trust, FRN, Series 2017-1 ‘E’, 144A 3.735% 17/07/2034 USD 300,000 301,334 0.05
Impac CMB Trust, FRN, Series 2004-5 ‘1M1’ 2.011% 25/10/2034 USD 175,797 164,938 0.03
Impac CMB Trust, FRN, Series 2004-8 ‘1A’ 1.936% 25/10/2034 USD 639,119 615,322 0.11
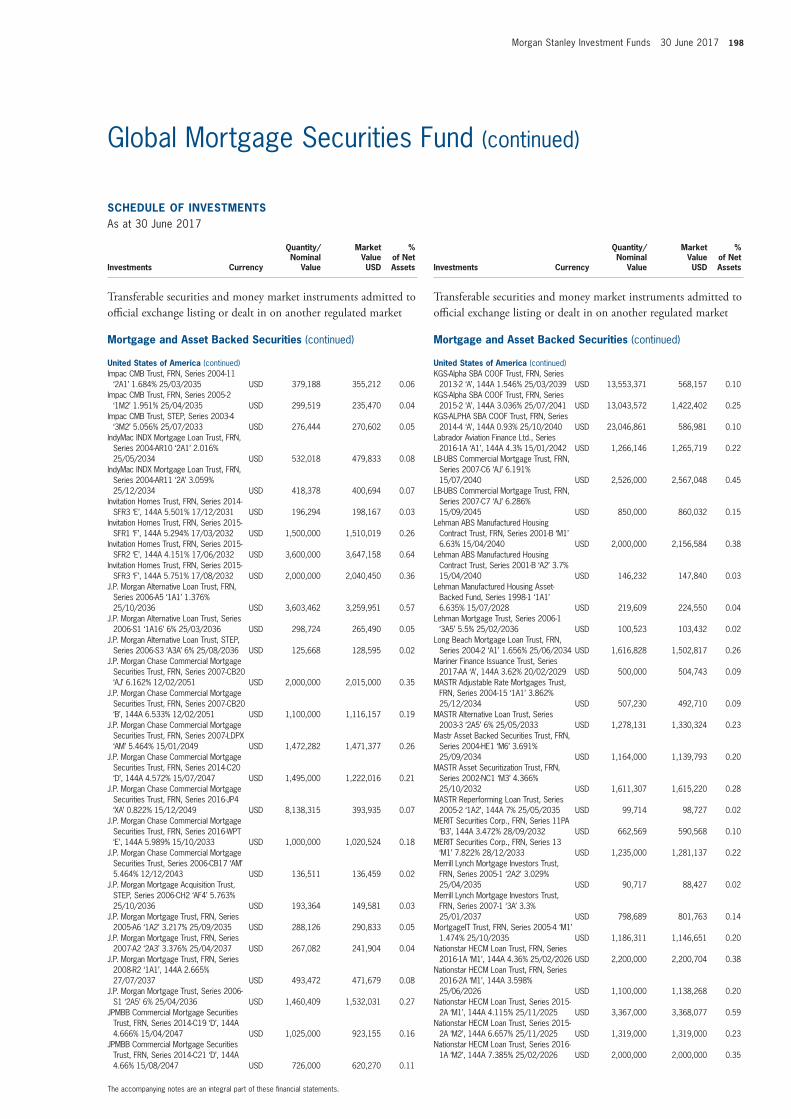
Morgan Stanley Investment Funds 30 June 2017 198
The accompanying notes are an integral part of these fi nancial statements.
Global Mortgage Securities Fund (continued)
SCHEDULE OF INVESTMENTSAs at 30 June 2017
Investments Currency
Quantity/Nominal
Value
Market Value USD
% of Net Assets
Transferable securities and money market instruments admitted to offi cial exchange listing or dealt in on another regulated market
Mortgage and Asset Backed Securities (continued)
United States of America (continued)Impac CMB Trust, FRN, Series 2004-11
‘2A1’ 1.684% 25/03/2035 USD 379,188 355,212 0.06 Impac CMB Trust, FRN, Series 2005-2
‘1M2’ 1.951% 25/04/2035 USD 299,519 235,470 0.04 Impac CMB Trust, STEP, Series 2003-4
‘3M2’ 5.056% 25/07/2033 USD 276,444 270,602 0.05 IndyMac INDX Mortgage Loan Trust, FRN,
Series 2004-AR10 ‘2A1’ 2.016% 25/05/2034 USD 532,018 479,833 0.08
IndyMac INDX Mortgage Loan Trust, FRN, Series 2004-AR11 ‘2A’ 3.059% 25/12/2034 USD 418,378 400,694 0.07
Invitation Homes Trust, FRN, Series 2014-SFR3 ‘E’, 144A 5.501% 17/12/2031 USD 196,294 198,167 0.03
Invitation Homes Trust, FRN, Series 2015-SFR1 ‘F’, 144A 5.294% 17/03/2032 USD 1,500,000 1,510,019 0.26
Invitation Homes Trust, FRN, Series 2015-SFR2 ‘E’, 144A 4.151% 17/06/2032 USD 3,600,000 3,647,158 0.64
Invitation Homes Trust, FRN, Series 2015-SFR3 ‘F’, 144A 5.751% 17/08/2032 USD 2,000,000 2,040,450 0.36
J.P. Morgan Alternative Loan Trust, FRN, Series 2006-A5 ‘1A1’ 1.376% 25/10/2036 USD 3,603,462 3,259,951 0.57
J.P. Morgan Alternative Loan Trust, Series 2006-S1 ‘1A16’ 6% 25/03/2036 USD 298,724 265,490 0.05
J.P. Morgan Alternative Loan Trust, STEP, Series 2006-S3 ‘A3A’ 6% 25/08/2036 USD 125,668 128,595 0.02
J.P. Morgan Chase Commercial Mortgage Securities Trust, FRN, Series 2007-CB20 ‘AJ’ 6.162% 12/02/2051 USD 2,000,000 2,015,000 0.35
J.P. Morgan Chase Commercial Mortgage Securities Trust, FRN, Series 2007-CB20 ‘B’, 144A 6.533% 12/02/2051 USD 1,100,000 1,116,157 0.19
J.P. Morgan Chase Commercial Mortgage Securities Trust, FRN, Series 2007-LDPX ‘AM’ 5.464% 15/01/2049 USD 1,472,282 1,471,377 0.26
J.P. Morgan Chase Commercial Mortgage Securities Trust, FRN, Series 2014-C20 ‘D’, 144A 4.572% 15/07/2047 USD 1,495,000 1,222,016 0.21
J.P. Morgan Chase Commercial Mortgage Securities Trust, FRN, Series 2016-JP4 ‘XA’ 0.822% 15/12/2049 USD 8,138,315 393,935 0.07
J.P. Morgan Chase Commercial Mortgage Securities Trust, FRN, Series 2016-WPT ‘E’, 144A 5.989% 15/10/2033 USD 1,000,000 1,020,524 0.18
J.P. Morgan Chase Commercial Mortgage Securities Trust, Series 2006-CB17 ‘AM’ 5.464% 12/12/2043 USD 136,511 136,459 0.02
J.P. Morgan Mortgage Acquisition Trust, STEP, Series 2006-CH2 ‘AF4’ 5.763% 25/10/2036 USD 193,364 149,581 0.03
J.P. Morgan Mortgage Trust, FRN, Series 2005-A6 ‘1A2’ 3.217% 25/09/2035 USD 288,126 290,833 0.05
J.P. Morgan Mortgage Trust, FRN, Series 2007-A2 ‘2A3’ 3.376% 25/04/2037 USD 267,082 241,904 0.04
J.P. Morgan Mortgage Trust, FRN, Series 2008-R2 ‘1A1’, 144A 2.665% 27/07/2037 USD 493,472 471,679 0.08
J.P. Morgan Mortgage Trust, Series 2006-S1 ‘2A5’ 6% 25/04/2036 USD 1,460,409 1,532,031 0.27
JPMBB Commercial Mortgage Securities Trust, FRN, Series 2014-C19 ‘D’, 144A 4.666% 15/04/2047 USD 1,025,000 923,155 0.16
JPMBB Commercial Mortgage Securities Trust, FRN, Series 2014-C21 ‘D’, 144A 4.66% 15/08/2047 USD 726,000 620,270 0.11
SCHEDULE OF INVESTMENTSAs at 30 June 2017
Investments Currency
Quantity/Nominal
Value
Market Value USD
% of Net Assets
Transferable securities and money market instruments admitted to offi cial exchange listing or dealt in on another regulated market
Mortgage and Asset Backed Securities (continued)
United States of America (continued)KGS-Alpha SBA COOF Trust, FRN, Series
2013-2 ‘A’, 144A 1.546% 25/03/2039 USD 13,553,371 568,157 0.10 KGS-Alpha SBA COOF Trust, FRN, Series
2015-2 ‘A’, 144A 3.036% 25/07/2041 USD 13,043,572 1,422,402 0.25 KGS-ALPHA SBA COOF Trust, FRN, Series
2014-4 ‘A’, 144A 0.93% 25/10/2040 USD 23,046,861 586,981 0.10 Labrador Aviation Finance Ltd., Series
2016-1A ‘A1’, 144A 4.3% 15/01/2042 USD 1,266,146 1,265,719 0.22 LB-UBS Commercial Mortgage Trust, FRN,
Series 2007-C6 ‘AJ’ 6.191% 15/07/2040 USD 2,526,000 2,567,048 0.45
LB-UBS Commercial Mortgage Trust, FRN, Series 2007-C7 ‘AJ’ 6.286% 15/09/2045 USD 850,000 860,032 0.15
Lehman ABS Manufactured Housing Contract Trust, FRN, Series 2001-B ‘M1’ 6.63% 15/04/2040 USD 2,000,000 2,156,584 0.38
Lehman ABS Manufactured Housing Contract Trust, Series 2001-B ‘A2’ 3.7% 15/04/2040 USD 146,232 147,840 0.03
Lehman Manufactured Housing Asset-Backed Fund, Series 1998-1 ‘1A1’ 6.635% 15/07/2028 USD 219,609 224,550 0.04
Lehman Mortgage Trust, Series 2006-1 ‘3A5’ 5.5% 25/02/2036 USD 100,523 103,432 0.02
Long Beach Mortgage Loan Trust, FRN, Series 2004-2 ‘A1’ 1.656% 25/06/2034 USD 1,616,828 1,502,817 0.26
Mariner Finance Issuance Trust, Series 2017-AA ‘A’, 144A 3.62% 20/02/2029 USD 500,000 504,743 0.09
MASTR Adjustable Rate Mortgages Trust, FRN, Series 2004-15 ‘1A1’ 3.862% 25/12/2034 USD 507,230 492,710 0.09
MASTR Alternative Loan Trust, Series 2003-3 ‘2A5’ 6% 25/05/2033 USD 1,278,131 1,330,324 0.23
Mastr Asset Backed Securities Trust, FRN, Series 2004-HE1 ‘M6’ 3.691% 25/09/2034 USD 1,164,000 1,139,793 0.20
MASTR Asset Securitization Trust, FRN, Series 2002-NC1 ‘M3’ 4.366% 25/10/2032 USD 1,611,307 1,615,220 0.28
MASTR Reperforming Loan Trust, Series 2005-2 ‘1A2’, 144A 7% 25/05/2035 USD 99,714 98,727 0.02
MERIT Securities Corp., FRN, Series 11PA ‘B3’, 144A 3.472% 28/09/2032 USD 662,569 590,568 0.10
MERIT Securities Corp., FRN, Series 13 ‘M1’ 7.822% 28/12/2033 USD 1,235,000 1,281,137 0.22
Merrill Lynch Mortgage Investors Trust, FRN, Series 2005-1 ‘2A2’ 3.029% 25/04/2035 USD 90,717 88,427 0.02
Merrill Lynch Mortgage Investors Trust, FRN, Series 2007-1 ‘3A’ 3.3% 25/01/2037 USD 798,689 801,763 0.14
MortgageIT Trust, FRN, Series 2005-4 ‘M1’ 1.474% 25/10/2035 USD 1,186,311 1,146,651 0.20
Nationstar HECM Loan Trust, FRN, Series 2016-1A ‘M1’, 144A 4.36% 25/02/2026 USD 2,200,000 2,200,704 0.38
Nationstar HECM Loan Trust, FRN, Series 2016-2A ‘M1’, 144A 3.598% 25/06/2026 USD 1,100,000 1,138,268 0.20
Nationstar HECM Loan Trust, Series 2015-2A ‘M1’, 144A 4.115% 25/11/2025 USD 3,367,000 3,368,077 0.59
Nationstar HECM Loan Trust, Series 2015-2A ‘M2’, 144A 6.657% 25/11/2025 USD 1,319,000 1,319,000 0.23
Nationstar HECM Loan Trust, Series 2016-1A ‘M2’, 144A 7.385% 25/02/2026 USD 2,000,000 2,000,000 0.35
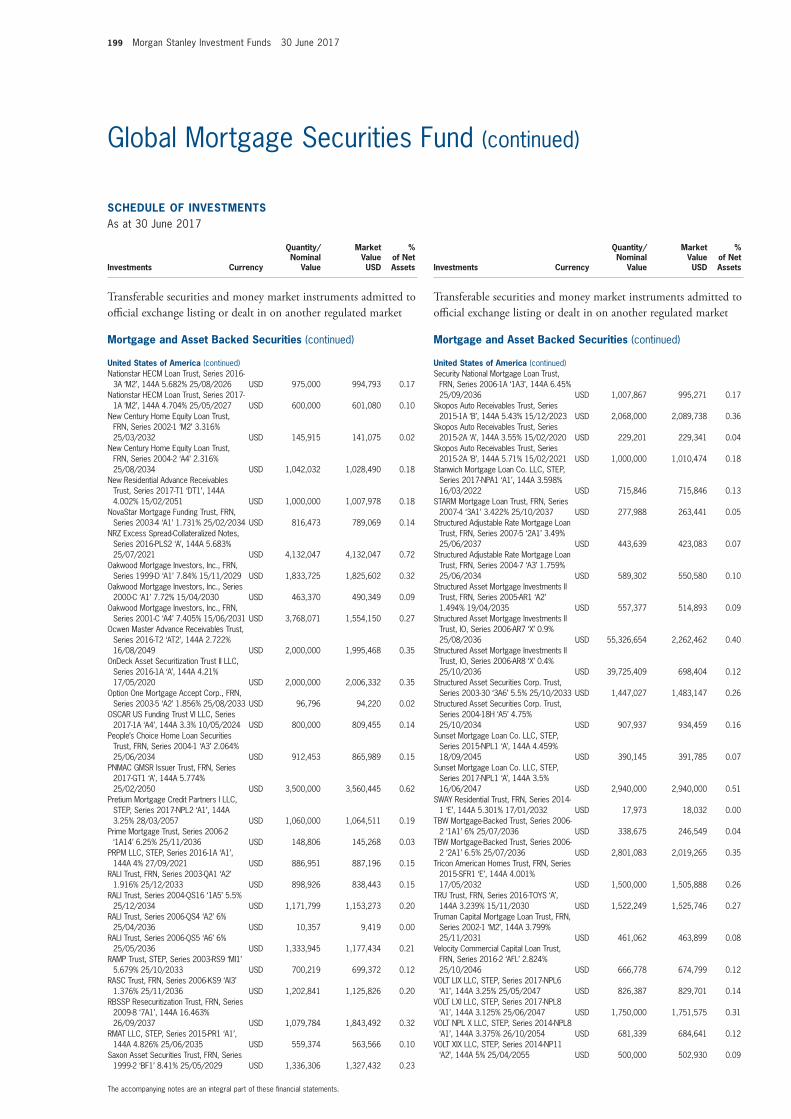
199 Morgan Stanley Investment Funds 30 June 2017
The accompanying notes are an integral part of these fi nancial statements.
Global Mortgage Securities Fund (continued)
SCHEDULE OF INVESTMENTSAs at 30 June 2017
Investments Currency
Quantity/Nominal
Value
Market Value USD
% of Net Assets
Transferable securities and money market instruments admitted to offi cial exchange listing or dealt in on another regulated market
Mortgage and Asset Backed Securities (continued)
United States of America (continued)Nationstar HECM Loan Trust, Series 2016-
3A ‘M2’, 144A 5.682% 25/08/2026 USD 975,000 994,793 0.17 Nationstar HECM Loan Trust, Series 2017-
1A ‘M2’, 144A 4.704% 25/05/2027 USD 600,000 601,080 0.10 New Century Home Equity Loan Trust,
FRN, Series 2002-1 ‘M2’ 3.316% 25/03/2032 USD 145,915 141,075 0.02
New Century Home Equity Loan Trust, FRN, Series 2004-2 ‘A4’ 2.316% 25/08/2034 USD 1,042,032 1,028,490 0.18
New Residential Advance Receivables Trust, Series 2017-T1 ‘DT1’, 144A 4.002% 15/02/2051 USD 1,000,000 1,007,978 0.18
NovaStar Mortgage Funding Trust, FRN, Series 2003-4 ‘A1’ 1.731% 25/02/2034 USD 816,473 789,069 0.14
NRZ Excess Spread-Collateralized Notes, Series 2016-PLS2 ‘A’, 144A 5.683% 25/07/2021 USD 4,132,047 4,132,047 0.72
Oakwood Mortgage Investors, Inc., FRN, Series 1999-D ‘A1’ 7.84% 15/11/2029 USD 1,833,725 1,825,602 0.32
Oakwood Mortgage Investors, Inc., Series 2000-C ‘A1’ 7.72% 15/04/2030 USD 463,370 490,349 0.09
Oakwood Mortgage Investors, Inc., FRN, Series 2001-C ‘A4’ 7.405% 15/06/2031 USD 3,768,071 1,554,150 0.27
Ocwen Master Advance Receivables Trust, Series 2016-T2 ‘AT2’, 144A 2.722% 16/08/2049 USD 2,000,000 1,995,468 0.35
OnDeck Asset Securitization Trust II LLC, Series 2016-1A ‘A’, 144A 4.21% 17/05/2020 USD 2,000,000 2,006,332 0.35
Option One Mortgage Accept Corp., FRN, Series 2003-5 ‘A2’ 1.856% 25/08/2033 USD 96,796 94,220 0.02
OSCAR US Funding Trust VI LLC, Series 2017-1A ‘A4’, 144A 3.3% 10/05/2024 USD 800,000 809,455 0.14
People’s Choice Home Loan Securities Trust, FRN, Series 2004-1 ‘A3’ 2.064% 25/06/2034 USD 912,453 865,989 0.15
PNMAC GMSR Issuer Trust, FRN, Series 2017-GT1 ‘A’, 144A 5.774% 25/02/2050 USD 3,500,000 3,560,445 0.62
Pretium Mortgage Credit Partners I LLC, STEP, Series 2017-NPL2 ‘A1’, 144A 3.25% 28/03/2057 USD 1,060,000 1,064,511 0.19
Prime Mortgage Trust, Series 2006-2 ‘1A14’ 6.25% 25/11/2036 USD 148,806 145,268 0.03
PRPM LLC, STEP, Series 2016-1A ‘A1’, 144A 4% 27/09/2021 USD 886,951 887,196 0.15
RALI Trust, FRN, Series 2003-QA1 ‘A2’ 1.916% 25/12/2033 USD 898,926 838,443 0.15
RALI Trust, Series 2004-QS16 ‘1A5’ 5.5% 25/12/2034 USD 1,171,799 1,153,273 0.20
RALI Trust, Series 2006-QS4 ‘A2’ 6% 25/04/2036 USD 10,357 9,419 0.00
RALI Trust, Series 2006-QS5 ‘A6’ 6% 25/05/2036 USD 1,333,945 1,177,434 0.21
RAMP Trust, STEP, Series 2003-RS9 ‘MI1’ 5.679% 25/10/2033 USD 700,219 699,372 0.12
RASC Trust, FRN, Series 2006-KS9 ‘AI3’ 1.376% 25/11/2036 USD 1,202,841 1,125,826 0.20
RBSSP Resecuritization Trust, FRN, Series 2009-8 ‘7A1’, 144A 16.463% 26/09/2037 USD 1,079,784 1,843,492 0.32
RMAT LLC, STEP, Series 2015-PR1 ‘A1’, 144A 4.826% 25/06/2035 USD 559,374 563,566 0.10
Saxon Asset Securities Trust, FRN, Series 1999-2 ‘BF1’ 8.41% 25/05/2029 USD 1,336,306 1,327,432 0.23
SCHEDULE OF INVESTMENTSAs at 30 June 2017
Investments Currency
Quantity/Nominal
Value
Market Value USD
% of Net Assets
Transferable securities and money market instruments admitted to offi cial exchange listing or dealt in on another regulated market
Mortgage and Asset Backed Securities (continued)
United States of America (continued)Security National Mortgage Loan Trust,
FRN, Series 2006-1A ‘1A3’, 144A 6.45% 25/09/2036 USD 1,007,867 995,271 0.17
Skopos Auto Receivables Trust, Series 2015-1A ‘B’, 144A 5.43% 15/12/2023 USD 2,068,000 2,089,738 0.36
Skopos Auto Receivables Trust, Series 2015-2A ‘A’, 144A 3.55% 15/02/2020 USD 229,201 229,341 0.04
Skopos Auto Receivables Trust, Series 2015-2A ‘B’, 144A 5.71% 15/02/2021 USD 1,000,000 1,010,474 0.18
Stanwich Mortgage Loan Co. LLC, STEP, Series 2017-NPA1 ‘A1’, 144A 3.598% 16/03/2022 USD 715,846 715,846 0.13
STARM Mortgage Loan Trust, FRN, Series 2007-4 ‘3A1’ 3.422% 25/10/2037 USD 277,988 263,441 0.05
Structured Adjustable Rate Mortgage Loan Trust, FRN, Series 2007-5 ‘2A1’ 3.49% 25/06/2037 USD 443,639 423,083 0.07
Structured Adjustable Rate Mortgage Loan Trust, FRN, Series 2004-7 ‘A3’ 1.759% 25/06/2034 USD 589,302 550,580 0.10
Structured Asset Mortgage Investments II Trust, FRN, Series 2005-AR1 ‘A2’ 1.494% 19/04/2035 USD 557,377 514,893 0.09
Structured Asset Mortgage Investments II Trust, IO, Series 2006-AR7 ‘X’ 0.9% 25/08/2036 USD 55,326,654 2,262,462 0.40
Structured Asset Mortgage Investments II Trust, IO, Series 2006-AR8 ‘X’ 0.4% 25/10/2036 USD 39,725,409 698,404 0.12
Structured Asset Securities Corp. Trust, Series 2003-30 ‘3A6’ 5.5% 25/10/2033 USD 1,447,027 1,483,147 0.26
Structured Asset Securities Corp. Trust, Series 2004-18H ‘A5’ 4.75% 25/10/2034 USD 907,937 934,459 0.16
Sunset Mortgage Loan Co. LLC, STEP, Series 2015-NPL1 ‘A’, 144A 4.459% 18/09/2045 USD 390,145 391,785 0.07
Sunset Mortgage Loan Co. LLC, STEP, Series 2017-NPL1 ‘A’, 144A 3.5% 16/06/2047 USD 2,940,000 2,940,000 0.51
SWAY Residential Trust, FRN, Series 2014-1 ‘E’, 144A 5.301% 17/01/2032 USD 17,973 18,032 0.00
TBW Mortgage-Backed Trust, Series 2006-2 ‘1A1’ 6% 25/07/2036 USD 338,675 246,549 0.04
TBW Mortgage-Backed Trust, Series 2006-2 ‘2A1’ 6.5% 25/07/2036 USD 2,801,083 2,019,265 0.35
Tricon American Homes Trust, FRN, Series 2015-SFR1 ‘E’, 144A 4.001% 17/05/2032 USD 1,500,000 1,505,888 0.26
TRU Trust, FRN, Series 2016-TOYS ‘A’, 144A 3.239% 15/11/2030 USD 1,522,249 1,525,746 0.27
Truman Capital Mortgage Loan Trust, FRN, Series 2002-1 ‘M2’, 144A 3.799% 25/11/2031 USD 461,062 463,899 0.08
Velocity Commercial Capital Loan Trust, FRN, Series 2016-2 ‘AFL’ 2.824% 25/10/2046 USD 666,778 674,799 0.12
VOLT LIX LLC, STEP, Series 2017-NPL6 ‘A1’, 144A 3.25% 25/05/2047 USD 826,387 829,701 0.14
VOLT LXI LLC, STEP, Series 2017-NPL8 ‘A1’, 144A 3.125% 25/06/2047 USD 1,750,000 1,751,575 0.31
VOLT NPL X LLC, STEP, Series 2014-NPL8 ‘A1’, 144A 3.375% 26/10/2054 USD 681,339 684,641 0.12
VOLT XIX LLC, STEP, Series 2014-NP11 ‘A2’, 144A 5% 25/04/2055 USD 500,000 502,930 0.09
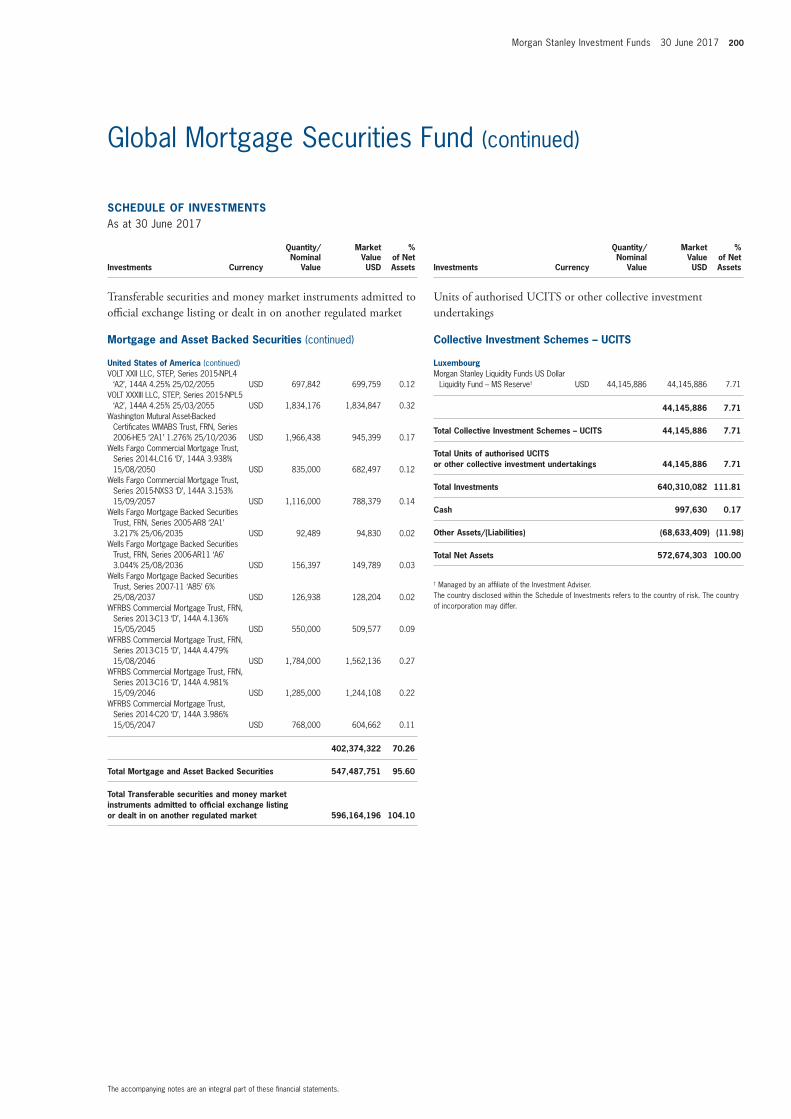
Morgan Stanley Investment Funds 30 June 2017 200
The accompanying notes are an integral part of these fi nancial statements.
Global Mortgage Securities Fund (continued)
SCHEDULE OF INVESTMENTSAs at 30 June 2017
Investments Currency
Quantity/Nominal
Value
Market Value USD
% of Net Assets
Transferable securities and money market instruments admitted to offi cial exchange listing or dealt in on another regulated market
Mortgage and Asset Backed Securities (continued)
United States of America (continued)VOLT XXII LLC, STEP, Series 2015-NPL4
‘A2’, 144A 4.25% 25/02/2055 USD 697,842 699,759 0.12 VOLT XXXIII LLC, STEP, Series 2015-NPL5
‘A2’, 144A 4.25% 25/03/2055 USD 1,834,176 1,834,847 0.32 Washington Mutural Asset-Backed
Certifi cates WMABS Trust, FRN, Series 2006-HE5 ‘2A1’ 1.276% 25/10/2036 USD 1,966,438 945,399 0.17
Wells Fargo Commercial Mortgage Trust, Series 2014-LC16 ‘D’, 144A 3.938% 15/08/2050 USD 835,000 682,497 0.12
Wells Fargo Commercial Mortgage Trust, Series 2015-NXS3 ‘D’, 144A 3.153% 15/09/2057 USD 1,116,000 788,379 0.14
Wells Fargo Mortgage Backed Securities Trust, FRN, Series 2005-AR8 ‘2A1’ 3.217% 25/06/2035 USD 92,489 94,830 0.02
Wells Fargo Mortgage Backed Securities Trust, FRN, Series 2006-AR11 ‘A6’ 3.044% 25/08/2036 USD 156,397 149,789 0.03
Wells Fargo Mortgage Backed Securities Trust, Series 2007-11 ‘A85’ 6% 25/08/2037 USD 126,938 128,204 0.02
WFRBS Commercial Mortgage Trust, FRN, Series 2013-C13 ‘D’, 144A 4.136% 15/05/2045 USD 550,000 509,577 0.09
WFRBS Commercial Mortgage Trust, FRN, Series 2013-C15 ‘D’, 144A 4.479% 15/08/2046 USD 1,784,000 1,562,136 0.27
WFRBS Commercial Mortgage Trust, FRN, Series 2013-C16 ‘D’, 144A 4.981% 15/09/2046 USD 1,285,000 1,244,108 0.22
WFRBS Commercial Mortgage Trust, Series 2014-C20 ‘D’, 144A 3.986% 15/05/2047 USD 768,000 604,662 0.11
402,374,322 70.26
Total Mortgage and Asset Backed Securities 547,487,751 95.60
Total Transferable securities and money market instruments admitted to offi cial exchange listing or dealt in on another regulated market 596,164,196 104.10
SCHEDULE OF INVESTMENTSAs at 30 June 2017
Investments Currency
Quantity/Nominal
Value
Market Value USD
% of Net Assets
Units of authorised UCITS or other collective investment undertakings
Collective Investment Schemes – UCITS
LuxembourgMorgan Stanley Liquidity Funds US Dollar
Liquidity Fund – MS Reserve† USD 44,145,886 44,145,886 7.71
44,145,886 7.71
Total Collective Investment Schemes – UCITS 44,145,886 7.71
Total Units of authorised UCITS or other collective investment undertakings 44,145,886 7.71
Total Investments 640,310,082 111.81
Cash 997,630 0.17
Other Assets/(Liabilities) (68,633,409) (11.98)
Total Net Assets 572,674,303 100.00
† Managed by an affi liate of the Investment Adviser.The country disclosed within the Schedule of Investments refers to the country of risk. The country of incorporation may differ.
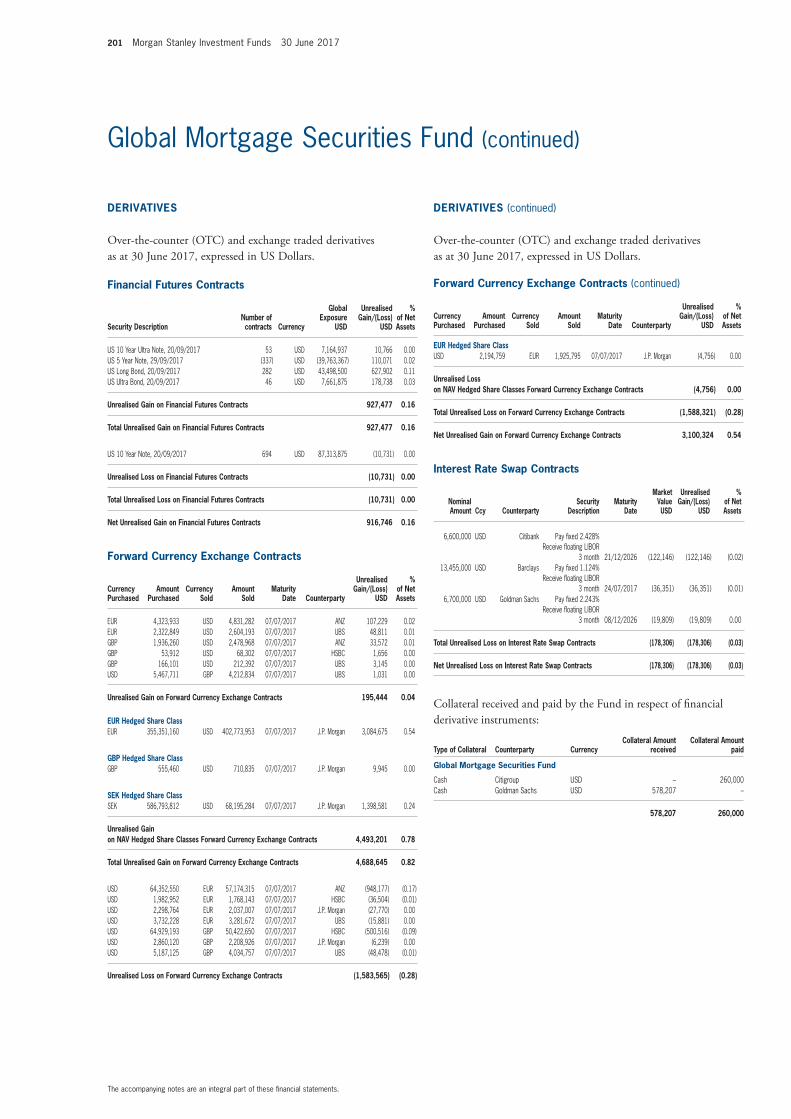
201 Morgan Stanley Investment Funds 30 June 2017
The accompanying notes are an integral part of these fi nancial statements.
Global Mortgage Securities Fund (continued)
Financial Futures Contracts
Security DescriptionNumber of contracts Currency
Global Exposure
USD
Unrealised Gain/(Loss)
USD
% of Net Assets
US 10 Year Ultra Note, 20/09/2017 53 USD 7,164,937 10,766 0.00 US 5 Year Note, 29/09/2017 (337) USD (39,763,367) 110,071 0.02 US Long Bond, 20/09/2017 282 USD 43,498,500 627,902 0.11 US Ultra Bond, 20/09/2017 46 USD 7,661,875 178,738 0.03
Unrealised Gain on Financial Futures Contracts 927,477 0.16
Total Unrealised Gain on Financial Futures Contracts 927,477 0.16
US 10 Year Note, 20/09/2017 694 USD 87,313,875 (10,731) 0.00
Unrealised Loss on Financial Futures Contracts (10,731) 0.00
Total Unrealised Loss on Financial Futures Contracts (10,731) 0.00
Net Unrealised Gain on Financial Futures Contracts 916,746 0.16
Forward Currency Exchange Contracts (continued)
Currency Purchased
Amount Purchased
Currency Sold
Amount Sold
Maturity Date Counterparty
Unrealised Gain/(Loss)
USD
% of Net Assets
EUR 4,323,933 USD 4,831,282 07/07/2017 ANZ 107,229 0.02 EUR 2,322,849 USD 2,604,193 07/07/2017 UBS 48,811 0.01 GBP 1,936,260 USD 2,478,968 07/07/2017 ANZ 33,572 0.01 GBP 53,912 USD 68,302 07/07/2017 HSBC 1,656 0.00 GBP 166,101 USD 212,392 07/07/2017 UBS 3,145 0.00 USD 5,467,711 GBP 4,212,834 07/07/2017 UBS 1,031 0.00
Unrealised Gain on Forward Currency Exchange Contracts 195,444 0.04
EUR Hedged Share ClassEUR 355,351,160 USD 402,773,953 07/07/2017 J.P. Morgan 3,084,675 0.54
GBP Hedged Share ClassGBP 555,460 USD 710,835 07/07/2017 J.P. Morgan 9,945 0.00
SEK Hedged Share ClassSEK 586,793,812 USD 68,195,284 07/07/2017 J.P. Morgan 1,398,581 0.24
Unrealised Gain on NAV Hedged Share Classes Forward Currency Exchange Contracts 4,493,201 0.78
Total Unrealised Gain on Forward Currency Exchange Contracts 4,688,645 0.82
USD 64,352,550 EUR 57,174,315 07/07/2017 ANZ (948,177) (0.17) USD 1,982,952 EUR 1,768,143 07/07/2017 HSBC (36,504) (0.01) USD 2,298,764 EUR 2,037,007 07/07/2017 J.P. Morgan (27,770) 0.00 USD 3,732,228 EUR 3,281,672 07/07/2017 UBS (15,881) 0.00 USD 64,929,193 GBP 50,422,650 07/07/2017 HSBC (500,516) (0.09) USD 2,860,120 GBP 2,208,926 07/07/2017 J.P. Morgan (6,239) 0.00 USD 5,187,125 GBP 4,034,757 07/07/2017 UBS (48,478) (0.01)
Unrealised Loss on Forward Currency Exchange Contracts (1,583,565) (0.28)
Forward Currency Exchange Contracts (continued)
Currency Purchased
Amount Purchased
Currency Sold
Amount Sold
Maturity Date Counterparty
Unrealised Gain/(Loss)
USD
% of Net Assets
EUR Hedged Share ClassUSD 2,194,759 EUR 1,925,795 07/07/2017 J.P. Morgan (4,756) 0.00
Unrealised Loss on NAV Hedged Share Classes Forward Currency Exchange Contracts (4,756) 0.00
Total Unrealised Loss on Forward Currency Exchange Contracts (1,588,321) (0.28)
Net Unrealised Gain on Forward Currency Exchange Contracts 3,100,324 0.54
Interest Rate Swap Contracts
Nominal Amount Ccy Counterparty
Security Description
Maturity Date
Market Value USD
Unrealised Gain/(Loss)
USD
% of Net Assets
6,600,000 USD Citibank Pay fi xed 2.428% Receive fl oating LIBOR
3 month 21/12/2026 (122,146) (122,146) (0.02) 13,455,000 USD Barclays Pay fi xed 1.124%
Receive fl oating LIBOR 3 month 24/07/2017 (36,351) (36,351) (0.01)
6,700,000 USD Goldman Sachs Pay fi xed 2.243% Receive fl oating LIBOR
3 month 08/12/2026 (19,809) (19,809) 0.00
Total Unrealised Loss on Interest Rate Swap Contracts (178,306) (178,306) (0.03)
Net Unrealised Loss on Interest Rate Swap Contracts (178,306) (178,306) (0.03)
Collateral received and paid by the Fund in respect of fi nancial derivative instruments:
Type of Collateral Counterparty CurrencyCollateral Amount
receivedCollateral Amount
paid
Global Mortgage Securities Fund
Cash Citigroup USD – 260,000Cash Goldman Sachs USD 578,207 –
578,207 260,000
DERIVATIVES
Over-the-counter (OTC) and exchange traded derivatives as at 30 June 2017, expressed in US Dollars.
DERIVATIVES (continued)
Over-the-counter (OTC) and exchange traded derivatives as at 30 June 2017, expressed in US Dollars.
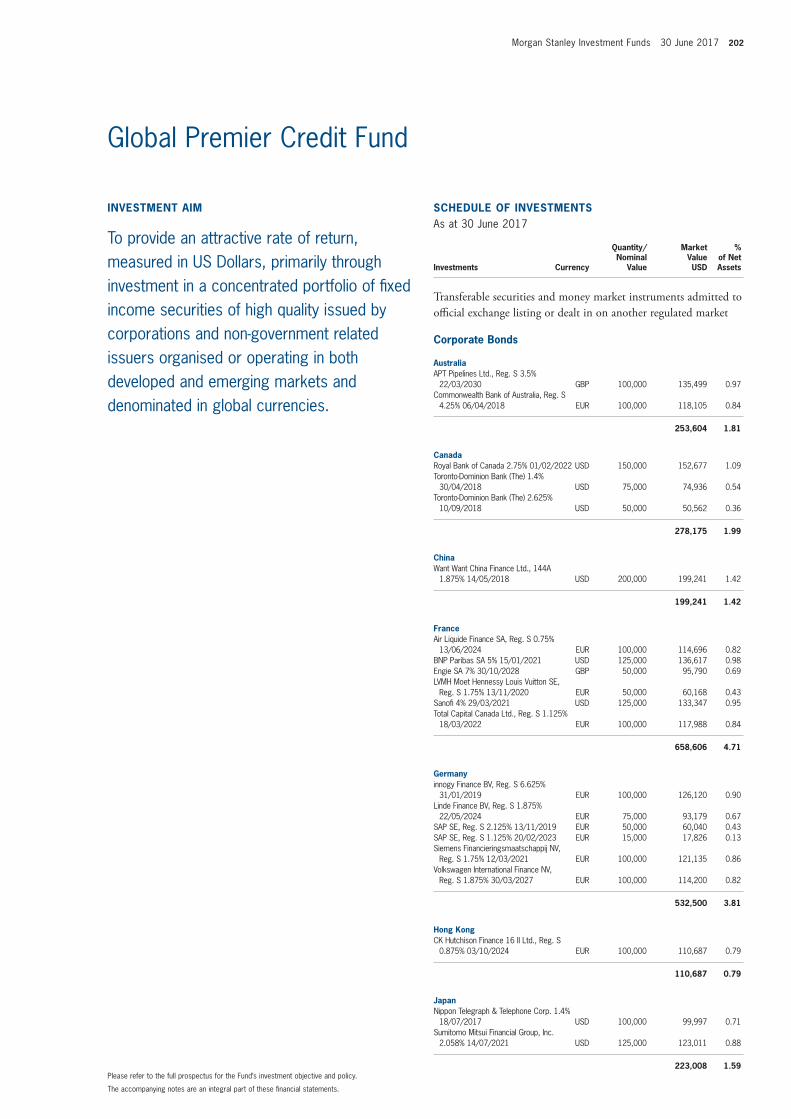
Morgan Stanley Investment Funds 30 June 2017 202
The accompanying notes are an integral part of these fi nancial statements.
Please refer to the full prospectus for the Fund’s investment objective and policy.
INVESTMENT AIM
To provide an attractive rate of return, measured in US Dollars, primarily through investment in a concentrated portfolio of fi xed income securities of high quality issued by corporations and non-government related issuers organised or operating in both developed and emerging markets and denominated in global currencies.
SCHEDULE OF INVESTMENTSAs at 30 June 2017
Investments Currency
Quantity/Nominal
Value
Market Value USD
% of Net Assets
Transferable securities and money market instruments admitted to offi cial exchange listing or dealt in on another regulated market
Corporate Bonds
AustraliaAPT Pipelines Ltd., Reg. S 3.5%
22/03/2030 GBP 100,000 135,499 0.97 Commonwealth Bank of Australia, Reg. S
4.25% 06/04/2018 EUR 100,000 118,105 0.84
253,604 1.81
CanadaRoyal Bank of Canada 2.75% 01/02/2022 USD 150,000 152,677 1.09 Toronto-Dominion Bank (The) 1.4%
30/04/2018 USD 75,000 74,936 0.54 Toronto-Dominion Bank (The) 2.625%
10/09/2018 USD 50,000 50,562 0.36
278,175 1.99
ChinaWant Want China Finance Ltd., 144A
1.875% 14/05/2018 USD 200,000 199,241 1.42
199,241 1.42
FranceAir Liquide Finance SA, Reg. S 0.75%
13/06/2024 EUR 100,000 114,696 0.82 BNP Paribas SA 5% 15/01/2021 USD 125,000 136,617 0.98 Engie SA 7% 30/10/2028 GBP 50,000 95,790 0.69 LVMH Moet Hennessy Louis Vuitton SE,
Reg. S 1.75% 13/11/2020 EUR 50,000 60,168 0.43 Sanofi 4% 29/03/2021 USD 125,000 133,347 0.95 Total Capital Canada Ltd., Reg. S 1.125%
18/03/2022 EUR 100,000 117,988 0.84
658,606 4.71
Germanyinnogy Finance BV, Reg. S 6.625%
31/01/2019 EUR 100,000 126,120 0.90 Linde Finance BV, Reg. S 1.875%
22/05/2024 EUR 75,000 93,179 0.67 SAP SE, Reg. S 2.125% 13/11/2019 EUR 50,000 60,040 0.43 SAP SE, Reg. S 1.125% 20/02/2023 EUR 15,000 17,826 0.13 Siemens Financieringsmaatschappij NV,
Reg. S 1.75% 12/03/2021 EUR 100,000 121,135 0.86 Volkswagen International Finance NV,
Reg. S 1.875% 30/03/2027 EUR 100,000 114,200 0.82
532,500 3.81
Hong KongCK Hutchison Finance 16 II Ltd., Reg. S
0.875% 03/10/2024 EUR 100,000 110,687 0.79
110,687 0.79
JapanNippon Telegraph & Telephone Corp. 1.4%
18/07/2017 USD 100,000 99,997 0.71 Sumitomo Mitsui Financial Group, Inc.
2.058% 14/07/2021 USD 125,000 123,011 0.88
223,008 1.59
Global Premier Credit Fund
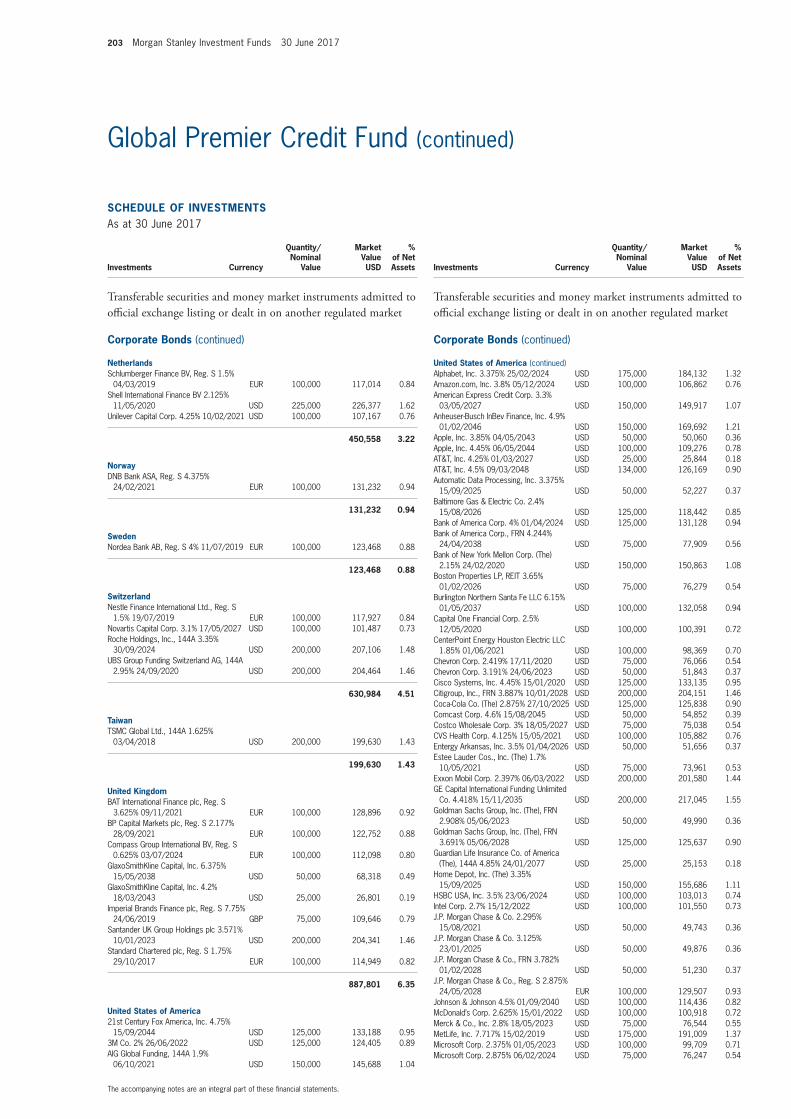
203 Morgan Stanley Investment Funds 30 June 2017
The accompanying notes are an integral part of these fi nancial statements.
Global Premier Credit Fund (continued)
SCHEDULE OF INVESTMENTSAs at 30 June 2017
Investments Currency
Quantity/Nominal
Value
Market Value USD
% of Net Assets
Transferable securities and money market instruments admitted to offi cial exchange listing or dealt in on another regulated market
Corporate Bonds (continued)
NetherlandsSchlumberger Finance BV, Reg. S 1.5%
04/03/2019 EUR 100,000 117,014 0.84 Shell International Finance BV 2.125%
11/05/2020 USD 225,000 226,377 1.62 Unilever Capital Corp. 4.25% 10/02/2021 USD 100,000 107,167 0.76
450,558 3.22
NorwayDNB Bank ASA, Reg. S 4.375%
24/02/2021 EUR 100,000 131,232 0.94
131,232 0.94
SwedenNordea Bank AB, Reg. S 4% 11/07/2019 EUR 100,000 123,468 0.88
123,468 0.88
SwitzerlandNestle Finance International Ltd., Reg. S
1.5% 19/07/2019 EUR 100,000 117,927 0.84 Novartis Capital Corp. 3.1% 17/05/2027 USD 100,000 101,487 0.73 Roche Holdings, Inc., 144A 3.35%
30/09/2024 USD 200,000 207,106 1.48 UBS Group Funding Switzerland AG, 144A
2.95% 24/09/2020 USD 200,000 204,464 1.46
630,984 4.51
TaiwanTSMC Global Ltd., 144A 1.625%
03/04/2018 USD 200,000 199,630 1.43
199,630 1.43
United KingdomBAT International Finance plc, Reg. S
3.625% 09/11/2021 EUR 100,000 128,896 0.92 BP Capital Markets plc, Reg. S 2.177%
28/09/2021 EUR 100,000 122,752 0.88 Compass Group International BV, Reg. S
0.625% 03/07/2024 EUR 100,000 112,098 0.80 GlaxoSmithKline Capital, Inc. 6.375%
15/05/2038 USD 50,000 68,318 0.49 GlaxoSmithKline Capital, Inc. 4.2%
18/03/2043 USD 25,000 26,801 0.19 Imperial Brands Finance plc, Reg. S 7.75%
24/06/2019 GBP 75,000 109,646 0.79 Santander UK Group Holdings plc 3.571%
10/01/2023 USD 200,000 204,341 1.46 Standard Chartered plc, Reg. S 1.75%
29/10/2017 EUR 100,000 114,949 0.82
887,801 6.35
United States of America21st Century Fox America, Inc. 4.75%
15/09/2044 USD 125,000 133,188 0.95 3M Co. 2% 26/06/2022 USD 125,000 124,405 0.89 AIG Global Funding, 144A 1.9%
06/10/2021 USD 150,000 145,688 1.04
SCHEDULE OF INVESTMENTSAs at 30 June 2017
Investments Currency
Quantity/Nominal
Value
Market Value USD
% of Net Assets
Transferable securities and money market instruments admitted to offi cial exchange listing or dealt in on another regulated market
Corporate Bonds (continued)
United States of America (continued)Alphabet, Inc. 3.375% 25/02/2024 USD 175,000 184,132 1.32 Amazon.com, Inc. 3.8% 05/12/2024 USD 100,000 106,862 0.76 American Express Credit Corp. 3.3%
03/05/2027 USD 150,000 149,917 1.07 Anheuser-Busch InBev Finance, Inc. 4.9%
01/02/2046 USD 150,000 169,692 1.21 Apple, Inc. 3.85% 04/05/2043 USD 50,000 50,060 0.36 Apple, Inc. 4.45% 06/05/2044 USD 100,000 109,276 0.78 AT&T, Inc. 4.25% 01/03/2027 USD 25,000 25,844 0.18 AT&T, Inc. 4.5% 09/03/2048 USD 134,000 126,169 0.90 Automatic Data Processing, Inc. 3.375%
15/09/2025 USD 50,000 52,227 0.37 Baltimore Gas & Electric Co. 2.4%
15/08/2026 USD 125,000 118,442 0.85 Bank of America Corp. 4% 01/04/2024 USD 125,000 131,128 0.94 Bank of America Corp., FRN 4.244%
24/04/2038 USD 75,000 77,909 0.56 Bank of New York Mellon Corp. (The)
2.15% 24/02/2020 USD 150,000 150,863 1.08 Boston Properties LP, REIT 3.65%
01/02/2026 USD 75,000 76,279 0.54 Burlington Northern Santa Fe LLC 6.15%
01/05/2037 USD 100,000 132,058 0.94 Capital One Financial Corp. 2.5%
12/05/2020 USD 100,000 100,391 0.72 CenterPoint Energy Houston Electric LLC
1.85% 01/06/2021 USD 100,000 98,369 0.70 Chevron Corp. 2.419% 17/11/2020 USD 75,000 76,066 0.54 Chevron Corp. 3.191% 24/06/2023 USD 50,000 51,843 0.37 Cisco Systems, Inc. 4.45% 15/01/2020 USD 125,000 133,135 0.95 Citigroup, Inc., FRN 3.887% 10/01/2028 USD 200,000 204,151 1.46 Coca-Cola Co. (The) 2.875% 27/10/2025 USD 125,000 125,838 0.90 Comcast Corp. 4.6% 15/08/2045 USD 50,000 54,852 0.39 Costco Wholesale Corp. 3% 18/05/2027 USD 75,000 75,038 0.54 CVS Health Corp. 4.125% 15/05/2021 USD 100,000 105,882 0.76 Entergy Arkansas, Inc. 3.5% 01/04/2026 USD 50,000 51,656 0.37 Estee Lauder Cos., Inc. (The) 1.7%
10/05/2021 USD 75,000 73,961 0.53 Exxon Mobil Corp. 2.397% 06/03/2022 USD 200,000 201,580 1.44 GE Capital International Funding Unlimited
Co. 4.418% 15/11/2035 USD 200,000 217,045 1.55 Goldman Sachs Group, Inc. (The), FRN
2.908% 05/06/2023 USD 50,000 49,990 0.36 Goldman Sachs Group, Inc. (The), FRN
3.691% 05/06/2028 USD 125,000 125,637 0.90 Guardian Life Insurance Co. of America
(The), 144A 4.85% 24/01/2077 USD 25,000 25,153 0.18 Home Depot, Inc. (The) 3.35%
15/09/2025 USD 150,000 155,686 1.11 HSBC USA, Inc. 3.5% 23/06/2024 USD 100,000 103,013 0.74 Intel Corp. 2.7% 15/12/2022 USD 100,000 101,550 0.73 J.P. Morgan Chase & Co. 2.295%
15/08/2021 USD 50,000 49,743 0.36 J.P. Morgan Chase & Co. 3.125%
23/01/2025 USD 50,000 49,876 0.36 J.P. Morgan Chase & Co., FRN 3.782%
01/02/2028 USD 50,000 51,230 0.37 J.P. Morgan Chase & Co., Reg. S 2.875%
24/05/2028 EUR 100,000 129,507 0.93 Johnson & Johnson 4.5% 01/09/2040 USD 100,000 114,436 0.82 McDonald’s Corp. 2.625% 15/01/2022 USD 100,000 100,918 0.72 Merck & Co., Inc. 2.8% 18/05/2023 USD 75,000 76,544 0.55 MetLife, Inc. 7.717% 15/02/2019 USD 175,000 191,009 1.37 Microsoft Corp. 2.375% 01/05/2023 USD 100,000 99,709 0.71 Microsoft Corp. 2.875% 06/02/2024 USD 75,000 76,247 0.54
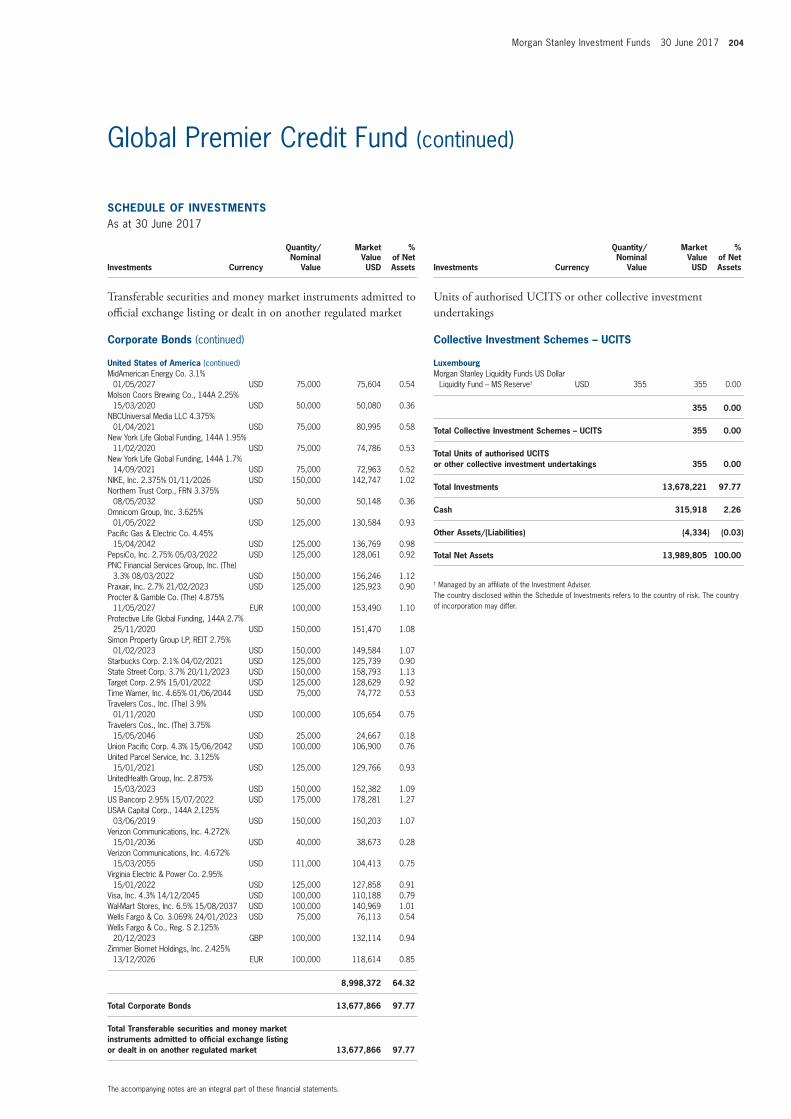
Morgan Stanley Investment Funds 30 June 2017 204
The accompanying notes are an integral part of these fi nancial statements.
Global Premier Credit Fund (continued)
SCHEDULE OF INVESTMENTSAs at 30 June 2017
Investments Currency
Quantity/Nominal
Value
Market Value USD
% of Net Assets
Transferable securities and money market instruments admitted to offi cial exchange listing or dealt in on another regulated market
Corporate Bonds (continued)
United States of America (continued)MidAmerican Energy Co. 3.1%
01/05/2027 USD 75,000 75,604 0.54 Molson Coors Brewing Co., 144A 2.25%
15/03/2020 USD 50,000 50,080 0.36 NBCUniversal Media LLC 4.375%
01/04/2021 USD 75,000 80,995 0.58 New York Life Global Funding, 144A 1.95%
11/02/2020 USD 75,000 74,786 0.53 New York Life Global Funding, 144A 1.7%
14/09/2021 USD 75,000 72,963 0.52 NIKE, Inc. 2.375% 01/11/2026 USD 150,000 142,747 1.02 Northern Trust Corp., FRN 3.375%
08/05/2032 USD 50,000 50,148 0.36 Omnicom Group, Inc. 3.625%
01/05/2022 USD 125,000 130,584 0.93 Pacifi c Gas & Electric Co. 4.45%
15/04/2042 USD 125,000 136,769 0.98 PepsiCo, Inc. 2.75% 05/03/2022 USD 125,000 128,061 0.92 PNC Financial Services Group, Inc. (The)
3.3% 08/03/2022 USD 150,000 156,246 1.12 Praxair, Inc. 2.7% 21/02/2023 USD 125,000 125,923 0.90 Procter & Gamble Co. (The) 4.875%
11/05/2027 EUR 100,000 153,490 1.10 Protective Life Global Funding, 144A 2.7%
25/11/2020 USD 150,000 151,470 1.08 Simon Property Group LP, REIT 2.75%
01/02/2023 USD 150,000 149,584 1.07 Starbucks Corp. 2.1% 04/02/2021 USD 125,000 125,739 0.90 State Street Corp. 3.7% 20/11/2023 USD 150,000 158,793 1.13 Target Corp. 2.9% 15/01/2022 USD 125,000 128,629 0.92 Time Warner, Inc. 4.65% 01/06/2044 USD 75,000 74,772 0.53 Travelers Cos., Inc. (The) 3.9%
01/11/2020 USD 100,000 105,654 0.75 Travelers Cos., Inc. (The) 3.75%
15/05/2046 USD 25,000 24,667 0.18 Union Pacifi c Corp. 4.3% 15/06/2042 USD 100,000 106,900 0.76 United Parcel Service, Inc. 3.125%
15/01/2021 USD 125,000 129,766 0.93 UnitedHealth Group, Inc. 2.875%
15/03/2023 USD 150,000 152,382 1.09 US Bancorp 2.95% 15/07/2022 USD 175,000 178,281 1.27 USAA Capital Corp., 144A 2.125%
03/06/2019 USD 150,000 150,203 1.07 Verizon Communications, Inc. 4.272%
15/01/2036 USD 40,000 38,673 0.28 Verizon Communications, Inc. 4.672%
15/03/2055 USD 111,000 104,413 0.75 Virginia Electric & Power Co. 2.95%
15/01/2022 USD 125,000 127,858 0.91 Visa, Inc. 4.3% 14/12/2045 USD 100,000 110,188 0.79 Wal-Mart Stores, Inc. 6.5% 15/08/2037 USD 100,000 140,969 1.01 Wells Fargo & Co. 3.069% 24/01/2023 USD 75,000 76,113 0.54 Wells Fargo & Co., Reg. S 2.125%
20/12/2023 GBP 100,000 132,114 0.94 Zimmer Biomet Holdings, Inc. 2.425%
13/12/2026 EUR 100,000 118,614 0.85
8,998,372 64.32
Total Corporate Bonds 13,677,866 97.77
Total Transferable securities and money market instruments admitted to offi cial exchange listing or dealt in on another regulated market 13,677,866 97.77
SCHEDULE OF INVESTMENTSAs at 30 June 2017
Investments Currency
Quantity/Nominal
Value
Market Value USD
% of Net Assets
Units of authorised UCITS or other collective investment undertakings
Collective Investment Schemes – UCITS
LuxembourgMorgan Stanley Liquidity Funds US Dollar
Liquidity Fund – MS Reserve† USD 355 355 0.00
355 0.00
Total Collective Investment Schemes – UCITS 355 0.00
Total Units of authorised UCITS or other collective investment undertakings 355 0.00
Total Investments 13,678,221 97.77
Cash 315,918 2.26
Other Assets/(Liabilities) (4,334) (0.03)
Total Net Assets 13,989,805 100.00
† Managed by an affi liate of the Investment Adviser.The country disclosed within the Schedule of Investments refers to the country of risk. The country of incorporation may differ.
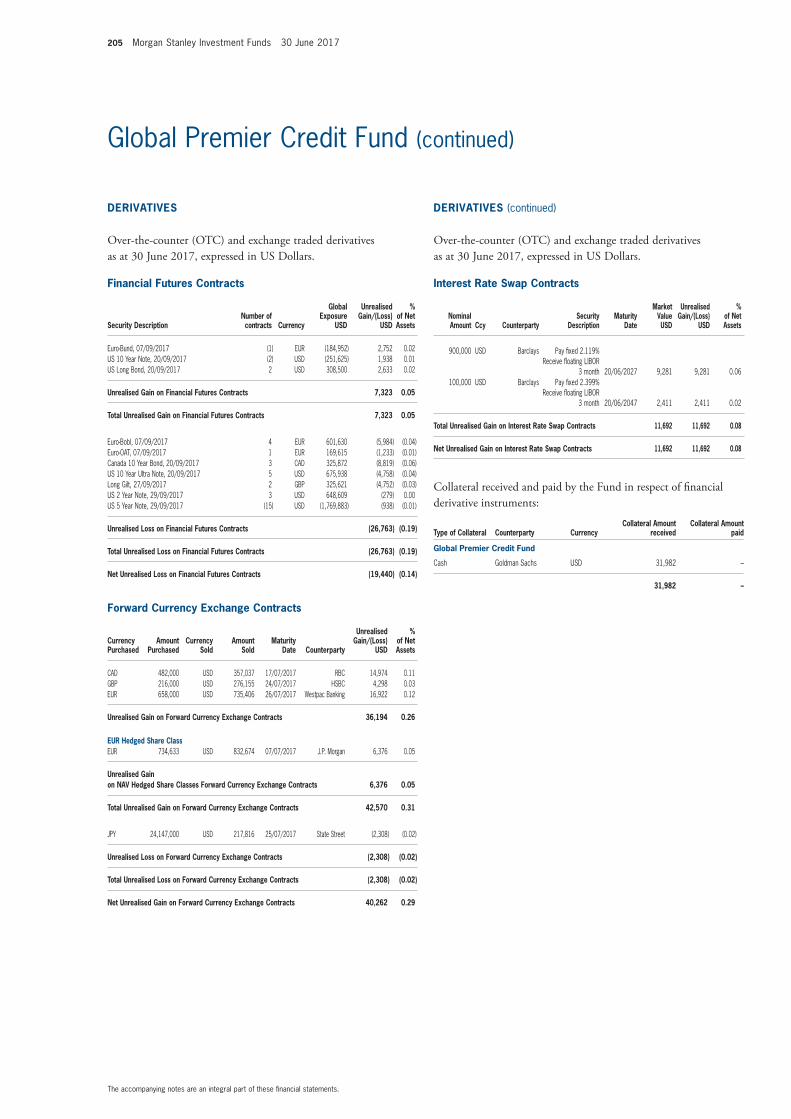
205 Morgan Stanley Investment Funds 30 June 2017
The accompanying notes are an integral part of these fi nancial statements.
Global Premier Credit Fund (continued)
Interest Rate Swap Contracts
Nominal Amount Ccy Counterparty
Security Description
Maturity Date
Market Value USD
Unrealised Gain/(Loss)
USD
% of Net Assets
900,000 USD Barclays Pay fi xed 2.119% Receive fl oating LIBOR
3 month 20/06/2027 9,281 9,281 0.06 100,000 USD Barclays Pay fi xed 2.399%
Receive fl oating LIBOR 3 month 20/06/2047 2,411 2,411 0.02
Total Unrealised Gain on Interest Rate Swap Contracts 11,692 11,692 0.08
Net Unrealised Gain on Interest Rate Swap Contracts 11,692 11,692 0.08
Collateral received and paid by the Fund in respect of fi nancial derivative instruments:
Type of Collateral Counterparty CurrencyCollateral Amount
receivedCollateral Amount
paid
Global Premier Credit Fund
Cash Goldman Sachs USD 31,982 –
31,982 –
Financial Futures Contracts
Security DescriptionNumber of contracts Currency
Global Exposure
USD
Unrealised Gain/(Loss)
USD
% of Net Assets
Euro-Bund, 07/09/2017 (1) EUR (184,952) 2,752 0.02 US 10 Year Note, 20/09/2017 (2) USD (251,625) 1,938 0.01 US Long Bond, 20/09/2017 2 USD 308,500 2,633 0.02
Unrealised Gain on Financial Futures Contracts 7,323 0.05
Total Unrealised Gain on Financial Futures Contracts 7,323 0.05
Euro-Bobl, 07/09/2017 4 EUR 601,630 (5,984) (0.04) Euro-OAT, 07/09/2017 1 EUR 169,615 (1,233) (0.01) Canada 10 Year Bond, 20/09/2017 3 CAD 325,872 (8,819) (0.06) US 10 Year Ultra Note, 20/09/2017 5 USD 675,938 (4,758) (0.04) Long Gilt, 27/09/2017 2 GBP 325,621 (4,752) (0.03) US 2 Year Note, 29/09/2017 3 USD 648,609 (279) 0.00 US 5 Year Note, 29/09/2017 (15) USD (1,769,883) (938) (0.01)
Unrealised Loss on Financial Futures Contracts (26,763) (0.19)
Total Unrealised Loss on Financial Futures Contracts (26,763) (0.19)
Net Unrealised Loss on Financial Futures Contracts (19,440) (0.14)
Forward Currency Exchange Contracts
Currency Purchased
Amount Purchased
Currency Sold
Amount Sold
Maturity Date Counterparty
Unrealised Gain/(Loss)
USD
% of Net Assets
CAD 482,000 USD 357,037 17/07/2017 RBC 14,974 0.11 GBP 216,000 USD 276,155 24/07/2017 HSBC 4,298 0.03 EUR 658,000 USD 735,406 26/07/2017 Westpac Banking 16,922 0.12
Unrealised Gain on Forward Currency Exchange Contracts 36,194 0.26
EUR Hedged Share ClassEUR 734,633 USD 832,674 07/07/2017 J.P. Morgan 6,376 0.05
Unrealised Gain on NAV Hedged Share Classes Forward Currency Exchange Contracts 6,376 0.05
Total Unrealised Gain on Forward Currency Exchange Contracts 42,570 0.31
JPY 24,147,000 USD 217,816 25/07/2017 State Street (2,308) (0.02)
Unrealised Loss on Forward Currency Exchange Contracts (2,308) (0.02)
Total Unrealised Loss on Forward Currency Exchange Contracts (2,308) (0.02)
Net Unrealised Gain on Forward Currency Exchange Contracts 40,262 0.29
DERIVATIVES (continued)
Over-the-counter (OTC) and exchange traded derivatives as at 30 June 2017, expressed in US Dollars.
DERIVATIVES
Over-the-counter (OTC) and exchange traded derivatives as at 30 June 2017, expressed in US Dollars.
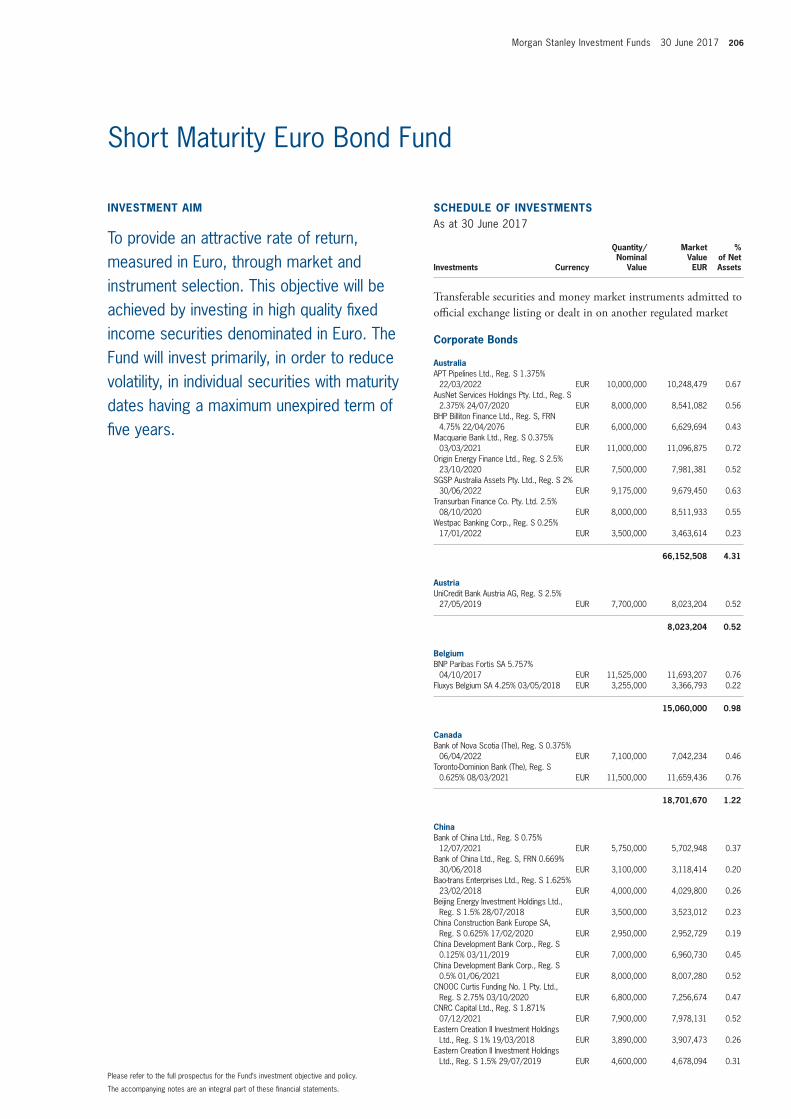
Morgan Stanley Investment Funds 30 June 2017 206
The accompanying notes are an integral part of these fi nancial statements.
Please refer to the full prospectus for the Fund’s investment objective and policy.
INVESTMENT AIM
To provide an attractive rate of return, measured in Euro, through market and instrument selection. This objective will be achieved by investing in high quality fi xed income securities denominated in Euro. The Fund will invest primarily, in order to reduce volatility, in individual securities with maturity dates having a maximum unexpired term of fi ve years.
SCHEDULE OF INVESTMENTSAs at 30 June 2017
Investments Currency
Quantity/Nominal
Value
Market Value EUR
% of Net Assets
Transferable securities and money market instruments admitted to offi cial exchange listing or dealt in on another regulated market
Corporate Bonds
AustraliaAPT Pipelines Ltd., Reg. S 1.375%
22/03/2022 EUR 10,000,000 10,248,479 0.67 AusNet Services Holdings Pty. Ltd., Reg. S
2.375% 24/07/2020 EUR 8,000,000 8,541,082 0.56 BHP Billiton Finance Ltd., Reg. S, FRN
4.75% 22/04/2076 EUR 6,000,000 6,629,694 0.43 Macquarie Bank Ltd., Reg. S 0.375%
03/03/2021 EUR 11,000,000 11,096,875 0.72 Origin Energy Finance Ltd., Reg. S 2.5%
23/10/2020 EUR 7,500,000 7,981,381 0.52 SGSP Australia Assets Pty. Ltd., Reg. S 2%
30/06/2022 EUR 9,175,000 9,679,450 0.63 Transurban Finance Co. Pty. Ltd. 2.5%
08/10/2020 EUR 8,000,000 8,511,933 0.55 Westpac Banking Corp., Reg. S 0.25%
17/01/2022 EUR 3,500,000 3,463,614 0.23
66,152,508 4.31
AustriaUniCredit Bank Austria AG, Reg. S 2.5%
27/05/2019 EUR 7,700,000 8,023,204 0.52
8,023,204 0.52
BelgiumBNP Paribas Fortis SA 5.757%
04/10/2017 EUR 11,525,000 11,693,207 0.76 Fluxys Belgium SA 4.25% 03/05/2018 EUR 3,255,000 3,366,793 0.22
15,060,000 0.98
CanadaBank of Nova Scotia (The), Reg. S 0.375%
06/04/2022 EUR 7,100,000 7,042,234 0.46 Toronto-Dominion Bank (The), Reg. S
0.625% 08/03/2021 EUR 11,500,000 11,659,436 0.76
18,701,670 1.22
ChinaBank of China Ltd., Reg. S 0.75%
12/07/2021 EUR 5,750,000 5,702,948 0.37 Bank of China Ltd., Reg. S, FRN 0.669%
30/06/2018 EUR 3,100,000 3,118,414 0.20 Bao-trans Enterprises Ltd., Reg. S 1.625%
23/02/2018 EUR 4,000,000 4,029,800 0.26 Beijing Energy Investment Holdings Ltd.,
Reg. S 1.5% 28/07/2018 EUR 3,500,000 3,523,012 0.23 China Construction Bank Europe SA,
Reg. S 0.625% 17/02/2020 EUR 2,950,000 2,952,729 0.19 China Development Bank Corp., Reg. S
0.125% 03/11/2019 EUR 7,000,000 6,960,730 0.45 China Development Bank Corp., Reg. S
0.5% 01/06/2021 EUR 8,000,000 8,007,280 0.52 CNOOC Curtis Funding No. 1 Pty. Ltd.,
Reg. S 2.75% 03/10/2020 EUR 6,800,000 7,256,674 0.47 CNRC Capital Ltd., Reg. S 1.871%
07/12/2021 EUR 7,900,000 7,978,131 0.52 Eastern Creation II Investment Holdings
Ltd., Reg. S 1% 19/03/2018 EUR 3,890,000 3,907,473 0.26 Eastern Creation II Investment Holdings
Ltd., Reg. S 1.5% 29/07/2019 EUR 4,600,000 4,678,094 0.31
Short Maturity Euro Bond Fund
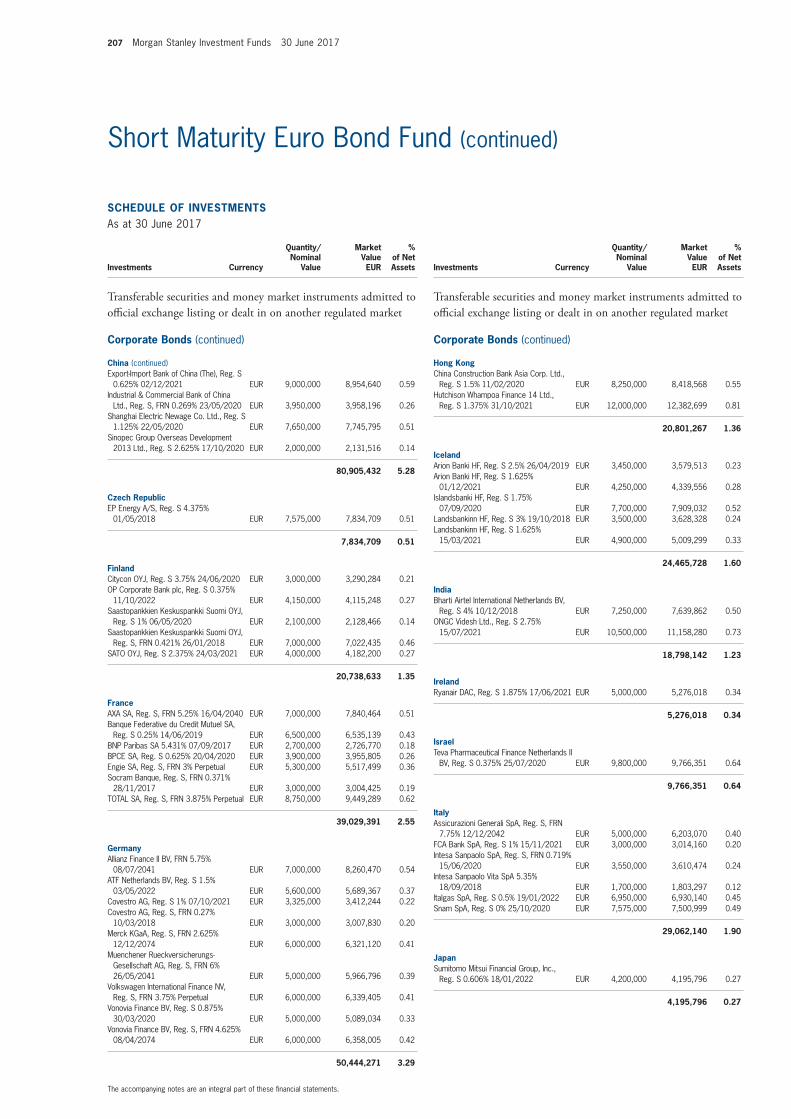
207 Morgan Stanley Investment Funds 30 June 2017
The accompanying notes are an integral part of these fi nancial statements.
Short Maturity Euro Bond Fund (continued)
SCHEDULE OF INVESTMENTSAs at 30 June 2017
Investments Currency
Quantity/Nominal
Value
Market Value EUR
% of Net Assets
Transferable securities and money market instruments admitted to offi cial exchange listing or dealt in on another regulated market
Corporate Bonds (continued)
China (continued)Export-Import Bank of China (The), Reg. S
0.625% 02/12/2021 EUR 9,000,000 8,954,640 0.59 Industrial & Commercial Bank of China
Ltd., Reg. S, FRN 0.269% 23/05/2020 EUR 3,950,000 3,958,196 0.26 Shanghai Electric Newage Co. Ltd., Reg. S
1.125% 22/05/2020 EUR 7,650,000 7,745,795 0.51 Sinopec Group Overseas Development
2013 Ltd., Reg. S 2.625% 17/10/2020 EUR 2,000,000 2,131,516 0.14
80,905,432 5.28
Czech RepublicEP Energy A/S, Reg. S 4.375%
01/05/2018 EUR 7,575,000 7,834,709 0.51
7,834,709 0.51
FinlandCitycon OYJ, Reg. S 3.75% 24/06/2020 EUR 3,000,000 3,290,284 0.21 OP Corporate Bank plc, Reg. S 0.375%
11/10/2022 EUR 4,150,000 4,115,248 0.27 Saastopankkien Keskuspankki Suomi OYJ,
Reg. S 1% 06/05/2020 EUR 2,100,000 2,128,466 0.14 Saastopankkien Keskuspankki Suomi OYJ,
Reg. S, FRN 0.421% 26/01/2018 EUR 7,000,000 7,022,435 0.46 SATO OYJ, Reg. S 2.375% 24/03/2021 EUR 4,000,000 4,182,200 0.27
20,738,633 1.35
FranceAXA SA, Reg. S, FRN 5.25% 16/04/2040 EUR 7,000,000 7,840,464 0.51 Banque Federative du Credit Mutuel SA,
Reg. S 0.25% 14/06/2019 EUR 6,500,000 6,535,139 0.43 BNP Paribas SA 5.431% 07/09/2017 EUR 2,700,000 2,726,770 0.18 BPCE SA, Reg. S 0.625% 20/04/2020 EUR 3,900,000 3,955,805 0.26 Engie SA, Reg. S, FRN 3% Perpetual EUR 5,300,000 5,517,499 0.36 Socram Banque, Reg. S, FRN 0.371%
28/11/2017 EUR 3,000,000 3,004,425 0.19 TOTAL SA, Reg. S, FRN 3.875% Perpetual EUR 8,750,000 9,449,289 0.62
39,029,391 2.55
GermanyAllianz Finance II BV, FRN 5.75%
08/07/2041 EUR 7,000,000 8,260,470 0.54 ATF Netherlands BV, Reg. S 1.5%
03/05/2022 EUR 5,600,000 5,689,367 0.37 Covestro AG, Reg. S 1% 07/10/2021 EUR 3,325,000 3,412,244 0.22 Covestro AG, Reg. S, FRN 0.27%
10/03/2018 EUR 3,000,000 3,007,830 0.20 Merck KGaA, Reg. S, FRN 2.625%
12/12/2074 EUR 6,000,000 6,321,120 0.41 Muenchener Rueckversicherungs-
Gesellschaft AG, Reg. S, FRN 6% 26/05/2041 EUR 5,000,000 5,966,796 0.39
Volkswagen International Finance NV, Reg. S, FRN 3.75% Perpetual EUR 6,000,000 6,339,405 0.41
Vonovia Finance BV, Reg. S 0.875% 30/03/2020 EUR 5,000,000 5,089,034 0.33
Vonovia Finance BV, Reg. S, FRN 4.625% 08/04/2074 EUR 6,000,000 6,358,005 0.42
50,444,271 3.29
SCHEDULE OF INVESTMENTSAs at 30 June 2017
Investments Currency
Quantity/Nominal
Value
Market Value EUR
% of Net Assets
Transferable securities and money market instruments admitted to offi cial exchange listing or dealt in on another regulated market
Corporate Bonds (continued)
Hong KongChina Construction Bank Asia Corp. Ltd.,
Reg. S 1.5% 11/02/2020 EUR 8,250,000 8,418,568 0.55 Hutchison Whampoa Finance 14 Ltd.,
Reg. S 1.375% 31/10/2021 EUR 12,000,000 12,382,699 0.81
20,801,267 1.36
IcelandArion Banki HF, Reg. S 2.5% 26/04/2019 EUR 3,450,000 3,579,513 0.23 Arion Banki HF, Reg. S 1.625%
01/12/2021 EUR 4,250,000 4,339,556 0.28 Islandsbanki HF, Reg. S 1.75%
07/09/2020 EUR 7,700,000 7,909,032 0.52 Landsbankinn HF, Reg. S 3% 19/10/2018 EUR 3,500,000 3,628,328 0.24 Landsbankinn HF, Reg. S 1.625%
15/03/2021 EUR 4,900,000 5,009,299 0.33
24,465,728 1.60
IndiaBharti Airtel International Netherlands BV,
Reg. S 4% 10/12/2018 EUR 7,250,000 7,639,862 0.50 ONGC Videsh Ltd., Reg. S 2.75%
15/07/2021 EUR 10,500,000 11,158,280 0.73
18,798,142 1.23
IrelandRyanair DAC, Reg. S 1.875% 17/06/2021 EUR 5,000,000 5,276,018 0.34
5,276,018 0.34
IsraelTeva Pharmaceutical Finance Netherlands II
BV, Reg. S 0.375% 25/07/2020 EUR 9,800,000 9,766,351 0.64
9,766,351 0.64
ItalyAssicurazioni Generali SpA, Reg. S, FRN
7.75% 12/12/2042 EUR 5,000,000 6,203,070 0.40 FCA Bank SpA, Reg. S 1% 15/11/2021 EUR 3,000,000 3,014,160 0.20 Intesa Sanpaolo SpA, Reg. S, FRN 0.719%
15/06/2020 EUR 3,550,000 3,610,474 0.24 Intesa Sanpaolo Vita SpA 5.35%
18/09/2018 EUR 1,700,000 1,803,297 0.12 Italgas SpA, Reg. S 0.5% 19/01/2022 EUR 6,950,000 6,930,140 0.45 Snam SpA, Reg. S 0% 25/10/2020 EUR 7,575,000 7,500,999 0.49
29,062,140 1.90
JapanSumitomo Mitsui Financial Group, Inc.,
Reg. S 0.606% 18/01/2022 EUR 4,200,000 4,195,796 0.27
4,195,796 0.27
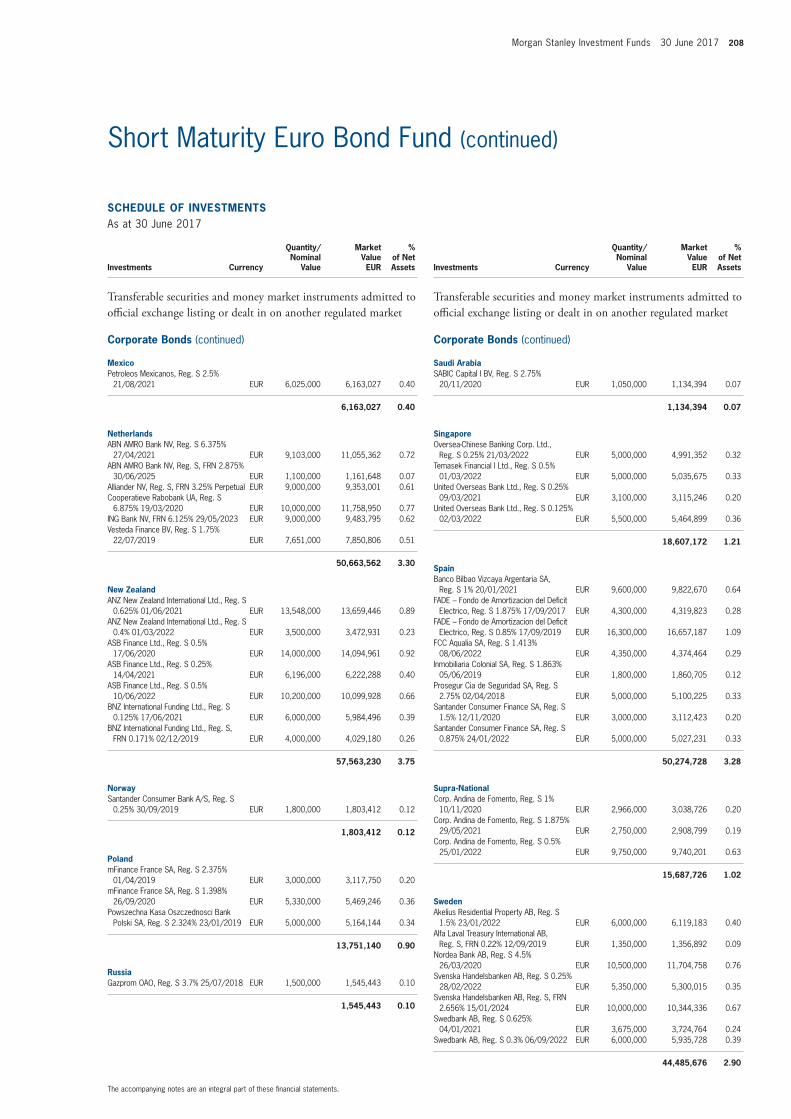
Morgan Stanley Investment Funds 30 June 2017 208
The accompanying notes are an integral part of these fi nancial statements.
Short Maturity Euro Bond Fund (continued)
SCHEDULE OF INVESTMENTSAs at 30 June 2017
Investments Currency
Quantity/Nominal
Value
Market Value EUR
% of Net Assets
Transferable securities and money market instruments admitted to offi cial exchange listing or dealt in on another regulated market
Corporate Bonds (continued)
MexicoPetroleos Mexicanos, Reg. S 2.5%
21/08/2021 EUR 6,025,000 6,163,027 0.40
6,163,027 0.40
NetherlandsABN AMRO Bank NV, Reg. S 6.375%
27/04/2021 EUR 9,103,000 11,055,362 0.72 ABN AMRO Bank NV, Reg. S, FRN 2.875%
30/06/2025 EUR 1,100,000 1,161,648 0.07 Alliander NV, Reg. S, FRN 3.25% Perpetual EUR 9,000,000 9,353,001 0.61 Cooperatieve Rabobank UA, Reg. S
6.875% 19/03/2020 EUR 10,000,000 11,758,950 0.77 ING Bank NV, FRN 6.125% 29/05/2023 EUR 9,000,000 9,483,795 0.62 Vesteda Finance BV, Reg. S 1.75%
22/07/2019 EUR 7,651,000 7,850,806 0.51
50,663,562 3.30
New ZealandANZ New Zealand International Ltd., Reg. S
0.625% 01/06/2021 EUR 13,548,000 13,659,446 0.89 ANZ New Zealand International Ltd., Reg. S
0.4% 01/03/2022 EUR 3,500,000 3,472,931 0.23 ASB Finance Ltd., Reg. S 0.5%
17/06/2020 EUR 14,000,000 14,094,961 0.92 ASB Finance Ltd., Reg. S 0.25%
14/04/2021 EUR 6,196,000 6,222,288 0.40 ASB Finance Ltd., Reg. S 0.5%
10/06/2022 EUR 10,200,000 10,099,928 0.66 BNZ International Funding Ltd., Reg. S
0.125% 17/06/2021 EUR 6,000,000 5,984,496 0.39 BNZ International Funding Ltd., Reg. S,
FRN 0.171% 02/12/2019 EUR 4,000,000 4,029,180 0.26
57,563,230 3.75
NorwaySantander Consumer Bank A/S, Reg. S
0.25% 30/09/2019 EUR 1,800,000 1,803,412 0.12
1,803,412 0.12
PolandmFinance France SA, Reg. S 2.375%
01/04/2019 EUR 3,000,000 3,117,750 0.20 mFinance France SA, Reg. S 1.398%
26/09/2020 EUR 5,330,000 5,469,246 0.36 Powszechna Kasa Oszczednosci Bank
Polski SA, Reg. S 2.324% 23/01/2019 EUR 5,000,000 5,164,144 0.34
13,751,140 0.90
RussiaGazprom OAO, Reg. S 3.7% 25/07/2018 EUR 1,500,000 1,545,443 0.10
1,545,443 0.10
SCHEDULE OF INVESTMENTSAs at 30 June 2017
Investments Currency
Quantity/Nominal
Value
Market Value EUR
% of Net Assets
Transferable securities and money market instruments admitted to offi cial exchange listing or dealt in on another regulated market
Corporate Bonds (continued)
Saudi ArabiaSABIC Capital I BV, Reg. S 2.75%
20/11/2020 EUR 1,050,000 1,134,394 0.07
1,134,394 0.07
SingaporeOversea-Chinese Banking Corp. Ltd.,
Reg. S 0.25% 21/03/2022 EUR 5,000,000 4,991,352 0.32 Temasek Financial I Ltd., Reg. S 0.5%
01/03/2022 EUR 5,000,000 5,035,675 0.33 United Overseas Bank Ltd., Reg. S 0.25%
09/03/2021 EUR 3,100,000 3,115,246 0.20 United Overseas Bank Ltd., Reg. S 0.125%
02/03/2022 EUR 5,500,000 5,464,899 0.36
18,607,172 1.21
SpainBanco Bilbao Vizcaya Argentaria SA,
Reg. S 1% 20/01/2021 EUR 9,600,000 9,822,670 0.64 FADE – Fondo de Amortizacion del Defi cit
Electrico, Reg. S 1.875% 17/09/2017 EUR 4,300,000 4,319,823 0.28 FADE – Fondo de Amortizacion del Defi cit
Electrico, Reg. S 0.85% 17/09/2019 EUR 16,300,000 16,657,187 1.09 FCC Aqualia SA, Reg. S 1.413%
08/06/2022 EUR 4,350,000 4,374,464 0.29 Inmobiliaria Colonial SA, Reg. S 1.863%
05/06/2019 EUR 1,800,000 1,860,705 0.12 Prosegur Cia de Seguridad SA, Reg. S
2.75% 02/04/2018 EUR 5,000,000 5,100,225 0.33 Santander Consumer Finance SA, Reg. S
1.5% 12/11/2020 EUR 3,000,000 3,112,423 0.20 Santander Consumer Finance SA, Reg. S
0.875% 24/01/2022 EUR 5,000,000 5,027,231 0.33
50,274,728 3.28
Supra-NationalCorp. Andina de Fomento, Reg. S 1%
10/11/2020 EUR 2,966,000 3,038,726 0.20 Corp. Andina de Fomento, Reg. S 1.875%
29/05/2021 EUR 2,750,000 2,908,799 0.19 Corp. Andina de Fomento, Reg. S 0.5%
25/01/2022 EUR 9,750,000 9,740,201 0.63
15,687,726 1.02
SwedenAkelius Residential Property AB, Reg. S
1.5% 23/01/2022 EUR 6,000,000 6,119,183 0.40 Alfa Laval Treasury International AB,
Reg. S, FRN 0.22% 12/09/2019 EUR 1,350,000 1,356,892 0.09 Nordea Bank AB, Reg. S 4.5%
26/03/2020 EUR 10,500,000 11,704,758 0.76 Svenska Handelsbanken AB, Reg. S 0.25%
28/02/2022 EUR 5,350,000 5,300,015 0.35 Svenska Handelsbanken AB, Reg. S, FRN
2.656% 15/01/2024 EUR 10,000,000 10,344,336 0.67 Swedbank AB, Reg. S 0.625%
04/01/2021 EUR 3,675,000 3,724,764 0.24 Swedbank AB, Reg. S 0.3% 06/09/2022 EUR 6,000,000 5,935,728 0.39
44,485,676 2.90
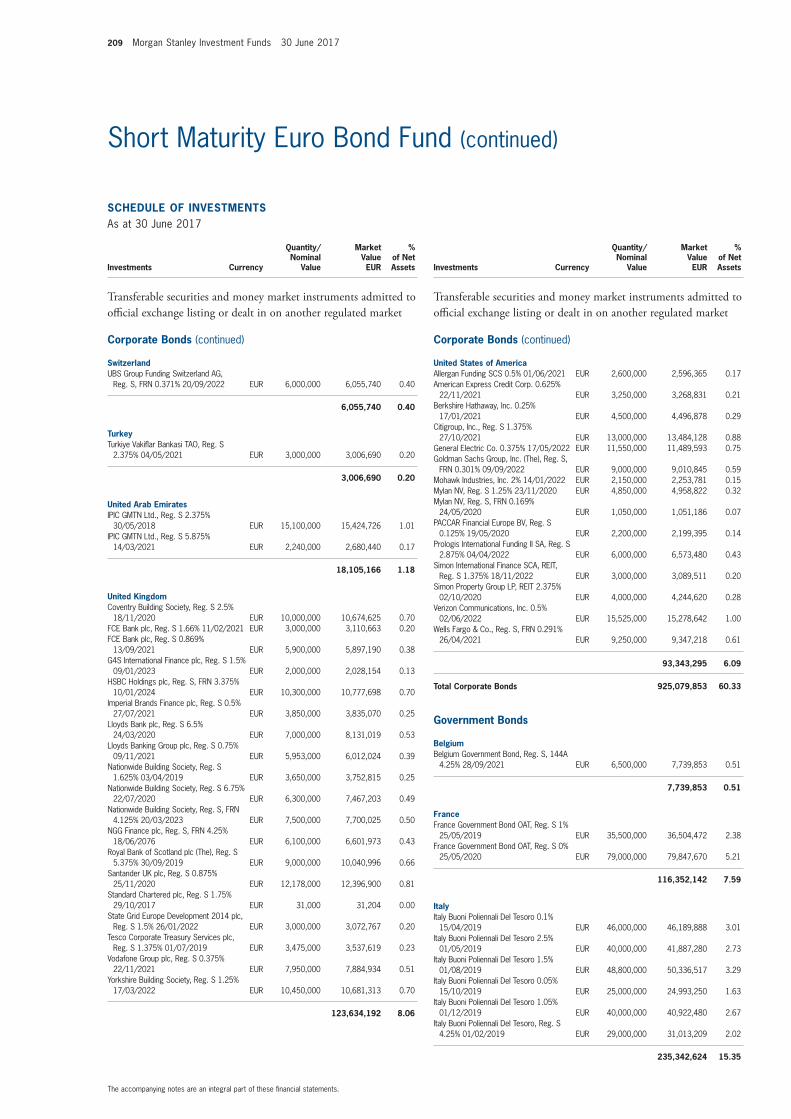
209 Morgan Stanley Investment Funds 30 June 2017
The accompanying notes are an integral part of these fi nancial statements.
Short Maturity Euro Bond Fund (continued)
SCHEDULE OF INVESTMENTSAs at 30 June 2017
Investments Currency
Quantity/Nominal
Value
Market Value EUR
% of Net Assets
Transferable securities and money market instruments admitted to offi cial exchange listing or dealt in on another regulated market
Corporate Bonds (continued)
SwitzerlandUBS Group Funding Switzerland AG,
Reg. S, FRN 0.371% 20/09/2022 EUR 6,000,000 6,055,740 0.40
6,055,740 0.40
TurkeyTurkiye Vakifl ar Bankasi TAO, Reg. S
2.375% 04/05/2021 EUR 3,000,000 3,006,690 0.20
3,006,690 0.20
United Arab EmiratesIPIC GMTN Ltd., Reg. S 2.375%
30/05/2018 EUR 15,100,000 15,424,726 1.01 IPIC GMTN Ltd., Reg. S 5.875%
14/03/2021 EUR 2,240,000 2,680,440 0.17
18,105,166 1.18
United KingdomCoventry Building Society, Reg. S 2.5%
18/11/2020 EUR 10,000,000 10,674,625 0.70 FCE Bank plc, Reg. S 1.66% 11/02/2021 EUR 3,000,000 3,110,663 0.20 FCE Bank plc, Reg. S 0.869%
13/09/2021 EUR 5,900,000 5,897,190 0.38 G4S International Finance plc, Reg. S 1.5%
09/01/2023 EUR 2,000,000 2,028,154 0.13 HSBC Holdings plc, Reg. S, FRN 3.375%
10/01/2024 EUR 10,300,000 10,777,698 0.70 Imperial Brands Finance plc, Reg. S 0.5%
27/07/2021 EUR 3,850,000 3,835,070 0.25 Lloyds Bank plc, Reg. S 6.5%
24/03/2020 EUR 7,000,000 8,131,019 0.53 Lloyds Banking Group plc, Reg. S 0.75%
09/11/2021 EUR 5,953,000 6,012,024 0.39 Nationwide Building Society, Reg. S
1.625% 03/04/2019 EUR 3,650,000 3,752,815 0.25 Nationwide Building Society, Reg. S 6.75%
22/07/2020 EUR 6,300,000 7,467,203 0.49 Nationwide Building Society, Reg. S, FRN
4.125% 20/03/2023 EUR 7,500,000 7,700,025 0.50 NGG Finance plc, Reg. S, FRN 4.25%
18/06/2076 EUR 6,100,000 6,601,973 0.43 Royal Bank of Scotland plc (The), Reg. S
5.375% 30/09/2019 EUR 9,000,000 10,040,996 0.66 Santander UK plc, Reg. S 0.875%
25/11/2020 EUR 12,178,000 12,396,900 0.81 Standard Chartered plc, Reg. S 1.75%
29/10/2017 EUR 31,000 31,204 0.00 State Grid Europe Development 2014 plc,
Reg. S 1.5% 26/01/2022 EUR 3,000,000 3,072,767 0.20 Tesco Corporate Treasury Services plc,
Reg. S 1.375% 01/07/2019 EUR 3,475,000 3,537,619 0.23 Vodafone Group plc, Reg. S 0.375%
22/11/2021 EUR 7,950,000 7,884,934 0.51 Yorkshire Building Society, Reg. S 1.25%
17/03/2022 EUR 10,450,000 10,681,313 0.70
123,634,192 8.06
SCHEDULE OF INVESTMENTSAs at 30 June 2017
Investments Currency
Quantity/Nominal
Value
Market Value EUR
% of Net Assets
Transferable securities and money market instruments admitted to offi cial exchange listing or dealt in on another regulated market
Corporate Bonds (continued)
United States of AmericaAllergan Funding SCS 0.5% 01/06/2021 EUR 2,600,000 2,596,365 0.17 American Express Credit Corp. 0.625%
22/11/2021 EUR 3,250,000 3,268,831 0.21 Berkshire Hathaway, Inc. 0.25%
17/01/2021 EUR 4,500,000 4,496,878 0.29 Citigroup, Inc., Reg. S 1.375%
27/10/2021 EUR 13,000,000 13,484,128 0.88 General Electric Co. 0.375% 17/05/2022 EUR 11,550,000 11,489,593 0.75 Goldman Sachs Group, Inc. (The), Reg. S,
FRN 0.301% 09/09/2022 EUR 9,000,000 9,010,845 0.59 Mohawk Industries, Inc. 2% 14/01/2022 EUR 2,150,000 2,253,781 0.15 Mylan NV, Reg. S 1.25% 23/11/2020 EUR 4,850,000 4,958,822 0.32 Mylan NV, Reg. S, FRN 0.169%
24/05/2020 EUR 1,050,000 1,051,186 0.07 PACCAR Financial Europe BV, Reg. S
0.125% 19/05/2020 EUR 2,200,000 2,199,395 0.14 Prologis International Funding II SA, Reg. S
2.875% 04/04/2022 EUR 6,000,000 6,573,480 0.43 Simon International Finance SCA, REIT,
Reg. S 1.375% 18/11/2022 EUR 3,000,000 3,089,511 0.20 Simon Property Group LP, REIT 2.375%
02/10/2020 EUR 4,000,000 4,244,620 0.28 Verizon Communications, Inc. 0.5%
02/06/2022 EUR 15,525,000 15,278,642 1.00 Wells Fargo & Co., Reg. S, FRN 0.291%
26/04/2021 EUR 9,250,000 9,347,218 0.61
93,343,295 6.09
Total Corporate Bonds 925,079,853 60.33
Government Bonds
BelgiumBelgium Government Bond, Reg. S, 144A
4.25% 28/09/2021 EUR 6,500,000 7,739,853 0.51
7,739,853 0.51
FranceFrance Government Bond OAT, Reg. S 1%
25/05/2019 EUR 35,500,000 36,504,472 2.38 France Government Bond OAT, Reg. S 0%
25/05/2020 EUR 79,000,000 79,847,670 5.21
116,352,142 7.59
ItalyItaly Buoni Poliennali Del Tesoro 0.1%
15/04/2019 EUR 46,000,000 46,189,888 3.01 Italy Buoni Poliennali Del Tesoro 2.5%
01/05/2019 EUR 40,000,000 41,887,280 2.73 Italy Buoni Poliennali Del Tesoro 1.5%
01/08/2019 EUR 48,800,000 50,336,517 3.29 Italy Buoni Poliennali Del Tesoro 0.05%
15/10/2019 EUR 25,000,000 24,993,250 1.63 Italy Buoni Poliennali Del Tesoro 1.05%
01/12/2019 EUR 40,000,000 40,922,480 2.67 Italy Buoni Poliennali Del Tesoro, Reg. S
4.25% 01/02/2019 EUR 29,000,000 31,013,209 2.02
235,342,624 15.35
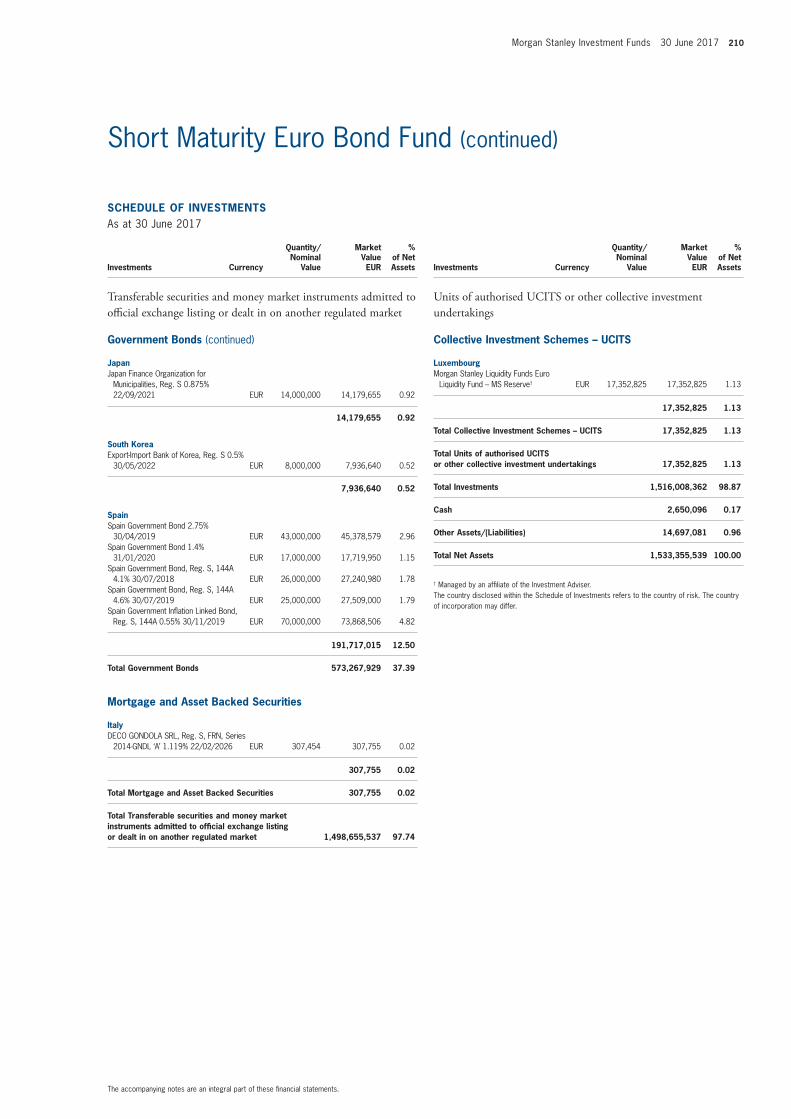
Morgan Stanley Investment Funds 30 June 2017 210
The accompanying notes are an integral part of these fi nancial statements.
Short Maturity Euro Bond Fund (continued)
SCHEDULE OF INVESTMENTSAs at 30 June 2017
Investments Currency
Quantity/Nominal
Value
Market Value EUR
% of Net Assets
Transferable securities and money market instruments admitted to offi cial exchange listing or dealt in on another regulated market
Government Bonds (continued)
JapanJapan Finance Organization for
Municipalities, Reg. S 0.875% 22/09/2021 EUR 14,000,000 14,179,655 0.92
14,179,655 0.92
South KoreaExport-Import Bank of Korea, Reg. S 0.5%
30/05/2022 EUR 8,000,000 7,936,640 0.52
7,936,640 0.52
SpainSpain Government Bond 2.75%
30/04/2019 EUR 43,000,000 45,378,579 2.96 Spain Government Bond 1.4%
31/01/2020 EUR 17,000,000 17,719,950 1.15 Spain Government Bond, Reg. S, 144A
4.1% 30/07/2018 EUR 26,000,000 27,240,980 1.78 Spain Government Bond, Reg. S, 144A
4.6% 30/07/2019 EUR 25,000,000 27,509,000 1.79 Spain Government Infl ation Linked Bond,
Reg. S, 144A 0.55% 30/11/2019 EUR 70,000,000 73,868,506 4.82
191,717,015 12.50
Total Government Bonds 573,267,929 37.39
Mortgage and Asset Backed Securities
ItalyDECO GONDOLA SRL, Reg. S, FRN, Series
2014-GNDL ‘A’ 1.119% 22/02/2026 EUR 307,454 307,755 0.02
307,755 0.02
Total Mortgage and Asset Backed Securities 307,755 0.02
Total Transferable securities and money market instruments admitted to offi cial exchange listing or dealt in on another regulated market 1,498,655,537 97.74
SCHEDULE OF INVESTMENTSAs at 30 June 2017
Investments Currency
Quantity/Nominal
Value
Market Value EUR
% of Net Assets
Units of authorised UCITS or other collective investment undertakings
Collective Investment Schemes – UCITS
LuxembourgMorgan Stanley Liquidity Funds Euro
Liquidity Fund – MS Reserve† EUR 17,352,825 17,352,825 1.13
17,352,825 1.13
Total Collective Investment Schemes – UCITS 17,352,825 1.13
Total Units of authorised UCITS or other collective investment undertakings 17,352,825 1.13
Total Investments 1,516,008,362 98.87
Cash 2,650,096 0.17
Other Assets/(Liabilities) 14,697,081 0.96
Total Net Assets 1,533,355,539 100.00
† Managed by an affi liate of the Investment Adviser.The country disclosed within the Schedule of Investments refers to the country of risk. The country of incorporation may differ.
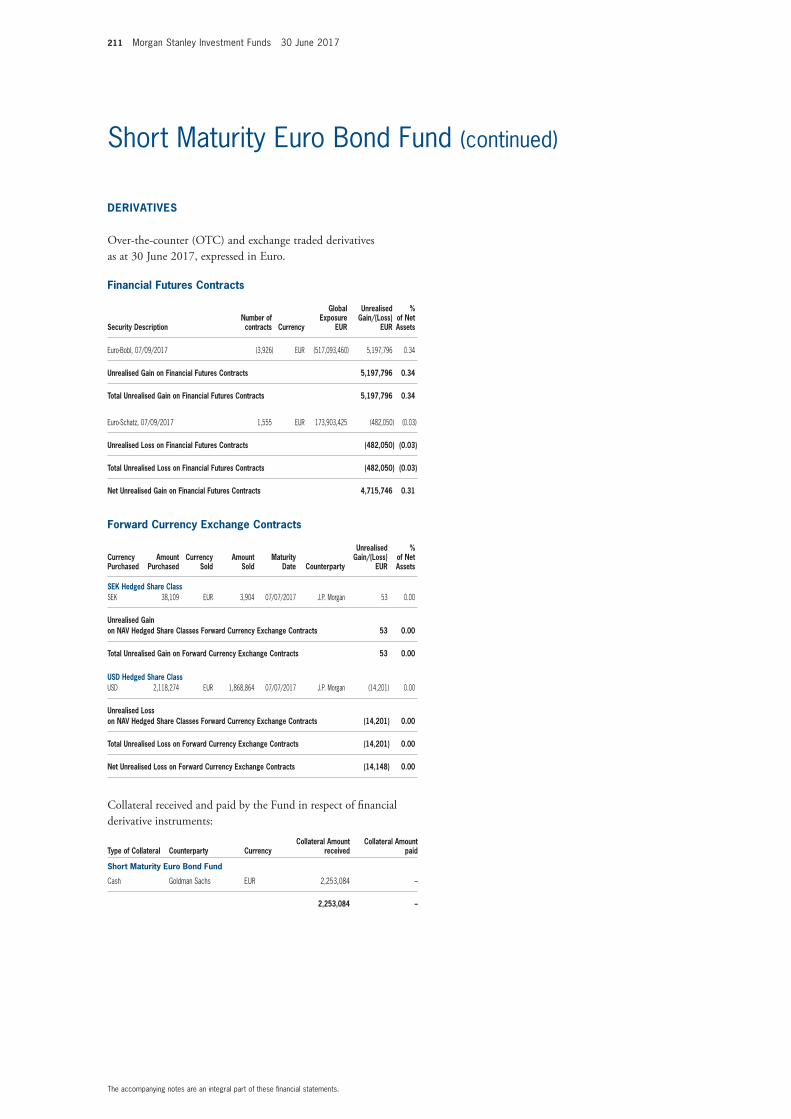
211 Morgan Stanley Investment Funds 30 June 2017
The accompanying notes are an integral part of these fi nancial statements.
Short Maturity Euro Bond Fund (continued)
Financial Futures Contracts
Security DescriptionNumber of contracts Currency
Global Exposure
EUR
Unrealised Gain/(Loss)
EUR
% of Net Assets
Euro-Bobl, 07/09/2017 (3,926) EUR (517,093,460) 5,197,796 0.34
Unrealised Gain on Financial Futures Contracts 5,197,796 0.34
Total Unrealised Gain on Financial Futures Contracts 5,197,796 0.34
Euro-Schatz, 07/09/2017 1,555 EUR 173,903,425 (482,050) (0.03)
Unrealised Loss on Financial Futures Contracts (482,050) (0.03)
Total Unrealised Loss on Financial Futures Contracts (482,050) (0.03)
Net Unrealised Gain on Financial Futures Contracts 4,715,746 0.31
Forward Currency Exchange Contracts
Currency Purchased
Amount Purchased
Currency Sold
Amount Sold
Maturity Date Counterparty
Unrealised Gain/(Loss)
EUR
% of Net Assets
SEK Hedged Share ClassSEK 38,109 EUR 3,904 07/07/2017 J.P. Morgan 53 0.00
Unrealised Gain on NAV Hedged Share Classes Forward Currency Exchange Contracts 53 0.00
Total Unrealised Gain on Forward Currency Exchange Contracts 53 0.00
USD Hedged Share ClassUSD 2,118,274 EUR 1,868,864 07/07/2017 J.P. Morgan (14,201) 0.00
Unrealised Loss on NAV Hedged Share Classes Forward Currency Exchange Contracts (14,201) 0.00
Total Unrealised Loss on Forward Currency Exchange Contracts (14,201) 0.00
Net Unrealised Loss on Forward Currency Exchange Contracts (14,148) 0.00
Collateral received and paid by the Fund in respect of fi nancial derivative instruments:
Type of Collateral Counterparty CurrencyCollateral Amount
receivedCollateral Amount
paid
Short Maturity Euro Bond Fund
Cash Goldman Sachs EUR 2,253,084 –
2,253,084 –
DERIVATIVES
Over-the-counter (OTC) and exchange traded derivatives as at 30 June 2017, expressed in Euro.
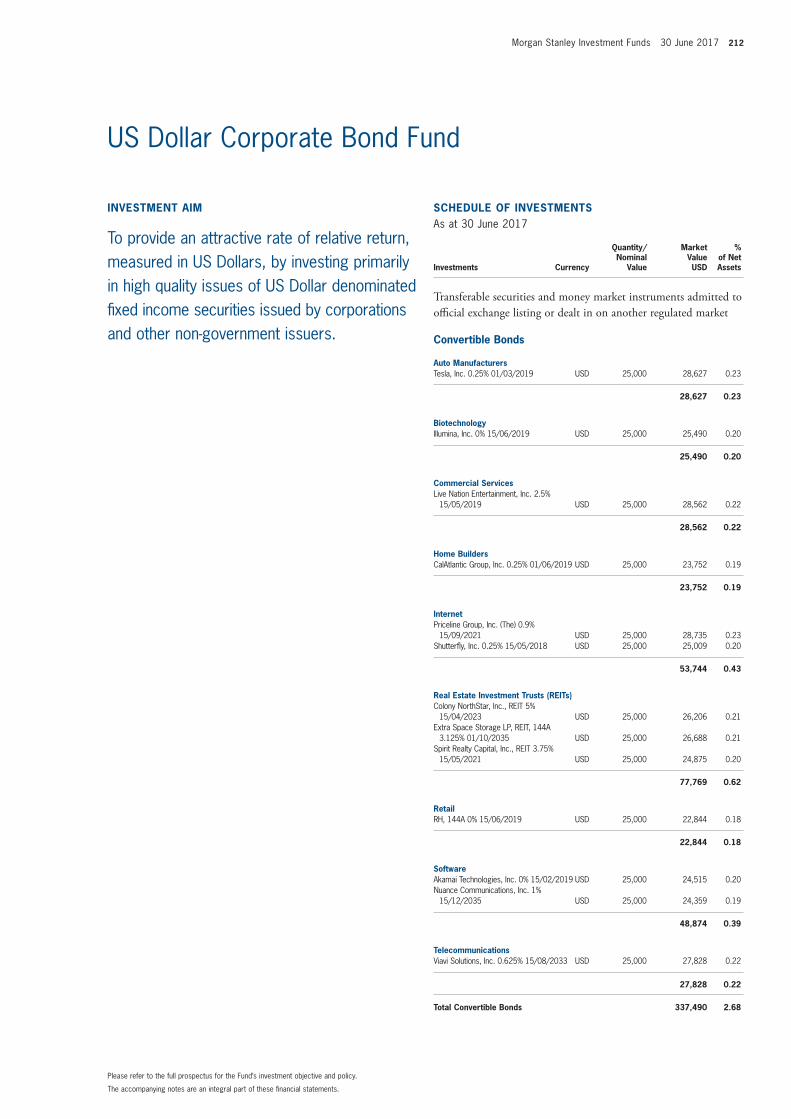
Morgan Stanley Investment Funds 30 June 2017 212
The accompanying notes are an integral part of these fi nancial statements.
Please refer to the full prospectus for the Fund’s investment objective and policy.
INVESTMENT AIM
To provide an attractive rate of relative return, measured in US Dollars, by investing primarily in high quality issues of US Dollar denominated fi xed income securities issued by corporations and other non-government issuers.
US Dollar Corporate Bond Fund
SCHEDULE OF INVESTMENTSAs at 30 June 2017
Investments Currency
Quantity/Nominal
Value
Market Value USD
% of Net Assets
Transferable securities and money market instruments admitted to offi cial exchange listing or dealt in on another regulated market
Convertible Bonds
Auto ManufacturersTesla, Inc. 0.25% 01/03/2019 USD 25,000 28,627 0.23
28,627 0.23
BiotechnologyIllumina, Inc. 0% 15/06/2019 USD 25,000 25,490 0.20
25,490 0.20
Commercial ServicesLive Nation Entertainment, Inc. 2.5%
15/05/2019 USD 25,000 28,562 0.22
28,562 0.22
Home BuildersCalAtlantic Group, Inc. 0.25% 01/06/2019 USD 25,000 23,752 0.19
23,752 0.19
InternetPriceline Group, Inc. (The) 0.9%
15/09/2021 USD 25,000 28,735 0.23 Shutterfl y, Inc. 0.25% 15/05/2018 USD 25,000 25,009 0.20
53,744 0.43
Real Estate Investment Trusts (REITs)Colony NorthStar, Inc., REIT 5%
15/04/2023 USD 25,000 26,206 0.21 Extra Space Storage LP, REIT, 144A
3.125% 01/10/2035 USD 25,000 26,688 0.21 Spirit Realty Capital, Inc., REIT 3.75%
15/05/2021 USD 25,000 24,875 0.20
77,769 0.62
RetailRH, 144A 0% 15/06/2019 USD 25,000 22,844 0.18
22,844 0.18
SoftwareAkamai Technologies, Inc. 0% 15/02/2019 USD 25,000 24,515 0.20 Nuance Communications, Inc. 1%
15/12/2035 USD 25,000 24,359 0.19
48,874 0.39
TelecommunicationsViavi Solutions, Inc. 0.625% 15/08/2033 USD 25,000 27,828 0.22
27,828 0.22
Total Convertible Bonds 337,490 2.68
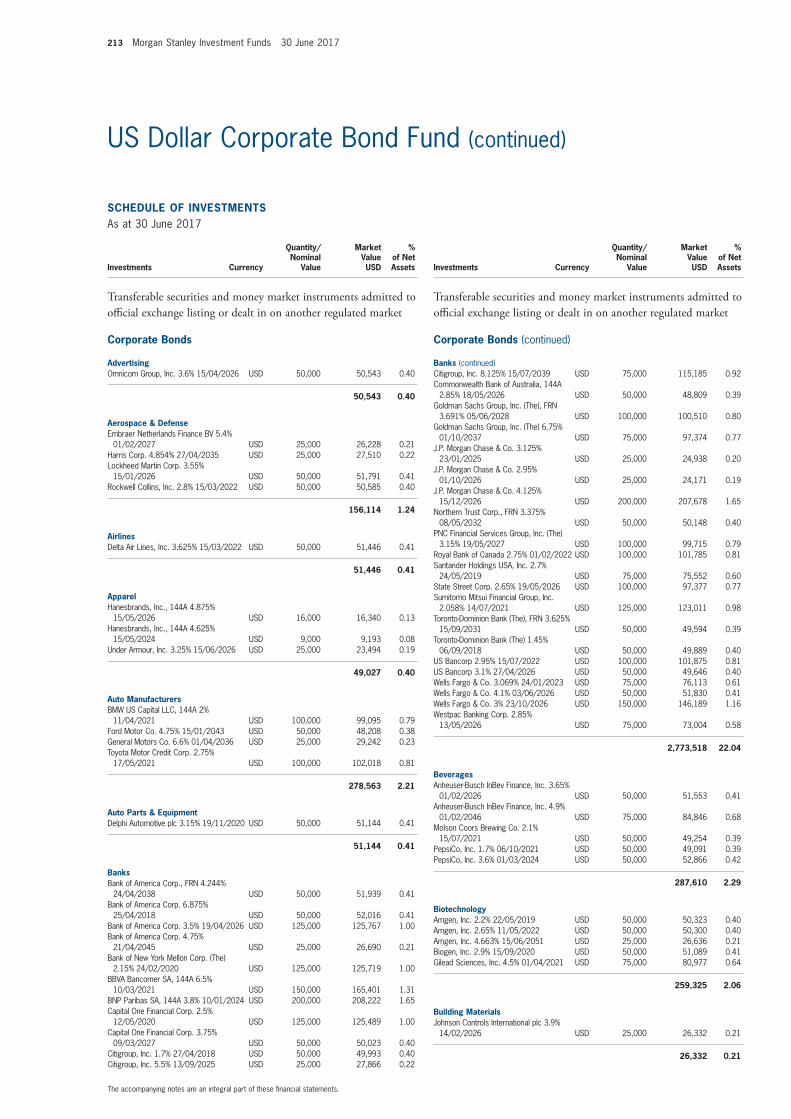
213 Morgan Stanley Investment Funds 30 June 2017
The accompanying notes are an integral part of these fi nancial statements.
US Dollar Corporate Bond Fund (continued)
SCHEDULE OF INVESTMENTSAs at 30 June 2017
Investments Currency
Quantity/Nominal
Value
Market Value USD
% of Net Assets
Transferable securities and money market instruments admitted to offi cial exchange listing or dealt in on another regulated market
Corporate Bonds
AdvertisingOmnicom Group, Inc. 3.6% 15/04/2026 USD 50,000 50,543 0.40
50,543 0.40
Aerospace & DefenseEmbraer Netherlands Finance BV 5.4%
01/02/2027 USD 25,000 26,228 0.21 Harris Corp. 4.854% 27/04/2035 USD 25,000 27,510 0.22 Lockheed Martin Corp. 3.55%
15/01/2026 USD 50,000 51,791 0.41 Rockwell Collins, Inc. 2.8% 15/03/2022 USD 50,000 50,585 0.40
156,114 1.24
AirlinesDelta Air Lines, Inc. 3.625% 15/03/2022 USD 50,000 51,446 0.41
51,446 0.41
ApparelHanesbrands, Inc., 144A 4.875%
15/05/2026 USD 16,000 16,340 0.13 Hanesbrands, Inc., 144A 4.625%
15/05/2024 USD 9,000 9,193 0.08 Under Armour, Inc. 3.25% 15/06/2026 USD 25,000 23,494 0.19
49,027 0.40
Auto ManufacturersBMW US Capital LLC, 144A 2%
11/04/2021 USD 100,000 99,095 0.79 Ford Motor Co. 4.75% 15/01/2043 USD 50,000 48,208 0.38 General Motors Co. 6.6% 01/04/2036 USD 25,000 29,242 0.23 Toyota Motor Credit Corp. 2.75%
17/05/2021 USD 100,000 102,018 0.81
278,563 2.21
Auto Parts & EquipmentDelphi Automotive plc 3.15% 19/11/2020 USD 50,000 51,144 0.41
51,144 0.41
BanksBank of America Corp., FRN 4.244%
24/04/2038 USD 50,000 51,939 0.41 Bank of America Corp. 6.875%
25/04/2018 USD 50,000 52,016 0.41 Bank of America Corp. 3.5% 19/04/2026 USD 125,000 125,767 1.00 Bank of America Corp. 4.75%
21/04/2045 USD 25,000 26,690 0.21 Bank of New York Mellon Corp. (The)
2.15% 24/02/2020 USD 125,000 125,719 1.00 BBVA Bancomer SA, 144A 6.5%
10/03/2021 USD 150,000 165,401 1.31 BNP Paribas SA, 144A 3.8% 10/01/2024 USD 200,000 208,222 1.65 Capital One Financial Corp. 2.5%
12/05/2020 USD 125,000 125,489 1.00 Capital One Financial Corp. 3.75%
09/03/2027 USD 50,000 50,023 0.40 Citigroup, Inc. 1.7% 27/04/2018 USD 50,000 49,993 0.40 Citigroup, Inc. 5.5% 13/09/2025 USD 25,000 27,866 0.22
SCHEDULE OF INVESTMENTSAs at 30 June 2017
Investments Currency
Quantity/Nominal
Value
Market Value USD
% of Net Assets
Transferable securities and money market instruments admitted to offi cial exchange listing or dealt in on another regulated market
Corporate Bonds (continued)
Banks (continued)Citigroup, Inc. 8.125% 15/07/2039 USD 75,000 115,185 0.92 Commonwealth Bank of Australia, 144A
2.85% 18/05/2026 USD 50,000 48,809 0.39 Goldman Sachs Group, Inc. (The), FRN
3.691% 05/06/2028 USD 100,000 100,510 0.80 Goldman Sachs Group, Inc. (The) 6.75%
01/10/2037 USD 75,000 97,374 0.77 J.P. Morgan Chase & Co. 3.125%
23/01/2025 USD 25,000 24,938 0.20 J.P. Morgan Chase & Co. 2.95%
01/10/2026 USD 25,000 24,171 0.19 J.P. Morgan Chase & Co. 4.125%
15/12/2026 USD 200,000 207,678 1.65 Northern Trust Corp., FRN 3.375%
08/05/2032 USD 50,000 50,148 0.40 PNC Financial Services Group, Inc. (The)
3.15% 19/05/2027 USD 100,000 99,715 0.79 Royal Bank of Canada 2.75% 01/02/2022 USD 100,000 101,785 0.81 Santander Holdings USA, Inc. 2.7%
24/05/2019 USD 75,000 75,552 0.60 State Street Corp. 2.65% 19/05/2026 USD 100,000 97,377 0.77 Sumitomo Mitsui Financial Group, Inc.
2.058% 14/07/2021 USD 125,000 123,011 0.98 Toronto-Dominion Bank (The), FRN 3.625%
15/09/2031 USD 50,000 49,594 0.39 Toronto-Dominion Bank (The) 1.45%
06/09/2018 USD 50,000 49,889 0.40 US Bancorp 2.95% 15/07/2022 USD 100,000 101,875 0.81 US Bancorp 3.1% 27/04/2026 USD 50,000 49,646 0.40 Wells Fargo & Co. 3.069% 24/01/2023 USD 75,000 76,113 0.61 Wells Fargo & Co. 4.1% 03/06/2026 USD 50,000 51,830 0.41 Wells Fargo & Co. 3% 23/10/2026 USD 150,000 146,189 1.16 Westpac Banking Corp. 2.85%
13/05/2026 USD 75,000 73,004 0.58
2,773,518 22.04
BeveragesAnheuser-Busch InBev Finance, Inc. 3.65%
01/02/2026 USD 50,000 51,553 0.41 Anheuser-Busch InBev Finance, Inc. 4.9%
01/02/2046 USD 75,000 84,846 0.68 Molson Coors Brewing Co. 2.1%
15/07/2021 USD 50,000 49,254 0.39 PepsiCo, Inc. 1.7% 06/10/2021 USD 50,000 49,091 0.39 PepsiCo, Inc. 3.6% 01/03/2024 USD 50,000 52,866 0.42
287,610 2.29
BiotechnologyAmgen, Inc. 2.2% 22/05/2019 USD 50,000 50,323 0.40 Amgen, Inc. 2.65% 11/05/2022 USD 50,000 50,300 0.40 Amgen, Inc. 4.663% 15/06/2051 USD 25,000 26,636 0.21 Biogen, Inc. 2.9% 15/09/2020 USD 50,000 51,089 0.41 Gilead Sciences, Inc. 4.5% 01/04/2021 USD 75,000 80,977 0.64
259,325 2.06
Building MaterialsJohnson Controls International plc 3.9%
14/02/2026 USD 25,000 26,332 0.21
26,332 0.21
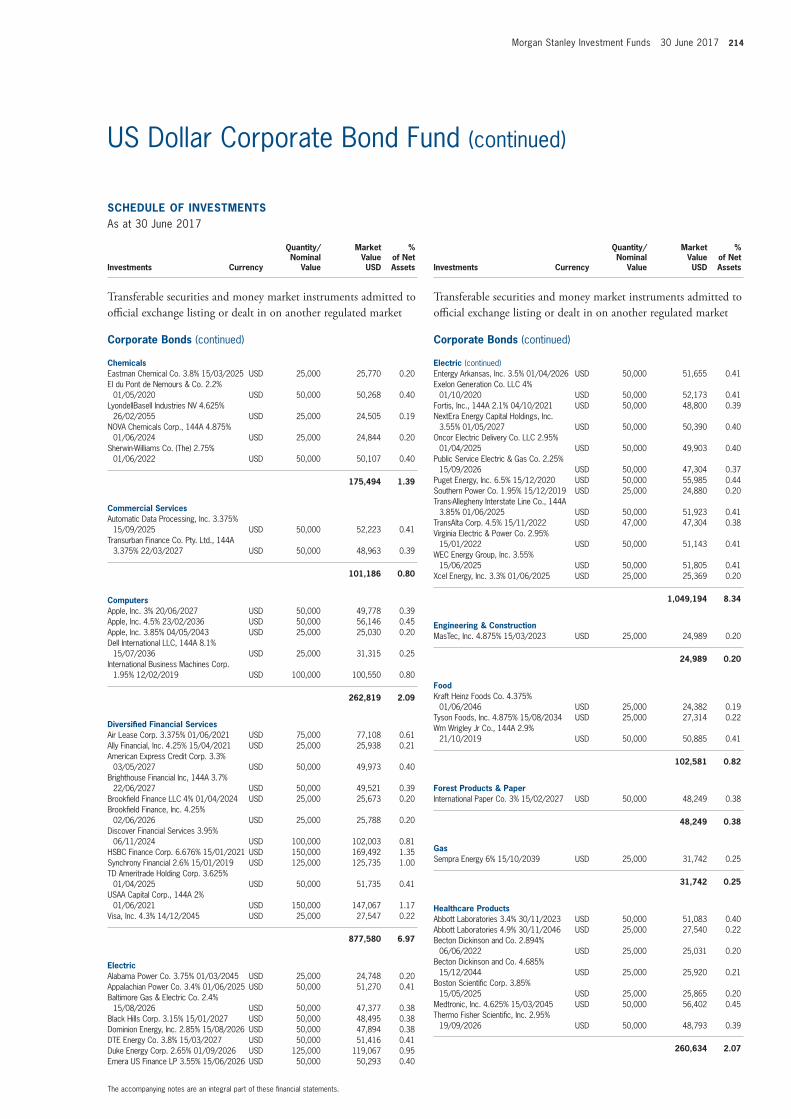
Morgan Stanley Investment Funds 30 June 2017 214
The accompanying notes are an integral part of these fi nancial statements.
US Dollar Corporate Bond Fund (continued)
SCHEDULE OF INVESTMENTSAs at 30 June 2017
Investments Currency
Quantity/Nominal
Value
Market Value USD
% of Net Assets
Transferable securities and money market instruments admitted to offi cial exchange listing or dealt in on another regulated market
Corporate Bonds (continued)
ChemicalsEastman Chemical Co. 3.8% 15/03/2025 USD 25,000 25,770 0.20 EI du Pont de Nemours & Co. 2.2%
01/05/2020 USD 50,000 50,268 0.40 LyondellBasell Industries NV 4.625%
26/02/2055 USD 25,000 24,505 0.19 NOVA Chemicals Corp., 144A 4.875%
01/06/2024 USD 25,000 24,844 0.20 Sherwin-Williams Co. (The) 2.75%
01/06/2022 USD 50,000 50,107 0.40
175,494 1.39
Commercial ServicesAutomatic Data Processing, Inc. 3.375%
15/09/2025 USD 50,000 52,223 0.41 Transurban Finance Co. Pty. Ltd., 144A
3.375% 22/03/2027 USD 50,000 48,963 0.39
101,186 0.80
ComputersApple, Inc. 3% 20/06/2027 USD 50,000 49,778 0.39 Apple, Inc. 4.5% 23/02/2036 USD 50,000 56,146 0.45 Apple, Inc. 3.85% 04/05/2043 USD 25,000 25,030 0.20 Dell International LLC, 144A 8.1%
15/07/2036 USD 25,000 31,315 0.25 International Business Machines Corp.
1.95% 12/02/2019 USD 100,000 100,550 0.80
262,819 2.09
Diversifi ed Financial ServicesAir Lease Corp. 3.375% 01/06/2021 USD 75,000 77,108 0.61 Ally Financial, Inc. 4.25% 15/04/2021 USD 25,000 25,938 0.21 American Express Credit Corp. 3.3%
03/05/2027 USD 50,000 49,973 0.40 Brighthouse Financial Inc, 144A 3.7%
22/06/2027 USD 50,000 49,521 0.39 Brookfi eld Finance LLC 4% 01/04/2024 USD 25,000 25,673 0.20 Brookfi eld Finance, Inc. 4.25%
02/06/2026 USD 25,000 25,788 0.20 Discover Financial Services 3.95%
06/11/2024 USD 100,000 102,003 0.81 HSBC Finance Corp. 6.676% 15/01/2021 USD 150,000 169,492 1.35 Synchrony Financial 2.6% 15/01/2019 USD 125,000 125,735 1.00 TD Ameritrade Holding Corp. 3.625%
01/04/2025 USD 50,000 51,735 0.41 USAA Capital Corp., 144A 2%
01/06/2021 USD 150,000 147,067 1.17 Visa, Inc. 4.3% 14/12/2045 USD 25,000 27,547 0.22
877,580 6.97
ElectricAlabama Power Co. 3.75% 01/03/2045 USD 25,000 24,748 0.20 Appalachian Power Co. 3.4% 01/06/2025 USD 50,000 51,270 0.41 Baltimore Gas & Electric Co. 2.4%
15/08/2026 USD 50,000 47,377 0.38 Black Hills Corp. 3.15% 15/01/2027 USD 50,000 48,495 0.38 Dominion Energy, Inc. 2.85% 15/08/2026 USD 50,000 47,894 0.38 DTE Energy Co. 3.8% 15/03/2027 USD 50,000 51,416 0.41 Duke Energy Corp. 2.65% 01/09/2026 USD 125,000 119,067 0.95 Emera US Finance LP 3.55% 15/06/2026 USD 50,000 50,293 0.40
SCHEDULE OF INVESTMENTSAs at 30 June 2017
Investments Currency
Quantity/Nominal
Value
Market Value USD
% of Net Assets
Transferable securities and money market instruments admitted to offi cial exchange listing or dealt in on another regulated market
Corporate Bonds (continued)
Electric (continued)Entergy Arkansas, Inc. 3.5% 01/04/2026 USD 50,000 51,655 0.41 Exelon Generation Co. LLC 4%
01/10/2020 USD 50,000 52,173 0.41 Fortis, Inc., 144A 2.1% 04/10/2021 USD 50,000 48,800 0.39 NextEra Energy Capital Holdings, Inc.
3.55% 01/05/2027 USD 50,000 50,390 0.40 Oncor Electric Delivery Co. LLC 2.95%
01/04/2025 USD 50,000 49,903 0.40 Public Service Electric & Gas Co. 2.25%
15/09/2026 USD 50,000 47,304 0.37 Puget Energy, Inc. 6.5% 15/12/2020 USD 50,000 55,985 0.44 Southern Power Co. 1.95% 15/12/2019 USD 25,000 24,880 0.20 Trans-Allegheny Interstate Line Co., 144A
3.85% 01/06/2025 USD 50,000 51,923 0.41 TransAlta Corp. 4.5% 15/11/2022 USD 47,000 47,304 0.38 Virginia Electric & Power Co. 2.95%
15/01/2022 USD 50,000 51,143 0.41 WEC Energy Group, Inc. 3.55%
15/06/2025 USD 50,000 51,805 0.41 Xcel Energy, Inc. 3.3% 01/06/2025 USD 25,000 25,369 0.20
1,049,194 8.34
Engineering & ConstructionMasTec, Inc. 4.875% 15/03/2023 USD 25,000 24,989 0.20
24,989 0.20
FoodKraft Heinz Foods Co. 4.375%
01/06/2046 USD 25,000 24,382 0.19 Tyson Foods, Inc. 4.875% 15/08/2034 USD 25,000 27,314 0.22 Wm Wrigley Jr Co., 144A 2.9%
21/10/2019 USD 50,000 50,885 0.41
102,581 0.82
Forest Products & PaperInternational Paper Co. 3% 15/02/2027 USD 50,000 48,249 0.38
48,249 0.38
GasSempra Energy 6% 15/10/2039 USD 25,000 31,742 0.25
31,742 0.25
Healthcare ProductsAbbott Laboratories 3.4% 30/11/2023 USD 50,000 51,083 0.40 Abbott Laboratories 4.9% 30/11/2046 USD 25,000 27,540 0.22 Becton Dickinson and Co. 2.894%
06/06/2022 USD 25,000 25,031 0.20 Becton Dickinson and Co. 4.685%
15/12/2044 USD 25,000 25,920 0.21 Boston Scientifi c Corp. 3.85%
15/05/2025 USD 25,000 25,865 0.20 Medtronic, Inc. 4.625% 15/03/2045 USD 50,000 56,402 0.45 Thermo Fisher Scientifi c, Inc. 2.95%
19/09/2026 USD 50,000 48,793 0.39
260,634 2.07
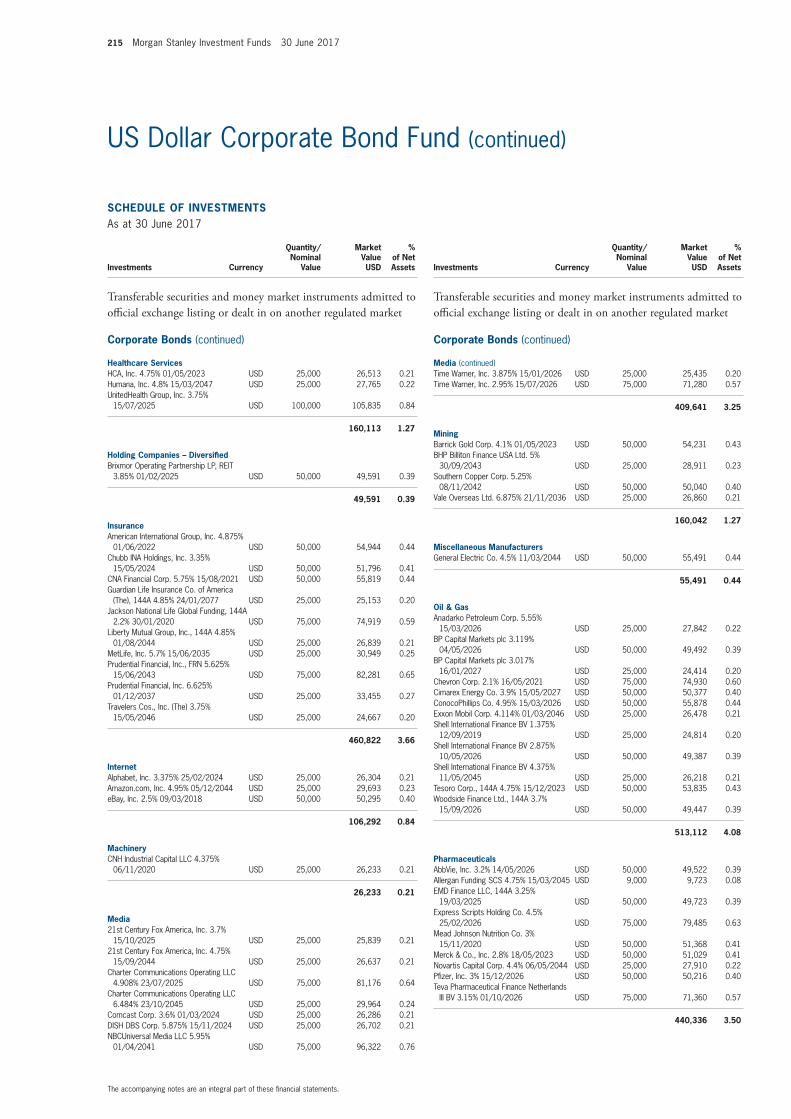
215 Morgan Stanley Investment Funds 30 June 2017
The accompanying notes are an integral part of these fi nancial statements.
US Dollar Corporate Bond Fund (continued)
SCHEDULE OF INVESTMENTSAs at 30 June 2017
Investments Currency
Quantity/Nominal
Value
Market Value USD
% of Net Assets
Transferable securities and money market instruments admitted to offi cial exchange listing or dealt in on another regulated market
Corporate Bonds (continued)
Healthcare ServicesHCA, Inc. 4.75% 01/05/2023 USD 25,000 26,513 0.21 Humana, Inc. 4.8% 15/03/2047 USD 25,000 27,765 0.22 UnitedHealth Group, Inc. 3.75%
15/07/2025 USD 100,000 105,835 0.84
160,113 1.27
Holding Companies – Diversifi edBrixmor Operating Partnership LP, REIT
3.85% 01/02/2025 USD 50,000 49,591 0.39
49,591 0.39
InsuranceAmerican International Group, Inc. 4.875%
01/06/2022 USD 50,000 54,944 0.44 Chubb INA Holdings, Inc. 3.35%
15/05/2024 USD 50,000 51,796 0.41 CNA Financial Corp. 5.75% 15/08/2021 USD 50,000 55,819 0.44 Guardian Life Insurance Co. of America
(The), 144A 4.85% 24/01/2077 USD 25,000 25,153 0.20 Jackson National Life Global Funding, 144A
2.2% 30/01/2020 USD 75,000 74,919 0.59 Liberty Mutual Group, Inc., 144A 4.85%
01/08/2044 USD 25,000 26,839 0.21 MetLife, Inc. 5.7% 15/06/2035 USD 25,000 30,949 0.25 Prudential Financial, Inc., FRN 5.625%
15/06/2043 USD 75,000 82,281 0.65 Prudential Financial, Inc. 6.625%
01/12/2037 USD 25,000 33,455 0.27 Travelers Cos., Inc. (The) 3.75%
15/05/2046 USD 25,000 24,667 0.20
460,822 3.66
InternetAlphabet, Inc. 3.375% 25/02/2024 USD 25,000 26,304 0.21 Amazon.com, Inc. 4.95% 05/12/2044 USD 25,000 29,693 0.23 eBay, Inc. 2.5% 09/03/2018 USD 50,000 50,295 0.40
106,292 0.84
MachineryCNH Industrial Capital LLC 4.375%
06/11/2020 USD 25,000 26,233 0.21
26,233 0.21
Media21st Century Fox America, Inc. 3.7%
15/10/2025 USD 25,000 25,839 0.21 21st Century Fox America, Inc. 4.75%
15/09/2044 USD 25,000 26,637 0.21 Charter Communications Operating LLC
4.908% 23/07/2025 USD 75,000 81,176 0.64 Charter Communications Operating LLC
6.484% 23/10/2045 USD 25,000 29,964 0.24 Comcast Corp. 3.6% 01/03/2024 USD 25,000 26,286 0.21 DISH DBS Corp. 5.875% 15/11/2024 USD 25,000 26,702 0.21 NBCUniversal Media LLC 5.95%
01/04/2041 USD 75,000 96,322 0.76
SCHEDULE OF INVESTMENTSAs at 30 June 2017
Investments Currency
Quantity/Nominal
Value
Market Value USD
% of Net Assets
Transferable securities and money market instruments admitted to offi cial exchange listing or dealt in on another regulated market
Corporate Bonds (continued)
Media (continued)Time Warner, Inc. 3.875% 15/01/2026 USD 25,000 25,435 0.20 Time Warner, Inc. 2.95% 15/07/2026 USD 75,000 71,280 0.57
409,641 3.25
MiningBarrick Gold Corp. 4.1% 01/05/2023 USD 50,000 54,231 0.43 BHP Billiton Finance USA Ltd. 5%
30/09/2043 USD 25,000 28,911 0.23 Southern Copper Corp. 5.25%
08/11/2042 USD 50,000 50,040 0.40 Vale Overseas Ltd. 6.875% 21/11/2036 USD 25,000 26,860 0.21
160,042 1.27
Miscellaneous ManufacturersGeneral Electric Co. 4.5% 11/03/2044 USD 50,000 55,491 0.44
55,491 0.44
Oil & GasAnadarko Petroleum Corp. 5.55%
15/03/2026 USD 25,000 27,842 0.22 BP Capital Markets plc 3.119%
04/05/2026 USD 50,000 49,492 0.39 BP Capital Markets plc 3.017%
16/01/2027 USD 25,000 24,414 0.20 Chevron Corp. 2.1% 16/05/2021 USD 75,000 74,930 0.60 Cimarex Energy Co. 3.9% 15/05/2027 USD 50,000 50,377 0.40 ConocoPhillips Co. 4.95% 15/03/2026 USD 50,000 55,878 0.44 Exxon Mobil Corp. 4.114% 01/03/2046 USD 25,000 26,478 0.21 Shell International Finance BV 1.375%
12/09/2019 USD 25,000 24,814 0.20 Shell International Finance BV 2.875%
10/05/2026 USD 50,000 49,387 0.39 Shell International Finance BV 4.375%
11/05/2045 USD 25,000 26,218 0.21 Tesoro Corp., 144A 4.75% 15/12/2023 USD 50,000 53,835 0.43 Woodside Finance Ltd., 144A 3.7%
15/09/2026 USD 50,000 49,447 0.39
513,112 4.08
PharmaceuticalsAbbVie, Inc. 3.2% 14/05/2026 USD 50,000 49,522 0.39 Allergan Funding SCS 4.75% 15/03/2045 USD 9,000 9,723 0.08 EMD Finance LLC, 144A 3.25%
19/03/2025 USD 50,000 49,723 0.39 Express Scripts Holding Co. 4.5%
25/02/2026 USD 75,000 79,485 0.63 Mead Johnson Nutrition Co. 3%
15/11/2020 USD 50,000 51,368 0.41 Merck & Co., Inc. 2.8% 18/05/2023 USD 50,000 51,029 0.41 Novartis Capital Corp. 4.4% 06/05/2044 USD 25,000 27,910 0.22 Pfi zer, Inc. 3% 15/12/2026 USD 50,000 50,216 0.40 Teva Pharmaceutical Finance Netherlands
III BV 3.15% 01/10/2026 USD 75,000 71,360 0.57
440,336 3.50
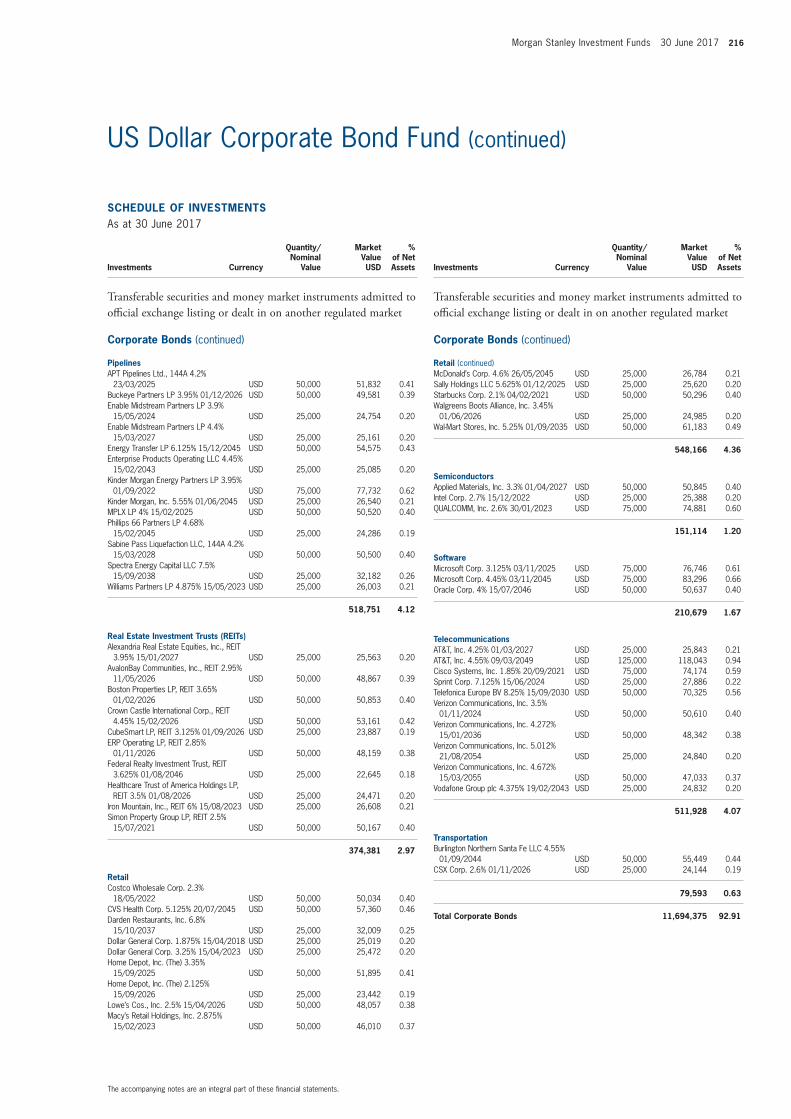
Morgan Stanley Investment Funds 30 June 2017 216
The accompanying notes are an integral part of these fi nancial statements.
US Dollar Corporate Bond Fund (continued)
SCHEDULE OF INVESTMENTSAs at 30 June 2017
Investments Currency
Quantity/Nominal
Value
Market Value USD
% of Net Assets
Transferable securities and money market instruments admitted to offi cial exchange listing or dealt in on another regulated market
Corporate Bonds (continued)
PipelinesAPT Pipelines Ltd., 144A 4.2%
23/03/2025 USD 50,000 51,832 0.41 Buckeye Partners LP 3.95% 01/12/2026 USD 50,000 49,581 0.39 Enable Midstream Partners LP 3.9%
15/05/2024 USD 25,000 24,754 0.20 Enable Midstream Partners LP 4.4%
15/03/2027 USD 25,000 25,161 0.20 Energy Transfer LP 6.125% 15/12/2045 USD 50,000 54,575 0.43 Enterprise Products Operating LLC 4.45%
15/02/2043 USD 25,000 25,085 0.20 Kinder Morgan Energy Partners LP 3.95%
01/09/2022 USD 75,000 77,732 0.62 Kinder Morgan, Inc. 5.55% 01/06/2045 USD 25,000 26,540 0.21 MPLX LP 4% 15/02/2025 USD 50,000 50,520 0.40 Phillips 66 Partners LP 4.68%
15/02/2045 USD 25,000 24,286 0.19 Sabine Pass Liquefaction LLC, 144A 4.2%
15/03/2028 USD 50,000 50,500 0.40 Spectra Energy Capital LLC 7.5%
15/09/2038 USD 25,000 32,182 0.26 Williams Partners LP 4.875% 15/05/2023 USD 25,000 26,003 0.21
518,751 4.12
Real Estate Investment Trusts (REITs)Alexandria Real Estate Equities, Inc., REIT
3.95% 15/01/2027 USD 25,000 25,563 0.20 AvalonBay Communities, Inc., REIT 2.95%
11/05/2026 USD 50,000 48,867 0.39 Boston Properties LP, REIT 3.65%
01/02/2026 USD 50,000 50,853 0.40 Crown Castle International Corp., REIT
4.45% 15/02/2026 USD 50,000 53,161 0.42 CubeSmart LP, REIT 3.125% 01/09/2026 USD 25,000 23,887 0.19 ERP Operating LP, REIT 2.85%
01/11/2026 USD 50,000 48,159 0.38 Federal Realty Investment Trust, REIT
3.625% 01/08/2046 USD 25,000 22,645 0.18 Healthcare Trust of America Holdings LP,
REIT 3.5% 01/08/2026 USD 25,000 24,471 0.20 Iron Mountain, Inc., REIT 6% 15/08/2023 USD 25,000 26,608 0.21 Simon Property Group LP, REIT 2.5%
15/07/2021 USD 50,000 50,167 0.40
374,381 2.97
RetailCostco Wholesale Corp. 2.3%
18/05/2022 USD 50,000 50,034 0.40 CVS Health Corp. 5.125% 20/07/2045 USD 50,000 57,360 0.46 Darden Restaurants, Inc. 6.8%
15/10/2037 USD 25,000 32,009 0.25 Dollar General Corp. 1.875% 15/04/2018 USD 25,000 25,019 0.20 Dollar General Corp. 3.25% 15/04/2023 USD 25,000 25,472 0.20 Home Depot, Inc. (The) 3.35%
15/09/2025 USD 50,000 51,895 0.41 Home Depot, Inc. (The) 2.125%
15/09/2026 USD 25,000 23,442 0.19 Lowe’s Cos., Inc. 2.5% 15/04/2026 USD 50,000 48,057 0.38 Macy’s Retail Holdings, Inc. 2.875%
15/02/2023 USD 50,000 46,010 0.37
SCHEDULE OF INVESTMENTSAs at 30 June 2017
Investments Currency
Quantity/Nominal
Value
Market Value USD
% of Net Assets
Transferable securities and money market instruments admitted to offi cial exchange listing or dealt in on another regulated market
Corporate Bonds (continued)
Retail (continued)McDonald’s Corp. 4.6% 26/05/2045 USD 25,000 26,784 0.21 Sally Holdings LLC 5.625% 01/12/2025 USD 25,000 25,620 0.20 Starbucks Corp. 2.1% 04/02/2021 USD 50,000 50,296 0.40 Walgreens Boots Alliance, Inc. 3.45%
01/06/2026 USD 25,000 24,985 0.20 Wal-Mart Stores, Inc. 5.25% 01/09/2035 USD 50,000 61,183 0.49
548,166 4.36
SemiconductorsApplied Materials, Inc. 3.3% 01/04/2027 USD 50,000 50,845 0.40 Intel Corp. 2.7% 15/12/2022 USD 25,000 25,388 0.20 QUALCOMM, Inc. 2.6% 30/01/2023 USD 75,000 74,881 0.60
151,114 1.20
SoftwareMicrosoft Corp. 3.125% 03/11/2025 USD 75,000 76,746 0.61 Microsoft Corp. 4.45% 03/11/2045 USD 75,000 83,296 0.66 Oracle Corp. 4% 15/07/2046 USD 50,000 50,637 0.40
210,679 1.67
TelecommunicationsAT&T, Inc. 4.25% 01/03/2027 USD 25,000 25,843 0.21 AT&T, Inc. 4.55% 09/03/2049 USD 125,000 118,043 0.94 Cisco Systems, Inc. 1.85% 20/09/2021 USD 75,000 74,174 0.59 Sprint Corp. 7.125% 15/06/2024 USD 25,000 27,886 0.22 Telefonica Europe BV 8.25% 15/09/2030 USD 50,000 70,325 0.56 Verizon Communications, Inc. 3.5%
01/11/2024 USD 50,000 50,610 0.40 Verizon Communications, Inc. 4.272%
15/01/2036 USD 50,000 48,342 0.38 Verizon Communications, Inc. 5.012%
21/08/2054 USD 25,000 24,840 0.20 Verizon Communications, Inc. 4.672%
15/03/2055 USD 50,000 47,033 0.37 Vodafone Group plc 4.375% 19/02/2043 USD 25,000 24,832 0.20
511,928 4.07
TransportationBurlington Northern Santa Fe LLC 4.55%
01/09/2044 USD 50,000 55,449 0.44 CSX Corp. 2.6% 01/11/2026 USD 25,000 24,144 0.19
79,593 0.63
Total Corporate Bonds 11,694,375 92.91
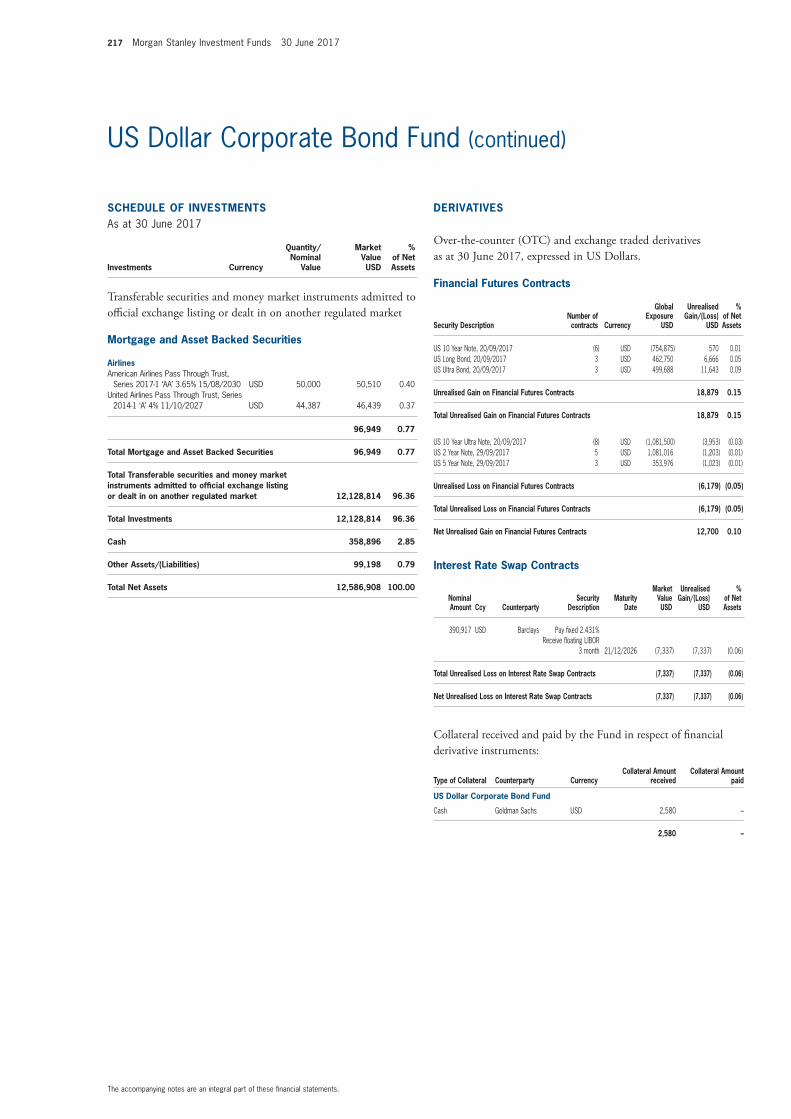
217 Morgan Stanley Investment Funds 30 June 2017
The accompanying notes are an integral part of these fi nancial statements.
US Dollar Corporate Bond Fund (continued)
Financial Futures Contracts
Security DescriptionNumber of contracts Currency
Global Exposure
USD
Unrealised Gain/(Loss)
USD
% of Net Assets
US 10 Year Note, 20/09/2017 (6) USD (754,875) 570 0.01 US Long Bond, 20/09/2017 3 USD 462,750 6,666 0.05 US Ultra Bond, 20/09/2017 3 USD 499,688 11,643 0.09
Unrealised Gain on Financial Futures Contracts 18,879 0.15
Total Unrealised Gain on Financial Futures Contracts 18,879 0.15
US 10 Year Ultra Note, 20/09/2017 (8) USD (1,081,500) (3,953) (0.03) US 2 Year Note, 29/09/2017 5 USD 1,081,016 (1,203) (0.01) US 5 Year Note, 29/09/2017 3 USD 353,976 (1,023) (0.01)
Unrealised Loss on Financial Futures Contracts (6,179) (0.05)
Total Unrealised Loss on Financial Futures Contracts (6,179) (0.05)
Net Unrealised Gain on Financial Futures Contracts 12,700 0.10
Interest Rate Swap Contracts
Nominal Amount Ccy Counterparty
Security Description
Maturity Date
Market Value USD
Unrealised Gain/(Loss)
USD
% of Net Assets
390,917 USD Barclays Pay fi xed 2.431% Receive fl oating LIBOR
3 month 21/12/2026 (7,337) (7,337) (0.06)
Total Unrealised Loss on Interest Rate Swap Contracts (7,337) (7,337) (0.06)
Net Unrealised Loss on Interest Rate Swap Contracts (7,337) (7,337) (0.06)
Collateral received and paid by the Fund in respect of fi nancial derivative instruments:
Type of Collateral Counterparty CurrencyCollateral Amount
receivedCollateral Amount
paid
US Dollar Corporate Bond Fund
Cash Goldman Sachs USD 2,580 –
2,580 –
SCHEDULE OF INVESTMENTSAs at 30 June 2017
Investments Currency
Quantity/Nominal
Value
Market Value USD
% of Net Assets
Transferable securities and money market instruments admitted to offi cial exchange listing or dealt in on another regulated market
Mortgage and Asset Backed Securities
AirlinesAmerican Airlines Pass Through Trust,
Series 2017-1 ‘AA’ 3.65% 15/08/2030 USD 50,000 50,510 0.40 United Airlines Pass Through Trust, Series
2014-1 ‘A’ 4% 11/10/2027 USD 44,387 46,439 0.37
96,949 0.77
Total Mortgage and Asset Backed Securities 96,949 0.77
Total Transferable securities and money market instruments admitted to offi cial exchange listing or dealt in on another regulated market 12,128,814 96.36
Total Investments 12,128,814 96.36
Cash 358,896 2.85
Other Assets/(Liabilities) 99,198 0.79
Total Net Assets 12,586,908 100.00
DERIVATIVES
Over-the-counter (OTC) and exchange traded derivatives as at 30 June 2017, expressed in US Dollars.

Morgan Stanley Investment Funds 30 June 2017 218
The accompanying notes are an integral part of these fi nancial statements.
Please refer to the full prospectus for the Fund’s investment objective and policy.
INVESTMENT AIM
To provide an attractive rate of total return, measured in US Dollars, primarily through investment in high yield and unrated US Dollar denominated fi xed income securities, including without limitation those issued by governments, agencies and corporations located in emerging markets.
SCHEDULE OF INVESTMENTSAs at 30 June 2017
Investments Currency
Quantity/Nominal
Value
Market Value USD
% of Net Assets
Transferable securities and money market instruments admitted to offi cial exchange listing or dealt in on another regulated market
Corporate Bonds
AdvertisingLamar Media Corp. 5.75% 01/02/2026 USD 470,000 509,045 0.40 MDC Partners, Inc., 144A 6.5%
01/05/2024 USD 560,000 552,031 0.44
1,061,076 0.84
Aerospace & DefenseKratos Defense & Security Solutions, Inc.
7% 15/05/2019 USD 750,000 772,500 0.61
772,500 0.61
AgriculturePinnacle Operating Corp., 144A 9%
15/11/2020 USD 50,000 40,250 0.03
40,250 0.03
AirlinesAir Canada, 144A 7.75% 15/04/2021 USD 350,000 402,500 0.32 American Airlines Group, Inc., 144A 5.5%
01/10/2019 USD 100,000 104,960 0.09 VistaJet Malta Finance plc, 144A 7.75%
01/06/2020 USD 700,000 493,500 0.39
1,000,960 0.80
ApparelHanesbrands, Inc., 144A 4.875%
15/05/2026 USD 525,000 536,156 0.43 Wolverine World Wide, Inc., 144A 5%
01/09/2026 USD 550,000 543,813 0.43
1,079,969 0.86
Auto ManufacturersAston Martin Capital Holdings Ltd., 144A
6.5% 15/04/2022 USD 700,000 731,311 0.58
731,311 0.58
Auto Parts & EquipmentMeritor, Inc. 6.25% 15/02/2024 USD 606,000 633,643 0.50
633,643 0.50
BanksProvident Funding Associates LP, 144A
6.375% 15/06/2025 USD 750,000 770,625 0.61
770,625 0.61
BeveragesBeverages & More, Inc., 144A 11.5%
15/06/2022 USD 750,000 731,250 0.58
731,250 0.58
US Dollar High Yield Bond Fund
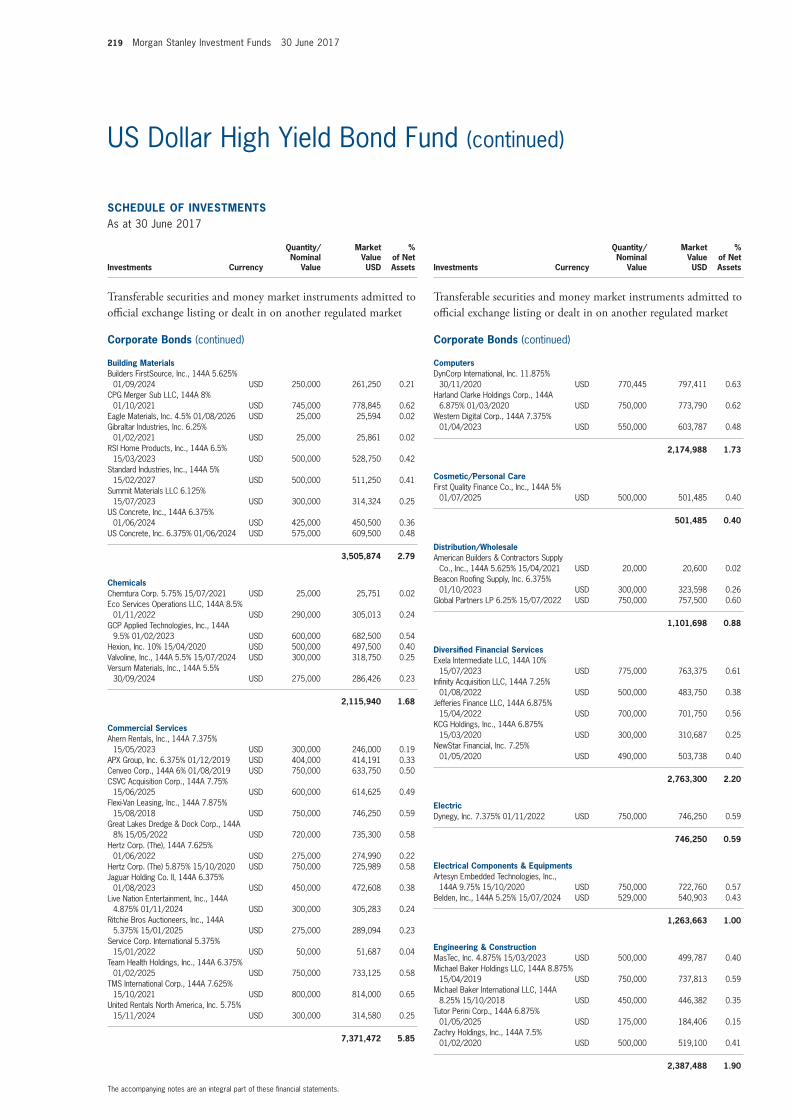
219 Morgan Stanley Investment Funds 30 June 2017
The accompanying notes are an integral part of these fi nancial statements.
US Dollar High Yield Bond Fund (continued)
SCHEDULE OF INVESTMENTSAs at 30 June 2017
Investments Currency
Quantity/Nominal
Value
Market Value USD
% of Net Assets
Transferable securities and money market instruments admitted to offi cial exchange listing or dealt in on another regulated market
Corporate Bonds (continued)
Building MaterialsBuilders FirstSource, Inc., 144A 5.625%
01/09/2024 USD 250,000 261,250 0.21 CPG Merger Sub LLC, 144A 8%
01/10/2021 USD 745,000 778,845 0.62 Eagle Materials, Inc. 4.5% 01/08/2026 USD 25,000 25,594 0.02 Gibraltar Industries, Inc. 6.25%
01/02/2021 USD 25,000 25,861 0.02 RSI Home Products, Inc., 144A 6.5%
15/03/2023 USD 500,000 528,750 0.42 Standard Industries, Inc., 144A 5%
15/02/2027 USD 500,000 511,250 0.41 Summit Materials LLC 6.125%
15/07/2023 USD 300,000 314,324 0.25 US Concrete, Inc., 144A 6.375%
01/06/2024 USD 425,000 450,500 0.36 US Concrete, Inc. 6.375% 01/06/2024 USD 575,000 609,500 0.48
3,505,874 2.79
ChemicalsChemtura Corp. 5.75% 15/07/2021 USD 25,000 25,751 0.02 Eco Services Operations LLC, 144A 8.5%
01/11/2022 USD 290,000 305,013 0.24 GCP Applied Technologies, Inc., 144A
9.5% 01/02/2023 USD 600,000 682,500 0.54 Hexion, Inc. 10% 15/04/2020 USD 500,000 497,500 0.40 Valvoline, Inc., 144A 5.5% 15/07/2024 USD 300,000 318,750 0.25 Versum Materials, Inc., 144A 5.5%
30/09/2024 USD 275,000 286,426 0.23
2,115,940 1.68
Commercial ServicesAhern Rentals, Inc., 144A 7.375%
15/05/2023 USD 300,000 246,000 0.19 APX Group, Inc. 6.375% 01/12/2019 USD 404,000 414,191 0.33 Cenveo Corp., 144A 6% 01/08/2019 USD 750,000 633,750 0.50 CSVC Acquisition Corp., 144A 7.75%
15/06/2025 USD 600,000 614,625 0.49 Flexi-Van Leasing, Inc., 144A 7.875%
15/08/2018 USD 750,000 746,250 0.59 Great Lakes Dredge & Dock Corp., 144A
8% 15/05/2022 USD 720,000 735,300 0.58 Hertz Corp. (The), 144A 7.625%
01/06/2022 USD 275,000 274,990 0.22 Hertz Corp. (The) 5.875% 15/10/2020 USD 750,000 725,989 0.58 Jaguar Holding Co. II, 144A 6.375%
01/08/2023 USD 450,000 472,608 0.38 Live Nation Entertainment, Inc., 144A
4.875% 01/11/2024 USD 300,000 305,283 0.24 Ritchie Bros Auctioneers, Inc., 144A
5.375% 15/01/2025 USD 275,000 289,094 0.23 Service Corp. International 5.375%
15/01/2022 USD 50,000 51,687 0.04 Team Health Holdings, Inc., 144A 6.375%
01/02/2025 USD 750,000 733,125 0.58 TMS International Corp., 144A 7.625%
15/10/2021 USD 800,000 814,000 0.65 United Rentals North America, Inc. 5.75%
15/11/2024 USD 300,000 314,580 0.25
7,371,472 5.85
SCHEDULE OF INVESTMENTSAs at 30 June 2017
Investments Currency
Quantity/Nominal
Value
Market Value USD
% of Net Assets
Transferable securities and money market instruments admitted to offi cial exchange listing or dealt in on another regulated market
Corporate Bonds (continued)
ComputersDynCorp International, Inc. 11.875%
30/11/2020 USD 770,445 797,411 0.63 Harland Clarke Holdings Corp., 144A
6.875% 01/03/2020 USD 750,000 773,790 0.62 Western Digital Corp., 144A 7.375%
01/04/2023 USD 550,000 603,787 0.48
2,174,988 1.73
Cosmetic/Personal CareFirst Quality Finance Co., Inc., 144A 5%
01/07/2025 USD 500,000 501,485 0.40
501,485 0.40
Distribution/WholesaleAmerican Builders & Contractors Supply
Co., Inc., 144A 5.625% 15/04/2021 USD 20,000 20,600 0.02 Beacon Roofi ng Supply, Inc. 6.375%
01/10/2023 USD 300,000 323,598 0.26 Global Partners LP 6.25% 15/07/2022 USD 750,000 757,500 0.60
1,101,698 0.88
Diversifi ed Financial ServicesExela Intermediate LLC, 144A 10%
15/07/2023 USD 775,000 763,375 0.61 Infi nity Acquisition LLC, 144A 7.25%
01/08/2022 USD 500,000 483,750 0.38 Jefferies Finance LLC, 144A 6.875%
15/04/2022 USD 700,000 701,750 0.56 KCG Holdings, Inc., 144A 6.875%
15/03/2020 USD 300,000 310,687 0.25 NewStar Financial, Inc. 7.25%
01/05/2020 USD 490,000 503,738 0.40
2,763,300 2.20
ElectricDynegy, Inc. 7.375% 01/11/2022 USD 750,000 746,250 0.59
746,250 0.59
Electrical Components & EquipmentsArtesyn Embedded Technologies, Inc.,
144A 9.75% 15/10/2020 USD 750,000 722,760 0.57 Belden, Inc., 144A 5.25% 15/07/2024 USD 529,000 540,903 0.43
1,263,663 1.00
Engineering & ConstructionMasTec, Inc. 4.875% 15/03/2023 USD 500,000 499,787 0.40 Michael Baker Holdings LLC, 144A 8.875%
15/04/2019 USD 750,000 737,813 0.59 Michael Baker International LLC, 144A
8.25% 15/10/2018 USD 450,000 446,382 0.35 Tutor Perini Corp., 144A 6.875%
01/05/2025 USD 175,000 184,406 0.15 Zachry Holdings, Inc., 144A 7.5%
01/02/2020 USD 500,000 519,100 0.41
2,387,488 1.90
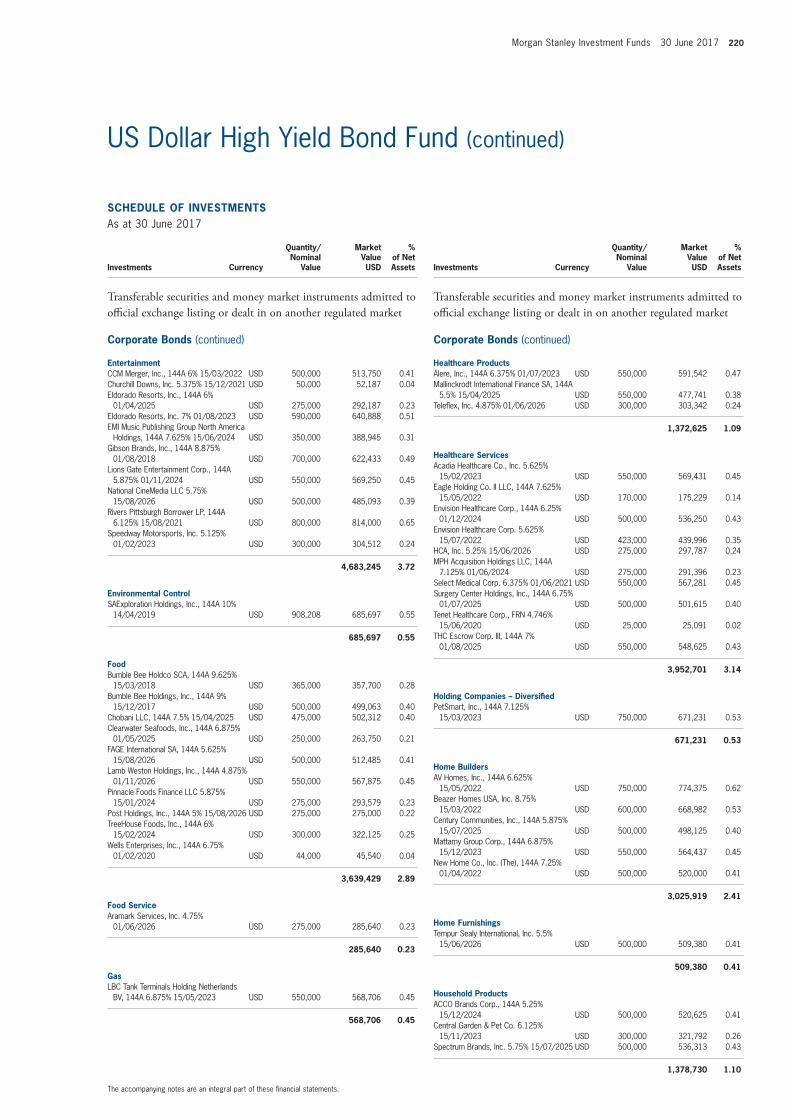
Morgan Stanley Investment Funds 30 June 2017 220
The accompanying notes are an integral part of these fi nancial statements.
US Dollar High Yield Bond Fund (continued)
SCHEDULE OF INVESTMENTSAs at 30 June 2017
Investments Currency
Quantity/Nominal
Value
Market Value USD
% of Net Assets
Transferable securities and money market instruments admitted to offi cial exchange listing or dealt in on another regulated market
Corporate Bonds (continued)
EntertainmentCCM Merger, Inc., 144A 6% 15/03/2022 USD 500,000 513,750 0.41 Churchill Downs, Inc. 5.375% 15/12/2021 USD 50,000 52,187 0.04 Eldorado Resorts, Inc., 144A 6%
01/04/2025 USD 275,000 292,187 0.23 Eldorado Resorts, Inc. 7% 01/08/2023 USD 590,000 640,888 0.51 EMI Music Publishing Group North America
Holdings, 144A 7.625% 15/06/2024 USD 350,000 388,945 0.31 Gibson Brands, Inc., 144A 8.875%
01/08/2018 USD 700,000 622,433 0.49 Lions Gate Entertainment Corp., 144A
5.875% 01/11/2024 USD 550,000 569,250 0.45 National CineMedia LLC 5.75%
15/08/2026 USD 500,000 485,093 0.39 Rivers Pittsburgh Borrower LP, 144A
6.125% 15/08/2021 USD 800,000 814,000 0.65 Speedway Motorsports, Inc. 5.125%
01/02/2023 USD 300,000 304,512 0.24
4,683,245 3.72
Environmental ControlSAExploration Holdings, Inc., 144A 10%
14/04/2019 USD 908,208 685,697 0.55
685,697 0.55
FoodBumble Bee Holdco SCA, 144A 9.625%
15/03/2018 USD 365,000 357,700 0.28 Bumble Bee Holdings, Inc., 144A 9%
15/12/2017 USD 500,000 499,063 0.40 Chobani LLC, 144A 7.5% 15/04/2025 USD 475,000 502,312 0.40 Clearwater Seafoods, Inc., 144A 6.875%
01/05/2025 USD 250,000 263,750 0.21 FAGE International SA, 144A 5.625%
15/08/2026 USD 500,000 512,485 0.41 Lamb Weston Holdings, Inc., 144A 4.875%
01/11/2026 USD 550,000 567,875 0.45 Pinnacle Foods Finance LLC 5.875%
15/01/2024 USD 275,000 293,579 0.23 Post Holdings, Inc., 144A 5% 15/08/2026 USD 275,000 275,000 0.22 TreeHouse Foods, Inc., 144A 6%
15/02/2024 USD 300,000 322,125 0.25 Wells Enterprises, Inc., 144A 6.75%
01/02/2020 USD 44,000 45,540 0.04
3,639,429 2.89
Food ServiceAramark Services, Inc. 4.75%
01/06/2026 USD 275,000 285,640 0.23
285,640 0.23
GasLBC Tank Terminals Holding Netherlands
BV, 144A 6.875% 15/05/2023 USD 550,000 568,706 0.45
568,706 0.45
SCHEDULE OF INVESTMENTSAs at 30 June 2017
Investments Currency
Quantity/Nominal
Value
Market Value USD
% of Net Assets
Transferable securities and money market instruments admitted to offi cial exchange listing or dealt in on another regulated market
Corporate Bonds (continued)
Healthcare ProductsAlere, Inc., 144A 6.375% 01/07/2023 USD 550,000 591,542 0.47 Mallinckrodt International Finance SA, 144A
5.5% 15/04/2025 USD 550,000 477,741 0.38 Telefl ex, Inc. 4.875% 01/06/2026 USD 300,000 303,342 0.24
1,372,625 1.09
Healthcare ServicesAcadia Healthcare Co., Inc. 5.625%
15/02/2023 USD 550,000 569,431 0.45 Eagle Holding Co. II LLC, 144A 7.625%
15/05/2022 USD 170,000 175,229 0.14 Envision Healthcare Corp., 144A 6.25%
01/12/2024 USD 500,000 536,250 0.43 Envision Healthcare Corp. 5.625%
15/07/2022 USD 423,000 439,996 0.35 HCA, Inc. 5.25% 15/06/2026 USD 275,000 297,787 0.24 MPH Acquisition Holdings LLC, 144A
7.125% 01/06/2024 USD 275,000 291,396 0.23 Select Medical Corp. 6.375% 01/06/2021 USD 550,000 567,281 0.45 Surgery Center Holdings, Inc., 144A 6.75%
01/07/2025 USD 500,000 501,615 0.40 Tenet Healthcare Corp., FRN 4.746%
15/06/2020 USD 25,000 25,091 0.02 THC Escrow Corp. III, 144A 7%
01/08/2025 USD 550,000 548,625 0.43
3,952,701 3.14
Holding Companies – Diversifi edPetSmart, Inc., 144A 7.125%
15/03/2023 USD 750,000 671,231 0.53
671,231 0.53
Home BuildersAV Homes, Inc., 144A 6.625%
15/05/2022 USD 750,000 774,375 0.62 Beazer Homes USA, Inc. 8.75%
15/03/2022 USD 600,000 668,982 0.53 Century Communities, Inc., 144A 5.875%
15/07/2025 USD 500,000 498,125 0.40 Mattamy Group Corp., 144A 6.875%
15/12/2023 USD 550,000 564,437 0.45 New Home Co., Inc. (The), 144A 7.25%
01/04/2022 USD 500,000 520,000 0.41
3,025,919 2.41
Home FurnishingsTempur Sealy International, Inc. 5.5%
15/06/2026 USD 500,000 509,380 0.41
509,380 0.41
Household ProductsACCO Brands Corp., 144A 5.25%
15/12/2024 USD 500,000 520,625 0.41 Central Garden & Pet Co. 6.125%
15/11/2023 USD 300,000 321,792 0.26 Spectrum Brands, Inc. 5.75% 15/07/2025 USD 500,000 536,313 0.43
1,378,730 1.10
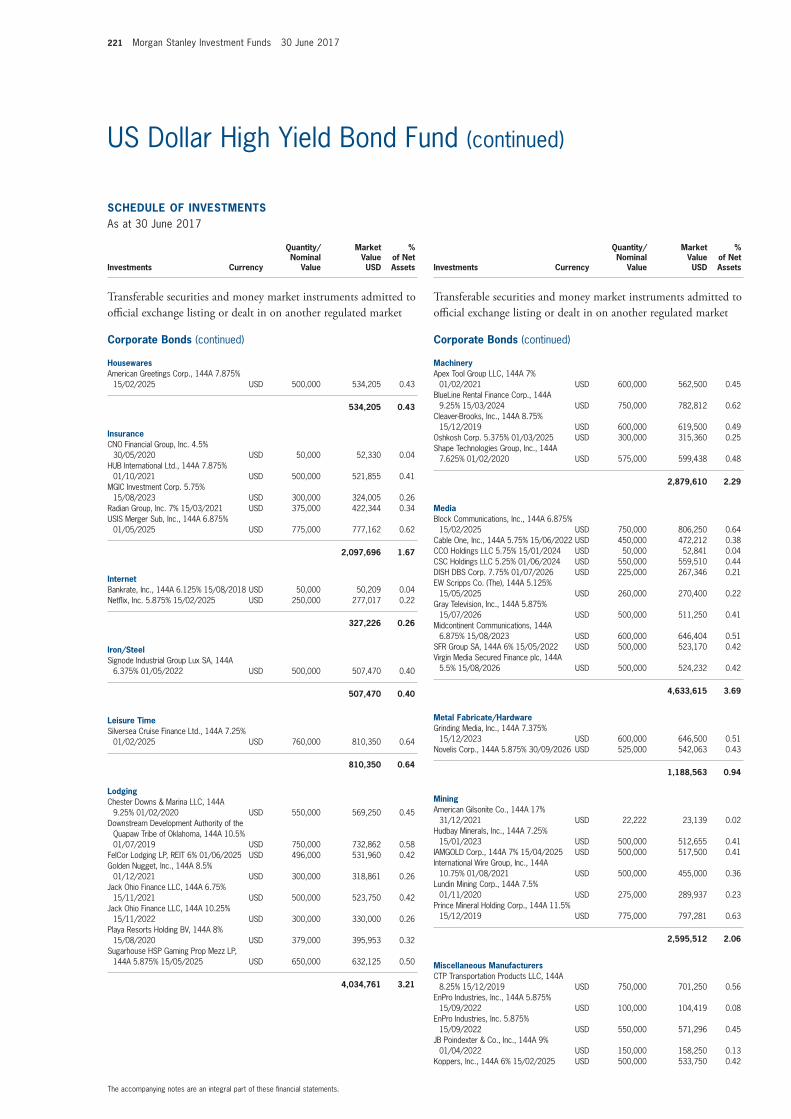
221 Morgan Stanley Investment Funds 30 June 2017
The accompanying notes are an integral part of these fi nancial statements.
US Dollar High Yield Bond Fund (continued)
SCHEDULE OF INVESTMENTSAs at 30 June 2017
Investments Currency
Quantity/Nominal
Value
Market Value USD
% of Net Assets
Transferable securities and money market instruments admitted to offi cial exchange listing or dealt in on another regulated market
Corporate Bonds (continued)
HousewaresAmerican Greetings Corp., 144A 7.875%
15/02/2025 USD 500,000 534,205 0.43
534,205 0.43
InsuranceCNO Financial Group, Inc. 4.5%
30/05/2020 USD 50,000 52,330 0.04 HUB International Ltd., 144A 7.875%
01/10/2021 USD 500,000 521,855 0.41 MGIC Investment Corp. 5.75%
15/08/2023 USD 300,000 324,005 0.26 Radian Group, Inc. 7% 15/03/2021 USD 375,000 422,344 0.34 USIS Merger Sub, Inc., 144A 6.875%
01/05/2025 USD 775,000 777,162 0.62
2,097,696 1.67
InternetBankrate, Inc., 144A 6.125% 15/08/2018 USD 50,000 50,209 0.04 Netfl ix, Inc. 5.875% 15/02/2025 USD 250,000 277,017 0.22
327,226 0.26
Iron/SteelSignode Industrial Group Lux SA, 144A
6.375% 01/05/2022 USD 500,000 507,470 0.40
507,470 0.40
Leisure TimeSilversea Cruise Finance Ltd., 144A 7.25%
01/02/2025 USD 760,000 810,350 0.64
810,350 0.64
LodgingChester Downs & Marina LLC, 144A
9.25% 01/02/2020 USD 550,000 569,250 0.45 Downstream Development Authority of the
Quapaw Tribe of Oklahoma, 144A 10.5% 01/07/2019 USD 750,000 732,862 0.58
FelCor Lodging LP, REIT 6% 01/06/2025 USD 496,000 531,960 0.42 Golden Nugget, Inc., 144A 8.5%
01/12/2021 USD 300,000 318,861 0.26 Jack Ohio Finance LLC, 144A 6.75%
15/11/2021 USD 500,000 523,750 0.42 Jack Ohio Finance LLC, 144A 10.25%
15/11/2022 USD 300,000 330,000 0.26 Playa Resorts Holding BV, 144A 8%
15/08/2020 USD 379,000 395,953 0.32 Sugarhouse HSP Gaming Prop Mezz LP,
144A 5.875% 15/05/2025 USD 650,000 632,125 0.50
4,034,761 3.21
SCHEDULE OF INVESTMENTSAs at 30 June 2017
Investments Currency
Quantity/Nominal
Value
Market Value USD
% of Net Assets
Transferable securities and money market instruments admitted to offi cial exchange listing or dealt in on another regulated market
Corporate Bonds (continued)
MachineryApex Tool Group LLC, 144A 7%
01/02/2021 USD 600,000 562,500 0.45 BlueLine Rental Finance Corp., 144A
9.25% 15/03/2024 USD 750,000 782,812 0.62 Cleaver-Brooks, Inc., 144A 8.75%
15/12/2019 USD 600,000 619,500 0.49 Oshkosh Corp. 5.375% 01/03/2025 USD 300,000 315,360 0.25 Shape Technologies Group, Inc., 144A
7.625% 01/02/2020 USD 575,000 599,438 0.48
2,879,610 2.29
MediaBlock Communications, Inc., 144A 6.875%
15/02/2025 USD 750,000 806,250 0.64 Cable One, Inc., 144A 5.75% 15/06/2022 USD 450,000 472,212 0.38 CCO Holdings LLC 5.75% 15/01/2024 USD 50,000 52,841 0.04 CSC Holdings LLC 5.25% 01/06/2024 USD 550,000 559,510 0.44 DISH DBS Corp. 7.75% 01/07/2026 USD 225,000 267,346 0.21 EW Scripps Co. (The), 144A 5.125%
15/05/2025 USD 260,000 270,400 0.22 Gray Television, Inc., 144A 5.875%
15/07/2026 USD 500,000 511,250 0.41 Midcontinent Communications, 144A
6.875% 15/08/2023 USD 600,000 646,404 0.51 SFR Group SA, 144A 6% 15/05/2022 USD 500,000 523,170 0.42 Virgin Media Secured Finance plc, 144A
5.5% 15/08/2026 USD 500,000 524,232 0.42
4,633,615 3.69
Metal Fabricate/HardwareGrinding Media, Inc., 144A 7.375%
15/12/2023 USD 600,000 646,500 0.51 Novelis Corp., 144A 5.875% 30/09/2026 USD 525,000 542,063 0.43
1,188,563 0.94
MiningAmerican Gilsonite Co., 144A 17%
31/12/2021 USD 22,222 23,139 0.02 Hudbay Minerals, Inc., 144A 7.25%
15/01/2023 USD 500,000 512,655 0.41 IAMGOLD Corp., 144A 7% 15/04/2025 USD 500,000 517,500 0.41 International Wire Group, Inc., 144A
10.75% 01/08/2021 USD 500,000 455,000 0.36 Lundin Mining Corp., 144A 7.5%
01/11/2020 USD 275,000 289,937 0.23 Prince Mineral Holding Corp., 144A 11.5%
15/12/2019 USD 775,000 797,281 0.63
2,595,512 2.06
Miscellaneous ManufacturersCTP Transportation Products LLC, 144A
8.25% 15/12/2019 USD 750,000 701,250 0.56 EnPro Industries, Inc., 144A 5.875%
15/09/2022 USD 100,000 104,419 0.08 EnPro Industries, Inc. 5.875%
15/09/2022 USD 550,000 571,296 0.45 JB Poindexter & Co., Inc., 144A 9%
01/04/2022 USD 150,000 158,250 0.13 Koppers, Inc., 144A 6% 15/02/2025 USD 500,000 533,750 0.42
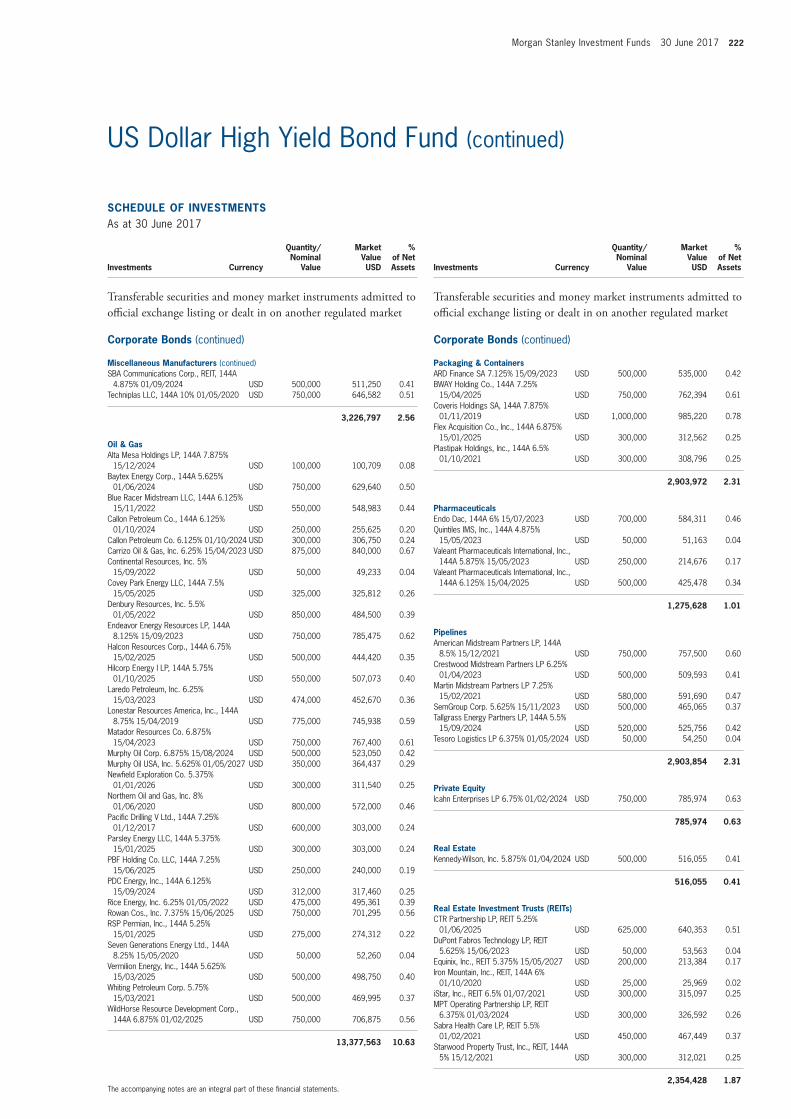
Morgan Stanley Investment Funds 30 June 2017 222
The accompanying notes are an integral part of these fi nancial statements.
US Dollar High Yield Bond Fund (continued)
SCHEDULE OF INVESTMENTSAs at 30 June 2017
Investments Currency
Quantity/Nominal
Value
Market Value USD
% of Net Assets
Transferable securities and money market instruments admitted to offi cial exchange listing or dealt in on another regulated market
Corporate Bonds (continued)
Miscellaneous Manufacturers (continued)SBA Communications Corp., REIT, 144A
4.875% 01/09/2024 USD 500,000 511,250 0.41 Techniplas LLC, 144A 10% 01/05/2020 USD 750,000 646,582 0.51
3,226,797 2.56
Oil & GasAlta Mesa Holdings LP, 144A 7.875%
15/12/2024 USD 100,000 100,709 0.08 Baytex Energy Corp., 144A 5.625%
01/06/2024 USD 750,000 629,640 0.50 Blue Racer Midstream LLC, 144A 6.125%
15/11/2022 USD 550,000 548,983 0.44 Callon Petroleum Co., 144A 6.125%
01/10/2024 USD 250,000 255,625 0.20 Callon Petroleum Co. 6.125% 01/10/2024 USD 300,000 306,750 0.24 Carrizo Oil & Gas, Inc. 6.25% 15/04/2023 USD 875,000 840,000 0.67 Continental Resources, Inc. 5%
15/09/2022 USD 50,000 49,233 0.04 Covey Park Energy LLC, 144A 7.5%
15/05/2025 USD 325,000 325,812 0.26 Denbury Resources, Inc. 5.5%
01/05/2022 USD 850,000 484,500 0.39 Endeavor Energy Resources LP, 144A
8.125% 15/09/2023 USD 750,000 785,475 0.62 Halcon Resources Corp., 144A 6.75%
15/02/2025 USD 500,000 444,420 0.35 Hilcorp Energy I LP, 144A 5.75%
01/10/2025 USD 550,000 507,073 0.40 Laredo Petroleum, Inc. 6.25%
15/03/2023 USD 474,000 452,670 0.36 Lonestar Resources America, Inc., 144A
8.75% 15/04/2019 USD 775,000 745,938 0.59 Matador Resources Co. 6.875%
15/04/2023 USD 750,000 767,400 0.61 Murphy Oil Corp. 6.875% 15/08/2024 USD 500,000 523,050 0.42 Murphy Oil USA, Inc. 5.625% 01/05/2027 USD 350,000 364,437 0.29 Newfi eld Exploration Co. 5.375%
01/01/2026 USD 300,000 311,540 0.25 Northern Oil and Gas, Inc. 8%
01/06/2020 USD 800,000 572,000 0.46 Pacifi c Drilling V Ltd., 144A 7.25%
01/12/2017 USD 600,000 303,000 0.24 Parsley Energy LLC, 144A 5.375%
15/01/2025 USD 300,000 303,000 0.24 PBF Holding Co. LLC, 144A 7.25%
15/06/2025 USD 250,000 240,000 0.19 PDC Energy, Inc., 144A 6.125%
15/09/2024 USD 312,000 317,460 0.25 Rice Energy, Inc. 6.25% 01/05/2022 USD 475,000 495,361 0.39 Rowan Cos., Inc. 7.375% 15/06/2025 USD 750,000 701,295 0.56 RSP Permian, Inc., 144A 5.25%
15/01/2025 USD 275,000 274,312 0.22 Seven Generations Energy Ltd., 144A
8.25% 15/05/2020 USD 50,000 52,260 0.04 Vermilion Energy, Inc., 144A 5.625%
15/03/2025 USD 500,000 498,750 0.40 Whiting Petroleum Corp. 5.75%
15/03/2021 USD 500,000 469,995 0.37 WildHorse Resource Development Corp.,
144A 6.875% 01/02/2025 USD 750,000 706,875 0.56
13,377,563 10.63
SCHEDULE OF INVESTMENTSAs at 30 June 2017
Investments Currency
Quantity/Nominal
Value
Market Value USD
% of Net Assets
Transferable securities and money market instruments admitted to offi cial exchange listing or dealt in on another regulated market
Corporate Bonds (continued)
Packaging & ContainersARD Finance SA 7.125% 15/09/2023 USD 500,000 535,000 0.42 BWAY Holding Co., 144A 7.25%
15/04/2025 USD 750,000 762,394 0.61 Coveris Holdings SA, 144A 7.875%
01/11/2019 USD 1,000,000 985,220 0.78 Flex Acquisition Co., Inc., 144A 6.875%
15/01/2025 USD 300,000 312,562 0.25 Plastipak Holdings, Inc., 144A 6.5%
01/10/2021 USD 300,000 308,796 0.25
2,903,972 2.31
PharmaceuticalsEndo Dac, 144A 6% 15/07/2023 USD 700,000 584,311 0.46 Quintiles IMS, Inc., 144A 4.875%
15/05/2023 USD 50,000 51,163 0.04 Valeant Pharmaceuticals International, Inc.,
144A 5.875% 15/05/2023 USD 250,000 214,676 0.17 Valeant Pharmaceuticals International, Inc.,
144A 6.125% 15/04/2025 USD 500,000 425,478 0.34
1,275,628 1.01
PipelinesAmerican Midstream Partners LP, 144A
8.5% 15/12/2021 USD 750,000 757,500 0.60 Crestwood Midstream Partners LP 6.25%
01/04/2023 USD 500,000 509,593 0.41 Martin Midstream Partners LP 7.25%
15/02/2021 USD 580,000 591,690 0.47 SemGroup Corp. 5.625% 15/11/2023 USD 500,000 465,065 0.37 Tallgrass Energy Partners LP, 144A 5.5%
15/09/2024 USD 520,000 525,756 0.42 Tesoro Logistics LP 6.375% 01/05/2024 USD 50,000 54,250 0.04
2,903,854 2.31
Private EquityIcahn Enterprises LP 6.75% 01/02/2024 USD 750,000 785,974 0.63
785,974 0.63
Real EstateKennedy-Wilson, Inc. 5.875% 01/04/2024 USD 500,000 516,055 0.41
516,055 0.41
Real Estate Investment Trusts (REITs)CTR Partnership LP, REIT 5.25%
01/06/2025 USD 625,000 640,353 0.51 DuPont Fabros Technology LP, REIT
5.625% 15/06/2023 USD 50,000 53,563 0.04 Equinix, Inc., REIT 5.375% 15/05/2027 USD 200,000 213,384 0.17 Iron Mountain, Inc., REIT, 144A 6%
01/10/2020 USD 25,000 25,969 0.02 iStar, Inc., REIT 6.5% 01/07/2021 USD 300,000 315,097 0.25 MPT Operating Partnership LP, REIT
6.375% 01/03/2024 USD 300,000 326,592 0.26 Sabra Health Care LP, REIT 5.5%
01/02/2021 USD 450,000 467,449 0.37 Starwood Property Trust, Inc., REIT, 144A
5% 15/12/2021 USD 300,000 312,021 0.25
2,354,428 1.87
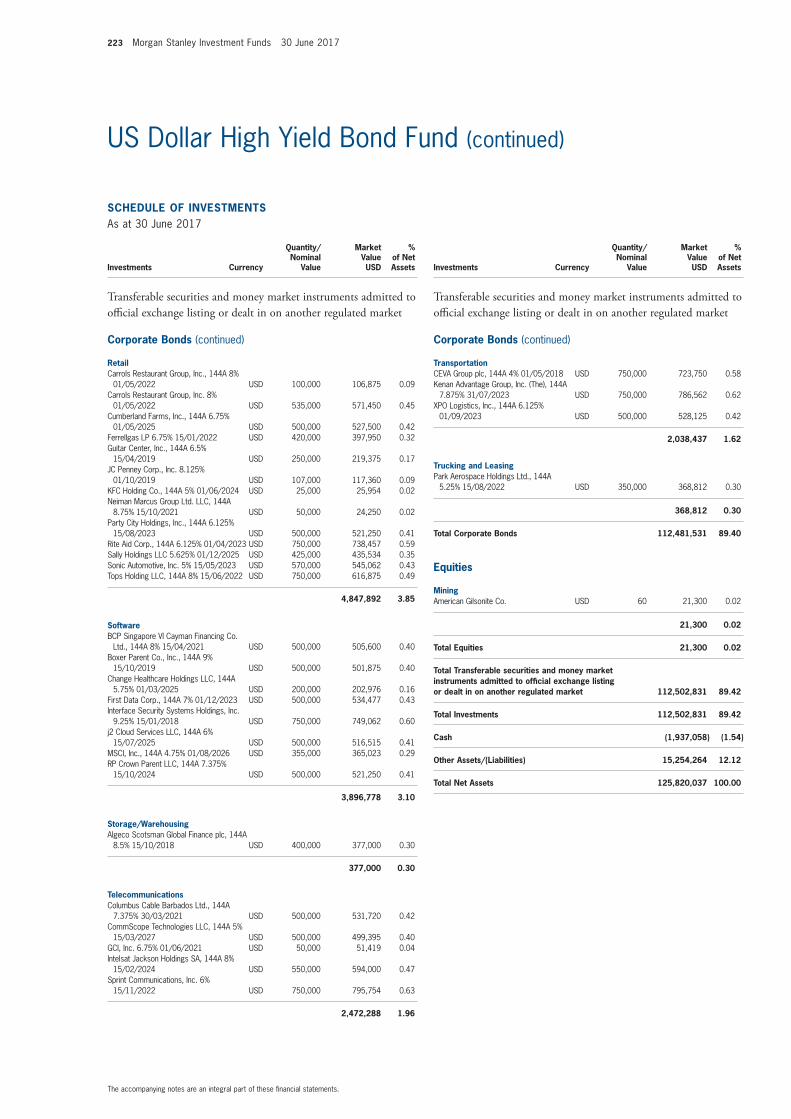
223 Morgan Stanley Investment Funds 30 June 2017
The accompanying notes are an integral part of these fi nancial statements.
US Dollar High Yield Bond Fund (continued)
SCHEDULE OF INVESTMENTSAs at 30 June 2017
Investments Currency
Quantity/Nominal
Value
Market Value USD
% of Net Assets
Transferable securities and money market instruments admitted to offi cial exchange listing or dealt in on another regulated market
Corporate Bonds (continued)
RetailCarrols Restaurant Group, Inc., 144A 8%
01/05/2022 USD 100,000 106,875 0.09 Carrols Restaurant Group, Inc. 8%
01/05/2022 USD 535,000 571,450 0.45 Cumberland Farms, Inc., 144A 6.75%
01/05/2025 USD 500,000 527,500 0.42 Ferrellgas LP 6.75% 15/01/2022 USD 420,000 397,950 0.32 Guitar Center, Inc., 144A 6.5%
15/04/2019 USD 250,000 219,375 0.17 JC Penney Corp., Inc. 8.125%
01/10/2019 USD 107,000 117,360 0.09 KFC Holding Co., 144A 5% 01/06/2024 USD 25,000 25,954 0.02 Neiman Marcus Group Ltd. LLC, 144A
8.75% 15/10/2021 USD 50,000 24,250 0.02 Party City Holdings, Inc., 144A 6.125%
15/08/2023 USD 500,000 521,250 0.41 Rite Aid Corp., 144A 6.125% 01/04/2023 USD 750,000 738,457 0.59 Sally Holdings LLC 5.625% 01/12/2025 USD 425,000 435,534 0.35 Sonic Automotive, Inc. 5% 15/05/2023 USD 570,000 545,062 0.43 Tops Holding LLC, 144A 8% 15/06/2022 USD 750,000 616,875 0.49
4,847,892 3.85
SoftwareBCP Singapore VI Cayman Financing Co.
Ltd., 144A 8% 15/04/2021 USD 500,000 505,600 0.40 Boxer Parent Co., Inc., 144A 9%
15/10/2019 USD 500,000 501,875 0.40 Change Healthcare Holdings LLC, 144A
5.75% 01/03/2025 USD 200,000 202,976 0.16 First Data Corp., 144A 7% 01/12/2023 USD 500,000 534,477 0.43 Interface Security Systems Holdings, Inc.
9.25% 15/01/2018 USD 750,000 749,062 0.60 j2 Cloud Services LLC, 144A 6%
15/07/2025 USD 500,000 516,515 0.41 MSCI, Inc., 144A 4.75% 01/08/2026 USD 355,000 365,023 0.29 RP Crown Parent LLC, 144A 7.375%
15/10/2024 USD 500,000 521,250 0.41
3,896,778 3.10
Storage/WarehousingAlgeco Scotsman Global Finance plc, 144A
8.5% 15/10/2018 USD 400,000 377,000 0.30
377,000 0.30
TelecommunicationsColumbus Cable Barbados Ltd., 144A
7.375% 30/03/2021 USD 500,000 531,720 0.42 CommScope Technologies LLC, 144A 5%
15/03/2027 USD 500,000 499,395 0.40 GCI, Inc. 6.75% 01/06/2021 USD 50,000 51,419 0.04 Intelsat Jackson Holdings SA, 144A 8%
15/02/2024 USD 550,000 594,000 0.47 Sprint Communications, Inc. 6%
15/11/2022 USD 750,000 795,754 0.63
2,472,288 1.96
SCHEDULE OF INVESTMENTSAs at 30 June 2017
Investments Currency
Quantity/Nominal
Value
Market Value USD
% of Net Assets
Transferable securities and money market instruments admitted to offi cial exchange listing or dealt in on another regulated market
Corporate Bonds (continued)
TransportationCEVA Group plc, 144A 4% 01/05/2018 USD 750,000 723,750 0.58 Kenan Advantage Group, Inc. (The), 144A
7.875% 31/07/2023 USD 750,000 786,562 0.62 XPO Logistics, Inc., 144A 6.125%
01/09/2023 USD 500,000 528,125 0.42
2,038,437 1.62
Trucking and LeasingPark Aerospace Holdings Ltd., 144A
5.25% 15/08/2022 USD 350,000 368,812 0.30
368,812 0.30
Total Corporate Bonds 112,481,531 89.40
Equities
MiningAmerican Gilsonite Co. USD 60 21,300 0.02
21,300 0.02
Total Equities 21,300 0.02
Total Transferable securities and money market instruments admitted to offi cial exchange listing or dealt in on another regulated market 112,502,831 89.42
Total Investments 112,502,831 89.42
Cash (1,937,058) (1.54)
Other Assets/(Liabilities) 15,254,264 12.12
Total Net Assets 125,820,037 100.00
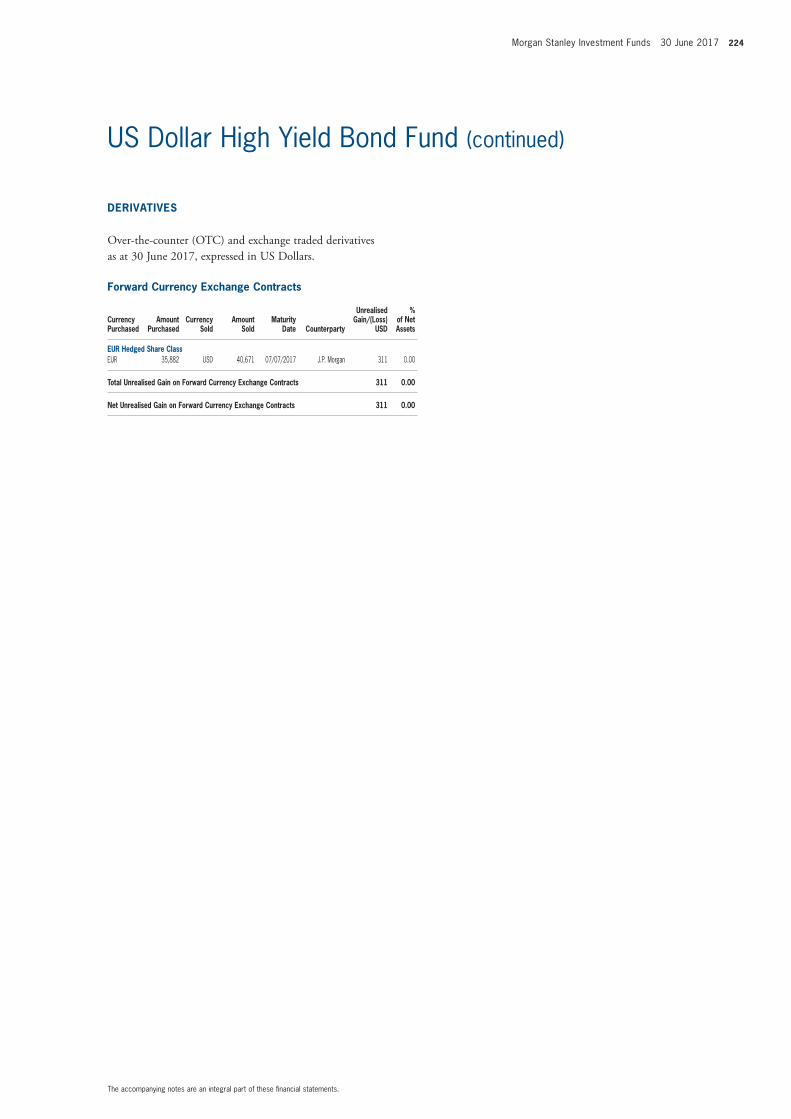
Morgan Stanley Investment Funds 30 June 2017 224
The accompanying notes are an integral part of these fi nancial statements.
US Dollar High Yield Bond Fund (continued)
Forward Currency Exchange Contracts
Currency Purchased
Amount Purchased
Currency Sold
Amount Sold
Maturity Date Counterparty
Unrealised Gain/(Loss)
USD
% of Net Assets
EUR Hedged Share ClassEUR 35,882 USD 40,671 07/07/2017 J.P. Morgan 311 0.00
Total Unrealised Gain on Forward Currency Exchange Contracts 311 0.00
Net Unrealised Gain on Forward Currency Exchange Contracts 311 0.00
DERIVATIVES
Over-the-counter (OTC) and exchange traded derivatives as at 30 June 2017, expressed in US Dollars.
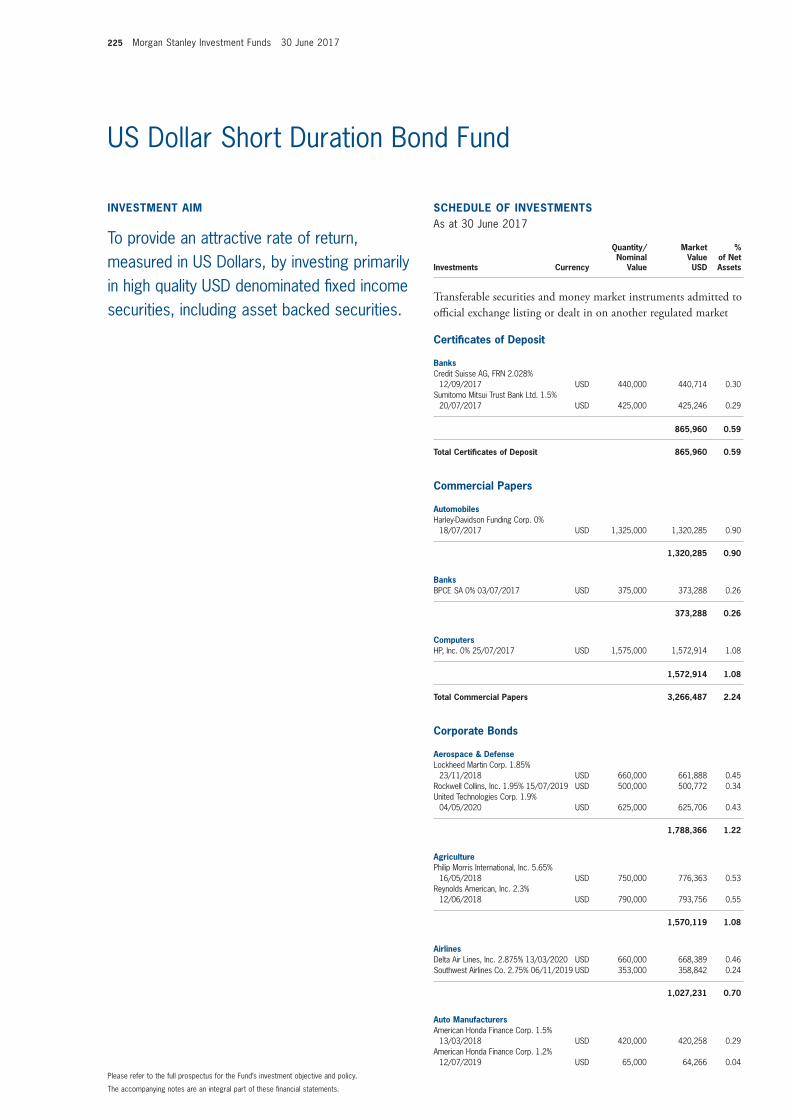
225 Morgan Stanley Investment Funds 30 June 2017
The accompanying notes are an integral part of these fi nancial statements.
Please refer to the full prospectus for the Fund’s investment objective and policy.
US Dollar Short Duration Bond Fund
INVESTMENT AIM
To provide an attractive rate of return, measured in US Dollars, by investing primarily in high quality USD denominated fi xed income securities, including asset backed securities.
SCHEDULE OF INVESTMENTSAs at 30 June 2017
Investments Currency
Quantity/Nominal
Value
Market Value USD
% of Net Assets
Transferable securities and money market instruments admitted to offi cial exchange listing or dealt in on another regulated market
Certifi cates of Deposit
BanksCredit Suisse AG, FRN 2.028%
12/09/2017 USD 440,000 440,714 0.30 Sumitomo Mitsui Trust Bank Ltd. 1.5%
20/07/2017 USD 425,000 425,246 0.29
865,960 0.59
Total Certifi cates of Deposit 865,960 0.59
Commercial Papers
AutomobilesHarley-Davidson Funding Corp. 0%
18/07/2017 USD 1,325,000 1,320,285 0.90
1,320,285 0.90
BanksBPCE SA 0% 03/07/2017 USD 375,000 373,288 0.26
373,288 0.26
ComputersHP, Inc. 0% 25/07/2017 USD 1,575,000 1,572,914 1.08
1,572,914 1.08
Total Commercial Papers 3,266,487 2.24
Corporate Bonds
Aerospace & DefenseLockheed Martin Corp. 1.85%
23/11/2018 USD 660,000 661,888 0.45 Rockwell Collins, Inc. 1.95% 15/07/2019 USD 500,000 500,772 0.34 United Technologies Corp. 1.9%
04/05/2020 USD 625,000 625,706 0.43
1,788,366 1.22
AgriculturePhilip Morris International, Inc. 5.65%
16/05/2018 USD 750,000 776,363 0.53 Reynolds American, Inc. 2.3%
12/06/2018 USD 790,000 793,756 0.55
1,570,119 1.08
AirlinesDelta Air Lines, Inc. 2.875% 13/03/2020 USD 660,000 668,389 0.46 Southwest Airlines Co. 2.75% 06/11/2019 USD 353,000 358,842 0.24
1,027,231 0.70
Auto ManufacturersAmerican Honda Finance Corp. 1.5%
13/03/2018 USD 420,000 420,258 0.29 American Honda Finance Corp. 1.2%
12/07/2019 USD 65,000 64,266 0.04
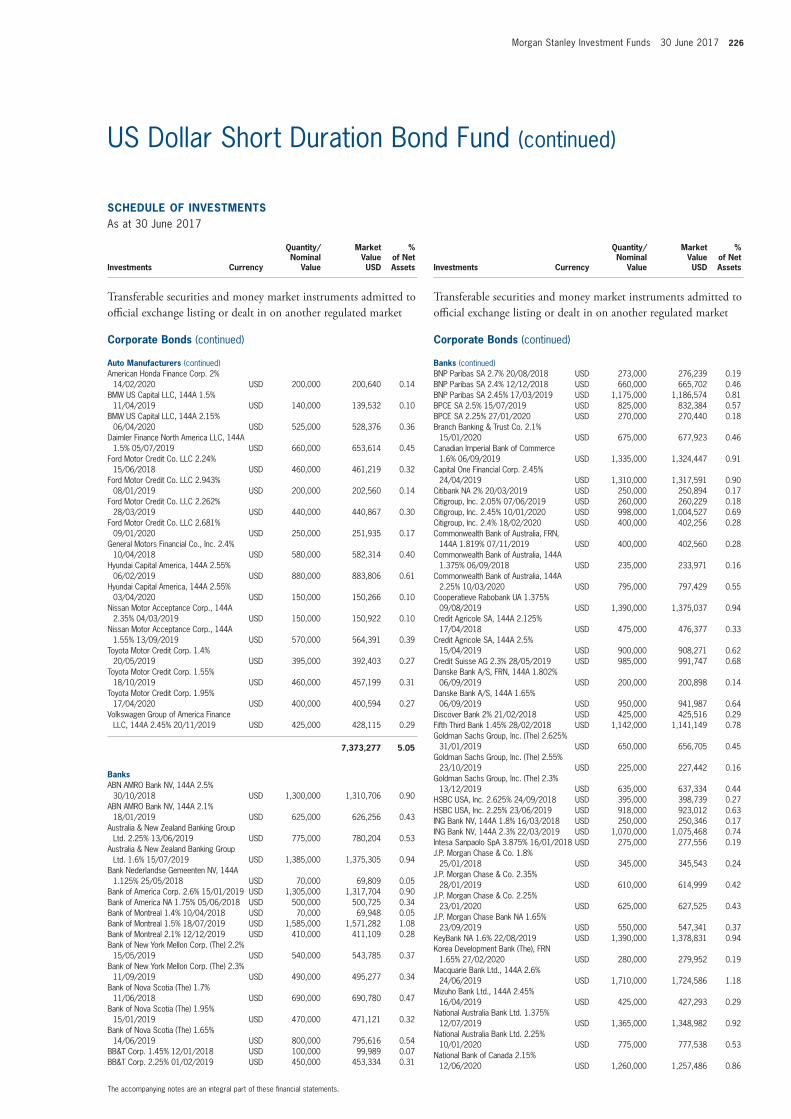
Morgan Stanley Investment Funds 30 June 2017 226
The accompanying notes are an integral part of these fi nancial statements.
US Dollar Short Duration Bond Fund (continued)
SCHEDULE OF INVESTMENTSAs at 30 June 2017
Investments Currency
Quantity/Nominal
Value
Market Value USD
% of Net Assets
Transferable securities and money market instruments admitted to offi cial exchange listing or dealt in on another regulated market
Corporate Bonds (continued)
Auto Manufacturers (continued)American Honda Finance Corp. 2%
14/02/2020 USD 200,000 200,640 0.14 BMW US Capital LLC, 144A 1.5%
11/04/2019 USD 140,000 139,532 0.10 BMW US Capital LLC, 144A 2.15%
06/04/2020 USD 525,000 528,376 0.36 Daimler Finance North America LLC, 144A
1.5% 05/07/2019 USD 660,000 653,614 0.45 Ford Motor Credit Co. LLC 2.24%
15/06/2018 USD 460,000 461,219 0.32 Ford Motor Credit Co. LLC 2.943%
08/01/2019 USD 200,000 202,560 0.14 Ford Motor Credit Co. LLC 2.262%
28/03/2019 USD 440,000 440,867 0.30 Ford Motor Credit Co. LLC 2.681%
09/01/2020 USD 250,000 251,935 0.17 General Motors Financial Co., Inc. 2.4%
10/04/2018 USD 580,000 582,314 0.40 Hyundai Capital America, 144A 2.55%
06/02/2019 USD 880,000 883,806 0.61 Hyundai Capital America, 144A 2.55%
03/04/2020 USD 150,000 150,266 0.10 Nissan Motor Acceptance Corp., 144A
2.35% 04/03/2019 USD 150,000 150,922 0.10 Nissan Motor Acceptance Corp., 144A
1.55% 13/09/2019 USD 570,000 564,391 0.39 Toyota Motor Credit Corp. 1.4%
20/05/2019 USD 395,000 392,403 0.27 Toyota Motor Credit Corp. 1.55%
18/10/2019 USD 460,000 457,199 0.31 Toyota Motor Credit Corp. 1.95%
17/04/2020 USD 400,000 400,594 0.27 Volkswagen Group of America Finance
LLC, 144A 2.45% 20/11/2019 USD 425,000 428,115 0.29
7,373,277 5.05
BanksABN AMRO Bank NV, 144A 2.5%
30/10/2018 USD 1,300,000 1,310,706 0.90 ABN AMRO Bank NV, 144A 2.1%
18/01/2019 USD 625,000 626,256 0.43 Australia & New Zealand Banking Group
Ltd. 2.25% 13/06/2019 USD 775,000 780,204 0.53 Australia & New Zealand Banking Group
Ltd. 1.6% 15/07/2019 USD 1,385,000 1,375,305 0.94 Bank Nederlandse Gemeenten NV, 144A
1.125% 25/05/2018 USD 70,000 69,809 0.05 Bank of America Corp. 2.6% 15/01/2019 USD 1,305,000 1,317,704 0.90 Bank of America NA 1.75% 05/06/2018 USD 500,000 500,725 0.34 Bank of Montreal 1.4% 10/04/2018 USD 70,000 69,948 0.05 Bank of Montreal 1.5% 18/07/2019 USD 1,585,000 1,571,282 1.08 Bank of Montreal 2.1% 12/12/2019 USD 410,000 411,109 0.28 Bank of New York Mellon Corp. (The) 2.2%
15/05/2019 USD 540,000 543,785 0.37 Bank of New York Mellon Corp. (The) 2.3%
11/09/2019 USD 490,000 495,277 0.34 Bank of Nova Scotia (The) 1.7%
11/06/2018 USD 690,000 690,780 0.47 Bank of Nova Scotia (The) 1.95%
15/01/2019 USD 470,000 471,121 0.32 Bank of Nova Scotia (The) 1.65%
14/06/2019 USD 800,000 795,616 0.54 BB&T Corp. 1.45% 12/01/2018 USD 100,000 99,989 0.07 BB&T Corp. 2.25% 01/02/2019 USD 450,000 453,334 0.31
SCHEDULE OF INVESTMENTSAs at 30 June 2017
Investments Currency
Quantity/Nominal
Value
Market Value USD
% of Net Assets
Transferable securities and money market instruments admitted to offi cial exchange listing or dealt in on another regulated market
Corporate Bonds (continued)
Banks (continued)BNP Paribas SA 2.7% 20/08/2018 USD 273,000 276,239 0.19 BNP Paribas SA 2.4% 12/12/2018 USD 660,000 665,702 0.46 BNP Paribas SA 2.45% 17/03/2019 USD 1,175,000 1,186,574 0.81 BPCE SA 2.5% 15/07/2019 USD 825,000 832,384 0.57 BPCE SA 2.25% 27/01/2020 USD 270,000 270,440 0.18 Branch Banking & Trust Co. 2.1%
15/01/2020 USD 675,000 677,923 0.46 Canadian Imperial Bank of Commerce
1.6% 06/09/2019 USD 1,335,000 1,324,447 0.91 Capital One Financial Corp. 2.45%
24/04/2019 USD 1,310,000 1,317,591 0.90 Citibank NA 2% 20/03/2019 USD 250,000 250,894 0.17 Citigroup, Inc. 2.05% 07/06/2019 USD 260,000 260,229 0.18 Citigroup, Inc. 2.45% 10/01/2020 USD 998,000 1,004,527 0.69 Citigroup, Inc. 2.4% 18/02/2020 USD 400,000 402,256 0.28 Commonwealth Bank of Australia, FRN,
144A 1.819% 07/11/2019 USD 400,000 402,560 0.28 Commonwealth Bank of Australia, 144A
1.375% 06/09/2018 USD 235,000 233,971 0.16 Commonwealth Bank of Australia, 144A
2.25% 10/03/2020 USD 795,000 797,429 0.55 Cooperatieve Rabobank UA 1.375%
09/08/2019 USD 1,390,000 1,375,037 0.94 Credit Agricole SA, 144A 2.125%
17/04/2018 USD 475,000 476,377 0.33 Credit Agricole SA, 144A 2.5%
15/04/2019 USD 900,000 908,271 0.62 Credit Suisse AG 2.3% 28/05/2019 USD 985,000 991,747 0.68 Danske Bank A/S, FRN, 144A 1.802%
06/09/2019 USD 200,000 200,898 0.14 Danske Bank A/S, 144A 1.65%
06/09/2019 USD 950,000 941,987 0.64 Discover Bank 2% 21/02/2018 USD 425,000 425,516 0.29 Fifth Third Bank 1.45% 28/02/2018 USD 1,142,000 1,141,149 0.78 Goldman Sachs Group, Inc. (The) 2.625%
31/01/2019 USD 650,000 656,705 0.45 Goldman Sachs Group, Inc. (The) 2.55%
23/10/2019 USD 225,000 227,442 0.16 Goldman Sachs Group, Inc. (The) 2.3%
13/12/2019 USD 635,000 637,334 0.44 HSBC USA, Inc. 2.625% 24/09/2018 USD 395,000 398,739 0.27 HSBC USA, Inc. 2.25% 23/06/2019 USD 918,000 923,012 0.63 ING Bank NV, 144A 1.8% 16/03/2018 USD 250,000 250,346 0.17 ING Bank NV, 144A 2.3% 22/03/2019 USD 1,070,000 1,075,468 0.74 Intesa Sanpaolo SpA 3.875% 16/01/2018 USD 275,000 277,556 0.19 J.P. Morgan Chase & Co. 1.8%
25/01/2018 USD 345,000 345,543 0.24 J.P. Morgan Chase & Co. 2.35%
28/01/2019 USD 610,000 614,999 0.42 J.P. Morgan Chase & Co. 2.25%
23/01/2020 USD 625,000 627,525 0.43 J.P. Morgan Chase Bank NA 1.65%
23/09/2019 USD 550,000 547,341 0.37 KeyBank NA 1.6% 22/08/2019 USD 1,390,000 1,378,831 0.94 Korea Development Bank (The), FRN
1.65% 27/02/2020 USD 280,000 279,952 0.19 Macquarie Bank Ltd., 144A 2.6%
24/06/2019 USD 1,710,000 1,724,586 1.18 Mizuho Bank Ltd., 144A 2.45%
16/04/2019 USD 425,000 427,293 0.29 National Australia Bank Ltd. 1.375%
12/07/2019 USD 1,365,000 1,348,982 0.92 National Australia Bank Ltd. 2.25%
10/01/2020 USD 775,000 777,538 0.53 National Bank of Canada 2.15%
12/06/2020 USD 1,260,000 1,257,486 0.86
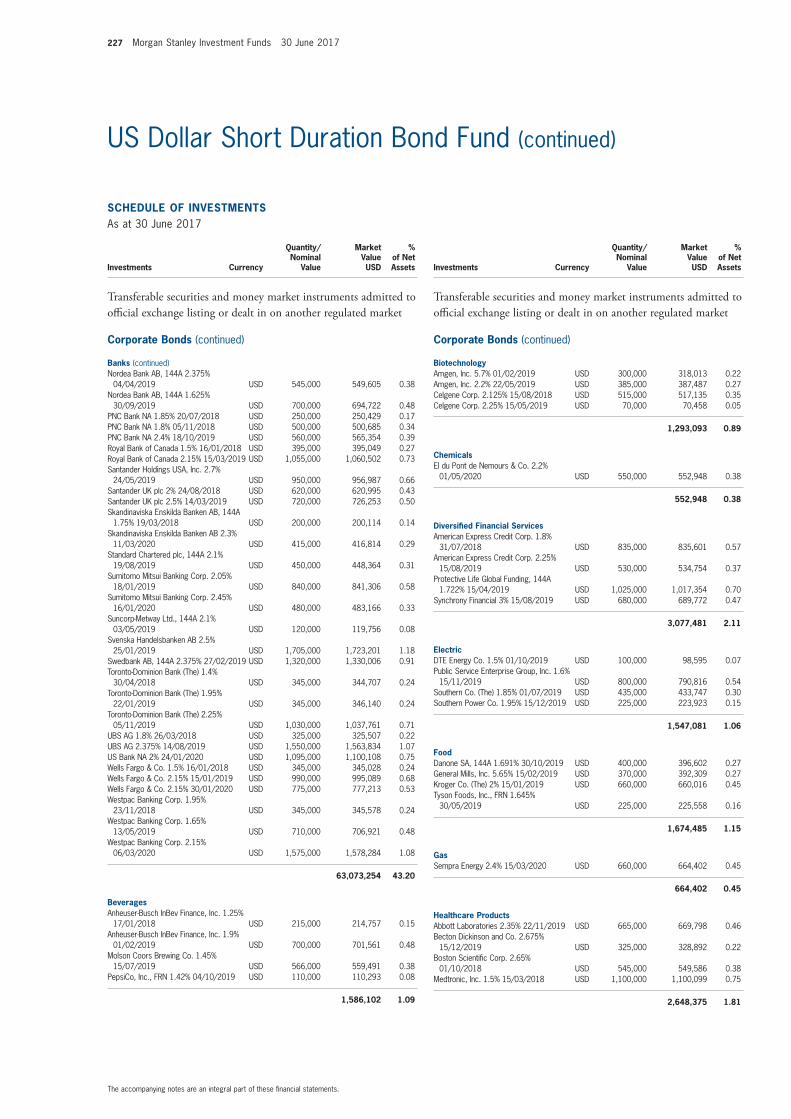
227 Morgan Stanley Investment Funds 30 June 2017
The accompanying notes are an integral part of these fi nancial statements.
US Dollar Short Duration Bond Fund (continued)
SCHEDULE OF INVESTMENTSAs at 30 June 2017
Investments Currency
Quantity/Nominal
Value
Market Value USD
% of Net Assets
Transferable securities and money market instruments admitted to offi cial exchange listing or dealt in on another regulated market
Corporate Bonds (continued)
Banks (continued)Nordea Bank AB, 144A 2.375%
04/04/2019 USD 545,000 549,605 0.38 Nordea Bank AB, 144A 1.625%
30/09/2019 USD 700,000 694,722 0.48 PNC Bank NA 1.85% 20/07/2018 USD 250,000 250,429 0.17 PNC Bank NA 1.8% 05/11/2018 USD 500,000 500,685 0.34 PNC Bank NA 2.4% 18/10/2019 USD 560,000 565,354 0.39 Royal Bank of Canada 1.5% 16/01/2018 USD 395,000 395,049 0.27 Royal Bank of Canada 2.15% 15/03/2019 USD 1,055,000 1,060,502 0.73 Santander Holdings USA, Inc. 2.7%
24/05/2019 USD 950,000 956,987 0.66 Santander UK plc 2% 24/08/2018 USD 620,000 620,995 0.43 Santander UK plc 2.5% 14/03/2019 USD 720,000 726,253 0.50 Skandinaviska Enskilda Banken AB, 144A
1.75% 19/03/2018 USD 200,000 200,114 0.14 Skandinaviska Enskilda Banken AB 2.3%
11/03/2020 USD 415,000 416,814 0.29 Standard Chartered plc, 144A 2.1%
19/08/2019 USD 450,000 448,364 0.31 Sumitomo Mitsui Banking Corp. 2.05%
18/01/2019 USD 840,000 841,306 0.58 Sumitomo Mitsui Banking Corp. 2.45%
16/01/2020 USD 480,000 483,166 0.33 Suncorp-Metway Ltd., 144A 2.1%
03/05/2019 USD 120,000 119,756 0.08 Svenska Handelsbanken AB 2.5%
25/01/2019 USD 1,705,000 1,723,201 1.18 Swedbank AB, 144A 2.375% 27/02/2019 USD 1,320,000 1,330,006 0.91 Toronto-Dominion Bank (The) 1.4%
30/04/2018 USD 345,000 344,707 0.24 Toronto-Dominion Bank (The) 1.95%
22/01/2019 USD 345,000 346,140 0.24 Toronto-Dominion Bank (The) 2.25%
05/11/2019 USD 1,030,000 1,037,761 0.71 UBS AG 1.8% 26/03/2018 USD 325,000 325,507 0.22 UBS AG 2.375% 14/08/2019 USD 1,550,000 1,563,834 1.07 US Bank NA 2% 24/01/2020 USD 1,095,000 1,100,108 0.75 Wells Fargo & Co. 1.5% 16/01/2018 USD 345,000 345,028 0.24 Wells Fargo & Co. 2.15% 15/01/2019 USD 990,000 995,089 0.68 Wells Fargo & Co. 2.15% 30/01/2020 USD 775,000 777,213 0.53 Westpac Banking Corp. 1.95%
23/11/2018 USD 345,000 345,578 0.24 Westpac Banking Corp. 1.65%
13/05/2019 USD 710,000 706,921 0.48 Westpac Banking Corp. 2.15%
06/03/2020 USD 1,575,000 1,578,284 1.08
63,073,254 43.20
BeveragesAnheuser-Busch InBev Finance, Inc. 1.25%
17/01/2018 USD 215,000 214,757 0.15 Anheuser-Busch InBev Finance, Inc. 1.9%
01/02/2019 USD 700,000 701,561 0.48 Molson Coors Brewing Co. 1.45%
15/07/2019 USD 566,000 559,491 0.38 PepsiCo, Inc., FRN 1.42% 04/10/2019 USD 110,000 110,293 0.08
1,586,102 1.09
SCHEDULE OF INVESTMENTSAs at 30 June 2017
Investments Currency
Quantity/Nominal
Value
Market Value USD
% of Net Assets
Transferable securities and money market instruments admitted to offi cial exchange listing or dealt in on another regulated market
Corporate Bonds (continued)
BiotechnologyAmgen, Inc. 5.7% 01/02/2019 USD 300,000 318,013 0.22 Amgen, Inc. 2.2% 22/05/2019 USD 385,000 387,487 0.27 Celgene Corp. 2.125% 15/08/2018 USD 515,000 517,135 0.35 Celgene Corp. 2.25% 15/05/2019 USD 70,000 70,458 0.05
1,293,093 0.89
ChemicalsEI du Pont de Nemours & Co. 2.2%
01/05/2020 USD 550,000 552,948 0.38
552,948 0.38
Diversifi ed Financial ServicesAmerican Express Credit Corp. 1.8%
31/07/2018 USD 835,000 835,601 0.57 American Express Credit Corp. 2.25%
15/08/2019 USD 530,000 534,754 0.37 Protective Life Global Funding, 144A
1.722% 15/04/2019 USD 1,025,000 1,017,354 0.70 Synchrony Financial 3% 15/08/2019 USD 680,000 689,772 0.47
3,077,481 2.11
ElectricDTE Energy Co. 1.5% 01/10/2019 USD 100,000 98,595 0.07 Public Service Enterprise Group, Inc. 1.6%
15/11/2019 USD 800,000 790,816 0.54 Southern Co. (The) 1.85% 01/07/2019 USD 435,000 433,747 0.30 Southern Power Co. 1.95% 15/12/2019 USD 225,000 223,923 0.15
1,547,081 1.06
FoodDanone SA, 144A 1.691% 30/10/2019 USD 400,000 396,602 0.27 General Mills, Inc. 5.65% 15/02/2019 USD 370,000 392,309 0.27 Kroger Co. (The) 2% 15/01/2019 USD 660,000 660,016 0.45 Tyson Foods, Inc., FRN 1.645%
30/05/2019 USD 225,000 225,558 0.16
1,674,485 1.15
GasSempra Energy 2.4% 15/03/2020 USD 660,000 664,402 0.45
664,402 0.45
Healthcare ProductsAbbott Laboratories 2.35% 22/11/2019 USD 665,000 669,798 0.46 Becton Dickinson and Co. 2.675%
15/12/2019 USD 325,000 328,892 0.22 Boston Scientifi c Corp. 2.65%
01/10/2018 USD 545,000 549,586 0.38 Medtronic, Inc. 1.5% 15/03/2018 USD 1,100,000 1,100,099 0.75
2,648,375 1.81
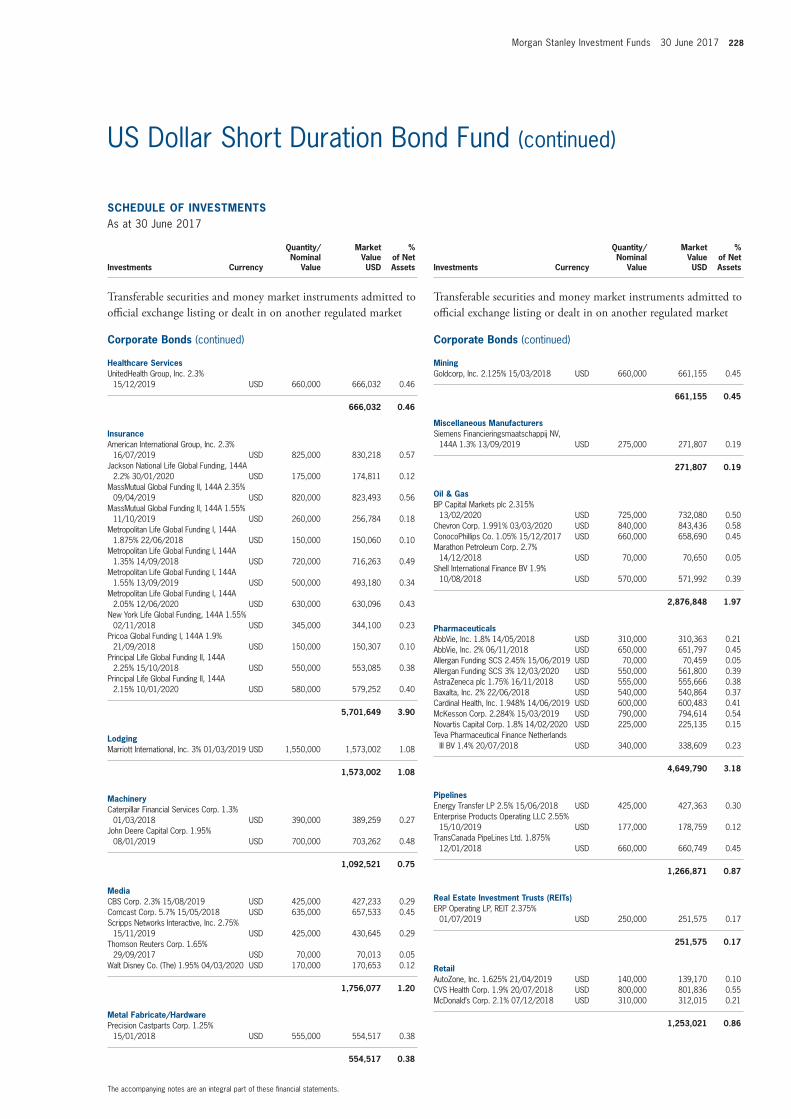
Morgan Stanley Investment Funds 30 June 2017 228
The accompanying notes are an integral part of these fi nancial statements.
US Dollar Short Duration Bond Fund (continued)
SCHEDULE OF INVESTMENTSAs at 30 June 2017
Investments Currency
Quantity/Nominal
Value
Market Value USD
% of Net Assets
Transferable securities and money market instruments admitted to offi cial exchange listing or dealt in on another regulated market
Corporate Bonds (continued)
Healthcare ServicesUnitedHealth Group, Inc. 2.3%
15/12/2019 USD 660,000 666,032 0.46
666,032 0.46
InsuranceAmerican International Group, Inc. 2.3%
16/07/2019 USD 825,000 830,218 0.57 Jackson National Life Global Funding, 144A
2.2% 30/01/2020 USD 175,000 174,811 0.12 MassMutual Global Funding II, 144A 2.35%
09/04/2019 USD 820,000 823,493 0.56 MassMutual Global Funding II, 144A 1.55%
11/10/2019 USD 260,000 256,784 0.18 Metropolitan Life Global Funding I, 144A
1.875% 22/06/2018 USD 150,000 150,060 0.10 Metropolitan Life Global Funding I, 144A
1.35% 14/09/2018 USD 720,000 716,263 0.49 Metropolitan Life Global Funding I, 144A
1.55% 13/09/2019 USD 500,000 493,180 0.34 Metropolitan Life Global Funding I, 144A
2.05% 12/06/2020 USD 630,000 630,096 0.43 New York Life Global Funding, 144A 1.55%
02/11/2018 USD 345,000 344,100 0.23 Pricoa Global Funding I, 144A 1.9%
21/09/2018 USD 150,000 150,307 0.10 Principal Life Global Funding II, 144A
2.25% 15/10/2018 USD 550,000 553,085 0.38 Principal Life Global Funding II, 144A
2.15% 10/01/2020 USD 580,000 579,252 0.40
5,701,649 3.90
LodgingMarriott International, Inc. 3% 01/03/2019 USD 1,550,000 1,573,002 1.08
1,573,002 1.08
MachineryCaterpillar Financial Services Corp. 1.3%
01/03/2018 USD 390,000 389,259 0.27 John Deere Capital Corp. 1.95%
08/01/2019 USD 700,000 703,262 0.48
1,092,521 0.75
MediaCBS Corp. 2.3% 15/08/2019 USD 425,000 427,233 0.29 Comcast Corp. 5.7% 15/05/2018 USD 635,000 657,533 0.45 Scripps Networks Interactive, Inc. 2.75%
15/11/2019 USD 425,000 430,645 0.29 Thomson Reuters Corp. 1.65%
29/09/2017 USD 70,000 70,013 0.05 Walt Disney Co. (The) 1.95% 04/03/2020 USD 170,000 170,653 0.12
1,756,077 1.20
Metal Fabricate/HardwarePrecision Castparts Corp. 1.25%
15/01/2018 USD 555,000 554,517 0.38
554,517 0.38
SCHEDULE OF INVESTMENTSAs at 30 June 2017
Investments Currency
Quantity/Nominal
Value
Market Value USD
% of Net Assets
Transferable securities and money market instruments admitted to offi cial exchange listing or dealt in on another regulated market
Corporate Bonds (continued)
MiningGoldcorp, Inc. 2.125% 15/03/2018 USD 660,000 661,155 0.45
661,155 0.45
Miscellaneous ManufacturersSiemens Financieringsmaatschappij NV,
144A 1.3% 13/09/2019 USD 275,000 271,807 0.19
271,807 0.19
Oil & GasBP Capital Markets plc 2.315%
13/02/2020 USD 725,000 732,080 0.50 Chevron Corp. 1.991% 03/03/2020 USD 840,000 843,436 0.58 ConocoPhillips Co. 1.05% 15/12/2017 USD 660,000 658,690 0.45 Marathon Petroleum Corp. 2.7%
14/12/2018 USD 70,000 70,650 0.05 Shell International Finance BV 1.9%
10/08/2018 USD 570,000 571,992 0.39
2,876,848 1.97
PharmaceuticalsAbbVie, Inc. 1.8% 14/05/2018 USD 310,000 310,363 0.21 AbbVie, Inc. 2% 06/11/2018 USD 650,000 651,797 0.45 Allergan Funding SCS 2.45% 15/06/2019 USD 70,000 70,459 0.05 Allergan Funding SCS 3% 12/03/2020 USD 550,000 561,800 0.39 AstraZeneca plc 1.75% 16/11/2018 USD 555,000 555,666 0.38 Baxalta, Inc. 2% 22/06/2018 USD 540,000 540,864 0.37 Cardinal Health, Inc. 1.948% 14/06/2019 USD 600,000 600,483 0.41 McKesson Corp. 2.284% 15/03/2019 USD 790,000 794,614 0.54 Novartis Capital Corp. 1.8% 14/02/2020 USD 225,000 225,135 0.15 Teva Pharmaceutical Finance Netherlands
III BV 1.4% 20/07/2018 USD 340,000 338,609 0.23
4,649,790 3.18
PipelinesEnergy Transfer LP 2.5% 15/06/2018 USD 425,000 427,363 0.30 Enterprise Products Operating LLC 2.55%
15/10/2019 USD 177,000 178,759 0.12 TransCanada PipeLines Ltd. 1.875%
12/01/2018 USD 660,000 660,749 0.45
1,266,871 0.87
Real Estate Investment Trusts (REITs)ERP Operating LP, REIT 2.375%
01/07/2019 USD 250,000 251,575 0.17
251,575 0.17
RetailAutoZone, Inc. 1.625% 21/04/2019 USD 140,000 139,170 0.10 CVS Health Corp. 1.9% 20/07/2018 USD 800,000 801,836 0.55 McDonald’s Corp. 2.1% 07/12/2018 USD 310,000 312,015 0.21
1,253,021 0.86
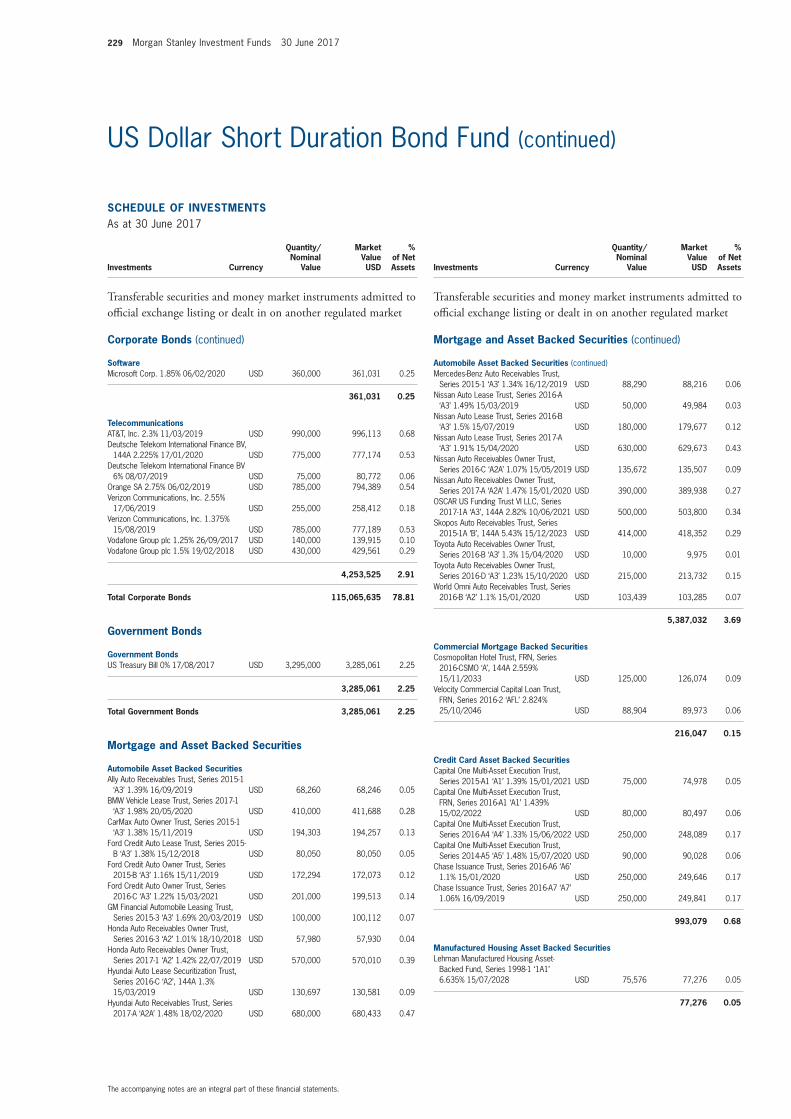
229 Morgan Stanley Investment Funds 30 June 2017
The accompanying notes are an integral part of these fi nancial statements.
US Dollar Short Duration Bond Fund (continued)
SCHEDULE OF INVESTMENTSAs at 30 June 2017
Investments Currency
Quantity/Nominal
Value
Market Value USD
% of Net Assets
Transferable securities and money market instruments admitted to offi cial exchange listing or dealt in on another regulated market
Corporate Bonds (continued)
SoftwareMicrosoft Corp. 1.85% 06/02/2020 USD 360,000 361,031 0.25
361,031 0.25
TelecommunicationsAT&T, Inc. 2.3% 11/03/2019 USD 990,000 996,113 0.68 Deutsche Telekom International Finance BV,
144A 2.225% 17/01/2020 USD 775,000 777,174 0.53 Deutsche Telekom International Finance BV
6% 08/07/2019 USD 75,000 80,772 0.06 Orange SA 2.75% 06/02/2019 USD 785,000 794,389 0.54 Verizon Communications, Inc. 2.55%
17/06/2019 USD 255,000 258,412 0.18 Verizon Communications, Inc. 1.375%
15/08/2019 USD 785,000 777,189 0.53 Vodafone Group plc 1.25% 26/09/2017 USD 140,000 139,915 0.10 Vodafone Group plc 1.5% 19/02/2018 USD 430,000 429,561 0.29
4,253,525 2.91
Total Corporate Bonds 115,065,635 78.81
Government Bonds
Government BondsUS Treasury Bill 0% 17/08/2017 USD 3,295,000 3,285,061 2.25
3,285,061 2.25
Total Government Bonds 3,285,061 2.25
Mortgage and Asset Backed Securities
Automobile Asset Backed SecuritiesAlly Auto Receivables Trust, Series 2015-1
‘A3’ 1.39% 16/09/2019 USD 68,260 68,246 0.05 BMW Vehicle Lease Trust, Series 2017-1
‘A3’ 1.98% 20/05/2020 USD 410,000 411,688 0.28 CarMax Auto Owner Trust, Series 2015-1
‘A3’ 1.38% 15/11/2019 USD 194,303 194,257 0.13 Ford Credit Auto Lease Trust, Series 2015-
B ‘A3’ 1.38% 15/12/2018 USD 80,050 80,050 0.05 Ford Credit Auto Owner Trust, Series
2015-B ‘A3’ 1.16% 15/11/2019 USD 172,294 172,073 0.12 Ford Credit Auto Owner Trust, Series
2016-C ‘A3’ 1.22% 15/03/2021 USD 201,000 199,513 0.14 GM Financial Automobile Leasing Trust,
Series 2015-3 ‘A3’ 1.69% 20/03/2019 USD 100,000 100,112 0.07 Honda Auto Receivables Owner Trust,
Series 2016-3 ‘A2’ 1.01% 18/10/2018 USD 57,980 57,930 0.04 Honda Auto Receivables Owner Trust,
Series 2017-1 ‘A2’ 1.42% 22/07/2019 USD 570,000 570,010 0.39 Hyundai Auto Lease Securitization Trust,
Series 2016-C ‘A2’, 144A 1.3% 15/03/2019 USD 130,697 130,581 0.09
Hyundai Auto Receivables Trust, Series 2017-A ‘A2A’ 1.48% 18/02/2020 USD 680,000 680,433 0.47
SCHEDULE OF INVESTMENTSAs at 30 June 2017
Investments Currency
Quantity/Nominal
Value
Market Value USD
% of Net Assets
Transferable securities and money market instruments admitted to offi cial exchange listing or dealt in on another regulated market
Mortgage and Asset Backed Securities (continued)
Automobile Asset Backed Securities (continued)Mercedes-Benz Auto Receivables Trust,
Series 2015-1 ‘A3’ 1.34% 16/12/2019 USD 88,290 88,216 0.06 Nissan Auto Lease Trust, Series 2016-A
‘A3’ 1.49% 15/03/2019 USD 50,000 49,984 0.03 Nissan Auto Lease Trust, Series 2016-B
‘A3’ 1.5% 15/07/2019 USD 180,000 179,677 0.12 Nissan Auto Lease Trust, Series 2017-A
‘A3’ 1.91% 15/04/2020 USD 630,000 629,673 0.43 Nissan Auto Receivables Owner Trust,
Series 2016-C ‘A2A’ 1.07% 15/05/2019 USD 135,672 135,507 0.09 Nissan Auto Receivables Owner Trust,
Series 2017-A ‘A2A’ 1.47% 15/01/2020 USD 390,000 389,938 0.27 OSCAR US Funding Trust VI LLC, Series
2017-1A ‘A3’, 144A 2.82% 10/06/2021 USD 500,000 503,800 0.34 Skopos Auto Receivables Trust, Series
2015-1A ‘B’, 144A 5.43% 15/12/2023 USD 414,000 418,352 0.29 Toyota Auto Receivables Owner Trust,
Series 2016-B ‘A3’ 1.3% 15/04/2020 USD 10,000 9,975 0.01 Toyota Auto Receivables Owner Trust,
Series 2016-D ‘A3’ 1.23% 15/10/2020 USD 215,000 213,732 0.15 World Omni Auto Receivables Trust, Series
2016-B ‘A2’ 1.1% 15/01/2020 USD 103,439 103,285 0.07
5,387,032 3.69
Commercial Mortgage Backed SecuritiesCosmopolitan Hotel Trust, FRN, Series
2016-CSMO ‘A’, 144A 2.559% 15/11/2033 USD 125,000 126,074 0.09
Velocity Commercial Capital Loan Trust, FRN, Series 2016-2 ‘AFL’ 2.824% 25/10/2046 USD 88,904 89,973 0.06
216,047 0.15
Credit Card Asset Backed SecuritiesCapital One Multi-Asset Execution Trust,
Series 2015-A1 ‘A1’ 1.39% 15/01/2021 USD 75,000 74,978 0.05 Capital One Multi-Asset Execution Trust,
FRN, Series 2016-A1 ‘A1’ 1.439% 15/02/2022 USD 80,000 80,497 0.06
Capital One Multi-Asset Execution Trust, Series 2016-A4 ‘A4’ 1.33% 15/06/2022 USD 250,000 248,089 0.17
Capital One Multi-Asset Execution Trust, Series 2014-A5 ‘A5’ 1.48% 15/07/2020 USD 90,000 90,028 0.06
Chase Issuance Trust, Series 2016-A6 ‘A6’ 1.1% 15/01/2020 USD 250,000 249,646 0.17
Chase Issuance Trust, Series 2016-A7 ‘A7’ 1.06% 16/09/2019 USD 250,000 249,841 0.17
993,079 0.68
Manufactured Housing Asset Backed SecuritiesLehman Manufactured Housing Asset-
Backed Fund, Series 1998-1 ‘1A1’ 6.635% 15/07/2028 USD 75,576 77,276 0.05
77,276 0.05
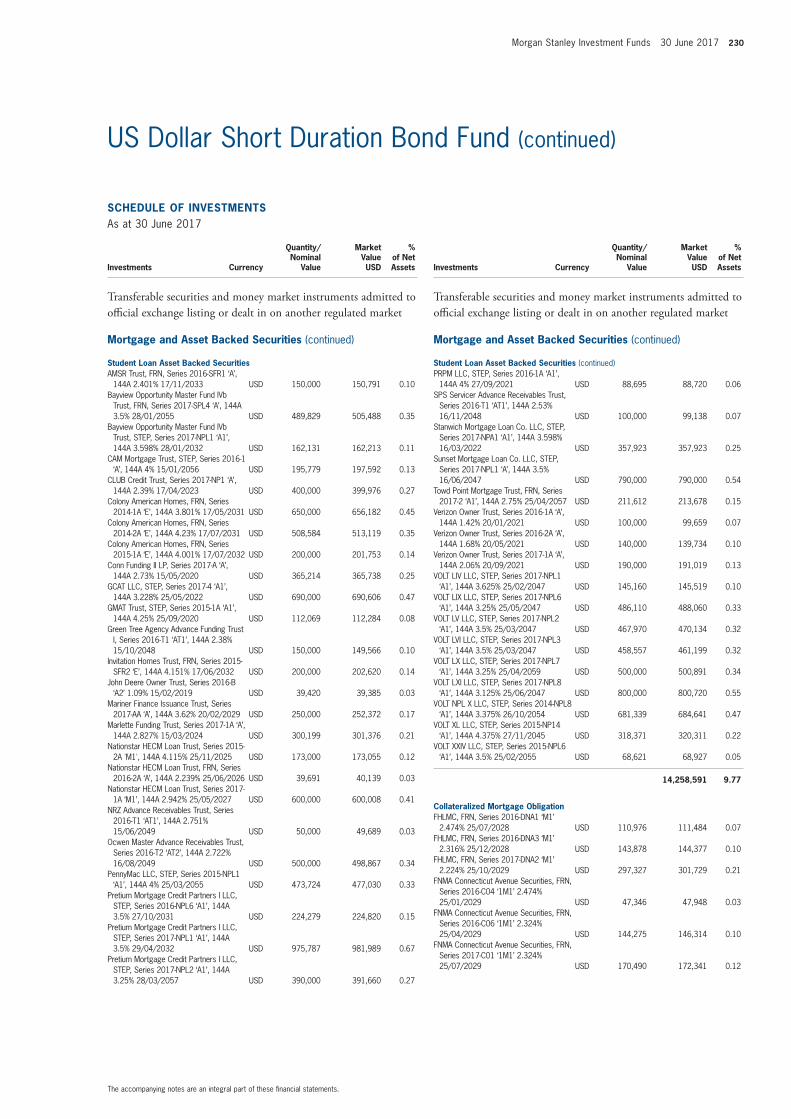
Morgan Stanley Investment Funds 30 June 2017 230
The accompanying notes are an integral part of these fi nancial statements.
US Dollar Short Duration Bond Fund (continued)
SCHEDULE OF INVESTMENTSAs at 30 June 2017
Investments Currency
Quantity/Nominal
Value
Market Value USD
% of Net Assets
Transferable securities and money market instruments admitted to offi cial exchange listing or dealt in on another regulated market
Mortgage and Asset Backed Securities (continued)
Student Loan Asset Backed SecuritiesAMSR Trust, FRN, Series 2016-SFR1 ‘A’,
144A 2.401% 17/11/2033 USD 150,000 150,791 0.10 Bayview Opportunity Master Fund IVb
Trust, FRN, Series 2017-SPL4 ‘A’, 144A 3.5% 28/01/2055 USD 489,829 505,488 0.35
Bayview Opportunity Master Fund IVb Trust, STEP, Series 2017-NPL1 ‘A1’, 144A 3.598% 28/01/2032 USD 162,131 162,213 0.11
CAM Mortgage Trust, STEP, Series 2016-1 ‘A’, 144A 4% 15/01/2056 USD 195,779 197,592 0.13
CLUB Credit Trust, Series 2017-NP1 ‘A’, 144A 2.39% 17/04/2023 USD 400,000 399,976 0.27
Colony American Homes, FRN, Series 2014-1A ‘E’, 144A 3.801% 17/05/2031 USD 650,000 656,182 0.45
Colony American Homes, FRN, Series 2014-2A ‘E’, 144A 4.23% 17/07/2031 USD 508,584 513,119 0.35
Colony American Homes, FRN, Series 2015-1A ‘E’, 144A 4.001% 17/07/2032 USD 200,000 201,753 0.14
Conn Funding II LP, Series 2017-A ‘A’, 144A 2.73% 15/05/2020 USD 365,214 365,738 0.25
GCAT LLC, STEP, Series 2017-4 ‘A1’, 144A 3.228% 25/05/2022 USD 690,000 690,606 0.47
GMAT Trust, STEP, Series 2015-1A ‘A1’, 144A 4.25% 25/09/2020 USD 112,069 112,284 0.08
Green Tree Agency Advance Funding Trust I, Series 2016-T1 ‘AT1’, 144A 2.38% 15/10/2048 USD 150,000 149,566 0.10
Invitation Homes Trust, FRN, Series 2015-SFR2 ‘E’, 144A 4.151% 17/06/2032 USD 200,000 202,620 0.14
John Deere Owner Trust, Series 2016-B ‘A2’ 1.09% 15/02/2019 USD 39,420 39,385 0.03
Mariner Finance Issuance Trust, Series 2017-AA ‘A’, 144A 3.62% 20/02/2029 USD 250,000 252,372 0.17
Marlette Funding Trust, Series 2017-1A ‘A’, 144A 2.827% 15/03/2024 USD 300,199 301,376 0.21
Nationstar HECM Loan Trust, Series 2015-2A 'M1', 144A 4.115% 25/11/2025 USD 173,000 173,055 0.12
Nationstar HECM Loan Trust, FRN, Series 2016-2A ‘A’, 144A 2.239% 25/06/2026 USD 39,691 40,139 0.03
Nationstar HECM Loan Trust, Series 2017-1A ‘M1’, 144A 2.942% 25/05/2027 USD 600,000 600,008 0.41
NRZ Advance Receivables Trust, Series 2016-T1 ‘AT1’, 144A 2.751% 15/06/2049 USD 50,000 49,689 0.03
Ocwen Master Advance Receivables Trust, Series 2016-T2 ‘AT2’, 144A 2.722% 16/08/2049 USD 500,000 498,867 0.34
PennyMac LLC, STEP, Series 2015-NPL1 ‘A1’, 144A 4% 25/03/2055 USD 473,724 477,030 0.33
Pretium Mortgage Credit Partners I LLC, STEP, Series 2016-NPL6 ‘A1’, 144A 3.5% 27/10/2031 USD 224,279 224,820 0.15
Pretium Mortgage Credit Partners I LLC, STEP, Series 2017-NPL1 ‘A1’, 144A 3.5% 29/04/2032 USD 975,787 981,989 0.67
Pretium Mortgage Credit Partners I LLC, STEP, Series 2017-NPL2 ‘A1’, 144A 3.25% 28/03/2057 USD 390,000 391,660 0.27
SCHEDULE OF INVESTMENTSAs at 30 June 2017
Investments Currency
Quantity/Nominal
Value
Market Value USD
% of Net Assets
Transferable securities and money market instruments admitted to offi cial exchange listing or dealt in on another regulated market
Mortgage and Asset Backed Securities (continued)
Student Loan Asset Backed Securities (continued)PRPM LLC, STEP, Series 2016-1A ‘A1’,
144A 4% 27/09/2021 USD 88,695 88,720 0.06 SPS Servicer Advance Receivables Trust,
Series 2016-T1 ‘AT1’, 144A 2.53% 16/11/2048 USD 100,000 99,138 0.07
Stanwich Mortgage Loan Co. LLC, STEP, Series 2017-NPA1 ‘A1’, 144A 3.598% 16/03/2022 USD 357,923 357,923 0.25
Sunset Mortgage Loan Co. LLC, STEP, Series 2017-NPL1 ‘A’, 144A 3.5% 16/06/2047 USD 790,000 790,000 0.54
Towd Point Mortgage Trust, FRN, Series 2017-2 ‘A1’, 144A 2.75% 25/04/2057 USD 211,612 213,678 0.15
Verizon Owner Trust, Series 2016-1A ‘A’, 144A 1.42% 20/01/2021 USD 100,000 99,659 0.07
Verizon Owner Trust, Series 2016-2A ‘A’, 144A 1.68% 20/05/2021 USD 140,000 139,734 0.10
Verizon Owner Trust, Series 2017-1A ‘A’, 144A 2.06% 20/09/2021 USD 190,000 191,019 0.13
VOLT LIV LLC, STEP, Series 2017-NPL1 ‘A1’, 144A 3.625% 25/02/2047 USD 145,160 145,519 0.10
VOLT LIX LLC, STEP, Series 2017-NPL6 ‘A1’, 144A 3.25% 25/05/2047 USD 486,110 488,060 0.33
VOLT LV LLC, STEP, Series 2017-NPL2 ‘A1’, 144A 3.5% 25/03/2047 USD 467,970 470,134 0.32
VOLT LVI LLC, STEP, Series 2017-NPL3 ‘A1’, 144A 3.5% 25/03/2047 USD 458,557 461,199 0.32
VOLT LX LLC, STEP, Series 2017-NPL7 ‘A1’, 144A 3.25% 25/04/2059 USD 500,000 500,891 0.34
VOLT LXI LLC, STEP, Series 2017-NPL8 ‘A1’, 144A 3.125% 25/06/2047 USD 800,000 800,720 0.55
VOLT NPL X LLC, STEP, Series 2014-NPL8 ‘A1’, 144A 3.375% 26/10/2054 USD 681,339 684,641 0.47
VOLT XL LLC, STEP, Series 2015-NP14 ‘A1’, 144A 4.375% 27/11/2045 USD 318,371 320,311 0.22
VOLT XXIV LLC, STEP, Series 2015-NPL6 ‘A1’, 144A 3.5% 25/02/2055 USD 68,621 68,927 0.05
14,258,591 9.77
Collateralized Mortgage ObligationFHLMC, FRN, Series 2016-DNA1 ‘M1’
2.474% 25/07/2028 USD 110,976 111,484 0.07 FHLMC, FRN, Series 2016-DNA3 ‘M1’
2.316% 25/12/2028 USD 143,878 144,377 0.10 FHLMC, FRN, Series 2017-DNA2 ‘M1’
2.224% 25/10/2029 USD 297,327 301,729 0.21 FNMA Connecticut Avenue Securities, FRN,
Series 2016-C04 ‘1M1’ 2.474% 25/01/2029 USD 47,346 47,948 0.03
FNMA Connecticut Avenue Securities, FRN, Series 2016-C06 ‘1M1’ 2.324% 25/04/2029 USD 144,275 146,314 0.10
FNMA Connecticut Avenue Securities, FRN, Series 2017-C01 ‘1M1’ 2.324% 25/07/2029 USD 170,490 172,341 0.12
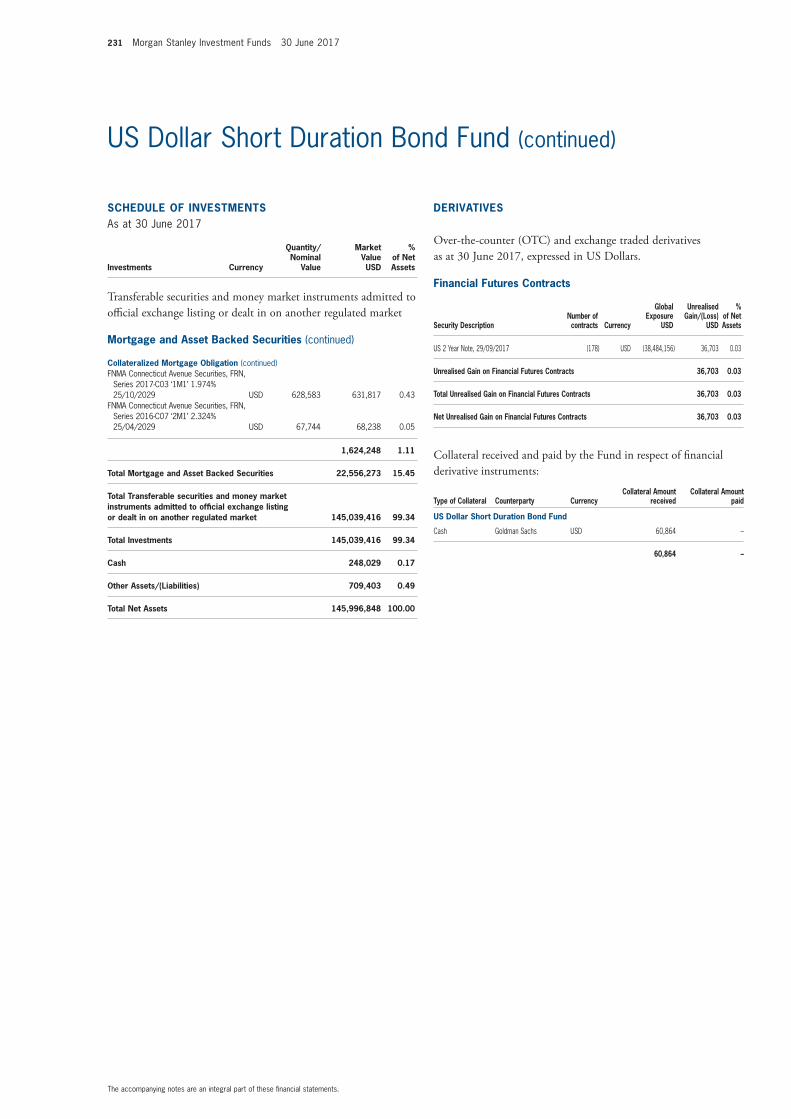
231 Morgan Stanley Investment Funds 30 June 2017
The accompanying notes are an integral part of these fi nancial statements.
US Dollar Short Duration Bond Fund (continued)
Financial Futures Contracts
Security DescriptionNumber of contracts Currency
Global Exposure
USD
Unrealised Gain/(Loss)
USD
% of Net Assets
US 2 Year Note, 29/09/2017 (178) USD (38,484,156) 36,703 0.03
Unrealised Gain on Financial Futures Contracts 36,703 0.03
Total Unrealised Gain on Financial Futures Contracts 36,703 0.03
Net Unrealised Gain on Financial Futures Contracts 36,703 0.03
Collateral received and paid by the Fund in respect of fi nancial derivative instruments:
Type of Collateral Counterparty CurrencyCollateral Amount
receivedCollateral Amount
paid
US Dollar Short Duration Bond Fund
Cash Goldman Sachs USD 60,864 –
60,864 –
SCHEDULE OF INVESTMENTSAs at 30 June 2017
Investments Currency
Quantity/Nominal
Value
Market Value USD
% of Net Assets
Transferable securities and money market instruments admitted to offi cial exchange listing or dealt in on another regulated market
Mortgage and Asset Backed Securities (continued)
Collateralized Mortgage Obligation (continued)FNMA Connecticut Avenue Securities, FRN,
Series 2017-C03 ‘1M1’ 1.974% 25/10/2029 USD 628,583 631,817 0.43
FNMA Connecticut Avenue Securities, FRN, Series 2016-C07 ‘2M1’ 2.324% 25/04/2029 USD 67,744 68,238 0.05
1,624,248 1.11
Total Mortgage and Asset Backed Securities 22,556,273 15.45
Total Transferable securities and money market instruments admitted to offi cial exchange listing or dealt in on another regulated market 145,039,416 99.34
Total Investments 145,039,416 99.34
Cash 248,029 0.17
Other Assets/(Liabilities) 709,403 0.49
Total Net Assets 145,996,848 100.00
DERIVATIVES
Over-the-counter (OTC) and exchange traded derivatives as at 30 June 2017, expressed in US Dollars.
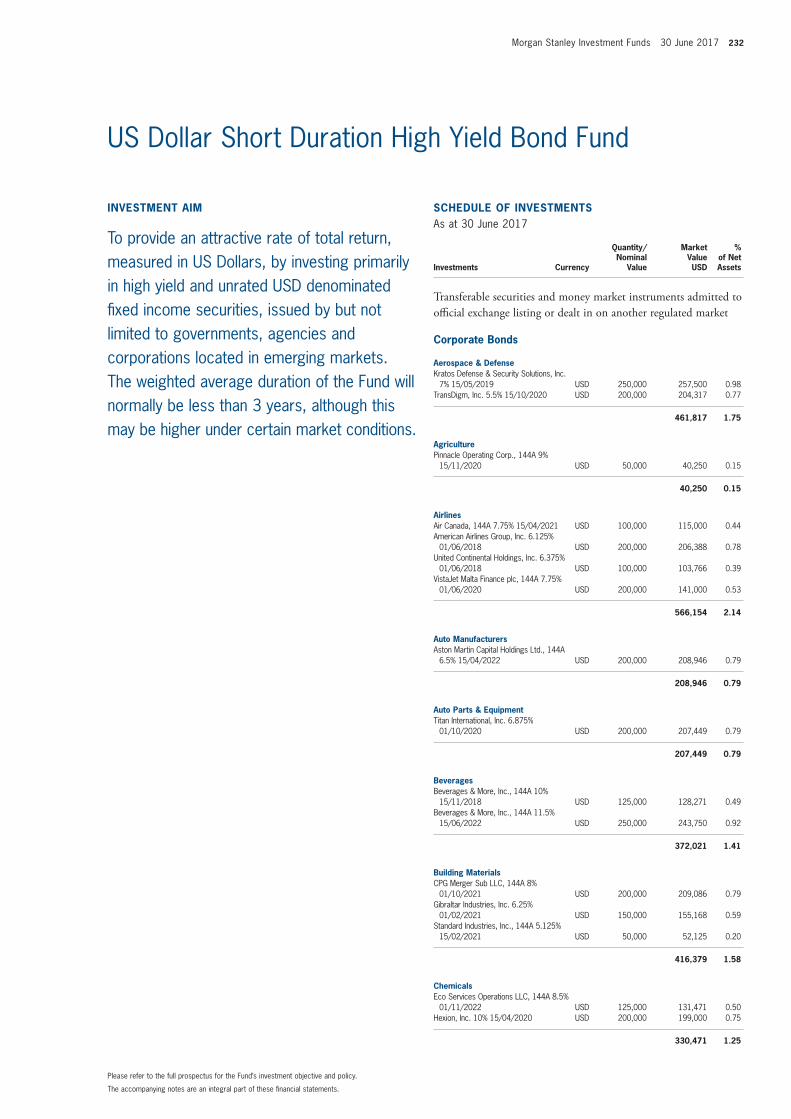
Morgan Stanley Investment Funds 30 June 2017 232
The accompanying notes are an integral part of these fi nancial statements.
Please refer to the full prospectus for the Fund’s investment objective and policy.
US Dollar Short Duration High Yield Bond Fund
INVESTMENT AIM
To provide an attractive rate of total return, measured in US Dollars, by investing primarily in high yield and unrated USD denominated fi xed income securities, issued by but not limited to governments, agencies and corporations located in emerging markets. The weighted average duration of the Fund will normally be less than 3 years, although this may be higher under certain market conditions.
SCHEDULE OF INVESTMENTSAs at 30 June 2017
Investments Currency
Quantity/Nominal
Value
Market Value USD
% of Net Assets
Transferable securities and money market instruments admitted to offi cial exchange listing or dealt in on another regulated market
Corporate Bonds
Aerospace & DefenseKratos Defense & Security Solutions, Inc.
7% 15/05/2019 USD 250,000 257,500 0.98 TransDigm, Inc. 5.5% 15/10/2020 USD 200,000 204,317 0.77
461,817 1.75
AgriculturePinnacle Operating Corp., 144A 9%
15/11/2020 USD 50,000 40,250 0.15
40,250 0.15
AirlinesAir Canada, 144A 7.75% 15/04/2021 USD 100,000 115,000 0.44 American Airlines Group, Inc. 6.125%
01/06/2018 USD 200,000 206,388 0.78 United Continental Holdings, Inc. 6.375%
01/06/2018 USD 100,000 103,766 0.39 VistaJet Malta Finance plc, 144A 7.75%
01/06/2020 USD 200,000 141,000 0.53
566,154 2.14
Auto ManufacturersAston Martin Capital Holdings Ltd., 144A
6.5% 15/04/2022 USD 200,000 208,946 0.79
208,946 0.79
Auto Parts & EquipmentTitan International, Inc. 6.875%
01/10/2020 USD 200,000 207,449 0.79
207,449 0.79
BeveragesBeverages & More, Inc., 144A 10%
15/11/2018 USD 125,000 128,271 0.49 Beverages & More, Inc., 144A 11.5%
15/06/2022 USD 250,000 243,750 0.92
372,021 1.41
Building MaterialsCPG Merger Sub LLC, 144A 8%
01/10/2021 USD 200,000 209,086 0.79 Gibraltar Industries, Inc. 6.25%
01/02/2021 USD 150,000 155,168 0.59 Standard Industries, Inc., 144A 5.125%
15/02/2021 USD 50,000 52,125 0.20
416,379 1.58
ChemicalsEco Services Operations LLC, 144A 8.5%
01/11/2022 USD 125,000 131,471 0.50 Hexion, Inc. 10% 15/04/2020 USD 200,000 199,000 0.75
330,471 1.25
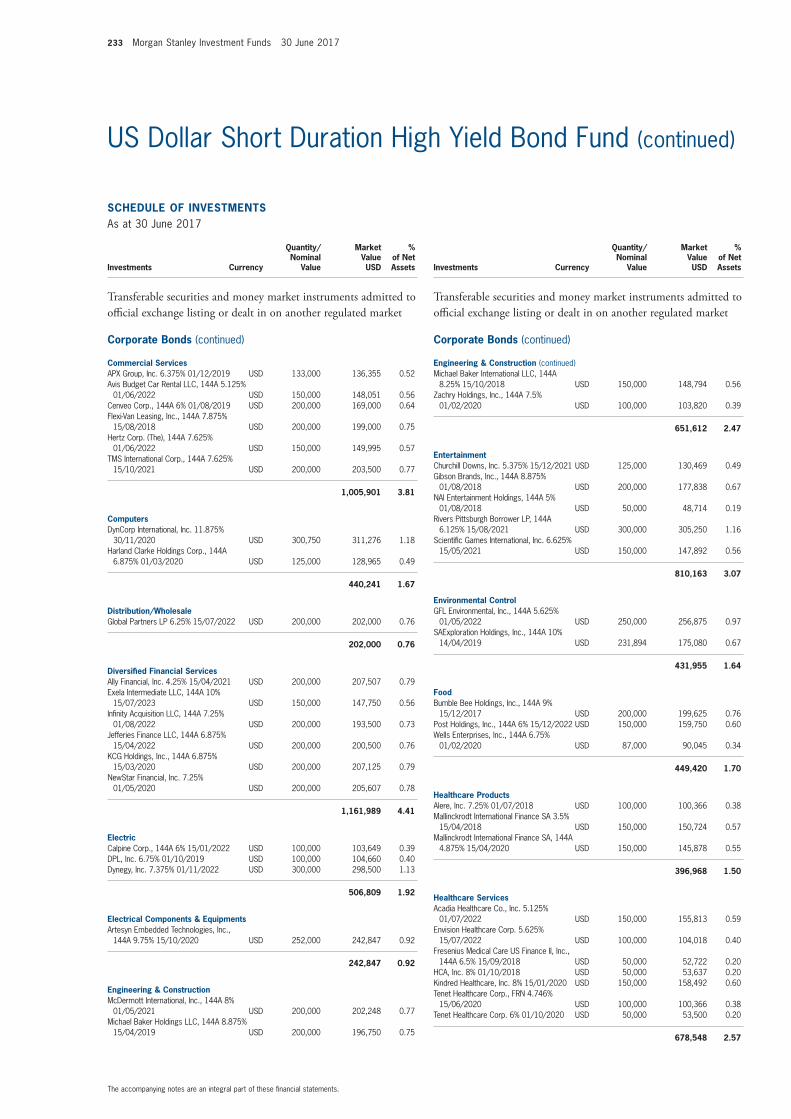
233 Morgan Stanley Investment Funds 30 June 2017
The accompanying notes are an integral part of these fi nancial statements.
US Dollar Short Duration High Yield Bond Fund (continued)
SCHEDULE OF INVESTMENTSAs at 30 June 2017
Investments Currency
Quantity/Nominal
Value
Market Value USD
% of Net Assets
Transferable securities and money market instruments admitted to offi cial exchange listing or dealt in on another regulated market
Corporate Bonds (continued)
Commercial ServicesAPX Group, Inc. 6.375% 01/12/2019 USD 133,000 136,355 0.52 Avis Budget Car Rental LLC, 144A 5.125%
01/06/2022 USD 150,000 148,051 0.56 Cenveo Corp., 144A 6% 01/08/2019 USD 200,000 169,000 0.64 Flexi-Van Leasing, Inc., 144A 7.875%
15/08/2018 USD 200,000 199,000 0.75 Hertz Corp. (The), 144A 7.625%
01/06/2022 USD 150,000 149,995 0.57 TMS International Corp., 144A 7.625%
15/10/2021 USD 200,000 203,500 0.77
1,005,901 3.81
ComputersDynCorp International, Inc. 11.875%
30/11/2020 USD 300,750 311,276 1.18 Harland Clarke Holdings Corp., 144A
6.875% 01/03/2020 USD 125,000 128,965 0.49
440,241 1.67
Distribution/WholesaleGlobal Partners LP 6.25% 15/07/2022 USD 200,000 202,000 0.76
202,000 0.76
Diversifi ed Financial ServicesAlly Financial, Inc. 4.25% 15/04/2021 USD 200,000 207,507 0.79 Exela Intermediate LLC, 144A 10%
15/07/2023 USD 150,000 147,750 0.56 Infi nity Acquisition LLC, 144A 7.25%
01/08/2022 USD 200,000 193,500 0.73 Jefferies Finance LLC, 144A 6.875%
15/04/2022 USD 200,000 200,500 0.76 KCG Holdings, Inc., 144A 6.875%
15/03/2020 USD 200,000 207,125 0.79 NewStar Financial, Inc. 7.25%
01/05/2020 USD 200,000 205,607 0.78
1,161,989 4.41
ElectricCalpine Corp., 144A 6% 15/01/2022 USD 100,000 103,649 0.39 DPL, Inc. 6.75% 01/10/2019 USD 100,000 104,660 0.40 Dynegy, Inc. 7.375% 01/11/2022 USD 300,000 298,500 1.13
506,809 1.92
Electrical Components & EquipmentsArtesyn Embedded Technologies, Inc.,
144A 9.75% 15/10/2020 USD 252,000 242,847 0.92
242,847 0.92
Engineering & ConstructionMcDermott International, Inc., 144A 8%
01/05/2021 USD 200,000 202,248 0.77 Michael Baker Holdings LLC, 144A 8.875%
15/04/2019 USD 200,000 196,750 0.75
SCHEDULE OF INVESTMENTSAs at 30 June 2017
Investments Currency
Quantity/Nominal
Value
Market Value USD
% of Net Assets
Transferable securities and money market instruments admitted to offi cial exchange listing or dealt in on another regulated market
Corporate Bonds (continued)
Engineering & Construction (continued)Michael Baker International LLC, 144A
8.25% 15/10/2018 USD 150,000 148,794 0.56 Zachry Holdings, Inc., 144A 7.5%
01/02/2020 USD 100,000 103,820 0.39
651,612 2.47
EntertainmentChurchill Downs, Inc. 5.375% 15/12/2021 USD 125,000 130,469 0.49 Gibson Brands, Inc., 144A 8.875%
01/08/2018 USD 200,000 177,838 0.67 NAI Entertainment Holdings, 144A 5%
01/08/2018 USD 50,000 48,714 0.19 Rivers Pittsburgh Borrower LP, 144A
6.125% 15/08/2021 USD 300,000 305,250 1.16 Scientifi c Games International, Inc. 6.625%
15/05/2021 USD 150,000 147,892 0.56
810,163 3.07
Environmental ControlGFL Environmental, Inc., 144A 5.625%
01/05/2022 USD 250,000 256,875 0.97 SAExploration Holdings, Inc., 144A 10%
14/04/2019 USD 231,894 175,080 0.67
431,955 1.64
FoodBumble Bee Holdings, Inc., 144A 9%
15/12/2017 USD 200,000 199,625 0.76 Post Holdings, Inc., 144A 6% 15/12/2022 USD 150,000 159,750 0.60 Wells Enterprises, Inc., 144A 6.75%
01/02/2020 USD 87,000 90,045 0.34
449,420 1.70
Healthcare ProductsAlere, Inc. 7.25% 01/07/2018 USD 100,000 100,366 0.38 Mallinckrodt International Finance SA 3.5%
15/04/2018 USD 150,000 150,724 0.57 Mallinckrodt International Finance SA, 144A
4.875% 15/04/2020 USD 150,000 145,878 0.55
396,968 1.50
Healthcare ServicesAcadia Healthcare Co., Inc. 5.125%
01/07/2022 USD 150,000 155,813 0.59 Envision Healthcare Corp. 5.625%
15/07/2022 USD 100,000 104,018 0.40 Fresenius Medical Care US Finance II, Inc.,
144A 6.5% 15/09/2018 USD 50,000 52,722 0.20 HCA, Inc. 8% 01/10/2018 USD 50,000 53,637 0.20 Kindred Healthcare, Inc. 8% 15/01/2020 USD 150,000 158,492 0.60 Tenet Healthcare Corp., FRN 4.746%
15/06/2020 USD 100,000 100,366 0.38 Tenet Healthcare Corp. 6% 01/10/2020 USD 50,000 53,500 0.20
678,548 2.57
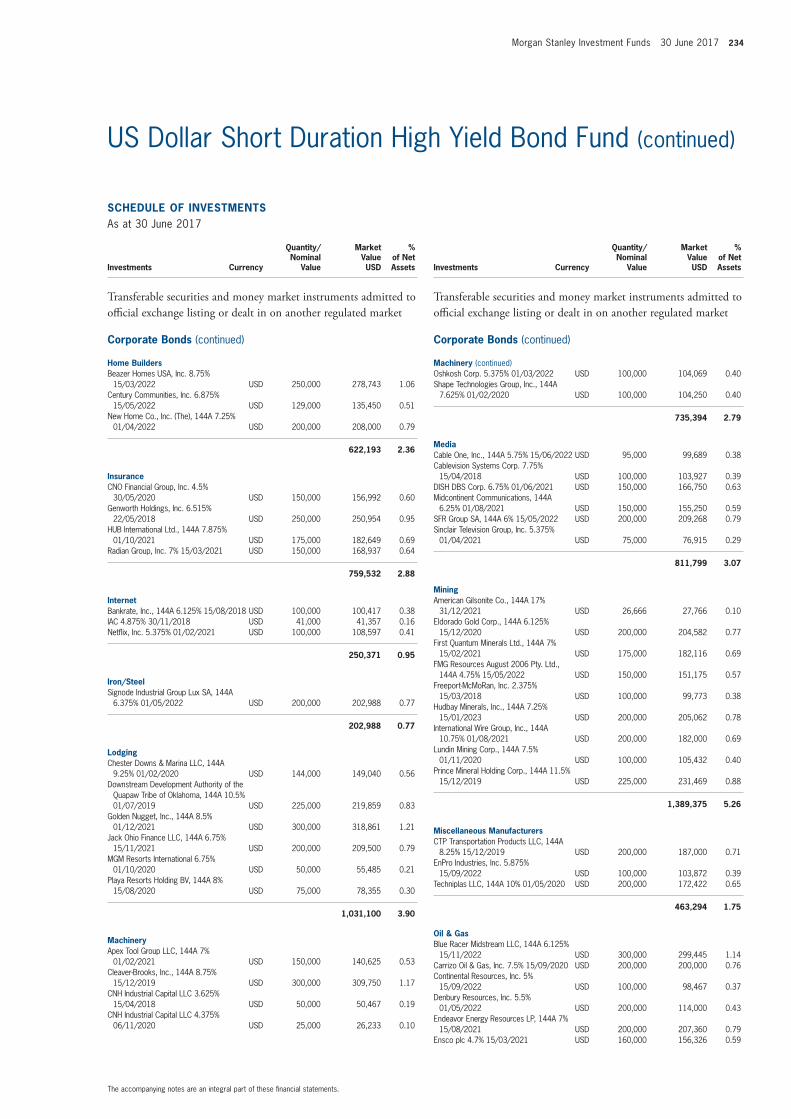
Morgan Stanley Investment Funds 30 June 2017 234
The accompanying notes are an integral part of these fi nancial statements.
US Dollar Short Duration High Yield Bond Fund (continued)
SCHEDULE OF INVESTMENTSAs at 30 June 2017
Investments Currency
Quantity/Nominal
Value
Market Value USD
% of Net Assets
Transferable securities and money market instruments admitted to offi cial exchange listing or dealt in on another regulated market
Corporate Bonds (continued)
Home BuildersBeazer Homes USA, Inc. 8.75%
15/03/2022 USD 250,000 278,743 1.06 Century Communities, Inc. 6.875%
15/05/2022 USD 129,000 135,450 0.51 New Home Co., Inc. (The), 144A 7.25%
01/04/2022 USD 200,000 208,000 0.79
622,193 2.36
InsuranceCNO Financial Group, Inc. 4.5%
30/05/2020 USD 150,000 156,992 0.60 Genworth Holdings, Inc. 6.515%
22/05/2018 USD 250,000 250,954 0.95 HUB International Ltd., 144A 7.875%
01/10/2021 USD 175,000 182,649 0.69 Radian Group, Inc. 7% 15/03/2021 USD 150,000 168,937 0.64
759,532 2.88
InternetBankrate, Inc., 144A 6.125% 15/08/2018 USD 100,000 100,417 0.38 IAC 4.875% 30/11/2018 USD 41,000 41,357 0.16 Netfl ix, Inc. 5.375% 01/02/2021 USD 100,000 108,597 0.41
250,371 0.95
Iron/SteelSignode Industrial Group Lux SA, 144A
6.375% 01/05/2022 USD 200,000 202,988 0.77
202,988 0.77
LodgingChester Downs & Marina LLC, 144A
9.25% 01/02/2020 USD 144,000 149,040 0.56 Downstream Development Authority of the
Quapaw Tribe of Oklahoma, 144A 10.5% 01/07/2019 USD 225,000 219,859 0.83
Golden Nugget, Inc., 144A 8.5% 01/12/2021 USD 300,000 318,861 1.21
Jack Ohio Finance LLC, 144A 6.75% 15/11/2021 USD 200,000 209,500 0.79
MGM Resorts International 6.75% 01/10/2020 USD 50,000 55,485 0.21
Playa Resorts Holding BV, 144A 8% 15/08/2020 USD 75,000 78,355 0.30
1,031,100 3.90
MachineryApex Tool Group LLC, 144A 7%
01/02/2021 USD 150,000 140,625 0.53 Cleaver-Brooks, Inc., 144A 8.75%
15/12/2019 USD 300,000 309,750 1.17 CNH Industrial Capital LLC 3.625%
15/04/2018 USD 50,000 50,467 0.19 CNH Industrial Capital LLC 4.375%
06/11/2020 USD 25,000 26,233 0.10
SCHEDULE OF INVESTMENTSAs at 30 June 2017
Investments Currency
Quantity/Nominal
Value
Market Value USD
% of Net Assets
Transferable securities and money market instruments admitted to offi cial exchange listing or dealt in on another regulated market
Corporate Bonds (continued)
Machinery (continued)Oshkosh Corp. 5.375% 01/03/2022 USD 100,000 104,069 0.40 Shape Technologies Group, Inc., 144A
7.625% 01/02/2020 USD 100,000 104,250 0.40
735,394 2.79
MediaCable One, Inc., 144A 5.75% 15/06/2022 USD 95,000 99,689 0.38 Cablevision Systems Corp. 7.75%
15/04/2018 USD 100,000 103,927 0.39 DISH DBS Corp. 6.75% 01/06/2021 USD 150,000 166,750 0.63 Midcontinent Communications, 144A
6.25% 01/08/2021 USD 150,000 155,250 0.59 SFR Group SA, 144A 6% 15/05/2022 USD 200,000 209,268 0.79 Sinclair Television Group, Inc. 5.375%
01/04/2021 USD 75,000 76,915 0.29
811,799 3.07
MiningAmerican Gilsonite Co., 144A 17%
31/12/2021 USD 26,666 27,766 0.10 Eldorado Gold Corp., 144A 6.125%
15/12/2020 USD 200,000 204,582 0.77 First Quantum Minerals Ltd., 144A 7%
15/02/2021 USD 175,000 182,116 0.69 FMG Resources August 2006 Pty. Ltd.,
144A 4.75% 15/05/2022 USD 150,000 151,175 0.57 Freeport-McMoRan, Inc. 2.375%
15/03/2018 USD 100,000 99,773 0.38 Hudbay Minerals, Inc., 144A 7.25%
15/01/2023 USD 200,000 205,062 0.78 International Wire Group, Inc., 144A
10.75% 01/08/2021 USD 200,000 182,000 0.69 Lundin Mining Corp., 144A 7.5%
01/11/2020 USD 100,000 105,432 0.40 Prince Mineral Holding Corp., 144A 11.5%
15/12/2019 USD 225,000 231,469 0.88
1,389,375 5.26
Miscellaneous ManufacturersCTP Transportation Products LLC, 144A
8.25% 15/12/2019 USD 200,000 187,000 0.71 EnPro Industries, Inc. 5.875%
15/09/2022 USD 100,000 103,872 0.39 Techniplas LLC, 144A 10% 01/05/2020 USD 200,000 172,422 0.65
463,294 1.75
Oil & GasBlue Racer Midstream LLC, 144A 6.125%
15/11/2022 USD 300,000 299,445 1.14 Carrizo Oil & Gas, Inc. 7.5% 15/09/2020 USD 200,000 200,000 0.76 Continental Resources, Inc. 5%
15/09/2022 USD 100,000 98,467 0.37 Denbury Resources, Inc. 5.5%
01/05/2022 USD 200,000 114,000 0.43 Endeavor Energy Resources LP, 144A 7%
15/08/2021 USD 200,000 207,360 0.79 Ensco plc 4.7% 15/03/2021 USD 160,000 156,326 0.59
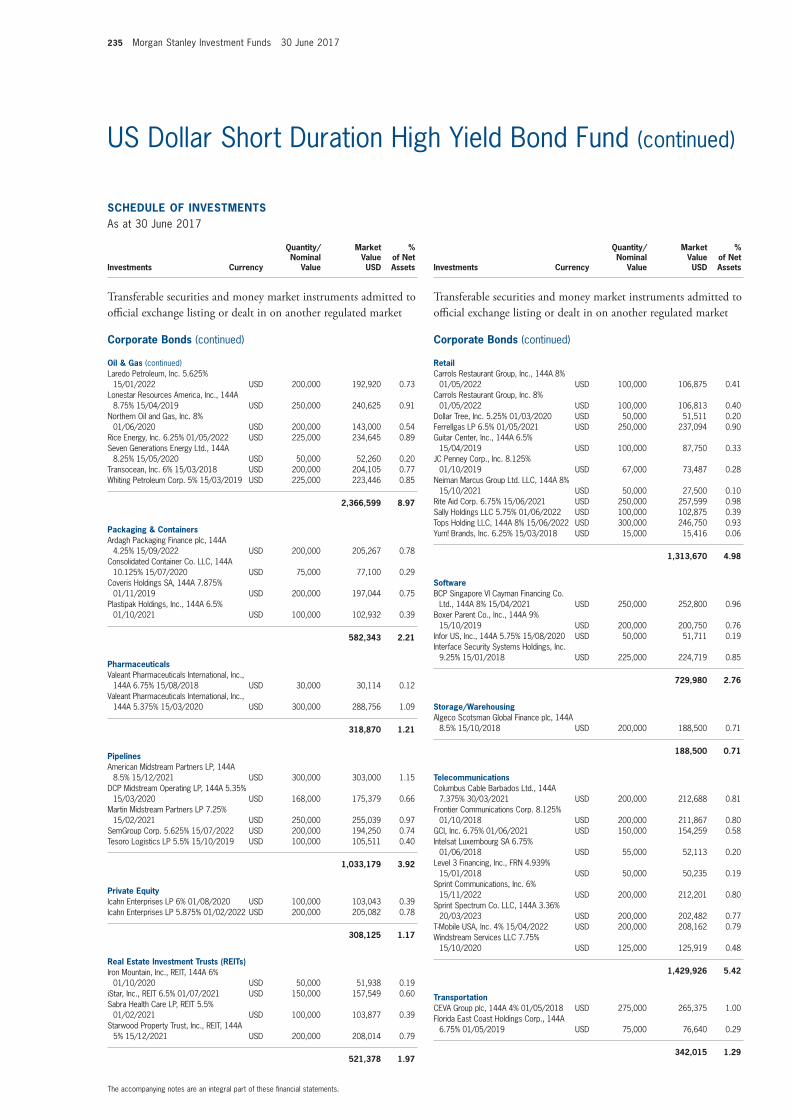
235 Morgan Stanley Investment Funds 30 June 2017
The accompanying notes are an integral part of these fi nancial statements.
US Dollar Short Duration High Yield Bond Fund (continued)
SCHEDULE OF INVESTMENTSAs at 30 June 2017
Investments Currency
Quantity/Nominal
Value
Market Value USD
% of Net Assets
Transferable securities and money market instruments admitted to offi cial exchange listing or dealt in on another regulated market
Corporate Bonds (continued)
Oil & Gas (continued)Laredo Petroleum, Inc. 5.625%
15/01/2022 USD 200,000 192,920 0.73 Lonestar Resources America, Inc., 144A
8.75% 15/04/2019 USD 250,000 240,625 0.91 Northern Oil and Gas, Inc. 8%
01/06/2020 USD 200,000 143,000 0.54 Rice Energy, Inc. 6.25% 01/05/2022 USD 225,000 234,645 0.89 Seven Generations Energy Ltd., 144A
8.25% 15/05/2020 USD 50,000 52,260 0.20 Transocean, Inc. 6% 15/03/2018 USD 200,000 204,105 0.77 Whiting Petroleum Corp. 5% 15/03/2019 USD 225,000 223,446 0.85
2,366,599 8.97
Packaging & ContainersArdagh Packaging Finance plc, 144A
4.25% 15/09/2022 USD 200,000 205,267 0.78 Consolidated Container Co. LLC, 144A
10.125% 15/07/2020 USD 75,000 77,100 0.29 Coveris Holdings SA, 144A 7.875%
01/11/2019 USD 200,000 197,044 0.75 Plastipak Holdings, Inc., 144A 6.5%
01/10/2021 USD 100,000 102,932 0.39
582,343 2.21
PharmaceuticalsValeant Pharmaceuticals International, Inc.,
144A 6.75% 15/08/2018 USD 30,000 30,114 0.12 Valeant Pharmaceuticals International, Inc.,
144A 5.375% 15/03/2020 USD 300,000 288,756 1.09
318,870 1.21
PipelinesAmerican Midstream Partners LP, 144A
8.5% 15/12/2021 USD 300,000 303,000 1.15 DCP Midstream Operating LP, 144A 5.35%
15/03/2020 USD 168,000 175,379 0.66 Martin Midstream Partners LP 7.25%
15/02/2021 USD 250,000 255,039 0.97 SemGroup Corp. 5.625% 15/07/2022 USD 200,000 194,250 0.74 Tesoro Logistics LP 5.5% 15/10/2019 USD 100,000 105,511 0.40
1,033,179 3.92
Private EquityIcahn Enterprises LP 6% 01/08/2020 USD 100,000 103,043 0.39 Icahn Enterprises LP 5.875% 01/02/2022 USD 200,000 205,082 0.78
308,125 1.17
Real Estate Investment Trusts (REITs)Iron Mountain, Inc., REIT, 144A 6%
01/10/2020 USD 50,000 51,938 0.19 iStar, Inc., REIT 6.5% 01/07/2021 USD 150,000 157,549 0.60 Sabra Health Care LP, REIT 5.5%
01/02/2021 USD 100,000 103,877 0.39 Starwood Property Trust, Inc., REIT, 144A
5% 15/12/2021 USD 200,000 208,014 0.79
521,378 1.97
SCHEDULE OF INVESTMENTSAs at 30 June 2017
Investments Currency
Quantity/Nominal
Value
Market Value USD
% of Net Assets
Transferable securities and money market instruments admitted to offi cial exchange listing or dealt in on another regulated market
Corporate Bonds (continued)
RetailCarrols Restaurant Group, Inc., 144A 8%
01/05/2022 USD 100,000 106,875 0.41 Carrols Restaurant Group, Inc. 8%
01/05/2022 USD 100,000 106,813 0.40 Dollar Tree, Inc. 5.25% 01/03/2020 USD 50,000 51,511 0.20 Ferrellgas LP 6.5% 01/05/2021 USD 250,000 237,094 0.90 Guitar Center, Inc., 144A 6.5%
15/04/2019 USD 100,000 87,750 0.33 JC Penney Corp., Inc. 8.125%
01/10/2019 USD 67,000 73,487 0.28 Neiman Marcus Group Ltd. LLC, 144A 8%
15/10/2021 USD 50,000 27,500 0.10 Rite Aid Corp. 6.75% 15/06/2021 USD 250,000 257,599 0.98 Sally Holdings LLC 5.75% 01/06/2022 USD 100,000 102,875 0.39 Tops Holding LLC, 144A 8% 15/06/2022 USD 300,000 246,750 0.93 Yum! Brands, Inc. 6.25% 15/03/2018 USD 15,000 15,416 0.06
1,313,670 4.98
SoftwareBCP Singapore VI Cayman Financing Co.
Ltd., 144A 8% 15/04/2021 USD 250,000 252,800 0.96 Boxer Parent Co., Inc., 144A 9%
15/10/2019 USD 200,000 200,750 0.76 Infor US, Inc., 144A 5.75% 15/08/2020 USD 50,000 51,711 0.19 Interface Security Systems Holdings, Inc.
9.25% 15/01/2018 USD 225,000 224,719 0.85
729,980 2.76
Storage/WarehousingAlgeco Scotsman Global Finance plc, 144A
8.5% 15/10/2018 USD 200,000 188,500 0.71
188,500 0.71
TelecommunicationsColumbus Cable Barbados Ltd., 144A
7.375% 30/03/2021 USD 200,000 212,688 0.81 Frontier Communications Corp. 8.125%
01/10/2018 USD 200,000 211,867 0.80 GCI, Inc. 6.75% 01/06/2021 USD 150,000 154,259 0.58 Intelsat Luxembourg SA 6.75%
01/06/2018 USD 55,000 52,113 0.20 Level 3 Financing, Inc., FRN 4.939%
15/01/2018 USD 50,000 50,235 0.19 Sprint Communications, Inc. 6%
15/11/2022 USD 200,000 212,201 0.80 Sprint Spectrum Co. LLC, 144A 3.36%
20/03/2023 USD 200,000 202,482 0.77 T-Mobile USA, Inc. 4% 15/04/2022 USD 200,000 208,162 0.79 Windstream Services LLC 7.75%
15/10/2020 USD 125,000 125,919 0.48
1,429,926 5.42
TransportationCEVA Group plc, 144A 4% 01/05/2018 USD 275,000 265,375 1.00 Florida East Coast Holdings Corp., 144A
6.75% 01/05/2019 USD 75,000 76,640 0.29
342,015 1.29
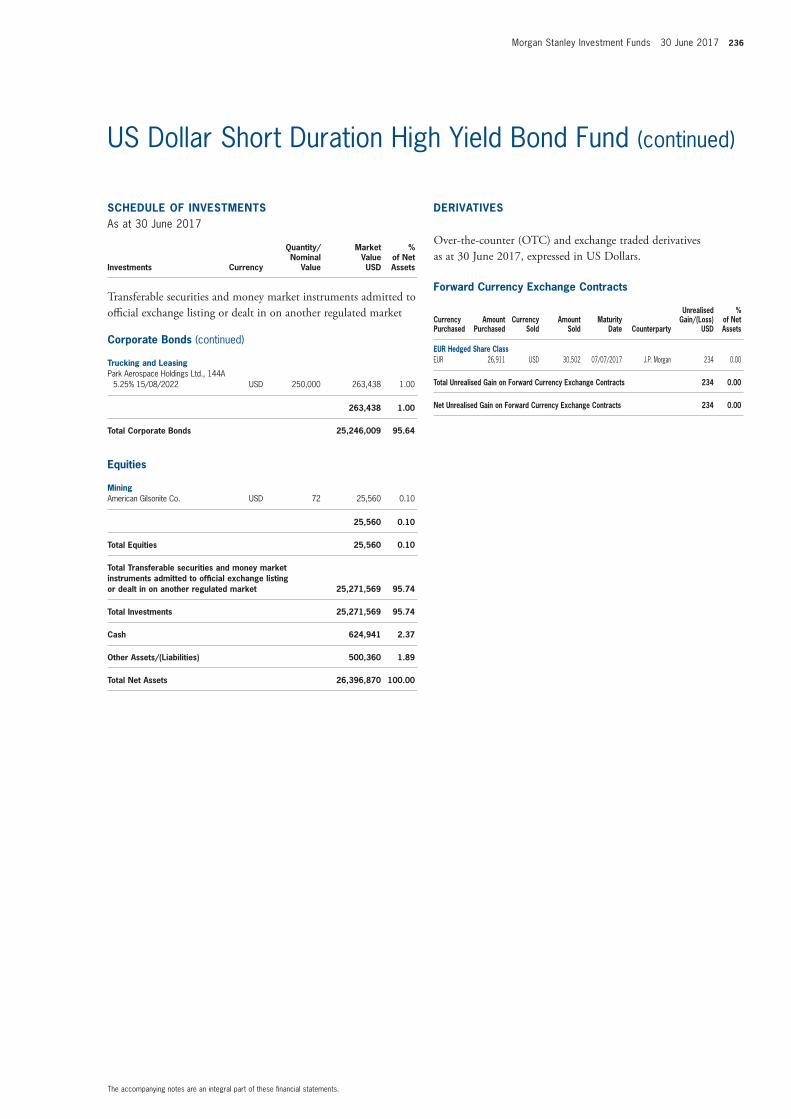
Morgan Stanley Investment Funds 30 June 2017 236
The accompanying notes are an integral part of these fi nancial statements.
US Dollar Short Duration High Yield Bond Fund (continued)
SCHEDULE OF INVESTMENTSAs at 30 June 2017
Investments Currency
Quantity/Nominal
Value
Market Value USD
% of Net Assets
Transferable securities and money market instruments admitted to offi cial exchange listing or dealt in on another regulated market
Corporate Bonds (continued)
Trucking and LeasingPark Aerospace Holdings Ltd., 144A
5.25% 15/08/2022 USD 250,000 263,438 1.00
263,438 1.00
Total Corporate Bonds 25,246,009 95.64
Equities
MiningAmerican Gilsonite Co. USD 72 25,560 0.10
25,560 0.10
Total Equities 25,560 0.10
Total Transferable securities and money market instruments admitted to offi cial exchange listing or dealt in on another regulated market 25,271,569 95.74
Total Investments 25,271,569 95.74
Cash 624,941 2.37
Other Assets/(Liabilities) 500,360 1.89
Total Net Assets 26,396,870 100.00
Forward Currency Exchange Contracts
Currency Purchased
Amount Purchased
Currency Sold
Amount Sold
Maturity Date Counterparty
Unrealised Gain/(Loss)
USD
% of Net Assets
EUR Hedged Share ClassEUR 26,911 USD 30,502 07/07/2017 J.P. Morgan 234 0.00
Total Unrealised Gain on Forward Currency Exchange Contracts 234 0.00
Net Unrealised Gain on Forward Currency Exchange Contracts 234 0.00
DERIVATIVES
Over-the-counter (OTC) and exchange traded derivatives as at 30 June 2017, expressed in US Dollars.
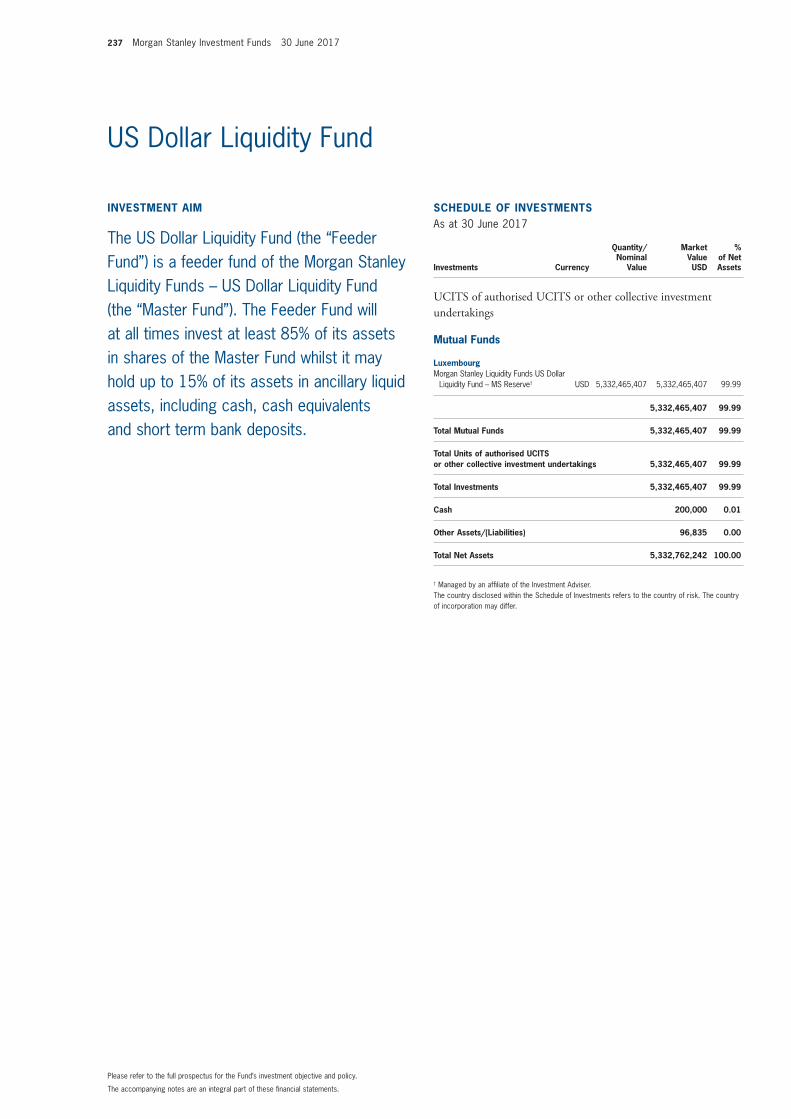
237 Morgan Stanley Investment Funds 30 June 2017
The accompanying notes are an integral part of these fi nancial statements.
Please refer to the full prospectus for the Fund’s investment objective and policy.
US Dollar Liquidity Fund
INVESTMENT AIM
The US Dollar Liquidity Fund (the “Feeder Fund”) is a feeder fund of the Morgan Stanley Liquidity Funds – US Dollar Liquidity Fund (the “Master Fund”). The Feeder Fund will at all times invest at least 85% of its assets in shares of the Master Fund whilst it may hold up to 15% of its assets in ancillary liquid assets, including cash, cash equivalents and short term bank deposits.
SCHEDULE OF INVESTMENTSAs at 30 June 2017
Investments Currency
Quantity/Nominal
Value
Market Value USD
% of Net Assets
UCITS of authorised UCITS or other collective investment undertakings
Mutual Funds
LuxembourgMorgan Stanley Liquidity Funds US Dollar
Liquidity Fund – MS Reserve† USD 5,332,465,407 5,332,465,407 99.99
5,332,465,407 99.99
Total Mutual Funds 5,332,465,407 99.99
Total Units of authorised UCITS or other collective investment undertakings 5,332,465,407 99.99
Total Investments 5,332,465,407 99.99
Cash 200,000 0.01
Other Assets/(Liabilities) 96,835 0.00
Total Net Assets 5,332,762,242 100.00
† Managed by an affi liate of the Investment Adviser.The country disclosed within the Schedule of Investments refers to the country of risk. The country of incorporation may differ.
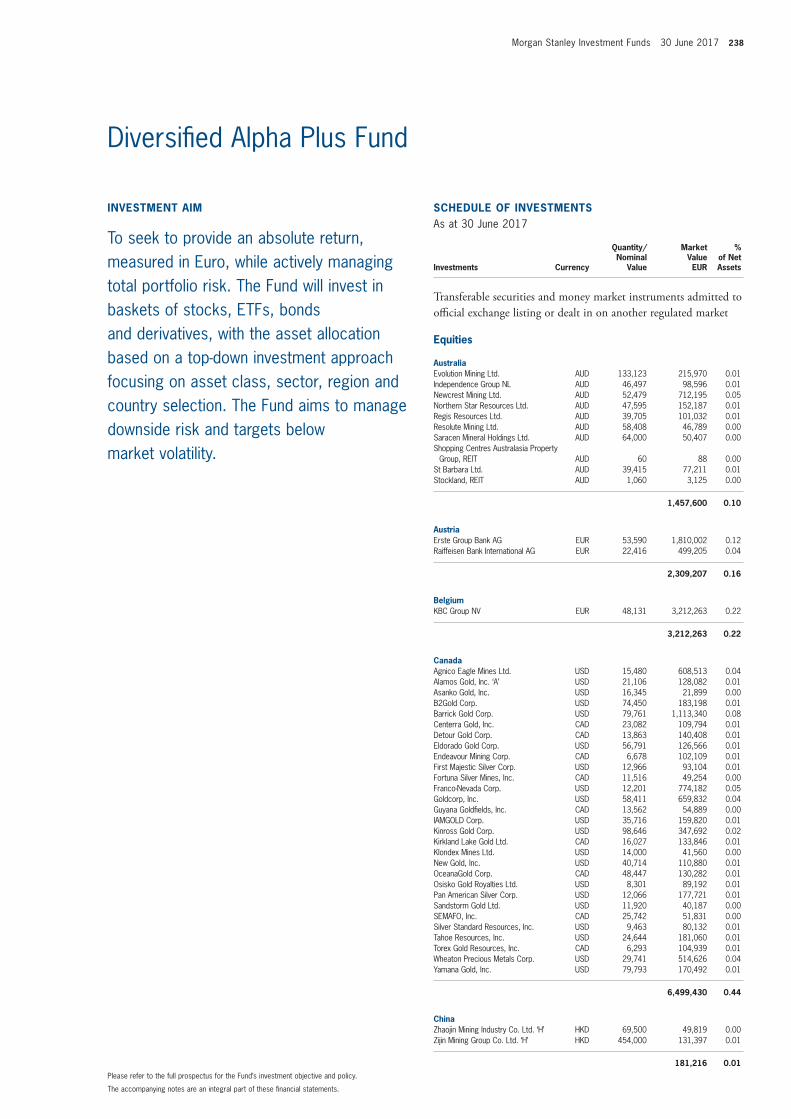
Morgan Stanley Investment Funds 30 June 2017 238
The accompanying notes are an integral part of these fi nancial statements.
Please refer to the full prospectus for the Fund’s investment objective and policy.
Diversifi ed Alpha Plus Fund
INVESTMENT AIM
To seek to provide an absolute return, measured in Euro, while actively managing total portfolio risk. The Fund will invest in baskets of stocks, ETFs, bonds and derivatives, with the asset allocation based on a top-down investment approach focusing on asset class, sector, region and country selection. The Fund aims to manage downside risk and targets below market volatility.
SCHEDULE OF INVESTMENTSAs at 30 June 2017
Investments Currency
Quantity/Nominal
Value
Market Value EUR
% of Net Assets
Transferable securities and money market instruments admitted to offi cial exchange listing or dealt in on another regulated market
Equities
AustraliaEvolution Mining Ltd. AUD 133,123 215,970 0.01 Independence Group NL AUD 46,497 98,596 0.01 Newcrest Mining Ltd. AUD 52,479 712,195 0.05 Northern Star Resources Ltd. AUD 47,595 152,187 0.01 Regis Resources Ltd. AUD 39,705 101,032 0.01 Resolute Mining Ltd. AUD 58,408 46,789 0.00 Saracen Mineral Holdings Ltd. AUD 64,000 50,407 0.00 Shopping Centres Australasia Property
Group, REIT AUD 60 88 0.00 St Barbara Ltd. AUD 39,415 77,211 0.01 Stockland, REIT AUD 1,060 3,125 0.00
1,457,600 0.10
AustriaErste Group Bank AG EUR 53,590 1,810,002 0.12 Raiffeisen Bank International AG EUR 22,416 499,205 0.04
2,309,207 0.16
BelgiumKBC Group NV EUR 48,131 3,212,263 0.22
3,212,263 0.22
CanadaAgnico Eagle Mines Ltd. USD 15,480 608,513 0.04 Alamos Gold, Inc. ‘A’ USD 21,106 128,082 0.01 Asanko Gold, Inc. USD 16,345 21,899 0.00 B2Gold Corp. USD 74,450 183,198 0.01 Barrick Gold Corp. USD 79,761 1,113,340 0.08 Centerra Gold, Inc. CAD 23,082 109,794 0.01 Detour Gold Corp. CAD 13,863 140,408 0.01 Eldorado Gold Corp. USD 56,791 126,566 0.01 Endeavour Mining Corp. CAD 6,678 102,109 0.01 First Majestic Silver Corp. USD 12,966 93,104 0.01 Fortuna Silver Mines, Inc. CAD 11,516 49,254 0.00 Franco-Nevada Corp. USD 12,201 774,182 0.05 Goldcorp, Inc. USD 58,411 659,832 0.04 Guyana Goldfi elds, Inc. CAD 13,562 54,889 0.00 IAMGOLD Corp. USD 35,716 159,820 0.01 Kinross Gold Corp. USD 98,646 347,692 0.02 Kirkland Lake Gold Ltd. CAD 16,027 133,846 0.01 Klondex Mines Ltd. USD 14,000 41,560 0.00 New Gold, Inc. USD 40,714 110,880 0.01 OceanaGold Corp. CAD 48,447 130,282 0.01 Osisko Gold Royalties Ltd. USD 8,301 89,192 0.01 Pan American Silver Corp. USD 12,066 177,721 0.01 Sandstorm Gold Ltd. USD 11,920 40,187 0.00 SEMAFO, Inc. CAD 25,742 51,831 0.00 Silver Standard Resources, Inc. USD 9,463 80,132 0.01 Tahoe Resources, Inc. USD 24,644 181,060 0.01 Torex Gold Resources, Inc. CAD 6,293 104,939 0.01 Wheaton Precious Metals Corp. USD 29,741 514,626 0.04 Yamana Gold, Inc. USD 79,793 170,492 0.01
6,499,430 0.44
ChinaZhaojin Mining Industry Co. Ltd. ‘H’ HKD 69,500 49,819 0.00 Zijin Mining Group Co. Ltd. ‘H’ HKD 454,000 131,397 0.01
181,216 0.01
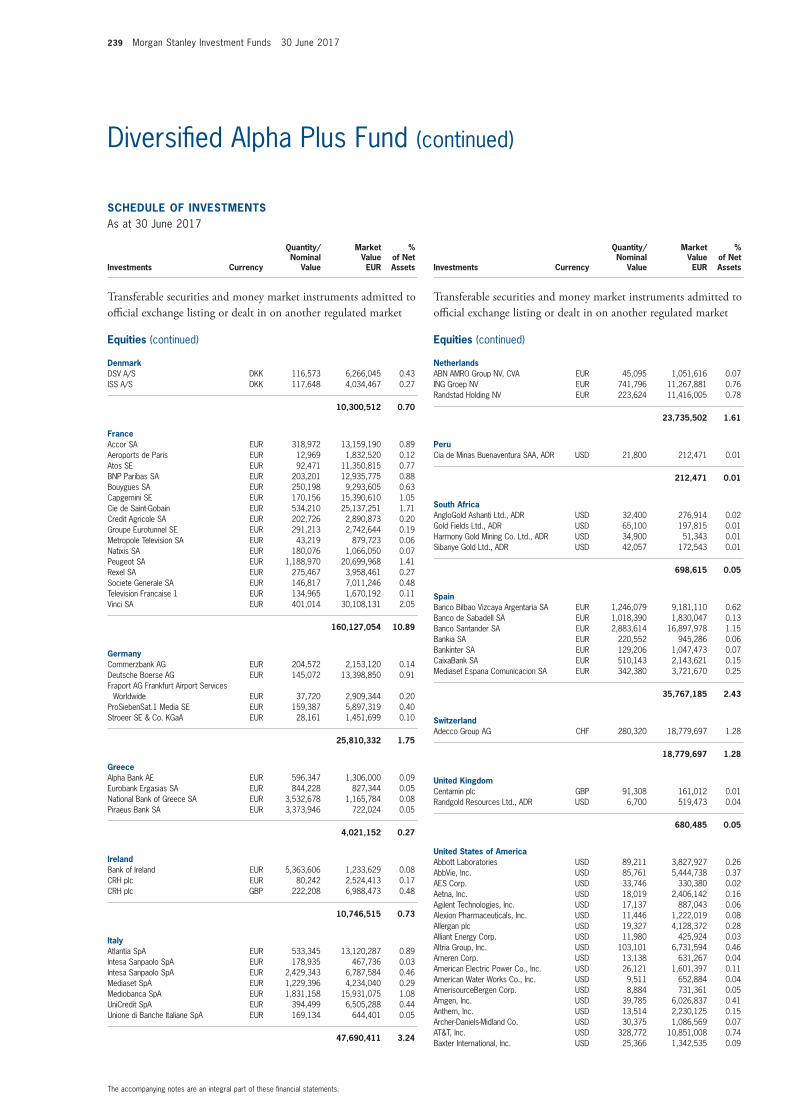
239 Morgan Stanley Investment Funds 30 June 2017
The accompanying notes are an integral part of these fi nancial statements.
Diversifi ed Alpha Plus Fund (continued)
SCHEDULE OF INVESTMENTSAs at 30 June 2017
Investments Currency
Quantity/Nominal
Value
Market Value EUR
% of Net Assets
Transferable securities and money market instruments admitted to offi cial exchange listing or dealt in on another regulated market
Equities (continued)
DenmarkDSV A/S DKK 116,573 6,266,045 0.43 ISS A/S DKK 117,648 4,034,467 0.27
10,300,512 0.70
FranceAccor SA EUR 318,972 13,159,190 0.89 Aeroports de Paris EUR 12,969 1,832,520 0.12 Atos SE EUR 92,471 11,350,815 0.77 BNP Paribas SA EUR 203,201 12,935,775 0.88 Bouygues SA EUR 250,198 9,293,605 0.63 Capgemini SE EUR 170,156 15,390,610 1.05 Cie de Saint-Gobain EUR 534,210 25,137,251 1.71 Credit Agricole SA EUR 202,726 2,890,873 0.20 Groupe Eurotunnel SE EUR 291,213 2,742,644 0.19 Metropole Television SA EUR 43,219 879,723 0.06 Natixis SA EUR 180,076 1,066,050 0.07 Peugeot SA EUR 1,188,970 20,699,968 1.41 Rexel SA EUR 275,467 3,958,461 0.27 Societe Generale SA EUR 146,817 7,011,246 0.48 Television Francaise 1 EUR 134,965 1,670,192 0.11 Vinci SA EUR 401,014 30,108,131 2.05
160,127,054 10.89
GermanyCommerzbank AG EUR 204,572 2,153,120 0.14 Deutsche Boerse AG EUR 145,072 13,398,850 0.91 Fraport AG Frankfurt Airport Services
Worldwide EUR 37,720 2,909,344 0.20 ProSiebenSat.1 Media SE EUR 159,387 5,897,319 0.40 Stroeer SE & Co. KGaA EUR 28,161 1,451,699 0.10
25,810,332 1.75
GreeceAlpha Bank AE EUR 596,347 1,306,000 0.09 Eurobank Ergasias SA EUR 844,228 827,344 0.05 National Bank of Greece SA EUR 3,532,678 1,165,784 0.08 Piraeus Bank SA EUR 3,373,946 722,024 0.05
4,021,152 0.27
IrelandBank of Ireland EUR 5,363,606 1,233,629 0.08 CRH plc EUR 80,242 2,524,413 0.17 CRH plc GBP 222,208 6,988,473 0.48
10,746,515 0.73
ItalyAtlantia SpA EUR 533,345 13,120,287 0.89 Intesa Sanpaolo SpA EUR 178,935 467,736 0.03 Intesa Sanpaolo SpA EUR 2,429,343 6,787,584 0.46 Mediaset SpA EUR 1,229,396 4,234,040 0.29 Mediobanca SpA EUR 1,831,158 15,931,075 1.08 UniCredit SpA EUR 394,499 6,505,288 0.44 Unione di Banche Italiane SpA EUR 169,134 644,401 0.05
47,690,411 3.24
SCHEDULE OF INVESTMENTSAs at 30 June 2017
Investments Currency
Quantity/Nominal
Value
Market Value EUR
% of Net Assets
Transferable securities and money market instruments admitted to offi cial exchange listing or dealt in on another regulated market
Equities (continued)
NetherlandsABN AMRO Group NV, CVA EUR 45,095 1,051,616 0.07 ING Groep NV EUR 741,796 11,267,881 0.76 Randstad Holding NV EUR 223,624 11,416,005 0.78
23,735,502 1.61
PeruCia de Minas Buenaventura SAA, ADR USD 21,800 212,471 0.01
212,471 0.01
South AfricaAngloGold Ashanti Ltd., ADR USD 32,400 276,914 0.02 Gold Fields Ltd., ADR USD 65,100 197,815 0.01 Harmony Gold Mining Co. Ltd., ADR USD 34,900 51,343 0.01 Sibanye Gold Ltd., ADR USD 42,057 172,543 0.01
698,615 0.05
SpainBanco Bilbao Vizcaya Argentaria SA EUR 1,246,079 9,181,110 0.62 Banco de Sabadell SA EUR 1,018,390 1,830,047 0.13 Banco Santander SA EUR 2,883,614 16,897,978 1.15 Bankia SA EUR 220,552 945,286 0.06 Bankinter SA EUR 129,206 1,047,473 0.07 CaixaBank SA EUR 510,143 2,143,621 0.15 Mediaset Espana Comunicacion SA EUR 342,380 3,721,670 0.25
35,767,185 2.43
SwitzerlandAdecco Group AG CHF 280,320 18,779,697 1.28
18,779,697 1.28
United KingdomCentamin plc GBP 91,308 161,012 0.01 Randgold Resources Ltd., ADR USD 6,700 519,473 0.04
680,485 0.05
United States of AmericaAbbott Laboratories USD 89,211 3,827,927 0.26 AbbVie, Inc. USD 85,761 5,444,738 0.37 AES Corp. USD 33,746 330,380 0.02 Aetna, Inc. USD 18,019 2,406,142 0.16 Agilent Technologies, Inc. USD 17,137 887,043 0.06 Alexion Pharmaceuticals, Inc. USD 11,446 1,222,019 0.08 Allergan plc USD 19,327 4,128,372 0.28 Alliant Energy Corp. USD 11,980 425,924 0.03 Altria Group, Inc. USD 103,101 6,731,594 0.46 Ameren Corp. USD 13,138 631,267 0.04 American Electric Power Co., Inc. USD 26,121 1,601,397 0.11 American Water Works Co., Inc. USD 9,511 652,884 0.04 AmerisourceBergen Corp. USD 8,884 731,361 0.05 Amgen, Inc. USD 39,785 6,026,837 0.41 Anthem, Inc. USD 13,514 2,230,125 0.15 Archer-Daniels-Midland Co. USD 30,375 1,086,569 0.07 AT&T, Inc. USD 328,772 10,851,008 0.74 Baxter International, Inc. USD 25,366 1,342,535 0.09
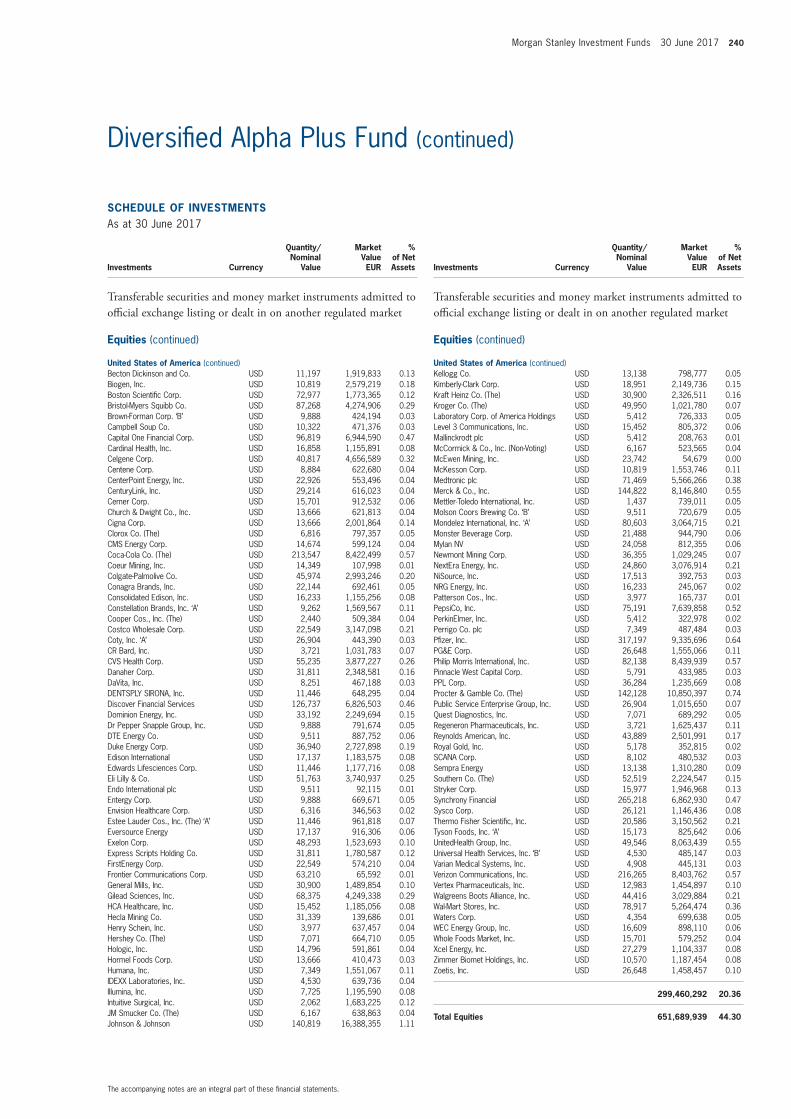
Morgan Stanley Investment Funds 30 June 2017 240
The accompanying notes are an integral part of these fi nancial statements.
Diversifi ed Alpha Plus Fund (continued)
SCHEDULE OF INVESTMENTSAs at 30 June 2017
Investments Currency
Quantity/Nominal
Value
Market Value EUR
% of Net Assets
Transferable securities and money market instruments admitted to offi cial exchange listing or dealt in on another regulated market
Equities (continued)
United States of America (continued)Becton Dickinson and Co. USD 11,197 1,919,833 0.13 Biogen, Inc. USD 10,819 2,579,219 0.18 Boston Scientifi c Corp. USD 72,977 1,773,365 0.12 Bristol-Myers Squibb Co. USD 87,268 4,274,906 0.29 Brown-Forman Corp. ‘B’ USD 9,888 424,194 0.03 Campbell Soup Co. USD 10,322 471,376 0.03 Capital One Financial Corp. USD 96,819 6,944,590 0.47 Cardinal Health, Inc. USD 16,858 1,155,891 0.08 Celgene Corp. USD 40,817 4,656,589 0.32 Centene Corp. USD 8,884 622,680 0.04 CenterPoint Energy, Inc. USD 22,926 553,496 0.04 CenturyLink, Inc. USD 29,214 616,023 0.04 Cerner Corp. USD 15,701 912,532 0.06 Church & Dwight Co., Inc. USD 13,666 621,813 0.04 Cigna Corp. USD 13,666 2,001,864 0.14 Clorox Co. (The) USD 6,816 797,357 0.05 CMS Energy Corp. USD 14,674 599,124 0.04 Coca-Cola Co. (The) USD 213,547 8,422,499 0.57 Coeur Mining, Inc. USD 14,349 107,998 0.01 Colgate-Palmolive Co. USD 45,974 2,993,246 0.20 Conagra Brands, Inc. USD 22,144 692,461 0.05 Consolidated Edison, Inc. USD 16,233 1,155,256 0.08 Constellation Brands, Inc. ‘A’ USD 9,262 1,569,567 0.11 Cooper Cos., Inc. (The) USD 2,440 509,384 0.04 Costco Wholesale Corp. USD 22,549 3,147,098 0.21 Coty, Inc. ‘A’ USD 26,904 443,390 0.03 CR Bard, Inc. USD 3,721 1,031,783 0.07 CVS Health Corp. USD 55,235 3,877,227 0.26 Danaher Corp. USD 31,811 2,348,581 0.16 DaVita, Inc. USD 8,251 467,188 0.03 DENTSPLY SIRONA, Inc. USD 11,446 648,295 0.04 Discover Financial Services USD 126,737 6,826,503 0.46 Dominion Energy, Inc. USD 33,192 2,249,694 0.15 Dr Pepper Snapple Group, Inc. USD 9,888 791,674 0.05 DTE Energy Co. USD 9,511 887,752 0.06 Duke Energy Corp. USD 36,940 2,727,898 0.19 Edison International USD 17,137 1,183,575 0.08 Edwards Lifesciences Corp. USD 11,446 1,177,716 0.08 Eli Lilly & Co. USD 51,763 3,740,937 0.25 Endo International plc USD 9,511 92,115 0.01 Entergy Corp. USD 9,888 669,671 0.05 Envision Healthcare Corp. USD 6,316 346,563 0.02 Estee Lauder Cos., Inc. (The) ‘A’ USD 11,446 961,818 0.07 Eversource Energy USD 17,137 916,306 0.06 Exelon Corp. USD 48,293 1,523,693 0.10 Express Scripts Holding Co. USD 31,811 1,780,587 0.12 FirstEnergy Corp. USD 22,549 574,210 0.04 Frontier Communications Corp. USD 63,210 65,592 0.01 General Mills, Inc. USD 30,900 1,489,854 0.10 Gilead Sciences, Inc. USD 68,375 4,249,338 0.29 HCA Healthcare, Inc. USD 15,452 1,185,056 0.08 Hecla Mining Co. USD 31,339 139,686 0.01 Henry Schein, Inc. USD 3,977 637,457 0.04 Hershey Co. (The) USD 7,071 664,710 0.05 Hologic, Inc. USD 14,796 591,861 0.04 Hormel Foods Corp. USD 13,666 410,473 0.03 Humana, Inc. USD 7,349 1,551,067 0.11 IDEXX Laboratories, Inc. USD 4,530 639,736 0.04 Illumina, Inc. USD 7,725 1,195,590 0.08 Intuitive Surgical, Inc. USD 2,062 1,683,225 0.12 JM Smucker Co. (The) USD 6,167 638,863 0.04 Johnson & Johnson USD 140,819 16,388,355 1.11
SCHEDULE OF INVESTMENTSAs at 30 June 2017
Investments Currency
Quantity/Nominal
Value
Market Value EUR
% of Net Assets
Transferable securities and money market instruments admitted to offi cial exchange listing or dealt in on another regulated market
Equities (continued)
United States of America (continued)Kellogg Co. USD 13,138 798,777 0.05 Kimberly-Clark Corp. USD 18,951 2,149,736 0.15 Kraft Heinz Co. (The) USD 30,900 2,326,511 0.16 Kroger Co. (The) USD 49,950 1,021,780 0.07 Laboratory Corp. of America Holdings USD 5,412 726,333 0.05 Level 3 Communications, Inc. USD 15,452 805,372 0.06 Mallinckrodt plc USD 5,412 208,763 0.01 McCormick & Co., Inc. (Non-Voting) USD 6,167 523,565 0.04 McEwen Mining, Inc. USD 23,742 54,679 0.00 McKesson Corp. USD 10,819 1,553,746 0.11 Medtronic plc USD 71,469 5,566,266 0.38 Merck & Co., Inc. USD 144,822 8,146,840 0.55 Mettler-Toledo International, Inc. USD 1,437 739,011 0.05 Molson Coors Brewing Co. ‘B’ USD 9,511 720,679 0.05 Mondelez International, Inc. ‘A’ USD 80,603 3,064,715 0.21 Monster Beverage Corp. USD 21,488 944,790 0.06 Mylan NV USD 24,058 812,355 0.06 Newmont Mining Corp. USD 36,355 1,029,245 0.07 NextEra Energy, Inc. USD 24,860 3,076,914 0.21 NiSource, Inc. USD 17,513 392,753 0.03 NRG Energy, Inc. USD 16,233 245,067 0.02 Patterson Cos., Inc. USD 3,977 165,737 0.01 PepsiCo, Inc. USD 75,191 7,639,858 0.52 PerkinElmer, Inc. USD 5,412 322,978 0.02 Perrigo Co. plc USD 7,349 487,484 0.03 Pfi zer, Inc. USD 317,197 9,335,696 0.64 PG&E Corp. USD 26,648 1,555,066 0.11 Philip Morris International, Inc. USD 82,138 8,439,939 0.57 Pinnacle West Capital Corp. USD 5,791 433,985 0.03 PPL Corp. USD 36,284 1,235,669 0.08 Procter & Gamble Co. (The) USD 142,128 10,850,397 0.74 Public Service Enterprise Group, Inc. USD 26,904 1,015,650 0.07 Quest Diagnostics, Inc. USD 7,071 689,292 0.05 Regeneron Pharmaceuticals, Inc. USD 3,721 1,625,437 0.11 Reynolds American, Inc. USD 43,889 2,501,991 0.17 Royal Gold, Inc. USD 5,178 352,815 0.02 SCANA Corp. USD 8,102 480,532 0.03 Sempra Energy USD 13,138 1,310,280 0.09 Southern Co. (The) USD 52,519 2,224,547 0.15 Stryker Corp. USD 15,977 1,946,968 0.13 Synchrony Financial USD 265,218 6,862,930 0.47 Sysco Corp. USD 26,121 1,146,436 0.08 Thermo Fisher Scientifi c, Inc. USD 20,586 3,150,562 0.21 Tyson Foods, Inc. ‘A’ USD 15,173 825,642 0.06 UnitedHealth Group, Inc. USD 49,546 8,063,439 0.55 Universal Health Services, Inc. ‘B’ USD 4,530 485,147 0.03 Varian Medical Systems, Inc. USD 4,908 445,131 0.03 Verizon Communications, Inc. USD 216,265 8,403,762 0.57 Vertex Pharmaceuticals, Inc. USD 12,983 1,454,897 0.10 Walgreens Boots Alliance, Inc. USD 44,416 3,029,884 0.21 Wal-Mart Stores, Inc. USD 78,917 5,264,474 0.36 Waters Corp. USD 4,354 699,638 0.05 WEC Energy Group, Inc. USD 16,609 898,110 0.06 Whole Foods Market, Inc. USD 15,701 579,252 0.04 Xcel Energy, Inc. USD 27,279 1,104,337 0.08 Zimmer Biomet Holdings, Inc. USD 10,570 1,187,454 0.08 Zoetis, Inc. USD 26,648 1,458,457 0.10
299,460,292 20.36
Total Equities 651,689,939 44.30
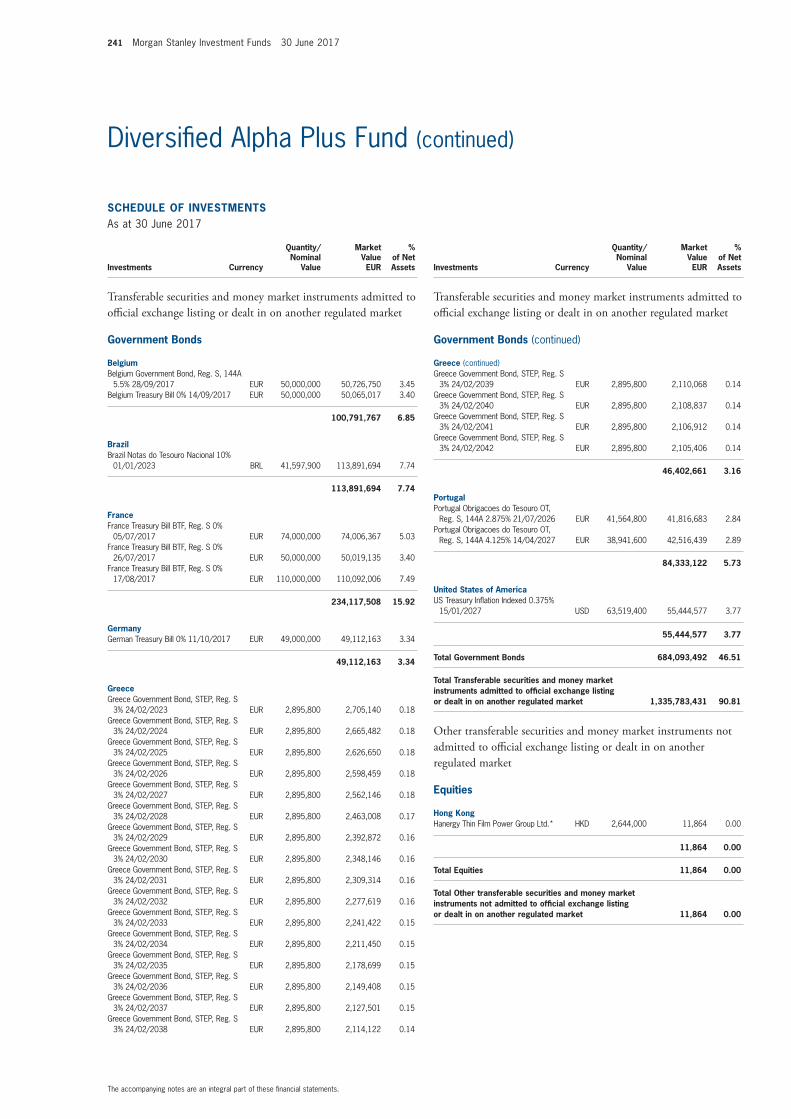
241 Morgan Stanley Investment Funds 30 June 2017
The accompanying notes are an integral part of these fi nancial statements.
Diversifi ed Alpha Plus Fund (continued)
SCHEDULE OF INVESTMENTSAs at 30 June 2017
Investments Currency
Quantity/Nominal
Value
Market Value EUR
% of Net Assets
Transferable securities and money market instruments admitted to offi cial exchange listing or dealt in on another regulated market
Government Bonds
BelgiumBelgium Government Bond, Reg. S, 144A
5.5% 28/09/2017 EUR 50,000,000 50,726,750 3.45 Belgium Treasury Bill 0% 14/09/2017 EUR 50,000,000 50,065,017 3.40
100,791,767 6.85
BrazilBrazil Notas do Tesouro Nacional 10%
01/01/2023 BRL 41,597,900 113,891,694 7.74
113,891,694 7.74
FranceFrance Treasury Bill BTF, Reg. S 0%
05/07/2017 EUR 74,000,000 74,006,367 5.03 France Treasury Bill BTF, Reg. S 0%
26/07/2017 EUR 50,000,000 50,019,135 3.40 France Treasury Bill BTF, Reg. S 0%
17/08/2017 EUR 110,000,000 110,092,006 7.49
234,117,508 15.92
GermanyGerman Treasury Bill 0% 11/10/2017 EUR 49,000,000 49,112,163 3.34
49,112,163 3.34
GreeceGreece Government Bond, STEP, Reg. S
3% 24/02/2023 EUR 2,895,800 2,705,140 0.18 Greece Government Bond, STEP, Reg. S
3% 24/02/2024 EUR 2,895,800 2,665,482 0.18 Greece Government Bond, STEP, Reg. S
3% 24/02/2025 EUR 2,895,800 2,626,650 0.18 Greece Government Bond, STEP, Reg. S
3% 24/02/2026 EUR 2,895,800 2,598,459 0.18 Greece Government Bond, STEP, Reg. S
3% 24/02/2027 EUR 2,895,800 2,562,146 0.18 Greece Government Bond, STEP, Reg. S
3% 24/02/2028 EUR 2,895,800 2,463,008 0.17 Greece Government Bond, STEP, Reg. S
3% 24/02/2029 EUR 2,895,800 2,392,872 0.16 Greece Government Bond, STEP, Reg. S
3% 24/02/2030 EUR 2,895,800 2,348,146 0.16 Greece Government Bond, STEP, Reg. S
3% 24/02/2031 EUR 2,895,800 2,309,314 0.16 Greece Government Bond, STEP, Reg. S
3% 24/02/2032 EUR 2,895,800 2,277,619 0.16 Greece Government Bond, STEP, Reg. S
3% 24/02/2033 EUR 2,895,800 2,241,422 0.15 Greece Government Bond, STEP, Reg. S
3% 24/02/2034 EUR 2,895,800 2,211,450 0.15 Greece Government Bond, STEP, Reg. S
3% 24/02/2035 EUR 2,895,800 2,178,699 0.15 Greece Government Bond, STEP, Reg. S
3% 24/02/2036 EUR 2,895,800 2,149,408 0.15 Greece Government Bond, STEP, Reg. S
3% 24/02/2037 EUR 2,895,800 2,127,501 0.15 Greece Government Bond, STEP, Reg. S
3% 24/02/2038 EUR 2,895,800 2,114,122 0.14
SCHEDULE OF INVESTMENTSAs at 30 June 2017
Investments Currency
Quantity/Nominal
Value
Market Value EUR
% of Net Assets
Transferable securities and money market instruments admitted to offi cial exchange listing or dealt in on another regulated market
Government Bonds (continued)
Greece (continued)Greece Government Bond, STEP, Reg. S
3% 24/02/2039 EUR 2,895,800 2,110,068 0.14 Greece Government Bond, STEP, Reg. S
3% 24/02/2040 EUR 2,895,800 2,108,837 0.14 Greece Government Bond, STEP, Reg. S
3% 24/02/2041 EUR 2,895,800 2,106,912 0.14 Greece Government Bond, STEP, Reg. S
3% 24/02/2042 EUR 2,895,800 2,105,406 0.14
46,402,661 3.16
PortugalPortugal Obrigacoes do Tesouro OT,
Reg. S, 144A 2.875% 21/07/2026 EUR 41,564,800 41,816,683 2.84 Portugal Obrigacoes do Tesouro OT,
Reg. S, 144A 4.125% 14/04/2027 EUR 38,941,600 42,516,439 2.89
84,333,122 5.73
United States of AmericaUS Treasury Infl ation Indexed 0.375%
15/01/2027 USD 63,519,400 55,444,577 3.77
55,444,577 3.77
Total Government Bonds 684,093,492 46.51
Total Transferable securities and money market instruments admitted to offi cial exchange listing or dealt in on another regulated market 1,335,783,431 90.81
Other transferable securities and money market instruments not admitted to offi cial exchange listing or dealt in on another regulated market
Equities
Hong KongHanergy Thin Film Power Group Ltd.* HKD 2,644,000 11,864 0.00
11,864 0.00
Total Equities 11,864 0.00
Total Other transferable securities and money market instruments not admitted to offi cial exchange listing or dealt in on another regulated market 11,864 0.00
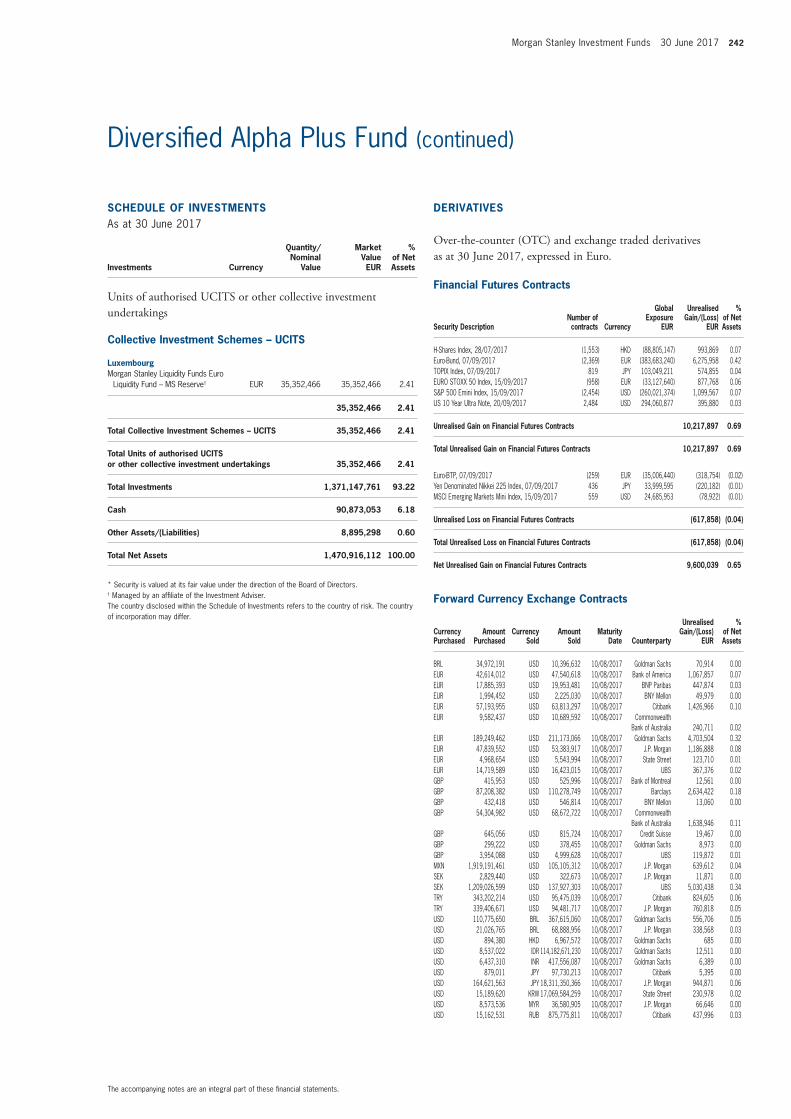
Morgan Stanley Investment Funds 30 June 2017 242
The accompanying notes are an integral part of these fi nancial statements.
Diversifi ed Alpha Plus Fund (continued)
Financial Futures Contracts
Security DescriptionNumber of contracts Currency
Global Exposure
EUR
Unrealised Gain/(Loss)
EUR
% of Net Assets
H-Shares Index, 28/07/2017 (1,553) HKD (88,805,147) 993,869 0.07 Euro-Bund, 07/09/2017 (2,369) EUR (383,683,240) 6,275,958 0.42 TOPIX Index, 07/09/2017 819 JPY 103,049,211 574,855 0.04 EURO STOXX 50 Index, 15/09/2017 (958) EUR (33,127,640) 877,768 0.06 S&P 500 Emini Index, 15/09/2017 (2,454) USD (260,021,374) 1,099,567 0.07 US 10 Year Ultra Note, 20/09/2017 2,484 USD 294,060,877 395,880 0.03
Unrealised Gain on Financial Futures Contracts 10,217,897 0.69
Total Unrealised Gain on Financial Futures Contracts 10,217,897 0.69
Euro-BTP, 07/09/2017 (259) EUR (35,006,440) (318,754) (0.02) Yen Denominated Nikkei 225 Index, 07/09/2017 436 JPY 33,999,595 (220,182) (0.01) MSCI Emerging Markets Mini Index, 15/09/2017 559 USD 24,685,953 (78,922) (0.01)
Unrealised Loss on Financial Futures Contracts (617,858) (0.04)
Total Unrealised Loss on Financial Futures Contracts (617,858) (0.04)
Net Unrealised Gain on Financial Futures Contracts 9,600,039 0.65
Forward Currency Exchange Contracts (continued)
Currency Purchased
Amount Purchased
Currency Sold
Amount Sold
Maturity Date Counterparty
Unrealised Gain/(Loss)
EUR
% of Net Assets
BRL 34,972,191 USD 10,396,632 10/08/2017 Goldman Sachs 70,914 0.00 EUR 42,614,012 USD 47,540,618 10/08/2017 Bank of America 1,067,857 0.07 EUR 17,885,393 USD 19,953,481 10/08/2017 BNP Paribas 447,874 0.03 EUR 1,994,452 USD 2,225,030 10/08/2017 BNY Mellon 49,979 0.00 EUR 57,193,955 USD 63,813,297 10/08/2017 Citibank 1,426,966 0.10 EUR 9,582,437 USD 10,689,592 10/08/2017 Commonwealth
Bank of Australia 240,711 0.02 EUR 189,249,462 USD 211,173,066 10/08/2017 Goldman Sachs 4,703,504 0.32 EUR 47,839,552 USD 53,383,917 10/08/2017 J.P. Morgan 1,186,888 0.08 EUR 4,968,654 USD 5,543,994 10/08/2017 State Street 123,710 0.01 EUR 14,719,589 USD 16,423,015 10/08/2017 UBS 367,376 0.02 GBP 415,953 USD 525,996 10/08/2017 Bank of Montreal 12,561 0.00 GBP 87,208,382 USD 110,278,749 10/08/2017 Barclays 2,634,422 0.18 GBP 432,418 USD 546,814 10/08/2017 BNY Mellon 13,060 0.00 GBP 54,304,982 USD 68,672,722 10/08/2017 Commonwealth
Bank of Australia 1,638,946 0.11 GBP 645,056 USD 815,724 10/08/2017 Credit Suisse 19,467 0.00 GBP 299,222 USD 378,455 10/08/2017 Goldman Sachs 8,973 0.00 GBP 3,954,088 USD 4,999,628 10/08/2017 UBS 119,872 0.01 MXN 1,919,191,461 USD 105,105,312 10/08/2017 J.P. Morgan 639,612 0.04 SEK 2,829,440 USD 322,673 10/08/2017 J.P. Morgan 11,871 0.00 SEK 1,209,026,599 USD 137,927,303 10/08/2017 UBS 5,030,438 0.34 TRY 343,202,214 USD 95,475,039 10/08/2017 Citibank 824,605 0.06 TRY 339,406,671 USD 94,481,717 10/08/2017 J.P. Morgan 760,818 0.05 USD 110,775,650 BRL 367,615,060 10/08/2017 Goldman Sachs 556,706 0.05 USD 21,026,765 BRL 68,888,956 10/08/2017 J.P. Morgan 338,568 0.03 USD 894,380 HKD 6,967,572 10/08/2017 Goldman Sachs 685 0.00 USD 8,537,022 IDR 114,182,671,230 10/08/2017 Goldman Sachs 12,511 0.00 USD 6,437,310 INR 417,556,087 10/08/2017 Goldman Sachs 6,389 0.00 USD 879,011 JPY 97,730,213 10/08/2017 Citibank 5,395 0.00 USD 164,621,563 JPY 18,311,350,366 10/08/2017 J.P. Morgan 944,871 0.06 USD 15,189,620 KRW 17,069,584,259 10/08/2017 State Street 230,978 0.02 USD 8,573,536 MYR 36,580,905 10/08/2017 J.P. Morgan 66,646 0.00 USD 15,162,531 RUB 875,775,811 10/08/2017 Citibank 437,996 0.03
SCHEDULE OF INVESTMENTSAs at 30 June 2017
Investments Currency
Quantity/Nominal
Value
Market Value EUR
% of Net Assets
Units of authorised UCITS or other collective investment undertakings
Collective Investment Schemes – UCITS
LuxembourgMorgan Stanley Liquidity Funds Euro
Liquidity Fund – MS Reserve† EUR 35,352,466 35,352,466 2.41
35,352,466 2.41
Total Collective Investment Schemes – UCITS 35,352,466 2.41
Total Units of authorised UCITS or other collective investment undertakings 35,352,466 2.41
Total Investments 1,371,147,761 93.22
Cash 90,873,053 6.18
Other Assets/(Liabilities) 8,895,298 0.60
Total Net Assets 1,470,916,112 100.00
* Security is valued at its fair value under the direction of the Board of Directors.† Managed by an affi liate of the Investment Adviser.The country disclosed within the Schedule of Investments refers to the country of risk. The country of incorporation may differ.
DERIVATIVES
Over-the-counter (OTC) and exchange traded derivatives as at 30 June 2017, expressed in Euro.
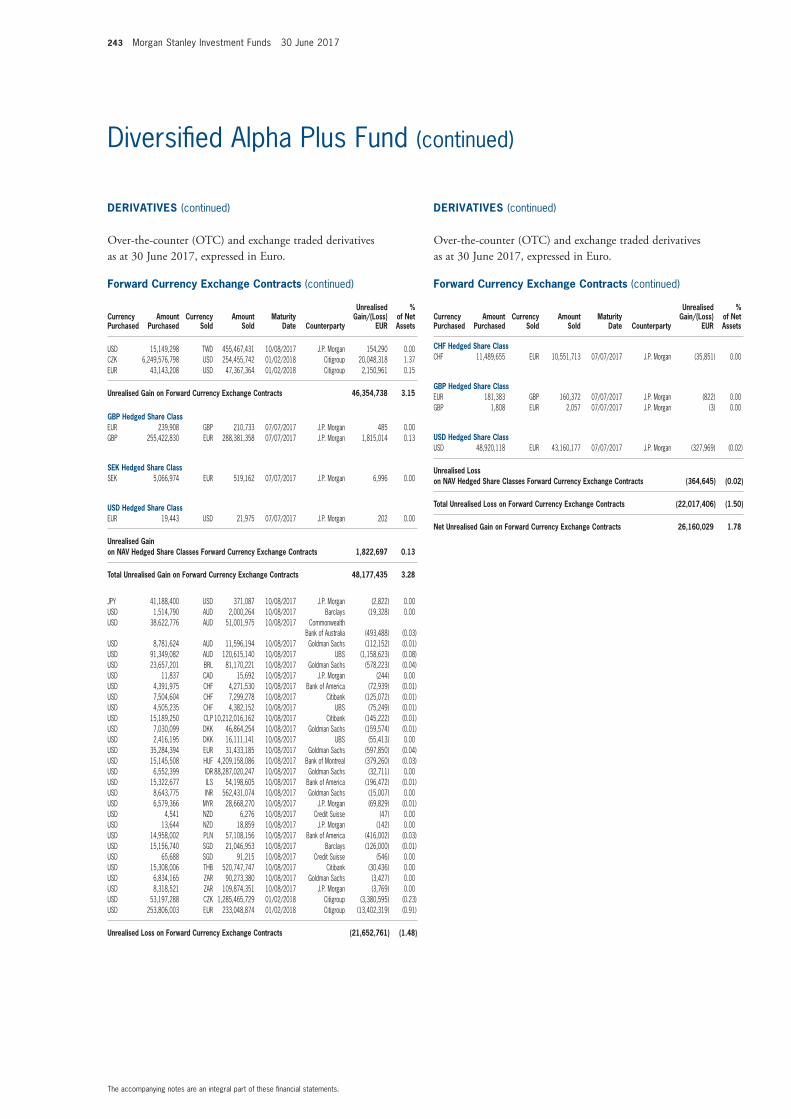
243 Morgan Stanley Investment Funds 30 June 2017
The accompanying notes are an integral part of these fi nancial statements.
Diversifi ed Alpha Plus Fund (continued)
Forward Currency Exchange Contracts (continued)
Currency Purchased
Amount Purchased
Currency Sold
Amount Sold
Maturity Date Counterparty
Unrealised Gain/(Loss)
EUR
% of Net Assets
USD 15,149,298 TWD 455,467,431 10/08/2017 J.P. Morgan 154,290 0.00 CZK 6,249,576,798 USD 254,455,742 01/02/2018 Citigroup 20,048,318 1.37 EUR 43,143,208 USD 47,367,364 01/02/2018 Citigroup 2,150,961 0.15
Unrealised Gain on Forward Currency Exchange Contracts 46,354,738 3.15
GBP Hedged Share ClassEUR 239,908 GBP 210,733 07/07/2017 J.P. Morgan 485 0.00 GBP 255,422,830 EUR 288,381,358 07/07/2017 J.P. Morgan 1,815,014 0.13
SEK Hedged Share ClassSEK 5,066,974 EUR 519,162 07/07/2017 J.P. Morgan 6,996 0.00
USD Hedged Share ClassEUR 19,443 USD 21,975 07/07/2017 J.P. Morgan 202 0.00
Unrealised Gain on NAV Hedged Share Classes Forward Currency Exchange Contracts 1,822,697 0.13
Total Unrealised Gain on Forward Currency Exchange Contracts 48,177,435 3.28
JPY 41,188,400 USD 371,087 10/08/2017 J.P. Morgan (2,822) 0.00 USD 1,514,790 AUD 2,000,264 10/08/2017 Barclays (19,328) 0.00 USD 38,622,776 AUD 51,001,975 10/08/2017 Commonwealth
Bank of Australia (493,488) (0.03) USD 8,781,624 AUD 11,596,194 10/08/2017 Goldman Sachs (112,152) (0.01) USD 91,349,082 AUD 120,615,140 10/08/2017 UBS (1,158,623) (0.08) USD 23,657,201 BRL 81,170,221 10/08/2017 Goldman Sachs (578,223) (0.04) USD 11,837 CAD 15,692 10/08/2017 J.P. Morgan (244) 0.00 USD 4,391,975 CHF 4,271,530 10/08/2017 Bank of America (72,939) (0.01) USD 7,504,604 CHF 7,299,278 10/08/2017 Citibank (125,072) (0.01) USD 4,505,235 CHF 4,382,152 10/08/2017 UBS (75,249) (0.01) USD 15,189,250 CLP 10,212,016,162 10/08/2017 Citibank (145,222) (0.01) USD 7,030,099 DKK 46,864,254 10/08/2017 Goldman Sachs (159,574) (0.01) USD 2,416,195 DKK 16,111,141 10/08/2017 UBS (55,413) 0.00 USD 35,284,394 EUR 31,433,185 10/08/2017 Goldman Sachs (597,850) (0.04) USD 15,145,508 HUF 4,209,158,086 10/08/2017 Bank of Montreal (379,260) (0.03) USD 6,552,399 IDR 88,287,020,247 10/08/2017 Goldman Sachs (32,711) 0.00 USD 15,322,677 ILS 54,198,605 10/08/2017 Bank of America (196,472) (0.01) USD 8,643,775 INR 562,431,074 10/08/2017 Goldman Sachs (15,007) 0.00 USD 6,579,366 MYR 28,668,270 10/08/2017 J.P. Morgan (69,829) (0.01) USD 4,541 NZD 6,276 10/08/2017 Credit Suisse (47) 0.00 USD 13,644 NZD 18,859 10/08/2017 J.P. Morgan (142) 0.00 USD 14,958,002 PLN 57,108,156 10/08/2017 Bank of America (416,002) (0.03) USD 15,156,740 SGD 21,046,953 10/08/2017 Barclays (126,000) (0.01) USD 65,688 SGD 91,215 10/08/2017 Credit Suisse (546) 0.00 USD 15,308,006 THB 520,747,747 10/08/2017 Citibank (30,436) 0.00 USD 6,834,165 ZAR 90,273,380 10/08/2017 Goldman Sachs (3,427) 0.00 USD 8,318,521 ZAR 109,874,351 10/08/2017 J.P. Morgan (3,769) 0.00 USD 53,197,288 CZK 1,285,465,729 01/02/2018 Citigroup (3,380,595) (0.23) USD 253,806,003 EUR 233,048,874 01/02/2018 Citigroup (13,402,319) (0.91)
Unrealised Loss on Forward Currency Exchange Contracts (21,652,761) (1.48)
Forward Currency Exchange Contracts (continued)
Currency Purchased
Amount Purchased
Currency Sold
Amount Sold
Maturity Date Counterparty
Unrealised Gain/(Loss)
EUR
% of Net Assets
CHF Hedged Share ClassCHF 11,489,655 EUR 10,551,713 07/07/2017 J.P. Morgan (35,851) 0.00
GBP Hedged Share ClassEUR 181,383 GBP 160,372 07/07/2017 J.P. Morgan (822) 0.00 GBP 1,808 EUR 2,057 07/07/2017 J.P. Morgan (3) 0.00
USD Hedged Share ClassUSD 48,920,118 EUR 43,160,177 07/07/2017 J.P. Morgan (327,969) (0.02)
Unrealised Loss on NAV Hedged Share Classes Forward Currency Exchange Contracts (364,645) (0.02)
Total Unrealised Loss on Forward Currency Exchange Contracts (22,017,406) (1.50)
Net Unrealised Gain on Forward Currency Exchange Contracts 26,160,029 1.78
DERIVATIVES (continued)
Over-the-counter (OTC) and exchange traded derivatives as at 30 June 2017, expressed in Euro.
DERIVATIVES (continued)
Over-the-counter (OTC) and exchange traded derivatives as at 30 June 2017, expressed in Euro.
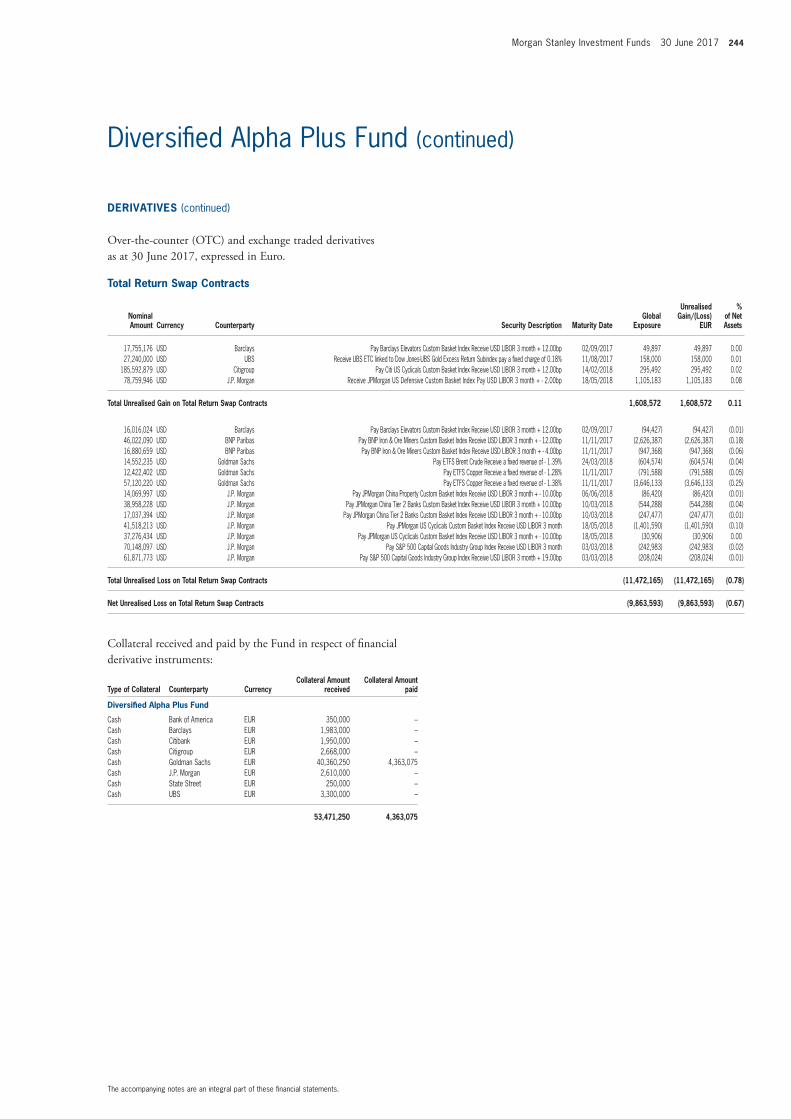
Morgan Stanley Investment Funds 30 June 2017 244
The accompanying notes are an integral part of these fi nancial statements.
Diversifi ed Alpha Plus Fund (continued)
Total Return Swap Contracts
Nominal Amount Currency Counterparty Security Description Maturity Date
Global Exposure
Unrealised Gain/(Loss)
EUR
% of Net Assets
17,755,176 USD Barclays Pay Barclays Elevators Custom Basket Index Receive USD LIBOR 3 month + 12.00bp 02/09/2017 49,897 49,897 0.0027,240,000 USD UBS Receive UBS ETC linked to Dow Jones-UBS Gold Excess Return Subindex pay a fi xed charge of 0.18% 11/08/2017 158,000 158,000 0.01
185,592,879 USD Citigroup Pay Citi US Cyclicals Custom Basket Index Receive USD LIBOR 3 month + 12.00bp 14/02/2018 295,492 295,492 0.02 78,759,946 USD J.P. Morgan Receive JPMorgan US Defensive Custom Basket Index Pay USD LIBOR 3 month + - 2.00bp 18/05/2018 1,105,183 1,105,183 0.08
Total Unrealised Gain on Total Return Swap Contracts 1,608,572 1,608,572 0.11
16,016,024 USD Barclays Pay Barclays Elevators Custom Basket Index Receive USD LIBOR 3 month + 12.00bp 02/09/2017 (94,427) (94,427) (0.01) 46,022,090 USD BNP Paribas Pay BNP Iron & Ore Miners Custom Basket Index Receive USD LIBOR 3 month + - 12.00bp 11/11/2017 (2,626,387) (2,626,387) (0.18) 16,880,659 USD BNP Paribas Pay BNP Iron & Ore Miners Custom Basket Index Receive USD LIBOR 3 month + - 4.00bp 11/11/2017 (947,368) (947,368) (0.06) 14,552,235 USD Goldman Sachs Pay ETFS Brent Crude Receive a fi xed revenue of - 1.39% 24/03/2018 (604,574) (604,574) (0.04) 12,422,402 USD Goldman Sachs Pay ETFS Copper Receive a fi xed revenue of - 1.28% 11/11/2017 (791,588) (791,588) (0.05) 57,120,220 USD Goldman Sachs Pay ETFS Copper Receive a fi xed revenue of - 1.38% 11/11/2017 (3,646,133) (3,646,133) (0.25) 14,069,997 USD J.P. Morgan Pay JPMorgan China Property Custom Basket Index Receive USD LIBOR 3 month + - 10.00bp 06/06/2018 (86,420) (86,420) (0.01) 38,958,228 USD J.P. Morgan Pay JPMorgan China Tier 2 Banks Custom Basket Index Receive USD LIBOR 3 month + 10.00bp 10/03/2018 (544,288) (544,288) (0.04) 17,037,394 USD J.P. Morgan Pay JPMorgan China Tier 2 Banks Custom Basket Index Receive USD LIBOR 3 month + - 10.00bp 10/03/2018 (247,477) (247,477) (0.01) 41,518,213 USD J.P. Morgan Pay JPMorgan US Cyclicals Custom Basket Index Receive USD LIBOR 3 month 18/05/2018 (1,401,590) (1,401,590) (0.10) 37,276,434 USD J.P. Morgan Pay JPMorgan US Cyclicals Custom Basket Index Receive USD LIBOR 3 month + - 10.00bp 18/05/2018 (30,906) (30,906) 0.0070,148,097 USD J.P. Morgan Pay S&P 500 Capital Goods Industry Group Index Receive USD LIBOR 3 month 03/03/2018 (242,983) (242,983) (0.02) 61,871,773 USD J.P. Morgan Pay S&P 500 Capital Goods Industry Group Index Receive USD LIBOR 3 month + 19.00bp 03/03/2018 (208,024) (208,024) (0.01)
Total Unrealised Loss on Total Return Swap Contracts (11,472,165) (11,472,165) (0.78)
Net Unrealised Loss on Total Return Swap Contracts (9,863,593) (9,863,593) (0.67)
Collateral received and paid by the Fund in respect of fi nancial derivative instruments:
Type of Collateral Counterparty CurrencyCollateral Amount
receivedCollateral Amount
paid
Diversifi ed Alpha Plus Fund
Cash Bank of America EUR 350,000 –Cash Barclays EUR 1,983,000 –Cash Citibank EUR 1,950,000 –Cash Citigroup EUR 2,668,000 –Cash Goldman Sachs EUR 40,360,250 4,363,075Cash J.P. Morgan EUR 2,610,000 –Cash State Street EUR 250,000 –Cash UBS EUR 3,300,000 –
53,471,250 4,363,075
DERIVATIVES (continued)
Over-the-counter (OTC) and exchange traded derivatives as at 30 June 2017, expressed in Euro.
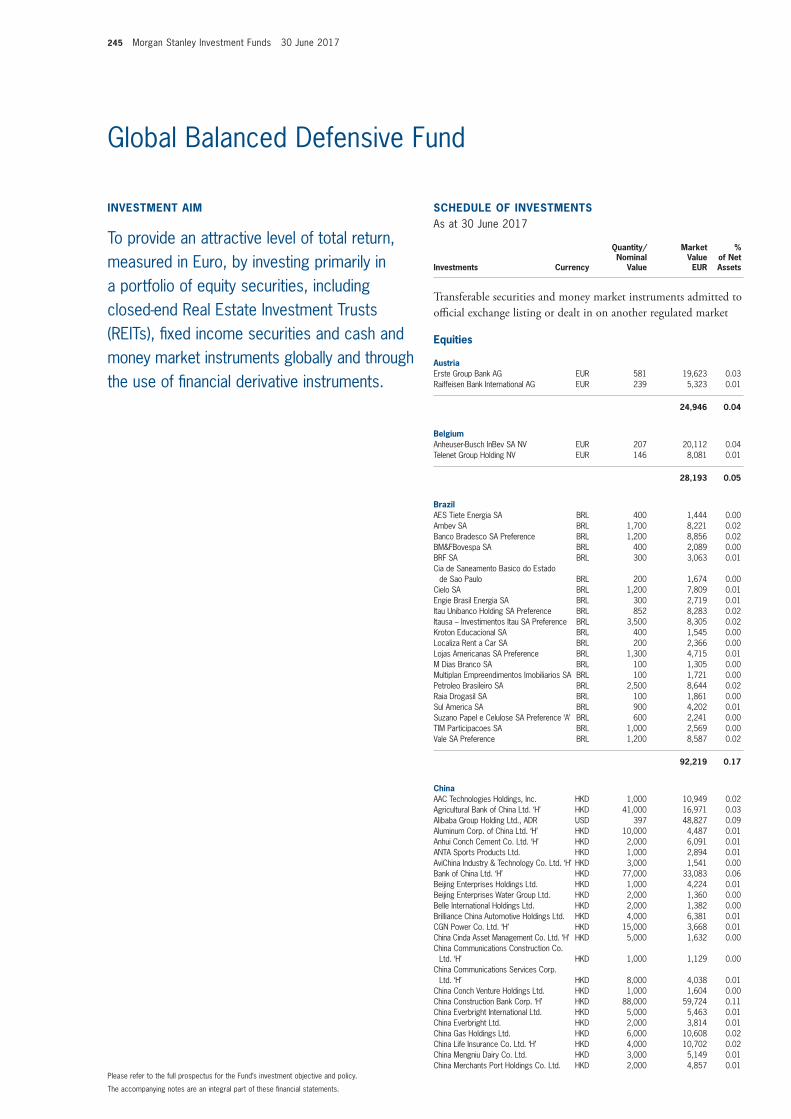
245 Morgan Stanley Investment Funds 30 June 2017
The accompanying notes are an integral part of these fi nancial statements.
Please refer to the full prospectus for the Fund’s investment objective and policy.
INVESTMENT AIM
To provide an attractive level of total return, measured in Euro, by investing primarily in a portfolio of equity securities, including closed-end Real Estate Investment Trusts (REITs), fi xed income securities and cash and money market instruments globally and through the use of fi nancial derivative instruments.
SCHEDULE OF INVESTMENTSAs at 30 June 2017
Investments Currency
Quantity/Nominal
Value
Market Value EUR
% of Net Assets
Transferable securities and money market instruments admitted to offi cial exchange listing or dealt in on another regulated market
Equities
AustriaErste Group Bank AG EUR 581 19,623 0.03 Raiffeisen Bank International AG EUR 239 5,323 0.01
24,946 0.04
BelgiumAnheuser-Busch InBev SA NV EUR 207 20,112 0.04 Telenet Group Holding NV EUR 146 8,081 0.01
28,193 0.05
BrazilAES Tiete Energia SA BRL 400 1,444 0.00 Ambev SA BRL 1,700 8,221 0.02 Banco Bradesco SA Preference BRL 1,200 8,856 0.02 BM&FBovespa SA BRL 400 2,089 0.00 BRF SA BRL 300 3,063 0.01 Cia de Saneamento Basico do Estado
de Sao Paulo BRL 200 1,674 0.00 Cielo SA BRL 1,200 7,809 0.01 Engie Brasil Energia SA BRL 300 2,719 0.01 Itau Unibanco Holding SA Preference BRL 852 8,283 0.02 Itausa – Investimentos Itau SA Preference BRL 3,500 8,305 0.02 Kroton Educacional SA BRL 400 1,545 0.00 Localiza Rent a Car SA BRL 200 2,366 0.00 Lojas Americanas SA Preference BRL 1,300 4,715 0.01 M Dias Branco SA BRL 100 1,305 0.00 Multiplan Empreendimentos Imobiliarios SA BRL 100 1,721 0.00 Petroleo Brasileiro SA BRL 2,500 8,644 0.02 Raia Drogasil SA BRL 100 1,861 0.00 Sul America SA BRL 900 4,202 0.01 Suzano Papel e Celulose SA Preference ‘A’ BRL 600 2,241 0.00 TIM Participacoes SA BRL 1,000 2,569 0.00 Vale SA Preference BRL 1,200 8,587 0.02
92,219 0.17
ChinaAAC Technologies Holdings, Inc. HKD 1,000 10,949 0.02 Agricultural Bank of China Ltd. ‘H’ HKD 41,000 16,971 0.03 Alibaba Group Holding Ltd., ADR USD 397 48,827 0.09 Aluminum Corp. of China Ltd. ‘H’ HKD 10,000 4,487 0.01 Anhui Conch Cement Co. Ltd. ‘H’ HKD 2,000 6,091 0.01 ANTA Sports Products Ltd. HKD 1,000 2,894 0.01 AviChina Industry & Technology Co. Ltd. ‘H’ HKD 3,000 1,541 0.00 Bank of China Ltd. ‘H’ HKD 77,000 33,083 0.06 Beijing Enterprises Holdings Ltd. HKD 1,000 4,224 0.01 Beijing Enterprises Water Group Ltd. HKD 2,000 1,360 0.00 Belle International Holdings Ltd. HKD 2,000 1,382 0.00 Brilliance China Automotive Holdings Ltd. HKD 4,000 6,381 0.01 CGN Power Co. Ltd. ‘H’ HKD 15,000 3,668 0.01 China Cinda Asset Management Co. Ltd. ‘H’ HKD 5,000 1,632 0.00 China Communications Construction Co.
Ltd. ‘H’ HKD 1,000 1,129 0.00 China Communications Services Corp.
Ltd. ‘H’ HKD 8,000 4,038 0.01 China Conch Venture Holdings Ltd. HKD 1,000 1,604 0.00 China Construction Bank Corp. ‘H’ HKD 88,000 59,724 0.11 China Everbright International Ltd. HKD 5,000 5,463 0.01 China Everbright Ltd. HKD 2,000 3,814 0.01 China Gas Holdings Ltd. HKD 6,000 10,608 0.02 China Life Insurance Co. Ltd. ‘H’ HKD 4,000 10,702 0.02 China Mengniu Dairy Co. Ltd. HKD 3,000 5,149 0.01 China Merchants Port Holdings Co. Ltd. HKD 2,000 4,857 0.01
Global Balanced Defensive Fund
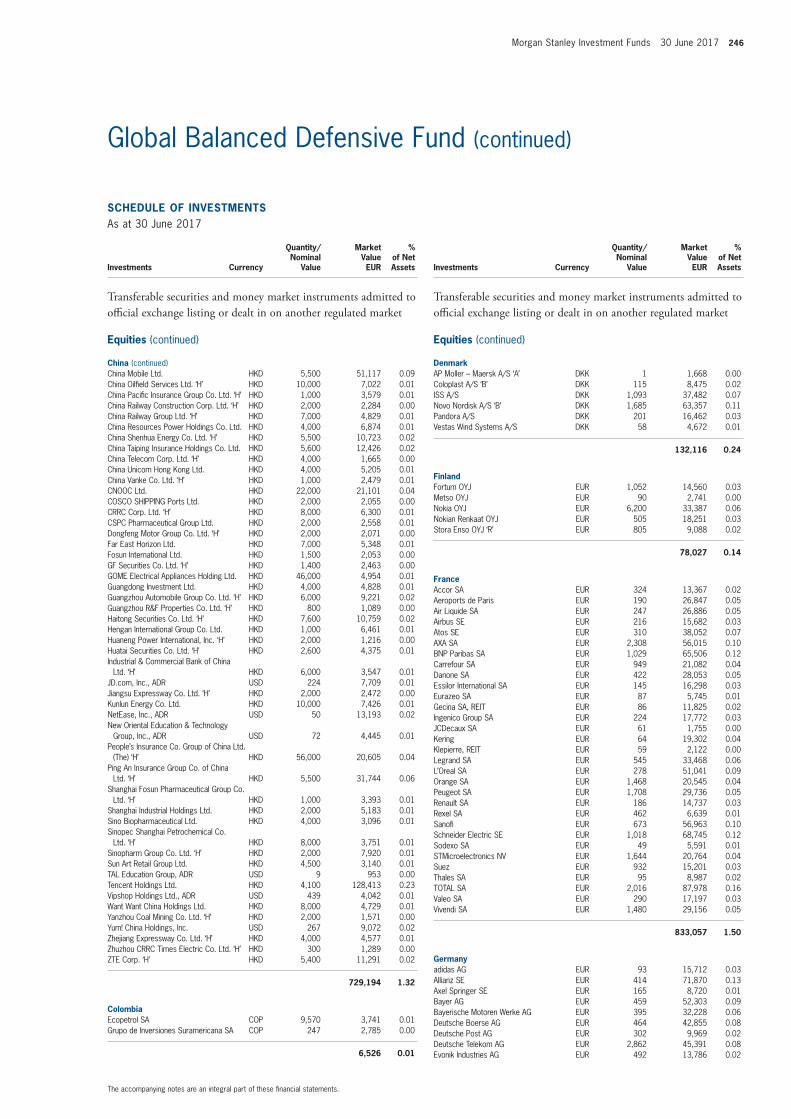
Morgan Stanley Investment Funds 30 June 2017 246
The accompanying notes are an integral part of these fi nancial statements.
Global Balanced Defensive Fund (continued)
SCHEDULE OF INVESTMENTSAs at 30 June 2017
Investments Currency
Quantity/Nominal
Value
Market Value EUR
% of Net Assets
Transferable securities and money market instruments admitted to offi cial exchange listing or dealt in on another regulated market
Equities (continued)
China (continued)China Mobile Ltd. HKD 5,500 51,117 0.09 China Oilfi eld Services Ltd. ‘H’ HKD 10,000 7,022 0.01 China Pacifi c Insurance Group Co. Ltd. ‘H’ HKD 1,000 3,579 0.01 China Railway Construction Corp. Ltd. ‘H’ HKD 2,000 2,284 0.00 China Railway Group Ltd. ‘H’ HKD 7,000 4,829 0.01 China Resources Power Holdings Co. Ltd. HKD 4,000 6,874 0.01 China Shenhua Energy Co. Ltd. ‘H’ HKD 5,500 10,723 0.02 China Taiping Insurance Holdings Co. Ltd. HKD 5,600 12,426 0.02 China Telecom Corp. Ltd. ‘H’ HKD 4,000 1,665 0.00 China Unicom Hong Kong Ltd. HKD 4,000 5,205 0.01 China Vanke Co. Ltd. ‘H’ HKD 1,000 2,479 0.01 CNOOC Ltd. HKD 22,000 21,101 0.04 COSCO SHIPPING Ports Ltd. HKD 2,000 2,055 0.00 CRRC Corp. Ltd. ‘H’ HKD 8,000 6,300 0.01 CSPC Pharmaceutical Group Ltd. HKD 2,000 2,558 0.01 Dongfeng Motor Group Co. Ltd. ‘H’ HKD 2,000 2,071 0.00 Far East Horizon Ltd. HKD 7,000 5,348 0.01 Fosun International Ltd. HKD 1,500 2,053 0.00 GF Securities Co. Ltd. ‘H’ HKD 1,400 2,463 0.00 GOME Electrical Appliances Holding Ltd. HKD 46,000 4,954 0.01 Guangdong Investment Ltd. HKD 4,000 4,828 0.01 Guangzhou Automobile Group Co. Ltd. ‘H’ HKD 6,000 9,221 0.02 Guangzhou R&F Properties Co. Ltd. ‘H’ HKD 800 1,089 0.00 Haitong Securities Co. Ltd. ‘H’ HKD 7,600 10,759 0.02 Hengan International Group Co. Ltd. HKD 1,000 6,461 0.01 Huaneng Power International, Inc. ‘H’ HKD 2,000 1,216 0.00 Huatai Securities Co. Ltd. ‘H’ HKD 2,600 4,375 0.01 Industrial & Commercial Bank of China
Ltd. ‘H’ HKD 6,000 3,547 0.01 JD.com, Inc., ADR USD 224 7,709 0.01 Jiangsu Expressway Co. Ltd. ‘H’ HKD 2,000 2,472 0.00 Kunlun Energy Co. Ltd. HKD 10,000 7,426 0.01 NetEase, Inc., ADR USD 50 13,193 0.02 New Oriental Education & Technology
Group, Inc., ADR USD 72 4,445 0.01 People’s Insurance Co. Group of China Ltd.
(The) ‘H’ HKD 56,000 20,605 0.04 Ping An Insurance Group Co. of China
Ltd. ‘H’ HKD 5,500 31,744 0.06 Shanghai Fosun Pharmaceutical Group Co.
Ltd. ‘H’ HKD 1,000 3,393 0.01 Shanghai Industrial Holdings Ltd. HKD 2,000 5,183 0.01 Sino Biopharmaceutical Ltd. HKD 4,000 3,096 0.01 Sinopec Shanghai Petrochemical Co.
Ltd. ‘H’ HKD 8,000 3,751 0.01 Sinopharm Group Co. Ltd. ‘H’ HKD 2,000 7,920 0.01 Sun Art Retail Group Ltd. HKD 4,500 3,140 0.01 TAL Education Group, ADR USD 9 953 0.00 Tencent Holdings Ltd. HKD 4,100 128,413 0.23 Vipshop Holdings Ltd., ADR USD 439 4,042 0.01 Want Want China Holdings Ltd. HKD 8,000 4,729 0.01 Yanzhou Coal Mining Co. Ltd. ‘H’ HKD 2,000 1,571 0.00 Yum! China Holdings, Inc. USD 267 9,072 0.02 Zhejiang Expressway Co. Ltd. ‘H’ HKD 4,000 4,577 0.01 Zhuzhou CRRC Times Electric Co. Ltd. ‘H’ HKD 300 1,289 0.00 ZTE Corp. ‘H’ HKD 5,400 11,291 0.02
729,194 1.32
ColombiaEcopetrol SA COP 9,570 3,741 0.01 Grupo de Inversiones Suramericana SA COP 247 2,785 0.00
6,526 0.01
SCHEDULE OF INVESTMENTSAs at 30 June 2017
Investments Currency
Quantity/Nominal
Value
Market Value EUR
% of Net Assets
Transferable securities and money market instruments admitted to offi cial exchange listing or dealt in on another regulated market
Equities (continued)
DenmarkAP Moller – Maersk A/S ‘A’ DKK 1 1,668 0.00 Coloplast A/S ‘B’ DKK 115 8,475 0.02 ISS A/S DKK 1,093 37,482 0.07 Novo Nordisk A/S ‘B’ DKK 1,685 63,357 0.11 Pandora A/S DKK 201 16,462 0.03 Vestas Wind Systems A/S DKK 58 4,672 0.01
132,116 0.24
FinlandFortum OYJ EUR 1,052 14,560 0.03 Metso OYJ EUR 90 2,741 0.00 Nokia OYJ EUR 6,200 33,387 0.06 Nokian Renkaat OYJ EUR 505 18,251 0.03 Stora Enso OYJ ‘R’ EUR 805 9,088 0.02
78,027 0.14
FranceAccor SA EUR 324 13,367 0.02 Aeroports de Paris EUR 190 26,847 0.05 Air Liquide SA EUR 247 26,886 0.05 Airbus SE EUR 216 15,682 0.03 Atos SE EUR 310 38,052 0.07 AXA SA EUR 2,308 56,015 0.10 BNP Paribas SA EUR 1,029 65,506 0.12 Carrefour SA EUR 949 21,082 0.04 Danone SA EUR 422 28,053 0.05 Essilor International SA EUR 145 16,298 0.03 Eurazeo SA EUR 87 5,745 0.01 Gecina SA, REIT EUR 86 11,825 0.02 Ingenico Group SA EUR 224 17,772 0.03 JCDecaux SA EUR 61 1,755 0.00 Kering EUR 64 19,302 0.04 Klepierre, REIT EUR 59 2,122 0.00 Legrand SA EUR 545 33,468 0.06 L’Oreal SA EUR 278 51,041 0.09 Orange SA EUR 1,468 20,545 0.04 Peugeot SA EUR 1,708 29,736 0.05 Renault SA EUR 186 14,737 0.03 Rexel SA EUR 462 6,639 0.01 Sanofi EUR 673 56,963 0.10 Schneider Electric SE EUR 1,018 68,745 0.12 Sodexo SA EUR 49 5,591 0.01 STMicroelectronics NV EUR 1,644 20,764 0.04 Suez EUR 932 15,201 0.03 Thales SA EUR 95 8,987 0.02 TOTAL SA EUR 2,016 87,978 0.16 Valeo SA EUR 290 17,197 0.03 Vivendi SA EUR 1,480 29,156 0.05
833,057 1.50
Germanyadidas AG EUR 93 15,712 0.03 Allianz SE EUR 414 71,870 0.13 Axel Springer SE EUR 165 8,720 0.01 Bayer AG EUR 459 52,303 0.09 Bayerische Motoren Werke AG EUR 395 32,228 0.06 Deutsche Boerse AG EUR 464 42,855 0.08 Deutsche Post AG EUR 302 9,969 0.02 Deutsche Telekom AG EUR 2,862 45,391 0.08 Evonik Industries AG EUR 492 13,786 0.02
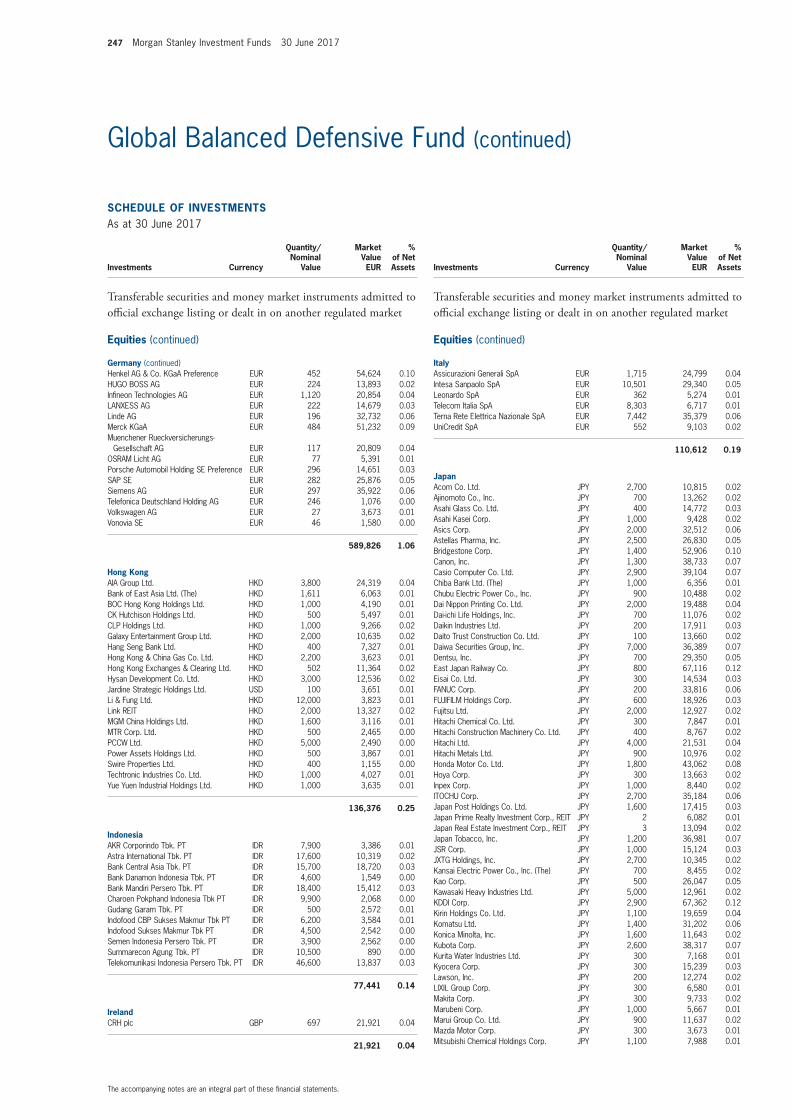
247 Morgan Stanley Investment Funds 30 June 2017
The accompanying notes are an integral part of these fi nancial statements.
Global Balanced Defensive Fund (continued)
SCHEDULE OF INVESTMENTSAs at 30 June 2017
Investments Currency
Quantity/Nominal
Value
Market Value EUR
% of Net Assets
Transferable securities and money market instruments admitted to offi cial exchange listing or dealt in on another regulated market
Equities (continued)
Germany (continued)Henkel AG & Co. KGaA Preference EUR 452 54,624 0.10 HUGO BOSS AG EUR 224 13,893 0.02 Infi neon Technologies AG EUR 1,120 20,854 0.04 LANXESS AG EUR 222 14,679 0.03 Linde AG EUR 196 32,732 0.06 Merck KGaA EUR 484 51,232 0.09 Muenchener Rueckversicherungs-
Gesellschaft AG EUR 117 20,809 0.04 OSRAM Licht AG EUR 77 5,391 0.01 Porsche Automobil Holding SE Preference EUR 296 14,651 0.03 SAP SE EUR 282 25,876 0.05 Siemens AG EUR 297 35,922 0.06 Telefonica Deutschland Holding AG EUR 246 1,076 0.00 Volkswagen AG EUR 27 3,673 0.01 Vonovia SE EUR 46 1,580 0.00
589,826 1.06
Hong KongAIA Group Ltd. HKD 3,800 24,319 0.04 Bank of East Asia Ltd. (The) HKD 1,611 6,063 0.01 BOC Hong Kong Holdings Ltd. HKD 1,000 4,190 0.01 CK Hutchison Holdings Ltd. HKD 500 5,497 0.01 CLP Holdings Ltd. HKD 1,000 9,266 0.02 Galaxy Entertainment Group Ltd. HKD 2,000 10,635 0.02 Hang Seng Bank Ltd. HKD 400 7,327 0.01 Hong Kong & China Gas Co. Ltd. HKD 2,200 3,623 0.01 Hong Kong Exchanges & Clearing Ltd. HKD 502 11,364 0.02 Hysan Development Co. Ltd. HKD 3,000 12,536 0.02 Jardine Strategic Holdings Ltd. USD 100 3,651 0.01 Li & Fung Ltd. HKD 12,000 3,823 0.01 Link REIT HKD 2,000 13,327 0.02 MGM China Holdings Ltd. HKD 1,600 3,116 0.01 MTR Corp. Ltd. HKD 500 2,465 0.00 PCCW Ltd. HKD 5,000 2,490 0.00 Power Assets Holdings Ltd. HKD 500 3,867 0.01 Swire Properties Ltd. HKD 400 1,155 0.00 Techtronic Industries Co. Ltd. HKD 1,000 4,027 0.01 Yue Yuen Industrial Holdings Ltd. HKD 1,000 3,635 0.01
136,376 0.25
IndonesiaAKR Corporindo Tbk. PT IDR 7,900 3,386 0.01 Astra International Tbk. PT IDR 17,600 10,319 0.02 Bank Central Asia Tbk. PT IDR 15,700 18,720 0.03 Bank Danamon Indonesia Tbk. PT IDR 4,600 1,549 0.00 Bank Mandiri Persero Tbk. PT IDR 18,400 15,412 0.03 Charoen Pokphand Indonesia Tbk PT IDR 9,900 2,068 0.00 Gudang Garam Tbk. PT IDR 500 2,572 0.01 Indofood CBP Sukses Makmur Tbk PT IDR 6,200 3,584 0.01 Indofood Sukses Makmur Tbk PT IDR 4,500 2,542 0.00 Semen Indonesia Persero Tbk. PT IDR 3,900 2,562 0.00 Summarecon Agung Tbk. PT IDR 10,500 890 0.00 Telekomunikasi Indonesia Persero Tbk. PT IDR 46,600 13,837 0.03
77,441 0.14
IrelandCRH plc GBP 697 21,921 0.04
21,921 0.04
SCHEDULE OF INVESTMENTSAs at 30 June 2017
Investments Currency
Quantity/Nominal
Value
Market Value EUR
% of Net Assets
Transferable securities and money market instruments admitted to offi cial exchange listing or dealt in on another regulated market
Equities (continued)
ItalyAssicurazioni Generali SpA EUR 1,715 24,799 0.04 Intesa Sanpaolo SpA EUR 10,501 29,340 0.05 Leonardo SpA EUR 362 5,274 0.01 Telecom Italia SpA EUR 8,303 6,717 0.01 Terna Rete Elettrica Nazionale SpA EUR 7,442 35,379 0.06 UniCredit SpA EUR 552 9,103 0.02
110,612 0.19
JapanAcom Co. Ltd. JPY 2,700 10,815 0.02 Ajinomoto Co., Inc. JPY 700 13,262 0.02 Asahi Glass Co. Ltd. JPY 400 14,772 0.03 Asahi Kasei Corp. JPY 1,000 9,428 0.02 Asics Corp. JPY 2,000 32,512 0.06 Astellas Pharma, Inc. JPY 2,500 26,830 0.05 Bridgestone Corp. JPY 1,400 52,906 0.10 Canon, Inc. JPY 1,300 38,733 0.07 Casio Computer Co. Ltd. JPY 2,900 39,104 0.07 Chiba Bank Ltd. (The) JPY 1,000 6,356 0.01 Chubu Electric Power Co., Inc. JPY 900 10,488 0.02 Dai Nippon Printing Co. Ltd. JPY 2,000 19,488 0.04 Dai-ichi Life Holdings, Inc. JPY 700 11,076 0.02 Daikin Industries Ltd. JPY 200 17,911 0.03 Daito Trust Construction Co. Ltd. JPY 100 13,660 0.02 Daiwa Securities Group, Inc. JPY 7,000 36,389 0.07 Dentsu, Inc. JPY 700 29,350 0.05 East Japan Railway Co. JPY 800 67,116 0.12 Eisai Co. Ltd. JPY 300 14,534 0.03 FANUC Corp. JPY 200 33,816 0.06 FUJIFILM Holdings Corp. JPY 600 18,926 0.03 Fujitsu Ltd. JPY 2,000 12,927 0.02 Hitachi Chemical Co. Ltd. JPY 300 7,847 0.01 Hitachi Construction Machinery Co. Ltd. JPY 400 8,767 0.02 Hitachi Ltd. JPY 4,000 21,531 0.04 Hitachi Metals Ltd. JPY 900 10,976 0.02 Honda Motor Co. Ltd. JPY 1,800 43,062 0.08 Hoya Corp. JPY 300 13,663 0.02 Inpex Corp. JPY 1,000 8,440 0.02 ITOCHU Corp. JPY 2,700 35,184 0.06 Japan Post Holdings Co. Ltd. JPY 1,600 17,415 0.03 Japan Prime Realty Investment Corp., REIT JPY 2 6,082 0.01 Japan Real Estate Investment Corp., REIT JPY 3 13,094 0.02 Japan Tobacco, Inc. JPY 1,200 36,981 0.07 JSR Corp. JPY 1,000 15,124 0.03 JXTG Holdings, Inc. JPY 2,700 10,345 0.02 Kansai Electric Power Co., Inc. (The) JPY 700 8,455 0.02 Kao Corp. JPY 500 26,047 0.05 Kawasaki Heavy Industries Ltd. JPY 5,000 12,961 0.02 KDDI Corp. JPY 2,900 67,362 0.12 Kirin Holdings Co. Ltd. JPY 1,100 19,659 0.04 Komatsu Ltd. JPY 1,400 31,202 0.06 Konica Minolta, Inc. JPY 1,600 11,643 0.02 Kubota Corp. JPY 2,600 38,317 0.07 Kurita Water Industries Ltd. JPY 300 7,168 0.01 Kyocera Corp. JPY 300 15,239 0.03 Lawson, Inc. JPY 200 12,274 0.02 LIXIL Group Corp. JPY 300 6,580 0.01 Makita Corp. JPY 300 9,733 0.02 Marubeni Corp. JPY 1,000 5,667 0.01 Marui Group Co. Ltd. JPY 900 11,637 0.02 Mazda Motor Corp. JPY 300 3,673 0.01 Mitsubishi Chemical Holdings Corp. JPY 1,100 7,988 0.01
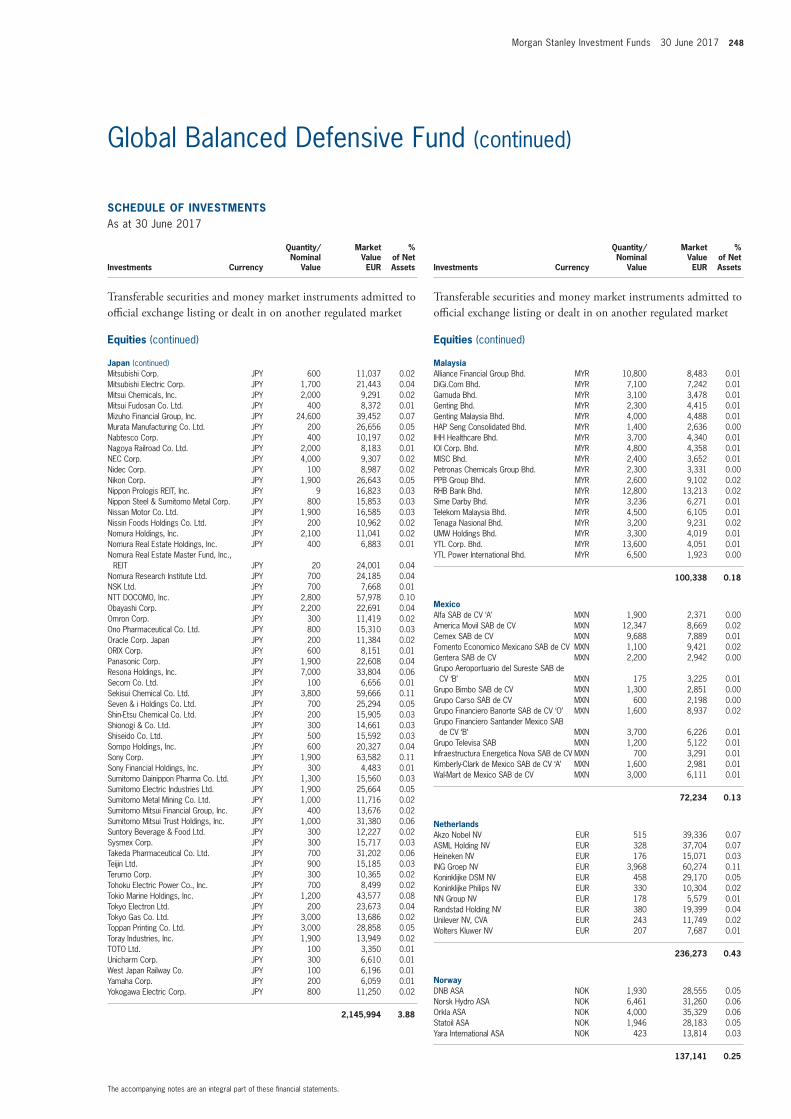
Morgan Stanley Investment Funds 30 June 2017 248
The accompanying notes are an integral part of these fi nancial statements.
Global Balanced Defensive Fund (continued)
SCHEDULE OF INVESTMENTSAs at 30 June 2017
Investments Currency
Quantity/Nominal
Value
Market Value EUR
% of Net Assets
Transferable securities and money market instruments admitted to offi cial exchange listing or dealt in on another regulated market
Equities (continued)
Japan (continued)Mitsubishi Corp. JPY 600 11,037 0.02 Mitsubishi Electric Corp. JPY 1,700 21,443 0.04 Mitsui Chemicals, Inc. JPY 2,000 9,291 0.02 Mitsui Fudosan Co. Ltd. JPY 400 8,372 0.01 Mizuho Financial Group, Inc. JPY 24,600 39,452 0.07 Murata Manufacturing Co. Ltd. JPY 200 26,656 0.05 Nabtesco Corp. JPY 400 10,197 0.02 Nagoya Railroad Co. Ltd. JPY 2,000 8,183 0.01 NEC Corp. JPY 4,000 9,307 0.02 Nidec Corp. JPY 100 8,987 0.02 Nikon Corp. JPY 1,900 26,643 0.05 Nippon Prologis REIT, Inc. JPY 9 16,823 0.03 Nippon Steel & Sumitomo Metal Corp. JPY 800 15,853 0.03 Nissan Motor Co. Ltd. JPY 1,900 16,585 0.03 Nissin Foods Holdings Co. Ltd. JPY 200 10,962 0.02 Nomura Holdings, Inc. JPY 2,100 11,041 0.02 Nomura Real Estate Holdings, Inc. JPY 400 6,883 0.01 Nomura Real Estate Master Fund, Inc.,
REIT JPY 20 24,001 0.04 Nomura Research Institute Ltd. JPY 700 24,185 0.04 NSK Ltd. JPY 700 7,668 0.01 NTT DOCOMO, Inc. JPY 2,800 57,978 0.10 Obayashi Corp. JPY 2,200 22,691 0.04 Omron Corp. JPY 300 11,419 0.02 Ono Pharmaceutical Co. Ltd. JPY 800 15,310 0.03 Oracle Corp. Japan JPY 200 11,384 0.02 ORIX Corp. JPY 600 8,151 0.01 Panasonic Corp. JPY 1,900 22,608 0.04 Resona Holdings, Inc. JPY 7,000 33,804 0.06 Secom Co. Ltd. JPY 100 6,656 0.01 Sekisui Chemical Co. Ltd. JPY 3,800 59,666 0.11 Seven & i Holdings Co. Ltd. JPY 700 25,294 0.05 Shin-Etsu Chemical Co. Ltd. JPY 200 15,905 0.03 Shionogi & Co. Ltd. JPY 300 14,661 0.03 Shiseido Co. Ltd. JPY 500 15,592 0.03 Sompo Holdings, Inc. JPY 600 20,327 0.04 Sony Corp. JPY 1,900 63,582 0.11 Sony Financial Holdings, Inc. JPY 300 4,483 0.01 Sumitomo Dainippon Pharma Co. Ltd. JPY 1,300 15,560 0.03 Sumitomo Electric Industries Ltd. JPY 1,900 25,664 0.05 Sumitomo Metal Mining Co. Ltd. JPY 1,000 11,716 0.02 Sumitomo Mitsui Financial Group, Inc. JPY 400 13,676 0.02 Sumitomo Mitsui Trust Holdings, Inc. JPY 1,000 31,380 0.06 Suntory Beverage & Food Ltd. JPY 300 12,227 0.02 Sysmex Corp. JPY 300 15,717 0.03 Takeda Pharmaceutical Co. Ltd. JPY 700 31,202 0.06 Teijin Ltd. JPY 900 15,185 0.03 Terumo Corp. JPY 300 10,365 0.02 Tohoku Electric Power Co., Inc. JPY 700 8,499 0.02 Tokio Marine Holdings, Inc. JPY 1,200 43,577 0.08 Tokyo Electron Ltd. JPY 200 23,673 0.04 Tokyo Gas Co. Ltd. JPY 3,000 13,686 0.02 Toppan Printing Co. Ltd. JPY 3,000 28,858 0.05 Toray Industries, Inc. JPY 1,900 13,949 0.02 TOTO Ltd. JPY 100 3,350 0.01 Unicharm Corp. JPY 300 6,610 0.01 West Japan Railway Co. JPY 100 6,196 0.01 Yamaha Corp. JPY 200 6,059 0.01 Yokogawa Electric Corp. JPY 800 11,250 0.02
2,145,994 3.88
SCHEDULE OF INVESTMENTSAs at 30 June 2017
Investments Currency
Quantity/Nominal
Value
Market Value EUR
% of Net Assets
Transferable securities and money market instruments admitted to offi cial exchange listing or dealt in on another regulated market
Equities (continued)
MalaysiaAlliance Financial Group Bhd. MYR 10,800 8,483 0.01 DiGi.Com Bhd. MYR 7,100 7,242 0.01 Gamuda Bhd. MYR 3,100 3,478 0.01 Genting Bhd. MYR 2,300 4,415 0.01 Genting Malaysia Bhd. MYR 4,000 4,488 0.01 HAP Seng Consolidated Bhd. MYR 1,400 2,636 0.00 IHH Healthcare Bhd. MYR 3,700 4,340 0.01 IOI Corp. Bhd. MYR 4,800 4,358 0.01 MISC Bhd. MYR 2,400 3,652 0.01 Petronas Chemicals Group Bhd. MYR 2,300 3,331 0.00 PPB Group Bhd. MYR 2,600 9,102 0.02 RHB Bank Bhd. MYR 12,800 13,213 0.02 Sime Darby Bhd. MYR 3,236 6,271 0.01 Telekom Malaysia Bhd. MYR 4,500 6,105 0.01 Tenaga Nasional Bhd. MYR 3,200 9,231 0.02 UMW Holdings Bhd. MYR 3,300 4,019 0.01 YTL Corp. Bhd. MYR 13,600 4,051 0.01 YTL Power International Bhd. MYR 6,500 1,923 0.00
100,338 0.18
MexicoAlfa SAB de CV ‘A’ MXN 1,900 2,371 0.00 America Movil SAB de CV MXN 12,347 8,669 0.02 Cemex SAB de CV MXN 9,688 7,889 0.01 Fomento Economico Mexicano SAB de CV MXN 1,100 9,421 0.02 Gentera SAB de CV MXN 2,200 2,942 0.00 Grupo Aeroportuario del Sureste SAB de
CV ‘B’ MXN 175 3,225 0.01 Grupo Bimbo SAB de CV MXN 1,300 2,851 0.00 Grupo Carso SAB de CV MXN 600 2,198 0.00 Grupo Financiero Banorte SAB de CV ‘O’ MXN 1,600 8,937 0.02 Grupo Financiero Santander Mexico SAB
de CV ‘B’ MXN 3,700 6,226 0.01 Grupo Televisa SAB MXN 1,200 5,122 0.01 Infraestructura Energetica Nova SAB de CV MXN 700 3,291 0.01 Kimberly-Clark de Mexico SAB de CV ‘A’ MXN 1,600 2,981 0.01 Wal-Mart de Mexico SAB de CV MXN 3,000 6,111 0.01
72,234 0.13
NetherlandsAkzo Nobel NV EUR 515 39,336 0.07 ASML Holding NV EUR 328 37,704 0.07 Heineken NV EUR 176 15,071 0.03 ING Groep NV EUR 3,968 60,274 0.11 Koninklijke DSM NV EUR 458 29,170 0.05 Koninklijke Philips NV EUR 330 10,304 0.02 NN Group NV EUR 178 5,579 0.01 Randstad Holding NV EUR 380 19,399 0.04 Unilever NV, CVA EUR 243 11,749 0.02 Wolters Kluwer NV EUR 207 7,687 0.01
236,273 0.43
NorwayDNB ASA NOK 1,930 28,555 0.05 Norsk Hydro ASA NOK 6,461 31,260 0.06 Orkla ASA NOK 4,000 35,329 0.06 Statoil ASA NOK 1,946 28,183 0.05 Yara International ASA NOK 423 13,814 0.03
137,141 0.25
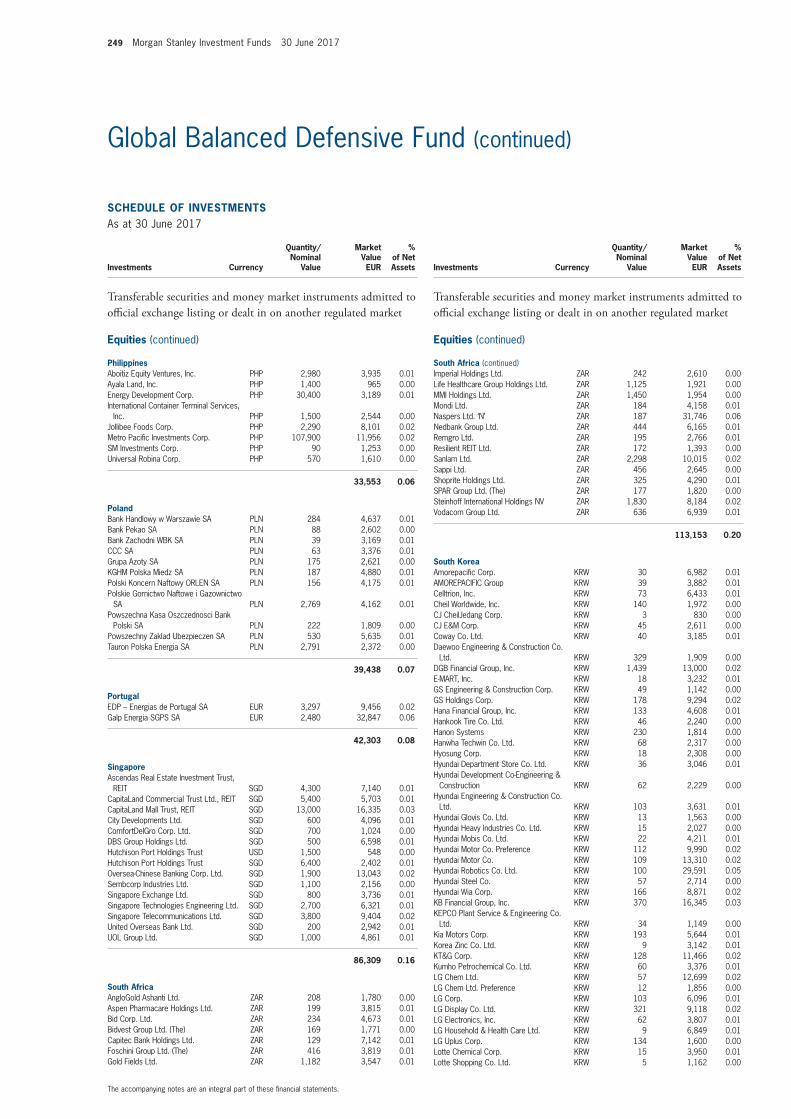
249 Morgan Stanley Investment Funds 30 June 2017
The accompanying notes are an integral part of these fi nancial statements.
Global Balanced Defensive Fund (continued)
SCHEDULE OF INVESTMENTSAs at 30 June 2017
Investments Currency
Quantity/Nominal
Value
Market Value EUR
% of Net Assets
Transferable securities and money market instruments admitted to offi cial exchange listing or dealt in on another regulated market
Equities (continued)
PhilippinesAboitiz Equity Ventures, Inc. PHP 2,980 3,935 0.01 Ayala Land, Inc. PHP 1,400 965 0.00 Energy Development Corp. PHP 30,400 3,189 0.01 International Container Terminal Services,
Inc. PHP 1,500 2,544 0.00 Jollibee Foods Corp. PHP 2,290 8,101 0.02 Metro Pacifi c Investments Corp. PHP 107,900 11,956 0.02 SM Investments Corp. PHP 90 1,253 0.00 Universal Robina Corp. PHP 570 1,610 0.00
33,553 0.06
PolandBank Handlowy w Warszawie SA PLN 284 4,637 0.01 Bank Pekao SA PLN 88 2,602 0.00 Bank Zachodni WBK SA PLN 39 3,169 0.01 CCC SA PLN 63 3,376 0.01 Grupa Azoty SA PLN 175 2,621 0.00 KGHM Polska Miedz SA PLN 187 4,880 0.01 Polski Koncern Naftowy ORLEN SA PLN 156 4,175 0.01 Polskie Gornictwo Naftowe i Gazownictwo
SA PLN 2,769 4,162 0.01 Powszechna Kasa Oszczednosci Bank
Polski SA PLN 222 1,809 0.00 Powszechny Zaklad Ubezpieczen SA PLN 530 5,635 0.01 Tauron Polska Energia SA PLN 2,791 2,372 0.00
39,438 0.07
PortugalEDP – Energias de Portugal SA EUR 3,297 9,456 0.02 Galp Energia SGPS SA EUR 2,480 32,847 0.06
42,303 0.08
SingaporeAscendas Real Estate Investment Trust,
REIT SGD 4,300 7,140 0.01 CapitaLand Commercial Trust Ltd., REIT SGD 5,400 5,703 0.01 CapitaLand Mall Trust, REIT SGD 13,000 16,335 0.03 City Developments Ltd. SGD 600 4,096 0.01 ComfortDelGro Corp. Ltd. SGD 700 1,024 0.00 DBS Group Holdings Ltd. SGD 500 6,598 0.01 Hutchison Port Holdings Trust USD 1,500 548 0.00 Hutchison Port Holdings Trust SGD 6,400 2,402 0.01 Oversea-Chinese Banking Corp. Ltd. SGD 1,900 13,043 0.02 Sembcorp Industries Ltd. SGD 1,100 2,156 0.00 Singapore Exchange Ltd. SGD 800 3,736 0.01 Singapore Technologies Engineering Ltd. SGD 2,700 6,321 0.01 Singapore Telecommunications Ltd. SGD 3,800 9,404 0.02 United Overseas Bank Ltd. SGD 200 2,942 0.01 UOL Group Ltd. SGD 1,000 4,861 0.01
86,309 0.16
South AfricaAngloGold Ashanti Ltd. ZAR 208 1,780 0.00 Aspen Pharmacare Holdings Ltd. ZAR 199 3,815 0.01 Bid Corp. Ltd. ZAR 234 4,673 0.01 Bidvest Group Ltd. (The) ZAR 169 1,771 0.00 Capitec Bank Holdings Ltd. ZAR 129 7,142 0.01 Foschini Group Ltd. (The) ZAR 416 3,819 0.01 Gold Fields Ltd. ZAR 1,182 3,547 0.01
SCHEDULE OF INVESTMENTSAs at 30 June 2017
Investments Currency
Quantity/Nominal
Value
Market Value EUR
% of Net Assets
Transferable securities and money market instruments admitted to offi cial exchange listing or dealt in on another regulated market
Equities (continued)
South Africa (continued)Imperial Holdings Ltd. ZAR 242 2,610 0.00 Life Healthcare Group Holdings Ltd. ZAR 1,125 1,921 0.00 MMI Holdings Ltd. ZAR 1,450 1,954 0.00 Mondi Ltd. ZAR 184 4,158 0.01 Naspers Ltd. ‘N’ ZAR 187 31,746 0.06 Nedbank Group Ltd. ZAR 444 6,165 0.01 Remgro Ltd. ZAR 195 2,766 0.01 Resilient REIT Ltd. ZAR 172 1,393 0.00 Sanlam Ltd. ZAR 2,298 10,015 0.02 Sappi Ltd. ZAR 456 2,645 0.00 Shoprite Holdings Ltd. ZAR 325 4,290 0.01 SPAR Group Ltd. (The) ZAR 177 1,820 0.00 Steinhoff International Holdings NV ZAR 1,830 8,184 0.02 Vodacom Group Ltd. ZAR 636 6,939 0.01
113,153 0.20
South KoreaAmorepacifi c Corp. KRW 30 6,982 0.01 AMOREPACIFIC Group KRW 39 3,882 0.01 Celltrion, Inc. KRW 73 6,433 0.01 Cheil Worldwide, Inc. KRW 140 1,972 0.00 CJ CheilJedang Corp. KRW 3 830 0.00 CJ E&M Corp. KRW 45 2,611 0.00 Coway Co. Ltd. KRW 40 3,185 0.01 Daewoo Engineering & Construction Co.
Ltd. KRW 329 1,909 0.00 DGB Financial Group, Inc. KRW 1,439 13,000 0.02 E-MART, Inc. KRW 18 3,232 0.01 GS Engineering & Construction Corp. KRW 49 1,142 0.00 GS Holdings Corp. KRW 178 9,294 0.02 Hana Financial Group, Inc. KRW 133 4,608 0.01 Hankook Tire Co. Ltd. KRW 46 2,240 0.00 Hanon Systems KRW 230 1,814 0.00 Hanwha Techwin Co. Ltd. KRW 68 2,317 0.00 Hyosung Corp. KRW 18 2,308 0.00 Hyundai Department Store Co. Ltd. KRW 36 3,046 0.01 Hyundai Development Co-Engineering &
Construction KRW 62 2,229 0.00 Hyundai Engineering & Construction Co.
Ltd. KRW 103 3,631 0.01 Hyundai Glovis Co. Ltd. KRW 13 1,563 0.00 Hyundai Heavy Industries Co. Ltd. KRW 15 2,027 0.00 Hyundai Mobis Co. Ltd. KRW 22 4,211 0.01 Hyundai Motor Co. Preference KRW 112 9,990 0.02 Hyundai Motor Co. KRW 109 13,310 0.02 Hyundai Robotics Co. Ltd. KRW 100 29,591 0.05 Hyundai Steel Co. KRW 57 2,714 0.00 Hyundai Wia Corp. KRW 166 8,871 0.02 KB Financial Group, Inc. KRW 370 16,345 0.03 KEPCO Plant Service & Engineering Co.
Ltd. KRW 34 1,149 0.00 Kia Motors Corp. KRW 193 5,644 0.01 Korea Zinc Co. Ltd. KRW 9 3,142 0.01 KT&G Corp. KRW 128 11,466 0.02 Kumho Petrochemical Co. Ltd. KRW 60 3,376 0.01 LG Chem Ltd. KRW 57 12,699 0.02 LG Chem Ltd. Preference KRW 12 1,856 0.00 LG Corp. KRW 103 6,096 0.01 LG Display Co. Ltd. KRW 321 9,118 0.02 LG Electronics, Inc. KRW 62 3,807 0.01 LG Household & Health Care Ltd. KRW 9 6,849 0.01 LG Uplus Corp. KRW 134 1,600 0.00 Lotte Chemical Corp. KRW 15 3,950 0.01 Lotte Shopping Co. Ltd. KRW 5 1,162 0.00
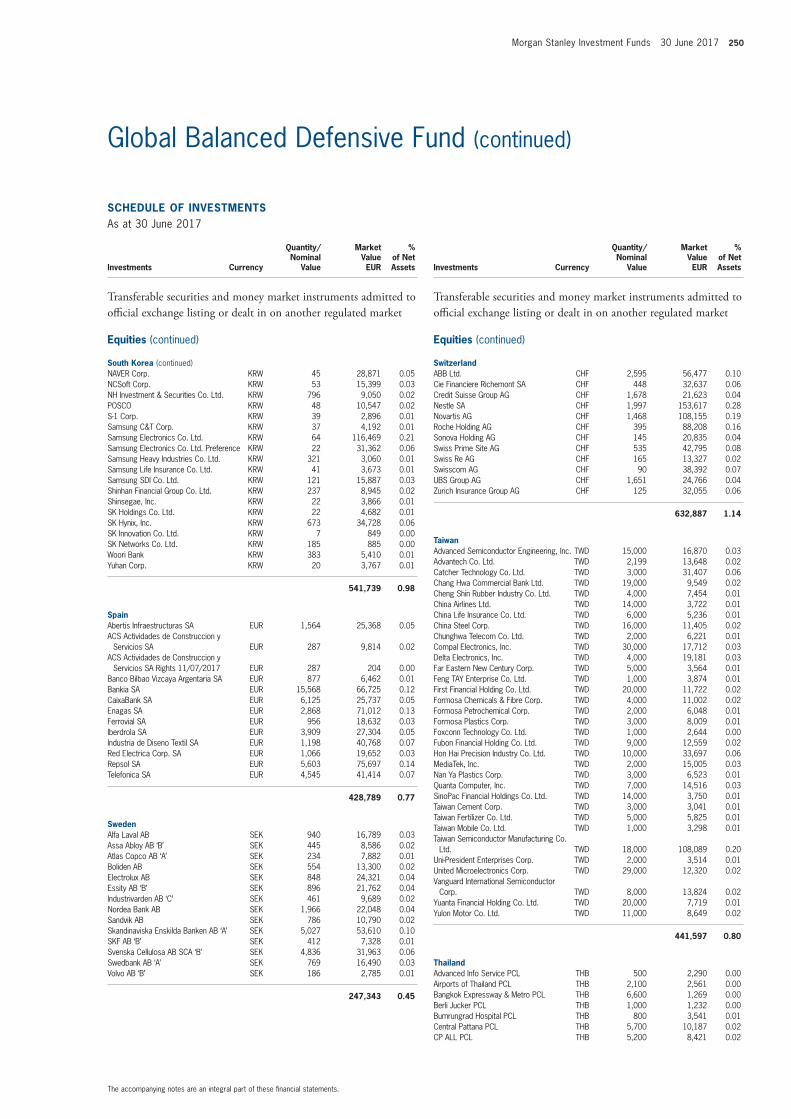
Morgan Stanley Investment Funds 30 June 2017 250
The accompanying notes are an integral part of these fi nancial statements.
Global Balanced Defensive Fund (continued)
SCHEDULE OF INVESTMENTSAs at 30 June 2017
Investments Currency
Quantity/Nominal
Value
Market Value EUR
% of Net Assets
Transferable securities and money market instruments admitted to offi cial exchange listing or dealt in on another regulated market
Equities (continued)
South Korea (continued)NAVER Corp. KRW 45 28,871 0.05 NCSoft Corp. KRW 53 15,399 0.03 NH Investment & Securities Co. Ltd. KRW 796 9,050 0.02 POSCO KRW 48 10,547 0.02 S-1 Corp. KRW 39 2,896 0.01 Samsung C&T Corp. KRW 37 4,192 0.01 Samsung Electronics Co. Ltd. KRW 64 116,469 0.21 Samsung Electronics Co. Ltd. Preference KRW 22 31,362 0.06 Samsung Heavy Industries Co. Ltd. KRW 321 3,060 0.01 Samsung Life Insurance Co. Ltd. KRW 41 3,673 0.01 Samsung SDI Co. Ltd. KRW 121 15,887 0.03 Shinhan Financial Group Co. Ltd. KRW 237 8,945 0.02 Shinsegae, Inc. KRW 22 3,866 0.01 SK Holdings Co. Ltd. KRW 22 4,682 0.01 SK Hynix, Inc. KRW 673 34,728 0.06 SK Innovation Co. Ltd. KRW 7 849 0.00 SK Networks Co. Ltd. KRW 185 885 0.00 Woori Bank KRW 383 5,410 0.01 Yuhan Corp. KRW 20 3,767 0.01
541,739 0.98
SpainAbertis Infraestructuras SA EUR 1,564 25,368 0.05 ACS Actividades de Construccion y
Servicios SA EUR 287 9,814 0.02 ACS Actividades de Construccion y
Servicios SA Rights 11/07/2017 EUR 287 204 0.00 Banco Bilbao Vizcaya Argentaria SA EUR 877 6,462 0.01 Bankia SA EUR 15,568 66,725 0.12 CaixaBank SA EUR 6,125 25,737 0.05 Enagas SA EUR 2,868 71,012 0.13 Ferrovial SA EUR 956 18,632 0.03 Iberdrola SA EUR 3,909 27,304 0.05 Industria de Diseno Textil SA EUR 1,198 40,768 0.07 Red Electrica Corp. SA EUR 1,066 19,652 0.03 Repsol SA EUR 5,603 75,697 0.14 Telefonica SA EUR 4,545 41,414 0.07
428,789 0.77
SwedenAlfa Laval AB SEK 940 16,789 0.03 Assa Abloy AB ‘B’ SEK 445 8,586 0.02 Atlas Copco AB ‘A’ SEK 234 7,882 0.01 Boliden AB SEK 554 13,300 0.02 Electrolux AB SEK 848 24,321 0.04 Essity AB ‘B’ SEK 896 21,762 0.04 Industrivarden AB ‘C’ SEK 461 9,689 0.02 Nordea Bank AB SEK 1,966 22,048 0.04 Sandvik AB SEK 786 10,790 0.02 Skandinaviska Enskilda Banken AB ‘A’ SEK 5,027 53,610 0.10 SKF AB ‘B’ SEK 412 7,328 0.01 Svenska Cellulosa AB SCA ‘B’ SEK 4,836 31,963 0.06 Swedbank AB ‘A’ SEK 769 16,490 0.03 Volvo AB ‘B’ SEK 186 2,785 0.01
247,343 0.45
SCHEDULE OF INVESTMENTSAs at 30 June 2017
Investments Currency
Quantity/Nominal
Value
Market Value EUR
% of Net Assets
Transferable securities and money market instruments admitted to offi cial exchange listing or dealt in on another regulated market
Equities (continued)
SwitzerlandABB Ltd. CHF 2,595 56,477 0.10 Cie Financiere Richemont SA CHF 448 32,637 0.06 Credit Suisse Group AG CHF 1,678 21,623 0.04 Nestle SA CHF 1,997 153,617 0.28 Novartis AG CHF 1,468 108,155 0.19 Roche Holding AG CHF 395 88,208 0.16 Sonova Holding AG CHF 145 20,835 0.04 Swiss Prime Site AG CHF 535 42,795 0.08 Swiss Re AG CHF 165 13,327 0.02 Swisscom AG CHF 90 38,392 0.07 UBS Group AG CHF 1,651 24,766 0.04 Zurich Insurance Group AG CHF 125 32,055 0.06
632,887 1.14
TaiwanAdvanced Semiconductor Engineering, Inc. TWD 15,000 16,870 0.03 Advantech Co. Ltd. TWD 2,199 13,648 0.02 Catcher Technology Co. Ltd. TWD 3,000 31,407 0.06 Chang Hwa Commercial Bank Ltd. TWD 19,000 9,549 0.02 Cheng Shin Rubber Industry Co. Ltd. TWD 4,000 7,454 0.01 China Airlines Ltd. TWD 14,000 3,722 0.01 China Life Insurance Co. Ltd. TWD 6,000 5,236 0.01 China Steel Corp. TWD 16,000 11,405 0.02 Chunghwa Telecom Co. Ltd. TWD 2,000 6,221 0.01 Compal Electronics, Inc. TWD 30,000 17,712 0.03 Delta Electronics, Inc. TWD 4,000 19,181 0.03 Far Eastern New Century Corp. TWD 5,000 3,564 0.01 Feng TAY Enterprise Co. Ltd. TWD 1,000 3,874 0.01 First Financial Holding Co. Ltd. TWD 20,000 11,722 0.02 Formosa Chemicals & Fibre Corp. TWD 4,000 11,002 0.02 Formosa Petrochemical Corp. TWD 2,000 6,048 0.01 Formosa Plastics Corp. TWD 3,000 8,009 0.01 Foxconn Technology Co. Ltd. TWD 1,000 2,644 0.00 Fubon Financial Holding Co. Ltd. TWD 9,000 12,559 0.02 Hon Hai Precision Industry Co. Ltd. TWD 10,000 33,697 0.06 MediaTek, Inc. TWD 2,000 15,005 0.03 Nan Ya Plastics Corp. TWD 3,000 6,523 0.01 Quanta Computer, Inc. TWD 7,000 14,516 0.03 SinoPac Financial Holdings Co. Ltd. TWD 14,000 3,750 0.01 Taiwan Cement Corp. TWD 3,000 3,041 0.01 Taiwan Fertilizer Co. Ltd. TWD 5,000 5,825 0.01 Taiwan Mobile Co. Ltd. TWD 1,000 3,298 0.01 Taiwan Semiconductor Manufacturing Co.
Ltd. TWD 18,000 108,089 0.20 Uni-President Enterprises Corp. TWD 2,000 3,514 0.01 United Microelectronics Corp. TWD 29,000 12,320 0.02 Vanguard International Semiconductor
Corp. TWD 8,000 13,824 0.02 Yuanta Financial Holding Co. Ltd. TWD 20,000 7,719 0.01 Yulon Motor Co. Ltd. TWD 11,000 8,649 0.02
441,597 0.80
ThailandAdvanced Info Service PCL THB 500 2,290 0.00 Airports of Thailand PCL THB 2,100 2,561 0.00 Bangkok Expressway & Metro PCL THB 6,600 1,269 0.00 Berli Jucker PCL THB 1,000 1,232 0.00 Bumrungrad Hospital PCL THB 800 3,541 0.01 Central Pattana PCL THB 5,700 10,187 0.02 CP ALL PCL THB 5,200 8,421 0.02
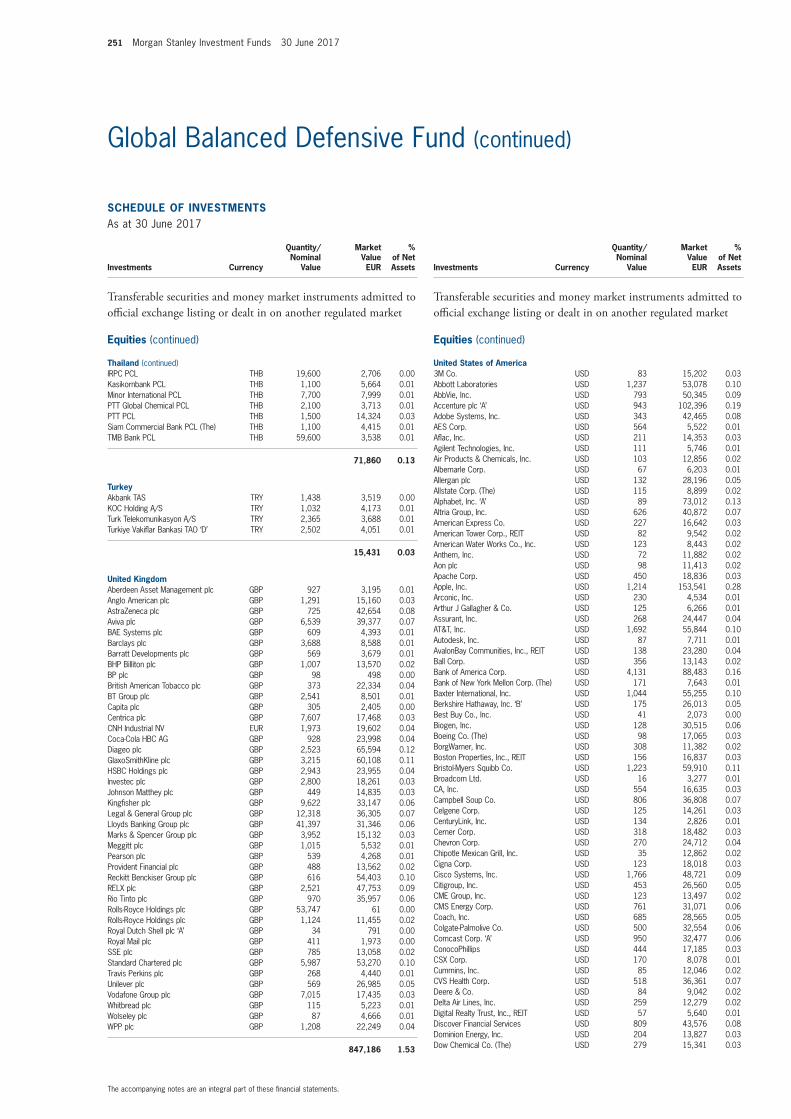
251 Morgan Stanley Investment Funds 30 June 2017
The accompanying notes are an integral part of these fi nancial statements.
Global Balanced Defensive Fund (continued)
SCHEDULE OF INVESTMENTSAs at 30 June 2017
Investments Currency
Quantity/Nominal
Value
Market Value EUR
% of Net Assets
Transferable securities and money market instruments admitted to offi cial exchange listing or dealt in on another regulated market
Equities (continued)
Thailand (continued)IRPC PCL THB 19,600 2,706 0.00 Kasikornbank PCL THB 1,100 5,664 0.01 Minor International PCL THB 7,700 7,999 0.01 PTT Global Chemical PCL THB 2,100 3,713 0.01 PTT PCL THB 1,500 14,324 0.03 Siam Commercial Bank PCL (The) THB 1,100 4,415 0.01 TMB Bank PCL THB 59,600 3,538 0.01
71,860 0.13
TurkeyAkbank TAS TRY 1,438 3,519 0.00 KOC Holding A/S TRY 1,032 4,173 0.01 Turk Telekomunikasyon A/S TRY 2,365 3,688 0.01 Turkiye Vakifl ar Bankasi TAO ‘D’ TRY 2,502 4,051 0.01
15,431 0.03
United KingdomAberdeen Asset Management plc GBP 927 3,195 0.01 Anglo American plc GBP 1,291 15,160 0.03 AstraZeneca plc GBP 725 42,654 0.08 Aviva plc GBP 6,539 39,377 0.07 BAE Systems plc GBP 609 4,393 0.01 Barclays plc GBP 3,688 8,588 0.01 Barratt Developments plc GBP 569 3,679 0.01 BHP Billiton plc GBP 1,007 13,570 0.02 BP plc GBP 98 498 0.00 British American Tobacco plc GBP 373 22,334 0.04 BT Group plc GBP 2,541 8,501 0.01 Capita plc GBP 305 2,405 0.00 Centrica plc GBP 7,607 17,468 0.03 CNH Industrial NV EUR 1,973 19,602 0.04 Coca-Cola HBC AG GBP 928 23,998 0.04 Diageo plc GBP 2,523 65,594 0.12 GlaxoSmithKline plc GBP 3,215 60,108 0.11 HSBC Holdings plc GBP 2,943 23,955 0.04 Investec plc GBP 2,800 18,261 0.03 Johnson Matthey plc GBP 449 14,835 0.03 Kingfi sher plc GBP 9,622 33,147 0.06 Legal & General Group plc GBP 12,318 36,305 0.07 Lloyds Banking Group plc GBP 41,397 31,346 0.06 Marks & Spencer Group plc GBP 3,952 15,132 0.03 Meggitt plc GBP 1,015 5,532 0.01 Pearson plc GBP 539 4,268 0.01 Provident Financial plc GBP 488 13,562 0.02 Reckitt Benckiser Group plc GBP 616 54,403 0.10 RELX plc GBP 2,521 47,753 0.09 Rio Tinto plc GBP 970 35,957 0.06 Rolls-Royce Holdings plc GBP 53,747 61 0.00 Rolls-Royce Holdings plc GBP 1,124 11,455 0.02 Royal Dutch Shell plc ‘A’ GBP 34 791 0.00 Royal Mail plc GBP 411 1,973 0.00 SSE plc GBP 785 13,058 0.02 Standard Chartered plc GBP 5,987 53,270 0.10 Travis Perkins plc GBP 268 4,440 0.01 Unilever plc GBP 569 26,985 0.05 Vodafone Group plc GBP 7,015 17,435 0.03 Whitbread plc GBP 115 5,223 0.01 Wolseley plc GBP 87 4,666 0.01 WPP plc GBP 1,208 22,249 0.04
847,186 1.53
SCHEDULE OF INVESTMENTSAs at 30 June 2017
Investments Currency
Quantity/Nominal
Value
Market Value EUR
% of Net Assets
Transferable securities and money market instruments admitted to offi cial exchange listing or dealt in on another regulated market
Equities (continued)
United States of America3M Co. USD 83 15,202 0.03 Abbott Laboratories USD 1,237 53,078 0.10 AbbVie, Inc. USD 793 50,345 0.09 Accenture plc ‘A’ USD 943 102,396 0.19 Adobe Systems, Inc. USD 343 42,465 0.08 AES Corp. USD 564 5,522 0.01 Afl ac, Inc. USD 211 14,353 0.03 Agilent Technologies, Inc. USD 111 5,746 0.01 Air Products & Chemicals, Inc. USD 103 12,856 0.02 Albemarle Corp. USD 67 6,203 0.01 Allergan plc USD 132 28,196 0.05 Allstate Corp. (The) USD 115 8,899 0.02 Alphabet, Inc. ‘A’ USD 89 73,012 0.13 Altria Group, Inc. USD 626 40,872 0.07 American Express Co. USD 227 16,642 0.03 American Tower Corp., REIT USD 82 9,542 0.02 American Water Works Co., Inc. USD 123 8,443 0.02 Anthem, Inc. USD 72 11,882 0.02 Aon plc USD 98 11,413 0.02 Apache Corp. USD 450 18,836 0.03 Apple, Inc. USD 1,214 153,541 0.28 Arconic, Inc. USD 230 4,534 0.01 Arthur J Gallagher & Co. USD 125 6,266 0.01 Assurant, Inc. USD 268 24,447 0.04 AT&T, Inc. USD 1,692 55,844 0.10 Autodesk, Inc. USD 87 7,711 0.01 AvalonBay Communities, Inc., REIT USD 138 23,280 0.04 Ball Corp. USD 356 13,143 0.02 Bank of America Corp. USD 4,131 88,483 0.16 Bank of New York Mellon Corp. (The) USD 171 7,643 0.01 Baxter International, Inc. USD 1,044 55,255 0.10 Berkshire Hathaway, Inc. ‘B’ USD 175 26,013 0.05 Best Buy Co., Inc. USD 41 2,073 0.00 Biogen, Inc. USD 128 30,515 0.06 Boeing Co. (The) USD 98 17,065 0.03 BorgWarner, Inc. USD 308 11,382 0.02 Boston Properties, Inc., REIT USD 156 16,837 0.03 Bristol-Myers Squibb Co. USD 1,223 59,910 0.11 Broadcom Ltd. USD 16 3,277 0.01 CA, Inc. USD 554 16,635 0.03 Campbell Soup Co. USD 806 36,808 0.07 Celgene Corp. USD 125 14,261 0.03 CenturyLink, Inc. USD 134 2,826 0.01 Cerner Corp. USD 318 18,482 0.03 Chevron Corp. USD 270 24,712 0.04 Chipotle Mexican Grill, Inc. USD 35 12,862 0.02 Cigna Corp. USD 123 18,018 0.03 Cisco Systems, Inc. USD 1,766 48,721 0.09 Citigroup, Inc. USD 453 26,560 0.05 CME Group, Inc. USD 123 13,497 0.02 CMS Energy Corp. USD 761 31,071 0.06 Coach, Inc. USD 685 28,565 0.05 Colgate-Palmolive Co. USD 500 32,554 0.06 Comcast Corp. ‘A’ USD 950 32,477 0.06 ConocoPhillips USD 444 17,185 0.03 CSX Corp. USD 170 8,078 0.01 Cummins, Inc. USD 85 12,046 0.02 CVS Health Corp. USD 518 36,361 0.07 Deere & Co. USD 84 9,042 0.02 Delta Air Lines, Inc. USD 259 12,279 0.02 Digital Realty Trust, Inc., REIT USD 57 5,640 0.01 Discover Financial Services USD 809 43,576 0.08 Dominion Energy, Inc. USD 204 13,827 0.03 Dow Chemical Co. (The) USD 279 15,341 0.03
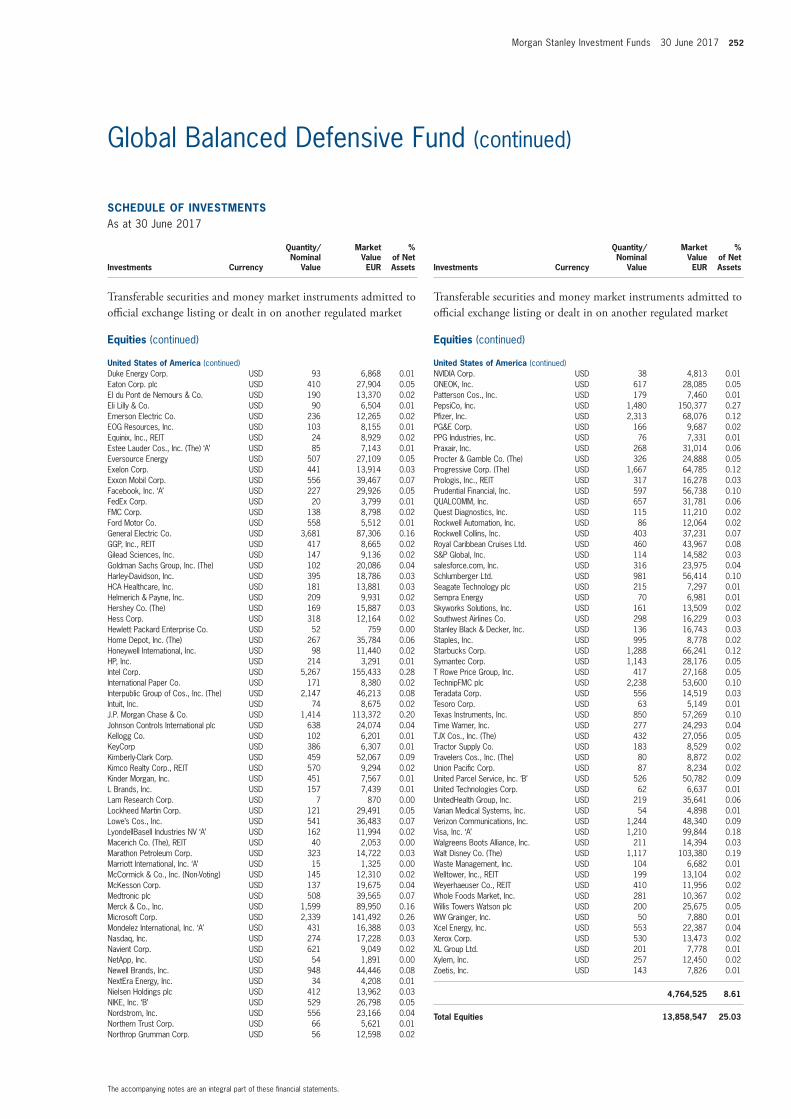
Morgan Stanley Investment Funds 30 June 2017 252
The accompanying notes are an integral part of these fi nancial statements.
Global Balanced Defensive Fund (continued)
SCHEDULE OF INVESTMENTSAs at 30 June 2017
Investments Currency
Quantity/Nominal
Value
Market Value EUR
% of Net Assets
Transferable securities and money market instruments admitted to offi cial exchange listing or dealt in on another regulated market
Equities (continued)
United States of America (continued)Duke Energy Corp. USD 93 6,868 0.01 Eaton Corp. plc USD 410 27,904 0.05 EI du Pont de Nemours & Co. USD 190 13,370 0.02 Eli Lilly & Co. USD 90 6,504 0.01 Emerson Electric Co. USD 236 12,265 0.02 EOG Resources, Inc. USD 103 8,155 0.01 Equinix, Inc., REIT USD 24 8,929 0.02 Estee Lauder Cos., Inc. (The) ‘A’ USD 85 7,143 0.01 Eversource Energy USD 507 27,109 0.05 Exelon Corp. USD 441 13,914 0.03 Exxon Mobil Corp. USD 556 39,467 0.07 Facebook, Inc. ‘A’ USD 227 29,926 0.05 FedEx Corp. USD 20 3,799 0.01 FMC Corp. USD 138 8,798 0.02 Ford Motor Co. USD 558 5,512 0.01 General Electric Co. USD 3,681 87,306 0.16 GGP, Inc., REIT USD 417 8,665 0.02 Gilead Sciences, Inc. USD 147 9,136 0.02 Goldman Sachs Group, Inc. (The) USD 102 20,086 0.04 Harley-Davidson, Inc. USD 395 18,786 0.03 HCA Healthcare, Inc. USD 181 13,881 0.03 Helmerich & Payne, Inc. USD 209 9,931 0.02 Hershey Co. (The) USD 169 15,887 0.03 Hess Corp. USD 318 12,164 0.02 Hewlett Packard Enterprise Co. USD 52 759 0.00 Home Depot, Inc. (The) USD 267 35,784 0.06 Honeywell International, Inc. USD 98 11,440 0.02 HP, Inc. USD 214 3,291 0.01 Intel Corp. USD 5,267 155,433 0.28 International Paper Co. USD 171 8,380 0.02 Interpublic Group of Cos., Inc. (The) USD 2,147 46,213 0.08 Intuit, Inc. USD 74 8,675 0.02 J.P. Morgan Chase & Co. USD 1,414 113,372 0.20 Johnson Controls International plc USD 638 24,074 0.04 Kellogg Co. USD 102 6,201 0.01 KeyCorp USD 386 6,307 0.01 Kimberly-Clark Corp. USD 459 52,067 0.09 Kimco Realty Corp., REIT USD 570 9,294 0.02 Kinder Morgan, Inc. USD 451 7,567 0.01 L Brands, Inc. USD 157 7,439 0.01 Lam Research Corp. USD 7 870 0.00 Lockheed Martin Corp. USD 121 29,491 0.05 Lowe’s Cos., Inc. USD 541 36,483 0.07 LyondellBasell Industries NV ‘A’ USD 162 11,994 0.02 Macerich Co. (The), REIT USD 40 2,053 0.00 Marathon Petroleum Corp. USD 323 14,722 0.03 Marriott International, Inc. ‘A’ USD 15 1,325 0.00 McCormick & Co., Inc. (Non-Voting) USD 145 12,310 0.02 McKesson Corp. USD 137 19,675 0.04 Medtronic plc USD 508 39,565 0.07 Merck & Co., Inc. USD 1,599 89,950 0.16 Microsoft Corp. USD 2,339 141,492 0.26 Mondelez International, Inc. ‘A’ USD 431 16,388 0.03 Nasdaq, Inc. USD 274 17,228 0.03 Navient Corp. USD 621 9,049 0.02 NetApp, Inc. USD 54 1,891 0.00 Newell Brands, Inc. USD 948 44,446 0.08 NextEra Energy, Inc. USD 34 4,208 0.01 Nielsen Holdings plc USD 412 13,962 0.03 NIKE, Inc. ‘B’ USD 529 26,798 0.05 Nordstrom, Inc. USD 556 23,166 0.04 Northern Trust Corp. USD 66 5,621 0.01 Northrop Grumman Corp. USD 56 12,598 0.02
SCHEDULE OF INVESTMENTSAs at 30 June 2017
Investments Currency
Quantity/Nominal
Value
Market Value EUR
% of Net Assets
Transferable securities and money market instruments admitted to offi cial exchange listing or dealt in on another regulated market
Equities (continued)
United States of America (continued)NVIDIA Corp. USD 38 4,813 0.01 ONEOK, Inc. USD 617 28,085 0.05 Patterson Cos., Inc. USD 179 7,460 0.01 PepsiCo, Inc. USD 1,480 150,377 0.27 Pfi zer, Inc. USD 2,313 68,076 0.12 PG&E Corp. USD 166 9,687 0.02 PPG Industries, Inc. USD 76 7,331 0.01 Praxair, Inc. USD 268 31,014 0.06 Procter & Gamble Co. (The) USD 326 24,888 0.05 Progressive Corp. (The) USD 1,667 64,785 0.12 Prologis, Inc., REIT USD 317 16,278 0.03 Prudential Financial, Inc. USD 597 56,738 0.10 QUALCOMM, Inc. USD 657 31,781 0.06 Quest Diagnostics, Inc. USD 115 11,210 0.02 Rockwell Automation, Inc. USD 86 12,064 0.02 Rockwell Collins, Inc. USD 403 37,231 0.07 Royal Caribbean Cruises Ltd. USD 460 43,967 0.08 S&P Global, Inc. USD 114 14,582 0.03 salesforce.com, Inc. USD 316 23,975 0.04 Schlumberger Ltd. USD 981 56,414 0.10 Seagate Technology plc USD 215 7,297 0.01 Sempra Energy USD 70 6,981 0.01 Skyworks Solutions, Inc. USD 161 13,509 0.02 Southwest Airlines Co. USD 298 16,229 0.03 Stanley Black & Decker, Inc. USD 136 16,743 0.03 Staples, Inc. USD 995 8,778 0.02 Starbucks Corp. USD 1,288 66,241 0.12 Symantec Corp. USD 1,143 28,176 0.05 T Rowe Price Group, Inc. USD 417 27,168 0.05 TechnipFMC plc USD 2,238 53,600 0.10 Teradata Corp. USD 556 14,519 0.03 Tesoro Corp. USD 63 5,149 0.01 Texas Instruments, Inc. USD 850 57,269 0.10 Time Warner, Inc. USD 277 24,293 0.04 TJX Cos., Inc. (The) USD 432 27,056 0.05 Tractor Supply Co. USD 183 8,529 0.02 Travelers Cos., Inc. (The) USD 80 8,872 0.02 Union Pacifi c Corp. USD 87 8,234 0.02 United Parcel Service, Inc. ‘B’ USD 526 50,782 0.09 United Technologies Corp. USD 62 6,637 0.01 UnitedHealth Group, Inc. USD 219 35,641 0.06 Varian Medical Systems, Inc. USD 54 4,898 0.01 Verizon Communications, Inc. USD 1,244 48,340 0.09 Visa, Inc. ‘A’ USD 1,210 99,844 0.18 Walgreens Boots Alliance, Inc. USD 211 14,394 0.03 Walt Disney Co. (The) USD 1,117 103,380 0.19 Waste Management, Inc. USD 104 6,682 0.01 Welltower, Inc., REIT USD 199 13,104 0.02 Weyerhaeuser Co., REIT USD 410 11,956 0.02 Whole Foods Market, Inc. USD 281 10,367 0.02 Willis Towers Watson plc USD 200 25,675 0.05 WW Grainger, Inc. USD 50 7,880 0.01 Xcel Energy, Inc. USD 553 22,387 0.04 Xerox Corp. USD 530 13,473 0.02 XL Group Ltd. USD 201 7,778 0.01 Xylem, Inc. USD 257 12,450 0.02 Zoetis, Inc. USD 143 7,826 0.01
4,764,525 8.61
Total Equities 13,858,547 25.03
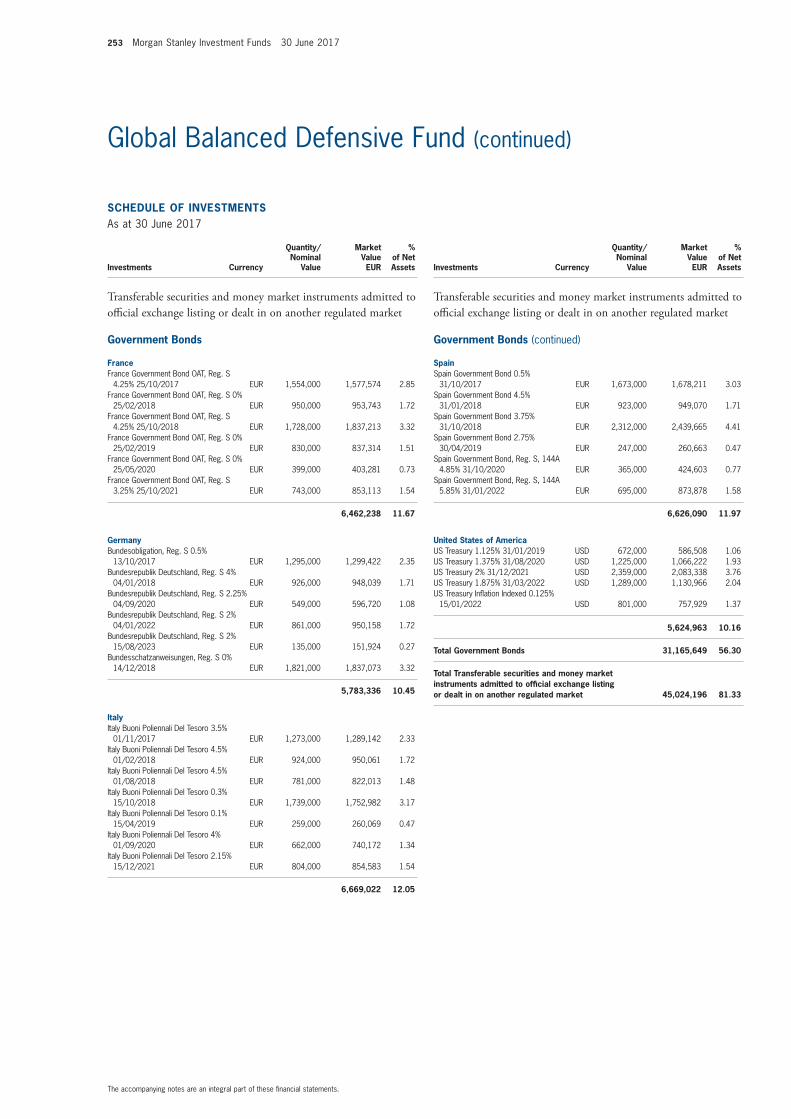
253 Morgan Stanley Investment Funds 30 June 2017
The accompanying notes are an integral part of these fi nancial statements.
Global Balanced Defensive Fund (continued)
SCHEDULE OF INVESTMENTSAs at 30 June 2017
Investments Currency
Quantity/Nominal
Value
Market Value EUR
% of Net Assets
Transferable securities and money market instruments admitted to offi cial exchange listing or dealt in on another regulated market
Government Bonds
FranceFrance Government Bond OAT, Reg. S
4.25% 25/10/2017 EUR 1,554,000 1,577,574 2.85 France Government Bond OAT, Reg. S 0%
25/02/2018 EUR 950,000 953,743 1.72 France Government Bond OAT, Reg. S
4.25% 25/10/2018 EUR 1,728,000 1,837,213 3.32 France Government Bond OAT, Reg. S 0%
25/02/2019 EUR 830,000 837,314 1.51 France Government Bond OAT, Reg. S 0%
25/05/2020 EUR 399,000 403,281 0.73 France Government Bond OAT, Reg. S
3.25% 25/10/2021 EUR 743,000 853,113 1.54
6,462,238 11.67
GermanyBundesobligation, Reg. S 0.5%
13/10/2017 EUR 1,295,000 1,299,422 2.35 Bundesrepublik Deutschland, Reg. S 4%
04/01/2018 EUR 926,000 948,039 1.71 Bundesrepublik Deutschland, Reg. S 2.25%
04/09/2020 EUR 549,000 596,720 1.08 Bundesrepublik Deutschland, Reg. S 2%
04/01/2022 EUR 861,000 950,158 1.72 Bundesrepublik Deutschland, Reg. S 2%
15/08/2023 EUR 135,000 151,924 0.27 Bundesschatzanweisungen, Reg. S 0%
14/12/2018 EUR 1,821,000 1,837,073 3.32
5,783,336 10.45
ItalyItaly Buoni Poliennali Del Tesoro 3.5%
01/11/2017 EUR 1,273,000 1,289,142 2.33 Italy Buoni Poliennali Del Tesoro 4.5%
01/02/2018 EUR 924,000 950,061 1.72 Italy Buoni Poliennali Del Tesoro 4.5%
01/08/2018 EUR 781,000 822,013 1.48 Italy Buoni Poliennali Del Tesoro 0.3%
15/10/2018 EUR 1,739,000 1,752,982 3.17 Italy Buoni Poliennali Del Tesoro 0.1%
15/04/2019 EUR 259,000 260,069 0.47 Italy Buoni Poliennali Del Tesoro 4%
01/09/2020 EUR 662,000 740,172 1.34 Italy Buoni Poliennali Del Tesoro 2.15%
15/12/2021 EUR 804,000 854,583 1.54
6,669,022 12.05
SCHEDULE OF INVESTMENTSAs at 30 June 2017
Investments Currency
Quantity/Nominal
Value
Market Value EUR
% of Net Assets
Transferable securities and money market instruments admitted to offi cial exchange listing or dealt in on another regulated market
Government Bonds (continued)
SpainSpain Government Bond 0.5%
31/10/2017 EUR 1,673,000 1,678,211 3.03 Spain Government Bond 4.5%
31/01/2018 EUR 923,000 949,070 1.71 Spain Government Bond 3.75%
31/10/2018 EUR 2,312,000 2,439,665 4.41 Spain Government Bond 2.75%
30/04/2019 EUR 247,000 260,663 0.47 Spain Government Bond, Reg. S, 144A
4.85% 31/10/2020 EUR 365,000 424,603 0.77 Spain Government Bond, Reg. S, 144A
5.85% 31/01/2022 EUR 695,000 873,878 1.58
6,626,090 11.97
United States of AmericaUS Treasury 1.125% 31/01/2019 USD 672,000 586,508 1.06 US Treasury 1.375% 31/08/2020 USD 1,225,000 1,066,222 1.93 US Treasury 2% 31/12/2021 USD 2,359,000 2,083,338 3.76 US Treasury 1.875% 31/03/2022 USD 1,289,000 1,130,966 2.04 US Treasury Infl ation Indexed 0.125%
15/01/2022 USD 801,000 757,929 1.37
5,624,963 10.16
Total Government Bonds 31,165,649 56.30
Total Transferable securities and money market instruments admitted to offi cial exchange listing or dealt in on another regulated market 45,024,196 81.33
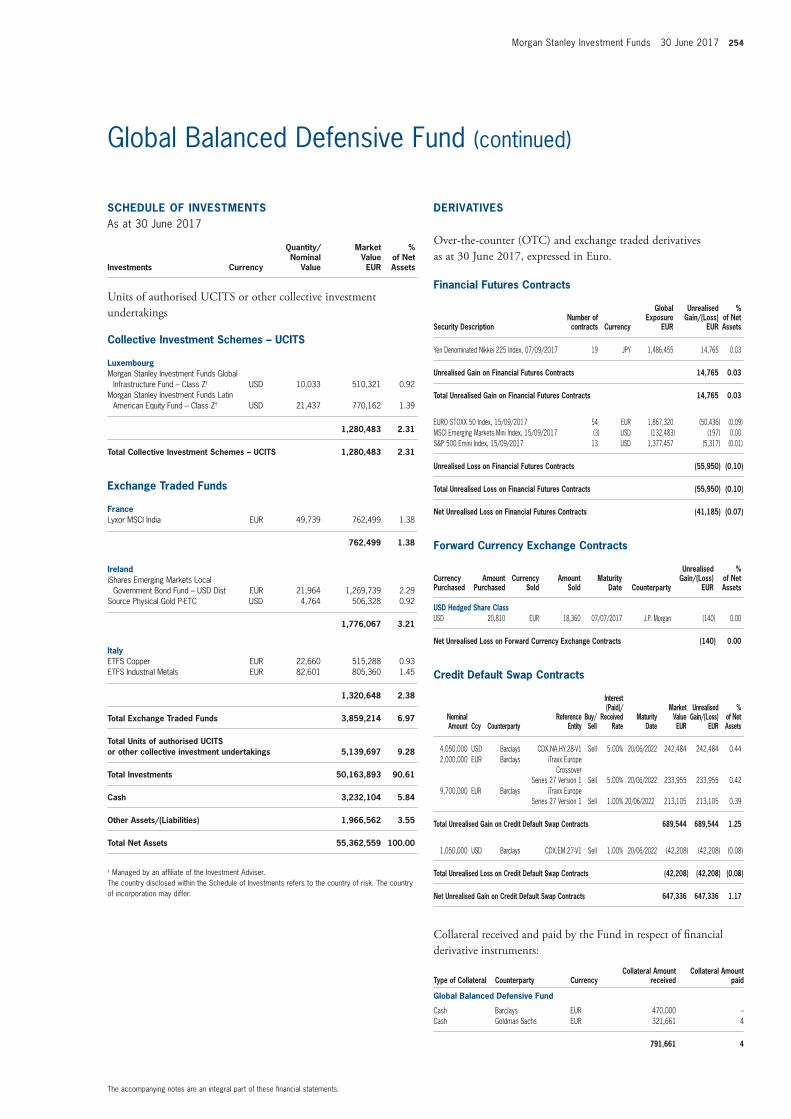
Morgan Stanley Investment Funds 30 June 2017 254
The accompanying notes are an integral part of these fi nancial statements.
Global Balanced Defensive Fund (continued)
SCHEDULE OF INVESTMENTSAs at 30 June 2017
Investments Currency
Quantity/Nominal
Value
Market Value EUR
% of Net Assets
Units of authorised UCITS or other collective investment undertakings
Collective Investment Schemes – UCITS
LuxembourgMorgan Stanley Investment Funds Global
Infrastructure Fund – Class Z† USD 10,033 510,321 0.92 Morgan Stanley Investment Funds Latin
American Equity Fund – Class Z† USD 21,437 770,162 1.39
1,280,483 2.31
Total Collective Investment Schemes – UCITS 1,280,483 2.31
Exchange Traded Funds
FranceLyxor MSCI India EUR 49,739 762,499 1.38
762,499 1.38
IrelandiShares Emerging Markets Local
Government Bond Fund – USD Dist EUR 21,964 1,269,739 2.29 Source Physical Gold P-ETC USD 4,764 506,328 0.92
1,776,067 3.21
ItalyETFS Copper EUR 22,660 515,288 0.93 ETFS Industrial Metals EUR 82,601 805,360 1.45
1,320,648 2.38
Total Exchange Traded Funds 3,859,214 6.97
Total Units of authorised UCITS or other collective investment undertakings 5,139,697 9.28
Total Investments 50,163,893 90.61
Cash 3,232,104 5.84
Other Assets/(Liabilities) 1,966,562 3.55
Total Net Assets 55,362,559 100.00
† Managed by an affi liate of the Investment Adviser.The country disclosed within the Schedule of Investments refers to the country of risk. The country of incorporation may differ.
Financial Futures Contracts
Security DescriptionNumber of contracts Currency
Global Exposure
EUR
Unrealised Gain/(Loss)
EUR
% of Net Assets
Yen Denominated Nikkei 225 Index, 07/09/2017 19 JPY 1,486,455 14,765 0.03
Unrealised Gain on Financial Futures Contracts 14,765 0.03
Total Unrealised Gain on Financial Futures Contracts 14,765 0.03
EURO STOXX 50 Index, 15/09/2017 54 EUR 1,867,320 (50,436) (0.09) MSCI Emerging Markets Mini Index, 15/09/2017 (3) USD (132,483) (197) 0.00 S&P 500 Emini Index, 15/09/2017 13 USD 1,377,457 (5,317) (0.01)
Unrealised Loss on Financial Futures Contracts (55,950) (0.10)
Total Unrealised Loss on Financial Futures Contracts (55,950) (0.10)
Net Unrealised Loss on Financial Futures Contracts (41,185) (0.07)
Forward Currency Exchange Contracts
Currency Purchased
Amount Purchased
Currency Sold
Amount Sold
Maturity Date Counterparty
Unrealised Gain/(Loss)
EUR
% of Net Assets
USD Hedged Share ClassUSD 20,810 EUR 18,360 07/07/2017 J.P. Morgan (140) 0.00
Net Unrealised Loss on Forward Currency Exchange Contracts (140) 0.00
Credit Default Swap Contracts
Nominal Amount Ccy Counterparty
Reference Entity
Buy/Sell
Interest (Paid)/
Received Rate
Maturity Date
Market Value EUR
Unrealised Gain/(Loss)
EUR
% of Net Assets
4,050,000 USD Barclays CDX.NA.HY.28-V1 Sell 5.00% 20/06/2022 242,484 242,484 0.44 2,000,000 EUR Barclays iTraxx Europe
Crossover Series 27 Version 1 Sell 5.00% 20/06/2022 233,955 233,955 0.42
9,700,000 EUR Barclays iTraxx Europe Series 27 Version 1 Sell 1.00% 20/06/2022 213,105 213,105 0.39
Total Unrealised Gain on Credit Default Swap Contracts 689,544 689,544 1.25
1,050,000 USD Barclays CDX.EM.27-V1 Sell 1.00% 20/06/2022 (42,208) (42,208) (0.08)
Total Unrealised Loss on Credit Default Swap Contracts (42,208) (42,208) (0.08)
Net Unrealised Gain on Credit Default Swap Contracts 647,336 647,336 1.17
Collateral received and paid by the Fund in respect of fi nancial derivative instruments:
Type of Collateral Counterparty CurrencyCollateral Amount
receivedCollateral Amount
paid
Global Balanced Defensive Fund
Cash Barclays EUR 470,000 –Cash Goldman Sachs EUR 321,661 4
791,661 4
DERIVATIVES
Over-the-counter (OTC) and exchange traded derivatives as at 30 June 2017, expressed in Euro.
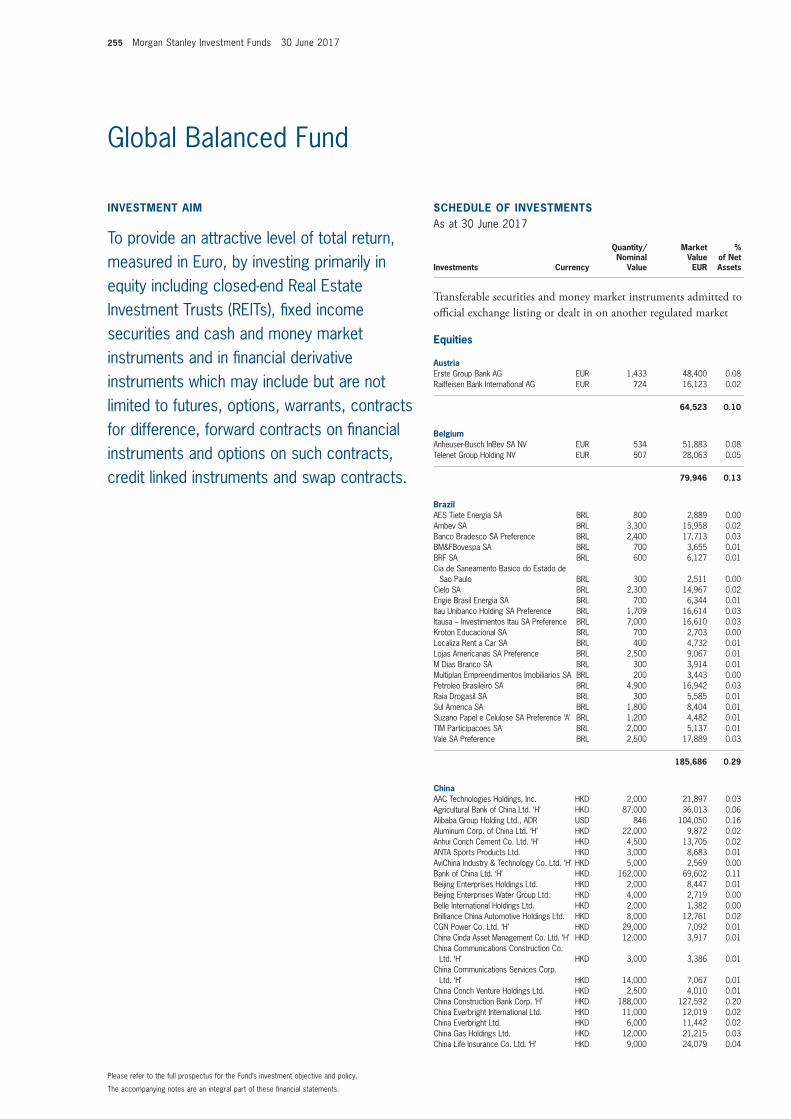
255 Morgan Stanley Investment Funds 30 June 2017
The accompanying notes are an integral part of these fi nancial statements.
Please refer to the full prospectus for the Fund’s investment objective and policy.
Global Balanced Fund
INVESTMENT AIM
To provide an attractive level of total return, measured in Euro, by investing primarily in equity including closed-end Real Estate Investment Trusts (REITs), fi xed income securities and cash and money market instruments and in fi nancial derivative instruments which may include but are not limited to futures, options, warrants, contracts for difference, forward contracts on fi nancial instruments and options on such contracts, credit linked instruments and swap contracts.
SCHEDULE OF INVESTMENTSAs at 30 June 2017
Investments Currency
Quantity/Nominal
Value
Market Value EUR
% of Net Assets
Transferable securities and money market instruments admitted to offi cial exchange listing or dealt in on another regulated market
Equities
AustriaErste Group Bank AG EUR 1,433 48,400 0.08 Raiffeisen Bank International AG EUR 724 16,123 0.02
64,523 0.10
BelgiumAnheuser-Busch InBev SA NV EUR 534 51,883 0.08 Telenet Group Holding NV EUR 507 28,063 0.05
79,946 0.13
BrazilAES Tiete Energia SA BRL 800 2,889 0.00 Ambev SA BRL 3,300 15,958 0.02 Banco Bradesco SA Preference BRL 2,400 17,713 0.03 BM&FBovespa SA BRL 700 3,655 0.01 BRF SA BRL 600 6,127 0.01 Cia de Saneamento Basico do Estado de
Sao Paulo BRL 300 2,511 0.00 Cielo SA BRL 2,300 14,967 0.02 Engie Brasil Energia SA BRL 700 6,344 0.01 Itau Unibanco Holding SA Preference BRL 1,709 16,614 0.03 Itausa – Investimentos Itau SA Preference BRL 7,000 16,610 0.03 Kroton Educacional SA BRL 700 2,703 0.00 Localiza Rent a Car SA BRL 400 4,732 0.01 Lojas Americanas SA Preference BRL 2,500 9,067 0.01 M Dias Branco SA BRL 300 3,914 0.01 Multiplan Empreendimentos Imobiliarios SA BRL 200 3,443 0.00 Petroleo Brasileiro SA BRL 4,900 16,942 0.03 Raia Drogasil SA BRL 300 5,585 0.01 Sul America SA BRL 1,800 8,404 0.01 Suzano Papel e Celulose SA Preference ‘A’ BRL 1,200 4,482 0.01 TIM Participacoes SA BRL 2,000 5,137 0.01 Vale SA Preference BRL 2,500 17,889 0.03
185,686 0.29
ChinaAAC Technologies Holdings, Inc. HKD 2,000 21,897 0.03 Agricultural Bank of China Ltd. ‘H’ HKD 87,000 36,013 0.06 Alibaba Group Holding Ltd., ADR USD 846 104,050 0.16 Aluminum Corp. of China Ltd. ‘H’ HKD 22,000 9,872 0.02 Anhui Conch Cement Co. Ltd. ‘H’ HKD 4,500 13,705 0.02 ANTA Sports Products Ltd. HKD 3,000 8,683 0.01 AviChina Industry & Technology Co. Ltd. ‘H’ HKD 5,000 2,569 0.00 Bank of China Ltd. ‘H’ HKD 162,000 69,602 0.11 Beijing Enterprises Holdings Ltd. HKD 2,000 8,447 0.01 Beijing Enterprises Water Group Ltd. HKD 4,000 2,719 0.00 Belle International Holdings Ltd. HKD 2,000 1,382 0.00 Brilliance China Automotive Holdings Ltd. HKD 8,000 12,761 0.02 CGN Power Co. Ltd. ‘H’ HKD 29,000 7,092 0.01 China Cinda Asset Management Co. Ltd. ‘H’ HKD 12,000 3,917 0.01 China Communications Construction Co.
Ltd. ‘H’ HKD 3,000 3,386 0.01 China Communications Services Corp.
Ltd. ‘H’ HKD 14,000 7,067 0.01 China Conch Venture Holdings Ltd. HKD 2,500 4,010 0.01 China Construction Bank Corp. ‘H’ HKD 188,000 127,592 0.20 China Everbright International Ltd. HKD 11,000 12,019 0.02 China Everbright Ltd. HKD 6,000 11,442 0.02 China Gas Holdings Ltd. HKD 12,000 21,215 0.03 China Life Insurance Co. Ltd. ‘H’ HKD 9,000 24,079 0.04
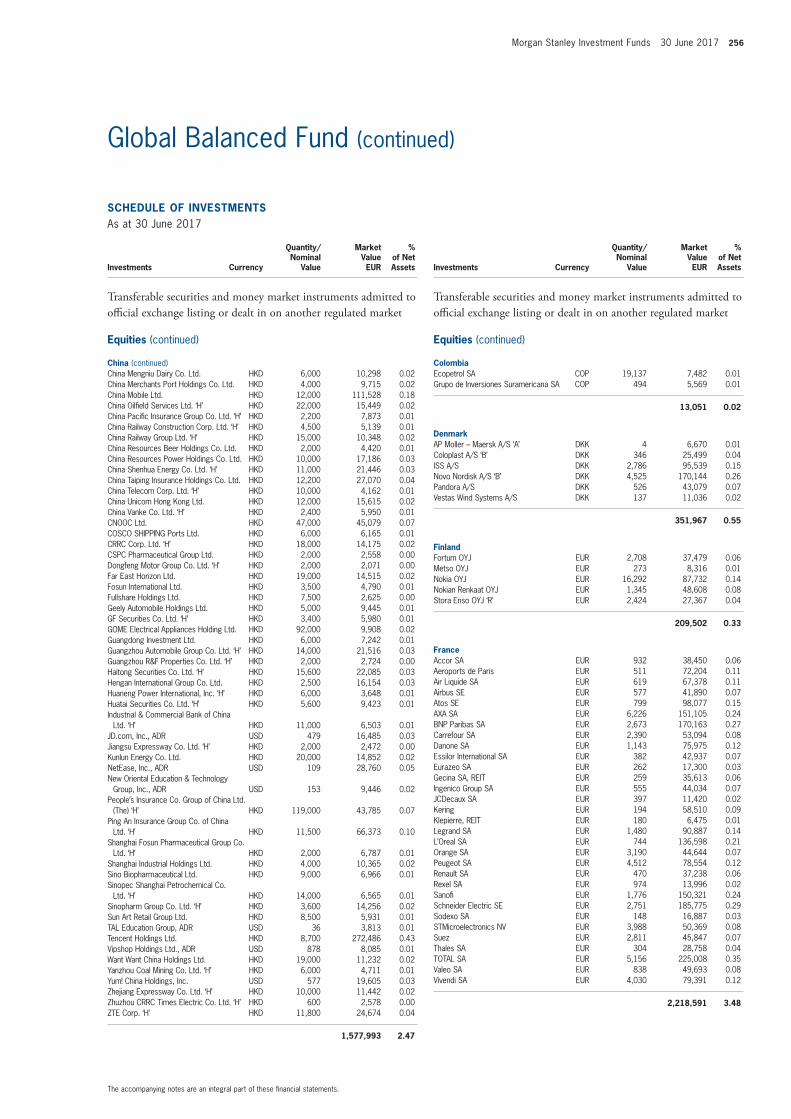
Morgan Stanley Investment Funds 30 June 2017 256
The accompanying notes are an integral part of these fi nancial statements.
Global Balanced Fund (continued)
SCHEDULE OF INVESTMENTSAs at 30 June 2017
Investments Currency
Quantity/Nominal
Value
Market Value EUR
% of Net Assets
Transferable securities and money market instruments admitted to offi cial exchange listing or dealt in on another regulated market
Equities (continued)
China (continued)China Mengniu Dairy Co. Ltd. HKD 6,000 10,298 0.02 China Merchants Port Holdings Co. Ltd. HKD 4,000 9,715 0.02 China Mobile Ltd. HKD 12,000 111,528 0.18 China Oilfi eld Services Ltd. ‘H’ HKD 22,000 15,449 0.02 China Pacifi c Insurance Group Co. Ltd. ‘H’ HKD 2,200 7,873 0.01 China Railway Construction Corp. Ltd. ‘H’ HKD 4,500 5,139 0.01 China Railway Group Ltd. ‘H’ HKD 15,000 10,348 0.02 China Resources Beer Holdings Co. Ltd. HKD 2,000 4,420 0.01 China Resources Power Holdings Co. Ltd. HKD 10,000 17,186 0.03 China Shenhua Energy Co. Ltd. ‘H’ HKD 11,000 21,446 0.03 China Taiping Insurance Holdings Co. Ltd. HKD 12,200 27,070 0.04 China Telecom Corp. Ltd. ‘H’ HKD 10,000 4,162 0.01 China Unicom Hong Kong Ltd. HKD 12,000 15,615 0.02 China Vanke Co. Ltd. ‘H’ HKD 2,400 5,950 0.01 CNOOC Ltd. HKD 47,000 45,079 0.07 COSCO SHIPPING Ports Ltd. HKD 6,000 6,165 0.01 CRRC Corp. Ltd. ‘H’ HKD 18,000 14,175 0.02 CSPC Pharmaceutical Group Ltd. HKD 2,000 2,558 0.00 Dongfeng Motor Group Co. Ltd. ‘H’ HKD 2,000 2,071 0.00 Far East Horizon Ltd. HKD 19,000 14,515 0.02 Fosun International Ltd. HKD 3,500 4,790 0.01 Fullshare Holdings Ltd. HKD 7,500 2,625 0.00 Geely Automobile Holdings Ltd. HKD 5,000 9,445 0.01 GF Securities Co. Ltd. ‘H’ HKD 3,400 5,980 0.01 GOME Electrical Appliances Holding Ltd. HKD 92,000 9,908 0.02 Guangdong Investment Ltd. HKD 6,000 7,242 0.01 Guangzhou Automobile Group Co. Ltd. ‘H’ HKD 14,000 21,516 0.03 Guangzhou R&F Properties Co. Ltd. ‘H’ HKD 2,000 2,724 0.00 Haitong Securities Co. Ltd. ‘H’ HKD 15,600 22,085 0.03 Hengan International Group Co. Ltd. HKD 2,500 16,154 0.03 Huaneng Power International, Inc. ‘H’ HKD 6,000 3,648 0.01 Huatai Securities Co. Ltd. ‘H’ HKD 5,600 9,423 0.01 Industrial & Commercial Bank of China
Ltd. ‘H’ HKD 11,000 6,503 0.01 JD.com, Inc., ADR USD 479 16,485 0.03 Jiangsu Expressway Co. Ltd. ‘H’ HKD 2,000 2,472 0.00 Kunlun Energy Co. Ltd. HKD 20,000 14,852 0.02 NetEase, Inc., ADR USD 109 28,760 0.05 New Oriental Education & Technology
Group, Inc., ADR USD 153 9,446 0.02 People’s Insurance Co. Group of China Ltd.
(The) ‘H’ HKD 119,000 43,785 0.07 Ping An Insurance Group Co. of China
Ltd. ‘H’ HKD 11,500 66,373 0.10 Shanghai Fosun Pharmaceutical Group Co.
Ltd. ‘H’ HKD 2,000 6,787 0.01 Shanghai Industrial Holdings Ltd. HKD 4,000 10,365 0.02 Sino Biopharmaceutical Ltd. HKD 9,000 6,966 0.01 Sinopec Shanghai Petrochemical Co.
Ltd. ‘H’ HKD 14,000 6,565 0.01 Sinopharm Group Co. Ltd. ‘H’ HKD 3,600 14,256 0.02 Sun Art Retail Group Ltd. HKD 8,500 5,931 0.01 TAL Education Group, ADR USD 36 3,813 0.01 Tencent Holdings Ltd. HKD 8,700 272,486 0.43 Vipshop Holdings Ltd., ADR USD 878 8,085 0.01 Want Want China Holdings Ltd. HKD 19,000 11,232 0.02 Yanzhou Coal Mining Co. Ltd. ‘H’ HKD 6,000 4,711 0.01 Yum! China Holdings, Inc. USD 577 19,605 0.03 Zhejiang Expressway Co. Ltd. ‘H’ HKD 10,000 11,442 0.02 Zhuzhou CRRC Times Electric Co. Ltd. ‘H’ HKD 600 2,578 0.00 ZTE Corp. ‘H’ HKD 11,800 24,674 0.04
1,577,993 2.47
SCHEDULE OF INVESTMENTSAs at 30 June 2017
Investments Currency
Quantity/Nominal
Value
Market Value EUR
% of Net Assets
Transferable securities and money market instruments admitted to offi cial exchange listing or dealt in on another regulated market
Equities (continued)
ColombiaEcopetrol SA COP 19,137 7,482 0.01 Grupo de Inversiones Suramericana SA COP 494 5,569 0.01
13,051 0.02
DenmarkAP Moller – Maersk A/S ‘A’ DKK 4 6,670 0.01 Coloplast A/S ‘B’ DKK 346 25,499 0.04 ISS A/S DKK 2,786 95,539 0.15 Novo Nordisk A/S ‘B’ DKK 4,525 170,144 0.26 Pandora A/S DKK 526 43,079 0.07 Vestas Wind Systems A/S DKK 137 11,036 0.02
351,967 0.55
FinlandFortum OYJ EUR 2,708 37,479 0.06 Metso OYJ EUR 273 8,316 0.01 Nokia OYJ EUR 16,292 87,732 0.14 Nokian Renkaat OYJ EUR 1,345 48,608 0.08 Stora Enso OYJ ‘R’ EUR 2,424 27,367 0.04
209,502 0.33
FranceAccor SA EUR 932 38,450 0.06 Aeroports de Paris EUR 511 72,204 0.11 Air Liquide SA EUR 619 67,378 0.11 Airbus SE EUR 577 41,890 0.07 Atos SE EUR 799 98,077 0.15 AXA SA EUR 6,226 151,105 0.24 BNP Paribas SA EUR 2,673 170,163 0.27 Carrefour SA EUR 2,390 53,094 0.08 Danone SA EUR 1,143 75,975 0.12 Essilor International SA EUR 382 42,937 0.07 Eurazeo SA EUR 262 17,300 0.03 Gecina SA, REIT EUR 259 35,613 0.06 Ingenico Group SA EUR 555 44,034 0.07 JCDecaux SA EUR 397 11,420 0.02 Kering EUR 194 58,510 0.09 Klepierre, REIT EUR 180 6,475 0.01 Legrand SA EUR 1,480 90,887 0.14 L’Oreal SA EUR 744 136,598 0.21 Orange SA EUR 3,190 44,644 0.07 Peugeot SA EUR 4,512 78,554 0.12 Renault SA EUR 470 37,238 0.06 Rexel SA EUR 974 13,996 0.02 Sanofi EUR 1,776 150,321 0.24 Schneider Electric SE EUR 2,751 185,775 0.29 Sodexo SA EUR 148 16,887 0.03 STMicroelectronics NV EUR 3,988 50,369 0.08 Suez EUR 2,811 45,847 0.07 Thales SA EUR 304 28,758 0.04 TOTAL SA EUR 5,156 225,008 0.35 Valeo SA EUR 838 49,693 0.08 Vivendi SA EUR 4,030 79,391 0.12
2,218,591 3.48
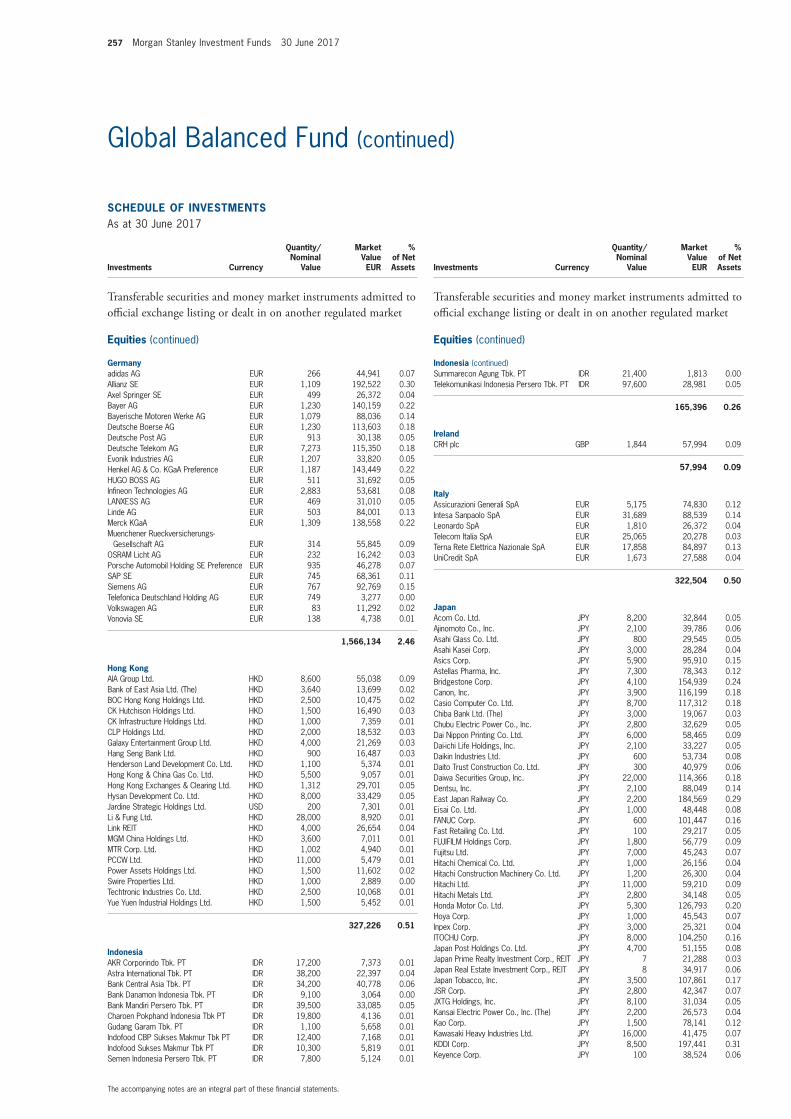
257 Morgan Stanley Investment Funds 30 June 2017
The accompanying notes are an integral part of these fi nancial statements.
Global Balanced Fund (continued)
SCHEDULE OF INVESTMENTSAs at 30 June 2017
Investments Currency
Quantity/Nominal
Value
Market Value EUR
% of Net Assets
Transferable securities and money market instruments admitted to offi cial exchange listing or dealt in on another regulated market
Equities (continued)
Germanyadidas AG EUR 266 44,941 0.07 Allianz SE EUR 1,109 192,522 0.30 Axel Springer SE EUR 499 26,372 0.04 Bayer AG EUR 1,230 140,159 0.22 Bayerische Motoren Werke AG EUR 1,079 88,036 0.14 Deutsche Boerse AG EUR 1,230 113,603 0.18 Deutsche Post AG EUR 913 30,138 0.05 Deutsche Telekom AG EUR 7,273 115,350 0.18 Evonik Industries AG EUR 1,207 33,820 0.05 Henkel AG & Co. KGaA Preference EUR 1,187 143,449 0.22 HUGO BOSS AG EUR 511 31,692 0.05 Infi neon Technologies AG EUR 2,883 53,681 0.08 LANXESS AG EUR 469 31,010 0.05 Linde AG EUR 503 84,001 0.13 Merck KGaA EUR 1,309 138,558 0.22 Muenchener Rueckversicherungs-
Gesellschaft AG EUR 314 55,845 0.09 OSRAM Licht AG EUR 232 16,242 0.03 Porsche Automobil Holding SE Preference EUR 935 46,278 0.07 SAP SE EUR 745 68,361 0.11 Siemens AG EUR 767 92,769 0.15 Telefonica Deutschland Holding AG EUR 749 3,277 0.00 Volkswagen AG EUR 83 11,292 0.02 Vonovia SE EUR 138 4,738 0.01
1,566,134 2.46
Hong KongAIA Group Ltd. HKD 8,600 55,038 0.09 Bank of East Asia Ltd. (The) HKD 3,640 13,699 0.02 BOC Hong Kong Holdings Ltd. HKD 2,500 10,475 0.02 CK Hutchison Holdings Ltd. HKD 1,500 16,490 0.03 CK Infrastructure Holdings Ltd. HKD 1,000 7,359 0.01 CLP Holdings Ltd. HKD 2,000 18,532 0.03 Galaxy Entertainment Group Ltd. HKD 4,000 21,269 0.03 Hang Seng Bank Ltd. HKD 900 16,487 0.03 Henderson Land Development Co. Ltd. HKD 1,100 5,374 0.01 Hong Kong & China Gas Co. Ltd. HKD 5,500 9,057 0.01 Hong Kong Exchanges & Clearing Ltd. HKD 1,312 29,701 0.05 Hysan Development Co. Ltd. HKD 8,000 33,429 0.05 Jardine Strategic Holdings Ltd. USD 200 7,301 0.01 Li & Fung Ltd. HKD 28,000 8,920 0.01 Link REIT HKD 4,000 26,654 0.04 MGM China Holdings Ltd. HKD 3,600 7,011 0.01 MTR Corp. Ltd. HKD 1,002 4,940 0.01 PCCW Ltd. HKD 11,000 5,479 0.01 Power Assets Holdings Ltd. HKD 1,500 11,602 0.02 Swire Properties Ltd. HKD 1,000 2,889 0.00 Techtronic Industries Co. Ltd. HKD 2,500 10,068 0.01 Yue Yuen Industrial Holdings Ltd. HKD 1,500 5,452 0.01
327,226 0.51
IndonesiaAKR Corporindo Tbk. PT IDR 17,200 7,373 0.01 Astra International Tbk. PT IDR 38,200 22,397 0.04 Bank Central Asia Tbk. PT IDR 34,200 40,778 0.06 Bank Danamon Indonesia Tbk. PT IDR 9,100 3,064 0.00 Bank Mandiri Persero Tbk. PT IDR 39,500 33,085 0.05 Charoen Pokphand Indonesia Tbk PT IDR 19,800 4,136 0.01 Gudang Garam Tbk. PT IDR 1,100 5,658 0.01 Indofood CBP Sukses Makmur Tbk PT IDR 12,400 7,168 0.01 Indofood Sukses Makmur Tbk PT IDR 10,300 5,819 0.01 Semen Indonesia Persero Tbk. PT IDR 7,800 5,124 0.01
SCHEDULE OF INVESTMENTSAs at 30 June 2017
Investments Currency
Quantity/Nominal
Value
Market Value EUR
% of Net Assets
Transferable securities and money market instruments admitted to offi cial exchange listing or dealt in on another regulated market
Equities (continued)
Indonesia (continued)Summarecon Agung Tbk. PT IDR 21,400 1,813 0.00 Telekomunikasi Indonesia Persero Tbk. PT IDR 97,600 28,981 0.05
165,396 0.26
IrelandCRH plc GBP 1,844 57,994 0.09
57,994 0.09
ItalyAssicurazioni Generali SpA EUR 5,175 74,830 0.12 Intesa Sanpaolo SpA EUR 31,689 88,539 0.14 Leonardo SpA EUR 1,810 26,372 0.04 Telecom Italia SpA EUR 25,065 20,278 0.03 Terna Rete Elettrica Nazionale SpA EUR 17,858 84,897 0.13 UniCredit SpA EUR 1,673 27,588 0.04
322,504 0.50
JapanAcom Co. Ltd. JPY 8,200 32,844 0.05 Ajinomoto Co., Inc. JPY 2,100 39,786 0.06 Asahi Glass Co. Ltd. JPY 800 29,545 0.05 Asahi Kasei Corp. JPY 3,000 28,284 0.04 Asics Corp. JPY 5,900 95,910 0.15 Astellas Pharma, Inc. JPY 7,300 78,343 0.12 Bridgestone Corp. JPY 4,100 154,939 0.24 Canon, Inc. JPY 3,900 116,199 0.18 Casio Computer Co. Ltd. JPY 8,700 117,312 0.18 Chiba Bank Ltd. (The) JPY 3,000 19,067 0.03 Chubu Electric Power Co., Inc. JPY 2,800 32,629 0.05 Dai Nippon Printing Co. Ltd. JPY 6,000 58,465 0.09 Dai-ichi Life Holdings, Inc. JPY 2,100 33,227 0.05 Daikin Industries Ltd. JPY 600 53,734 0.08 Daito Trust Construction Co. Ltd. JPY 300 40,979 0.06 Daiwa Securities Group, Inc. JPY 22,000 114,366 0.18 Dentsu, Inc. JPY 2,100 88,049 0.14 East Japan Railway Co. JPY 2,200 184,569 0.29 Eisai Co. Ltd. JPY 1,000 48,448 0.08 FANUC Corp. JPY 600 101,447 0.16 Fast Retailing Co. Ltd. JPY 100 29,217 0.05 FUJIFILM Holdings Corp. JPY 1,800 56,779 0.09 Fujitsu Ltd. JPY 7,000 45,243 0.07 Hitachi Chemical Co. Ltd. JPY 1,000 26,156 0.04 Hitachi Construction Machinery Co. Ltd. JPY 1,200 26,300 0.04 Hitachi Ltd. JPY 11,000 59,210 0.09 Hitachi Metals Ltd. JPY 2,800 34,148 0.05 Honda Motor Co. Ltd. JPY 5,300 126,793 0.20 Hoya Corp. JPY 1,000 45,543 0.07 Inpex Corp. JPY 3,000 25,321 0.04 ITOCHU Corp. JPY 8,000 104,250 0.16 Japan Post Holdings Co. Ltd. JPY 4,700 51,155 0.08 Japan Prime Realty Investment Corp., REIT JPY 7 21,288 0.03 Japan Real Estate Investment Corp., REIT JPY 8 34,917 0.06 Japan Tobacco, Inc. JPY 3,500 107,861 0.17 JSR Corp. JPY 2,800 42,347 0.07 JXTG Holdings, Inc. JPY 8,100 31,034 0.05 Kansai Electric Power Co., Inc. (The) JPY 2,200 26,573 0.04 Kao Corp. JPY 1,500 78,141 0.12 Kawasaki Heavy Industries Ltd. JPY 16,000 41,475 0.07 KDDI Corp. JPY 8,500 197,441 0.31 Keyence Corp. JPY 100 38,524 0.06
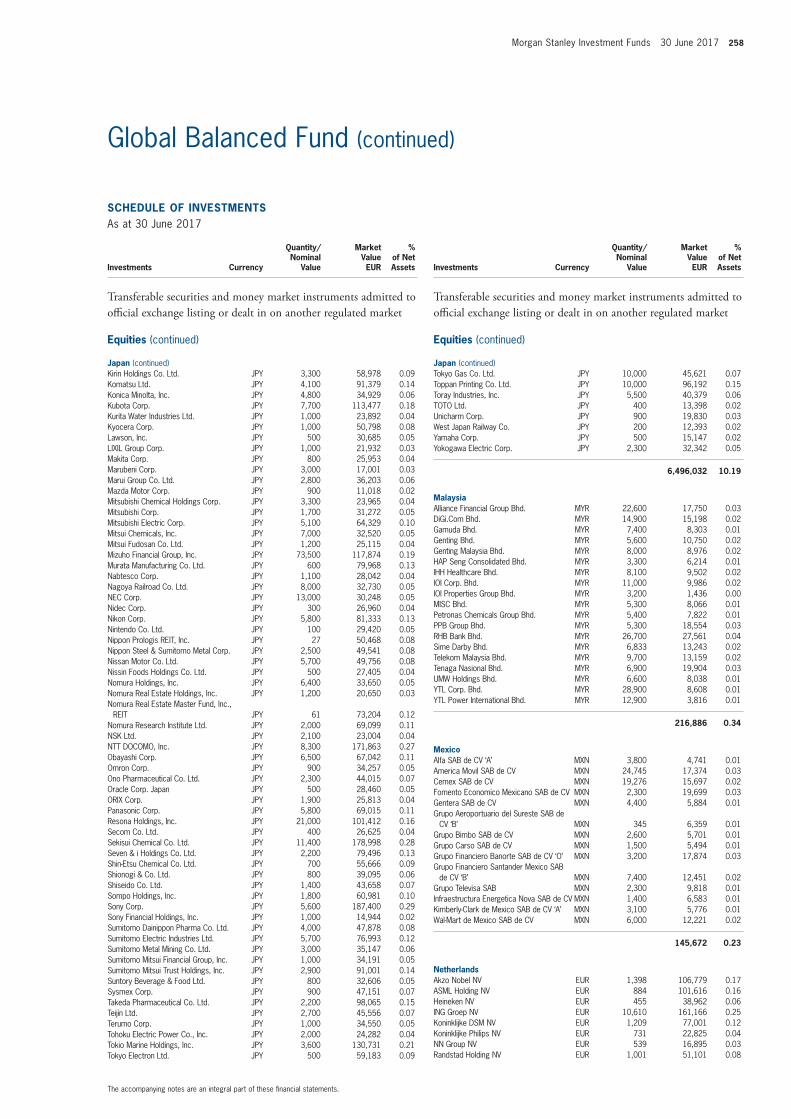
Morgan Stanley Investment Funds 30 June 2017 258
The accompanying notes are an integral part of these fi nancial statements.
Global Balanced Fund (continued)
SCHEDULE OF INVESTMENTSAs at 30 June 2017
Investments Currency
Quantity/Nominal
Value
Market Value EUR
% of Net Assets
Transferable securities and money market instruments admitted to offi cial exchange listing or dealt in on another regulated market
Equities (continued)
Japan (continued)Kirin Holdings Co. Ltd. JPY 3,300 58,978 0.09 Komatsu Ltd. JPY 4,100 91,379 0.14 Konica Minolta, Inc. JPY 4,800 34,929 0.06 Kubota Corp. JPY 7,700 113,477 0.18 Kurita Water Industries Ltd. JPY 1,000 23,892 0.04 Kyocera Corp. JPY 1,000 50,798 0.08 Lawson, Inc. JPY 500 30,685 0.05 LIXIL Group Corp. JPY 1,000 21,932 0.03 Makita Corp. JPY 800 25,953 0.04 Marubeni Corp. JPY 3,000 17,001 0.03 Marui Group Co. Ltd. JPY 2,800 36,203 0.06 Mazda Motor Corp. JPY 900 11,018 0.02 Mitsubishi Chemical Holdings Corp. JPY 3,300 23,965 0.04 Mitsubishi Corp. JPY 1,700 31,272 0.05 Mitsubishi Electric Corp. JPY 5,100 64,329 0.10 Mitsui Chemicals, Inc. JPY 7,000 32,520 0.05 Mitsui Fudosan Co. Ltd. JPY 1,200 25,115 0.04 Mizuho Financial Group, Inc. JPY 73,500 117,874 0.19 Murata Manufacturing Co. Ltd. JPY 600 79,968 0.13 Nabtesco Corp. JPY 1,100 28,042 0.04 Nagoya Railroad Co. Ltd. JPY 8,000 32,730 0.05 NEC Corp. JPY 13,000 30,248 0.05 Nidec Corp. JPY 300 26,960 0.04 Nikon Corp. JPY 5,800 81,333 0.13 Nintendo Co. Ltd. JPY 100 29,420 0.05 Nippon Prologis REIT, Inc. JPY 27 50,468 0.08 Nippon Steel & Sumitomo Metal Corp. JPY 2,500 49,541 0.08 Nissan Motor Co. Ltd. JPY 5,700 49,756 0.08 Nissin Foods Holdings Co. Ltd. JPY 500 27,405 0.04 Nomura Holdings, Inc. JPY 6,400 33,650 0.05 Nomura Real Estate Holdings, Inc. JPY 1,200 20,650 0.03 Nomura Real Estate Master Fund, Inc.,
REIT JPY 61 73,204 0.12 Nomura Research Institute Ltd. JPY 2,000 69,099 0.11 NSK Ltd. JPY 2,100 23,004 0.04 NTT DOCOMO, Inc. JPY 8,300 171,863 0.27 Obayashi Corp. JPY 6,500 67,042 0.11 Omron Corp. JPY 900 34,257 0.05 Ono Pharmaceutical Co. Ltd. JPY 2,300 44,015 0.07 Oracle Corp. Japan JPY 500 28,460 0.05 ORIX Corp. JPY 1,900 25,813 0.04 Panasonic Corp. JPY 5,800 69,015 0.11 Resona Holdings, Inc. JPY 21,000 101,412 0.16 Secom Co. Ltd. JPY 400 26,625 0.04 Sekisui Chemical Co. Ltd. JPY 11,400 178,998 0.28 Seven & i Holdings Co. Ltd. JPY 2,200 79,496 0.13 Shin-Etsu Chemical Co. Ltd. JPY 700 55,666 0.09 Shionogi & Co. Ltd. JPY 800 39,095 0.06 Shiseido Co. Ltd. JPY 1,400 43,658 0.07 Sompo Holdings, Inc. JPY 1,800 60,981 0.10 Sony Corp. JPY 5,600 187,400 0.29 Sony Financial Holdings, Inc. JPY 1,000 14,944 0.02 Sumitomo Dainippon Pharma Co. Ltd. JPY 4,000 47,878 0.08 Sumitomo Electric Industries Ltd. JPY 5,700 76,993 0.12 Sumitomo Metal Mining Co. Ltd. JPY 3,000 35,147 0.06 Sumitomo Mitsui Financial Group, Inc. JPY 1,000 34,191 0.05 Sumitomo Mitsui Trust Holdings, Inc. JPY 2,900 91,001 0.14 Suntory Beverage & Food Ltd. JPY 800 32,606 0.05 Sysmex Corp. JPY 900 47,151 0.07 Takeda Pharmaceutical Co. Ltd. JPY 2,200 98,065 0.15 Teijin Ltd. JPY 2,700 45,556 0.07 Terumo Corp. JPY 1,000 34,550 0.05 Tohoku Electric Power Co., Inc. JPY 2,000 24,282 0.04 Tokio Marine Holdings, Inc. JPY 3,600 130,731 0.21 Tokyo Electron Ltd. JPY 500 59,183 0.09
SCHEDULE OF INVESTMENTSAs at 30 June 2017
Investments Currency
Quantity/Nominal
Value
Market Value EUR
% of Net Assets
Transferable securities and money market instruments admitted to offi cial exchange listing or dealt in on another regulated market
Equities (continued)
Japan (continued)Tokyo Gas Co. Ltd. JPY 10,000 45,621 0.07 Toppan Printing Co. Ltd. JPY 10,000 96,192 0.15 Toray Industries, Inc. JPY 5,500 40,379 0.06 TOTO Ltd. JPY 400 13,398 0.02 Unicharm Corp. JPY 900 19,830 0.03 West Japan Railway Co. JPY 200 12,393 0.02 Yamaha Corp. JPY 500 15,147 0.02 Yokogawa Electric Corp. JPY 2,300 32,342 0.05
6,496,032 10.19
MalaysiaAlliance Financial Group Bhd. MYR 22,600 17,750 0.03 DiGi.Com Bhd. MYR 14,900 15,198 0.02 Gamuda Bhd. MYR 7,400 8,303 0.01 Genting Bhd. MYR 5,600 10,750 0.02 Genting Malaysia Bhd. MYR 8,000 8,976 0.02 HAP Seng Consolidated Bhd. MYR 3,300 6,214 0.01 IHH Healthcare Bhd. MYR 8,100 9,502 0.02 IOI Corp. Bhd. MYR 11,000 9,986 0.02 IOI Properties Group Bhd. MYR 3,200 1,436 0.00 MISC Bhd. MYR 5,300 8,066 0.01 Petronas Chemicals Group Bhd. MYR 5,400 7,822 0.01 PPB Group Bhd. MYR 5,300 18,554 0.03 RHB Bank Bhd. MYR 26,700 27,561 0.04 Sime Darby Bhd. MYR 6,833 13,243 0.02 Telekom Malaysia Bhd. MYR 9,700 13,159 0.02 Tenaga Nasional Bhd. MYR 6,900 19,904 0.03 UMW Holdings Bhd. MYR 6,600 8,038 0.01 YTL Corp. Bhd. MYR 28,900 8,608 0.01 YTL Power International Bhd. MYR 12,900 3,816 0.01
216,886 0.34
MexicoAlfa SAB de CV ‘A’ MXN 3,800 4,741 0.01 America Movil SAB de CV MXN 24,745 17,374 0.03 Cemex SAB de CV MXN 19,276 15,697 0.02 Fomento Economico Mexicano SAB de CV MXN 2,300 19,699 0.03 Gentera SAB de CV MXN 4,400 5,884 0.01 Grupo Aeroportuario del Sureste SAB de
CV ‘B’ MXN 345 6,359 0.01 Grupo Bimbo SAB de CV MXN 2,600 5,701 0.01 Grupo Carso SAB de CV MXN 1,500 5,494 0.01 Grupo Financiero Banorte SAB de CV ‘O’ MXN 3,200 17,874 0.03 Grupo Financiero Santander Mexico SAB
de CV ‘B’ MXN 7,400 12,451 0.02 Grupo Televisa SAB MXN 2,300 9,818 0.01 Infraestructura Energetica Nova SAB de CV MXN 1,400 6,583 0.01 Kimberly-Clark de Mexico SAB de CV ‘A’ MXN 3,100 5,776 0.01 Wal-Mart de Mexico SAB de CV MXN 6,000 12,221 0.02
145,672 0.23
NetherlandsAkzo Nobel NV EUR 1,398 106,779 0.17 ASML Holding NV EUR 884 101,616 0.16 Heineken NV EUR 455 38,962 0.06 ING Groep NV EUR 10,610 161,166 0.25 Koninklijke DSM NV EUR 1,209 77,001 0.12 Koninklijke Philips NV EUR 731 22,825 0.04 NN Group NV EUR 539 16,895 0.03 Randstad Holding NV EUR 1,001 51,101 0.08
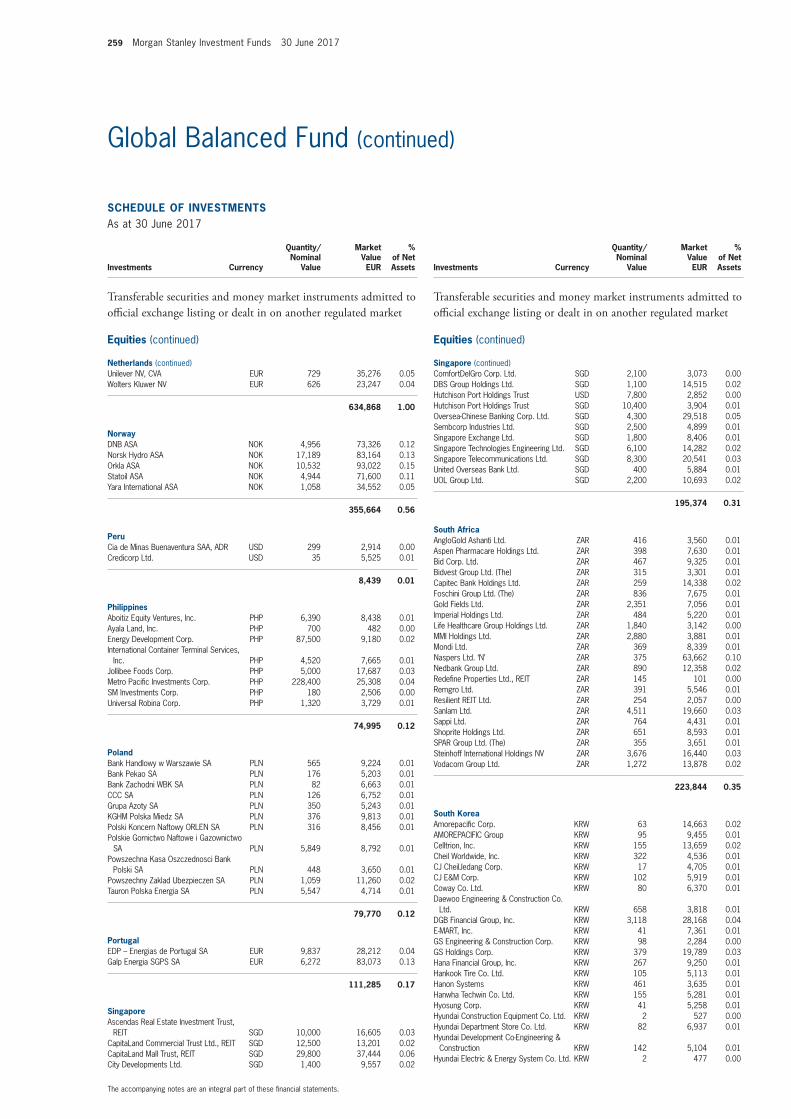
259 Morgan Stanley Investment Funds 30 June 2017
The accompanying notes are an integral part of these fi nancial statements.
Global Balanced Fund (continued)
SCHEDULE OF INVESTMENTSAs at 30 June 2017
Investments Currency
Quantity/Nominal
Value
Market Value EUR
% of Net Assets
Transferable securities and money market instruments admitted to offi cial exchange listing or dealt in on another regulated market
Equities (continued)
Netherlands (continued)Unilever NV, CVA EUR 729 35,276 0.05 Wolters Kluwer NV EUR 626 23,247 0.04
634,868 1.00
NorwayDNB ASA NOK 4,956 73,326 0.12 Norsk Hydro ASA NOK 17,189 83,164 0.13 Orkla ASA NOK 10,532 93,022 0.15 Statoil ASA NOK 4,944 71,600 0.11 Yara International ASA NOK 1,058 34,552 0.05
355,664 0.56
PeruCia de Minas Buenaventura SAA, ADR USD 299 2,914 0.00 Credicorp Ltd. USD 35 5,525 0.01
8,439 0.01
PhilippinesAboitiz Equity Ventures, Inc. PHP 6,390 8,438 0.01 Ayala Land, Inc. PHP 700 482 0.00 Energy Development Corp. PHP 87,500 9,180 0.02 International Container Terminal Services,
Inc. PHP 4,520 7,665 0.01 Jollibee Foods Corp. PHP 5,000 17,687 0.03 Metro Pacifi c Investments Corp. PHP 228,400 25,308 0.04 SM Investments Corp. PHP 180 2,506 0.00 Universal Robina Corp. PHP 1,320 3,729 0.01
74,995 0.12
PolandBank Handlowy w Warszawie SA PLN 565 9,224 0.01 Bank Pekao SA PLN 176 5,203 0.01 Bank Zachodni WBK SA PLN 82 6,663 0.01 CCC SA PLN 126 6,752 0.01 Grupa Azoty SA PLN 350 5,243 0.01 KGHM Polska Miedz SA PLN 376 9,813 0.01 Polski Koncern Naftowy ORLEN SA PLN 316 8,456 0.01 Polskie Gornictwo Naftowe i Gazownictwo
SA PLN 5,849 8,792 0.01 Powszechna Kasa Oszczednosci Bank
Polski SA PLN 448 3,650 0.01 Powszechny Zaklad Ubezpieczen SA PLN 1,059 11,260 0.02 Tauron Polska Energia SA PLN 5,547 4,714 0.01
79,770 0.12
PortugalEDP – Energias de Portugal SA EUR 9,837 28,212 0.04 Galp Energia SGPS SA EUR 6,272 83,073 0.13
111,285 0.17
SingaporeAscendas Real Estate Investment Trust,
REIT SGD 10,000 16,605 0.03 CapitaLand Commercial Trust Ltd., REIT SGD 12,500 13,201 0.02 CapitaLand Mall Trust, REIT SGD 29,800 37,444 0.06 City Developments Ltd. SGD 1,400 9,557 0.02
SCHEDULE OF INVESTMENTSAs at 30 June 2017
Investments Currency
Quantity/Nominal
Value
Market Value EUR
% of Net Assets
Transferable securities and money market instruments admitted to offi cial exchange listing or dealt in on another regulated market
Equities (continued)
Singapore (continued)ComfortDelGro Corp. Ltd. SGD 2,100 3,073 0.00 DBS Group Holdings Ltd. SGD 1,100 14,515 0.02 Hutchison Port Holdings Trust USD 7,800 2,852 0.00 Hutchison Port Holdings Trust SGD 10,400 3,904 0.01 Oversea-Chinese Banking Corp. Ltd. SGD 4,300 29,518 0.05 Sembcorp Industries Ltd. SGD 2,500 4,899 0.01 Singapore Exchange Ltd. SGD 1,800 8,406 0.01 Singapore Technologies Engineering Ltd. SGD 6,100 14,282 0.02 Singapore Telecommunications Ltd. SGD 8,300 20,541 0.03 United Overseas Bank Ltd. SGD 400 5,884 0.01 UOL Group Ltd. SGD 2,200 10,693 0.02
195,374 0.31
South AfricaAngloGold Ashanti Ltd. ZAR 416 3,560 0.01 Aspen Pharmacare Holdings Ltd. ZAR 398 7,630 0.01 Bid Corp. Ltd. ZAR 467 9,325 0.01 Bidvest Group Ltd. (The) ZAR 315 3,301 0.01 Capitec Bank Holdings Ltd. ZAR 259 14,338 0.02 Foschini Group Ltd. (The) ZAR 836 7,675 0.01 Gold Fields Ltd. ZAR 2,351 7,056 0.01 Imperial Holdings Ltd. ZAR 484 5,220 0.01 Life Healthcare Group Holdings Ltd. ZAR 1,840 3,142 0.00 MMI Holdings Ltd. ZAR 2,880 3,881 0.01 Mondi Ltd. ZAR 369 8,339 0.01 Naspers Ltd. ‘N’ ZAR 375 63,662 0.10 Nedbank Group Ltd. ZAR 890 12,358 0.02 Redefi ne Properties Ltd., REIT ZAR 145 101 0.00 Remgro Ltd. ZAR 391 5,546 0.01 Resilient REIT Ltd. ZAR 254 2,057 0.00 Sanlam Ltd. ZAR 4,511 19,660 0.03 Sappi Ltd. ZAR 764 4,431 0.01 Shoprite Holdings Ltd. ZAR 651 8,593 0.01 SPAR Group Ltd. (The) ZAR 355 3,651 0.01 Steinhoff International Holdings NV ZAR 3,676 16,440 0.03 Vodacom Group Ltd. ZAR 1,272 13,878 0.02
223,844 0.35
South KoreaAmorepacifi c Corp. KRW 63 14,663 0.02 AMOREPACIFIC Group KRW 95 9,455 0.01 Celltrion, Inc. KRW 155 13,659 0.02 Cheil Worldwide, Inc. KRW 322 4,536 0.01 CJ CheilJedang Corp. KRW 17 4,705 0.01 CJ E&M Corp. KRW 102 5,919 0.01 Coway Co. Ltd. KRW 80 6,370 0.01 Daewoo Engineering & Construction Co.
Ltd. KRW 658 3,818 0.01 DGB Financial Group, Inc. KRW 3,118 28,168 0.04 E-MART, Inc. KRW 41 7,361 0.01 GS Engineering & Construction Corp. KRW 98 2,284 0.00 GS Holdings Corp. KRW 379 19,789 0.03 Hana Financial Group, Inc. KRW 267 9,250 0.01 Hankook Tire Co. Ltd. KRW 105 5,113 0.01 Hanon Systems KRW 461 3,635 0.01 Hanwha Techwin Co. Ltd. KRW 155 5,281 0.01 Hyosung Corp. KRW 41 5,258 0.01 Hyundai Construction Equipment Co. Ltd. KRW 2 527 0.00 Hyundai Department Store Co. Ltd. KRW 82 6,937 0.01 Hyundai Development Co-Engineering &
Construction KRW 142 5,104 0.01 Hyundai Electric & Energy System Co. Ltd. KRW 2 477 0.00
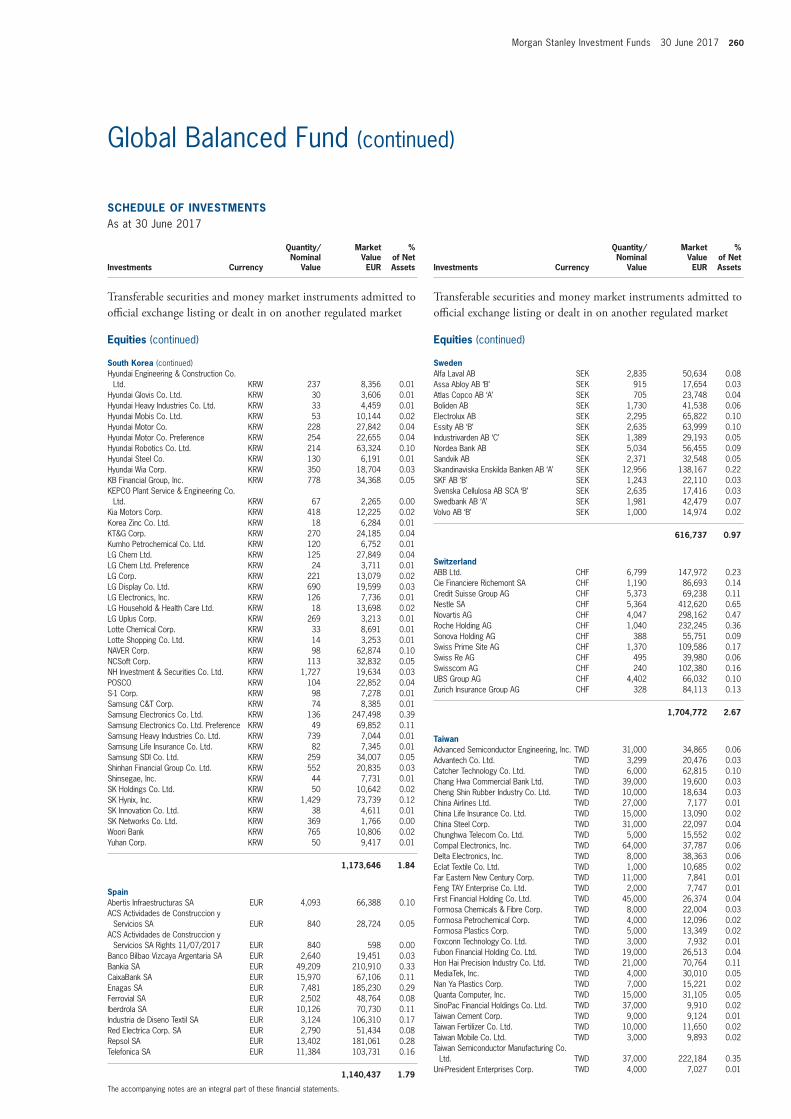
Morgan Stanley Investment Funds 30 June 2017 260
The accompanying notes are an integral part of these fi nancial statements.
Global Balanced Fund (continued)
SCHEDULE OF INVESTMENTSAs at 30 June 2017
Investments Currency
Quantity/Nominal
Value
Market Value EUR
% of Net Assets
Transferable securities and money market instruments admitted to offi cial exchange listing or dealt in on another regulated market
Equities (continued)
South Korea (continued)Hyundai Engineering & Construction Co.
Ltd. KRW 237 8,356 0.01 Hyundai Glovis Co. Ltd. KRW 30 3,606 0.01 Hyundai Heavy Industries Co. Ltd. KRW 33 4,459 0.01 Hyundai Mobis Co. Ltd. KRW 53 10,144 0.02 Hyundai Motor Co. KRW 228 27,842 0.04 Hyundai Motor Co. Preference KRW 254 22,655 0.04 Hyundai Robotics Co. Ltd. KRW 214 63,324 0.10 Hyundai Steel Co. KRW 130 6,191 0.01 Hyundai Wia Corp. KRW 350 18,704 0.03 KB Financial Group, Inc. KRW 778 34,368 0.05 KEPCO Plant Service & Engineering Co.
Ltd. KRW 67 2,265 0.00 Kia Motors Corp. KRW 418 12,225 0.02 Korea Zinc Co. Ltd. KRW 18 6,284 0.01 KT&G Corp. KRW 270 24,185 0.04 Kumho Petrochemical Co. Ltd. KRW 120 6,752 0.01 LG Chem Ltd. KRW 125 27,849 0.04 LG Chem Ltd. Preference KRW 24 3,711 0.01 LG Corp. KRW 221 13,079 0.02 LG Display Co. Ltd. KRW 690 19,599 0.03 LG Electronics, Inc. KRW 126 7,736 0.01 LG Household & Health Care Ltd. KRW 18 13,698 0.02 LG Uplus Corp. KRW 269 3,213 0.01 Lotte Chemical Corp. KRW 33 8,691 0.01 Lotte Shopping Co. Ltd. KRW 14 3,253 0.01 NAVER Corp. KRW 98 62,874 0.10 NCSoft Corp. KRW 113 32,832 0.05 NH Investment & Securities Co. Ltd. KRW 1,727 19,634 0.03 POSCO KRW 104 22,852 0.04 S-1 Corp. KRW 98 7,278 0.01 Samsung C&T Corp. KRW 74 8,385 0.01 Samsung Electronics Co. Ltd. KRW 136 247,498 0.39 Samsung Electronics Co. Ltd. Preference KRW 49 69,852 0.11 Samsung Heavy Industries Co. Ltd. KRW 739 7,044 0.01 Samsung Life Insurance Co. Ltd. KRW 82 7,345 0.01 Samsung SDI Co. Ltd. KRW 259 34,007 0.05 Shinhan Financial Group Co. Ltd. KRW 552 20,835 0.03 Shinsegae, Inc. KRW 44 7,731 0.01 SK Holdings Co. Ltd. KRW 50 10,642 0.02 SK Hynix, Inc. KRW 1,429 73,739 0.12 SK Innovation Co. Ltd. KRW 38 4,611 0.01 SK Networks Co. Ltd. KRW 369 1,766 0.00 Woori Bank KRW 765 10,806 0.02 Yuhan Corp. KRW 50 9,417 0.01
1,173,646 1.84
SpainAbertis Infraestructuras SA EUR 4,093 66,388 0.10 ACS Actividades de Construccion y
Servicios SA EUR 840 28,724 0.05 ACS Actividades de Construccion y
Servicios SA Rights 11/07/2017 EUR 840 598 0.00 Banco Bilbao Vizcaya Argentaria SA EUR 2,640 19,451 0.03 Bankia SA EUR 49,209 210,910 0.33 CaixaBank SA EUR 15,970 67,106 0.11 Enagas SA EUR 7,481 185,230 0.29 Ferrovial SA EUR 2,502 48,764 0.08 Iberdrola SA EUR 10,126 70,730 0.11 Industria de Diseno Textil SA EUR 3,124 106,310 0.17 Red Electrica Corp. SA EUR 2,790 51,434 0.08 Repsol SA EUR 13,402 181,061 0.28 Telefonica SA EUR 11,384 103,731 0.16
1,140,437 1.79
SCHEDULE OF INVESTMENTSAs at 30 June 2017
Investments Currency
Quantity/Nominal
Value
Market Value EUR
% of Net Assets
Transferable securities and money market instruments admitted to offi cial exchange listing or dealt in on another regulated market
Equities (continued)
SwedenAlfa Laval AB SEK 2,835 50,634 0.08 Assa Abloy AB ‘B’ SEK 915 17,654 0.03 Atlas Copco AB ‘A’ SEK 705 23,748 0.04 Boliden AB SEK 1,730 41,538 0.06 Electrolux AB SEK 2,295 65,822 0.10 Essity AB ‘B’ SEK 2,635 63,999 0.10 Industrivarden AB ‘C’ SEK 1,389 29,193 0.05 Nordea Bank AB SEK 5,034 56,455 0.09 Sandvik AB SEK 2,371 32,548 0.05 Skandinaviska Enskilda Banken AB ‘A’ SEK 12,956 138,167 0.22 SKF AB ‘B’ SEK 1,243 22,110 0.03 Svenska Cellulosa AB SCA ‘B’ SEK 2,635 17,416 0.03 Swedbank AB ‘A’ SEK 1,981 42,479 0.07 Volvo AB ‘B’ SEK 1,000 14,974 0.02
616,737 0.97
SwitzerlandABB Ltd. CHF 6,799 147,972 0.23 Cie Financiere Richemont SA CHF 1,190 86,693 0.14 Credit Suisse Group AG CHF 5,373 69,238 0.11 Nestle SA CHF 5,364 412,620 0.65 Novartis AG CHF 4,047 298,162 0.47 Roche Holding AG CHF 1,040 232,245 0.36 Sonova Holding AG CHF 388 55,751 0.09 Swiss Prime Site AG CHF 1,370 109,586 0.17 Swiss Re AG CHF 495 39,980 0.06 Swisscom AG CHF 240 102,380 0.16 UBS Group AG CHF 4,402 66,032 0.10 Zurich Insurance Group AG CHF 328 84,113 0.13
1,704,772 2.67
TaiwanAdvanced Semiconductor Engineering, Inc. TWD 31,000 34,865 0.06 Advantech Co. Ltd. TWD 3,299 20,476 0.03 Catcher Technology Co. Ltd. TWD 6,000 62,815 0.10 Chang Hwa Commercial Bank Ltd. TWD 39,000 19,600 0.03 Cheng Shin Rubber Industry Co. Ltd. TWD 10,000 18,634 0.03 China Airlines Ltd. TWD 27,000 7,177 0.01 China Life Insurance Co. Ltd. TWD 15,000 13,090 0.02 China Steel Corp. TWD 31,000 22,097 0.04 Chunghwa Telecom Co. Ltd. TWD 5,000 15,552 0.02 Compal Electronics, Inc. TWD 64,000 37,787 0.06 Delta Electronics, Inc. TWD 8,000 38,363 0.06 Eclat Textile Co. Ltd. TWD 1,000 10,685 0.02 Far Eastern New Century Corp. TWD 11,000 7,841 0.01 Feng TAY Enterprise Co. Ltd. TWD 2,000 7,747 0.01 First Financial Holding Co. Ltd. TWD 45,000 26,374 0.04 Formosa Chemicals & Fibre Corp. TWD 8,000 22,004 0.03 Formosa Petrochemical Corp. TWD 4,000 12,096 0.02 Formosa Plastics Corp. TWD 5,000 13,349 0.02 Foxconn Technology Co. Ltd. TWD 3,000 7,932 0.01 Fubon Financial Holding Co. Ltd. TWD 19,000 26,513 0.04 Hon Hai Precision Industry Co. Ltd. TWD 21,000 70,764 0.11 MediaTek, Inc. TWD 4,000 30,010 0.05 Nan Ya Plastics Corp. TWD 7,000 15,221 0.02 Quanta Computer, Inc. TWD 15,000 31,105 0.05 SinoPac Financial Holdings Co. Ltd. TWD 37,000 9,910 0.02 Taiwan Cement Corp. TWD 9,000 9,124 0.01 Taiwan Fertilizer Co. Ltd. TWD 10,000 11,650 0.02 Taiwan Mobile Co. Ltd. TWD 3,000 9,893 0.02 Taiwan Semiconductor Manufacturing Co.
Ltd. TWD 37,000 222,184 0.35 Uni-President Enterprises Corp. TWD 4,000 7,027 0.01
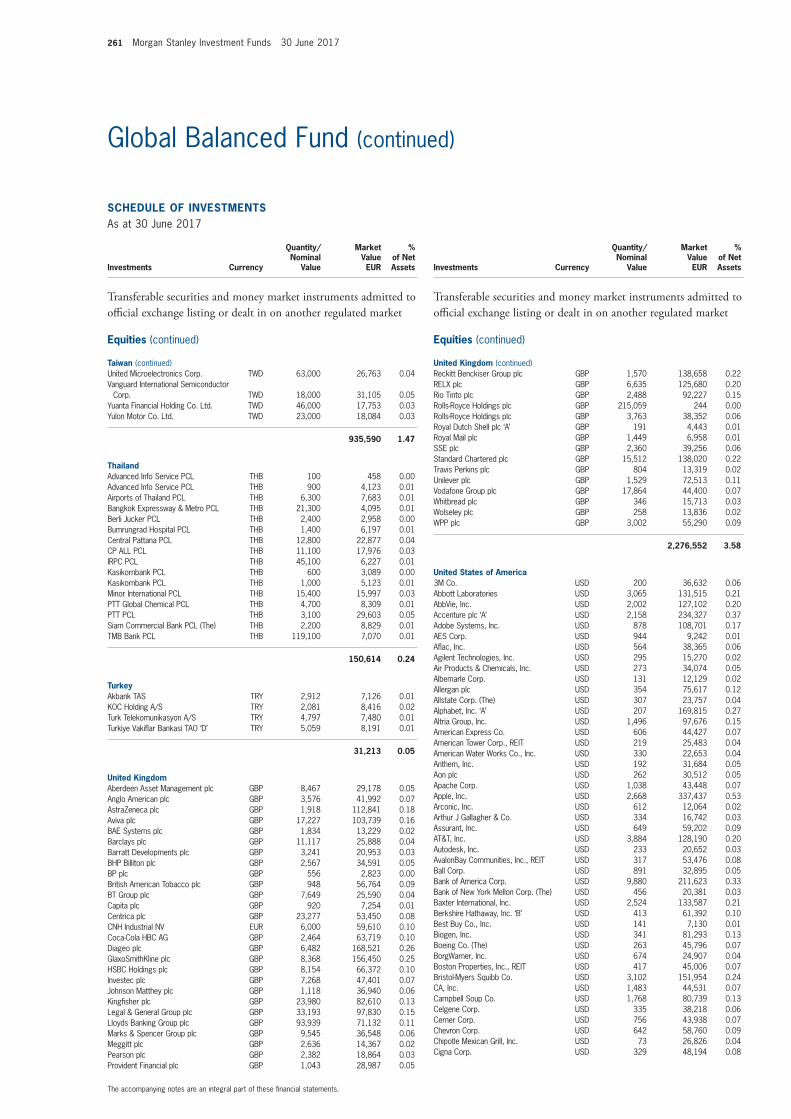
261 Morgan Stanley Investment Funds 30 June 2017
The accompanying notes are an integral part of these fi nancial statements.
Global Balanced Fund (continued)
SCHEDULE OF INVESTMENTSAs at 30 June 2017
Investments Currency
Quantity/Nominal
Value
Market Value EUR
% of Net Assets
Transferable securities and money market instruments admitted to offi cial exchange listing or dealt in on another regulated market
Equities (continued)
Taiwan (continued)United Microelectronics Corp. TWD 63,000 26,763 0.04 Vanguard International Semiconductor
Corp. TWD 18,000 31,105 0.05 Yuanta Financial Holding Co. Ltd. TWD 46,000 17,753 0.03 Yulon Motor Co. Ltd. TWD 23,000 18,084 0.03
935,590 1.47
ThailandAdvanced Info Service PCL THB 100 458 0.00 Advanced Info Service PCL THB 900 4,123 0.01 Airports of Thailand PCL THB 6,300 7,683 0.01 Bangkok Expressway & Metro PCL THB 21,300 4,095 0.01 Berli Jucker PCL THB 2,400 2,958 0.00 Bumrungrad Hospital PCL THB 1,400 6,197 0.01 Central Pattana PCL THB 12,800 22,877 0.04 CP ALL PCL THB 11,100 17,976 0.03 IRPC PCL THB 45,100 6,227 0.01 Kasikornbank PCL THB 600 3,089 0.00 Kasikornbank PCL THB 1,000 5,123 0.01 Minor International PCL THB 15,400 15,997 0.03 PTT Global Chemical PCL THB 4,700 8,309 0.01 PTT PCL THB 3,100 29,603 0.05 Siam Commercial Bank PCL (The) THB 2,200 8,829 0.01 TMB Bank PCL THB 119,100 7,070 0.01
150,614 0.24
TurkeyAkbank TAS TRY 2,912 7,126 0.01 KOC Holding A/S TRY 2,081 8,416 0.02 Turk Telekomunikasyon A/S TRY 4,797 7,480 0.01 Turkiye Vakifl ar Bankasi TAO ‘D’ TRY 5,059 8,191 0.01
31,213 0.05
United KingdomAberdeen Asset Management plc GBP 8,467 29,178 0.05 Anglo American plc GBP 3,576 41,992 0.07 AstraZeneca plc GBP 1,918 112,841 0.18 Aviva plc GBP 17,227 103,739 0.16 BAE Systems plc GBP 1,834 13,229 0.02 Barclays plc GBP 11,117 25,888 0.04 Barratt Developments plc GBP 3,241 20,953 0.03 BHP Billiton plc GBP 2,567 34,591 0.05 BP plc GBP 556 2,823 0.00 British American Tobacco plc GBP 948 56,764 0.09 BT Group plc GBP 7,649 25,590 0.04 Capita plc GBP 920 7,254 0.01 Centrica plc GBP 23,277 53,450 0.08 CNH Industrial NV EUR 6,000 59,610 0.10 Coca-Cola HBC AG GBP 2,464 63,719 0.10 Diageo plc GBP 6,482 168,521 0.26 GlaxoSmithKline plc GBP 8,368 156,450 0.25 HSBC Holdings plc GBP 8,154 66,372 0.10 Investec plc GBP 7,268 47,401 0.07 Johnson Matthey plc GBP 1,118 36,940 0.06 Kingfi sher plc GBP 23,980 82,610 0.13 Legal & General Group plc GBP 33,193 97,830 0.15 Lloyds Banking Group plc GBP 93,939 71,132 0.11 Marks & Spencer Group plc GBP 9,545 36,548 0.06 Meggitt plc GBP 2,636 14,367 0.02 Pearson plc GBP 2,382 18,864 0.03 Provident Financial plc GBP 1,043 28,987 0.05
SCHEDULE OF INVESTMENTSAs at 30 June 2017
Investments Currency
Quantity/Nominal
Value
Market Value EUR
% of Net Assets
Transferable securities and money market instruments admitted to offi cial exchange listing or dealt in on another regulated market
Equities (continued)
United Kingdom (continued)Reckitt Benckiser Group plc GBP 1,570 138,658 0.22 RELX plc GBP 6,635 125,680 0.20 Rio Tinto plc GBP 2,488 92,227 0.15 Rolls-Royce Holdings plc GBP 215,059 244 0.00 Rolls-Royce Holdings plc GBP 3,763 38,352 0.06 Royal Dutch Shell plc ‘A’ GBP 191 4,443 0.01 Royal Mail plc GBP 1,449 6,958 0.01 SSE plc GBP 2,360 39,256 0.06 Standard Chartered plc GBP 15,512 138,020 0.22 Travis Perkins plc GBP 804 13,319 0.02 Unilever plc GBP 1,529 72,513 0.11 Vodafone Group plc GBP 17,864 44,400 0.07 Whitbread plc GBP 346 15,713 0.03 Wolseley plc GBP 258 13,836 0.02 WPP plc GBP 3,002 55,290 0.09
2,276,552 3.58
United States of America3M Co. USD 200 36,632 0.06 Abbott Laboratories USD 3,065 131,515 0.21 AbbVie, Inc. USD 2,002 127,102 0.20 Accenture plc ‘A’ USD 2,158 234,327 0.37 Adobe Systems, Inc. USD 878 108,701 0.17 AES Corp. USD 944 9,242 0.01 Afl ac, Inc. USD 564 38,365 0.06 Agilent Technologies, Inc. USD 295 15,270 0.02 Air Products & Chemicals, Inc. USD 273 34,074 0.05 Albemarle Corp. USD 131 12,129 0.02 Allergan plc USD 354 75,617 0.12 Allstate Corp. (The) USD 307 23,757 0.04 Alphabet, Inc. ‘A’ USD 207 169,815 0.27 Altria Group, Inc. USD 1,496 97,676 0.15 American Express Co. USD 606 44,427 0.07 American Tower Corp., REIT USD 219 25,483 0.04 American Water Works Co., Inc. USD 330 22,653 0.04 Anthem, Inc. USD 192 31,684 0.05 Aon plc USD 262 30,512 0.05 Apache Corp. USD 1,038 43,448 0.07 Apple, Inc. USD 2,668 337,437 0.53 Arconic, Inc. USD 612 12,064 0.02 Arthur J Gallagher & Co. USD 334 16,742 0.03 Assurant, Inc. USD 649 59,202 0.09 AT&T, Inc. USD 3,884 128,190 0.20 Autodesk, Inc. USD 233 20,652 0.03 AvalonBay Communities, Inc., REIT USD 317 53,476 0.08 Ball Corp. USD 891 32,895 0.05 Bank of America Corp. USD 9,880 211,623 0.33 Bank of New York Mellon Corp. (The) USD 456 20,381 0.03 Baxter International, Inc. USD 2,524 133,587 0.21 Berkshire Hathaway, Inc. ‘B’ USD 413 61,392 0.10 Best Buy Co., Inc. USD 141 7,130 0.01 Biogen, Inc. USD 341 81,293 0.13 Boeing Co. (The) USD 263 45,796 0.07 BorgWarner, Inc. USD 674 24,907 0.04 Boston Properties, Inc., REIT USD 417 45,006 0.07 Bristol-Myers Squibb Co. USD 3,102 151,954 0.24 CA, Inc. USD 1,483 44,531 0.07 Campbell Soup Co. USD 1,768 80,739 0.13 Celgene Corp. USD 335 38,218 0.06 Cerner Corp. USD 756 43,938 0.07 Chevron Corp. USD 642 58,760 0.09 Chipotle Mexican Grill, Inc. USD 73 26,826 0.04 Cigna Corp. USD 329 48,194 0.08
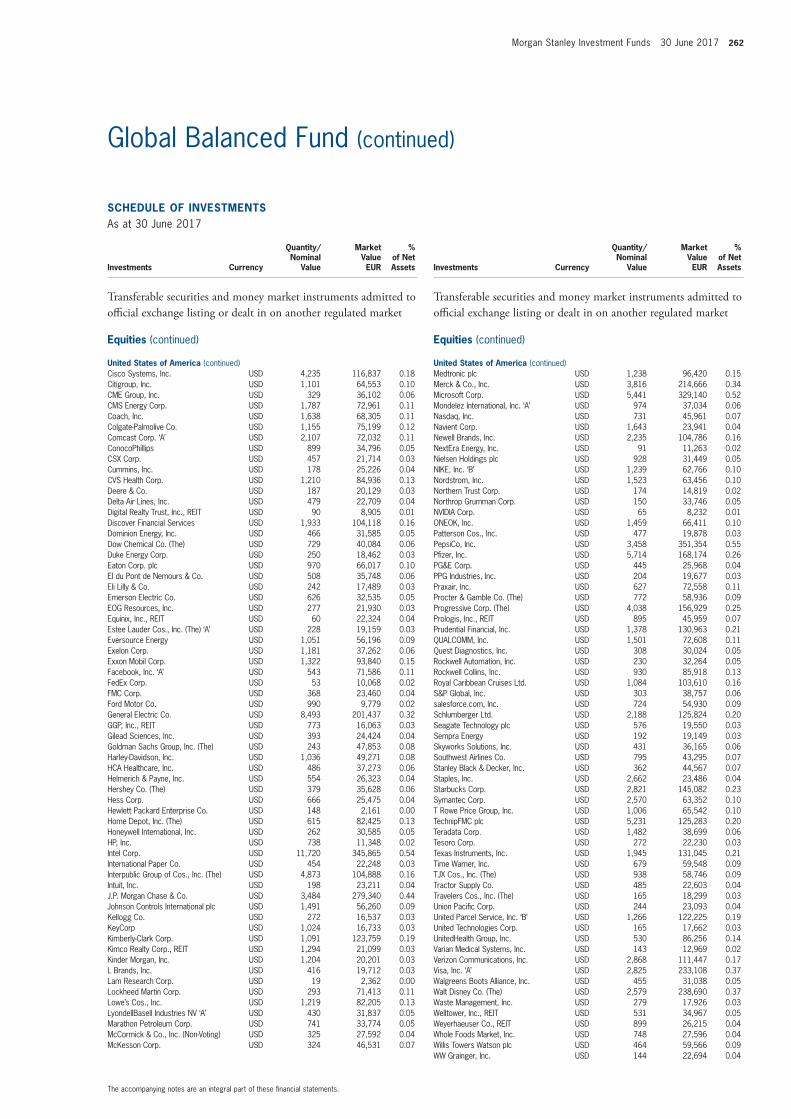
Morgan Stanley Investment Funds 30 June 2017 262
The accompanying notes are an integral part of these fi nancial statements.
Global Balanced Fund (continued)
SCHEDULE OF INVESTMENTSAs at 30 June 2017
Investments Currency
Quantity/Nominal
Value
Market Value EUR
% of Net Assets
Transferable securities and money market instruments admitted to offi cial exchange listing or dealt in on another regulated market
Equities (continued)
United States of America (continued)Cisco Systems, Inc. USD 4,235 116,837 0.18 Citigroup, Inc. USD 1,101 64,553 0.10 CME Group, Inc. USD 329 36,102 0.06 CMS Energy Corp. USD 1,787 72,961 0.11 Coach, Inc. USD 1,638 68,305 0.11 Colgate-Palmolive Co. USD 1,155 75,199 0.12 Comcast Corp. ‘A’ USD 2,107 72,032 0.11 ConocoPhillips USD 899 34,796 0.05 CSX Corp. USD 457 21,714 0.03 Cummins, Inc. USD 178 25,226 0.04 CVS Health Corp. USD 1,210 84,936 0.13 Deere & Co. USD 187 20,129 0.03 Delta Air Lines, Inc. USD 479 22,709 0.04 Digital Realty Trust, Inc., REIT USD 90 8,905 0.01 Discover Financial Services USD 1,933 104,118 0.16 Dominion Energy, Inc. USD 466 31,585 0.05 Dow Chemical Co. (The) USD 729 40,084 0.06 Duke Energy Corp. USD 250 18,462 0.03 Eaton Corp. plc USD 970 66,017 0.10 EI du Pont de Nemours & Co. USD 508 35,748 0.06 Eli Lilly & Co. USD 242 17,489 0.03 Emerson Electric Co. USD 626 32,535 0.05 EOG Resources, Inc. USD 277 21,930 0.03 Equinix, Inc., REIT USD 60 22,324 0.04 Estee Lauder Cos., Inc. (The) ‘A’ USD 228 19,159 0.03 Eversource Energy USD 1,051 56,196 0.09 Exelon Corp. USD 1,181 37,262 0.06 Exxon Mobil Corp. USD 1,322 93,840 0.15 Facebook, Inc. ‘A’ USD 543 71,586 0.11 FedEx Corp. USD 53 10,068 0.02 FMC Corp. USD 368 23,460 0.04 Ford Motor Co. USD 990 9,779 0.02 General Electric Co. USD 8,493 201,437 0.32 GGP, Inc., REIT USD 773 16,063 0.03 Gilead Sciences, Inc. USD 393 24,424 0.04 Goldman Sachs Group, Inc. (The) USD 243 47,853 0.08 Harley-Davidson, Inc. USD 1,036 49,271 0.08 HCA Healthcare, Inc. USD 486 37,273 0.06 Helmerich & Payne, Inc. USD 554 26,323 0.04 Hershey Co. (The) USD 379 35,628 0.06 Hess Corp. USD 666 25,475 0.04 Hewlett Packard Enterprise Co. USD 148 2,161 0.00 Home Depot, Inc. (The) USD 615 82,425 0.13 Honeywell International, Inc. USD 262 30,585 0.05 HP, Inc. USD 738 11,348 0.02 Intel Corp. USD 11,720 345,865 0.54 International Paper Co. USD 454 22,248 0.03 Interpublic Group of Cos., Inc. (The) USD 4,873 104,888 0.16 Intuit, Inc. USD 198 23,211 0.04 J.P. Morgan Chase & Co. USD 3,484 279,340 0.44 Johnson Controls International plc USD 1,491 56,260 0.09 Kellogg Co. USD 272 16,537 0.03 KeyCorp USD 1,024 16,733 0.03 Kimberly-Clark Corp. USD 1,091 123,759 0.19 Kimco Realty Corp., REIT USD 1,294 21,099 0.03 Kinder Morgan, Inc. USD 1,204 20,201 0.03 L Brands, Inc. USD 416 19,712 0.03 Lam Research Corp. USD 19 2,362 0.00 Lockheed Martin Corp. USD 293 71,413 0.11 Lowe’s Cos., Inc. USD 1,219 82,205 0.13 LyondellBasell Industries NV ‘A’ USD 430 31,837 0.05 Marathon Petroleum Corp. USD 741 33,774 0.05 McCormick & Co., Inc. (Non-Voting) USD 325 27,592 0.04 McKesson Corp. USD 324 46,531 0.07
SCHEDULE OF INVESTMENTSAs at 30 June 2017
Investments Currency
Quantity/Nominal
Value
Market Value EUR
% of Net Assets
Transferable securities and money market instruments admitted to offi cial exchange listing or dealt in on another regulated market
Equities (continued)
United States of America (continued)Medtronic plc USD 1,238 96,420 0.15 Merck & Co., Inc. USD 3,816 214,666 0.34 Microsoft Corp. USD 5,441 329,140 0.52 Mondelez International, Inc. ‘A’ USD 974 37,034 0.06 Nasdaq, Inc. USD 731 45,961 0.07 Navient Corp. USD 1,643 23,941 0.04 Newell Brands, Inc. USD 2,235 104,786 0.16 NextEra Energy, Inc. USD 91 11,263 0.02 Nielsen Holdings plc USD 928 31,449 0.05 NIKE, Inc. ‘B’ USD 1,239 62,766 0.10 Nordstrom, Inc. USD 1,523 63,456 0.10 Northern Trust Corp. USD 174 14,819 0.02 Northrop Grumman Corp. USD 150 33,746 0.05 NVIDIA Corp. USD 65 8,232 0.01 ONEOK, Inc. USD 1,459 66,411 0.10 Patterson Cos., Inc. USD 477 19,878 0.03 PepsiCo, Inc. USD 3,458 351,354 0.55 Pfi zer, Inc. USD 5,714 168,174 0.26 PG&E Corp. USD 445 25,968 0.04 PPG Industries, Inc. USD 204 19,677 0.03 Praxair, Inc. USD 627 72,558 0.11 Procter & Gamble Co. (The) USD 772 58,936 0.09 Progressive Corp. (The) USD 4,038 156,929 0.25 Prologis, Inc., REIT USD 895 45,959 0.07 Prudential Financial, Inc. USD 1,378 130,963 0.21 QUALCOMM, Inc. USD 1,501 72,608 0.11 Quest Diagnostics, Inc. USD 308 30,024 0.05 Rockwell Automation, Inc. USD 230 32,264 0.05 Rockwell Collins, Inc. USD 930 85,918 0.13 Royal Caribbean Cruises Ltd. USD 1,084 103,610 0.16 S&P Global, Inc. USD 303 38,757 0.06 salesforce.com, Inc. USD 724 54,930 0.09 Schlumberger Ltd. USD 2,188 125,824 0.20 Seagate Technology plc USD 576 19,550 0.03 Sempra Energy USD 192 19,149 0.03 Skyworks Solutions, Inc. USD 431 36,165 0.06 Southwest Airlines Co. USD 795 43,295 0.07 Stanley Black & Decker, Inc. USD 362 44,567 0.07 Staples, Inc. USD 2,662 23,486 0.04 Starbucks Corp. USD 2,821 145,082 0.23 Symantec Corp. USD 2,570 63,352 0.10 T Rowe Price Group, Inc. USD 1,006 65,542 0.10 TechnipFMC plc USD 5,231 125,283 0.20 Teradata Corp. USD 1,482 38,699 0.06 Tesoro Corp. USD 272 22,230 0.03 Texas Instruments, Inc. USD 1,945 131,045 0.21 Time Warner, Inc. USD 679 59,548 0.09 TJX Cos., Inc. (The) USD 938 58,746 0.09 Tractor Supply Co. USD 485 22,603 0.04 Travelers Cos., Inc. (The) USD 165 18,299 0.03 Union Pacifi c Corp. USD 244 23,093 0.04 United Parcel Service, Inc. ‘B’ USD 1,266 122,225 0.19 United Technologies Corp. USD 165 17,662 0.03 UnitedHealth Group, Inc. USD 530 86,256 0.14 Varian Medical Systems, Inc. USD 143 12,969 0.02 Verizon Communications, Inc. USD 2,868 111,447 0.17 Visa, Inc. ‘A’ USD 2,825 233,108 0.37 Walgreens Boots Alliance, Inc. USD 455 31,038 0.05 Walt Disney Co. (The) USD 2,579 238,690 0.37 Waste Management, Inc. USD 279 17,926 0.03 Welltower, Inc., REIT USD 531 34,967 0.05 Weyerhaeuser Co., REIT USD 899 26,215 0.04 Whole Foods Market, Inc. USD 748 27,596 0.04 Willis Towers Watson plc USD 464 59,566 0.09 WW Grainger, Inc. USD 144 22,694 0.04
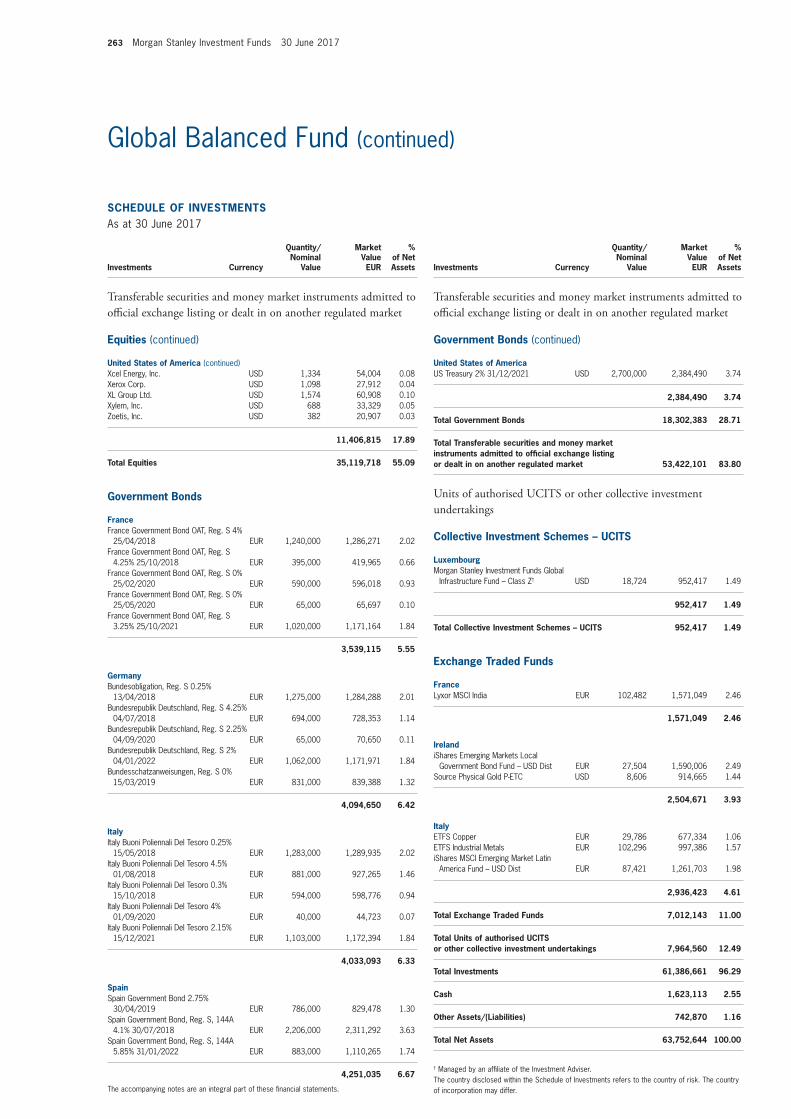
263 Morgan Stanley Investment Funds 30 June 2017
The accompanying notes are an integral part of these fi nancial statements.
Global Balanced Fund (continued)
SCHEDULE OF INVESTMENTSAs at 30 June 2017
Investments Currency
Quantity/Nominal
Value
Market Value EUR
% of Net Assets
Transferable securities and money market instruments admitted to offi cial exchange listing or dealt in on another regulated market
Equities (continued)
United States of America (continued)Xcel Energy, Inc. USD 1,334 54,004 0.08 Xerox Corp. USD 1,098 27,912 0.04 XL Group Ltd. USD 1,574 60,908 0.10 Xylem, Inc. USD 688 33,329 0.05 Zoetis, Inc. USD 382 20,907 0.03
11,406,815 17.89
Total Equities 35,119,718 55.09
Government Bonds
FranceFrance Government Bond OAT, Reg. S 4%
25/04/2018 EUR 1,240,000 1,286,271 2.02 France Government Bond OAT, Reg. S
4.25% 25/10/2018 EUR 395,000 419,965 0.66 France Government Bond OAT, Reg. S 0%
25/02/2020 EUR 590,000 596,018 0.93 France Government Bond OAT, Reg. S 0%
25/05/2020 EUR 65,000 65,697 0.10 France Government Bond OAT, Reg. S
3.25% 25/10/2021 EUR 1,020,000 1,171,164 1.84
3,539,115 5.55
GermanyBundesobligation, Reg. S 0.25%
13/04/2018 EUR 1,275,000 1,284,288 2.01 Bundesrepublik Deutschland, Reg. S 4.25%
04/07/2018 EUR 694,000 728,353 1.14 Bundesrepublik Deutschland, Reg. S 2.25%
04/09/2020 EUR 65,000 70,650 0.11 Bundesrepublik Deutschland, Reg. S 2%
04/01/2022 EUR 1,062,000 1,171,971 1.84 Bundesschatzanweisungen, Reg. S 0%
15/03/2019 EUR 831,000 839,388 1.32
4,094,650 6.42
ItalyItaly Buoni Poliennali Del Tesoro 0.25%
15/05/2018 EUR 1,283,000 1,289,935 2.02 Italy Buoni Poliennali Del Tesoro 4.5%
01/08/2018 EUR 881,000 927,265 1.46 Italy Buoni Poliennali Del Tesoro 0.3%
15/10/2018 EUR 594,000 598,776 0.94 Italy Buoni Poliennali Del Tesoro 4%
01/09/2020 EUR 40,000 44,723 0.07 Italy Buoni Poliennali Del Tesoro 2.15%
15/12/2021 EUR 1,103,000 1,172,394 1.84
4,033,093 6.33
SpainSpain Government Bond 2.75%
30/04/2019 EUR 786,000 829,478 1.30 Spain Government Bond, Reg. S, 144A
4.1% 30/07/2018 EUR 2,206,000 2,311,292 3.63 Spain Government Bond, Reg. S, 144A
5.85% 31/01/2022 EUR 883,000 1,110,265 1.74
4,251,035 6.67
SCHEDULE OF INVESTMENTSAs at 30 June 2017
Investments Currency
Quantity/Nominal
Value
Market Value EUR
% of Net Assets
Transferable securities and money market instruments admitted to offi cial exchange listing or dealt in on another regulated market
Government Bonds (continued)
United States of AmericaUS Treasury 2% 31/12/2021 USD 2,700,000 2,384,490 3.74
2,384,490 3.74
Total Government Bonds 18,302,383 28.71
Total Transferable securities and money market instruments admitted to offi cial exchange listing or dealt in on another regulated market 53,422,101 83.80
Units of authorised UCITS or other collective investment undertakings
Collective Investment Schemes – UCITS
LuxembourgMorgan Stanley Investment Funds Global
Infrastructure Fund – Class Z† USD 18,724 952,417 1.49
952,417 1.49
Total Collective Investment Schemes – UCITS 952,417 1.49
Exchange Traded Funds
FranceLyxor MSCI India EUR 102,482 1,571,049 2.46
1,571,049 2.46
IrelandiShares Emerging Markets Local
Government Bond Fund – USD Dist EUR 27,504 1,590,006 2.49 Source Physical Gold P-ETC USD 8,606 914,665 1.44
2,504,671 3.93
ItalyETFS Copper EUR 29,786 677,334 1.06 ETFS Industrial Metals EUR 102,296 997,386 1.57 iShares MSCI Emerging Market Latin
America Fund – USD Dist EUR 87,421 1,261,703 1.98
2,936,423 4.61
Total Exchange Traded Funds 7,012,143 11.00
Total Units of authorised UCITS or other collective investment undertakings 7,964,560 12.49
Total Investments 61,386,661 96.29
Cash 1,623,113 2.55
Other Assets/(Liabilities) 742,870 1.16
Total Net Assets 63,752,644 100.00
† Managed by an affi liate of the Investment Adviser.The country disclosed within the Schedule of Investments refers to the country of risk. The country of incorporation may differ.
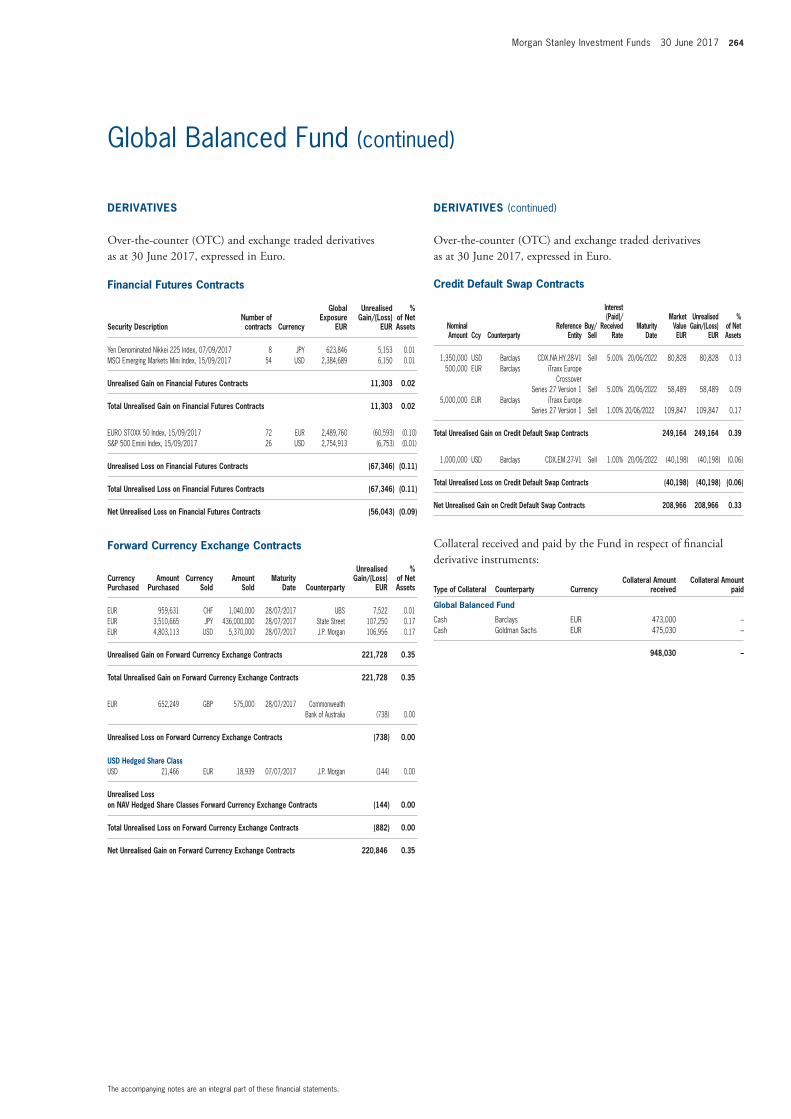
Morgan Stanley Investment Funds 30 June 2017 264
The accompanying notes are an integral part of these fi nancial statements.
Global Balanced Fund (continued)
Financial Futures Contracts
Security DescriptionNumber of contracts Currency
Global Exposure
EUR
Unrealised Gain/(Loss)
EUR
% of Net Assets
Yen Denominated Nikkei 225 Index, 07/09/2017 8 JPY 623,846 5,153 0.01 MSCI Emerging Markets Mini Index, 15/09/2017 54 USD 2,384,689 6,150 0.01
Unrealised Gain on Financial Futures Contracts 11,303 0.02
Total Unrealised Gain on Financial Futures Contracts 11,303 0.02
EURO STOXX 50 Index, 15/09/2017 72 EUR 2,489,760 (60,593) (0.10) S&P 500 Emini Index, 15/09/2017 26 USD 2,754,913 (6,753) (0.01)
Unrealised Loss on Financial Futures Contracts (67,346) (0.11)
Total Unrealised Loss on Financial Futures Contracts (67,346) (0.11)
Net Unrealised Loss on Financial Futures Contracts (56,043) (0.09)
Forward Currency Exchange Contracts
Currency Purchased
Amount Purchased
Currency Sold
Amount Sold
Maturity Date Counterparty
Unrealised Gain/(Loss)
EUR
% of Net Assets
EUR 959,631 CHF 1,040,000 28/07/2017 UBS 7,522 0.01 EUR 3,510,665 JPY 436,000,000 28/07/2017 State Street 107,250 0.17 EUR 4,803,113 USD 5,370,000 28/07/2017 J.P. Morgan 106,956 0.17
Unrealised Gain on Forward Currency Exchange Contracts 221,728 0.35
Total Unrealised Gain on Forward Currency Exchange Contracts 221,728 0.35
EUR 652,249 GBP 575,000 28/07/2017 Commonwealth Bank of Australia (738) 0.00
Unrealised Loss on Forward Currency Exchange Contracts (738) 0.00
USD Hedged Share ClassUSD 21,466 EUR 18,939 07/07/2017 J.P. Morgan (144) 0.00
Unrealised Loss on NAV Hedged Share Classes Forward Currency Exchange Contracts (144) 0.00
Total Unrealised Loss on Forward Currency Exchange Contracts (882) 0.00
Net Unrealised Gain on Forward Currency Exchange Contracts 220,846 0.35
Credit Default Swap Contracts
Nominal Amount Ccy Counterparty
Reference Entity
Buy/Sell
Interest (Paid)/
Received Rate
Maturity Date
Market Value EUR
Unrealised Gain/(Loss)
EUR
% of Net Assets
1,350,000 USD Barclays CDX.NA.HY.28-V1 Sell 5.00% 20/06/2022 80,828 80,828 0.13 500,000 EUR Barclays iTraxx Europe
Crossover Series 27 Version 1 Sell 5.00% 20/06/2022 58,489 58,489 0.09
5,000,000 EUR Barclays iTraxx Europe Series 27 Version 1 Sell 1.00% 20/06/2022 109,847 109,847 0.17
Total Unrealised Gain on Credit Default Swap Contracts 249,164 249,164 0.39
1,000,000 USD Barclays CDX.EM.27-V1 Sell 1.00% 20/06/2022 (40,198) (40,198) (0.06)
Total Unrealised Loss on Credit Default Swap Contracts (40,198) (40,198) (0.06)
Net Unrealised Gain on Credit Default Swap Contracts 208,966 208,966 0.33
Collateral received and paid by the Fund in respect of fi nancial derivative instruments:
Type of Collateral Counterparty CurrencyCollateral Amount
receivedCollateral Amount
paid
Global Balanced Fund
Cash Barclays EUR 473,000 –Cash Goldman Sachs EUR 475,030 –
948,030 –
DERIVATIVES
Over-the-counter (OTC) and exchange traded derivatives as at 30 June 2017, expressed in Euro.
DERIVATIVES (continued)
Over-the-counter (OTC) and exchange traded derivatives as at 30 June 2017, expressed in Euro.
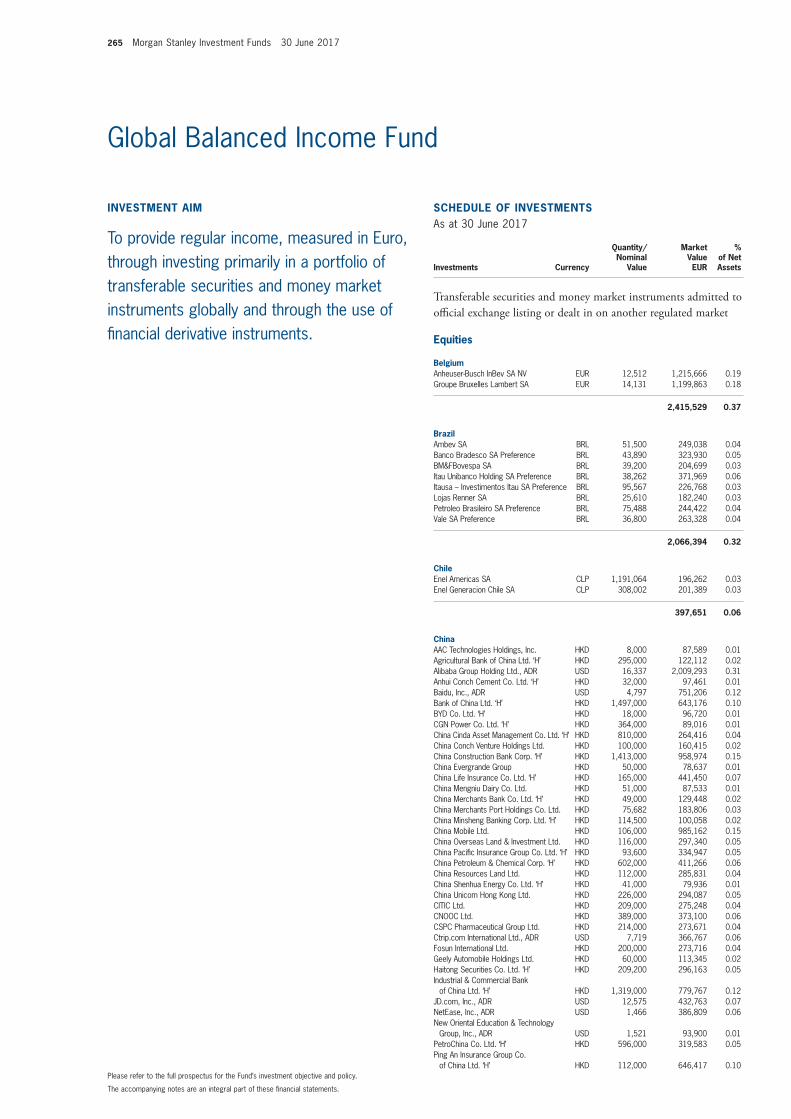
265 Morgan Stanley Investment Funds 30 June 2017
The accompanying notes are an integral part of these fi nancial statements.
Please refer to the full prospectus for the Fund’s investment objective and policy.
INVESTMENT AIM
To provide regular income, measured in Euro, through investing primarily in a portfolio of transferable securities and money market instruments globally and through the use of fi nancial derivative instruments.
SCHEDULE OF INVESTMENTSAs at 30 June 2017
Investments Currency
Quantity/Nominal
Value
Market Value EUR
% of Net Assets
Transferable securities and money market instruments admitted to offi cial exchange listing or dealt in on another regulated market
Equities
BelgiumAnheuser-Busch InBev SA NV EUR 12,512 1,215,666 0.19 Groupe Bruxelles Lambert SA EUR 14,131 1,199,863 0.18
2,415,529 0.37
BrazilAmbev SA BRL 51,500 249,038 0.04 Banco Bradesco SA Preference BRL 43,890 323,930 0.05 BM&FBovespa SA BRL 39,200 204,699 0.03 Itau Unibanco Holding SA Preference BRL 38,262 371,969 0.06 Itausa – Investimentos Itau SA Preference BRL 95,567 226,768 0.03 Lojas Renner SA BRL 25,610 182,240 0.03 Petroleo Brasileiro SA Preference BRL 75,488 244,422 0.04 Vale SA Preference BRL 36,800 263,328 0.04
2,066,394 0.32
ChileEnel Americas SA CLP 1,191,064 196,262 0.03 Enel Generacion Chile SA CLP 308,002 201,389 0.03
397,651 0.06
ChinaAAC Technologies Holdings, Inc. HKD 8,000 87,589 0.01 Agricultural Bank of China Ltd. ‘H’ HKD 295,000 122,112 0.02 Alibaba Group Holding Ltd., ADR USD 16,337 2,009,293 0.31 Anhui Conch Cement Co. Ltd. ‘H’ HKD 32,000 97,461 0.01 Baidu, Inc., ADR USD 4,797 751,206 0.12 Bank of China Ltd. ‘H’ HKD 1,497,000 643,176 0.10 BYD Co. Ltd. ‘H’ HKD 18,000 96,720 0.01 CGN Power Co. Ltd. ‘H’ HKD 364,000 89,016 0.01 China Cinda Asset Management Co. Ltd. ‘H’ HKD 810,000 264,416 0.04 China Conch Venture Holdings Ltd. HKD 100,000 160,415 0.02 China Construction Bank Corp. ‘H’ HKD 1,413,000 958,974 0.15 China Evergrande Group HKD 50,000 78,637 0.01 China Life Insurance Co. Ltd. ‘H’ HKD 165,000 441,450 0.07 China Mengniu Dairy Co. Ltd. HKD 51,000 87,533 0.01 China Merchants Bank Co. Ltd. ‘H’ HKD 49,000 129,448 0.02 China Merchants Port Holdings Co. Ltd. HKD 75,682 183,806 0.03 China Minsheng Banking Corp. Ltd. ‘H’ HKD 114,500 100,058 0.02 China Mobile Ltd. HKD 106,000 985,162 0.15 China Overseas Land & Investment Ltd. HKD 116,000 297,340 0.05 China Pacifi c Insurance Group Co. Ltd. ‘H’ HKD 93,600 334,947 0.05 China Petroleum & Chemical Corp. ‘H’ HKD 602,000 411,266 0.06 China Resources Land Ltd. HKD 112,000 285,831 0.04 China Shenhua Energy Co. Ltd. ‘H’ HKD 41,000 79,936 0.01 China Unicom Hong Kong Ltd. HKD 226,000 294,087 0.05 CITIC Ltd. HKD 209,000 275,248 0.04 CNOOC Ltd. HKD 389,000 373,100 0.06 CSPC Pharmaceutical Group Ltd. HKD 214,000 273,671 0.04 Ctrip.com International Ltd., ADR USD 7,719 366,767 0.06 Fosun International Ltd. HKD 200,000 273,716 0.04 Geely Automobile Holdings Ltd. HKD 60,000 113,345 0.02 Haitong Securities Co. Ltd. ‘H’ HKD 209,200 296,163 0.05 Industrial & Commercial Bank
of China Ltd. ‘H’ HKD 1,319,000 779,767 0.12 JD.com, Inc., ADR USD 12,575 432,763 0.07 NetEase, Inc., ADR USD 1,466 386,809 0.06 New Oriental Education & Technology
Group, Inc., ADR USD 1,521 93,900 0.01 PetroChina Co. Ltd. ‘H’ HKD 596,000 319,583 0.05 Ping An Insurance Group Co.
of China Ltd. ‘H’ HKD 112,000 646,417 0.10
Global Balanced Income Fund
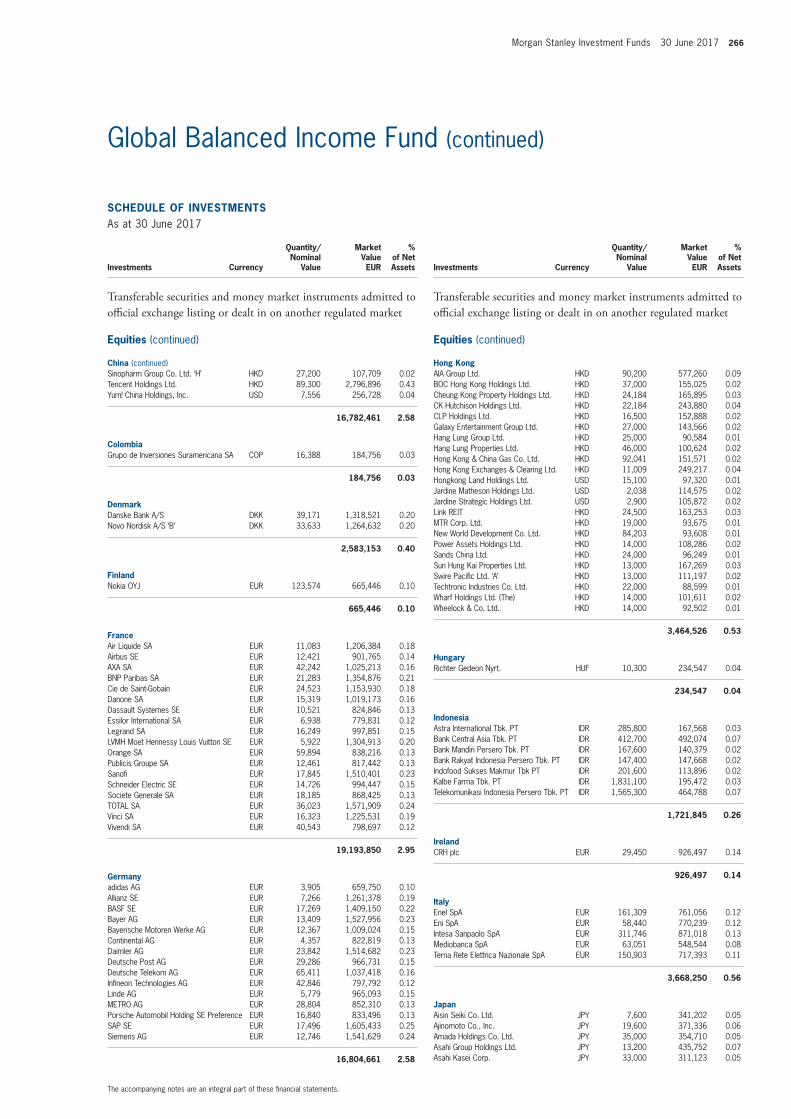
Morgan Stanley Investment Funds 30 June 2017 266
The accompanying notes are an integral part of these fi nancial statements.
Global Balanced Income Fund (continued)
SCHEDULE OF INVESTMENTSAs at 30 June 2017
Investments Currency
Quantity/Nominal
Value
Market Value EUR
% of Net Assets
Transferable securities and money market instruments admitted to offi cial exchange listing or dealt in on another regulated market
Equities (continued)
China (continued)Sinopharm Group Co. Ltd. ‘H’ HKD 27,200 107,709 0.02 Tencent Holdings Ltd. HKD 89,300 2,796,896 0.43 Yum! China Holdings, Inc. USD 7,556 256,728 0.04
16,782,461 2.58
ColombiaGrupo de Inversiones Suramericana SA COP 16,388 184,756 0.03
184,756 0.03
DenmarkDanske Bank A/S DKK 39,171 1,318,521 0.20 Novo Nordisk A/S ‘B’ DKK 33,633 1,264,632 0.20
2,583,153 0.40
FinlandNokia OYJ EUR 123,574 665,446 0.10
665,446 0.10
FranceAir Liquide SA EUR 11,083 1,206,384 0.18 Airbus SE EUR 12,421 901,765 0.14 AXA SA EUR 42,242 1,025,213 0.16 BNP Paribas SA EUR 21,283 1,354,876 0.21 Cie de Saint-Gobain EUR 24,523 1,153,930 0.18 Danone SA EUR 15,319 1,019,173 0.16 Dassault Systemes SE EUR 10,521 824,846 0.13 Essilor International SA EUR 6,938 779,831 0.12 Legrand SA EUR 16,249 997,851 0.15 LVMH Moet Hennessy Louis Vuitton SE EUR 5,922 1,304,913 0.20 Orange SA EUR 59,894 838,216 0.13 Publicis Groupe SA EUR 12,461 817,442 0.13 Sanofi EUR 17,845 1,510,401 0.23 Schneider Electric SE EUR 14,726 994,447 0.15 Societe Generale SA EUR 18,185 868,425 0.13 TOTAL SA EUR 36,023 1,571,909 0.24 Vinci SA EUR 16,323 1,225,531 0.19 Vivendi SA EUR 40,543 798,697 0.12
19,193,850 2.95
Germanyadidas AG EUR 3,905 659,750 0.10 Allianz SE EUR 7,266 1,261,378 0.19 BASF SE EUR 17,269 1,409,150 0.22 Bayer AG EUR 13,409 1,527,956 0.23 Bayerische Motoren Werke AG EUR 12,367 1,009,024 0.15 Continental AG EUR 4,357 822,819 0.13 Daimler AG EUR 23,842 1,514,682 0.23 Deutsche Post AG EUR 29,286 966,731 0.15 Deutsche Telekom AG EUR 65,411 1,037,418 0.16 Infi neon Technologies AG EUR 42,846 797,792 0.12 Linde AG EUR 5,779 965,093 0.15 METRO AG EUR 28,804 852,310 0.13 Porsche Automobil Holding SE Preference EUR 16,840 833,496 0.13 SAP SE EUR 17,496 1,605,433 0.25 Siemens AG EUR 12,746 1,541,629 0.24
16,804,661 2.58
SCHEDULE OF INVESTMENTSAs at 30 June 2017
Investments Currency
Quantity/Nominal
Value
Market Value EUR
% of Net Assets
Transferable securities and money market instruments admitted to offi cial exchange listing or dealt in on another regulated market
Equities (continued)
Hong KongAIA Group Ltd. HKD 90,200 577,260 0.09 BOC Hong Kong Holdings Ltd. HKD 37,000 155,025 0.02 Cheung Kong Property Holdings Ltd. HKD 24,184 165,895 0.03 CK Hutchison Holdings Ltd. HKD 22,184 243,880 0.04 CLP Holdings Ltd. HKD 16,500 152,888 0.02 Galaxy Entertainment Group Ltd. HKD 27,000 143,566 0.02 Hang Lung Group Ltd. HKD 25,000 90,584 0.01 Hang Lung Properties Ltd. HKD 46,000 100,624 0.02 Hong Kong & China Gas Co. Ltd. HKD 92,041 151,571 0.02 Hong Kong Exchanges & Clearing Ltd. HKD 11,009 249,217 0.04 Hongkong Land Holdings Ltd. USD 15,100 97,320 0.01 Jardine Matheson Holdings Ltd. USD 2,038 114,575 0.02 Jardine Strategic Holdings Ltd. USD 2,900 105,872 0.02 Link REIT HKD 24,500 163,253 0.03 MTR Corp. Ltd. HKD 19,000 93,675 0.01 New World Development Co. Ltd. HKD 84,203 93,608 0.01 Power Assets Holdings Ltd. HKD 14,000 108,286 0.02 Sands China Ltd. HKD 24,000 96,249 0.01 Sun Hung Kai Properties Ltd. HKD 13,000 167,269 0.03 Swire Pacifi c Ltd. ‘A’ HKD 13,000 111,197 0.02 Techtronic Industries Co. Ltd. HKD 22,000 88,599 0.01 Wharf Holdings Ltd. (The) HKD 14,000 101,611 0.02 Wheelock & Co. Ltd. HKD 14,000 92,502 0.01
3,464,526 0.53
HungaryRichter Gedeon Nyrt. HUF 10,300 234,547 0.04
234,547 0.04
IndonesiaAstra International Tbk. PT IDR 285,800 167,568 0.03 Bank Central Asia Tbk. PT IDR 412,700 492,074 0.07 Bank Mandiri Persero Tbk. PT IDR 167,600 140,379 0.02 Bank Rakyat Indonesia Persero Tbk. PT IDR 147,400 147,668 0.02 Indofood Sukses Makmur Tbk PT IDR 201,600 113,896 0.02 Kalbe Farma Tbk. PT IDR 1,831,100 195,472 0.03 Telekomunikasi Indonesia Persero Tbk. PT IDR 1,565,300 464,788 0.07
1,721,845 0.26
IrelandCRH plc EUR 29,450 926,497 0.14
926,497 0.14
ItalyEnel SpA EUR 161,309 761,056 0.12 Eni SpA EUR 58,440 770,239 0.12 Intesa Sanpaolo SpA EUR 311,746 871,018 0.13 Mediobanca SpA EUR 63,051 548,544 0.08 Terna Rete Elettrica Nazionale SpA EUR 150,903 717,393 0.11
3,668,250 0.56
JapanAisin Seiki Co. Ltd. JPY 7,600 341,202 0.05 Ajinomoto Co., Inc. JPY 19,600 371,336 0.06 Amada Holdings Co. Ltd. JPY 35,000 354,710 0.05 Asahi Group Holdings Ltd. JPY 13,200 435,752 0.07 Asahi Kasei Corp. JPY 33,000 311,123 0.05
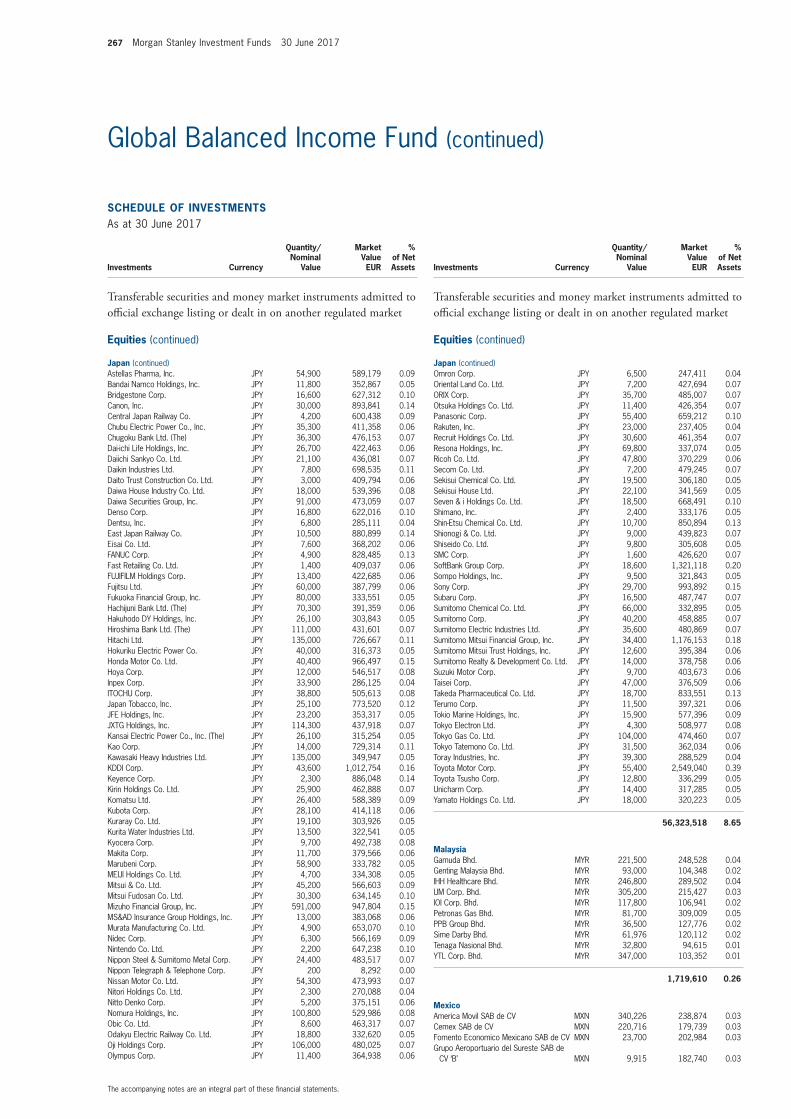
267 Morgan Stanley Investment Funds 30 June 2017
The accompanying notes are an integral part of these fi nancial statements.
Global Balanced Income Fund (continued)
SCHEDULE OF INVESTMENTSAs at 30 June 2017
Investments Currency
Quantity/Nominal
Value
Market Value EUR
% of Net Assets
Transferable securities and money market instruments admitted to offi cial exchange listing or dealt in on another regulated market
Equities (continued)
Japan (continued)Astellas Pharma, Inc. JPY 54,900 589,179 0.09 Bandai Namco Holdings, Inc. JPY 11,800 352,867 0.05 Bridgestone Corp. JPY 16,600 627,312 0.10 Canon, Inc. JPY 30,000 893,841 0.14 Central Japan Railway Co. JPY 4,200 600,438 0.09 Chubu Electric Power Co., Inc. JPY 35,300 411,358 0.06 Chugoku Bank Ltd. (The) JPY 36,300 476,153 0.07 Dai-ichi Life Holdings, Inc. JPY 26,700 422,463 0.06 Daiichi Sankyo Co. Ltd. JPY 21,100 436,081 0.07 Daikin Industries Ltd. JPY 7,800 698,535 0.11 Daito Trust Construction Co. Ltd. JPY 3,000 409,794 0.06 Daiwa House Industry Co. Ltd. JPY 18,000 539,396 0.08 Daiwa Securities Group, Inc. JPY 91,000 473,059 0.07 Denso Corp. JPY 16,800 622,016 0.10 Dentsu, Inc. JPY 6,800 285,111 0.04 East Japan Railway Co. JPY 10,500 880,899 0.14 Eisai Co. Ltd. JPY 7,600 368,202 0.06 FANUC Corp. JPY 4,900 828,485 0.13 Fast Retailing Co. Ltd. JPY 1,400 409,037 0.06 FUJIFILM Holdings Corp. JPY 13,400 422,685 0.06 Fujitsu Ltd. JPY 60,000 387,799 0.06 Fukuoka Financial Group, Inc. JPY 80,000 333,551 0.05 Hachijuni Bank Ltd. (The) JPY 70,300 391,359 0.06 Hakuhodo DY Holdings, Inc. JPY 26,100 303,843 0.05 Hiroshima Bank Ltd. (The) JPY 111,000 431,601 0.07 Hitachi Ltd. JPY 135,000 726,667 0.11 Hokuriku Electric Power Co. JPY 40,000 316,373 0.05 Honda Motor Co. Ltd. JPY 40,400 966,497 0.15 Hoya Corp. JPY 12,000 546,517 0.08 Inpex Corp. JPY 33,900 286,125 0.04 ITOCHU Corp. JPY 38,800 505,613 0.08 Japan Tobacco, Inc. JPY 25,100 773,520 0.12 JFE Holdings, Inc. JPY 23,200 353,317 0.05 JXTG Holdings, Inc. JPY 114,300 437,918 0.07 Kansai Electric Power Co., Inc. (The) JPY 26,100 315,254 0.05 Kao Corp. JPY 14,000 729,314 0.11 Kawasaki Heavy Industries Ltd. JPY 135,000 349,947 0.05 KDDI Corp. JPY 43,600 1,012,754 0.16 Keyence Corp. JPY 2,300 886,048 0.14 Kirin Holdings Co. Ltd. JPY 25,900 462,888 0.07 Komatsu Ltd. JPY 26,400 588,389 0.09 Kubota Corp. JPY 28,100 414,118 0.06 Kuraray Co. Ltd. JPY 19,100 303,926 0.05 Kurita Water Industries Ltd. JPY 13,500 322,541 0.05 Kyocera Corp. JPY 9,700 492,738 0.08 Makita Corp. JPY 11,700 379,566 0.06 Marubeni Corp. JPY 58,900 333,782 0.05 MEIJI Holdings Co. Ltd. JPY 4,700 334,308 0.05 Mitsui & Co. Ltd. JPY 45,200 566,603 0.09 Mitsui Fudosan Co. Ltd. JPY 30,300 634,145 0.10 Mizuho Financial Group, Inc. JPY 591,000 947,804 0.15 MS&AD Insurance Group Holdings, Inc. JPY 13,000 383,068 0.06 Murata Manufacturing Co. Ltd. JPY 4,900 653,070 0.10 Nidec Corp. JPY 6,300 566,169 0.09 Nintendo Co. Ltd. JPY 2,200 647,238 0.10 Nippon Steel & Sumitomo Metal Corp. JPY 24,400 483,517 0.07 Nippon Telegraph & Telephone Corp. JPY 200 8,292 0.00 Nissan Motor Co. Ltd. JPY 54,300 473,993 0.07 Nitori Holdings Co. Ltd. JPY 2,300 270,088 0.04 Nitto Denko Corp. JPY 5,200 375,151 0.06 Nomura Holdings, Inc. JPY 100,800 529,986 0.08 Obic Co. Ltd. JPY 8,600 463,317 0.07 Odakyu Electric Railway Co. Ltd. JPY 18,800 332,620 0.05 Oji Holdings Corp. JPY 106,000 480,025 0.07 Olympus Corp. JPY 11,400 364,938 0.06
SCHEDULE OF INVESTMENTSAs at 30 June 2017
Investments Currency
Quantity/Nominal
Value
Market Value EUR
% of Net Assets
Transferable securities and money market instruments admitted to offi cial exchange listing or dealt in on another regulated market
Equities (continued)
Japan (continued)Omron Corp. JPY 6,500 247,411 0.04 Oriental Land Co. Ltd. JPY 7,200 427,694 0.07 ORIX Corp. JPY 35,700 485,007 0.07 Otsuka Holdings Co. Ltd. JPY 11,400 426,354 0.07 Panasonic Corp. JPY 55,400 659,212 0.10 Rakuten, Inc. JPY 23,000 237,405 0.04 Recruit Holdings Co. Ltd. JPY 30,600 461,354 0.07 Resona Holdings, Inc. JPY 69,800 337,074 0.05 Ricoh Co. Ltd. JPY 47,800 370,229 0.06 Secom Co. Ltd. JPY 7,200 479,245 0.07 Sekisui Chemical Co. Ltd. JPY 19,500 306,180 0.05 Sekisui House Ltd. JPY 22,100 341,569 0.05 Seven & i Holdings Co. Ltd. JPY 18,500 668,491 0.10 Shimano, Inc. JPY 2,400 333,176 0.05 Shin-Etsu Chemical Co. Ltd. JPY 10,700 850,894 0.13 Shionogi & Co. Ltd. JPY 9,000 439,823 0.07 Shiseido Co. Ltd. JPY 9,800 305,608 0.05 SMC Corp. JPY 1,600 426,620 0.07 SoftBank Group Corp. JPY 18,600 1,321,118 0.20 Sompo Holdings, Inc. JPY 9,500 321,843 0.05 Sony Corp. JPY 29,700 993,892 0.15 Subaru Corp. JPY 16,500 487,747 0.07 Sumitomo Chemical Co. Ltd. JPY 66,000 332,895 0.05 Sumitomo Corp. JPY 40,200 458,885 0.07 Sumitomo Electric Industries Ltd. JPY 35,600 480,869 0.07 Sumitomo Mitsui Financial Group, Inc. JPY 34,400 1,176,153 0.18 Sumitomo Mitsui Trust Holdings, Inc. JPY 12,600 395,384 0.06 Sumitomo Realty & Development Co. Ltd. JPY 14,000 378,758 0.06 Suzuki Motor Corp. JPY 9,700 403,673 0.06 Taisei Corp. JPY 47,000 376,509 0.06 Takeda Pharmaceutical Co. Ltd. JPY 18,700 833,551 0.13 Terumo Corp. JPY 11,500 397,321 0.06 Tokio Marine Holdings, Inc. JPY 15,900 577,396 0.09 Tokyo Electron Ltd. JPY 4,300 508,977 0.08 Tokyo Gas Co. Ltd. JPY 104,000 474,460 0.07 Tokyo Tatemono Co. Ltd. JPY 31,500 362,034 0.06 Toray Industries, Inc. JPY 39,300 288,529 0.04 Toyota Motor Corp. JPY 55,400 2,549,040 0.39 Toyota Tsusho Corp. JPY 12,800 336,299 0.05 Unicharm Corp. JPY 14,400 317,285 0.05 Yamato Holdings Co. Ltd. JPY 18,000 320,223 0.05
56,323,518 8.65
MalaysiaGamuda Bhd. MYR 221,500 248,528 0.04 Genting Malaysia Bhd. MYR 93,000 104,348 0.02 IHH Healthcare Bhd. MYR 246,800 289,502 0.04 IJM Corp. Bhd. MYR 305,200 215,427 0.03 IOI Corp. Bhd. MYR 117,800 106,941 0.02 Petronas Gas Bhd. MYR 81,700 309,009 0.05 PPB Group Bhd. MYR 36,500 127,776 0.02 Sime Darby Bhd. MYR 61,976 120,112 0.02 Tenaga Nasional Bhd. MYR 32,800 94,615 0.01 YTL Corp. Bhd. MYR 347,000 103,352 0.01
1,719,610 0.26
MexicoAmerica Movil SAB de CV MXN 340,226 238,874 0.03 Cemex SAB de CV MXN 220,716 179,739 0.03 Fomento Economico Mexicano SAB de CV MXN 23,700 202,984 0.03 Grupo Aeroportuario del Sureste SAB de
CV ‘B’ MXN 9,915 182,740 0.03
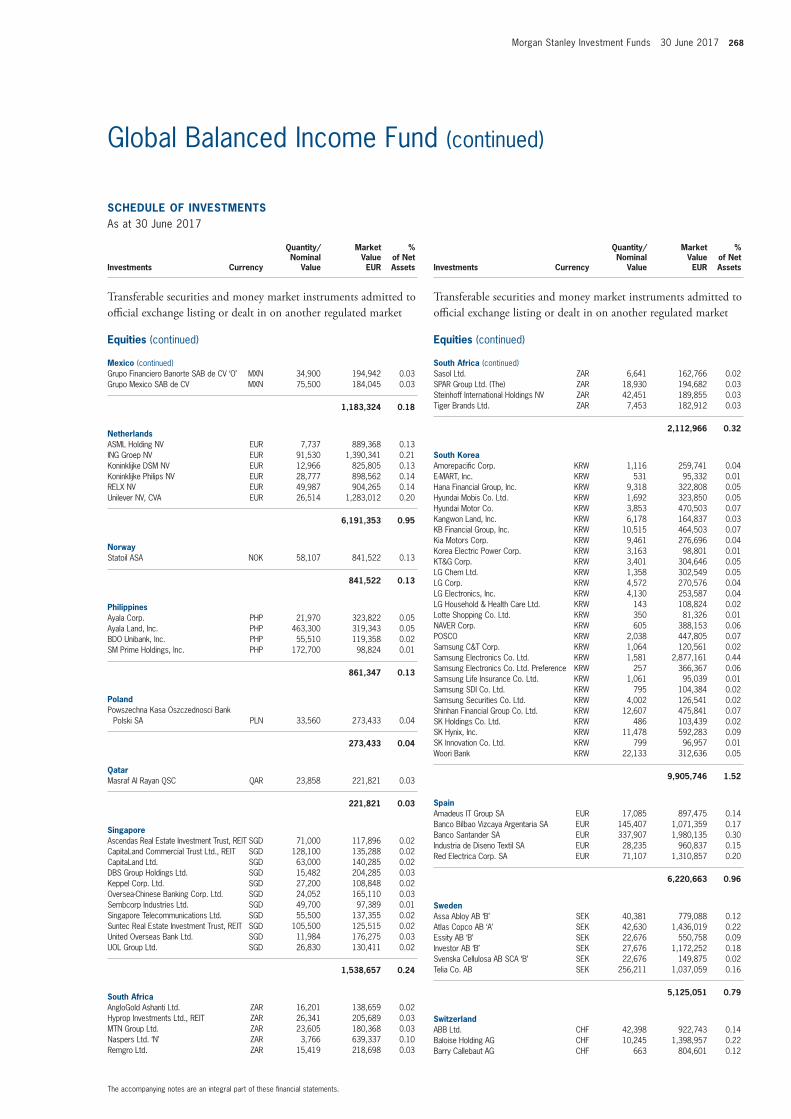
Morgan Stanley Investment Funds 30 June 2017 268
The accompanying notes are an integral part of these fi nancial statements.
Global Balanced Income Fund (continued)
SCHEDULE OF INVESTMENTSAs at 30 June 2017
Investments Currency
Quantity/Nominal
Value
Market Value EUR
% of Net Assets
Transferable securities and money market instruments admitted to offi cial exchange listing or dealt in on another regulated market
Equities (continued)
Mexico (continued)Grupo Financiero Banorte SAB de CV ‘O’ MXN 34,900 194,942 0.03 Grupo Mexico SAB de CV MXN 75,500 184,045 0.03
1,183,324 0.18
NetherlandsASML Holding NV EUR 7,737 889,368 0.13 ING Groep NV EUR 91,530 1,390,341 0.21 Koninklijke DSM NV EUR 12,966 825,805 0.13 Koninklijke Philips NV EUR 28,777 898,562 0.14 RELX NV EUR 49,987 904,265 0.14 Unilever NV, CVA EUR 26,514 1,283,012 0.20
6,191,353 0.95
NorwayStatoil ASA NOK 58,107 841,522 0.13
841,522 0.13
PhilippinesAyala Corp. PHP 21,970 323,822 0.05 Ayala Land, Inc. PHP 463,300 319,343 0.05 BDO Unibank, Inc. PHP 55,510 119,358 0.02 SM Prime Holdings, Inc. PHP 172,700 98,824 0.01
861,347 0.13
PolandPowszechna Kasa Oszczednosci Bank
Polski SA PLN 33,560 273,433 0.04
273,433 0.04
QatarMasraf Al Rayan QSC QAR 23,858 221,821 0.03
221,821 0.03
SingaporeAscendas Real Estate Investment Trust, REIT SGD 71,000 117,896 0.02 CapitaLand Commercial Trust Ltd., REIT SGD 128,100 135,288 0.02 CapitaLand Ltd. SGD 63,000 140,285 0.02 DBS Group Holdings Ltd. SGD 15,482 204,285 0.03 Keppel Corp. Ltd. SGD 27,200 108,848 0.02 Oversea-Chinese Banking Corp. Ltd. SGD 24,052 165,110 0.03 Sembcorp Industries Ltd. SGD 49,700 97,389 0.01 Singapore Telecommunications Ltd. SGD 55,500 137,355 0.02 Suntec Real Estate Investment Trust, REIT SGD 105,500 125,515 0.02 United Overseas Bank Ltd. SGD 11,984 176,275 0.03 UOL Group Ltd. SGD 26,830 130,411 0.02
1,538,657 0.24
South AfricaAngloGold Ashanti Ltd. ZAR 16,201 138,659 0.02 Hyprop Investments Ltd., REIT ZAR 26,341 205,689 0.03 MTN Group Ltd. ZAR 23,605 180,368 0.03 Naspers Ltd. ‘N’ ZAR 3,766 639,337 0.10 Remgro Ltd. ZAR 15,419 218,698 0.03
SCHEDULE OF INVESTMENTSAs at 30 June 2017
Investments Currency
Quantity/Nominal
Value
Market Value EUR
% of Net Assets
Transferable securities and money market instruments admitted to offi cial exchange listing or dealt in on another regulated market
Equities (continued)
South Africa (continued)Sasol Ltd. ZAR 6,641 162,766 0.02 SPAR Group Ltd. (The) ZAR 18,930 194,682 0.03 Steinhoff International Holdings NV ZAR 42,451 189,855 0.03 Tiger Brands Ltd. ZAR 7,453 182,912 0.03
2,112,966 0.32
South KoreaAmorepacifi c Corp. KRW 1,116 259,741 0.04 E-MART, Inc. KRW 531 95,332 0.01 Hana Financial Group, Inc. KRW 9,318 322,808 0.05 Hyundai Mobis Co. Ltd. KRW 1,692 323,850 0.05 Hyundai Motor Co. KRW 3,853 470,503 0.07 Kangwon Land, Inc. KRW 6,178 164,837 0.03 KB Financial Group, Inc. KRW 10,515 464,503 0.07 Kia Motors Corp. KRW 9,461 276,696 0.04 Korea Electric Power Corp. KRW 3,163 98,801 0.01 KT&G Corp. KRW 3,401 304,646 0.05 LG Chem Ltd. KRW 1,358 302,549 0.05 LG Corp. KRW 4,572 270,576 0.04 LG Electronics, Inc. KRW 4,130 253,587 0.04 LG Household & Health Care Ltd. KRW 143 108,824 0.02 Lotte Shopping Co. Ltd. KRW 350 81,326 0.01 NAVER Corp. KRW 605 388,153 0.06 POSCO KRW 2,038 447,805 0.07 Samsung C&T Corp. KRW 1,064 120,561 0.02 Samsung Electronics Co. Ltd. KRW 1,581 2,877,161 0.44 Samsung Electronics Co. Ltd. Preference KRW 257 366,367 0.06 Samsung Life Insurance Co. Ltd. KRW 1,061 95,039 0.01 Samsung SDI Co. Ltd. KRW 795 104,384 0.02 Samsung Securities Co. Ltd. KRW 4,002 126,541 0.02 Shinhan Financial Group Co. Ltd. KRW 12,607 475,841 0.07 SK Holdings Co. Ltd. KRW 486 103,439 0.02 SK Hynix, Inc. KRW 11,478 592,283 0.09 SK Innovation Co. Ltd. KRW 799 96,957 0.01 Woori Bank KRW 22,133 312,636 0.05
9,905,746 1.52
SpainAmadeus IT Group SA EUR 17,085 897,475 0.14 Banco Bilbao Vizcaya Argentaria SA EUR 145,407 1,071,359 0.17 Banco Santander SA EUR 337,907 1,980,135 0.30 Industria de Diseno Textil SA EUR 28,235 960,837 0.15 Red Electrica Corp. SA EUR 71,107 1,310,857 0.20
6,220,663 0.96
SwedenAssa Abloy AB ‘B’ SEK 40,381 779,088 0.12 Atlas Copco AB ‘A’ SEK 42,630 1,436,019 0.22 Essity AB ‘B’ SEK 22,676 550,758 0.09 Investor AB ‘B’ SEK 27,676 1,172,252 0.18 Svenska Cellulosa AB SCA ‘B’ SEK 22,676 149,875 0.02 Telia Co. AB SEK 256,211 1,037,059 0.16
5,125,051 0.79
SwitzerlandABB Ltd. CHF 42,398 922,743 0.14 Baloise Holding AG CHF 10,245 1,398,957 0.22 Barry Callebaut AG CHF 663 804,601 0.12
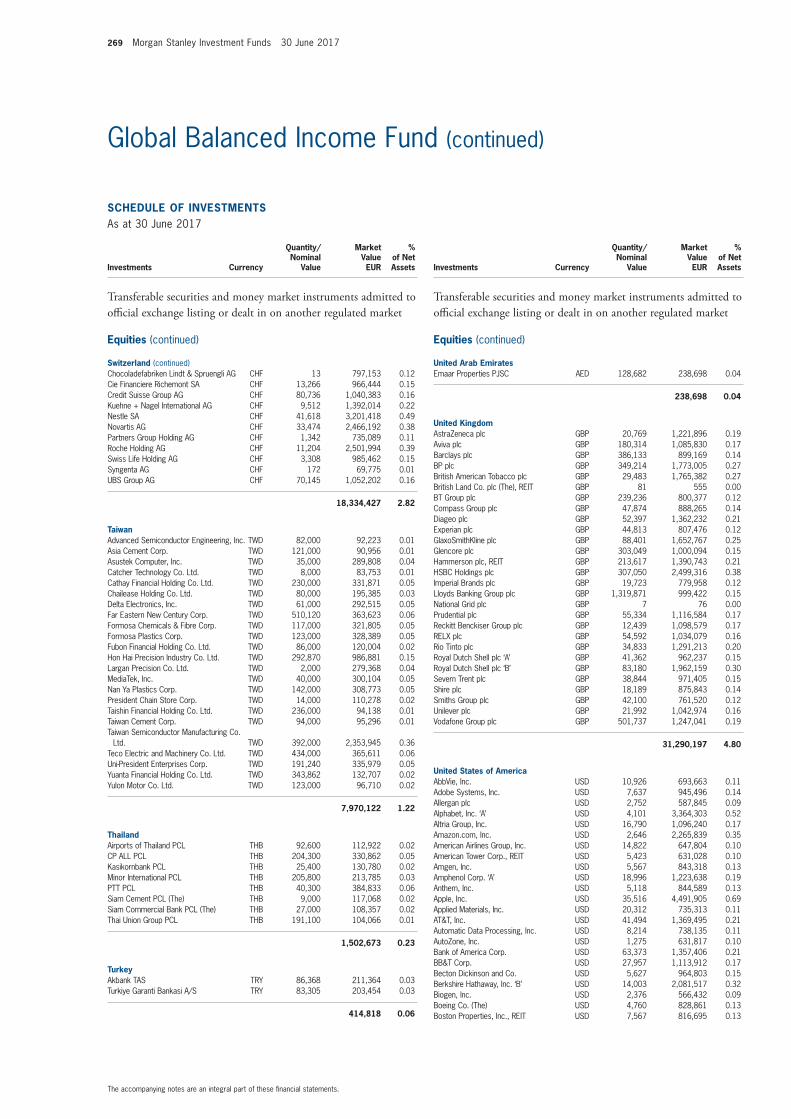
269 Morgan Stanley Investment Funds 30 June 2017
The accompanying notes are an integral part of these fi nancial statements.
Global Balanced Income Fund (continued)
SCHEDULE OF INVESTMENTSAs at 30 June 2017
Investments Currency
Quantity/Nominal
Value
Market Value EUR
% of Net Assets
Transferable securities and money market instruments admitted to offi cial exchange listing or dealt in on another regulated market
Equities (continued)
Switzerland (continued)Chocoladefabriken Lindt & Spruengli AG CHF 13 797,153 0.12 Cie Financiere Richemont SA CHF 13,266 966,444 0.15 Credit Suisse Group AG CHF 80,736 1,040,383 0.16 Kuehne + Nagel International AG CHF 9,512 1,392,014 0.22 Nestle SA CHF 41,618 3,201,418 0.49 Novartis AG CHF 33,474 2,466,192 0.38 Partners Group Holding AG CHF 1,342 735,089 0.11 Roche Holding AG CHF 11,204 2,501,994 0.39 Swiss Life Holding AG CHF 3,308 985,462 0.15 Syngenta AG CHF 172 69,775 0.01 UBS Group AG CHF 70,145 1,052,202 0.16
18,334,427 2.82
TaiwanAdvanced Semiconductor Engineering, Inc. TWD 82,000 92,223 0.01 Asia Cement Corp. TWD 121,000 90,956 0.01 Asustek Computer, Inc. TWD 35,000 289,808 0.04 Catcher Technology Co. Ltd. TWD 8,000 83,753 0.01 Cathay Financial Holding Co. Ltd. TWD 230,000 331,871 0.05 Chailease Holding Co. Ltd. TWD 80,000 195,385 0.03 Delta Electronics, Inc. TWD 61,000 292,515 0.05 Far Eastern New Century Corp. TWD 510,120 363,623 0.06 Formosa Chemicals & Fibre Corp. TWD 117,000 321,805 0.05 Formosa Plastics Corp. TWD 123,000 328,389 0.05 Fubon Financial Holding Co. Ltd. TWD 86,000 120,004 0.02 Hon Hai Precision Industry Co. Ltd. TWD 292,870 986,881 0.15 Largan Precision Co. Ltd. TWD 2,000 279,368 0.04 MediaTek, Inc. TWD 40,000 300,104 0.05 Nan Ya Plastics Corp. TWD 142,000 308,773 0.05 President Chain Store Corp. TWD 14,000 110,278 0.02 Taishin Financial Holding Co. Ltd. TWD 236,000 94,138 0.01 Taiwan Cement Corp. TWD 94,000 95,296 0.01 Taiwan Semiconductor Manufacturing Co.
Ltd. TWD 392,000 2,353,945 0.36 Teco Electric and Machinery Co. Ltd. TWD 434,000 365,611 0.06 Uni-President Enterprises Corp. TWD 191,240 335,979 0.05 Yuanta Financial Holding Co. Ltd. TWD 343,862 132,707 0.02 Yulon Motor Co. Ltd. TWD 123,000 96,710 0.02
7,970,122 1.22
ThailandAirports of Thailand PCL THB 92,600 112,922 0.02 CP ALL PCL THB 204,300 330,862 0.05 Kasikornbank PCL THB 25,400 130,780 0.02 Minor International PCL THB 205,800 213,785 0.03 PTT PCL THB 40,300 384,833 0.06 Siam Cement PCL (The) THB 9,000 117,068 0.02 Siam Commercial Bank PCL (The) THB 27,000 108,357 0.02 Thai Union Group PCL THB 191,100 104,066 0.01
1,502,673 0.23
TurkeyAkbank TAS TRY 86,368 211,364 0.03 Turkiye Garanti Bankasi A/S TRY 83,305 203,454 0.03
414,818 0.06
SCHEDULE OF INVESTMENTSAs at 30 June 2017
Investments Currency
Quantity/Nominal
Value
Market Value EUR
% of Net Assets
Transferable securities and money market instruments admitted to offi cial exchange listing or dealt in on another regulated market
Equities (continued)
United Arab EmiratesEmaar Properties PJSC AED 128,682 238,698 0.04
238,698 0.04
United KingdomAstraZeneca plc GBP 20,769 1,221,896 0.19 Aviva plc GBP 180,314 1,085,830 0.17 Barclays plc GBP 386,133 899,169 0.14 BP plc GBP 349,214 1,773,005 0.27 British American Tobacco plc GBP 29,483 1,765,382 0.27 British Land Co. plc (The), REIT GBP 81 555 0.00 BT Group plc GBP 239,236 800,377 0.12 Compass Group plc GBP 47,874 888,265 0.14 Diageo plc GBP 52,397 1,362,232 0.21 Experian plc GBP 44,813 807,476 0.12 GlaxoSmithKline plc GBP 88,401 1,652,767 0.25 Glencore plc GBP 303,049 1,000,094 0.15 Hammerson plc, REIT GBP 213,617 1,390,743 0.21 HSBC Holdings plc GBP 307,050 2,499,316 0.38 Imperial Brands plc GBP 19,723 779,958 0.12 Lloyds Banking Group plc GBP 1,319,871 999,422 0.15 National Grid plc GBP 7 76 0.00 Prudential plc GBP 55,334 1,116,584 0.17 Reckitt Benckiser Group plc GBP 12,439 1,098,579 0.17 RELX plc GBP 54,592 1,034,079 0.16 Rio Tinto plc GBP 34,833 1,291,213 0.20 Royal Dutch Shell plc ‘A’ GBP 41,362 962,237 0.15 Royal Dutch Shell plc ‘B’ GBP 83,180 1,962,159 0.30 Severn Trent plc GBP 38,844 971,405 0.15 Shire plc GBP 18,189 875,843 0.14 Smiths Group plc GBP 42,100 761,520 0.12 Unilever plc GBP 21,992 1,042,974 0.16 Vodafone Group plc GBP 501,737 1,247,041 0.19
31,290,197 4.80
United States of AmericaAbbVie, Inc. USD 10,926 693,663 0.11 Adobe Systems, Inc. USD 7,637 945,496 0.14 Allergan plc USD 2,752 587,845 0.09 Alphabet, Inc. ‘A’ USD 4,101 3,364,303 0.52 Altria Group, Inc. USD 16,790 1,096,240 0.17 Amazon.com, Inc. USD 2,646 2,265,839 0.35 American Airlines Group, Inc. USD 14,822 647,804 0.10 American Tower Corp., REIT USD 5,423 631,028 0.10 Amgen, Inc. USD 5,567 843,318 0.13 Amphenol Corp. ‘A’ USD 18,996 1,223,638 0.19 Anthem, Inc. USD 5,118 844,589 0.13 Apple, Inc. USD 35,516 4,491,905 0.69 Applied Materials, Inc. USD 20,312 735,313 0.11 AT&T, Inc. USD 41,494 1,369,495 0.21 Automatic Data Processing, Inc. USD 8,214 738,135 0.11 AutoZone, Inc. USD 1,275 631,817 0.10 Bank of America Corp. USD 63,373 1,357,406 0.21 BB&T Corp. USD 27,957 1,113,912 0.17 Becton Dickinson and Co. USD 5,627 964,803 0.15 Berkshire Hathaway, Inc. ‘B’ USD 14,003 2,081,517 0.32 Biogen, Inc. USD 2,376 566,432 0.09 Boeing Co. (The) USD 4,760 828,861 0.13 Boston Properties, Inc., REIT USD 7,567 816,695 0.13
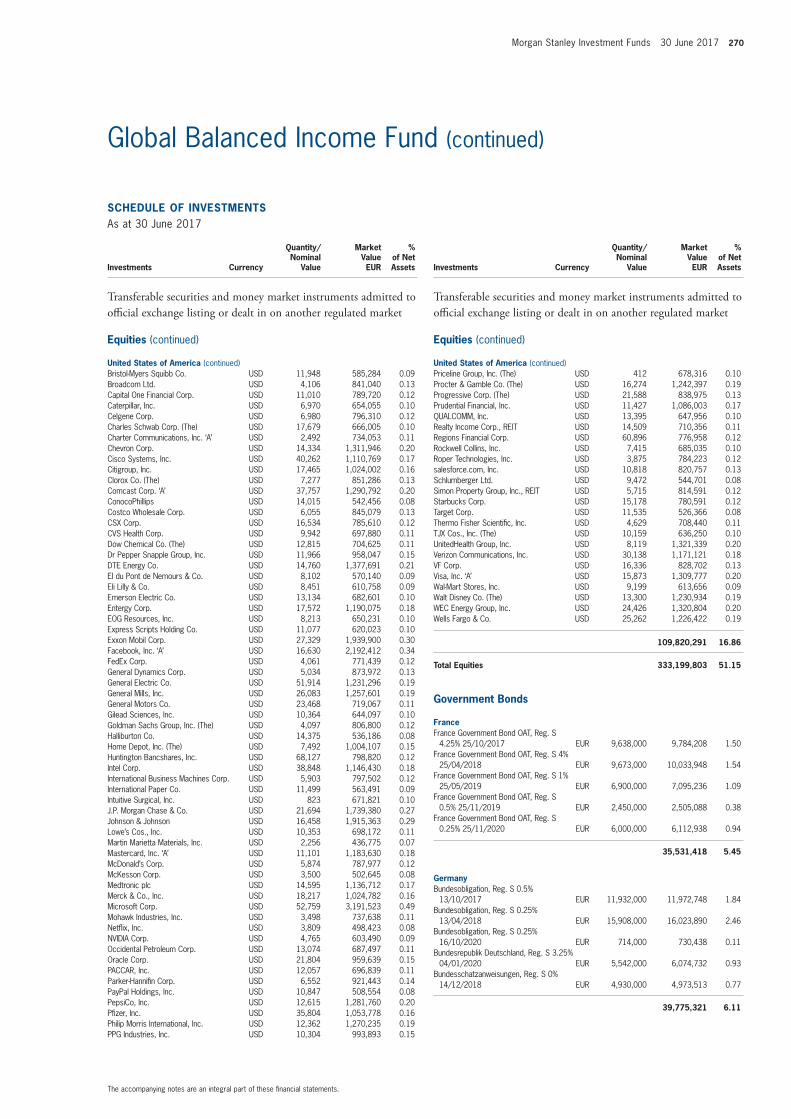
Morgan Stanley Investment Funds 30 June 2017 270
The accompanying notes are an integral part of these fi nancial statements.
Global Balanced Income Fund (continued)
SCHEDULE OF INVESTMENTSAs at 30 June 2017
Investments Currency
Quantity/Nominal
Value
Market Value EUR
% of Net Assets
Transferable securities and money market instruments admitted to offi cial exchange listing or dealt in on another regulated market
Equities (continued)
United States of America (continued)Bristol-Myers Squibb Co. USD 11,948 585,284 0.09 Broadcom Ltd. USD 4,106 841,040 0.13 Capital One Financial Corp. USD 11,010 789,720 0.12 Caterpillar, Inc. USD 6,970 654,055 0.10 Celgene Corp. USD 6,980 796,310 0.12 Charles Schwab Corp. (The) USD 17,679 666,005 0.10 Charter Communications, Inc. ‘A’ USD 2,492 734,053 0.11 Chevron Corp. USD 14,334 1,311,946 0.20 Cisco Systems, Inc. USD 40,262 1,110,769 0.17 Citigroup, Inc. USD 17,465 1,024,002 0.16 Clorox Co. (The) USD 7,277 851,286 0.13 Comcast Corp. ‘A’ USD 37,757 1,290,792 0.20 ConocoPhillips USD 14,015 542,456 0.08 Costco Wholesale Corp. USD 6,055 845,079 0.13 CSX Corp. USD 16,534 785,610 0.12 CVS Health Corp. USD 9,942 697,880 0.11 Dow Chemical Co. (The) USD 12,815 704,625 0.11 Dr Pepper Snapple Group, Inc. USD 11,966 958,047 0.15 DTE Energy Co. USD 14,760 1,377,691 0.21 EI du Pont de Nemours & Co. USD 8,102 570,140 0.09 Eli Lilly & Co. USD 8,451 610,758 0.09 Emerson Electric Co. USD 13,134 682,601 0.10 Entergy Corp. USD 17,572 1,190,075 0.18 EOG Resources, Inc. USD 8,213 650,231 0.10 Express Scripts Holding Co. USD 11,077 620,023 0.10 Exxon Mobil Corp. USD 27,329 1,939,900 0.30 Facebook, Inc. ‘A’ USD 16,630 2,192,412 0.34 FedEx Corp. USD 4,061 771,439 0.12 General Dynamics Corp. USD 5,034 873,972 0.13 General Electric Co. USD 51,914 1,231,296 0.19 General Mills, Inc. USD 26,083 1,257,601 0.19 General Motors Co. USD 23,468 719,067 0.11 Gilead Sciences, Inc. USD 10,364 644,097 0.10 Goldman Sachs Group, Inc. (The) USD 4,097 806,800 0.12 Halliburton Co. USD 14,375 536,186 0.08 Home Depot, Inc. (The) USD 7,492 1,004,107 0.15 Huntington Bancshares, Inc. USD 68,127 798,820 0.12 Intel Corp. USD 38,848 1,146,430 0.18 International Business Machines Corp. USD 5,903 797,502 0.12 International Paper Co. USD 11,499 563,491 0.09 Intuitive Surgical, Inc. USD 823 671,821 0.10 J.P. Morgan Chase & Co. USD 21,694 1,739,380 0.27 Johnson & Johnson USD 16,458 1,915,363 0.29 Lowe’s Cos., Inc. USD 10,353 698,172 0.11 Martin Marietta Materials, Inc. USD 2,256 436,775 0.07 Mastercard, Inc. ‘A’ USD 11,101 1,183,630 0.18 McDonald’s Corp. USD 5,874 787,977 0.12 McKesson Corp. USD 3,500 502,645 0.08 Medtronic plc USD 14,595 1,136,712 0.17 Merck & Co., Inc. USD 18,217 1,024,782 0.16 Microsoft Corp. USD 52,759 3,191,523 0.49 Mohawk Industries, Inc. USD 3,498 737,638 0.11 Netfl ix, Inc. USD 3,809 498,423 0.08 NVIDIA Corp. USD 4,765 603,490 0.09 Occidental Petroleum Corp. USD 13,074 687,497 0.11 Oracle Corp. USD 21,804 959,639 0.15 PACCAR, Inc. USD 12,057 696,839 0.11 Parker-Hannifi n Corp. USD 6,552 921,443 0.14 PayPal Holdings, Inc. USD 10,847 508,554 0.08 PepsiCo, Inc. USD 12,615 1,281,760 0.20 Pfi zer, Inc. USD 35,804 1,053,778 0.16 Philip Morris International, Inc. USD 12,362 1,270,235 0.19 PPG Industries, Inc. USD 10,304 993,893 0.15
SCHEDULE OF INVESTMENTSAs at 30 June 2017
Investments Currency
Quantity/Nominal
Value
Market Value EUR
% of Net Assets
Transferable securities and money market instruments admitted to offi cial exchange listing or dealt in on another regulated market
Equities (continued)
United States of America (continued)Priceline Group, Inc. (The) USD 412 678,316 0.10 Procter & Gamble Co. (The) USD 16,274 1,242,397 0.19 Progressive Corp. (The) USD 21,588 838,975 0.13 Prudential Financial, Inc. USD 11,427 1,086,003 0.17 QUALCOMM, Inc. USD 13,395 647,956 0.10 Realty Income Corp., REIT USD 14,509 710,356 0.11 Regions Financial Corp. USD 60,896 776,958 0.12 Rockwell Collins, Inc. USD 7,415 685,035 0.10 Roper Technologies, Inc. USD 3,875 784,223 0.12 salesforce.com, Inc. USD 10,818 820,757 0.13 Schlumberger Ltd. USD 9,472 544,701 0.08 Simon Property Group, Inc., REIT USD 5,715 814,591 0.12 Starbucks Corp. USD 15,178 780,591 0.12 Target Corp. USD 11,535 526,366 0.08 Thermo Fisher Scientifi c, Inc. USD 4,629 708,440 0.11 TJX Cos., Inc. (The) USD 10,159 636,250 0.10 UnitedHealth Group, Inc. USD 8,119 1,321,339 0.20 Verizon Communications, Inc. USD 30,138 1,171,121 0.18 VF Corp. USD 16,336 828,702 0.13 Visa, Inc. ‘A’ USD 15,873 1,309,777 0.20 Wal-Mart Stores, Inc. USD 9,199 613,656 0.09 Walt Disney Co. (The) USD 13,300 1,230,934 0.19 WEC Energy Group, Inc. USD 24,426 1,320,804 0.20 Wells Fargo & Co. USD 25,262 1,226,422 0.19
109,820,291 16.86
Total Equities 333,199,803 51.15
Government Bonds
FranceFrance Government Bond OAT, Reg. S
4.25% 25/10/2017 EUR 9,638,000 9,784,208 1.50 France Government Bond OAT, Reg. S 4%
25/04/2018 EUR 9,673,000 10,033,948 1.54 France Government Bond OAT, Reg. S 1%
25/05/2019 EUR 6,900,000 7,095,236 1.09 France Government Bond OAT, Reg. S
0.5% 25/11/2019 EUR 2,450,000 2,505,088 0.38 France Government Bond OAT, Reg. S
0.25% 25/11/2020 EUR 6,000,000 6,112,938 0.94
35,531,418 5.45
GermanyBundesobligation, Reg. S 0.5%
13/10/2017 EUR 11,932,000 11,972,748 1.84 Bundesobligation, Reg. S 0.25%
13/04/2018 EUR 15,908,000 16,023,890 2.46 Bundesobligation, Reg. S 0.25%
16/10/2020 EUR 714,000 730,438 0.11 Bundesrepublik Deutschland, Reg. S 3.25%
04/01/2020 EUR 5,542,000 6,074,732 0.93 Bundesschatzanweisungen, Reg. S 0%
14/12/2018 EUR 4,930,000 4,973,513 0.77
39,775,321 6.11
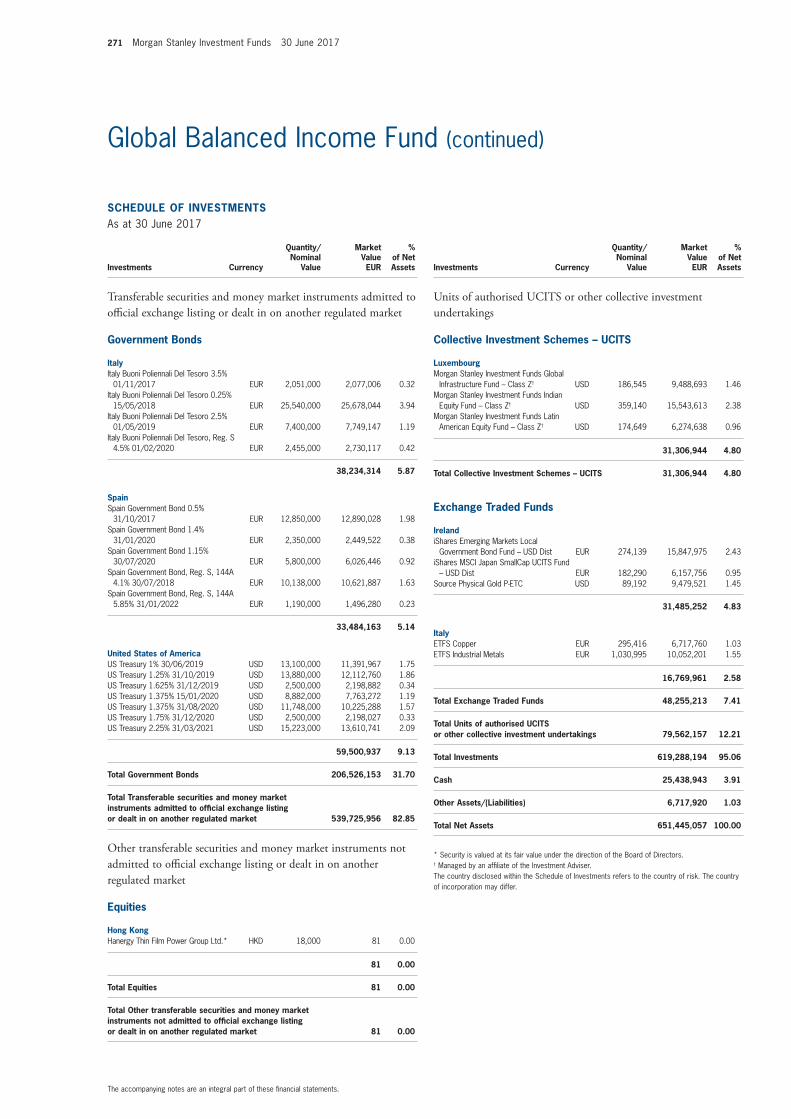
271 Morgan Stanley Investment Funds 30 June 2017
The accompanying notes are an integral part of these fi nancial statements.
Global Balanced Income Fund (continued)
SCHEDULE OF INVESTMENTSAs at 30 June 2017
Investments Currency
Quantity/Nominal
Value
Market Value EUR
% of Net Assets
Transferable securities and money market instruments admitted to offi cial exchange listing or dealt in on another regulated market
Government Bonds
ItalyItaly Buoni Poliennali Del Tesoro 3.5%
01/11/2017 EUR 2,051,000 2,077,006 0.32 Italy Buoni Poliennali Del Tesoro 0.25%
15/05/2018 EUR 25,540,000 25,678,044 3.94 Italy Buoni Poliennali Del Tesoro 2.5%
01/05/2019 EUR 7,400,000 7,749,147 1.19 Italy Buoni Poliennali Del Tesoro, Reg. S
4.5% 01/02/2020 EUR 2,455,000 2,730,117 0.42
38,234,314 5.87
SpainSpain Government Bond 0.5%
31/10/2017 EUR 12,850,000 12,890,028 1.98 Spain Government Bond 1.4%
31/01/2020 EUR 2,350,000 2,449,522 0.38 Spain Government Bond 1.15%
30/07/2020 EUR 5,800,000 6,026,446 0.92 Spain Government Bond, Reg. S, 144A
4.1% 30/07/2018 EUR 10,138,000 10,621,887 1.63 Spain Government Bond, Reg. S, 144A
5.85% 31/01/2022 EUR 1,190,000 1,496,280 0.23
33,484,163 5.14
United States of AmericaUS Treasury 1% 30/06/2019 USD 13,100,000 11,391,967 1.75 US Treasury 1.25% 31/10/2019 USD 13,880,000 12,112,760 1.86 US Treasury 1.625% 31/12/2019 USD 2,500,000 2,198,882 0.34 US Treasury 1.375% 15/01/2020 USD 8,882,000 7,763,272 1.19 US Treasury 1.375% 31/08/2020 USD 11,748,000 10,225,288 1.57 US Treasury 1.75% 31/12/2020 USD 2,500,000 2,198,027 0.33 US Treasury 2.25% 31/03/2021 USD 15,223,000 13,610,741 2.09
59,500,937 9.13
Total Government Bonds 206,526,153 31.70
Total Transferable securities and money market instruments admitted to offi cial exchange listing or dealt in on another regulated market 539,725,956 82.85
Other transferable securities and money market instruments not admitted to offi cial exchange listing or dealt in on another regulated market
Equities
Hong KongHanergy Thin Film Power Group Ltd.* HKD 18,000 81 0.00
81 0.00
Total Equities 81 0.00
Total Other transferable securities and money market instruments not admitted to offi cial exchange listing or dealt in on another regulated market 81 0.00
SCHEDULE OF INVESTMENTSAs at 30 June 2017
Investments Currency
Quantity/Nominal
Value
Market Value EUR
% of Net Assets
Units of authorised UCITS or other collective investment undertakings
Collective Investment Schemes – UCITS
LuxembourgMorgan Stanley Investment Funds Global
Infrastructure Fund – Class Z† USD 186,545 9,488,693 1.46 Morgan Stanley Investment Funds Indian
Equity Fund – Class Z† USD 359,140 15,543,613 2.38 Morgan Stanley Investment Funds Latin
American Equity Fund – Class Z† USD 174,649 6,274,638 0.96
31,306,944 4.80
Total Collective Investment Schemes – UCITS 31,306,944 4.80
Exchange Traded Funds
IrelandiShares Emerging Markets Local
Government Bond Fund – USD Dist EUR 274,139 15,847,975 2.43 iShares MSCI Japan SmallCap UCITS Fund
– USD Dist EUR 182,290 6,157,756 0.95 Source Physical Gold P-ETC USD 89,192 9,479,521 1.45
31,485,252 4.83
ItalyETFS Copper EUR 295,416 6,717,760 1.03 ETFS Industrial Metals EUR 1,030,995 10,052,201 1.55
16,769,961 2.58
Total Exchange Traded Funds 48,255,213 7.41
Total Units of authorised UCITS or other collective investment undertakings 79,562,157 12.21
Total Investments 619,288,194 95.06
Cash 25,438,943 3.91
Other Assets/(Liabilities) 6,717,920 1.03
Total Net Assets 651,445,057 100.00
* Security is valued at its fair value under the direction of the Board of Directors.† Managed by an affi liate of the Investment Adviser.The country disclosed within the Schedule of Investments refers to the country of risk. The country of incorporation may differ.
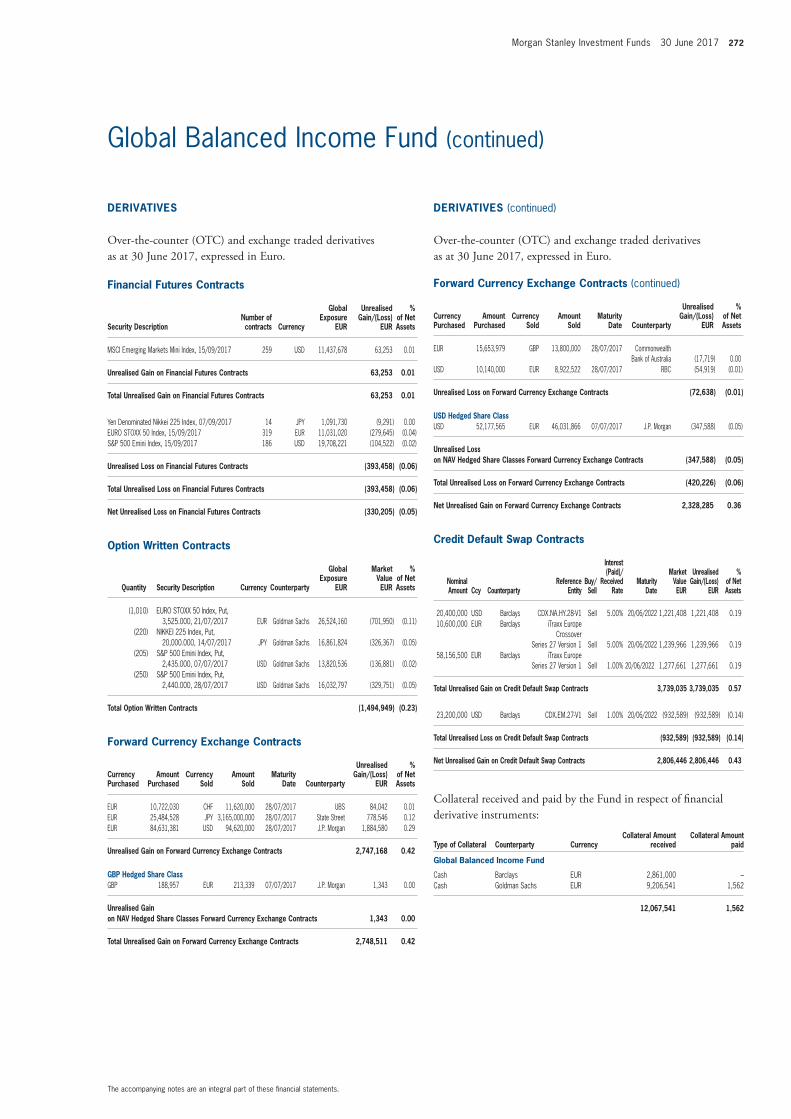
Morgan Stanley Investment Funds 30 June 2017 272
The accompanying notes are an integral part of these fi nancial statements.
Global Balanced Income Fund (continued)
Financial Futures Contracts
Security DescriptionNumber of contracts Currency
Global Exposure
EUR
Unrealised Gain/(Loss)
EUR
% of Net Assets
MSCI Emerging Markets Mini Index, 15/09/2017 259 USD 11,437,678 63,253 0.01
Unrealised Gain on Financial Futures Contracts 63,253 0.01
Total Unrealised Gain on Financial Futures Contracts 63,253 0.01
Yen Denominated Nikkei 225 Index, 07/09/2017 14 JPY 1,091,730 (9,291) 0.00 EURO STOXX 50 Index, 15/09/2017 319 EUR 11,031,020 (279,645) (0.04) S&P 500 Emini Index, 15/09/2017 186 USD 19,708,221 (104,522) (0.02)
Unrealised Loss on Financial Futures Contracts (393,458) (0.06)
Total Unrealised Loss on Financial Futures Contracts (393,458) (0.06)
Net Unrealised Loss on Financial Futures Contracts (330,205) (0.05)
Option Written Contracts
Quantity Security Description Currency Counterparty
Global Exposure
EUR
Market Value EUR
% of Net Assets
(1,010) EURO STOXX 50 Index, Put, 3,525.000, 21/07/2017 EUR Goldman Sachs 26,524,160 (701,950) (0.11)
(220) NIKKEI 225 Index, Put, 20,000.000, 14/07/2017 JPY Goldman Sachs 16,861,824 (326,367) (0.05)
(205) S&P 500 Emini Index, Put, 2,435.000, 07/07/2017 USD Goldman Sachs 13,820,536 (136,881) (0.02)
(250) S&P 500 Emini Index, Put, 2,440.000, 28/07/2017 USD Goldman Sachs 16,032,797 (329,751) (0.05)
Total Option Written Contracts (1,494,949) (0.23)
Forward Currency Exchange Contracts (continued)
Currency Purchased
Amount Purchased
Currency Sold
Amount Sold
Maturity Date Counterparty
Unrealised Gain/(Loss)
EUR
% of Net Assets
EUR 10,722,030 CHF 11,620,000 28/07/2017 UBS 84,042 0.01 EUR 25,484,528 JPY 3,165,000,000 28/07/2017 State Street 778,546 0.12 EUR 84,631,381 USD 94,620,000 28/07/2017 J.P. Morgan 1,884,580 0.29
Unrealised Gain on Forward Currency Exchange Contracts 2,747,168 0.42
GBP Hedged Share ClassGBP 188,957 EUR 213,339 07/07/2017 J.P. Morgan 1,343 0.00
Unrealised Gain on NAV Hedged Share Classes Forward Currency Exchange Contracts 1,343 0.00
Total Unrealised Gain on Forward Currency Exchange Contracts 2,748,511 0.42
Forward Currency Exchange Contracts (continued)
Currency Purchased
Amount Purchased
Currency Sold
Amount Sold
Maturity Date Counterparty
Unrealised Gain/(Loss)
EUR
% of Net Assets
EUR 15,653,979 GBP 13,800,000 28/07/2017 Commonwealth Bank of Australia (17,719) 0.00
USD 10,140,000 EUR 8,922,522 28/07/2017 RBC (54,919) (0.01)
Unrealised Loss on Forward Currency Exchange Contracts (72,638) (0.01)
USD Hedged Share ClassUSD 52,177,565 EUR 46,031,866 07/07/2017 J.P. Morgan (347,588) (0.05)
Unrealised Loss on NAV Hedged Share Classes Forward Currency Exchange Contracts (347,588) (0.05)
Total Unrealised Loss on Forward Currency Exchange Contracts (420,226) (0.06)
Net Unrealised Gain on Forward Currency Exchange Contracts 2,328,285 0.36
Credit Default Swap Contracts
Nominal Amount Ccy Counterparty
Reference Entity
Buy/Sell
Interest (Paid)/
Received Rate
Maturity Date
Market Value EUR
Unrealised Gain/(Loss)
EUR
% of Net Assets
20,400,000 USD Barclays CDX.NA.HY.28-V1 Sell 5.00% 20/06/2022 1,221,408 1,221,408 0.19 10,600,000 EUR Barclays iTraxx Europe
Crossover Series 27 Version 1 Sell 5.00% 20/06/2022 1,239,966 1,239,966 0.19
58,156,500 EUR Barclays iTraxx Europe Series 27 Version 1 Sell 1.00% 20/06/2022 1,277,661 1,277,661 0.19
Total Unrealised Gain on Credit Default Swap Contracts 3,739,035 3,739,035 0.57
23,200,000 USD Barclays CDX.EM.27-V1 Sell 1.00% 20/06/2022 (932,589) (932,589) (0.14)
Total Unrealised Loss on Credit Default Swap Contracts (932,589) (932,589) (0.14)
Net Unrealised Gain on Credit Default Swap Contracts 2,806,446 2,806,446 0.43
Collateral received and paid by the Fund in respect of fi nancial derivative instruments:
Type of Collateral Counterparty CurrencyCollateral Amount
receivedCollateral Amount
paid
Global Balanced Income Fund
Cash Barclays EUR 2,861,000 –Cash Goldman Sachs EUR 9,206,541 1,562
12,067,541 1,562
DERIVATIVES
Over-the-counter (OTC) and exchange traded derivatives as at 30 June 2017, expressed in Euro.
DERIVATIVES (continued)
Over-the-counter (OTC) and exchange traded derivatives as at 30 June 2017, expressed in Euro.
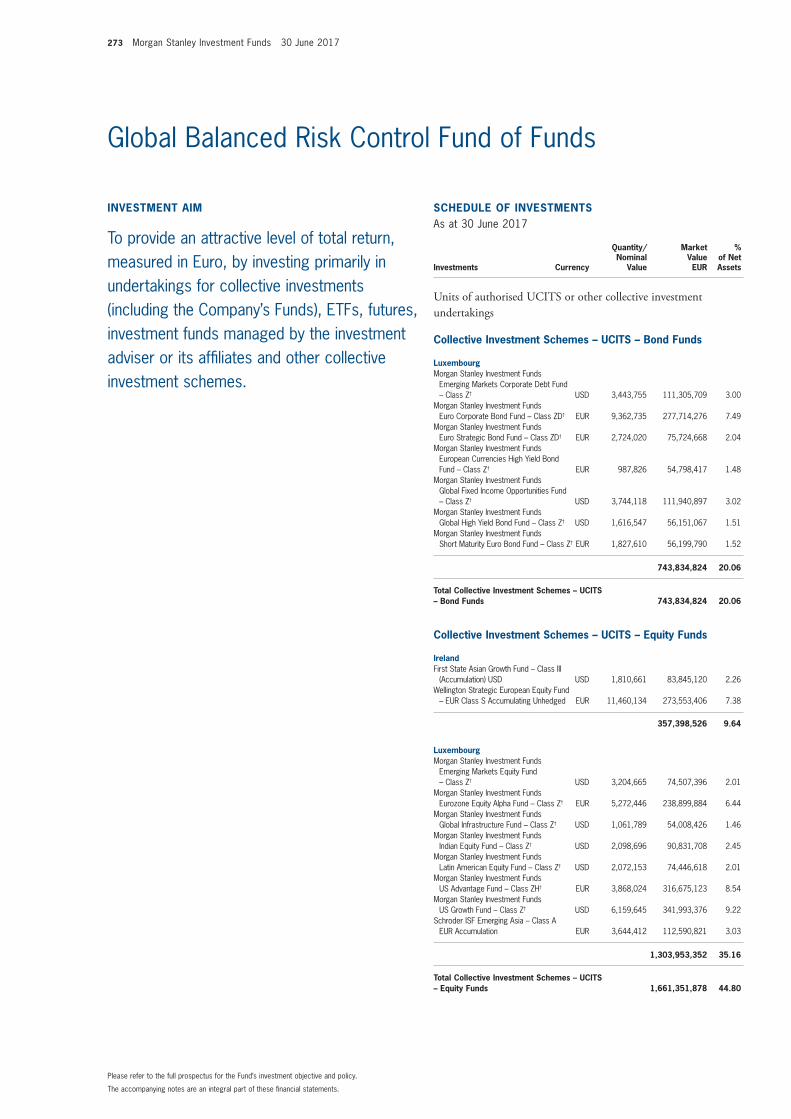
273 Morgan Stanley Investment Funds 30 June 2017
The accompanying notes are an integral part of these fi nancial statements.
Please refer to the full prospectus for the Fund’s investment objective and policy.
INVESTMENT AIM
To provide an attractive level of total return, measured in Euro, by investing primarily in undertakings for collective investments (including the Company’s Funds), ETFs, futures, investment funds managed by the investment adviser or its affi liates and other collective investment schemes.
SCHEDULE OF INVESTMENTSAs at 30 June 2017
Investments Currency
Quantity/Nominal
Value
Market Value EUR
% of Net Assets
Units of authorised UCITS or other collective investment undertakings
Collective Investment Schemes – UCITS – Bond Funds
LuxembourgMorgan Stanley Investment Funds
Emerging Markets Corporate Debt Fund – Class Z† USD 3,443,755 111,305,709 3.00
Morgan Stanley Investment Funds Euro Corporate Bond Fund – Class ZD† EUR 9,362,735 277,714,276 7.49
Morgan Stanley Investment Funds Euro Strategic Bond Fund – Class ZD† EUR 2,724,020 75,724,668 2.04
Morgan Stanley Investment Funds European Currencies High Yield Bond Fund – Class Z† EUR 987,826 54,798,417 1.48
Morgan Stanley Investment Funds Global Fixed Income Opportunities Fund – Class Z† USD 3,744,118 111,940,897 3.02
Morgan Stanley Investment Funds Global High Yield Bond Fund – Class Z† USD 1,616,547 56,151,067 1.51
Morgan Stanley Investment Funds Short Maturity Euro Bond Fund – Class Z† EUR 1,827,610 56,199,790 1.52
743,834,824 20.06
Total Collective Investment Schemes – UCITS – Bond Funds 743,834,824 20.06
Collective Investment Schemes – UCITS – Equity Funds
IrelandFirst State Asian Growth Fund – Class III
(Accumulation) USD USD 1,810,661 83,845,120 2.26 Wellington Strategic European Equity Fund
– EUR Class S Accumulating Unhedged EUR 11,460,134 273,553,406 7.38
357,398,526 9.64
LuxembourgMorgan Stanley Investment Funds
Emerging Markets Equity Fund – Class Z† USD 3,204,665 74,507,396 2.01
Morgan Stanley Investment Funds Eurozone Equity Alpha Fund – Class Z† EUR 5,272,446 238,899,884 6.44
Morgan Stanley Investment Funds Global Infrastructure Fund – Class Z† USD 1,061,789 54,008,426 1.46
Morgan Stanley Investment Funds Indian Equity Fund – Class Z† USD 2,098,696 90,831,708 2.45
Morgan Stanley Investment Funds Latin American Equity Fund – Class Z† USD 2,072,153 74,446,618 2.01
Morgan Stanley Investment Funds US Advantage Fund – Class ZH† EUR 3,868,024 316,675,123 8.54
Morgan Stanley Investment Funds US Growth Fund – Class Z† USD 6,159,645 341,993,376 9.22
Schroder ISF Emerging Asia – Class A EUR Accumulation EUR 3,644,412 112,590,821 3.03
1,303,953,352 35.16
Total Collective Investment Schemes – UCITS – Equity Funds 1,661,351,878 44.80
Global Balanced Risk Control Fund of Funds
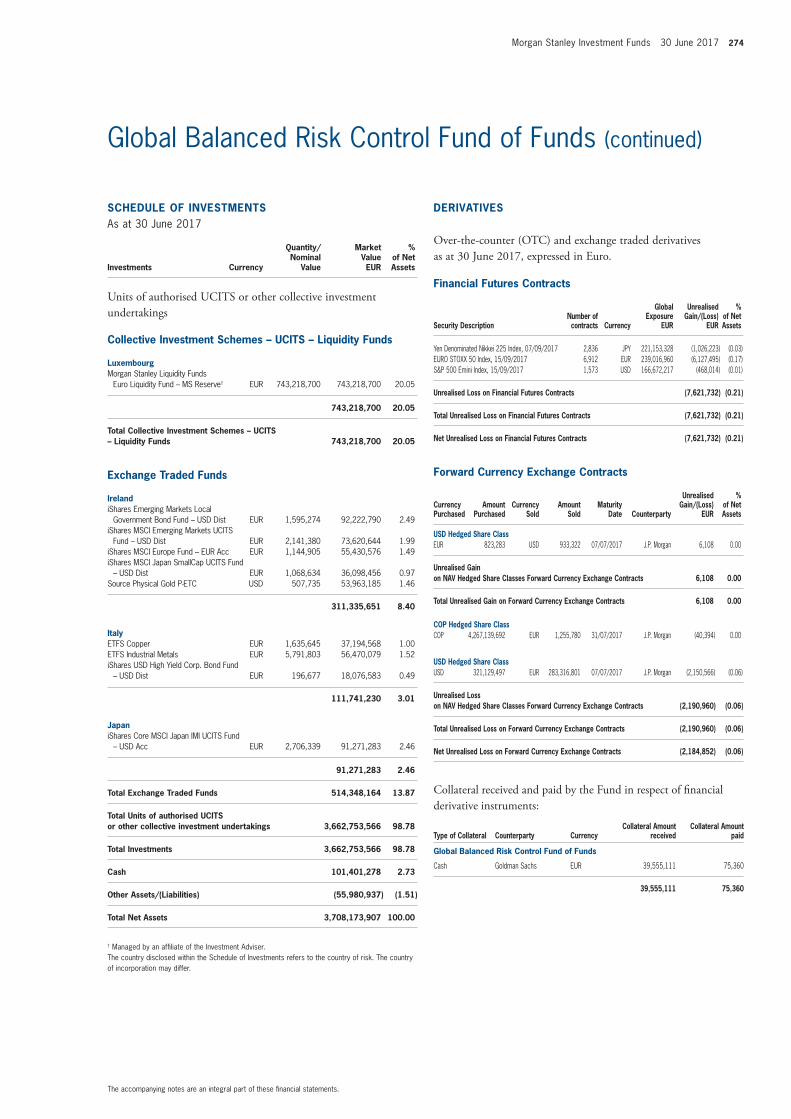
Morgan Stanley Investment Funds 30 June 2017 274
The accompanying notes are an integral part of these fi nancial statements.
Global Balanced Risk Control Fund of Funds (continued)
SCHEDULE OF INVESTMENTSAs at 30 June 2017
Investments Currency
Quantity/Nominal
Value
Market Value EUR
% of Net Assets
Units of authorised UCITS or other collective investment undertakings
Collective Investment Schemes – UCITS – Liquidity Funds
LuxembourgMorgan Stanley Liquidity Funds
Euro Liquidity Fund – MS Reserve† EUR 743,218,700 743,218,700 20.05
743,218,700 20.05
Total Collective Investment Schemes – UCITS – Liquidity Funds 743,218,700 20.05
Exchange Traded Funds
IrelandiShares Emerging Markets Local
Government Bond Fund – USD Dist EUR 1,595,274 92,222,790 2.49 iShares MSCI Emerging Markets UCITS
Fund – USD Dist EUR 2,141,380 73,620,644 1.99 iShares MSCI Europe Fund – EUR Acc EUR 1,144,905 55,430,576 1.49 iShares MSCI Japan SmallCap UCITS Fund
– USD Dist EUR 1,068,634 36,098,456 0.97 Source Physical Gold P-ETC USD 507,735 53,963,185 1.46
311,335,651 8.40
ItalyETFS Copper EUR 1,635,645 37,194,568 1.00 ETFS Industrial Metals EUR 5,791,803 56,470,079 1.52 iShares USD High Yield Corp. Bond Fund
– USD Dist EUR 196,677 18,076,583 0.49
111,741,230 3.01
JapaniShares Core MSCI Japan IMI UCITS Fund
– USD Acc EUR 2,706,339 91,271,283 2.46
91,271,283 2.46
Total Exchange Traded Funds 514,348,164 13.87
Total Units of authorised UCITS or other collective investment undertakings 3,662,753,566 98.78
Total Investments 3,662,753,566 98.78
Cash 101,401,278 2.73
Other Assets/(Liabilities) (55,980,937) (1.51)
Total Net Assets 3,708,173,907 100.00
† Managed by an affi liate of the Investment Adviser.The country disclosed within the Schedule of Investments refers to the country of risk. The country of incorporation may differ.
Financial Futures Contracts
Security DescriptionNumber of contracts Currency
Global Exposure
EUR
Unrealised Gain/(Loss)
EUR
% of Net Assets
Yen Denominated Nikkei 225 Index, 07/09/2017 2,836 JPY 221,153,328 (1,026,223) (0.03) EURO STOXX 50 Index, 15/09/2017 6,912 EUR 239,016,960 (6,127,495) (0.17) S&P 500 Emini Index, 15/09/2017 1,573 USD 166,672,217 (468,014) (0.01)
Unrealised Loss on Financial Futures Contracts (7,621,732) (0.21)
Total Unrealised Loss on Financial Futures Contracts (7,621,732) (0.21)
Net Unrealised Loss on Financial Futures Contracts (7,621,732) (0.21)
Forward Currency Exchange Contracts
Currency Purchased
Amount Purchased
Currency Sold
Amount Sold
Maturity Date Counterparty
Unrealised Gain/(Loss)
EUR
% of Net Assets
USD Hedged Share ClassEUR 823,283 USD 933,322 07/07/2017 J.P. Morgan 6,108 0.00
Unrealised Gain on NAV Hedged Share Classes Forward Currency Exchange Contracts 6,108 0.00
Total Unrealised Gain on Forward Currency Exchange Contracts 6,108 0.00
COP Hedged Share ClassCOP 4,267,139,692 EUR 1,255,780 31/07/2017 J.P. Morgan (40,394) 0.00
USD Hedged Share ClassUSD 321,129,497 EUR 283,316,801 07/07/2017 J.P. Morgan (2,150,566) (0.06)
Unrealised Loss on NAV Hedged Share Classes Forward Currency Exchange Contracts (2,190,960) (0.06)
Total Unrealised Loss on Forward Currency Exchange Contracts (2,190,960) (0.06)
Net Unrealised Loss on Forward Currency Exchange Contracts (2,184,852) (0.06)
Collateral received and paid by the Fund in respect of fi nancial derivative instruments:
Type of Collateral Counterparty CurrencyCollateral Amount
receivedCollateral Amount
paid
Global Balanced Risk Control Fund of Funds
Cash Goldman Sachs EUR 39,555,111 75,360
39,555,111 75,360
DERIVATIVES
Over-the-counter (OTC) and exchange traded derivatives as at 30 June 2017, expressed in Euro.
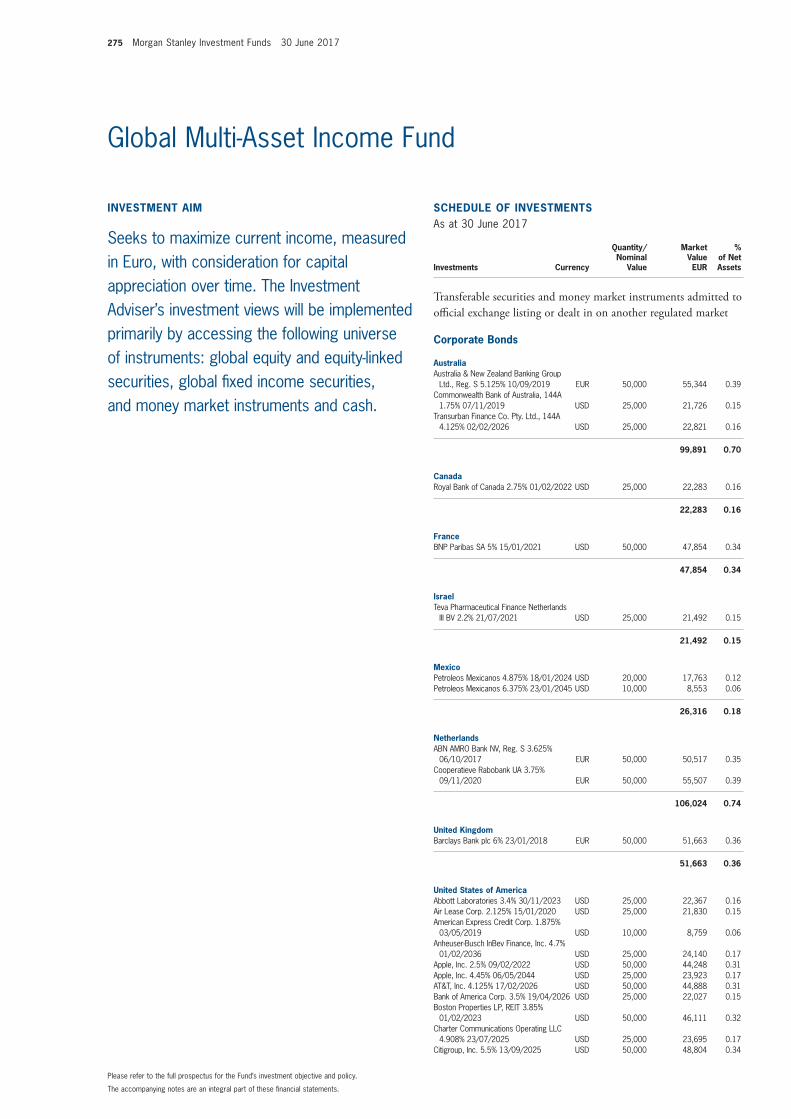
275 Morgan Stanley Investment Funds 30 June 2017
The accompanying notes are an integral part of these fi nancial statements.
Please refer to the full prospectus for the Fund’s investment objective and policy.
Global Multi-Asset Income Fund
SCHEDULE OF INVESTMENTSAs at 30 June 2017
Investments Currency
Quantity/Nominal
Value
Market Value EUR
% of Net Assets
Transferable securities and money market instruments admitted to offi cial exchange listing or dealt in on another regulated market
Corporate Bonds
AustraliaAustralia & New Zealand Banking Group
Ltd., Reg. S 5.125% 10/09/2019 EUR 50,000 55,344 0.39 Commonwealth Bank of Australia, 144A
1.75% 07/11/2019 USD 25,000 21,726 0.15 Transurban Finance Co. Pty. Ltd., 144A
4.125% 02/02/2026 USD 25,000 22,821 0.16
99,891 0.70
CanadaRoyal Bank of Canada 2.75% 01/02/2022 USD 25,000 22,283 0.16
22,283 0.16
FranceBNP Paribas SA 5% 15/01/2021 USD 50,000 47,854 0.34
47,854 0.34
IsraelTeva Pharmaceutical Finance Netherlands
III BV 2.2% 21/07/2021 USD 25,000 21,492 0.15
21,492 0.15
MexicoPetroleos Mexicanos 4.875% 18/01/2024 USD 20,000 17,763 0.12 Petroleos Mexicanos 6.375% 23/01/2045 USD 10,000 8,553 0.06
26,316 0.18
NetherlandsABN AMRO Bank NV, Reg. S 3.625%
06/10/2017 EUR 50,000 50,517 0.35 Cooperatieve Rabobank UA 3.75%
09/11/2020 EUR 50,000 55,507 0.39
106,024 0.74
United KingdomBarclays Bank plc 6% 23/01/2018 EUR 50,000 51,663 0.36
51,663 0.36
United States of AmericaAbbott Laboratories 3.4% 30/11/2023 USD 25,000 22,367 0.16 Air Lease Corp. 2.125% 15/01/2020 USD 25,000 21,830 0.15 American Express Credit Corp. 1.875%
03/05/2019 USD 10,000 8,759 0.06 Anheuser-Busch InBev Finance, Inc. 4.7%
01/02/2036 USD 25,000 24,140 0.17 Apple, Inc. 2.5% 09/02/2022 USD 50,000 44,248 0.31 Apple, Inc. 4.45% 06/05/2044 USD 25,000 23,923 0.17 AT&T, Inc. 4.125% 17/02/2026 USD 50,000 44,888 0.31 Bank of America Corp. 3.5% 19/04/2026 USD 25,000 22,027 0.15 Boston Properties LP, REIT 3.85%
01/02/2023 USD 50,000 46,111 0.32 Charter Communications Operating LLC
4.908% 23/07/2025 USD 25,000 23,695 0.17 Citigroup, Inc. 5.5% 13/09/2025 USD 50,000 48,804 0.34
INVESTMENT AIM
Seeks to maximize current income, measured in Euro, with consideration for capital appreciation over time. The Investment Adviser’s investment views will be implemented primarily by accessing the following universe of instruments: global equity and equity-linked securities, global fi xed income securities, and money market instruments and cash.
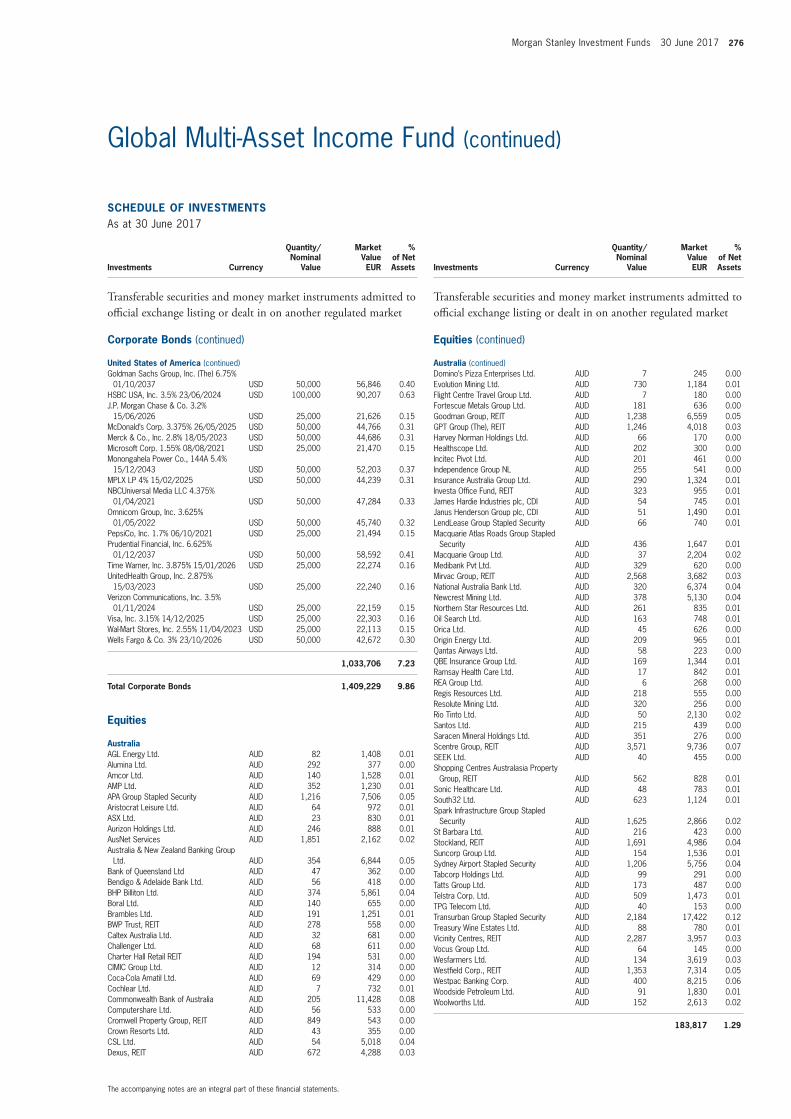
Morgan Stanley Investment Funds 30 June 2017 276
The accompanying notes are an integral part of these fi nancial statements.
Global Multi-Asset Income Fund (continued)
SCHEDULE OF INVESTMENTSAs at 30 June 2017
Investments Currency
Quantity/Nominal
Value
Market Value EUR
% of Net Assets
Transferable securities and money market instruments admitted to offi cial exchange listing or dealt in on another regulated market
Corporate Bonds (continued)
United States of America (continued)Goldman Sachs Group, Inc. (The) 6.75%
01/10/2037 USD 50,000 56,846 0.40 HSBC USA, Inc. 3.5% 23/06/2024 USD 100,000 90,207 0.63 J.P. Morgan Chase & Co. 3.2%
15/06/2026 USD 25,000 21,626 0.15 McDonald’s Corp. 3.375% 26/05/2025 USD 50,000 44,766 0.31 Merck & Co., Inc. 2.8% 18/05/2023 USD 50,000 44,686 0.31 Microsoft Corp. 1.55% 08/08/2021 USD 25,000 21,470 0.15 Monongahela Power Co., 144A 5.4%
15/12/2043 USD 50,000 52,203 0.37 MPLX LP 4% 15/02/2025 USD 50,000 44,239 0.31 NBCUniversal Media LLC 4.375%
01/04/2021 USD 50,000 47,284 0.33 Omnicom Group, Inc. 3.625%
01/05/2022 USD 50,000 45,740 0.32 PepsiCo, Inc. 1.7% 06/10/2021 USD 25,000 21,494 0.15 Prudential Financial, Inc. 6.625%
01/12/2037 USD 50,000 58,592 0.41 Time Warner, Inc. 3.875% 15/01/2026 USD 25,000 22,274 0.16 UnitedHealth Group, Inc. 2.875%
15/03/2023 USD 25,000 22,240 0.16 Verizon Communications, Inc. 3.5%
01/11/2024 USD 25,000 22,159 0.15 Visa, Inc. 3.15% 14/12/2025 USD 25,000 22,303 0.16 Wal-Mart Stores, Inc. 2.55% 11/04/2023 USD 25,000 22,113 0.15 Wells Fargo & Co. 3% 23/10/2026 USD 50,000 42,672 0.30
1,033,706 7.23
Total Corporate Bonds 1,409,229 9.86
Equities
AustraliaAGL Energy Ltd. AUD 82 1,408 0.01 Alumina Ltd. AUD 292 377 0.00 Amcor Ltd. AUD 140 1,528 0.01 AMP Ltd. AUD 352 1,230 0.01 APA Group Stapled Security AUD 1,216 7,506 0.05 Aristocrat Leisure Ltd. AUD 64 972 0.01 ASX Ltd. AUD 23 830 0.01 Aurizon Holdings Ltd. AUD 246 888 0.01 AusNet Services AUD 1,851 2,162 0.02 Australia & New Zealand Banking Group
Ltd. AUD 354 6,844 0.05 Bank of Queensland Ltd AUD 47 362 0.00 Bendigo & Adelaide Bank Ltd. AUD 56 418 0.00 BHP Billiton Ltd. AUD 374 5,861 0.04 Boral Ltd. AUD 140 655 0.00 Brambles Ltd. AUD 191 1,251 0.01 BWP Trust, REIT AUD 278 558 0.00 Caltex Australia Ltd. AUD 32 681 0.00 Challenger Ltd. AUD 68 611 0.00 Charter Hall Retail REIT AUD 194 531 0.00 CIMIC Group Ltd. AUD 12 314 0.00 Coca-Cola Amatil Ltd. AUD 69 429 0.00 Cochlear Ltd. AUD 7 732 0.01 Commonwealth Bank of Australia AUD 205 11,428 0.08 Computershare Ltd. AUD 56 533 0.00 Cromwell Property Group, REIT AUD 849 543 0.00 Crown Resorts Ltd. AUD 43 355 0.00 CSL Ltd. AUD 54 5,018 0.04 Dexus, REIT AUD 672 4,288 0.03
SCHEDULE OF INVESTMENTSAs at 30 June 2017
Investments Currency
Quantity/Nominal
Value
Market Value EUR
% of Net Assets
Transferable securities and money market instruments admitted to offi cial exchange listing or dealt in on another regulated market
Equities (continued)
Australia (continued)Domino’s Pizza Enterprises Ltd. AUD 7 245 0.00 Evolution Mining Ltd. AUD 730 1,184 0.01 Flight Centre Travel Group Ltd. AUD 7 180 0.00 Fortescue Metals Group Ltd. AUD 181 636 0.00 Goodman Group, REIT AUD 1,238 6,559 0.05 GPT Group (The), REIT AUD 1,246 4,018 0.03 Harvey Norman Holdings Ltd. AUD 66 170 0.00 Healthscope Ltd. AUD 202 300 0.00 Incitec Pivot Ltd. AUD 201 461 0.00 Independence Group NL AUD 255 541 0.00 Insurance Australia Group Ltd. AUD 290 1,324 0.01 Investa Offi ce Fund, REIT AUD 323 955 0.01 James Hardie Industries plc, CDI AUD 54 745 0.01 Janus Henderson Group plc, CDI AUD 51 1,490 0.01 LendLease Group Stapled Security AUD 66 740 0.01 Macquarie Atlas Roads Group Stapled
Security AUD 436 1,647 0.01 Macquarie Group Ltd. AUD 37 2,204 0.02 Medibank Pvt Ltd. AUD 329 620 0.00 Mirvac Group, REIT AUD 2,568 3,682 0.03 National Australia Bank Ltd. AUD 320 6,374 0.04 Newcrest Mining Ltd. AUD 378 5,130 0.04 Northern Star Resources Ltd. AUD 261 835 0.01 Oil Search Ltd. AUD 163 748 0.01 Orica Ltd. AUD 45 626 0.00 Origin Energy Ltd. AUD 209 965 0.01 Qantas Airways Ltd. AUD 58 223 0.00 QBE Insurance Group Ltd. AUD 169 1,344 0.01 Ramsay Health Care Ltd. AUD 17 842 0.01 REA Group Ltd. AUD 6 268 0.00 Regis Resources Ltd. AUD 218 555 0.00 Resolute Mining Ltd. AUD 320 256 0.00 Rio Tinto Ltd. AUD 50 2,130 0.02 Santos Ltd. AUD 215 439 0.00 Saracen Mineral Holdings Ltd. AUD 351 276 0.00 Scentre Group, REIT AUD 3,571 9,736 0.07 SEEK Ltd. AUD 40 455 0.00 Shopping Centres Australasia Property
Group, REIT AUD 562 828 0.01 Sonic Healthcare Ltd. AUD 48 783 0.01 South32 Ltd. AUD 623 1,124 0.01 Spark Infrastructure Group Stapled
Security AUD 1,625 2,866 0.02 St Barbara Ltd. AUD 216 423 0.00 Stockland, REIT AUD 1,691 4,986 0.04 Suncorp Group Ltd. AUD 154 1,536 0.01 Sydney Airport Stapled Security AUD 1,206 5,756 0.04 Tabcorp Holdings Ltd. AUD 99 291 0.00 Tatts Group Ltd. AUD 173 487 0.00 Telstra Corp. Ltd. AUD 509 1,473 0.01 TPG Telecom Ltd. AUD 40 153 0.00 Transurban Group Stapled Security AUD 2,184 17,422 0.12 Treasury Wine Estates Ltd. AUD 88 780 0.01 Vicinity Centres, REIT AUD 2,287 3,957 0.03 Vocus Group Ltd. AUD 64 145 0.00 Wesfarmers Ltd. AUD 134 3,619 0.03 Westfi eld Corp., REIT AUD 1,353 7,314 0.05 Westpac Banking Corp. AUD 400 8,215 0.06 Woodside Petroleum Ltd. AUD 91 1,830 0.01 Woolworths Ltd. AUD 152 2,613 0.02
183,817 1.29
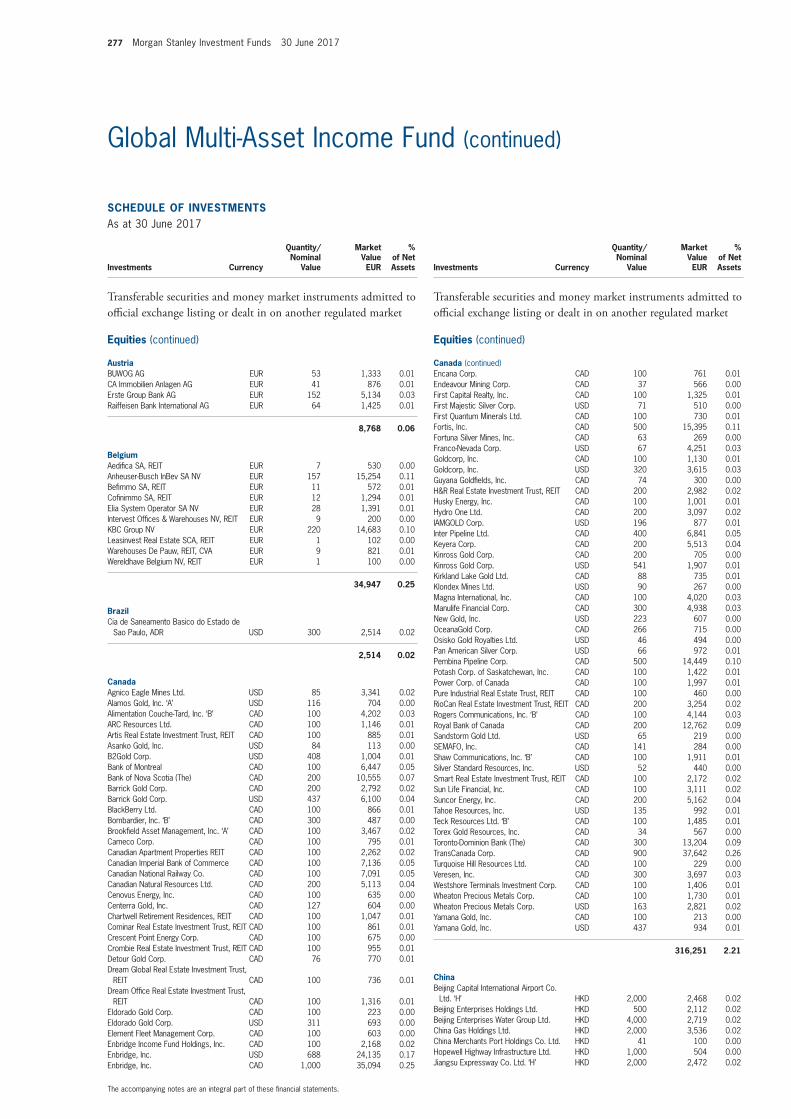
277 Morgan Stanley Investment Funds 30 June 2017
The accompanying notes are an integral part of these fi nancial statements.
Global Multi-Asset Income Fund (continued)
SCHEDULE OF INVESTMENTSAs at 30 June 2017
Investments Currency
Quantity/Nominal
Value
Market Value EUR
% of Net Assets
Transferable securities and money market instruments admitted to offi cial exchange listing or dealt in on another regulated market
Equities (continued)
AustriaBUWOG AG EUR 53 1,333 0.01 CA Immobilien Anlagen AG EUR 41 876 0.01 Erste Group Bank AG EUR 152 5,134 0.03 Raiffeisen Bank International AG EUR 64 1,425 0.01
8,768 0.06
BelgiumAedifi ca SA, REIT EUR 7 530 0.00 Anheuser-Busch InBev SA NV EUR 157 15,254 0.11 Befi mmo SA, REIT EUR 11 572 0.01 Cofi nimmo SA, REIT EUR 12 1,294 0.01 Elia System Operator SA NV EUR 28 1,391 0.01 Intervest Offi ces & Warehouses NV, REIT EUR 9 200 0.00 KBC Group NV EUR 220 14,683 0.10 Leasinvest Real Estate SCA, REIT EUR 1 102 0.00 Warehouses De Pauw, REIT, CVA EUR 9 821 0.01 Wereldhave Belgium NV, REIT EUR 1 100 0.00
34,947 0.25
BrazilCia de Saneamento Basico do Estado de
Sao Paulo, ADR USD 300 2,514 0.02
2,514 0.02
CanadaAgnico Eagle Mines Ltd. USD 85 3,341 0.02 Alamos Gold, Inc. ‘A’ USD 116 704 0.00 Alimentation Couche-Tard, Inc. ‘B’ CAD 100 4,202 0.03 ARC Resources Ltd. CAD 100 1,146 0.01 Artis Real Estate Investment Trust, REIT CAD 100 885 0.01 Asanko Gold, Inc. USD 84 113 0.00 B2Gold Corp. USD 408 1,004 0.01 Bank of Montreal CAD 100 6,447 0.05 Bank of Nova Scotia (The) CAD 200 10,555 0.07 Barrick Gold Corp. CAD 200 2,792 0.02 Barrick Gold Corp. USD 437 6,100 0.04 BlackBerry Ltd. CAD 100 866 0.01 Bombardier, Inc. ‘B’ CAD 300 487 0.00 Brookfi eld Asset Management, Inc. ‘A’ CAD 100 3,467 0.02 Cameco Corp. CAD 100 795 0.01 Canadian Apartment Properties REIT CAD 100 2,262 0.02 Canadian Imperial Bank of Commerce CAD 100 7,136 0.05 Canadian National Railway Co. CAD 100 7,091 0.05 Canadian Natural Resources Ltd. CAD 200 5,113 0.04 Cenovus Energy, Inc. CAD 100 635 0.00 Centerra Gold, Inc. CAD 127 604 0.00 Chartwell Retirement Residences, REIT CAD 100 1,047 0.01 Cominar Real Estate Investment Trust, REIT CAD 100 861 0.01 Crescent Point Energy Corp. CAD 100 675 0.00 Crombie Real Estate Investment Trust, REIT CAD 100 955 0.01 Detour Gold Corp. CAD 76 770 0.01 Dream Global Real Estate Investment Trust,
REIT CAD 100 736 0.01 Dream Offi ce Real Estate Investment Trust,
REIT CAD 100 1,316 0.01 Eldorado Gold Corp. CAD 100 223 0.00 Eldorado Gold Corp. USD 311 693 0.00 Element Fleet Management Corp. CAD 100 603 0.00 Enbridge Income Fund Holdings, Inc. CAD 100 2,168 0.02 Enbridge, Inc. USD 688 24,135 0.17 Enbridge, Inc. CAD 1,000 35,094 0.25
SCHEDULE OF INVESTMENTSAs at 30 June 2017
Investments Currency
Quantity/Nominal
Value
Market Value EUR
% of Net Assets
Transferable securities and money market instruments admitted to offi cial exchange listing or dealt in on another regulated market
Equities (continued)
Canada (continued)Encana Corp. CAD 100 761 0.01 Endeavour Mining Corp. CAD 37 566 0.00 First Capital Realty, Inc. CAD 100 1,325 0.01 First Majestic Silver Corp. USD 71 510 0.00 First Quantum Minerals Ltd. CAD 100 730 0.01 Fortis, Inc. CAD 500 15,395 0.11 Fortuna Silver Mines, Inc. CAD 63 269 0.00 Franco-Nevada Corp. USD 67 4,251 0.03 Goldcorp, Inc. CAD 100 1,130 0.01 Goldcorp, Inc. USD 320 3,615 0.03 Guyana Goldfi elds, Inc. CAD 74 300 0.00 H&R Real Estate Investment Trust, REIT CAD 200 2,982 0.02 Husky Energy, Inc. CAD 100 1,001 0.01 Hydro One Ltd. CAD 200 3,097 0.02 IAMGOLD Corp. USD 196 877 0.01 Inter Pipeline Ltd. CAD 400 6,841 0.05 Keyera Corp. CAD 200 5,513 0.04 Kinross Gold Corp. CAD 200 705 0.00 Kinross Gold Corp. USD 541 1,907 0.01 Kirkland Lake Gold Ltd. CAD 88 735 0.01 Klondex Mines Ltd. USD 90 267 0.00 Magna International, Inc. CAD 100 4,020 0.03 Manulife Financial Corp. CAD 300 4,938 0.03 New Gold, Inc. USD 223 607 0.00 OceanaGold Corp. CAD 266 715 0.00 Osisko Gold Royalties Ltd. USD 46 494 0.00 Pan American Silver Corp. USD 66 972 0.01 Pembina Pipeline Corp. CAD 500 14,449 0.10 Potash Corp. of Saskatchewan, Inc. CAD 100 1,422 0.01 Power Corp. of Canada CAD 100 1,997 0.01 Pure Industrial Real Estate Trust, REIT CAD 100 460 0.00 RioCan Real Estate Investment Trust, REIT CAD 200 3,254 0.02 Rogers Communications, Inc. ‘B’ CAD 100 4,144 0.03 Royal Bank of Canada CAD 200 12,762 0.09 Sandstorm Gold Ltd. USD 65 219 0.00 SEMAFO, Inc. CAD 141 284 0.00 Shaw Communications, Inc. ‘B’ CAD 100 1,911 0.01 Silver Standard Resources, Inc. USD 52 440 0.00 Smart Real Estate Investment Trust, REIT CAD 100 2,172 0.02 Sun Life Financial, Inc. CAD 100 3,111 0.02 Suncor Energy, Inc. CAD 200 5,162 0.04 Tahoe Resources, Inc. USD 135 992 0.01 Teck Resources Ltd. ‘B’ CAD 100 1,485 0.01 Torex Gold Resources, Inc. CAD 34 567 0.00 Toronto-Dominion Bank (The) CAD 300 13,204 0.09 TransCanada Corp. CAD 900 37,642 0.26 Turquoise Hill Resources Ltd. CAD 100 229 0.00 Veresen, Inc. CAD 300 3,697 0.03 Westshore Terminals Investment Corp. CAD 100 1,406 0.01 Wheaton Precious Metals Corp. CAD 100 1,730 0.01 Wheaton Precious Metals Corp. USD 163 2,821 0.02 Yamana Gold, Inc. CAD 100 213 0.00 Yamana Gold, Inc. USD 437 934 0.01
316,251 2.21
ChinaBeijing Capital International Airport Co.
Ltd. ‘H’ HKD 2,000 2,468 0.02 Beijing Enterprises Holdings Ltd. HKD 500 2,112 0.02 Beijing Enterprises Water Group Ltd. HKD 4,000 2,719 0.02 China Gas Holdings Ltd. HKD 2,000 3,536 0.02 China Merchants Port Holdings Co. Ltd. HKD 41 100 0.00 Hopewell Highway Infrastructure Ltd. HKD 1,000 504 0.00 Jiangsu Expressway Co. Ltd. ‘H’ HKD 2,000 2,472 0.02
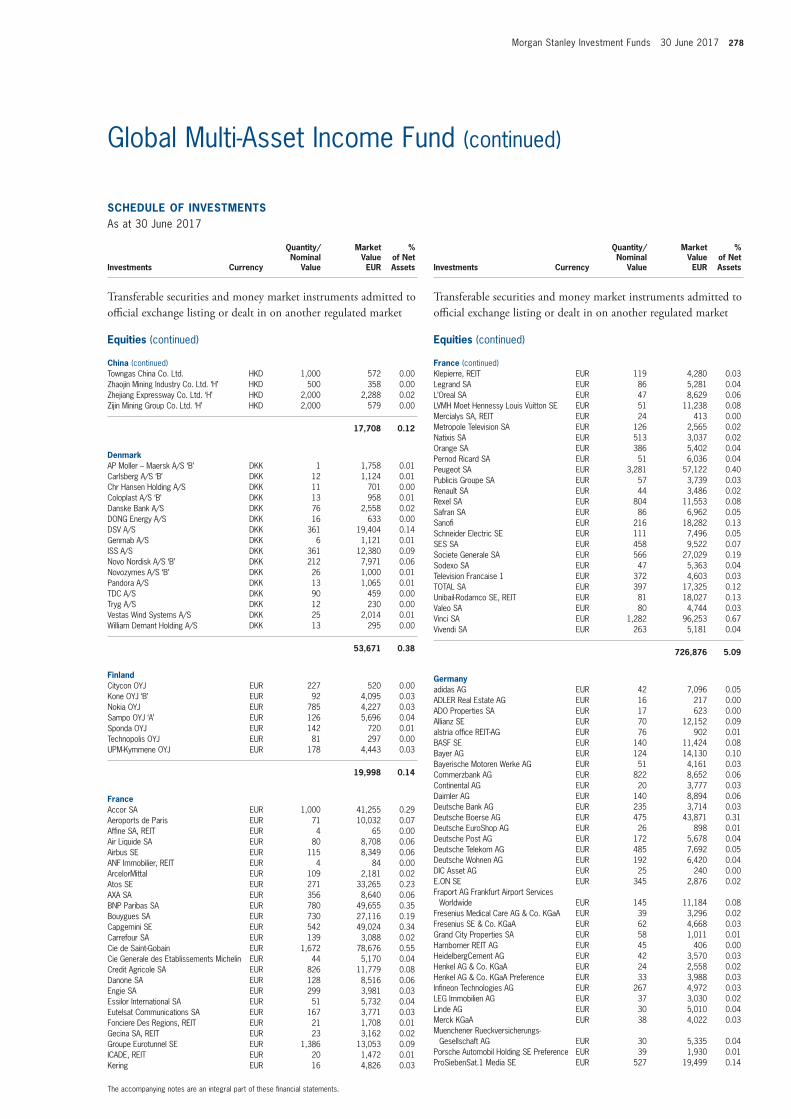
Morgan Stanley Investment Funds 30 June 2017 278
The accompanying notes are an integral part of these fi nancial statements.
Global Multi-Asset Income Fund (continued)
SCHEDULE OF INVESTMENTSAs at 30 June 2017
Investments Currency
Quantity/Nominal
Value
Market Value EUR
% of Net Assets
Transferable securities and money market instruments admitted to offi cial exchange listing or dealt in on another regulated market
Equities (continued)
China (continued)Towngas China Co. Ltd. HKD 1,000 572 0.00 Zhaojin Mining Industry Co. Ltd. ‘H’ HKD 500 358 0.00 Zhejiang Expressway Co. Ltd. ‘H’ HKD 2,000 2,288 0.02 Zijin Mining Group Co. Ltd. ‘H’ HKD 2,000 579 0.00
17,708 0.12
DenmarkAP Moller – Maersk A/S ‘B’ DKK 1 1,758 0.01 Carlsberg A/S ‘B’ DKK 12 1,124 0.01 Chr Hansen Holding A/S DKK 11 701 0.00 Coloplast A/S ‘B’ DKK 13 958 0.01 Danske Bank A/S DKK 76 2,558 0.02 DONG Energy A/S DKK 16 633 0.00 DSV A/S DKK 361 19,404 0.14 Genmab A/S DKK 6 1,121 0.01 ISS A/S DKK 361 12,380 0.09 Novo Nordisk A/S ‘B’ DKK 212 7,971 0.06 Novozymes A/S ‘B’ DKK 26 1,000 0.01 Pandora A/S DKK 13 1,065 0.01 TDC A/S DKK 90 459 0.00 Tryg A/S DKK 12 230 0.00 Vestas Wind Systems A/S DKK 25 2,014 0.01 William Demant Holding A/S DKK 13 295 0.00
53,671 0.38
FinlandCitycon OYJ EUR 227 520 0.00 Kone OYJ ‘B’ EUR 92 4,095 0.03 Nokia OYJ EUR 785 4,227 0.03 Sampo OYJ ‘A’ EUR 126 5,696 0.04 Sponda OYJ EUR 142 720 0.01 Technopolis OYJ EUR 81 297 0.00 UPM-Kymmene OYJ EUR 178 4,443 0.03
19,998 0.14
FranceAccor SA EUR 1,000 41,255 0.29 Aeroports de Paris EUR 71 10,032 0.07 Affi ne SA, REIT EUR 4 65 0.00 Air Liquide SA EUR 80 8,708 0.06 Airbus SE EUR 115 8,349 0.06 ANF Immobilier, REIT EUR 4 84 0.00 ArcelorMittal EUR 109 2,181 0.02 Atos SE EUR 271 33,265 0.23 AXA SA EUR 356 8,640 0.06 BNP Paribas SA EUR 780 49,655 0.35 Bouygues SA EUR 730 27,116 0.19 Capgemini SE EUR 542 49,024 0.34 Carrefour SA EUR 139 3,088 0.02 Cie de Saint-Gobain EUR 1,672 78,676 0.55 Cie Generale des Etablissements Michelin EUR 44 5,170 0.04 Credit Agricole SA EUR 826 11,779 0.08 Danone SA EUR 128 8,516 0.06 Engie SA EUR 299 3,981 0.03 Essilor International SA EUR 51 5,732 0.04 Eutelsat Communications SA EUR 167 3,771 0.03 Fonciere Des Regions, REIT EUR 21 1,708 0.01 Gecina SA, REIT EUR 23 3,162 0.02 Groupe Eurotunnel SE EUR 1,386 13,053 0.09 ICADE, REIT EUR 20 1,472 0.01 Kering EUR 16 4,826 0.03
SCHEDULE OF INVESTMENTSAs at 30 June 2017
Investments Currency
Quantity/Nominal
Value
Market Value EUR
% of Net Assets
Transferable securities and money market instruments admitted to offi cial exchange listing or dealt in on another regulated market
Equities (continued)
France (continued)Klepierre, REIT EUR 119 4,280 0.03 Legrand SA EUR 86 5,281 0.04 L’Oreal SA EUR 47 8,629 0.06 LVMH Moet Hennessy Louis Vuitton SE EUR 51 11,238 0.08 Mercialys SA, REIT EUR 24 413 0.00 Metropole Television SA EUR 126 2,565 0.02 Natixis SA EUR 513 3,037 0.02 Orange SA EUR 386 5,402 0.04 Pernod Ricard SA EUR 51 6,036 0.04 Peugeot SA EUR 3,281 57,122 0.40 Publicis Groupe SA EUR 57 3,739 0.03 Renault SA EUR 44 3,486 0.02 Rexel SA EUR 804 11,553 0.08 Safran SA EUR 86 6,962 0.05 Sanofi EUR 216 18,282 0.13 Schneider Electric SE EUR 111 7,496 0.05 SES SA EUR 458 9,522 0.07 Societe Generale SA EUR 566 27,029 0.19 Sodexo SA EUR 47 5,363 0.04 Television Francaise 1 EUR 372 4,603 0.03 TOTAL SA EUR 397 17,325 0.12 Unibail-Rodamco SE, REIT EUR 81 18,027 0.13 Valeo SA EUR 80 4,744 0.03 Vinci SA EUR 1,282 96,253 0.67 Vivendi SA EUR 263 5,181 0.04
726,876 5.09
Germanyadidas AG EUR 42 7,096 0.05 ADLER Real Estate AG EUR 16 217 0.00 ADO Properties SA EUR 17 623 0.00 Allianz SE EUR 70 12,152 0.09 alstria offi ce REIT-AG EUR 76 902 0.01 BASF SE EUR 140 11,424 0.08 Bayer AG EUR 124 14,130 0.10 Bayerische Motoren Werke AG EUR 51 4,161 0.03 Commerzbank AG EUR 822 8,652 0.06 Continental AG EUR 20 3,777 0.03 Daimler AG EUR 140 8,894 0.06 Deutsche Bank AG EUR 235 3,714 0.03 Deutsche Boerse AG EUR 475 43,871 0.31 Deutsche EuroShop AG EUR 26 898 0.01 Deutsche Post AG EUR 172 5,678 0.04 Deutsche Telekom AG EUR 485 7,692 0.05 Deutsche Wohnen AG EUR 192 6,420 0.04 DIC Asset AG EUR 25 240 0.00 E.ON SE EUR 345 2,876 0.02 Fraport AG Frankfurt Airport Services
Worldwide EUR 145 11,184 0.08 Fresenius Medical Care AG & Co. KGaA EUR 39 3,296 0.02 Fresenius SE & Co. KGaA EUR 62 4,668 0.03 Grand City Properties SA EUR 58 1,011 0.01 Hamborner REIT AG EUR 45 406 0.00 HeidelbergCement AG EUR 42 3,570 0.03 Henkel AG & Co. KGaA EUR 24 2,558 0.02 Henkel AG & Co. KGaA Preference EUR 33 3,988 0.03 Infi neon Technologies AG EUR 267 4,972 0.03 LEG Immobilien AG EUR 37 3,030 0.02 Linde AG EUR 30 5,010 0.04 Merck KGaA EUR 38 4,022 0.03 Muenchener Rueckversicherungs-
Gesellschaft AG EUR 30 5,335 0.04 Porsche Automobil Holding SE Preference EUR 39 1,930 0.01 ProSiebenSat.1 Media SE EUR 527 19,499 0.14
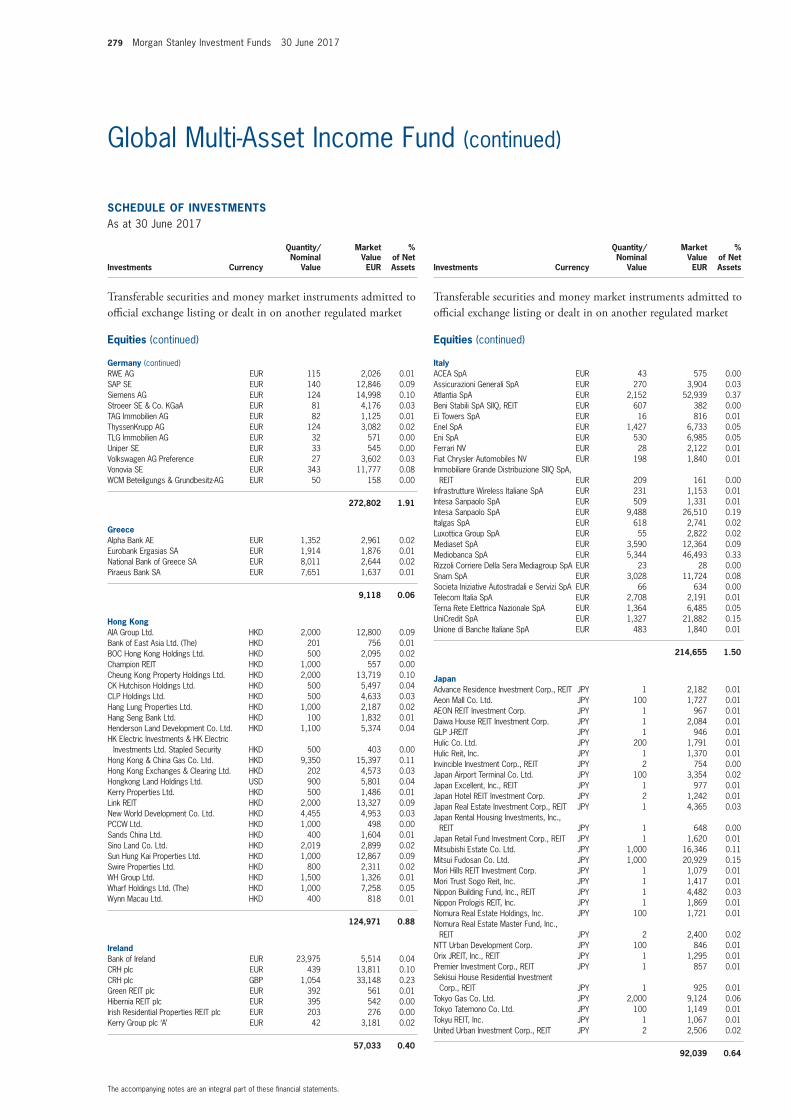
279 Morgan Stanley Investment Funds 30 June 2017
The accompanying notes are an integral part of these fi nancial statements.
Global Multi-Asset Income Fund (continued)
SCHEDULE OF INVESTMENTSAs at 30 June 2017
Investments Currency
Quantity/Nominal
Value
Market Value EUR
% of Net Assets
Transferable securities and money market instruments admitted to offi cial exchange listing or dealt in on another regulated market
Equities (continued)
Germany (continued)RWE AG EUR 115 2,026 0.01 SAP SE EUR 140 12,846 0.09 Siemens AG EUR 124 14,998 0.10 Stroeer SE & Co. KGaA EUR 81 4,176 0.03 TAG Immobilien AG EUR 82 1,125 0.01 ThyssenKrupp AG EUR 124 3,082 0.02 TLG Immobilien AG EUR 32 571 0.00 Uniper SE EUR 33 545 0.00 Volkswagen AG Preference EUR 27 3,602 0.03 Vonovia SE EUR 343 11,777 0.08 WCM Beteiligungs & Grundbesitz-AG EUR 50 158 0.00
272,802 1.91
GreeceAlpha Bank AE EUR 1,352 2,961 0.02 Eurobank Ergasias SA EUR 1,914 1,876 0.01 National Bank of Greece SA EUR 8,011 2,644 0.02 Piraeus Bank SA EUR 7,651 1,637 0.01
9,118 0.06
Hong KongAIA Group Ltd. HKD 2,000 12,800 0.09 Bank of East Asia Ltd. (The) HKD 201 756 0.01 BOC Hong Kong Holdings Ltd. HKD 500 2,095 0.02 Champion REIT HKD 1,000 557 0.00 Cheung Kong Property Holdings Ltd. HKD 2,000 13,719 0.10 CK Hutchison Holdings Ltd. HKD 500 5,497 0.04 CLP Holdings Ltd. HKD 500 4,633 0.03 Hang Lung Properties Ltd. HKD 1,000 2,187 0.02 Hang Seng Bank Ltd. HKD 100 1,832 0.01 Henderson Land Development Co. Ltd. HKD 1,100 5,374 0.04 HK Electric Investments & HK Electric
Investments Ltd. Stapled Security HKD 500 403 0.00 Hong Kong & China Gas Co. Ltd. HKD 9,350 15,397 0.11 Hong Kong Exchanges & Clearing Ltd. HKD 202 4,573 0.03 Hongkong Land Holdings Ltd. USD 900 5,801 0.04 Kerry Properties Ltd. HKD 500 1,486 0.01 Link REIT HKD 2,000 13,327 0.09 New World Development Co. Ltd. HKD 4,455 4,953 0.03 PCCW Ltd. HKD 1,000 498 0.00 Sands China Ltd. HKD 400 1,604 0.01 Sino Land Co. Ltd. HKD 2,019 2,899 0.02 Sun Hung Kai Properties Ltd. HKD 1,000 12,867 0.09 Swire Properties Ltd. HKD 800 2,311 0.02 WH Group Ltd. HKD 1,500 1,326 0.01 Wharf Holdings Ltd. (The) HKD 1,000 7,258 0.05 Wynn Macau Ltd. HKD 400 818 0.01
124,971 0.88
IrelandBank of Ireland EUR 23,975 5,514 0.04 CRH plc EUR 439 13,811 0.10 CRH plc GBP 1,054 33,148 0.23 Green REIT plc EUR 392 561 0.01 Hibernia REIT plc EUR 395 542 0.00 Irish Residential Properties REIT plc EUR 203 276 0.00 Kerry Group plc ‘A’ EUR 42 3,181 0.02
57,033 0.40
SCHEDULE OF INVESTMENTSAs at 30 June 2017
Investments Currency
Quantity/Nominal
Value
Market Value EUR
% of Net Assets
Transferable securities and money market instruments admitted to offi cial exchange listing or dealt in on another regulated market
Equities (continued)
ItalyACEA SpA EUR 43 575 0.00 Assicurazioni Generali SpA EUR 270 3,904 0.03 Atlantia SpA EUR 2,152 52,939 0.37 Beni Stabili SpA SIIQ, REIT EUR 607 382 0.00 Ei Towers SpA EUR 16 816 0.01 Enel SpA EUR 1,427 6,733 0.05 Eni SpA EUR 530 6,985 0.05 Ferrari NV EUR 28 2,122 0.01 Fiat Chrysler Automobiles NV EUR 198 1,840 0.01 Immobiliare Grande Distribuzione SIIQ SpA,
REIT EUR 209 161 0.00 Infrastrutture Wireless Italiane SpA EUR 231 1,153 0.01 Intesa Sanpaolo SpA EUR 509 1,331 0.01 Intesa Sanpaolo SpA EUR 9,488 26,510 0.19 Italgas SpA EUR 618 2,741 0.02 Luxottica Group SpA EUR 55 2,822 0.02 Mediaset SpA EUR 3,590 12,364 0.09 Mediobanca SpA EUR 5,344 46,493 0.33 Rizzoli Corriere Della Sera Mediagroup SpA EUR 23 28 0.00 Snam SpA EUR 3,028 11,724 0.08 Societa Iniziative Autostradali e Servizi SpA EUR 66 634 0.00 Telecom Italia SpA EUR 2,708 2,191 0.01 Terna Rete Elettrica Nazionale SpA EUR 1,364 6,485 0.05 UniCredit SpA EUR 1,327 21,882 0.15 Unione di Banche Italiane SpA EUR 483 1,840 0.01
214,655 1.50
JapanAdvance Residence Investment Corp., REIT JPY 1 2,182 0.01 Aeon Mall Co. Ltd. JPY 100 1,727 0.01 AEON REIT Investment Corp. JPY 1 967 0.01 Daiwa House REIT Investment Corp. JPY 1 2,084 0.01 GLP J-REIT JPY 1 946 0.01 Hulic Co. Ltd. JPY 200 1,791 0.01 Hulic Reit, Inc. JPY 1 1,370 0.01 Invincible Investment Corp., REIT JPY 2 754 0.00 Japan Airport Terminal Co. Ltd. JPY 100 3,354 0.02 Japan Excellent, Inc., REIT JPY 1 977 0.01 Japan Hotel REIT Investment Corp. JPY 2 1,242 0.01 Japan Real Estate Investment Corp., REIT JPY 1 4,365 0.03 Japan Rental Housing Investments, Inc.,
REIT JPY 1 648 0.00 Japan Retail Fund Investment Corp., REIT JPY 1 1,620 0.01 Mitsubishi Estate Co. Ltd. JPY 1,000 16,346 0.11 Mitsui Fudosan Co. Ltd. JPY 1,000 20,929 0.15 Mori Hills REIT Investment Corp. JPY 1 1,079 0.01 Mori Trust Sogo Reit, Inc. JPY 1 1,417 0.01 Nippon Building Fund, Inc., REIT JPY 1 4,482 0.03 Nippon Prologis REIT, Inc. JPY 1 1,869 0.01 Nomura Real Estate Holdings, Inc. JPY 100 1,721 0.01 Nomura Real Estate Master Fund, Inc.,
REIT JPY 2 2,400 0.02 NTT Urban Development Corp. JPY 100 846 0.01 Orix JREIT, Inc., REIT JPY 1 1,295 0.01 Premier Investment Corp., REIT JPY 1 857 0.01 Sekisui House Residential Investment
Corp., REIT JPY 1 925 0.01 Tokyo Gas Co. Ltd. JPY 2,000 9,124 0.06 Tokyo Tatemono Co. Ltd. JPY 100 1,149 0.01 Tokyu REIT, Inc. JPY 1 1,067 0.01 United Urban Investment Corp., REIT JPY 2 2,506 0.02
92,039 0.64
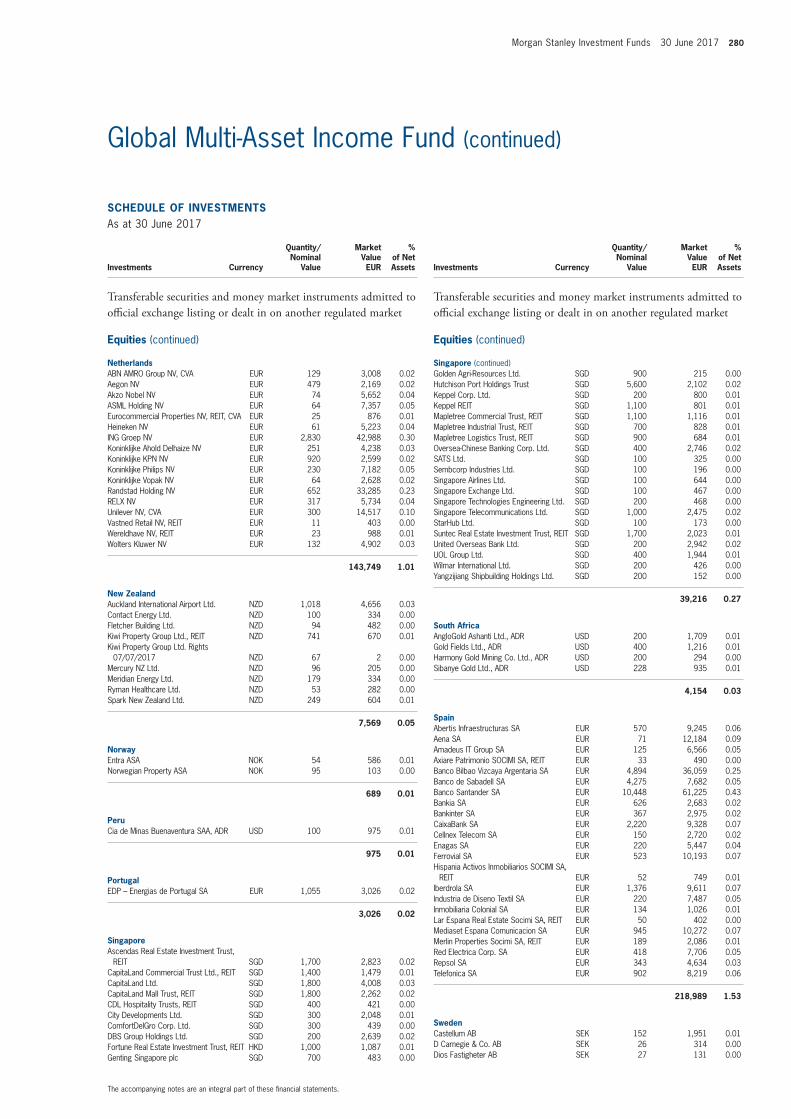
Morgan Stanley Investment Funds 30 June 2017 280
The accompanying notes are an integral part of these fi nancial statements.
Global Multi-Asset Income Fund (continued)
SCHEDULE OF INVESTMENTSAs at 30 June 2017
Investments Currency
Quantity/Nominal
Value
Market Value EUR
% of Net Assets
Transferable securities and money market instruments admitted to offi cial exchange listing or dealt in on another regulated market
Equities (continued)
NetherlandsABN AMRO Group NV, CVA EUR 129 3,008 0.02 Aegon NV EUR 479 2,169 0.02 Akzo Nobel NV EUR 74 5,652 0.04 ASML Holding NV EUR 64 7,357 0.05 Eurocommercial Properties NV, REIT, CVA EUR 25 876 0.01 Heineken NV EUR 61 5,223 0.04 ING Groep NV EUR 2,830 42,988 0.30 Koninklijke Ahold Delhaize NV EUR 251 4,238 0.03 Koninklijke KPN NV EUR 920 2,599 0.02 Koninklijke Philips NV EUR 230 7,182 0.05 Koninklijke Vopak NV EUR 64 2,628 0.02 Randstad Holding NV EUR 652 33,285 0.23 RELX NV EUR 317 5,734 0.04 Unilever NV, CVA EUR 300 14,517 0.10 Vastned Retail NV, REIT EUR 11 403 0.00 Wereldhave NV, REIT EUR 23 988 0.01 Wolters Kluwer NV EUR 132 4,902 0.03
143,749 1.01
New ZealandAuckland International Airport Ltd. NZD 1,018 4,656 0.03 Contact Energy Ltd. NZD 100 334 0.00 Fletcher Building Ltd. NZD 94 482 0.00 Kiwi Property Group Ltd., REIT NZD 741 670 0.01 Kiwi Property Group Ltd. Rights
07/07/2017 NZD 67 2 0.00 Mercury NZ Ltd. NZD 96 205 0.00 Meridian Energy Ltd. NZD 179 334 0.00 Ryman Healthcare Ltd. NZD 53 282 0.00 Spark New Zealand Ltd. NZD 249 604 0.01
7,569 0.05
NorwayEntra ASA NOK 54 586 0.01 Norwegian Property ASA NOK 95 103 0.00
689 0.01
PeruCia de Minas Buenaventura SAA, ADR USD 100 975 0.01
975 0.01
PortugalEDP – Energias de Portugal SA EUR 1,055 3,026 0.02
3,026 0.02
SingaporeAscendas Real Estate Investment Trust,
REIT SGD 1,700 2,823 0.02 CapitaLand Commercial Trust Ltd., REIT SGD 1,400 1,479 0.01 CapitaLand Ltd. SGD 1,800 4,008 0.03 CapitaLand Mall Trust, REIT SGD 1,800 2,262 0.02 CDL Hospitality Trusts, REIT SGD 400 421 0.00 City Developments Ltd. SGD 300 2,048 0.01 ComfortDelGro Corp. Ltd. SGD 300 439 0.00 DBS Group Holdings Ltd. SGD 200 2,639 0.02 Fortune Real Estate Investment Trust, REIT HKD 1,000 1,087 0.01 Genting Singapore plc SGD 700 483 0.00
SCHEDULE OF INVESTMENTSAs at 30 June 2017
Investments Currency
Quantity/Nominal
Value
Market Value EUR
% of Net Assets
Transferable securities and money market instruments admitted to offi cial exchange listing or dealt in on another regulated market
Equities (continued)
Singapore (continued)Golden Agri-Resources Ltd. SGD 900 215 0.00 Hutchison Port Holdings Trust SGD 5,600 2,102 0.02 Keppel Corp. Ltd. SGD 200 800 0.01 Keppel REIT SGD 1,100 801 0.01 Mapletree Commercial Trust, REIT SGD 1,100 1,116 0.01 Mapletree Industrial Trust, REIT SGD 700 828 0.01 Mapletree Logistics Trust, REIT SGD 900 684 0.01 Oversea-Chinese Banking Corp. Ltd. SGD 400 2,746 0.02 SATS Ltd. SGD 100 325 0.00 Sembcorp Industries Ltd. SGD 100 196 0.00 Singapore Airlines Ltd. SGD 100 644 0.00 Singapore Exchange Ltd. SGD 100 467 0.00 Singapore Technologies Engineering Ltd. SGD 200 468 0.00 Singapore Telecommunications Ltd. SGD 1,000 2,475 0.02 StarHub Ltd. SGD 100 173 0.00 Suntec Real Estate Investment Trust, REIT SGD 1,700 2,023 0.01 United Overseas Bank Ltd. SGD 200 2,942 0.02 UOL Group Ltd. SGD 400 1,944 0.01 Wilmar International Ltd. SGD 200 426 0.00 Yangzijiang Shipbuilding Holdings Ltd. SGD 200 152 0.00
39,216 0.27
South AfricaAngloGold Ashanti Ltd., ADR USD 200 1,709 0.01 Gold Fields Ltd., ADR USD 400 1,216 0.01 Harmony Gold Mining Co. Ltd., ADR USD 200 294 0.00 Sibanye Gold Ltd., ADR USD 228 935 0.01
4,154 0.03
SpainAbertis Infraestructuras SA EUR 570 9,245 0.06 Aena SA EUR 71 12,184 0.09 Amadeus IT Group SA EUR 125 6,566 0.05 Axiare Patrimonio SOCIMI SA, REIT EUR 33 490 0.00 Banco Bilbao Vizcaya Argentaria SA EUR 4,894 36,059 0.25 Banco de Sabadell SA EUR 4,275 7,682 0.05 Banco Santander SA EUR 10,448 61,225 0.43 Bankia SA EUR 626 2,683 0.02 Bankinter SA EUR 367 2,975 0.02 CaixaBank SA EUR 2,220 9,328 0.07 Cellnex Telecom SA EUR 150 2,720 0.02 Enagas SA EUR 220 5,447 0.04 Ferrovial SA EUR 523 10,193 0.07 Hispania Activos Inmobiliarios SOCIMI SA,
REIT EUR 52 749 0.01 Iberdrola SA EUR 1,376 9,611 0.07 Industria de Diseno Textil SA EUR 220 7,487 0.05 Inmobiliaria Colonial SA EUR 134 1,026 0.01 Lar Espana Real Estate Socimi SA, REIT EUR 50 402 0.00 Mediaset Espana Comunicacion SA EUR 945 10,272 0.07 Merlin Properties Socimi SA, REIT EUR 189 2,086 0.01 Red Electrica Corp. SA EUR 418 7,706 0.05 Repsol SA EUR 343 4,634 0.03 Telefonica SA EUR 902 8,219 0.06
218,989 1.53
SwedenCastellum AB SEK 152 1,951 0.01 D Carnegie & Co. AB SEK 26 314 0.00 Dios Fastigheter AB SEK 27 131 0.00
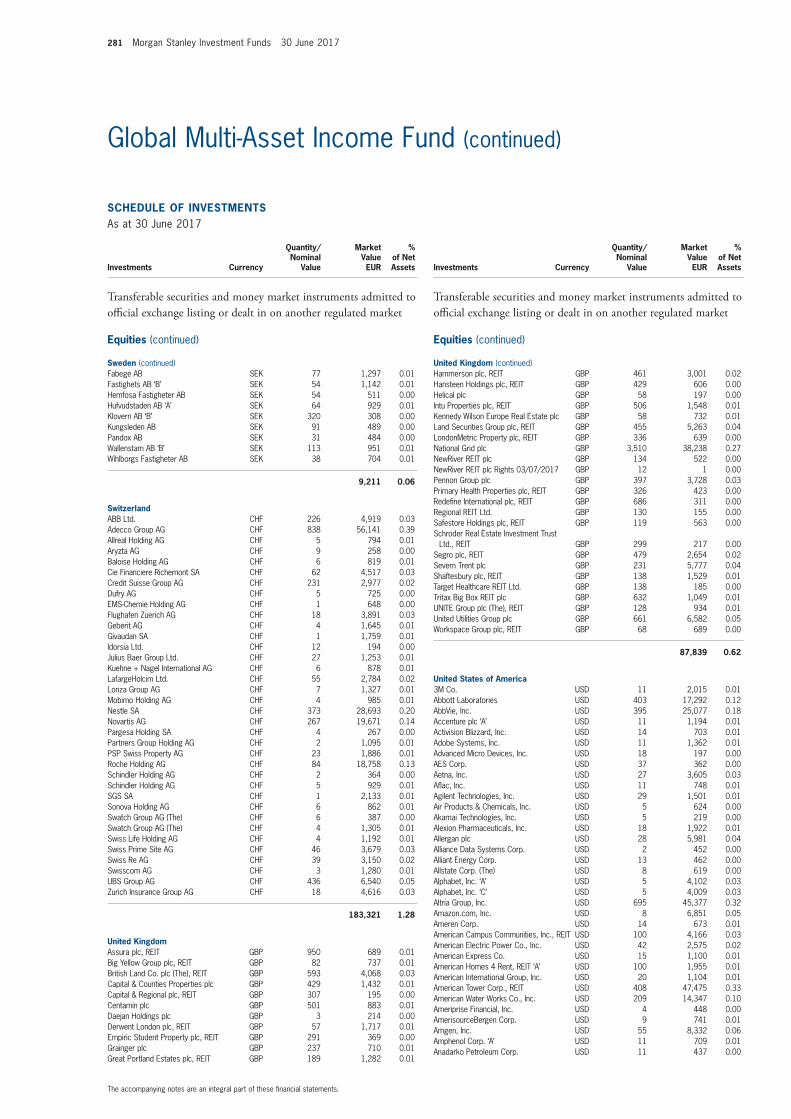
281 Morgan Stanley Investment Funds 30 June 2017
The accompanying notes are an integral part of these fi nancial statements.
Global Multi-Asset Income Fund (continued)
SCHEDULE OF INVESTMENTSAs at 30 June 2017
Investments Currency
Quantity/Nominal
Value
Market Value EUR
% of Net Assets
Transferable securities and money market instruments admitted to offi cial exchange listing or dealt in on another regulated market
Equities (continued)
Sweden (continued)Fabege AB SEK 77 1,297 0.01 Fastighets AB ‘B’ SEK 54 1,142 0.01 Hemfosa Fastigheter AB SEK 54 511 0.00 Hufvudstaden AB ‘A’ SEK 64 929 0.01 Klovern AB ‘B’ SEK 320 308 0.00 Kungsleden AB SEK 91 489 0.00 Pandox AB SEK 31 484 0.00 Wallenstam AB ‘B’ SEK 113 951 0.01 Wihlborgs Fastigheter AB SEK 38 704 0.01
9,211 0.06
SwitzerlandABB Ltd. CHF 226 4,919 0.03 Adecco Group AG CHF 838 56,141 0.39 Allreal Holding AG CHF 5 794 0.01 Aryzta AG CHF 9 258 0.00 Baloise Holding AG CHF 6 819 0.01 Cie Financiere Richemont SA CHF 62 4,517 0.03 Credit Suisse Group AG CHF 231 2,977 0.02 Dufry AG CHF 5 725 0.00 EMS-Chemie Holding AG CHF 1 648 0.00 Flughafen Zuerich AG CHF 18 3,891 0.03 Geberit AG CHF 4 1,645 0.01 Givaudan SA CHF 1 1,759 0.01 Idorsia Ltd. CHF 12 194 0.00 Julius Baer Group Ltd. CHF 27 1,253 0.01 Kuehne + Nagel International AG CHF 6 878 0.01 LafargeHolcim Ltd. CHF 55 2,784 0.02 Lonza Group AG CHF 7 1,327 0.01 Mobimo Holding AG CHF 4 985 0.01 Nestle SA CHF 373 28,693 0.20 Novartis AG CHF 267 19,671 0.14 Pargesa Holding SA CHF 4 267 0.00 Partners Group Holding AG CHF 2 1,095 0.01 PSP Swiss Property AG CHF 23 1,886 0.01 Roche Holding AG CHF 84 18,758 0.13 Schindler Holding AG CHF 2 364 0.00 Schindler Holding AG CHF 5 929 0.01 SGS SA CHF 1 2,133 0.01 Sonova Holding AG CHF 6 862 0.01 Swatch Group AG (The) CHF 6 387 0.00 Swatch Group AG (The) CHF 4 1,305 0.01 Swiss Life Holding AG CHF 4 1,192 0.01 Swiss Prime Site AG CHF 46 3,679 0.03 Swiss Re AG CHF 39 3,150 0.02 Swisscom AG CHF 3 1,280 0.01 UBS Group AG CHF 436 6,540 0.05 Zurich Insurance Group AG CHF 18 4,616 0.03
183,321 1.28
United KingdomAssura plc, REIT GBP 950 689 0.01 Big Yellow Group plc, REIT GBP 82 737 0.01 British Land Co. plc (The), REIT GBP 593 4,068 0.03 Capital & Counties Properties plc GBP 429 1,432 0.01 Capital & Regional plc, REIT GBP 307 195 0.00 Centamin plc GBP 501 883 0.01 Daejan Holdings plc GBP 3 214 0.00 Derwent London plc, REIT GBP 57 1,717 0.01 Empiric Student Property plc, REIT GBP 291 369 0.00 Grainger plc GBP 237 710 0.01 Great Portland Estates plc, REIT GBP 189 1,282 0.01
SCHEDULE OF INVESTMENTSAs at 30 June 2017
Investments Currency
Quantity/Nominal
Value
Market Value EUR
% of Net Assets
Transferable securities and money market instruments admitted to offi cial exchange listing or dealt in on another regulated market
Equities (continued)
United Kingdom (continued)Hammerson plc, REIT GBP 461 3,001 0.02 Hansteen Holdings plc, REIT GBP 429 606 0.00 Helical plc GBP 58 197 0.00 Intu Properties plc, REIT GBP 506 1,548 0.01 Kennedy Wilson Europe Real Estate plc GBP 58 732 0.01 Land Securities Group plc, REIT GBP 455 5,263 0.04 LondonMetric Property plc, REIT GBP 336 639 0.00 National Grid plc GBP 3,510 38,238 0.27 NewRiver REIT plc GBP 134 522 0.00 NewRiver REIT plc Rights 03/07/2017 GBP 12 1 0.00 Pennon Group plc GBP 397 3,728 0.03 Primary Health Properties plc, REIT GBP 326 423 0.00 Redefi ne International plc, REIT GBP 686 311 0.00 Regional REIT Ltd. GBP 130 155 0.00 Safestore Holdings plc, REIT GBP 119 563 0.00 Schroder Real Estate Investment Trust
Ltd., REIT GBP 299 217 0.00 Segro plc, REIT GBP 479 2,654 0.02 Severn Trent plc GBP 231 5,777 0.04 Shaftesbury plc, REIT GBP 138 1,529 0.01 Target Healthcare REIT Ltd. GBP 138 185 0.00 Tritax Big Box REIT plc GBP 632 1,049 0.01 UNITE Group plc (The), REIT GBP 128 934 0.01 United Utilities Group plc GBP 661 6,582 0.05 Workspace Group plc, REIT GBP 68 689 0.00
87,839 0.62
United States of America3M Co. USD 11 2,015 0.01 Abbott Laboratories USD 403 17,292 0.12 AbbVie, Inc. USD 395 25,077 0.18 Accenture plc ‘A’ USD 11 1,194 0.01 Activision Blizzard, Inc. USD 14 703 0.01 Adobe Systems, Inc. USD 11 1,362 0.01 Advanced Micro Devices, Inc. USD 18 197 0.00 AES Corp. USD 37 362 0.00 Aetna, Inc. USD 27 3,605 0.03 Afl ac, Inc. USD 11 748 0.01 Agilent Technologies, Inc. USD 29 1,501 0.01 Air Products & Chemicals, Inc. USD 5 624 0.00 Akamai Technologies, Inc. USD 5 219 0.00 Alexion Pharmaceuticals, Inc. USD 18 1,922 0.01 Allergan plc USD 28 5,981 0.04 Alliance Data Systems Corp. USD 2 452 0.00 Alliant Energy Corp. USD 13 462 0.00 Allstate Corp. (The) USD 8 619 0.00 Alphabet, Inc. ‘A’ USD 5 4,102 0.03 Alphabet, Inc. ‘C’ USD 5 4,009 0.03 Altria Group, Inc. USD 695 45,377 0.32 Amazon.com, Inc. USD 8 6,851 0.05 Ameren Corp. USD 14 673 0.01 American Campus Communities, Inc., REIT USD 100 4,166 0.03 American Electric Power Co., Inc. USD 42 2,575 0.02 American Express Co. USD 15 1,100 0.01 American Homes 4 Rent, REIT ‘A’ USD 100 1,955 0.01 American International Group, Inc. USD 20 1,104 0.01 American Tower Corp., REIT USD 408 47,475 0.33 American Water Works Co., Inc. USD 209 14,347 0.10 Ameriprise Financial, Inc. USD 4 448 0.00 AmerisourceBergen Corp. USD 9 741 0.01 Amgen, Inc. USD 55 8,332 0.06 Amphenol Corp. ‘A’ USD 11 709 0.01 Anadarko Petroleum Corp. USD 11 437 0.00
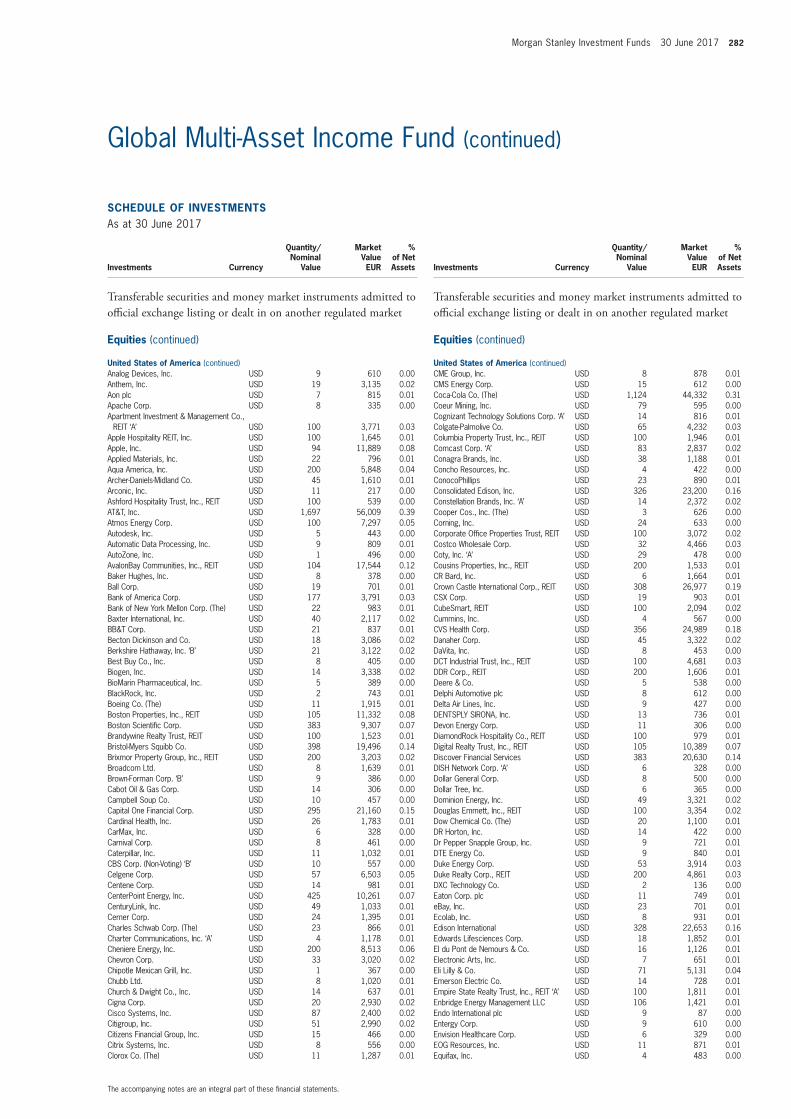
Morgan Stanley Investment Funds 30 June 2017 282
The accompanying notes are an integral part of these fi nancial statements.
Global Multi-Asset Income Fund (continued)
SCHEDULE OF INVESTMENTSAs at 30 June 2017
Investments Currency
Quantity/Nominal
Value
Market Value EUR
% of Net Assets
Transferable securities and money market instruments admitted to offi cial exchange listing or dealt in on another regulated market
Equities (continued)
United States of America (continued)Analog Devices, Inc. USD 9 610 0.00 Anthem, Inc. USD 19 3,135 0.02 Aon plc USD 7 815 0.01 Apache Corp. USD 8 335 0.00 Apartment Investment & Management Co.,
REIT ‘A’ USD 100 3,771 0.03 Apple Hospitality REIT, Inc. USD 100 1,645 0.01 Apple, Inc. USD 94 11,889 0.08 Applied Materials, Inc. USD 22 796 0.01 Aqua America, Inc. USD 200 5,848 0.04 Archer-Daniels-Midland Co. USD 45 1,610 0.01 Arconic, Inc. USD 11 217 0.00 Ashford Hospitality Trust, Inc., REIT USD 100 539 0.00 AT&T, Inc. USD 1,697 56,009 0.39 Atmos Energy Corp. USD 100 7,297 0.05 Autodesk, Inc. USD 5 443 0.00 Automatic Data Processing, Inc. USD 9 809 0.01 AutoZone, Inc. USD 1 496 0.00 AvalonBay Communities, Inc., REIT USD 104 17,544 0.12 Baker Hughes, Inc. USD 8 378 0.00 Ball Corp. USD 19 701 0.01 Bank of America Corp. USD 177 3,791 0.03 Bank of New York Mellon Corp. (The) USD 22 983 0.01 Baxter International, Inc. USD 40 2,117 0.02 BB&T Corp. USD 21 837 0.01 Becton Dickinson and Co. USD 18 3,086 0.02 Berkshire Hathaway, Inc. ‘B’ USD 21 3,122 0.02 Best Buy Co., Inc. USD 8 405 0.00 Biogen, Inc. USD 14 3,338 0.02 BioMarin Pharmaceutical, Inc. USD 5 389 0.00 BlackRock, Inc. USD 2 743 0.01 Boeing Co. (The) USD 11 1,915 0.01 Boston Properties, Inc., REIT USD 105 11,332 0.08 Boston Scientifi c Corp. USD 383 9,307 0.07 Brandywine Realty Trust, REIT USD 100 1,523 0.01 Bristol-Myers Squibb Co. USD 398 19,496 0.14 Brixmor Property Group, Inc., REIT USD 200 3,203 0.02 Broadcom Ltd. USD 8 1,639 0.01 Brown-Forman Corp. ‘B’ USD 9 386 0.00 Cabot Oil & Gas Corp. USD 14 306 0.00 Campbell Soup Co. USD 10 457 0.00 Capital One Financial Corp. USD 295 21,160 0.15 Cardinal Health, Inc. USD 26 1,783 0.01 CarMax, Inc. USD 6 328 0.00 Carnival Corp. USD 8 461 0.00 Caterpillar, Inc. USD 11 1,032 0.01 CBS Corp. (Non-Voting) ‘B’ USD 10 557 0.00 Celgene Corp. USD 57 6,503 0.05 Centene Corp. USD 14 981 0.01 CenterPoint Energy, Inc. USD 425 10,261 0.07 CenturyLink, Inc. USD 49 1,033 0.01 Cerner Corp. USD 24 1,395 0.01 Charles Schwab Corp. (The) USD 23 866 0.01 Charter Communications, Inc. ‘A’ USD 4 1,178 0.01 Cheniere Energy, Inc. USD 200 8,513 0.06 Chevron Corp. USD 33 3,020 0.02 Chipotle Mexican Grill, Inc. USD 1 367 0.00 Chubb Ltd. USD 8 1,020 0.01 Church & Dwight Co., Inc. USD 14 637 0.01 Cigna Corp. USD 20 2,930 0.02 Cisco Systems, Inc. USD 87 2,400 0.02 Citigroup, Inc. USD 51 2,990 0.02 Citizens Financial Group, Inc. USD 15 466 0.00 Citrix Systems, Inc. USD 8 556 0.00 Clorox Co. (The) USD 11 1,287 0.01
SCHEDULE OF INVESTMENTSAs at 30 June 2017
Investments Currency
Quantity/Nominal
Value
Market Value EUR
% of Net Assets
Transferable securities and money market instruments admitted to offi cial exchange listing or dealt in on another regulated market
Equities (continued)
United States of America (continued)CME Group, Inc. USD 8 878 0.01 CMS Energy Corp. USD 15 612 0.00 Coca-Cola Co. (The) USD 1,124 44,332 0.31 Coeur Mining, Inc. USD 79 595 0.00 Cognizant Technology Solutions Corp. ‘A’ USD 14 816 0.01 Colgate-Palmolive Co. USD 65 4,232 0.03 Columbia Property Trust, Inc., REIT USD 100 1,946 0.01 Comcast Corp. ‘A’ USD 83 2,837 0.02 Conagra Brands, Inc. USD 38 1,188 0.01 Concho Resources, Inc. USD 4 422 0.00 ConocoPhillips USD 23 890 0.01 Consolidated Edison, Inc. USD 326 23,200 0.16 Constellation Brands, Inc. ‘A’ USD 14 2,372 0.02 Cooper Cos., Inc. (The) USD 3 626 0.00 Corning, Inc. USD 24 633 0.00 Corporate Offi ce Properties Trust, REIT USD 100 3,072 0.02 Costco Wholesale Corp. USD 32 4,466 0.03 Coty, Inc. ‘A’ USD 29 478 0.00 Cousins Properties, Inc., REIT USD 200 1,533 0.01 CR Bard, Inc. USD 6 1,664 0.01 Crown Castle International Corp., REIT USD 308 26,977 0.19 CSX Corp. USD 19 903 0.01 CubeSmart, REIT USD 100 2,094 0.02 Cummins, Inc. USD 4 567 0.00 CVS Health Corp. USD 356 24,989 0.18 Danaher Corp. USD 45 3,322 0.02 DaVita, Inc. USD 8 453 0.00 DCT Industrial Trust, Inc., REIT USD 100 4,681 0.03 DDR Corp., REIT USD 200 1,606 0.01 Deere & Co. USD 5 538 0.00 Delphi Automotive plc USD 8 612 0.00Delta Air Lines, Inc. USD 9 427 0.00 DENTSPLY SIRONA, Inc. USD 13 736 0.01 Devon Energy Corp. USD 11 306 0.00 DiamondRock Hospitality Co., REIT USD 100 979 0.01 Digital Realty Trust, Inc., REIT USD 105 10,389 0.07 Discover Financial Services USD 383 20,630 0.14 DISH Network Corp. ‘A’ USD 6 328 0.00 Dollar General Corp. USD 8 500 0.00 Dollar Tree, Inc. USD 6 365 0.00 Dominion Energy, Inc. USD 49 3,321 0.02 Douglas Emmett, Inc., REIT USD 100 3,354 0.02 Dow Chemical Co. (The) USD 20 1,100 0.01 DR Horton, Inc. USD 14 422 0.00 Dr Pepper Snapple Group, Inc. USD 9 721 0.01 DTE Energy Co. USD 9 840 0.01 Duke Energy Corp. USD 53 3,914 0.03 Duke Realty Corp., REIT USD 200 4,861 0.03 DXC Technology Co. USD 2 136 0.00 Eaton Corp. plc USD 11 749 0.01 eBay, Inc. USD 23 701 0.01 Ecolab, Inc. USD 8 931 0.01 Edison International USD 328 22,653 0.16 Edwards Lifesciences Corp. USD 18 1,852 0.01 EI du Pont de Nemours & Co. USD 16 1,126 0.01 Electronic Arts, Inc. USD 7 651 0.01 Eli Lilly & Co. USD 71 5,131 0.04 Emerson Electric Co. USD 14 728 0.01 Empire State Realty Trust, Inc., REIT ‘A’ USD 100 1,811 0.01 Enbridge Energy Management LLC USD 106 1,421 0.01 Endo International plc USD 9 87 0.00 Entergy Corp. USD 9 610 0.00 Envision Healthcare Corp. USD 6 329 0.00 EOG Resources, Inc. USD 11 871 0.01 Equifax, Inc. USD 4 483 0.00
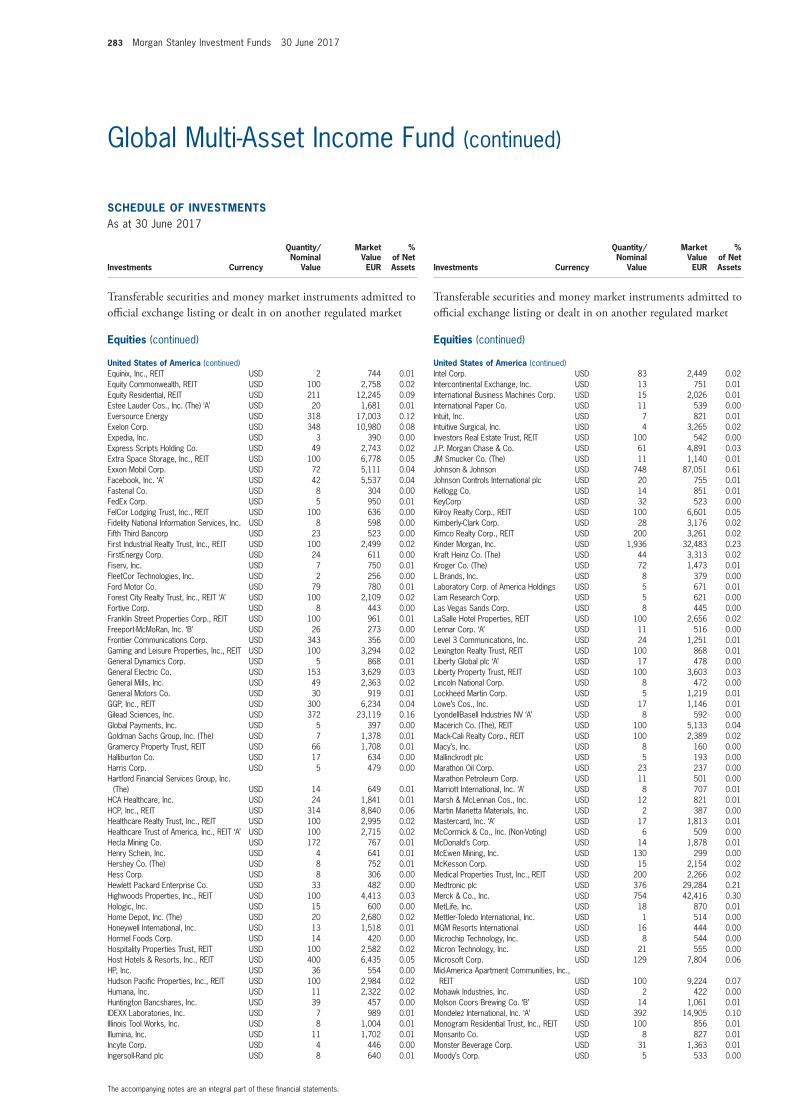
283 Morgan Stanley Investment Funds 30 June 2017
The accompanying notes are an integral part of these fi nancial statements.
Global Multi-Asset Income Fund (continued)
SCHEDULE OF INVESTMENTSAs at 30 June 2017
Investments Currency
Quantity/Nominal
Value
Market Value EUR
% of Net Assets
Transferable securities and money market instruments admitted to offi cial exchange listing or dealt in on another regulated market
Equities (continued)
United States of America (continued)Equinix, Inc., REIT USD 2 744 0.01 Equity Commonwealth, REIT USD 100 2,758 0.02 Equity Residential, REIT USD 211 12,245 0.09 Estee Lauder Cos., Inc. (The) ‘A’ USD 20 1,681 0.01 Eversource Energy USD 318 17,003 0.12 Exelon Corp. USD 348 10,980 0.08 Expedia, Inc. USD 3 390 0.00 Express Scripts Holding Co. USD 49 2,743 0.02 Extra Space Storage, Inc., REIT USD 100 6,778 0.05 Exxon Mobil Corp. USD 72 5,111 0.04 Facebook, Inc. ‘A’ USD 42 5,537 0.04 Fastenal Co. USD 8 304 0.00 FedEx Corp. USD 5 950 0.01 FelCor Lodging Trust, Inc., REIT USD 100 636 0.00 Fidelity National Information Services, Inc. USD 8 598 0.00 Fifth Third Bancorp USD 23 523 0.00 First Industrial Realty Trust, Inc., REIT USD 100 2,499 0.02 FirstEnergy Corp. USD 24 611 0.00 Fiserv, Inc. USD 7 750 0.01 FleetCor Technologies, Inc. USD 2 256 0.00 Ford Motor Co. USD 79 780 0.01 Forest City Realty Trust, Inc., REIT ‘A’ USD 100 2,109 0.02 Fortive Corp. USD 8 443 0.00 Franklin Street Properties Corp., REIT USD 100 961 0.01 Freeport-McMoRan, Inc. ‘B’ USD 26 273 0.00 Frontier Communications Corp. USD 343 356 0.00 Gaming and Leisure Properties, Inc., REIT USD 100 3,294 0.02 General Dynamics Corp. USD 5 868 0.01 General Electric Co. USD 153 3,629 0.03 General Mills, Inc. USD 49 2,363 0.02 General Motors Co. USD 30 919 0.01 GGP, Inc., REIT USD 300 6,234 0.04 Gilead Sciences, Inc. USD 372 23,119 0.16 Global Payments, Inc. USD 5 397 0.00 Goldman Sachs Group, Inc. (The) USD 7 1,378 0.01 Gramercy Property Trust, REIT USD 66 1,708 0.01 Halliburton Co. USD 17 634 0.00 Harris Corp. USD 5 479 0.00 Hartford Financial Services Group, Inc.
(The) USD 14 649 0.01 HCA Healthcare, Inc. USD 24 1,841 0.01 HCP, Inc., REIT USD 314 8,840 0.06 Healthcare Realty Trust, Inc., REIT USD 100 2,995 0.02 Healthcare Trust of America, Inc., REIT ‘A’ USD 100 2,715 0.02 Hecla Mining Co. USD 172 767 0.01 Henry Schein, Inc. USD 4 641 0.01 Hershey Co. (The) USD 8 752 0.01 Hess Corp. USD 8 306 0.00 Hewlett Packard Enterprise Co. USD 33 482 0.00 Highwoods Properties, Inc., REIT USD 100 4,413 0.03 Hologic, Inc. USD 15 600 0.00 Home Depot, Inc. (The) USD 20 2,680 0.02 Honeywell International, Inc. USD 13 1,518 0.01 Hormel Foods Corp. USD 14 420 0.00 Hospitality Properties Trust, REIT USD 100 2,582 0.02 Host Hotels & Resorts, Inc., REIT USD 400 6,435 0.05 HP, Inc. USD 36 554 0.00 Hudson Pacifi c Properties, Inc., REIT USD 100 2,984 0.02 Humana, Inc. USD 11 2,322 0.02 Huntington Bancshares, Inc. USD 39 457 0.00 IDEXX Laboratories, Inc. USD 7 989 0.01 Illinois Tool Works, Inc. USD 8 1,004 0.01 Illumina, Inc. USD 11 1,702 0.01 Incyte Corp. USD 4 446 0.00 Ingersoll-Rand plc USD 8 640 0.01
SCHEDULE OF INVESTMENTSAs at 30 June 2017
Investments Currency
Quantity/Nominal
Value
Market Value EUR
% of Net Assets
Transferable securities and money market instruments admitted to offi cial exchange listing or dealt in on another regulated market
Equities (continued)
United States of America (continued)Intel Corp. USD 83 2,449 0.02 Intercontinental Exchange, Inc. USD 13 751 0.01 International Business Machines Corp. USD 15 2,026 0.01 International Paper Co. USD 11 539 0.00 Intuit, Inc. USD 7 821 0.01 Intuitive Surgical, Inc. USD 4 3,265 0.02 Investors Real Estate Trust, REIT USD 100 542 0.00 J.P. Morgan Chase & Co. USD 61 4,891 0.03 JM Smucker Co. (The) USD 11 1,140 0.01 Johnson & Johnson USD 748 87,051 0.61 Johnson Controls International plc USD 20 755 0.01 Kellogg Co. USD 14 851 0.01 KeyCorp USD 32 523 0.00 Kilroy Realty Corp., REIT USD 100 6,601 0.05 Kimberly-Clark Corp. USD 28 3,176 0.02 Kimco Realty Corp., REIT USD 200 3,261 0.02 Kinder Morgan, Inc. USD 1,936 32,483 0.23 Kraft Heinz Co. (The) USD 44 3,313 0.02 Kroger Co. (The) USD 72 1,473 0.01 L Brands, Inc. USD 8 379 0.00 Laboratory Corp. of America Holdings USD 5 671 0.01 Lam Research Corp. USD 5 621 0.00 Las Vegas Sands Corp. USD 8 445 0.00 LaSalle Hotel Properties, REIT USD 100 2,656 0.02 Lennar Corp. ‘A’ USD 11 516 0.00 Level 3 Communications, Inc. USD 24 1,251 0.01 Lexington Realty Trust, REIT USD 100 868 0.01 Liberty Global plc ‘A’ USD 17 478 0.00 Liberty Property Trust, REIT USD 100 3,603 0.03 Lincoln National Corp. USD 8 472 0.00 Lockheed Martin Corp. USD 5 1,219 0.01 Lowe’s Cos., Inc. USD 17 1,146 0.01 LyondellBasell Industries NV ‘A’ USD 8 592 0.00 Macerich Co. (The), REIT USD 100 5,133 0.04 Mack-Cali Realty Corp., REIT USD 100 2,389 0.02 Macy’s, Inc. USD 8 160 0.00 Mallinckrodt plc USD 5 193 0.00 Marathon Oil Corp. USD 23 237 0.00 Marathon Petroleum Corp. USD 11 501 0.00 Marriott International, Inc. ‘A’ USD 8 707 0.01 Marsh & McLennan Cos., Inc. USD 12 821 0.01 Martin Marietta Materials, Inc. USD 2 387 0.00 Mastercard, Inc. ‘A’ USD 17 1,813 0.01 McCormick & Co., Inc. (Non-Voting) USD 6 509 0.00 McDonald’s Corp. USD 14 1,878 0.01 McEwen Mining, Inc. USD 130 299 0.00 McKesson Corp. USD 15 2,154 0.02 Medical Properties Trust, Inc., REIT USD 200 2,266 0.02 Medtronic plc USD 376 29,284 0.21 Merck & Co., Inc. USD 754 42,416 0.30 MetLife, Inc. USD 18 870 0.01 Mettler-Toledo International, Inc. USD 1 514 0.00 MGM Resorts International USD 16 444 0.00 Microchip Technology, Inc. USD 8 544 0.00 Micron Technology, Inc. USD 21 555 0.00 Microsoft Corp. USD 129 7,804 0.06 Mid-America Apartment Communities, Inc.,
REIT USD 100 9,224 0.07 Mohawk Industries, Inc. USD 2 422 0.00 Molson Coors Brewing Co. ‘B’ USD 14 1,061 0.01 Mondelez International, Inc. ‘A’ USD 392 14,905 0.10 Monogram Residential Trust, Inc., REIT USD 100 856 0.01 Monsanto Co. USD 8 827 0.01 Monster Beverage Corp. USD 31 1,363 0.01 Moody’s Corp. USD 5 533 0.00
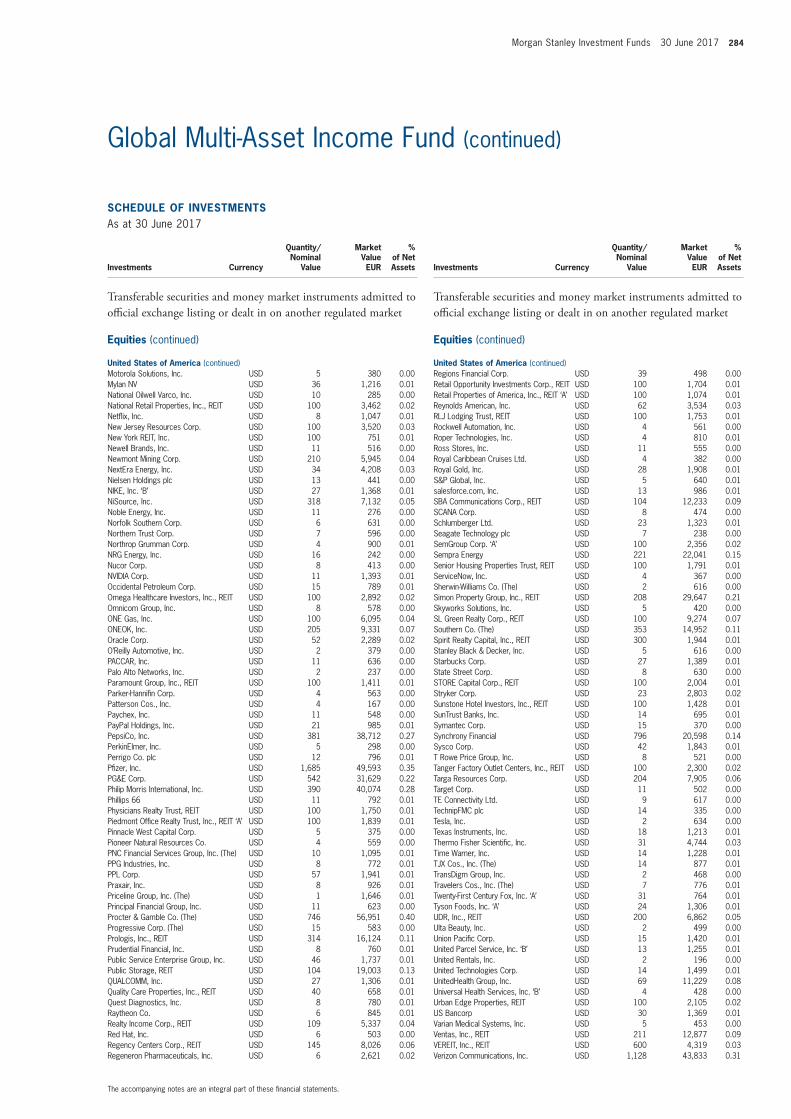
Morgan Stanley Investment Funds 30 June 2017 284
The accompanying notes are an integral part of these fi nancial statements.
Global Multi-Asset Income Fund (continued)
SCHEDULE OF INVESTMENTSAs at 30 June 2017
Investments Currency
Quantity/Nominal
Value
Market Value EUR
% of Net Assets
Transferable securities and money market instruments admitted to offi cial exchange listing or dealt in on another regulated market
Equities (continued)
United States of America (continued)Motorola Solutions, Inc. USD 5 380 0.00 Mylan NV USD 36 1,216 0.01 National Oilwell Varco, Inc. USD 10 285 0.00 National Retail Properties, Inc., REIT USD 100 3,462 0.02 Netfl ix, Inc. USD 8 1,047 0.01 New Jersey Resources Corp. USD 100 3,520 0.03 New York REIT, Inc. USD 100 751 0.01 Newell Brands, Inc. USD 11 516 0.00 Newmont Mining Corp. USD 210 5,945 0.04 NextEra Energy, Inc. USD 34 4,208 0.03 Nielsen Holdings plc USD 13 441 0.00 NIKE, Inc. ‘B’ USD 27 1,368 0.01 NiSource, Inc. USD 318 7,132 0.05 Noble Energy, Inc. USD 11 276 0.00 Norfolk Southern Corp. USD 6 631 0.00 Northern Trust Corp. USD 7 596 0.00 Northrop Grumman Corp. USD 4 900 0.01 NRG Energy, Inc. USD 16 242 0.00 Nucor Corp. USD 8 413 0.00 NVIDIA Corp. USD 11 1,393 0.01 Occidental Petroleum Corp. USD 15 789 0.01 Omega Healthcare Investors, Inc., REIT USD 100 2,892 0.02 Omnicom Group, Inc. USD 8 578 0.00 ONE Gas, Inc. USD 100 6,095 0.04 ONEOK, Inc. USD 205 9,331 0.07 Oracle Corp. USD 52 2,289 0.02 O’Reilly Automotive, Inc. USD 2 379 0.00 PACCAR, Inc. USD 11 636 0.00 Palo Alto Networks, Inc. USD 2 237 0.00 Paramount Group, Inc., REIT USD 100 1,411 0.01 Parker-Hannifi n Corp. USD 4 563 0.00 Patterson Cos., Inc. USD 4 167 0.00 Paychex, Inc. USD 11 548 0.00 PayPal Holdings, Inc. USD 21 985 0.01 PepsiCo, Inc. USD 381 38,712 0.27 PerkinElmer, Inc. USD 5 298 0.00 Perrigo Co. plc USD 12 796 0.01 Pfi zer, Inc. USD 1,685 49,593 0.35 PG&E Corp. USD 542 31,629 0.22 Philip Morris International, Inc. USD 390 40,074 0.28 Phillips 66 USD 11 792 0.01 Physicians Realty Trust, REIT USD 100 1,750 0.01 Piedmont Offi ce Realty Trust, Inc., REIT ‘A’ USD 100 1,839 0.01 Pinnacle West Capital Corp. USD 5 375 0.00 Pioneer Natural Resources Co. USD 4 559 0.00 PNC Financial Services Group, Inc. (The) USD 10 1,095 0.01 PPG Industries, Inc. USD 8 772 0.01 PPL Corp. USD 57 1,941 0.01 Praxair, Inc. USD 8 926 0.01 Priceline Group, Inc. (The) USD 1 1,646 0.01 Principal Financial Group, Inc. USD 11 623 0.00 Procter & Gamble Co. (The) USD 746 56,951 0.40 Progressive Corp. (The) USD 15 583 0.00 Prologis, Inc., REIT USD 314 16,124 0.11 Prudential Financial, Inc. USD 8 760 0.01 Public Service Enterprise Group, Inc. USD 46 1,737 0.01 Public Storage, REIT USD 104 19,003 0.13 QUALCOMM, Inc. USD 27 1,306 0.01 Quality Care Properties, Inc., REIT USD 40 658 0.01 Quest Diagnostics, Inc. USD 8 780 0.01 Raytheon Co. USD 6 845 0.01 Realty Income Corp., REIT USD 109 5,337 0.04 Red Hat, Inc. USD 6 503 0.00 Regency Centers Corp., REIT USD 145 8,026 0.06 Regeneron Pharmaceuticals, Inc. USD 6 2,621 0.02
SCHEDULE OF INVESTMENTSAs at 30 June 2017
Investments Currency
Quantity/Nominal
Value
Market Value EUR
% of Net Assets
Transferable securities and money market instruments admitted to offi cial exchange listing or dealt in on another regulated market
Equities (continued)
United States of America (continued)Regions Financial Corp. USD 39 498 0.00 Retail Opportunity Investments Corp., REIT USD 100 1,704 0.01 Retail Properties of America, Inc., REIT ‘A’ USD 100 1,074 0.01 Reynolds American, Inc. USD 62 3,534 0.03 RLJ Lodging Trust, REIT USD 100 1,753 0.01 Rockwell Automation, Inc. USD 4 561 0.00 Roper Technologies, Inc. USD 4 810 0.01 Ross Stores, Inc. USD 11 555 0.00 Royal Caribbean Cruises Ltd. USD 4 382 0.00 Royal Gold, Inc. USD 28 1,908 0.01 S&P Global, Inc. USD 5 640 0.01 salesforce.com, Inc. USD 13 986 0.01 SBA Communications Corp., REIT USD 104 12,233 0.09 SCANA Corp. USD 8 474 0.00 Schlumberger Ltd. USD 23 1,323 0.01 Seagate Technology plc USD 7 238 0.00 SemGroup Corp. ‘A’ USD 100 2,356 0.02 Sempra Energy USD 221 22,041 0.15 Senior Housing Properties Trust, REIT USD 100 1,791 0.01 ServiceNow, Inc. USD 4 367 0.00 Sherwin-Williams Co. (The) USD 2 616 0.00 Simon Property Group, Inc., REIT USD 208 29,647 0.21 Skyworks Solutions, Inc. USD 5 420 0.00 SL Green Realty Corp., REIT USD 100 9,274 0.07 Southern Co. (The) USD 353 14,952 0.11 Spirit Realty Capital, Inc., REIT USD 300 1,944 0.01 Stanley Black & Decker, Inc. USD 5 616 0.00 Starbucks Corp. USD 27 1,389 0.01 State Street Corp. USD 8 630 0.00 STORE Capital Corp., REIT USD 100 2,004 0.01 Stryker Corp. USD 23 2,803 0.02 Sunstone Hotel Investors, Inc., REIT USD 100 1,428 0.01 SunTrust Banks, Inc. USD 14 695 0.01 Symantec Corp. USD 15 370 0.00 Synchrony Financial USD 796 20,598 0.14 Sysco Corp. USD 42 1,843 0.01 T Rowe Price Group, Inc. USD 8 521 0.00 Tanger Factory Outlet Centers, Inc., REIT USD 100 2,300 0.02 Targa Resources Corp. USD 204 7,905 0.06 Target Corp. USD 11 502 0.00 TE Connectivity Ltd. USD 9 617 0.00 TechnipFMC plc USD 14 335 0.00 Tesla, Inc. USD 2 634 0.00 Texas Instruments, Inc. USD 18 1,213 0.01 Thermo Fisher Scientifi c, Inc. USD 31 4,744 0.03 Time Warner, Inc. USD 14 1,228 0.01 TJX Cos., Inc. (The) USD 14 877 0.01 TransDigm Group, Inc. USD 2 468 0.00 Travelers Cos., Inc. (The) USD 7 776 0.01 Twenty-First Century Fox, Inc. ‘A’ USD 31 764 0.01 Tyson Foods, Inc. ‘A’ USD 24 1,306 0.01 UDR, Inc., REIT USD 200 6,862 0.05 Ulta Beauty, Inc. USD 2 499 0.00 Union Pacifi c Corp. USD 15 1,420 0.01 United Parcel Service, Inc. ‘B’ USD 13 1,255 0.01 United Rentals, Inc. USD 2 196 0.00 United Technologies Corp. USD 14 1,499 0.01 UnitedHealth Group, Inc. USD 69 11,229 0.08 Universal Health Services, Inc. ‘B’ USD 4 428 0.00 Urban Edge Properties, REIT USD 100 2,105 0.02 US Bancorp USD 30 1,369 0.01 Varian Medical Systems, Inc. USD 5 453 0.00 Ventas, Inc., REIT USD 211 12,877 0.09 VEREIT, Inc., REIT USD 600 4,319 0.03 Verizon Communications, Inc. USD 1,128 43,833 0.31
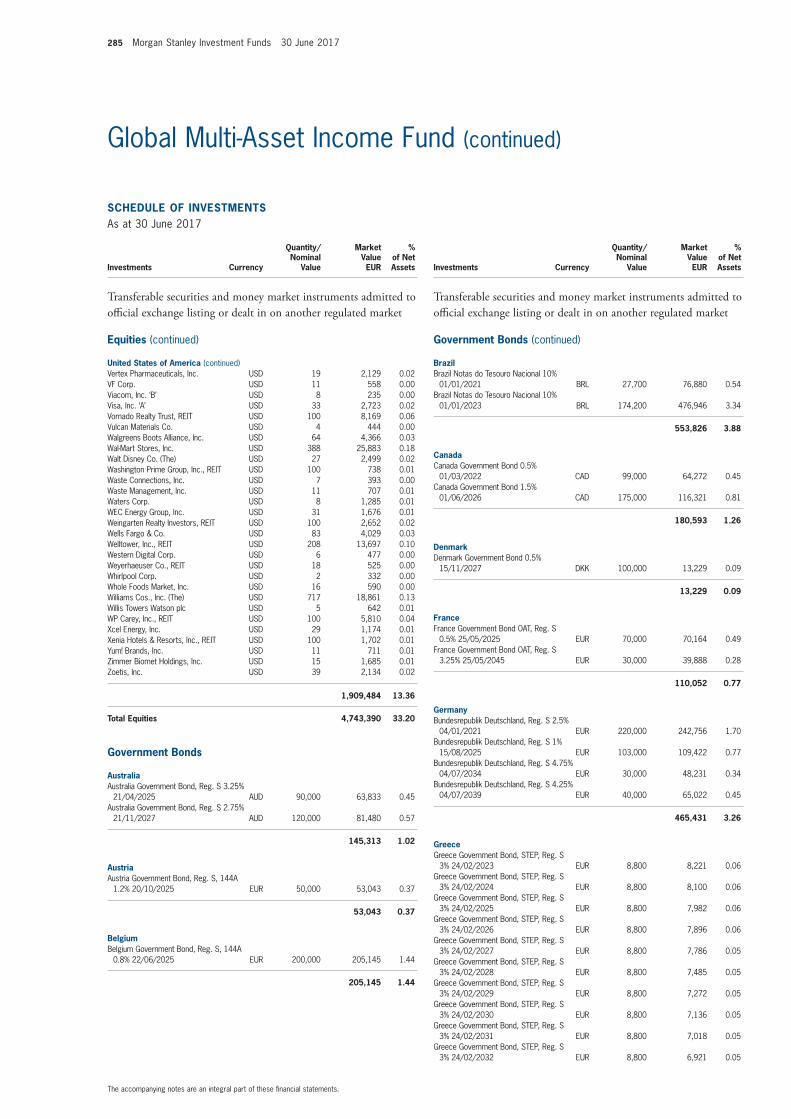
285 Morgan Stanley Investment Funds 30 June 2017
The accompanying notes are an integral part of these fi nancial statements.
Global Multi-Asset Income Fund (continued)
SCHEDULE OF INVESTMENTSAs at 30 June 2017
Investments Currency
Quantity/Nominal
Value
Market Value EUR
% of Net Assets
Transferable securities and money market instruments admitted to offi cial exchange listing or dealt in on another regulated market
Equities (continued)
United States of America (continued)Vertex Pharmaceuticals, Inc. USD 19 2,129 0.02 VF Corp. USD 11 558 0.00 Viacom, Inc. ‘B’ USD 8 235 0.00 Visa, Inc. ‘A’ USD 33 2,723 0.02 Vornado Realty Trust, REIT USD 100 8,169 0.06 Vulcan Materials Co. USD 4 444 0.00 Walgreens Boots Alliance, Inc. USD 64 4,366 0.03 Wal-Mart Stores, Inc. USD 388 25,883 0.18 Walt Disney Co. (The) USD 27 2,499 0.02 Washington Prime Group, Inc., REIT USD 100 738 0.01 Waste Connections, Inc. USD 7 393 0.00 Waste Management, Inc. USD 11 707 0.01 Waters Corp. USD 8 1,285 0.01 WEC Energy Group, Inc. USD 31 1,676 0.01 Weingarten Realty Investors, REIT USD 100 2,652 0.02 Wells Fargo & Co. USD 83 4,029 0.03 Welltower, Inc., REIT USD 208 13,697 0.10 Western Digital Corp. USD 6 477 0.00 Weyerhaeuser Co., REIT USD 18 525 0.00 Whirlpool Corp. USD 2 332 0.00 Whole Foods Market, Inc. USD 16 590 0.00 Williams Cos., Inc. (The) USD 717 18,861 0.13 Willis Towers Watson plc USD 5 642 0.01 WP Carey, Inc., REIT USD 100 5,810 0.04 Xcel Energy, Inc. USD 29 1,174 0.01 Xenia Hotels & Resorts, Inc., REIT USD 100 1,702 0.01 Yum! Brands, Inc. USD 11 711 0.01 Zimmer Biomet Holdings, Inc. USD 15 1,685 0.01 Zoetis, Inc. USD 39 2,134 0.02
1,909,484 13.36
Total Equities 4,743,390 33.20
Government Bonds
AustraliaAustralia Government Bond, Reg. S 3.25%
21/04/2025 AUD 90,000 63,833 0.45 Australia Government Bond, Reg. S 2.75%
21/11/2027 AUD 120,000 81,480 0.57
145,313 1.02
AustriaAustria Government Bond, Reg. S, 144A
1.2% 20/10/2025 EUR 50,000 53,043 0.37
53,043 0.37
BelgiumBelgium Government Bond, Reg. S, 144A
0.8% 22/06/2025 EUR 200,000 205,145 1.44
205,145 1.44
SCHEDULE OF INVESTMENTSAs at 30 June 2017
Investments Currency
Quantity/Nominal
Value
Market Value EUR
% of Net Assets
Transferable securities and money market instruments admitted to offi cial exchange listing or dealt in on another regulated market
Government Bonds (continued)
BrazilBrazil Notas do Tesouro Nacional 10%
01/01/2021 BRL 27,700 76,880 0.54 Brazil Notas do Tesouro Nacional 10%
01/01/2023 BRL 174,200 476,946 3.34
553,826 3.88
CanadaCanada Government Bond 0.5%
01/03/2022 CAD 99,000 64,272 0.45 Canada Government Bond 1.5%
01/06/2026 CAD 175,000 116,321 0.81
180,593 1.26
DenmarkDenmark Government Bond 0.5%
15/11/2027 DKK 100,000 13,229 0.09
13,229 0.09
FranceFrance Government Bond OAT, Reg. S
0.5% 25/05/2025 EUR 70,000 70,164 0.49 France Government Bond OAT, Reg. S
3.25% 25/05/2045 EUR 30,000 39,888 0.28
110,052 0.77
GermanyBundesrepublik Deutschland, Reg. S 2.5%
04/01/2021 EUR 220,000 242,756 1.70 Bundesrepublik Deutschland, Reg. S 1%
15/08/2025 EUR 103,000 109,422 0.77 Bundesrepublik Deutschland, Reg. S 4.75%
04/07/2034 EUR 30,000 48,231 0.34 Bundesrepublik Deutschland, Reg. S 4.25%
04/07/2039 EUR 40,000 65,022 0.45
465,431 3.26
GreeceGreece Government Bond, STEP, Reg. S
3% 24/02/2023 EUR 8,800 8,221 0.06 Greece Government Bond, STEP, Reg. S
3% 24/02/2024 EUR 8,800 8,100 0.06 Greece Government Bond, STEP, Reg. S
3% 24/02/2025 EUR 8,800 7,982 0.06 Greece Government Bond, STEP, Reg. S
3% 24/02/2026 EUR 8,800 7,896 0.06 Greece Government Bond, STEP, Reg. S
3% 24/02/2027 EUR 8,800 7,786 0.05 Greece Government Bond, STEP, Reg. S
3% 24/02/2028 EUR 8,800 7,485 0.05 Greece Government Bond, STEP, Reg. S
3% 24/02/2029 EUR 8,800 7,272 0.05 Greece Government Bond, STEP, Reg. S
3% 24/02/2030 EUR 8,800 7,136 0.05 Greece Government Bond, STEP, Reg. S
3% 24/02/2031 EUR 8,800 7,018 0.05 Greece Government Bond, STEP, Reg. S
3% 24/02/2032 EUR 8,800 6,921 0.05
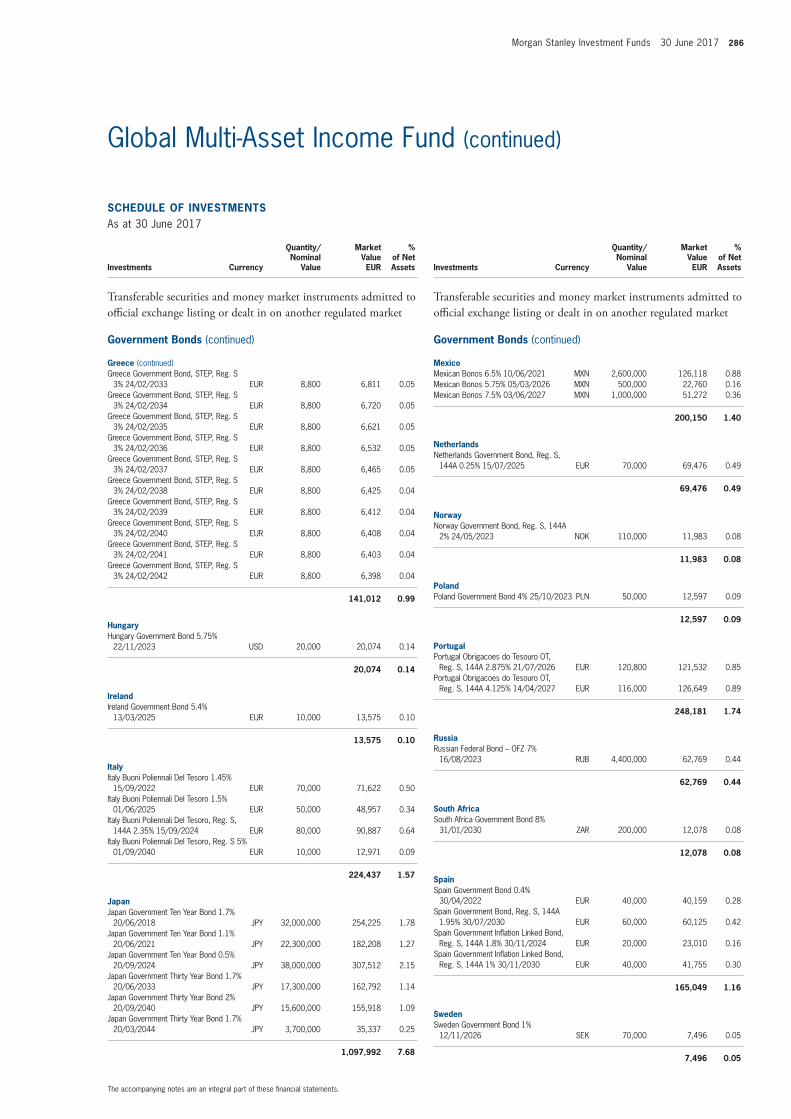
Morgan Stanley Investment Funds 30 June 2017 286
The accompanying notes are an integral part of these fi nancial statements.
Global Multi-Asset Income Fund (continued)
SCHEDULE OF INVESTMENTSAs at 30 June 2017
Investments Currency
Quantity/Nominal
Value
Market Value EUR
% of Net Assets
Transferable securities and money market instruments admitted to offi cial exchange listing or dealt in on another regulated market
Government Bonds (continued)
Greece (continued)Greece Government Bond, STEP, Reg. S
3% 24/02/2033 EUR 8,800 6,811 0.05 Greece Government Bond, STEP, Reg. S
3% 24/02/2034 EUR 8,800 6,720 0.05 Greece Government Bond, STEP, Reg. S
3% 24/02/2035 EUR 8,800 6,621 0.05 Greece Government Bond, STEP, Reg. S
3% 24/02/2036 EUR 8,800 6,532 0.05 Greece Government Bond, STEP, Reg. S
3% 24/02/2037 EUR 8,800 6,465 0.05 Greece Government Bond, STEP, Reg. S
3% 24/02/2038 EUR 8,800 6,425 0.04 Greece Government Bond, STEP, Reg. S
3% 24/02/2039 EUR 8,800 6,412 0.04 Greece Government Bond, STEP, Reg. S
3% 24/02/2040 EUR 8,800 6,408 0.04 Greece Government Bond, STEP, Reg. S
3% 24/02/2041 EUR 8,800 6,403 0.04 Greece Government Bond, STEP, Reg. S
3% 24/02/2042 EUR 8,800 6,398 0.04
141,012 0.99
HungaryHungary Government Bond 5.75%
22/11/2023 USD 20,000 20,074 0.14
20,074 0.14
IrelandIreland Government Bond 5.4%
13/03/2025 EUR 10,000 13,575 0.10
13,575 0.10
ItalyItaly Buoni Poliennali Del Tesoro 1.45%
15/09/2022 EUR 70,000 71,622 0.50 Italy Buoni Poliennali Del Tesoro 1.5%
01/06/2025 EUR 50,000 48,957 0.34 Italy Buoni Poliennali Del Tesoro, Reg. S,
144A 2.35% 15/09/2024 EUR 80,000 90,887 0.64 Italy Buoni Poliennali Del Tesoro, Reg. S 5%
01/09/2040 EUR 10,000 12,971 0.09
224,437 1.57
JapanJapan Government Ten Year Bond 1.7%
20/06/2018 JPY 32,000,000 254,225 1.78 Japan Government Ten Year Bond 1.1%
20/06/2021 JPY 22,300,000 182,208 1.27 Japan Government Ten Year Bond 0.5%
20/09/2024 JPY 38,000,000 307,512 2.15 Japan Government Thirty Year Bond 1.7%
20/06/2033 JPY 17,300,000 162,792 1.14 Japan Government Thirty Year Bond 2%
20/09/2040 JPY 15,600,000 155,918 1.09 Japan Government Thirty Year Bond 1.7%
20/03/2044 JPY 3,700,000 35,337 0.25
1,097,992 7.68
SCHEDULE OF INVESTMENTSAs at 30 June 2017
Investments Currency
Quantity/Nominal
Value
Market Value EUR
% of Net Assets
Transferable securities and money market instruments admitted to offi cial exchange listing or dealt in on another regulated market
Government Bonds (continued)
MexicoMexican Bonos 6.5% 10/06/2021 MXN 2,600,000 126,118 0.88 Mexican Bonos 5.75% 05/03/2026 MXN 500,000 22,760 0.16 Mexican Bonos 7.5% 03/06/2027 MXN 1,000,000 51,272 0.36
200,150 1.40
NetherlandsNetherlands Government Bond, Reg. S,
144A 0.25% 15/07/2025 EUR 70,000 69,476 0.49
69,476 0.49
NorwayNorway Government Bond, Reg. S, 144A
2% 24/05/2023 NOK 110,000 11,983 0.08
11,983 0.08
PolandPoland Government Bond 4% 25/10/2023 PLN 50,000 12,597 0.09
12,597 0.09
PortugalPortugal Obrigacoes do Tesouro OT,
Reg. S, 144A 2.875% 21/07/2026 EUR 120,800 121,532 0.85 Portugal Obrigacoes do Tesouro OT,
Reg. S, 144A 4.125% 14/04/2027 EUR 116,000 126,649 0.89
248,181 1.74
RussiaRussian Federal Bond – OFZ 7%
16/08/2023 RUB 4,400,000 62,769 0.44
62,769 0.44
South AfricaSouth Africa Government Bond 8%
31/01/2030 ZAR 200,000 12,078 0.08
12,078 0.08
SpainSpain Government Bond 0.4%
30/04/2022 EUR 40,000 40,159 0.28 Spain Government Bond, Reg. S, 144A
1.95% 30/07/2030 EUR 60,000 60,125 0.42 Spain Government Infl ation Linked Bond,
Reg. S, 144A 1.8% 30/11/2024 EUR 20,000 23,010 0.16 Spain Government Infl ation Linked Bond,
Reg. S, 144A 1% 30/11/2030 EUR 40,000 41,755 0.30
165,049 1.16
SwedenSweden Government Bond 1%
12/11/2026 SEK 70,000 7,496 0.05
7,496 0.05
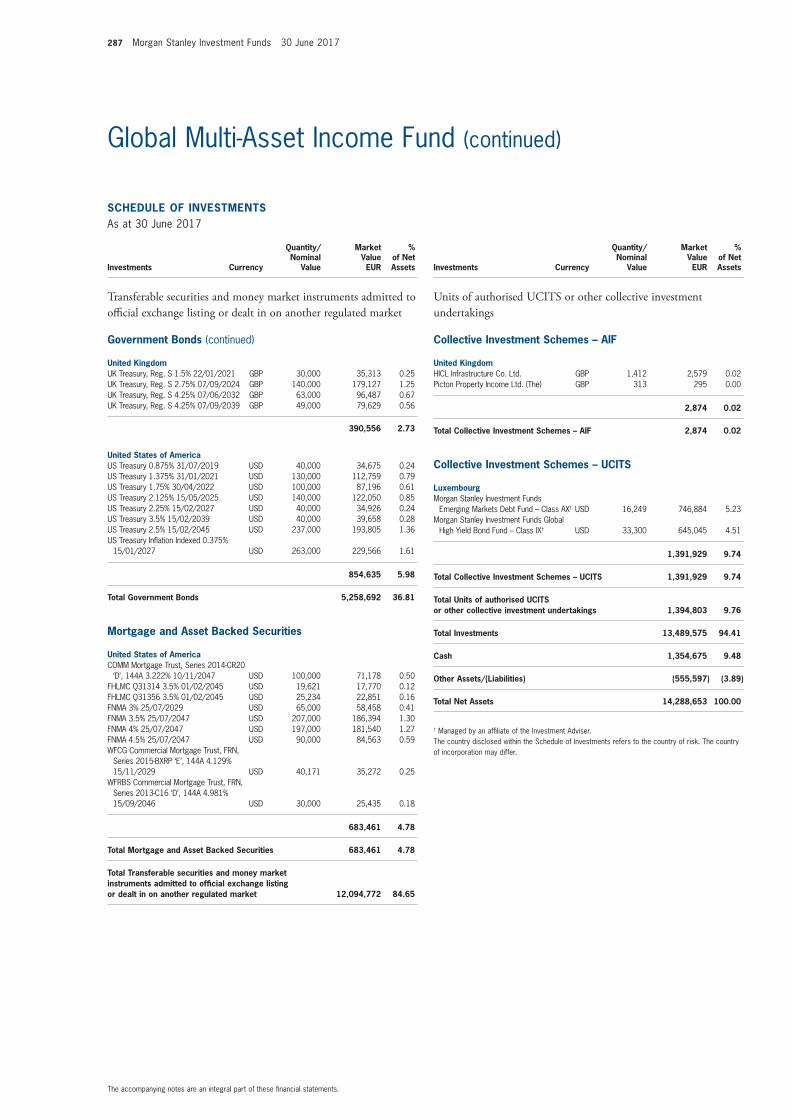
287 Morgan Stanley Investment Funds 30 June 2017
The accompanying notes are an integral part of these fi nancial statements.
Global Multi-Asset Income Fund (continued)
SCHEDULE OF INVESTMENTSAs at 30 June 2017
Investments Currency
Quantity/Nominal
Value
Market Value EUR
% of Net Assets
Transferable securities and money market instruments admitted to offi cial exchange listing or dealt in on another regulated market
Government Bonds (continued)
United KingdomUK Treasury, Reg. S 1.5% 22/01/2021 GBP 30,000 35,313 0.25 UK Treasury, Reg. S 2.75% 07/09/2024 GBP 140,000 179,127 1.25 UK Treasury, Reg. S 4.25% 07/06/2032 GBP 63,000 96,487 0.67 UK Treasury, Reg. S 4.25% 07/09/2039 GBP 49,000 79,629 0.56
390,556 2.73
United States of AmericaUS Treasury 0.875% 31/07/2019 USD 40,000 34,675 0.24 US Treasury 1.375% 31/01/2021 USD 130,000 112,759 0.79 US Treasury 1.75% 30/04/2022 USD 100,000 87,196 0.61 US Treasury 2.125% 15/05/2025 USD 140,000 122,050 0.85 US Treasury 2.25% 15/02/2027 USD 40,000 34,926 0.24 US Treasury 3.5% 15/02/2039 USD 40,000 39,658 0.28 US Treasury 2.5% 15/02/2045 USD 237,000 193,805 1.36 US Treasury Infl ation Indexed 0.375%
15/01/2027 USD 263,000 229,566 1.61
854,635 5.98
Total Government Bonds 5,258,692 36.81
Mortgage and Asset Backed Securities
United States of AmericaCOMM Mortgage Trust, Series 2014-CR20
‘D’, 144A 3.222% 10/11/2047 USD 100,000 71,178 0.50 FHLMC Q31314 3.5% 01/02/2045 USD 19,621 17,770 0.12 FHLMC Q31356 3.5% 01/02/2045 USD 25,234 22,851 0.16 FNMA 3% 25/07/2029 USD 65,000 58,458 0.41 FNMA 3.5% 25/07/2047 USD 207,000 186,394 1.30 FNMA 4% 25/07/2047 USD 197,000 181,540 1.27 FNMA 4.5% 25/07/2047 USD 90,000 84,563 0.59 WFCG Commercial Mortgage Trust, FRN,
Series 2015-BXRP ‘E’, 144A 4.129% 15/11/2029 USD 40,171 35,272 0.25
WFRBS Commercial Mortgage Trust, FRN, Series 2013-C16 ‘D’, 144A 4.981% 15/09/2046 USD 30,000 25,435 0.18
683,461 4.78
Total Mortgage and Asset Backed Securities 683,461 4.78
Total Transferable securities and money market instruments admitted to offi cial exchange listing or dealt in on another regulated market 12,094,772 84.65
SCHEDULE OF INVESTMENTSAs at 30 June 2017
Investments Currency
Quantity/Nominal
Value
Market Value EUR
% of Net Assets
Units of authorised UCITS or other collective investment undertakings
Collective Investment Schemes – AIF
United KingdomHICL Infrastructure Co. Ltd. GBP 1,412 2,579 0.02 Picton Property Income Ltd. (The) GBP 313 295 0.00
2,874 0.02
Total Collective Investment Schemes – AIF 2,874 0.02
Collective Investment Schemes – UCITS
LuxembourgMorgan Stanley Investment Funds
Emerging Markets Debt Fund – Class AX† USD 16,249 746,884 5.23 Morgan Stanley Investment Funds Global
High Yield Bond Fund – Class IX† USD 33,300 645,045 4.51
1,391,929 9.74
Total Collective Investment Schemes – UCITS 1,391,929 9.74
Total Units of authorised UCITS or other collective investment undertakings 1,394,803 9.76
Total Investments 13,489,575 94.41
Cash 1,354,675 9.48
Other Assets/(Liabilities) (555,597) (3.89)
Total Net Assets 14,288,653 100.00
† Managed by an affi liate of the Investment Adviser.The country disclosed within the Schedule of Investments refers to the country of risk. The country of incorporation may differ.
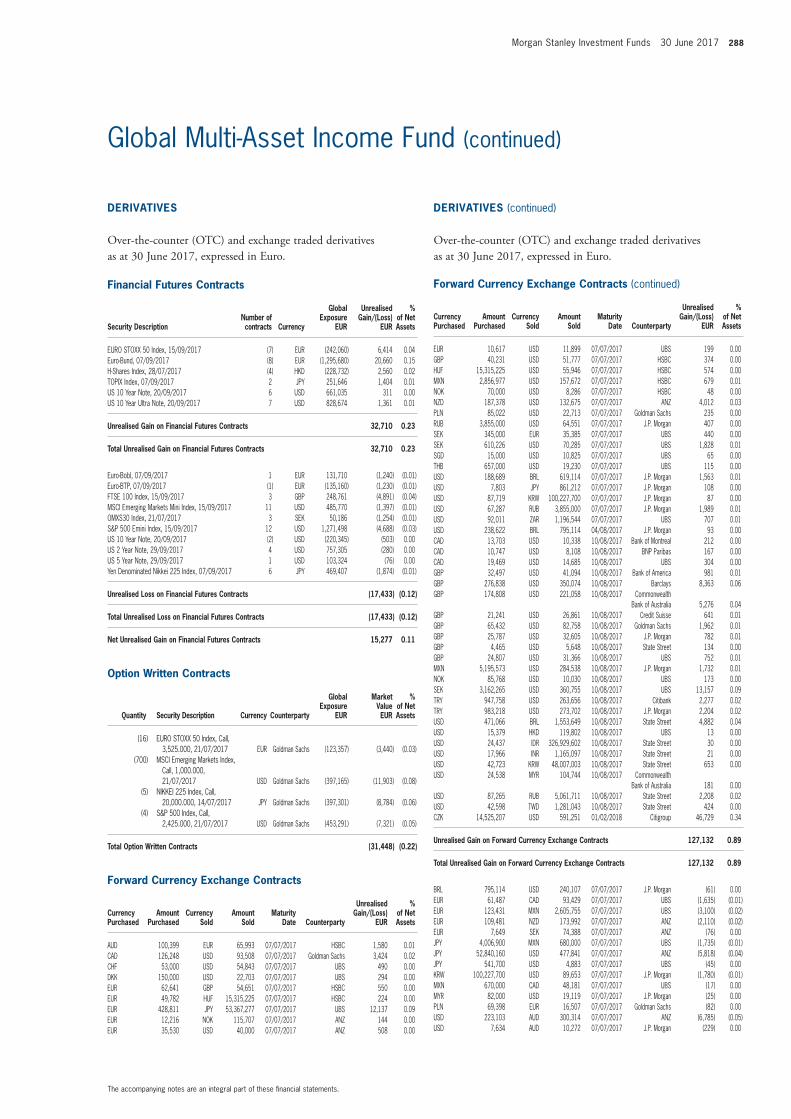
Morgan Stanley Investment Funds 30 June 2017 288
The accompanying notes are an integral part of these fi nancial statements.
Global Multi-Asset Income Fund (continued)
Financial Futures Contracts
Security DescriptionNumber of contracts Currency
Global Exposure
EUR
Unrealised Gain/(Loss)
EUR
% of Net Assets
EURO STOXX 50 Index, 15/09/2017 (7) EUR (242,060) 6,414 0.04 Euro-Bund, 07/09/2017 (8) EUR (1,295,680) 20,660 0.15 H-Shares Index, 28/07/2017 (4) HKD (228,732) 2,560 0.02 TOPIX Index, 07/09/2017 2 JPY 251,646 1,404 0.01 US 10 Year Note, 20/09/2017 6 USD 661,035 311 0.00 US 10 Year Ultra Note, 20/09/2017 7 USD 828,674 1,361 0.01
Unrealised Gain on Financial Futures Contracts 32,710 0.23
Total Unrealised Gain on Financial Futures Contracts 32,710 0.23
Euro-Bobl, 07/09/2017 1 EUR 131,710 (1,240) (0.01) Euro-BTP, 07/09/2017 (1) EUR (135,160) (1,230) (0.01) FTSE 100 Index, 15/09/2017 3 GBP 248,761 (4,891) (0.04) MSCI Emerging Markets Mini Index, 15/09/2017 11 USD 485,770 (1,397) (0.01) OMXS30 Index, 21/07/2017 3 SEK 50,186 (1,254) (0.01) S&P 500 Emini Index, 15/09/2017 12 USD 1,271,498 (4,688) (0.03) US 10 Year Note, 20/09/2017 (2) USD (220,345) (503) 0.00 US 2 Year Note, 29/09/2017 4 USD 757,305 (280) 0.00 US 5 Year Note, 29/09/2017 1 USD 103,324 (76) 0.00 Yen Denominated Nikkei 225 Index, 07/09/2017 6 JPY 469,407 (1,874) (0.01)
Unrealised Loss on Financial Futures Contracts (17,433) (0.12)
Total Unrealised Loss on Financial Futures Contracts (17,433) (0.12)
Net Unrealised Gain on Financial Futures Contracts 15,277 0.11
Option Written Contracts
Quantity Security Description Currency Counterparty
Global Exposure
EUR
Market Value EUR
% of Net Assets
(16) EURO STOXX 50 Index, Call, 3,525.000, 21/07/2017 EUR Goldman Sachs (123,357) (3,440) (0.03)
(700) MSCI Emerging Markets Index, Call, 1,000.000, 21/07/2017 USD Goldman Sachs (397,165) (11,903) (0.08)
(5) NIKKEI 225 Index, Call, 20,000.000, 14/07/2017 JPY Goldman Sachs (397,301) (8,784) (0.06)
(4) S&P 500 Index, Call, 2,425.000, 21/07/2017 USD Goldman Sachs (453,291) (7,321) (0.05)
Total Option Written Contracts (31,448) (0.22)
Forward Currency Exchange Contracts (continued)
Currency Purchased
Amount Purchased
Currency Sold
Amount Sold
Maturity Date Counterparty
Unrealised Gain/(Loss)
EUR
% of Net Assets
AUD 100,399 EUR 65,993 07/07/2017 HSBC 1,580 0.01 CAD 126,248 USD 93,508 07/07/2017 Goldman Sachs 3,424 0.02 CHF 53,000 USD 54,843 07/07/2017 UBS 490 0.00 DKK 150,000 USD 22,703 07/07/2017 UBS 294 0.00 EUR 62,641 GBP 54,651 07/07/2017 HSBC 550 0.00 EUR 49,782 HUF 15,315,225 07/07/2017 HSBC 224 0.00 EUR 428,811 JPY 53,367,277 07/07/2017 UBS 12,137 0.09 EUR 12,216 NOK 115,707 07/07/2017 ANZ 144 0.00 EUR 35,530 USD 40,000 07/07/2017 ANZ 508 0.00
Forward Currency Exchange Contracts (continued)
Currency Purchased
Amount Purchased
Currency Sold
Amount Sold
Maturity Date Counterparty
Unrealised Gain/(Loss)
EUR
% of Net Assets
EUR 10,617 USD 11,899 07/07/2017 UBS 199 0.00 GBP 40,231 USD 51,777 07/07/2017 HSBC 374 0.00 HUF 15,315,225 USD 55,946 07/07/2017 HSBC 574 0.00 MXN 2,856,977 USD 157,672 07/07/2017 HSBC 679 0.01 NOK 70,000 USD 8,286 07/07/2017 HSBC 48 0.00 NZD 187,378 USD 132,675 07/07/2017 ANZ 4,012 0.03 PLN 85,022 USD 22,713 07/07/2017 Goldman Sachs 235 0.00 RUB 3,855,000 USD 64,551 07/07/2017 J.P. Morgan 407 0.00 SEK 345,000 EUR 35,385 07/07/2017 UBS 440 0.00 SEK 610,226 USD 70,285 07/07/2017 UBS 1,828 0.01 SGD 15,000 USD 10,825 07/07/2017 UBS 65 0.00 THB 657,000 USD 19,230 07/07/2017 UBS 115 0.00 USD 188,689 BRL 619,114 07/07/2017 J.P. Morgan 1,563 0.01 USD 7,803 JPY 861,212 07/07/2017 J.P. Morgan 108 0.00 USD 87,719 KRW 100,227,700 07/07/2017 J.P. Morgan 87 0.00 USD 67,287 RUB 3,855,000 07/07/2017 J.P. Morgan 1,989 0.01 USD 92,011 ZAR 1,196,544 07/07/2017 UBS 707 0.01 USD 238,622 BRL 795,114 04/08/2017 J.P. Morgan 93 0.00 CAD 13,703 USD 10,338 10/08/2017 Bank of Montreal 212 0.00 CAD 10,747 USD 8,108 10/08/2017 BNP Paribas 167 0.00 CAD 19,469 USD 14,685 10/08/2017 UBS 304 0.00 GBP 32,497 USD 41,094 10/08/2017 Bank of America 981 0.01 GBP 276,838 USD 350,074 10/08/2017 Barclays 8,363 0.06 GBP 174,808 USD 221,058 10/08/2017 Commonwealth
Bank of Australia 5,276 0.04 GBP 21,241 USD 26,861 10/08/2017 Credit Suisse 641 0.01 GBP 65,432 USD 82,758 10/08/2017 Goldman Sachs 1,962 0.01 GBP 25,787 USD 32,605 10/08/2017 J.P. Morgan 782 0.01 GBP 4,465 USD 5,648 10/08/2017 State Street 134 0.00 GBP 24,807 USD 31,366 10/08/2017 UBS 752 0.01 MXN 5,195,573 USD 284,538 10/08/2017 J.P. Morgan 1,732 0.01 NOK 85,768 USD 10,030 10/08/2017 UBS 173 0.00 SEK 3,162,265 USD 360,755 10/08/2017 UBS 13,157 0.09 TRY 947,758 USD 263,656 10/08/2017 Citibank 2,277 0.02 TRY 983,218 USD 273,702 10/08/2017 J.P. Morgan 2,204 0.02 USD 471,066 BRL 1,553,649 10/08/2017 State Street 4,882 0.04 USD 15,379 HKD 119,802 10/08/2017 UBS 13 0.00 USD 24,437 IDR 326,929,602 10/08/2017 State Street 30 0.00 USD 17,966 INR 1,165,097 10/08/2017 State Street 21 0.00 USD 42,723 KRW 48,007,003 10/08/2017 State Street 653 0.00 USD 24,538 MYR 104,744 10/08/2017 Commonwealth
Bank of Australia 181 0.00 USD 87,265 RUB 5,061,711 10/08/2017 State Street 2,208 0.02 USD 42,598 TWD 1,281,043 10/08/2017 State Street 424 0.00 CZK 14,525,207 USD 591,251 01/02/2018 Citigroup 46,729 0.34
Unrealised Gain on Forward Currency Exchange Contracts 127,132 0.89
Total Unrealised Gain on Forward Currency Exchange Contracts 127,132 0.89
BRL 795,114 USD 240,107 07/07/2017 J.P. Morgan (61) 0.00 EUR 61,487 CAD 93,429 07/07/2017 UBS (1,635) (0.01) EUR 123,431 MXN 2,605,755 07/07/2017 UBS (3,100) (0.02) EUR 109,481 NZD 173,992 07/07/2017 ANZ (2,110) (0.02) EUR 7,649 SEK 74,388 07/07/2017 ANZ (76) 0.00 JPY 4,006,900 MXN 680,000 07/07/2017 UBS (1,735) (0.01) JPY 52,840,160 USD 477,841 07/07/2017 ANZ (5,818) (0.04) JPY 541,700 USD 4,883 07/07/2017 UBS (45) 0.00 KRW 100,227,700 USD 89,653 07/07/2017 J.P. Morgan (1,780) (0.01) MXN 670,000 CAD 48,181 07/07/2017 UBS (17) 0.00 MYR 82,000 USD 19,119 07/07/2017 J.P. Morgan (25) 0.00 PLN 69,398 EUR 16,507 07/07/2017 Goldman Sachs (82) 0.00 USD 223,103 AUD 300,314 07/07/2017 ANZ (6,785) (0.05) USD 7,634 AUD 10,272 07/07/2017 J.P. Morgan (229) 0.00
DERIVATIVES
Over-the-counter (OTC) and exchange traded derivatives as at 30 June 2017, expressed in Euro.
DERIVATIVES (continued)
Over-the-counter (OTC) and exchange traded derivatives as at 30 June 2017, expressed in Euro.
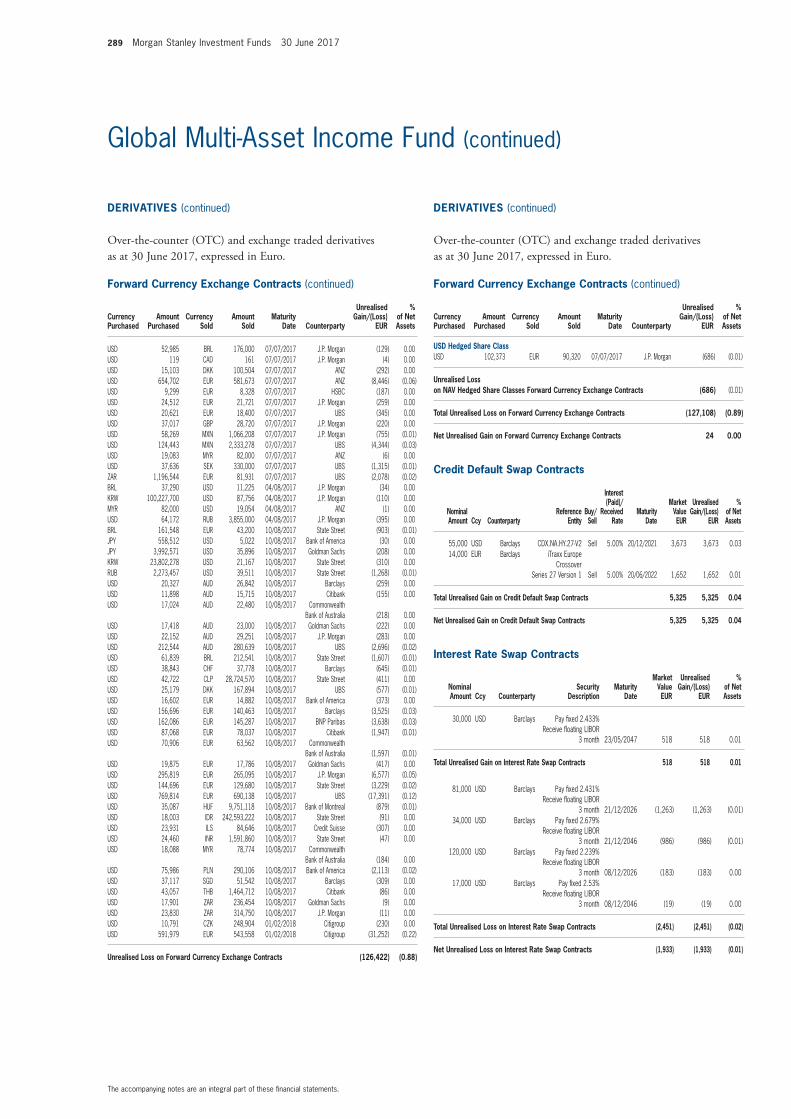
289 Morgan Stanley Investment Funds 30 June 2017
The accompanying notes are an integral part of these fi nancial statements.
Global Multi-Asset Income Fund (continued)
Forward Currency Exchange Contracts (continued)
Currency Purchased
Amount Purchased
Currency Sold
Amount Sold
Maturity Date Counterparty
Unrealised Gain/(Loss)
EUR
% of Net Assets
USD 52,985 BRL 176,000 07/07/2017 J.P. Morgan (129) 0.00 USD 119 CAD 161 07/07/2017 J.P. Morgan (4) 0.00 USD 15,103 DKK 100,504 07/07/2017 ANZ (292) 0.00 USD 654,702 EUR 581,673 07/07/2017 ANZ (8,446) (0.06) USD 9,299 EUR 8,328 07/07/2017 HSBC (187) 0.00 USD 24,512 EUR 21,721 07/07/2017 J.P. Morgan (259) 0.00 USD 20,621 EUR 18,400 07/07/2017 UBS (345) 0.00 USD 37,017 GBP 28,720 07/07/2017 J.P. Morgan (220) 0.00 USD 58,269 MXN 1,066,208 07/07/2017 J.P. Morgan (755) (0.01) USD 124,443 MXN 2,333,278 07/07/2017 UBS (4,344) (0.03) USD 19,083 MYR 82,000 07/07/2017 ANZ (6) 0.00 USD 37,636 SEK 330,000 07/07/2017 UBS (1,315) (0.01) ZAR 1,196,544 EUR 81,931 07/07/2017 UBS (2,078) (0.02) BRL 37,290 USD 11,225 04/08/2017 J.P. Morgan (34) 0.00 KRW 100,227,700 USD 87,756 04/08/2017 J.P. Morgan (110) 0.00 MYR 82,000 USD 19,054 04/08/2017 ANZ (1) 0.00 USD 64,172 RUB 3,855,000 04/08/2017 J.P. Morgan (395) 0.00 BRL 161,548 EUR 43,200 10/08/2017 State Street (903) (0.01) JPY 558,512 USD 5,022 10/08/2017 Bank of America (30) 0.00 JPY 3,992,571 USD 35,896 10/08/2017 Goldman Sachs (208) 0.00 KRW 23,802,278 USD 21,167 10/08/2017 State Street (310) 0.00 RUB 2,273,457 USD 39,511 10/08/2017 State Street (1,268) (0.01) USD 20,327 AUD 26,842 10/08/2017 Barclays (259) 0.00 USD 11,898 AUD 15,715 10/08/2017 Citibank (155) 0.00 USD 17,024 AUD 22,480 10/08/2017 Commonwealth
Bank of Australia (218) 0.00 USD 17,418 AUD 23,000 10/08/2017 Goldman Sachs (222) 0.00 USD 22,152 AUD 29,251 10/08/2017 J.P. Morgan (283) 0.00 USD 212,544 AUD 280,639 10/08/2017 UBS (2,696) (0.02) USD 61,839 BRL 212,541 10/08/2017 State Street (1,607) (0.01) USD 38,843 CHF 37,778 10/08/2017 Barclays (645) (0.01) USD 42,722 CLP 28,724,570 10/08/2017 State Street (411) 0.00 USD 25,179 DKK 167,894 10/08/2017 UBS (577) (0.01) USD 16,602 EUR 14,882 10/08/2017 Bank of America (373) 0.00 USD 156,696 EUR 140,463 10/08/2017 Barclays (3,525) (0.03) USD 162,086 EUR 145,287 10/08/2017 BNP Paribas (3,638) (0.03) USD 87,068 EUR 78,037 10/08/2017 Citibank (1,947) (0.01) USD 70,906 EUR 63,562 10/08/2017 Commonwealth
Bank of Australia (1,597) (0.01) USD 19,875 EUR 17,786 10/08/2017 Goldman Sachs (417) 0.00 USD 295,819 EUR 265,095 10/08/2017 J.P. Morgan (6,577) (0.05) USD 144,696 EUR 129,680 10/08/2017 State Street (3,229) (0.02) USD 769,814 EUR 690,138 10/08/2017 UBS (17,391) (0.12) USD 35,087 HUF 9,751,118 10/08/2017 Bank of Montreal (879) (0.01) USD 18,003 IDR 242,593,222 10/08/2017 State Street (91) 0.00 USD 23,931 ILS 84,646 10/08/2017 Credit Suisse (307) 0.00 USD 24,460 INR 1,591,860 10/08/2017 State Street (47) 0.00 USD 18,088 MYR 78,774 10/08/2017 Commonwealth
Bank of Australia (184) 0.00 USD 75,986 PLN 290,106 10/08/2017 Bank of America (2,113) (0.02) USD 37,117 SGD 51,542 10/08/2017 Barclays (309) 0.00 USD 43,057 THB 1,464,712 10/08/2017 Citibank (86) 0.00 USD 17,901 ZAR 236,454 10/08/2017 Goldman Sachs (9) 0.00 USD 23,830 ZAR 314,750 10/08/2017 J.P. Morgan (11) 0.00 USD 10,791 CZK 248,904 01/02/2018 Citigroup (230) 0.00 USD 591,979 EUR 543,558 01/02/2018 Citigroup (31,252) (0.22)
Unrealised Loss on Forward Currency Exchange Contracts (126,422) (0.88)
Forward Currency Exchange Contracts (continued)
Currency Purchased
Amount Purchased
Currency Sold
Amount Sold
Maturity Date Counterparty
Unrealised Gain/(Loss)
EUR
% of Net Assets
USD Hedged Share ClassUSD 102,373 EUR 90,320 07/07/2017 J.P. Morgan (686) (0.01)
Unrealised Loss on NAV Hedged Share Classes Forward Currency Exchange Contracts (686) (0.01)
Total Unrealised Loss on Forward Currency Exchange Contracts (127,108) (0.89)
Net Unrealised Gain on Forward Currency Exchange Contracts 24 0.00
Credit Default Swap Contracts
Nominal Amount Ccy Counterparty
Reference Entity
Buy/Sell
Interest (Paid)/
Received Rate
Maturity Date
Market Value EUR
Unrealised Gain/(Loss)
EUR
% of Net Assets
55,000 USD Barclays CDX.NA.HY.27-V2 Sell 5.00% 20/12/2021 3,673 3,673 0.03 14,000 EUR Barclays iTraxx Europe
Crossover Series 27 Version 1 Sell 5.00% 20/06/2022 1,652 1,652 0.01
Total Unrealised Gain on Credit Default Swap Contracts 5,325 5,325 0.04
Net Unrealised Gain on Credit Default Swap Contracts 5,325 5,325 0.04
Interest Rate Swap Contracts
Nominal Amount Ccy Counterparty
Security Description
Maturity Date
Market Value EUR
Unrealised Gain/(Loss)
EUR
% of Net Assets
30,000 USD Barclays Pay fi xed 2.433% Receive fl oating LIBOR
3 month 23/05/2047 518 518 0.01
Total Unrealised Gain on Interest Rate Swap Contracts 518 518 0.01
81,000 USD Barclays Pay fi xed 2.431% Receive fl oating LIBOR
3 month 21/12/2026 (1,263) (1,263) (0.01) 34,000 USD Barclays Pay fi xed 2.679%
Receive fl oating LIBOR 3 month 21/12/2046 (986) (986) (0.01)
120,000 USD Barclays Pay fi xed 2.239% Receive fl oating LIBOR
3 month 08/12/2026 (183) (183) 0.00 17,000 USD Barclays Pay fi xed 2.53%
Receive fl oating LIBOR 3 month 08/12/2046 (19) (19) 0.00
Total Unrealised Loss on Interest Rate Swap Contracts (2,451) (2,451) (0.02)
Net Unrealised Loss on Interest Rate Swap Contracts (1,933) (1,933) (0.01)
DERIVATIVES (continued)
Over-the-counter (OTC) and exchange traded derivatives as at 30 June 2017, expressed in Euro.
DERIVATIVES (continued)
Over-the-counter (OTC) and exchange traded derivatives as at 30 June 2017, expressed in Euro.
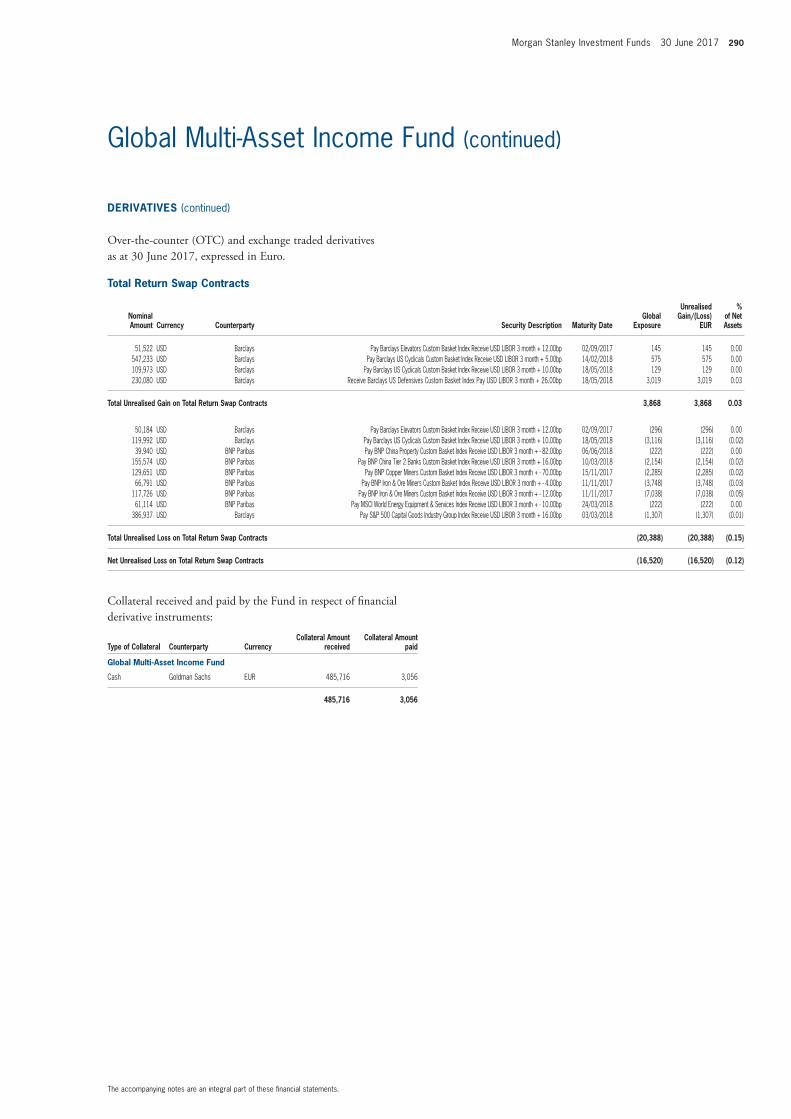
Morgan Stanley Investment Funds 30 June 2017 290
The accompanying notes are an integral part of these fi nancial statements.
Global Multi-Asset Income Fund (continued)
Total Return Swap Contracts
Nominal Amount Currency Counterparty Security Description Maturity Date
Global Exposure
Unrealised Gain/(Loss)
EUR
% of Net Assets
51,522 USD Barclays Pay Barclays Elevators Custom Basket Index Receive USD LIBOR 3 month + 12.00bp 02/09/2017 145 145 0.00547,233 USD Barclays Pay Barclays US Cyclicals Custom Basket Index Receive USD LIBOR 3 month + 5.00bp 14/02/2018 575 575 0.00109,973 USD Barclays Pay Barclays US Cyclicals Custom Basket Index Receive USD LIBOR 3 month + 10.00bp 18/05/2018 129 129 0.00230,080 USD Barclays Receive Barclays US Defensives Custom Basket Index Pay USD LIBOR 3 month + 26.00bp 18/05/2018 3,019 3,019 0.03
Total Unrealised Gain on Total Return Swap Contracts 3,868 3,868 0.03
50,184 USD Barclays Pay Barclays Elevators Custom Basket Index Receive USD LIBOR 3 month + 12.00bp 02/09/2017 (296) (296) 0.00119,992 USD Barclays Pay Barclays US Cyclicals Custom Basket Index Receive USD LIBOR 3 month + 10.00bp 18/05/2018 (3,116) (3,116) (0.02) 39,940 USD BNP Paribas Pay BNP China Property Custom Basket Index Receive USD LIBOR 3 month + - 82.00bp 06/06/2018 (222) (222) 0.00
155,574 USD BNP Paribas Pay BNP China Tier 2 Banks Custom Basket Index Receive USD LIBOR 3 month + 16.00bp 10/03/2018 (2,154) (2,154) (0.02) 129,651 USD BNP Paribas Pay BNP Copper Miners Custom Basket Index Receive USD LIBOR 3 month + - 70.00bp 15/11/2017 (2,285) (2,285) (0.02)
66,791 USD BNP Paribas Pay BNP Iron & Ore Miners Custom Basket Index Receive USD LIBOR 3 month + - 4.00bp 11/11/2017 (3,748) (3,748) (0.03) 117,726 USD BNP Paribas Pay BNP Iron & Ore Miners Custom Basket Index Receive USD LIBOR 3 month + - 12.00bp 11/11/2017 (7,038) (7,038) (0.05) 61,114 USD BNP Paribas Pay MSCI World Energy Equipment & Services Index Receive USD LIBOR 3 month + - 10.00bp 24/03/2018 (222) (222) 0.00
386,937 USD Barclays Pay S&P 500 Capital Goods Industry Group Index Receive USD LIBOR 3 month + 16.00bp 03/03/2018 (1,307) (1,307) (0.01)
Total Unrealised Loss on Total Return Swap Contracts (20,388) (20,388) (0.15)
Net Unrealised Loss on Total Return Swap Contracts (16,520) (16,520) (0.12)
Collateral received and paid by the Fund in respect of fi nancial derivative instruments:
Type of Collateral Counterparty CurrencyCollateral Amount
receivedCollateral Amount
paid
Global Multi-Asset Income Fund
Cash Goldman Sachs EUR 485,716 3,056
485,716 3,056
DERIVATIVES (continued)
Over-the-counter (OTC) and exchange traded derivatives as at 30 June 2017, expressed in Euro.
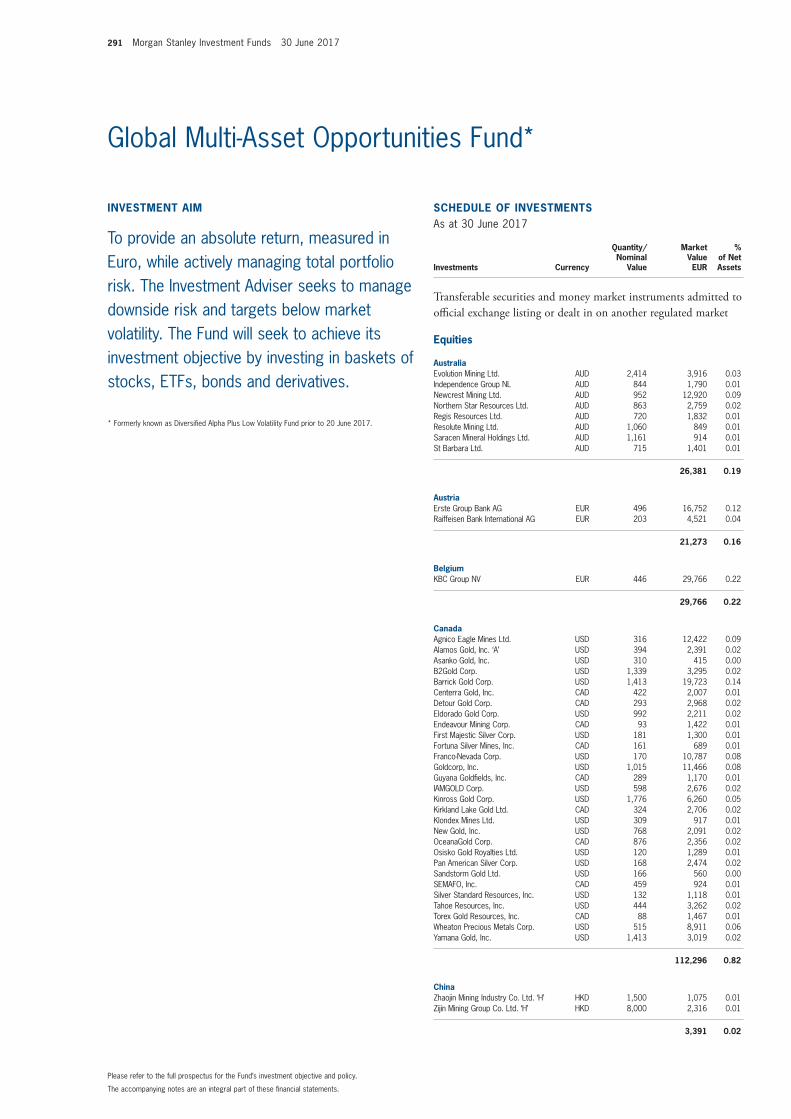
291 Morgan Stanley Investment Funds 30 June 2017
The accompanying notes are an integral part of these fi nancial statements.
Please refer to the full prospectus for the Fund’s investment objective and policy.
SCHEDULE OF INVESTMENTSAs at 30 June 2017
Investments Currency
Quantity/Nominal
Value
Market Value EUR
% of Net Assets
Transferable securities and money market instruments admitted to offi cial exchange listing or dealt in on another regulated market
Equities
AustraliaEvolution Mining Ltd. AUD 2,414 3,916 0.03 Independence Group NL AUD 844 1,790 0.01 Newcrest Mining Ltd. AUD 952 12,920 0.09 Northern Star Resources Ltd. AUD 863 2,759 0.02 Regis Resources Ltd. AUD 720 1,832 0.01 Resolute Mining Ltd. AUD 1,060 849 0.01 Saracen Mineral Holdings Ltd. AUD 1,161 914 0.01 St Barbara Ltd. AUD 715 1,401 0.01
26,381 0.19
AustriaErste Group Bank AG EUR 496 16,752 0.12 Raiffeisen Bank International AG EUR 203 4,521 0.04
21,273 0.16
BelgiumKBC Group NV EUR 446 29,766 0.22
29,766 0.22
CanadaAgnico Eagle Mines Ltd. USD 316 12,422 0.09 Alamos Gold, Inc. ‘A’ USD 394 2,391 0.02 Asanko Gold, Inc. USD 310 415 0.00 B2Gold Corp. USD 1,339 3,295 0.02 Barrick Gold Corp. USD 1,413 19,723 0.14 Centerra Gold, Inc. CAD 422 2,007 0.01 Detour Gold Corp. CAD 293 2,968 0.02 Eldorado Gold Corp. USD 992 2,211 0.02 Endeavour Mining Corp. CAD 93 1,422 0.01 First Majestic Silver Corp. USD 181 1,300 0.01 Fortuna Silver Mines, Inc. CAD 161 689 0.01 Franco-Nevada Corp. USD 170 10,787 0.08 Goldcorp, Inc. USD 1,015 11,466 0.08 Guyana Goldfi elds, Inc. CAD 289 1,170 0.01 IAMGOLD Corp. USD 598 2,676 0.02 Kinross Gold Corp. USD 1,776 6,260 0.05 Kirkland Lake Gold Ltd. CAD 324 2,706 0.02 Klondex Mines Ltd. USD 309 917 0.01 New Gold, Inc. USD 768 2,091 0.02 OceanaGold Corp. CAD 876 2,356 0.02 Osisko Gold Royalties Ltd. USD 120 1,289 0.01 Pan American Silver Corp. USD 168 2,474 0.02 Sandstorm Gold Ltd. USD 166 560 0.00 SEMAFO, Inc. CAD 459 924 0.01 Silver Standard Resources, Inc. USD 132 1,118 0.01 Tahoe Resources, Inc. USD 444 3,262 0.02 Torex Gold Resources, Inc. CAD 88 1,467 0.01 Wheaton Precious Metals Corp. USD 515 8,911 0.06 Yamana Gold, Inc. USD 1,413 3,019 0.02
112,296 0.82
ChinaZhaojin Mining Industry Co. Ltd. ‘H’ HKD 1,500 1,075 0.01 Zijin Mining Group Co. Ltd. ‘H’ HKD 8,000 2,316 0.01
3,391 0.02
Global Multi-Asset Opportunities Fund*
* Formerly known as Diversifi ed Alpha Plus Low Volatility Fund prior to 20 June 2017.
INVESTMENT AIM
To provide an absolute return, measured in Euro, while actively managing total portfolio risk. The Investment Adviser seeks to manage downside risk and targets below market volatility. The Fund will seek to achieve its investment objective by investing in baskets of stocks, ETFs, bonds and derivatives.
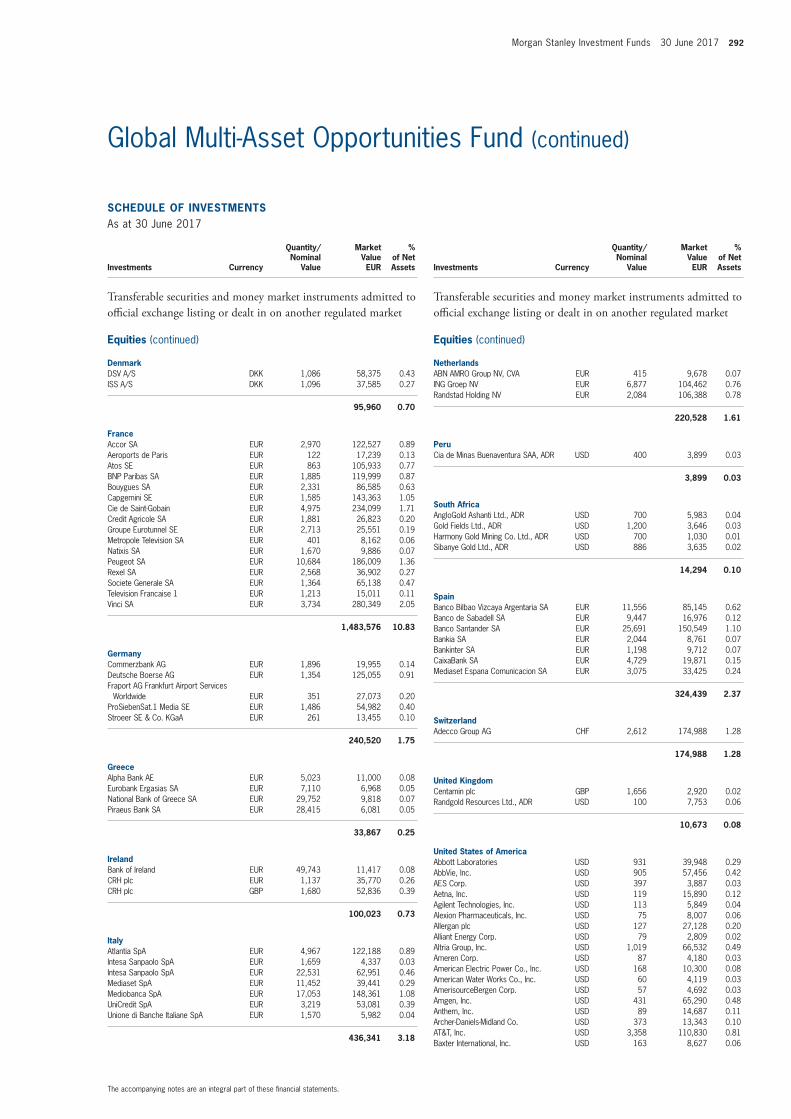
Morgan Stanley Investment Funds 30 June 2017 292
The accompanying notes are an integral part of these fi nancial statements.
Global Multi-Asset Opportunities Fund (continued)
SCHEDULE OF INVESTMENTSAs at 30 June 2017
Investments Currency
Quantity/Nominal
Value
Market Value EUR
% of Net Assets
Transferable securities and money market instruments admitted to offi cial exchange listing or dealt in on another regulated market
Equities (continued)
DenmarkDSV A/S DKK 1,086 58,375 0.43 ISS A/S DKK 1,096 37,585 0.27
95,960 0.70
FranceAccor SA EUR 2,970 122,527 0.89 Aeroports de Paris EUR 122 17,239 0.13 Atos SE EUR 863 105,933 0.77 BNP Paribas SA EUR 1,885 119,999 0.87 Bouygues SA EUR 2,331 86,585 0.63 Capgemini SE EUR 1,585 143,363 1.05 Cie de Saint-Gobain EUR 4,975 234,099 1.71 Credit Agricole SA EUR 1,881 26,823 0.20 Groupe Eurotunnel SE EUR 2,713 25,551 0.19 Metropole Television SA EUR 401 8,162 0.06 Natixis SA EUR 1,670 9,886 0.07 Peugeot SA EUR 10,684 186,009 1.36 Rexel SA EUR 2,568 36,902 0.27 Societe Generale SA EUR 1,364 65,138 0.47 Television Francaise 1 EUR 1,213 15,011 0.11 Vinci SA EUR 3,734 280,349 2.05
1,483,576 10.83
GermanyCommerzbank AG EUR 1,896 19,955 0.14 Deutsche Boerse AG EUR 1,354 125,055 0.91 Fraport AG Frankfurt Airport Services
Worldwide EUR 351 27,073 0.20 ProSiebenSat.1 Media SE EUR 1,486 54,982 0.40 Stroeer SE & Co. KGaA EUR 261 13,455 0.10
240,520 1.75
GreeceAlpha Bank AE EUR 5,023 11,000 0.08 Eurobank Ergasias SA EUR 7,110 6,968 0.05 National Bank of Greece SA EUR 29,752 9,818 0.07 Piraeus Bank SA EUR 28,415 6,081 0.05
33,867 0.25
IrelandBank of Ireland EUR 49,743 11,417 0.08 CRH plc EUR 1,137 35,770 0.26 CRH plc GBP 1,680 52,836 0.39
100,023 0.73
ItalyAtlantia SpA EUR 4,967 122,188 0.89 Intesa Sanpaolo SpA EUR 1,659 4,337 0.03 Intesa Sanpaolo SpA EUR 22,531 62,951 0.46 Mediaset SpA EUR 11,452 39,441 0.29 Mediobanca SpA EUR 17,053 148,361 1.08 UniCredit SpA EUR 3,219 53,081 0.39 Unione di Banche Italiane SpA EUR 1,570 5,982 0.04
436,341 3.18
SCHEDULE OF INVESTMENTSAs at 30 June 2017
Investments Currency
Quantity/Nominal
Value
Market Value EUR
% of Net Assets
Transferable securities and money market instruments admitted to offi cial exchange listing or dealt in on another regulated market
Equities (continued)
NetherlandsABN AMRO Group NV, CVA EUR 415 9,678 0.07 ING Groep NV EUR 6,877 104,462 0.76 Randstad Holding NV EUR 2,084 106,388 0.78
220,528 1.61
PeruCia de Minas Buenaventura SAA, ADR USD 400 3,899 0.03
3,899 0.03
South AfricaAngloGold Ashanti Ltd., ADR USD 700 5,983 0.04 Gold Fields Ltd., ADR USD 1,200 3,646 0.03 Harmony Gold Mining Co. Ltd., ADR USD 700 1,030 0.01 Sibanye Gold Ltd., ADR USD 886 3,635 0.02
14,294 0.10
SpainBanco Bilbao Vizcaya Argentaria SA EUR 11,556 85,145 0.62 Banco de Sabadell SA EUR 9,447 16,976 0.12 Banco Santander SA EUR 25,691 150,549 1.10 Bankia SA EUR 2,044 8,761 0.07 Bankinter SA EUR 1,198 9,712 0.07 CaixaBank SA EUR 4,729 19,871 0.15 Mediaset Espana Comunicacion SA EUR 3,075 33,425 0.24
324,439 2.37
SwitzerlandAdecco Group AG CHF 2,612 174,988 1.28
174,988 1.28
United KingdomCentamin plc GBP 1,656 2,920 0.02 Randgold Resources Ltd., ADR USD 100 7,753 0.06
10,673 0.08
United States of AmericaAbbott Laboratories USD 931 39,948 0.29 AbbVie, Inc. USD 905 57,456 0.42 AES Corp. USD 397 3,887 0.03 Aetna, Inc. USD 119 15,890 0.12 Agilent Technologies, Inc. USD 113 5,849 0.04 Alexion Pharmaceuticals, Inc. USD 75 8,007 0.06 Allergan plc USD 127 27,128 0.20 Alliant Energy Corp. USD 79 2,809 0.02 Altria Group, Inc. USD 1,019 66,532 0.49 Ameren Corp. USD 87 4,180 0.03 American Electric Power Co., Inc. USD 168 10,300 0.08 American Water Works Co., Inc. USD 60 4,119 0.03 AmerisourceBergen Corp. USD 57 4,692 0.03 Amgen, Inc. USD 431 65,290 0.48 Anthem, Inc. USD 89 14,687 0.11 Archer-Daniels-Midland Co. USD 373 13,343 0.10 AT&T, Inc. USD 3,358 110,830 0.81 Baxter International, Inc. USD 163 8,627 0.06
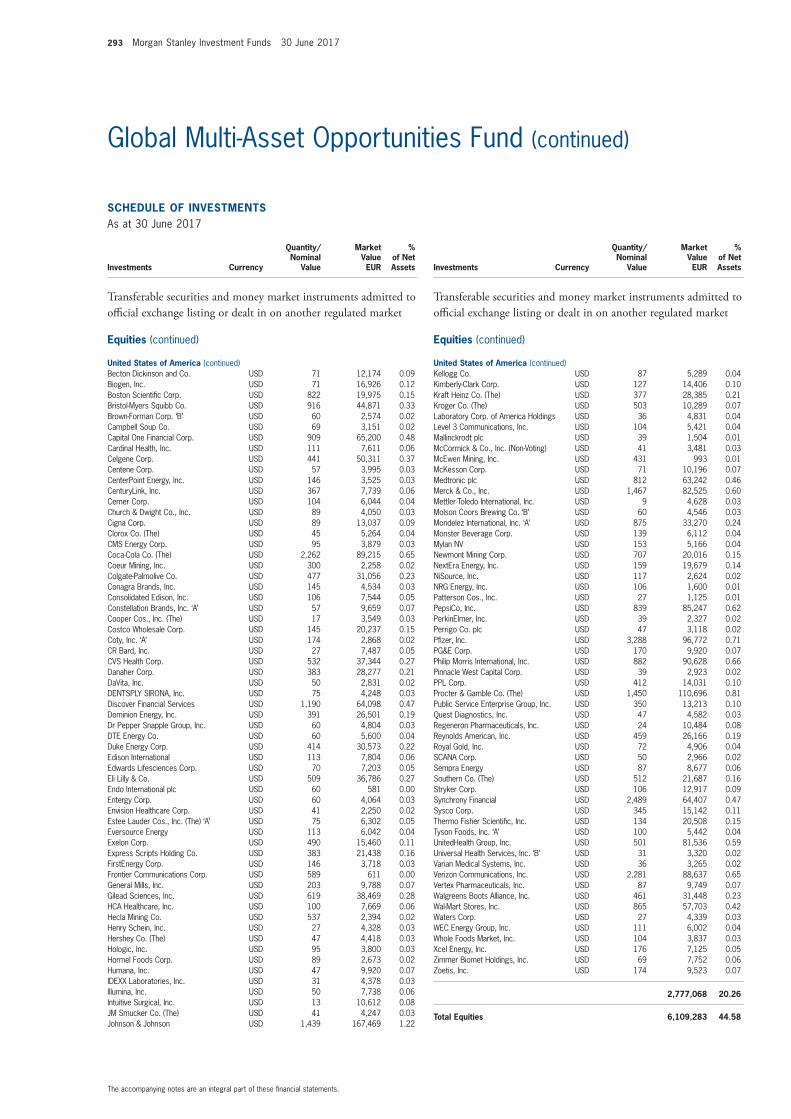
293 Morgan Stanley Investment Funds 30 June 2017
The accompanying notes are an integral part of these fi nancial statements.
Global Multi-Asset Opportunities Fund (continued)
SCHEDULE OF INVESTMENTSAs at 30 June 2017
Investments Currency
Quantity/Nominal
Value
Market Value EUR
% of Net Assets
Transferable securities and money market instruments admitted to offi cial exchange listing or dealt in on another regulated market
Equities (continued)
United States of America (continued)Becton Dickinson and Co. USD 71 12,174 0.09 Biogen, Inc. USD 71 16,926 0.12 Boston Scientifi c Corp. USD 822 19,975 0.15 Bristol-Myers Squibb Co. USD 916 44,871 0.33 Brown-Forman Corp. ‘B’ USD 60 2,574 0.02 Campbell Soup Co. USD 69 3,151 0.02 Capital One Financial Corp. USD 909 65,200 0.48 Cardinal Health, Inc. USD 111 7,611 0.06 Celgene Corp. USD 441 50,311 0.37 Centene Corp. USD 57 3,995 0.03 CenterPoint Energy, Inc. USD 146 3,525 0.03 CenturyLink, Inc. USD 367 7,739 0.06 Cerner Corp. USD 104 6,044 0.04 Church & Dwight Co., Inc. USD 89 4,050 0.03 Cigna Corp. USD 89 13,037 0.09 Clorox Co. (The) USD 45 5,264 0.04 CMS Energy Corp. USD 95 3,879 0.03 Coca-Cola Co. (The) USD 2,262 89,215 0.65 Coeur Mining, Inc. USD 300 2,258 0.02 Colgate-Palmolive Co. USD 477 31,056 0.23 Conagra Brands, Inc. USD 145 4,534 0.03 Consolidated Edison, Inc. USD 106 7,544 0.05 Constellation Brands, Inc. ‘A’ USD 57 9,659 0.07 Cooper Cos., Inc. (The) USD 17 3,549 0.03 Costco Wholesale Corp. USD 145 20,237 0.15 Coty, Inc. ‘A’ USD 174 2,868 0.02 CR Bard, Inc. USD 27 7,487 0.05 CVS Health Corp. USD 532 37,344 0.27 Danaher Corp. USD 383 28,277 0.21 DaVita, Inc. USD 50 2,831 0.02 DENTSPLY SIRONA, Inc. USD 75 4,248 0.03 Discover Financial Services USD 1,190 64,098 0.47 Dominion Energy, Inc. USD 391 26,501 0.19 Dr Pepper Snapple Group, Inc. USD 60 4,804 0.03 DTE Energy Co. USD 60 5,600 0.04 Duke Energy Corp. USD 414 30,573 0.22 Edison International USD 113 7,804 0.06 Edwards Lifesciences Corp. USD 70 7,203 0.05 Eli Lilly & Co. USD 509 36,786 0.27 Endo International plc USD 60 581 0.00 Entergy Corp. USD 60 4,064 0.03 Envision Healthcare Corp. USD 41 2,250 0.02 Estee Lauder Cos., Inc. (The) ‘A’ USD 75 6,302 0.05 Eversource Energy USD 113 6,042 0.04 Exelon Corp. USD 490 15,460 0.11 Express Scripts Holding Co. USD 383 21,438 0.16 FirstEnergy Corp. USD 146 3,718 0.03 Frontier Communications Corp. USD 589 611 0.00 General Mills, Inc. USD 203 9,788 0.07 Gilead Sciences, Inc. USD 619 38,469 0.28 HCA Healthcare, Inc. USD 100 7,669 0.06 Hecla Mining Co. USD 537 2,394 0.02 Henry Schein, Inc. USD 27 4,328 0.03 Hershey Co. (The) USD 47 4,418 0.03 Hologic, Inc. USD 95 3,800 0.03 Hormel Foods Corp. USD 89 2,673 0.02 Humana, Inc. USD 47 9,920 0.07 IDEXX Laboratories, Inc. USD 31 4,378 0.03 Illumina, Inc. USD 50 7,738 0.06 Intuitive Surgical, Inc. USD 13 10,612 0.08 JM Smucker Co. (The) USD 41 4,247 0.03 Johnson & Johnson USD 1,439 167,469 1.22
SCHEDULE OF INVESTMENTSAs at 30 June 2017
Investments Currency
Quantity/Nominal
Value
Market Value EUR
% of Net Assets
Transferable securities and money market instruments admitted to offi cial exchange listing or dealt in on another regulated market
Equities (continued)
United States of America (continued)Kellogg Co. USD 87 5,289 0.04 Kimberly-Clark Corp. USD 127 14,406 0.10 Kraft Heinz Co. (The) USD 377 28,385 0.21 Kroger Co. (The) USD 503 10,289 0.07 Laboratory Corp. of America Holdings USD 36 4,831 0.04 Level 3 Communications, Inc. USD 104 5,421 0.04 Mallinckrodt plc USD 39 1,504 0.01 McCormick & Co., Inc. (Non-Voting) USD 41 3,481 0.03 McEwen Mining, Inc. USD 431 993 0.01 McKesson Corp. USD 71 10,196 0.07 Medtronic plc USD 812 63,242 0.46 Merck & Co., Inc. USD 1,467 82,525 0.60 Mettler-Toledo International, Inc. USD 9 4,628 0.03 Molson Coors Brewing Co. ‘B’ USD 60 4,546 0.03 Mondelez International, Inc. ‘A’ USD 875 33,270 0.24 Monster Beverage Corp. USD 139 6,112 0.04 Mylan NV USD 153 5,166 0.04 Newmont Mining Corp. USD 707 20,016 0.15 NextEra Energy, Inc. USD 159 19,679 0.14 NiSource, Inc. USD 117 2,624 0.02 NRG Energy, Inc. USD 106 1,600 0.01 Patterson Cos., Inc. USD 27 1,125 0.01 PepsiCo, Inc. USD 839 85,247 0.62 PerkinElmer, Inc. USD 39 2,327 0.02 Perrigo Co. plc USD 47 3,118 0.02 Pfi zer, Inc. USD 3,288 96,772 0.71 PG&E Corp. USD 170 9,920 0.07 Philip Morris International, Inc. USD 882 90,628 0.66 Pinnacle West Capital Corp. USD 39 2,923 0.02 PPL Corp. USD 412 14,031 0.10 Procter & Gamble Co. (The) USD 1,450 110,696 0.81 Public Service Enterprise Group, Inc. USD 350 13,213 0.10 Quest Diagnostics, Inc. USD 47 4,582 0.03 Regeneron Pharmaceuticals, Inc. USD 24 10,484 0.08 Reynolds American, Inc. USD 459 26,166 0.19 Royal Gold, Inc. USD 72 4,906 0.04 SCANA Corp. USD 50 2,966 0.02 Sempra Energy USD 87 8,677 0.06 Southern Co. (The) USD 512 21,687 0.16 Stryker Corp. USD 106 12,917 0.09 Synchrony Financial USD 2,489 64,407 0.47 Sysco Corp. USD 345 15,142 0.11 Thermo Fisher Scientifi c, Inc. USD 134 20,508 0.15 Tyson Foods, Inc. ‘A’ USD 100 5,442 0.04 UnitedHealth Group, Inc. USD 501 81,536 0.59 Universal Health Services, Inc. ‘B’ USD 31 3,320 0.02 Varian Medical Systems, Inc. USD 36 3,265 0.02 Verizon Communications, Inc. USD 2,281 88,637 0.65 Vertex Pharmaceuticals, Inc. USD 87 9,749 0.07 Walgreens Boots Alliance, Inc. USD 461 31,448 0.23 Wal-Mart Stores, Inc. USD 865 57,703 0.42 Waters Corp. USD 27 4,339 0.03 WEC Energy Group, Inc. USD 111 6,002 0.04 Whole Foods Market, Inc. USD 104 3,837 0.03 Xcel Energy, Inc. USD 176 7,125 0.05 Zimmer Biomet Holdings, Inc. USD 69 7,752 0.06 Zoetis, Inc. USD 174 9,523 0.07
2,777,068 20.26
Total Equities 6,109,283 44.58
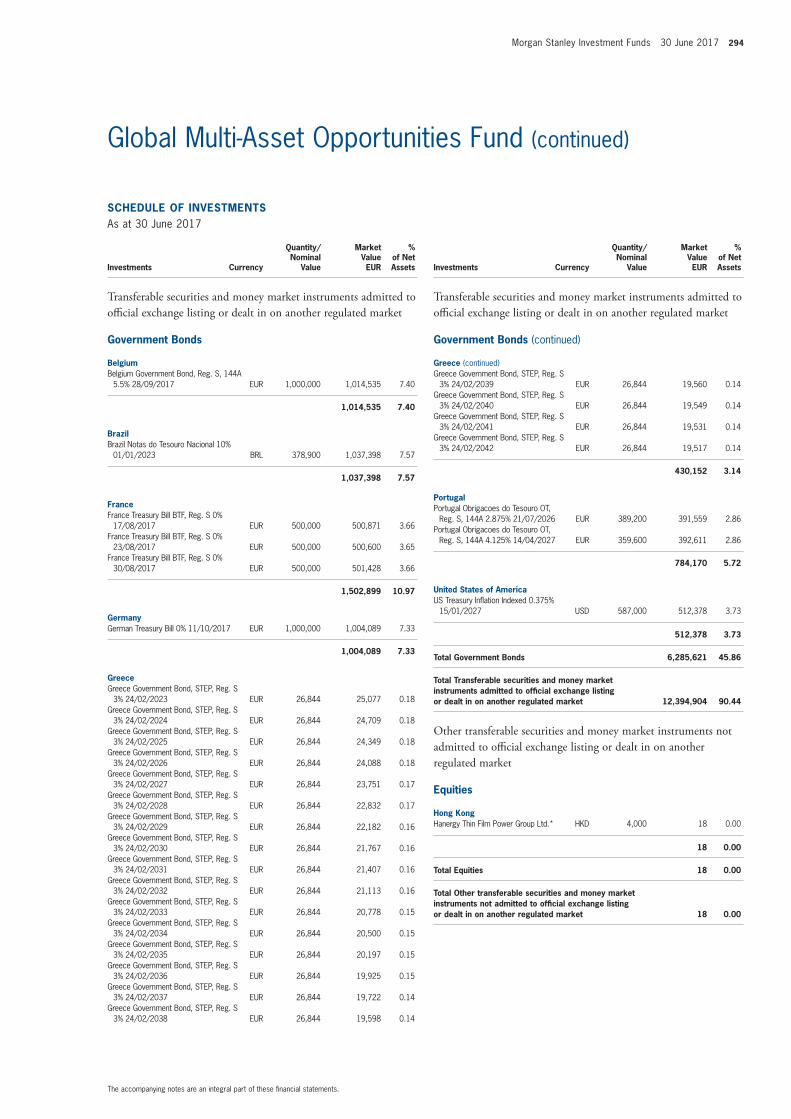
Morgan Stanley Investment Funds 30 June 2017 294
The accompanying notes are an integral part of these fi nancial statements.
Global Multi-Asset Opportunities Fund (continued)
SCHEDULE OF INVESTMENTSAs at 30 June 2017
Investments Currency
Quantity/Nominal
Value
Market Value EUR
% of Net Assets
Transferable securities and money market instruments admitted to offi cial exchange listing or dealt in on another regulated market
Government Bonds (continued)
Greece (continued)Greece Government Bond, STEP, Reg. S
3% 24/02/2039 EUR 26,844 19,560 0.14 Greece Government Bond, STEP, Reg. S
3% 24/02/2040 EUR 26,844 19,549 0.14 Greece Government Bond, STEP, Reg. S
3% 24/02/2041 EUR 26,844 19,531 0.14 Greece Government Bond, STEP, Reg. S
3% 24/02/2042 EUR 26,844 19,517 0.14
430,152 3.14
PortugalPortugal Obrigacoes do Tesouro OT,
Reg. S, 144A 2.875% 21/07/2026 EUR 389,200 391,559 2.86 Portugal Obrigacoes do Tesouro OT,
Reg. S, 144A 4.125% 14/04/2027 EUR 359,600 392,611 2.86
784,170 5.72
United States of AmericaUS Treasury Infl ation Indexed 0.375%
15/01/2027 USD 587,000 512,378 3.73
512,378 3.73
Total Government Bonds 6,285,621 45.86
Total Transferable securities and money market instruments admitted to offi cial exchange listing or dealt in on another regulated market 12,394,904 90.44
Other transferable securities and money market instruments not admitted to offi cial exchange listing or dealt in on another regulated market
Equities
Hong KongHanergy Thin Film Power Group Ltd.* HKD 4,000 18 0.00
18 0.00
Total Equities 18 0.00
Total Other transferable securities and money market instruments not admitted to offi cial exchange listing or dealt in on another regulated market 18 0.00
SCHEDULE OF INVESTMENTSAs at 30 June 2017
Investments Currency
Quantity/Nominal
Value
Market Value EUR
% of Net Assets
Transferable securities and money market instruments admitted to offi cial exchange listing or dealt in on another regulated market
Government Bonds
BelgiumBelgium Government Bond, Reg. S, 144A
5.5% 28/09/2017 EUR 1,000,000 1,014,535 7.40
1,014,535 7.40
BrazilBrazil Notas do Tesouro Nacional 10%
01/01/2023 BRL 378,900 1,037,398 7.57
1,037,398 7.57
FranceFrance Treasury Bill BTF, Reg. S 0%
17/08/2017 EUR 500,000 500,871 3.66 France Treasury Bill BTF, Reg. S 0%
23/08/2017 EUR 500,000 500,600 3.65 France Treasury Bill BTF, Reg. S 0%
30/08/2017 EUR 500,000 501,428 3.66
1,502,899 10.97
GermanyGerman Treasury Bill 0% 11/10/2017 EUR 1,000,000 1,004,089 7.33
1,004,089 7.33
GreeceGreece Government Bond, STEP, Reg. S
3% 24/02/2023 EUR 26,844 25,077 0.18 Greece Government Bond, STEP, Reg. S
3% 24/02/2024 EUR 26,844 24,709 0.18 Greece Government Bond, STEP, Reg. S
3% 24/02/2025 EUR 26,844 24,349 0.18 Greece Government Bond, STEP, Reg. S
3% 24/02/2026 EUR 26,844 24,088 0.18 Greece Government Bond, STEP, Reg. S
3% 24/02/2027 EUR 26,844 23,751 0.17 Greece Government Bond, STEP, Reg. S
3% 24/02/2028 EUR 26,844 22,832 0.17 Greece Government Bond, STEP, Reg. S
3% 24/02/2029 EUR 26,844 22,182 0.16 Greece Government Bond, STEP, Reg. S
3% 24/02/2030 EUR 26,844 21,767 0.16 Greece Government Bond, STEP, Reg. S
3% 24/02/2031 EUR 26,844 21,407 0.16 Greece Government Bond, STEP, Reg. S
3% 24/02/2032 EUR 26,844 21,113 0.16 Greece Government Bond, STEP, Reg. S
3% 24/02/2033 EUR 26,844 20,778 0.15 Greece Government Bond, STEP, Reg. S
3% 24/02/2034 EUR 26,844 20,500 0.15 Greece Government Bond, STEP, Reg. S
3% 24/02/2035 EUR 26,844 20,197 0.15 Greece Government Bond, STEP, Reg. S
3% 24/02/2036 EUR 26,844 19,925 0.15 Greece Government Bond, STEP, Reg. S
3% 24/02/2037 EUR 26,844 19,722 0.14 Greece Government Bond, STEP, Reg. S
3% 24/02/2038 EUR 26,844 19,598 0.14
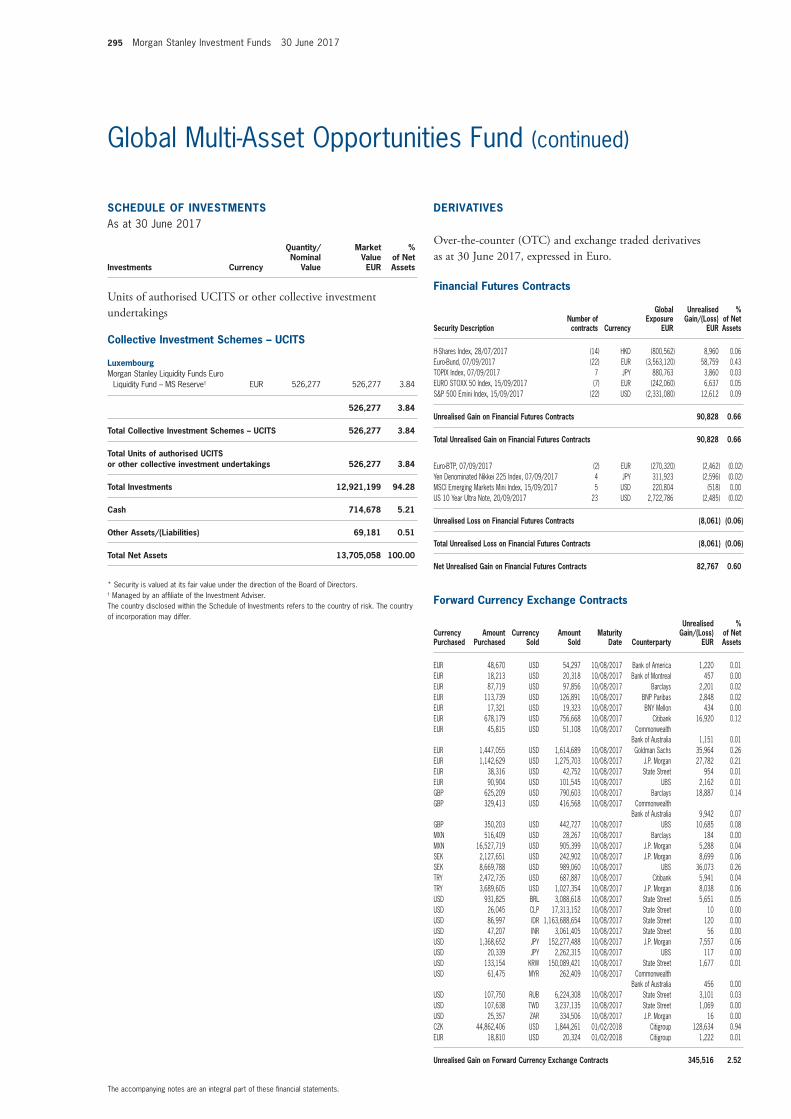
295 Morgan Stanley Investment Funds 30 June 2017
The accompanying notes are an integral part of these fi nancial statements.
Global Multi-Asset Opportunities Fund (continued)
Financial Futures Contracts
Security DescriptionNumber of contracts Currency
Global Exposure
EUR
Unrealised Gain/(Loss)
EUR
% of Net Assets
H-Shares Index, 28/07/2017 (14) HKD (800,562) 8,960 0.06 Euro-Bund, 07/09/2017 (22) EUR (3,563,120) 58,759 0.43 TOPIX Index, 07/09/2017 7 JPY 880,763 3,860 0.03 EURO STOXX 50 Index, 15/09/2017 (7) EUR (242,060) 6,637 0.05 S&P 500 Emini Index, 15/09/2017 (22) USD (2,331,080) 12,612 0.09
Unrealised Gain on Financial Futures Contracts 90,828 0.66
Total Unrealised Gain on Financial Futures Contracts 90,828 0.66
Euro-BTP, 07/09/2017 (2) EUR (270,320) (2,462) (0.02) Yen Denominated Nikkei 225 Index, 07/09/2017 4 JPY 311,923 (2,596) (0.02) MSCI Emerging Markets Mini Index, 15/09/2017 5 USD 220,804 (518) 0.00 US 10 Year Ultra Note, 20/09/2017 23 USD 2,722,786 (2,485) (0.02)
Unrealised Loss on Financial Futures Contracts (8,061) (0.06)
Total Unrealised Loss on Financial Futures Contracts (8,061) (0.06)
Net Unrealised Gain on Financial Futures Contracts 82,767 0.60
Forward Currency Exchange Contracts (continued)
Currency Purchased
Amount Purchased
Currency Sold
Amount Sold
Maturity Date Counterparty
Unrealised Gain/(Loss)
EUR
% of Net Assets
EUR 48,670 USD 54,297 10/08/2017 Bank of America 1,220 0.01 EUR 18,213 USD 20,318 10/08/2017 Bank of Montreal 457 0.00 EUR 87,719 USD 97,856 10/08/2017 Barclays 2,201 0.02 EUR 113,739 USD 126,891 10/08/2017 BNP Paribas 2,848 0.02 EUR 17,321 USD 19,323 10/08/2017 BNY Mellon 434 0.00 EUR 678,179 USD 756,668 10/08/2017 Citibank 16,920 0.12 EUR 45,815 USD 51,108 10/08/2017 Commonwealth
Bank of Australia 1,151 0.01 EUR 1,447,055 USD 1,614,689 10/08/2017 Goldman Sachs 35,964 0.26 EUR 1,142,629 USD 1,275,703 10/08/2017 J.P. Morgan 27,782 0.21 EUR 38,316 USD 42,752 10/08/2017 State Street 954 0.01 EUR 90,904 USD 101,545 10/08/2017 UBS 2,162 0.01 GBP 625,209 USD 790,603 10/08/2017 Barclays 18,887 0.14 GBP 329,413 USD 416,568 10/08/2017 Commonwealth
Bank of Australia 9,942 0.07 GBP 350,203 USD 442,727 10/08/2017 UBS 10,685 0.08 MXN 516,409 USD 28,267 10/08/2017 Barclays 184 0.00 MXN 16,527,719 USD 905,399 10/08/2017 J.P. Morgan 5,288 0.04 SEK 2,127,651 USD 242,902 10/08/2017 J.P. Morgan 8,699 0.06 SEK 8,669,788 USD 989,060 10/08/2017 UBS 36,073 0.26 TRY 2,472,735 USD 687,887 10/08/2017 Citibank 5,941 0.04 TRY 3,689,605 USD 1,027,354 10/08/2017 J.P. Morgan 8,038 0.06 USD 931,825 BRL 3,088,618 10/08/2017 State Street 5,651 0.05 USD 26,045 CLP 17,313,152 10/08/2017 State Street 10 0.00 USD 86,997 IDR 1,163,688,654 10/08/2017 State Street 120 0.00 USD 47,207 INR 3,061,405 10/08/2017 State Street 56 0.00 USD 1,368,652 JPY 152,277,488 10/08/2017 J.P. Morgan 7,557 0.06 USD 20,339 JPY 2,262,315 10/08/2017 UBS 117 0.00 USD 133,154 KRW 150,089,421 10/08/2017 State Street 1,677 0.01 USD 61,475 MYR 262,409 10/08/2017 Commonwealth
Bank of Australia 456 0.00 USD 107,750 RUB 6,224,308 10/08/2017 State Street 3,101 0.03 USD 107,638 TWD 3,237,135 10/08/2017 State Street 1,069 0.00 USD 25,357 ZAR 334,506 10/08/2017 J.P. Morgan 16 0.00 CZK 44,862,406 USD 1,844,261 01/02/2018 Citigroup 128,634 0.94 EUR 18,810 USD 20,324 01/02/2018 Citigroup 1,222 0.01
Unrealised Gain on Forward Currency Exchange Contracts 345,516 2.52
SCHEDULE OF INVESTMENTSAs at 30 June 2017
Investments Currency
Quantity/Nominal
Value
Market Value EUR
% of Net Assets
Units of authorised UCITS or other collective investment undertakings
Collective Investment Schemes – UCITS
LuxembourgMorgan Stanley Liquidity Funds Euro
Liquidity Fund – MS Reserve† EUR 526,277 526,277 3.84
526,277 3.84
Total Collective Investment Schemes – UCITS 526,277 3.84
Total Units of authorised UCITS or other collective investment undertakings 526,277 3.84
Total Investments 12,921,199 94.28
Cash 714,678 5.21
Other Assets/(Liabilities) 69,181 0.51
Total Net Assets 13,705,058 100.00
* Security is valued at its fair value under the direction of the Board of Directors.† Managed by an affi liate of the Investment Adviser.The country disclosed within the Schedule of Investments refers to the country of risk. The country of incorporation may differ.
DERIVATIVES
Over-the-counter (OTC) and exchange traded derivatives as at 30 June 2017, expressed in Euro.
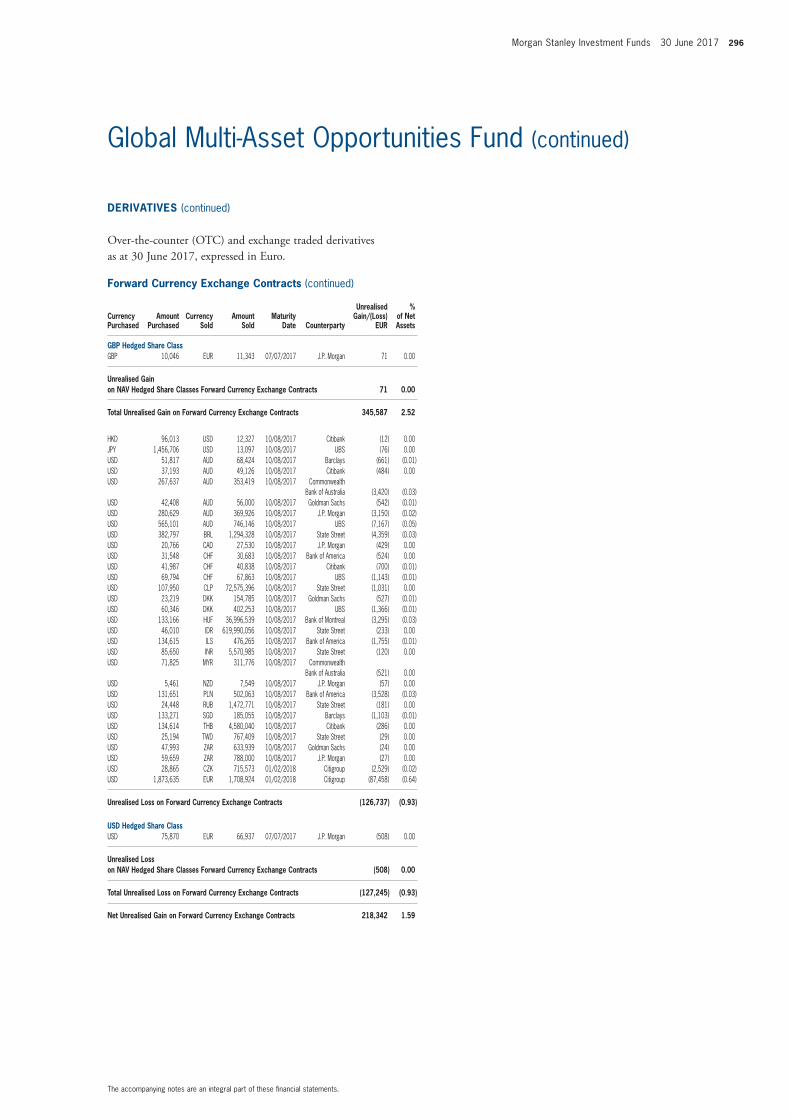
Morgan Stanley Investment Funds 30 June 2017 296
The accompanying notes are an integral part of these fi nancial statements.
Global Multi-Asset Opportunities Fund (continued)
Forward Currency Exchange Contracts (continued)
Currency Purchased
Amount Purchased
Currency Sold
Amount Sold
Maturity Date Counterparty
Unrealised Gain/(Loss)
EUR
% of Net Assets
GBP Hedged Share ClassGBP 10,046 EUR 11,343 07/07/2017 J.P. Morgan 71 0.00
Unrealised Gain on NAV Hedged Share Classes Forward Currency Exchange Contracts 71 0.00
Total Unrealised Gain on Forward Currency Exchange Contracts 345,587 2.52
HKD 96,013 USD 12,327 10/08/2017 Citibank (12) 0.00 JPY 1,456,706 USD 13,097 10/08/2017 UBS (76) 0.00 USD 51,817 AUD 68,424 10/08/2017 Barclays (661) (0.01) USD 37,193 AUD 49,126 10/08/2017 Citibank (484) 0.00 USD 267,637 AUD 353,419 10/08/2017 Commonwealth
Bank of Australia (3,420) (0.03) USD 42,408 AUD 56,000 10/08/2017 Goldman Sachs (542) (0.01) USD 280,629 AUD 369,926 10/08/2017 J.P. Morgan (3,150) (0.02) USD 565,101 AUD 746,146 10/08/2017 UBS (7,167) (0.05) USD 382,797 BRL 1,294,328 10/08/2017 State Street (4,359) (0.03) USD 20,766 CAD 27,530 10/08/2017 J.P. Morgan (429) 0.00 USD 31,548 CHF 30,683 10/08/2017 Bank of America (524) 0.00 USD 41,987 CHF 40,838 10/08/2017 Citibank (700) (0.01) USD 69,794 CHF 67,863 10/08/2017 UBS (1,143) (0.01) USD 107,950 CLP 72,575,396 10/08/2017 State Street (1,031) 0.00 USD 23,219 DKK 154,785 10/08/2017 Goldman Sachs (527) (0.01) USD 60,346 DKK 402,253 10/08/2017 UBS (1,366) (0.01) USD 133,166 HUF 36,996,539 10/08/2017 Bank of Montreal (3,295) (0.03) USD 46,010 IDR 619,990,056 10/08/2017 State Street (233) 0.00 USD 134,615 ILS 476,265 10/08/2017 Bank of America (1,755) (0.01) USD 85,650 INR 5,570,985 10/08/2017 State Street (120) 0.00 USD 71,825 MYR 311,776 10/08/2017 Commonwealth
Bank of Australia (521) 0.00 USD 5,461 NZD 7,549 10/08/2017 J.P. Morgan (57) 0.00 USD 131,651 PLN 502,063 10/08/2017 Bank of America (3,528) (0.03) USD 24,448 RUB 1,472,771 10/08/2017 State Street (181) 0.00 USD 133,271 SGD 185,055 10/08/2017 Barclays (1,103) (0.01) USD 134,614 THB 4,580,040 10/08/2017 Citibank (286) 0.00 USD 25,194 TWD 767,409 10/08/2017 State Street (29) 0.00 USD 47,993 ZAR 633,939 10/08/2017 Goldman Sachs (24) 0.00 USD 59,659 ZAR 788,000 10/08/2017 J.P. Morgan (27) 0.00 USD 28,865 CZK 715,573 01/02/2018 Citigroup (2,529) (0.02) USD 1,873,635 EUR 1,708,924 01/02/2018 Citigroup (87,458) (0.64)
Unrealised Loss on Forward Currency Exchange Contracts (126,737) (0.93)
USD Hedged Share ClassUSD 75,870 EUR 66,937 07/07/2017 J.P. Morgan (508) 0.00
Unrealised Loss on NAV Hedged Share Classes Forward Currency Exchange Contracts (508) 0.00
Total Unrealised Loss on Forward Currency Exchange Contracts (127,245) (0.93)
Net Unrealised Gain on Forward Currency Exchange Contracts 218,342 1.59
DERIVATIVES (continued)
Over-the-counter (OTC) and exchange traded derivatives as at 30 June 2017, expressed in Euro.
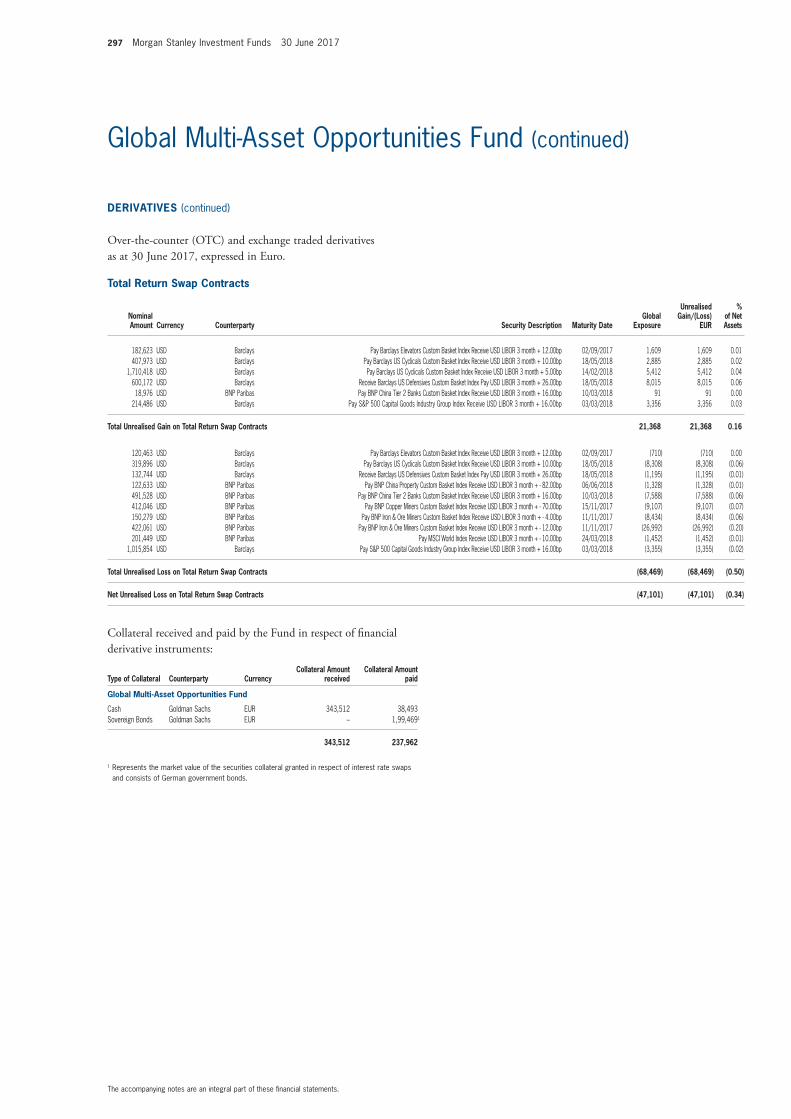
297 Morgan Stanley Investment Funds 30 June 2017
The accompanying notes are an integral part of these fi nancial statements.
Global Multi-Asset Opportunities Fund (continued)
Total Return Swap Contracts
Nominal Amount Currency Counterparty Security Description Maturity Date
Global Exposure
Unrealised Gain/(Loss)
EUR
% of Net Assets
182,623 USD Barclays Pay Barclays Elevators Custom Basket Index Receive USD LIBOR 3 month + 12.00bp 02/09/2017 1,609 1,609 0.01407,973 USD Barclays Pay Barclays US Cyclicals Custom Basket Index Receive USD LIBOR 3 month + 10.00bp 18/05/2018 2,885 2,885 0.02
1,710,418 USD Barclays Pay Barclays US Cyclicals Custom Basket Index Receive USD LIBOR 3 month + 5.00bp 14/02/2018 5,412 5,412 0.04600,172 USD Barclays Receive Barclays US Defensives Custom Basket Index Pay USD LIBOR 3 month + 26.00bp 18/05/2018 8,015 8,015 0.06
18,976 USD BNP Paribas Pay BNP China Tier 2 Banks Custom Basket Index Receive USD LIBOR 3 month + 16.00bp 10/03/2018 91 91 0.00214,486 USD Barclays Pay S&P 500 Capital Goods Industry Group Index Receive USD LIBOR 3 month + 16.00bp 03/03/2018 3,356 3,356 0.03
Total Unrealised Gain on Total Return Swap Contracts 21,368 21,368 0.16
120,463 USD Barclays Pay Barclays Elevators Custom Basket Index Receive USD LIBOR 3 month + 12.00bp 02/09/2017 (710) (710) 0.00319,896 USD Barclays Pay Barclays US Cyclicals Custom Basket Index Receive USD LIBOR 3 month + 10.00bp 18/05/2018 (8,308) (8,308) (0.06)132,744 USD Barclays Receive Barclays US Defensives Custom Basket Index Pay USD LIBOR 3 month + 26.00bp 18/05/2018 (1,195) (1,195) (0.01)122,633 USD BNP Paribas Pay BNP China Property Custom Basket Index Receive USD LIBOR 3 month + - 82.00bp 06/06/2018 (1,328) (1,328) (0.01)491,528 USD BNP Paribas Pay BNP China Tier 2 Banks Custom Basket Index Receive USD LIBOR 3 month + 16.00bp 10/03/2018 (7,588) (7,588) (0.06)412,046 USD BNP Paribas Pay BNP Copper Miners Custom Basket Index Receive USD LIBOR 3 month + - 70.00bp 15/11/2017 (9,107) (9,107) (0.07)150,279 USD BNP Paribas Pay BNP Iron & Ore Miners Custom Basket Index Receive USD LIBOR 3 month + - 4.00bp 11/11/2017 (8,434) (8,434) (0.06)422,061 USD BNP Paribas Pay BNP Iron & Ore Miners Custom Basket Index Receive USD LIBOR 3 month + - 12.00bp 11/11/2017 (26,992) (26,992) (0.20)201,449 USD BNP Paribas Pay MSCI World Index Receive USD LIBOR 3 month + - 10.00bp 24/03/2018 (1,452) (1,452) (0.01)
1,015,854 USD Barclays Pay S&P 500 Capital Goods Industry Group Index Receive USD LIBOR 3 month + 16.00bp 03/03/2018 (3,355) (3,355) (0.02)
Total Unrealised Loss on Total Return Swap Contracts (68,469) (68,469) (0.50)
Net Unrealised Loss on Total Return Swap Contracts (47,101) (47,101) (0.34)
Collateral received and paid by the Fund in respect of fi nancial derivative instruments:
Type of Collateral Counterparty CurrencyCollateral Amount
receivedCollateral Amount
paid
Global Multi-Asset Opportunities Fund
Cash Goldman Sachs EUR 343,512 38,493Sovereign Bonds Goldman Sachs EUR – 1,99,4691
343,512 237,962
1 Represents the market value of the securities collateral granted in respect of interest rate swaps and consists of German government bonds.
DERIVATIVES (continued)
Over-the-counter (OTC) and exchange traded derivatives as at 30 June 2017, expressed in Euro.
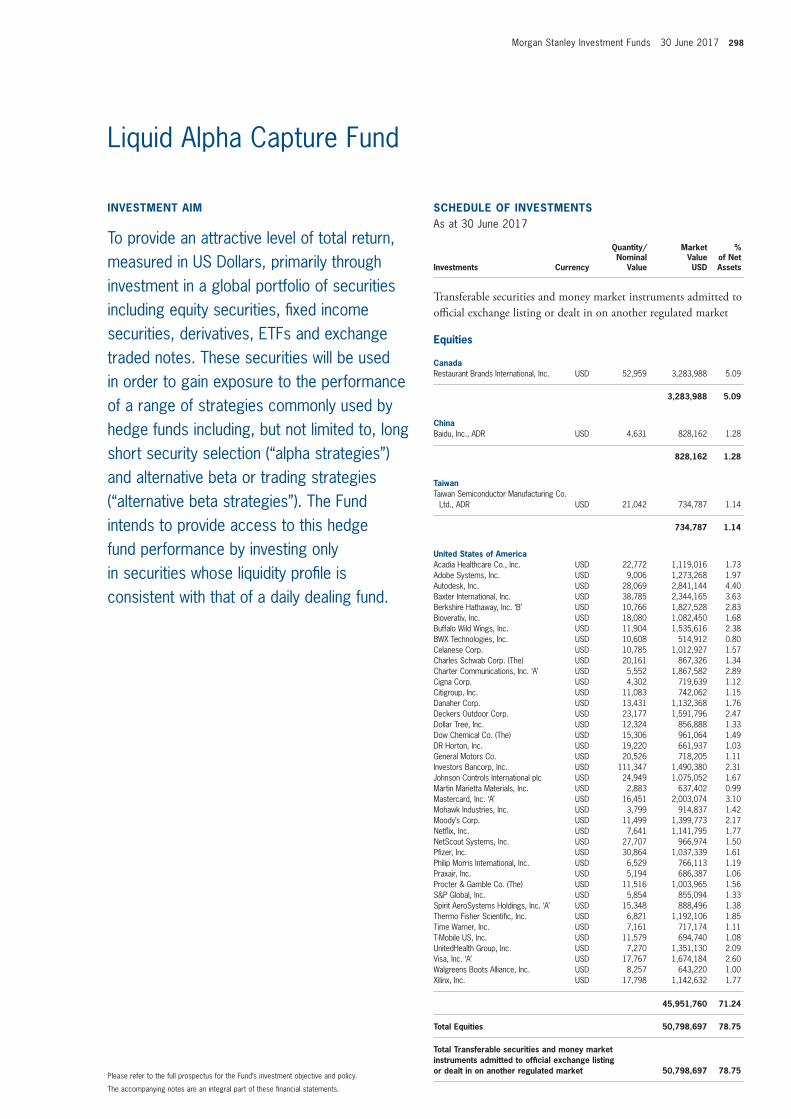
Morgan Stanley Investment Funds 30 June 2017 298
The accompanying notes are an integral part of these fi nancial statements.
Please refer to the full prospectus for the Fund’s investment objective and policy.
INVESTMENT AIM
To provide an attractive level of total return, measured in US Dollars, primarily through investment in a global portfolio of securities including equity securities, fi xed income securities, derivatives, ETFs and exchange traded notes. These securities will be used in order to gain exposure to the performance of a range of strategies commonly used by hedge funds including, but not limited to, long short security selection (“alpha strategies”) and alternative beta or trading strategies (“alternative beta strategies”). The Fund intends to provide access to this hedge fund performance by investing only in securities whose liquidity profi le is consistent with that of a daily dealing fund.
SCHEDULE OF INVESTMENTSAs at 30 June 2017
Investments Currency
Quantity/Nominal
Value
Market Value USD
% of Net Assets
Transferable securities and money market instruments admitted to offi cial exchange listing or dealt in on another regulated market
Equities
CanadaRestaurant Brands International, Inc. USD 52,959 3,283,988 5.09
3,283,988 5.09
ChinaBaidu, Inc., ADR USD 4,631 828,162 1.28
828,162 1.28
TaiwanTaiwan Semiconductor Manufacturing Co.
Ltd., ADR USD 21,042 734,787 1.14
734,787 1.14
United States of AmericaAcadia Healthcare Co., Inc. USD 22,772 1,119,016 1.73 Adobe Systems, Inc. USD 9,006 1,273,268 1.97 Autodesk, Inc. USD 28,069 2,841,144 4.40 Baxter International, Inc. USD 38,785 2,344,165 3.63 Berkshire Hathaway, Inc. ‘B’ USD 10,766 1,827,528 2.83 Bioverativ, Inc. USD 18,080 1,082,450 1.68 Buffalo Wild Wings, Inc. USD 11,904 1,535,616 2.38 BWX Technologies, Inc. USD 10,608 514,912 0.80 Celanese Corp. USD 10,785 1,012,927 1.57 Charles Schwab Corp. (The) USD 20,161 867,326 1.34 Charter Communications, Inc. ‘A’ USD 5,552 1,867,582 2.89 Cigna Corp. USD 4,302 719,639 1.12 Citigroup, Inc. USD 11,083 742,062 1.15 Danaher Corp. USD 13,431 1,132,368 1.76 Deckers Outdoor Corp. USD 23,177 1,591,796 2.47 Dollar Tree, Inc. USD 12,324 856,888 1.33 Dow Chemical Co. (The) USD 15,306 961,064 1.49 DR Horton, Inc. USD 19,220 661,937 1.03 General Motors Co. USD 20,526 718,205 1.11 Investors Bancorp, Inc. USD 111,347 1,490,380 2.31 Johnson Controls International plc USD 24,949 1,075,052 1.67 Martin Marietta Materials, Inc. USD 2,883 637,402 0.99 Mastercard, Inc. ‘A’ USD 16,451 2,003,074 3.10 Mohawk Industries, Inc. USD 3,799 914,837 1.42 Moody’s Corp. USD 11,499 1,399,773 2.17 Netfl ix, Inc. USD 7,641 1,141,795 1.77 NetScout Systems, Inc. USD 27,707 966,974 1.50 Pfi zer, Inc. USD 30,864 1,037,339 1.61 Philip Morris International, Inc. USD 6,529 766,113 1.19 Praxair, Inc. USD 5,194 686,387 1.06 Procter & Gamble Co. (The) USD 11,516 1,003,965 1.56 S&P Global, Inc. USD 5,854 855,094 1.33 Spirit AeroSystems Holdings, Inc. ‘A’ USD 15,348 888,496 1.38 Thermo Fisher Scientifi c, Inc. USD 6,821 1,192,106 1.85 Time Warner, Inc. USD 7,161 717,174 1.11 T-Mobile US, Inc. USD 11,579 694,740 1.08 UnitedHealth Group, Inc. USD 7,270 1,351,130 2.09 Visa, Inc. ‘A’ USD 17,767 1,674,184 2.60 Walgreens Boots Alliance, Inc. USD 8,257 643,220 1.00 Xilinx, Inc. USD 17,798 1,142,632 1.77
45,951,760 71.24
Total Equities 50,798,697 78.75
Total Transferable securities and money market instruments admitted to offi cial exchange listing or dealt in on another regulated market 50,798,697 78.75
Liquid Alpha Capture Fund
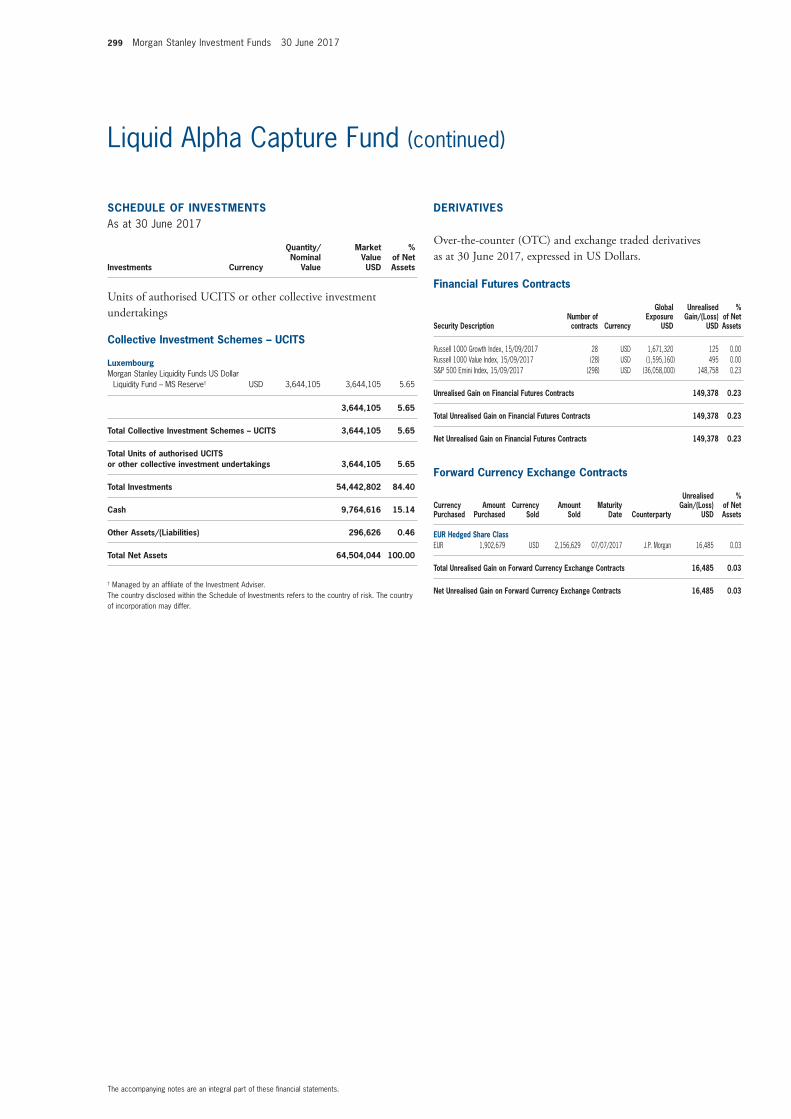
299 Morgan Stanley Investment Funds 30 June 2017
The accompanying notes are an integral part of these fi nancial statements.
Liquid Alpha Capture Fund (continued)
SCHEDULE OF INVESTMENTSAs at 30 June 2017
Investments Currency
Quantity/Nominal
Value
Market Value USD
% of Net Assets
Units of authorised UCITS or other collective investment undertakings
Collective Investment Schemes – UCITS
LuxembourgMorgan Stanley Liquidity Funds US Dollar
Liquidity Fund – MS Reserve† USD 3,644,105 3,644,105 5.65
3,644,105 5.65
Total Collective Investment Schemes – UCITS 3,644,105 5.65
Total Units of authorised UCITS or other collective investment undertakings 3,644,105 5.65
Total Investments 54,442,802 84.40
Cash 9,764,616 15.14
Other Assets/(Liabilities) 296,626 0.46
Total Net Assets 64,504,044 100.00
† Managed by an affi liate of the Investment Adviser.The country disclosed within the Schedule of Investments refers to the country of risk. The country of incorporation may differ.
Financial Futures Contracts
Security DescriptionNumber of contracts Currency
Global Exposure
USD
Unrealised Gain/(Loss)
USD
% of Net Assets
Russell 1000 Growth Index, 15/09/2017 28 USD 1,671,320 125 0.00 Russell 1000 Value Index, 15/09/2017 (28) USD (1,595,160) 495 0.00 S&P 500 Emini Index, 15/09/2017 (298) USD (36,058,000) 148,758 0.23
Unrealised Gain on Financial Futures Contracts 149,378 0.23
Total Unrealised Gain on Financial Futures Contracts 149,378 0.23
Net Unrealised Gain on Financial Futures Contracts 149,378 0.23
Forward Currency Exchange Contracts
Currency Purchased
Amount Purchased
Currency Sold
Amount Sold
Maturity Date Counterparty
Unrealised Gain/(Loss)
USD
% of Net Assets
EUR Hedged Share ClassEUR 1,902,679 USD 2,156,629 07/07/2017 J.P. Morgan 16,485 0.03
Total Unrealised Gain on Forward Currency Exchange Contracts 16,485 0.03
Net Unrealised Gain on Forward Currency Exchange Contracts 16,485 0.03
DERIVATIVES
Over-the-counter (OTC) and exchange traded derivatives as at 30 June 2017, expressed in US Dollars.
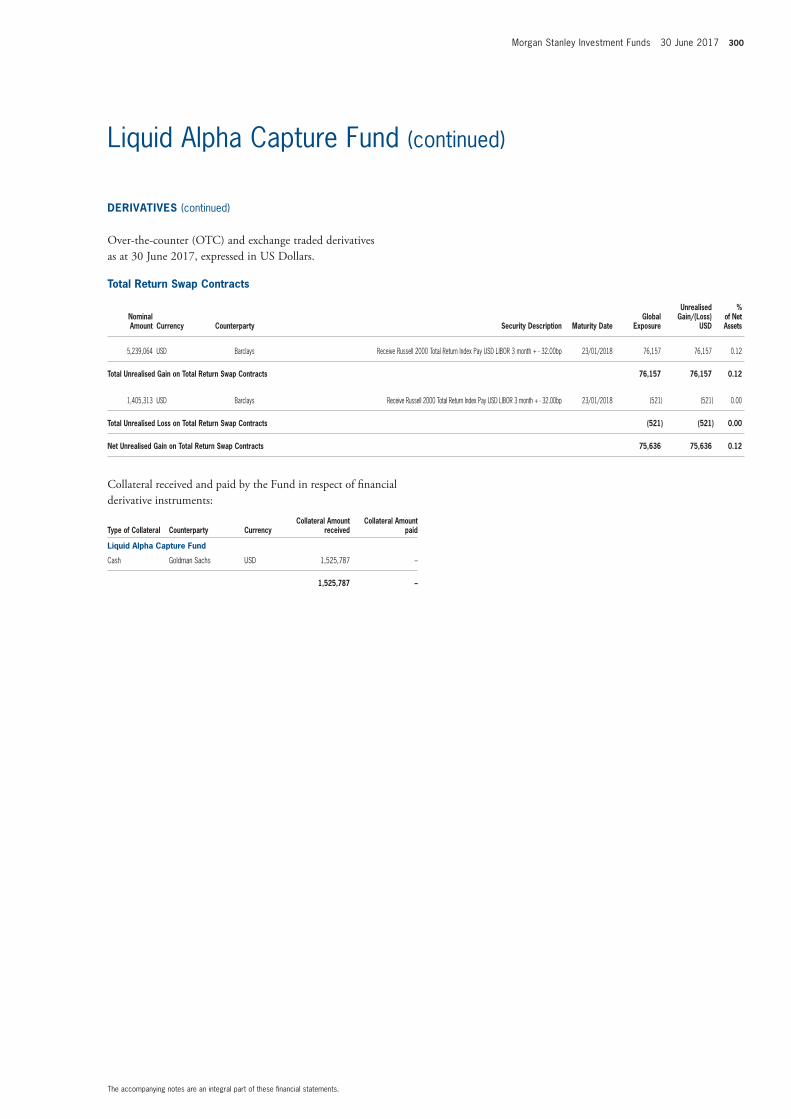
Morgan Stanley Investment Funds 30 June 2017 300
The accompanying notes are an integral part of these fi nancial statements.
Liquid Alpha Capture Fund (continued)
Total Return Swap Contracts
Nominal Amount Currency Counterparty Security Description Maturity Date
Global Exposure
Unrealised Gain/(Loss)
USD
% of Net Assets
5,239,064 USD Barclays Receive Russell 2000 Total Return Index Pay USD LIBOR 3 month + - 32.00bp 23/01/2018 76,157 76,157 0.12
Total Unrealised Gain on Total Return Swap Contracts 76,157 76,157 0.12
1,405,313 USD Barclays Receive Russell 2000 Total Return Index Pay USD LIBOR 3 month + - 32.00bp 23/01/2018 (521) (521) 0.00
Total Unrealised Loss on Total Return Swap Contracts (521) (521) 0.00
Net Unrealised Gain on Total Return Swap Contracts 75,636 75,636 0.12
Collateral received and paid by the Fund in respect of fi nancial derivative instruments:
Type of Collateral Counterparty CurrencyCollateral Amount
receivedCollateral Amount
paid
Liquid Alpha Capture Fund
Cash Goldman Sachs USD 1,525,787 –
1,525,787 –
DERIVATIVES (continued)
Over-the-counter (OTC) and exchange traded derivatives as at 30 June 2017, expressed in US Dollars.
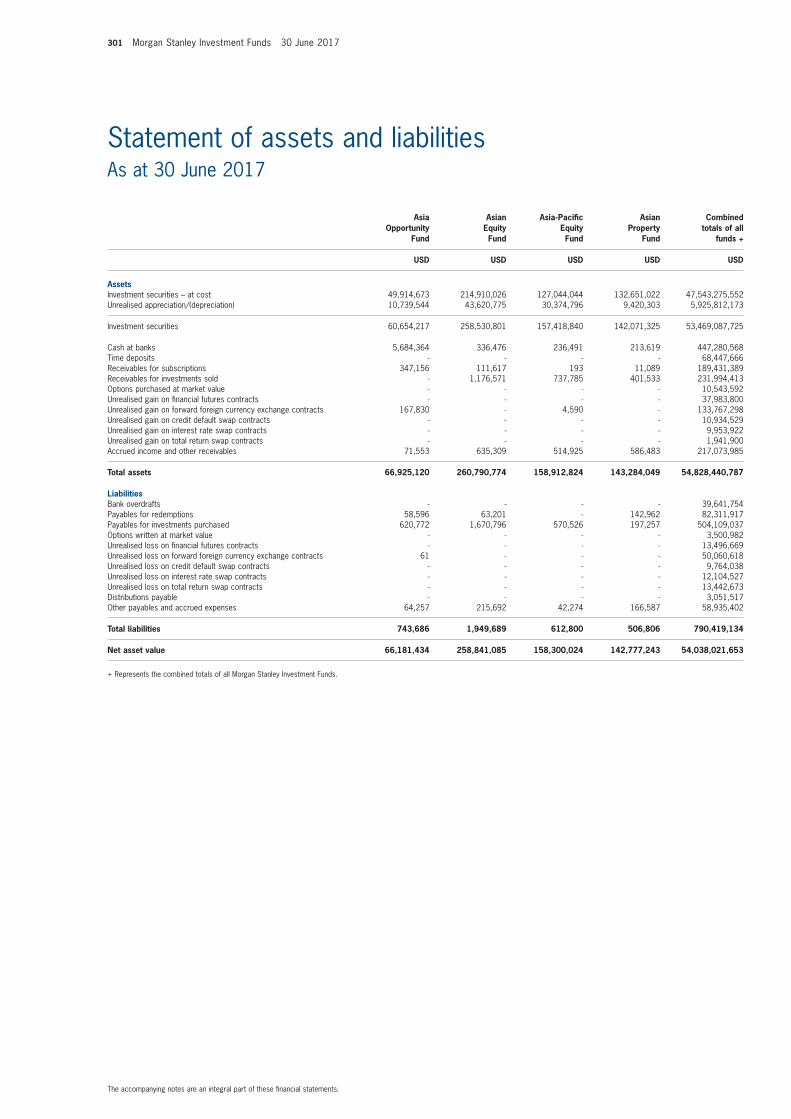
301 Morgan Stanley Investment Funds 30 June 2017
The accompanying notes are an integral part of these fi nancial statements.
Asia Opportunity
Fund
Asian Equity Fund
Asia-Pacifi c Equity Fund
Asian Property
Fund
Combined totals of all
funds +
USD USD USD USD USD
AssetsInvestment securities – at cost 49,914,673 214,910,026 127,044,044 132,651,022 47,543,275,552 Unrealised appreciation/(depreciation) 10,739,544 43,620,775 30,374,796 9,420,303 5,925,812,173
Investment securities 60,654,217 258,530,801 157,418,840 142,071,325 53,469,087,725
Cash at banks 5,684,364 336,476 236,491 213,619 447,280,568 Time deposits - - - - 68,447,666 Receivables for subscriptions 347,156 111,617 193 11,089 189,431,389 Receivables for investments sold - 1,176,571 737,785 401,533 231,994,413 Options purchased at market value - - - - 10,543,592 Unrealised gain on fi nancial futures contracts - - - - 37,983,800 Unrealised gain on forward foreign currency exchange contracts 167,830 - 4,590 - 133,767,298 Unrealised gain on credit default swap contracts - - - - 10,934,529 Unrealised gain on interest rate swap contracts - - - - 9,953,922 Unrealised gain on total return swap contracts - - - - 1,941,900 Accrued income and other receivables 71,553 635,309 514,925 586,483 217,073,985
Total assets 66,925,120 260,790,774 158,912,824 143,284,049 54,828,440,787
LiabilitiesBank overdrafts - - - - 39,641,754 Payables for redemptions 58,596 63,201 - 142,962 82,311,917 Payables for investments purchased 620,772 1,670,796 570,526 197,257 504,109,037Options written at market value - - - - 3,500,982 Unrealised loss on fi nancial futures contracts - - - - 13,496,669 Unrealised loss on forward foreign currency exchange contracts 61 - - - 50,060,618 Unrealised loss on credit default swap contracts - - - - 9,764,038 Unrealised loss on interest rate swap contracts - - - - 12,104,527 Unrealised loss on total return swap contracts - - - - 13,442,673 Distributions payable - - - - 3,051,517 Other payables and accrued expenses 64,257 215,692 42,274 166,587 58,935,402
Total liabilities 743,686 1,949,689 612,800 506,806 790,419,134
Net asset value 66,181,434 258,841,085 158,300,024 142,777,243 54,038,021,653
+ Represents the combined totals of all Morgan Stanley Investment Funds.
Statement of assets and liabilitiesAs at 30 June 2017
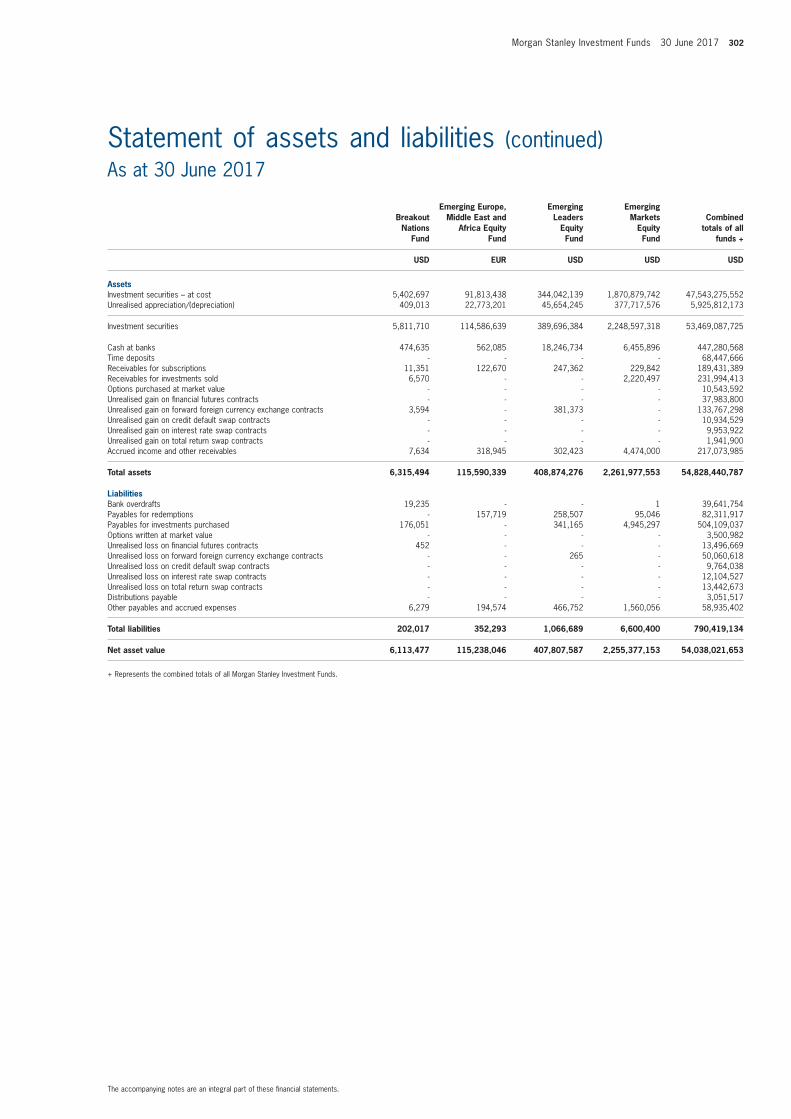
Morgan Stanley Investment Funds 30 June 2017 302
The accompanying notes are an integral part of these fi nancial statements.
Statement of assets and liabilities (continued)As at 30 June 2017
Breakout Nations
Fund
Emerging Europe, Middle East and
Africa Equity Fund
Emerging Leaders
Equity Fund
Emerging Markets
Equity Fund
Combined totals of all
funds +
USD EUR USD USD USD
AssetsInvestment securities – at cost 5,402,697 91,813,438 344,042,139 1,870,879,742 47,543,275,552 Unrealised appreciation/(depreciation) 409,013 22,773,201 45,654,245 377,717,576 5,925,812,173
Investment securities 5,811,710 114,586,639 389,696,384 2,248,597,318 53,469,087,725
Cash at banks 474,635 562,085 18,246,734 6,455,896 447,280,568 Time deposits - - - - 68,447,666 Receivables for subscriptions 11,351 122,670 247,362 229,842 189,431,389 Receivables for investments sold 6,570 - - 2,220,497 231,994,413 Options purchased at market value - - - - 10,543,592 Unrealised gain on fi nancial futures contracts - - - - 37,983,800 Unrealised gain on forward foreign currency exchange contracts 3,594 - 381,373 - 133,767,298 Unrealised gain on credit default swap contracts - - - - 10,934,529 Unrealised gain on interest rate swap contracts - - - - 9,953,922 Unrealised gain on total return swap contracts - - - - 1,941,900 Accrued income and other receivables 7,634 318,945 302,423 4,474,000 217,073,985
Total assets 6,315,494 115,590,339 408,874,276 2,261,977,553 54,828,440,787
LiabilitiesBank overdrafts 19,235 - - 1 39,641,754 Payables for redemptions - 157,719 258,507 95,046 82,311,917 Payables for investments purchased 176,051 - 341,165 4,945,297 504,109,037Options written at market value - - - - 3,500,982 Unrealised loss on fi nancial futures contracts 452 - - - 13,496,669 Unrealised loss on forward foreign currency exchange contracts - - 265 - 50,060,618 Unrealised loss on credit default swap contracts - - - - 9,764,038 Unrealised loss on interest rate swap contracts - - - - 12,104,527 Unrealised loss on total return swap contracts - - - - 13,442,673 Distributions payable - - - - 3,051,517 Other payables and accrued expenses 6,279 194,574 466,752 1,560,056 58,935,402
Total liabilities 202,017 352,293 1,066,689 6,600,400 790,419,134
Net asset value 6,113,477 115,238,046 407,807,587 2,255,377,153 54,038,021,653
+ Represents the combined totals of all Morgan Stanley Investment Funds.
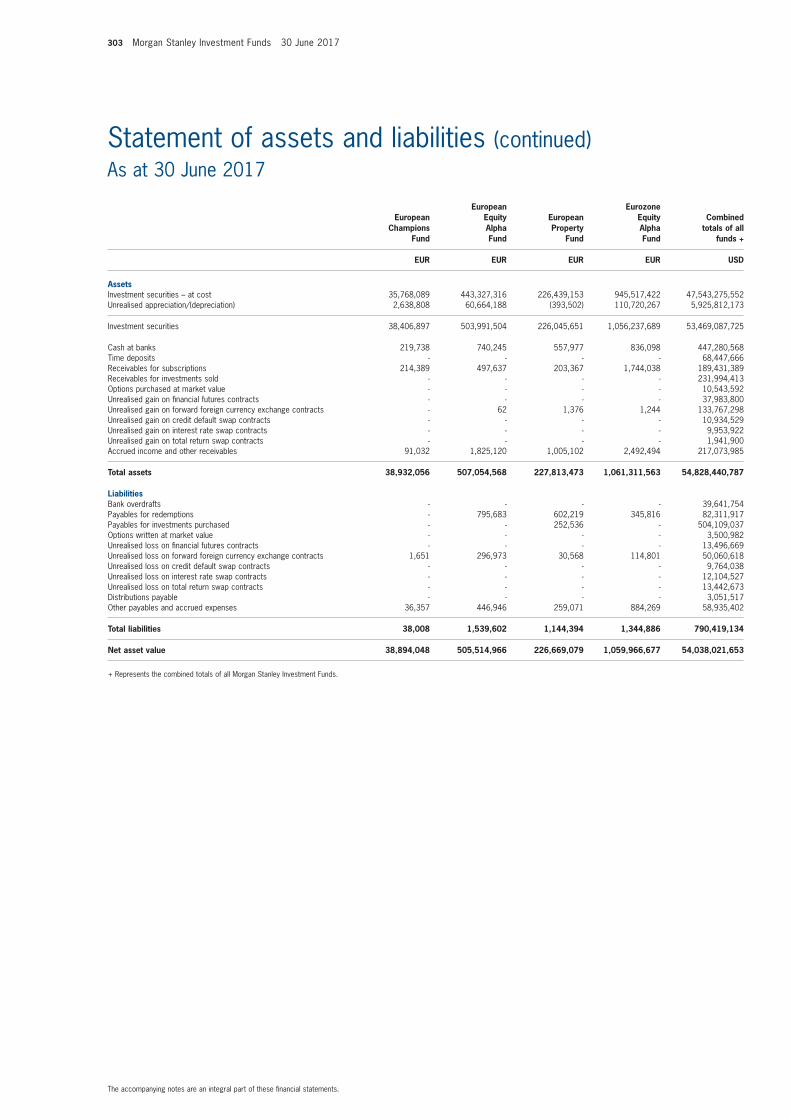
303 Morgan Stanley Investment Funds 30 June 2017
The accompanying notes are an integral part of these fi nancial statements.
Statement of assets and liabilities (continued)As at 30 June 2017
European Champions
Fund
European Equity Alpha Fund
European Property
Fund
Eurozone Equity Alpha Fund
Combined totals of all
funds +
EUR EUR EUR EUR USD
AssetsInvestment securities – at cost 35,768,089 443,327,316 226,439,153 945,517,422 47,543,275,552 Unrealised appreciation/(depreciation) 2,638,808 60,664,188 (393,502) 110,720,267 5,925,812,173
Investment securities 38,406,897 503,991,504 226,045,651 1,056,237,689 53,469,087,725
Cash at banks 219,738 740,245 557,977 836,098 447,280,568 Time deposits - - - - 68,447,666 Receivables for subscriptions 214,389 497,637 203,367 1,744,038 189,431,389 Receivables for investments sold - - - - 231,994,413 Options purchased at market value - - - - 10,543,592 Unrealised gain on fi nancial futures contracts - - - - 37,983,800 Unrealised gain on forward foreign currency exchange contracts - 62 1,376 1,244 133,767,298 Unrealised gain on credit default swap contracts - - - - 10,934,529 Unrealised gain on interest rate swap contracts - - - - 9,953,922 Unrealised gain on total return swap contracts - - - - 1,941,900 Accrued income and other receivables 91,032 1,825,120 1,005,102 2,492,494 217,073,985
Total assets 38,932,056 507,054,568 227,813,473 1,061,311,563 54,828,440,787
LiabilitiesBank overdrafts - - - - 39,641,754 Payables for redemptions - 795,683 602,219 345,816 82,311,917 Payables for investments purchased - - 252,536 - 504,109,037Options written at market value - - - - 3,500,982 Unrealised loss on fi nancial futures contracts - - - - 13,496,669 Unrealised loss on forward foreign currency exchange contracts 1,651 296,973 30,568 114,801 50,060,618 Unrealised loss on credit default swap contracts - - - - 9,764,038 Unrealised loss on interest rate swap contracts - - - - 12,104,527 Unrealised loss on total return swap contracts - - - - 13,442,673 Distributions payable - - - - 3,051,517 Other payables and accrued expenses 36,357 446,946 259,071 884,269 58,935,402
Total liabilities 38,008 1,539,602 1,144,394 1,344,886 790,419,134
Net asset value 38,894,048 505,514,966 226,669,079 1,059,966,677 54,038,021,653
+ Represents the combined totals of all Morgan Stanley Investment Funds.
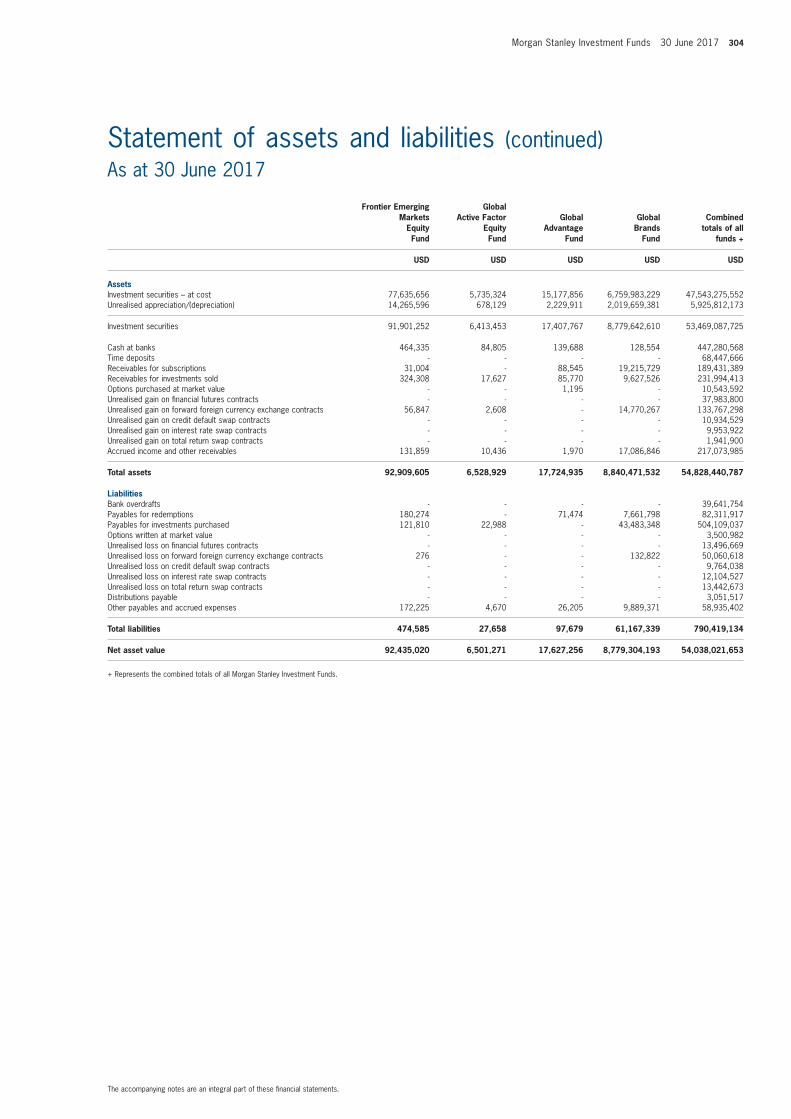
Morgan Stanley Investment Funds 30 June 2017 304
The accompanying notes are an integral part of these fi nancial statements.
Statement of assets and liabilities (continued)As at 30 June 2017
Frontier Emerging Markets
Equity Fund
Global Active Factor
Equity Fund
Global Advantage
Fund
Global Brands
Fund
Combined totals of all
funds +
USD USD USD USD USD
AssetsInvestment securities – at cost 77,635,656 5,735,324 15,177,856 6,759,983,229 47,543,275,552 Unrealised appreciation/(depreciation) 14,265,596 678,129 2,229,911 2,019,659,381 5,925,812,173
Investment securities 91,901,252 6,413,453 17,407,767 8,779,642,610 53,469,087,725
Cash at banks 464,335 84,805 139,688 128,554 447,280,568 Time deposits - - - - 68,447,666 Receivables for subscriptions 31,004 - 88,545 19,215,729 189,431,389 Receivables for investments sold 324,308 17,627 85,770 9,627,526 231,994,413 Options purchased at market value - - 1,195 - 10,543,592 Unrealised gain on fi nancial futures contracts - - - - 37,983,800 Unrealised gain on forward foreign currency exchange contracts 56,847 2,608 - 14,770,267 133,767,298 Unrealised gain on credit default swap contracts - - - - 10,934,529 Unrealised gain on interest rate swap contracts - - - - 9,953,922 Unrealised gain on total return swap contracts - - - - 1,941,900 Accrued income and other receivables 131,859 10,436 1,970 17,086,846 217,073,985
Total assets 92,909,605 6,528,929 17,724,935 8,840,471,532 54,828,440,787
LiabilitiesBank overdrafts - - - - 39,641,754 Payables for redemptions 180,274 - 71,474 7,661,798 82,311,917 Payables for investments purchased 121,810 22,988 - 43,483,348 504,109,037Options written at market value - - - - 3,500,982 Unrealised loss on fi nancial futures contracts - - - - 13,496,669 Unrealised loss on forward foreign currency exchange contracts 276 - - 132,822 50,060,618 Unrealised loss on credit default swap contracts - - - - 9,764,038 Unrealised loss on interest rate swap contracts - - - - 12,104,527 Unrealised loss on total return swap contracts - - - - 13,442,673 Distributions payable - - - - 3,051,517 Other payables and accrued expenses 172,225 4,670 26,205 9,889,371 58,935,402
Total liabilities 474,585 27,658 97,679 61,167,339 790,419,134
Net asset value 92,435,020 6,501,271 17,627,256 8,779,304,193 54,038,021,653
+ Represents the combined totals of all Morgan Stanley Investment Funds.
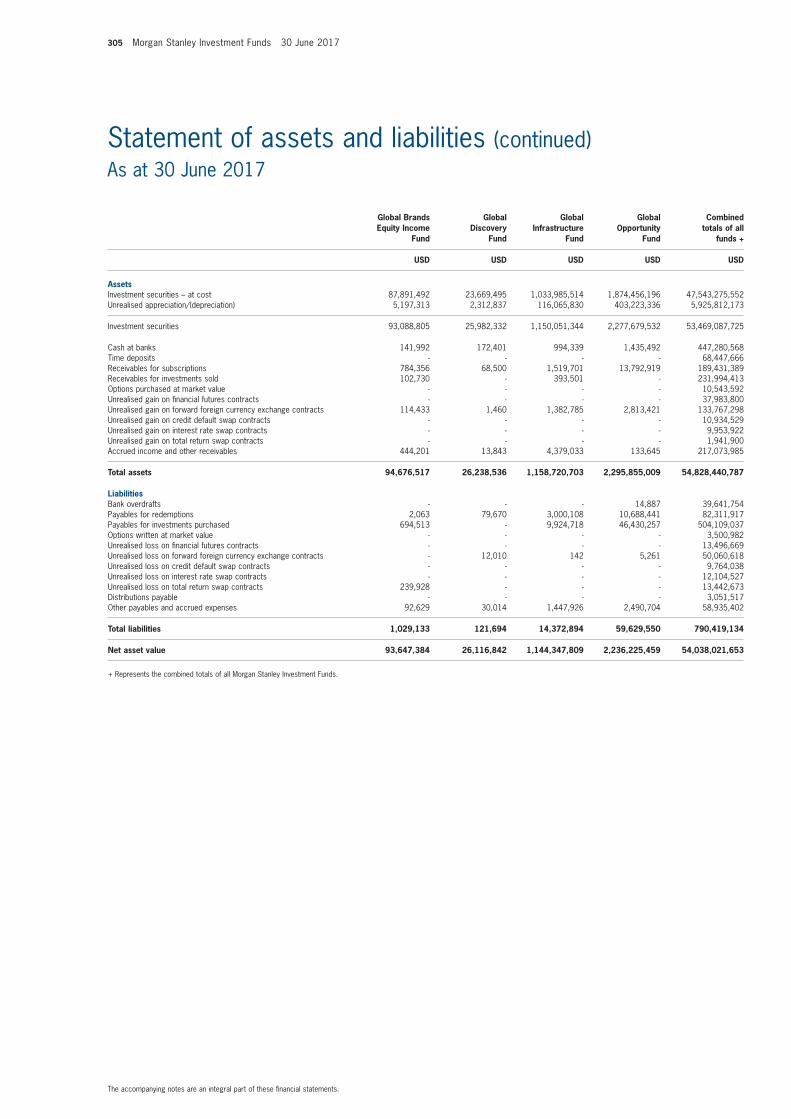
305 Morgan Stanley Investment Funds 30 June 2017
The accompanying notes are an integral part of these fi nancial statements.
Statement of assets and liabilities (continued)As at 30 June 2017
Global Brands Equity Income
Fund
Global Discovery
Fund
Global Infrastructure
Fund
Global Opportunity
Fund
Combined totals of all
funds +
USD USD USD USD USD
AssetsInvestment securities – at cost 87,891,492 23,669,495 1,033,985,514 1,874,456,196 47,543,275,552 Unrealised appreciation/(depreciation) 5,197,313 2,312,837 116,065,830 403,223,336 5,925,812,173
Investment securities 93,088,805 25,982,332 1,150,051,344 2,277,679,532 53,469,087,725
Cash at banks 141,992 172,401 994,339 1,435,492 447,280,568 Time deposits - - - - 68,447,666 Receivables for subscriptions 784,356 68,500 1,519,701 13,792,919 189,431,389 Receivables for investments sold 102,730 - 393,501 - 231,994,413 Options purchased at market value - - - - 10,543,592 Unrealised gain on fi nancial futures contracts - - - - 37,983,800 Unrealised gain on forward foreign currency exchange contracts 114,433 1,460 1,382,785 2,813,421 133,767,298 Unrealised gain on credit default swap contracts - - - - 10,934,529 Unrealised gain on interest rate swap contracts - - - - 9,953,922 Unrealised gain on total return swap contracts - - - - 1,941,900 Accrued income and other receivables 444,201 13,843 4,379,033 133,645 217,073,985
Total assets 94,676,517 26,238,536 1,158,720,703 2,295,855,009 54,828,440,787
LiabilitiesBank overdrafts - - - 14,887 39,641,754 Payables for redemptions 2,063 79,670 3,000,108 10,688,441 82,311,917 Payables for investments purchased 694,513 - 9,924,718 46,430,257 504,109,037Options written at market value - - - - 3,500,982 Unrealised loss on fi nancial futures contracts - - - - 13,496,669 Unrealised loss on forward foreign currency exchange contracts - 12,010 142 5,261 50,060,618 Unrealised loss on credit default swap contracts - - - - 9,764,038 Unrealised loss on interest rate swap contracts - - - - 12,104,527 Unrealised loss on total return swap contracts 239,928 - - - 13,442,673 Distributions payable - - - - 3,051,517 Other payables and accrued expenses 92,629 30,014 1,447,926 2,490,704 58,935,402
Total liabilities 1,029,133 121,694 14,372,894 59,629,550 790,419,134
Net asset value 93,647,384 26,116,842 1,144,347,809 2,236,225,459 54,038,021,653
+ Represents the combined totals of all Morgan Stanley Investment Funds.
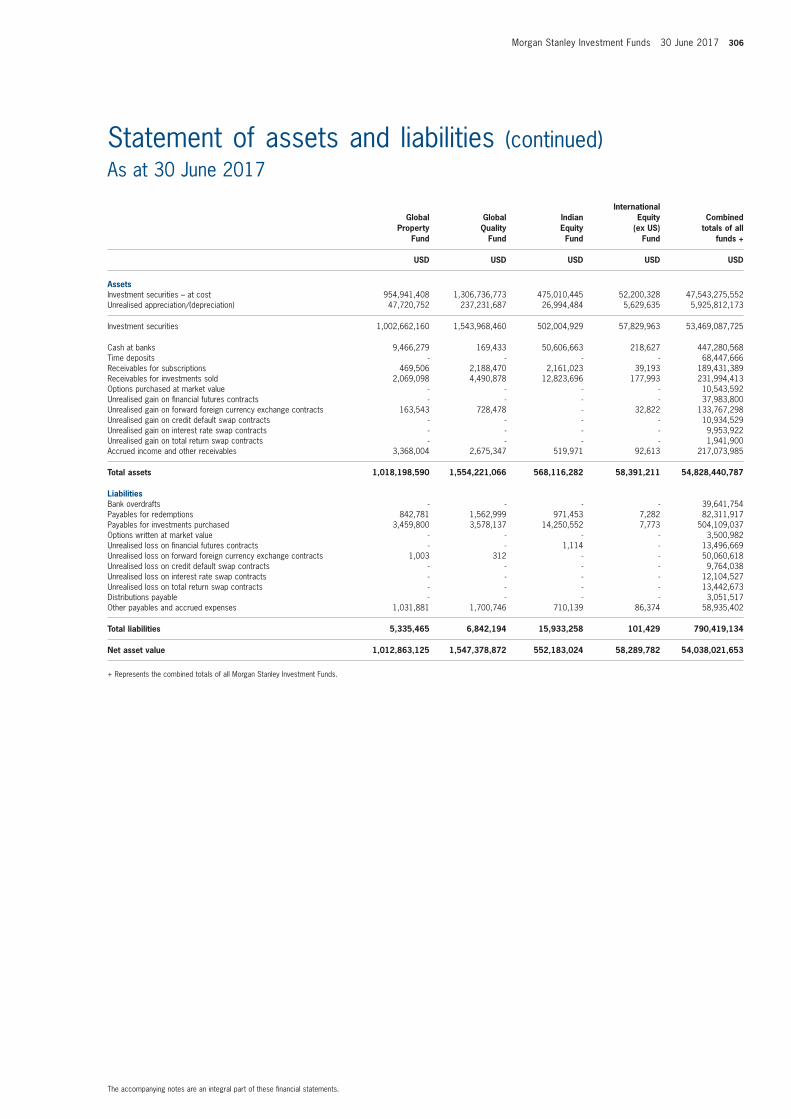
Morgan Stanley Investment Funds 30 June 2017 306
The accompanying notes are an integral part of these fi nancial statements.
Statement of assets and liabilities (continued)As at 30 June 2017
Global Property
Fund
Global Quality
Fund
Indian Equity Fund
International Equity
(ex US) Fund
Combined totals of all
funds +
USD USD USD USD USD
AssetsInvestment securities – at cost 954,941,408 1,306,736,773 475,010,445 52,200,328 47,543,275,552 Unrealised appreciation/(depreciation) 47,720,752 237,231,687 26,994,484 5,629,635 5,925,812,173
Investment securities 1,002,662,160 1,543,968,460 502,004,929 57,829,963 53,469,087,725
Cash at banks 9,466,279 169,433 50,606,663 218,627 447,280,568 Time deposits - - - - 68,447,666 Receivables for subscriptions 469,506 2,188,470 2,161,023 39,193 189,431,389 Receivables for investments sold 2,069,098 4,490,878 12,823,696 177,993 231,994,413 Options purchased at market value - - - - 10,543,592 Unrealised gain on fi nancial futures contracts - - - - 37,983,800 Unrealised gain on forward foreign currency exchange contracts 163,543 728,478 - 32,822 133,767,298 Unrealised gain on credit default swap contracts - - - - 10,934,529 Unrealised gain on interest rate swap contracts - - - - 9,953,922 Unrealised gain on total return swap contracts - - - - 1,941,900 Accrued income and other receivables 3,368,004 2,675,347 519,971 92,613 217,073,985
Total assets 1,018,198,590 1,554,221,066 568,116,282 58,391,211 54,828,440,787
LiabilitiesBank overdrafts - - - - 39,641,754 Payables for redemptions 842,781 1,562,999 971,453 7,282 82,311,917 Payables for investments purchased 3,459,800 3,578,137 14,250,552 7,773 504,109,037Options written at market value - - - - 3,500,982 Unrealised loss on fi nancial futures contracts - - 1,114 - 13,496,669 Unrealised loss on forward foreign currency exchange contracts 1,003 312 - - 50,060,618 Unrealised loss on credit default swap contracts - - - - 9,764,038 Unrealised loss on interest rate swap contracts - - - - 12,104,527 Unrealised loss on total return swap contracts - - - - 13,442,673 Distributions payable - - - - 3,051,517 Other payables and accrued expenses 1,031,881 1,700,746 710,139 86,374 58,935,402
Total liabilities 5,335,465 6,842,194 15,933,258 101,429 790,419,134
Net asset value 1,012,863,125 1,547,378,872 552,183,024 58,289,782 54,038,021,653
+ Represents the combined totals of all Morgan Stanley Investment Funds.
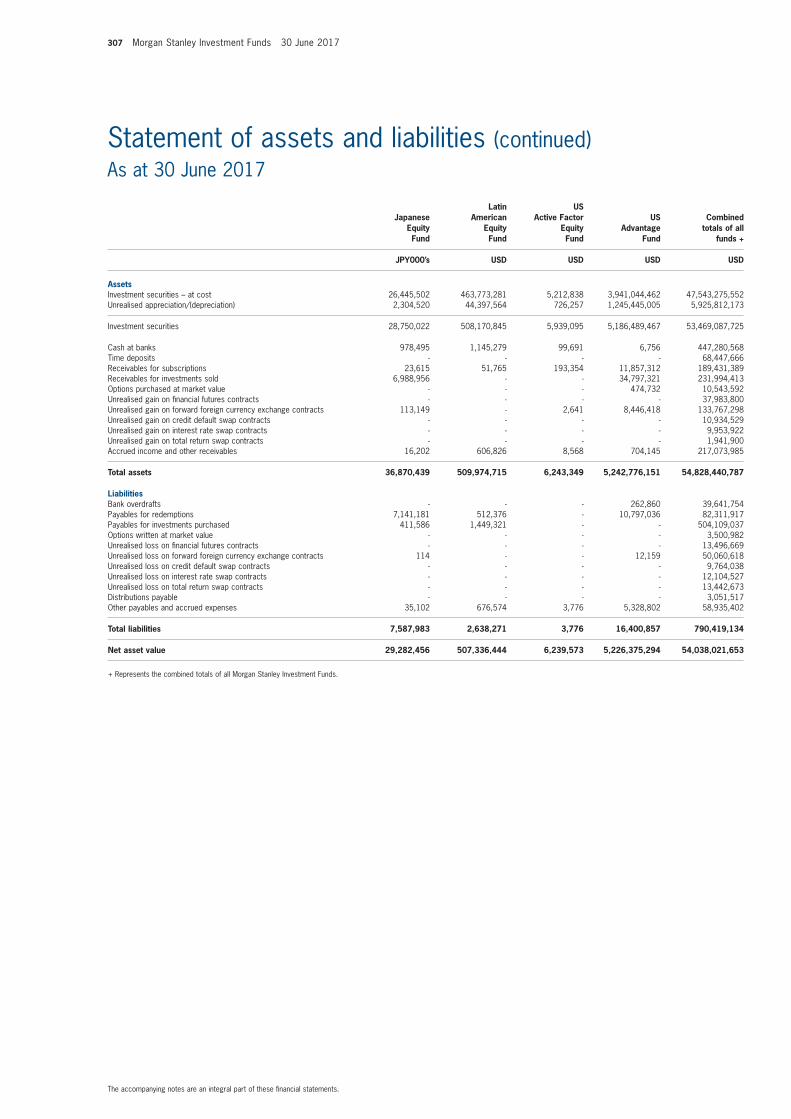
307 Morgan Stanley Investment Funds 30 June 2017
The accompanying notes are an integral part of these fi nancial statements.
Statement of assets and liabilities (continued)As at 30 June 2017
Japanese Equity Fund
Latin American
Equity Fund
US Active Factor
Equity Fund
US Advantage
Fund
Combined totals of all
funds +
JPY000’s USD USD USD USD
AssetsInvestment securities – at cost 26,445,502 463,773,281 5,212,838 3,941,044,462 47,543,275,552 Unrealised appreciation/(depreciation) 2,304,520 44,397,564 726,257 1,245,445,005 5,925,812,173
Investment securities 28,750,022 508,170,845 5,939,095 5,186,489,467 53,469,087,725
Cash at banks 978,495 1,145,279 99,691 6,756 447,280,568 Time deposits - - - - 68,447,666 Receivables for subscriptions 23,615 51,765 193,354 11,857,312 189,431,389 Receivables for investments sold 6,988,956 - - 34,797,321 231,994,413 Options purchased at market value - - - 474,732 10,543,592 Unrealised gain on fi nancial futures contracts - - - - 37,983,800 Unrealised gain on forward foreign currency exchange contracts 113,149 - 2,641 8,446,418 133,767,298 Unrealised gain on credit default swap contracts - - - - 10,934,529 Unrealised gain on interest rate swap contracts - - - - 9,953,922 Unrealised gain on total return swap contracts - - - - 1,941,900 Accrued income and other receivables 16,202 606,826 8,568 704,145 217,073,985
Total assets 36,870,439 509,974,715 6,243,349 5,242,776,151 54,828,440,787
LiabilitiesBank overdrafts - - - 262,860 39,641,754 Payables for redemptions 7,141,181 512,376 - 10,797,036 82,311,917 Payables for investments purchased 411,586 1,449,321 - - 504,109,037Options written at market value - - - - 3,500,982 Unrealised loss on fi nancial futures contracts - - - - 13,496,669 Unrealised loss on forward foreign currency exchange contracts 114 - - 12,159 50,060,618 Unrealised loss on credit default swap contracts - - - - 9,764,038 Unrealised loss on interest rate swap contracts - - - - 12,104,527 Unrealised loss on total return swap contracts - - - - 13,442,673 Distributions payable - - - - 3,051,517 Other payables and accrued expenses 35,102 676,574 3,776 5,328,802 58,935,402
Total liabilities 7,587,983 2,638,271 3,776 16,400,857 790,419,134
Net asset value 29,282,456 507,336,444 6,239,573 5,226,375,294 54,038,021,653
+ Represents the combined totals of all Morgan Stanley Investment Funds.
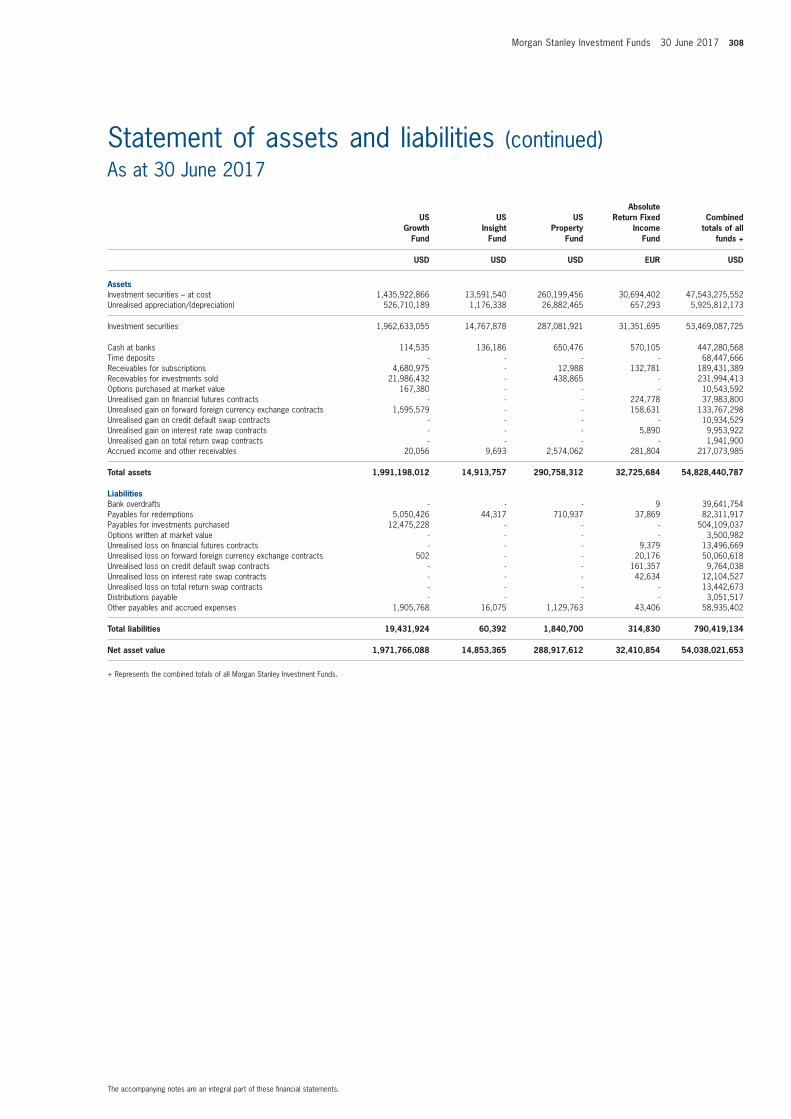
Morgan Stanley Investment Funds 30 June 2017 308
The accompanying notes are an integral part of these fi nancial statements.
Statement of assets and liabilities (continued)As at 30 June 2017
US Growth
Fund
US Insight
Fund
US Property
Fund
Absolute Return Fixed
Income Fund
Combined totals of all
funds +
USD USD USD EUR USD
AssetsInvestment securities – at cost 1,435,922,866 13,591,540 260,199,456 30,694,402 47,543,275,552 Unrealised appreciation/(depreciation) 526,710,189 1,176,338 26,882,465 657,293 5,925,812,173
Investment securities 1,962,633,055 14,767,878 287,081,921 31,351,695 53,469,087,725
Cash at banks 114,535 136,186 650,476 570,105 447,280,568 Time deposits - - - - 68,447,666 Receivables for subscriptions 4,680,975 - 12,988 132,781 189,431,389 Receivables for investments sold 21,986,432 - 438,865 - 231,994,413 Options purchased at market value 167,380 - - - 10,543,592 Unrealised gain on fi nancial futures contracts - - - 224,778 37,983,800 Unrealised gain on forward foreign currency exchange contracts 1,595,579 - - 158,631 133,767,298 Unrealised gain on credit default swap contracts - - - - 10,934,529 Unrealised gain on interest rate swap contracts - - - 5,890 9,953,922 Unrealised gain on total return swap contracts - - - - 1,941,900 Accrued income and other receivables 20,056 9,693 2,574,062 281,804 217,073,985
Total assets 1,991,198,012 14,913,757 290,758,312 32,725,684 54,828,440,787
LiabilitiesBank overdrafts - - - 9 39,641,754 Payables for redemptions 5,050,426 44,317 710,937 37,869 82,311,917 Payables for investments purchased 12,475,228 - - - 504,109,037Options written at market value - - - - 3,500,982 Unrealised loss on fi nancial futures contracts - - - 9,379 13,496,669 Unrealised loss on forward foreign currency exchange contracts 502 - - 20,176 50,060,618 Unrealised loss on credit default swap contracts - - - 161,357 9,764,038 Unrealised loss on interest rate swap contracts - - - 42,634 12,104,527 Unrealised loss on total return swap contracts - - - - 13,442,673 Distributions payable - - - - 3,051,517 Other payables and accrued expenses 1,905,768 16,075 1,129,763 43,406 58,935,402
Total liabilities 19,431,924 60,392 1,840,700 314,830 790,419,134
Net asset value 1,971,766,088 14,853,365 288,917,612 32,410,854 54,038,021,653
+ Represents the combined totals of all Morgan Stanley Investment Funds.
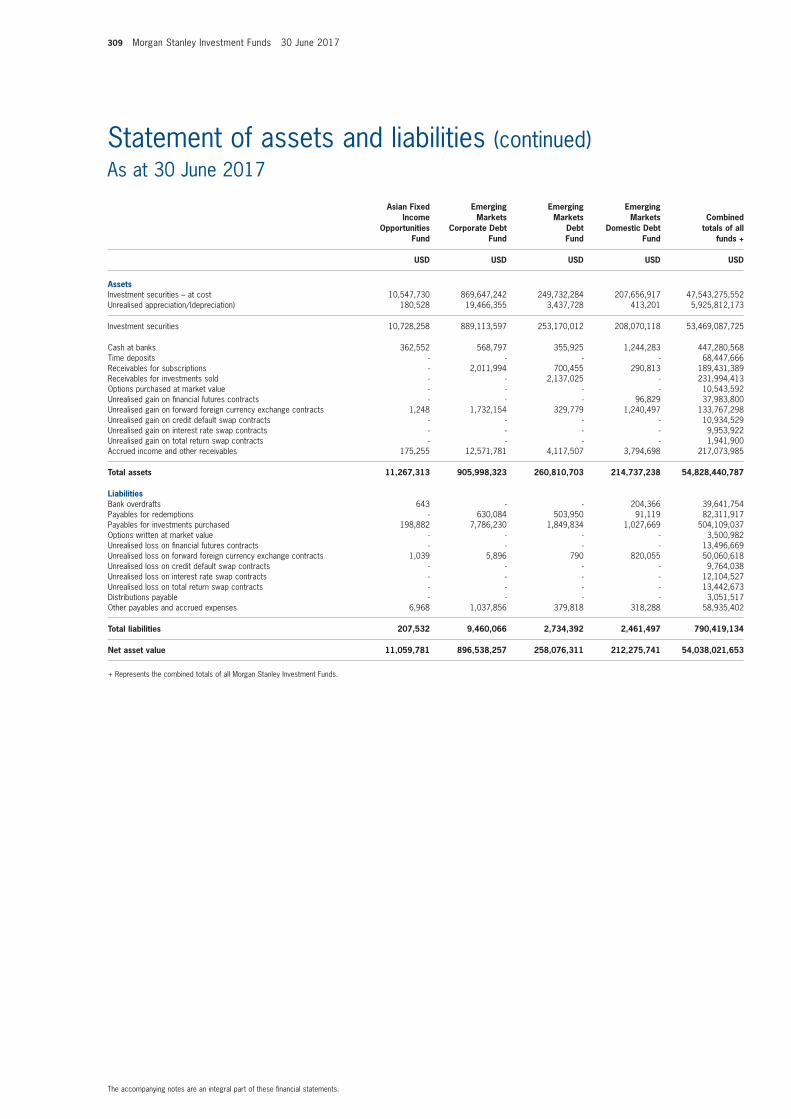
309 Morgan Stanley Investment Funds 30 June 2017
The accompanying notes are an integral part of these fi nancial statements.
Statement of assets and liabilities (continued)As at 30 June 2017
Asian Fixed Income
Opportunities Fund
Emerging Markets
Corporate Debt Fund
Emerging Markets
Debt Fund
Emerging Markets
Domestic Debt Fund
Combined totals of all
funds +
USD USD USD USD USD
AssetsInvestment securities – at cost 10,547,730 869,647,242 249,732,284 207,656,917 47,543,275,552 Unrealised appreciation/(depreciation) 180,528 19,466,355 3,437,728 413,201 5,925,812,173
Investment securities 10,728,258 889,113,597 253,170,012 208,070,118 53,469,087,725
Cash at banks 362,552 568,797 355,925 1,244,283 447,280,568 Time deposits - - - - 68,447,666 Receivables for subscriptions - 2,011,994 700,455 290,813 189,431,389 Receivables for investments sold - - 2,137,025 - 231,994,413 Options purchased at market value - - - - 10,543,592 Unrealised gain on fi nancial futures contracts - - - 96,829 37,983,800 Unrealised gain on forward foreign currency exchange contracts 1,248 1,732,154 329,779 1,240,497 133,767,298 Unrealised gain on credit default swap contracts - - - - 10,934,529 Unrealised gain on interest rate swap contracts - - - - 9,953,922 Unrealised gain on total return swap contracts - - - - 1,941,900 Accrued income and other receivables 175,255 12,571,781 4,117,507 3,794,698 217,073,985
Total assets 11,267,313 905,998,323 260,810,703 214,737,238 54,828,440,787
LiabilitiesBank overdrafts 643 - - 204,366 39,641,754 Payables for redemptions - 630,084 503,950 91,119 82,311,917 Payables for investments purchased 198,882 7,786,230 1,849,834 1,027,669 504,109,037Options written at market value - - - - 3,500,982 Unrealised loss on fi nancial futures contracts - - - - 13,496,669 Unrealised loss on forward foreign currency exchange contracts 1,039 5,896 790 820,055 50,060,618 Unrealised loss on credit default swap contracts - - - - 9,764,038 Unrealised loss on interest rate swap contracts - - - - 12,104,527 Unrealised loss on total return swap contracts - - - - 13,442,673 Distributions payable - - - - 3,051,517 Other payables and accrued expenses 6,968 1,037,856 379,818 318,288 58,935,402
Total liabilities 207,532 9,460,066 2,734,392 2,461,497 790,419,134
Net asset value 11,059,781 896,538,257 258,076,311 212,275,741 54,038,021,653
+ Represents the combined totals of all Morgan Stanley Investment Funds.
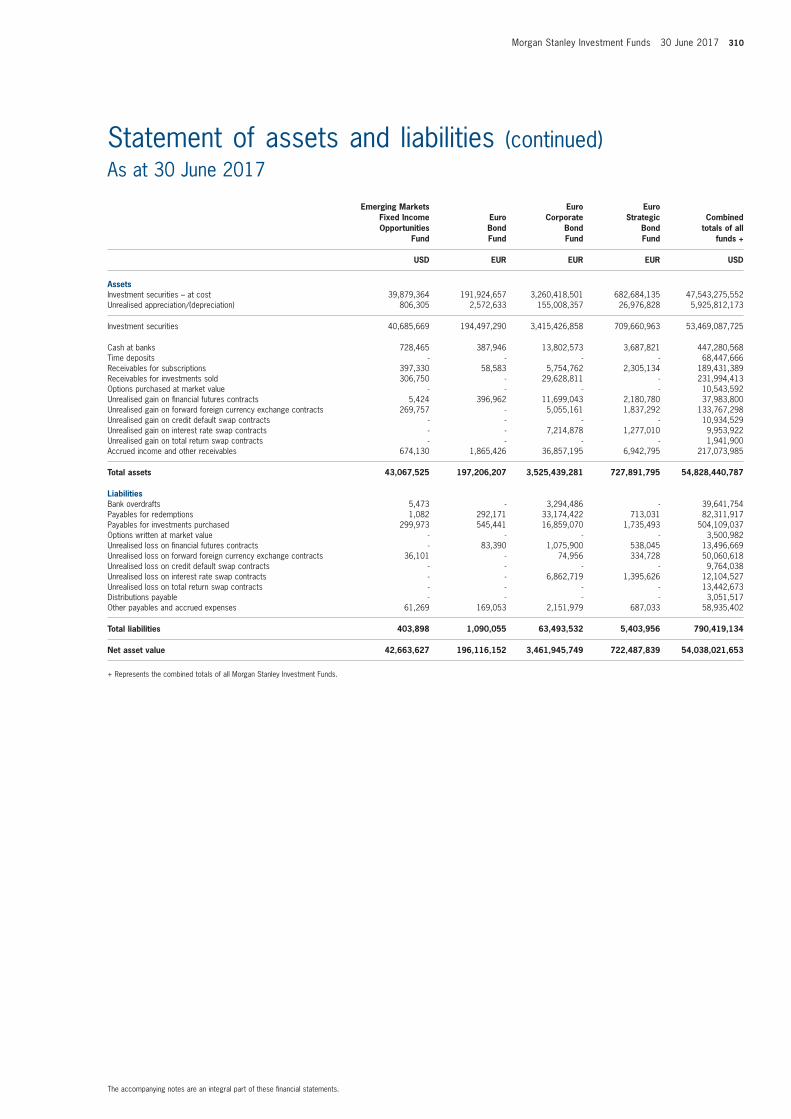
Morgan Stanley Investment Funds 30 June 2017 310
The accompanying notes are an integral part of these fi nancial statements.
Statement of assets and liabilities (continued)As at 30 June 2017
Emerging Markets Fixed Income Opportunities
Fund
Euro Bond Fund
Euro Corporate
Bond Fund
Euro Strategic
Bond Fund
Combined totals of all
funds +
USD EUR EUR EUR USD
AssetsInvestment securities – at cost 39,879,364 191,924,657 3,260,418,501 682,684,135 47,543,275,552 Unrealised appreciation/(depreciation) 806,305 2,572,633 155,008,357 26,976,828 5,925,812,173
Investment securities 40,685,669 194,497,290 3,415,426,858 709,660,963 53,469,087,725
Cash at banks 728,465 387,946 13,802,573 3,687,821 447,280,568 Time deposits - - - - 68,447,666 Receivables for subscriptions 397,330 58,583 5,754,762 2,305,134 189,431,389 Receivables for investments sold 306,750 - 29,628,811 - 231,994,413 Options purchased at market value - - - - 10,543,592 Unrealised gain on fi nancial futures contracts 5,424 396,962 11,699,043 2,180,780 37,983,800 Unrealised gain on forward foreign currency exchange contracts 269,757 - 5,055,161 1,837,292 133,767,298 Unrealised gain on credit default swap contracts - - - - 10,934,529 Unrealised gain on interest rate swap contracts - - 7,214,878 1,277,010 9,953,922 Unrealised gain on total return swap contracts - - - - 1,941,900 Accrued income and other receivables 674,130 1,865,426 36,857,195 6,942,795 217,073,985
Total assets 43,067,525 197,206,207 3,525,439,281 727,891,795 54,828,440,787
LiabilitiesBank overdrafts 5,473 - 3,294,486 - 39,641,754 Payables for redemptions 1,082 292,171 33,174,422 713,031 82,311,917 Payables for investments purchased 299,973 545,441 16,859,070 1,735,493 504,109,037Options written at market value - - - - 3,500,982 Unrealised loss on fi nancial futures contracts - 83,390 1,075,900 538,045 13,496,669 Unrealised loss on forward foreign currency exchange contracts 36,101 - 74,956 334,728 50,060,618 Unrealised loss on credit default swap contracts - - - - 9,764,038 Unrealised loss on interest rate swap contracts - - 6,862,719 1,395,626 12,104,527 Unrealised loss on total return swap contracts - - - - 13,442,673 Distributions payable - - - - 3,051,517 Other payables and accrued expenses 61,269 169,053 2,151,979 687,033 58,935,402
Total liabilities 403,898 1,090,055 63,493,532 5,403,956 790,419,134
Net asset value 42,663,627 196,116,152 3,461,945,749 722,487,839 54,038,021,653
+ Represents the combined totals of all Morgan Stanley Investment Funds.
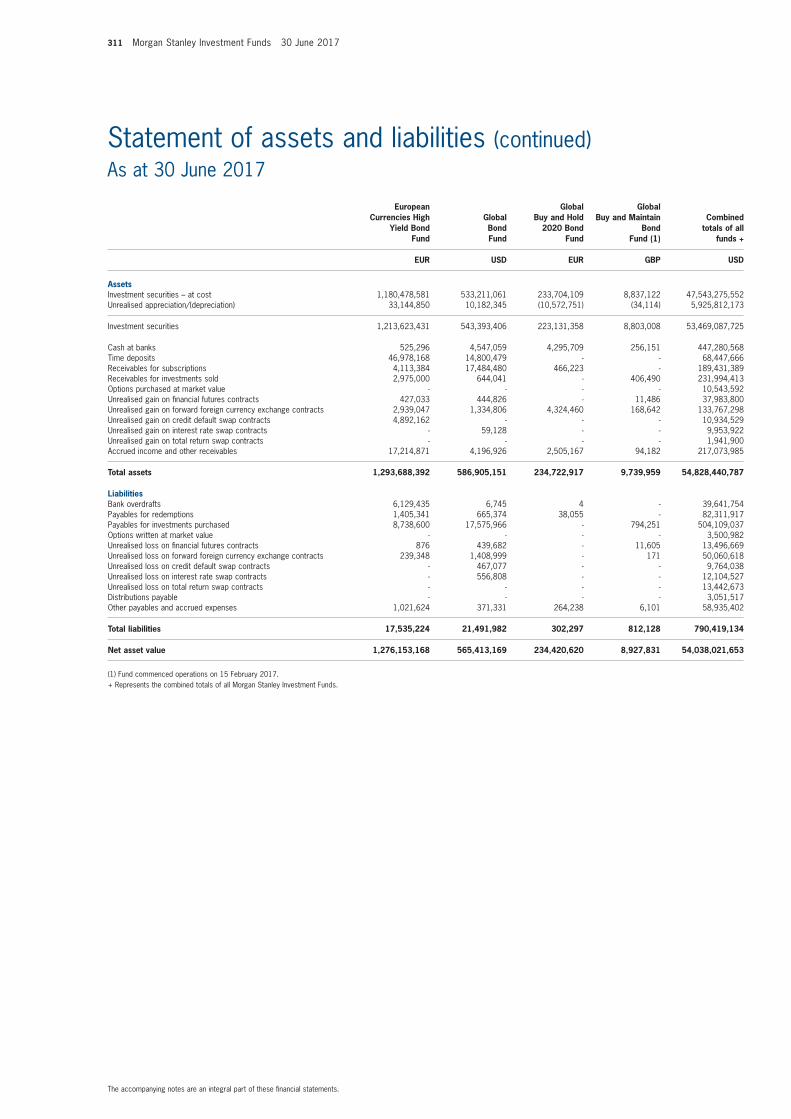
311 Morgan Stanley Investment Funds 30 June 2017
The accompanying notes are an integral part of these fi nancial statements.
Statement of assets and liabilities (continued)As at 30 June 2017
European Currencies High
Yield Bond Fund
Global Bond Fund
Global Buy and Hold
2020 Bond Fund
GlobalBuy and Maintain
BondFund (1)
Combined totals of all
funds +
EUR USD EUR GBP USD
AssetsInvestment securities – at cost 1,180,478,581 533,211,061 233,704,109 8,837,122 47,543,275,552 Unrealised appreciation/(depreciation) 33,144,850 10,182,345 (10,572,751) (34,114) 5,925,812,173
Investment securities 1,213,623,431 543,393,406 223,131,358 8,803,008 53,469,087,725
Cash at banks 525,296 4,547,059 4,295,709 256,151 447,280,568 Time deposits 46,978,168 14,800,479 - - 68,447,666 Receivables for subscriptions 4,113,384 17,484,480 466,223 - 189,431,389 Receivables for investments sold 2,975,000 644,041 - 406,490 231,994,413 Options purchased at market value - - - - 10,543,592 Unrealised gain on fi nancial futures contracts 427,033 444,826 - 11,486 37,983,800 Unrealised gain on forward foreign currency exchange contracts 2,939,047 1,334,806 4,324,460 168,642 133,767,298 Unrealised gain on credit default swap contracts 4,892,162 - - - 10,934,529 Unrealised gain on interest rate swap contracts - 59,128 - - 9,953,922 Unrealised gain on total return swap contracts - - - - 1,941,900 Accrued income and other receivables 17,214,871 4,196,926 2,505,167 94,182 217,073,985
Total assets 1,293,688,392 586,905,151 234,722,917 9,739,959 54,828,440,787
LiabilitiesBank overdrafts 6,129,435 6,745 4 - 39,641,754 Payables for redemptions 1,405,341 665,374 38,055 - 82,311,917 Payables for investments purchased 8,738,600 17,575,966 - 794,251 504,109,037Options written at market value - - - - 3,500,982 Unrealised loss on fi nancial futures contracts 876 439,682 - 11,605 13,496,669 Unrealised loss on forward foreign currency exchange contracts 239,348 1,408,999 - 171 50,060,618 Unrealised loss on credit default swap contracts - 467,077 - - 9,764,038 Unrealised loss on interest rate swap contracts - 556,808 - - 12,104,527 Unrealised loss on total return swap contracts - - - - 13,442,673 Distributions payable - - - - 3,051,517 Other payables and accrued expenses 1,021,624 371,331 264,238 6,101 58,935,402
Total liabilities 17,535,224 21,491,982 302,297 812,128 790,419,134
Net asset value 1,276,153,168 565,413,169 234,420,620 8,927,831 54,038,021,653
(1) Fund commenced operations on 15 February 2017.+ Represents the combined totals of all Morgan Stanley Investment Funds.
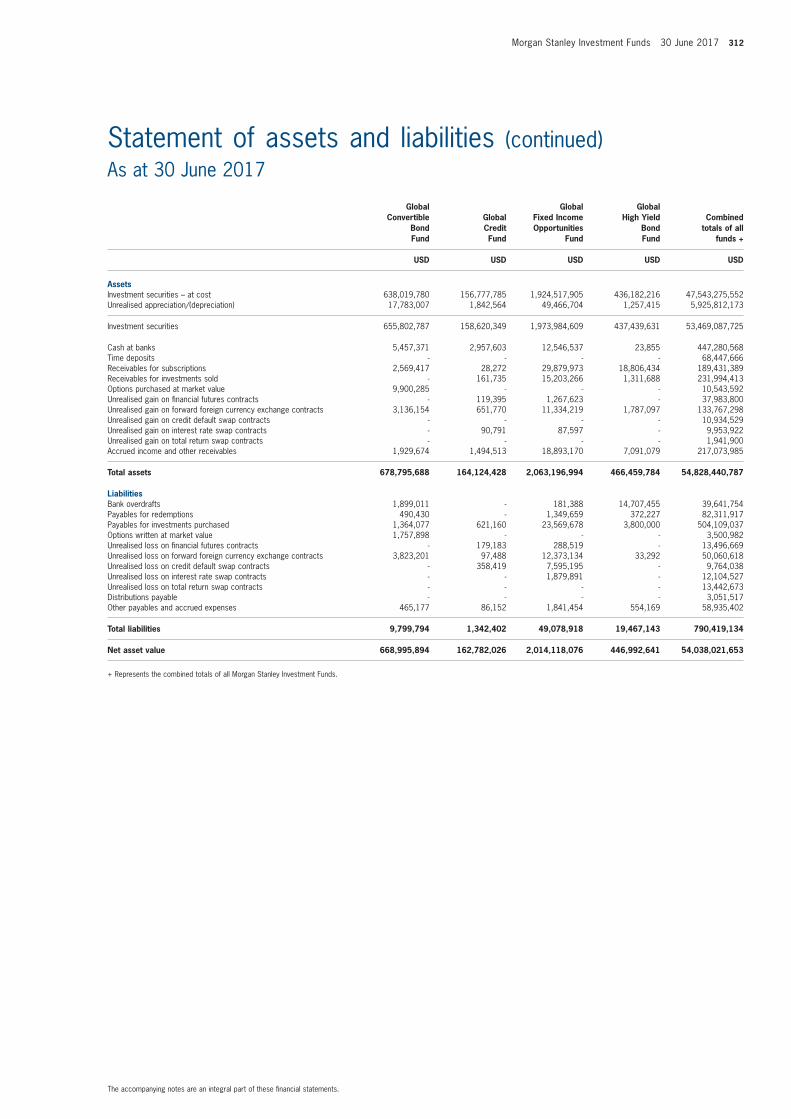
Morgan Stanley Investment Funds 30 June 2017 312
The accompanying notes are an integral part of these fi nancial statements.
Statement of assets and liabilities (continued)As at 30 June 2017
Global Convertible
Bond Fund
Global Credit Fund
Global Fixed Income Opportunities
Fund
Global High Yield
Bond Fund
Combined totals of all
funds +
USD USD USD USD USD
AssetsInvestment securities – at cost 638,019,780 156,777,785 1,924,517,905 436,182,216 47,543,275,552 Unrealised appreciation/(depreciation) 17,783,007 1,842,564 49,466,704 1,257,415 5,925,812,173
Investment securities 655,802,787 158,620,349 1,973,984,609 437,439,631 53,469,087,725
Cash at banks 5,457,371 2,957,603 12,546,537 23,855 447,280,568 Time deposits - - - - 68,447,666 Receivables for subscriptions 2,569,417 28,272 29,879,973 18,806,434 189,431,389 Receivables for investments sold - 161,735 15,203,266 1,311,688 231,994,413 Options purchased at market value 9,900,285 - - - 10,543,592 Unrealised gain on fi nancial futures contracts - 119,395 1,267,623 - 37,983,800 Unrealised gain on forward foreign currency exchange contracts 3,136,154 651,770 11,334,219 1,787,097 133,767,298 Unrealised gain on credit default swap contracts - - - - 10,934,529 Unrealised gain on interest rate swap contracts - 90,791 87,597 - 9,953,922 Unrealised gain on total return swap contracts - - - - 1,941,900 Accrued income and other receivables 1,929,674 1,494,513 18,893,170 7,091,079 217,073,985
Total assets 678,795,688 164,124,428 2,063,196,994 466,459,784 54,828,440,787
LiabilitiesBank overdrafts 1,899,011 - 181,388 14,707,455 39,641,754 Payables for redemptions 490,430 - 1,349,659 372,227 82,311,917 Payables for investments purchased 1,364,077 621,160 23,569,678 3,800,000 504,109,037Options written at market value 1,757,898 - - - 3,500,982 Unrealised loss on fi nancial futures contracts - 179,183 288,519 - 13,496,669 Unrealised loss on forward foreign currency exchange contracts 3,823,201 97,488 12,373,134 33,292 50,060,618 Unrealised loss on credit default swap contracts - 358,419 7,595,195 - 9,764,038 Unrealised loss on interest rate swap contracts - - 1,879,891 - 12,104,527 Unrealised loss on total return swap contracts - - - - 13,442,673 Distributions payable - - - - 3,051,517 Other payables and accrued expenses 465,177 86,152 1,841,454 554,169 58,935,402
Total liabilities 9,799,794 1,342,402 49,078,918 19,467,143 790,419,134
Net asset value 668,995,894 162,782,026 2,014,118,076 446,992,641 54,038,021,653
+ Represents the combined totals of all Morgan Stanley Investment Funds.

313 Morgan Stanley Investment Funds 30 June 2017
The accompanying notes are an integral part of these fi nancial statements.
Statement of assets and liabilities (continued)As at 30 June 2017
Global Mortgage Securities
Fund
Global Premier
Credit Fund
Short Maturity
Euro Bond Fund
US Dollar Corporate
Bond Fund
Combined totals of all
funds +
USD USD EUR USD USD
AssetsInvestment securities – at cost 633,361,391 13,946,067 1,521,562,806 12,032,819 47,543,275,552 Unrealised appreciation/(depreciation) 6,948,691 (267,846) (5,554,444) 95,995 5,925,812,173
Investment securities 640,310,082 13,678,221 1,516,008,362 12,128,814 53,469,087,725
Cash at banks 997,919 315,918 2,650,096 358,896 447,280,568 Time deposits - - - - 68,447,666 Receivables for subscriptions 16,210,350 - 3,283,882 - 189,431,389 Receivables for investments sold 2,917,042 - 14,449,980 17,329 231,994,413 Options purchased at market value - - - - 10,543,592 Unrealised gain on fi nancial futures contracts 927,477 7,323 5,197,796 18,879 37,983,800 Unrealised gain on forward foreign currency exchange contracts 4,688,645 42,570 53 - 133,767,298 Unrealised gain on credit default swap contracts - - - - 10,934,529 Unrealised gain on interest rate swap contracts - 11,692 - - 9,953,922 Unrealised gain on total return swap contracts - - - - 1,941,900 Accrued income and other receivables 1,690,691 123,691 11,766,361 108,443 217,073,985
Total assets 667,742,206 14,179,415 1,553,356,530 12,632,361 54,828,440,787
LiabilitiesBank overdrafts 289 - - - 39,641,754 Payables for redemptions 2,335,203 35,854 18,591,193 - 82,311,917 Payables for investments purchased 90,571,588 113,249 - 26,632 504,109,037Options written at market value - - - - 3,500,982 Unrealised loss on fi nancial futures contracts 10,731 26,763 482,050 6,179 13,496,669 Unrealised loss on forward foreign currency exchange contracts 1,588,321 2,308 14,201 - 50,060,618 Unrealised loss on credit default swap contracts - - - - 9,764,038 Unrealised loss on interest rate swap contracts 178,306 - - 7,337 12,104,527 Unrealised loss on total return swap contracts - - - - 13,442,673 Distributions payable - - - - 3,051,517 Other payables and accrued expenses 383,465 11,436 913,547 5,305 58,935,402
Total liabilities 95,067,903 189,610 20,000,991 45,453 790,419,134
Net asset value 572,674,303 13,989,805 1,533,355,539 12,586,908 54,038,021,653
+ Represents the combined totals of all Morgan Stanley Investment Funds.
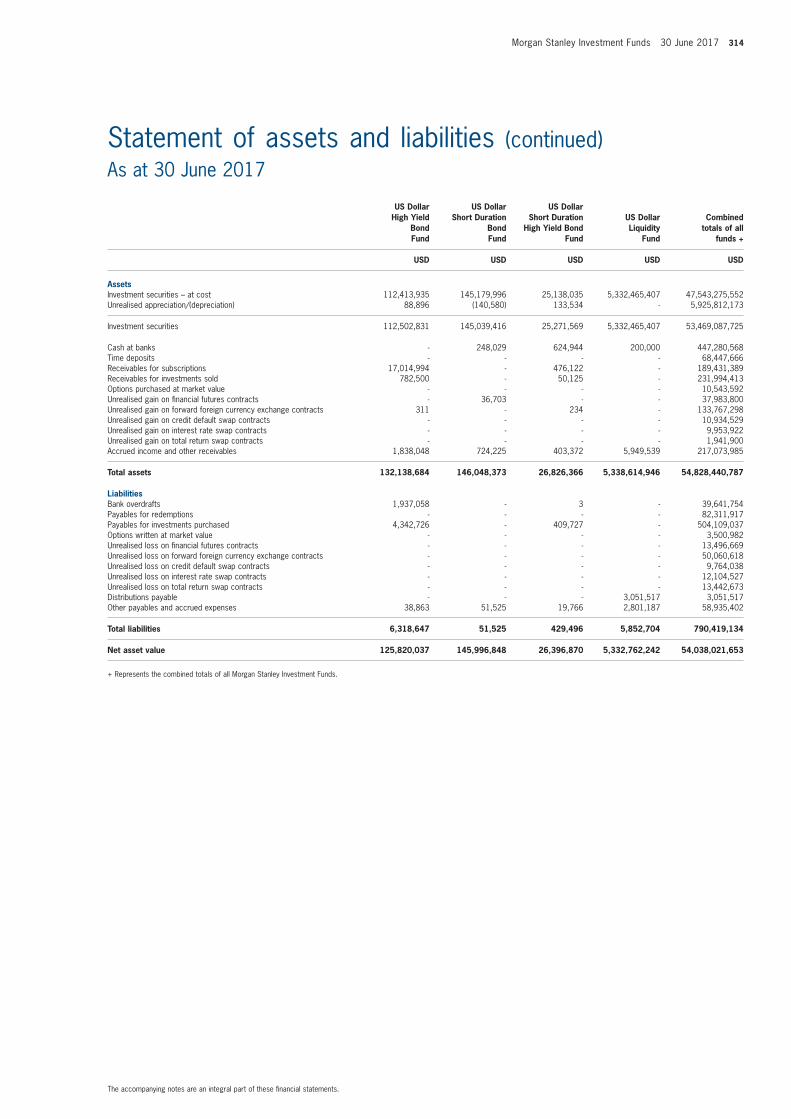
Morgan Stanley Investment Funds 30 June 2017 314
The accompanying notes are an integral part of these fi nancial statements.
Statement of assets and liabilities (continued)As at 30 June 2017
US Dollar High Yield
Bond Fund
US Dollar Short Duration
Bond Fund
US Dollar Short Duration
High Yield Bond Fund
US Dollar Liquidity
Fund
Combined totals of all
funds +
USD USD USD USD USD
AssetsInvestment securities – at cost 112,413,935 145,179,996 25,138,035 5,332,465,407 47,543,275,552 Unrealised appreciation/(depreciation) 88,896 (140,580) 133,534 - 5,925,812,173
Investment securities 112,502,831 145,039,416 25,271,569 5,332,465,407 53,469,087,725
Cash at banks - 248,029 624,944 200,000 447,280,568 Time deposits - - - - 68,447,666 Receivables for subscriptions 17,014,994 - 476,122 - 189,431,389 Receivables for investments sold 782,500 - 50,125 - 231,994,413 Options purchased at market value - - - - 10,543,592 Unrealised gain on fi nancial futures contracts - 36,703 - - 37,983,800 Unrealised gain on forward foreign currency exchange contracts 311 - 234 - 133,767,298 Unrealised gain on credit default swap contracts - - - - 10,934,529 Unrealised gain on interest rate swap contracts - - - - 9,953,922 Unrealised gain on total return swap contracts - - - - 1,941,900 Accrued income and other receivables 1,838,048 724,225 403,372 5,949,539 217,073,985
Total assets 132,138,684 146,048,373 26,826,366 5,338,614,946 54,828,440,787
LiabilitiesBank overdrafts 1,937,058 - 3 - 39,641,754 Payables for redemptions - - - - 82,311,917 Payables for investments purchased 4,342,726 - 409,727 - 504,109,037Options written at market value - - - - 3,500,982 Unrealised loss on fi nancial futures contracts - - - - 13,496,669 Unrealised loss on forward foreign currency exchange contracts - - - - 50,060,618 Unrealised loss on credit default swap contracts - - - - 9,764,038 Unrealised loss on interest rate swap contracts - - - - 12,104,527 Unrealised loss on total return swap contracts - - - - 13,442,673 Distributions payable - - - 3,051,517 3,051,517 Other payables and accrued expenses 38,863 51,525 19,766 2,801,187 58,935,402
Total liabilities 6,318,647 51,525 429,496 5,852,704 790,419,134
Net asset value 125,820,037 145,996,848 26,396,870 5,332,762,242 54,038,021,653
+ Represents the combined totals of all Morgan Stanley Investment Funds.
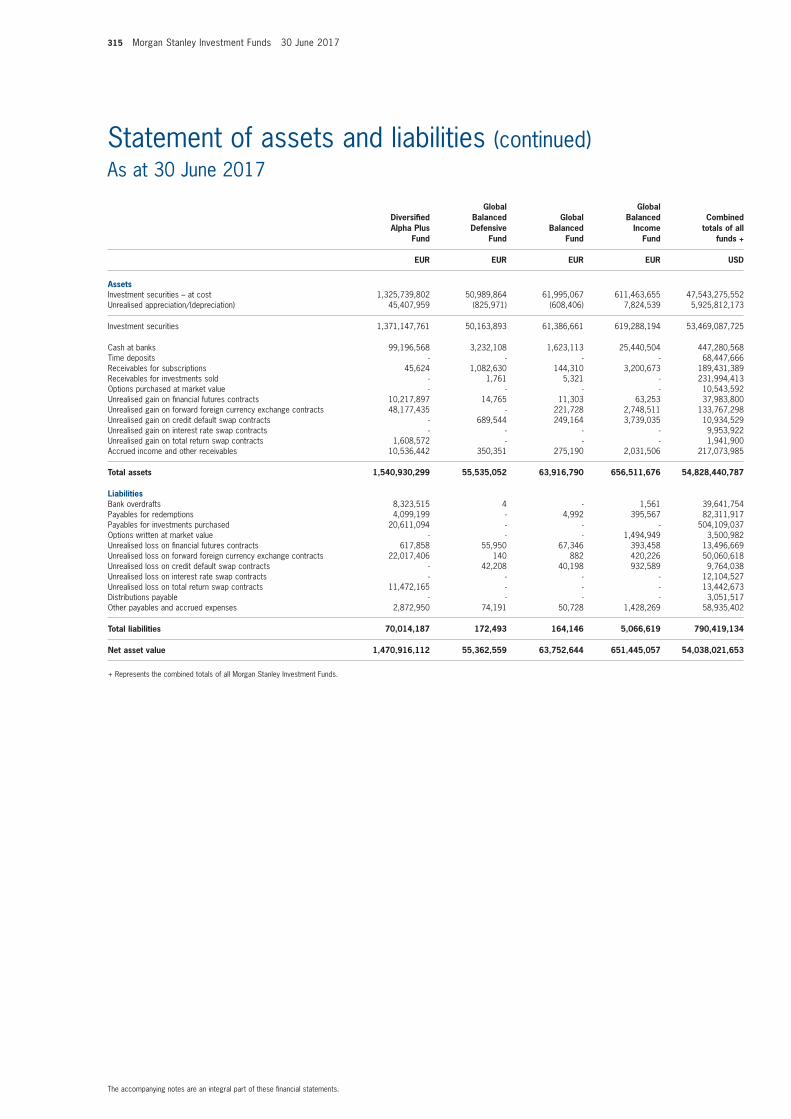
315 Morgan Stanley Investment Funds 30 June 2017
The accompanying notes are an integral part of these fi nancial statements.
Statement of assets and liabilities (continued)As at 30 June 2017
Diversifi ed Alpha Plus
Fund
Global Balanced Defensive
Fund
Global Balanced
Fund
Global Balanced
Income Fund
Combined totals of all
funds +
EUR EUR EUR EUR USD
AssetsInvestment securities – at cost 1,325,739,802 50,989,864 61,995,067 611,463,655 47,543,275,552 Unrealised appreciation/(depreciation) 45,407,959 (825,971) (608,406) 7,824,539 5,925,812,173
Investment securities 1,371,147,761 50,163,893 61,386,661 619,288,194 53,469,087,725
Cash at banks 99,196,568 3,232,108 1,623,113 25,440,504 447,280,568 Time deposits - - - - 68,447,666 Receivables for subscriptions 45,624 1,082,630 144,310 3,200,673 189,431,389 Receivables for investments sold - 1,761 5,321 - 231,994,413 Options purchased at market value - - - - 10,543,592 Unrealised gain on fi nancial futures contracts 10,217,897 14,765 11,303 63,253 37,983,800 Unrealised gain on forward foreign currency exchange contracts 48,177,435 - 221,728 2,748,511 133,767,298 Unrealised gain on credit default swap contracts - 689,544 249,164 3,739,035 10,934,529 Unrealised gain on interest rate swap contracts - - - - 9,953,922 Unrealised gain on total return swap contracts 1,608,572 - - - 1,941,900 Accrued income and other receivables 10,536,442 350,351 275,190 2,031,506 217,073,985
Total assets 1,540,930,299 55,535,052 63,916,790 656,511,676 54,828,440,787
LiabilitiesBank overdrafts 8,323,515 4 - 1,561 39,641,754 Payables for redemptions 4,099,199 - 4,992 395,567 82,311,917 Payables for investments purchased 20,611,094 - - - 504,109,037Options written at market value - - - 1,494,949 3,500,982 Unrealised loss on fi nancial futures contracts 617,858 55,950 67,346 393,458 13,496,669 Unrealised loss on forward foreign currency exchange contracts 22,017,406 140 882 420,226 50,060,618 Unrealised loss on credit default swap contracts - 42,208 40,198 932,589 9,764,038 Unrealised loss on interest rate swap contracts - - - - 12,104,527 Unrealised loss on total return swap contracts 11,472,165 - - - 13,442,673 Distributions payable - - - - 3,051,517 Other payables and accrued expenses 2,872,950 74,191 50,728 1,428,269 58,935,402
Total liabilities 70,014,187 172,493 164,146 5,066,619 790,419,134
Net asset value 1,470,916,112 55,362,559 63,752,644 651,445,057 54,038,021,653
+ Represents the combined totals of all Morgan Stanley Investment Funds.
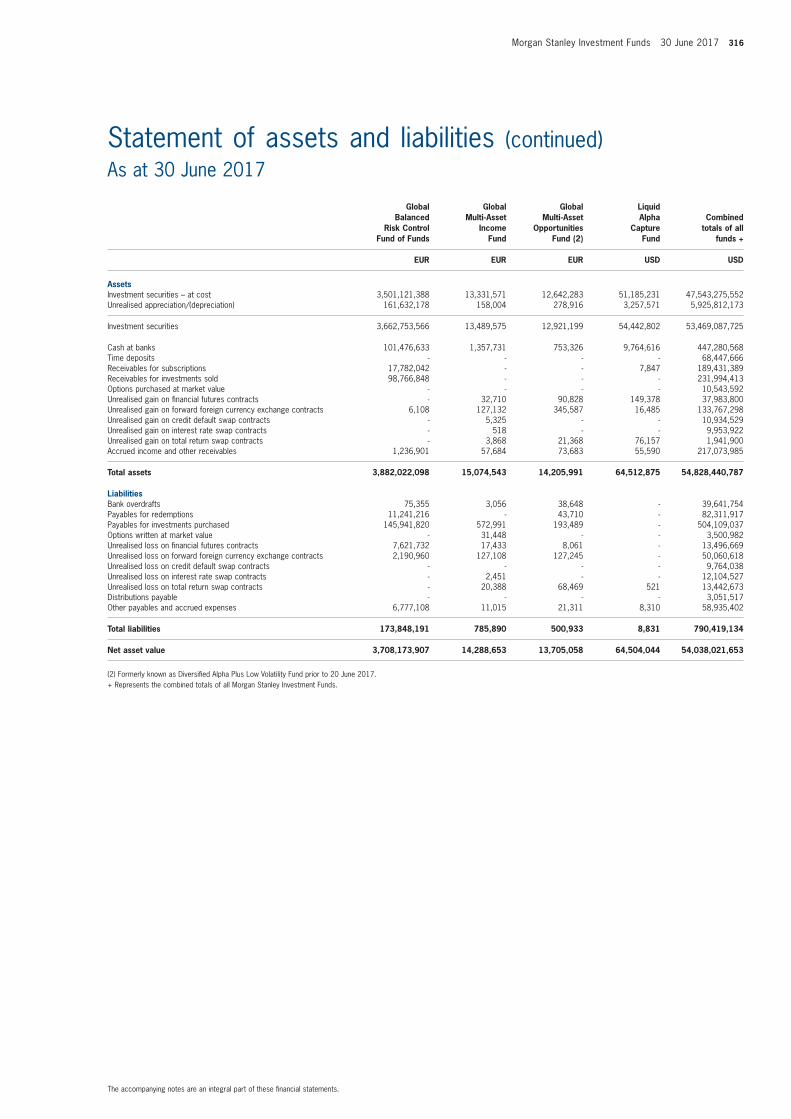
Morgan Stanley Investment Funds 30 June 2017 316
The accompanying notes are an integral part of these fi nancial statements.
Statement of assets and liabilities (continued)As at 30 June 2017
Global Balanced
Risk Control Fund of Funds
Global Multi-Asset
Income Fund
GlobalMulti-Asset
OpportunitiesFund (2)
Liquid Alpha
Capture Fund
Combined totals of all
funds +
EUR EUR EUR USD USD
AssetsInvestment securities – at cost 3,501,121,388 13,331,571 12,642,283 51,185,231 47,543,275,552 Unrealised appreciation/(depreciation) 161,632,178 158,004 278,916 3,257,571 5,925,812,173
Investment securities 3,662,753,566 13,489,575 12,921,199 54,442,802 53,469,087,725
Cash at banks 101,476,633 1,357,731 753,326 9,764,616 447,280,568 Time deposits - - - - 68,447,666 Receivables for subscriptions 17,782,042 - - 7,847 189,431,389 Receivables for investments sold 98,766,848 - - - 231,994,413 Options purchased at market value - - - - 10,543,592 Unrealised gain on fi nancial futures contracts - 32,710 90,828 149,378 37,983,800 Unrealised gain on forward foreign currency exchange contracts 6,108 127,132 345,587 16,485 133,767,298 Unrealised gain on credit default swap contracts - 5,325 - - 10,934,529 Unrealised gain on interest rate swap contracts - 518 - - 9,953,922 Unrealised gain on total return swap contracts - 3,868 21,368 76,157 1,941,900 Accrued income and other receivables 1,236,901 57,684 73,683 55,590 217,073,985
Total assets 3,882,022,098 15,074,543 14,205,991 64,512,875 54,828,440,787
LiabilitiesBank overdrafts 75,355 3,056 38,648 - 39,641,754 Payables for redemptions 11,241,216 - 43,710 - 82,311,917 Payables for investments purchased 145,941,820 572,991 193,489 - 504,109,037Options written at market value - 31,448 - - 3,500,982 Unrealised loss on fi nancial futures contracts 7,621,732 17,433 8,061 - 13,496,669 Unrealised loss on forward foreign currency exchange contracts 2,190,960 127,108 127,245 - 50,060,618 Unrealised loss on credit default swap contracts - - - - 9,764,038 Unrealised loss on interest rate swap contracts - 2,451 - - 12,104,527 Unrealised loss on total return swap contracts - 20,388 68,469 521 13,442,673 Distributions payable - - - - 3,051,517 Other payables and accrued expenses 6,777,108 11,015 21,311 8,310 58,935,402
Total liabilities 173,848,191 785,890 500,933 8,831 790,419,134
Net asset value 3,708,173,907 14,288,653 13,705,058 64,504,044 54,038,021,653
(2) Formerly known as Diversifi ed Alpha Plus Low Volatility Fund prior to 20 June 2017.+ Represents the combined totals of all Morgan Stanley Investment Funds.
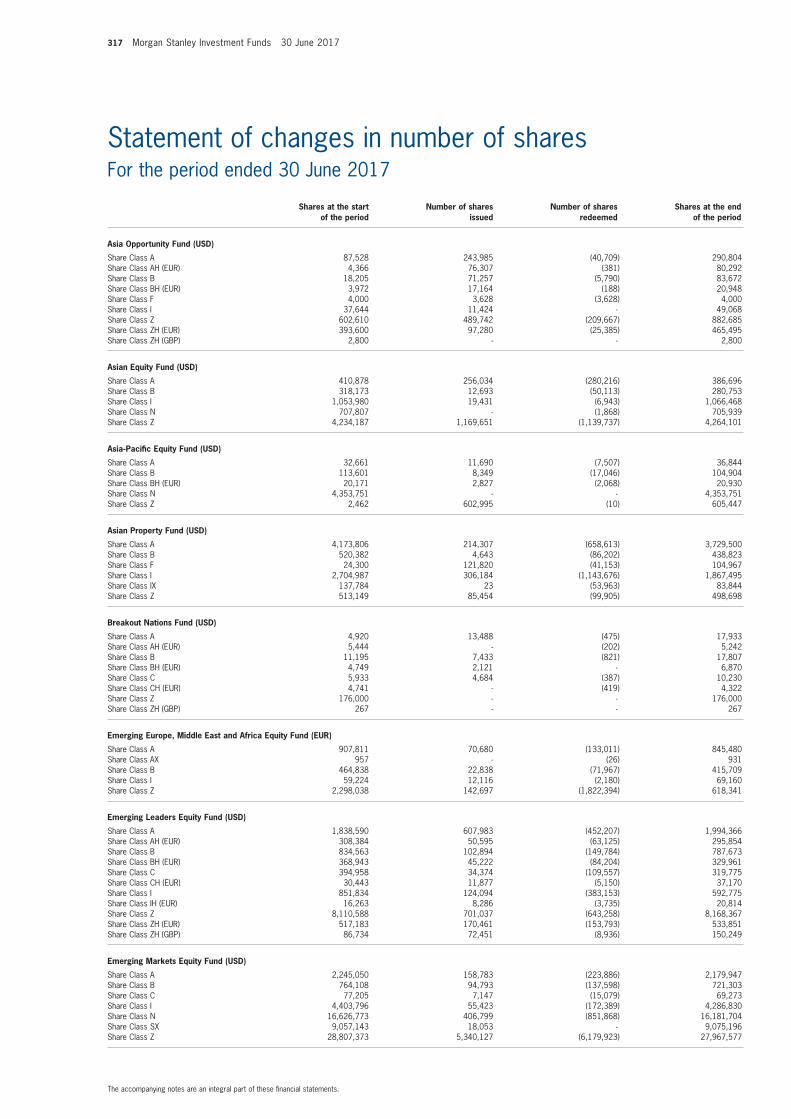
317 Morgan Stanley Investment Funds 30 June 2017
The accompanying notes are an integral part of these fi nancial statements.
Statement of changes in number of shares (continued)For the period ended 30 June 2017Statement of changes in number of shares For the period ended 30 June 2017
Shares at the start of the period
Number of shares issued
Number of shares redeemed
Shares at the end of the period
Asia Opportunity Fund (USD)
Share Class A 87,528 243,985 (40,709) 290,804Share Class AH (EUR) 4,366 76,307 (381) 80,292Share Class B 18,205 71,257 (5,790) 83,672Share Class BH (EUR) 3,972 17,164 (188) 20,948Share Class F 4,000 3,628 (3,628) 4,000Share Class I 37,644 11,424 - 49,068Share Class Z 602,610 489,742 (209,667) 882,685Share Class ZH (EUR) 393,600 97,280 (25,385) 465,495Share Class ZH (GBP) 2,800 - - 2,800
Asian Equity Fund (USD)
Share Class A 410,878 256,034 (280,216) 386,696Share Class B 318,173 12,693 (50,113) 280,753Share Class I 1,053,980 19,431 (6,943) 1,066,468Share Class N 707,807 - (1,868) 705,939Share Class Z 4,234,187 1,169,651 (1,139,737) 4,264,101
Asia-Pacifi c Equity Fund (USD)
Share Class A 32,661 11,690 (7,507) 36,844Share Class B 113,601 8,349 (17,046) 104,904Share Class BH (EUR) 20,171 2,827 (2,068) 20,930Share Class N 4,353,751 - - 4,353,751Share Class Z 2,462 602,995 (10) 605,447
Asian Property Fund (USD)
Share Class A 4,173,806 214,307 (658,613) 3,729,500Share Class B 520,382 4,643 (86,202) 438,823Share Class F 24,300 121,820 (41,153) 104,967Share Class I 2,704,987 306,184 (1,143,676) 1,867,495Share Class IX 137,784 23 (53,963) 83,844Share Class Z 513,149 85,454 (99,905) 498,698
Breakout Nations Fund (USD)
Share Class A 4,920 13,488 (475) 17,933Share Class AH (EUR) 5,444 - (202) 5,242Share Class B 11,195 7,433 (821) 17,807Share Class BH (EUR) 4,749 2,121 - 6,870Share Class C 5,933 4,684 (387) 10,230Share Class CH (EUR) 4,741 - (419) 4,322Share Class Z 176,000 - - 176,000Share Class ZH (GBP) 267 - - 267
Emerging Europe, Middle East and Africa Equity Fund (EUR)
Share Class A 907,811 70,680 (133,011) 845,480Share Class AX 957 - (26) 931Share Class B 464,838 22,838 (71,967) 415,709Share Class I 59,224 12,116 (2,180) 69,160Share Class Z 2,298,038 142,697 (1,822,394) 618,341
Emerging Leaders Equity Fund (USD)
Share Class A 1,838,590 607,983 (452,207) 1,994,366Share Class AH (EUR) 308,384 50,595 (63,125) 295,854Share Class B 834,563 102,894 (149,784) 787,673Share Class BH (EUR) 368,943 45,222 (84,204) 329,961Share Class C 394,958 34,374 (109,557) 319,775Share Class CH (EUR) 30,443 11,877 (5,150) 37,170Share Class I 851,834 124,094 (383,153) 592,775Share Class IH (EUR) 16,263 8,286 (3,735) 20,814Share Class Z 8,110,588 701,037 (643,258) 8,168,367Share Class ZH (EUR) 517,183 170,461 (153,793) 533,851Share Class ZH (GBP) 86,734 72,451 (8,936) 150,249
Emerging Markets Equity Fund (USD)
Share Class A 2,245,050 158,783 (223,886) 2,179,947Share Class B 764,108 94,793 (137,598) 721,303Share Class C 77,205 7,147 (15,079) 69,273Share Class I 4,403,796 55,423 (172,389) 4,286,830Share Class N 16,626,773 406,799 (851,868) 16,181,704Share Class SX 9,057,143 18,053 - 9,075,196Share Class Z 28,807,373 5,340,127 (6,179,923) 27,967,577
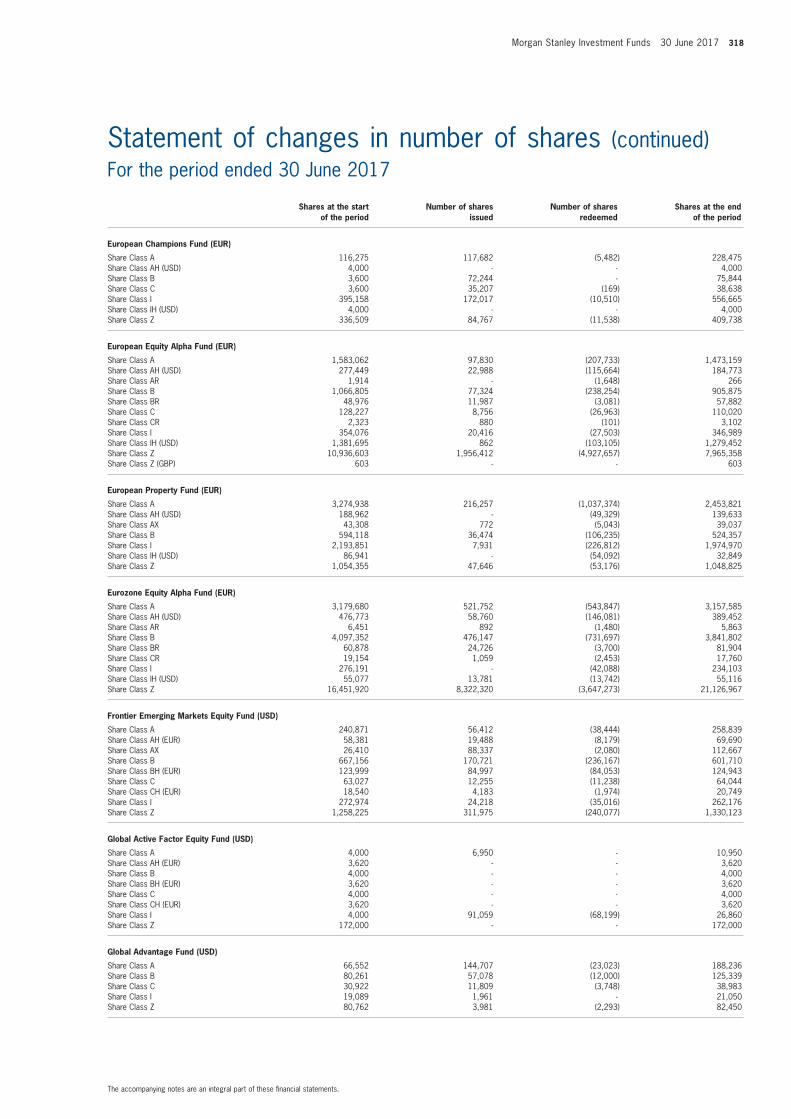
Morgan Stanley Investment Funds 30 June 2017 318
The accompanying notes are an integral part of these fi nancial statements.
Statement of changes in number of shares (continued)For the period ended 30 June 2017
Shares at the start of the period
Number of shares issued
Number of shares redeemed
Shares at the end of the period
European Champions Fund (EUR)
Share Class A 116,275 117,682 (5,482) 228,475Share Class AH (USD) 4,000 - - 4,000Share Class B 3,600 72,244 - 75,844Share Class C 3,600 35,207 (169) 38,638Share Class I 395,158 172,017 (10,510) 556,665Share Class IH (USD) 4,000 - - 4,000Share Class Z 336,509 84,767 (11,538) 409,738
European Equity Alpha Fund (EUR)
Share Class A 1,583,062 97,830 (207,733) 1,473,159Share Class AH (USD) 277,449 22,988 (115,664) 184,773Share Class AR 1,914 - (1,648) 266Share Class B 1,066,805 77,324 (238,254) 905,875Share Class BR 48,976 11,987 (3,081) 57,882Share Class C 128,227 8,756 (26,963) 110,020Share Class CR 2,323 880 (101) 3,102Share Class I 354,076 20,416 (27,503) 346,989Share Class IH (USD) 1,381,695 862 (103,105) 1,279,452Share Class Z 10,936,603 1,956,412 (4,927,657) 7,965,358Share Class Z (GBP) 603 - - 603
European Property Fund (EUR)
Share Class A 3,274,938 216,257 (1,037,374) 2,453,821Share Class AH (USD) 188,962 - (49,329) 139,633Share Class AX 43,308 772 (5,043) 39,037Share Class B 594,118 36,474 (106,235) 524,357Share Class I 2,193,851 7,931 (226,812) 1,974,970Share Class IH (USD) 86,941 - (54,092) 32,849Share Class Z 1,054,355 47,646 (53,176) 1,048,825
Eurozone Equity Alpha Fund (EUR)
Share Class A 3,179,680 521,752 (543,847) 3,157,585Share Class AH (USD) 476,773 58,760 (146,081) 389,452Share Class AR 6,451 892 (1,480) 5,863Share Class B 4,097,352 476,147 (731,697) 3,841,802Share Class BR 60,878 24,726 (3,700) 81,904Share Class CR 19,154 1,059 (2,453) 17,760Share Class I 276,191 - (42,088) 234,103Share Class IH (USD) 55,077 13,781 (13,742) 55,116Share Class Z 16,451,920 8,322,320 (3,647,273) 21,126,967
Frontier Emerging Markets Equity Fund (USD)
Share Class A 240,871 56,412 (38,444) 258,839Share Class AH (EUR) 58,381 19,488 (8,179) 69,690Share Class AX 26,410 88,337 (2,080) 112,667Share Class B 667,156 170,721 (236,167) 601,710Share Class BH (EUR) 123,999 84,997 (84,053) 124,943Share Class C 63,027 12,255 (11,238) 64,044Share Class CH (EUR) 18,540 4,183 (1,974) 20,749Share Class I 272,974 24,218 (35,016) 262,176Share Class Z 1,258,225 311,975 (240,077) 1,330,123
Global Active Factor Equity Fund (USD)
Share Class A 4,000 6,950 - 10,950Share Class AH (EUR) 3,620 - - 3,620Share Class B 4,000 - - 4,000Share Class BH (EUR) 3,620 - - 3,620Share Class C 4,000 - - 4,000Share Class CH (EUR) 3,620 - - 3,620Share Class I 4,000 91,059 (68,199) 26,860Share Class Z 172,000 - - 172,000
Global Advantage Fund (USD)
Share Class A 66,552 144,707 (23,023) 188,236Share Class B 80,261 57,078 (12,000) 125,339Share Class C 30,922 11,809 (3,748) 38,983Share Class I 19,089 1,961 - 21,050Share Class Z 80,762 3,981 (2,293) 82,450
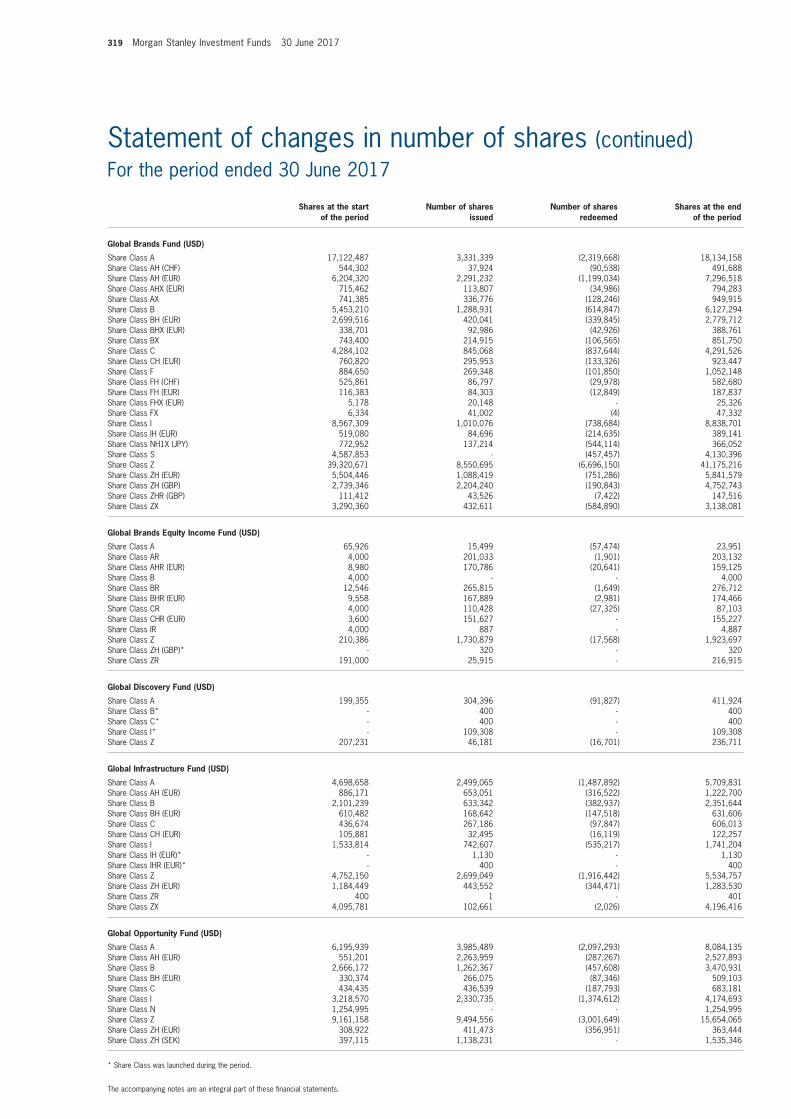
319 Morgan Stanley Investment Funds 30 June 2017
The accompanying notes are an integral part of these fi nancial statements.
Statement of changes in number of shares (continued)For the period ended 30 June 2017
Shares at the start of the period
Number of shares issued
Number of shares redeemed
Shares at the end of the period
Global Brands Fund (USD)
Share Class A 17,122,487 3,331,339 (2,319,668) 18,134,158Share Class AH (CHF) 544,302 37,924 (90,538) 491,688Share Class AH (EUR) 6,204,320 2,291,232 (1,199,034) 7,296,518Share Class AHX (EUR) 715,462 113,807 (34,986) 794,283Share Class AX 741,385 336,776 (128,246) 949,915Share Class B 5,453,210 1,288,931 (614,847) 6,127,294Share Class BH (EUR) 2,699,516 420,041 (339,845) 2,779,712Share Class BHX (EUR) 338,701 92,986 (42,926) 388,761Share Class BX 743,400 214,915 (106,565) 851,750Share Class C 4,284,102 845,068 (837,644) 4,291,526Share Class CH (EUR) 760,820 295,953 (133,326) 923,447Share Class F 884,650 269,348 (101,850) 1,052,148Share Class FH (CHF) 525,861 86,797 (29,978) 582,680Share Class FH (EUR) 116,383 84,303 (12,849) 187,837Share Class FHX (EUR) 5,178 20,148 - 25,326Share Class FX 6,334 41,002 (4) 47,332Share Class I 8,567,309 1,010,076 (738,684) 8,838,701Share Class IH (EUR) 519,080 84,696 (214,635) 389,141Share Class NH1X (JPY) 772,952 137,214 (544,114) 366,052Share Class S 4,587,853 - (457,457) 4,130,396Share Class Z 39,320,671 8,550,695 (6,696,150) 41,175,216Share Class ZH (EUR) 5,504,446 1,088,419 (751,286) 5,841,579Share Class ZH (GBP) 2,739,346 2,204,240 (190,843) 4,752,743Share Class ZHR (GBP) 111,412 43,526 (7,422) 147,516Share Class ZX 3,290,360 432,611 (584,890) 3,138,081
Global Brands Equity Income Fund (USD)
Share Class A 65,926 15,499 (57,474) 23,951Share Class AR 4,000 201,033 (1,901) 203,132Share Class AHR (EUR) 8,980 170,786 (20,641) 159,125Share Class B 4,000 - - 4,000Share Class BR 12,546 265,815 (1,649) 276,712Share Class BHR (EUR) 9,558 167,889 (2,981) 174,466Share Class CR 4,000 110,428 (27,325) 87,103Share Class CHR (EUR) 3,600 151,627 - 155,227Share Class IR 4,000 887 - 4,887Share Class Z 210,386 1,730,879 (17,568) 1,923,697Share Class ZH (GBP)* - 320 - 320Share Class ZR 191,000 25,915 - 216,915
Global Discovery Fund (USD)
Share Class A 199,355 304,396 (91,827) 411,924Share Class B* - 400 - 400Share Class C* - 400 - 400Share Class I* - 109,308 - 109,308Share Class Z 207,231 46,181 (16,701) 236,711
Global Infrastructure Fund (USD)
Share Class A 4,698,658 2,499,065 (1,487,892) 5,709,831Share Class AH (EUR) 886,171 653,051 (316,522) 1,222,700Share Class B 2,101,239 633,342 (382,937) 2,351,644Share Class BH (EUR) 610,482 168,642 (147,518) 631,606Share Class C 436,674 267,186 (97,847) 606,013Share Class CH (EUR) 105,881 32,495 (16,119) 122,257Share Class I 1,533,814 742,607 (535,217) 1,741,204Share Class IH (EUR)* - 1,130 - 1,130Share Class IHR (EUR)* - 400 - 400Share Class Z 4,752,150 2,699,049 (1,916,442) 5,534,757Share Class ZH (EUR) 1,184,449 443,552 (344,471) 1,283,530Share Class ZR 400 1 - 401Share Class ZX 4,095,781 102,661 (2,026) 4,196,416
Global Opportunity Fund (USD)
Share Class A 6,195,939 3,985,489 (2,097,293) 8,084,135Share Class AH (EUR) 551,201 2,263,959 (287,267) 2,527,893Share Class B 2,666,172 1,262,367 (457,608) 3,470,931Share Class BH (EUR) 330,374 266,075 (87,346) 509,103Share Class C 434,435 436,539 (187,793) 683,181Share Class I 3,218,570 2,330,735 (1,374,612) 4,174,693Share Class N 1,254,995 - - 1,254,995Share Class Z 9,161,158 9,494,556 (3,001,649) 15,654,065Share Class ZH (EUR) 308,922 411,473 (356,951) 363,444Share Class ZH (SEK) 397,115 1,138,231 - 1,535,346
* Share Class was launched during the period.
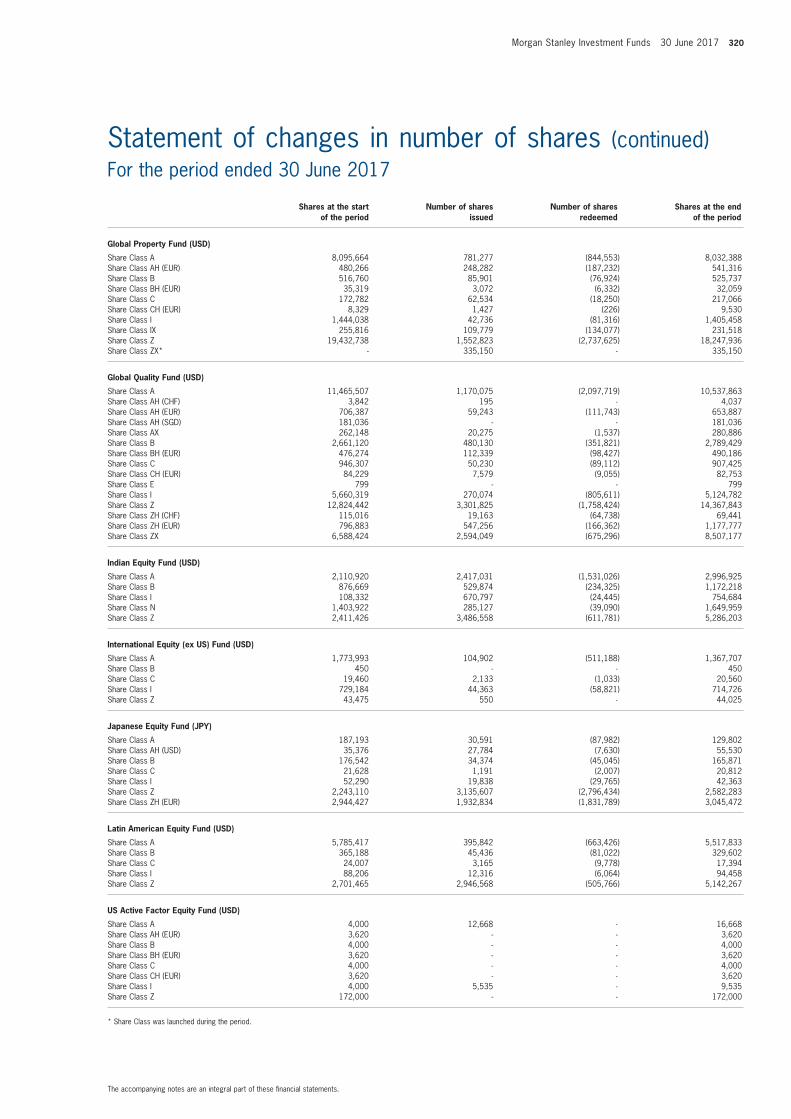
Morgan Stanley Investment Funds 30 June 2017 320
The accompanying notes are an integral part of these fi nancial statements.
Statement of changes in number of shares (continued)For the period ended 30 June 2017
Shares at the start of the period
Number of shares issued
Number of shares redeemed
Shares at the end of the period
Global Property Fund (USD)
Share Class A 8,095,664 781,277 (844,553) 8,032,388Share Class AH (EUR) 480,266 248,282 (187,232) 541,316Share Class B 516,760 85,901 (76,924) 525,737Share Class BH (EUR) 35,319 3,072 (6,332) 32,059Share Class C 172,782 62,534 (18,250) 217,066Share Class CH (EUR) 8,329 1,427 (226) 9,530Share Class I 1,444,038 42,736 (81,316) 1,405,458Share Class IX 255,816 109,779 (134,077) 231,518Share Class Z 19,432,738 1,552,823 (2,737,625) 18,247,936Share Class ZX* - 335,150 - 335,150
Global Quality Fund (USD)
Share Class A 11,465,507 1,170,075 (2,097,719) 10,537,863Share Class AH (CHF) 3,842 195 - 4,037Share Class AH (EUR) 706,387 59,243 (111,743) 653,887Share Class AH (SGD) 181,036 - - 181,036Share Class AX 262,148 20,275 (1,537) 280,886Share Class B 2,661,120 480,130 (351,821) 2,789,429Share Class BH (EUR) 476,274 112,339 (98,427) 490,186Share Class C 946,307 50,230 (89,112) 907,425Share Class CH (EUR) 84,229 7,579 (9,055) 82,753Share Class E 799 - - 799Share Class I 5,660,319 270,074 (805,611) 5,124,782Share Class Z 12,824,442 3,301,825 (1,758,424) 14,367,843Share Class ZH (CHF) 115,016 19,163 (64,738) 69,441Share Class ZH (EUR) 796,883 547,256 (166,362) 1,177,777Share Class ZX 6,588,424 2,594,049 (675,296) 8,507,177
Indian Equity Fund (USD)
Share Class A 2,110,920 2,417,031 (1,531,026) 2,996,925Share Class B 876,669 529,874 (234,325) 1,172,218Share Class I 108,332 670,797 (24,445) 754,684Share Class N 1,403,922 285,127 (39,090) 1,649,959Share Class Z 2,411,426 3,486,558 (611,781) 5,286,203
International Equity (ex US) Fund (USD)
Share Class A 1,773,993 104,902 (511,188) 1,367,707Share Class B 450 - - 450Share Class C 19,460 2,133 (1,033) 20,560Share Class I 729,184 44,363 (58,821) 714,726Share Class Z 43,475 550 - 44,025
Japanese Equity Fund (JPY)
Share Class A 187,193 30,591 (87,982) 129,802Share Class AH (USD) 35,376 27,784 (7,630) 55,530Share Class B 176,542 34,374 (45,045) 165,871Share Class C 21,628 1,191 (2,007) 20,812Share Class I 52,290 19,838 (29,765) 42,363Share Class Z 2,243,110 3,135,607 (2,796,434) 2,582,283Share Class ZH (EUR) 2,944,427 1,932,834 (1,831,789) 3,045,472
Latin American Equity Fund (USD)
Share Class A 5,785,417 395,842 (663,426) 5,517,833Share Class B 365,188 45,436 (81,022) 329,602Share Class C 24,007 3,165 (9,778) 17,394Share Class I 88,206 12,316 (6,064) 94,458Share Class Z 2,701,465 2,946,568 (505,766) 5,142,267
US Active Factor Equity Fund (USD)
Share Class A 4,000 12,668 - 16,668Share Class AH (EUR) 3,620 - - 3,620Share Class B 4,000 - - 4,000Share Class BH (EUR) 3,620 - - 3,620Share Class C 4,000 - - 4,000Share Class CH (EUR) 3,620 - - 3,620Share Class I 4,000 5,535 - 9,535Share Class Z 172,000 - - 172,000
* Share Class was launched during the period.
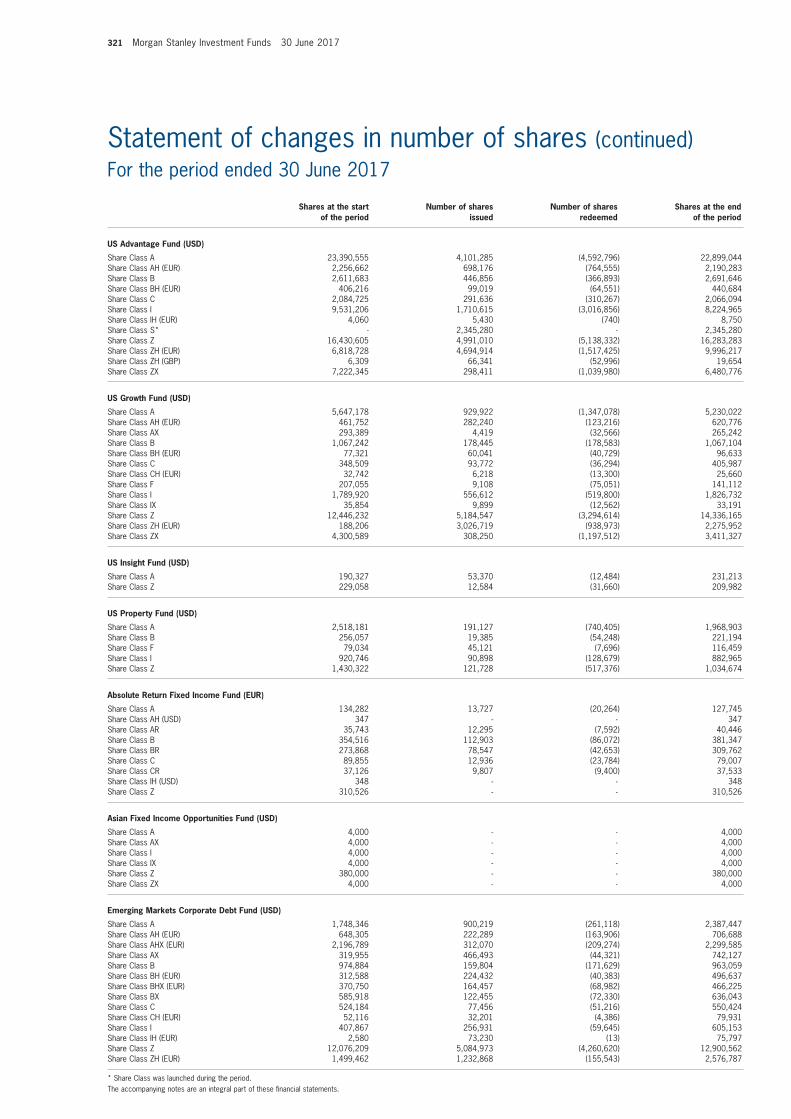
321 Morgan Stanley Investment Funds 30 June 2017
The accompanying notes are an integral part of these fi nancial statements.
Statement of changes in number of shares (continued)For the period ended 30 June 2017
Shares at the start of the period
Number of shares issued
Number of shares redeemed
Shares at the end of the period
US Advantage Fund (USD)
Share Class A 23,390,555 4,101,285 (4,592,796) 22,899,044Share Class AH (EUR) 2,256,662 698,176 (764,555) 2,190,283Share Class B 2,611,683 446,856 (366,893) 2,691,646Share Class BH (EUR) 406,216 99,019 (64,551) 440,684Share Class C 2,084,725 291,636 (310,267) 2,066,094Share Class I 9,531,206 1,710,615 (3,016,856) 8,224,965Share Class IH (EUR) 4,060 5,430 (740) 8,750Share Class S* - 2,345,280 - 2,345,280Share Class Z 16,430,605 4,991,010 (5,138,332) 16,283,283Share Class ZH (EUR) 6,818,728 4,694,914 (1,517,425) 9,996,217Share Class ZH (GBP) 6,309 66,341 (52,996) 19,654Share Class ZX 7,222,345 298,411 (1,039,980) 6,480,776
US Growth Fund (USD)
Share Class A 5,647,178 929,922 (1,347,078) 5,230,022Share Class AH (EUR) 461,752 282,240 (123,216) 620,776Share Class AX 293,389 4,419 (32,566) 265,242Share Class B 1,067,242 178,445 (178,583) 1,067,104Share Class BH (EUR) 77,321 60,041 (40,729) 96,633Share Class C 348,509 93,772 (36,294) 405,987Share Class CH (EUR) 32,742 6,218 (13,300) 25,660Share Class F 207,055 9,108 (75,051) 141,112Share Class I 1,789,920 556,612 (519,800) 1,826,732Share Class IX 35,854 9,899 (12,562) 33,191Share Class Z 12,446,232 5,184,547 (3,294,614) 14,336,165Share Class ZH (EUR) 188,206 3,026,719 (938,973) 2,275,952Share Class ZX 4,300,589 308,250 (1,197,512) 3,411,327
US Insight Fund (USD)
Share Class A 190,327 53,370 (12,484) 231,213Share Class Z 229,058 12,584 (31,660) 209,982
US Property Fund (USD)
Share Class A 2,518,181 191,127 (740,405) 1,968,903Share Class B 256,057 19,385 (54,248) 221,194Share Class F 79,034 45,121 (7,696) 116,459Share Class I 920,746 90,898 (128,679) 882,965Share Class Z 1,430,322 121,728 (517,376) 1,034,674
Absolute Return Fixed Income Fund (EUR)
Share Class A 134,282 13,727 (20,264) 127,745Share Class AH (USD) 347 - - 347Share Class AR 35,743 12,295 (7,592) 40,446Share Class B 354,516 112,903 (86,072) 381,347Share Class BR 273,868 78,547 (42,653) 309,762Share Class C 89,855 12,936 (23,784) 79,007Share Class CR 37,126 9,807 (9,400) 37,533Share Class IH (USD) 348 - - 348Share Class Z 310,526 - - 310,526
Asian Fixed Income Opportunities Fund (USD)
Share Class A 4,000 - - 4,000Share Class AX 4,000 - - 4,000Share Class I 4,000 - - 4,000Share Class IX 4,000 - - 4,000Share Class Z 380,000 - - 380,000Share Class ZX 4,000 - - 4,000
Emerging Markets Corporate Debt Fund (USD)
Share Class A 1,748,346 900,219 (261,118) 2,387,447Share Class AH (EUR) 648,305 222,289 (163,906) 706,688Share Class AHX (EUR) 2,196,789 312,070 (209,274) 2,299,585Share Class AX 319,955 466,493 (44,321) 742,127Share Class B 974,884 159,804 (171,629) 963,059Share Class BH (EUR) 312,588 224,432 (40,383) 496,637Share Class BHX (EUR) 370,750 164,457 (68,982) 466,225Share Class BX 585,918 122,455 (72,330) 636,043Share Class C 524,184 77,456 (51,216) 550,424Share Class CH (EUR) 52,116 32,201 (4,386) 79,931Share Class I 407,867 256,931 (59,645) 605,153Share Class IH (EUR) 2,580 73,230 (13) 75,797Share Class Z 12,076,209 5,084,973 (4,260,620) 12,900,562Share Class ZH (EUR) 1,499,462 1,232,868 (155,543) 2,576,787
* Share Class was launched during the period.
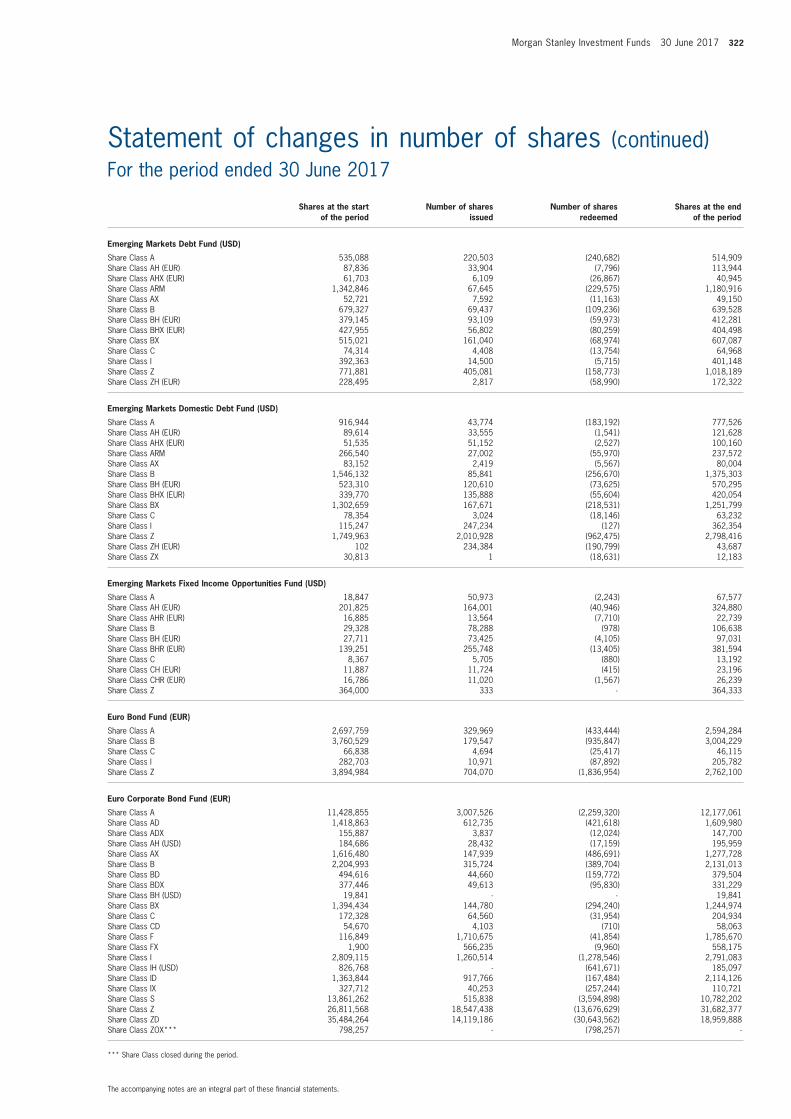
Morgan Stanley Investment Funds 30 June 2017 322
The accompanying notes are an integral part of these fi nancial statements.
Statement of changes in number of shares (continued)For the period ended 30 June 2017
Shares at the start of the period
Number of shares issued
Number of shares redeemed
Shares at the end of the period
Emerging Markets Debt Fund (USD)
Share Class A 535,088 220,503 (240,682) 514,909Share Class AH (EUR) 87,836 33,904 (7,796) 113,944Share Class AHX (EUR) 61,703 6,109 (26,867) 40,945Share Class ARM 1,342,846 67,645 (229,575) 1,180,916Share Class AX 52,721 7,592 (11,163) 49,150Share Class B 679,327 69,437 (109,236) 639,528Share Class BH (EUR) 379,145 93,109 (59,973) 412,281Share Class BHX (EUR) 427,955 56,802 (80,259) 404,498Share Class BX 515,021 161,040 (68,974) 607,087Share Class C 74,314 4,408 (13,754) 64,968Share Class I 392,363 14,500 (5,715) 401,148Share Class Z 771,881 405,081 (158,773) 1,018,189Share Class ZH (EUR) 228,495 2,817 (58,990) 172,322
Emerging Markets Domestic Debt Fund (USD)
Share Class A 916,944 43,774 (183,192) 777,526Share Class AH (EUR) 89,614 33,555 (1,541) 121,628Share Class AHX (EUR) 51,535 51,152 (2,527) 100,160Share Class ARM 266,540 27,002 (55,970) 237,572Share Class AX 83,152 2,419 (5,567) 80,004Share Class B 1,546,132 85,841 (256,670) 1,375,303Share Class BH (EUR) 523,310 120,610 (73,625) 570,295Share Class BHX (EUR) 339,770 135,888 (55,604) 420,054Share Class BX 1,302,659 167,671 (218,531) 1,251,799Share Class C 78,354 3,024 (18,146) 63,232Share Class I 115,247 247,234 (127) 362,354Share Class Z 1,749,963 2,010,928 (962,475) 2,798,416Share Class ZH (EUR) 102 234,384 (190,799) 43,687Share Class ZX 30,813 1 (18,631) 12,183
Emerging Markets Fixed Income Opportunities Fund (USD)
Share Class A 18,847 50,973 (2,243) 67,577Share Class AH (EUR) 201,825 164,001 (40,946) 324,880Share Class AHR (EUR) 16,885 13,564 (7,710) 22,739Share Class B 29,328 78,288 (978) 106,638Share Class BH (EUR) 27,711 73,425 (4,105) 97,031Share Class BHR (EUR) 139,251 255,748 (13,405) 381,594Share Class C 8,367 5,705 (880) 13,192Share Class CH (EUR) 11,887 11,724 (415) 23,196Share Class CHR (EUR) 16,786 11,020 (1,567) 26,239Share Class Z 364,000 333 - 364,333
Euro Bond Fund (EUR)
Share Class A 2,697,759 329,969 (433,444) 2,594,284Share Class B 3,760,529 179,547 (935,847) 3,004,229Share Class C 66,838 4,694 (25,417) 46,115Share Class I 282,703 10,971 (87,892) 205,782Share Class Z 3,894,984 704,070 (1,836,954) 2,762,100
Euro Corporate Bond Fund (EUR)
Share Class A 11,428,855 3,007,526 (2,259,320) 12,177,061Share Class AD 1,418,863 612,735 (421,618) 1,609,980Share Class ADX 155,887 3,837 (12,024) 147,700Share Class AH (USD) 184,686 28,432 (17,159) 195,959Share Class AX 1,616,480 147,939 (486,691) 1,277,728Share Class B 2,204,993 315,724 (389,704) 2,131,013Share Class BD 494,616 44,660 (159,772) 379,504Share Class BDX 377,446 49,613 (95,830) 331,229Share Class BH (USD) 19,841 - - 19,841Share Class BX 1,394,434 144,780 (294,240) 1,244,974Share Class C 172,328 64,560 (31,954) 204,934Share Class CD 54,670 4,103 (710) 58,063Share Class F 116,849 1,710,675 (41,854) 1,785,670Share Class FX 1,900 566,235 (9,960) 558,175Share Class I 2,809,115 1,260,514 (1,278,546) 2,791,083Share Class IH (USD) 826,768 - (641,671) 185,097Share Class ID 1,363,844 917,766 (167,484) 2,114,126Share Class IX 327,712 40,253 (257,244) 110,721Share Class S 13,861,262 515,838 (3,594,898) 10,782,202Share Class Z 26,811,568 18,547,438 (13,676,629) 31,682,377Share Class ZD 35,484,264 14,119,186 (30,643,562) 18,959,888Share Class ZOX*** 798,257 - (798,257) -
*** Share Class closed during the period.
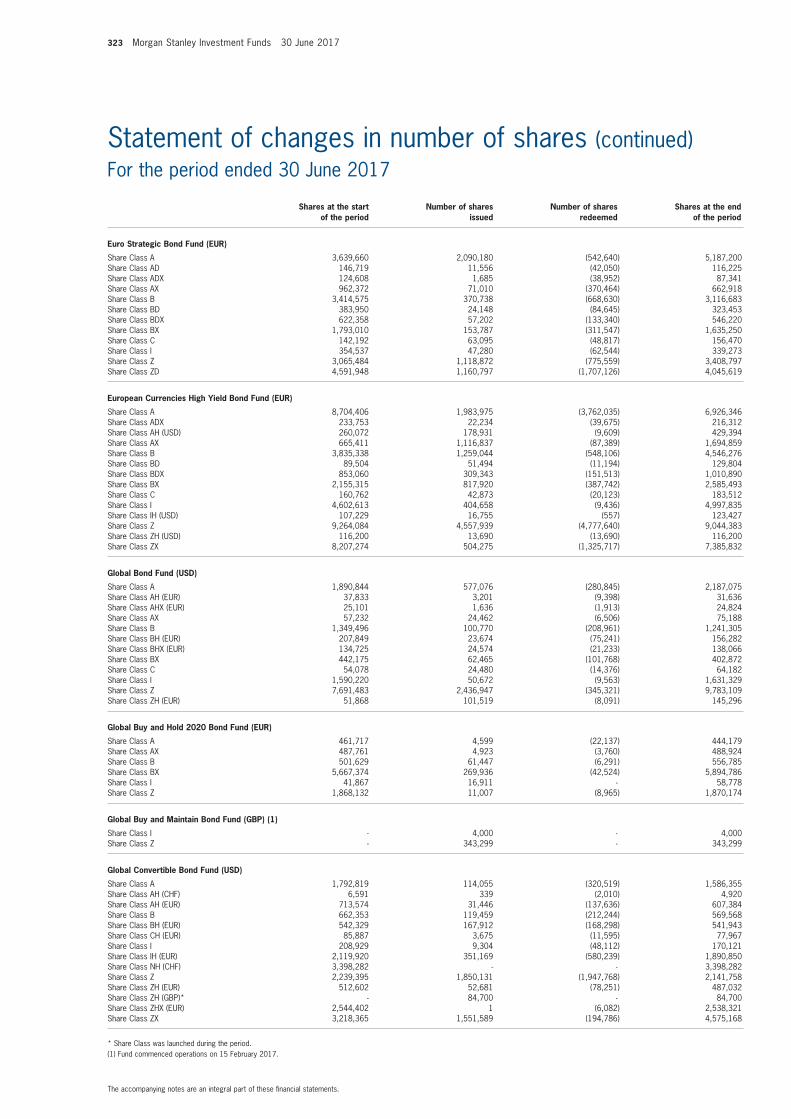
323 Morgan Stanley Investment Funds 30 June 2017
The accompanying notes are an integral part of these fi nancial statements.
Statement of changes in number of shares (continued)For the period ended 30 June 2017
Shares at the start of the period
Number of shares issued
Number of shares redeemed
Shares at the end of the period
Euro Strategic Bond Fund (EUR)
Share Class A 3,639,660 2,090,180 (542,640) 5,187,200Share Class AD 146,719 11,556 (42,050) 116,225Share Class ADX 124,608 1,685 (38,952) 87,341Share Class AX 962,372 71,010 (370,464) 662,918Share Class B 3,414,575 370,738 (668,630) 3,116,683Share Class BD 383,950 24,148 (84,645) 323,453Share Class BDX 622,358 57,202 (133,340) 546,220Share Class BX 1,793,010 153,787 (311,547) 1,635,250Share Class C 142,192 63,095 (48,817) 156,470Share Class I 354,537 47,280 (62,544) 339,273Share Class Z 3,065,484 1,118,872 (775,559) 3,408,797Share Class ZD 4,591,948 1,160,797 (1,707,126) 4,045,619
European Currencies High Yield Bond Fund (EUR)
Share Class A 8,704,406 1,983,975 (3,762,035) 6,926,346Share Class ADX 233,753 22,234 (39,675) 216,312Share Class AH (USD) 260,072 178,931 (9,609) 429,394Share Class AX 665,411 1,116,837 (87,389) 1,694,859Share Class B 3,835,338 1,259,044 (548,106) 4,546,276Share Class BD 89,504 51,494 (11,194) 129,804Share Class BDX 853,060 309,343 (151,513) 1,010,890Share Class BX 2,155,315 817,920 (387,742) 2,585,493Share Class C 160,762 42,873 (20,123) 183,512Share Class I 4,602,613 404,658 (9,436) 4,997,835Share Class IH (USD) 107,229 16,755 (557) 123,427Share Class Z 9,264,084 4,557,939 (4,777,640) 9,044,383Share Class ZH (USD) 116,200 13,690 (13,690) 116,200Share Class ZX 8,207,274 504,275 (1,325,717) 7,385,832
Global Bond Fund (USD)
Share Class A 1,890,844 577,076 (280,845) 2,187,075Share Class AH (EUR) 37,833 3,201 (9,398) 31,636Share Class AHX (EUR) 25,101 1,636 (1,913) 24,824Share Class AX 57,232 24,462 (6,506) 75,188Share Class B 1,349,496 100,770 (208,961) 1,241,305Share Class BH (EUR) 207,849 23,674 (75,241) 156,282Share Class BHX (EUR) 134,725 24,574 (21,233) 138,066Share Class BX 442,175 62,465 (101,768) 402,872Share Class C 54,078 24,480 (14,376) 64,182Share Class I 1,590,220 50,672 (9,563) 1,631,329Share Class Z 7,691,483 2,436,947 (345,321) 9,783,109Share Class ZH (EUR) 51,868 101,519 (8,091) 145,296
Global Buy and Hold 2020 Bond Fund (EUR)
Share Class A 461,717 4,599 (22,137) 444,179Share Class AX 487,761 4,923 (3,760) 488,924Share Class B 501,629 61,447 (6,291) 556,785Share Class BX 5,667,374 269,936 (42,524) 5,894,786Share Class I 41,867 16,911 - 58,778Share Class Z 1,868,132 11,007 (8,965) 1,870,174
Global Buy and Maintain Bond Fund (GBP) (1)
Share Class I - 4,000 - 4,000Share Class Z - 343,299 - 343,299
Global Convertible Bond Fund (USD)
Share Class A 1,792,819 114,055 (320,519) 1,586,355Share Class AH (CHF) 6,591 339 (2,010) 4,920Share Class AH (EUR) 713,574 31,446 (137,636) 607,384Share Class B 662,353 119,459 (212,244) 569,568Share Class BH (EUR) 542,329 167,912 (168,298) 541,943Share Class CH (EUR) 85,887 3,675 (11,595) 77,967Share Class I 208,929 9,304 (48,112) 170,121Share Class IH (EUR) 2,119,920 351,169 (580,239) 1,890,850Share Class NH (CHF) 3,398,282 - - 3,398,282Share Class Z 2,239,395 1,850,131 (1,947,768) 2,141,758Share Class ZH (EUR) 512,602 52,681 (78,251) 487,032Share Class ZH (GBP)* - 84,700 - 84,700Share Class ZHX (EUR) 2,544,402 1 (6,082) 2,538,321Share Class ZX 3,218,365 1,551,589 (194,786) 4,575,168
* Share Class was launched during the period.(1) Fund commenced operations on 15 February 2017.
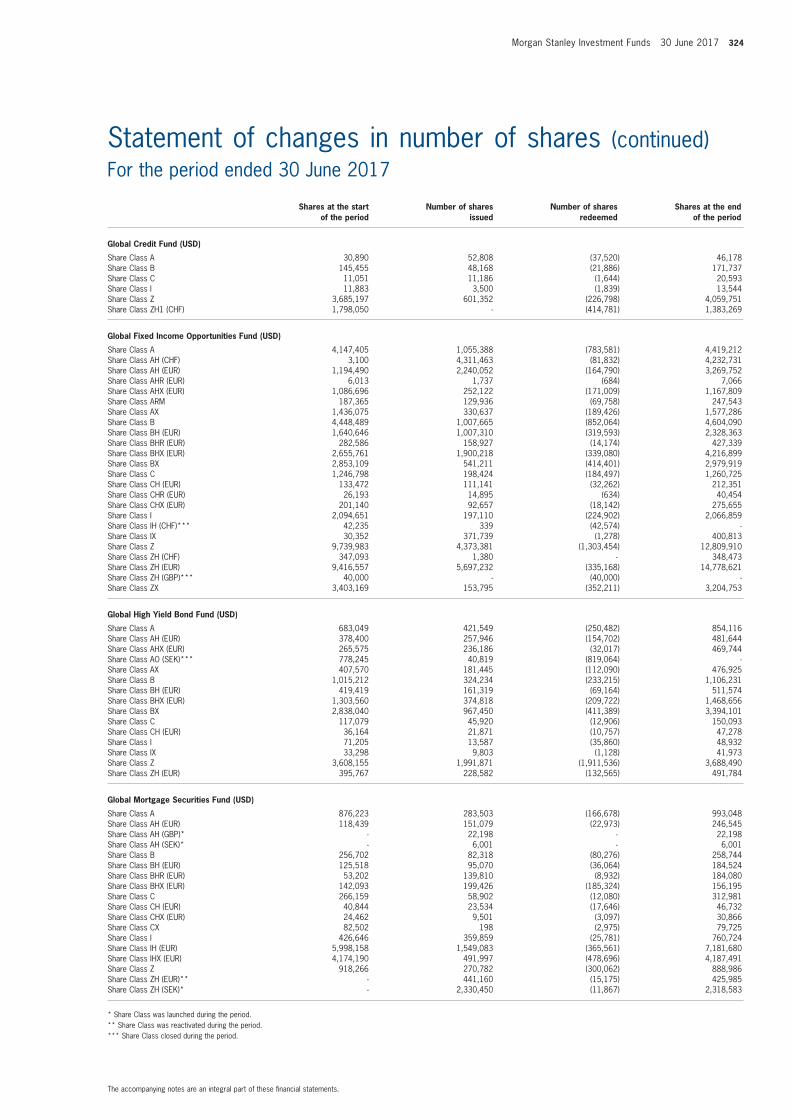
Morgan Stanley Investment Funds 30 June 2017 324
The accompanying notes are an integral part of these fi nancial statements.
Statement of changes in number of shares (continued)For the period ended 30 June 2017
Shares at the start of the period
Number of shares issued
Number of shares redeemed
Shares at the end of the period
Global Credit Fund (USD)
Share Class A 30,890 52,808 (37,520) 46,178Share Class B 145,455 48,168 (21,886) 171,737Share Class C 11,051 11,186 (1,644) 20,593Share Class I 11,883 3,500 (1,839) 13,544Share Class Z 3,685,197 601,352 (226,798) 4,059,751Share Class ZH1 (CHF) 1,798,050 - (414,781) 1,383,269
Global Fixed Income Opportunities Fund (USD)
Share Class A 4,147,405 1,055,388 (783,581) 4,419,212Share Class AH (CHF) 3,100 4,311,463 (81,832) 4,232,731Share Class AH (EUR) 1,194,490 2,240,052 (164,790) 3,269,752Share Class AHR (EUR) 6,013 1,737 (684) 7,066Share Class AHX (EUR) 1,086,696 252,122 (171,009) 1,167,809Share Class ARM 187,365 129,936 (69,758) 247,543Share Class AX 1,436,075 330,637 (189,426) 1,577,286Share Class B 4,448,489 1,007,665 (852,064) 4,604,090Share Class BH (EUR) 1,640,646 1,007,310 (319,593) 2,328,363Share Class BHR (EUR) 282,586 158,927 (14,174) 427,339Share Class BHX (EUR) 2,655,761 1,900,218 (339,080) 4,216,899Share Class BX 2,853,109 541,211 (414,401) 2,979,919Share Class C 1,246,798 198,424 (184,497) 1,260,725Share Class CH (EUR) 133,472 111,141 (32,262) 212,351Share Class CHR (EUR) 26,193 14,895 (634) 40,454Share Class CHX (EUR) 201,140 92,657 (18,142) 275,655Share Class I 2,094,651 197,110 (224,902) 2,066,859Share Class IH (CHF)*** 42,235 339 (42,574) -Share Class IX 30,352 371,739 (1,278) 400,813Share Class Z 9,739,983 4,373,381 (1,303,454) 12,809,910Share Class ZH (CHF) 347,093 1,380 - 348,473Share Class ZH (EUR) 9,416,557 5,697,232 (335,168) 14,778,621Share Class ZH (GBP)*** 40,000 - (40,000) -Share Class ZX 3,403,169 153,795 (352,211) 3,204,753
Global High Yield Bond Fund (USD)
Share Class A 683,049 421,549 (250,482) 854,116Share Class AH (EUR) 378,400 257,946 (154,702) 481,644Share Class AHX (EUR) 265,575 236,186 (32,017) 469,744Share Class AO (SEK)*** 778,245 40,819 (819,064) -Share Class AX 407,570 181,445 (112,090) 476,925Share Class B 1,015,212 324,234 (233,215) 1,106,231Share Class BH (EUR) 419,419 161,319 (69,164) 511,574Share Class BHX (EUR) 1,303,560 374,818 (209,722) 1,468,656Share Class BX 2,838,040 967,450 (411,389) 3,394,101Share Class C 117,079 45,920 (12,906) 150,093Share Class CH (EUR) 36,164 21,871 (10,757) 47,278Share Class I 71,205 13,587 (35,860) 48,932Share Class IX 33,298 9,803 (1,128) 41,973Share Class Z 3,608,155 1,991,871 (1,911,536) 3,688,490Share Class ZH (EUR) 395,767 228,582 (132,565) 491,784
Global Mortgage Securities Fund (USD)
Share Class A 876,223 283,503 (166,678) 993,048Share Class AH (EUR) 118,439 151,079 (22,973) 246,545Share Class AH (GBP)* - 22,198 - 22,198Share Class AH (SEK)* - 6,001 - 6,001Share Class B 256,702 82,318 (80,276) 258,744Share Class BH (EUR) 125,518 95,070 (36,064) 184,524Share Class BHR (EUR) 53,202 139,810 (8,932) 184,080Share Class BHX (EUR) 142,093 199,426 (185,324) 156,195Share Class C 266,159 58,902 (12,080) 312,981Share Class CH (EUR) 40,844 23,534 (17,646) 46,732Share Class CHX (EUR) 24,462 9,501 (3,097) 30,866Share Class CX 82,502 198 (2,975) 79,725Share Class I 426,646 359,859 (25,781) 760,724Share Class IH (EUR) 5,998,158 1,549,083 (365,561) 7,181,680Share Class IHX (EUR) 4,174,190 491,997 (478,696) 4,187,491Share Class Z 918,266 270,782 (300,062) 888,986Share Class ZH (EUR)** - 441,160 (15,175) 425,985Share Class ZH (SEK)* - 2,330,450 (11,867) 2,318,583
* Share Class was launched during the period.** Share Class was reactivated during the period.*** Share Class closed during the period.
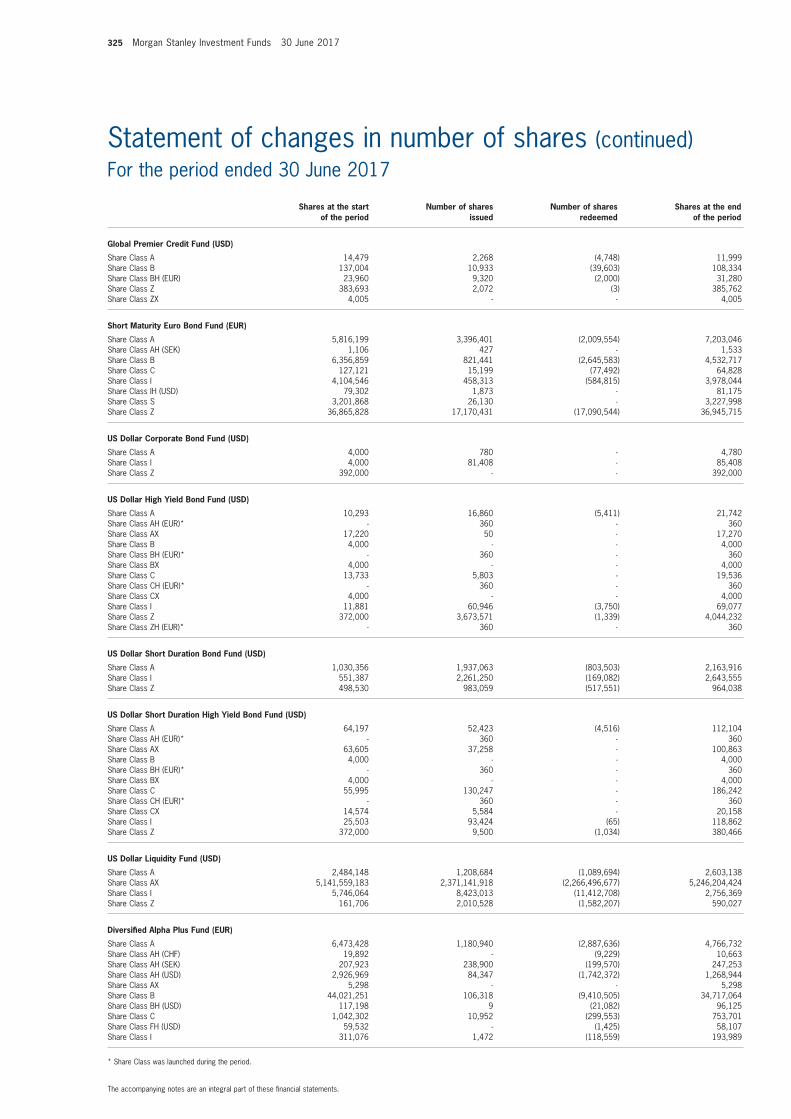
325 Morgan Stanley Investment Funds 30 June 2017
The accompanying notes are an integral part of these fi nancial statements.
Statement of changes in number of shares (continued)For the period ended 30 June 2017
Shares at the start of the period
Number of shares issued
Number of shares redeemed
Shares at the end of the period
Global Premier Credit Fund (USD)
Share Class A 14,479 2,268 (4,748) 11,999Share Class B 137,004 10,933 (39,603) 108,334Share Class BH (EUR) 23,960 9,320 (2,000) 31,280Share Class Z 383,693 2,072 (3) 385,762Share Class ZX 4,005 - - 4,005
Short Maturity Euro Bond Fund (EUR)
Share Class A 5,816,199 3,396,401 (2,009,554) 7,203,046Share Class AH (SEK) 1,106 427 - 1,533Share Class B 6,356,859 821,441 (2,645,583) 4,532,717Share Class C 127,121 15,199 (77,492) 64,828Share Class I 4,104,546 458,313 (584,815) 3,978,044Share Class IH (USD) 79,302 1,873 - 81,175Share Class S 3,201,868 26,130 - 3,227,998Share Class Z 36,865,828 17,170,431 (17,090,544) 36,945,715
US Dollar Corporate Bond Fund (USD)
Share Class A 4,000 780 - 4,780Share Class I 4,000 81,408 - 85,408Share Class Z 392,000 - - 392,000
US Dollar High Yield Bond Fund (USD)
Share Class A 10,293 16,860 (5,411) 21,742Share Class AH (EUR)* - 360 - 360Share Class AX 17,220 50 - 17,270Share Class B 4,000 - - 4,000Share Class BH (EUR)* - 360 - 360Share Class BX 4,000 - - 4,000Share Class C 13,733 5,803 - 19,536Share Class CH (EUR)* - 360 - 360Share Class CX 4,000 - - 4,000Share Class I 11,881 60,946 (3,750) 69,077Share Class Z 372,000 3,673,571 (1,339) 4,044,232Share Class ZH (EUR)* - 360 - 360
US Dollar Short Duration Bond Fund (USD)
Share Class A 1,030,356 1,937,063 (803,503) 2,163,916Share Class I 551,387 2,261,250 (169,082) 2,643,555Share Class Z 498,530 983,059 (517,551) 964,038
US Dollar Short Duration High Yield Bond Fund (USD)
Share Class A 64,197 52,423 (4,516) 112,104Share Class AH (EUR)* - 360 - 360Share Class AX 63,605 37,258 - 100,863Share Class B 4,000 - - 4,000Share Class BH (EUR)* - 360 - 360Share Class BX 4,000 - - 4,000Share Class C 55,995 130,247 - 186,242Share Class CH (EUR)* - 360 - 360Share Class CX 14,574 5,584 - 20,158Share Class I 25,503 93,424 (65) 118,862Share Class Z 372,000 9,500 (1,034) 380,466
US Dollar Liquidity Fund (USD)
Share Class A 2,484,148 1,208,684 (1,089,694) 2,603,138Share Class AX 5,141,559,183 2,371,141,918 (2,266,496,677) 5,246,204,424Share Class I 5,746,064 8,423,013 (11,412,708) 2,756,369Share Class Z 161,706 2,010,528 (1,582,207) 590,027
Diversifi ed Alpha Plus Fund (EUR)
Share Class A 6,473,428 1,180,940 (2,887,636) 4,766,732Share Class AH (CHF) 19,892 - (9,229) 10,663Share Class AH (SEK) 207,923 238,900 (199,570) 247,253Share Class AH (USD) 2,926,969 84,347 (1,742,372) 1,268,944Share Class AX 5,298 - - 5,298Share Class B 44,021,251 106,318 (9,410,505) 34,717,064Share Class BH (USD) 117,198 9 (21,082) 96,125Share Class C 1,042,302 10,952 (299,553) 753,701Share Class FH (USD) 59,532 - (1,425) 58,107Share Class I 311,076 1,472 (118,559) 193,989
* Share Class was launched during the period.
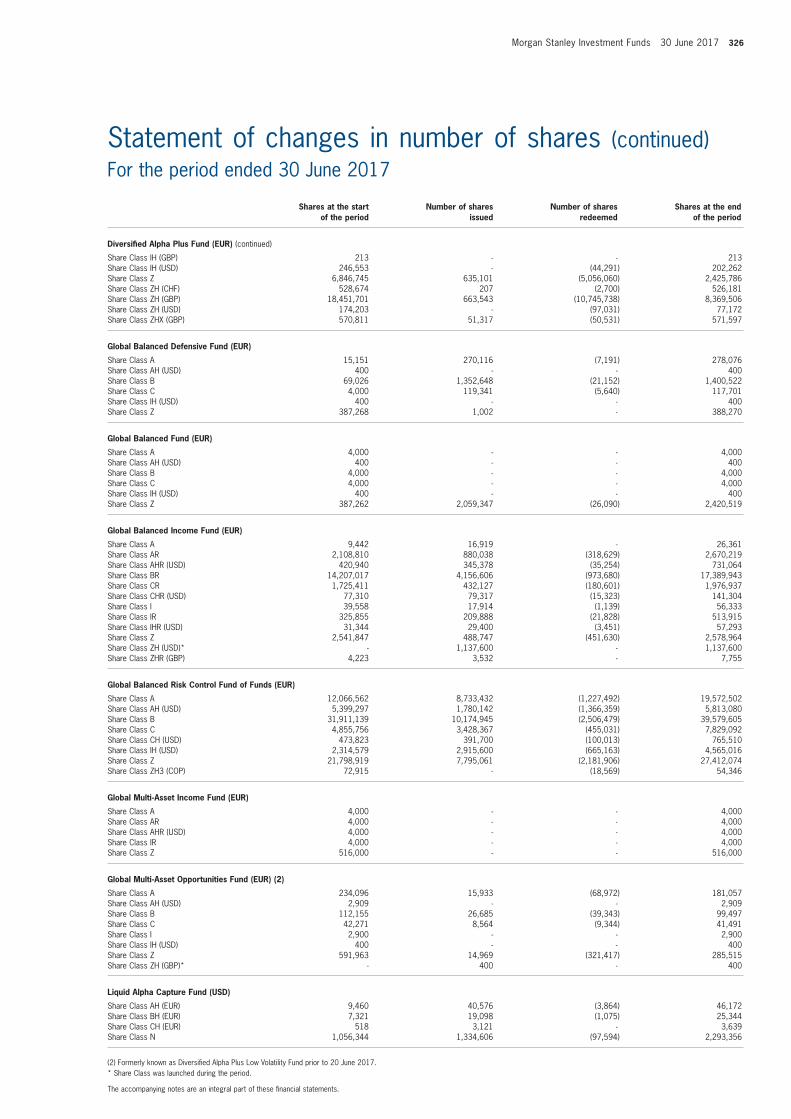
Morgan Stanley Investment Funds 30 June 2017 326
The accompanying notes are an integral part of these fi nancial statements.
Statement of changes in number of shares (continued)For the period ended 30 June 2017
Shares at the start of the period
Number of shares issued
Number of shares redeemed
Shares at the end of the period
Diversifi ed Alpha Plus Fund (EUR) (continued)
Share Class IH (GBP) 213 - - 213Share Class IH (USD) 246,553 - (44,291) 202,262Share Class Z 6,846,745 635,101 (5,056,060) 2,425,786Share Class ZH (CHF) 528,674 207 (2,700) 526,181Share Class ZH (GBP) 18,451,701 663,543 (10,745,738) 8,369,506Share Class ZH (USD) 174,203 - (97,031) 77,172Share Class ZHX (GBP) 570,811 51,317 (50,531) 571,597
Global Balanced Defensive Fund (EUR)
Share Class A 15,151 270,116 (7,191) 278,076Share Class AH (USD) 400 - - 400Share Class B 69,026 1,352,648 (21,152) 1,400,522Share Class C 4,000 119,341 (5,640) 117,701Share Class IH (USD) 400 - - 400Share Class Z 387,268 1,002 - 388,270
Global Balanced Fund (EUR)
Share Class A 4,000 - - 4,000Share Class AH (USD) 400 - - 400Share Class B 4,000 - - 4,000Share Class C 4,000 - - 4,000Share Class IH (USD) 400 - - 400Share Class Z 387,262 2,059,347 (26,090) 2,420,519
Global Balanced Income Fund (EUR)
Share Class A 9,442 16,919 - 26,361Share Class AR 2,108,810 880,038 (318,629) 2,670,219Share Class AHR (USD) 420,940 345,378 (35,254) 731,064Share Class BR 14,207,017 4,156,606 (973,680) 17,389,943Share Class CR 1,725,411 432,127 (180,601) 1,976,937Share Class CHR (USD) 77,310 79,317 (15,323) 141,304Share Class I 39,558 17,914 (1,139) 56,333Share Class IR 325,855 209,888 (21,828) 513,915Share Class IHR (USD) 31,344 29,400 (3,451) 57,293Share Class Z 2,541,847 488,747 (451,630) 2,578,964Share Class ZH (USD)* - 1,137,600 - 1,137,600Share Class ZHR (GBP) 4,223 3,532 - 7,755
Global Balanced Risk Control Fund of Funds (EUR)
Share Class A 12,066,562 8,733,432 (1,227,492) 19,572,502Share Class AH (USD) 5,399,297 1,780,142 (1,366,359) 5,813,080Share Class B 31,911,139 10,174,945 (2,506,479) 39,579,605Share Class C 4,855,756 3,428,367 (455,031) 7,829,092Share Class CH (USD) 473,823 391,700 (100,013) 765,510Share Class IH (USD) 2,314,579 2,915,600 (665,163) 4,565,016Share Class Z 21,798,919 7,795,061 (2,181,906) 27,412,074Share Class ZH3 (COP) 72,915 - (18,569) 54,346
Global Multi-Asset Income Fund (EUR)
Share Class A 4,000 - - 4,000Share Class AR 4,000 - - 4,000Share Class AHR (USD) 4,000 - - 4,000Share Class IR 4,000 - - 4,000Share Class Z 516,000 - - 516,000
Global Multi-Asset Opportunities Fund (EUR) (2)
Share Class A 234,096 15,933 (68,972) 181,057Share Class AH (USD) 2,909 - - 2,909Share Class B 112,155 26,685 (39,343) 99,497Share Class C 42,271 8,564 (9,344) 41,491Share Class I 2,900 - - 2,900Share Class IH (USD) 400 - - 400Share Class Z 591,963 14,969 (321,417) 285,515Share Class ZH (GBP)* - 400 - 400
Liquid Alpha Capture Fund (USD)
Share Class AH (EUR) 9,460 40,576 (3,864) 46,172Share Class BH (EUR) 7,321 19,098 (1,075) 25,344Share Class CH (EUR) 518 3,121 - 3,639Share Class N 1,056,344 1,334,606 (97,594) 2,293,356
(2) Formerly known as Diversifi ed Alpha Plus Low Volatility Fund prior to 20 June 2017.* Share Class was launched during the period.
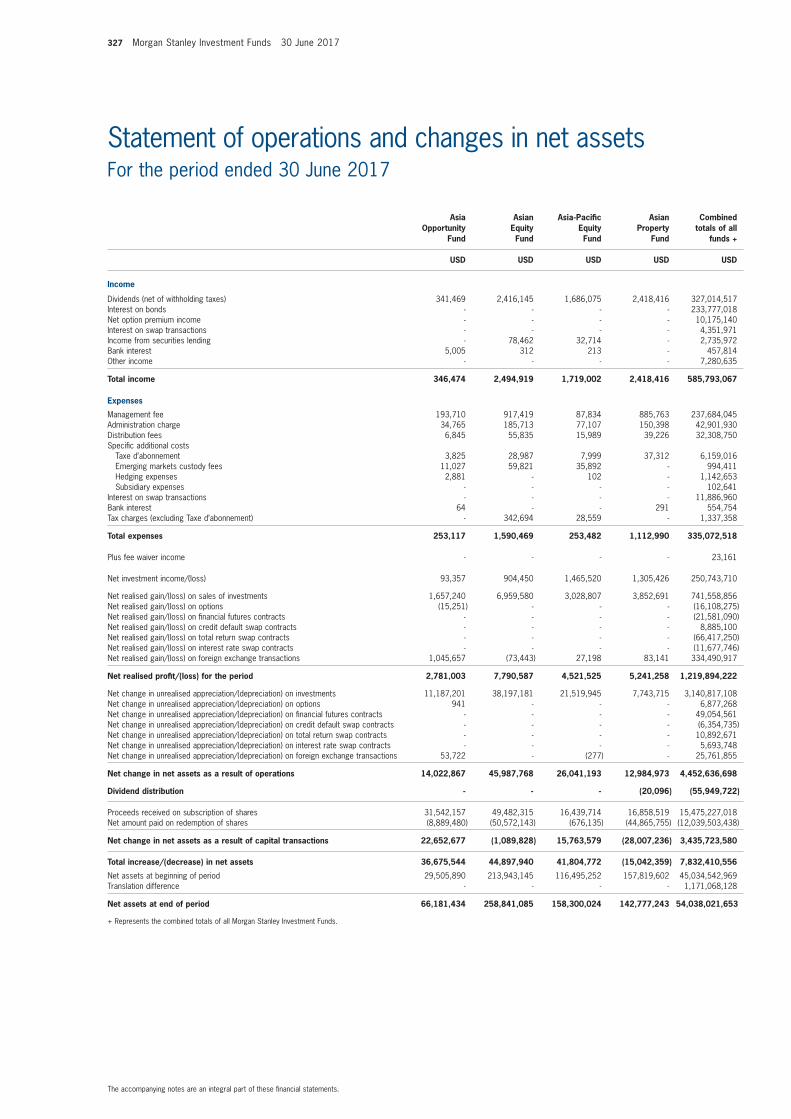
327 Morgan Stanley Investment Funds 30 June 2017
The accompanying notes are an integral part of these fi nancial statements.
Statement of operations and changes in net assetsFor the period ended 30 June 2017
Asia Opportunity
Fund
Asian Equity Fund
Asia-Pacifi c Equity Fund
Asian Property
Fund
Combined totals of all
funds +
USD USD USD USD USD
Income
Dividends (net of withholding taxes) 341,469 2,416,145 1,686,075 2,418,416 327,014,517Interest on bonds - - - - 233,777,018Net option premium income - - - - 10,175,140Interest on swap transactions - - - - 4,351,971Income from securities lending - 78,462 32,714 - 2,735,972Bank interest 5,005 312 213 - 457,814Other income - - - - 7,280,635
Total income 346,474 2,494,919 1,719,002 2,418,416 585,793,067
Expenses
Management fee 193,710 917,419 87,834 885,763 237,684,045Administration charge 34,765 185,713 77,107 150,398 42,901,930Distribution fees 6,845 55,835 15,989 39,226 32,308,750Specifi c additional costs Taxe d’abonnement 3,825 28,987 7,999 37,312 6,159,016 Emerging markets custody fees 11,027 59,821 35,892 - 994,411 Hedging expenses 2,881 - 102 - 1,142,653 Subsidiary expenses - - - - 102,641Interest on swap transactions - - - - 11,886,960Bank interest 64 - - 291 554,754Tax charges (excluding Taxe d’abonnement) - 342,694 28,559 - 1,337,358
Total expenses 253,117 1,590,469 253,482 1,112,990 335,072,518
Plus fee waiver income - - - - 23,161
Net investment income/(loss) 93,357 904,450 1,465,520 1,305,426 250,743,710
Net realised gain/(loss) on sales of investments 1,657,240 6,959,580 3,028,807 3,852,691 741,558,856Net realised gain/(loss) on options (15,251) - - - (16,108,275)Net realised gain/(loss) on fi nancial futures contracts - - - - (21,581,090)Net realised gain/(loss) on credit default swap contracts - - - - 8,885,100Net realised gain/(loss) on total return swap contracts - - - - (66,417,250)Net realised gain/(loss) on interest rate swap contracts - - - - (11,677,746)Net realised gain/(loss) on foreign exchange transactions 1,045,657 (73,443) 27,198 83,141 334,490,917
Net realised profi t/(loss) for the period 2,781,003 7,790,587 4,521,525 5,241,258 1,219,894,222
Net change in unrealised appreciation/(depreciation) on investments 11,187,201 38,197,181 21,519,945 7,743,715 3,140,817,108Net change in unrealised appreciation/(depreciation) on options 941 - - - 6,877,268Net change in unrealised appreciation/(depreciation) on fi nancial futures contracts - - - - 49,054,561Net change in unrealised appreciation/(depreciation) on credit default swap contracts - - - - (6,354,735)Net change in unrealised appreciation/(depreciation) on total return swap contracts - - - - 10,892,671Net change in unrealised appreciation/(depreciation) on interest rate swap contracts - - - - 5,693,748Net change in unrealised appreciation/(depreciation) on foreign exchange transactions 53,722 - (277) - 25,761,855
Net change in net assets as a result of operations 14,022,867 45,987,768 26,041,193 12,984,973 4,452,636,698
Dividend distribution - - - (20,096) (55,949,722)
Proceeds received on subscription of shares 31,542,157 49,482,315 16,439,714 16,858,519 15,475,227,018Net amount paid on redemption of shares (8,889,480) (50,572,143) (676,135) (44,865,755) (12,039,503,438)
Net change in net assets as a result of capital transactions 22,652,677 (1,089,828) 15,763,579 (28,007,236) 3,435,723,580
Total increase/(decrease) in net assets 36,675,544 44,897,940 41,804,772 (15,042,359) 7,832,410,556
Net assets at beginning of period 29,505,890 213,943,145 116,495,252 157,819,602 45,034,542,969Translation difference - - - - 1,171,068,128
Net assets at end of period 66,181,434 258,841,085 158,300,024 142,777,243 54,038,021,653
+ Represents the combined totals of all Morgan Stanley Investment Funds.
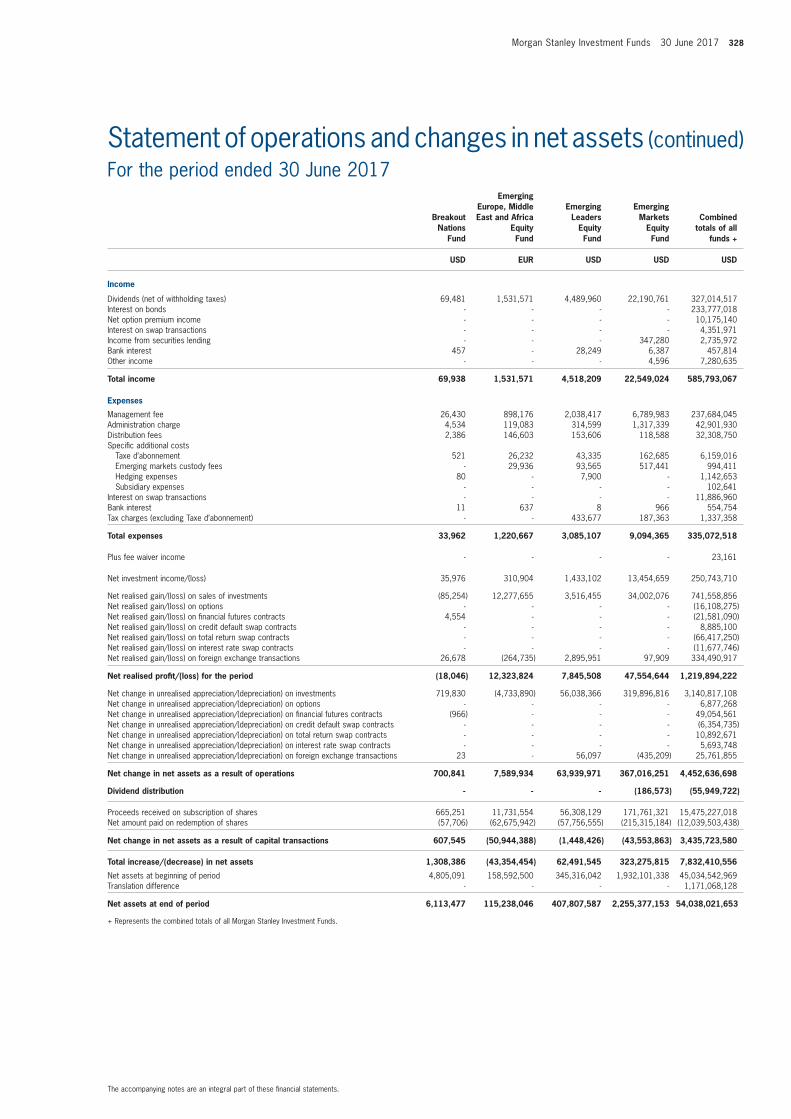
Morgan Stanley Investment Funds 30 June 2017 328
The accompanying notes are an integral part of these fi nancial statements.
Statement of operations and changes in net assets (continued)For the period ended 30 June 2017
Breakout Nations
Fund
Emerging Europe, Middle East and Africa
Equity Fund
Emerging Leaders
Equity Fund
Emerging Markets
Equity Fund
Combined totals of all
funds +
USD EUR USD USD USD
Income
Dividends (net of withholding taxes) 69,481 1,531,571 4,489,960 22,190,761 327,014,517Interest on bonds - - - - 233,777,018Net option premium income - - - - 10,175,140Interest on swap transactions - - - - 4,351,971Income from securities lending - - - 347,280 2,735,972Bank interest 457 - 28,249 6,387 457,814Other income - - - 4,596 7,280,635
Total income 69,938 1,531,571 4,518,209 22,549,024 585,793,067
Expenses
Management fee 26,430 898,176 2,038,417 6,789,983 237,684,045Administration charge 4,534 119,083 314,599 1,317,339 42,901,930Distribution fees 2,386 146,603 153,606 118,588 32,308,750Specifi c additional costs Taxe d’abonnement 521 26,232 43,335 162,685 6,159,016 Emerging markets custody fees - 29,936 93,565 517,441 994,411 Hedging expenses 80 - 7,900 - 1,142,653 Subsidiary expenses - - - - 102,641Interest on swap transactions - - - - 11,886,960Bank interest 11 637 8 966 554,754Tax charges (excluding Taxe d’abonnement) - - 433,677 187,363 1,337,358
Total expenses 33,962 1,220,667 3,085,107 9,094,365 335,072,518
Plus fee waiver income - - - - 23,161
Net investment income/(loss) 35,976 310,904 1,433,102 13,454,659 250,743,710
Net realised gain/(loss) on sales of investments (85,254) 12,277,655 3,516,455 34,002,076 741,558,856Net realised gain/(loss) on options - - - - (16,108,275)Net realised gain/(loss) on fi nancial futures contracts 4,554 - - - (21,581,090)Net realised gain/(loss) on credit default swap contracts - - - - 8,885,100Net realised gain/(loss) on total return swap contracts - - - - (66,417,250)Net realised gain/(loss) on interest rate swap contracts - - - - (11,677,746)Net realised gain/(loss) on foreign exchange transactions 26,678 (264,735) 2,895,951 97,909 334,490,917
Net realised profi t/(loss) for the period (18,046) 12,323,824 7,845,508 47,554,644 1,219,894,222
Net change in unrealised appreciation/(depreciation) on investments 719,830 (4,733,890) 56,038,366 319,896,816 3,140,817,108Net change in unrealised appreciation/(depreciation) on options - - - - 6,877,268Net change in unrealised appreciation/(depreciation) on fi nancial futures contracts (966) - - - 49,054,561Net change in unrealised appreciation/(depreciation) on credit default swap contracts - - - - (6,354,735)Net change in unrealised appreciation/(depreciation) on total return swap contracts - - - - 10,892,671Net change in unrealised appreciation/(depreciation) on interest rate swap contracts - - - - 5,693,748Net change in unrealised appreciation/(depreciation) on foreign exchange transactions 23 - 56,097 (435,209) 25,761,855
Net change in net assets as a result of operations 700,841 7,589,934 63,939,971 367,016,251 4,452,636,698
Dividend distribution - - - (186,573) (55,949,722)
Proceeds received on subscription of shares 665,251 11,731,554 56,308,129 171,761,321 15,475,227,018Net amount paid on redemption of shares (57,706) (62,675,942) (57,756,555) (215,315,184) (12,039,503,438)
Net change in net assets as a result of capital transactions 607,545 (50,944,388) (1,448,426) (43,553,863) 3,435,723,580
Total increase/(decrease) in net assets 1,308,386 (43,354,454) 62,491,545 323,275,815 7,832,410,556
Net assets at beginning of period 4,805,091 158,592,500 345,316,042 1,932,101,338 45,034,542,969Translation difference - - - - 1,171,068,128
Net assets at end of period 6,113,477 115,238,046 407,807,587 2,255,377,153 54,038,021,653
+ Represents the combined totals of all Morgan Stanley Investment Funds.
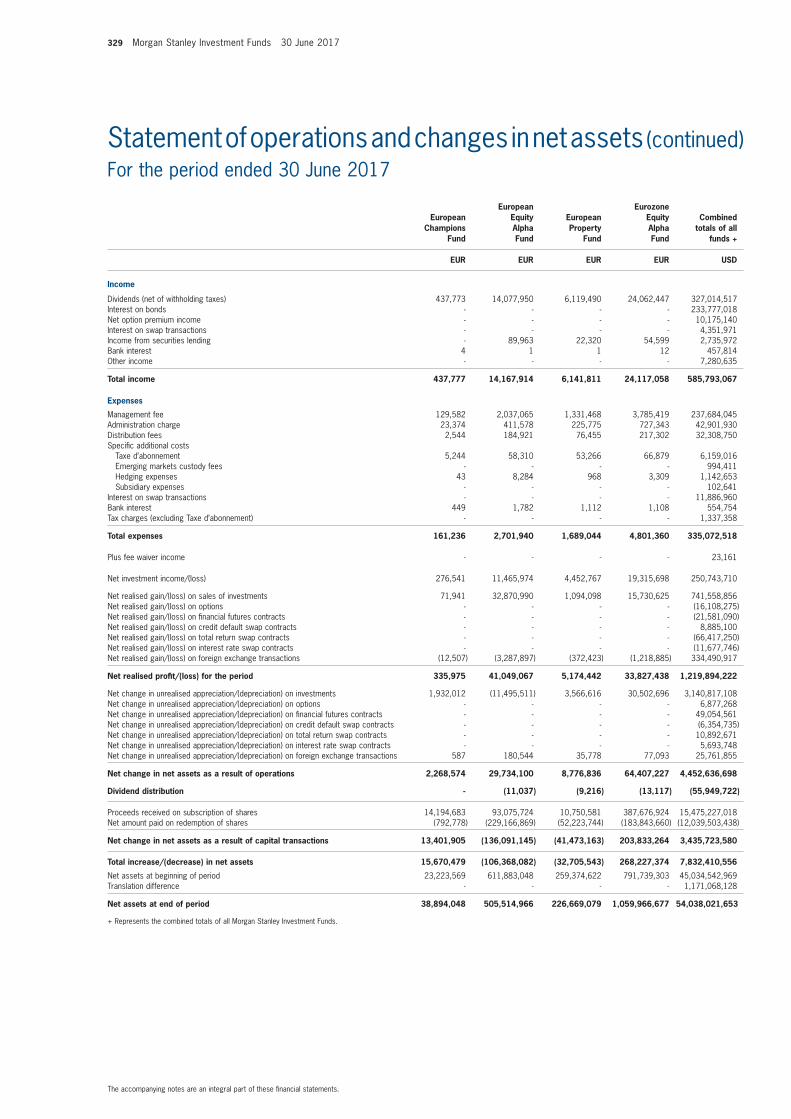
329 Morgan Stanley Investment Funds 30 June 2017
The accompanying notes are an integral part of these fi nancial statements.
Statement of operations and changes in net assets (continued)For the period ended 30 June 2017
European Champions
Fund
European Equity Alpha Fund
European Property
Fund
Eurozone Equity Alpha Fund
Combined totals of all
funds +
EUR EUR EUR EUR USD
Income
Dividends (net of withholding taxes) 437,773 14,077,950 6,119,490 24,062,447 327,014,517Interest on bonds - - - - 233,777,018Net option premium income - - - - 10,175,140Interest on swap transactions - - - - 4,351,971Income from securities lending - 89,963 22,320 54,599 2,735,972Bank interest 4 1 1 12 457,814Other income - - - - 7,280,635
Total income 437,777 14,167,914 6,141,811 24,117,058 585,793,067
Expenses
Management fee 129,582 2,037,065 1,331,468 3,785,419 237,684,045Administration charge 23,374 411,578 225,775 727,343 42,901,930Distribution fees 2,544 184,921 76,455 217,302 32,308,750Specifi c additional costs Taxe d’abonnement 5,244 58,310 53,266 66,879 6,159,016 Emerging markets custody fees - - - - 994,411 Hedging expenses 43 8,284 968 3,309 1,142,653 Subsidiary expenses - - - - 102,641Interest on swap transactions - - - - 11,886,960Bank interest 449 1,782 1,112 1,108 554,754Tax charges (excluding Taxe d’abonnement) - - - - 1,337,358
Total expenses 161,236 2,701,940 1,689,044 4,801,360 335,072,518
Plus fee waiver income - - - - 23,161
Net investment income/(loss) 276,541 11,465,974 4,452,767 19,315,698 250,743,710
Net realised gain/(loss) on sales of investments 71,941 32,870,990 1,094,098 15,730,625 741,558,856Net realised gain/(loss) on options - - - - (16,108,275)Net realised gain/(loss) on fi nancial futures contracts - - - - (21,581,090)Net realised gain/(loss) on credit default swap contracts - - - - 8,885,100Net realised gain/(loss) on total return swap contracts - - - - (66,417,250)Net realised gain/(loss) on interest rate swap contracts - - - - (11,677,746)Net realised gain/(loss) on foreign exchange transactions (12,507) (3,287,897) (372,423) (1,218,885) 334,490,917
Net realised profi t/(loss) for the period 335,975 41,049,067 5,174,442 33,827,438 1,219,894,222
Net change in unrealised appreciation/(depreciation) on investments 1,932,012 (11,495,511) 3,566,616 30,502,696 3,140,817,108Net change in unrealised appreciation/(depreciation) on options - - - - 6,877,268Net change in unrealised appreciation/(depreciation) on fi nancial futures contracts - - - - 49,054,561Net change in unrealised appreciation/(depreciation) on credit default swap contracts - - - - (6,354,735)Net change in unrealised appreciation/(depreciation) on total return swap contracts - - - - 10,892,671Net change in unrealised appreciation/(depreciation) on interest rate swap contracts - - - - 5,693,748Net change in unrealised appreciation/(depreciation) on foreign exchange transactions 587 180,544 35,778 77,093 25,761,855
Net change in net assets as a result of operations 2,268,574 29,734,100 8,776,836 64,407,227 4,452,636,698
Dividend distribution - (11,037) (9,216) (13,117) (55,949,722)
Proceeds received on subscription of shares 14,194,683 93,075,724 10,750,581 387,676,924 15,475,227,018Net amount paid on redemption of shares (792,778) (229,166,869) (52,223,744) (183,843,660) (12,039,503,438)
Net change in net assets as a result of capital transactions 13,401,905 (136,091,145) (41,473,163) 203,833,264 3,435,723,580
Total increase/(decrease) in net assets 15,670,479 (106,368,082) (32,705,543) 268,227,374 7,832,410,556
Net assets at beginning of period 23,223,569 611,883,048 259,374,622 791,739,303 45,034,542,969Translation difference - - - - 1,171,068,128
Net assets at end of period 38,894,048 505,514,966 226,669,079 1,059,966,677 54,038,021,653
+ Represents the combined totals of all Morgan Stanley Investment Funds.
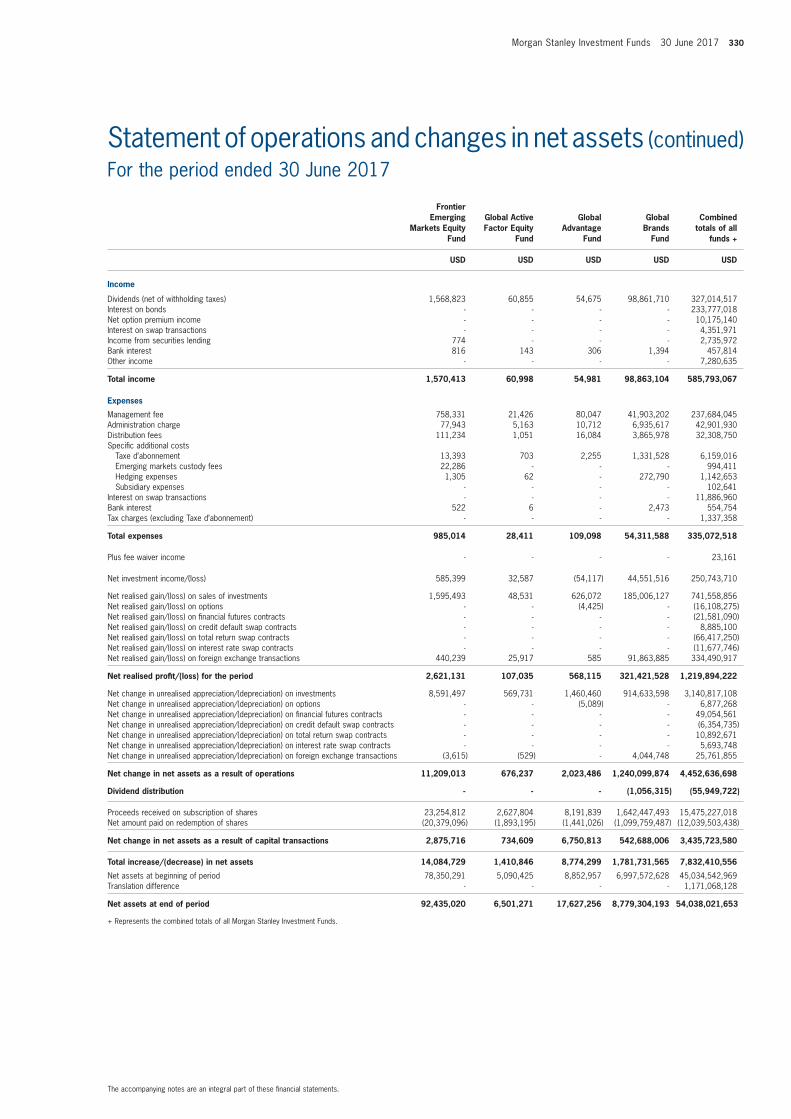
Morgan Stanley Investment Funds 30 June 2017 330
The accompanying notes are an integral part of these fi nancial statements.
Statement of operations and changes in net assets (continued)For the period ended 30 June 2017
Frontier Emerging
Markets Equity Fund
Global Active Factor Equity
Fund
Global Advantage
Fund
Global Brands
Fund
Combined totals of all
funds +
USD USD USD USD USD
Income
Dividends (net of withholding taxes) 1,568,823 60,855 54,675 98,861,710 327,014,517Interest on bonds - - - - 233,777,018Net option premium income - - - - 10,175,140Interest on swap transactions - - - - 4,351,971Income from securities lending 774 - - - 2,735,972Bank interest 816 143 306 1,394 457,814Other income - - - - 7,280,635
Total income 1,570,413 60,998 54,981 98,863,104 585,793,067
Expenses
Management fee 758,331 21,426 80,047 41,903,202 237,684,045Administration charge 77,943 5,163 10,712 6,935,617 42,901,930Distribution fees 111,234 1,051 16,084 3,865,978 32,308,750Specifi c additional costs Taxe d’abonnement 13,393 703 2,255 1,331,528 6,159,016 Emerging markets custody fees 22,286 - - - 994,411 Hedging expenses 1,305 62 - 272,790 1,142,653 Subsidiary expenses - - - - 102,641Interest on swap transactions - - - - 11,886,960Bank interest 522 6 - 2,473 554,754Tax charges (excluding Taxe d’abonnement) - - - - 1,337,358
Total expenses 985,014 28,411 109,098 54,311,588 335,072,518
Plus fee waiver income - - - - 23,161
Net investment income/(loss) 585,399 32,587 (54,117) 44,551,516 250,743,710
Net realised gain/(loss) on sales of investments 1,595,493 48,531 626,072 185,006,127 741,558,856Net realised gain/(loss) on options - - (4,425) - (16,108,275)Net realised gain/(loss) on fi nancial futures contracts - - - - (21,581,090)Net realised gain/(loss) on credit default swap contracts - - - - 8,885,100Net realised gain/(loss) on total return swap contracts - - - - (66,417,250)Net realised gain/(loss) on interest rate swap contracts - - - - (11,677,746)Net realised gain/(loss) on foreign exchange transactions 440,239 25,917 585 91,863,885 334,490,917
Net realised profi t/(loss) for the period 2,621,131 107,035 568,115 321,421,528 1,219,894,222
Net change in unrealised appreciation/(depreciation) on investments 8,591,497 569,731 1,460,460 914,633,598 3,140,817,108Net change in unrealised appreciation/(depreciation) on options - - (5,089) - 6,877,268Net change in unrealised appreciation/(depreciation) on fi nancial futures contracts - - - - 49,054,561Net change in unrealised appreciation/(depreciation) on credit default swap contracts - - - - (6,354,735)Net change in unrealised appreciation/(depreciation) on total return swap contracts - - - - 10,892,671Net change in unrealised appreciation/(depreciation) on interest rate swap contracts - - - - 5,693,748Net change in unrealised appreciation/(depreciation) on foreign exchange transactions (3,615) (529) - 4,044,748 25,761,855
Net change in net assets as a result of operations 11,209,013 676,237 2,023,486 1,240,099,874 4,452,636,698
Dividend distribution - - - (1,056,315) (55,949,722)
Proceeds received on subscription of shares 23,254,812 2,627,804 8,191,839 1,642,447,493 15,475,227,018Net amount paid on redemption of shares (20,379,096) (1,893,195) (1,441,026) (1,099,759,487) (12,039,503,438)
Net change in net assets as a result of capital transactions 2,875,716 734,609 6,750,813 542,688,006 3,435,723,580
Total increase/(decrease) in net assets 14,084,729 1,410,846 8,774,299 1,781,731,565 7,832,410,556
Net assets at beginning of period 78,350,291 5,090,425 8,852,957 6,997,572,628 45,034,542,969Translation difference - - - - 1,171,068,128
Net assets at end of period 92,435,020 6,501,271 17,627,256 8,779,304,193 54,038,021,653
+ Represents the combined totals of all Morgan Stanley Investment Funds.
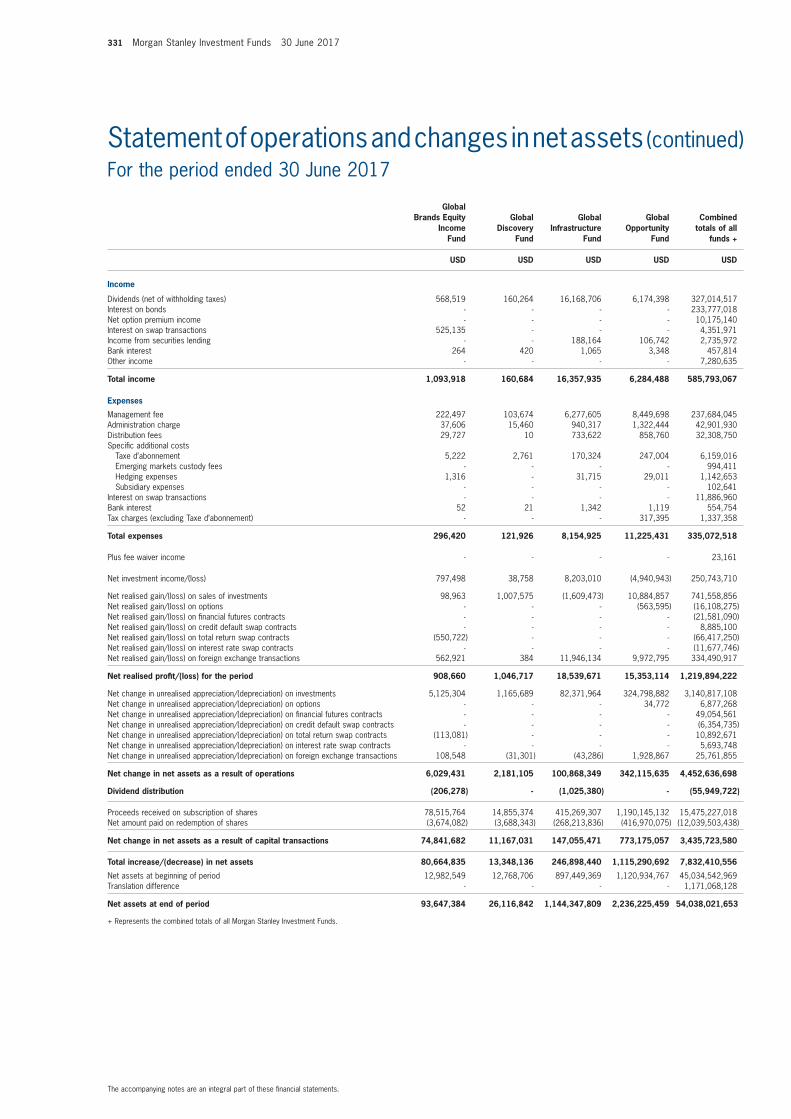
331 Morgan Stanley Investment Funds 30 June 2017
The accompanying notes are an integral part of these fi nancial statements.
Statement of operations and changes in net assets (continued)For the period ended 30 June 2017
Global Brands Equity
Income Fund
Global Discovery
Fund
Global Infrastructure
Fund
Global Opportunity
Fund
Combined totals of all
funds +
USD USD USD USD USD
Income
Dividends (net of withholding taxes) 568,519 160,264 16,168,706 6,174,398 327,014,517Interest on bonds - - - - 233,777,018Net option premium income - - - - 10,175,140Interest on swap transactions 525,135 - - - 4,351,971Income from securities lending - - 188,164 106,742 2,735,972Bank interest 264 420 1,065 3,348 457,814Other income - - - - 7,280,635
Total income 1,093,918 160,684 16,357,935 6,284,488 585,793,067
Expenses
Management fee 222,497 103,674 6,277,605 8,449,698 237,684,045Administration charge 37,606 15,460 940,317 1,322,444 42,901,930Distribution fees 29,727 10 733,622 858,760 32,308,750Specifi c additional costs Taxe d’abonnement 5,222 2,761 170,324 247,004 6,159,016 Emerging markets custody fees - - - - 994,411 Hedging expenses 1,316 - 31,715 29,011 1,142,653 Subsidiary expenses - - - - 102,641Interest on swap transactions - - - - 11,886,960Bank interest 52 21 1,342 1,119 554,754Tax charges (excluding Taxe d’abonnement) - - - 317,395 1,337,358
Total expenses 296,420 121,926 8,154,925 11,225,431 335,072,518
Plus fee waiver income - - - - 23,161
Net investment income/(loss) 797,498 38,758 8,203,010 (4,940,943) 250,743,710
Net realised gain/(loss) on sales of investments 98,963 1,007,575 (1,609,473) 10,884,857 741,558,856Net realised gain/(loss) on options - - - (563,595) (16,108,275)Net realised gain/(loss) on fi nancial futures contracts - - - - (21,581,090)Net realised gain/(loss) on credit default swap contracts - - - - 8,885,100Net realised gain/(loss) on total return swap contracts (550,722) - - - (66,417,250)Net realised gain/(loss) on interest rate swap contracts - - - - (11,677,746)Net realised gain/(loss) on foreign exchange transactions 562,921 384 11,946,134 9,972,795 334,490,917
Net realised profi t/(loss) for the period 908,660 1,046,717 18,539,671 15,353,114 1,219,894,222
Net change in unrealised appreciation/(depreciation) on investments 5,125,304 1,165,689 82,371,964 324,798,882 3,140,817,108Net change in unrealised appreciation/(depreciation) on options - - - 34,772 6,877,268Net change in unrealised appreciation/(depreciation) on fi nancial futures contracts - - - - 49,054,561Net change in unrealised appreciation/(depreciation) on credit default swap contracts - - - - (6,354,735)Net change in unrealised appreciation/(depreciation) on total return swap contracts (113,081) - - - 10,892,671Net change in unrealised appreciation/(depreciation) on interest rate swap contracts - - - - 5,693,748Net change in unrealised appreciation/(depreciation) on foreign exchange transactions 108,548 (31,301) (43,286) 1,928,867 25,761,855
Net change in net assets as a result of operations 6,029,431 2,181,105 100,868,349 342,115,635 4,452,636,698
Dividend distribution (206,278) - (1,025,380) - (55,949,722)
Proceeds received on subscription of shares 78,515,764 14,855,374 415,269,307 1,190,145,132 15,475,227,018Net amount paid on redemption of shares (3,674,082) (3,688,343) (268,213,836) (416,970,075) (12,039,503,438)
Net change in net assets as a result of capital transactions 74,841,682 11,167,031 147,055,471 773,175,057 3,435,723,580
Total increase/(decrease) in net assets 80,664,835 13,348,136 246,898,440 1,115,290,692 7,832,410,556
Net assets at beginning of period 12,982,549 12,768,706 897,449,369 1,120,934,767 45,034,542,969Translation difference - - - - 1,171,068,128
Net assets at end of period 93,647,384 26,116,842 1,144,347,809 2,236,225,459 54,038,021,653
+ Represents the combined totals of all Morgan Stanley Investment Funds.
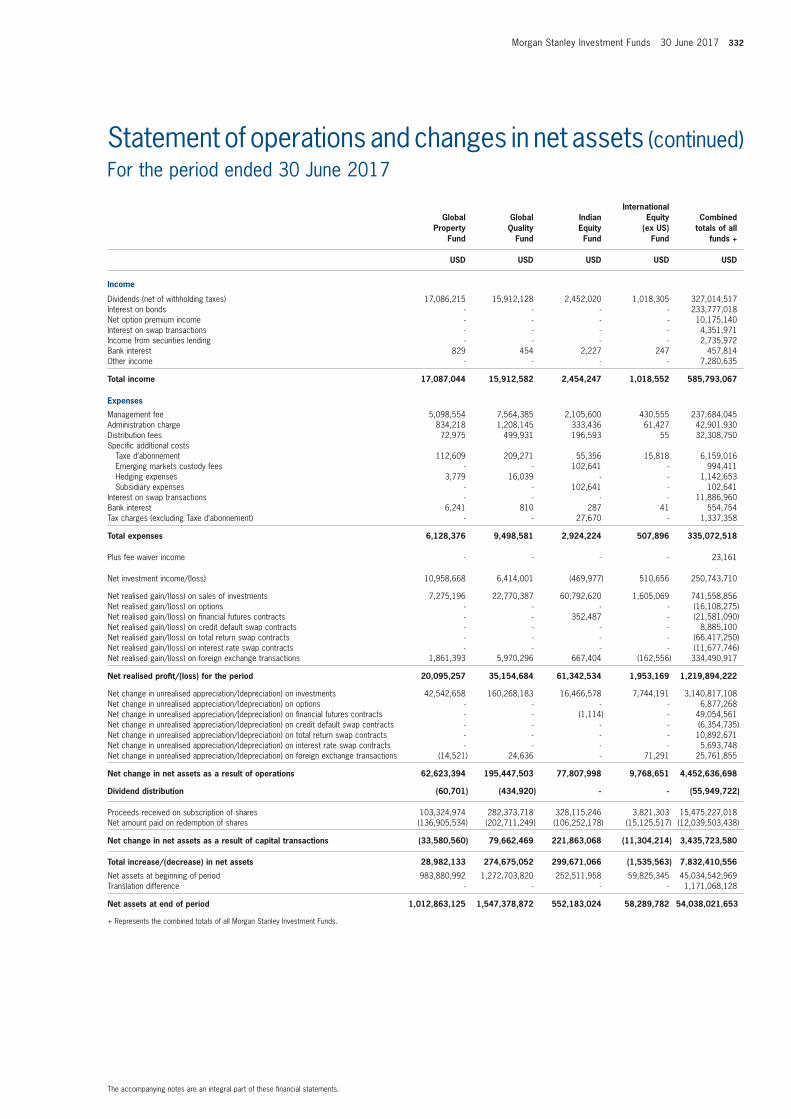
Morgan Stanley Investment Funds 30 June 2017 332
The accompanying notes are an integral part of these fi nancial statements.
Statement of operations and changes in net assets (continued)For the period ended 30 June 2017
Global Property
Fund
Global Quality
Fund
Indian Equity Fund
International Equity
(ex US) Fund
Combined totals of all
funds +
USD USD USD USD USD
Income
Dividends (net of withholding taxes) 17,086,215 15,912,128 2,452,020 1,018,305 327,014,517Interest on bonds - - - - 233,777,018Net option premium income - - - - 10,175,140Interest on swap transactions - - - - 4,351,971Income from securities lending - - - - 2,735,972Bank interest 829 454 2,227 247 457,814Other income - - - - 7,280,635
Total income 17,087,044 15,912,582 2,454,247 1,018,552 585,793,067
Expenses
Management fee 5,098,554 7,564,385 2,105,600 430,555 237,684,045Administration charge 834,218 1,208,145 333,436 61,427 42,901,930Distribution fees 72,975 499,931 196,593 55 32,308,750Specifi c additional costs Taxe d’abonnement 112,609 209,271 55,356 15,818 6,159,016 Emerging markets custody fees - - 102,641 - 994,411 Hedging expenses 3,779 16,039 - - 1,142,653 Subsidiary expenses - - 102,641 - 102,641Interest on swap transactions - - - - 11,886,960Bank interest 6,241 810 287 41 554,754Tax charges (excluding Taxe d’abonnement) - - 27,670 - 1,337,358
Total expenses 6,128,376 9,498,581 2,924,224 507,896 335,072,518
Plus fee waiver income - - - - 23,161
Net investment income/(loss) 10,958,668 6,414,001 (469,977) 510,656 250,743,710
Net realised gain/(loss) on sales of investments 7,275,196 22,770,387 60,792,620 1,605,069 741,558,856Net realised gain/(loss) on options - - - - (16,108,275)Net realised gain/(loss) on fi nancial futures contracts - - 352,487 - (21,581,090)Net realised gain/(loss) on credit default swap contracts - - - - 8,885,100Net realised gain/(loss) on total return swap contracts - - - - (66,417,250)Net realised gain/(loss) on interest rate swap contracts - - - - (11,677,746)Net realised gain/(loss) on foreign exchange transactions 1,861,393 5,970,296 667,404 (162,556) 334,490,917
Net realised profi t/(loss) for the period 20,095,257 35,154,684 61,342,534 1,953,169 1,219,894,222
Net change in unrealised appreciation/(depreciation) on investments 42,542,658 160,268,183 16,466,578 7,744,191 3,140,817,108Net change in unrealised appreciation/(depreciation) on options - - - - 6,877,268Net change in unrealised appreciation/(depreciation) on fi nancial futures contracts - - (1,114) - 49,054,561Net change in unrealised appreciation/(depreciation) on credit default swap contracts - - - - (6,354,735)Net change in unrealised appreciation/(depreciation) on total return swap contracts - - - - 10,892,671Net change in unrealised appreciation/(depreciation) on interest rate swap contracts - - - - 5,693,748Net change in unrealised appreciation/(depreciation) on foreign exchange transactions (14,521) 24,636 - 71,291 25,761,855
Net change in net assets as a result of operations 62,623,394 195,447,503 77,807,998 9,768,651 4,452,636,698
Dividend distribution (60,701) (434,920) - - (55,949,722)
Proceeds received on subscription of shares 103,324,974 282,373,718 328,115,246 3,821,303 15,475,227,018Net amount paid on redemption of shares (136,905,534) (202,711,249) (106,252,178) (15,125,517) (12,039,503,438)
Net change in net assets as a result of capital transactions (33,580,560) 79,662,469 221,863,068 (11,304,214) 3,435,723,580
Total increase/(decrease) in net assets 28,982,133 274,675,052 299,671,066 (1,535,563) 7,832,410,556
Net assets at beginning of period 983,880,992 1,272,703,820 252,511,958 59,825,345 45,034,542,969Translation difference - - - - 1,171,068,128
Net assets at end of period 1,012,863,125 1,547,378,872 552,183,024 58,289,782 54,038,021,653
+ Represents the combined totals of all Morgan Stanley Investment Funds.
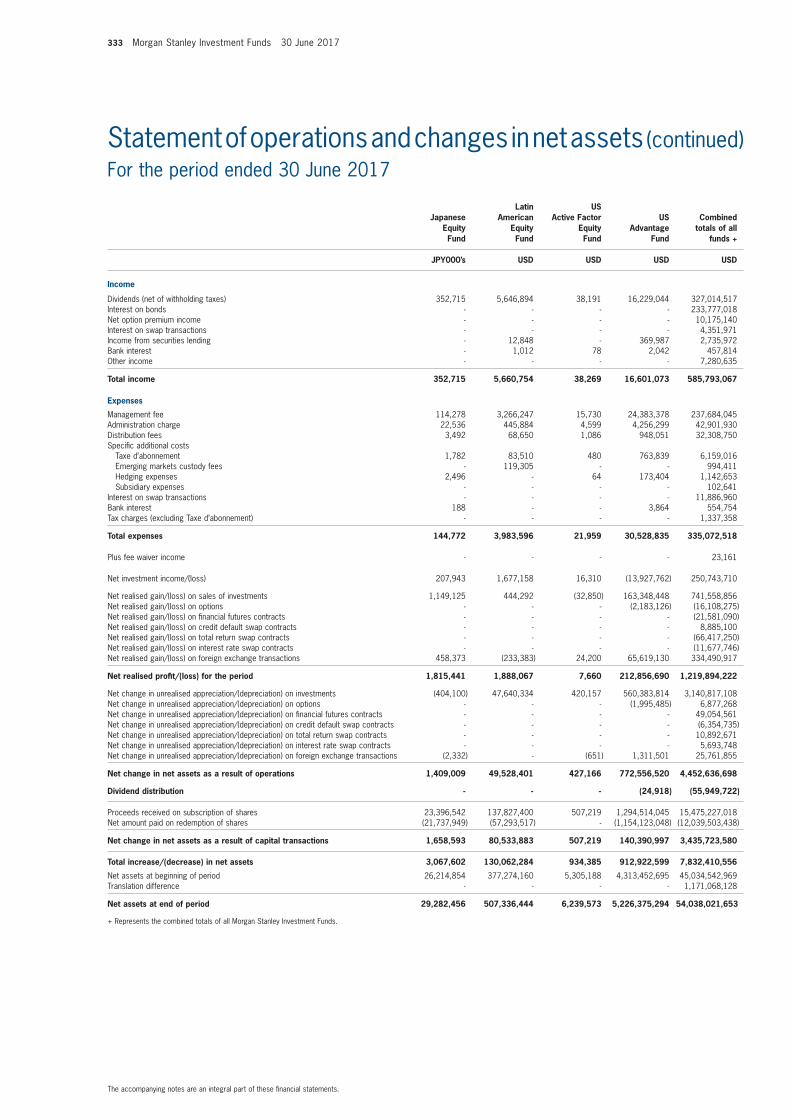
333 Morgan Stanley Investment Funds 30 June 2017
The accompanying notes are an integral part of these fi nancial statements.
Statement of operations and changes in net assets (continued)For the period ended 30 June 2017
Japanese Equity Fund
Latin American
Equity Fund
US Active Factor
Equity Fund
US Advantage
Fund
Combined totals of all
funds +
JPY000’s USD USD USD USD
Income
Dividends (net of withholding taxes) 352,715 5,646,894 38,191 16,229,044 327,014,517Interest on bonds - - - - 233,777,018Net option premium income - - - - 10,175,140Interest on swap transactions - - - - 4,351,971Income from securities lending - 12,848 - 369,987 2,735,972Bank interest - 1,012 78 2,042 457,814Other income - - - - 7,280,635
Total income 352,715 5,660,754 38,269 16,601,073 585,793,067
Expenses
Management fee 114,278 3,266,247 15,730 24,383,378 237,684,045Administration charge 22,536 445,884 4,599 4,256,299 42,901,930Distribution fees 3,492 68,650 1,086 948,051 32,308,750Specifi c additional costs Taxe d’abonnement 1,782 83,510 480 763,839 6,159,016 Emerging markets custody fees - 119,305 - - 994,411 Hedging expenses 2,496 - 64 173,404 1,142,653 Subsidiary expenses - - - - 102,641Interest on swap transactions - - - - 11,886,960Bank interest 188 - - 3,864 554,754Tax charges (excluding Taxe d’abonnement) - - - - 1,337,358
Total expenses 144,772 3,983,596 21,959 30,528,835 335,072,518
Plus fee waiver income - - - - 23,161
Net investment income/(loss) 207,943 1,677,158 16,310 (13,927,762) 250,743,710
Net realised gain/(loss) on sales of investments 1,149,125 444,292 (32,850) 163,348,448 741,558,856Net realised gain/(loss) on options - - - (2,183,126) (16,108,275)Net realised gain/(loss) on fi nancial futures contracts - - - - (21,581,090)Net realised gain/(loss) on credit default swap contracts - - - - 8,885,100Net realised gain/(loss) on total return swap contracts - - - - (66,417,250)Net realised gain/(loss) on interest rate swap contracts - - - - (11,677,746)Net realised gain/(loss) on foreign exchange transactions 458,373 (233,383) 24,200 65,619,130 334,490,917
Net realised profi t/(loss) for the period 1,815,441 1,888,067 7,660 212,856,690 1,219,894,222
Net change in unrealised appreciation/(depreciation) on investments (404,100) 47,640,334 420,157 560,383,814 3,140,817,108Net change in unrealised appreciation/(depreciation) on options - - - (1,995,485) 6,877,268Net change in unrealised appreciation/(depreciation) on fi nancial futures contracts - - - - 49,054,561Net change in unrealised appreciation/(depreciation) on credit default swap contracts - - - - (6,354,735)Net change in unrealised appreciation/(depreciation) on total return swap contracts - - - - 10,892,671Net change in unrealised appreciation/(depreciation) on interest rate swap contracts - - - - 5,693,748Net change in unrealised appreciation/(depreciation) on foreign exchange transactions (2,332) - (651) 1,311,501 25,761,855
Net change in net assets as a result of operations 1,409,009 49,528,401 427,166 772,556,520 4,452,636,698
Dividend distribution - - - (24,918) (55,949,722)
Proceeds received on subscription of shares 23,396,542 137,827,400 507,219 1,294,514,045 15,475,227,018Net amount paid on redemption of shares (21,737,949) (57,293,517) - (1,154,123,048) (12,039,503,438)
Net change in net assets as a result of capital transactions 1,658,593 80,533,883 507,219 140,390,997 3,435,723,580
Total increase/(decrease) in net assets 3,067,602 130,062,284 934,385 912,922,599 7,832,410,556
Net assets at beginning of period 26,214,854 377,274,160 5,305,188 4,313,452,695 45,034,542,969Translation difference - - - - 1,171,068,128
Net assets at end of period 29,282,456 507,336,444 6,239,573 5,226,375,294 54,038,021,653
+ Represents the combined totals of all Morgan Stanley Investment Funds.
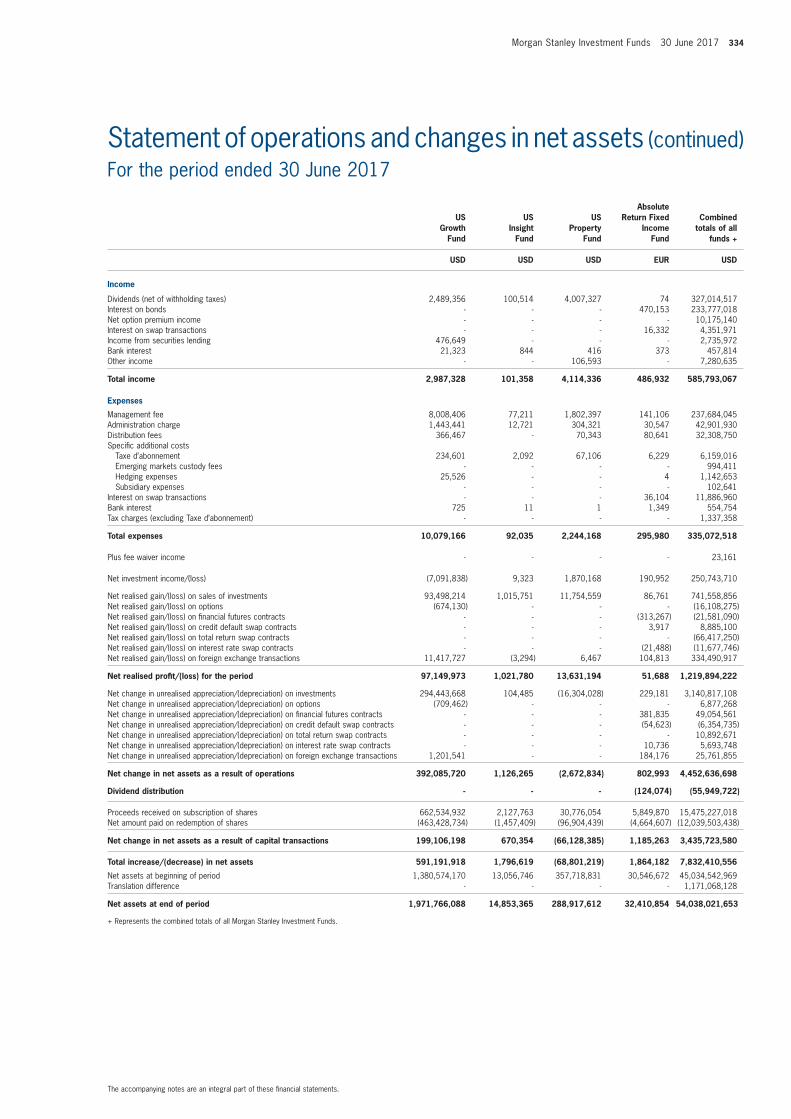
Morgan Stanley Investment Funds 30 June 2017 334
The accompanying notes are an integral part of these fi nancial statements.
Statement of operations and changes in net assets (continued)For the period ended 30 June 2017
US Growth
Fund
US Insight
Fund
US Property
Fund
Absolute Return Fixed
Income Fund
Combined totals of all
funds +
USD USD USD EUR USD
Income
Dividends (net of withholding taxes) 2,489,356 100,514 4,007,327 74 327,014,517Interest on bonds - - - 470,153 233,777,018Net option premium income - - - - 10,175,140Interest on swap transactions - - - 16,332 4,351,971Income from securities lending 476,649 - - - 2,735,972Bank interest 21,323 844 416 373 457,814Other income - - 106,593 - 7,280,635
Total income 2,987,328 101,358 4,114,336 486,932 585,793,067
Expenses
Management fee 8,008,406 77,211 1,802,397 141,106 237,684,045Administration charge 1,443,441 12,721 304,321 30,547 42,901,930Distribution fees 366,467 - 70,343 80,641 32,308,750Specifi c additional costs Taxe d’abonnement 234,601 2,092 67,106 6,229 6,159,016 Emerging markets custody fees - - - - 994,411 Hedging expenses 25,526 - - 4 1,142,653 Subsidiary expenses - - - - 102,641Interest on swap transactions - - - 36,104 11,886,960Bank interest 725 11 1 1,349 554,754Tax charges (excluding Taxe d’abonnement) - - - - 1,337,358
Total expenses 10,079,166 92,035 2,244,168 295,980 335,072,518
Plus fee waiver income - - - - 23,161
Net investment income/(loss) (7,091,838) 9,323 1,870,168 190,952 250,743,710
Net realised gain/(loss) on sales of investments 93,498,214 1,015,751 11,754,559 86,761 741,558,856Net realised gain/(loss) on options (674,130) - - - (16,108,275)Net realised gain/(loss) on fi nancial futures contracts - - - (313,267) (21,581,090)Net realised gain/(loss) on credit default swap contracts - - - 3,917 8,885,100Net realised gain/(loss) on total return swap contracts - - - - (66,417,250)Net realised gain/(loss) on interest rate swap contracts - - - (21,488) (11,677,746)Net realised gain/(loss) on foreign exchange transactions 11,417,727 (3,294) 6,467 104,813 334,490,917
Net realised profi t/(loss) for the period 97,149,973 1,021,780 13,631,194 51,688 1,219,894,222
Net change in unrealised appreciation/(depreciation) on investments 294,443,668 104,485 (16,304,028) 229,181 3,140,817,108Net change in unrealised appreciation/(depreciation) on options (709,462) - - - 6,877,268Net change in unrealised appreciation/(depreciation) on fi nancial futures contracts - - - 381,835 49,054,561Net change in unrealised appreciation/(depreciation) on credit default swap contracts - - - (54,623) (6,354,735)Net change in unrealised appreciation/(depreciation) on total return swap contracts - - - - 10,892,671Net change in unrealised appreciation/(depreciation) on interest rate swap contracts - - - 10,736 5,693,748Net change in unrealised appreciation/(depreciation) on foreign exchange transactions 1,201,541 - - 184,176 25,761,855
Net change in net assets as a result of operations 392,085,720 1,126,265 (2,672,834) 802,993 4,452,636,698
Dividend distribution - - - (124,074) (55,949,722)
Proceeds received on subscription of shares 662,534,932 2,127,763 30,776,054 5,849,870 15,475,227,018Net amount paid on redemption of shares (463,428,734) (1,457,409) (96,904,439) (4,664,607) (12,039,503,438)
Net change in net assets as a result of capital transactions 199,106,198 670,354 (66,128,385) 1,185,263 3,435,723,580
Total increase/(decrease) in net assets 591,191,918 1,796,619 (68,801,219) 1,864,182 7,832,410,556
Net assets at beginning of period 1,380,574,170 13,056,746 357,718,831 30,546,672 45,034,542,969Translation difference - - - - 1,171,068,128
Net assets at end of period 1,971,766,088 14,853,365 288,917,612 32,410,854 54,038,021,653
+ Represents the combined totals of all Morgan Stanley Investment Funds.
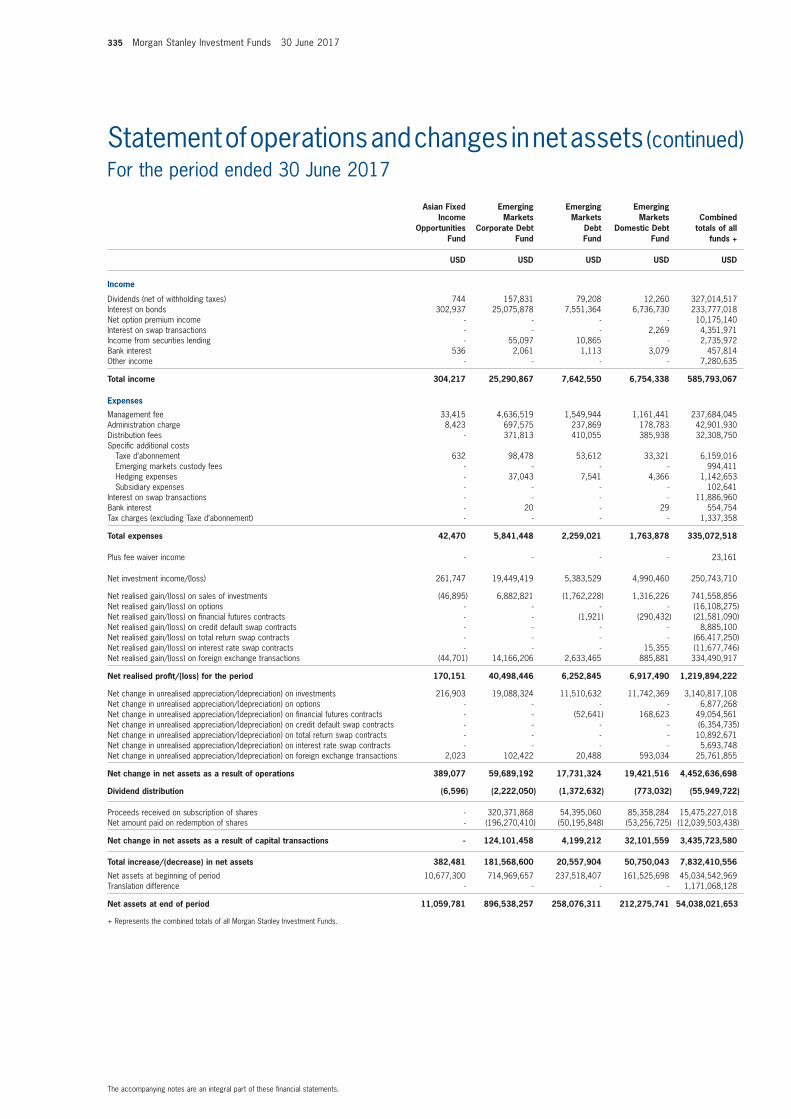
335 Morgan Stanley Investment Funds 30 June 2017
The accompanying notes are an integral part of these fi nancial statements.
Statement of operations and changes in net assets (continued)For the period ended 30 June 2017
Asian Fixed Income
Opportunities Fund
EmergingMarkets
Corporate DebtFund
Emerging Markets
Debt Fund
Emerging Markets
Domestic Debt Fund
Combined totals of all
funds +
USD USD USD USD USD
Income
Dividends (net of withholding taxes) 744 157,831 79,208 12,260 327,014,517Interest on bonds 302,937 25,075,878 7,551,364 6,736,730 233,777,018Net option premium income - - - - 10,175,140Interest on swap transactions - - - 2,269 4,351,971Income from securities lending - 55,097 10,865 - 2,735,972Bank interest 536 2,061 1,113 3,079 457,814Other income - - - - 7,280,635
Total income 304,217 25,290,867 7,642,550 6,754,338 585,793,067
Expenses
Management fee 33,415 4,636,519 1,549,944 1,161,441 237,684,045Administration charge 8,423 697,575 237,869 178,783 42,901,930Distribution fees - 371,813 410,055 385,938 32,308,750Specifi c additional costs Taxe d’abonnement 632 98,478 53,612 33,321 6,159,016 Emerging markets custody fees - - - - 994,411 Hedging expenses - 37,043 7,541 4,366 1,142,653 Subsidiary expenses - - - - 102,641Interest on swap transactions - - - - 11,886,960Bank interest - 20 - 29 554,754Tax charges (excluding Taxe d’abonnement) - - - - 1,337,358
Total expenses 42,470 5,841,448 2,259,021 1,763,878 335,072,518
Plus fee waiver income - - - - 23,161
Net investment income/(loss) 261,747 19,449,419 5,383,529 4,990,460 250,743,710
Net realised gain/(loss) on sales of investments (46,895) 6,882,821 (1,762,228) 1,316,226 741,558,856Net realised gain/(loss) on options - - - - (16,108,275)Net realised gain/(loss) on fi nancial futures contracts - - (1,921) (290,432) (21,581,090)Net realised gain/(loss) on credit default swap contracts - - - - 8,885,100Net realised gain/(loss) on total return swap contracts - - - - (66,417,250)Net realised gain/(loss) on interest rate swap contracts - - - 15,355 (11,677,746)Net realised gain/(loss) on foreign exchange transactions (44,701) 14,166,206 2,633,465 885,881 334,490,917
Net realised profi t/(loss) for the period 170,151 40,498,446 6,252,845 6,917,490 1,219,894,222
Net change in unrealised appreciation/(depreciation) on investments 216,903 19,088,324 11,510,632 11,742,369 3,140,817,108Net change in unrealised appreciation/(depreciation) on options - - - - 6,877,268Net change in unrealised appreciation/(depreciation) on fi nancial futures contracts - - (52,641) 168,623 49,054,561Net change in unrealised appreciation/(depreciation) on credit default swap contracts - - - - (6,354,735)Net change in unrealised appreciation/(depreciation) on total return swap contracts - - - - 10,892,671Net change in unrealised appreciation/(depreciation) on interest rate swap contracts - - - - 5,693,748Net change in unrealised appreciation/(depreciation) on foreign exchange transactions 2,023 102,422 20,488 593,034 25,761,855
Net change in net assets as a result of operations 389,077 59,689,192 17,731,324 19,421,516 4,452,636,698
Dividend distribution (6,596) (2,222,050) (1,372,632) (773,032) (55,949,722)
Proceeds received on subscription of shares - 320,371,868 54,395,060 85,358,284 15,475,227,018Net amount paid on redemption of shares - (196,270,410) (50,195,848) (53,256,725) (12,039,503,438)
Net change in net assets as a result of capital transactions - 124,101,458 4,199,212 32,101,559 3,435,723,580
Total increase/(decrease) in net assets 382,481 181,568,600 20,557,904 50,750,043 7,832,410,556
Net assets at beginning of period 10,677,300 714,969,657 237,518,407 161,525,698 45,034,542,969Translation difference - - - - 1,171,068,128
Net assets at end of period 11,059,781 896,538,257 258,076,311 212,275,741 54,038,021,653
+ Represents the combined totals of all Morgan Stanley Investment Funds.
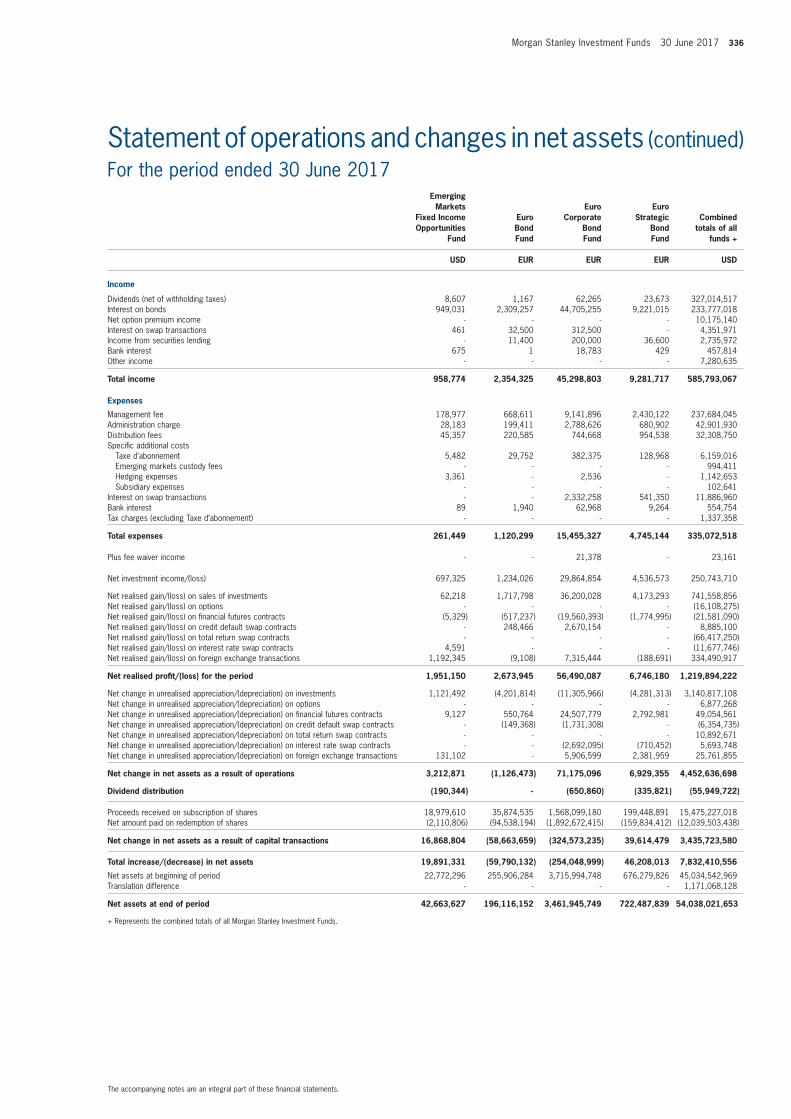
Morgan Stanley Investment Funds 30 June 2017 336
The accompanying notes are an integral part of these fi nancial statements.
Statement of operations and changes in net assets (continued)For the period ended 30 June 2017
Emerging Markets
Fixed Income Opportunities
Fund
Euro Bond Fund
Euro Corporate
Bond Fund
Euro Strategic
Bond Fund
Combined totals of all
funds +
USD EUR EUR EUR USD
Income
Dividends (net of withholding taxes) 8,607 1,167 62,265 23,673 327,014,517Interest on bonds 949,031 2,309,257 44,705,255 9,221,015 233,777,018Net option premium income - - - - 10,175,140Interest on swap transactions 461 32,500 312,500 - 4,351,971Income from securities lending - 11,400 200,000 36,600 2,735,972Bank interest 675 1 18,783 429 457,814Other income - - - - 7,280,635
Total income 958,774 2,354,325 45,298,803 9,281,717 585,793,067
Expenses
Management fee 178,977 668,611 9,141,896 2,430,122 237,684,045Administration charge 28,183 199,411 2,788,626 680,902 42,901,930Distribution fees 45,357 220,585 744,668 954,538 32,308,750Specifi c additional costs Taxe d’abonnement 5,482 29,752 382,375 128,968 6,159,016 Emerging markets custody fees - - - - 994,411 Hedging expenses 3,361 - 2,536 - 1,142,653 Subsidiary expenses - - - - 102,641Interest on swap transactions - - 2,332,258 541,350 11,886,960Bank interest 89 1,940 62,968 9,264 554,754Tax charges (excluding Taxe d’abonnement) - - - - 1,337,358
Total expenses 261,449 1,120,299 15,455,327 4,745,144 335,072,518
Plus fee waiver income - - 21,378 - 23,161
Net investment income/(loss) 697,325 1,234,026 29,864,854 4,536,573 250,743,710
Net realised gain/(loss) on sales of investments 62,218 1,717,798 36,200,028 4,173,293 741,558,856Net realised gain/(loss) on options - - - - (16,108,275)Net realised gain/(loss) on fi nancial futures contracts (5,329) (517,237) (19,560,393) (1,774,995) (21,581,090)Net realised gain/(loss) on credit default swap contracts - 248,466 2,670,154 - 8,885,100Net realised gain/(loss) on total return swap contracts - - - - (66,417,250)Net realised gain/(loss) on interest rate swap contracts 4,591 - - - (11,677,746)Net realised gain/(loss) on foreign exchange transactions 1,192,345 (9,108) 7,315,444 (188,691) 334,490,917
Net realised profi t/(loss) for the period 1,951,150 2,673,945 56,490,087 6,746,180 1,219,894,222
Net change in unrealised appreciation/(depreciation) on investments 1,121,492 (4,201,814) (11,305,966) (4,281,313) 3,140,817,108Net change in unrealised appreciation/(depreciation) on options - - - - 6,877,268Net change in unrealised appreciation/(depreciation) on fi nancial futures contracts 9,127 550,764 24,507,779 2,792,981 49,054,561Net change in unrealised appreciation/(depreciation) on credit default swap contracts - (149,368) (1,731,308) - (6,354,735)Net change in unrealised appreciation/(depreciation) on total return swap contracts - - - - 10,892,671Net change in unrealised appreciation/(depreciation) on interest rate swap contracts - - (2,692,095) (710,452) 5,693,748Net change in unrealised appreciation/(depreciation) on foreign exchange transactions 131,102 - 5,906,599 2,381,959 25,761,855
Net change in net assets as a result of operations 3,212,871 (1,126,473) 71,175,096 6,929,355 4,452,636,698
Dividend distribution (190,344) - (650,860) (335,821) (55,949,722)
Proceeds received on subscription of shares 18,979,610 35,874,535 1,568,099,180 199,448,891 15,475,227,018Net amount paid on redemption of shares (2,110,806) (94,538,194) (1,892,672,415) (159,834,412) (12,039,503,438)
Net change in net assets as a result of capital transactions 16,868,804 (58,663,659) (324,573,235) 39,614,479 3,435,723,580
Total increase/(decrease) in net assets 19,891,331 (59,790,132) (254,048,999) 46,208,013 7,832,410,556
Net assets at beginning of period 22,772,296 255,906,284 3,715,994,748 676,279,826 45,034,542,969Translation difference - - - - 1,171,068,128
Net assets at end of period 42,663,627 196,116,152 3,461,945,749 722,487,839 54,038,021,653
+ Represents the combined totals of all Morgan Stanley Investment Funds.
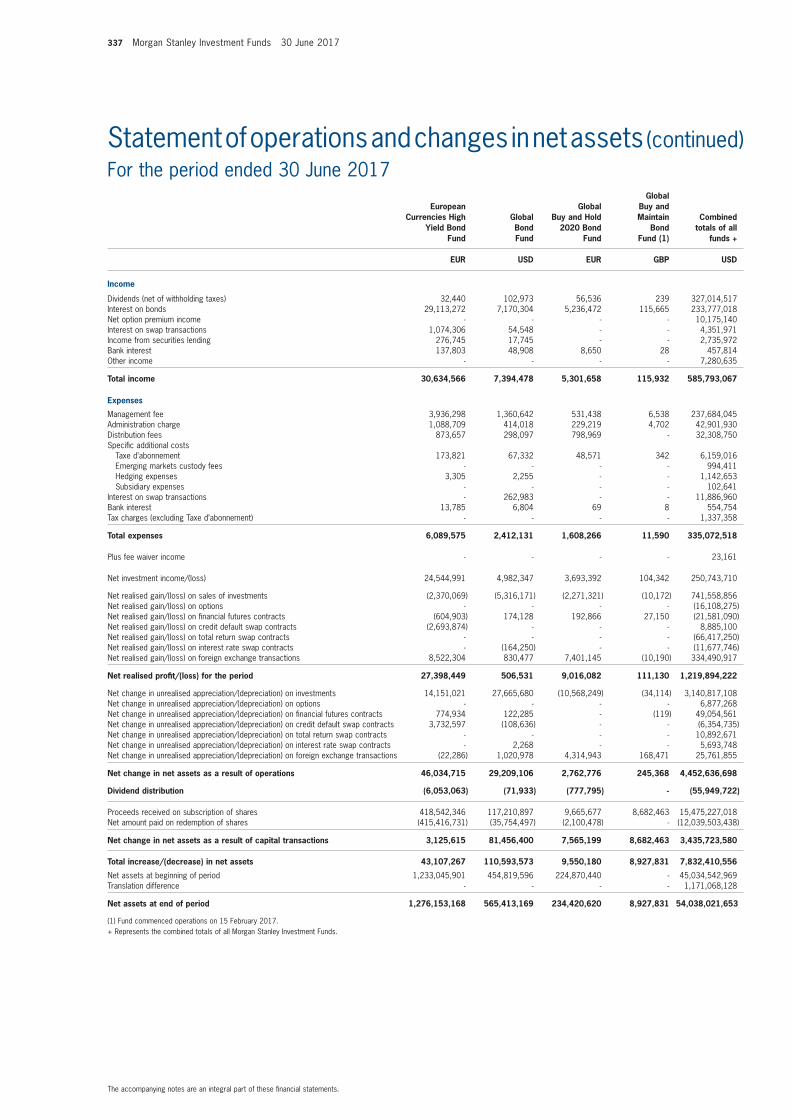
337 Morgan Stanley Investment Funds 30 June 2017
The accompanying notes are an integral part of these fi nancial statements.
Statement of operations and changes in net assets (continued)For the period ended 30 June 2017
European Currencies High
Yield Bond Fund
Global Bond Fund
Global Buy and Hold
2020 Bond Fund
Global Buy and Maintain
BondFund (1)
Combined totals of all
funds +
EUR USD EUR GBP USD
Income
Dividends (net of withholding taxes) 32,440 102,973 56,536 239 327,014,517Interest on bonds 29,113,272 7,170,304 5,236,472 115,665 233,777,018Net option premium income - - - - 10,175,140Interest on swap transactions 1,074,306 54,548 - - 4,351,971Income from securities lending 276,745 17,745 - - 2,735,972Bank interest 137,803 48,908 8,650 28 457,814Other income - - - - 7,280,635
Total income 30,634,566 7,394,478 5,301,658 115,932 585,793,067
Expenses
Management fee 3,936,298 1,360,642 531,438 6,538 237,684,045Administration charge 1,088,709 414,018 229,219 4,702 42,901,930Distribution fees 873,657 298,097 798,969 - 32,308,750Specifi c additional costs Taxe d’abonnement 173,821 67,332 48,571 342 6,159,016 Emerging markets custody fees - - - - 994,411 Hedging expenses 3,305 2,255 - - 1,142,653 Subsidiary expenses - - - - 102,641Interest on swap transactions - 262,983 - - 11,886,960Bank interest 13,785 6,804 69 8 554,754Tax charges (excluding Taxe d’abonnement) - - - - 1,337,358
Total expenses 6,089,575 2,412,131 1,608,266 11,590 335,072,518
Plus fee waiver income - - - - 23,161
Net investment income/(loss) 24,544,991 4,982,347 3,693,392 104,342 250,743,710
Net realised gain/(loss) on sales of investments (2,370,069) (5,316,171) (2,271,321) (10,172) 741,558,856Net realised gain/(loss) on options - - - - (16,108,275)Net realised gain/(loss) on fi nancial futures contracts (604,903) 174,128 192,866 27,150 (21,581,090)Net realised gain/(loss) on credit default swap contracts (2,693,874) - - - 8,885,100Net realised gain/(loss) on total return swap contracts - - - - (66,417,250)Net realised gain/(loss) on interest rate swap contracts - (164,250) - - (11,677,746)Net realised gain/(loss) on foreign exchange transactions 8,522,304 830,477 7,401,145 (10,190) 334,490,917
Net realised profi t/(loss) for the period 27,398,449 506,531 9,016,082 111,130 1,219,894,222
Net change in unrealised appreciation/(depreciation) on investments 14,151,021 27,665,680 (10,568,249) (34,114) 3,140,817,108Net change in unrealised appreciation/(depreciation) on options - - - - 6,877,268Net change in unrealised appreciation/(depreciation) on fi nancial futures contracts 774,934 122,285 - (119) 49,054,561Net change in unrealised appreciation/(depreciation) on credit default swap contracts 3,732,597 (108,636) - - (6,354,735)Net change in unrealised appreciation/(depreciation) on total return swap contracts - - - - 10,892,671Net change in unrealised appreciation/(depreciation) on interest rate swap contracts - 2,268 - - 5,693,748Net change in unrealised appreciation/(depreciation) on foreign exchange transactions (22,286) 1,020,978 4,314,943 168,471 25,761,855
Net change in net assets as a result of operations 46,034,715 29,209,106 2,762,776 245,368 4,452,636,698
Dividend distribution (6,053,063) (71,933) (777,795) - (55,949,722)
Proceeds received on subscription of shares 418,542,346 117,210,897 9,665,677 8,682,463 15,475,227,018Net amount paid on redemption of shares (415,416,731) (35,754,497) (2,100,478) - (12,039,503,438)
Net change in net assets as a result of capital transactions 3,125,615 81,456,400 7,565,199 8,682,463 3,435,723,580
Total increase/(decrease) in net assets 43,107,267 110,593,573 9,550,180 8,927,831 7,832,410,556
Net assets at beginning of period 1,233,045,901 454,819,596 224,870,440 - 45,034,542,969Translation difference - - - - 1,171,068,128
Net assets at end of period 1,276,153,168 565,413,169 234,420,620 8,927,831 54,038,021,653
(1) Fund commenced operations on 15 February 2017. + Represents the combined totals of all Morgan Stanley Investment Funds.
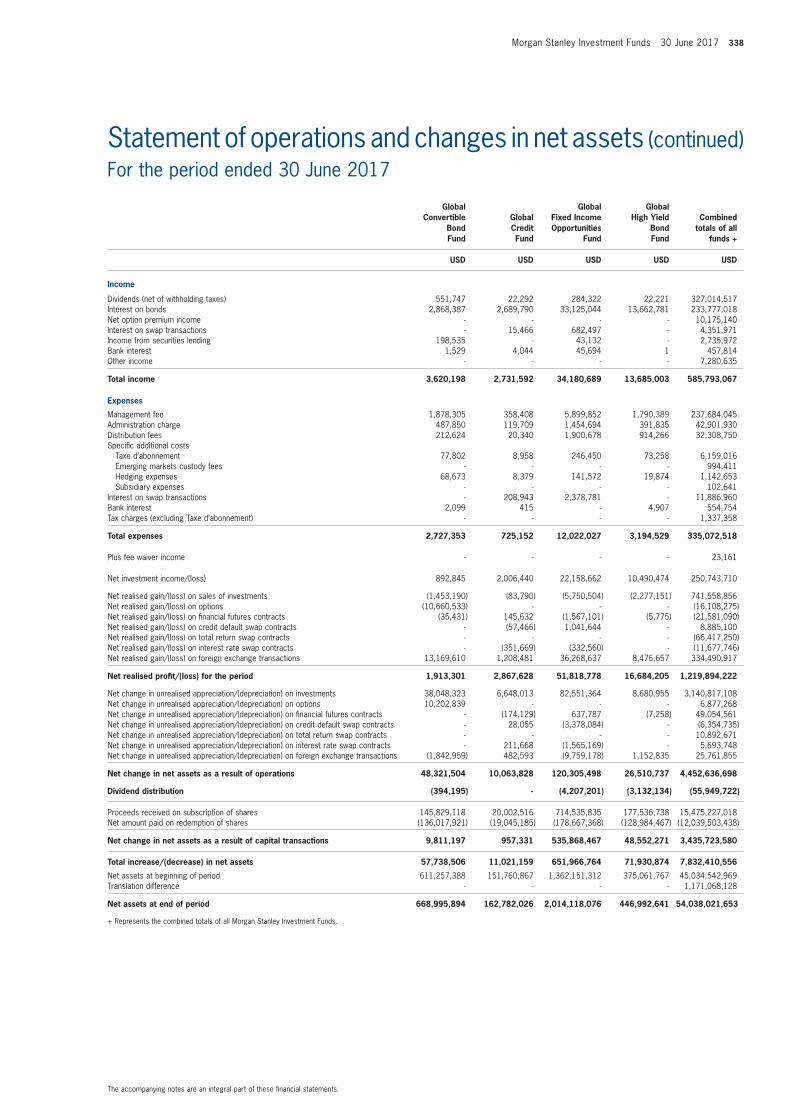
Morgan Stanley Investment Funds 30 June 2017 338
The accompanying notes are an integral part of these fi nancial statements.
Statement of operations and changes in net assets (continued)For the period ended 30 June 2017
Global Convertible
Bond Fund
Global Credit Fund
Global Fixed Income Opportunities
Fund
Global High Yield
Bond Fund
Combined totals of all
funds +
USD USD USD USD USD
Income
Dividends (net of withholding taxes) 551,747 22,292 284,322 22,221 327,014,517Interest on bonds 2,868,387 2,689,790 33,125,044 13,662,781 233,777,018Net option premium income - - - - 10,175,140Interest on swap transactions - 15,466 682,497 - 4,351,971Income from securities lending 198,535 - 43,132 - 2,735,972Bank interest 1,529 4,044 45,694 1 457,814Other income - - - - 7,280,635
Total income 3,620,198 2,731,592 34,180,689 13,685,003 585,793,067
Expenses
Management fee 1,878,305 358,408 5,899,852 1,790,389 237,684,045Administration charge 487,850 119,709 1,454,694 391,835 42,901,930Distribution fees 212,624 20,340 1,900,678 914,266 32,308,750Specifi c additional costs Taxe d’abonnement 77,802 8,958 246,450 73,258 6,159,016 Emerging markets custody fees - - - - 994,411 Hedging expenses 68,673 8,379 141,572 19,874 1,142,653 Subsidiary expenses - - - - 102,641Interest on swap transactions - 208,943 2,378,781 - 11,886,960Bank interest 2,099 415 - 4,907 554,754Tax charges (excluding Taxe d’abonnement) - - - - 1,337,358
Total expenses 2,727,353 725,152 12,022,027 3,194,529 335,072,518
Plus fee waiver income - - - - 23,161
Net investment income/(loss) 892,845 2,006,440 22,158,662 10,490,474 250,743,710
Net realised gain/(loss) on sales of investments (1,453,190) (83,790) (5,750,504) (2,277,151) 741,558,856Net realised gain/(loss) on options (10,660,533) - - - (16,108,275)Net realised gain/(loss) on fi nancial futures contracts (35,431) 145,632 (1,567,101) (5,775) (21,581,090)Net realised gain/(loss) on credit default swap contracts - (57,466) 1,041,644 - 8,885,100Net realised gain/(loss) on total return swap contracts - - - - (66,417,250)Net realised gain/(loss) on interest rate swap contracts - (351,669) (332,560) - (11,677,746)Net realised gain/(loss) on foreign exchange transactions 13,169,610 1,208,481 36,268,637 8,476,657 334,490,917
Net realised profi t/(loss) for the period 1,913,301 2,867,628 51,818,778 16,684,205 1,219,894,222
Net change in unrealised appreciation/(depreciation) on investments 38,048,323 6,648,013 82,551,364 8,680,955 3,140,817,108Net change in unrealised appreciation/(depreciation) on options 10,202,839 - - - 6,877,268Net change in unrealised appreciation/(depreciation) on fi nancial futures contracts - (174,129) 637,787 (7,258) 49,054,561Net change in unrealised appreciation/(depreciation) on credit default swap contracts - 28,055 (3,378,084) - (6,354,735)Net change in unrealised appreciation/(depreciation) on total return swap contracts - - - - 10,892,671Net change in unrealised appreciation/(depreciation) on interest rate swap contracts - 211,668 (1,565,169) - 5,693,748Net change in unrealised appreciation/(depreciation) on foreign exchange transactions (1,842,959) 482,593 (9,759,178) 1,152,835 25,761,855
Net change in net assets as a result of operations 48,321,504 10,063,828 120,305,498 26,510,737 4,452,636,698
Dividend distribution (394,195) - (4,207,201) (3,132,134) (55,949,722)
Proceeds received on subscription of shares 145,829,118 20,002,516 714,535,835 177,536,738 15,475,227,018Net amount paid on redemption of shares (136,017,921) (19,045,185) (178,667,368) (128,984,467) (12,039,503,438)
Net change in net assets as a result of capital transactions 9,811,197 957,331 535,868,467 48,552,271 3,435,723,580
Total increase/(decrease) in net assets 57,738,506 11,021,159 651,966,764 71,930,874 7,832,410,556
Net assets at beginning of period 611,257,388 151,760,867 1,362,151,312 375,061,767 45,034,542,969Translation difference - - - - 1,171,068,128
Net assets at end of period 668,995,894 162,782,026 2,014,118,076 446,992,641 54,038,021,653
+ Represents the combined totals of all Morgan Stanley Investment Funds.
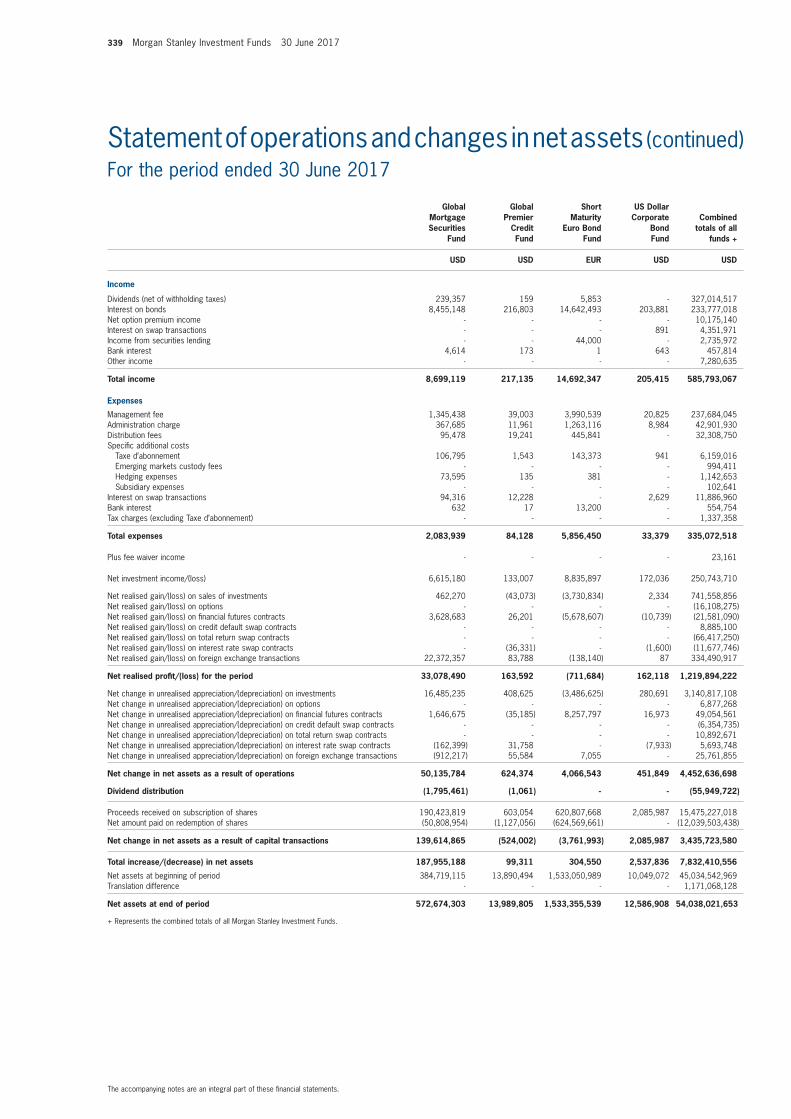
339 Morgan Stanley Investment Funds 30 June 2017
The accompanying notes are an integral part of these fi nancial statements.
Statement of operations and changes in net assets (continued)For the period ended 30 June 2017
Global Mortgage Securities
Fund
GlobalPremier
CreditFund
Short Maturity
Euro Bond Fund
US Dollar Corporate
Bond Fund
Combined totals of all
funds +
USD USD EUR USD USD
Income
Dividends (net of withholding taxes) 239,357 159 5,853 - 327,014,517Interest on bonds 8,455,148 216,803 14,642,493 203,881 233,777,018Net option premium income - - - - 10,175,140Interest on swap transactions - - - 891 4,351,971Income from securities lending - - 44,000 - 2,735,972Bank interest 4,614 173 1 643 457,814Other income - - - - 7,280,635
Total income 8,699,119 217,135 14,692,347 205,415 585,793,067
Expenses
Management fee 1,345,438 39,003 3,990,539 20,825 237,684,045Administration charge 367,685 11,961 1,263,116 8,984 42,901,930Distribution fees 95,478 19,241 445,841 - 32,308,750Specifi c additional costs Taxe d’abonnement 106,795 1,543 143,373 941 6,159,016 Emerging markets custody fees - - - - 994,411 Hedging expenses 73,595 135 381 - 1,142,653 Subsidiary expenses - - - - 102,641Interest on swap transactions 94,316 12,228 - 2,629 11,886,960Bank interest 632 17 13,200 - 554,754Tax charges (excluding Taxe d’abonnement) - - - - 1,337,358
Total expenses 2,083,939 84,128 5,856,450 33,379 335,072,518
Plus fee waiver income - - - - 23,161
Net investment income/(loss) 6,615,180 133,007 8,835,897 172,036 250,743,710
Net realised gain/(loss) on sales of investments 462,270 (43,073) (3,730,834) 2,334 741,558,856Net realised gain/(loss) on options - - - - (16,108,275)Net realised gain/(loss) on fi nancial futures contracts 3,628,683 26,201 (5,678,607) (10,739) (21,581,090)Net realised gain/(loss) on credit default swap contracts - - - - 8,885,100Net realised gain/(loss) on total return swap contracts - - - - (66,417,250)Net realised gain/(loss) on interest rate swap contracts - (36,331) - (1,600) (11,677,746)Net realised gain/(loss) on foreign exchange transactions 22,372,357 83,788 (138,140) 87 334,490,917
Net realised profi t/(loss) for the period 33,078,490 163,592 (711,684) 162,118 1,219,894,222
Net change in unrealised appreciation/(depreciation) on investments 16,485,235 408,625 (3,486,625) 280,691 3,140,817,108Net change in unrealised appreciation/(depreciation) on options - - - - 6,877,268Net change in unrealised appreciation/(depreciation) on fi nancial futures contracts 1,646,675 (35,185) 8,257,797 16,973 49,054,561Net change in unrealised appreciation/(depreciation) on credit default swap contracts - - - - (6,354,735)Net change in unrealised appreciation/(depreciation) on total return swap contracts - - - - 10,892,671Net change in unrealised appreciation/(depreciation) on interest rate swap contracts (162,399) 31,758 - (7,933) 5,693,748Net change in unrealised appreciation/(depreciation) on foreign exchange transactions (912,217) 55,584 7,055 - 25,761,855
Net change in net assets as a result of operations 50,135,784 624,374 4,066,543 451,849 4,452,636,698
Dividend distribution (1,795,461) (1,061) - - (55,949,722)
Proceeds received on subscription of shares 190,423,819 603,054 620,807,668 2,085,987 15,475,227,018Net amount paid on redemption of shares (50,808,954) (1,127,056) (624,569,661) - (12,039,503,438)
Net change in net assets as a result of capital transactions 139,614,865 (524,002) (3,761,993) 2,085,987 3,435,723,580
Total increase/(decrease) in net assets 187,955,188 99,311 304,550 2,537,836 7,832,410,556
Net assets at beginning of period 384,719,115 13,890,494 1,533,050,989 10,049,072 45,034,542,969Translation difference - - - - 1,171,068,128
Net assets at end of period 572,674,303 13,989,805 1,533,355,539 12,586,908 54,038,021,653
+ Represents the combined totals of all Morgan Stanley Investment Funds.
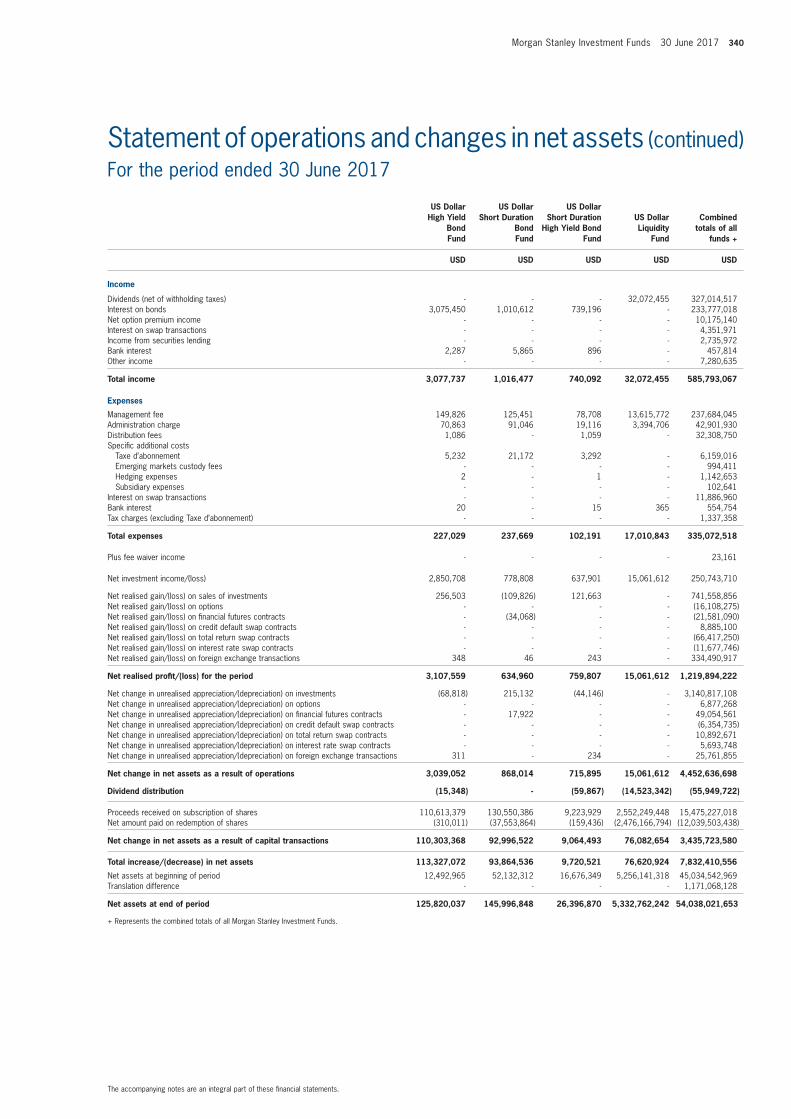
Morgan Stanley Investment Funds 30 June 2017 340
The accompanying notes are an integral part of these fi nancial statements.
Statement of operations and changes in net assets (continued)For the period ended 30 June 2017
US Dollar High Yield
Bond Fund
US Dollar Short Duration
Bond Fund
US Dollar Short Duration
High Yield Bond Fund
US Dollar Liquidity
Fund
Combined totals of all
funds +
USD USD USD USD USD
Income
Dividends (net of withholding taxes) - - - 32,072,455 327,014,517Interest on bonds 3,075,450 1,010,612 739,196 - 233,777,018Net option premium income - - - - 10,175,140Interest on swap transactions - - - - 4,351,971Income from securities lending - - - - 2,735,972Bank interest 2,287 5,865 896 - 457,814Other income - - - - 7,280,635
Total income 3,077,737 1,016,477 740,092 32,072,455 585,793,067
Expenses
Management fee 149,826 125,451 78,708 13,615,772 237,684,045Administration charge 70,863 91,046 19,116 3,394,706 42,901,930Distribution fees 1,086 - 1,059 - 32,308,750Specifi c additional costs Taxe d’abonnement 5,232 21,172 3,292 - 6,159,016 Emerging markets custody fees - - - - 994,411 Hedging expenses 2 - 1 - 1,142,653 Subsidiary expenses - - - - 102,641Interest on swap transactions - - - - 11,886,960Bank interest 20 - 15 365 554,754Tax charges (excluding Taxe d’abonnement) - - - - 1,337,358
Total expenses 227,029 237,669 102,191 17,010,843 335,072,518
Plus fee waiver income - - - - 23,161
Net investment income/(loss) 2,850,708 778,808 637,901 15,061,612 250,743,710
Net realised gain/(loss) on sales of investments 256,503 (109,826) 121,663 - 741,558,856Net realised gain/(loss) on options - - - - (16,108,275)Net realised gain/(loss) on fi nancial futures contracts - (34,068) - - (21,581,090)Net realised gain/(loss) on credit default swap contracts - - - - 8,885,100Net realised gain/(loss) on total return swap contracts - - - - (66,417,250)Net realised gain/(loss) on interest rate swap contracts - - - - (11,677,746)Net realised gain/(loss) on foreign exchange transactions 348 46 243 - 334,490,917
Net realised profi t/(loss) for the period 3,107,559 634,960 759,807 15,061,612 1,219,894,222
Net change in unrealised appreciation/(depreciation) on investments (68,818) 215,132 (44,146) - 3,140,817,108Net change in unrealised appreciation/(depreciation) on options - - - - 6,877,268Net change in unrealised appreciation/(depreciation) on fi nancial futures contracts - 17,922 - - 49,054,561Net change in unrealised appreciation/(depreciation) on credit default swap contracts - - - - (6,354,735)Net change in unrealised appreciation/(depreciation) on total return swap contracts - - - - 10,892,671Net change in unrealised appreciation/(depreciation) on interest rate swap contracts - - - - 5,693,748Net change in unrealised appreciation/(depreciation) on foreign exchange transactions 311 - 234 - 25,761,855
Net change in net assets as a result of operations 3,039,052 868,014 715,895 15,061,612 4,452,636,698
Dividend distribution (15,348) - (59,867) (14,523,342) (55,949,722)
Proceeds received on subscription of shares 110,613,379 130,550,386 9,223,929 2,552,249,448 15,475,227,018Net amount paid on redemption of shares (310,011) (37,553,864) (159,436) (2,476,166,794) (12,039,503,438)
Net change in net assets as a result of capital transactions 110,303,368 92,996,522 9,064,493 76,082,654 3,435,723,580
Total increase/(decrease) in net assets 113,327,072 93,864,536 9,720,521 76,620,924 7,832,410,556
Net assets at beginning of period 12,492,965 52,132,312 16,676,349 5,256,141,318 45,034,542,969Translation difference - - - - 1,171,068,128
Net assets at end of period 125,820,037 145,996,848 26,396,870 5,332,762,242 54,038,021,653
+ Represents the combined totals of all Morgan Stanley Investment Funds.
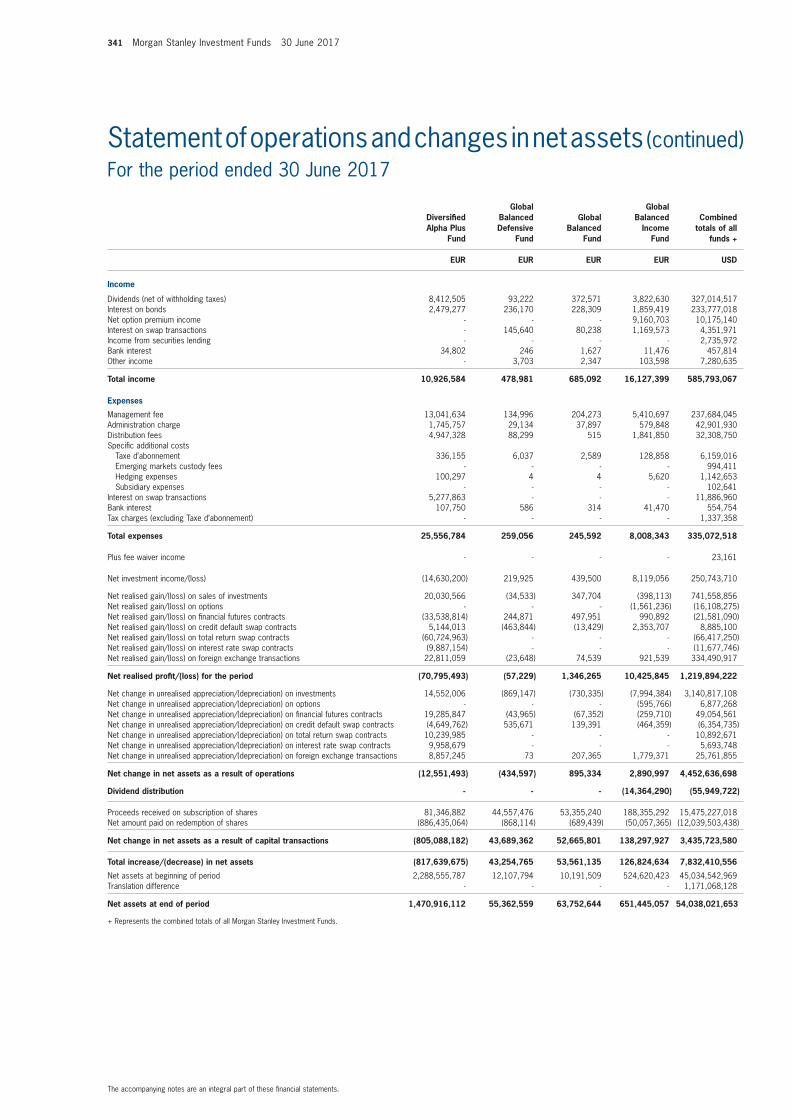
341 Morgan Stanley Investment Funds 30 June 2017
The accompanying notes are an integral part of these fi nancial statements.
Statement of operations and changes in net assets (continued)For the period ended 30 June 2017
Diversifi ed Alpha Plus
Fund
Global Balanced Defensive
Fund
Global Balanced
Fund
Global Balanced
Income Fund
Combined totals of all
funds +
EUR EUR EUR EUR USD
Income
Dividends (net of withholding taxes) 8,412,505 93,222 372,571 3,822,630 327,014,517Interest on bonds 2,479,277 236,170 228,309 1,859,419 233,777,018Net option premium income - - - 9,160,703 10,175,140Interest on swap transactions - 145,640 80,238 1,169,573 4,351,971Income from securities lending - - - - 2,735,972Bank interest 34,802 246 1,627 11,476 457,814Other income - 3,703 2,347 103,598 7,280,635
Total income 10,926,584 478,981 685,092 16,127,399 585,793,067
Expenses
Management fee 13,041,634 134,996 204,273 5,410,697 237,684,045Administration charge 1,745,757 29,134 37,897 579,848 42,901,930Distribution fees 4,947,328 88,299 515 1,841,850 32,308,750Specifi c additional costs Taxe d’abonnement 336,155 6,037 2,589 128,858 6,159,016 Emerging markets custody fees - - - - 994,411 Hedging expenses 100,297 4 4 5,620 1,142,653 Subsidiary expenses - - - - 102,641Interest on swap transactions 5,277,863 - - - 11,886,960Bank interest 107,750 586 314 41,470 554,754Tax charges (excluding Taxe d’abonnement) - - - - 1,337,358
Total expenses 25,556,784 259,056 245,592 8,008,343 335,072,518
Plus fee waiver income - - - - 23,161
Net investment income/(loss) (14,630,200) 219,925 439,500 8,119,056 250,743,710
Net realised gain/(loss) on sales of investments 20,030,566 (34,533) 347,704 (398,113) 741,558,856Net realised gain/(loss) on options - - - (1,561,236) (16,108,275)Net realised gain/(loss) on fi nancial futures contracts (33,538,814) 244,871 497,951 990,892 (21,581,090)Net realised gain/(loss) on credit default swap contracts 5,144,013 (463,844) (13,429) 2,353,707 8,885,100Net realised gain/(loss) on total return swap contracts (60,724,963) - - - (66,417,250)Net realised gain/(loss) on interest rate swap contracts (9,887,154) - - - (11,677,746)Net realised gain/(loss) on foreign exchange transactions 22,811,059 (23,648) 74,539 921,539 334,490,917
Net realised profi t/(loss) for the period (70,795,493) (57,229) 1,346,265 10,425,845 1,219,894,222
Net change in unrealised appreciation/(depreciation) on investments 14,552,006 (869,147) (730,335) (7,994,384) 3,140,817,108Net change in unrealised appreciation/(depreciation) on options - - - (595,766) 6,877,268Net change in unrealised appreciation/(depreciation) on fi nancial futures contracts 19,285,847 (43,965) (67,352) (259,710) 49,054,561Net change in unrealised appreciation/(depreciation) on credit default swap contracts (4,649,762) 535,671 139,391 (464,359) (6,354,735)Net change in unrealised appreciation/(depreciation) on total return swap contracts 10,239,985 - - - 10,892,671Net change in unrealised appreciation/(depreciation) on interest rate swap contracts 9,958,679 - - - 5,693,748Net change in unrealised appreciation/(depreciation) on foreign exchange transactions 8,857,245 73 207,365 1,779,371 25,761,855
Net change in net assets as a result of operations (12,551,493) (434,597) 895,334 2,890,997 4,452,636,698
Dividend distribution - - - (14,364,290) (55,949,722)
Proceeds received on subscription of shares 81,346,882 44,557,476 53,355,240 188,355,292 15,475,227,018Net amount paid on redemption of shares (886,435,064) (868,114) (689,439) (50,057,365) (12,039,503,438)
Net change in net assets as a result of capital transactions (805,088,182) 43,689,362 52,665,801 138,297,927 3,435,723,580
Total increase/(decrease) in net assets (817,639,675) 43,254,765 53,561,135 126,824,634 7,832,410,556
Net assets at beginning of period 2,288,555,787 12,107,794 10,191,509 524,620,423 45,034,542,969Translation difference - - - - 1,171,068,128
Net assets at end of period 1,470,916,112 55,362,559 63,752,644 651,445,057 54,038,021,653
+ Represents the combined totals of all Morgan Stanley Investment Funds.
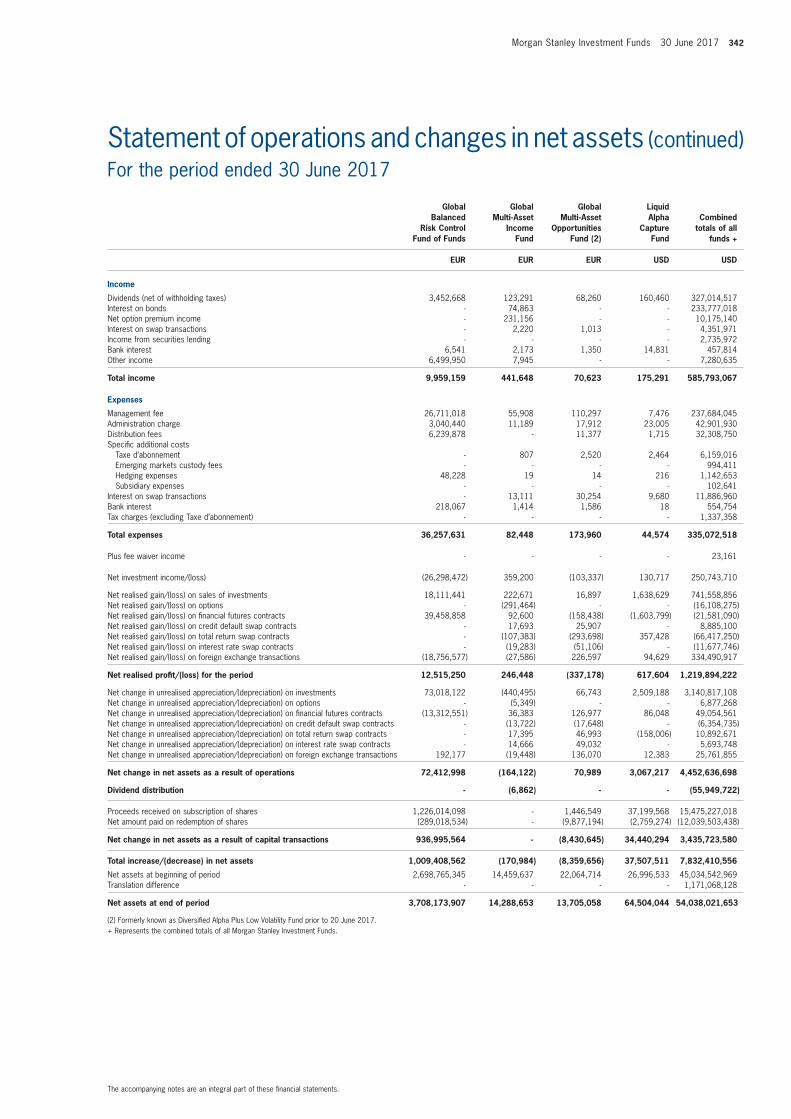
Morgan Stanley Investment Funds 30 June 2017 342
The accompanying notes are an integral part of these fi nancial statements.
Statement of operations and changes in net assets (continued)For the period ended 30 June 2017
Global Balanced
Risk Control Fund of Funds
Global Multi-Asset
Income Fund
GlobalMulti-Asset
OpportunitiesFund (2)
Liquid Alpha
Capture Fund
Combined totals of all
funds +
EUR EUR EUR USD USD
Income
Dividends (net of withholding taxes) 3,452,668 123,291 68,260 160,460 327,014,517Interest on bonds - 74,863 - - 233,777,018Net option premium income - 231,156 - - 10,175,140Interest on swap transactions - 2,220 1,013 - 4,351,971Income from securities lending - - - - 2,735,972Bank interest 6,541 2,173 1,350 14,831 457,814Other income 6,499,950 7,945 - - 7,280,635
Total income 9,959,159 441,648 70,623 175,291 585,793,067
Expenses
Management fee 26,711,018 55,908 110,297 7,476 237,684,045Administration charge 3,040,440 11,189 17,912 23,005 42,901,930Distribution fees 6,239,878 - 11,377 1,715 32,308,750Specifi c additional costs Taxe d’abonnement - 807 2,520 2,464 6,159,016 Emerging markets custody fees - - - - 994,411 Hedging expenses 48,228 19 14 216 1,142,653 Subsidiary expenses - - - - 102,641Interest on swap transactions - 13,111 30,254 9,680 11,886,960Bank interest 218,067 1,414 1,586 18 554,754Tax charges (excluding Taxe d’abonnement) - - - - 1,337,358
Total expenses 36,257,631 82,448 173,960 44,574 335,072,518
Plus fee waiver income - - - - 23,161
Net investment income/(loss) (26,298,472) 359,200 (103,337) 130,717 250,743,710
Net realised gain/(loss) on sales of investments 18,111,441 222,671 16,897 1,638,629 741,558,856Net realised gain/(loss) on options - (291,464) - - (16,108,275)Net realised gain/(loss) on fi nancial futures contracts 39,458,858 92,600 (158,438) (1,603,799) (21,581,090)Net realised gain/(loss) on credit default swap contracts - 17,693 25,907 - 8,885,100Net realised gain/(loss) on total return swap contracts - (107,383) (293,698) 357,428 (66,417,250)Net realised gain/(loss) on interest rate swap contracts - (19,283) (51,106) - (11,677,746)Net realised gain/(loss) on foreign exchange transactions (18,756,577) (27,586) 226,597 94,629 334,490,917
Net realised profi t/(loss) for the period 12,515,250 246,448 (337,178) 617,604 1,219,894,222
Net change in unrealised appreciation/(depreciation) on investments 73,018,122 (440,495) 66,743 2,509,188 3,140,817,108Net change in unrealised appreciation/(depreciation) on options - (5,349) - - 6,877,268Net change in unrealised appreciation/(depreciation) on fi nancial futures contracts (13,312,551) 36,383 126,977 86,048 49,054,561Net change in unrealised appreciation/(depreciation) on credit default swap contracts - (13,722) (17,648) - (6,354,735)Net change in unrealised appreciation/(depreciation) on total return swap contracts - 17,395 46,993 (158,006) 10,892,671Net change in unrealised appreciation/(depreciation) on interest rate swap contracts - 14,666 49,032 - 5,693,748Net change in unrealised appreciation/(depreciation) on foreign exchange transactions 192,177 (19,448) 136,070 12,383 25,761,855
Net change in net assets as a result of operations 72,412,998 (164,122) 70,989 3,067,217 4,452,636,698
Dividend distribution - (6,862) - - (55,949,722)
Proceeds received on subscription of shares 1,226,014,098 - 1,446,549 37,199,568 15,475,227,018Net amount paid on redemption of shares (289,018,534) - (9,877,194) (2,759,274) (12,039,503,438)
Net change in net assets as a result of capital transactions 936,995,564 - (8,430,645) 34,440,294 3,435,723,580
Total increase/(decrease) in net assets 1,009,408,562 (170,984) (8,359,656) 37,507,511 7,832,410,556
Net assets at beginning of period 2,698,765,345 14,459,637 22,064,714 26,996,533 45,034,542,969Translation difference - - - - 1,171,068,128
Net assets at end of period 3,708,173,907 14,288,653 13,705,058 64,504,044 54,038,021,653
(2) Formerly known as Diversifi ed Alpha Plus Low Volatility Fund prior to 20 June 2017.+ Represents the combined totals of all Morgan Stanley Investment Funds.
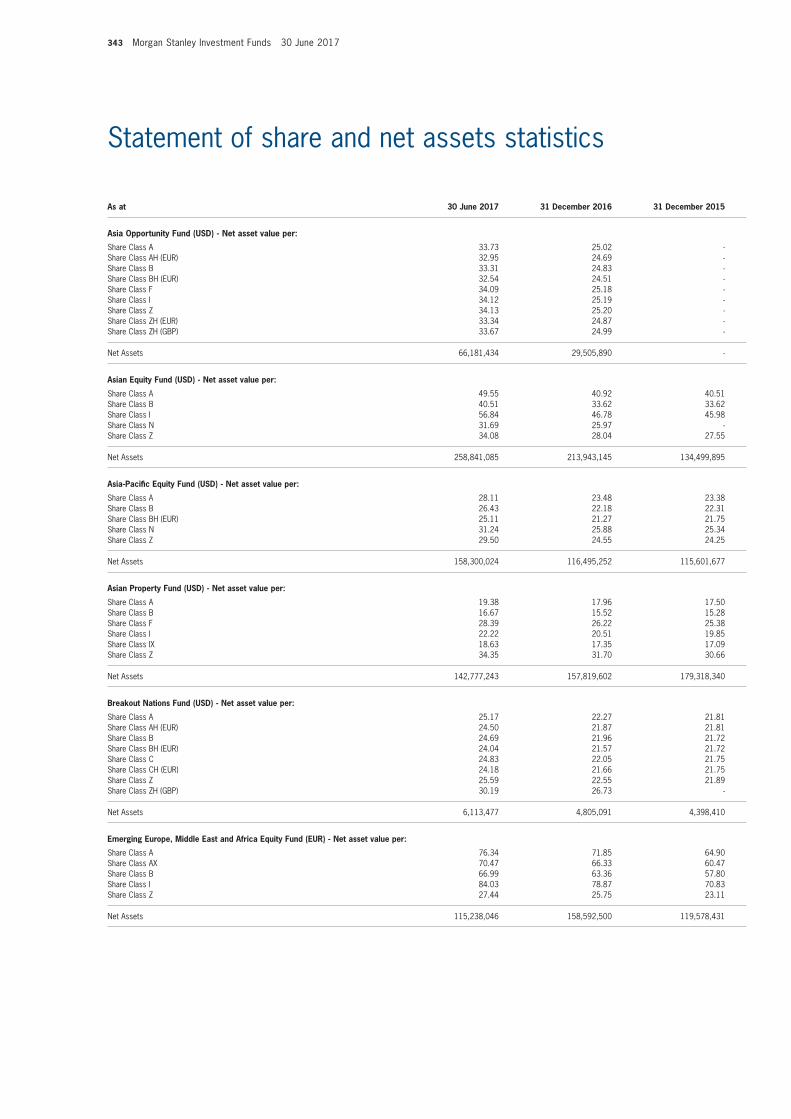
343 Morgan Stanley Investment Funds 30 June 2017
Statement of share and net assets statistics
As at 30 June 2017 31 December 2016 31 December 2015
Asia Opportunity Fund (USD) - Net asset value per:
Share Class A 33.73 25.02 -Share Class AH (EUR) 32.95 24.69 -Share Class B 33.31 24.83 -Share Class BH (EUR) 32.54 24.51 -Share Class F 34.09 25.18 -Share Class I 34.12 25.19 -Share Class Z 34.13 25.20 -Share Class ZH (EUR) 33.34 24.87 -Share Class ZH (GBP) 33.67 24.99 -
Net Assets 66,181,434 29,505,890 -
Asian Equity Fund (USD) - Net asset value per:
Share Class A 49.55 40.92 40.51Share Class B 40.51 33.62 33.62Share Class I 56.84 46.78 45.98Share Class N 31.69 25.97 -Share Class Z 34.08 28.04 27.55
Net Assets 258,841,085 213,943,145 134,499,895
Asia-Pacifi c Equity Fund (USD) - Net asset value per:
Share Class A 28.11 23.48 23.38Share Class B 26.43 22.18 22.31Share Class BH (EUR) 25.11 21.27 21.75Share Class N 31.24 25.88 25.34Share Class Z 29.50 24.55 24.25
Net Assets 158,300,024 116,495,252 115,601,677
Asian Property Fund (USD) - Net asset value per:
Share Class A 19.38 17.96 17.50Share Class B 16.67 15.52 15.28Share Class F 28.39 26.22 25.38Share Class I 22.22 20.51 19.85Share Class IX 18.63 17.35 17.09Share Class Z 34.35 31.70 30.66
Net Assets 142,777,243 157,819,602 179,318,340
Breakout Nations Fund (USD) - Net asset value per:
Share Class A 25.17 22.27 21.81Share Class AH (EUR) 24.50 21.87 21.81Share Class B 24.69 21.96 21.72Share Class BH (EUR) 24.04 21.57 21.72Share Class C 24.83 22.05 21.75Share Class CH (EUR) 24.18 21.66 21.75Share Class Z 25.59 22.55 21.89Share Class ZH (GBP) 30.19 26.73 -
Net Assets 6,113,477 4,805,091 4,398,410
Emerging Europe, Middle East and Africa Equity Fund (EUR) - Net asset value per:
Share Class A 76.34 71.85 64.90Share Class AX 70.47 66.33 60.47Share Class B 66.99 63.36 57.80Share Class I 84.03 78.87 70.83Share Class Z 27.44 25.75 23.11
Net Assets 115,238,046 158,592,500 119,578,431
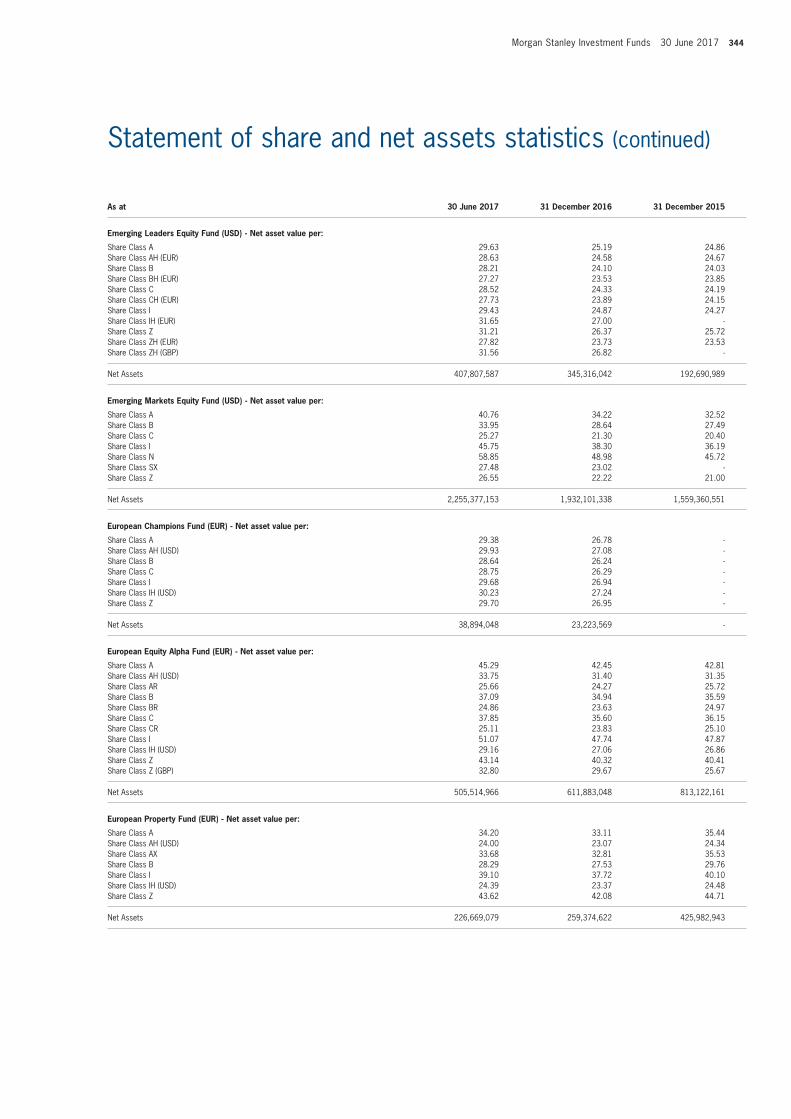
Morgan Stanley Investment Funds 30 June 2017 344
Statement of share and net assets statistics (continued)
As at 30 June 2017 31 December 2016 31 December 2015
Emerging Leaders Equity Fund (USD) - Net asset value per:
Share Class A 29.63 25.19 24.86Share Class AH (EUR) 28.63 24.58 24.67Share Class B 28.21 24.10 24.03Share Class BH (EUR) 27.27 23.53 23.85Share Class C 28.52 24.33 24.19Share Class CH (EUR) 27.73 23.89 24.15Share Class I 29.43 24.87 24.27Share Class IH (EUR) 31.65 27.00 -Share Class Z 31.21 26.37 25.72Share Class ZH (EUR) 27.82 23.73 23.53Share Class ZH (GBP) 31.56 26.82 -
Net Assets 407,807,587 345,316,042 192,690,989
Emerging Markets Equity Fund (USD) - Net asset value per:
Share Class A 40.76 34.22 32.52Share Class B 33.95 28.64 27.49Share Class C 25.27 21.30 20.40Share Class I 45.75 38.30 36.19Share Class N 58.85 48.98 45.72Share Class SX 27.48 23.02 -Share Class Z 26.55 22.22 21.00
Net Assets 2,255,377,153 1,932,101,338 1,559,360,551
European Champions Fund (EUR) - Net asset value per:
Share Class A 29.38 26.78 -Share Class AH (USD) 29.93 27.08 -Share Class B 28.64 26.24 -Share Class C 28.75 26.29 -Share Class I 29.68 26.94 -Share Class IH (USD) 30.23 27.24 -Share Class Z 29.70 26.95 -
Net Assets 38,894,048 23,223,569 -
European Equity Alpha Fund (EUR) - Net asset value per:
Share Class A 45.29 42.45 42.81Share Class AH (USD) 33.75 31.40 31.35Share Class AR 25.66 24.27 25.72Share Class B 37.09 34.94 35.59Share Class BR 24.86 23.63 24.97Share Class C 37.85 35.60 36.15Share Class CR 25.11 23.83 25.10Share Class I 51.07 47.74 47.87Share Class IH (USD) 29.16 27.06 26.86Share Class Z 43.14 40.32 40.41Share Class Z (GBP) 32.80 29.67 25.67
Net Assets 505,514,966 611,883,048 813,122,161
European Property Fund (EUR) - Net asset value per:
Share Class A 34.20 33.11 35.44Share Class AH (USD) 24.00 23.07 24.34Share Class AX 33.68 32.81 35.53Share Class B 28.29 27.53 29.76Share Class I 39.10 37.72 40.10Share Class IH (USD) 24.39 23.37 24.48Share Class Z 43.62 42.08 44.71
Net Assets 226,669,079 259,374,622 425,982,943
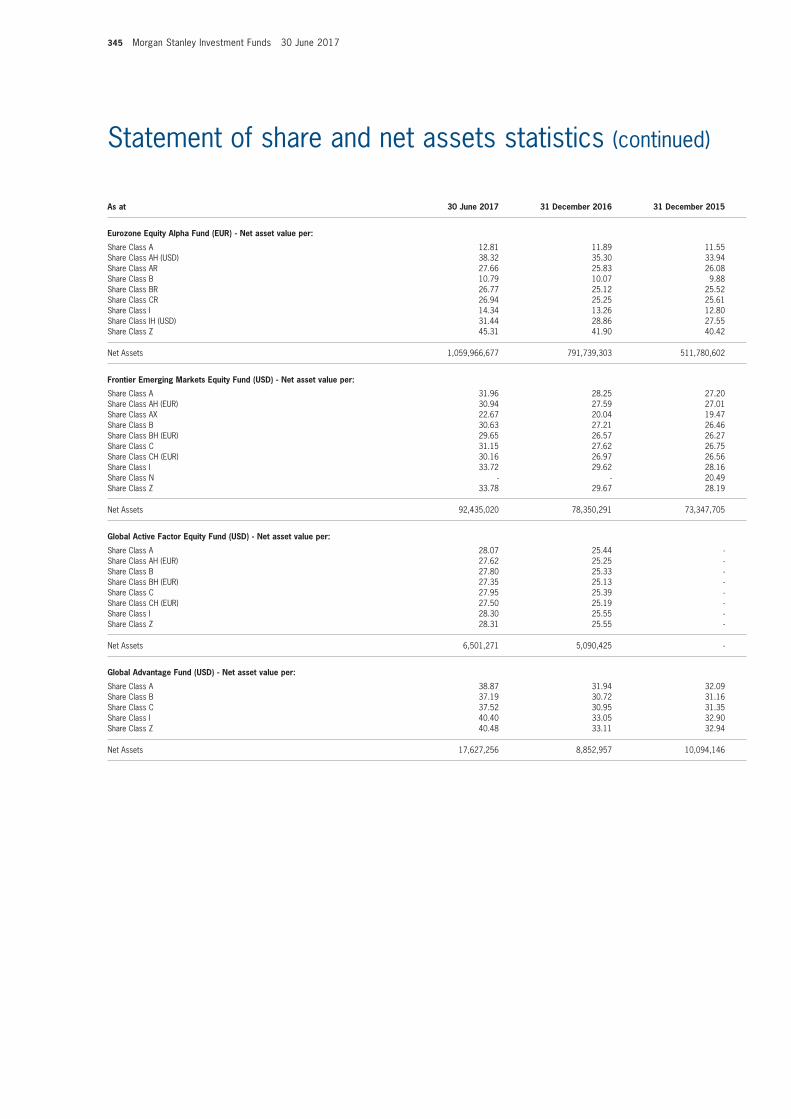
345 Morgan Stanley Investment Funds 30 June 2017
Statement of share and net assets statistics (continued)
As at 30 June 2017 31 December 2016 31 December 2015
Eurozone Equity Alpha Fund (EUR) - Net asset value per:
Share Class A 12.81 11.89 11.55Share Class AH (USD) 38.32 35.30 33.94Share Class AR 27.66 25.83 26.08Share Class B 10.79 10.07 9.88Share Class BR 26.77 25.12 25.52Share Class CR 26.94 25.25 25.61Share Class I 14.34 13.26 12.80Share Class IH (USD) 31.44 28.86 27.55Share Class Z 45.31 41.90 40.42
Net Assets 1,059,966,677 791,739,303 511,780,602
Frontier Emerging Markets Equity Fund (USD) - Net asset value per:
Share Class A 31.96 28.25 27.20Share Class AH (EUR) 30.94 27.59 27.01Share Class AX 22.67 20.04 19.47Share Class B 30.63 27.21 26.46Share Class BH (EUR) 29.65 26.57 26.27Share Class C 31.15 27.62 26.75Share Class CH (EUR) 30.16 26.97 26.56Share Class I 33.72 29.62 28.16Share Class N - - 20.49Share Class Z 33.78 29.67 28.19
Net Assets 92,435,020 78,350,291 73,347,705
Global Active Factor Equity Fund (USD) - Net asset value per:
Share Class A 28.07 25.44 -Share Class AH (EUR) 27.62 25.25 -Share Class B 27.80 25.33 -Share Class BH (EUR) 27.35 25.13 -Share Class C 27.95 25.39 -Share Class CH (EUR) 27.50 25.19 -Share Class I 28.30 25.55 -Share Class Z 28.31 25.55 -
Net Assets 6,501,271 5,090,425 -
Global Advantage Fund (USD) - Net asset value per:
Share Class A 38.87 31.94 32.09Share Class B 37.19 30.72 31.16Share Class C 37.52 30.95 31.35Share Class I 40.40 33.05 32.90Share Class Z 40.48 33.11 32.94
Net Assets 17,627,256 8,852,957 10,094,146
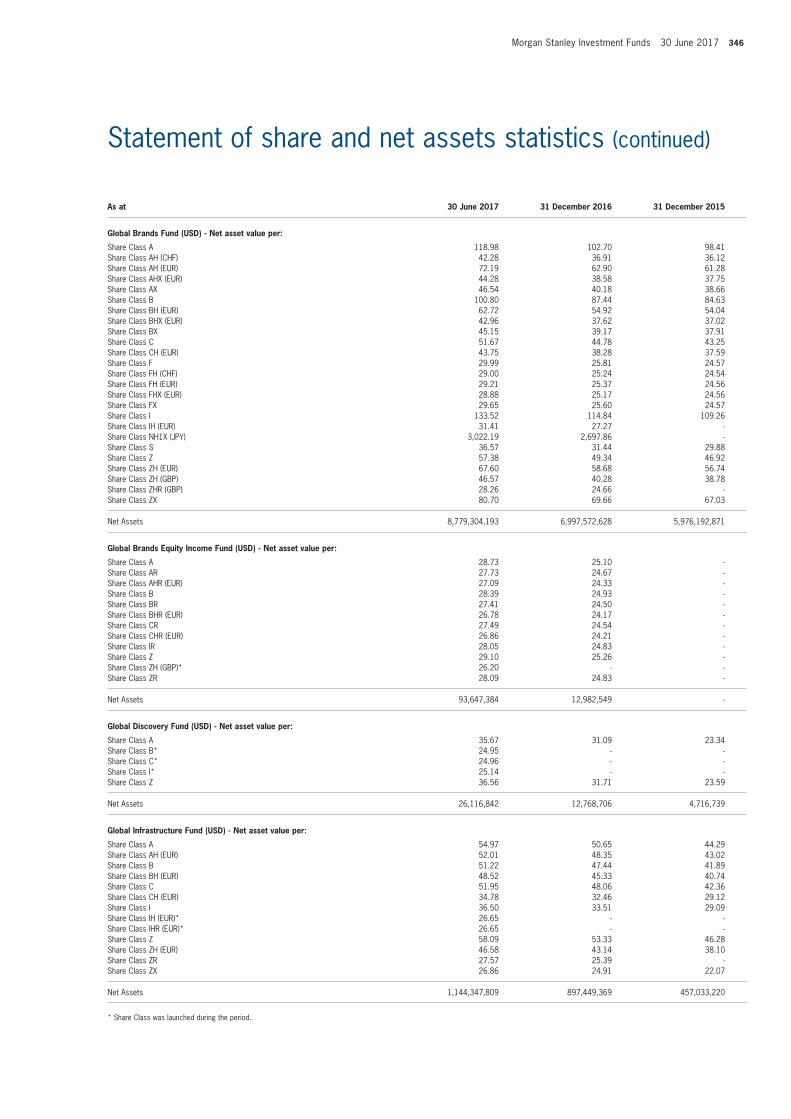
Morgan Stanley Investment Funds 30 June 2017 346
Statement of share and net assets statistics (continued)
As at 30 June 2017 31 December 2016 31 December 2015
Global Brands Fund (USD) - Net asset value per:
Share Class A 118.98 102.70 98.41Share Class AH (CHF) 42.28 36.91 36.12Share Class AH (EUR) 72.19 62.90 61.28Share Class AHX (EUR) 44.28 38.58 37.75Share Class AX 46.54 40.18 38.66Share Class B 100.80 87.44 84.63Share Class BH (EUR) 62.72 54.92 54.04Share Class BHX (EUR) 42.96 37.62 37.02Share Class BX 45.15 39.17 37.91Share Class C 51.67 44.78 43.25Share Class CH (EUR) 43.75 38.28 37.59Share Class F 29.99 25.81 24.57Share Class FH (CHF) 29.00 25.24 24.54Share Class FH (EUR) 29.21 25.37 24.56Share Class FHX (EUR) 28.88 25.17 24.56Share Class FX 29.65 25.60 24.57Share Class I 133.52 114.84 109.26Share Class IH (EUR) 31.41 27.27 -Share Class NH1X (JPY) 3,022.19 2,697.86 -Share Class S 36.57 31.44 29.88Share Class Z 57.38 49.34 46.92Share Class ZH (EUR) 67.60 58.68 56.74Share Class ZH (GBP) 46.57 40.28 38.78Share Class ZHR (GBP) 28.26 24.66 -Share Class ZX 80.70 69.66 67.03
Net Assets 8,779,304,193 6,997,572,628 5,976,192,871
Global Brands Equity Income Fund (USD) - Net asset value per:
Share Class A 28.73 25.10 -Share Class AR 27.73 24.67 -Share Class AHR (EUR) 27.09 24.33 -Share Class B 28.39 24.93 -Share Class BR 27.41 24.50 -Share Class BHR (EUR) 26.78 24.17 -Share Class CR 27.49 24.54 -Share Class CHR (EUR) 26.86 24.21 -Share Class IR 28.05 24.83 -Share Class Z 29.10 25.26 -Share Class ZH (GBP)* 26.20 - -Share Class ZR 28.09 24.83 -
Net Assets 93,647,384 12,982,549 -
Global Discovery Fund (USD) - Net asset value per:
Share Class A 35.67 31.09 23.34Share Class B* 24.95 - -Share Class C* 24.96 - -Share Class I* 25.14 - -Share Class Z 36.56 31.71 23.59
Net Assets 26,116,842 12,768,706 4,716,739
Global Infrastructure Fund (USD) - Net asset value per:
Share Class A 54.97 50.65 44.29Share Class AH (EUR) 52.01 48.35 43.02Share Class B 51.22 47.44 41.89Share Class BH (EUR) 48.52 45.33 40.74Share Class C 51.95 48.06 42.36Share Class CH (EUR) 34.78 32.46 29.12Share Class I 36.50 33.51 29.09Share Class IH (EUR)* 26.65 - -Share Class IHR (EUR)* 26.65 - -Share Class Z 58.09 53.33 46.28Share Class ZH (EUR) 46.58 43.14 38.10Share Class ZR 27.57 25.39 -Share Class ZX 26.86 24.91 22.07
Net Assets 1,144,347,809 897,449,369 457,033,220
* Share Class was launched during the period.
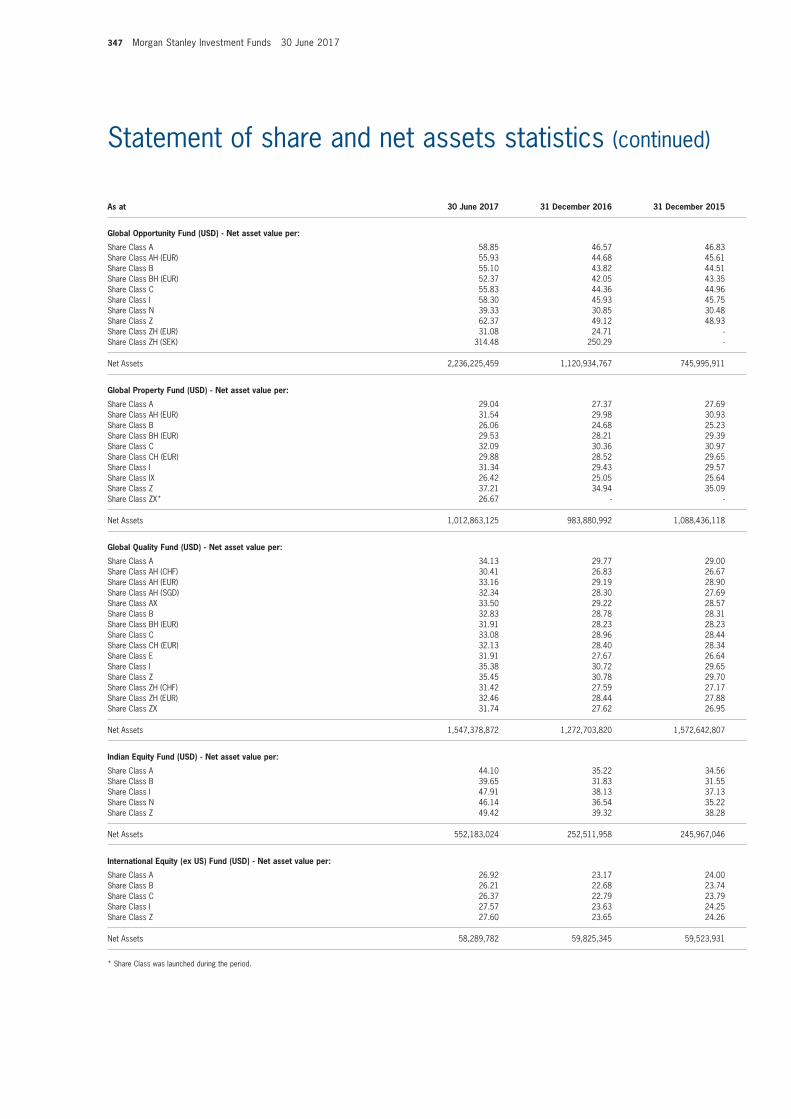
347 Morgan Stanley Investment Funds 30 June 2017
Statement of share and net assets statistics (continued)
As at 30 June 2017 31 December 2016 31 December 2015
Global Opportunity Fund (USD) - Net asset value per:
Share Class A 58.85 46.57 46.83Share Class AH (EUR) 55.93 44.68 45.61Share Class B 55.10 43.82 44.51Share Class BH (EUR) 52.37 42.05 43.35Share Class C 55.83 44.36 44.96Share Class I 58.30 45.93 45.75Share Class N 39.33 30.85 30.48Share Class Z 62.37 49.12 48.93Share Class ZH (EUR) 31.08 24.71 -Share Class ZH (SEK) 314.48 250.29 -
Net Assets 2,236,225,459 1,120,934,767 745,995,911
Global Property Fund (USD) - Net asset value per:
Share Class A 29.04 27.37 27.69Share Class AH (EUR) 31.54 29.98 30.93Share Class B 26.06 24.68 25.23Share Class BH (EUR) 29.53 28.21 29.39Share Class C 32.09 30.36 30.97Share Class CH (EUR) 29.88 28.52 29.65Share Class I 31.34 29.43 29.57Share Class IX 26.42 25.05 25.64Share Class Z 37.21 34.94 35.09Share Class ZX* 26.67 - -
Net Assets 1,012,863,125 983,880,992 1,088,436,118
Global Quality Fund (USD) - Net asset value per:
Share Class A 34.13 29.77 29.00Share Class AH (CHF) 30.41 26.83 26.67Share Class AH (EUR) 33.16 29.19 28.90Share Class AH (SGD) 32.34 28.30 27.69Share Class AX 33.50 29.22 28.57Share Class B 32.83 28.78 28.31Share Class BH (EUR) 31.91 28.23 28.23Share Class C 33.08 28.96 28.44Share Class CH (EUR) 32.13 28.40 28.34Share Class E 31.91 27.67 26.64Share Class I 35.38 30.72 29.65Share Class Z 35.45 30.78 29.70Share Class ZH (CHF) 31.42 27.59 27.17Share Class ZH (EUR) 32.46 28.44 27.88Share Class ZX 31.74 27.62 26.95
Net Assets 1,547,378,872 1,272,703,820 1,572,642,807
Indian Equity Fund (USD) - Net asset value per:
Share Class A 44.10 35.22 34.56Share Class B 39.65 31.83 31.55Share Class I 47.91 38.13 37.13Share Class N 46.14 36.54 35.22Share Class Z 49.42 39.32 38.28
Net Assets 552,183,024 252,511,958 245,967,046
International Equity (ex US) Fund (USD) - Net asset value per:
Share Class A 26.92 23.17 24.00Share Class B 26.21 22.68 23.74Share Class C 26.37 22.79 23.79Share Class I 27.57 23.63 24.25Share Class Z 27.60 23.65 24.26
Net Assets 58,289,782 59,825,345 59,523,931
* Share Class was launched during the period.
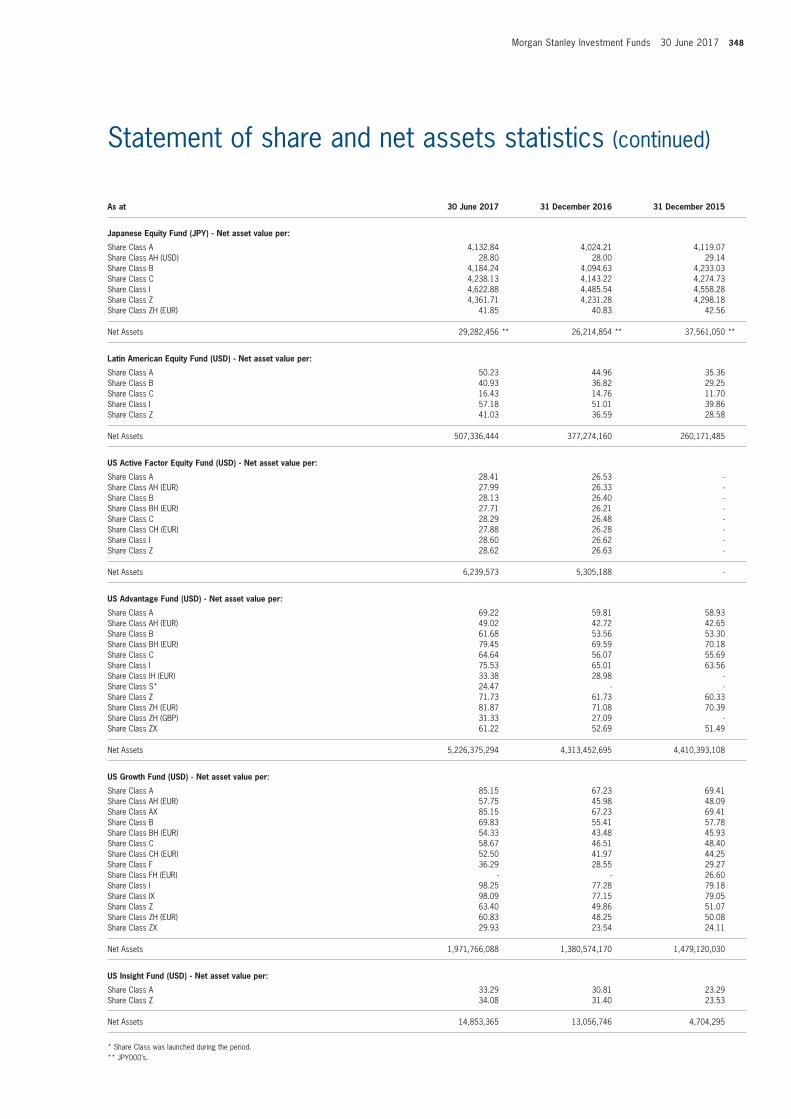
Morgan Stanley Investment Funds 30 June 2017 348
Statement of share and net assets statistics (continued)
As at 30 June 2017 31 December 2016 31 December 2015
Japanese Equity Fund (JPY) - Net asset value per:
Share Class A 4,132.84 4,024.21 4,119.07Share Class AH (USD) 28.80 28.00 29.14Share Class B 4,184.24 4,094.63 4,233.03Share Class C 4,238.13 4,143.22 4,274.73Share Class I 4,622.88 4,485.54 4,558.28Share Class Z 4,361.71 4,231.28 4,298.18Share Class ZH (EUR) 41.85 40.83 42.56
Net Assets 29,282,456 ** 26,214,854 ** 37,561,050 **
Latin American Equity Fund (USD) - Net asset value per:
Share Class A 50.23 44.96 35.36Share Class B 40.93 36.82 29.25Share Class C 16.43 14.76 11.70Share Class I 57.18 51.01 39.86Share Class Z 41.03 36.59 28.58
Net Assets 507,336,444 377,274,160 260,171,485
US Active Factor Equity Fund (USD) - Net asset value per:
Share Class A 28.41 26.53 -Share Class AH (EUR) 27.99 26.33 -Share Class B 28.13 26.40 -Share Class BH (EUR) 27.71 26.21 -Share Class C 28.29 26.48 -Share Class CH (EUR) 27.88 26.28 -Share Class I 28.60 26.62 -Share Class Z 28.62 26.63 -
Net Assets 6,239,573 5,305,188 -
US Advantage Fund (USD) - Net asset value per:
Share Class A 69.22 59.81 58.93Share Class AH (EUR) 49.02 42.72 42.65Share Class B 61.68 53.56 53.30Share Class BH (EUR) 79.45 69.59 70.18Share Class C 64.64 56.07 55.69Share Class I 75.53 65.01 63.56Share Class IH (EUR) 33.38 28.98 -Share Class S* 24.47 - -Share Class Z 71.73 61.73 60.33Share Class ZH (EUR) 81.87 71.08 70.39Share Class ZH (GBP) 31.33 27.09 -Share Class ZX 61.22 52.69 51.49
Net Assets 5,226,375,294 4,313,452,695 4,410,393,108
US Growth Fund (USD) - Net asset value per:
Share Class A 85.15 67.23 69.41Share Class AH (EUR) 57.75 45.98 48.09Share Class AX 85.15 67.23 69.41Share Class B 69.83 55.41 57.78Share Class BH (EUR) 54.33 43.48 45.93Share Class C 58.67 46.51 48.40Share Class CH (EUR) 52.50 41.97 44.25Share Class F 36.29 28.55 29.27Share Class FH (EUR) - - 26.60Share Class I 98.25 77.28 79.18Share Class IX 98.09 77.15 79.05Share Class Z 63.40 49.86 51.07Share Class ZH (EUR) 60.83 48.25 50.08Share Class ZX 29.93 23.54 24.11
Net Assets 1,971,766,088 1,380,574,170 1,479,120,030
US Insight Fund (USD) - Net asset value per:
Share Class A 33.29 30.81 23.29Share Class Z 34.08 31.40 23.53
Net Assets 14,853,365 13,056,746 4,704,295
* Share Class was launched during the period.** JPY000’s.
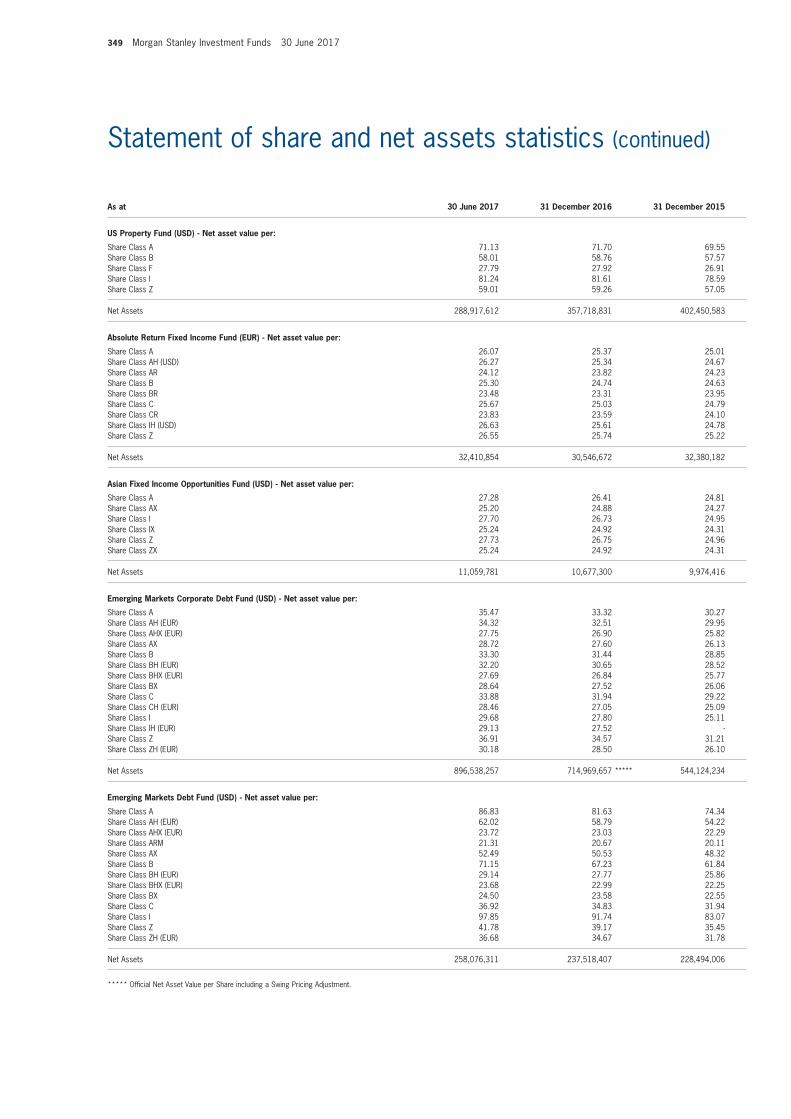
349 Morgan Stanley Investment Funds 30 June 2017
Statement of share and net assets statistics (continued)
***** Offi cial Net Asset Value per Share including a Swing Pricing Adjustment.
As at 30 June 2017 31 December 2016 31 December 2015
US Property Fund (USD) - Net asset value per:
Share Class A 71.13 71.70 69.55Share Class B 58.01 58.76 57.57Share Class F 27.79 27.92 26.91Share Class I 81.24 81.61 78.59Share Class Z 59.01 59.26 57.05
Net Assets 288,917,612 357,718,831 402,450,583
Absolute Return Fixed Income Fund (EUR) - Net asset value per:
Share Class A 26.07 25.37 25.01Share Class AH (USD) 26.27 25.34 24.67Share Class AR 24.12 23.82 24.23Share Class B 25.30 24.74 24.63Share Class BR 23.48 23.31 23.95Share Class C 25.67 25.03 24.79Share Class CR 23.83 23.59 24.10Share Class IH (USD) 26.63 25.61 24.78Share Class Z 26.55 25.74 25.22
Net Assets 32,410,854 30,546,672 32,380,182
Asian Fixed Income Opportunities Fund (USD) - Net asset value per:
Share Class A 27.28 26.41 24.81Share Class AX 25.20 24.88 24.27Share Class I 27.70 26.73 24.95Share Class IX 25.24 24.92 24.31Share Class Z 27.73 26.75 24.96Share Class ZX 25.24 24.92 24.31
Net Assets 11,059,781 10,677,300 9,974,416
Emerging Markets Corporate Debt Fund (USD) - Net asset value per:
Share Class A 35.47 33.32 30.27Share Class AH (EUR) 34.32 32.51 29.95Share Class AHX (EUR) 27.75 26.90 25.82Share Class AX 28.72 27.60 26.13Share Class B 33.30 31.44 28.85Share Class BH (EUR) 32.20 30.65 28.52Share Class BHX (EUR) 27.69 26.84 25.77Share Class BX 28.64 27.52 26.06Share Class C 33.88 31.94 29.22Share Class CH (EUR) 28.46 27.05 25.09Share Class I 29.68 27.80 25.11Share Class IH (EUR) 29.13 27.52 -Share Class Z 36.91 34.57 31.21Share Class ZH (EUR) 30.18 28.50 26.10
Net Assets 896,538,257 714,969,657 ***** 544,124,234
Emerging Markets Debt Fund (USD) - Net asset value per:
Share Class A 86.83 81.63 74.34Share Class AH (EUR) 62.02 58.79 54.22Share Class AHX (EUR) 23.72 23.03 22.29Share Class ARM 21.31 20.67 20.11Share Class AX 52.49 50.53 48.32Share Class B 71.15 67.23 61.84Share Class BH (EUR) 29.14 27.77 25.86Share Class BHX (EUR) 23.68 22.99 22.25Share Class BX 24.50 23.58 22.55Share Class C 36.92 34.83 31.94Share Class I 97.85 91.74 83.07Share Class Z 41.78 39.17 35.45Share Class ZH (EUR) 36.68 34.67 31.78
Net Assets 258,076,311 237,518,407 228,494,006
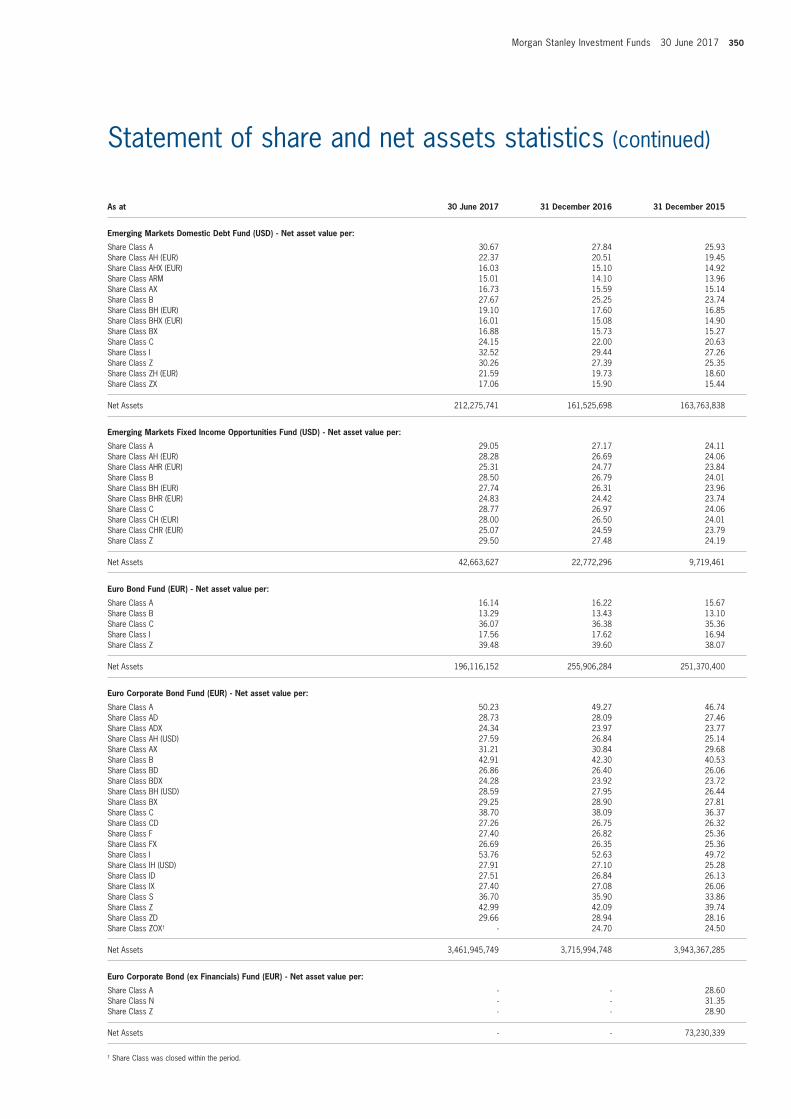
Morgan Stanley Investment Funds 30 June 2017 350
Statement of share and net assets statistics (continued)
As at 30 June 2017 31 December 2016 31 December 2015
Emerging Markets Domestic Debt Fund (USD) - Net asset value per:
Share Class A 30.67 27.84 25.93Share Class AH (EUR) 22.37 20.51 19.45Share Class AHX (EUR) 16.03 15.10 14.92Share Class ARM 15.01 14.10 13.96Share Class AX 16.73 15.59 15.14Share Class B 27.67 25.25 23.74Share Class BH (EUR) 19.10 17.60 16.85Share Class BHX (EUR) 16.01 15.08 14.90Share Class BX 16.88 15.73 15.27Share Class C 24.15 22.00 20.63Share Class I 32.52 29.44 27.26Share Class Z 30.26 27.39 25.35Share Class ZH (EUR) 21.59 19.73 18.60Share Class ZX 17.06 15.90 15.44
Net Assets 212,275,741 161,525,698 163,763,838
Emerging Markets Fixed Income Opportunities Fund (USD) - Net asset value per:
Share Class A 29.05 27.17 24.11Share Class AH (EUR) 28.28 26.69 24.06Share Class AHR (EUR) 25.31 24.77 23.84Share Class B 28.50 26.79 24.01Share Class BH (EUR) 27.74 26.31 23.96Share Class BHR (EUR) 24.83 24.42 23.74Share Class C 28.77 26.97 24.06Share Class CH (EUR) 28.00 26.50 24.01Share Class CHR (EUR) 25.07 24.59 23.79Share Class Z 29.50 27.48 24.19
Net Assets 42,663,627 22,772,296 9,719,461
Euro Bond Fund (EUR) - Net asset value per:
Share Class A 16.14 16.22 15.67Share Class B 13.29 13.43 13.10Share Class C 36.07 36.38 35.36Share Class I 17.56 17.62 16.94Share Class Z 39.48 39.60 38.07
Net Assets 196,116,152 255,906,284 251,370,400
Euro Corporate Bond Fund (EUR) - Net asset value per:
Share Class A 50.23 49.27 46.74Share Class AD 28.73 28.09 27.46Share Class ADX 24.34 23.97 23.77Share Class AH (USD) 27.59 26.84 25.14Share Class AX 31.21 30.84 29.68Share Class B 42.91 42.30 40.53Share Class BD 26.86 26.40 26.06Share Class BDX 24.28 23.92 23.72Share Class BH (USD) 28.59 27.95 26.44Share Class BX 29.25 28.90 27.81Share Class C 38.70 38.09 36.37Share Class CD 27.26 26.75 26.32Share Class F 27.40 26.82 25.36Share Class FX 26.69 26.35 25.36Share Class I 53.76 52.63 49.72Share Class IH (USD) 27.91 27.10 25.28Share Class ID 27.51 26.84 26.13Share Class IX 27.40 27.08 26.06Share Class S 36.70 35.90 33.86Share Class Z 42.99 42.09 39.74Share Class ZD 29.66 28.94 28.16Share Class ZOX† - 24.70 24.50
Net Assets 3,461,945,749 3,715,994,748 3,943,367,285
Euro Corporate Bond (ex Financials) Fund (EUR) - Net asset value per:
Share Class A - - 28.60Share Class N - - 31.35Share Class Z - - 28.90
Net Assets - - 73,230,339
† Share Class was closed within the period.
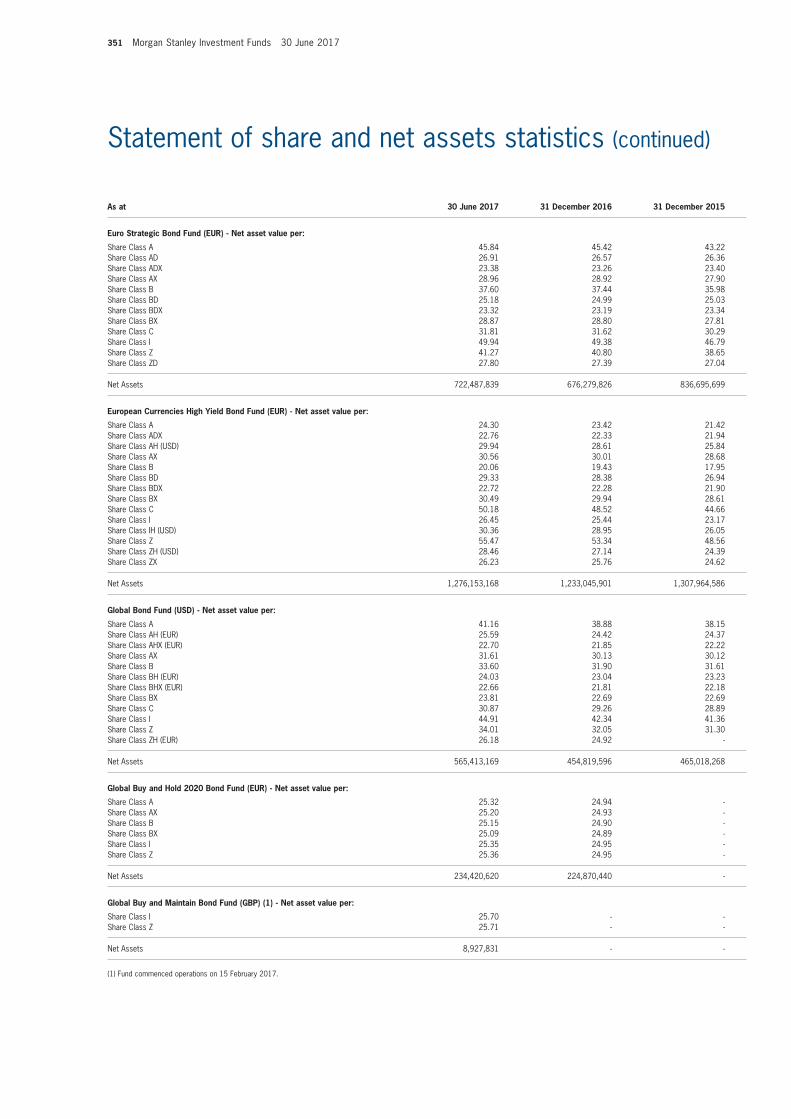
351 Morgan Stanley Investment Funds 30 June 2017
Statement of share and net assets statistics (continued)
As at 30 June 2017 31 December 2016 31 December 2015
Euro Strategic Bond Fund (EUR) - Net asset value per:
Share Class A 45.84 45.42 43.22Share Class AD 26.91 26.57 26.36Share Class ADX 23.38 23.26 23.40Share Class AX 28.96 28.92 27.90Share Class B 37.60 37.44 35.98Share Class BD 25.18 24.99 25.03Share Class BDX 23.32 23.19 23.34Share Class BX 28.87 28.80 27.81Share Class C 31.81 31.62 30.29Share Class I 49.94 49.38 46.79Share Class Z 41.27 40.80 38.65Share Class ZD 27.80 27.39 27.04
Net Assets 722,487,839 676,279,826 836,695,699
European Currencies High Yield Bond Fund (EUR) - Net asset value per:
Share Class A 24.30 23.42 21.42Share Class ADX 22.76 22.33 21.94Share Class AH (USD) 29.94 28.61 25.84Share Class AX 30.56 30.01 28.68Share Class B 20.06 19.43 17.95Share Class BD 29.33 28.38 26.94Share Class BDX 22.72 22.28 21.90Share Class BX 30.49 29.94 28.61Share Class C 50.18 48.52 44.66Share Class I 26.45 25.44 23.17Share Class IH (USD) 30.36 28.95 26.05Share Class Z 55.47 53.34 48.56Share Class ZH (USD) 28.46 27.14 24.39Share Class ZX 26.23 25.76 24.62
Net Assets 1,276,153,168 1,233,045,901 1,307,964,586
Global Bond Fund (USD) - Net asset value per:
Share Class A 41.16 38.88 38.15Share Class AH (EUR) 25.59 24.42 24.37Share Class AHX (EUR) 22.70 21.85 22.22Share Class AX 31.61 30.13 30.12Share Class B 33.60 31.90 31.61Share Class BH (EUR) 24.03 23.04 23.23Share Class BHX (EUR) 22.66 21.81 22.18Share Class BX 23.81 22.69 22.69Share Class C 30.87 29.26 28.89Share Class I 44.91 42.34 41.36Share Class Z 34.01 32.05 31.30Share Class ZH (EUR) 26.18 24.92 -
Net Assets 565,413,169 454,819,596 465,018,268
Global Buy and Hold 2020 Bond Fund (EUR) - Net asset value per:
Share Class A 25.32 24.94 -Share Class AX 25.20 24.93 -Share Class B 25.15 24.90 -Share Class BX 25.09 24.89 -Share Class I 25.35 24.95 -Share Class Z 25.36 24.95 -
Net Assets 234,420,620 224,870,440 -
Global Buy and Maintain Bond Fund (GBP) (1) - Net asset value per:
Share Class I 25.70 - -Share Class Z 25.71 - -
Net Assets 8,927,831 - -
(1) Fund commenced operations on 15 February 2017.
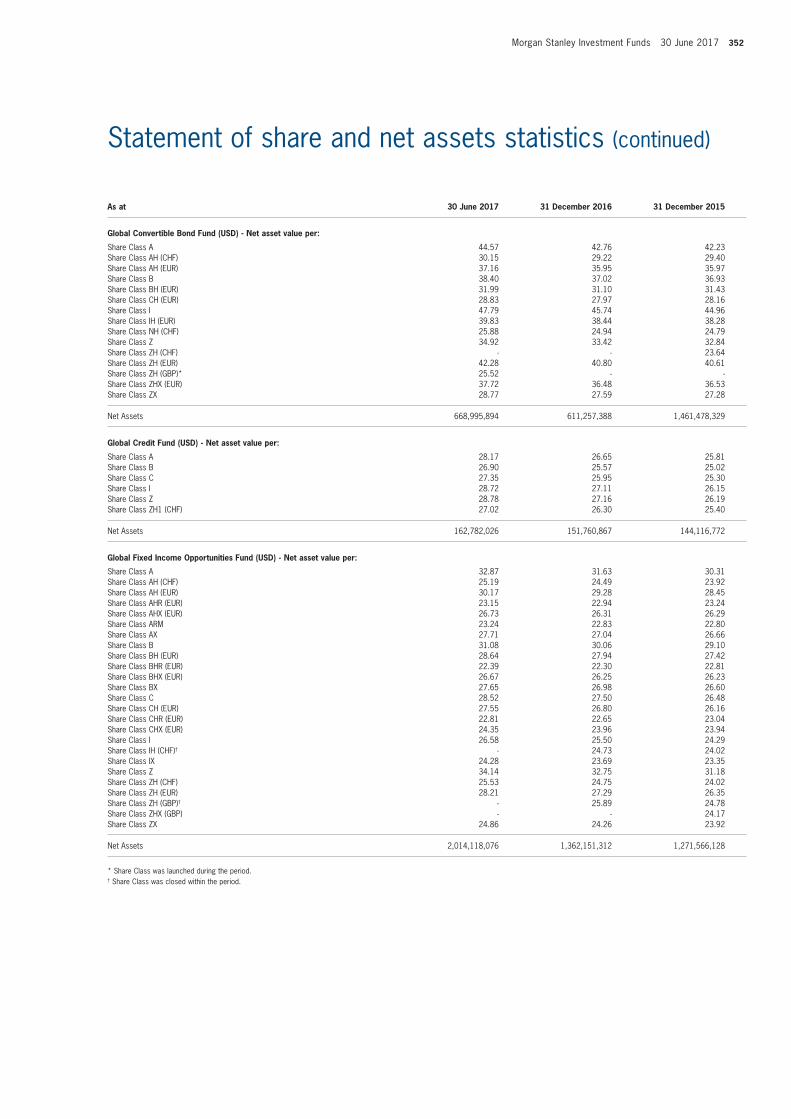
Morgan Stanley Investment Funds 30 June 2017 352
Statement of share and net assets statistics (continued)
As at 30 June 2017 31 December 2016 31 December 2015
Global Convertible Bond Fund (USD) - Net asset value per:
Share Class A 44.57 42.76 42.23Share Class AH (CHF) 30.15 29.22 29.40Share Class AH (EUR) 37.16 35.95 35.97Share Class B 38.40 37.02 36.93Share Class BH (EUR) 31.99 31.10 31.43Share Class CH (EUR) 28.83 27.97 28.16Share Class I 47.79 45.74 44.96Share Class IH (EUR) 39.83 38.44 38.28Share Class NH (CHF) 25.88 24.94 24.79Share Class Z 34.92 33.42 32.84Share Class ZH (CHF) - - 23.64Share Class ZH (EUR) 42.28 40.80 40.61Share Class ZH (GBP)* 25.52 - -Share Class ZHX (EUR) 37.72 36.48 36.53Share Class ZX 28.77 27.59 27.28
Net Assets 668,995,894 611,257,388 1,461,478,329
Global Credit Fund (USD) - Net asset value per:
Share Class A 28.17 26.65 25.81Share Class B 26.90 25.57 25.02Share Class C 27.35 25.95 25.30Share Class I 28.72 27.11 26.15Share Class Z 28.78 27.16 26.19Share Class ZH1 (CHF) 27.02 26.30 25.40
Net Assets 162,782,026 151,760,867 144,116,772
Global Fixed Income Opportunities Fund (USD) - Net asset value per:
Share Class A 32.87 31.63 30.31Share Class AH (CHF) 25.19 24.49 23.92Share Class AH (EUR) 30.17 29.28 28.45Share Class AHR (EUR) 23.15 22.94 23.24Share Class AHX (EUR) 26.73 26.31 26.29Share Class ARM 23.24 22.83 22.80Share Class AX 27.71 27.04 26.66Share Class B 31.08 30.06 29.10Share Class BH (EUR) 28.64 27.94 27.42Share Class BHR (EUR) 22.39 22.30 22.81Share Class BHX (EUR) 26.67 26.25 26.23Share Class BX 27.65 26.98 26.60Share Class C 28.52 27.50 26.48Share Class CH (EUR) 27.55 26.80 26.16Share Class CHR (EUR) 22.81 22.65 23.04Share Class CHX (EUR) 24.35 23.96 23.94Share Class I 26.58 25.50 24.29Share Class IH (CHF)† - 24.73 24.02Share Class IX 24.28 23.69 23.35Share Class Z 34.14 32.75 31.18Share Class ZH (CHF) 25.53 24.75 24.02Share Class ZH (EUR) 28.21 27.29 26.35Share Class ZH (GBP)† - 25.89 24.78Share Class ZHX (GBP) - - 24.17Share Class ZX 24.86 24.26 23.92
Net Assets 2,014,118,076 1,362,151,312 1,271,566,128
* Share Class was launched during the period.† Share Class was closed within the period.
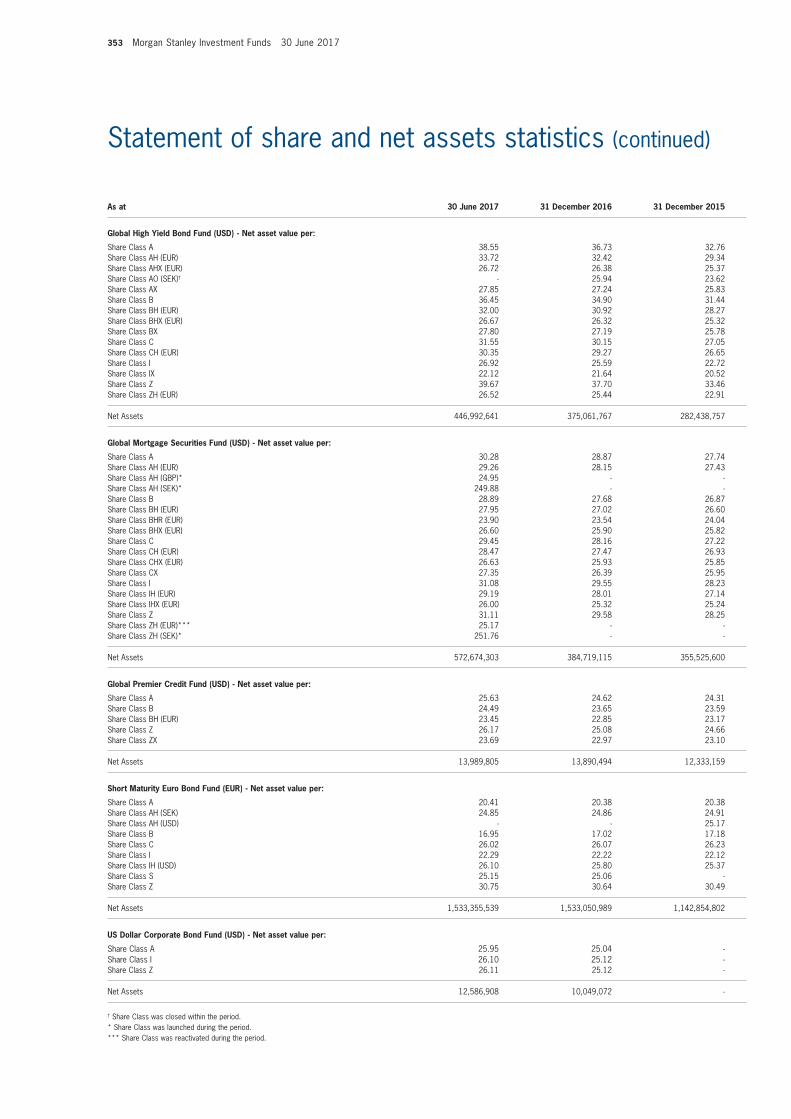
353 Morgan Stanley Investment Funds 30 June 2017
Statement of share and net assets statistics (continued)
As at 30 June 2017 31 December 2016 31 December 2015
Global High Yield Bond Fund (USD) - Net asset value per:
Share Class A 38.55 36.73 32.76Share Class AH (EUR) 33.72 32.42 29.34Share Class AHX (EUR) 26.72 26.38 25.37Share Class AO (SEK)† - 25.94 23.62Share Class AX 27.85 27.24 25.83Share Class B 36.45 34.90 31.44Share Class BH (EUR) 32.00 30.92 28.27Share Class BHX (EUR) 26.67 26.32 25.32Share Class BX 27.80 27.19 25.78Share Class C 31.55 30.15 27.05Share Class CH (EUR) 30.35 29.27 26.65Share Class I 26.92 25.59 22.72Share Class IX 22.12 21.64 20.52Share Class Z 39.67 37.70 33.46Share Class ZH (EUR) 26.52 25.44 22.91
Net Assets 446,992,641 375,061,767 282,438,757
Global Mortgage Securities Fund (USD) - Net asset value per:
Share Class A 30.28 28.87 27.74Share Class AH (EUR) 29.26 28.15 27.43Share Class AH (GBP)* 24.95 - -Share Class AH (SEK)* 249.88 - -Share Class B 28.89 27.68 26.87Share Class BH (EUR) 27.95 27.02 26.60Share Class BHR (EUR) 23.90 23.54 24.04Share Class BHX (EUR) 26.60 25.90 25.82Share Class C 29.45 28.16 27.22Share Class CH (EUR) 28.47 27.47 26.93Share Class CHX (EUR) 26.63 25.93 25.85Share Class CX 27.35 26.39 25.95Share Class I 31.08 29.55 28.23Share Class IH (EUR) 29.19 28.01 27.14Share Class IHX (EUR) 26.00 25.32 25.24Share Class Z 31.11 29.58 28.25Share Class ZH (EUR)*** 25.17 - -Share Class ZH (SEK)* 251.76 - -
Net Assets 572,674,303 384,719,115 355,525,600
Global Premier Credit Fund (USD) - Net asset value per:
Share Class A 25.63 24.62 24.31Share Class B 24.49 23.65 23.59Share Class BH (EUR) 23.45 22.85 23.17Share Class Z 26.17 25.08 24.66Share Class ZX 23.69 22.97 23.10
Net Assets 13,989,805 13,890,494 12,333,159
Short Maturity Euro Bond Fund (EUR) - Net asset value per:
Share Class A 20.41 20.38 20.38Share Class AH (SEK) 24.85 24.86 24.91Share Class AH (USD) - - 25.17Share Class B 16.95 17.02 17.18Share Class C 26.02 26.07 26.23Share Class I 22.29 22.22 22.12Share Class IH (USD) 26.10 25.80 25.37Share Class S 25.15 25.06 -Share Class Z 30.75 30.64 30.49
Net Assets 1,533,355,539 1,533,050,989 1,142,854,802
US Dollar Corporate Bond Fund (USD) - Net asset value per:
Share Class A 25.95 25.04 -Share Class I 26.10 25.12 -Share Class Z 26.11 25.12 -
Net Assets 12,586,908 10,049,072 -
† Share Class was closed within the period.* Share Class was launched during the period.*** Share Class was reactivated during the period.
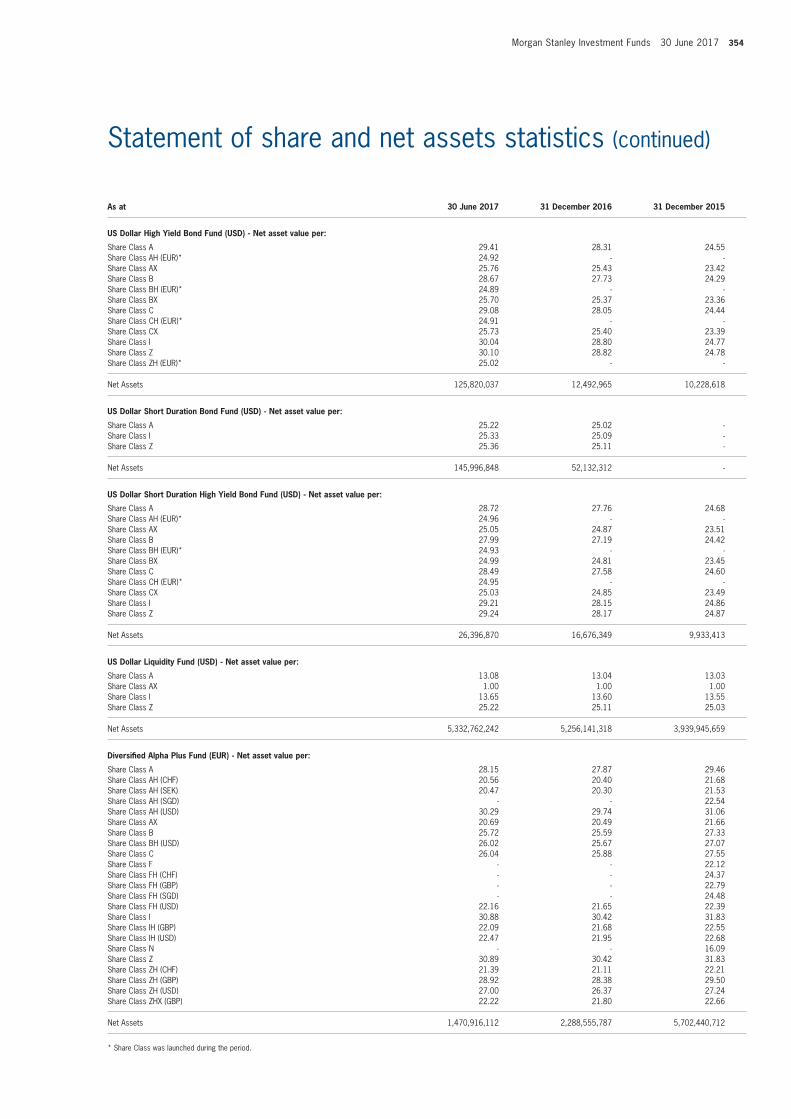
Morgan Stanley Investment Funds 30 June 2017 354
Statement of share and net assets statistics (continued)
As at 30 June 2017 31 December 2016 31 December 2015
US Dollar High Yield Bond Fund (USD) - Net asset value per:
Share Class A 29.41 28.31 24.55Share Class AH (EUR)* 24.92 - -Share Class AX 25.76 25.43 23.42Share Class B 28.67 27.73 24.29Share Class BH (EUR)* 24.89 - -Share Class BX 25.70 25.37 23.36Share Class C 29.08 28.05 24.44Share Class CH (EUR)* 24.91 - -Share Class CX 25.73 25.40 23.39Share Class I 30.04 28.80 24.77Share Class Z 30.10 28.82 24.78Share Class ZH (EUR)* 25.02 - -
Net Assets 125,820,037 12,492,965 10,228,618
US Dollar Short Duration Bond Fund (USD) - Net asset value per:
Share Class A 25.22 25.02 -Share Class I 25.33 25.09 -Share Class Z 25.36 25.11 -
Net Assets 145,996,848 52,132,312 -
US Dollar Short Duration High Yield Bond Fund (USD) - Net asset value per:
Share Class A 28.72 27.76 24.68Share Class AH (EUR)* 24.96 - -Share Class AX 25.05 24.87 23.51Share Class B 27.99 27.19 24.42Share Class BH (EUR)* 24.93 - -Share Class BX 24.99 24.81 23.45Share Class C 28.49 27.58 24.60Share Class CH (EUR)* 24.95 - -Share Class CX 25.03 24.85 23.49Share Class I 29.21 28.15 24.86Share Class Z 29.24 28.17 24.87
Net Assets 26,396,870 16,676,349 9,933,413
US Dollar Liquidity Fund (USD) - Net asset value per:
Share Class A 13.08 13.04 13.03Share Class AX 1.00 1.00 1.00Share Class I 13.65 13.60 13.55Share Class Z 25.22 25.11 25.03
Net Assets 5,332,762,242 5,256,141,318 3,939,945,659
Diversifi ed Alpha Plus Fund (EUR) - Net asset value per:
Share Class A 28.15 27.87 29.46Share Class AH (CHF) 20.56 20.40 21.68Share Class AH (SEK) 20.47 20.30 21.53Share Class AH (SGD) - - 22.54Share Class AH (USD) 30.29 29.74 31.06Share Class AX 20.69 20.49 21.66Share Class B 25.72 25.59 27.33Share Class BH (USD) 26.02 25.67 27.07Share Class C 26.04 25.88 27.55Share Class F - - 22.12Share Class FH (CHF) - - 24.37Share Class FH (GBP) - - 22.79Share Class FH (SGD) - - 24.48Share Class FH (USD) 22.16 21.65 22.39Share Class I 30.88 30.42 31.83Share Class IH (GBP) 22.09 21.68 22.55Share Class IH (USD) 22.47 21.95 22.68Share Class N - - 16.09Share Class Z 30.89 30.42 31.83Share Class ZH (CHF) 21.39 21.11 22.21Share Class ZH (GBP) 28.92 28.38 29.50Share Class ZH (USD) 27.00 26.37 27.24Share Class ZHX (GBP) 22.22 21.80 22.66
Net Assets 1,470,916,112 2,288,555,787 5,702,440,712
* Share Class was launched during the period.
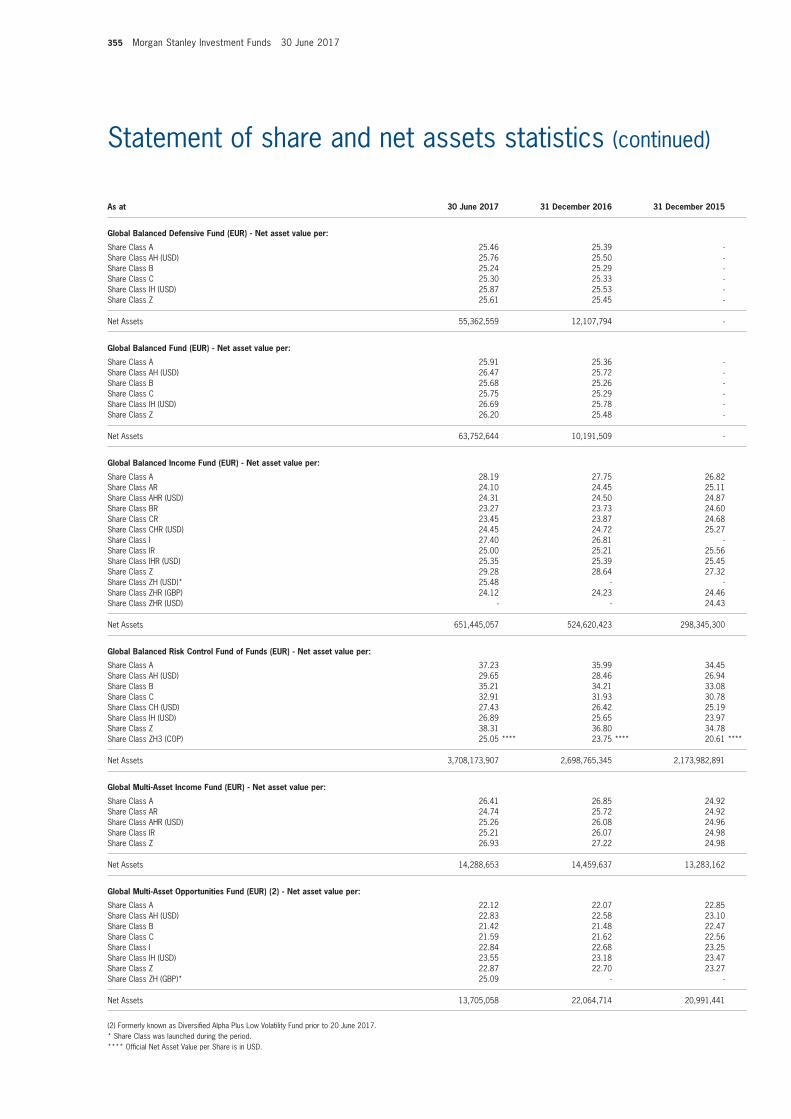
355 Morgan Stanley Investment Funds 30 June 2017
Statement of share and net assets statistics (continued)
As at 30 June 2017 31 December 2016 31 December 2015
Global Balanced Defensive Fund (EUR) - Net asset value per:
Share Class A 25.46 25.39 -Share Class AH (USD) 25.76 25.50 -Share Class B 25.24 25.29 -Share Class C 25.30 25.33 -Share Class IH (USD) 25.87 25.53 -Share Class Z 25.61 25.45 -
Net Assets 55,362,559 12,107,794 -
Global Balanced Fund (EUR) - Net asset value per:
Share Class A 25.91 25.36 -Share Class AH (USD) 26.47 25.72 -Share Class B 25.68 25.26 -Share Class C 25.75 25.29 -Share Class IH (USD) 26.69 25.78 -Share Class Z 26.20 25.48 -
Net Assets 63,752,644 10,191,509 -
Global Balanced Income Fund (EUR) - Net asset value per:
Share Class A 28.19 27.75 26.82Share Class AR 24.10 24.45 25.11Share Class AHR (USD) 24.31 24.50 24.87Share Class BR 23.27 23.73 24.60Share Class CR 23.45 23.87 24.68Share Class CHR (USD) 24.45 24.72 25.27Share Class I 27.40 26.81 -Share Class IR 25.00 25.21 25.56Share Class IHR (USD) 25.35 25.39 25.45Share Class Z 29.28 28.64 27.32Share Class ZH (USD)* 25.48 - -Share Class ZHR (GBP) 24.12 24.23 24.46Share Class ZHR (USD) - - 24.43
Net Assets 651,445,057 524,620,423 298,345,300
Global Balanced Risk Control Fund of Funds (EUR) - Net asset value per:
Share Class A 37.23 35.99 34.45Share Class AH (USD) 29.65 28.46 26.94Share Class B 35.21 34.21 33.08Share Class C 32.91 31.93 30.78Share Class CH (USD) 27.43 26.42 25.19Share Class IH (USD) 26.89 25.65 23.97Share Class Z 38.31 36.80 34.78Share Class ZH3 (COP) 25.05 **** 23.75 **** 20.61 ****
Net Assets 3,708,173,907 2,698,765,345 2,173,982,891
Global Multi-Asset Income Fund (EUR) - Net asset value per:
Share Class A 26.41 26.85 24.92Share Class AR 24.74 25.72 24.92Share Class AHR (USD) 25.26 26.08 24.96Share Class IR 25.21 26.07 24.98Share Class Z 26.93 27.22 24.98
Net Assets 14,288,653 14,459,637 13,283,162
Global Multi-Asset Opportunities Fund (EUR) (2) - Net asset value per:
Share Class A 22.12 22.07 22.85Share Class AH (USD) 22.83 22.58 23.10Share Class B 21.42 21.48 22.47Share Class C 21.59 21.62 22.56Share Class I 22.84 22.68 23.25Share Class IH (USD) 23.55 23.18 23.47Share Class Z 22.87 22.70 23.27Share Class ZH (GBP)* 25.09 - -
Net Assets 13,705,058 22,064,714 20,991,441
(2) Formerly known as Diversifi ed Alpha Plus Low Volatility Fund prior to 20 June 2017.* Share Class was launched during the period.**** Offi cial Net Asset Value per Share is in USD.
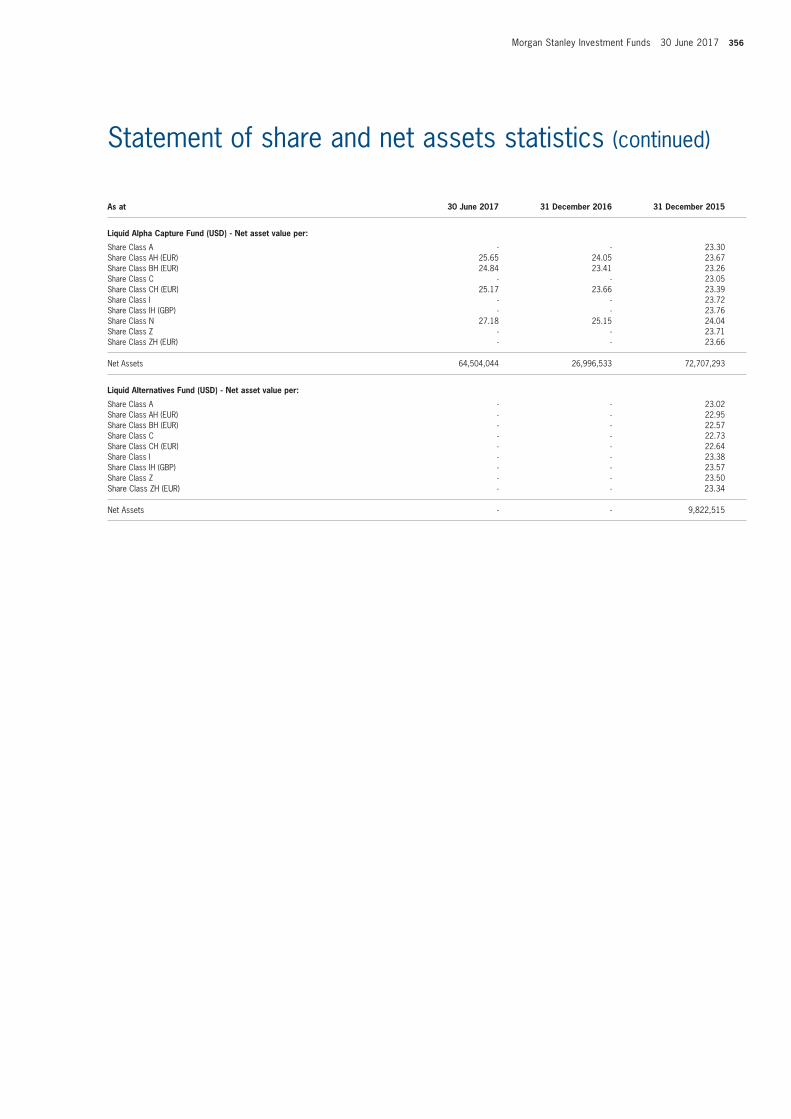
Morgan Stanley Investment Funds 30 June 2017 356
Statement of share and net assets statistics (continued)
As at 30 June 2017 31 December 2016 31 December 2015
Liquid Alpha Capture Fund (USD) - Net asset value per:
Share Class A - - 23.30Share Class AH (EUR) 25.65 24.05 23.67Share Class BH (EUR) 24.84 23.41 23.26Share Class C - - 23.05Share Class CH (EUR) 25.17 23.66 23.39Share Class I - - 23.72Share Class IH (GBP) - - 23.76Share Class N 27.18 25.15 24.04Share Class Z - - 23.71Share Class ZH (EUR) - - 23.66
Net Assets 64,504,044 26,996,533 72,707,293
Liquid Alternatives Fund (USD) - Net asset value per:
Share Class A - - 23.02Share Class AH (EUR) - - 22.95Share Class BH (EUR) - - 22.57Share Class C - - 22.73Share Class CH (EUR) - - 22.64Share Class I - - 23.38Share Class IH (GBP) - - 23.57Share Class Z - - 23.50Share Class ZH (EUR) - - 23.34
Net Assets - - 9,822,515
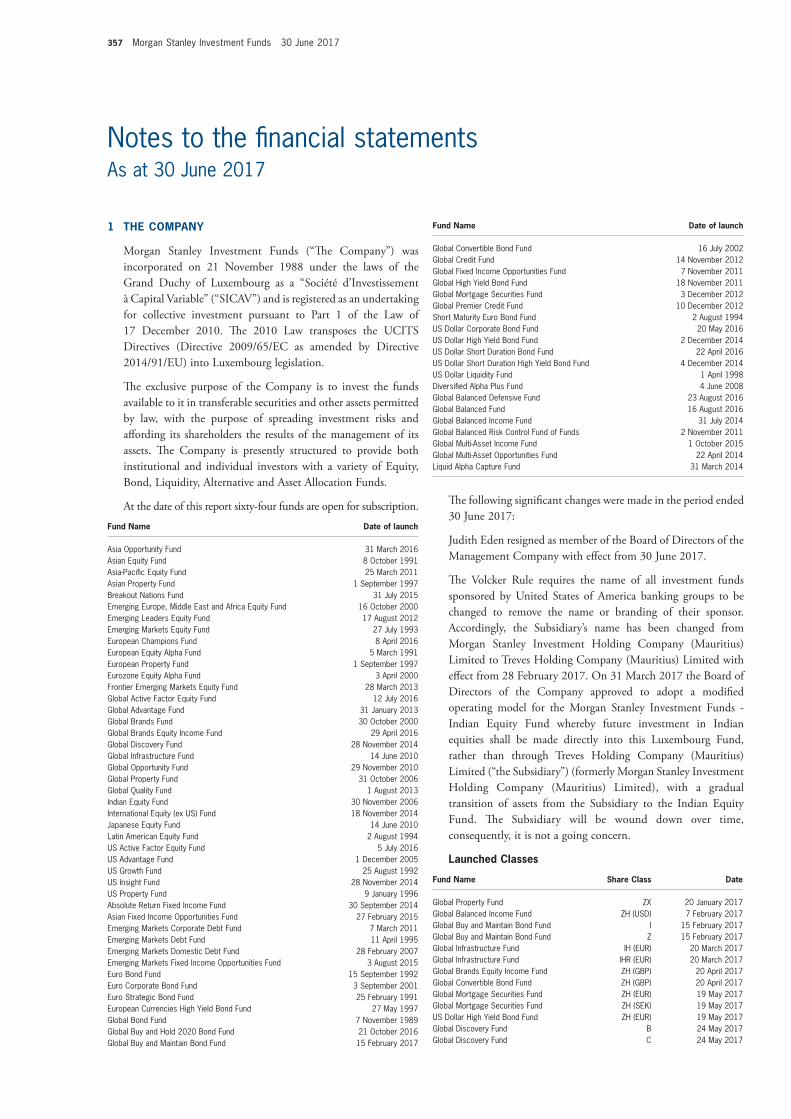
357 Morgan Stanley Investment Funds 30 June 2017
1 THE COMPANY
Morgan Stanley Investment Funds (“Th e Company”) was incorporated on 21 November 1988 under the laws of the Grand Duchy of Luxembourg as a “Société d’Investissement à Capital Variable” (“SICAV”) and is registered as an undertaking for collective investment pursuant to Part 1 of the Law of 17 December 2010. Th e 2010 Law transposes the UCITS Directives (Directive 2009/65/EC as amended by Directive 2014/91/EU) into Luxembourg legislation.
Th e exclusive purpose of the Company is to invest the funds available to it in transferable securities and other assets permitted by law, with the purpose of spreading investment risks and aff ording its shareholders the results of the management of its assets. Th e Company is presently structured to provide both institutional and individual investors with a variety of Equity, Bond, Liquidity, Alternative and Asset Allocation Funds.
At the date of this report sixty-four funds are open for subscription.
Fund Name Date of launch
Asia Opportunity Fund 31 March 2016Asian Equity Fund 8 October 1991Asia-Pacifi c Equity Fund 25 March 2011Asian Property Fund 1 September 1997Breakout Nations Fund 31 July 2015Emerging Europe, Middle East and Africa Equity Fund 16 October 2000Emerging Leaders Equity Fund 17 August 2012Emerging Markets Equity Fund 27 July 1993European Champions Fund 8 April 2016European Equity Alpha Fund 5 March 1991European Property Fund 1 September 1997Eurozone Equity Alpha Fund 3 April 2000Frontier Emerging Markets Equity Fund 28 March 2013Global Active Factor Equity Fund 12 July 2016Global Advantage Fund 31 January 2013Global Brands Fund 30 October 2000Global Brands Equity Income Fund 29 April 2016Global Discovery Fund 28 November 2014Global Infrastructure Fund 14 June 2010Global Opportunity Fund 29 November 2010Global Property Fund 31 October 2006Global Quality Fund 1 August 2013Indian Equity Fund 30 November 2006International Equity (ex US) Fund 18 November 2014Japanese Equity Fund 14 June 2010Latin American Equity Fund 2 August 1994US Active Factor Equity Fund 5 July 2016US Advantage Fund 1 December 2005US Growth Fund 25 August 1992US Insight Fund 28 November 2014US Property Fund 9 January 1996Absolute Return Fixed Income Fund 30 September 2014Asian Fixed Income Opportunities Fund 27 February 2015Emerging Markets Corporate Debt Fund 7 March 2011Emerging Markets Debt Fund 11 April 1995Emerging Markets Domestic Debt Fund 28 February 2007Emerging Markets Fixed Income Opportunities Fund 3 August 2015Euro Bond Fund 15 September 1992Euro Corporate Bond Fund 3 September 2001Euro Strategic Bond Fund 25 February 1991European Currencies High Yield Bond Fund 27 May 1997Global Bond Fund 7 November 1989Global Buy and Hold 2020 Bond Fund 21 October 2016Global Buy and Maintain Bond Fund 15 February 2017
Fund Name Date of launch
Global Convertible Bond Fund 16 July 2002Global Credit Fund 14 November 2012Global Fixed Income Opportunities Fund 7 November 2011Global High Yield Bond Fund 18 November 2011Global Mortgage Securities Fund 3 December 2012Global Premier Credit Fund 10 December 2012Short Maturity Euro Bond Fund 2 August 1994US Dollar Corporate Bond Fund 20 May 2016US Dollar High Yield Bond Fund 2 December 2014US Dollar Short Duration Bond Fund 22 April 2016US Dollar Short Duration High Yield Bond Fund 4 December 2014US Dollar Liquidity Fund 1 April 1998Diversifi ed Alpha Plus Fund 4 June 2008Global Balanced Defensive Fund 23 August 2016Global Balanced Fund 16 August 2016Global Balanced Income Fund 31 July 2014Global Balanced Risk Control Fund of Funds 2 November 2011Global Multi-Asset Income Fund 1 October 2015Global Multi-Asset Opportunities Fund 22 April 2014Liquid Alpha Capture Fund 31 March 2014
Th e following signifi cant changes were made in the period ended 30 June 2017:
Judith Eden resigned as member of the Board of Directors of the Management Company with eff ect from 30 June 2017.
Th e Volcker Rule requires the name of all investment funds sponsored by United States of America banking groups to be changed to remove the name or branding of their sponsor. Accordingly, the Subsidiary’s name has been changed from Morgan Stanley Investment Holding Company (Mauritius) Limited to Treves Holding Company (Mauritius) Limited with eff ect from 28 February 2017. On 31 March 2017 the Board of Directors of the Company approved to adopt a modifi ed operating model for the Morgan Stanley Investment Funds - Indian Equity Fund whereby future investment in Indian equities shall be made directly into this Luxembourg Fund, rather than through Treves Holding Company (Mauritius) Limited (“the Subsidiary”) (formerly Morgan Stanley Investment Holding Company (Mauritius) Limited), with a gradual transition of assets from the Subsidiary to the Indian Equity Fund. Th e Subsidiary will be wound down over time, consequently, it is not a going concern.
Launched Classes
Fund Name Share Class Date
Global Property Fund ZX 20 January 2017Global Balanced Income Fund ZH (USD) 7 February 2017Global Buy and Maintain Bond Fund I 15 February 2017Global Buy and Maintain Bond Fund Z 15 February 2017Global Infrastructure Fund IH (EUR) 20 March 2017Global Infrastructure Fund IHR (EUR) 20 March 2017Global Brands Equity Income Fund ZH (GBP) 20 April 2017Global Convertible Bond Fund ZH (GBP) 20 April 2017Global Mortgage Securities Fund ZH (EUR) 19 May 2017Global Mortgage Securities Fund ZH (SEK) 19 May 2017US Dollar High Yield Bond Fund ZH (EUR) 19 May 2017Global Discovery Fund B 24 May 2017Global Discovery Fund C 24 May 2017
Notes to the fi nancial statementsAs at 30 June 2017
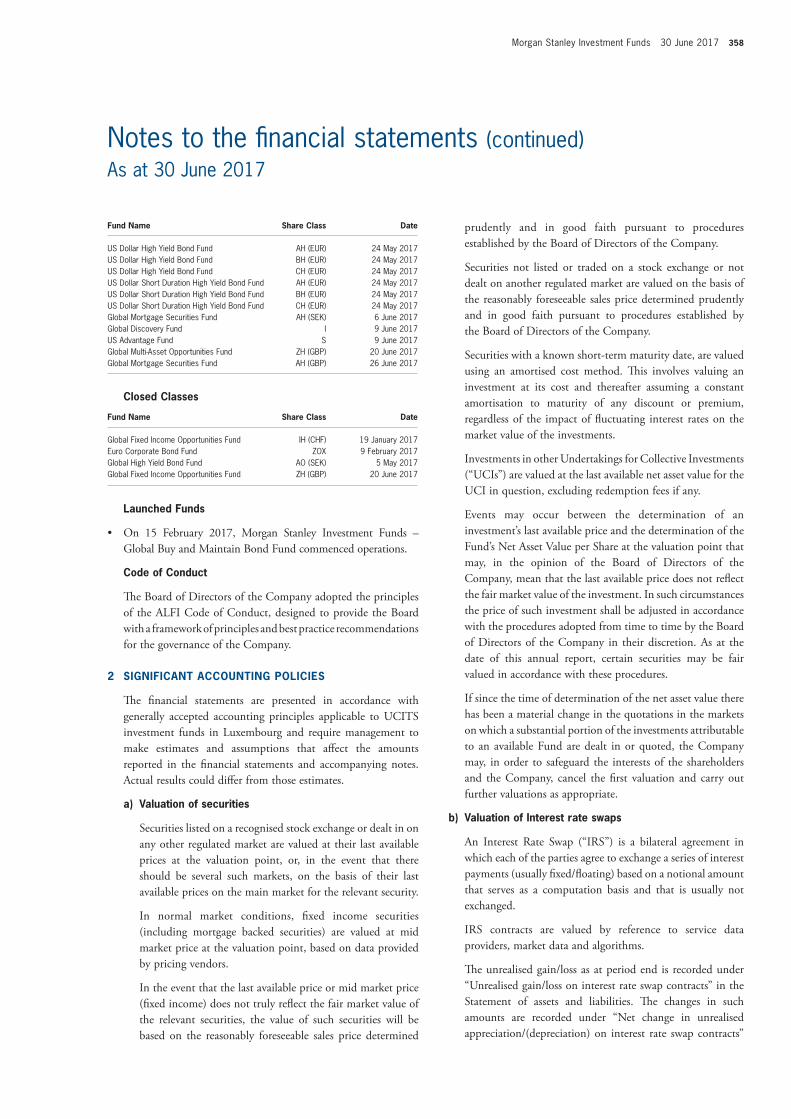
Morgan Stanley Investment Funds 30 June 2017 358
Notes to the fi nancial statements (continued)As at 30 June 2017
Fund Name Share Class Date
US Dollar High Yield Bond Fund AH (EUR) 24 May 2017US Dollar High Yield Bond Fund BH (EUR) 24 May 2017US Dollar High Yield Bond Fund CH (EUR) 24 May 2017US Dollar Short Duration High Yield Bond Fund AH (EUR) 24 May 2017US Dollar Short Duration High Yield Bond Fund BH (EUR) 24 May 2017US Dollar Short Duration High Yield Bond Fund CH (EUR) 24 May 2017Global Mortgage Securities Fund AH (SEK) 6 June 2017Global Discovery Fund I 9 June 2017US Advantage Fund S 9 June 2017Global Multi-Asset Opportunities Fund ZH (GBP) 20 June 2017Global Mortgage Securities Fund AH (GBP) 26 June 2017
Closed Classes
Fund Name Share Class Date
Global Fixed Income Opportunities Fund IH (CHF) 19 January 2017Euro Corporate Bond Fund ZOX 9 February 2017Global High Yield Bond Fund AO (SEK) 5 May 2017Global Fixed Income Opportunities Fund ZH (GBP) 20 June 2017
Launched Funds
• On 15 February 2017, Morgan Stanley Investment Funds – Global Buy and Maintain Bond Fund commenced operations.
Code of Conduct
Th e Board of Directors of the Company adopted the principles of the ALFI Code of Conduct, designed to provide the Board with a framework of principles and best practice recommendations for the governance of the Company.
2 SIGNIFICANT ACCOUNTING POLICIES
Th e fi nancial statements are presented in accordance with generally accepted accounting principles applicable to UCITS investment funds in Luxembourg and require management to make estimates and assumptions that aff ect the amounts reported in the fi nancial statements and accompanying notes. Actual results could diff er from those estimates.
a) Valuation of securities
Securities listed on a recognised stock exchange or dealt in on any other regulated market are valued at their last available prices at the valuation point, or, in the event that there should be several such markets, on the basis of their last available prices on the main market for the relevant security.
In normal market conditions, fi xed income securities (including mortgage backed securities) are valued at mid market price at the valuation point, based on data provided by pricing vendors.
In the event that the last available price or mid market price (fi xed income) does not truly refl ect the fair market value of the relevant securities, the value of such securities will be based on the reasonably foreseeable sales price determined
prudently and in good faith pursuant to procedures established by the Board of Directors of the Company.
Securities not listed or traded on a stock exchange or not dealt on another regulated market are valued on the basis of the reasonably foreseeable sales price determined prudently and in good faith pursuant to procedures established by the Board of Directors of the Company.
Securities with a known short-term maturity date, are valued using an amortised cost method. Th is involves valuing an investment at its cost and thereafter assuming a constant amortisation to maturity of any discount or premium, regardless of the impact of fl uctuating interest rates on the market value of the investments.
Investments in other Undertakings for Collective Investments (“UCIs”) are valued at the last available net asset value for the UCI in question, excluding redemption fees if any.
Events may occur between the determination of an investment’s last available price and the determination of the Fund’s Net Asset Value per Share at the valuation point that may, in the opinion of the Board of Directors of the Company, mean that the last available price does not refl ect the fair market value of the investment. In such circumstances the price of such investment shall be adjusted in accordance with the procedures adopted from time to time by the Board of Directors of the Company in their discretion. As at the date of this annual report, certain securities may be fair valued in accordance with these procedures.
If since the time of determination of the net asset value there has been a material change in the quotations in the markets on which a substantial portion of the investments attributable to an available Fund are dealt in or quoted, the Company may, in order to safeguard the interests of the shareholders and the Company, cancel the fi rst valuation and carry out further valuations as appropriate.
b) Valuation of Interest rate swaps
An Interest Rate Swap (“IRS”) is a bilateral agreement in which each of the parties agree to exchange a series of interest payments (usually fi xed/fl oating) based on a notional amount that serves as a computation basis and that is usually not exchanged.
IRS contracts are valued by reference to service data providers, market data and algorithms.
Th e unrealised gain/loss as at period end is recorded under “Unrealised gain/loss on interest rate swap contracts” in the Statement of assets and liabilities. Th e changes in such amounts are recorded under “Net change in unrealised appreciation/(depreciation) on interest rate swap contracts”
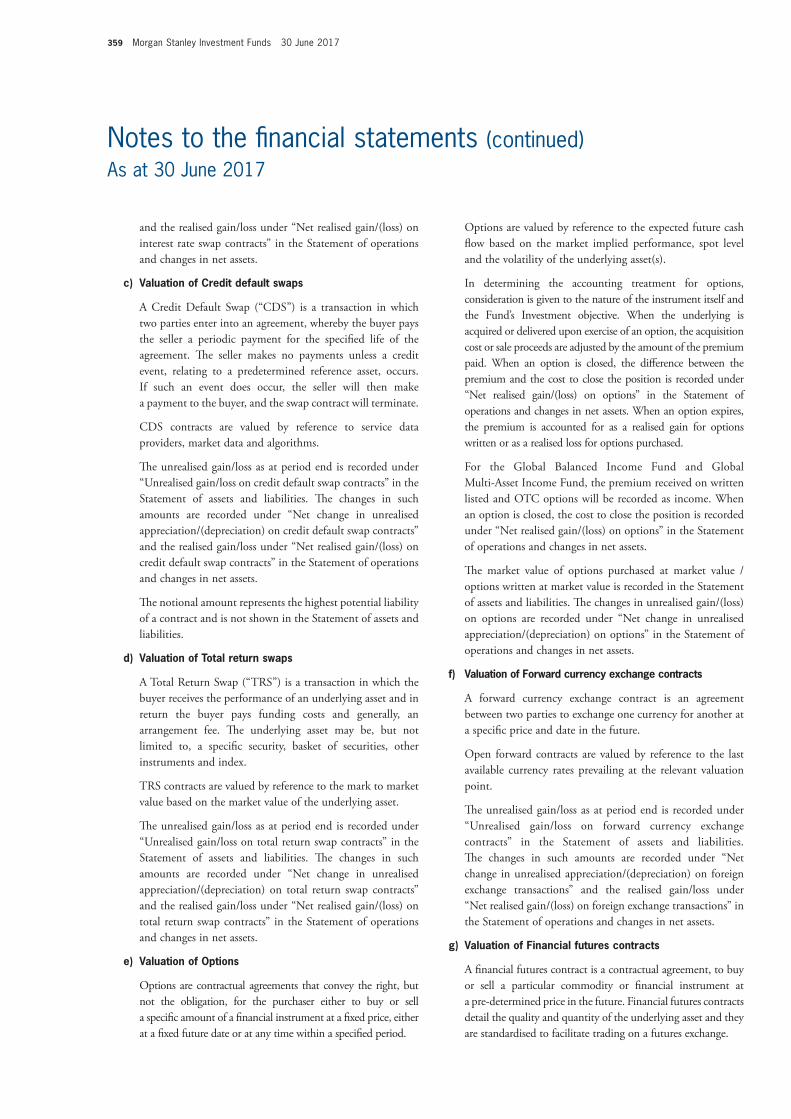
359 Morgan Stanley Investment Funds 30 June 2017
Notes to the fi nancial statements (continued)As at 30 June 2017
and the realised gain/loss under “Net realised gain/(loss) on interest rate swap contracts” in the Statement of operations and changes in net assets.
c) Valuation of Credit default swaps
A Credit Default Swap (“CDS”) is a transaction in which two parties enter into an agreement, whereby the buyer pays the seller a periodic payment for the specifi ed life of the agreement. Th e seller makes no payments unless a credit event, relating to a predetermined reference asset, occurs. If such an event does occur, the seller will then make a payment to the buyer, and the swap contract will terminate.
CDS contracts are valued by reference to service data providers, market data and algorithms.
Th e unrealised gain/loss as at period end is recorded under “Unrealised gain/loss on credit default swap contracts” in the Statement of assets and liabilities. Th e changes in such amounts are recorded under “Net change in unrealised appreciation/(depreciation) on credit default swap contracts” and the realised gain/loss under “Net realised gain/(loss) on credit default swap contracts” in the Statement of operations and changes in net assets.
Th e notional amount represents the highest potential liability of a contract and is not shown in the Statement of assets and liabilities.
d) Valuation of Total return swaps
A Total Return Swap (“TRS”) is a transaction in which the buyer receives the performance of an underlying asset and in return the buyer pays funding costs and generally, an arrangement fee. Th e underlying asset may be, but not limited to, a specifi c security, basket of securities, other instruments and index.
TRS contracts are valued by reference to the mark to market value based on the market value of the underlying asset.
Th e unrealised gain/loss as at period end is recorded under “Unrealised gain/loss on total return swap contracts” in the Statement of assets and liabilities. Th e changes in such amounts are recorded under “Net change in unrealised appreciation/(depreciation) on total return swap contracts” and the realised gain/loss under “Net realised gain/(loss) on total return swap contracts” in the Statement of operations and changes in net assets.
e) Valuation of Options
Options are contractual agreements that convey the right, but not the obligation, for the purchaser either to buy or sell a specifi c amount of a fi nancial instrument at a fi xed price, either at a fi xed future date or at any time within a specifi ed period.
Options are valued by reference to the expected future cash fl ow based on the market implied performance, spot level and the volatility of the underlying asset(s).
In determining the accounting treatment for options, consideration is given to the nature of the instrument itself and the Fund’s Investment objective. When the underlying is acquired or delivered upon exercise of an option, the acquisition cost or sale proceeds are adjusted by the amount of the premium paid. When an option is closed, the diff erence between the premium and the cost to close the position is recorded under “Net realised gain/(loss) on options” in the Statement of operations and changes in net assets. When an option expires, the premium is accounted for as a realised gain for options written or as a realised loss for options purchased.
For the Global Balanced Income Fund and Global Multi-Asset Income Fund, the premium received on written listed and OTC options will be recorded as income. When an option is closed, the cost to close the position is recorded under “Net realised gain/(loss) on options” in the Statement of operations and changes in net assets.
Th e market value of options purchased at market value / options written at market value is recorded in the Statement of assets and liabilities. Th e changes in unrealised gain/(loss) on options are recorded under “Net change in unrealised appreciation/(depreciation) on options” in the Statement of operations and changes in net assets.
f) Valuation of Forward currency exchange contracts
A forward currency exchange contract is an agreement between two parties to exchange one currency for another at a specifi c price and date in the future.
Open forward contracts are valued by reference to the last available currency rates prevailing at the relevant valuation point.
Th e unrealised gain/loss as at period end is recorded under “Unrealised gain/loss on forward currency exchange contracts” in the Statement of assets and liabilities. Th e changes in such amounts are recorded under “Net change in unrealised appreciation/(depreciation) on foreign exchange transactions” and the realised gain/loss under “Net realised gain/(loss) on foreign exchange transactions” in the Statement of operations and changes in net assets.
g) Valuation of Financial futures contracts
A fi nancial futures contract is a contractual agreement, to buy or sell a particular commodity or fi nancial instrument at a pre-determined price in the future. Financial futures contracts detail the quality and quantity of the underlying asset and they are standardised to facilitate trading on a futures exchange.
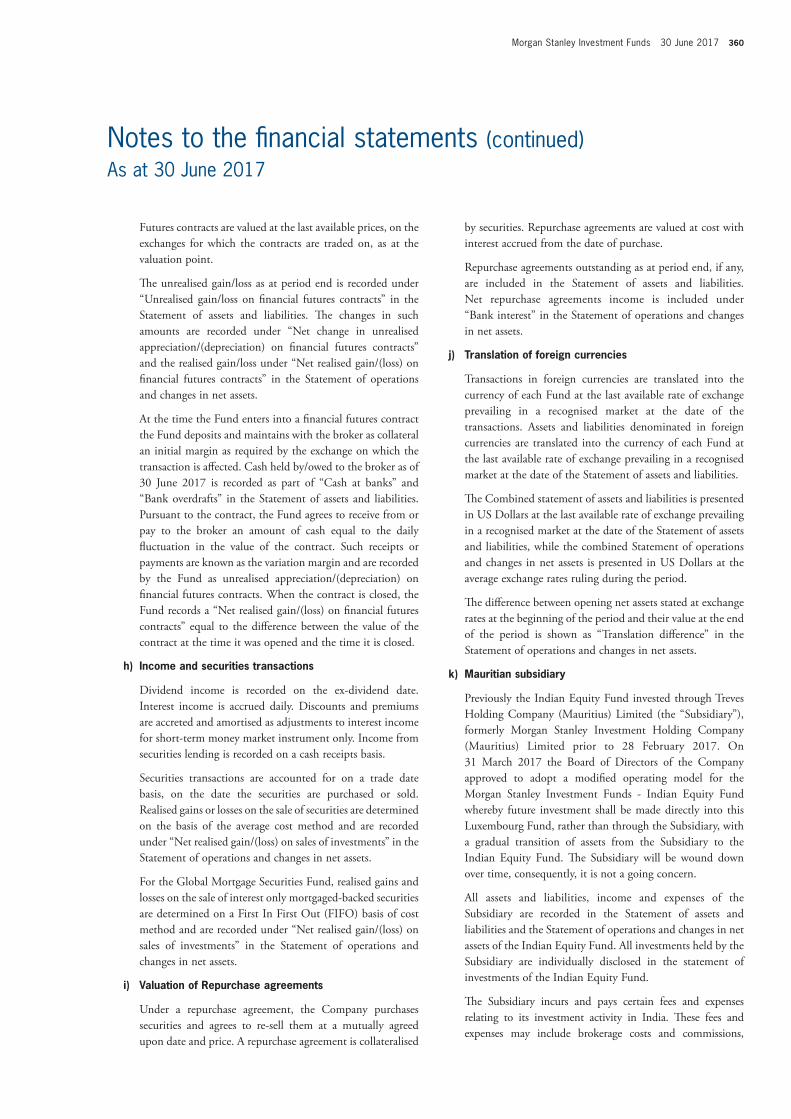
Morgan Stanley Investment Funds 30 June 2017 360
Notes to the fi nancial statements (continued)As at 30 June 2017
Futures contracts are valued at the last available prices, on the exchanges for which the contracts are traded on, as at the valuation point.
Th e unrealised gain/loss as at period end is recorded under “Unrealised gain/loss on fi nancial futures contracts” in the Statement of assets and liabilities. Th e changes in such amounts are recorded under “Net change in unrealised appreciation/(depreciation) on fi nancial futures contracts” and the realised gain/loss under “Net realised gain/(loss) on fi nancial futures contracts” in the Statement of operations and changes in net assets.
At the time the Fund enters into a fi nancial futures contract the Fund deposits and maintains with the broker as collateral an initial margin as required by the exchange on which the transaction is aff ected. Cash held by/owed to the broker as of 30 June 2017 is recorded as part of “Cash at banks” and “Bank overdrafts” in the Statement of assets and liabilities. Pursuant to the contract, the Fund agrees to receive from or pay to the broker an amount of cash equal to the daily fl uctuation in the value of the contract. Such receipts or payments are known as the variation margin and are recorded by the Fund as unrealised appreciation/(depreciation) on fi nancial futures contracts. When the contract is closed, the Fund records a “Net realised gain/(loss) on fi nancial futures contracts” equal to the diff erence between the value of the contract at the time it was opened and the time it is closed.
h) Income and securities transactions
Dividend income is recorded on the ex-dividend date. Interest income is accrued daily. Discounts and premiums are accreted and amortised as adjustments to interest income for short-term money market instrument only. Income from securities lending is recorded on a cash receipts basis.
Securities transactions are accounted for on a trade date basis, on the date the securities are purchased or sold. Realised gains or losses on the sale of securities are determined on the basis of the average cost method and are recorded under “Net realised gain/(loss) on sales of investments” in the Statement of operations and changes in net assets.
For the Global Mortgage Securities Fund, realised gains and losses on the sale of interest only mortgaged-backed securities are determined on a First In First Out (FIFO) basis of cost method and are recorded under “Net realised gain/(loss) on sales of investments” in the Statement of operations and changes in net assets.
i) Valuation of Repurchase agreements
Under a repurchase agreement, the Company purchases securities and agrees to re-sell them at a mutually agreed upon date and price. A repurchase agreement is collateralised
by securities. Repurchase agreements are valued at cost with interest accrued from the date of purchase.
Repurchase agreements outstanding as at period end, if any, are included in the Statement of assets and liabilities. Net repurchase agreements income is included under “Bank interest” in the Statement of operations and changes in net assets.
j) Translation of foreign currencies
Transactions in foreign currencies are translated into the currency of each Fund at the last available rate of exchange prevailing in a recognised market at the date of the transactions. Assets and liabilities denominated in foreign currencies are translated into the currency of each Fund at the last available rate of exchange prevailing in a recognised market at the date of the Statement of assets and liabilities.
Th e Combined statement of assets and liabilities is presented in US Dollars at the last available rate of exchange prevailing in a recognised market at the date of the Statement of assets and liabilities, while the combined Statement of operations and changes in net assets is presented in US Dollars at the average exchange rates ruling during the period.
Th e diff erence between opening net assets stated at exchange rates at the beginning of the period and their value at the end of the period is shown as “Translation diff erence” in the Statement of operations and changes in net assets.
k) Mauritian subsidiary
Previously the Indian Equity Fund invested through Treves Holding Company (Mauritius) Limited (the “Subsidiary”), formerly Morgan Stanley Investment Holding Company (Mauritius) Limited prior to 28 February 2017. On 31 March 2017 the Board of Directors of the Company approved to adopt a modifi ed operating model for the Morgan Stanley Investment Funds - Indian Equity Fund whereby future investment shall be made directly into this Luxembourg Fund, rather than through the Subsidiary, with a gradual transition of assets from the Subsidiary to the Indian Equity Fund. Th e Subsidiary will be wound down over time, consequently, it is not a going concern.
All assets and liabilities, income and expenses of the Subsidiary are recorded in the Statement of assets and liabilities and the Statement of operations and changes in net assets of the Indian Equity Fund. All investments held by the Subsidiary are individually disclosed in the statement of investments of the Indian Equity Fund.
Th e Subsidiary incurs and pays certain fees and expenses relating to its investment activity in India. Th ese fees and expenses may include brokerage costs and commissions,
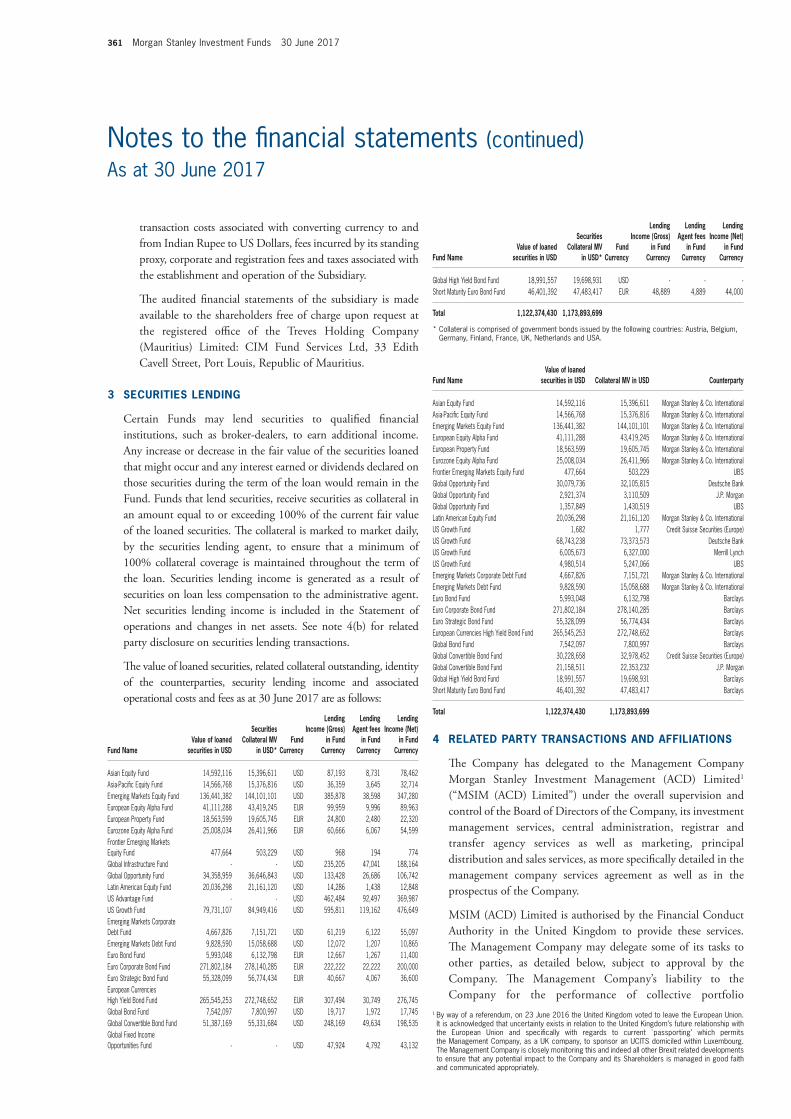
361 Morgan Stanley Investment Funds 30 June 2017
Notes to the fi nancial statements (continued)As at 30 June 2017
transaction costs associated with converting currency to and from Indian Rupee to US Dollars, fees incurred by its standing proxy, corporate and registration fees and taxes associated with the establishment and operation of the Subsidiary.
Th e audited fi nancial statements of the subsidiary is made available to the shareholders free of charge upon request at the registered offi ce of the Treves Holding Company (Mauritius) Limited: CIM Fund Services Ltd, 33 Edith Cavell Street, Port Louis, Republic of Mauritius.
3 SECURITIES LENDING
Certain Funds may lend securities to qualifi ed fi nancial institutions, such as broker-dealers, to earn additional income. Any increase or decrease in the fair value of the securities loaned that might occur and any interest earned or dividends declared on those securities during the term of the loan would remain in the Fund. Funds that lend securities, receive securities as collateral in an amount equal to or exceeding 100% of the current fair value of the loaned securities. Th e collateral is marked to market daily, by the securities lending agent, to ensure that a minimum of 100% collateral coverage is maintained throughout the term of the loan. Securities lending income is generated as a result of securities on loan less compensation to the administrative agent. Net securities lending income is included in the Statement of operations and changes in net assets. See note 4(b) for related party disclosure on securities lending transactions.
Th e value of loaned securities, related collateral outstanding, identity of the counterparties, security lending income and associated operational costs and fees as at 30 June 2017 are as follows:
Fund NameValue of loaned
securities in USD
Securities Collateral MV
in USD*Fund
Currency
Lending Income (Gross)
in Fund Currency
Lending Agent fees
in Fund Currency
Lending Income (Net)
in Fund Currency
Asian Equity Fund 14,592,116 15,396,611 USD 87,193 8,731 78,462Asia-Pacifi c Equity Fund 14,566,768 15,376,816 USD 36,359 3,645 32,714Emerging Markets Equity Fund 136,441,382 144,101,101 USD 385,878 38,598 347,280European Equity Alpha Fund 41,111,288 43,419,245 EUR 99,959 9,996 89,963European Property Fund 18,563,599 19,605,745 EUR 24,800 2,480 22,320Eurozone Equity Alpha Fund 25,008,034 26,411,966 EUR 60,666 6,067 54,599Frontier Emerging Markets Equity Fund 477,664 503,229 USD 968 194 774Global Infrastructure Fund - - USD 235,205 47,041 188,164Global Opportunity Fund 34,358,959 36,646,843 USD 133,428 26,686 106,742Latin American Equity Fund 20,036,298 21,161,120 USD 14,286 1,438 12,848US Advantage Fund - - USD 462,484 92,497 369,987US Growth Fund 79,731,107 84,949,416 USD 595,811 119,162 476,649Emerging Markets Corporate Debt Fund 4,667,826 7,151,721 USD 61,219 6,122 55,097Emerging Markets Debt Fund 9,828,590 15,058,688 USD 12,072 1,207 10,865Euro Bond Fund 5,993,048 6,132,798 EUR 12,667 1,267 11,400Euro Corporate Bond Fund 271,802,184 278,140,285 EUR 222,222 22,222 200,000Euro Strategic Bond Fund 55,328,099 56,774,434 EUR 40,667 4,067 36,600European Currencies High Yield Bond Fund 265,545,253 272,748,652 EUR 307,494 30,749 276,745Global Bond Fund 7,542,097 7,800,997 USD 19,717 1,972 17,745Global Convertible Bond Fund 51,387,169 55,331,684 USD 248,169 49,634 198,535Global Fixed Income Opportunities Fund - - USD 47,924 4,792 43,132
Fund NameValue of loaned
securities in USD
Securities Collateral MV
in USD*Fund
Currency
Lending Income (Gross)
in Fund Currency
Lending Agent fees
in Fund Currency
Lending Income (Net)
in Fund Currency
Global High Yield Bond Fund 18,991,557 19,698,931 USD - - -Short Maturity Euro Bond Fund 46,401,392 47,483,417 EUR 48,889 4,889 44,000
Total 1,122,374,430 1,173,893,699
* Collateral is comprised of government bonds issued by the following countries: Austria, Belgium, Germany, Finland, France, UK, Netherlands and USA.
Fund NameValue of loaned
securities in USD Collateral MV in USD Counterparty
Asian Equity Fund 14,592,116 15,396,611 Morgan Stanley & Co. InternationalAsia-Pacifi c Equity Fund 14,566,768 15,376,816 Morgan Stanley & Co. InternationalEmerging Markets Equity Fund 136,441,382 144,101,101 Morgan Stanley & Co. InternationalEuropean Equity Alpha Fund 41,111,288 43,419,245 Morgan Stanley & Co. InternationalEuropean Property Fund 18,563,599 19,605,745 Morgan Stanley & Co. InternationalEurozone Equity Alpha Fund 25,008,034 26,411,966 Morgan Stanley & Co. InternationalFrontier Emerging Markets Equity Fund 477,664 503,229 UBSGlobal Opportunity Fund 30,079,736 32,105,815 Deutsche BankGlobal Opportunity Fund 2,921,374 3,110,509 J.P. MorganGlobal Opportunity Fund 1,357,849 1,430,519 UBSLatin American Equity Fund 20,036,298 21,161,120 Morgan Stanley & Co. InternationalUS Growth Fund 1,682 1,777 Credit Suisse Securities (Europe)US Growth Fund 68,743,238 73,373,573 Deutsche BankUS Growth Fund 6,005,673 6,327,000 Merrill LynchUS Growth Fund 4,980,514 5,247,066 UBSEmerging Markets Corporate Debt Fund 4,667,826 7,151,721 Morgan Stanley & Co. InternationalEmerging Markets Debt Fund 9,828,590 15,058,688 Morgan Stanley & Co. InternationalEuro Bond Fund 5,993,048 6,132,798 BarclaysEuro Corporate Bond Fund 271,802,184 278,140,285 BarclaysEuro Strategic Bond Fund 55,328,099 56,774,434 BarclaysEuropean Currencies High Yield Bond Fund 265,545,253 272,748,652 BarclaysGlobal Bond Fund 7,542,097 7,800,997 BarclaysGlobal Convertible Bond Fund 30,228,658 32,978,452 Credit Suisse Securities (Europe)Global Convertible Bond Fund 21,158,511 22,353,232 J.P. MorganGlobal High Yield Bond Fund 18,991,557 19,698,931 BarclaysShort Maturity Euro Bond Fund 46,401,392 47,483,417 Barclays
Total 1,122,374,430 1,173,893,699
4 RELATED PARTY TRANSACTIONS AND AFFILIATIONS
Th e Company has delegated to the Management Company Morgan Stanley Investment Management (ACD) Limited1 (“MSIM (ACD) Limited”) under the overall supervision and control of the Board of Directors of the Company, its investment management services, central administration, registrar and transfer agency services as well as marketing, principal distribution and sales services, as more specifi cally detailed in the management company services agreement as well as in the prospectus of the Company.
MSIM (ACD) Limited is authorised by the Financial Conduct Authority in the United Kingdom to provide these services. Th e Management Company may delegate some of its tasks to other parties, as detailed below, subject to approval by the Company. Th e Management Company’s liability to the Company for the performance of collective portfolio
1 By way of a referendum, on 23 June 2016 the United Kingdom voted to leave the European Union. It is acknowledged that uncertainty exists in relation to the United Kingdom’s future relationship with the European Union and specifi cally with regards to current `passporting’ which permits the Management Company, as a UK company, to sponsor an UCITS domiciled within Luxembourg. The Management Company is closely monitoring this and indeed all other Brexit related developments to ensure that any potential impact to the Company and its Shareholders is managed in good faith and communicated appropriately.
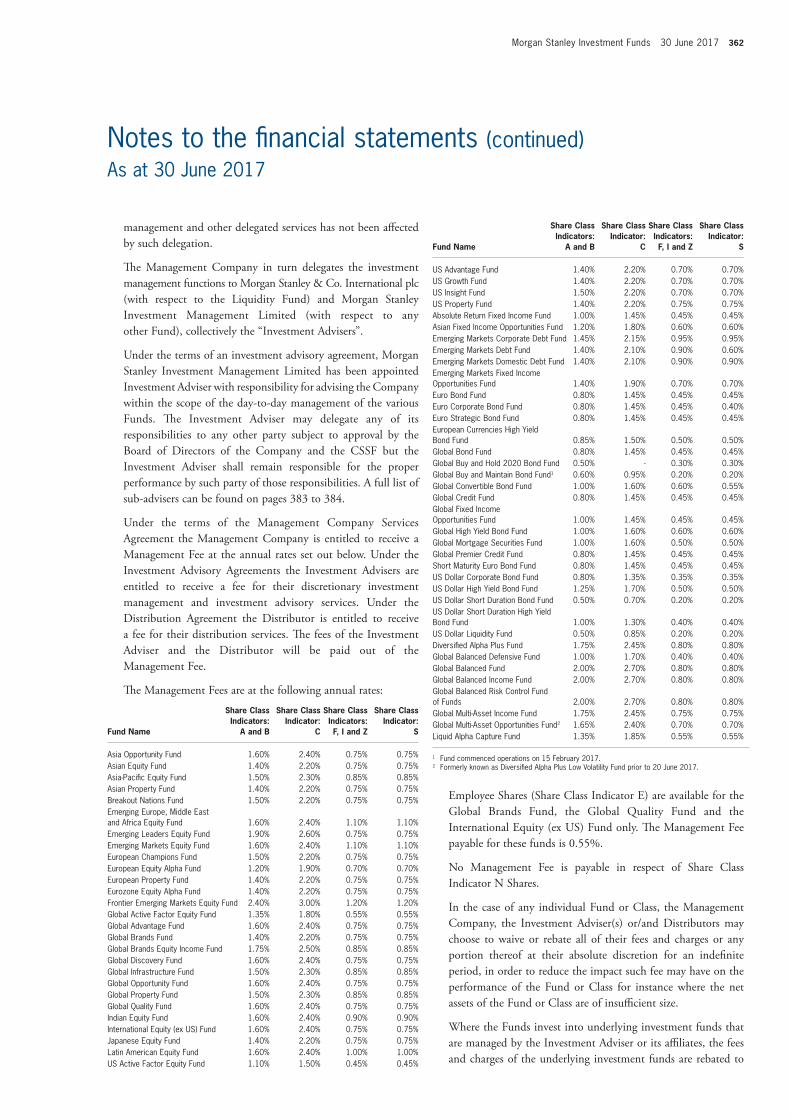
Morgan Stanley Investment Funds 30 June 2017 362
Notes to the fi nancial statements (continued)As at 30 June 2017
management and other delegated services has not been aff ected by such delegation.
Th e Management Company in turn delegates the investment management functions to Morgan Stanley & Co. International plc (with respect to the Liquidity Fund) and Morgan Stanley Investment Management Limited (with respect to any other Fund), collectively the “Investment Advisers”.
Under the terms of an investment advisory agreement, Morgan Stanley Investment Management Limited has been appointed Investment Adviser with responsibility for advising the Company within the scope of the day-to-day management of the various Funds. Th e Investment Adviser may delegate any of its responsibilities to any other party subject to approval by the Board of Directors of the Company and the CSSF but the Investment Adviser shall remain responsible for the proper performance by such party of those responsibilities. A full list of sub-advisers can be found on pages 383 to 384.
Under the terms of the Management Company Services Agreement the Management Company is entitled to receive a Management Fee at the annual rates set out below. Under the Investment Advisory Agreements the Investment Advisers are entitled to receive a fee for their discretionary investment management and investment advisory services. Under the Distribution Agreement the Distributor is entitled to receive a fee for their distribution services. Th e fees of the Investment Adviser and the Distributor will be paid out of the Management Fee.
Th e Management Fees are at the following annual rates:
Fund Name
Share Class Indicators:
A and B
Share Class Indicator:
C
Share Class Indicators: F, I and Z
Share Class Indicator:
S
Asia Opportunity Fund 1.60% 2.40% 0.75% 0.75%Asian Equity Fund 1.40% 2.20% 0.75% 0.75%Asia-Pacifi c Equity Fund 1.50% 2.30% 0.85% 0.85%Asian Property Fund 1.40% 2.20% 0.75% 0.75%Breakout Nations Fund 1.50% 2.20% 0.75% 0.75%Emerging Europe, Middle East and Africa Equity Fund 1.60% 2.40% 1.10% 1.10%Emerging Leaders Equity Fund 1.90% 2.60% 0.75% 0.75%Emerging Markets Equity Fund 1.60% 2.40% 1.10% 1.10%European Champions Fund 1.50% 2.20% 0.75% 0.75%European Equity Alpha Fund 1.20% 1.90% 0.70% 0.70%European Property Fund 1.40% 2.20% 0.75% 0.75%Eurozone Equity Alpha Fund 1.40% 2.20% 0.75% 0.75%Frontier Emerging Markets Equity Fund 2.40% 3.00% 1.20% 1.20%Global Active Factor Equity Fund 1.35% 1.80% 0.55% 0.55%Global Advantage Fund 1.60% 2.40% 0.75% 0.75%Global Brands Fund 1.40% 2.20% 0.75% 0.75%Global Brands Equity Income Fund 1.75% 2.50% 0.85% 0.85%Global Discovery Fund 1.60% 2.40% 0.75% 0.75%Global Infrastructure Fund 1.50% 2.30% 0.85% 0.85%Global Opportunity Fund 1.60% 2.40% 0.75% 0.75%Global Property Fund 1.50% 2.30% 0.85% 0.85%Global Quality Fund 1.60% 2.40% 0.75% 0.75%Indian Equity Fund 1.60% 2.40% 0.90% 0.90%International Equity (ex US) Fund 1.60% 2.40% 0.75% 0.75%Japanese Equity Fund 1.40% 2.20% 0.75% 0.75%Latin American Equity Fund 1.60% 2.40% 1.00% 1.00%US Active Factor Equity Fund 1.10% 1.50% 0.45% 0.45%
Fund Name
Share Class Indicators:
A and B
Share Class Indicator:
C
Share Class Indicators: F, I and Z
Share Class Indicator:
S
US Advantage Fund 1.40% 2.20% 0.70% 0.70%US Growth Fund 1.40% 2.20% 0.70% 0.70%US Insight Fund 1.50% 2.20% 0.70% 0.70%US Property Fund 1.40% 2.20% 0.75% 0.75%Absolute Return Fixed Income Fund 1.00% 1.45% 0.45% 0.45%Asian Fixed Income Opportunities Fund 1.20% 1.80% 0.60% 0.60%Emerging Markets Corporate Debt Fund 1.45% 2.15% 0.95% 0.95%Emerging Markets Debt Fund 1.40% 2.10% 0.90% 0.60%Emerging Markets Domestic Debt Fund 1.40% 2.10% 0.90% 0.90%Emerging Markets Fixed Income Opportunities Fund 1.40% 1.90% 0.70% 0.70%Euro Bond Fund 0.80% 1.45% 0.45% 0.45%Euro Corporate Bond Fund 0.80% 1.45% 0.45% 0.40%Euro Strategic Bond Fund 0.80% 1.45% 0.45% 0.45%European Currencies High Yield Bond Fund 0.85% 1.50% 0.50% 0.50%Global Bond Fund 0.80% 1.45% 0.45% 0.45%Global Buy and Hold 2020 Bond Fund 0.50% - 0.30% 0.30%Global Buy and Maintain Bond Fund1 0.60% 0.95% 0.20% 0.20%Global Convertible Bond Fund 1.00% 1.60% 0.60% 0.55%Global Credit Fund 0.80% 1.45% 0.45% 0.45%Global Fixed Income Opportunities Fund 1.00% 1.45% 0.45% 0.45%Global High Yield Bond Fund 1.00% 1.60% 0.60% 0.60%Global Mortgage Securities Fund 1.00% 1.60% 0.50% 0.50%Global Premier Credit Fund 0.80% 1.45% 0.45% 0.45%Short Maturity Euro Bond Fund 0.80% 1.45% 0.45% 0.45%US Dollar Corporate Bond Fund 0.80% 1.35% 0.35% 0.35%US Dollar High Yield Bond Fund 1.25% 1.70% 0.50% 0.50%US Dollar Short Duration Bond Fund 0.50% 0.70% 0.20% 0.20%US Dollar Short Duration High Yield Bond Fund 1.00% 1.30% 0.40% 0.40%US Dollar Liquidity Fund 0.50% 0.85% 0.20% 0.20%Diversifi ed Alpha Plus Fund 1.75% 2.45% 0.80% 0.80%Global Balanced Defensive Fund 1.00% 1.70% 0.40% 0.40%Global Balanced Fund 2.00% 2.70% 0.80% 0.80%Global Balanced Income Fund 2.00% 2.70% 0.80% 0.80%Global Balanced Risk Control Fund of Funds 2.00% 2.70% 0.80% 0.80%Global Multi-Asset Income Fund 1.75% 2.45% 0.75% 0.75%Global Multi-Asset Opportunities Fund2 1.65% 2.40% 0.70% 0.70%Liquid Alpha Capture Fund 1.35% 1.85% 0.55% 0.55%
1 Fund commenced operations on 15 February 2017.2 Formerly known as Diversifi ed Alpha Plus Low Volatility Fund prior to 20 June 2017.
Employee Shares (Share Class Indicator E) are available for the Global Brands Fund, the Global Quality Fund and the International Equity (ex US) Fund only. Th e Management Fee payable for these funds is 0.55%.
No Management Fee is payable in respect of Share Class Indicator N Shares.
In the case of any individual Fund or Class, the Management Company, the Investment Adviser(s) or/and Distributors may choose to waive or rebate all of their fees and charges or any portion thereof at their absolute discretion for an indefi nite period, in order to reduce the impact such fee may have on the performance of the Fund or Class for instance where the net assets of the Fund or Class are of insuffi cient size.
Where the Funds invest into underlying investment funds that are managed by the Investment Adviser or its affi liates, the fees and charges of the underlying investment funds are rebated to
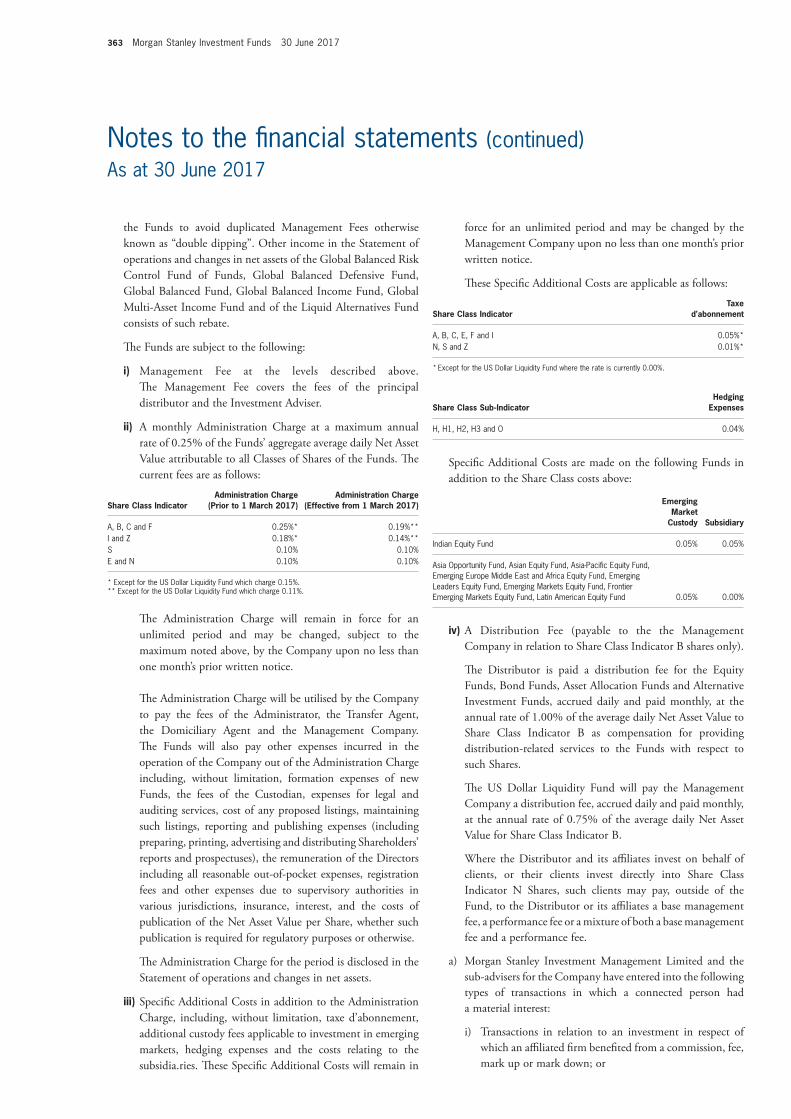
363 Morgan Stanley Investment Funds 30 June 2017
Notes to the fi nancial statements (continued)As at 30 June 2017
force for an unlimited period and may be changed by the Management Company upon no less than one month’s prior written notice.
Th ese Specifi c Additional Costs are applicable as follows:
Share Class Indicator Taxe
d’abonnement
A, B, C, E, F and I 0.05%*N, S and Z 0.01%*
* Except for the US Dollar Liquidity Fund where the rate is currently 0.00%.
Share Class Sub-IndicatorHedging
Expenses
H, H1, H2, H3 and O 0.04%
Specifi c Additional Costs are made on the following Funds in addition to the Share Class costs above:
Emerging Market
Custody Subsidiary
Indian Equity Fund 0.05% 0.05%
Asia Opportunity Fund, Asian Equity Fund, Asia-Pacifi c Equity Fund, Emerging Europe Middle East and Africa Equity Fund, Emerging Leaders Equity Fund, Emerging Markets Equity Fund, Frontier Emerging Markets Equity Fund, Latin American Equity Fund 0.05% 0.00%
iv) A Distribution Fee (payable to the the Management Company in relation to Share Class Indicator B shares only).
Th e Distributor is paid a distribution fee for the Equity Funds, Bond Funds, Asset Allocation Funds and Alternative Investment Funds, accrued daily and paid monthly, at the annual rate of 1.00% of the average daily Net Asset Value to Share Class Indicator B as compensation for providing distribution-related services to the Funds with respect to such Shares.
Th e US Dollar Liquidity Fund will pay the Management Company a distribution fee, accrued daily and paid monthly, at the annual rate of 0.75% of the average daily Net Asset Value for Share Class Indicator B.
Where the Distributor and its affi liates invest on behalf of clients, or their clients invest directly into Share Class Indicator N Shares, such clients may pay, outside of the Fund, to the Distributor or its affi liates a base management fee, a performance fee or a mixture of both a base management fee and a performance fee.
a) Morgan Stanley Investment Management Limited and the sub-advisers for the Company have entered into the following types of transactions in which a connected person had a material interest:
i) Transactions in relation to an investment in respect of which an affi liated fi rm benefi ted from a commission, fee, mark up or mark down; or
the Funds to avoid duplicated Management Fees otherwise known as “double dipping”. Other income in the Statement of operations and changes in net assets of the Global Balanced Risk Control Fund of Funds, Global Balanced Defensive Fund, Global Balanced Fund, Global Balanced Income Fund, Global Multi-Asset Income Fund and of the Liquid Alternatives Fund consists of such rebate.
Th e Funds are subject to the following:
i) Management Fee at the levels described above. Th e Management Fee covers the fees of the principal distributor and the Investment Adviser.
ii) A monthly Administration Charge at a maximum annual rate of 0.25% of the Funds’ aggregate average daily Net Asset Value attributable to all Classes of Shares of the Funds. Th e current fees are as follows:
Share Class IndicatorAdministration Charge
(Prior to 1 March 2017)Administration Charge
(Effective from 1 March 2017)
A, B, C and F 0.25%* 0.19%**I and Z 0.18%* 0.14%**S 0.10% 0.10%E and N 0.10% 0.10%
* Except for the US Dollar Liquidity Fund which charge 0.15%.** Except for the US Dollar Liquidity Fund which charge 0.11%.
Th e Administration Charge will remain in force for an unlimited period and may be changed, subject to the maximum noted above, by the Company upon no less than one month’s prior written notice.
Th e Administration Charge will be utilised by the Company to pay the fees of the Administrator, the Transfer Agent, the Domiciliary Agent and the Management Company. Th e Funds will also pay other expenses incurred in the operation of the Company out of the Administration Charge including, without limitation, formation expenses of new Funds, the fees of the Custodian, expenses for legal and auditing services, cost of any proposed listings, maintaining such listings, reporting and publishing expenses (including preparing, printing, advertising and distributing Shareholders’ reports and prospectuses), the remuneration of the Directors including all reasonable out-of-pocket expenses, registration fees and other expenses due to supervisory authorities in various jurisdictions, insurance, interest, and the costs of publication of the Net Asset Value per Share, whether such publication is required for regulatory purposes or otherwise.
Th e Administration Charge for the period is disclosed in the Statement of operations and changes in net assets.
iii) Specifi c Additional Costs in addition to the Administration Charge, including, without limitation, taxe d’abonnement, additional custody fees applicable to investment in emerging markets, hedging expenses and the costs relating to the subsidia.ries. Th ese Specifi c Additional Costs will remain in
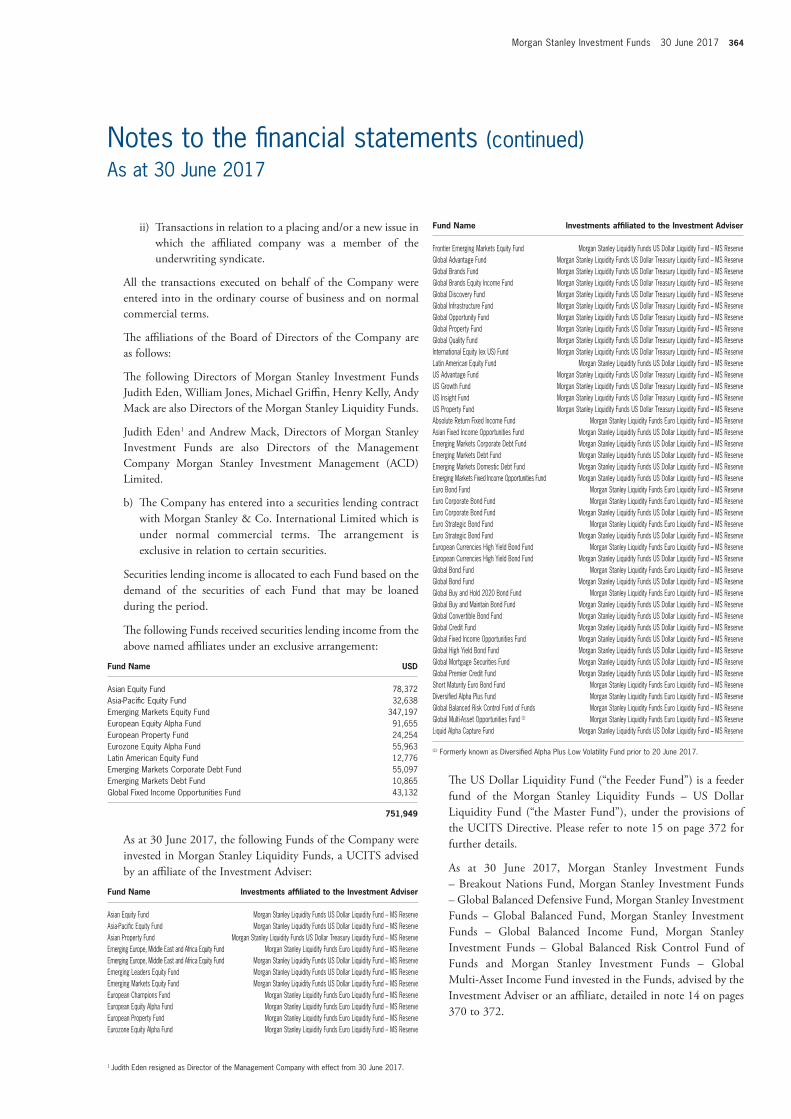
Morgan Stanley Investment Funds 30 June 2017 364
Notes to the fi nancial statements (continued)As at 30 June 2017
Fund Name Investments affi liated to the Investment Adviser
Frontier Emerging Markets Equity Fund Morgan Stanley Liquidity Funds US Dollar Liquidity Fund – MS ReserveGlobal Advantage Fund Morgan Stanley Liquidity Funds US Dollar Treasury Liquidity Fund – MS ReserveGlobal Brands Fund Morgan Stanley Liquidity Funds US Dollar Treasury Liquidity Fund – MS ReserveGlobal Brands Equity Income Fund Morgan Stanley Liquidity Funds US Dollar Treasury Liquidity Fund – MS ReserveGlobal Discovery Fund Morgan Stanley Liquidity Funds US Dollar Treasury Liquidity Fund – MS ReserveGlobal Infrastructure Fund Morgan Stanley Liquidity Funds US Dollar Treasury Liquidity Fund – MS ReserveGlobal Opportunity Fund Morgan Stanley Liquidity Funds US Dollar Treasury Liquidity Fund – MS ReserveGlobal Property Fund Morgan Stanley Liquidity Funds US Dollar Treasury Liquidity Fund – MS ReserveGlobal Quality Fund Morgan Stanley Liquidity Funds US Dollar Treasury Liquidity Fund – MS ReserveInternational Equity (ex US) Fund Morgan Stanley Liquidity Funds US Dollar Treasury Liquidity Fund – MS ReserveLatin American Equity Fund Morgan Stanley Liquidity Funds US Dollar Liquidity Fund – MS ReserveUS Advantage Fund Morgan Stanley Liquidity Funds US Dollar Treasury Liquidity Fund – MS ReserveUS Growth Fund Morgan Stanley Liquidity Funds US Dollar Treasury Liquidity Fund – MS ReserveUS Insight Fund Morgan Stanley Liquidity Funds US Dollar Treasury Liquidity Fund – MS ReserveUS Property Fund Morgan Stanley Liquidity Funds US Dollar Treasury Liquidity Fund – MS ReserveAbsolute Return Fixed Income Fund Morgan Stanley Liquidity Funds Euro Liquidity Fund – MS ReserveAsian Fixed Income Opportunities Fund Morgan Stanley Liquidity Funds US Dollar Liquidity Fund – MS ReserveEmerging Markets Corporate Debt Fund Morgan Stanley Liquidity Funds US Dollar Liquidity Fund – MS ReserveEmerging Markets Debt Fund Morgan Stanley Liquidity Funds US Dollar Liquidity Fund – MS ReserveEmerging Markets Domestic Debt Fund Morgan Stanley Liquidity Funds US Dollar Liquidity Fund – MS ReserveEmerging Markets Fixed Income Opportunities Fund Morgan Stanley Liquidity Funds US Dollar Liquidity Fund – MS ReserveEuro Bond Fund Morgan Stanley Liquidity Funds Euro Liquidity Fund – MS ReserveEuro Corporate Bond Fund Morgan Stanley Liquidity Funds Euro Liquidity Fund – MS ReserveEuro Corporate Bond Fund Morgan Stanley Liquidity Funds US Dollar Liquidity Fund – MS ReserveEuro Strategic Bond Fund Morgan Stanley Liquidity Funds Euro Liquidity Fund – MS ReserveEuro Strategic Bond Fund Morgan Stanley Liquidity Funds US Dollar Liquidity Fund – MS ReserveEuropean Currencies High Yield Bond Fund Morgan Stanley Liquidity Funds Euro Liquidity Fund – MS ReserveEuropean Currencies High Yield Bond Fund Morgan Stanley Liquidity Funds US Dollar Liquidity Fund – MS ReserveGlobal Bond Fund Morgan Stanley Liquidity Funds Euro Liquidity Fund – MS ReserveGlobal Bond Fund Morgan Stanley Liquidity Funds US Dollar Liquidity Fund – MS ReserveGlobal Buy and Hold 2020 Bond Fund Morgan Stanley Liquidity Funds Euro Liquidity Fund – MS ReserveGlobal Buy and Maintain Bond Fund Morgan Stanley Liquidity Funds US Dollar Liquidity Fund – MS ReserveGlobal Convertible Bond Fund Morgan Stanley Liquidity Funds US Dollar Liquidity Fund – MS ReserveGlobal Credit Fund Morgan Stanley Liquidity Funds US Dollar Liquidity Fund – MS ReserveGlobal Fixed Income Opportunities Fund Morgan Stanley Liquidity Funds US Dollar Liquidity Fund – MS ReserveGlobal High Yield Bond Fund Morgan Stanley Liquidity Funds US Dollar Liquidity Fund – MS ReserveGlobal Mortgage Securities Fund Morgan Stanley Liquidity Funds US Dollar Liquidity Fund – MS ReserveGlobal Premier Credit Fund Morgan Stanley Liquidity Funds US Dollar Liquidity Fund – MS ReserveShort Maturity Euro Bond Fund Morgan Stanley Liquidity Funds Euro Liquidity Fund – MS ReserveDiversifi ed Alpha Plus Fund Morgan Stanley Liquidity Funds Euro Liquidity Fund – MS ReserveGlobal Balanced Risk Control Fund of Funds Morgan Stanley Liquidity Funds Euro Liquidity Fund – MS ReserveGlobal Multi-Asset Opportunities Fund (1) Morgan Stanley Liquidity Funds Euro Liquidity Fund – MS ReserveLiquid Alpha Capture Fund Morgan Stanley Liquidity Funds US Dollar Liquidity Fund – MS Reserve
(1) Formerly known as Diversifi ed Alpha Plus Low Volatility Fund prior to 20 June 2017.
Th e US Dollar Liquidity Fund (“the Feeder Fund”) is a feeder fund of the Morgan Stanley Liquidity Funds – US Dollar Liquidity Fund (“the Master Fund”), under the provisions of the UCITS Directive. Please refer to note 15 on page 372 for further details.
As at 30 June 2017, Morgan Stanley Investment Funds – Breakout Nations Fund, Morgan Stanley Investment Funds – Global Balanced Defensive Fund, Morgan Stanley Investment Funds – Global Balanced Fund, Morgan Stanley Investment Funds – Global Balanced Income Fund, Morgan Stanley Investment Funds – Global Balanced Risk Control Fund of Funds and Morgan Stanley Investment Funds – Global Multi-Asset Income Fund invested in the Funds, advised by the Investment Adviser or an affi liate, detailed in note 14 on pages 370 to 372.
ii) Transactions in relation to a placing and/or a new issue in which the affi liated company was a member of the underwriting syndicate.
All the transactions executed on behalf of the Company were entered into in the ordinary course of business and on normal commercial terms.
Th e affi liations of the Board of Directors of the Company are as follows:
Th e following Directors of Morgan Stanley Investment Funds Judith Eden, William Jones, Michael Griffi n, Henry Kelly, Andy Mack are also Directors of the Morgan Stanley Liquidity Funds.
Judith Eden1 and Andrew Mack, Directors of Morgan Stanley Investment Funds are also Directors of the Management Company Morgan Stanley Investment Management (ACD) Limited.
b) Th e Company has entered into a securities lending contract with Morgan Stanley & Co. International Limited which is under normal commercial terms. Th e arrangement is exclusive in relation to certain securities.
Securities lending income is allocated to each Fund based on the demand of the securities of each Fund that may be loaned during the period.
Th e following Funds received securities lending income from the above named affi liates under an exclusive arrangement:
Fund Name USD
Asian Equity Fund 78,372Asia-Pacifi c Equity Fund 32,638Emerging Markets Equity Fund 347,197European Equity Alpha Fund 91,655European Property Fund 24,254Eurozone Equity Alpha Fund 55,963Latin American Equity Fund 12,776Emerging Markets Corporate Debt Fund 55,097Emerging Markets Debt Fund 10,865Global Fixed Income Opportunities Fund 43,132
751,949
As at 30 June 2017, the following Funds of the Company were invested in Morgan Stanley Liquidity Funds, a UCITS advised by an affi liate of the Investment Adviser:
Fund Name Investments affi liated to the Investment Adviser
Asian Equity Fund Morgan Stanley Liquidity Funds US Dollar Liquidity Fund – MS ReserveAsia-Pacifi c Equity Fund Morgan Stanley Liquidity Funds US Dollar Liquidity Fund – MS ReserveAsian Property Fund Morgan Stanley Liquidity Funds US Dollar Treasury Liquidity Fund – MS ReserveEmerging Europe, Middle East and Africa Equity Fund Morgan Stanley Liquidity Funds Euro Liquidity Fund – MS ReserveEmerging Europe, Middle East and Africa Equity Fund Morgan Stanley Liquidity Funds US Dollar Liquidity Fund – MS ReserveEmerging Leaders Equity Fund Morgan Stanley Liquidity Funds US Dollar Liquidity Fund – MS ReserveEmerging Markets Equity Fund Morgan Stanley Liquidity Funds US Dollar Liquidity Fund – MS ReserveEuropean Champions Fund Morgan Stanley Liquidity Funds Euro Liquidity Fund – MS ReserveEuropean Equity Alpha Fund Morgan Stanley Liquidity Funds Euro Liquidity Fund – MS ReserveEuropean Property Fund Morgan Stanley Liquidity Funds Euro Liquidity Fund – MS ReserveEurozone Equity Alpha Fund Morgan Stanley Liquidity Funds Euro Liquidity Fund – MS Reserve
1 Judith Eden resigned as Director of the Management Company with effect from 30 June 2017.
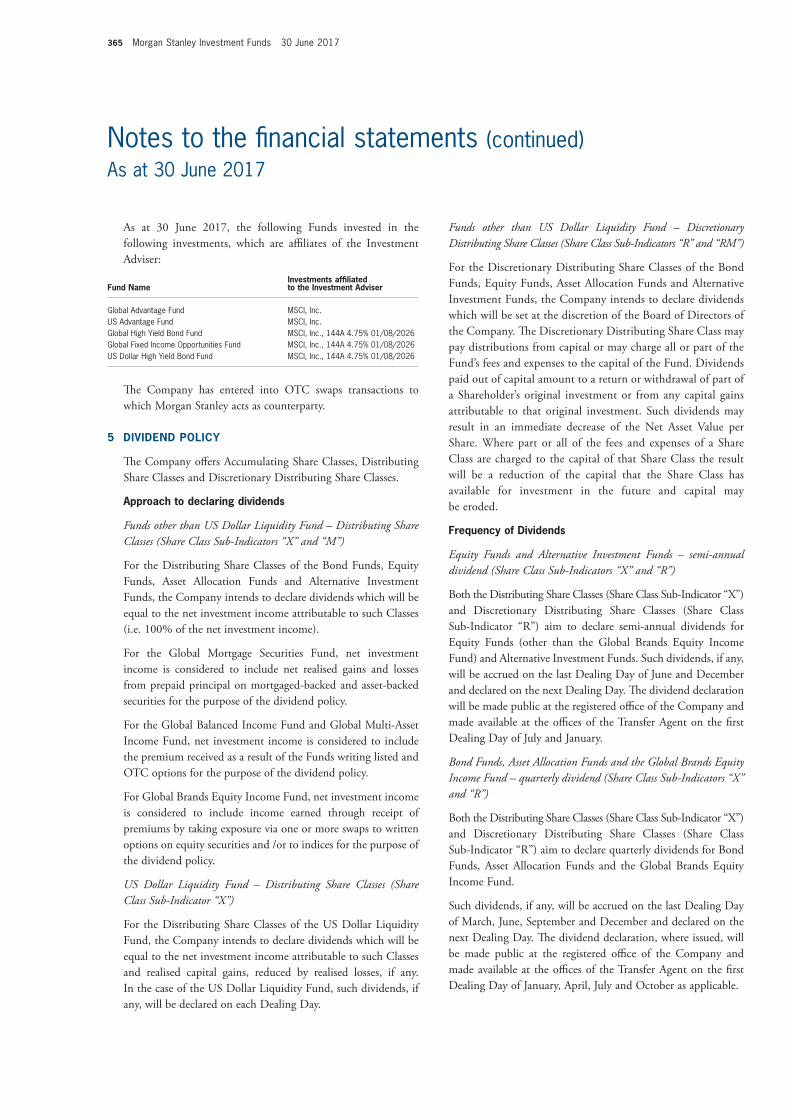
365 Morgan Stanley Investment Funds 30 June 2017
Notes to the fi nancial statements (continued)As at 30 June 2017
Funds other than US Dollar Liquidity Fund – Discretionary Distributing Share Classes (Share Class Sub-Indicators “R” and “RM”)
For the Discretionary Distributing Share Classes of the Bond Funds, Equity Funds, Asset Allocation Funds and Alternative Investment Funds, the Company intends to declare dividends which will be set at the discretion of the Board of Directors of the Company. Th e Discretionary Distributing Share Class may pay distributions from capital or may charge all or part of the Fund’s fees and expenses to the capital of the Fund. Dividends paid out of capital amount to a return or withdrawal of part of a Shareholder’s original investment or from any capital gains attributable to that original investment. Such dividends may result in an immediate decrease of the Net Asset Value per Share. Where part or all of the fees and expenses of a Share Class are charged to the capital of that Share Class the result will be a reduction of the capital that the Share Class has available for investment in the future and capital may be eroded.
Frequency of Dividends
Equity Funds and Alternative Investment Funds – semi-annual dividend (Share Class Sub-Indicators “X” and “R”)
Both the Distributing Share Classes (Share Class Sub-Indicator “X”) and Discretionary Distributing Share Classes (Share Class Sub-Indicator “R”) aim to declare semi-annual dividends for Equity Funds (other than the Global Brands Equity Income Fund) and Alternative Investment Funds. Such dividends, if any, will be accrued on the last Dealing Day of June and December and declared on the next Dealing Day. Th e dividend declaration will be made public at the registered offi ce of the Company and made available at the offi ces of the Transfer Agent on the fi rst Dealing Day of July and January.
Bond Funds, Asset Allocation Funds and the Global Brands Equity Income Fund – quarterly dividend (Share Class Sub-Indicators “X” and “R”)
Both the Distributing Share Classes (Share Class Sub-Indicator “X”) and Discretionary Distributing Share Classes (Share Class Sub-Indicator “R”) aim to declare quarterly dividends for Bond Funds, Asset Allocation Funds and the Global Brands Equity Income Fund.
Such dividends, if any, will be accrued on the last Dealing Day of March, June, September and December and declared on the next Dealing Day. Th e dividend declaration, where issued, will be made public at the registered offi ce of the Company and made available at the offi ces of the Transfer Agent on the fi rst Dealing Day of January, April, July and October as applicable.
As at 30 June 2017, the following Funds invested in the following investments, which are affi liates of the Investment Adviser:
Fund NameInvestments affi liated to the Investment Adviser
Global Advantage Fund MSCI, Inc.US Advantage Fund MSCI, Inc.Global High Yield Bond Fund MSCI, Inc., 144A 4.75% 01/08/2026Global Fixed Income Opportunities Fund MSCI, Inc., 144A 4.75% 01/08/2026US Dollar High Yield Bond Fund MSCI, Inc., 144A 4.75% 01/08/2026
Th e Company has entered into OTC swaps transactions to which Morgan Stanley acts as counterparty.
5 DIVIDEND POLICY
Th e Company off ers Accumulating Share Classes, Distributing Share Classes and Discretionary Distributing Share Classes.
Approach to declaring dividends
Funds other than US Dollar Liquidity Fund – Distributing Share Classes (Share Class Sub-Indicators “X” and “M”)
For the Distributing Share Classes of the Bond Funds, Equity Funds, Asset Allocation Funds and Alternative Investment Funds, the Company intends to declare dividends which will be equal to the net investment income attributable to such Classes (i.e. 100% of the net investment income).
For the Global Mortgage Securities Fund, net investment income is considered to include net realised gains and losses from prepaid principal on mortgaged-backed and asset-backed securities for the purpose of the dividend policy.
For the Global Balanced Income Fund and Global Multi-Asset Income Fund, net investment income is considered to include the premium received as a result of the Funds writing listed and OTC options for the purpose of the dividend policy.
For Global Brands Equity Income Fund, net investment income is considered to include income earned through receipt of premiums by taking exposure via one or more swaps to written options on equity securities and /or to indices for the purpose of the dividend policy.
US Dollar Liquidity Fund – Distributing Share Classes (Share Class Sub-Indicator “X”)
For the Distributing Share Classes of the US Dollar Liquidity Fund, the Company intends to declare dividends which will be equal to the net investment income attributable to such Classes and realised capital gains, reduced by realised losses, if any. In the case of the US Dollar Liquidity Fund, such dividends, if any, will be declared on each Dealing Day.
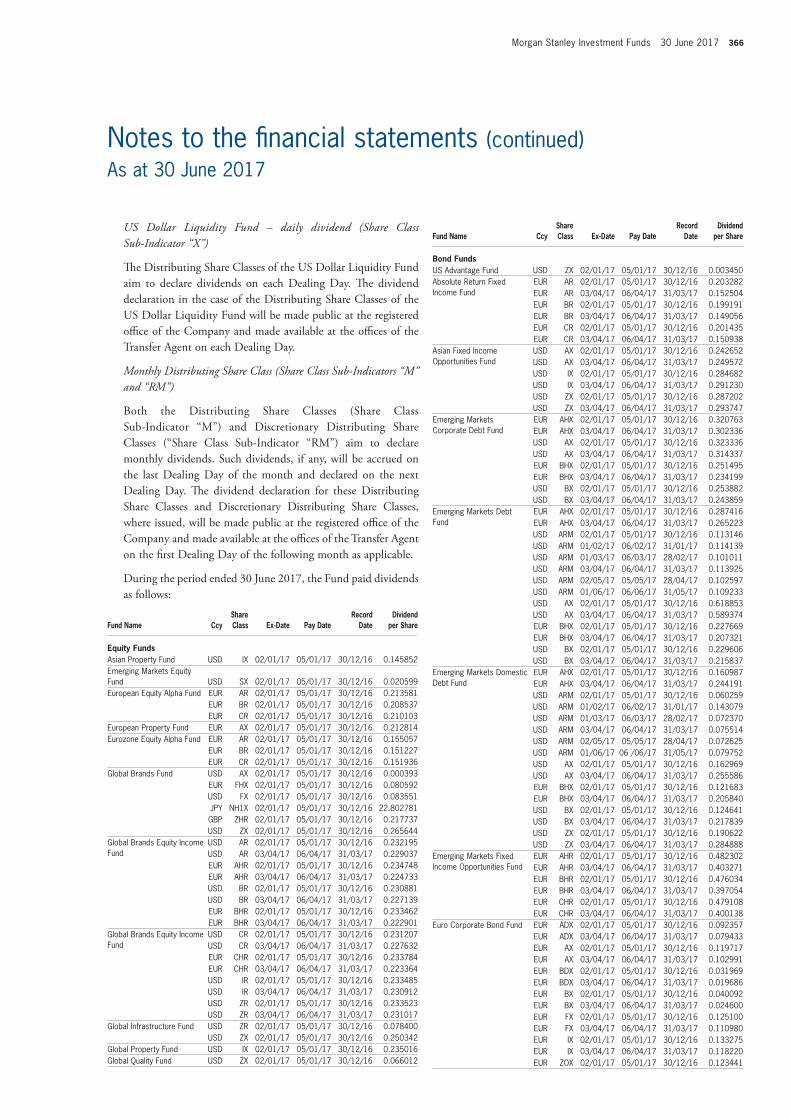
Morgan Stanley Investment Funds 30 June 2017 366
Notes to the fi nancial statements (continued)As at 30 June 2017
Fund Name CcyShare Class Ex-Date Pay Date
Record Date
Dividend per Share
Bond FundsUS Advantage Fund USD ZX 02/01/17 05/01/17 30/12/16 0.003450Absolute Return Fixed Income Fund
EUR AR 02/01/17 05/01/17 30/12/16 0.203282EUR AR 03/04/17 06/04/17 31/03/17 0.152504EUR BR 02/01/17 05/01/17 30/12/16 0.199191EUR BR 03/04/17 06/04/17 31/03/17 0.149056EUR CR 02/01/17 05/01/17 30/12/16 0.201435EUR CR 03/04/17 06/04/17 31/03/17 0.150938
Asian Fixed Income Opportunities Fund
USD AX 02/01/17 05/01/17 30/12/16 0.242652USD AX 03/04/17 06/04/17 31/03/17 0.249572USD IX 02/01/17 05/01/17 30/12/16 0.284682USD IX 03/04/17 06/04/17 31/03/17 0.291230USD ZX 02/01/17 05/01/17 30/12/16 0.287202USD ZX 03/04/17 06/04/17 31/03/17 0.293747
Emerging Markets Corporate Debt Fund
EUR AHX 02/01/17 05/01/17 30/12/16 0.320763EUR AHX 03/04/17 06/04/17 31/03/17 0.302336USD AX 02/01/17 05/01/17 30/12/16 0.323336USD AX 03/04/17 06/04/17 31/03/17 0.314337EUR BHX 02/01/17 05/01/17 30/12/16 0.251495EUR BHX 03/04/17 06/04/17 31/03/17 0.234199USD BX 02/01/17 05/01/17 30/12/16 0.253882USD BX 03/04/17 06/04/17 31/03/17 0.243859
Emerging Markets Debt Fund
EUR AHX 02/01/17 05/01/17 30/12/16 0.287416EUR AHX 03/04/17 06/04/17 31/03/17 0.265223USD ARM 02/01/17 05/01/17 30/12/16 0.113146USD ARM 01/02/17 06/02/17 31/01/17 0.114139USD ARM 01/03/17 06/03/17 28/02/17 0.101011USD ARM 03/04/17 06/04/17 31/03/17 0.113925USD ARM 02/05/17 05/05/17 28/04/17 0.102597USD ARM 01/06/17 06/06/17 31/05/17 0.109233USD AX 02/01/17 05/01/17 30/12/16 0.618853USD AX 03/04/17 06/04/17 31/03/17 0.589374EUR BHX 02/01/17 05/01/17 30/12/16 0.227669EUR BHX 03/04/17 06/04/17 31/03/17 0.207321USD BX 02/01/17 05/01/17 30/12/16 0.229606USD BX 03/04/17 06/04/17 31/03/17 0.215837
Emerging Markets DomesticDebt Fund
EUR AHX 02/01/17 05/01/17 30/12/16 0.160987EUR AHX 03/04/17 06/04/17 31/03/17 0.244191USD ARM 02/01/17 05/01/17 30/12/16 0.060259USD ARM 01/02/17 06/02/17 31/01/17 0.143079USD ARM 01/03/17 06/03/17 28/02/17 0.072370USD ARM 03/04/17 06/04/17 31/03/17 0.075514USD ARM 02/05/17 05/05/17 28/04/17 0.072625USD ARM 01/06/17 06 /06/17 31/05/17 0.079752USD AX 02/01/17 05/01/17 30/12/16 0.162969USD AX 03/04/17 06/04/17 31/03/17 0.255586EUR BHX 02/01/17 05/01/17 30/12/16 0.121683EUR BHX 03/04/17 06/04/17 31/03/17 0.205840USD BX 02/01/17 05/01/17 30/12/16 0.124641USD BX 03/04/17 06/04/17 31/03/17 0.217839USD ZX 02/01/17 05/01/17 30/12/16 0.190622USD ZX 03/04/17 06/04/17 31/03/17 0.284888
Emerging Markets Fixed Income Opportunities Fund
EUR AHR 02/01/17 05/01/17 30/12/16 0.482302EUR AHR 03/04/17 06/04/17 31/03/17 0.403271EUR BHR 02/01/17 05/01/17 30/12/16 0.476034EUR BHR 03/04/17 06/04/17 31/03/17 0.397054EUR CHR 02/01/17 05/01/17 30/12/16 0.479108EUR CHR 03/04/17 06/04/17 31/03/17 0.400138
Euro Corporate Bond Fund EUR ADX 02/01/17 05/01/17 30/12/16 0.092357EUR ADX 03/04/17 06/04/17 31/03/17 0.079433EUR AX 02/01/17 05/01/17 30/12/16 0.119717EUR AX 03/04/17 06/04/17 31/03/17 0.102991EUR BDX 02/01/17 05/01/17 30/12/16 0.031969EUR BDX 03/04/17 06/04/17 31/03/17 0.019686EUR BX 02/01/17 05/01/17 30/12/16 0.040092EUR BX 03/04/17 06/04/17 31/03/17 0.024600EUR FX 02/01/17 05/01/17 30/12/16 0.125100EUR FX 03/04/17 06/04/17 31/03/17 0.110980EUR IX 02/01/17 05/01/17 30/12/16 0.133275EUR IX 03/04/17 06/04/17 31/03/17 0.118220EUR ZOX 02/01/17 05/01/17 30/12/16 0.123441
US Dollar Liquidity Fund – daily dividend (Share Class Sub-Indicator “X”)
Th e Distributing Share Classes of the US Dollar Liquidity Fund aim to declare dividends on each Dealing Day. Th e dividend declaration in the case of the Distributing Share Classes of the US Dollar Liquidity Fund will be made public at the registered offi ce of the Company and made available at the offi ces of the Transfer Agent on each Dealing Day.
Monthly Distributing Share Class (Share Class Sub-Indicators “M” and “RM”)
Both the Distributing Share Classes (Share Class Sub-Indicator “M”) and Discretionary Distributing Share Classes (“Share Class Sub-Indicator “RM”) aim to declare monthly dividends. Such dividends, if any, will be accrued on the last Dealing Day of the month and declared on the next Dealing Day. Th e dividend declaration for these Distributing Share Classes and Discretionary Distributing Share Classes, where issued, will be made public at the registered offi ce of the Company and made available at the offi ces of the Transfer Agent on the fi rst Dealing Day of the following month as applicable.
During the period ended 30 June 2017, the Fund paid dividends as follows:
Fund Name CcyShare Class Ex-Date Pay Date
Record Date
Dividend per Share
Equity FundsAsian Property Fund USD IX 02/01/17 05/01/17 30/12/16 0.145852Emerging Markets Equity Fund USD SX 02/01/17 05/01/17 30/12/16 0.020599European Equity Alpha Fund EUR AR 02/01/17 05/01/17 30/12/16 0.213581
EUR BR 02/01/17 05/01/17 30/12/16 0.208537EUR CR 02/01/17 05/01/17 30/12/16 0.210103
European Property Fund EUR AX 02/01/17 05/01/17 30/12/16 0.212814Eurozone Equity Alpha Fund EUR AR 02/01/17 05/01/17 30/12/16 0.155057
EUR BR 02/01/17 05/01/17 30/12/16 0.151227EUR CR 02/01/17 05/01/17 30/12/16 0.151936
Global Brands Fund USD AX 02/01/17 05/01/17 30/12/16 0.000393EUR FHX 02/01/17 05/01/17 30/12/16 0.080592USD FX 02/01/17 05/01/17 30/12/16 0.083551JPY NH1X 02/01/17 05/01/17 30/12/16 22.802781GBP ZHR 02/01/17 05/01/17 30/12/16 0.217737USD ZX 02/01/17 05/01/17 30/12/16 0.265644
Global Brands Equity Income Fund
USD AR 02/01/17 05/01/17 30/12/16 0.232195USD AR 03/04/17 06/04/17 31/03/17 0.229037EUR AHR 02/01/17 05/01/17 30/12/16 0.234748EUR AHR 03/04/17 06/04/17 31/03/17 0.224733USD BR 02/01/17 05/01/17 30/12/16 0.230881USD BR 03/04/17 06/04/17 31/03/17 0.227139EUR BHR 02/01/17 05/01/17 30/12/16 0.233462EUR BHR 03/04/17 06/04/17 31/03/17 0.222901
Global Brands Equity Income Fund
USD CR 02/01/17 05/01/17 30/12/16 0.231207USD CR 03/04/17 06/04/17 31/03/17 0.227632EUR CHR 02/01/17 05/01/17 30/12/16 0.233784EUR CHR 03/04/17 06/04/17 31/03/17 0.223364USD IR 02/01/17 05/01/17 30/12/16 0.233485USD IR 03/04/17 06/04/17 31/03/17 0.230912USD ZR 02/01/17 05/01/17 30/12/16 0.233523USD ZR 03/04/17 06/04/17 31/03/17 0.231017
Global Infrastructure Fund USD ZR 02/01/17 05/01/17 30/12/16 0.078400USD ZX 02/01/17 05/01/17 30/12/16 0.250342
Global Property Fund USD IX 02/01/17 05/01/17 30/12/16 0.235016Global Quality Fund USD ZX 02/01/17 05/01/17 30/12/16 0.066012
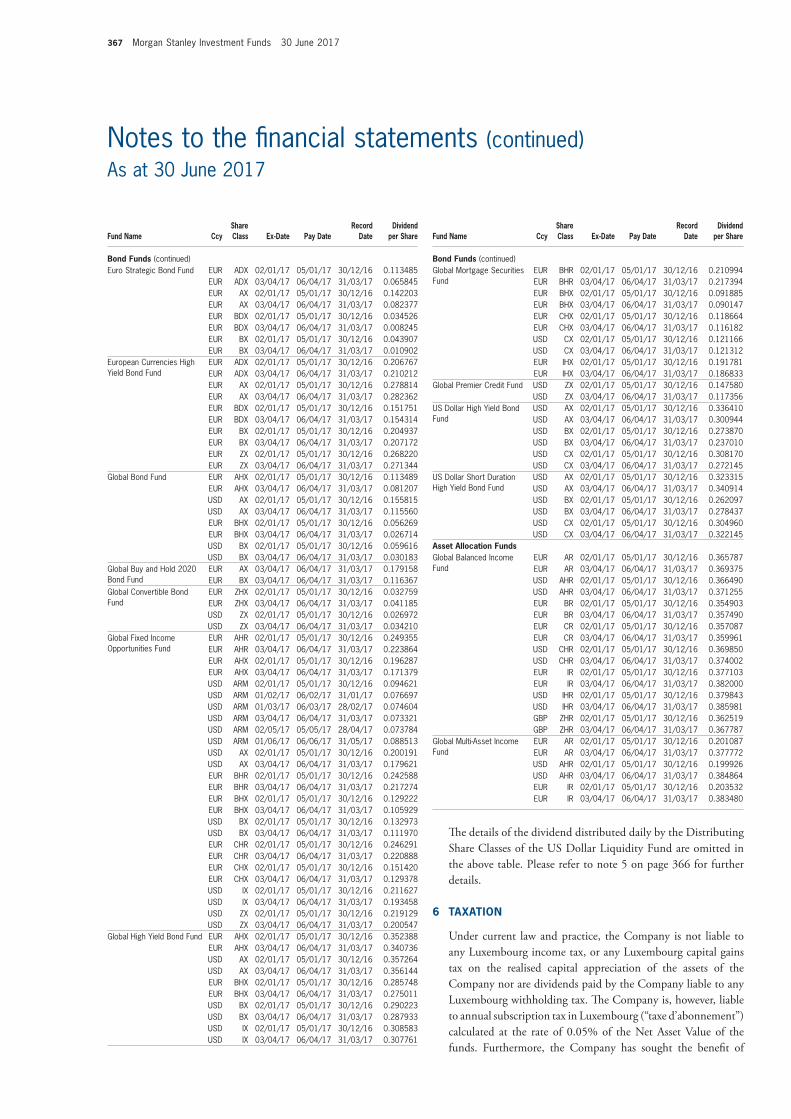
367 Morgan Stanley Investment Funds 30 June 2017
Notes to the fi nancial statements (continued)As at 30 June 2017
Fund Name CcyShare Class Ex-Date Pay Date
Record Date
Dividend per Share
Bond Funds (continued)Global Mortgage Securities Fund
EUR BHR 02/01/17 05/01/17 30/12/16 0.210994EUR BHR 03/04/17 06/04/17 31/03/17 0.217394EUR BHX 02/01/17 05/01/17 30/12/16 0.091885EUR BHX 03/04/17 06/04/17 31/03/17 0.090147EUR CHX 02/01/17 05/01/17 30/12/16 0.118664EUR CHX 03/04/17 06/04/17 31/03/17 0.116182USD CX 02/01/17 05/01/17 30/12/16 0.121166USD CX 03/04/17 06/04/17 31/03/17 0.121312EUR IHX 02/01/17 05/01/17 30/12/16 0.191781EUR IHX 03/04/17 06/04/17 31/03/17 0.186833
Global Premier Credit Fund USD ZX 02/01/17 05/01/17 30/12/16 0.147580USD ZX 03/04/17 06/04/17 31/03/17 0.117356
US Dollar High Yield Bond Fund
USD AX 02/01/17 05/01/17 30/12/16 0.336410USD AX 03/04/17 06/04/17 31/03/17 0.300944USD BX 02/01/17 05/01/17 30/12/16 0.273870USD BX 03/04/17 06/04/17 31/03/17 0.237010USD CX 02/01/17 05/01/17 30/12/16 0.308170USD CX 03/04/17 06/04/17 31/03/17 0.272145
US Dollar Short Duration High Yield Bond Fund
USD AX 02/01/17 05/01/17 30/12/16 0.323315USD AX 03/04/17 06/04/17 31/03/17 0.340914USD BX 02/01/17 05/01/17 30/12/16 0.262097USD BX 03/04/17 06/04/17 31/03/17 0.278437USD CX 02/01/17 05/01/17 30/12/16 0.304960USD CX 03/04/17 06/04/17 31/03/17 0.322145
Asset Allocation FundsGlobal Balanced Income Fund
EUR AR 02/01/17 05/01/17 30/12/16 0.365787EUR AR 03/04/17 06/04/17 31/03/17 0.369375USD AHR 02/01/17 05/01/17 30/12/16 0.366490USD AHR 03/04/17 06/04/17 31/03/17 0.371255EUR BR 02/01/17 05/01/17 30/12/16 0.354903EUR BR 03/04/17 06/04/17 31/03/17 0.357490EUR CR 02/01/17 05/01/17 30/12/16 0.357087EUR CR 03/04/17 06/04/17 31/03/17 0.359961USD CHR 02/01/17 05/01/17 30/12/16 0.369850USD CHR 03/04/17 06/04/17 31/03/17 0.374002EUR IR 02/01/17 05/01/17 30/12/16 0.377103EUR IR 03/04/17 06/04/17 31/03/17 0.382000USD IHR 02/01/17 05/01/17 30/12/16 0.379843USD IHR 03/04/17 06/04/17 31/03/17 0.385981GBP ZHR 02/01/17 05/01/17 30/12/16 0.362519GBP ZHR 03/04/17 06/04/17 31/03/17 0.367787
Global Multi-Asset Income Fund
EUR AR 02/01/17 05/01/17 30/12/16 0.201087EUR AR 03/04/17 06/04/17 31/03/17 0.377772USD AHR 02/01/17 05/01/17 30/12/16 0.199926USD AHR 03/04/17 06/04/17 31/03/17 0.384864EUR IR 02/01/17 05/01/17 30/12/16 0.203532EUR IR 03/04/17 06/04/17 31/03/17 0.383480
Th e details of the dividend distributed daily by the Distributing Share Classes of the US Dollar Liquidity Fund are omitted in the above table. Please refer to note 5 on page 366 for further details.
6 TAXATION
Under current law and practice, the Company is not liable to any Luxembourg income tax, or any Luxembourg capital gains tax on the realised capital appreciation of the assets of the Company nor are dividends paid by the Company liable to any Luxembourg withholding tax. Th e Company is, however, liable to annual subscription tax in Luxembourg (“taxe d’abonnement”) calculated at the rate of 0.05% of the Net Asset Value of the funds. Furthermore, the Company has sought the benefi t of
Fund Name CcyShare Class Ex-Date Pay Date
Record Date
Dividend per Share
Bond Funds (continued)Euro Strategic Bond Fund EUR ADX 02/01/17 05/01/17 30/12/16 0.113485
EUR ADX 03/04/17 06/04/17 31/03/17 0.065845EUR AX 02/01/17 05/01/17 30/12/16 0.142203EUR AX 03/04/17 06/04/17 31/03/17 0.082377EUR BDX 02/01/17 05/01/17 30/12/16 0.034526EUR BDX 03/04/17 06/04/17 31/03/17 0.008245EUR BX 02/01/17 05/01/17 30/12/16 0.043907EUR BX 03/04/17 06/04/17 31/03/17 0.010902
European Currencies High Yield Bond Fund
EUR ADX 02/01/17 05/01/17 30/12/16 0.206767EUR ADX 03/04/17 06/04/17 31/03/17 0.210212EUR AX 02/01/17 05/01/17 30/12/16 0.278814EUR AX 03/04/17 06/04/17 31/03/17 0.282362EUR BDX 02/01/17 05/01/17 30/12/16 0.151751EUR BDX 03/04/17 06/04/17 31/03/17 0.154314EUR BX 02/01/17 05/01/17 30/12/16 0.204937EUR BX 03/04/17 06/04/17 31/03/17 0.207172EUR ZX 02/01/17 05/01/17 30/12/16 0.268220EUR ZX 03/04/17 06/04/17 31/03/17 0.271344
Global Bond Fund EUR AHX 02/01/17 05/01/17 30/12/16 0.113489EUR AHX 03/04/17 06/04/17 31/03/17 0.081207USD AX 02/01/17 05/01/17 30/12/16 0.155815USD AX 03/04/17 06/04/17 31/03/17 0.115560EUR BHX 02/01/17 05/01/17 30/12/16 0.056269EUR BHX 03/04/17 06/04/17 31/03/17 0.026714USD BX 02/01/17 05/01/17 30/12/16 0.059616USD BX 03/04/17 06/04/17 31/03/17 0.030183
Global Buy and Hold 2020 Bond Fund
EUR AX 03/04/17 06/04/17 31/03/17 0.179158EUR BX 03/04/17 06/04/17 31/03/17 0.116367
Global Convertible Bond Fund
EUR ZHX 02/01/17 05/01/17 30/12/16 0.032759EUR ZHX 03/04/17 06/04/17 31/03/17 0.041185USD ZX 02/01/17 05/01/17 30/12/16 0.026972USD ZX 03/04/17 06/04/17 31/03/17 0.034210
Global Fixed Income Opportunities Fund
EUR AHR 02/01/17 05/01/17 30/12/16 0.249355EUR AHR 03/04/17 06/04/17 31/03/17 0.223864EUR AHX 02/01/17 05/01/17 30/12/16 0.196287EUR AHX 03/04/17 06/04/17 31/03/17 0.171379USD ARM 02/01/17 05/01/17 30/12/16 0.094621USD ARM 01/02/17 06/02/17 31/01/17 0.076697USD ARM 01/03/17 06/03/17 28/02/17 0.074604USD ARM 03/04/17 06/04/17 31/03/17 0.073321USD ARM 02/05/17 05/05/17 28/04/17 0.073784USD ARM 01/06/17 06/06/17 31/05/17 0.088513USD AX 02/01/17 05/01/17 30/12/16 0.200191USD AX 03/04/17 06/04/17 31/03/17 0.179621EUR BHR 02/01/17 05/01/17 30/12/16 0.242588EUR BHR 03/04/17 06/04/17 31/03/17 0.217274EUR BHX 02/01/17 05/01/17 30/12/16 0.129222EUR BHX 03/04/17 06/04/17 31/03/17 0.105929USD BX 02/01/17 05/01/17 30/12/16 0.132973USD BX 03/04/17 06/04/17 31/03/17 0.111970EUR CHR 02/01/17 05/01/17 30/12/16 0.246291EUR CHR 03/04/17 06/04/17 31/03/17 0.220888EUR CHX 02/01/17 05/01/17 30/12/16 0.151420EUR CHX 03/04/17 06/04/17 31/03/17 0.129378USD IX 02/01/17 05/01/17 30/12/16 0.211627USD IX 03/04/17 06/04/17 31/03/17 0.193458USD ZX 02/01/17 05/01/17 30/12/16 0.219129USD ZX 03/04/17 06/04/17 31/03/17 0.200547
Global High Yield Bond Fund EUR AHX 02/01/17 05/01/17 30/12/16 0.352388EUR AHX 03/04/17 06/04/17 31/03/17 0.340736USD AX 02/01/17 05/01/17 30/12/16 0.357264USD AX 03/04/17 06/04/17 31/03/17 0.356144EUR BHX 02/01/17 05/01/17 30/12/16 0.285748EUR BHX 03/04/17 06/04/17 31/03/17 0.275011USD BX 02/01/17 05/01/17 30/12/16 0.290223USD BX 03/04/17 06/04/17 31/03/17 0.287933USD IX 02/01/17 05/01/17 30/12/16 0.308583USD IX 03/04/17 06/04/17 31/03/17 0.307761
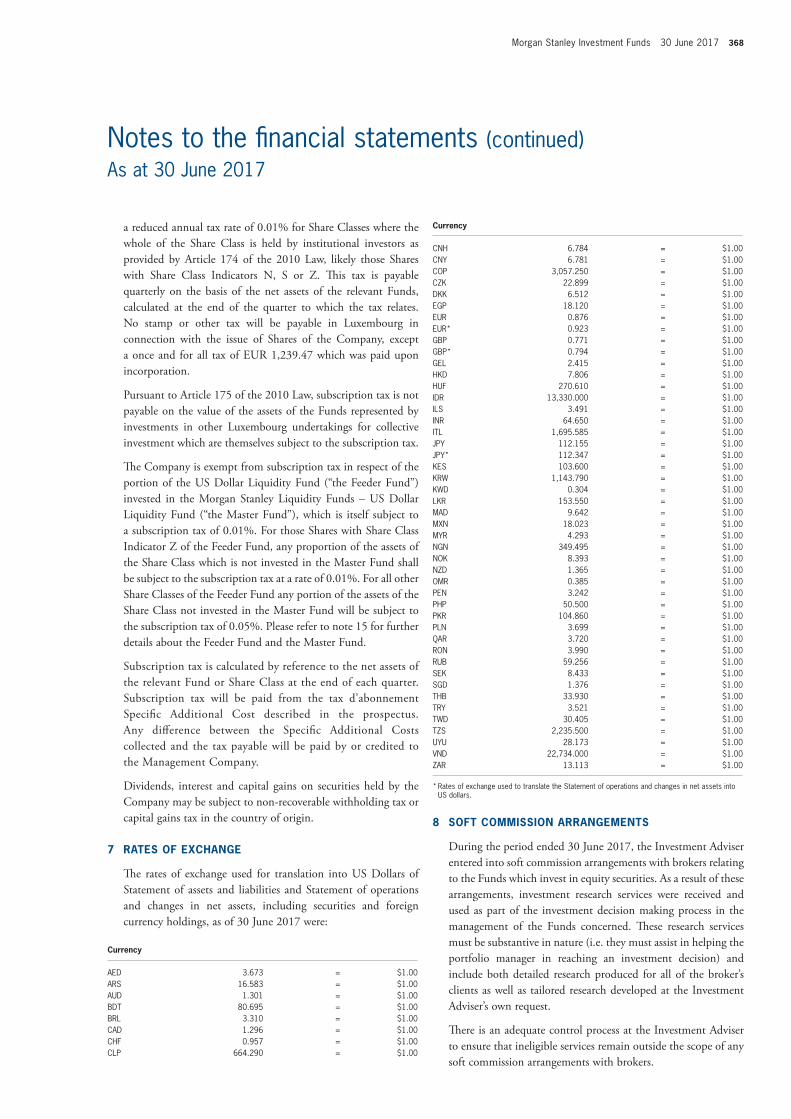
Morgan Stanley Investment Funds 30 June 2017 368
Notes to the fi nancial statements (continued)As at 30 June 2017
Currency
CNH 6.784 = $1.00CNY 6.781 = $1.00COP 3,057.250 = $1.00CZK 22.899 = $1.00DKK 6.512 = $1.00EGP 18.120 = $1.00EUR 0.876 = $1.00EUR* 0.923 = $1.00GBP 0.771 = $1.00GBP* 0.794 = $1.00GEL 2.415 = $1.00HKD 7.806 = $1.00HUF 270.610 = $1.00IDR 13,330.000 = $1.00ILS 3.491 = $1.00INR 64.650 = $1.00ITL 1,695.585 = $1.00JPY 112.155 = $1.00JPY* 112.347 = $1.00KES 103.600 = $1.00KRW 1,143.790 = $1.00KWD 0.304 = $1.00LKR 153.550 = $1.00MAD 9.642 = $1.00MXN 18.023 = $1.00MYR 4.293 = $1.00NGN 349.495 = $1.00NOK 8.393 = $1.00NZD 1.365 = $1.00OMR 0.385 = $1.00PEN 3.242 = $1.00PHP 50.500 = $1.00PKR 104.860 = $1.00PLN 3.699 = $1.00QAR 3.720 = $1.00RON 3.990 = $1.00RUB 59.256 = $1.00SEK 8.433 = $1.00SGD 1.376 = $1.00THB 33.930 = $1.00TRY 3.521 = $1.00TWD 30.405 = $1.00TZS 2,235.500 = $1.00UYU 28.173 = $1.00VND 22,734.000 = $1.00ZAR 13.113 = $1.00
* Rates of exchange used to translate the Statement of operations and changes in net assets into US dollars.
8 SOFT COMMISSION ARRANGEMENTS
During the period ended 30 June 2017, the Investment Adviser entered into soft commission arrangements with brokers relating to the Funds which invest in equity securities. As a result of these arrangements, investment research services were received and used as part of the investment decision making process in the management of the Funds concerned. Th ese research services must be substantive in nature (i.e. they must assist in helping the portfolio manager in reaching an investment decision) and include both detailed research produced for all of the broker’s clients as well as tailored research developed at the Investment Adviser’s own request.
Th ere is an adequate control process at the Investment Adviser to ensure that ineligible services remain outside the scope of any soft commission arrangements with brokers.
a reduced annual tax rate of 0.01% for Share Classes where the whole of the Share Class is held by institutional investors as provided by Article 174 of the 2010 Law, likely those Shares with Share Class Indicators N, S or Z. Th is tax is payable quarterly on the basis of the net assets of the relevant Funds, calculated at the end of the quarter to which the tax relates. No stamp or other tax will be payable in Luxembourg in connection with the issue of Shares of the Company, except a once and for all tax of EUR 1,239.47 which was paid upon incorporation.
Pursuant to Article 175 of the 2010 Law, subscription tax is not payable on the value of the assets of the Funds represented by investments in other Luxembourg undertakings for collective investment which are themselves subject to the subscription tax.
Th e Company is exempt from subscription tax in respect of the portion of the US Dollar Liquidity Fund (“the Feeder Fund”) invested in the Morgan Stanley Liquidity Funds – US Dollar Liquidity Fund (“the Master Fund”), which is itself subject to a subscription tax of 0.01%. For those Shares with Share Class Indicator Z of the Feeder Fund, any proportion of the assets of the Share Class which is not invested in the Master Fund shall be subject to the subscription tax at a rate of 0.01%. For all other Share Classes of the Feeder Fund any portion of the assets of the Share Class not invested in the Master Fund will be subject to the subscription tax of 0.05%. Please refer to note 15 for further details about the Feeder Fund and the Master Fund.
Subscription tax is calculated by reference to the net assets of the relevant Fund or Share Class at the end of each quarter. Subscription tax will be paid from the tax d’abonnement Specifi c Additional Cost described in the prospectus. Any diff erence between the Specifi c Additional Costs collected and the tax payable will be paid by or credited to the Management Company.
Dividends, interest and capital gains on securities held by the Company may be subject to non-recoverable withholding tax or capital gains tax in the country of origin.
7 RATES OF EXCHANGE
Th e rates of exchange used for translation into US Dollars of Statement of assets and liabilities and Statement of operations and changes in net assets, including securities and foreign currency holdings, as of 30 June 2017 were:
Currency
AED 3.673 = $1.00ARS 16.583 = $1.00AUD 1.301 = $1.00BDT 80.695 = $1.00BRL 3.310 = $1.00CAD 1.296 = $1.00CHF 0.957 = $1.00CLP 664.290 = $1.00
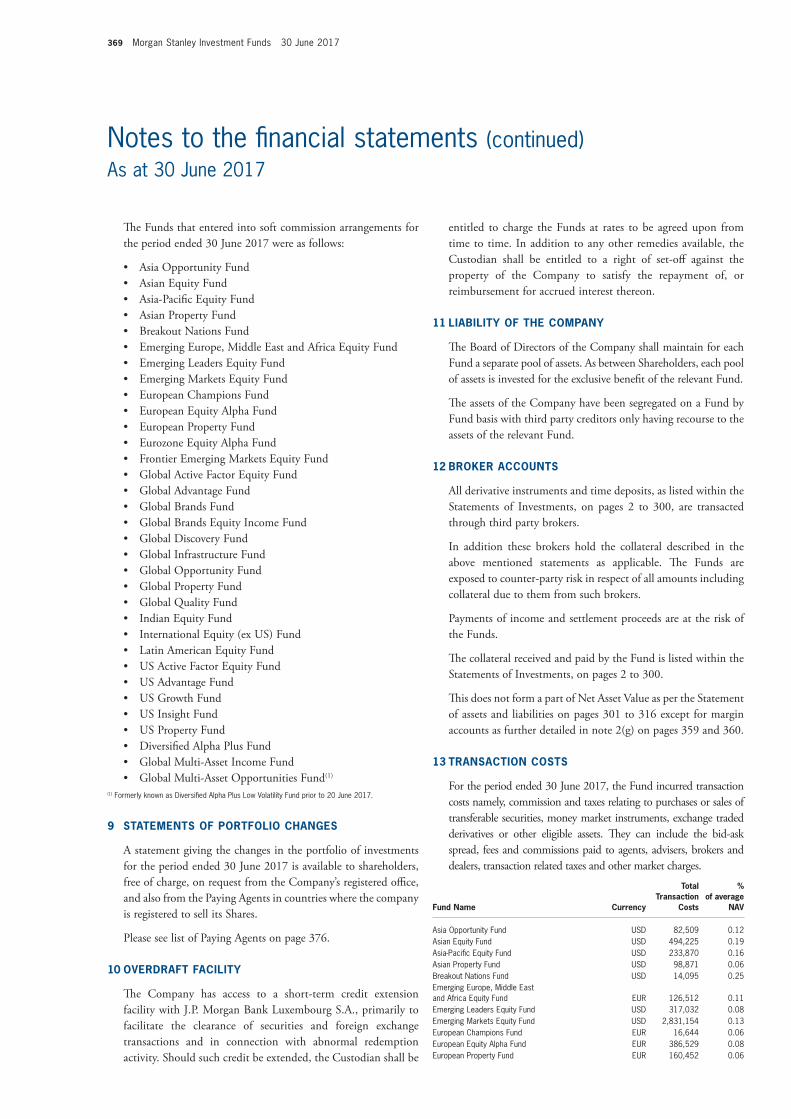
369 Morgan Stanley Investment Funds 30 June 2017
Notes to the fi nancial statements (continued)As at 30 June 2017
entitled to charge the Funds at rates to be agreed upon from time to time. In addition to any other remedies available, the Custodian shall be entitled to a right of set-off against the property of the Company to satisfy the repayment of, or reimbursement for accrued interest thereon.
11 LIABILITY OF THE COMPANY
Th e Board of Directors of the Company shall maintain for each Fund a separate pool of assets. As between Shareholders, each pool of assets is invested for the exclusive benefi t of the relevant Fund.
Th e assets of the Company have been segregated on a Fund by Fund basis with third party creditors only having recourse to the assets of the relevant Fund.
12 BROKER ACCOUNTS
All derivative instruments and time deposits, as listed within the Statements of Investments, on pages 2 to 300, are transacted through third party brokers.
In addition these brokers hold the collateral described in the above mentioned statements as applicable. Th e Funds are exposed to counter-party risk in respect of all amounts including collateral due to them from such brokers.
Payments of income and settlement proceeds are at the risk of the Funds.
Th e collateral received and paid by the Fund is listed within the Statements of Investments, on pages 2 to 300.
Th is does not form a part of Net Asset Value as per the Statement of assets and liabilities on pages 301 to 316 except for margin accounts as further detailed in note 2(g) on pages 359 and 360.
13 TRANSACTION COSTS
For the period ended 30 June 2017, the Fund incurred transaction costs namely, commission and taxes relating to purchases or sales of transferable securities, money market instruments, exchange traded derivatives or other eligible assets. Th ey can include the bid-ask spread, fees and commissions paid to agents, advisers, brokers and dealers, transaction related taxes and other market charges.
Fund Name Currency
Total Transaction
Costs
% of average
NAV
Asia Opportunity Fund USD 82,509 0.12Asian Equity Fund USD 494,225 0.19Asia-Pacifi c Equity Fund USD 233,870 0.16Asian Property Fund USD 98,871 0.06Breakout Nations Fund USD 14,095 0.25Emerging Europe, Middle East and Africa Equity Fund EUR 126,512 0.11Emerging Leaders Equity Fund USD 317,032 0.08Emerging Markets Equity Fund USD 2,831,154 0.13European Champions Fund EUR 16,644 0.06European Equity Alpha Fund EUR 386,529 0.08European Property Fund EUR 160,452 0.06
Th e Funds that entered into soft commission arrangements for the period ended 30 June 2017 were as follows:
• Asia Opportunity Fund • Asian Equity Fund • Asia-Pacifi c Equity Fund • Asian Property Fund • Breakout Nations Fund • Emerging Europe, Middle East and Africa Equity Fund • Emerging Leaders Equity Fund • Emerging Markets Equity Fund • European Champions Fund • European Equity Alpha Fund • European Property Fund • Eurozone Equity Alpha Fund • Frontier Emerging Markets Equity Fund • Global Active Factor Equity Fund • Global Advantage Fund • Global Brands Fund • Global Brands Equity Income Fund • Global Discovery Fund • Global Infrastructure Fund • Global Opportunity Fund • Global Property Fund • Global Quality Fund • Indian Equity Fund • International Equity (ex US) Fund • Latin American Equity Fund • US Active Factor Equity Fund • US Advantage Fund • US Growth Fund • US Insight Fund • US Property Fund • Diversifi ed Alpha Plus Fund • Global Multi-Asset Income Fund • Global Multi-Asset Opportunities Fund(1)
(1) Formerly known as Diversifi ed Alpha Plus Low Volatility Fund prior to 20 June 2017.
9 STATEMENTS OF PORTFOLIO CHANGES
A statement giving the changes in the portfolio of investments for the period ended 30 June 2017 is available to shareholders, free of charge, on request from the Company’s registered offi ce, and also from the Paying Agents in countries where the company is registered to sell its Shares.
Please see list of Paying Agents on page 376.
10 OVERDRAFT FACILITY
Th e Company has access to a short-term credit extension facility with J.P. Morgan Bank Luxembourg S.A., primarily to facilitate the clearance of securities and foreign exchange transactions and in connection with abnormal redemption activity. Should such credit be extended, the Custodian shall be
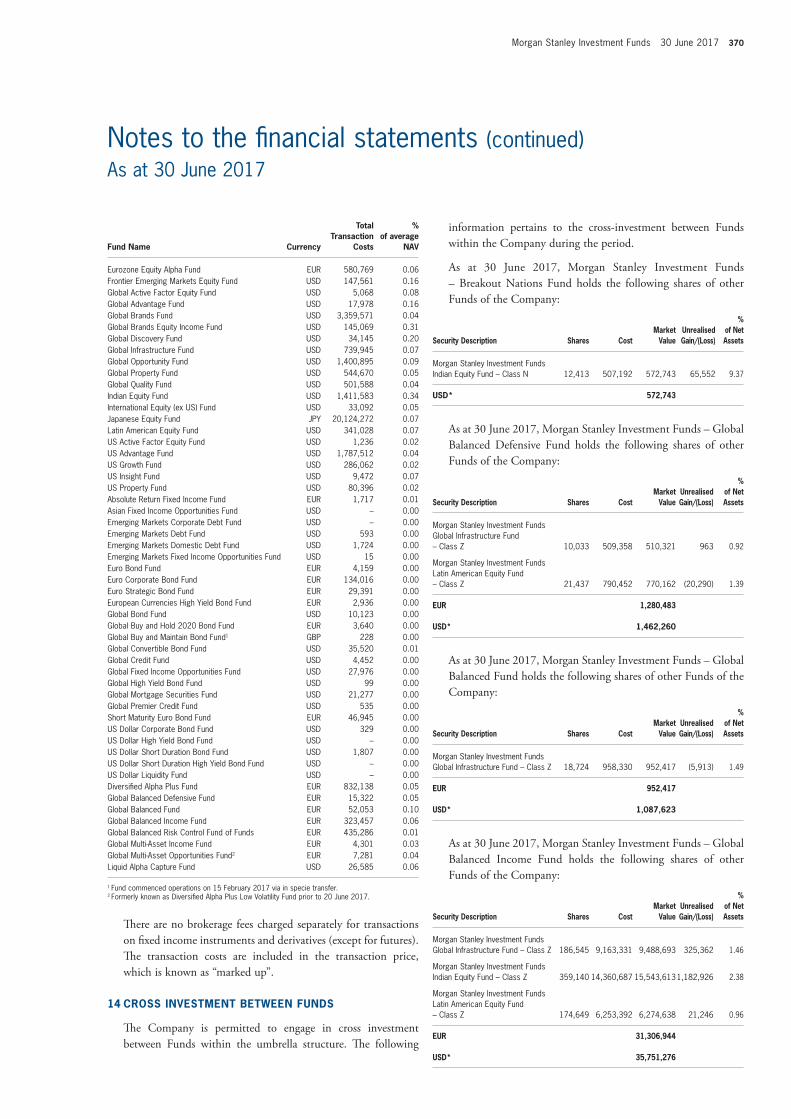
Morgan Stanley Investment Funds 30 June 2017 370
Notes to the fi nancial statements (continued)As at 30 June 2017
information pertains to the cross-investment between Funds within the Company during the period.
As at 30 June 2017, Morgan Stanley Investment Funds – Breakout Nations Fund holds the following shares of other Funds of the Company:
Security Description Shares CostMarket
ValueUnrealised Gain/(Loss)
% of Net Assets
Morgan Stanley Investment Funds Indian Equity Fund – Class N 12,413 507,192 572,743 65,552 9.37
USD* 572,743
As at 30 June 2017, Morgan Stanley Investment Funds – Global Balanced Defensive Fund holds the following shares of other Funds of the Company:
Security Description Shares CostMarket
ValueUnrealised Gain/(Loss)
% of Net Assets
Morgan Stanley Investment Funds Global Infrastructure Fund – Class Z 10,033 509,358 510,321 963 0.92
Morgan Stanley Investment Funds Latin American Equity Fund – Class Z 21,437 790,452 770,162 (20,290) 1.39
EUR 1,280,483
USD* 1,462,260
As at 30 June 2017, Morgan Stanley Investment Funds – Global Balanced Fund holds the following shares of other Funds of the Company:
Security Description Shares CostMarket
ValueUnrealised Gain/(Loss)
% of Net Assets
Morgan Stanley Investment Funds Global Infrastructure Fund – Class Z 18,724 958,330 952,417 (5,913) 1.49
EUR 952,417
USD* 1,087,623
As at 30 June 2017, Morgan Stanley Investment Funds – Global Balanced Income Fund holds the following shares of other Funds of the Company:
Security Description Shares CostMarket
ValueUnrealised Gain/(Loss)
% of Net Assets
Morgan Stanley Investment Funds Global Infrastructure Fund – Class Z 186,545 9,163,331 9,488,693 325,362 1.46
Morgan Stanley Investment Funds Indian Equity Fund – Class Z 359,140 14,360,687 15,543,6131,182,926 2.38
Morgan Stanley Investment Funds Latin American Equity Fund – Class Z 174,649 6,253,392 6,274,638 21,246 0.96
EUR 31,306,944
USD* 35,751,276
Fund Name Currency
Total Transaction
Costs
% of average
NAV
Eurozone Equity Alpha Fund EUR 580,769 0.06Frontier Emerging Markets Equity Fund USD 147,561 0.16Global Active Factor Equity Fund USD 5,068 0.08Global Advantage Fund USD 17,978 0.16Global Brands Fund USD 3,359,571 0.04Global Brands Equity Income Fund USD 145,069 0.31Global Discovery Fund USD 34,145 0.20Global Infrastructure Fund USD 739,945 0.07Global Opportunity Fund USD 1,400,895 0.09Global Property Fund USD 544,670 0.05Global Quality Fund USD 501,588 0.04Indian Equity Fund USD 1,411,583 0.34International Equity (ex US) Fund USD 33,092 0.05Japanese Equity Fund JPY 20,124,272 0.07Latin American Equity Fund USD 341,028 0.07US Active Factor Equity Fund USD 1,236 0.02US Advantage Fund USD 1,787,512 0.04US Growth Fund USD 286,062 0.02US Insight Fund USD 9,472 0.07US Property Fund USD 80,396 0.02Absolute Return Fixed Income Fund EUR 1,717 0.01Asian Fixed Income Opportunities Fund USD – 0.00Emerging Markets Corporate Debt Fund USD – 0.00Emerging Markets Debt Fund USD 593 0.00Emerging Markets Domestic Debt Fund USD 1,724 0.00Emerging Markets Fixed Income Opportunities Fund USD 15 0.00Euro Bond Fund EUR 4,159 0.00Euro Corporate Bond Fund EUR 134,016 0.00Euro Strategic Bond Fund EUR 29,391 0.00European Currencies High Yield Bond Fund EUR 2,936 0.00Global Bond Fund USD 10,123 0.00Global Buy and Hold 2020 Bond Fund EUR 3,640 0.00Global Buy and Maintain Bond Fund1 GBP 228 0.00Global Convertible Bond Fund USD 35,520 0.01Global Credit Fund USD 4,452 0.00Global Fixed Income Opportunities Fund USD 27,976 0.00Global High Yield Bond Fund USD 99 0.00Global Mortgage Securities Fund USD 21,277 0.00Global Premier Credit Fund USD 535 0.00Short Maturity Euro Bond Fund EUR 46,945 0.00US Dollar Corporate Bond Fund USD 329 0.00US Dollar High Yield Bond Fund USD – 0.00US Dollar Short Duration Bond Fund USD 1,807 0.00US Dollar Short Duration High Yield Bond Fund USD – 0.00US Dollar Liquidity Fund USD – 0.00Diversifi ed Alpha Plus Fund EUR 832,138 0.05Global Balanced Defensive Fund EUR 15,322 0.05Global Balanced Fund EUR 52,053 0.10Global Balanced Income Fund EUR 323,457 0.06Global Balanced Risk Control Fund of Funds EUR 435,286 0.01Global Multi-Asset Income Fund EUR 4,301 0.03Global Multi-Asset Opportunities Fund2 EUR 7,281 0.04Liquid Alpha Capture Fund USD 26,585 0.06
1 Fund commenced operations on 15 February 2017 via in specie transfer.2 Formerly known as Diversifi ed Alpha Plus Low Volatility Fund prior to 20 June 2017.
Th ere are no brokerage fees charged separately for transactions on fi xed income instruments and derivatives (except for futures). Th e transaction costs are included in the transaction price, which is known as “marked up”.
14 CROSS INVESTMENT BETWEEN FUNDS
Th e Company is permitted to engage in cross investment between Funds within the umbrella structure. Th e following
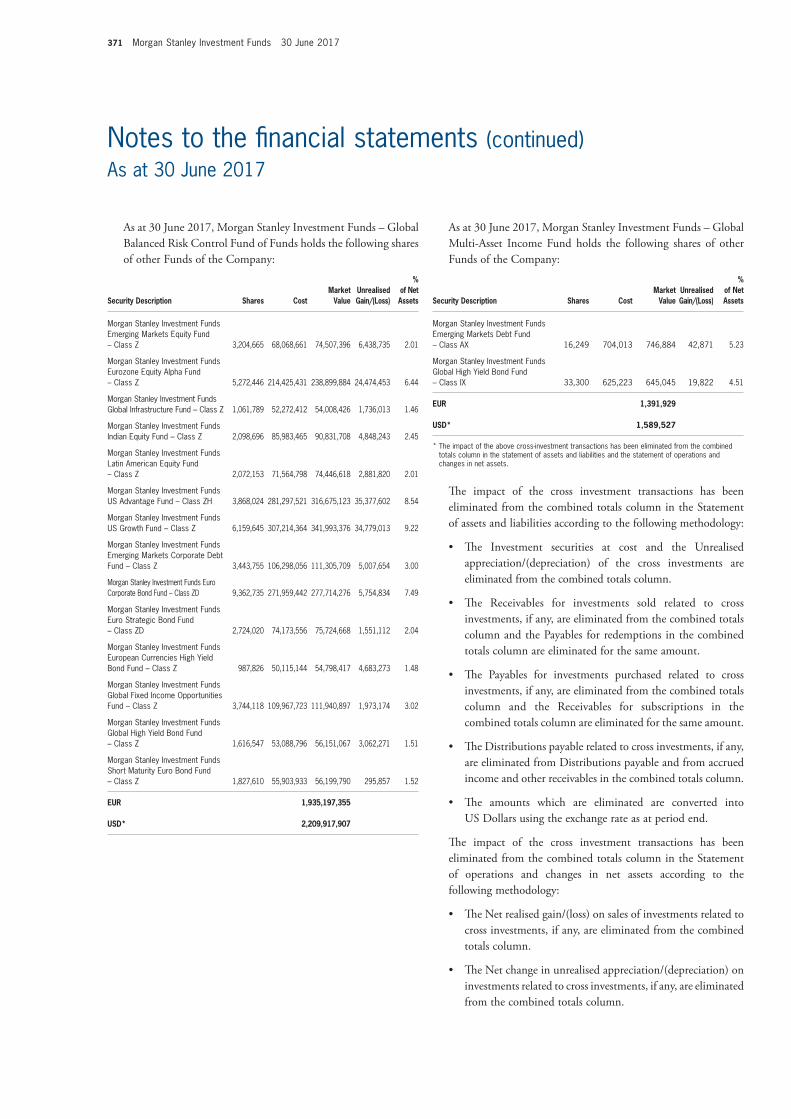
371 Morgan Stanley Investment Funds 30 June 2017
Notes to the fi nancial statements (continued)As at 30 June 2017
As at 30 June 2017, Morgan Stanley Investment Funds – Global Multi-Asset Income Fund holds the following shares of other Funds of the Company:
Security Description Shares CostMarket
ValueUnrealised Gain/(Loss)
% of Net Assets
Morgan Stanley Investment Funds Emerging Markets Debt Fund – Class AX 16,249 704,013 746,884 42,871 5.23
Morgan Stanley Investment Funds Global High Yield Bond Fund – Class IX 33,300 625,223 645,045 19,822 4.51
EUR 1,391,929
USD* 1,589,527
* The impact of the above cross-investment transactions has been eliminated from the combined totals column in the statement of assets and liabilities and the statement of operations and changes in net assets.
Th e impact of the cross investment transactions has been eliminated from the combined totals column in the Statement of assets and liabilities according to the following methodology:
• Th e Investment securities at cost and the Unrealised appreciation/(depreciation) of the cross investments are eliminated from the combined totals column.
• Th e Receivables for investments sold related to cross investments, if any, are eliminated from the combined totals column and the Payables for redemptions in the combined totals column are eliminated for the same amount.
• Th e Payables for investments purchased related to cross investments, if any, are eliminated from the combined totals column and the Receivables for subscriptions in the combined totals column are eliminated for the same amount.
• Th e Distributions payable related to cross investments, if any, are eliminated from Distributions payable and from accrued income and other receivables in the combined totals column.
• Th e amounts which are eliminated are converted into US Dollars using the exchange rate as at period end.
Th e impact of the cross investment transactions has been eliminated from the combined totals column in the Statement of operations and changes in net assets according to the following methodology:
• Th e Net realised gain/(loss) on sales of investments related to cross investments, if any, are eliminated from the combined totals column.
• Th e Net change in unrealised appreciation/(depreciation) on investments related to cross investments, if any, are eliminated from the combined totals column.
As at 30 June 2017, Morgan Stanley Investment Funds – Global Balanced Risk Control Fund of Funds holds the following shares of other Funds of the Company:
Security Description Shares CostMarket
ValueUnrealised Gain/(Loss)
% of Net Assets
Morgan Stanley Investment Funds Emerging Markets Equity Fund – Class Z 3,204,665 68,068,661 74,507,396 6,438,735 2.01
Morgan Stanley Investment Funds Eurozone Equity Alpha Fund – Class Z 5,272,446 214,425,431 238,899,884 24,474,453 6.44
Morgan Stanley Investment Funds Global Infrastructure Fund – Class Z 1,061,789 52,272,412 54,008,426 1,736,013 1.46
Morgan Stanley Investment Funds Indian Equity Fund – Class Z 2,098,696 85,983,465 90,831,708 4,848,243 2.45
Morgan Stanley Investment Funds Latin American Equity Fund – Class Z 2,072,153 71,564,798 74,446,618 2,881,820 2.01
Morgan Stanley Investment Funds US Advantage Fund – Class ZH 3,868,024 281,297,521 316,675,123 35,377,602 8.54
Morgan Stanley Investment Funds US Growth Fund – Class Z 6,159,645 307,214,364 341,993,376 34,779,013 9.22
Morgan Stanley Investment Funds Emerging Markets Corporate Debt Fund – Class Z 3,443,755 106,298,056 111,305,709 5,007,654 3.00
Morgan Stanley Investment Funds Euro Corporate Bond Fund – Class ZD 9,362,735 271,959,442 277,714,276 5,754,834 7.49
Morgan Stanley Investment Funds Euro Strategic Bond Fund – Class ZD 2,724,020 74,173,556 75,724,668 1,551,112 2.04
Morgan Stanley Investment Funds European Currencies High Yield Bond Fund – Class Z 987,826 50,115,144 54,798,417 4,683,273 1.48
Morgan Stanley Investment Funds Global Fixed Income Opportunities Fund – Class Z 3,744,118 109,967,723 111,940,897 1,973,174 3.02
Morgan Stanley Investment Funds Global High Yield Bond Fund – Class Z 1,616,547 53,088,796 56,151,067 3,062,271 1.51
Morgan Stanley Investment Funds Short Maturity Euro Bond Fund – Class Z 1,827,610 55,903,933 56,199,790 295,857 1.52
EUR 1,935,197,355
USD* 2,209,917,907
Morgan Stanley Investment Funds 30 June 2017 372
Notes to the fi nancial statements (continued)As at 30 June 2017
• Th e purchase amounts for the period related to cross investments, if any, are eliminated from the Proceeds received on subscription of shares in the combined totals column.
• Th e sale amounts for the period related to cross investments, if any, are eliminated from the Net amount paid on redemption of shares in the combined totals column.
• Th e dividend distributions related to cross investments, if any, are eliminated from the Dividend distribution and from the Dividends (net of withholding taxes) in the combined totals column.
• Th e amounts which are eliminated are converted into US Dollars using the average exchange rate. Th e translation diff erence in the combined totals column includes the diff erence in the exchange rates used for the conversion in the Statement of assets and liabilities and the Statement of operations and changes in net assets. It also includes the diff erence in the exchange rates used for the conversion of prior period cross investment eliminations.
Th e synthetic expense ratio of each Class the Global Balanced Fund, the Global Balanced Income Fund and of the Global Balanced Risk Control Fund of Funds is detailed in Appendix 1 on page 381.
15 MORGAN STANLEY LIQUIDITY FUNDS – US DOLLAR LIQUIDITY FUND (“THE MASTER FUND”) AND MORGAN STANLEY INVESTMENT FUNDS – US DOLLAR LIQUIDITY FUND (“THE FEEDER FUND”)
Th e US Dollar Liquidity Fund (“the Feeder Fund”) is a feeder fund of the Morgan Stanley Liquidity Funds – US Dollar Liquidity Fund (“the Master Fund”), under the provisions of UCITS Directive. Th e Feeder Fund will at all times invest at least 85% of its assets in shares of the Master Fund (Master Share Class) whilst it may hold up to 15% of its assets in ancillary liquid assets, including cash, cash equivalents and short term bank deposits.
Th e investment objective of the Feeder Fund is to provide liquidity and high current income, to the extent consistent with the preservation of capital. Th e Feeder Fund seeks to achieve its investment objective by investing substantially all of its assets in shares of the Master Fund shares. Th e Feeder Fund does not invest in money market instruments directly and will only obtain its exposure to money market instruments through its investment in the Master Fund.
Th e Master Fund’s investment objective is to provide liquidity and an attractive rate of income, to the extent consistent with the preservation of capital. Th e Master Fund will seek to achieve its investment objective primarily by investing in high quality
short-term Money Market Instruments comprising transferable debt securities (which may include by way of example fi xed or fl oating rate instruments including without limitation commercial paper, certifi cates of deposit, freely transferable promissory notes, government and corporate bonds and asset-backed securities) that are denominated in US Dollars, provided that, at the time of acquisition, their initial or residual maturity does not exceed 397 days.
Th ese fi nancial statements should be read in conjunction with the fi nancial statements of the Master Fund.
Th e audited and unaudited fi nancial statements of the Master Fund are available to the Shareholders free of charge upon request at the registered offi ce of the Morgan Stanley Liquidity Funds – US Dollar Liquidity Fund (“the Master Fund”): 6B, route de Trèves, L-2633 Senningerberg, Grand Duchy of Luxembourg. Th e Master Fund’s accounting year begins on 1 April and ends on 31 March of each year.
As of 30 June 2017, the Feeder Fund holds 27.05% of the net asset value of the Master Fund, and 100% of the Master Share Class.
For the period ended 30 June 2017, the aggregated total expenses of the Feeder Fund and the Master Share Class of the Master Fund are USD 17,284,843.
Th e synthetic expense ratio of each Class of the Feeder Fund is detailed in Appendix 1 on page 380. Th e total expense ratio of the Master Fund (Master Share Class) is 0.01%.
16 SWING PRICING
To the extent that the Board of Directors of the Company consider that it is in the best interests of Shareholders, taking into account factors including the prevailing market conditions, the level of subscriptions and redemptions in a particular Fund and the size of the Fund, the Board of Directors of the Company may decide to adjust the Net Asset Value of a Fund to refl ect the estimated dealing spreads, costs and charges (“Swing Factor”) to be incurred by the Fund in liquidating or purchasing investments to satisfy the net transactions received in respect of a particular day.
Under normal market circumstances, the Swing Factor shall not exceed 2% of the Net Asset Value of the relevant Fund on the relevant day. When net subscriptions in a Fund exceed a certain threshold on a given day, the Net Asset Value is adjusted upwards by the Swing Factor. Similarly, when net redemptions in a Fund exceed a certain threshold on a given day, the Net Asset Value of the Fund is adjusted downwards by the Swing Factor.
No swing pricing was applied to any Fund’s Net Asset Value as of 30 June 2017.
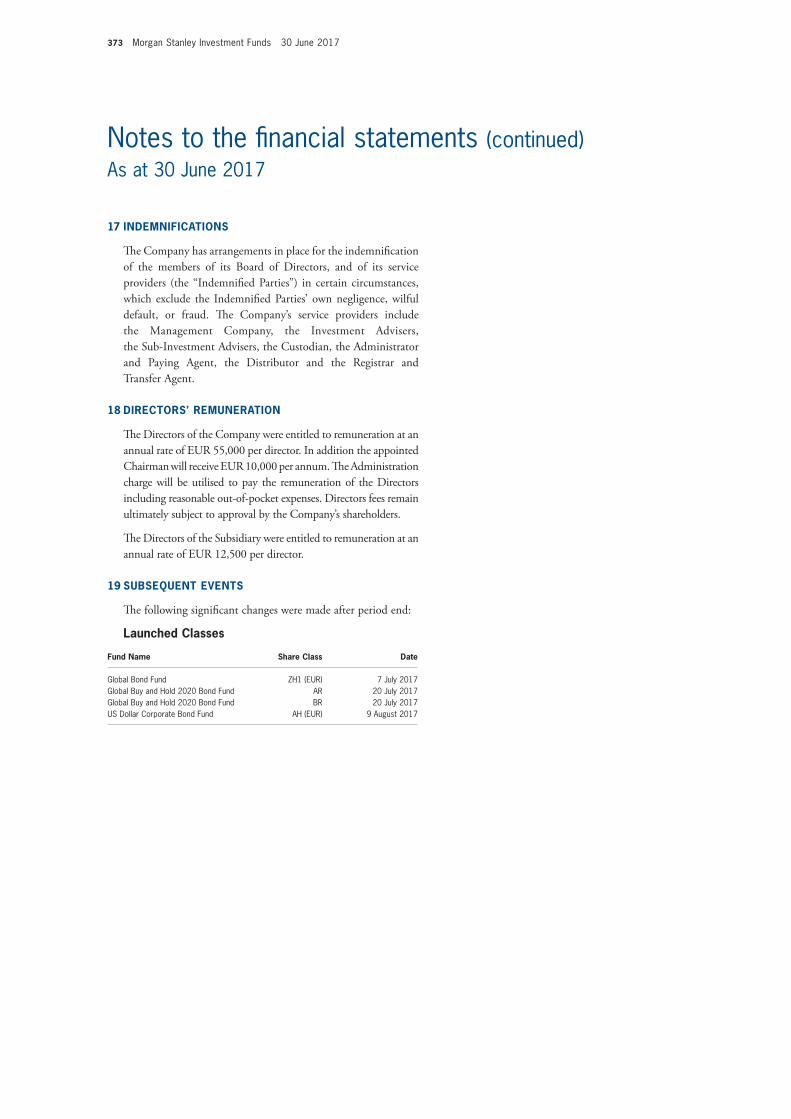
373 Morgan Stanley Investment Funds 30 June 2017
Notes to the fi nancial statements (continued)As at 30 June 2017
17 INDEMNIFICATIONS
Th e Company has arrangements in place for the indemnifi cation of the members of its Board of Directors, and of its service providers (the “Indemnifi ed Parties”) in certain circumstances, which exclude the Indemnifi ed Parties’ own negligence, wilful default, or fraud. Th e Company’s service providers include the Management Company, the Investment Advisers, the Sub-Investment Advisers, the Custodian, the Administrator and Paying Agent, the Distributor and the Registrar and Transfer Agent.
18 DIRECTORS’ REMUNERATION
Th e Directors of the Company were entitled to remuneration at an annual rate of EUR 55,000 per director. In addition the appointed Chairman will receive EUR 10,000 per annum. Th e Administration charge will be utilised to pay the remuneration of the Directors including reasonable out-of-pocket expenses. Directors fees remain ultimately subject to approval by the Company’s shareholders.
Th e Directors of the Subsidiary were entitled to remuneration at an annual rate of EUR 12,500 per director.
19 SUBSEQUENT EVENTS
Th e following signifi cant changes were made after period end:
Launched Classes
Fund Name Share Class Date
Global Bond Fund ZH1 (EUR) 7 July 2017Global Buy and Hold 2020 Bond Fund AR 20 July 2017Global Buy and Hold 2020 Bond Fund BR 20 July 2017US Dollar Corporate Bond Fund AH (EUR) 9 August 2017
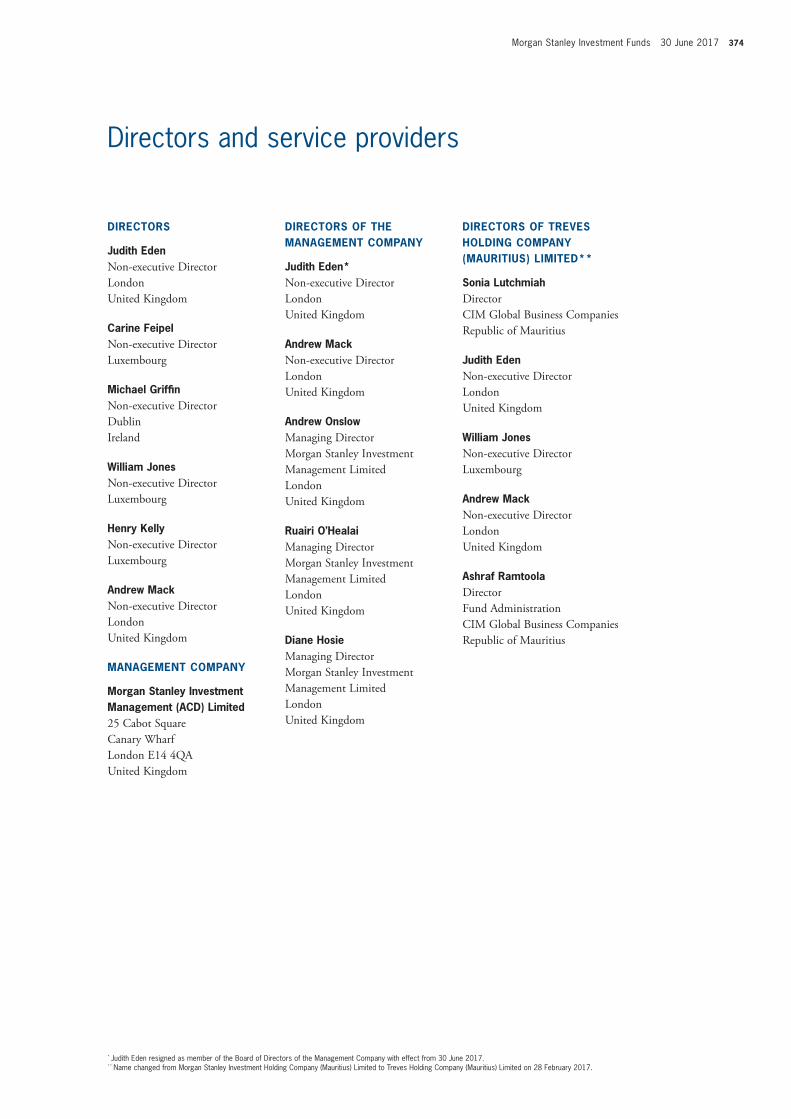
Morgan Stanley Investment Funds 30 June 2017 374
DIRECTORS
Judith EdenNon-executive DirectorLondonUnited Kingdom
Carine FeipelNon-executive DirectorLuxembourg
Michael Griffi nNon-executive DirectorDublinIreland
William JonesNon-executive DirectorLuxembourg
Henry KellyNon-executive DirectorLuxembourg
Andrew MackNon-executive DirectorLondonUnited Kingdom
MANAGEMENT COMPANY
Morgan Stanley Investment Management (ACD) Limited25 Cabot Square Canary Wharf London E14 4QA United Kingdom
DIRECTORS OF THE MANAGEMENT COMPANY
Judith Eden*Non-executive DirectorLondon United Kingdom
Andrew MackNon-executive Director LondonUnited Kingdom
Andrew Onslow Managing Director Morgan Stanley InvestmentManagement LimitedLondon United Kingdom
Ruairi O’HealaiManaging DirectorMorgan Stanley InvestmentManagement LimitedLondon United Kingdom
Diane HosieManaging DirectorMorgan Stanley InvestmentManagement LimitedLondonUnited Kingdom
DIRECTORS OF TREVES HOLDING COMPANY (MAURITIUS) LIMITED**
Sonia LutchmiahDirectorCIM Global Business CompaniesRepublic of Mauritius
Judith EdenNon-executive DirectorLondonUnited Kingdom
William JonesNon-executive DirectorLuxembourg
Andrew Mack Non-executive DirectorLondonUnited Kingdom
Ashraf Ramtoola Director Fund AdministrationCIM Global Business CompaniesRepublic of Mauritius
Directors and service providers
* Judith Eden resigned as member of the Board of Directors of the Management Company with effect from 30 June 2017.** Name changed from Morgan Stanley Investment Holding Company (Mauritius) Limited to Treves Holding Company (Mauritius) Limited on 28 February 2017.
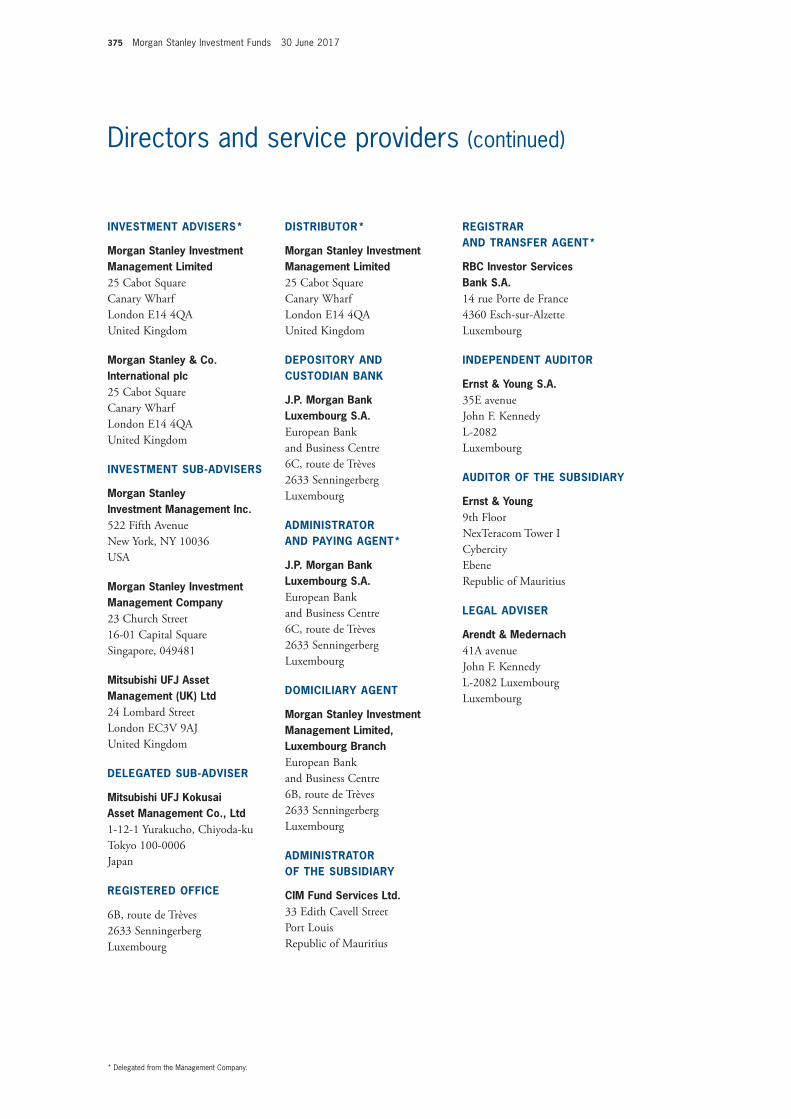
375 Morgan Stanley Investment Funds 30 June 2017
Directors and service providers (continued)As at 30 June 2017
INVESTMENT ADVISERS*
Morgan Stanley InvestmentManagement Limited25 Cabot SquareCanary WharfLondon E14 4QAUnited Kingdom
Morgan Stanley & Co. International plc25 Cabot SquareCanary WharfLondon E14 4QAUnited Kingdom
INVESTMENT SUB-ADVISERS
Morgan StanleyInvestment Management Inc.522 Fifth AvenueNew York, NY 10036USA
Morgan Stanley InvestmentManagement Company23 Church Street16-01 Capital SquareSingapore, 049481
Mitsubishi UFJ Asset Management (UK) Ltd24 Lombard StreetLondon EC3V 9AJUnited Kingdom
DELEGATED SUB-ADVISER
Mitsubishi UFJ Kokusai Asset Management Co., Ltd1-12-1 Yurakucho, Chiyoda-ku Tokyo 100-0006Japan
REGISTERED OFFICE
6B, route de Trèves2633 SenningerbergLuxembourg
DISTRIBUTOR*
Morgan Stanley InvestmentManagement Limited25 Cabot SquareCanary WharfLondon E14 4QAUnited Kingdom
DEPOSITORY AND CUSTODIAN BANK
J.P. Morgan BankLuxembourg S.A.European Bankand Business Centre6C, route de Trèves2633 SenningerbergLuxembourg
ADMINISTRATOR AND PAYING AGENT*
J.P. Morgan BankLuxembourg S.A.European Bankand Business Centre6C, route de Trèves2633 SenningerbergLuxembourg
DOMICILIARY AGENT
Morgan Stanley Investment Management Limited, Luxembourg BranchEuropean Bank and Business Centre6B, route de Trèves2633 SenningerbergLuxembourg
ADMINISTRATOR OF THE SUBSIDIARY
CIM Fund Services Ltd.33 Edith Cavell StreetPort LouisRepublic of Mauritius
REGISTRAR AND TRANSFER AGENT*
RBC Investor ServicesBank S.A.14 rue Porte de France4360 Esch-sur-AlzetteLuxembourg
INDEPENDENT AUDITOR
Ernst & Young S.A.35E avenueJohn F. KennedyL-2082Luxembourg
AUDITOR OF THE SUBSIDIARY
Ernst & Young9th Floor NexTeracom Tower ICybercityEbeneRepublic of Mauritius
LEGAL ADVISER
Arendt & Medernach41A avenue John F. KennedyL-2082 Luxembourg Luxembourg
* Delegated from the Management Company.
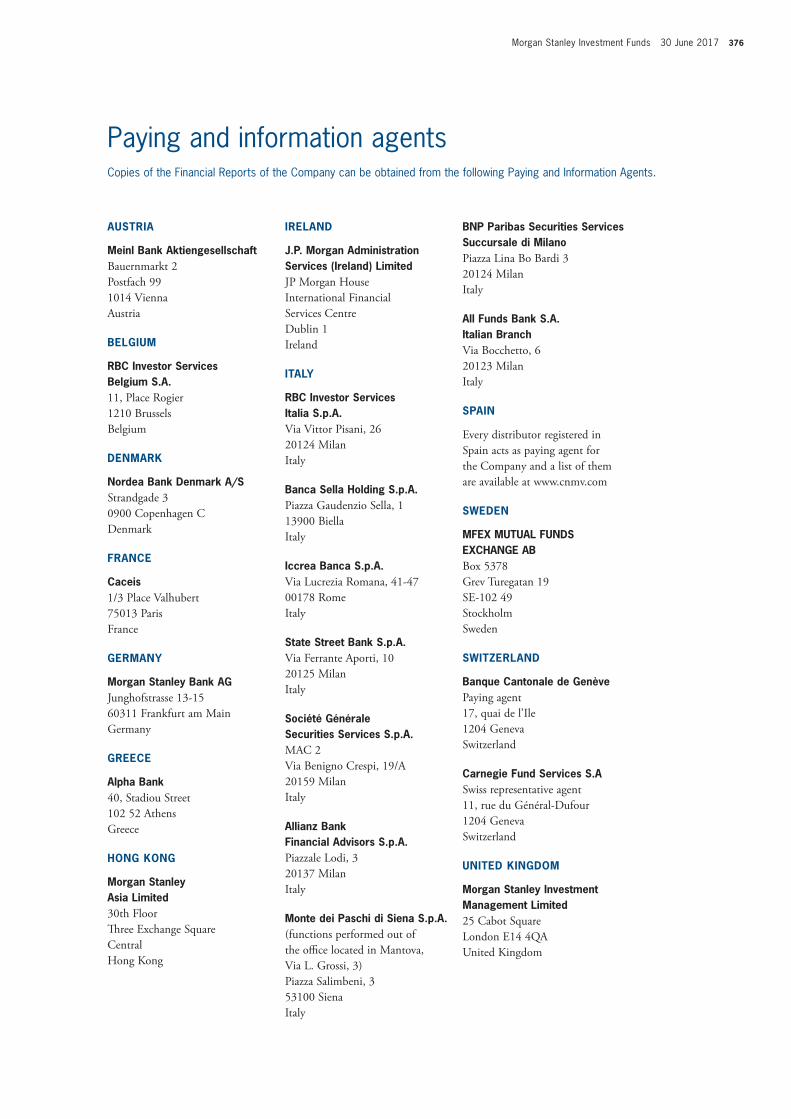
Morgan Stanley Investment Funds 30 June 2017 376
AUSTRIA
Meinl Bank AktiengesellschaftBauernmarkt 2Postfach 991014 ViennaAustria
BELGIUM
RBC Investor Services Belgium S.A.11, Place Rogier1210 BrusselsBelgium
DENMARK
Nordea Bank Denmark A/SStrandgade 30900 Copenhagen CDenmark
FRANCE
Caceis1/3 Place Valhubert75013 ParisFrance
GERMANY
Morgan Stanley Bank AGJunghofstrasse 13-1560311 Frankfurt am MainGermany
GREECE
Alpha Bank40, Stadiou Street102 52 AthensGreece
HONG KONG
Morgan Stanley Asia Limited30th FloorTh ree Exchange SquareCentralHong Kong
IRELAND
J.P. Morgan Administration Services (Ireland) LimitedJP Morgan HouseInternational Financial Services CentreDublin 1Ireland
ITALY
RBC Investor Services Italia S.p.A.Via Vittor Pisani, 2620124 MilanItaly
Banca Sella Holding S.p.A.Piazza Gaudenzio Sella, 113900 BiellaItaly
Iccrea Banca S.p.A.Via Lucrezia Romana, 41-4700178 RomeItaly
State Street Bank S.p.A.Via Ferrante Aporti, 1020125 MilanItaly
Société Générale Securities Services S.p.A.MAC 2Via Benigno Crespi, 19/A20159 MilanItaly
Allianz BankFinancial Advisors S.p.A.Piazzale Lodi, 320137 MilanItaly
Monte dei Paschi di Siena S.p.A.(functions performed out of the offi ce located in Mantova, Via L. Grossi, 3) Piazza Salimbeni, 3 53100 Siena Italy
BNP Paribas Securities Services Succursale di MilanoPiazza Lina Bo Bardi 3 20124 MilanItaly
All Funds Bank S.A. Italian Branch Via Bocchetto, 6 20123 MilanItaly
SPAIN
Every distributor registered in Spain acts as paying agent for the Company and a list of them are available at www.cnmv.com
SWEDEN
MFEX MUTUAL FUNDS EXCHANGE ABBox 5378Grev Turegatan 19SE-102 49StockholmSweden
SWITZERLAND
Banque Cantonale de GenèvePaying agent17, quai de l’Ile1204 GenevaSwitzerland
Carnegie Fund Services S.ASwiss representative agent11, rue du Général-Dufour1204 GenevaSwitzerland
UNITED KINGDOM
Morgan Stanley InvestmentManagement Limited25 Cabot SquareLondon E14 4QAUnited Kingdom
Paying and information agentsCopies of the Financial Reports of the Company can be obtained from the following Paying and Information Agents.
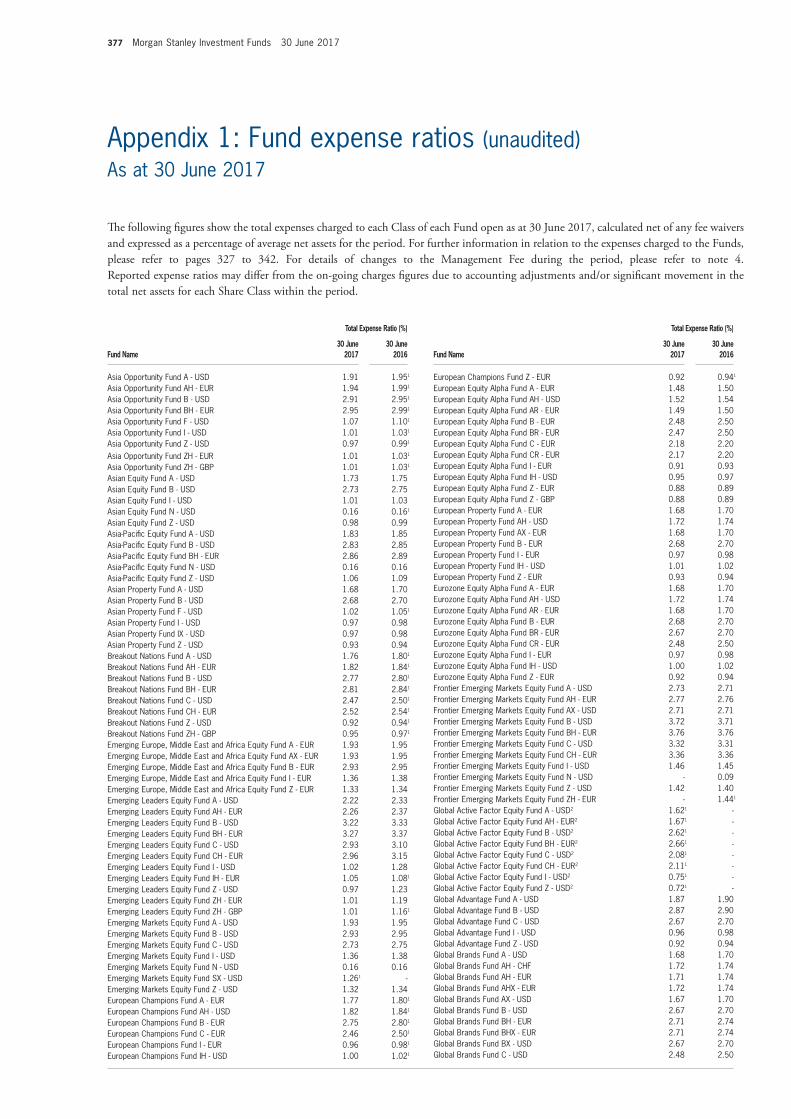
377 Morgan Stanley Investment Funds 30 June 2017
Total Expense Ratio (%)
Fund Name30 June
201730 June
2016
European Champions Fund Z - EUR 0.92 0.941
European Equity Alpha Fund A - EUR 1.48 1.50European Equity Alpha Fund AH - USD 1.52 1.54European Equity Alpha Fund AR - EUR 1.49 1.50European Equity Alpha Fund B - EUR 2.48 2.50European Equity Alpha Fund BR - EUR 2.47 2.50European Equity Alpha Fund C - EUR 2.18 2.20European Equity Alpha Fund CR - EUR 2.17 2.20European Equity Alpha Fund I - EUR 0.91 0.93European Equity Alpha Fund IH - USD 0.95 0.97European Equity Alpha Fund Z - EUR 0.88 0.89European Equity Alpha Fund Z - GBP 0.88 0.89European Property Fund A - EUR 1.68 1.70European Property Fund AH - USD 1.72 1.74European Property Fund AX - EUR 1.68 1.70European Property Fund B - EUR 2.68 2.70European Property Fund I - EUR 0.97 0.98European Property Fund IH - USD 1.01 1.02European Property Fund Z - EUR 0.93 0.94Eurozone Equity Alpha Fund A - EUR 1.68 1.70Eurozone Equity Alpha Fund AH - USD 1.72 1.74Eurozone Equity Alpha Fund AR - EUR 1.68 1.70Eurozone Equity Alpha Fund B - EUR 2.68 2.70Eurozone Equity Alpha Fund BR - EUR 2.67 2.70Eurozone Equity Alpha Fund CR - EUR 2.48 2.50Eurozone Equity Alpha Fund I - EUR 0.97 0.98Eurozone Equity Alpha Fund IH - USD 1.00 1.02Eurozone Equity Alpha Fund Z - EUR 0.92 0.94Frontier Emerging Markets Equity Fund A - USD 2.73 2.71Frontier Emerging Markets Equity Fund AH - EUR 2.77 2.76Frontier Emerging Markets Equity Fund AX - USD 2.71 2.71Frontier Emerging Markets Equity Fund B - USD 3.72 3.71Frontier Emerging Markets Equity Fund BH - EUR 3.76 3.76Frontier Emerging Markets Equity Fund C - USD 3.32 3.31Frontier Emerging Markets Equity Fund CH - EUR 3.36 3.36Frontier Emerging Markets Equity Fund I - USD 1.46 1.45Frontier Emerging Markets Equity Fund N - USD - 0.09Frontier Emerging Markets Equity Fund Z - USD 1.42 1.40Frontier Emerging Markets Equity Fund ZH - EUR - 1.441
Global Active Factor Equity Fund A - USD2 1.621 -Global Active Factor Equity Fund AH - EUR2 1.671 -Global Active Factor Equity Fund B - USD2 2.621 -Global Active Factor Equity Fund BH - EUR2 2.661 -Global Active Factor Equity Fund C - USD2 2.081 -Global Active Factor Equity Fund CH - EUR2 2.111 -Global Active Factor Equity Fund I - USD2 0.751 -Global Active Factor Equity Fund Z - USD2 0.721 -Global Advantage Fund A - USD 1.87 1.90Global Advantage Fund B - USD 2.87 2.90Global Advantage Fund C - USD 2.67 2.70Global Advantage Fund I - USD 0.96 0.98Global Advantage Fund Z - USD 0.92 0.94Global Brands Fund A - USD 1.68 1.70Global Brands Fund AH - CHF 1.72 1.74Global Brands Fund AH - EUR 1.71 1.74Global Brands Fund AHX - EUR 1.72 1.74Global Brands Fund AX - USD 1.67 1.70Global Brands Fund B - USD 2.67 2.70Global Brands Fund BH - EUR 2.71 2.74Global Brands Fund BHX - EUR 2.71 2.74Global Brands Fund BX - USD 2.67 2.70Global Brands Fund C - USD 2.48 2.50
Total Expense Ratio (%)
Fund Name30 June
201730 June
2016
Asia Opportunity Fund A - USD 1.91 1.951
Asia Opportunity Fund AH - EUR 1.94 1.991
Asia Opportunity Fund B - USD 2.91 2.951
Asia Opportunity Fund BH - EUR 2.95 2.991
Asia Opportunity Fund F - USD 1.07 1.101
Asia Opportunity Fund I - USD 1.01 1.031
Asia Opportunity Fund Z - USD 0.97 0.991
Asia Opportunity Fund ZH - EUR 1.01 1.031
Asia Opportunity Fund ZH - GBP 1.01 1.031
Asian Equity Fund A - USD 1.73 1.75Asian Equity Fund B - USD 2.73 2.75Asian Equity Fund I - USD 1.01 1.03Asian Equity Fund N - USD 0.16 0.161
Asian Equity Fund Z - USD 0.98 0.99Asia-Pacifi c Equity Fund A - USD 1.83 1.85Asia-Pacifi c Equity Fund B - USD 2.83 2.85Asia-Pacifi c Equity Fund BH - EUR 2.86 2.89Asia-Pacifi c Equity Fund N - USD 0.16 0.16Asia-Pacifi c Equity Fund Z - USD 1.06 1.09Asian Property Fund A - USD 1.68 1.70Asian Property Fund B - USD 2.68 2.70Asian Property Fund F - USD 1.02 1.051
Asian Property Fund I - USD 0.97 0.98Asian Property Fund IX - USD 0.97 0.98Asian Property Fund Z - USD 0.93 0.94Breakout Nations Fund A - USD 1.76 1.801
Breakout Nations Fund AH - EUR 1.82 1.841
Breakout Nations Fund B - USD 2.77 2.801
Breakout Nations Fund BH - EUR 2.81 2.841
Breakout Nations Fund C - USD 2.47 2.501
Breakout Nations Fund CH - EUR 2.52 2.541
Breakout Nations Fund Z - USD 0.92 0.941
Breakout Nations Fund ZH - GBP 0.95 0.971
Emerging Europe, Middle East and Africa Equity Fund A - EUR 1.93 1.95Emerging Europe, Middle East and Africa Equity Fund AX - EUR 1.93 1.95Emerging Europe, Middle East and Africa Equity Fund B - EUR 2.93 2.95Emerging Europe, Middle East and Africa Equity Fund I - EUR 1.36 1.38Emerging Europe, Middle East and Africa Equity Fund Z - EUR 1.33 1.34Emerging Leaders Equity Fund A - USD 2.22 2.33Emerging Leaders Equity Fund AH - EUR 2.26 2.37Emerging Leaders Equity Fund B - USD 3.22 3.33Emerging Leaders Equity Fund BH - EUR 3.27 3.37Emerging Leaders Equity Fund C - USD 2.93 3.10Emerging Leaders Equity Fund CH - EUR 2.96 3.15Emerging Leaders Equity Fund I - USD 1.02 1.28Emerging Leaders Equity Fund IH - EUR 1.05 1.081
Emerging Leaders Equity Fund Z - USD 0.97 1.23Emerging Leaders Equity Fund ZH - EUR 1.01 1.19Emerging Leaders Equity Fund ZH - GBP 1.01 1.161
Emerging Markets Equity Fund A - USD 1.93 1.95Emerging Markets Equity Fund B - USD 2.93 2.95Emerging Markets Equity Fund C - USD 2.73 2.75Emerging Markets Equity Fund I - USD 1.36 1.38Emerging Markets Equity Fund N - USD 0.16 0.16Emerging Markets Equity Fund SX - USD 1.261 -Emerging Markets Equity Fund Z - USD 1.32 1.34European Champions Fund A - EUR 1.77 1.801
European Champions Fund AH - USD 1.82 1.841
European Champions Fund B - EUR 2.75 2.801
European Champions Fund C - EUR 2.46 2.501
European Champions Fund I - EUR 0.96 0.981
European Champions Fund IH - USD 1.00 1.021
Th e following fi gures show the total expenses charged to each Class of each Fund open as at 30 June 2017, calculated net of any fee waivers and expressed as a percentage of average net assets for the period. For further information in relation to the expenses charged to the Funds, please refer to pages 327 to 342. For details of changes to the Management Fee during the period, please refer to note 4.Reported expense ratios may diff er from the on-going charges fi gures due to accounting adjustments and/or signifi cant movement in the total net assets for each Share Class within the period.
Appendix 1: Fund expense ratios (unaudited)As at 30 June 2017
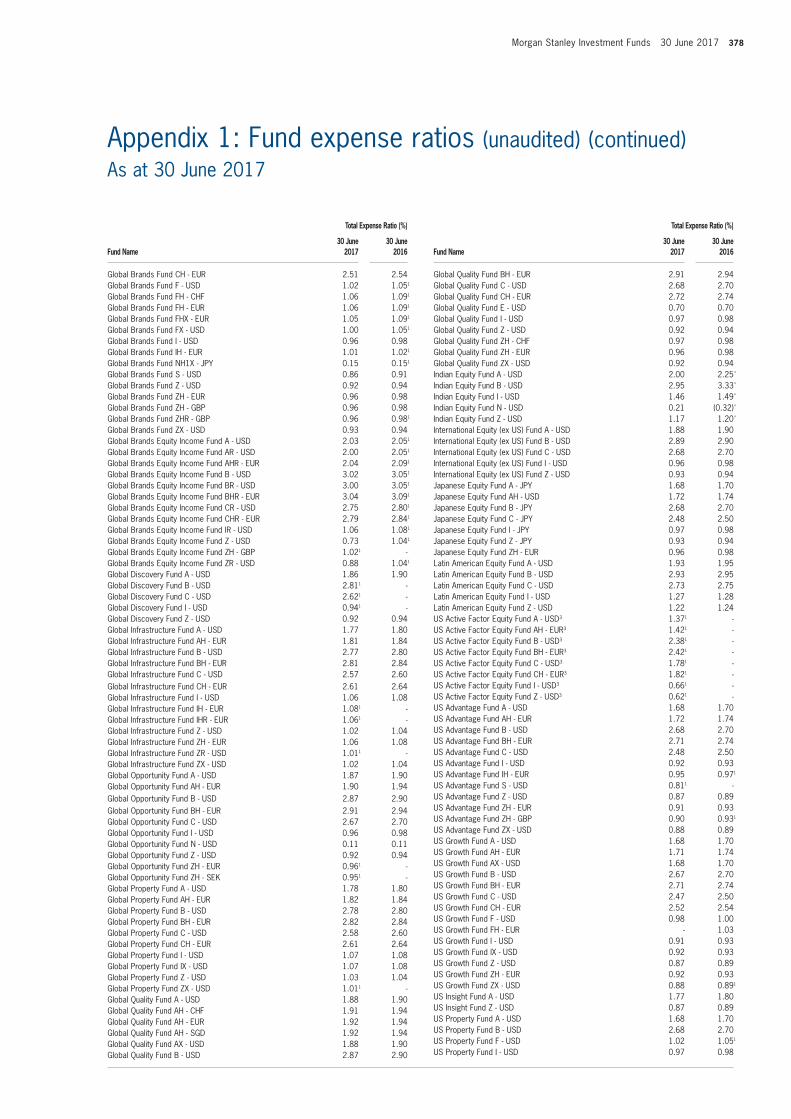
Morgan Stanley Investment Funds 30 June 2017 378
Appendix 1: Fund expense ratios (unaudited) (continued)As at 30 June 2017
Total Expense Ratio (%)
Fund Name30 June
201730 June
2016
Global Quality Fund BH - EUR 2.91 2.94Global Quality Fund C - USD 2.68 2.70Global Quality Fund CH - EUR 2.72 2.74Global Quality Fund E - USD 0.70 0.70Global Quality Fund I - USD 0.97 0.98Global Quality Fund Z - USD 0.92 0.94Global Quality Fund ZH - CHF 0.97 0.98Global Quality Fund ZH - EUR 0.96 0.98Global Quality Fund ZX - USD 0.92 0.94Indian Equity Fund A - USD 2.00 2.25^
Indian Equity Fund B - USD 2.95 3.33^
Indian Equity Fund I - USD 1.46 1.49^
Indian Equity Fund N - USD 0.21 (0.32)^
Indian Equity Fund Z - USD 1.17 1.20^
International Equity (ex US) Fund A - USD 1.88 1.90International Equity (ex US) Fund B - USD 2.89 2.90International Equity (ex US) Fund C - USD 2.68 2.70International Equity (ex US) Fund I - USD 0.96 0.98International Equity (ex US) Fund Z - USD 0.93 0.94Japanese Equity Fund A - JPY 1.68 1.70Japanese Equity Fund AH - USD 1.72 1.74Japanese Equity Fund B - JPY 2.68 2.70Japanese Equity Fund C - JPY 2.48 2.50Japanese Equity Fund I - JPY 0.97 0.98Japanese Equity Fund Z - JPY 0.93 0.94Japanese Equity Fund ZH - EUR 0.96 0.98Latin American Equity Fund A - USD 1.93 1.95Latin American Equity Fund B - USD 2.93 2.95Latin American Equity Fund C - USD 2.73 2.75Latin American Equity Fund I - USD 1.27 1.28Latin American Equity Fund Z - USD 1.22 1.24US Active Factor Equity Fund A - USD3 1.371 -US Active Factor Equity Fund AH - EUR3 1.421 -US Active Factor Equity Fund B - USD3 2.381 -US Active Factor Equity Fund BH - EUR3 2.421 -US Active Factor Equity Fund C - USD3 1.781 -US Active Factor Equity Fund CH - EUR3 1.821 -US Active Factor Equity Fund I - USD3 0.661 -US Active Factor Equity Fund Z - USD3 0.621 -US Advantage Fund A - USD 1.68 1.70US Advantage Fund AH - EUR 1.72 1.74US Advantage Fund B - USD 2.68 2.70US Advantage Fund BH - EUR 2.71 2.74US Advantage Fund C - USD 2.48 2.50US Advantage Fund I - USD 0.92 0.93US Advantage Fund IH - EUR 0.95 0.971
US Advantage Fund S - USD 0.811 -US Advantage Fund Z - USD 0.87 0.89US Advantage Fund ZH - EUR 0.91 0.93US Advantage Fund ZH - GBP 0.90 0.931
US Advantage Fund ZX - USD 0.88 0.89US Growth Fund A - USD 1.68 1.70US Growth Fund AH - EUR 1.71 1.74US Growth Fund AX - USD 1.68 1.70US Growth Fund B - USD 2.67 2.70US Growth Fund BH - EUR 2.71 2.74US Growth Fund C - USD 2.47 2.50US Growth Fund CH - EUR 2.52 2.54US Growth Fund F - USD 0.98 1.00US Growth Fund FH - EUR - 1.03US Growth Fund I - USD 0.91 0.93US Growth Fund IX - USD 0.92 0.93US Growth Fund Z - USD 0.87 0.89US Growth Fund ZH - EUR 0.92 0.93US Growth Fund ZX - USD 0.88 0.891
US Insight Fund A - USD 1.77 1.80US Insight Fund Z - USD 0.87 0.89US Property Fund A - USD 1.68 1.70US Property Fund B - USD 2.68 2.70US Property Fund F - USD 1.02 1.051
US Property Fund I - USD 0.97 0.98
Total Expense Ratio (%)
Fund Name30 June
201730 June
2016
Global Brands Fund CH - EUR 2.51 2.54Global Brands Fund F - USD 1.02 1.051
Global Brands Fund FH - CHF 1.06 1.091
Global Brands Fund FH - EUR 1.06 1.091
Global Brands Fund FHX - EUR 1.05 1.091
Global Brands Fund FX - USD 1.00 1.051
Global Brands Fund I - USD 0.96 0.98Global Brands Fund IH - EUR 1.01 1.021
Global Brands Fund NH1X - JPY 0.15 0.151
Global Brands Fund S - USD 0.86 0.91Global Brands Fund Z - USD 0.92 0.94Global Brands Fund ZH - EUR 0.96 0.98Global Brands Fund ZH - GBP 0.96 0.98Global Brands Fund ZHR - GBP 0.96 0.981
Global Brands Fund ZX - USD 0.93 0.94Global Brands Equity Income Fund A - USD 2.03 2.051
Global Brands Equity Income Fund AR - USD 2.00 2.051
Global Brands Equity Income Fund AHR - EUR 2.04 2.091
Global Brands Equity Income Fund B - USD 3.02 3.051
Global Brands Equity Income Fund BR - USD 3.00 3.051
Global Brands Equity Income Fund BHR - EUR 3.04 3.091
Global Brands Equity Income Fund CR - USD 2.75 2.801
Global Brands Equity Income Fund CHR - EUR 2.79 2.841
Global Brands Equity Income Fund IR - USD 1.06 1.081
Global Brands Equity Income Fund Z - USD 0.73 1.041
Global Brands Equity Income Fund ZH - GBP 1.021 -Global Brands Equity Income Fund ZR - USD 0.88 1.041
Global Discovery Fund A - USD 1.86 1.90Global Discovery Fund B - USD 2.811 -Global Discovery Fund C - USD 2.621 -Global Discovery Fund I - USD 0.941 -Global Discovery Fund Z - USD 0.92 0.94Global Infrastructure Fund A - USD 1.77 1.80Global Infrastructure Fund AH - EUR 1.81 1.84Global Infrastructure Fund B - USD 2.77 2.80Global Infrastructure Fund BH - EUR 2.81 2.84Global Infrastructure Fund C - USD 2.57 2.60Global Infrastructure Fund CH - EUR 2.61 2.64Global Infrastructure Fund I - USD 1.06 1.08Global Infrastructure Fund IH - EUR 1.081 -Global Infrastructure Fund IHR - EUR 1.061 -Global Infrastructure Fund Z - USD 1.02 1.04Global Infrastructure Fund ZH - EUR 1.06 1.08Global Infrastructure Fund ZR - USD 1.011 -Global Infrastructure Fund ZX - USD 1.02 1.04Global Opportunity Fund A - USD 1.87 1.90Global Opportunity Fund AH - EUR 1.90 1.94Global Opportunity Fund B - USD 2.87 2.90Global Opportunity Fund BH - EUR 2.91 2.94Global Opportunity Fund C - USD 2.67 2.70Global Opportunity Fund I - USD 0.96 0.98Global Opportunity Fund N - USD 0.11 0.11Global Opportunity Fund Z - USD 0.92 0.94Global Opportunity Fund ZH - EUR 0.961 -Global Opportunity Fund ZH - SEK 0.951 -Global Property Fund A - USD 1.78 1.80Global Property Fund AH - EUR 1.82 1.84Global Property Fund B - USD 2.78 2.80Global Property Fund BH - EUR 2.82 2.84Global Property Fund C - USD 2.58 2.60Global Property Fund CH - EUR 2.61 2.64Global Property Fund I - USD 1.07 1.08Global Property Fund IX - USD 1.07 1.08Global Property Fund Z - USD 1.03 1.04Global Property Fund ZX - USD 1.011 -Global Quality Fund A - USD 1.88 1.90Global Quality Fund AH - CHF 1.91 1.94Global Quality Fund AH - EUR 1.92 1.94Global Quality Fund AH - SGD 1.92 1.94Global Quality Fund AX - USD 1.88 1.90Global Quality Fund B - USD 2.87 2.90
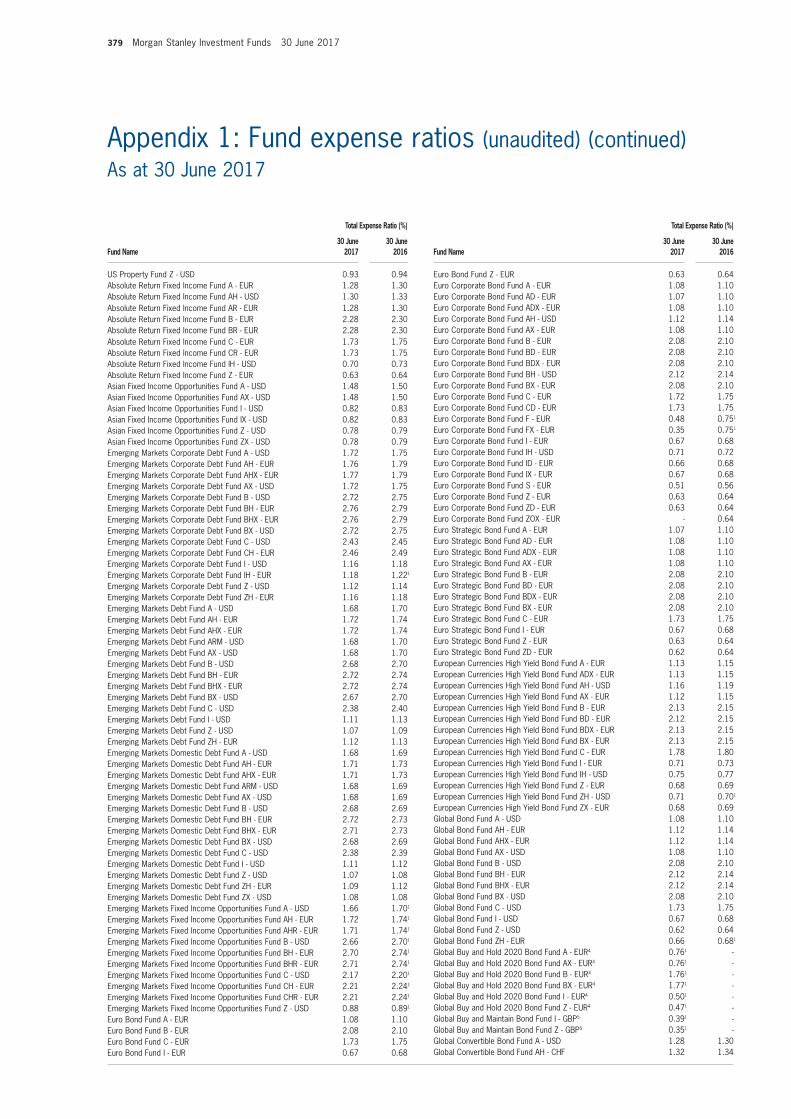
379 Morgan Stanley Investment Funds 30 June 2017
Appendix 1: Fund expense ratios (unaudited) (continued)As at 30 June 2017
Total Expense Ratio (%)
Fund Name30 June
201730 June
2016
Euro Bond Fund Z - EUR 0.63 0.64Euro Corporate Bond Fund A - EUR 1.08 1.10Euro Corporate Bond Fund AD - EUR 1.07 1.10Euro Corporate Bond Fund ADX - EUR 1.08 1.10Euro Corporate Bond Fund AH - USD 1.12 1.14Euro Corporate Bond Fund AX - EUR 1.08 1.10Euro Corporate Bond Fund B - EUR 2.08 2.10Euro Corporate Bond Fund BD - EUR 2.08 2.10Euro Corporate Bond Fund BDX - EUR 2.08 2.10Euro Corporate Bond Fund BH - USD 2.12 2.14Euro Corporate Bond Fund BX - EUR 2.08 2.10Euro Corporate Bond Fund C - EUR 1.72 1.75Euro Corporate Bond Fund CD - EUR 1.73 1.75Euro Corporate Bond Fund F - EUR 0.48 0.751
Euro Corporate Bond Fund FX - EUR 0.35 0.751
Euro Corporate Bond Fund I - EUR 0.67 0.68Euro Corporate Bond Fund IH - USD 0.71 0.72Euro Corporate Bond Fund ID - EUR 0.66 0.68Euro Corporate Bond Fund IX - EUR 0.67 0.68Euro Corporate Bond Fund S - EUR 0.51 0.56Euro Corporate Bond Fund Z - EUR 0.63 0.64Euro Corporate Bond Fund ZD - EUR 0.63 0.64Euro Corporate Bond Fund ZOX - EUR - 0.64Euro Strategic Bond Fund A - EUR 1.07 1.10Euro Strategic Bond Fund AD - EUR 1.08 1.10Euro Strategic Bond Fund ADX - EUR 1.08 1.10Euro Strategic Bond Fund AX - EUR 1.08 1.10Euro Strategic Bond Fund B - EUR 2.08 2.10Euro Strategic Bond Fund BD - EUR 2.08 2.10Euro Strategic Bond Fund BDX - EUR 2.08 2.10Euro Strategic Bond Fund BX - EUR 2.08 2.10Euro Strategic Bond Fund C - EUR 1.73 1.75Euro Strategic Bond Fund I - EUR 0.67 0.68Euro Strategic Bond Fund Z - EUR 0.63 0.64Euro Strategic Bond Fund ZD - EUR 0.62 0.64European Currencies High Yield Bond Fund A - EUR 1.13 1.15European Currencies High Yield Bond Fund ADX - EUR 1.13 1.15European Currencies High Yield Bond Fund AH - USD 1.16 1.19European Currencies High Yield Bond Fund AX - EUR 1.12 1.15European Currencies High Yield Bond Fund B - EUR 2.13 2.15European Currencies High Yield Bond Fund BD - EUR 2.12 2.15European Currencies High Yield Bond Fund BDX - EUR 2.13 2.15European Currencies High Yield Bond Fund BX - EUR 2.13 2.15European Currencies High Yield Bond Fund C - EUR 1.78 1.80European Currencies High Yield Bond Fund I - EUR 0.71 0.73European Currencies High Yield Bond Fund IH - USD 0.75 0.77European Currencies High Yield Bond Fund Z - EUR 0.68 0.69European Currencies High Yield Bond Fund ZH - USD 0.71 0.701
European Currencies High Yield Bond Fund ZX - EUR 0.68 0.69Global Bond Fund A - USD 1.08 1.10Global Bond Fund AH - EUR 1.12 1.14Global Bond Fund AHX - EUR 1.12 1.14Global Bond Fund AX - USD 1.08 1.10Global Bond Fund B - USD 2.08 2.10Global Bond Fund BH - EUR 2.12 2.14Global Bond Fund BHX - EUR 2.12 2.14Global Bond Fund BX - USD 2.08 2.10Global Bond Fund C - USD 1.73 1.75Global Bond Fund I - USD 0.67 0.68Global Bond Fund Z - USD 0.62 0.64Global Bond Fund ZH - EUR 0.66 0.681
Global Buy and Hold 2020 Bond Fund A - EUR4 0.761 -Global Buy and Hold 2020 Bond Fund AX - EUR4 0.761 -Global Buy and Hold 2020 Bond Fund B - EUR4 1.761 -Global Buy and Hold 2020 Bond Fund BX - EUR4 1.771 -Global Buy and Hold 2020 Bond Fund I - EUR4 0.501 -Global Buy and Hold 2020 Bond Fund Z - EUR4 0.471 -Global Buy and Maintain Bond Fund I - GBP5 0.391 -Global Buy and Maintain Bond Fund Z - GBP5 0.351 -Global Convertible Bond Fund A - USD 1.28 1.30Global Convertible Bond Fund AH - CHF 1.32 1.34
Total Expense Ratio (%)
Fund Name30 June
201730 June
2016
US Property Fund Z - USD 0.93 0.94Absolute Return Fixed Income Fund A - EUR 1.28 1.30Absolute Return Fixed Income Fund AH - USD 1.30 1.33Absolute Return Fixed Income Fund AR - EUR 1.28 1.30Absolute Return Fixed Income Fund B - EUR 2.28 2.30Absolute Return Fixed Income Fund BR - EUR 2.28 2.30Absolute Return Fixed Income Fund C - EUR 1.73 1.75Absolute Return Fixed Income Fund CR - EUR 1.73 1.75Absolute Return Fixed Income Fund IH - USD 0.70 0.73Absolute Return Fixed Income Fund Z - EUR 0.63 0.64Asian Fixed Income Opportunities Fund A - USD 1.48 1.50Asian Fixed Income Opportunities Fund AX - USD 1.48 1.50Asian Fixed Income Opportunities Fund I - USD 0.82 0.83Asian Fixed Income Opportunities Fund IX - USD 0.82 0.83Asian Fixed Income Opportunities Fund Z - USD 0.78 0.79Asian Fixed Income Opportunities Fund ZX - USD 0.78 0.79Emerging Markets Corporate Debt Fund A - USD 1.72 1.75Emerging Markets Corporate Debt Fund AH - EUR 1.76 1.79Emerging Markets Corporate Debt Fund AHX - EUR 1.77 1.79Emerging Markets Corporate Debt Fund AX - USD 1.72 1.75Emerging Markets Corporate Debt Fund B - USD 2.72 2.75Emerging Markets Corporate Debt Fund BH - EUR 2.76 2.79Emerging Markets Corporate Debt Fund BHX - EUR 2.76 2.79Emerging Markets Corporate Debt Fund BX - USD 2.72 2.75Emerging Markets Corporate Debt Fund C - USD 2.43 2.45Emerging Markets Corporate Debt Fund CH - EUR 2.46 2.49Emerging Markets Corporate Debt Fund I - USD 1.16 1.18Emerging Markets Corporate Debt Fund IH - EUR 1.18 1.221
Emerging Markets Corporate Debt Fund Z - USD 1.12 1.14Emerging Markets Corporate Debt Fund ZH - EUR 1.16 1.18Emerging Markets Debt Fund A - USD 1.68 1.70Emerging Markets Debt Fund AH - EUR 1.72 1.74Emerging Markets Debt Fund AHX - EUR 1.72 1.74Emerging Markets Debt Fund ARM - USD 1.68 1.70Emerging Markets Debt Fund AX - USD 1.68 1.70Emerging Markets Debt Fund B - USD 2.68 2.70Emerging Markets Debt Fund BH - EUR 2.72 2.74Emerging Markets Debt Fund BHX - EUR 2.72 2.74Emerging Markets Debt Fund BX - USD 2.67 2.70Emerging Markets Debt Fund C - USD 2.38 2.40Emerging Markets Debt Fund I - USD 1.11 1.13Emerging Markets Debt Fund Z - USD 1.07 1.09Emerging Markets Debt Fund ZH - EUR 1.12 1.13Emerging Markets Domestic Debt Fund A - USD 1.68 1.69Emerging Markets Domestic Debt Fund AH - EUR 1.71 1.73Emerging Markets Domestic Debt Fund AHX - EUR 1.71 1.73Emerging Markets Domestic Debt Fund ARM - USD 1.68 1.69Emerging Markets Domestic Debt Fund AX - USD 1.68 1.69Emerging Markets Domestic Debt Fund B - USD 2.68 2.69Emerging Markets Domestic Debt Fund BH - EUR 2.72 2.73Emerging Markets Domestic Debt Fund BHX - EUR 2.71 2.73Emerging Markets Domestic Debt Fund BX - USD 2.68 2.69Emerging Markets Domestic Debt Fund C - USD 2.38 2.39Emerging Markets Domestic Debt Fund I - USD 1.11 1.12Emerging Markets Domestic Debt Fund Z - USD 1.07 1.08Emerging Markets Domestic Debt Fund ZH - EUR 1.09 1.12Emerging Markets Domestic Debt Fund ZX - USD 1.08 1.08Emerging Markets Fixed Income Opportunities Fund A - USD 1.66 1.701
Emerging Markets Fixed Income Opportunities Fund AH - EUR 1.72 1.741
Emerging Markets Fixed Income Opportunities Fund AHR - EUR 1.71 1.741
Emerging Markets Fixed Income Opportunities Fund B - USD 2.66 2.701
Emerging Markets Fixed Income Opportunities Fund BH - EUR 2.70 2.741
Emerging Markets Fixed Income Opportunities Fund BHR - EUR 2.71 2.741
Emerging Markets Fixed Income Opportunities Fund C - USD 2.17 2.201
Emerging Markets Fixed Income Opportunities Fund CH - EUR 2.21 2.241
Emerging Markets Fixed Income Opportunities Fund CHR - EUR 2.21 2.241
Emerging Markets Fixed Income Opportunities Fund Z - USD 0.88 0.891
Euro Bond Fund A - EUR 1.08 1.10Euro Bond Fund B - EUR 2.08 2.10Euro Bond Fund C - EUR 1.73 1.75Euro Bond Fund I - EUR 0.67 0.68
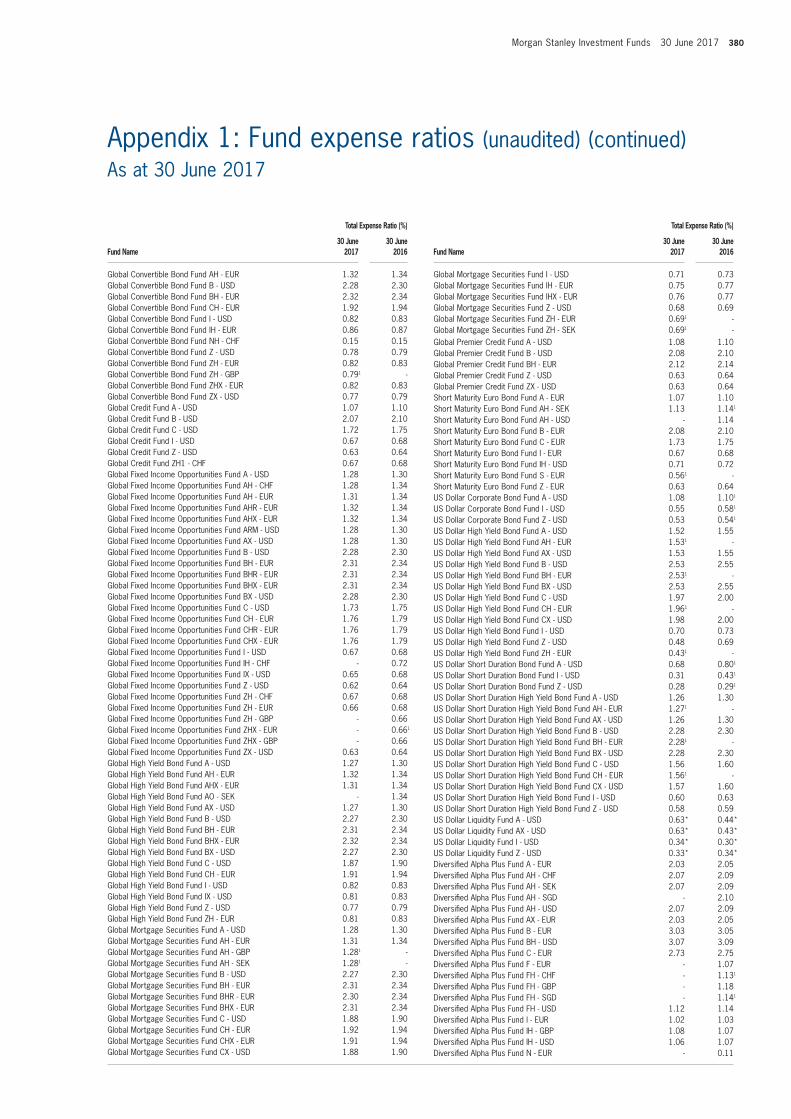
Morgan Stanley Investment Funds 30 June 2017 380
Appendix 1: Fund expense ratios (unaudited) (continued)As at 30 June 2017
Total Expense Ratio (%)
Fund Name30 June
201730 June
2016
Global Mortgage Securities Fund I - USD 0.71 0.73Global Mortgage Securities Fund IH - EUR 0.75 0.77Global Mortgage Securities Fund IHX - EUR 0.76 0.77Global Mortgage Securities Fund Z - USD 0.68 0.69Global Mortgage Securities Fund ZH - EUR 0.691 -Global Mortgage Securities Fund ZH - SEK 0.691 -Global Premier Credit Fund A - USD 1.08 1.10Global Premier Credit Fund B - USD 2.08 2.10Global Premier Credit Fund BH - EUR 2.12 2.14Global Premier Credit Fund Z - USD 0.63 0.64Global Premier Credit Fund ZX - USD 0.63 0.64Short Maturity Euro Bond Fund A - EUR 1.07 1.10Short Maturity Euro Bond Fund AH - SEK 1.13 1.141
Short Maturity Euro Bond Fund AH - USD - 1.14Short Maturity Euro Bond Fund B - EUR 2.08 2.10Short Maturity Euro Bond Fund C - EUR 1.73 1.75Short Maturity Euro Bond Fund I - EUR 0.67 0.68Short Maturity Euro Bond Fund IH - USD 0.71 0.72Short Maturity Euro Bond Fund S - EUR 0.561 -Short Maturity Euro Bond Fund Z - EUR 0.63 0.64US Dollar Corporate Bond Fund A - USD 1.08 1.101
US Dollar Corporate Bond Fund I - USD 0.55 0.581
US Dollar Corporate Bond Fund Z - USD 0.53 0.541
US Dollar High Yield Bond Fund A - USD 1.52 1.55US Dollar High Yield Bond Fund AH - EUR 1.531 -US Dollar High Yield Bond Fund AX - USD 1.53 1.55US Dollar High Yield Bond Fund B - USD 2.53 2.55US Dollar High Yield Bond Fund BH - EUR 2.531 -US Dollar High Yield Bond Fund BX - USD 2.53 2.55US Dollar High Yield Bond Fund C - USD 1.97 2.00US Dollar High Yield Bond Fund CH - EUR 1.961 -US Dollar High Yield Bond Fund CX - USD 1.98 2.00US Dollar High Yield Bond Fund I - USD 0.70 0.73US Dollar High Yield Bond Fund Z - USD 0.48 0.69US Dollar High Yield Bond Fund ZH - EUR 0.431 -US Dollar Short Duration Bond Fund A - USD 0.68 0.801
US Dollar Short Duration Bond Fund I - USD 0.31 0.431
US Dollar Short Duration Bond Fund Z - USD 0.28 0.291
US Dollar Short Duration High Yield Bond Fund A - USD 1.26 1.30US Dollar Short Duration High Yield Bond Fund AH - EUR 1.271 -US Dollar Short Duration High Yield Bond Fund AX - USD 1.26 1.30US Dollar Short Duration High Yield Bond Fund B - USD 2.28 2.30US Dollar Short Duration High Yield Bond Fund BH - EUR 2.281 -US Dollar Short Duration High Yield Bond Fund BX - USD 2.28 2.30US Dollar Short Duration High Yield Bond Fund C - USD 1.56 1.60US Dollar Short Duration High Yield Bond Fund CH - EUR 1.561 -US Dollar Short Duration High Yield Bond Fund CX - USD 1.57 1.60US Dollar Short Duration High Yield Bond Fund I - USD 0.60 0.63US Dollar Short Duration High Yield Bond Fund Z - USD 0.58 0.59US Dollar Liquidity Fund A - USD 0.63* 0.44*
US Dollar Liquidity Fund AX - USD 0.63* 0.43*
US Dollar Liquidity Fund I - USD 0.34* 0.30*
US Dollar Liquidity Fund Z - USD 0.33* 0.34*
Diversifi ed Alpha Plus Fund A - EUR 2.03 2.05Diversifi ed Alpha Plus Fund AH - CHF 2.07 2.09Diversifi ed Alpha Plus Fund AH - SEK 2.07 2.09Diversifi ed Alpha Plus Fund AH - SGD - 2.10Diversifi ed Alpha Plus Fund AH - USD 2.07 2.09Diversifi ed Alpha Plus Fund AX - EUR 2.03 2.05Diversifi ed Alpha Plus Fund B - EUR 3.03 3.05Diversifi ed Alpha Plus Fund BH - USD 3.07 3.09Diversifi ed Alpha Plus Fund C - EUR 2.73 2.75Diversifi ed Alpha Plus Fund F - EUR - 1.07Diversifi ed Alpha Plus Fund FH - CHF - 1.131
Diversifi ed Alpha Plus Fund FH - GBP - 1.18Diversifi ed Alpha Plus Fund FH - SGD - 1.141
Diversifi ed Alpha Plus Fund FH - USD 1.12 1.14Diversifi ed Alpha Plus Fund I - EUR 1.02 1.03Diversifi ed Alpha Plus Fund IH - GBP 1.08 1.07Diversifi ed Alpha Plus Fund IH - USD 1.06 1.07Diversifi ed Alpha Plus Fund N - EUR - 0.11
Total Expense Ratio (%)
Fund Name30 June
201730 June
2016
Global Convertible Bond Fund AH - EUR 1.32 1.34Global Convertible Bond Fund B - USD 2.28 2.30Global Convertible Bond Fund BH - EUR 2.32 2.34Global Convertible Bond Fund CH - EUR 1.92 1.94Global Convertible Bond Fund I - USD 0.82 0.83Global Convertible Bond Fund IH - EUR 0.86 0.87Global Convertible Bond Fund NH - CHF 0.15 0.15Global Convertible Bond Fund Z - USD 0.78 0.79Global Convertible Bond Fund ZH - EUR 0.82 0.83Global Convertible Bond Fund ZH - GBP 0.791 -Global Convertible Bond Fund ZHX - EUR 0.82 0.83Global Convertible Bond Fund ZX - USD 0.77 0.79Global Credit Fund A - USD 1.07 1.10Global Credit Fund B - USD 2.07 2.10Global Credit Fund C - USD 1.72 1.75Global Credit Fund I - USD 0.67 0.68Global Credit Fund Z - USD 0.63 0.64Global Credit Fund ZH1 - CHF 0.67 0.68Global Fixed Income Opportunities Fund A - USD 1.28 1.30Global Fixed Income Opportunities Fund AH - CHF 1.28 1.34Global Fixed Income Opportunities Fund AH - EUR 1.31 1.34Global Fixed Income Opportunities Fund AHR - EUR 1.32 1.34Global Fixed Income Opportunities Fund AHX - EUR 1.32 1.34Global Fixed Income Opportunities Fund ARM - USD 1.28 1.30Global Fixed Income Opportunities Fund AX - USD 1.28 1.30Global Fixed Income Opportunities Fund B - USD 2.28 2.30Global Fixed Income Opportunities Fund BH - EUR 2.31 2.34Global Fixed Income Opportunities Fund BHR - EUR 2.31 2.34Global Fixed Income Opportunities Fund BHX - EUR 2.31 2.34Global Fixed Income Opportunities Fund BX - USD 2.28 2.30Global Fixed Income Opportunities Fund C - USD 1.73 1.75Global Fixed Income Opportunities Fund CH - EUR 1.76 1.79Global Fixed Income Opportunities Fund CHR - EUR 1.76 1.79Global Fixed Income Opportunities Fund CHX - EUR 1.76 1.79Global Fixed Income Opportunities Fund I - USD 0.67 0.68Global Fixed Income Opportunities Fund IH - CHF - 0.72Global Fixed Income Opportunities Fund IX - USD 0.65 0.68Global Fixed Income Opportunities Fund Z - USD 0.62 0.64Global Fixed Income Opportunities Fund ZH - CHF 0.67 0.68Global Fixed Income Opportunities Fund ZH - EUR 0.66 0.68Global Fixed Income Opportunities Fund ZH - GBP - 0.66Global Fixed Income Opportunities Fund ZHX - EUR - 0.661
Global Fixed Income Opportunities Fund ZHX - GBP - 0.66Global Fixed Income Opportunities Fund ZX - USD 0.63 0.64Global High Yield Bond Fund A - USD 1.27 1.30Global High Yield Bond Fund AH - EUR 1.32 1.34Global High Yield Bond Fund AHX - EUR 1.31 1.34Global High Yield Bond Fund AO - SEK - 1.34Global High Yield Bond Fund AX - USD 1.27 1.30Global High Yield Bond Fund B - USD 2.27 2.30Global High Yield Bond Fund BH - EUR 2.31 2.34Global High Yield Bond Fund BHX - EUR 2.32 2.34Global High Yield Bond Fund BX - USD 2.27 2.30Global High Yield Bond Fund C - USD 1.87 1.90Global High Yield Bond Fund CH - EUR 1.91 1.94Global High Yield Bond Fund I - USD 0.82 0.83Global High Yield Bond Fund IX - USD 0.81 0.83Global High Yield Bond Fund Z - USD 0.77 0.79Global High Yield Bond Fund ZH - EUR 0.81 0.83Global Mortgage Securities Fund A - USD 1.28 1.30Global Mortgage Securities Fund AH - EUR 1.31 1.34Global Mortgage Securities Fund AH - GBP 1.281 -Global Mortgage Securities Fund AH - SEK 1.281 -Global Mortgage Securities Fund B - USD 2.27 2.30Global Mortgage Securities Fund BH - EUR 2.31 2.34Global Mortgage Securities Fund BHR - EUR 2.30 2.34Global Mortgage Securities Fund BHX - EUR 2.31 2.34Global Mortgage Securities Fund C - USD 1.88 1.90Global Mortgage Securities Fund CH - EUR 1.92 1.94Global Mortgage Securities Fund CHX - EUR 1.91 1.94Global Mortgage Securities Fund CX - USD 1.88 1.90
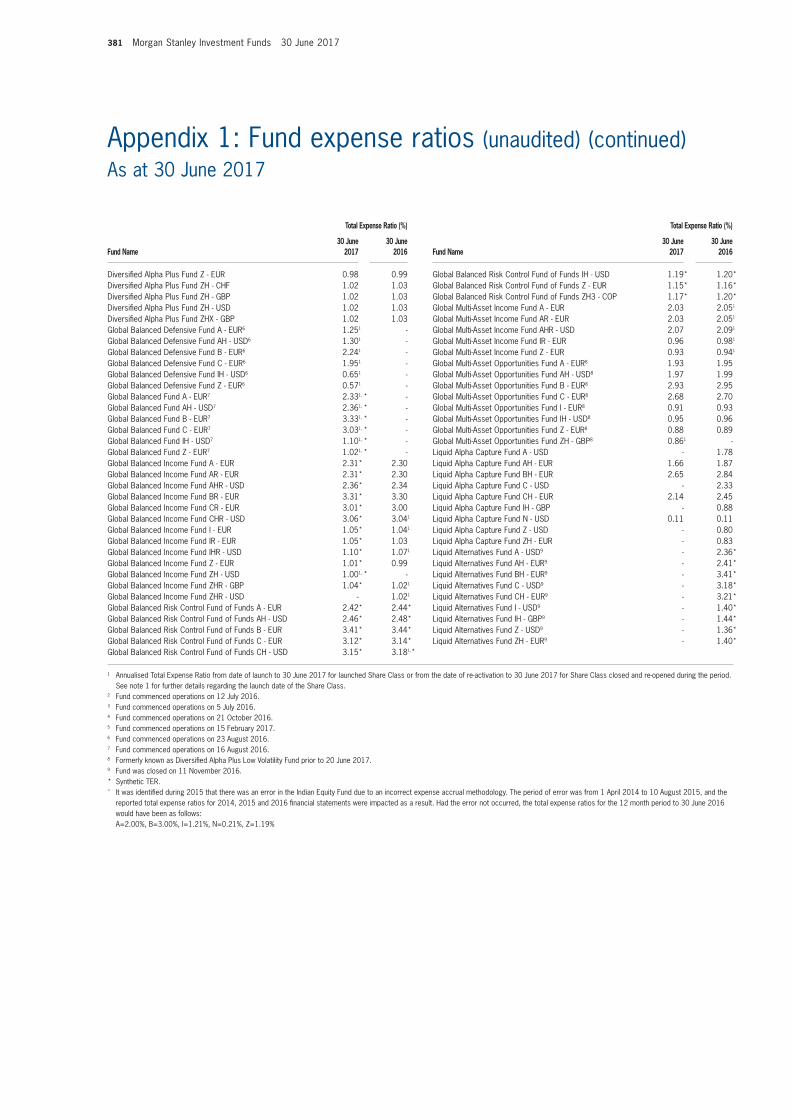
381 Morgan Stanley Investment Funds 30 June 2017
Appendix 1: Fund expense ratios (unaudited) (continued)As at 30 June 2017
1 Annualised Total Expense Ratio from date of launch to 30 June 2017 for launched Share Class or from the date of re-activation to 30 June 2017 for Share Class closed and re-opened during the period. See note 1 for further details regarding the launch date of the Share Class.
2 Fund commenced operations on 12 July 2016.3 Fund commenced operations on 5 July 2016.4 Fund commenced operations on 21 October 2016.5 Fund commenced operations on 15 February 2017.6 Fund commenced operations on 23 August 2016.7 Fund commenced operations on 16 August 2016.8 Formerly known as Diversifi ed Alpha Plus Low Volatility Fund prior to 20 June 2017.9 Fund was closed on 11 November 2016.* Synthetic TER.^ It was identifi ed during 2015 that there was an error in the Indian Equity Fund due to an incorrect expense accrual methodology. The period of error was from 1 April 2014 to 10 August 2015, and the
reported total expense ratios for 2014, 2015 and 2016 fi nancial statements were impacted as a result. Had the error not occurred, the total expense ratios for the 12 month period to 30 June 2016 would have been as follows:A=2.00%, B=3.00%, I=1.21%, N=0.21%, Z=1.19%
Total Expense Ratio (%)
Fund Name30 June
201730 June
2016
Diversifi ed Alpha Plus Fund Z - EUR 0.98 0.99Diversifi ed Alpha Plus Fund ZH - CHF 1.02 1.03Diversifi ed Alpha Plus Fund ZH - GBP 1.02 1.03Diversifi ed Alpha Plus Fund ZH - USD 1.02 1.03Diversifi ed Alpha Plus Fund ZHX - GBP 1.02 1.03Global Balanced Defensive Fund A - EUR6 1.251 -Global Balanced Defensive Fund AH - USD6 1.301 -Global Balanced Defensive Fund B - EUR6 2.241 -Global Balanced Defensive Fund C - EUR6 1.951 -Global Balanced Defensive Fund IH - USD6 0.651 -Global Balanced Defensive Fund Z - EUR6 0.571 -Global Balanced Fund A - EUR7 2.331, * -Global Balanced Fund AH - USD7 2.361, * -Global Balanced Fund B - EUR7 3.331, * -Global Balanced Fund C - EUR7 3.031, * -Global Balanced Fund IH - USD7 1.101, * -Global Balanced Fund Z - EUR7 1.021, * -Global Balanced Income Fund A - EUR 2.31* 2.30Global Balanced Income Fund AR - EUR 2.31* 2.30Global Balanced Income Fund AHR - USD 2.36* 2.34Global Balanced Income Fund BR - EUR 3.31* 3.30Global Balanced Income Fund CR - EUR 3.01* 3.00Global Balanced Income Fund CHR - USD 3.06* 3.041
Global Balanced Income Fund I - EUR 1.05* 1.041
Global Balanced Income Fund IR - EUR 1.05* 1.03Global Balanced Income Fund IHR - USD 1.10* 1.071
Global Balanced Income Fund Z - EUR 1.01* 0.99Global Balanced Income Fund ZH - USD 1.001, * -Global Balanced Income Fund ZHR - GBP 1.04* 1.021
Global Balanced Income Fund ZHR - USD - 1.021
Global Balanced Risk Control Fund of Funds A - EUR 2.42* 2.44*
Global Balanced Risk Control Fund of Funds AH - USD 2.46* 2.48*
Global Balanced Risk Control Fund of Funds B - EUR 3.41* 3.44*
Global Balanced Risk Control Fund of Funds C - EUR 3.12* 3.14*
Global Balanced Risk Control Fund of Funds CH - USD 3.15* 3.181,*
Total Expense Ratio (%)
Fund Name30 June
201730 June
2016
Global Balanced Risk Control Fund of Funds IH - USD 1.19* 1.20*
Global Balanced Risk Control Fund of Funds Z - EUR 1.15* 1.16*
Global Balanced Risk Control Fund of Funds ZH3 - COP 1.17* 1.20*
Global Multi-Asset Income Fund A - EUR 2.03 2.051
Global Multi-Asset Income Fund AR - EUR 2.03 2.051
Global Multi-Asset Income Fund AHR - USD 2.07 2.091
Global Multi-Asset Income Fund IR - EUR 0.96 0.981
Global Multi-Asset Income Fund Z - EUR 0.93 0.941
Global Multi-Asset Opportunities Fund A - EUR8 1.93 1.95Global Multi-Asset Opportunities Fund AH - USD8 1.97 1.99Global Multi-Asset Opportunities Fund B - EUR8 2.93 2.95Global Multi-Asset Opportunities Fund C - EUR8 2.68 2.70Global Multi-Asset Opportunities Fund I - EUR8 0.91 0.93Global Multi-Asset Opportunities Fund IH - USD8 0.95 0.96Global Multi-Asset Opportunities Fund Z - EUR8 0.88 0.89Global Multi-Asset Opportunities Fund ZH - GBP8 0.861 -Liquid Alpha Capture Fund A - USD - 1.78Liquid Alpha Capture Fund AH - EUR 1.66 1.87Liquid Alpha Capture Fund BH - EUR 2.65 2.84Liquid Alpha Capture Fund C - USD - 2.33Liquid Alpha Capture Fund CH - EUR 2.14 2.45Liquid Alpha Capture Fund IH - GBP - 0.88Liquid Alpha Capture Fund N - USD 0.11 0.11Liquid Alpha Capture Fund Z - USD - 0.80Liquid Alpha Capture Fund ZH - EUR - 0.83Liquid Alternatives Fund A - USD9 - 2.36*
Liquid Alternatives Fund AH - EUR9 - 2.41*
Liquid Alternatives Fund BH - EUR9 - 3.41*
Liquid Alternatives Fund C - USD9 - 3.18*
Liquid Alternatives Fund CH - EUR9 - 3.21*
Liquid Alternatives Fund I - USD9 - 1.40*
Liquid Alternatives Fund IH - GBP9 - 1.44*
Liquid Alternatives Fund Z - USD9 - 1.36*
Liquid Alternatives Fund ZH - EUR9 - 1.40*
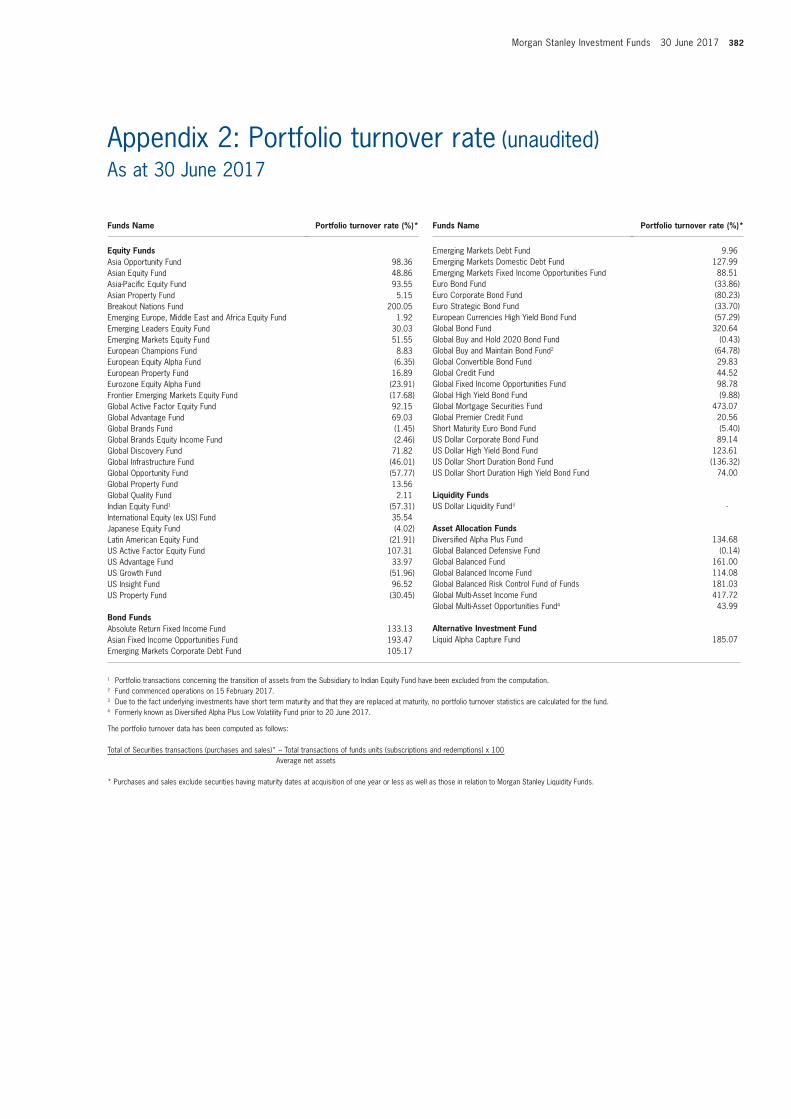
Morgan Stanley Investment Funds 30 June 2017 382
Appendix 2: Portfolio turnover rate (unaudited)As at 30 June 2017
Funds Name Portfolio turnover rate (%)*
Equity FundsAsia Opportunity Fund 98.36Asian Equity Fund 48.86Asia-Pacifi c Equity Fund 93.55Asian Property Fund 5.15Breakout Nations Fund 200.05Emerging Europe, Middle East and Africa Equity Fund 1.92Emerging Leaders Equity Fund 30.03Emerging Markets Equity Fund 51.55European Champions Fund 8.83European Equity Alpha Fund (6.35)European Property Fund 16.89Eurozone Equity Alpha Fund (23.91)Frontier Emerging Markets Equity Fund (17.68)Global Active Factor Equity Fund 92.15Global Advantage Fund 69.03Global Brands Fund (1.45)Global Brands Equity Income Fund (2.46)Global Discovery Fund 71.82Global Infrastructure Fund (46.01)Global Opportunity Fund (57.77)Global Property Fund 13.56Global Quality Fund 2.11Indian Equity Fund1 (57.31)International Equity (ex US) Fund 35.54Japanese Equity Fund (4.02)Latin American Equity Fund (21.91)US Active Factor Equity Fund 107.31US Advantage Fund 33.97US Growth Fund (51.96)US Insight Fund 96.52US Property Fund (30.45)
Bond FundsAbsolute Return Fixed Income Fund 133.13Asian Fixed Income Opportunities Fund 193.47Emerging Markets Corporate Debt Fund 105.17
Funds Name Portfolio turnover rate (%)*
Emerging Markets Debt Fund 9.96Emerging Markets Domestic Debt Fund 127.99Emerging Markets Fixed Income Opportunities Fund 88.51Euro Bond Fund (33.86)Euro Corporate Bond Fund (80.23)Euro Strategic Bond Fund (33.70)European Currencies High Yield Bond Fund (57.29)Global Bond Fund 320.64Global Buy and Hold 2020 Bond Fund (0.43)Global Buy and Maintain Bond Fund2 (64.78)Global Convertible Bond Fund 29.83Global Credit Fund 44.52Global Fixed Income Opportunities Fund 98.78Global High Yield Bond Fund (9.88)Global Mortgage Securities Fund 473.07Global Premier Credit Fund 20.56Short Maturity Euro Bond Fund (5.40)US Dollar Corporate Bond Fund 89.14US Dollar High Yield Bond Fund 123.61US Dollar Short Duration Bond Fund (136.32)US Dollar Short Duration High Yield Bond Fund 74.00
Liquidity FundsUS Dollar Liquidity Fund3 -
Asset Allocation FundsDiversifi ed Alpha Plus Fund 134.68Global Balanced Defensive Fund (0.14)Global Balanced Fund 161.00Global Balanced Income Fund 114.08Global Balanced Risk Control Fund of Funds 181.03Global Multi-Asset Income Fund 417.72Global Multi-Asset Opportunities Fund4 43.99
Alternative Investment FundLiquid Alpha Capture Fund 185.07
1 Portfolio transactions concerning the transition of assets from the Subsidiary to Indian Equity Fund have been excluded from the computation.2 Fund commenced operations on 15 February 2017.3 Due to the fact underlying investments have short term maturity and that they are replaced at maturity, no portfolio turnover statistics are calculated for the fund.4 Formerly known as Diversifi ed Alpha Plus Low Volatility Fund prior to 20 June 2017.
The portfolio turnover data has been computed as follows:
Total of Securities transactions (purchases and sales)* – Total transactions of funds units (subscriptions and redemptions) x 100Average net assets
* Purchases and sales exclude securities having maturity dates at acquisition of one year or less as well as those in relation to Morgan Stanley Liquidity Funds.
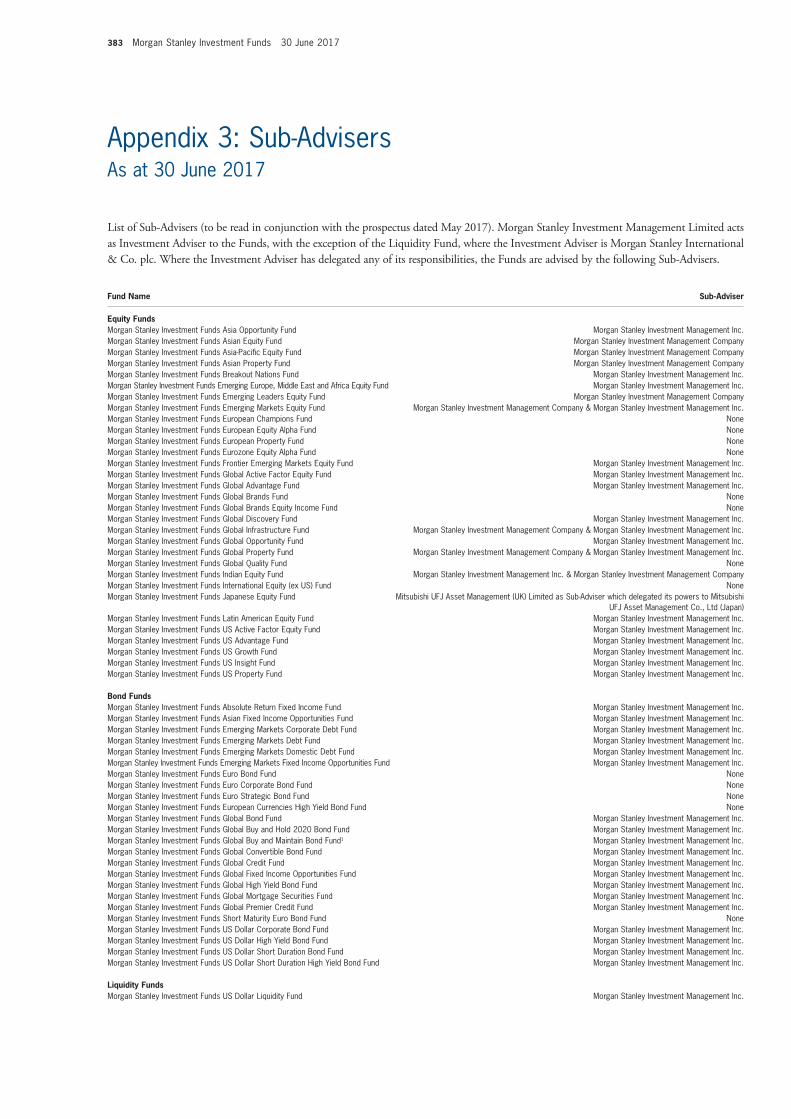
383 Morgan Stanley Investment Funds 30 June 2017
Fund Name Sub-Adviser
Equity FundsMorgan Stanley Investment Funds Asia Opportunity Fund Morgan Stanley Investment Management Inc.Morgan Stanley Investment Funds Asian Equity Fund Morgan Stanley Investment Management CompanyMorgan Stanley Investment Funds Asia-Pacifi c Equity Fund Morgan Stanley Investment Management CompanyMorgan Stanley Investment Funds Asian Property Fund Morgan Stanley Investment Management CompanyMorgan Stanley Investment Funds Breakout Nations Fund Morgan Stanley Investment Management Inc.Morgan Stanley Investment Funds Emerging Europe, Middle East and Africa Equity Fund Morgan Stanley Investment Management Inc.Morgan Stanley Investment Funds Emerging Leaders Equity Fund Morgan Stanley Investment Management CompanyMorgan Stanley Investment Funds Emerging Markets Equity Fund Morgan Stanley Investment Management Company & Morgan Stanley Investment Management Inc.Morgan Stanley Investment Funds European Champions Fund NoneMorgan Stanley Investment Funds European Equity Alpha Fund NoneMorgan Stanley Investment Funds European Property Fund NoneMorgan Stanley Investment Funds Eurozone Equity Alpha Fund NoneMorgan Stanley Investment Funds Frontier Emerging Markets Equity Fund Morgan Stanley Investment Management Inc.Morgan Stanley Investment Funds Global Active Factor Equity Fund Morgan Stanley Investment Management Inc.Morgan Stanley Investment Funds Global Advantage Fund Morgan Stanley Investment Management Inc.Morgan Stanley Investment Funds Global Brands Fund NoneMorgan Stanley Investment Funds Global Brands Equity Income Fund NoneMorgan Stanley Investment Funds Global Discovery Fund Morgan Stanley Investment Management Inc.Morgan Stanley Investment Funds Global Infrastructure Fund Morgan Stanley Investment Management Company & Morgan Stanley Investment Management Inc.Morgan Stanley Investment Funds Global Opportunity Fund Morgan Stanley Investment Management Inc.Morgan Stanley Investment Funds Global Property Fund Morgan Stanley Investment Management Company & Morgan Stanley Investment Management Inc.Morgan Stanley Investment Funds Global Quality Fund NoneMorgan Stanley Investment Funds Indian Equity Fund Morgan Stanley Investment Management Inc. & Morgan Stanley Investment Management CompanyMorgan Stanley Investment Funds International Equity (ex US) Fund NoneMorgan Stanley Investment Funds Japanese Equity Fund Mitsubishi UFJ Asset Management (UK) Limited as Sub-Adviser which delegated its powers to Mitsubishi
UFJ Asset Management Co., Ltd (Japan)Morgan Stanley Investment Funds Latin American Equity Fund Morgan Stanley Investment Management Inc.Morgan Stanley Investment Funds US Active Factor Equity Fund Morgan Stanley Investment Management Inc.Morgan Stanley Investment Funds US Advantage Fund Morgan Stanley Investment Management Inc.Morgan Stanley Investment Funds US Growth Fund Morgan Stanley Investment Management Inc.Morgan Stanley Investment Funds US Insight Fund Morgan Stanley Investment Management Inc.Morgan Stanley Investment Funds US Property Fund Morgan Stanley Investment Management Inc.
Bond FundsMorgan Stanley Investment Funds Absolute Return Fixed Income Fund Morgan Stanley Investment Management Inc.Morgan Stanley Investment Funds Asian Fixed Income Opportunities Fund Morgan Stanley Investment Management Inc.Morgan Stanley Investment Funds Emerging Markets Corporate Debt Fund Morgan Stanley Investment Management Inc.Morgan Stanley Investment Funds Emerging Markets Debt Fund Morgan Stanley Investment Management Inc.Morgan Stanley Investment Funds Emerging Markets Domestic Debt Fund Morgan Stanley Investment Management Inc.Morgan Stanley Investment Funds Emerging Markets Fixed Income Opportunities Fund Morgan Stanley Investment Management Inc.Morgan Stanley Investment Funds Euro Bond Fund NoneMorgan Stanley Investment Funds Euro Corporate Bond Fund NoneMorgan Stanley Investment Funds Euro Strategic Bond Fund NoneMorgan Stanley Investment Funds European Currencies High Yield Bond Fund NoneMorgan Stanley Investment Funds Global Bond Fund Morgan Stanley Investment Management Inc.Morgan Stanley Investment Funds Global Buy and Hold 2020 Bond Fund Morgan Stanley Investment Management Inc.Morgan Stanley Investment Funds Global Buy and Maintain Bond Fund1 Morgan Stanley Investment Management Inc.Morgan Stanley Investment Funds Global Convertible Bond Fund Morgan Stanley Investment Management Inc.Morgan Stanley Investment Funds Global Credit Fund Morgan Stanley Investment Management Inc.Morgan Stanley Investment Funds Global Fixed Income Opportunities Fund Morgan Stanley Investment Management Inc.Morgan Stanley Investment Funds Global High Yield Bond Fund Morgan Stanley Investment Management Inc.Morgan Stanley Investment Funds Global Mortgage Securities Fund Morgan Stanley Investment Management Inc.Morgan Stanley Investment Funds Global Premier Credit Fund Morgan Stanley Investment Management Inc.Morgan Stanley Investment Funds Short Maturity Euro Bond Fund NoneMorgan Stanley Investment Funds US Dollar Corporate Bond Fund Morgan Stanley Investment Management Inc.Morgan Stanley Investment Funds US Dollar High Yield Bond Fund Morgan Stanley Investment Management Inc.Morgan Stanley Investment Funds US Dollar Short Duration Bond Fund Morgan Stanley Investment Management Inc.Morgan Stanley Investment Funds US Dollar Short Duration High Yield Bond Fund Morgan Stanley Investment Management Inc.
Liquidity FundsMorgan Stanley Investment Funds US Dollar Liquidity Fund Morgan Stanley Investment Management Inc.
List of Sub-Advisers (to be read in conjunction with the prospectus dated May 2017). Morgan Stanley Investment Management Limited acts as Investment Adviser to the Funds, with the exception of the Liquidity Fund, where the Investment Adviser is Morgan Stanley International & Co. plc. Where the Investment Adviser has delegated any of its responsibilities, the Funds are advised by the following Sub-Advisers.
Appendix 3: Sub-AdvisersAs at 30 June 2017
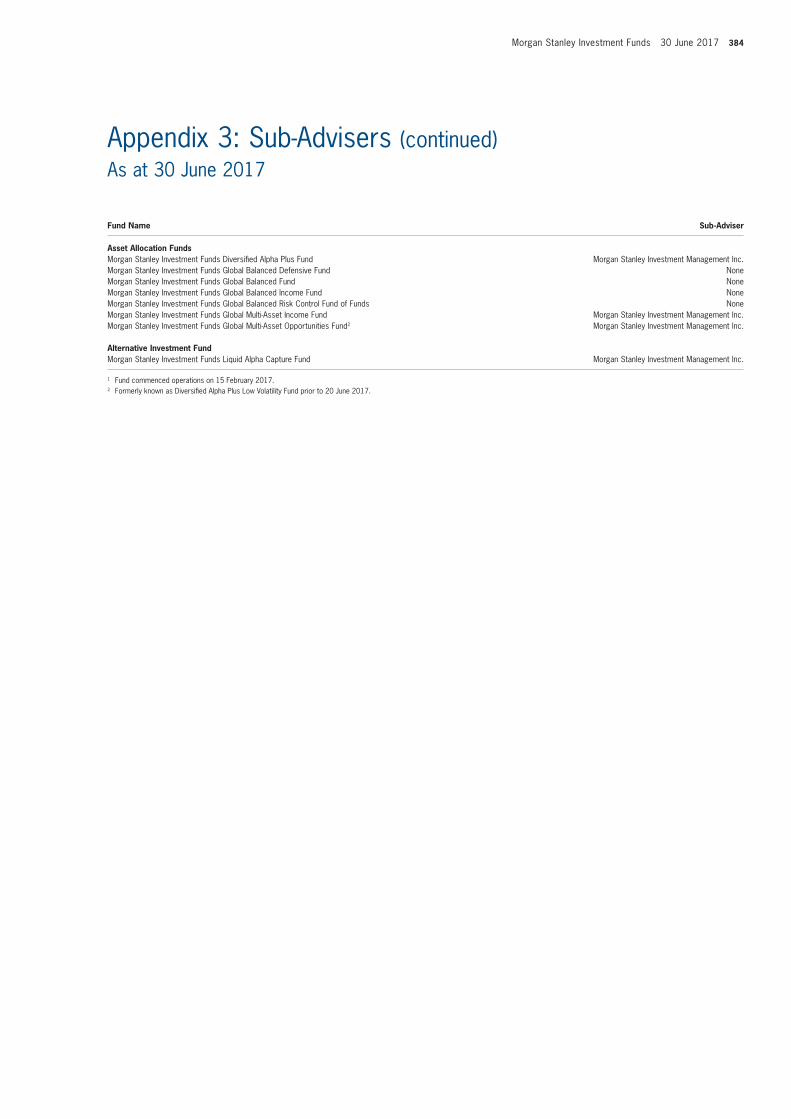
Morgan Stanley Investment Funds 30 June 2017 384
Fund Name Sub-Adviser
Asset Allocation FundsMorgan Stanley Investment Funds Diversifi ed Alpha Plus Fund Morgan Stanley Investment Management Inc.Morgan Stanley Investment Funds Global Balanced Defensive Fund NoneMorgan Stanley Investment Funds Global Balanced Fund NoneMorgan Stanley Investment Funds Global Balanced Income Fund NoneMorgan Stanley Investment Funds Global Balanced Risk Control Fund of Funds NoneMorgan Stanley Investment Funds Global Multi-Asset Income Fund Morgan Stanley Investment Management Inc.Morgan Stanley Investment Funds Global Multi-Asset Opportunities Fund2 Morgan Stanley Investment Management Inc.
Alternative Investment FundMorgan Stanley Investment Funds Liquid Alpha Capture Fund Morgan Stanley Investment Management Inc.
1 Fund commenced operations on 15 February 2017.2 Formerly known as Diversifi ed Alpha Plus Low Volatility Fund prior to 20 June 2017.
Appendix 3: Sub-Advisers (continued)As at 30 June 2017
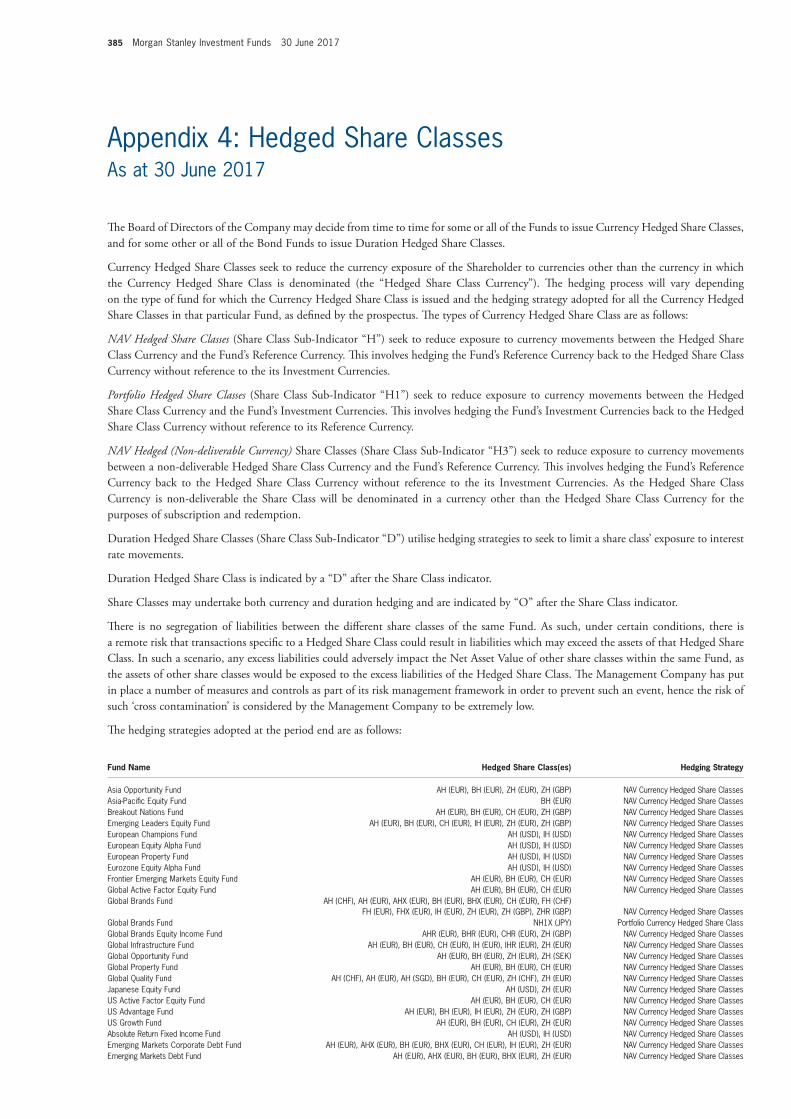
385 Morgan Stanley Investment Funds 30 June 2017
Fund Name Hedged Share Class(es) Hedging Strategy
Asia Opportunity Fund AH (EUR), BH (EUR), ZH (EUR), ZH (GBP) NAV Currency Hedged Share ClassesAsia-Pacifi c Equity Fund BH (EUR) NAV Currency Hedged Share ClassesBreakout Nations Fund AH (EUR), BH (EUR), CH (EUR), ZH (GBP) NAV Currency Hedged Share ClassesEmerging Leaders Equity Fund AH (EUR), BH (EUR), CH (EUR), IH (EUR), ZH (EUR), ZH (GBP) NAV Currency Hedged Share ClassesEuropean Champions Fund AH (USD), IH (USD) NAV Currency Hedged Share ClassesEuropean Equity Alpha Fund AH (USD), IH (USD) NAV Currency Hedged Share ClassesEuropean Property Fund AH (USD), IH (USD) NAV Currency Hedged Share ClassesEurozone Equity Alpha Fund AH (USD), IH (USD) NAV Currency Hedged Share ClassesFrontier Emerging Markets Equity Fund AH (EUR), BH (EUR), CH (EUR) NAV Currency Hedged Share ClassesGlobal Active Factor Equity Fund AH (EUR), BH (EUR), CH (EUR) NAV Currency Hedged Share ClassesGlobal Brands Fund AH (CHF), AH (EUR), AHX (EUR), BH (EUR), BHX (EUR), CH (EUR), FH (CHF)
FH (EUR), FHX (EUR), IH (EUR), ZH (EUR), ZH (GBP), ZHR (GBP) NAV Currency Hedged Share ClassesGlobal Brands Fund NH1X (JPY) Portfolio Currency Hedged Share ClassGlobal Brands Equity Income Fund AHR (EUR), BHR (EUR), CHR (EUR), ZH (GBP) NAV Currency Hedged Share ClassesGlobal Infrastructure Fund AH (EUR), BH (EUR), CH (EUR), IH (EUR), IHR (EUR), ZH (EUR) NAV Currency Hedged Share ClassesGlobal Opportunity Fund AH (EUR), BH (EUR), ZH (EUR), ZH (SEK) NAV Currency Hedged Share ClassesGlobal Property Fund AH (EUR), BH (EUR), CH (EUR) NAV Currency Hedged Share ClassesGlobal Quality Fund AH (CHF), AH (EUR), AH (SGD), BH (EUR), CH (EUR), ZH (CHF), ZH (EUR) NAV Currency Hedged Share ClassesJapanese Equity Fund AH (USD), ZH (EUR) NAV Currency Hedged Share ClassesUS Active Factor Equity Fund AH (EUR), BH (EUR), CH (EUR) NAV Currency Hedged Share ClassesUS Advantage Fund AH (EUR), BH (EUR), IH (EUR), ZH (EUR), ZH (GBP) NAV Currency Hedged Share ClassesUS Growth Fund AH (EUR), BH (EUR), CH (EUR), ZH (EUR) NAV Currency Hedged Share ClassesAbsolute Return Fixed Income Fund AH (USD), IH (USD) NAV Currency Hedged Share ClassesEmerging Markets Corporate Debt Fund AH (EUR), AHX (EUR), BH (EUR), BHX (EUR), CH (EUR), IH (EUR), ZH (EUR) NAV Currency Hedged Share ClassesEmerging Markets Debt Fund AH (EUR), AHX (EUR), BH (EUR), BHX (EUR), ZH (EUR) NAV Currency Hedged Share Classes
Th e Board of Directors of the Company may decide from time to time for some or all of the Funds to issue Currency Hedged Share Classes, and for some other or all of the Bond Funds to issue Duration Hedged Share Classes.
Currency Hedged Share Classes seek to reduce the currency exposure of the Shareholder to currencies other than the currency in which the Currency Hedged Share Class is denominated (the “Hedged Share Class Currency”). Th e hedging process will vary depending on the type of fund for which the Currency Hedged Share Class is issued and the hedging strategy adopted for all the Currency Hedged Share Classes in that particular Fund, as defi ned by the prospectus. Th e types of Currency Hedged Share Class are as follows:
NAV Hedged Share Classes (Share Class Sub-Indicator “H”) seek to reduce exposure to currency movements between the Hedged Share Class Currency and the Fund’s Reference Currency. Th is involves hedging the Fund’s Reference Currency back to the Hedged Share Class Currency without reference to the its Investment Currencies.
Portfolio Hedged Share Classes (Share Class Sub-Indicator “H1”) seek to reduce exposure to currency movements between the Hedged Share Class Currency and the Fund’s Investment Currencies. Th is involves hedging the Fund’s Investment Currencies back to the Hedged Share Class Currency without reference to its Reference Currency.
NAV Hedged (Non-deliverable Currency) Share Classes (Share Class Sub-Indicator “H3”) seek to reduce exposure to currency movements between a non-deliverable Hedged Share Class Currency and the Fund’s Reference Currency. Th is involves hedging the Fund’s Reference Currency back to the Hedged Share Class Currency without reference to the its Investment Currencies. As the Hedged Share Class Currency is non-deliverable the Share Class will be denominated in a currency other than the Hedged Share Class Currency for the purposes of subscription and redemption.
Duration Hedged Share Classes (Share Class Sub-Indicator “D”) utilise hedging strategies to seek to limit a share class’ exposure to interest rate movements.
Duration Hedged Share Class is indicated by a “D” after the Share Class indicator.
Share Classes may undertake both currency and duration hedging and are indicated by “O” after the Share Class indicator.
Th ere is no segregation of liabilities between the diff erent share classes of the same Fund. As such, under certain conditions, there is a remote risk that transactions specifi c to a Hedged Share Class could result in liabilities which may exceed the assets of that Hedged Share Class. In such a scenario, any excess liabilities could adversely impact the Net Asset Value of other share classes within the same Fund, as the assets of other share classes would be exposed to the excess liabilities of the Hedged Share Class. Th e Management Company has put in place a number of measures and controls as part of its risk management framework in order to prevent such an event, hence the risk of such ‘cross contamination’ is considered by the Management Company to be extremely low.
Th e hedging strategies adopted at the period end are as follows:
Appendix 4: Hedged Share ClassesAs at 30 June 2017
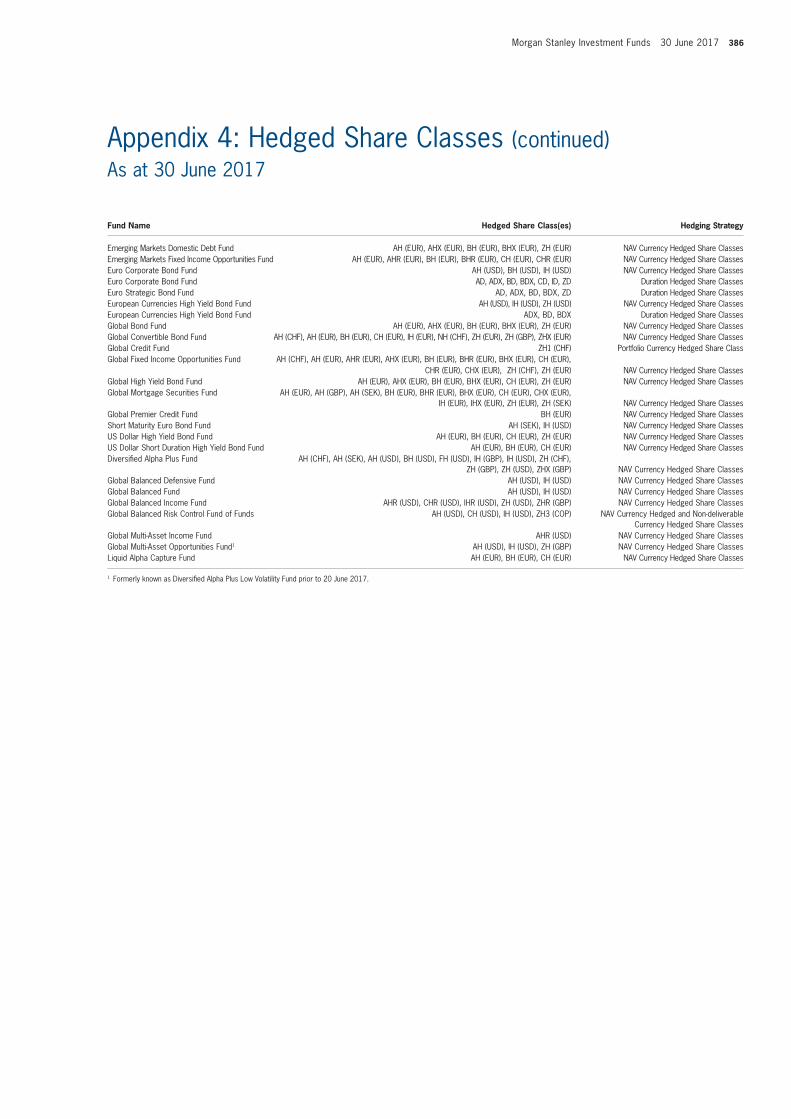
Morgan Stanley Investment Funds 30 June 2017 386
Fund Name Hedged Share Class(es) Hedging Strategy
Emerging Markets Domestic Debt Fund AH (EUR), AHX (EUR), BH (EUR), BHX (EUR), ZH (EUR) NAV Currency Hedged Share ClassesEmerging Markets Fixed Income Opportunities Fund AH (EUR), AHR (EUR), BH (EUR), BHR (EUR), CH (EUR), CHR (EUR) NAV Currency Hedged Share ClassesEuro Corporate Bond Fund AH (USD), BH (USD), IH (USD) NAV Currency Hedged Share ClassesEuro Corporate Bond Fund AD, ADX, BD, BDX, CD, ID, ZD Duration Hedged Share ClassesEuro Strategic Bond Fund AD, ADX, BD, BDX, ZD Duration Hedged Share ClassesEuropean Currencies High Yield Bond Fund AH (USD), IH (USD), ZH (USD) NAV Currency Hedged Share ClassesEuropean Currencies High Yield Bond Fund ADX, BD, BDX Duration Hedged Share ClassesGlobal Bond Fund AH (EUR), AHX (EUR), BH (EUR), BHX (EUR), ZH (EUR) NAV Currency Hedged Share ClassesGlobal Convertible Bond Fund AH (CHF), AH (EUR), BH (EUR), CH (EUR), IH (EUR), NH (CHF), ZH (EUR), ZH (GBP), ZHX (EUR) NAV Currency Hedged Share ClassesGlobal Credit Fund ZH1 (CHF) Portfolio Currency Hedged Share ClassGlobal Fixed Income Opportunities Fund AH (CHF), AH (EUR), AHR (EUR), AHX (EUR), BH (EUR), BHR (EUR), BHX (EUR), CH (EUR),
CHR (EUR), CHX (EUR), ZH (CHF), ZH (EUR) NAV Currency Hedged Share ClassesGlobal High Yield Bond Fund AH (EUR), AHX (EUR), BH (EUR), BHX (EUR), CH (EUR), ZH (EUR) NAV Currency Hedged Share ClassesGlobal Mortgage Securities Fund AH (EUR), AH (GBP), AH (SEK), BH (EUR), BHR (EUR), BHX (EUR), CH (EUR), CHX (EUR),
IH (EUR), IHX (EUR), ZH (EUR), ZH (SEK) NAV Currency Hedged Share ClassesGlobal Premier Credit Fund BH (EUR) NAV Currency Hedged Share ClassesShort Maturity Euro Bond Fund AH (SEK), IH (USD) NAV Currency Hedged Share ClassesUS Dollar High Yield Bond Fund AH (EUR), BH (EUR), CH (EUR), ZH (EUR) NAV Currency Hedged Share ClassesUS Dollar Short Duration High Yield Bond Fund AH (EUR), BH (EUR), CH (EUR) NAV Currency Hedged Share ClassesDiversifi ed Alpha Plus Fund AH (CHF), AH (SEK), AH (USD), BH (USD), FH (USD), IH (GBP), IH (USD), ZH (CHF),
ZH (GBP), ZH (USD), ZHX (GBP) NAV Currency Hedged Share ClassesGlobal Balanced Defensive Fund AH (USD), IH (USD) NAV Currency Hedged Share ClassesGlobal Balanced Fund AH (USD), IH (USD) NAV Currency Hedged Share ClassesGlobal Balanced Income Fund AHR (USD), CHR (USD), IHR (USD), ZH (USD), ZHR (GBP) NAV Currency Hedged Share ClassesGlobal Balanced Risk Control Fund of Funds AH (USD), CH (USD), IH (USD), ZH3 (COP) NAV Currency Hedged and Non-deliverable
Currency Hedged Share ClassesGlobal Multi-Asset Income Fund AHR (USD) NAV Currency Hedged Share ClassesGlobal Multi-Asset Opportunities Fund1 AH (USD), IH (USD), ZH (GBP) NAV Currency Hedged Share ClassesLiquid Alpha Capture Fund AH (EUR), BH (EUR), CH (EUR) NAV Currency Hedged Share Classes
1 Formerly known as Diversifi ed Alpha Plus Low Volatility Fund prior to 20 June 2017.
Appendix 4: Hedged Share Classes (continued)As at 30 June 2017
387 Morgan Stanley Investment Funds 30 June 2017
Th e Management Company has a remuneration policy in place which seeks to ensure that the interests of the Company and the Shareholders are aligned. Such remuneration policy imposes remuneration rules on staff and senior management within the Management Company whose activities have an impact on the risk profi le of the Company. Th e Management Company shall seek to ensure that such remuneration policies and practices will be consistent with sound and eff ective risk management and with UCITS Regulation. Th e Management Company shall also seek to ensure that such remuneration policies and practices shall not encourage risk taking which is inconsistent with the risk profi le and constitutional documents of the Company.
Th e Management Company shall seek to ensure that the remuneration policy will, at all times, be consistent with the business strategy, objectives, values and interests of the Company and the Shareholders and that the remuneration policy will include measures that seek to ensure that all relevant confl icts of interest can be managed appropriately at all times.
Individuals who are subject to the provisions of the UCITS remuneration policy (“Remuneration Code Staff ”) will complete the fi rst full remuneration performance year under the new UCITS remuneration rules on 31 December 2017. Th erefore, the total amount of remuneration the Remuneration Code Staff receive, and how this remuneration is split into fi xed and variable remuneration, is not available for the Company’s annual accounting period in question.
Appendix 5: Remuneration Policy of the Management Company (unaudited)As at 30 June 2017
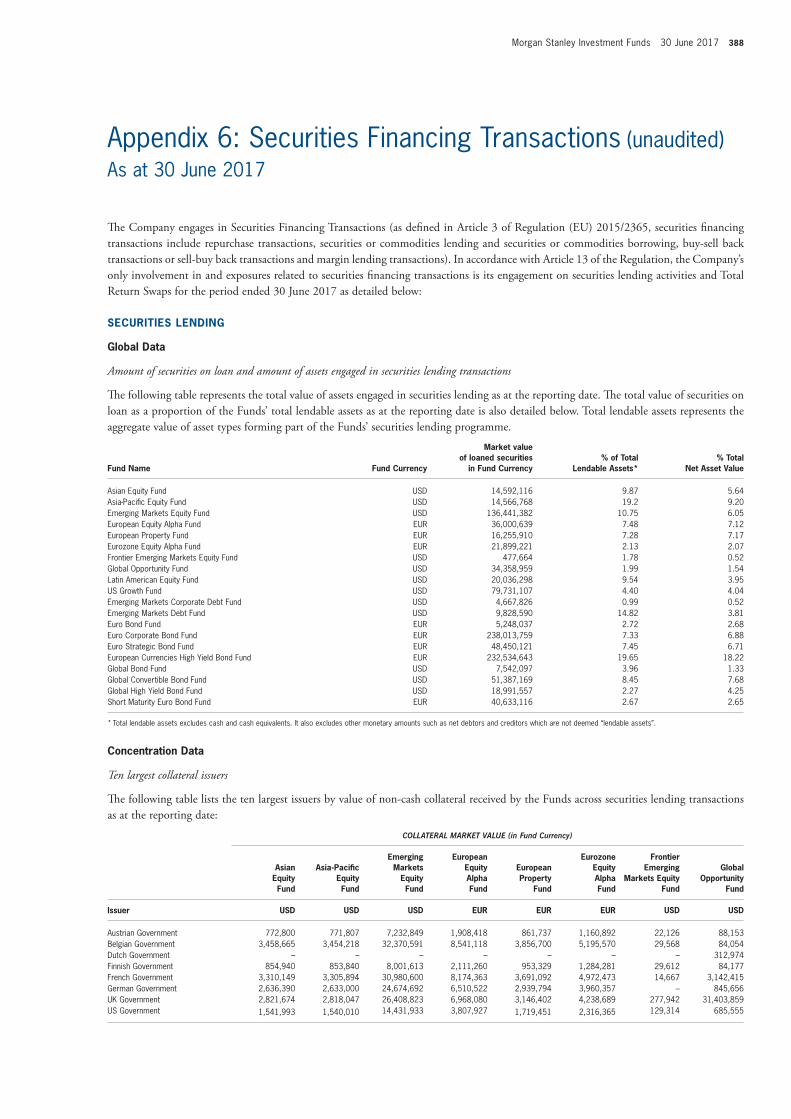
Morgan Stanley Investment Funds 30 June 2017 388
Appendix 6: Securities Financing Transactions (unaudited)As at 30 June 2017
Th e Company engages in Securities Financing Transactions (as defi ned in Article 3 of Regulation (EU) 2015/2365, securities fi nancing transactions include repurchase transactions, securities or commodities lending and securities or commodities borrowing, buy-sell back transactions or sell-buy back transactions and margin lending transactions). In accordance with Article 13 of the Regulation, the Company’s only involvement in and exposures related to securities fi nancing transactions is its engagement on securities lending activities and Total Return Swaps for the period ended 30 June 2017 as detailed below:
SECURITIES LENDING
Global Data
Amount of securities on loan and amount of assets engaged in securities lending transactions
Th e following table represents the total value of assets engaged in securities lending as at the reporting date. Th e total value of securities on loan as a proportion of the Funds’ total lendable assets as at the reporting date is also detailed below. Total lendable assets represents the aggregate value of asset types forming part of the Funds’ securities lending programme.
Fund Name Fund Currency
Market value of loaned securities
in Fund Currency% of Total
Lendable Assets*% Total
Net Asset Value
Asian Equity Fund USD 14,592,116 9.87 5.64Asia-Pacifi c Equity Fund USD 14,566,768 19.2 9.20Emerging Markets Equity Fund USD 136,441,382 10.75 6.05European Equity Alpha Fund EUR 36,000,639 7.48 7.12European Property Fund EUR 16,255,910 7.28 7.17Eurozone Equity Alpha Fund EUR 21,899,221 2.13 2.07Frontier Emerging Markets Equity Fund USD 477,664 1.78 0.52Global Opportunity Fund USD 34,358,959 1.99 1.54Latin American Equity Fund USD 20,036,298 9.54 3.95US Growth Fund USD 79,731,107 4.40 4.04Emerging Markets Corporate Debt Fund USD 4,667,826 0.99 0.52Emerging Markets Debt Fund USD 9,828,590 14.82 3.81Euro Bond Fund EUR 5,248,037 2.72 2.68Euro Corporate Bond Fund EUR 238,013,759 7.33 6.88Euro Strategic Bond Fund EUR 48,450,121 7.45 6.71European Currencies High Yield Bond Fund EUR 232,534,643 19.65 18.22Global Bond Fund USD 7,542,097 3.96 1.33Global Convertible Bond Fund USD 51,387,169 8.45 7.68Global High Yield Bond Fund USD 18,991,557 2.27 4.25Short Maturity Euro Bond Fund EUR 40,633,116 2.67 2.65
* Total lendable assets excludes cash and cash equivalents. It also excludes other monetary amounts such as net debtors and creditors which are not deemed “lendable assets”.
Concentration Data
Ten largest collateral issuers
Th e following table lists the ten largest issuers by value of non-cash collateral received by the Funds across securities lending transactions as at the reporting date:
COLLATERAL MARKET VALUE (in Fund Currency)
Asian Equity Fund
Asia-Pacifi c Equity Fund
Emerging Markets
Equity Fund
European Equity Alpha Fund
European Property
Fund
Eurozone Equity Alpha Fund
Frontier Emerging
Markets Equity Fund
Global Opportunity
Fund
Issuer USD USD USD EUR EUR EUR USD USD
Austrian Government 772,800 771,807 7,232,849 1,908,418 861,737 1,160,892 22,126 88,153Belgian Government 3,458,665 3,454,218 32,370,591 8,541,118 3,856,700 5,195,570 29,568 84,054Dutch Government – – – – – – – 312,974Finnish Government 854,940 853,840 8,001,613 2,111,260 953,329 1,284,281 29,612 84,177French Government 3,310,149 3,305,894 30,980,600 8,174,363 3,691,092 4,972,473 14,667 3,142,415German Government 2,636,390 2,633,000 24,674,692 6,510,522 2,939,794 3,960,357 – 845,656UK Government 2,821,674 2,818,047 26,408,823 6,968,080 3,146,402 4,238,689 277,942 31,403,859US Government 1,541,993 1,540,010 14,431,933 3,807,927 1,719,451 2,316,365 129,314 685,555
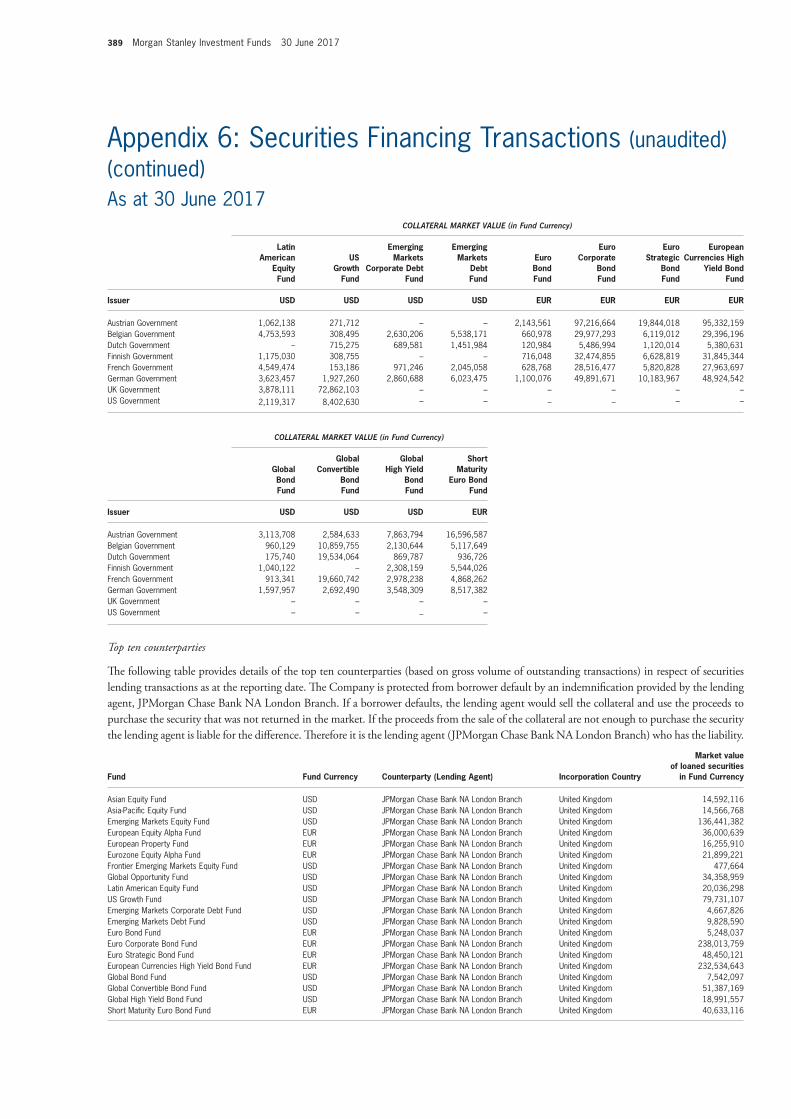
389 Morgan Stanley Investment Funds 30 June 2017
COLLATERAL MARKET VALUE (in Fund Currency)
Latin American
Equity Fund
US Growth
Fund
Emerging Markets
Corporate Debt Fund
Emerging Markets
Debt Fund
Euro Bond Fund
Euro Corporate
Bond Fund
Euro Strategic
Bond Fund
European Currencies High
Yield Bond Fund
Issuer USD USD USD USD EUR EUR EUR EUR
Austrian Government 1,062,138 271,712 – – 2,143,561 97,216,664 19,844,018 95,332,159Belgian Government 4,753,593 308,495 2,630,206 5,538,171 660,978 29,977,293 6,119,012 29,396,196Dutch Government – 715,275 689,581 1,451,984 120,984 5,486,994 1,120,014 5,380,631Finnish Government 1,175,030 308,755 – – 716,048 32,474,855 6,628,819 31,845,344French Government 4,549,474 153,186 971,246 2,045,058 628,768 28,516,477 5,820,828 27,963,697German Government 3,623,457 1,927,260 2,860,688 6,023,475 1,100,076 49,891,671 10,183,967 48,924,542UK Government 3,878,111 72,862,103 – – – – – –US Government 2,119,317 8,402,630 – – – – – –
COLLATERAL MARKET VALUE (in Fund Currency)
Global Bond Fund
Global Convertible
Bond Fund
Global High Yield
Bond Fund
Short Maturity
Euro Bond Fund
Issuer USD USD USD EUR
Austrian Government 3,113,708 2,584,633 7,863,794 16,596,587Belgian Government 960,129 10,859,755 2,130,644 5,117,649Dutch Government 175,740 19,534,064 869,787 936,726Finnish Government 1,040,122 – 2,308,159 5,544,026French Government 913,341 19,660,742 2,978,238 4,868,262German Government 1,597,957 2,692,490 3,548,309 8,517,382UK Government – – – –US Government – – – –
Top ten counterparties
Th e following table provides details of the top ten counterparties (based on gross volume of outstanding transactions) in respect of securities lending transactions as at the reporting date. Th e Company is protected from borrower default by an indemnifi cation provided by the lending agent, JPMorgan Chase Bank NA London Branch. If a borrower defaults, the lending agent would sell the collateral and use the proceeds to purchase the security that was not returned in the market. If the proceeds from the sale of the collateral are not enough to purchase the security the lending agent is liable for the diff erence. Th erefore it is the lending agent (JPMorgan Chase Bank NA London Branch) who has the liability.
Fund Fund Currency Counterparty (Lending Agent) Incorporation Country
Market value of loaned securities
in Fund Currency
Asian Equity Fund USD JPMorgan Chase Bank NA London Branch United Kingdom 14,592,116Asia-Pacifi c Equity Fund USD JPMorgan Chase Bank NA London Branch United Kingdom 14,566,768Emerging Markets Equity Fund USD JPMorgan Chase Bank NA London Branch United Kingdom 136,441,382European Equity Alpha Fund EUR JPMorgan Chase Bank NA London Branch United Kingdom 36,000,639European Property Fund EUR JPMorgan Chase Bank NA London Branch United Kingdom 16,255,910Eurozone Equity Alpha Fund EUR JPMorgan Chase Bank NA London Branch United Kingdom 21,899,221Frontier Emerging Markets Equity Fund USD JPMorgan Chase Bank NA London Branch United Kingdom 477,664Global Opportunity Fund USD JPMorgan Chase Bank NA London Branch United Kingdom 34,358,959Latin American Equity Fund USD JPMorgan Chase Bank NA London Branch United Kingdom 20,036,298US Growth Fund USD JPMorgan Chase Bank NA London Branch United Kingdom 79,731,107Emerging Markets Corporate Debt Fund USD JPMorgan Chase Bank NA London Branch United Kingdom 4,667,826Emerging Markets Debt Fund USD JPMorgan Chase Bank NA London Branch United Kingdom 9,828,590Euro Bond Fund EUR JPMorgan Chase Bank NA London Branch United Kingdom 5,248,037Euro Corporate Bond Fund EUR JPMorgan Chase Bank NA London Branch United Kingdom 238,013,759Euro Strategic Bond Fund EUR JPMorgan Chase Bank NA London Branch United Kingdom 48,450,121European Currencies High Yield Bond Fund EUR JPMorgan Chase Bank NA London Branch United Kingdom 232,534,643Global Bond Fund USD JPMorgan Chase Bank NA London Branch United Kingdom 7,542,097Global Convertible Bond Fund USD JPMorgan Chase Bank NA London Branch United Kingdom 51,387,169Global High Yield Bond Fund USD JPMorgan Chase Bank NA London Branch United Kingdom 18,991,557Short Maturity Euro Bond Fund EUR JPMorgan Chase Bank NA London Branch United Kingdom 40,633,116
Appendix 6: Securities Financing Transactions (unaudited)(continued)As at 30 June 2017
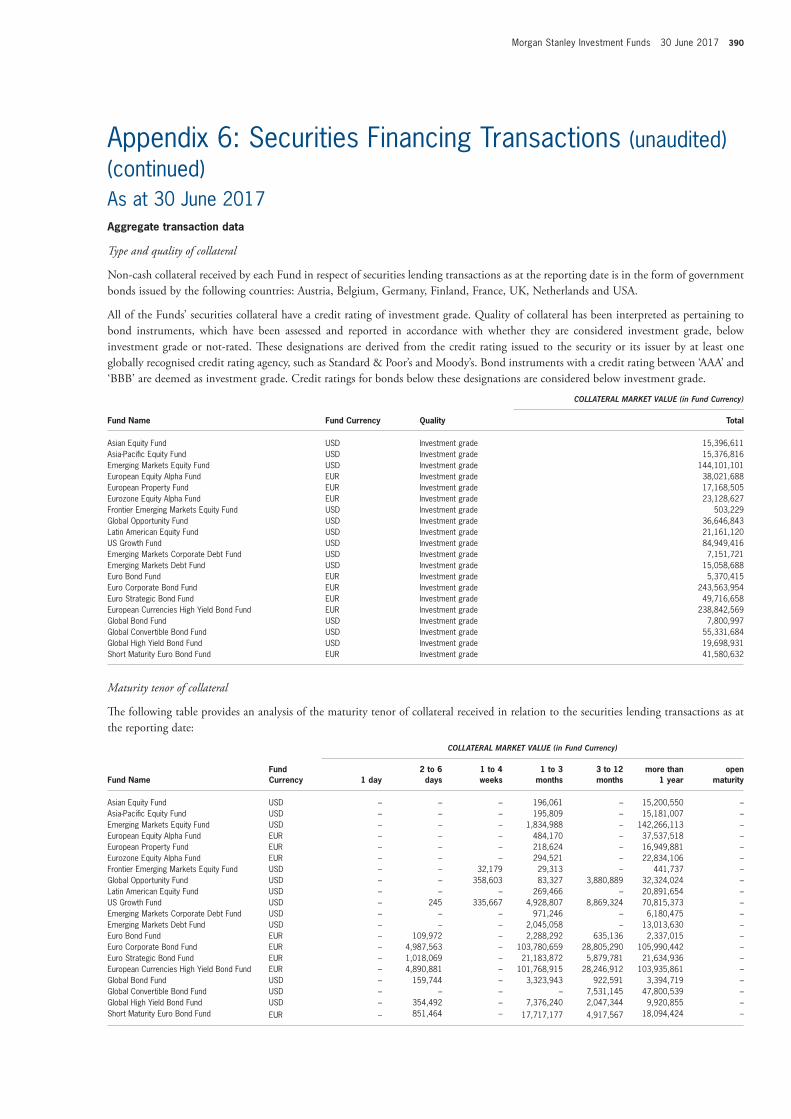
Morgan Stanley Investment Funds 30 June 2017 390
Appendix 6: Securities Financing Transactions (unaudited)(continued)As at 30 June 2017Aggregate transaction data
Type and quality of collateral
Non-cash collateral received by each Fund in respect of securities lending transactions as at the reporting date is in the form of government bonds issued by the following countries: Austria, Belgium, Germany, Finland, France, UK, Netherlands and USA.
All of the Funds’ securities collateral have a credit rating of investment grade. Quality of collateral has been interpreted as pertaining to bond instruments, which have been assessed and reported in accordance with whether they are considered investment grade, below investment grade or not-rated. Th ese designations are derived from the credit rating issued to the security or its issuer by at least one globally recognised credit rating agency, such as Standard & Poor’s and Moody’s. Bond instruments with a credit rating between ‘AAA’ and ‘BBB’ are deemed as investment grade. Credit ratings for bonds below these designations are considered below investment grade.
COLLATERAL MARKET VALUE (in Fund Currency)
Fund Name Fund Currency Quality Total
Asian Equity Fund USD Investment grade 15,396,611Asia-Pacifi c Equity Fund USD Investment grade 15,376,816Emerging Markets Equity Fund USD Investment grade 144,101,101European Equity Alpha Fund EUR Investment grade 38,021,688European Property Fund EUR Investment grade 17,168,505Eurozone Equity Alpha Fund EUR Investment grade 23,128,627Frontier Emerging Markets Equity Fund USD Investment grade 503,229Global Opportunity Fund USD Investment grade 36,646,843Latin American Equity Fund USD Investment grade 21,161,120US Growth Fund USD Investment grade 84,949,416Emerging Markets Corporate Debt Fund USD Investment grade 7,151,721Emerging Markets Debt Fund USD Investment grade 15,058,688Euro Bond Fund EUR Investment grade 5,370,415Euro Corporate Bond Fund EUR Investment grade 243,563,954Euro Strategic Bond Fund EUR Investment grade 49,716,658European Currencies High Yield Bond Fund EUR Investment grade 238,842,569Global Bond Fund USD Investment grade 7,800,997Global Convertible Bond Fund USD Investment grade 55,331,684Global High Yield Bond Fund USD Investment grade 19,698,931Short Maturity Euro Bond Fund EUR Investment grade 41,580,632
Maturity tenor of collateral
Th e following table provides an analysis of the maturity tenor of collateral received in relation to the securities lending transactions as at the reporting date:
COLLATERAL MARKET VALUE (in Fund Currency)
Fund NameFund Currency 1 day
2 to 6 days
1 to 4 weeks
1 to 3 months
3 to 12 months
more than 1 year
open maturity
Asian Equity Fund USD – – – 196,061 – 15,200,550 –Asia-Pacifi c Equity Fund USD – – – 195,809 – 15,181,007 –Emerging Markets Equity Fund USD – – – 1,834,988 – 142,266,113 –European Equity Alpha Fund EUR – – – 484,170 – 37,537,518 –European Property Fund EUR – – – 218,624 – 16,949,881 –Eurozone Equity Alpha Fund EUR – – – 294,521 – 22,834,106 –Frontier Emerging Markets Equity Fund USD – – 32,179 29,313 – 441,737 –Global Opportunity Fund USD – – 358,603 83,327 3,880,889 32,324,024 –Latin American Equity Fund USD – – – 269,466 – 20,891,654 –US Growth Fund USD – 245 335,667 4,928,807 8,869,324 70,815,373 –Emerging Markets Corporate Debt Fund USD – – – 971,246 – 6,180,475 –Emerging Markets Debt Fund USD – – – 2,045,058 – 13,013,630 –Euro Bond Fund EUR – 109,972 – 2,288,292 635,136 2,337,015 –Euro Corporate Bond Fund EUR – 4,987,563 – 103,780,659 28,805,290 105,990,442 –Euro Strategic Bond Fund EUR – 1,018,069 – 21,183,872 5,879,781 21,634,936 –European Currencies High Yield Bond Fund EUR – 4,890,881 – 101,768,915 28,246,912 103,935,861 –Global Bond Fund USD – 159,744 – 3,323,943 922,591 3,394,719 –Global Convertible Bond Fund USD – – – – 7,531,145 47,800,539 –Global High Yield Bond Fund USD – 354,492 – 7,376,240 2,047,344 9,920,855 –Short Maturity Euro Bond Fund EUR – 851,464 – 17,717,177 4,917,567 18,094,424 –
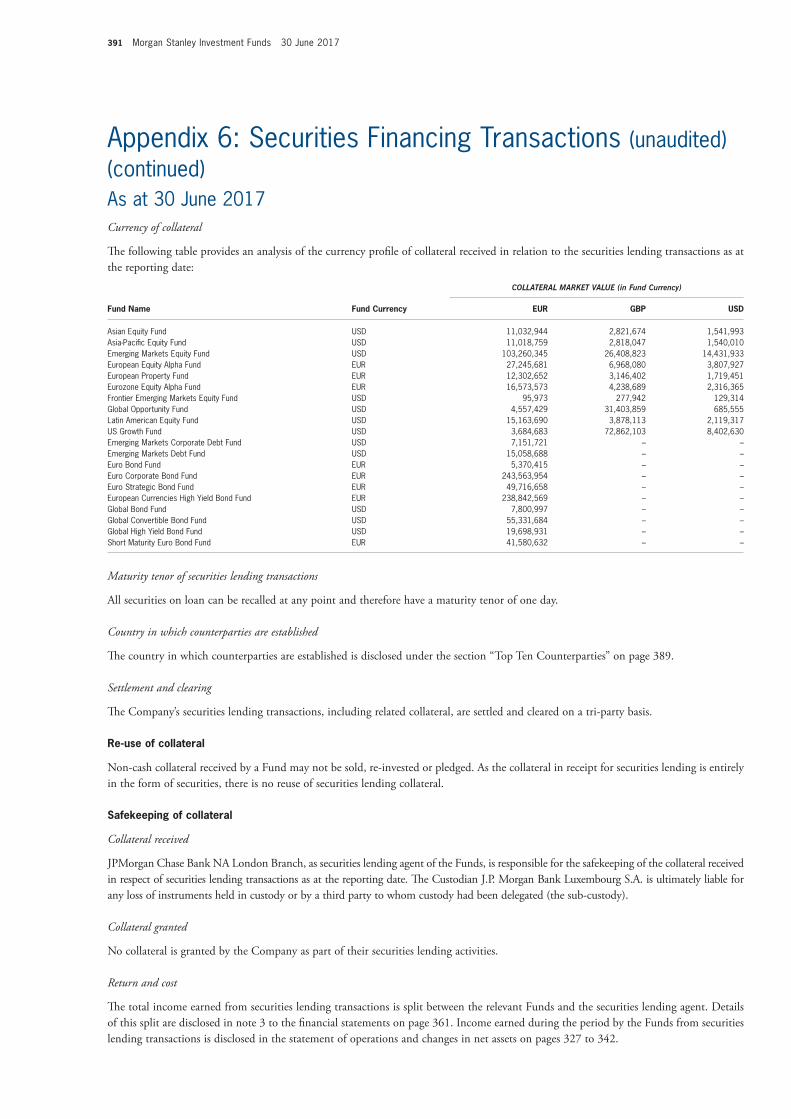
391 Morgan Stanley Investment Funds 30 June 2017
Appendix 6: Securities Financing Transactions (unaudited)(continued)As at 30 June 2017Currency of collateral
Th e following table provides an analysis of the currency profi le of collateral received in relation to the securities lending transactions as at the reporting date:
COLLATERAL MARKET VALUE (in Fund Currency)
Fund Name Fund Currency EUR GBP USD
Asian Equity Fund USD 11,032,944 2,821,674 1,541,993Asia-Pacifi c Equity Fund USD 11,018,759 2,818,047 1,540,010Emerging Markets Equity Fund USD 103,260,345 26,408,823 14,431,933European Equity Alpha Fund EUR 27,245,681 6,968,080 3,807,927European Property Fund EUR 12,302,652 3,146,402 1,719,451Eurozone Equity Alpha Fund EUR 16,573,573 4,238,689 2,316,365Frontier Emerging Markets Equity Fund USD 95,973 277,942 129,314Global Opportunity Fund USD 4,557,429 31,403,859 685,555Latin American Equity Fund USD 15,163,690 3,878,113 2,119,317US Growth Fund USD 3,684,683 72,862,103 8,402,630Emerging Markets Corporate Debt Fund USD 7,151,721 – –Emerging Markets Debt Fund USD 15,058,688 – –Euro Bond Fund EUR 5,370,415 – –Euro Corporate Bond Fund EUR 243,563,954 – –Euro Strategic Bond Fund EUR 49,716,658 – –European Currencies High Yield Bond Fund EUR 238,842,569 – –Global Bond Fund USD 7,800,997 – –Global Convertible Bond Fund USD 55,331,684 – –Global High Yield Bond Fund USD 19,698,931 – –Short Maturity Euro Bond Fund EUR 41,580,632 – –
Maturity tenor of securities lending transactions
All securities on loan can be recalled at any point and therefore have a maturity tenor of one day.
Country in which counterparties are established
Th e country in which counterparties are established is disclosed under the section “Top Ten Counterparties” on page 389.
Settlement and clearing
Th e Company’s securities lending transactions, including related collateral, are settled and cleared on a tri-party basis.
Re-use of collateral
Non-cash collateral received by a Fund may not be sold, re-invested or pledged. As the collateral in receipt for securities lending is entirely in the form of securities, there is no reuse of securities lending collateral.
Safekeeping of collateral
Collateral received
JPMorgan Chase Bank NA London Branch, as securities lending agent of the Funds, is responsible for the safekeeping of the collateral received in respect of securities lending transactions as at the reporting date. Th e Custodian J.P. Morgan Bank Luxembourg S.A. is ultimately liable for any loss of instruments held in custody or by a third party to whom custody had been delegated (the sub-custody).
Collateral granted
No collateral is granted by the Company as part of their securities lending activities.
Return and cost
Th e total income earned from securities lending transactions is split between the relevant Funds and the securities lending agent. Details of this split are disclosed in note 3 to the fi nancial statements on page 361. Income earned during the period by the Funds from securities lending transactions is disclosed in the statement of operations and changes in net assets on pages 327 to 342.
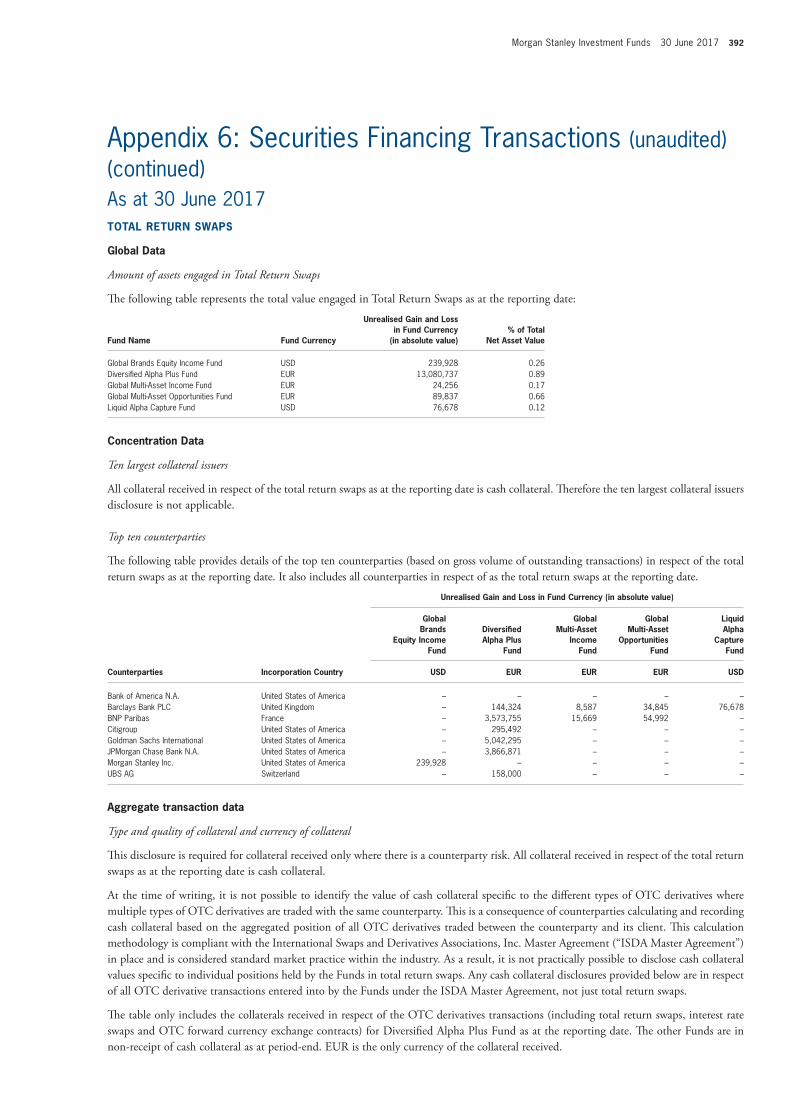
Morgan Stanley Investment Funds 30 June 2017 392
Appendix 6: Securities Financing Transactions (unaudited)(continued)As at 30 June 2017TOTAL RETURN SWAPS
Global Data
Amount of assets engaged in Total Return Swaps
Th e following table represents the total value engaged in Total Return Swaps as at the reporting date:
Fund Name Fund Currency
Unrealised Gain and Loss in Fund Currency
(in absolute value)% of Total
Net Asset Value
Global Brands Equity Income Fund USD 239,928 0.26Diversifi ed Alpha Plus Fund EUR 13,080,737 0.89Global Multi-Asset Income Fund EUR 24,256 0.17Global Multi-Asset Opportunities Fund EUR 89,837 0.66Liquid Alpha Capture Fund USD 76,678 0.12
Concentration Data
Ten largest collateral issuers
All collateral received in respect of the total return swaps as at the reporting date is cash collateral. Th erefore the ten largest collateral issuers disclosure is not applicable.
Top ten counterparties
Th e following table provides details of the top ten counterparties (based on gross volume of outstanding transactions) in respect of the total return swaps as at the reporting date. It also includes all counterparties in respect of as the total return swaps at the reporting date.
Unrealised Gain and Loss in Fund Currency (in absolute value)
Global Brands
Equity Income Fund
Diversifi ed Alpha Plus
Fund
GlobalMulti-Asset
IncomeFund
GlobalMulti-Asset
OpportunitiesFund
Liquid Alpha
Capture Fund
Counterparties Incorporation Country USD EUR EUR EUR USD
Bank of America N.A. United States of America – – – – –Barclays Bank PLC United Kingdom – 144,324 8,587 34,845 76,678BNP Paribas France – 3,573,755 15,669 54,992 –Citigroup United States of America – 295,492 – – –Goldman Sachs International United States of America – 5,042,295 – – –JPMorgan Chase Bank N.A. United States of America – 3,866,871 – – –Morgan Stanley Inc. United States of America 239,928 – – – –UBS AG Switzerland – 158,000 – – –
Aggregate transaction data
Type and quality of collateral and currency of collateral
Th is disclosure is required for collateral received only where there is a counterparty risk. All collateral received in respect of the total return swaps as at the reporting date is cash collateral.
At the time of writing, it is not possible to identify the value of cash collateral specifi c to the diff erent types of OTC derivatives where multiple types of OTC derivatives are traded with the same counterparty. Th is is a consequence of counterparties calculating and recording cash collateral based on the aggregated position of all OTC derivatives traded between the counterparty and its client. Th is calculation methodology is compliant with the International Swaps and Derivatives Associations, Inc. Master Agreement (“ISDA Master Agreement”) in place and is considered standard market practice within the industry. As a result, it is not practically possible to disclose cash collateral values specifi c to individual positions held by the Funds in total return swaps. Any cash collateral disclosures provided below are in respect of all OTC derivative transactions entered into by the Funds under the ISDA Master Agreement, not just total return swaps.
Th e table only includes the collaterals received in respect of the OTC derivatives transactions (including total return swaps, interest rate swaps and OTC forward currency exchange contracts) for Diversifi ed Alpha Plus Fund as at the reporting date. Th e other Funds are in non-receipt of cash collateral as at period-end. EUR is the only currency of the collateral received.
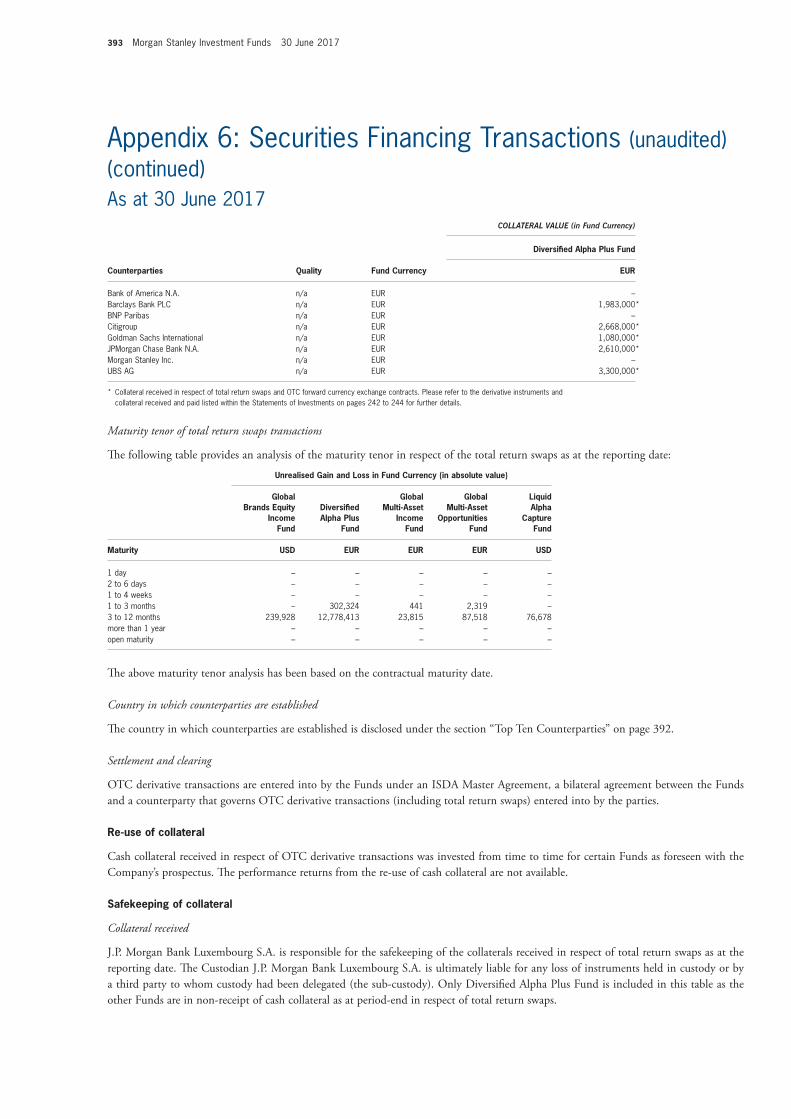
393 Morgan Stanley Investment Funds 30 June 2017
Appendix 6: Securities Financing Transactions (unaudited)(continued)As at 30 June 2017
COLLATERAL VALUE (in Fund Currency)
Diversifi ed Alpha Plus Fund
Counterparties Quality Fund Currency EUR
Bank of America N.A. n/a EUR –Barclays Bank PLC n/a EUR 1,983,000*BNP Paribas n/a EUR –Citigroup n/a EUR 2,668,000*Goldman Sachs International n/a EUR 1,080,000*JPMorgan Chase Bank N.A. n/a EUR 2,610,000*Morgan Stanley Inc. n/a EUR –UBS AG n/a EUR 3,300,000*
* Collateral received in respect of total return swaps and OTC forward currency exchange contracts. Please refer to the derivative instruments andcollateral received and paid listed within the Statements of Investments on pages 242 to 244 for further details.
Maturity tenor of total return swaps transactions
Th e following table provides an analysis of the maturity tenor in respect of the total return swaps as at the reporting date:
Unrealised Gain and Loss in Fund Currency (in absolute value)
Global Brands Equity
Income Fund
Diversifi ed Alpha Plus
Fund
Global Multi-Asset
Income Fund
Global Multi-Asset
Opportunities Fund
Liquid Alpha
Capture Fund
Maturity USD EUR EUR EUR USD
1 day – – – – –2 to 6 days – – – – –1 to 4 weeks – – – – –1 to 3 months – 302,324 441 2,319 –3 to 12 months 239,928 12,778,413 23,815 87,518 76,678more than 1 year – – – – –open maturity – – – – –
Th e above maturity tenor analysis has been based on the contractual maturity date.
Country in which counterparties are established
Th e country in which counterparties are established is disclosed under the section “Top Ten Counterparties” on page 392.
Settlement and clearing
OTC derivative transactions are entered into by the Funds under an ISDA Master Agreement, a bilateral agreement between the Funds and a counterparty that governs OTC derivative transactions (including total return swaps) entered into by the parties.
Re-use of collateral
Cash collateral received in respect of OTC derivative transactions was invested from time to time for certain Funds as foreseen with the Company’s prospectus. Th e performance returns from the re-use of cash collateral are not available.
Safekeeping of collateral
Collateral received
J.P. Morgan Bank Luxembourg S.A. is responsible for the safekeeping of the collaterals received in respect of total return swaps as at the reporting date. Th e Custodian J.P. Morgan Bank Luxembourg S.A. is ultimately liable for any loss of instruments held in custody or by a third party to whom custody had been delegated (the sub-custody). Only Diversifi ed Alpha Plus Fund is included in this table as the other Funds are in non-receipt of cash collateral as at period-end in respect of total return swaps.
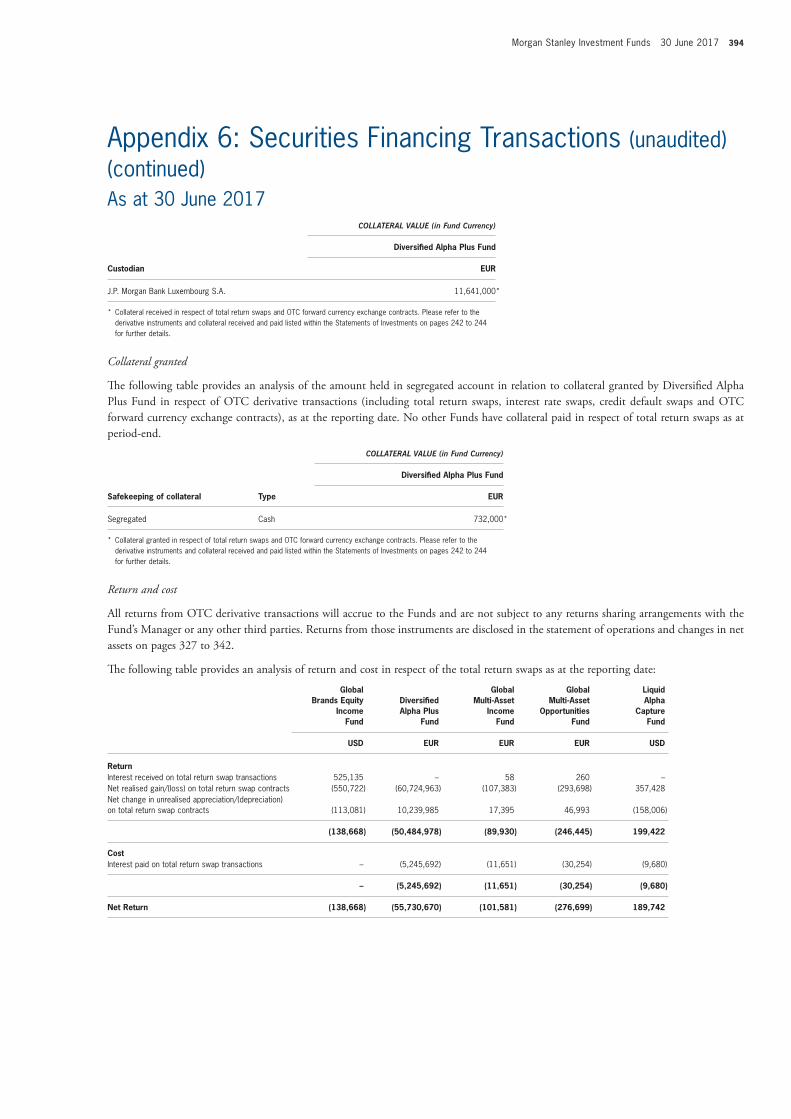
Morgan Stanley Investment Funds 30 June 2017 394
Appendix 6: Securities Financing Transactions (unaudited)(continued)As at 30 June 2017
COLLATERAL VALUE (in Fund Currency)
Diversifi ed Alpha Plus Fund
Custodian EUR
J.P. Morgan Bank Luxembourg S.A. 11,641,000*
* Collateral received in respect of total return swaps and OTC forward currency exchange contracts. Please refer to the derivative instruments and collateral received and paid listed within the Statements of Investments on pages 242 to 244 for further details.
Collateral granted
Th e following table provides an analysis of the amount held in segregated account in relation to collateral granted by Diversifi ed Alpha Plus Fund in respect of OTC derivative transactions (including total return swaps, interest rate swaps, credit default swaps and OTC forward currency exchange contracts), as at the reporting date. No other Funds have collateral paid in respect of total return swaps as at period-end.
COLLATERAL VALUE (in Fund Currency)
Diversifi ed Alpha Plus Fund
Safekeeping of collateral Type EUR
Segregated Cash 732,000*
* Collateral granted in respect of total return swaps and OTC forward currency exchange contracts. Please refer to the derivative instruments and collateral received and paid listed within the Statements of Investments on pages 242 to 244 for further details.
Return and cost
All returns from OTC derivative transactions will accrue to the Funds and are not subject to any returns sharing arrangements with the Fund’s Manager or any other third parties. Returns from those instruments are disclosed in the statement of operations and changes in net assets on pages 327 to 342.
Th e following table provides an analysis of return and cost in respect of the total return swaps as at the reporting date:
GlobalBrands Equity
IncomeFund
Diversifi edAlpha Plus
Fund
GlobalMulti-Asset
IncomeFund
GlobalMulti-Asset
OpportunitiesFund
LiquidAlpha
CaptureFund
USD EUR EUR EUR USD
ReturnInterest received on total return swap transactions 525,135 – 58 260 –Net realised gain/(loss) on total return swap contracts (550,722) (60,724,963) (107,383) (293,698) 357,428Net change in unrealised appreciation/(depreciation) on total return swap contracts (113,081) 10,239,985 17,395 46,993 (158,006)
(138,668) (50,484,978) (89,930) (246,445) 199,422
CostInterest paid on total return swap transactions – (5,245,692) (11,651) (30,254) (9,680)
– (5,245,692) (11,651) (30,254) (9,680)
Net Return (138,668) (55,730,670) (101,581) (276,699) 189,742


www.morganstanleyinvestmentfunds.com CN S
AR S
ICAV
17