social work and social care statistics for scotland: …...social work and social care statistics...
TRANSCRIPT

Social Work and Social Care
Statistics for Scotland:
A Summary
January 2016
This paper has been produced by the Office of the Chief
Social Work Adviser, Scottish Government. It aims to
provide an overview of statistics available in a range of
publications which cover the different areas of social care.
It summarises selected trends and statistics from a range
of sources which were publicly available at December 31st
2015. As a result of the time-lag in publication of data the
statistics in this paper predominantly relate to the financial
year 2013-14. Where publicly available, more recent
statistics are included.
Annual updates to this paper are planned. Suggestions for
improvements, including additional data sources, are welcome and
should be sent to [email protected]

CONTENTS
1. Introduction 1 2. An overview 1 3. The social services workforce 5 4. Children involved with social services 6
4a. Looked after children, secure care and child protection 6
4b. Children looked after in short term placements 8 5. Adults involved with social services 11
5a. Social care services 11 5b. Housing support 19 5c. Residential care 20 5d. Free personal and nursing care 22 5e. Carers / Respite care 24 6. Learning disability services 26 7. Social services and mental health 27 8. Criminal justice social work 29 9. Information sources 32

1
1. Introduction
This paper aims to provide an overview of current published statistics from across the different areas of social care. It is written for policy makers, those working in the social care sector, academics and other interested parties. This paper provides an overview of existing data and includes summaries and selected trends for regularly collected data that is already in the public domain. It is important to emphasise that the paper does not provide detail on the policy context, an overview of current policy objectives or performance against these objectives. Detail on the policy context is available from the Scottish Government website: http://www.gov.scot/ More extensive data sets and analyses can be found elsewhere, including in the publications referenced. The latest data published up to the end of 2015 is included here. Publications are released regularly and should be checked if more recent information is required. Information in this publication focuses on social care services and includes:
Social care services for children and adults which are purchased or provided by Local Authorities and delivered by a range of public, voluntary and private providers.
Criminal justice social work, which is purchased or provided by local authorities.
Community mental health services, which are the responsibility of the National Health Service, but also involve local authority-funded social care resources including specialist staff.
The terms social care and social care services are used interchangeably throughout the document.
2. An overview
Local Authorities provide or purchase almost all social care services in Scotland. The funding for social care comes from the General Revenue Funding of Local Authorities, (the money they receive from government, local taxation, etc) and from transfers from NHS Health Boards, service user charges and other sources. The total cost of social care in Scotland is best given by the Gross Expenditure by Local Authorities, as this gives the amount spent on services, irrespective of the source of funds. Figure 1 shows the breakdown of Gross Expenditure on social care services by age group of service users.
Children & Families
22%
Older People
(aged 65+) 44%
Adults (aged 18-64) 30%
Other 4%
Figure 1.
£3.92 billion was spent on social
care services in 2013/14
2
Figure 3. Local
Authority gross
expenditure on
children’s services –
figures do not include
expenditure on
children’s panels.
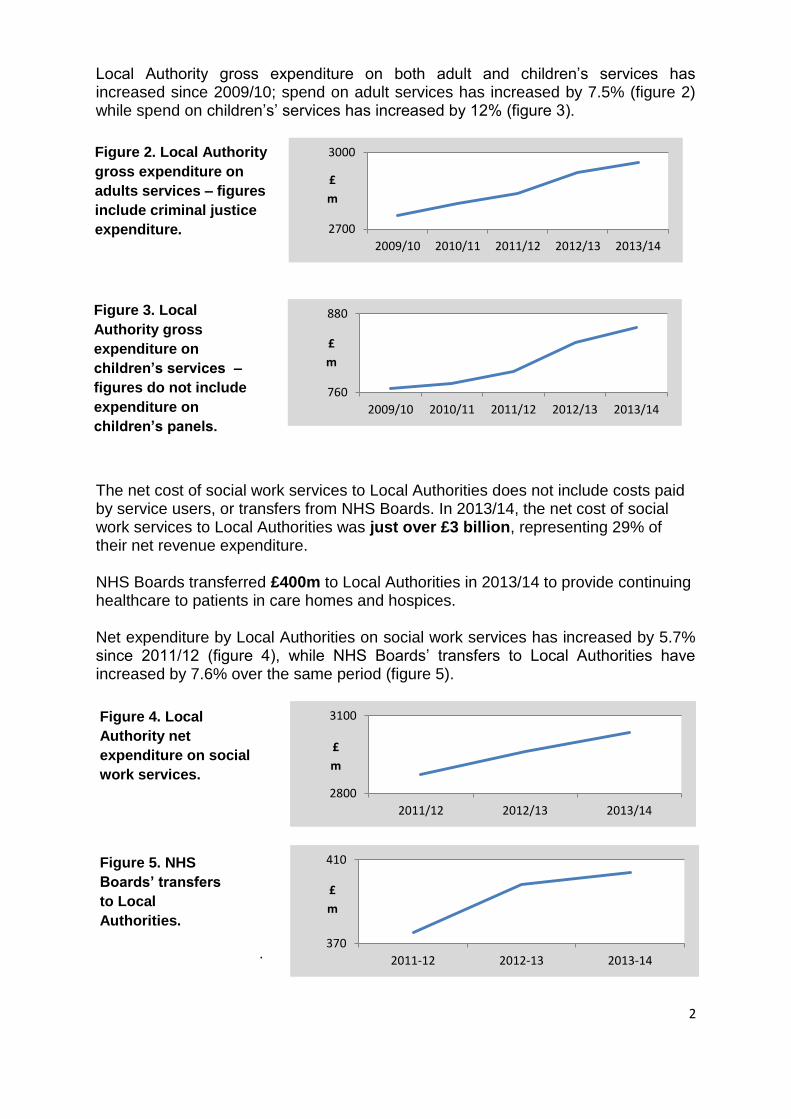
Local Authority gross expenditure on both adult and children’s services has increased since 2009/10; spend on adult services has increased by 7.5% (figure 2) while spend on children’s’ services has increased by 12% (figure 3).
The net cost of social work services to Local Authorities does not include costs paid by service users, or transfers from NHS Boards. In 2013/14, the net cost of social work services to Local Authorities was just over £3 billion, representing 29% of their net revenue expenditure. NHS Boards transferred £400m to Local Authorities in 2013/14 to provide continuing healthcare to patients in care homes and hospices. Net expenditure by Local Authorities on social work services has increased by 5.7% since 2011/12 (figure 4), while NHS Boards’ transfers to Local Authorities have increased by 7.6% over the same period (figure 5).
2700
3000
2009/10 2010/11 2011/12 2012/13 2013/14
£
m
760
880
2009/10 2010/11 2011/12 2012/13 2013/14
£
m
2800
3100
2011/12 2012/13 2013/14
£
m
370
410
2011-12 2012-13 2013-14
£
m
Figure 4. Local
Authority net
expenditure on social
work services.
Figure 5. NHS
Boards’ transfers
to Local
Authorities.
.
Figure 2. Local Authority
gross expenditure on
adults services – figures
include criminal justice
expenditure.
3
Figure 6. Social Care and Social Work Services in Scotland – an overview
Local Authorities1
Social work services £3.0 billion
Housing support services £0.15bn
Criminal Justice Social Work £0.1bn2
NHS Boards
£0.40 billion transferred to councils
+
Community psychiatry services £0.31bn
Scottish Government
Commissioning
bodies
4,300 residents of care home
beds for people with mental
health needs
2,200 people on
compulsory
treatment orders
61,500 people receive home
care totalling
706,000 hours
37,000 adults in care homes
78,000 people receive Free
Personal Care
6,500 people receive Direct
Payments
203,000 weeks of respite care
31,400 criminal justice social
work reports issued
20,400 social work orders
commenced
6,000 people receive
statutory throughcare
2,250 cases commenced
diversions from prosecution
16,000 looked after
children
5,500 children
being fostered
20,200 children referred to
the children’s reporter
Exam
ple
s o
f se
rvic
es
Council services
5,900 social workers
657 (603 WTE) mental health officers
5,800 staff in children’s fieldwork services
Around 11% of care home places
Around 40% of home care hours
Private and Voluntary Sector Services
87% of workforce in care homes for adults
75% of workforce providing housing
support/care at home
Around 89% of care home places
Around 60% of home care hours
Serv
ice
Pro
vid
ers
NHS Services
2,570 community psychiatric nurses

4
Figure 6: An overview of social care and social work services in Scotland. The figures shown here for Local Authority spend on social work services and housing support services are Net Revenue Expenditure. The main reported costs of services to commissioning bodies are provided, but are likely to represent an underestimate, for example it is difficult to quantify how much Local Authorities spend on mental health services. In addition the payments from local authority education services to fund residential school places for children are not included and users of some services contribute to their own care, including many adults in residential care homes. The costs of regulation by the Scottish Social Services Council and the Care Inspectorate are also not shown in this figure. The data shown for service providers and services are examples, not a comprehensive listing and show numbers of users, staff or activity at a particular point in time, or over the most recent year (e.g. NHS Services will include other disciplines besides psychiatric nurses). Further detail can be found elsewhere in the publication. Figures are for 2013/14, 2014/15 or at fixed points in 2014 or 2015, but actual dates/periods vary for different figures.
1 In Highland Region, adult social care services are commissioned by Highland Health Board,
rather than Highland Council. 2The Scottish Government provides Local Authorities with ring-fenced funding of £95m for
criminal justice social work via eight Community Justice Authorities under section 27A and 27B of the Social Work (Scotland) Act 1968.
Figure 7 shows the Local Authority net revenue expenditure on the major groups of services users for Local Authority services in 2013/14. Approximately two fifths of Local Authority net revenue expenditure on social care services goes on services to older people, while just under a third funds services for children and families. The proportions differ from those shown in Figure 1 for gross expenditure due to income received, for example, service users contribute to the costs of adult social care services. Figure 7. Local Authority net revenue expenditure on social care service users and services, 2013/14.
£1,324mm
older people
adults with physical/sensory disabilities £194m
adults with mental health needs £93m
£33m
service strategy
£46m
adults with other needs
adults with learning disabilities
£502m
children and families
£837m
children’s panel
£1m
housing support services
£149m
£7m
criminal justice
social work
£95m NB Scottish Government provides ‘ring-fenced’ funding to Local Authorities for criminal justice social work via Community Justice Authorities.

5
Data sources i. Expenditure of Adult Social Care Services, Scotland 2003-04 to 2013-14.
http://www.gov.scot/Topics/Statistics/Browse/Health/Data/Expenditure ii. Scottish Local Government Financial Statistics 2013-14, Scottish Government
2015. http://www.gov.scot/Publications/2015/02/3131 iii. Scottish Local Government Financial Statistics 2012-13, Scottish Government
2014. http://www.gov.scot/Publications/2014/02/4500 iv. Scottish Local Government Financial Statistics 2011-12, Scottish Government
2013. http://www.gov.scot/Publications/2013/02/4659 v. Scottish Local Government Financial Statistics 2010-11, Scottish Government
2012. http://www.gov.scot/Publications/2012/02/2421 vi. Scottish Local Government Financial Statistics 2009-10, Scottish Government
2011. http://www.gov.scot/Publications/2011/02/21143624/0 vii. Other references throughout document
3. The social services workforce
The social services workforce is regulated by the Scottish Social Services Council (SSSC). Social service workers are employed in a range of settings, such as care homes for adults and children, in criminal justice social work, in social work with children and families and in mental health services. The workforce also includes people working in early years settings, such as nurseries or out of school care clubs1,2. SSSC are responsible for collecting and publishing official statistics on the workforce. SSSC publications also use data collected by the Care Inspectorate, which is the official body responsible for regulating and inspecting care services in Scotland. In December 2014:
199,670 people worked in the social services sector1,3. 7.7% of employment in Scotland was in this sector. 84% of the workforce are female. 80% of the workforce are employed on permanent contracts. 10% (approx.) of the workforce are estimated to be on zero hours contracts. 41% of the workforce are employed in the private sector. 31% of the workforce are employed in the public sector. 27% of the workforce are employed in the voluntary sector. 33% (65,990) of the workforce worked in housing support/care at home.
1 The headcount for people working in childminding and day care of children was 37,980 in 2014. This
figure is included in the total number of people given here. Other data on these services are not included in this publication. 2 The number of active childminding and day care for children services registered with the Care
Inspectorate at 31 Dec 2014 was 9342, this number is included in the total number of services. Other data on these services are not included in this publication. 3 Personal assistants and centrally based office staff in private and voluntary organisations are not
included in the total numbers. People working in non-registered, community-based care services (e.g. lunch clubs) are also not included in the numbers.
6
27% (54,520) of the workforce worked in care homes for adults. 10,965 individuals were registered as social workers with SSSC. 54% (5921) of these worked in local authority fieldwork services performing statutory duties. 13,559 services were active and registered with the Care Inspectorate at 31 Dec 20142. 14% of these were delivering housing support/care at home services. 9% were providing care homes for adults.
TRENDS
The headcount of staff in the social services sector increased by 5.3% (10,000) between 2013 and 2014, reversing the downward trend seen in recent years. Note that it is not known whether this rise is reflected in WTE figures.
Most of the increase in headcount is seen in the housing support/care at home sub-sector (3,820), with the largest relative increase (96%) seen in nurse agencies.
The proportion of the workforce employed in the private sector has remained the same for the last two years following an upward trend in previous years.
Data source viii. Scottish Social Service Sector: Report on 2014 Workforce Data. SSSC, 2015.
http://data.sssc.uk.com/data-publications/22-workforce-data-report/99-scottish-social-service-sector-report-on-2014-workforce-data
4. Children involved with social services
4a. Looked after children, secure care and child protection Local Authorities have a responsibility to provide support to certain vulnerable young people, known as 'looked after children'. A young person may become looked after for a number of reasons, including neglect, abuse, complex disabilities which require specialist care, or involvement in the youth justice system. When a child is believed to be at risk of harm, their name will be added to the child protection register.
1.7%4 (17,634) of children aged 0-17 in Scotland were looked after by Local Authorities or on the child protection register at 31 July 2014. 5,910 staff (headcount) worked in children’s fieldwork services in 2014, all of these were employed in the public sector5.
2 See footnote 2 on previous page.
4 Assuming mid 2014 population for Scotland aged 0-17 is 1,033,183 – National Records of Scotland
2015. 5 These staff will also work with children who are not looked after or on the child protection register.

7
There are a number of routes by which a child may come to be looked after, in secure care or on the child protection register. Children may be referred to the Children’s Reporter, be the subject of an investigation without being referred to the Reporter, become voluntarily looked after or come in through the criminal justice system (see figure 8).
2.0% (20,240) of children aged 0-17 in Scotland were referred to the Scottish Children’s Reporter in 2013/14. 17,476 were referred on non-offence grounds (for care and protection). 2,764 were referred on offence grounds (some referrals may be for both).
Figure 8. Routes through which children may become looked after, in secure care or on the child protection register.
Figure 9. Numbers of children
looked after and on the child
protection register in July
2014
Looked after total
= 15,580
.
Child protection
total
= 2,882
Both
= 828 81 young people
were in secure care
accommodation
Referral to Children’s Reporter
Investigation
Children’s Hearing
N o registration
Child Protection
Register
Discharge case
Compulsory Supervision
Order
CSO with Secure Accommodation
authorisation
Looked after
accommodated
Looked after
at home
Secure Care
Offence committed
Young person
prosecuted
Early Effective Intervention or diversion from
prosecution
Remand/ a lternatives to remand
Sentence Custodial
Community alternatives to custody
Scottish Prison Service
Aftercare
services

8
Looked after children may be accommodated in a community placement, for example, at home with parents, with family/friends or with foster carers/prospective adopters. Alternatively they may be in a residential placement, a residential school or secure care accommodation. In 2014:
41% of children starting to be looked after were aged under five. 29% of children starting to be looked after were aged twelve or over. 14,110 children were looked after in the community. Of these, 4,144 were looked after at home with parents, 4,181 were with friends/relatives and 5533 were with Foster Carers. 1,470 children were looked after in residential accommodation, with 580 of these in local authority care homes and 393 in residential schools. 7,360 staff (headcount) worked in residential child care. 293 active residential child care services were registered with the Care Inspectorate at 31 December 2014.
Fostering and Adoption. Fostering and/or adoption may be used to provide a family life for children being looked after away from home. Adoption services and fostering agencies are regulated by the Care Inspectorate. In 2014:
5,533 children were being looked after by foster carers. 201 children were being looked after by prospective adopters. 440 staff (headcount) worked in adoption services. 61 active fostering services and 39 active adoption services were registered with the Care Inspectorate at December 2014.
Aftercare services. Local Authorities have a duty to provide advice, guidance and assistance for young people who have reached school leaving age at the time they leave care. At the end of July 2014:
3,767 young people were reported to be eligible for aftercare services. 70% of eligible children were receiving aftercare services.
Secure care refers to residential accommodation services for children and young people who pose a significant risk to themselves or others and are likely to run away. Children and young people are usually placed in secure care on welfare grounds by the Children’s Hearing System. Children can also be placed on offence grounds by the Hearings System or the Criminal Justice System.
74 residents (on average) were in secure accommodation throughout 2013/14. 90 secure places were available in five secure units excluding emergency beds on 31 July 2014.
4b. Children looked after in short term placements.
If a child is subject to a planned series of short-term placements, where they stay away from home for more than 24 hours continuously, they are categorised as being looked after by the local authority for that period. These children are not included in the main looked after children statistics and statistics on short-term placements have not been collected since 2012/13. The following statistics are for 31 July 2013, the last date for which data is held.

9
1,914 children were being looked after on a planned series of short term placements. 61% of these children were in residential establishments. 25% were in foster placements.
TRENDS
Referrals to the Children’s Reporter
The numbers of children and young people referred to the Reporter has decreased by close to 60% between 2004 and 2014. This is the result of falls in both offence and non-offence referrals.
Looked after Children
The total number of looked after children has fallen for the second year in a row, following a peak in 2012. This reflects a decrease in the numbers of children starting to be looked after, which has also fallen for two years in a row.
The numbers of children being looked after by foster carers/prospective adopters has increased steadily over more than a decade.
The number of children looked after for more than three years has doubled since 2004, though numbers remained similar between 2013 and 2014.
Children are being looked after from a younger age; the percentage starting to be looked after before age 5 increased from 28% in 2004 to 41% in 2014.
The number of staff working in residential child care increased by 8% (550) in 2014, to a four year high.
Child Protection
The number of children on the child protection register has fluctuated, but overall has increased by 41% between 2000 and 2014, with a 9% rise between 2012/13 and 2013/14.
There is a continuing decrease in the length of time children tend to spend on the child protection register.
Children continue to be placed in the child protection register at younger ages.
Secure Care
The average number of young people in secure care has been decreasing since 2010. The average number of residents in secure care in 2013/14 decreased by 4% from 77 residents in 2012/13.
Emergency bed usage for 2013/14 was the lowest recorded.
More than nine in ten young people in secure care were reported as having at least one additional support need, most commonly categorised as non-medically diagnosed social, emotional and behavioural difficulties’.

10
Figure 10. Children looked after or on the child protection register, 2000-2014
Figure 11. Children referred to the Childrens Reporter and numbers looked after/on child protection register, 2004-2014
Note for Fig 11: There is double counting of numbers who were both looked after and on the child
protection register in the line graph to enable the long term trend to be shown (separate figures were
unavailable until recently).
Data sources ix. Children’s Social Work Statistics Scotland, 2013-14, Scottish Government
(2015). http://www.gov.scot/Topics/Statistics/Browse/Children/PubChildrenSocialWork
x. Scottish Social Service Sector: Report on 2014 Workforce Data. SSSC, 2015. http://data.sssc.uk.com/data-publications/22-workforce-data-report/99-scottish-social-service-sector-report-on-2014-workforce-data
xi. Mid-2014 Population Estimates Scotland, National Records of Scotland, 2015. http://www.gro-scotland.gov.uk/statistics-and-data/statistics/statistics-by-theme/population/population-estimates/mid-year-population-estimates/mid-2014
0
2,000
4,000
6,000
8,000
10,000
12,000
14,000
16,000
2000 2002 2004 2006 2008 2010 2012 2014
Nu
mb
er o
f ch
ildre
n Looked after - community
Looked after - residential
On child protection register
0
10,000
20,000
30,000
40,000
50,000
60,000
70,000
2004 2005 2006 2007 2008 2009 2010 2011 2012 2013 2014
Offence referrals
Care and protection referrals
Looked after/child protection

11
5. Adults involved with social work services
Local Authorities have a duty to provide social care for those who need it. Over the time period covered in this publication services were provided by Local Authorities, contracted to voluntary or private organisations or a budget was provided to people to arrange their care directly (self-directed support). Due to different dates of publication of statistics, the data in this section covers 2013-2015 and specific dates are provided for most statistics. Much of the information on social care (sections 5a, 5b) is derived from the 2015 Social Care Survey. These data are collected by the Local Authorities either for the census week at the end of March, or during the financial year 1 April 2014-31 March 2015. Further information on data collection is available in the referenced publications.
205,430 people in Scotland were provided with social care services in 2014-2015. 36,751 people in Scotland were living in residential care homes in 2014.
5a. Social care services Social care services give people the support, practical help and personal care that they need to live as independently as possible in the community. Services provided by Local Authorities include home care, community alarm and telecare services, meals services, housing support services and direct payments.
75%% of social care clients were aged 65 years or more in 2015. 67% of clients aged 65 or more were female in 2015. 51% of social care clients aged 18-64 were male in 2015. Less than 2% of social care clients were aged 0-17 years in 2015. 59% of these were male. 64,900 clients were receiving social care primarily because they were ‘frail older people’. 60,800 clients were receiving social care primarily because of physical disability. Many people recorded in this group have physical disability linked to frailty due to old age. 65,990 staff (headcount) worked in care at home/housing support services in 2014. 8,370 staff (headcount) worked in adult day care in 2014. 5,070 staff (head count) worked in fieldwork services for adults in 2014. 85% of respondents to the Scottish Health and Care Experience survey in 2013/14 rated their help, care or support services as either excellent or good. 55% of respondents to the Scottish Household Survey were satisfied with social care or social work services in 2013/14.

12
Figure 12. Numbers of people receiving different social care services in 2014-15
* Clients can receive multiple social care services
** Data on Social Worker/ Support Workers and Self-Directed Support is in development.
*** Four Local Authorities did not submit meals data for 2015.
Community Alarm/Telecare, Direct Payments, SDS and Social Worker/Support Worker information
are for the financial year. Home Care, Housing Support and Meals data is for the March census week.
Figure 13. Age and gender of social care clients in 2015

13
Figure 14. Numbers and age groups of clients receiving social care services, by client group
Note: “Other” includes addictions, palliative care and carers
Note: “Dementia” is known to be under recorded in the data
In the three largest groups of clients, most service users are aged 65 and over. In the mental health and learning/learning and physical disability groups, most services users are under 65. Figure 15. Percentage of adults satisfied with social care or social work services (Scottish Household Survey)
Results from the Scottish Household Survey described in the local government benchmarking report, indicate that levels of satisfaction with social care or social work services vary from 41-85% across different Local Authorities in Scotland. The highest levels of satisfaction are seen in island councils. There is no systematic pattern between satisfaction rate, size of council, sparsity or deprivation. Data from the Health and Social Care Experience survey in 2013/14 show higher levels of satisfaction from people who have received care services (table 1). 84% of respondents rated the overall help, care or support services as either excellent or good.
62 57 55
0
20
40
60
80
2010/11 2012/13 2013/14
% Satisfied

14
TRENDS
Workforce headcount in housing support/home care increased by 6% (3,820) in 2014, reversing the decline seen since 2011.
Workforce headcount in care homes for adults increased by 4% (2,090) to a four year high in 2014, following a fall in headcount of 1,790 in 2013.
Workforce headcount in nurse agencies increased by 96% (1,330) in 2014, reversing the decline seen since 2011.
The average satisfaction rate with social care or social work services has fallen since 2010/11.
Home care is care provided in the home to enable a person to maintain independence. It involves regular visits from a home care worker and may include personal care, shopping, laundry, cleaning, etc. In 2015:
61,500 people in Scotland were receiving home care in March 2015. 706,000 hours of home care support were provided in 20156. 60% of home care clients were living alone. 82% of home care clients were aged 65 or over. 18% of home care clients were aged 18-64. 48% of clients received their home care services solely from Local Authorities.
6 Annual home care hours are calculated based on a census week containing 31 March 2015. The
figures given here exclude 24/7 care, which has not been included in the Home Care definition since 2013.
Table 1

15
33% of home care hours were provided by Local Authorities. This differs from the proportion of clients shown above as the other (private and voluntary) sectors, on average, provide larger packages of care.
£20.25 per hour was the average spend per hour on home care services across Scotland for 2013/14. This figure is reported by Local Authorities. The range of spending went from £11.48 per hour to £36.88 per hour, with rural councils having higher hourly costs that urban councils.
Figure 16. Home care clients aged 65 and over by client group and age group
Notes for figure 16: “Dementia” is known to be under recorded in the data. From 2013 24/7 care has
been classed by Local Authorities as Housing Support, not Home Care. ‘Other’ includes addictions,
palliative care and carers.
TRENDS
The number of home care clients in 2015 was similar to that for the last two years, following decreases from 2005-2013.
The number of Home Care hours provided (excluding 24/7 care) has increased every year since 2011.
The proportion of Home Care hours being provided solely by Local Authorities has decreased every year since 2007.
The rate per population of clients aged 65+ receiving home care has remained around 52-53 per 1,000 since 2013, following a steady decrease since 2006 (see figure 17, below)
The number of people aged 65+ receiving home care has remained relatively stable over the years 2013-15, following slight decreases over the previous two years.
Gross expenditure on home care increased by 3.3% between 2010/11 and 2013/14, but this has not been a consistent trend.
Unit costs of home care for people over 65 have fallen in real terms by 4.6% between 2010/11 and 2013/14, while over this period the hours delivered increased by 8.3%.
3230 490 3240 650
670
80 420
260 9030
9710 1770 5700 1040
650
40 170
470 19550
12300 1660 5560 1060
520
10 30
450 21580
0%
20%
40%
60%
80%
100%
Frail olderpeople
Dementia PhysicalDisability
Other MentalHealth
Learningand
PhysicalDisability
LearningDisability
Not known All
85+
75-84
65-74

16
Figure 17. Rates per population of clients aged 65 and over receiving Home Care, 2006-2015
Community Alarms and Telecare help people live more independently and feel safer in their own homes thus reducing the need for residential care.
122,730 clients received community alarm and/or other telecare services in 2014-15. 86% (106,030) of these clients were aged 65 and over. 77% of these only had a Community Alarm.
TRENDS
The numbers of people receiving both community alarms and telecare increased each year between 2011 and 2014. The numbers for 2015 also show an increase. However data has been collected differently for 2015, meaning a direct comparison with previous years is not possible.
Direct payments are one way that people can take control of their individual budget for health and social care or social care support. They are cash payments made to individuals so they can purchase support. The introduction of Self-directed Support (SDS) means that everyone eligible for social care and support has the right to choice, control and flexibility to meet their personal outcomes.
6,450 people in Scotland received Direct Payments (SDS option 1) in 2014/15. £86.1m was spent on Direct Payment provision during financial year 2014/15. 38% of Direct Payment clients were aged 65 or over. 51% of Direct Payment clients were aged 18-64.
0
20
40
60
80
2006 2007 2008 2009 2010 2011 2012 2013 2014 2015
Rat
es p
er 1
,00
0
po
pu
lati
on

17
Figure 18. Direct payments by client group, 2014/15, clients aged 65+
Figure 19. Direct payments by client group, 2014/15, clients aged 18-65
Note for Figures 18 and 19. Some clients receive more than one direct payment. Dementia is known to be under recorded by Local Authorities. ‘Learning disability’ includes clients with both a learning disability and physical disability.
£0.0
£2.0
£4.0
£6.0
£8.0
£10.0
£12.0
0
200
400
600
800
1,000
1,200
Frail olderpeople
Physicaldisability
Dementia MentalHealth
Learningdisability
Other Notknown
Exp
en
dit
ure
£m
No
. of
clie
nts
Number ofclients*
Expenditure(£ millions)
£0.0
£5.0
£10.0
£15.0
£20.0
£25.0
0
200
400
600
800
1,000
1,200
1,400
Exp
en
dit
ure
£m
No
. of
clie
nts
Number ofclients*
Expenditure(£ millions)

18
£22.8m was spent on direct payments to clients aged 65 and over in 2014/15. Just under half this expenditure went to clients with frailty due to old age; a further fifth went to people with physical disability. £59.1m was spent on Direct Payments to clients aged 18-65 in 2014/15. Approximately 35% of this expenditure went to clients with physical disability; a further 33% went to people with learning disability (this group includes those with both learning and physical disability). There are no robust data on the numbers of people directly employed by individuals receiving direct payments, though a 2010 study suggested an average of 2.4 personal assistants per employer.
TRENDS
The number of people receiving Direct Payment has increased steadily since 2001.
The number of people aged 65 and over receiving Direct Payments has increased from just under 500 in 2005-06, to around 2,400 in 2014/15.
The number of people aged 18-64 receiving Direct Payments has increased from around 2000 in 2009-10, to around 3,300 in 2014/15.
The total value of Direct Payments has increased steadily from 2001.
Figure 20. Number of people receiving Direct Payments (and value of payments) 2005-06 to 2014/15
Note for Figure 20. Clients can receive more than one direct payment in the year. Figures for Direct Payments for 2014/15 have been adjusted to account for missing data from East Renfrewshire council.
£0.0
£10.0
£20.0
£30.0
£40.0
£50.0
£60.0
£70.0
£80.0
£90.0
£100.0
0
1,000
2,000
3,000
4,000
5,000
6,000
7,000
2005-06 2006-07 2007-08 2008-09 2009-10 2010-11 2011-12 2012-13 2013-14 2014-15
Val
ue
of
pay
me
nts
(£
mill
ion
s)
Nu
mb
er
of
Clie
nts
Number of clients
Value of payments (£millions)

19
Meals services include hot and frozen prepared meals delivered to clients at home and may be provided on a short or long-term basis. Data on meals services is difficult to capture and the available figures are likely to be underestimates.
7,640 clients were receiving Meals services at the 2015 census. 92% (approximately) of these clients were aged 65 or over. 46% (approximately) of these clients were aged 85 or over.
5b. Housing support Housing support services help people live more independently in the community. They can be provided in an individual’s own home, or in temporary accommodation such as hostels for homeless people. They include services such as assistance with budgeting, claiming welfare benefits, help with shopping and housework and keeping safe and secure. Housing support has included Live-In and 24/7 home care since 2013. Some issues have been reported by Local Authorities with the quality of data on housing support, however these data have been published for the first time in 2015.
18,030 people were recorded as receiving Housing Support in 2015 57% of housing support clients are aged 65 or more. Around 80% of Housing Support clients are recorded as also receiving another Social Care Service.
Data sources
xii. Social Care Services, Scotland, 2015. Scottish Government 2015. http://www.gov.scot/Topics/Statistics/Browse/Health/Data/HomeCare#top
xiii. Local Government benchmarking Framework, National Overview Benchmarking Report Improvement Service 2015. Includes results from the Scottish Household Survey. http://www.improvementservice.org.uk/benchmarking/documents/2015_overview_report.pdf
xiv. Health and Care Experience Survey 2013/14 Vol 1: National Results, Scottish Government, 2014. http://www.gov.scot/Topics/Statistics/Browse/Health/GPPatientExperienceSurvey/Survey1314
xv. Study of the Workforce and Employment Issues Surrounding Self-Directed Support, Scottish Government, 2010. http://www.gov.scot/Publications/2010/04/07112801/0

20
5c. Residential Care Residential care may be required for adults who are unable to remain safely in their own home, due for example, to frailty in old age or disability. Local Authorities may provide funding for residential care, depending on assessment of need and financial situation. Care homes may provide long stay, short stay and/or respite care. They may be run by Local Authorities/NHS, private companies or the voluntary sector; they are all registered with and regulated by the Care Inspectorate.
36,751 adults were in residential care homes as of 31 March 2014. 42,502 places were available in 1,249 care homes for adults in Scotland. 72% (902) of care homes provided care to older people 57% (711) of care homes providing 31,856 places to 27,927 residents were run by the private sector. 28% (353) of care homes providing 5,883 places to 5,383 residents were run by the voluntary sector. 15% (185) of care homes providing 4,763 places to 4,071 residents were run by Local Authorities or NHS Boards. 90% of long stay residents in care homes are aged 65 and over.
£368 per week was the average cost of residential care to Local Authorities across Scotland per resident in 2013/14. The range was £194-467 per week (excluding island councils).7
TRENDS
The number of care homes, number of registered places and number of residents in care homes have all fallen between 2000 and 2014 (figure 21).
All provider sectors have seen a fall in the numbers of care homes between 2004-2014, with the largest fall of 41% seen in the voluntary sector.
The number of registered places in the local authority/NHS and voluntary sectors has fallen steadily since 2000.
The number of registered places in the private sector has increased by 8% from 29,373 in March 2000 to 31,856 in March 2014.
Care homes are getting larger; the average number of registered places per home has risen from 27 to 34 places per home between 2000 and 2014.
7 Residents with capital of less than £15,500 are eligible for public funding, but also make
contributions to care home fees from their pensions and any other income. Residents with capital, including property, worth £25,250 or more must meet their care costs in full, though they can still receive any assessed entitlement to free personal and nursing care. Fees for publicly funded residents are covered in the National Care Home Contract which is negotiated between the Convention of Scottish Local Authorities (COSLA) and Scottish Care annually.

21
Care homes for older people are those where the main client group is older people (65 and over), however they may also have other types of resident.
31,943 people were long term residents in care homes for older people as of March 2014. 1,244 people were short term or respite care residents. 13,056 long stay admissions were made into care homes for older people in the period April 2013-March 2014. 46% (~6000) of long stay residents in these homes were admitted from hospital. 33% (~4,300) of long stay residents were admitted from their own homes. 2.4% of long stay residents who were discharged returned to their own homes or supported accommodation/sheltered housing. 79% of discharges were due to death. 53% (16,955) of long stay residents had a medical diagnosis of dementia as of March 2014. 64% of long stay residents in the 75-84 age group had a diagnosis (medical or non-medical) of dementia. £499 was the average weekly charge across Scotland for publicly funded long stay residents without nursing care on 31 March 2014. £580 was the average weekly charge for these residents with nursing care. £683 was the average weekly charge for self-funding residents without nursing care. £754 was the average weekly charge for these residents with nursing care.
TRENDS Figure 21. The numbers of registered places, residents and homes in Scotland from March 2000-March 2014
0
200
400
600
800
1,000
1,200
1,400
1,600
1,800
2,000
0
5,000
10,000
15,000
20,000
25,000
30,000
35,000
40,000
45,000
50,000
Ho
me
s
Pla
ces/
Re
sid
en
ts
Number of Registered Places
Number of Residents
Number of Care Homes

22
The distribution of sources of admission (own home, sheltered housing, supported accommodation, other care homes, hospital, other) for long stay residents in homes for older people has remained fairly steady since March 2005.
The number of long stay residents in the 85-94 age group increased by 14% between March 2005 and March 2014. During the same period, the number in the 75-84 age group fell by 15%
The number of short stay and respite care residents in care homes for older people increased by 58% from 789 at March 2005 to 1,244 at March 2014.
The overall number of long stay residents with dementia (medically and non-medically diagnosed) has increased by 37% since 2005.
Care homes for other clients include facilities for adults with physical disabilities, adults with mental health problems and adults with learning disabilities. As of March 2014, there were:
40 care homes for adults with physical disabilities providing 645 places to 537 residents. 64 care homes for adults with mental health problems providing 1,040 places to 944 residents. 220 care homes for adults with learning disabilities providing 2,028 places to 1,821 residents. 52% (1733 out of 3302) of residents from these client groups are in care homes run by the voluntary sector.
TRENDS
The number of long stay residents in care homes where the main client group is adults with learning disabilities has declined by 34% since 2005.
The number of long stay residents in care homes where the main client group is adults with mental health problems has declined by 17% since 2005.
5d. Free Personal and Nursing Care (FPNC)
The Community Care and Health (Scotland) Act 2001 introduced Free Personal Care for older people, regardless of income or whether they live at home or in residential care. Free Nursing Care is available to people of any age who have been assessed as requiring nursing care services. Data on personal care services is available to 2013/14.
Around 78,000 people in Scotland benefit from Free Personal and/or Nursing Care. Around £494m was spent on Free Personal and Nursing care in 2013/14.

23
Free Personal and Nursing Care in care homes has been provided, if required, to self-funded older residents of care homes since 1 July 2002. For publicly funded residents, funding for this care is included in their public support. In 2013/14:
30,400 long stay residents of care homes were aged 65+ and therefore entitled to receive Free Personal and/or Nursing Care. 6,430 self-funding residents care home residents of all ages received Free Nursing Care. 33% (10,180) of long stay residents of care homes aged 65+ were self-funded and receiving Free Personal Care. 63% of these residents also received free nursing care. 67% of care home residents were publicly funded and receiving personal and nursing care services for free. £130m was spent by Local Authorities on Free Personal and Nursing Care payments to self-funded residents of care homes.
Free personal care services, if required, are provided without charge to people aged 65+ living in their own homes. In 2013/14:
47,810 people aged 65+ received free personal care at home. £364m was spent by Local Authorities on providing/purchasing personal care services for people living at home.
TRENDS
Expenditure on Free Personal and Nursing Care increased substantially between 2004/5 and 2013/14, though the rate of increase has been much lower in recent years (figure 22).
The number of long stay residents aged 65+ receiving public support (either by local authority funding or Free Personal and/or Nursing Care) fell by 5% from 32,080 in 2004/5 to 30,400 in 2013/14.
The number of older people receiving personal care services in their own homes has increased from 36,300 in 2004/5 to 47,810 in 2013/14.
The average number of hours of personal care provided at home per week per recipient has increased from 6.7 hours in 2004/5 to 8.6 hours in 2013/14.
In 2013/14 95% of people receiving Home Care services also received personal care, up from 63% in 2004/5.

24
Figure 22. Expenditure on Free Personal and Nursing Care (FPNC) (£millions)
Data sources xvi. Care Home Census 2014, Information Services Division, National Services
Scotland, October 2014. https://isdscotland.scot.nhs.uk/Health-Topics/Health-and-Social-Community-Care/Publications/2014-10-28/2014-10-28-CHCensus-Report.pdf?68531435729
xvii. Local Government benchmarking Framework, National Overview Benchmarking Report Improvement Service 2015. http://www.improvementservice.org.uk/benchmarking/documents/2015_overview_report.pdf
xviii. Free Personal and Nursing Care, Scotland, 2013-14, Scottish Government, April 2014. http://www.gov.scot/Topics/Statistics/Browse/Health/Data/FPNC
xix. Care Home Census 2014, Data tables. http://www.isdscotland.org/Health-Topics/Health-and-Social-Community-Care/Publications/data-tables.asp?id=1315#1315
5e. Carers / Respite Care
Many people who need help for everyday living receive their support from friends and family8, rather than from formal services. It is difficult to collect accurate data on carer numbers, the figures provided here are from survey data and represent the latest available estimates for Scotland at the time of publication. In 2012/13: Around 759,000 carers aged 16+ were providing care to one or more people; this is approximately 17% of the adult population Around 29,000 young people, aged 4-15 were providing care to one or more people. Over 171,000 carers aged 16+ were caring for 35 hours a week or more. 59% of carers are women, while 41% of carers are men. Working age women are much more likely to be carers than men. 55-64 years old is the age group when someone is most likely to be a carer.
8 41% of people needing help for everyday living received support from outwith formal services in the
Health and Care Experience Survey 2013/14.
93 97 99 104 106 108 108 111 116 130
158 189
228
267 277
316 342 347 351 364
0
50
100
150
200
250
300
350
400
2004-5 2005-6 2006-7 2007-8 2008-9 2009-10 2010-11 2011-12 2012-13 2013-14
Expenditure on FPNC in CareHomes £m
Expenditure on FPC at Home£m

25
TRENDS:
The number of people saying they provided 50 or more hours of care each week increased from 115,000 in 2001 (24% of carers), to 132,000 in 2011 (27% of carers).
The number of people saying they provided 20-49 hours of care each week increased from just over 60,000 in 2001 (13% of carers) to 87,000 in 2011 (18% of carers).
Respite care includes services provided or purchased by a local authority that are intended to benefit a carer and the person cared for, by providing a short break from caring tasks. Respite care may be provided in a residential home or in an individual’s home. There are challenges associated with collecting accurate data for respite care and the information included here does not include services provided directly through the voluntary sector and Health Boards.
203,090 respite weeks9 were provided in Scotland in 2013/14. 12,590 or more10 additional weeks were provided through Direct Payments. 53% of respite weeks were provided to carers of people aged 65+. 36% of respite weeks were provided to carers of people aged 18-64. 11% of respite weeks were provided to carers of people aged 0-17. £10.1m was reported as being spent on Direct Payments for respite care by Local Authorities11
TRENDS:
The number of respite weeks provided in Scotland is estimated to have increased by 6.2% (10,650 weeks) in real terms between 2007/8 and 2013/14. The increase arises mainly from services provided to carers of older people.
Though there are challenges in interpreting the data, in part due to changes in recording, the number of respite care weeks is estimated to have decreased by 1% between 2012/13 and 2013/14.
Data sources
xx. Scotland’s Carers, Scottish Government, 2015
http://www.gov.scot/Topics/Statistics/Browse/Health/Data/Carers xxi. Respite Care, Scotland, 2014. Scottish Government, 2014
http://www.gov.scot/Publications/2014/10/4559/6
9 Data is converted from numbers of days and nights of respite care into total number of respite
weeks. 10
Incomplete data is available for Direct Payment information, so these figures are underestimates. 11
18 of 32 local authorities submitted data, so the true amount is expected to be larger.

26
6. Learning disability services
National statistics are collected on adults with learning disabilities that are known to Local Authorities. There will be adults with learning disabilities not known to Local Authorities, so the numbers are underestimates. The latest data for adults with learning disabilities known to Local Authorities is available for 2014 and shows that:
26,786 adults12 with learning disabilities were known to Local Authorities across Scotland. This equates to 6 per 1,000 people in the general population. 9,299 (34.7%) live with a family carer. 16,161 (60.3%) live in mainstream accommodation. 1,782 (6.7%) of adults with learning disabilities that were known to Local Authorities were known to be in employment in 2014. 3,725 (14%) were in employment, training for employment or volunteering. 14,497 (54.1%) were not in employment, training for employment or volunteering. The status of the remaining 8,564 was not known.
A range of services are provided for adults with learning disabilities. Local area coordinators work with people with learning disabilities and their families to find out their needs and support them to meet them. However, not all Local Authorities provide local area coordination. Personal Life Plans (or Person Centred Plans) are assessments and/or support plans that focus on what is important to someone now and for the future. They are implemented in alliance with family and friends. The provision of independent advocacy is a legal requirement (Mental Health (Care and Treatment) (Scotland) Act 2003; NHS Boards and Local Authorities are obliged to work together to ensure independent advocacy is available.
2,729 (10.2%) of adults with a learning disability known to Local Authorities used local area co-ordination services. 15,538 had a personal life plan; this was 79% of the 19,482 adults who had been asked if they wanted a personal life plan. 5,368 attended a day centre. 1919 adults were recorded as using an advocacy service in 2014. 59% of these individuals used professional advocacy services13.
Data source
xxii. Learning Disability Statistics Scotland, 2014. Scottish Consortium for Learning
Disability, 2015. http://www.scld.org.uk/learning-disability-statistics-scotland/statistics/
12 East Renfrewshire did not provide data on adults with learning disabilities in 2014. To preserve
national relevance, 2013 data were used for East Renfrewshire. 13
Advocacy data is collected both at individual and aggregate level. This figure comes from the individually reported data and appears to underestimate some figures, such as that for self-advocacy. For fuller data and an explanation of the data see reference xxi

27
7. Social services and mental health
Mental health services are delivered primarily through the NHS and Local Authorities in partnership with the voluntary and independent sectors. The majority of these services are provided in the community. NHS Boards are responsible for the treatment of those with mental health problems either in community or acute settings, whilst local authorities are responsible for securing social care and support services (e.g. housing, day care services etc.) in the community, as well as providing services to support recovery. This document includes some statistics available on mental health services in the community in Scotland, focusing on the contributions made by social care services. A more comprehensive review of mental health in Scotland with a range of data sources can be found in reference xiv below. It is difficult to assess total expenditure on mental health services, as the definition of such services varies. According to available data, in 2013/14 –
£310m was spent by NHS Scotland on general psychiatry services in the community, representing about 35% of total psychiatry services spend in Scotland. £156m (gross) was spent by Local Authorities on social work services for adults with mental health needs, with £63m received in income for these services. 4,291 residents were in Local Authority funded care home beds for people with mental health needs. 4,260 people with dementia received home care in 2014. 3,050 people with mental health problems received home care in 2014. 2,180 people were on compulsory treatment orders (CTOs) in Scotland. 42% of these were community-based compulsory treatment orders.
Mental Health Officers (MHOs) are employed by Local Authorities in non-specialist or specialist mental health teams. MHOs have specific statutory duties, including making decisions on compulsory admissions to hospital.
603 whole time equivalent (WTE) MHOs were working in Scotland on 1 Dec 2014. 2570 (WTE) nurses were defined as community mental health nurses in 2014, with another 330 working in both hospital and the community. Together this represents 34% of the total of 8530 (WTE) mental health nurses.

28
TRENDS:
Figure 23. Numbers of people with dementia and mental health problems receiving home care.
The number of people with dementia receiving home care increased by 20% between 2013 and 2014, reaching the highest figure for more than fifteen years.
Numbers of community-based CTOs rose each year from 525 in 2007/8 to 916 in 2013/14. The percentage of all CTOs that are community-based has also increased from 30% to 42% in that time.
The number of occupied Local Authority funded mental health beds per 100,000 in the population14 has increased slightly from 78.1 in 2008/9 to 82.5 in 2013/14, though numbers have not increased every year.
Numbers of WTE MHOs fell by 4.6% in 2014, to the lowest number since 2005. The number of practising MHOs followed a similar pattern, falling by 2.5% in 2014 to the lowest number since 2005.
Data sources xxiii. Mental Health Benchmarking Toolkit 2013/14, ISD Scotland 2014.
http://www.isdscotland.org/Health-Topics/Quality-Indicators/National-Benchmarking-Project/Mental-Health-Dashboard.asp
xxiv. Mental Health Officers (Scotland) Report 2014. SSSC 2015. http://data.sssc.uk.com/data-publications/23-mental-health-officers-reports
xxv. SPICe Briefing. Mental Health in Scotland, May 2014. http://www.scottish.parliament.uk/ResearchBriefingsAndFactsheets/S4/SB_14-36.pdf
xxvi. Scottish Local Government Financial Statistics 2013-14, Scottish Government 2015. http://www.gov.scot/Publications/2015/02/3131
14 Rates are for beds/100,000 NRAC weighted population – for explanation of the NRAC formula see
http://www.isdscotland.org/Health-Topics/Finance/Resource-Allocation-Formula/
0
500
1000
1500
2000
2500
3000
3500
4000
4500
2005 2006 2007 2008 2009 2010 2011 2012 2013 2014
No
. of
pe
op
le
People withdementia
People with mentalhealth problems

29
8. Criminal Justice Social Work
As one part of the Criminal Justice System, Social Work Services work in the community and in prisons to contribute to the protection of the public by seeking to reduce the risks of re-offending and serious harm. This is accomplished by helping to manage risks posed by people who have offended and by engaging them in rehabilitative and reparative interventions and services. The work of Local Authority criminal justice social work includes the supervision of individuals who have been subject to a community disposal, provision of reports to courts to assist decisions on sentencing, statutory supervision for certain individuals on release from custody and the provision of throughcare support services. Diversion from prosecution is a formal decision by the Procurator Fiscal to divert an individual away from prosecution in favour of a social work intervention. Diversion is intended to provide an opportunity for individuals, typically accused of relatively minor offences in cases in which prosecution would be justified but not in the public interest, to be dealt with outwith the court system. In 2013/14:
2,250 diversion cases involving approximately 2,060 individuals were commenced. 29% of these cases involved 16-17 year olds. 44% of these cases involved females. 50% of cases involved offenders who were unemployed.
Social work orders include community payback orders, community service orders, probation orders, supervised attendance orders, and drug treatment and testing orders. In 2013/14:
20,400 social work orders were commenced. 19,200 social work orders terminated (includes all reasons for termination). 71% (13,600) of these were completions/discharges. 78% of social work orders commenced included an element of unpaid work or other activity.
Community Payback Orders (CPOs) were introduced by the Criminal Justice and Licensing (Scotland) Act 2010 and replaced previous provisions for community service / probation / supervised attendance orders. They can include a range of requirements, including drug/alcohol treatment, unpaid work or other activity and/or offender supervision. In 2013/14:
18,600 CPOs were commenced; this was 91% of all social work orders issued. 17,000 CPOs were in force at 31 March 2014. 15,300 CPOs were terminated. 85% (15,700) of CPOs commenced were for males. 61% of CPOs commenced included one requirement (normally unpaid work/other activity or supervision). 29% of CPOs commenced included two requirements, usually including supervision.

30
Court-based services and social work reports. The purpose of the Criminal Justice Social Work Report (CJSWR) is to assist in the sentencing process and to complement the range of other information available to sentencers (for example victim information and the narrative from the Procurator Fiscal). In particular the CGSWR provides information on social work interventions and how these may impact upon offending behaviour. In 2013/14:
31,400 criminal justice social work reports were submitted to the courts15. 45% of reports recommended the use of a community payback order. 6,900 requests were made to Local Authorities by courts for bail information. 3,700 same day (pre-sentence or specific sentence) reports were provided to the courts 20,200 post-sentence interviews took place with people remanded into custody or receiving custodial sentences for the first time.
Statutory/voluntary throughcare. Local Authorities have a statutory responsibility to supervise certain individuals on their release from custody including those sentenced to over 4 years in prison. Local Authorities also have a statutory responsibility to offer voluntary throughcare which consists of advice, guidance and assistance to people who request such a service within 12 months of their release from custody.
6,000 individuals were being provided with statutory throughcare as of 31 March 2014. 2,300 individuals received voluntary throughcare during 2013/14.
TRENDS:
Diversion from prosecution
The number of diversion cases more than doubled over the three years from 2010/11 to 2013/14 and increased by 35%, between 2012/13 and 2013/14. There were also substantial increases in numbers of referrals, assessments and cases completed.
Social work orders
The numbers of terminations of social work orders (including completion/discharge, revocation and other reasons for termination) in 2013/14 rose for the second year running, to the highest level for seven years.
15 Includes supplementary reports, but excludes letters sent in lieu of reports.

31
Court-based services and social work reports
The number of criminal justice social work reports submitted to the courts has shown an overall downward trend for several years, falling by over a quarter since 2008/9.
The number of same day reports provided to the courts increased by 13% compared to 2012/13 and has increased every year since 2009/10.
Statutory/voluntary throughcare services
The statutory throughcare caseload has gradually increased since 2010/11, with the 2013/14 figure representing the highest level since this data was first collected.
Data source
xxvii. Criminal Justice Social Work Statistics In Scotland: 2013-14. Scottish
Government, 2015. http://www.gov.scot/Publications/2015/03/1740
December 30 2015

32
Information sources.
The table lists the information sources used to compile this publication, indicating the
release dates for the data included and whether the publication is annual or
otherwise.
Study of the Workforce and Employment Issues
Surrounding Self-Directed Support, Scottish Government,
2010. http://www.gov.scot/Publications/2010/04/07112801/0
April 2010*
SPICe Briefing. Mental Health in Scotland, May 2014. http://www.scottish.parliament.uk/ResearchBriefingsAndFactsheets/S4/SB_14-36.pdf
May 2014*
Health and Care Experience Survey 2013/14 Vol 1: National
Results, Scottish Government, 2014.
http://www.gov.scot/Topics/Statistics/Browse/Health/GPPatie
ntExperienceSurvey/Survey1314
May 2014**
Care Home Census 2014, Data tables. http://www.isdscotland.org/Health-Topics/Health-and-Social-Community-Care/Publications/data-tables.asp?id=1315#1315
Tables published
throughout 2015
Local Government benchmarking Framework, National
Overview Benchmarking Report Improvement Service 2015.
Includes results from the Scottish Household Survey.
http://www.improvementservice.org.uk/benchmarking/docu
ments/2015_overview_report.pdf
January 2015
Scottish Local Government Financial Statistics 2013-14, Scottish Government 2015. http://www.gov.scot/Publications/2015/02/3131
Feb 2015
April 2015 (updated)
Children’s Social Work Statistics Scotland, 2013-14, Scottish Government (2015). http://www.gov.scot/Topics/Statistics/Browse/Children/PubChildrenSocialWork
March 2015
Expenditure of Adult Social Care Services, Scotland 2003-
04 to 2013-14.
http://www.gov.scot/Topics/Statistics/Browse/Health/Data/E
xpenditure
March 2015
Respite Care, Scotland, 2014. Scottish Government, 2014
http://www.gov.scot/Publications/2014/10/4559/6
March 2015
Scotland’s Carers, Scottish Government, 2015
http://www.gov.scot/Topics/Statistics/Browse/Health/Data/Ca
rers
March 2015

33
Criminal Justice Social Work Statistics In Scotland: 2013-
14. Scottish Government, 2015.
http://www.gov.scot/Publications/2015/03/1740
March 2015
Free Personal and Nursing Care, Scotland, 2013-14, Scottish Government, April 2014. http://www.gov.scot/Topics/Statistics/Browse/Health/Data/FPNC
April 2015
Mental Health Benchmarking Toolkit 2013/14, ISD Scotland
2014. http://www.isdscotland.org/Health-Topics/Quality-
Indicators/National-Benchmarking-Project/Mental-Health-
Dashboard.asp
June 2015***
Learning Disability Statistics Scotland, 2014. Scottish Consortium for Learning Disability, 2015. http://www.scld.org.uk/learning-disability-statistics-scotland/statistics/
August 2015
Mental Health Officers (Scotland) Report 2014. SSSC 2015.
http://data.sssc.uk.com/data-publications/23-mental-health-
officers-reports
August 2015
Scottish Social Service Sector: Report on 2014 Workforce
Data. SSSC, 2015. http://data.sssc.uk.com/data-
publications/22-workforce-data-report/99-scottish-social-
service-sector-report-on-2014-workforce-data
August 2015
Care Home Census 2014, Information Services Division,
National Services Scotland, October 2014.
https://isdscotland.scot.nhs.uk/Health-Topics/Health-and-
Social-Community-Care/Publications/2014-10-28/2014-10-
28-CHCensus-Report.pdf?68531435729
October 2015
Social Care Services, Scotland, 2015. Scottish Government
2015.
http://www.gov.scot/Topics/Statistics/Browse/Health/Data/Ho
meCare#top
November 2015
* Not published annually
** Published biannually
*** Next release expected March 2016
The Care Inspectorate is a valuable source of statistics and information on social
services. Their reports have not been specifically referenced in this publication,
though selected data are included and are published in some of the reports
referenced above. Additional statistics and information can be found the Care
Inspectorate website at http://www.careinspectorate.com/index.php and
http://www.careinspectorate.com/index.php/publications-statistics/19-public/statistics.