construction output in scotland stephen curtis, office for national statistics
TRANSCRIPT
Construction output in Scotland
Stephen Curtis,
Office for National Statistics

Structure of the talk
• The register and the sample
• What information do we get?
• What do we produce for the UK?
• How do we use our information to produce data for Scotland?
• How reliable are the figures?

Coverage
Our surveys cover:
• Great Britain• Construction, as in the Standard Industrial
Classification, except SIC 41.1 (development of building projects)
The register
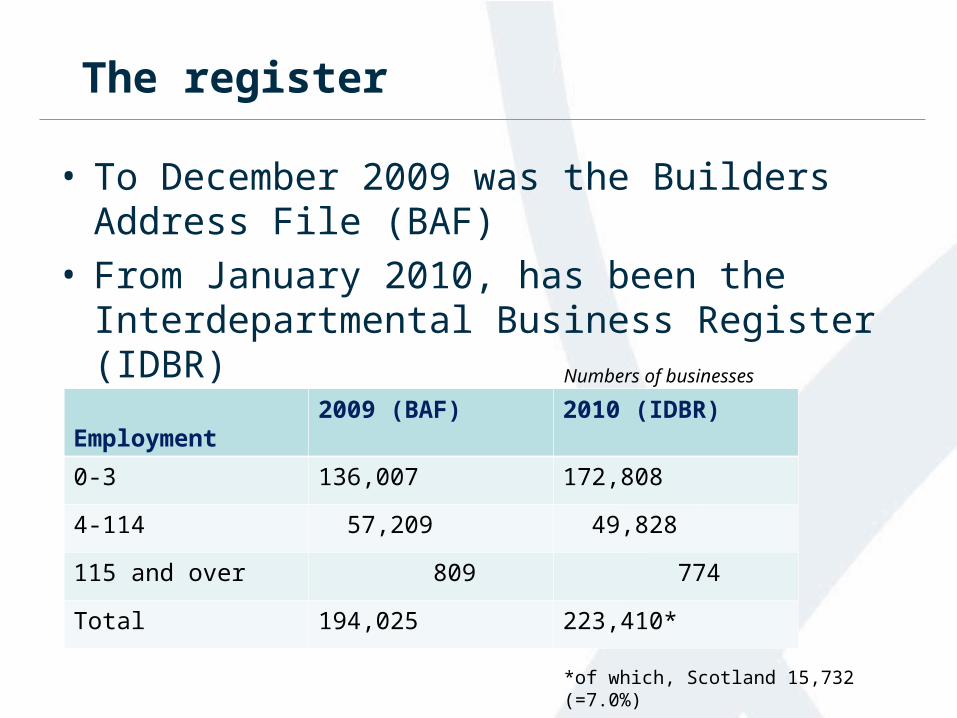
• To December 2009 was the Builders Address File (BAF)
• From January 2010, has been the Interdepartmental Business Register (IDBR)
Employment2009 (BAF) 2010 (IDBR)
0-3 136,007 172,808
4-114 57,209 49,828
115 and over 809 774
Total 194,025 223,410*
Numbers of businesses
*of which, Scotland 15,732 (=7.0%)

Sample sizes
Sample of 7,800 construction businesses:
• Target for each set of results is for at least 70% of forms to be back; 80% by value of register turnover. Achieved.
Register employment
Population count (Q4 2011)
Proportions of turnover
Sample size Sampling fraction
0-4 184,005 21.1% 3,311 1.8%
5-19 32,965 17.5% 2,134 6.5%
20-99 5,613 17.7% 1,506 26.8%
100 and more 831 43.7% 831 100.0%
223,414 100.0% 7,782 3.5%*
*= 50.2% by turnover

What information do we get?
• Up to December 2009, BIS obtained figures of output (quarterly) and new orders (monthly). For new work output there was only one question. For repair and maintenance there were 4 categories
• From January 2010, ONS has obtained figures of output (monthly) and new orders (quarterly). New work output is now split into 6 categories; repair and maintenance into 5 (infrastructure added)

What the output survey measures
• Output, not turnover (excludes sub-contractors)
• Output of the construction industry, not construction output.Will exclude: De minimis output
Businesses not classified to construction
Most direct labour departmentsDevelopment of building projects
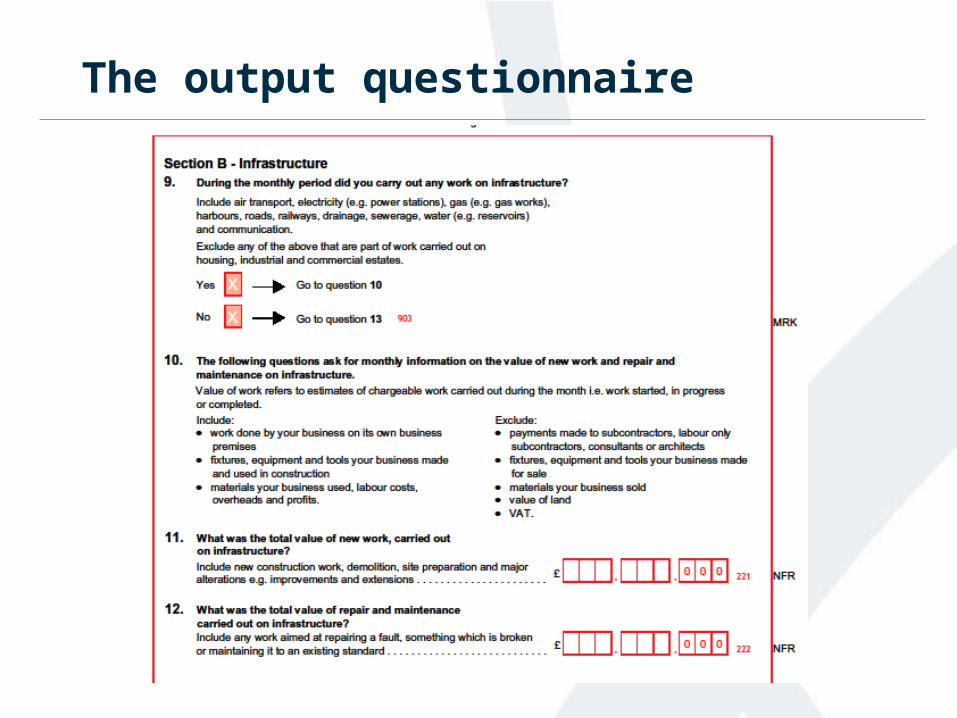
The output questionnaire

The new orders questionnaire

UK data
• From these questionnaires we can (and do) measure directly:
• The value of output.• The value of new orders obtained, in total, by
region, and by type of activity.
Both sets of figures are then deflated and seasonally adjusted. (Output is only seasonally adjusted quarterly).

Regional data
• For new work, we have no direct information on regional output
• For new orders of £100,000 or more: we do have information about location of the work
• For new orders under £100,000: we assume they are located in the region of the firm’s address
• We can make assumptions about how long these orders take to fulfil
• Those assumptions are based on surveys from 2005-2007

Location of construction work
Q4 2011
Region of registration EAST MIDLANDS
EAST OF ENGLAND
LONDONNORTH
EASTNORTH
WESTSCOTLAND
SOUTH EAST
SOUTH WEST
WALESWEST
MIDLANDS
YORKSHIRE & THE
HUMBERTOTALS
EAST MIDLANDS 376 34 59 2 42 5 32 7 1 69 22 649EAST OF ENGLAND 69 534 370 11 54 32 308 73 4 63 17 1,534
LONDON 7 33 1,102 4 7 71 96 23 2 13 11 1,369NORTH EAST 0 3 8 82 14 6 2 0 1 0 5 121
NORTH WEST 7 2 2 273 538 41 3 4 6 67 22 967SCOTLAND 10 44 179 17 34 540 8 4 9 5 18 867
SOUTH EAST 56 72 1,283 48 170 23 1,027 135 18 89 61 2,981SOUTH WEST 20 14 88 4 0 1 72 499 14 81 4 798
WALES 7 5 0 0 25 0 19 18 184 9 5 273WEST MIDLANDS 43 23 109 16 94 29 120 91 51 331 80 987
YORKSHIRE & THE HUMBER 28 71 51 44 78 11 38 3 8 36 309 676TOTALS 623 834 3,250 501 1,055 761 1,726 857 298 763 554 11,221
Region where work is to take place
New orders, Q4 2011, £ million
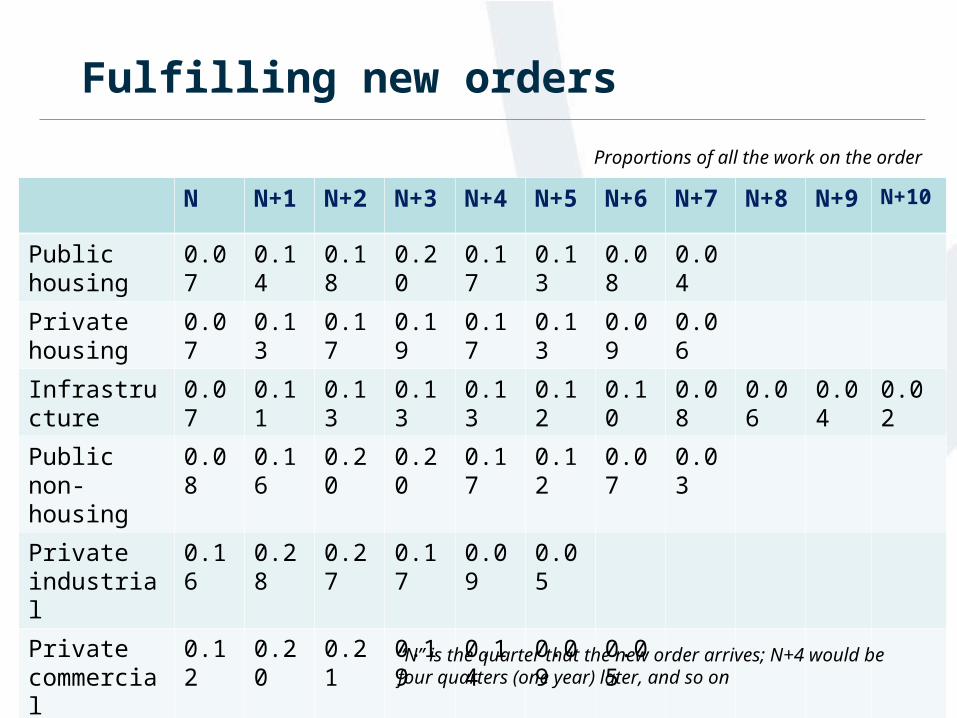
Fulfilling new orders
N N+1 N+2 N+3 N+4 N+5 N+6 N+7 N+8 N+9 N+10
Public housing
0.07 0.14 0.18 0.20 0.17 0.13 0.08 0.04
Private housing
0.07 0.13 0.17 0.19 0.17 0.13 0.09 0.06
Infrastructure 0.07 0.11 0.13 0.13 0.13 0.12 0.10 0.08 0.06 0.04 0.02
Public non-housing
0.08 0.16 0.20 0.20 0.17 0.12 0.07 0.03
Private industrial
0.16 0.28 0.27 0.17 0.09 0.05
Private commercial
0.12 0.20 0.21 0.19 0.14 0.09 0.05
“N” is the quarter that the new order arrives; N+4 would be four quarters (one year) later, and so on
Proportions of all the work on the order
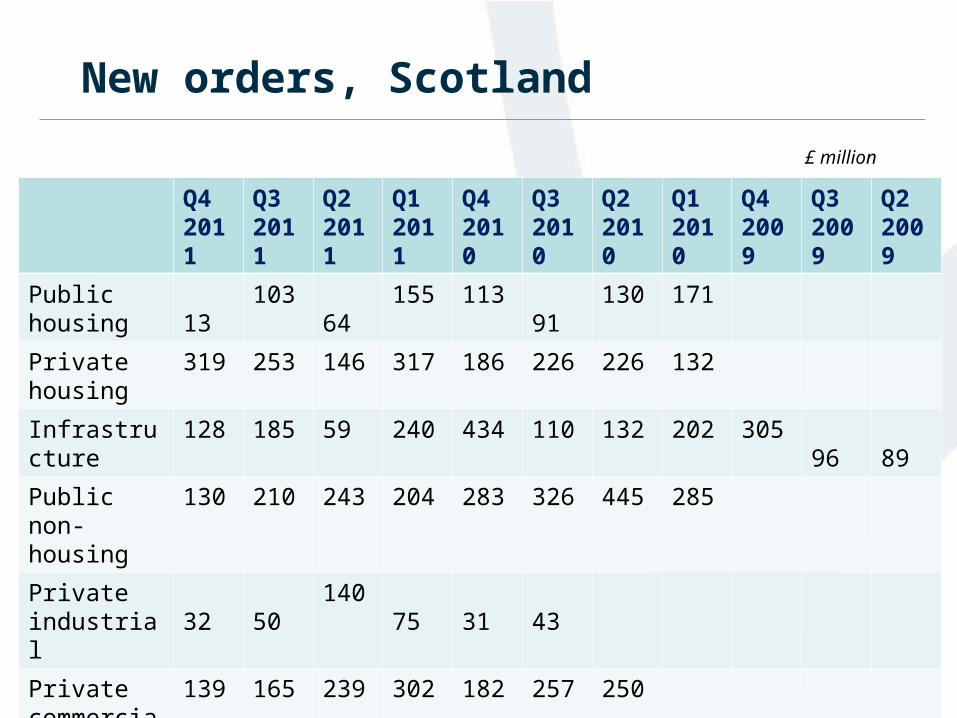
New orders, Scotland
Q4 2011
Q3 2011
Q2 2011
Q1 2011
Q4 2010
Q3 2010
Q2 2010
Q1 2010
Q4 2009
Q3 2009
Q2 2009
Public housing
13 103 64 155 113 91 130 171
Private housing
319 253 146 317 186 226 226 132
Infrastructure 128 185 59 240 434 110 132 202 305 96 89
Public non-housing
130 210 243 204 283 326 445 285
Private industrial
32 50 140 75 31 43
Private commercial
139 165 239 302 182 257 250
£ million

Contributions to output, Q4 2011, Scotland
Q4 2011
Q3 2011
Q2 2011
Q1 2011
Q4 2010
Q3 2010
Q2 2010
Q1 2010
Q4 2009
Q3 2009
Q2 2009
Public housing
0.9 14.4 11.5 31.0 19.2 11.8 10.4 6.8
Private housing
22.3 32.9 24.8 60.2 31.6 29.4 20.3 7.9
Infrastructure 9.0 20.4 7.7 31.2 56.4 13.2 13.2 16.2 18.3 3.8 1.8
Public non-housing
10.4 33.6 48.6 40.8 48.1 39.1 31.2 8.6
Private industrial
5.1 14.0 37.8 12.8 2.8 2.2
Private commercial
16.7 33.0 50.2 57.4 25.5 23.1 12.5
£ million

Output, Q4 2011, Scotland
Q4 2011
Public housing 106
Private housing 229
Infrastructure 191
Public non-housing 260
Private industrial 75
Private commercial 218
£ million
Total = £ 1,080 million
Note: because the new orders source largely uses the location of the building work, this mainly represents some form of output in Scotland, not necessarily output by Scottish businesses.

Other regions
We then undertake the same calculation for each of the other regions of Great Britain
We compare the aggregate for all regions taken together with total output directly from the construction survey
The total output figures first published for Q4 2011 were:
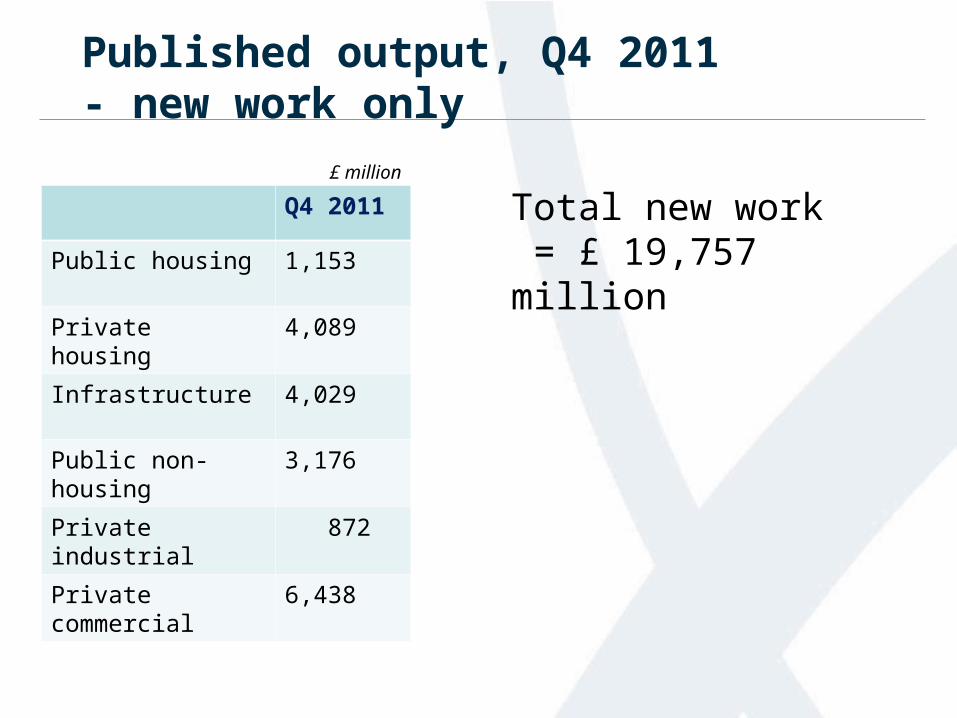
Published output, Q4 2011- new work only
Q4 2011
Public housing 1,153
Private housing 4,089
Infrastructure 4,029
Public non-housing 3,176
Private industrial 872
Private commercial 6,438
£ million
Total new work = £ 19,757 million
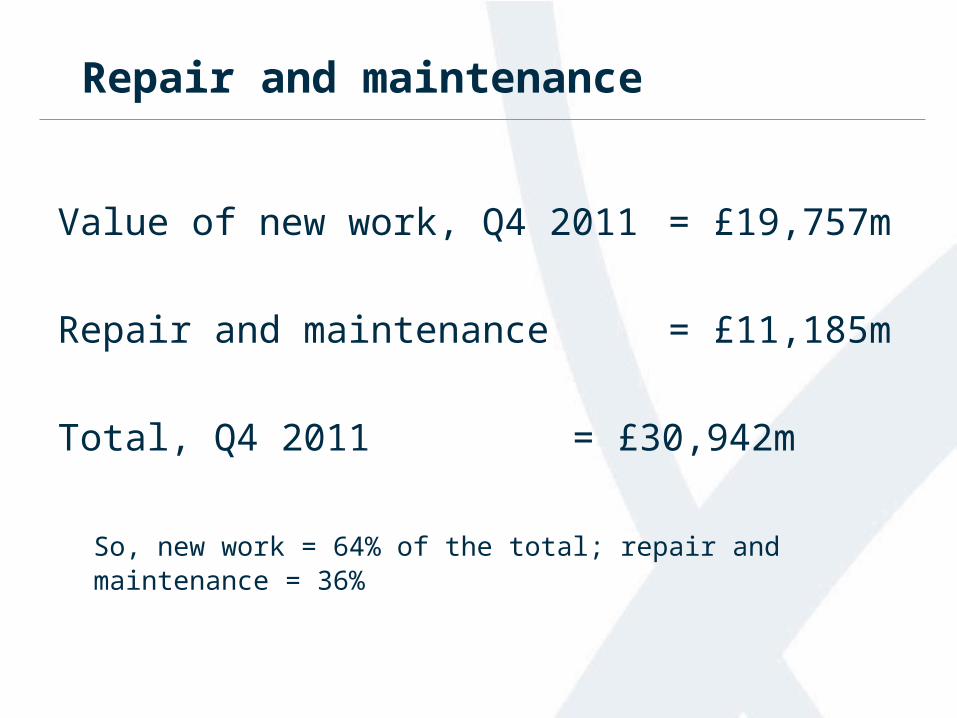
Repair and maintenance
Value of new work, Q4 2011 = £19,757m
Repair and maintenance = £11,185m
Total, Q4 2011 = £30,942m
So, new work = 64% of the total; repair and maintenance = 36%

Repair and maintenance by region
• Repair and maintenance data are collected in the output survey
• Assumed that repair and maintenance occurs in the region where the firm is based
• So, for example, all repair and maintenance in Scotland is assumed to be undertaken by firms with Scottish addresses
• No system of lagging new orders is needed

Deflation
• We often want to know not only the current value of building work, but whether the output of the construction industry is growing or shrinking in “real terms”
• To do that, we divide the current price amounts by an indicator of how prices have moved in the period (a “deflator”)
• We only deflate data for GB as a whole

Construction industry deflators
• Are obtained from the Building Cost Information Service (BCIS)
• Are of two types: output deflators and tender price deflators
• Are used for Great Britain and for every region (by type of work)
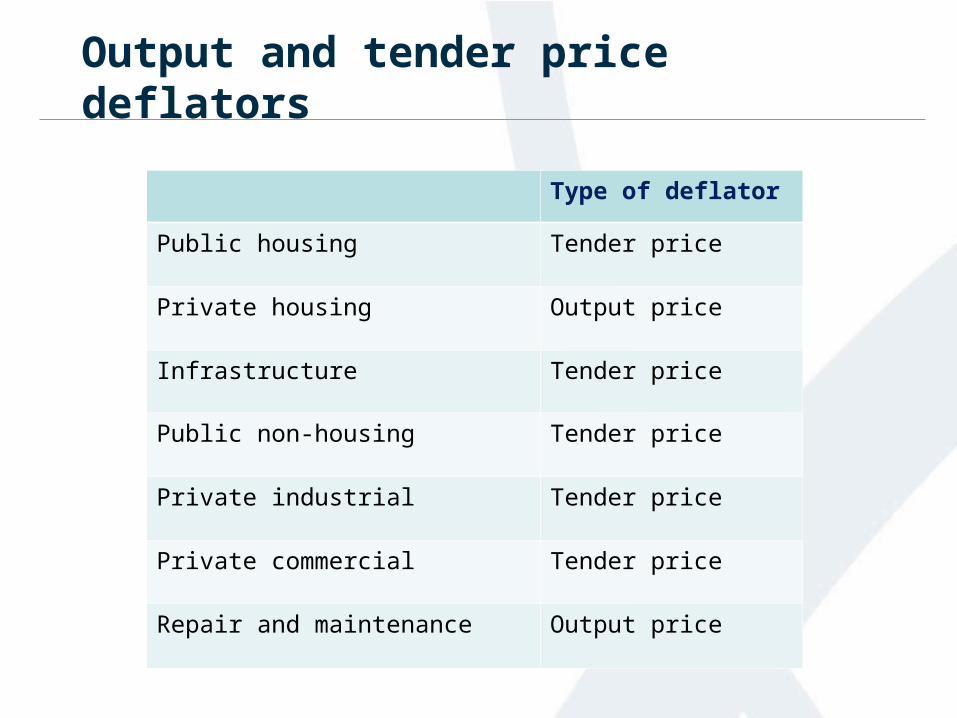
Output and tender price deflators
Type of deflator
Public housing Tender price
Private housing Output price
Infrastructure Tender price
Public non-housing Tender price
Private industrial Tender price
Private commercial Tender price
Repair and maintenance Output price

Output price deflators
Figures for Q4 2011 (2005=100)
Public housing 111.9
Private housing 119.0
Infrastructure 119.4
Public non-housing 109.0
Private industrial 108.1
Private commercial 100.9
Repair and maintenance 125.3*
* Derived from: public housing R&M = 124.0; private housing R&M =143.7; other categories of R&M = 114.7

Seasonal adjustment
• We use the standard ONS method for seasonal adjustment, X-12 ARIMA
• Seasonal adjustment is applied individually to each type of work (public housing, private housing etc)
• Seasonal adjustment of total GB output is the sum of the component series
• Regional figures are not seasonally adjusted

Reliability of new orders as a leading indicator
0
5,000
10,000
15,000
20,000
25,000
19
78
19
79
19
80
19
81
19
82
19
83
19
84
19
85
19
86
19
87
19
88
19
89
19
90
19
91
19
92
19
93
19
94
19
95
19
96
19
97
19
98
19
99
20
00
20
01
20
02
20
03
20
04
20
05
20
06
20
07
20
08
20
09
20
10
20
11
£ m
illio
n
Construction output - total new work
Output as published (Dec ref) Output as modelled from new orders
GB data
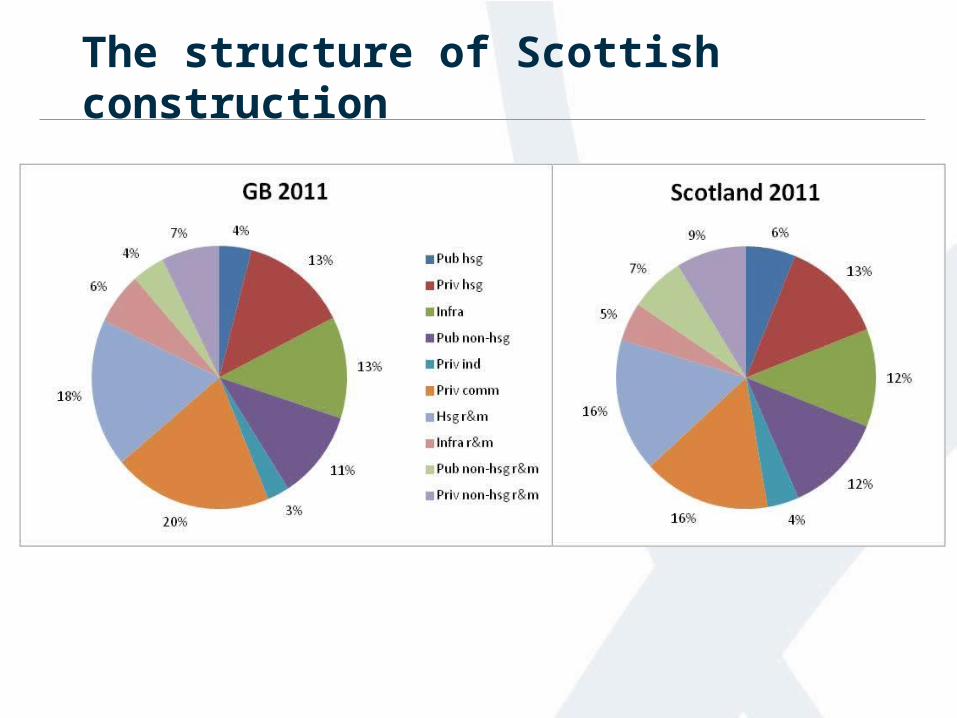
The structure of Scottish construction

GB figures vs Scotland: new work

GB figures vs Scotland: R&M
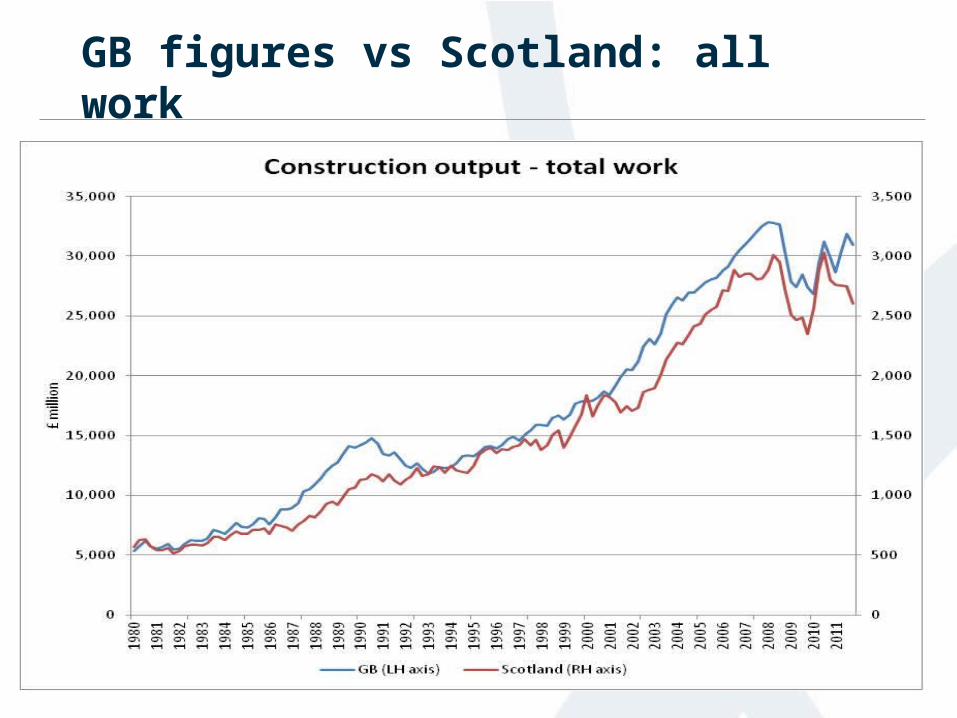
GB figures vs Scotland: all work

Any questions?