social safety nets - statsbots.org.bw
TRANSCRIPT
Social Safety Nets Stats Brief
Private Bag 0024, Gaborone Tel: 3671300 Fax: 3952201 Toll Free: 0800 600 200
Private Bag F193, Francistown Botswana Tel. 241 5848, Fax. 241 7540
Private Bag 32 GhanziTel: 371 5723 Fax: 659 7506
Private Bag 47MaunTel: 371 5716 Fax: 686 4327
E-mail: [email protected] Website: http://www.statsbots.org.bw

Social Safety Nets Stats BriefStatistics Botswana
I
Table of Contents
Abbreviations and Acronyms..............................................................................................................................................II
1. Preface........................................................................................................................................................................III
1.0 Introduction..............................................................................................................................................................11.1 A synopsis of the Social Safety Nets (SNNs)................................................................................................................1
2. Summary of Findings....................................................................................................................................................42.1 Characteristics of Households................................................................................................................................42.2 ProportionofHouseholdswhichBenefittedfromSocialSafetyNetsProgrammes.......................................................42.3 ProportionofBeneficiariesbystrata.......................................................................................................................52.4 Orphan Care Programme.......................................................................................................................................62.4.1 Proportion of Households that Received Orphan Care by Strata........................................................................6
Annxure 1........................................................................................................................................................................8
Annxure 2......................................................................................................................................................................10
Refrences..........................................................................................................................................................................11
List of Figures
Figure1:ProportionofHouseholdswhichBenefittedfromSocialSafetyNetsProgrammes......................................................5Figure2:ProportionofHouseholdswhichBenefitted fromSocial SafetyNetsProgrammesbyStrata….................................5Figure3:PercentageofHouseholds thatBenefitted fromOrphanCarebyStrata…………….......................…………………6Figure 4: Comparison between QMTS and BMTHS …………………………………………...............…………………………….7
List of Tables
TABLE 1: SOCIAL SAFETY NETS AS AT APRIL 2019................................................................................................................3TABLE 2: THE NUMBER OF HOUSEHOLDS BENEFITING FROM SAFETY NETS AND OTHER GOVERNMENT PROGRAMMES ……………………………….........…………………………………………….4TABLE 3: BENEFICIARY HEADS OF HOUSEHOLDS BY GENDER………….......……...............…………………………….....………4TABLE 4: PROPORTION OF HOUSEHOLDS THAT BENEFITTED FROM VARIOUS COMPONENTS OF THE ORPHAN CARE PROGRAMME BY STRATA…………...........……………………………………………………………...............…6TABLE (I): NUMBER OF HOUSEHOLDS THAT BENEFITTED FROM VARIOUS TYPE OF ORPHAN CARE PROGRAMME BY STRATA ………………………………………………………………….......…………...……......8TABLE (II): COMPARISON BETWEEN BMTHS AND CMTHS....................……………………………..……………………………..8TABLE (III): PROPORTION OF HOUSEHOLDS THAT BENEFITTED FROM VARIOUS TYPE OF SSN PROGRAMMES BY STRATA.......……………………………..……………………………………………................…..9

Social Safety Nets Stats BriefStatistics Botswana II
Abbreviations and Acronyms
BCWIS Botswana Core Welfare IndicatorsBIDPA Botswana Institute for Development Policy AnalysisBMTHS Botswana Multi-topic Household SurveyCAPI Computer Assisted Personal InterviewsCHC Community Home-Based CareDAP Disability Package AllowanceDPP Destitute Persons ProgrammeIPEL IpelegengLIMID Livestock Management and Infrastructure DevelopmentMLGRD Ministry of Local Government Rural DevelopmentNSP Needy Student PackageOAP Old Age PensionOCP Orphan Care ProgrammePEP Poverty Eradication ProgrammeQMTS Quarterly Multi-topic SurveyRAPD Remote Area Development ProgrammeSSNs Social Safety NetsSF School FeedingVGFP Vulnerable Groups Feeding ProgrammeWW2 World War II Veterans’ Allowance

Social Safety Nets Stats BriefStatistics Botswana
III
1. Preface
The statistical brief (stats brief) gives estimates on households that received government transfers in the form of social safety nets, based on data collected in the third quarter of 2019 through the Quarterly Multi-Topic Survey.
The safety nets module was primarily included to give estimates on the number of households that benefited from safety nets and other government programmes. A total of 3, 240 households were sampled yielding 669, 429 households after weighting. Households were asked if they have received any assistance from programmes covered under the safety nets module, taking into consideration that one household could receive more than one safety net package. A nominal scale of 1 for “yes” and 2 for “no” was used.
The results showed that 57.9% (387, 503) of the households received either of the social safety nets packages. Of the recipient households. 55.9% were female headed, while 44.1% were male headed households. This is consistent with all poverty survey results conducted in the country in the past, which indicated that poverty was more prevalent in female headed households compared to male headed households.
The results further indicated that the school feeding programme covered a larger proportion of households at 41.1%, followed by vulnerable group feeding, old age pension and Ipelegeng at 23.7%, 15.9% and 14.9% respectively, displaying a similar pattern of coverage observed in the Botswana Multi-Topic Household Survey (BMTHS) of 2015/16.
Further data decomposition by domains/strata revealed that social safety nets interventions are dominant in the rural areas as compared to urban villages and cities/towns. Table IV in annexure 1 shows that the proportion of Social Safety Nets (SSN) beneficiaries in rural arears was 68.3%, followed by urban villages and cities/towns at 58.9% and 40% respectively. The results further showed that the most dominant social safety nets programmes in rural areas include amongst others Rural Area Development Programme (RADP), Poverty Eradication Programme, Livestock Management and Infrastructure Development (LIMID), Destitute Persons Programme and Ipelegeng at 90.8%, 81.8%, 60.8%, 60.1%, & 58.7% respectively. The Community home based package, school feeding, vulnerable group feeding and disability package allowance are more prominent in urban villages at 47.7%, 46.7%, 44.2% and 40.1% respectively while the dominant programmes in cities/towns, although at lower proportions compared to rural areas and urban villages, includes school feeding, disability package allowance, vulnerable group feeding and orphan care programmes at 16.1%, 15.3%, 12.1% and 11.2% respectively.
Analysis of households that benefited from various components of the orphan care programme by strata indicated that from the total number of households that received the orphan care package, the food basket including the toiletries component covered a larger proportion of households at 87.9%, followed by school uniforms, educational support and casual clothing components at 44.1%, 40.8%, and 28.4% respectively.
It is expected that stakeholders will find these results useful in informing policy formulation, review, and monitoring of national plans and programmes.
Dr. Burton MguniStatistician GeneralAugust 2021

Social Safety Nets Stats Brief1 Statistics Botswana
1.0 IntroductionThe Government of Botswana has over the years implemented social protection programmes to assist vulnerable groups within the society such as, orphaned children, people with disabilities, old age persons and children who are prone to poverty, poor nutrition, poor health and lack of access to social services.
This statistical brief summarises a select number of social safety nets (SSN) programmes in Botswana as captured during the third quarter (July-September) of the Quarterly Multi-Topic Survey (QMTS) 2019. The survey was conducted through Computer Assisted Personal Interviews (CAPI). Each household was requested to indicate if there were any members of their households who were receiving any of the social protection programmes packages, and the specific member(s) of the household who was the beneficiary. A copy of the SSNs module (from the Q3 questionnaire) is attached as annex 1.
The brief starts with a synopsis of the SSNs programmes, their description and their eligibility criterion together with their implementation arrangements. Secondly, the brief includes characteristics of households receiving the social safety nets, which were captured during the QMTS quarter three of 2019, and a summary of results.
1.1 A synopsis of the Social Safety Nets (SNNs)
i. Old Age Pension Program: This Program was established in 1996 and it is a universal flat transfer, non-means tested, that solely aids all persons aged 65 years and older. The payments are made through the post office network countrywide. The World War II Veterans program uses the same network for payments.
ii. School Feeding Program: Students are provided with breakfast and lunch, according to the Social Protection Sector Review. The students receive a meal equivalent to 1/3 of a child‘s daily nutrition needs and it consists of samp, beans, sorghum meal, beef, stew, vegetables, fruits, tea, and agricultural produce amongst others. The program is managed by the Ministry of Local Government & Rural Development. In this brief, the indicator on school feeding consists of students from primary and secondary education in government and government aided schools.
iii. Orphan Care Program: Botswana opted for a narrow definition of orphans as defined in the 1999-2011 Short-term Plan of Action on Care of Orphans which posits that an orphan is a child under 18 years who has lost both parents if they were married, or one parent in the case of single-parent families. The program was introduced in 1999 and it is one of the largest assistance programs in Botswana designed to respond to the needs of orphaned children such as food, clothing, shelter, education, protection and care. The beneficiaries are not means-tested, as the program is open to all orphaned children.
iv. Vulnerable Groups Feeding Program (VGFP): The VGFP was introduced in 1988 with the aim to distribute meals and nutritional supplements to people who are vulnerable to under-nutrition. The program provides monthly home rations through clinics to vulnerable children aged 6-60 months, pregnant and lactating women, and to tuberculosis (TB) and leprosy patients from poor households. The ration consists of Tsabana, Malutu, beans and sunflower oil.
v. World War II Veterans: The program was introduced in 1998 with the objective of providing pensions to veterans of World War II and their surviving spouses or children up to the age of 21.
vi. Ipelegeng: The labour–intensive program was initially a drought relief public works programme and was made permanent in 2008, as a tool for cushioning the effects of poverty both in rural and urban areas replacing a long series of drought relief/public works and “food-for-work” programs dating back to independence in 1966. The overall number of work slots is revised for each monthly cycle and beneficiaries are enrolled on rotational basis.

Social Safety Nets Stats Brief2Statistics Botswana
vii. Community Home-based Care (CHBC): This program was initially established as a response to the HIV/AID pandemic in 1995, but later extended to cover people with other chronic diseases such as diabetes. The program was designed to enhance quality care at home for terminally ill patients as health facilities were overwhelmed. It included a homebased care food package depending on the needs of a patient as guided by a health practitioner.
viii. Livestock Management & Infrastructure Development (LIMID): The program started in 2008 as part of government’s initiative to improve food security and to eradicate poverty. According to LIMID Phase II guidelines of 2010, the program consists of seven packages out of which three packages (i.e., small stock, guinea fowl and Tswana chickens) focused on resource-poor households, and the infrastructure development which included animal husbandry and fodder support, borehole/well equipping, borehole drilling and reticulation and borehole purchase, as well as cooperative poultry abattoirs. LIMID support is a once off assistance programme for all packages except animal husbandry and fodder support.
ix. Remote Area Development Plan (RADP): The program originally financed projects meant to benefit marginalised communities in remote areas. After its evaluation which was approved in 2010, it now focuses on community led developments, creation of sustainable livelihoods systems and an affirmative action program for disadvantaged groups.
x. Destitute Persons Program: This program was established in 1980 with the aim to assist those who have no other source of support. Beneficiaries are means-tested through assessments conducted by social workers. The Village and Ward Development Committees and other local authorities or institutions at times assist in identifying potential beneficiaries prior to these assessments.

Social Safety Nets Stats Brief3 Statistics Botswana
TABLE 1: SOCIAL SAFETY NETS AS AT APRIL 2017
Type Of SSN Programme Benefit Eligibility Criteria
Destitute Cash Allowance
P300/month
Possessing not more than four livestock units. Earning or receiving an income of less than P120/month without dependents or less than P150/month with dependents
Destitute In-Kind Allowance
Monthly food basket, school supplies, shelter, transportation, exemption from payment of medical fees and school fees.
Should be a registered destitute person approved and registered by a District or Town Council on a temporary or permanent basis.
P500-650/month
Should be a registered destitute person approved and registered by a District or Town Council on a temporary or permanent basis.
Needy students (usually needy children living in destitute households) receive school uniform, toiletry, private clothing and other educational support.
Needy student is a dependent of a re-gistered destitute person or a graduated orphan who is still attending school.
Old Age Pension P530/monthBe a citizen of Botswana, have attained the age of 65, not means-tested.
World War II Veterans P600/month
Have participated in World War II or be a spouse of a World War II veteran.
OrphansBenefit
Monthly food basket ranging between P600-P700, school uniform and other educa-tional needs, transportation, exemptions from payment of school fees.
A child under the age of 18 whose parent has died if parent was not married or both parents if they were married. (Thus if one of the married parents is alive the child is not an orphan).
Disability Allowance P450/Month
A citizen of Botswana with severe and profound disability confirmed by a medical doctor.
Community Home Based Care (CHBC)
Food basket ranging between P500 and P1, 200, depending on the needs of a patient as guided by a health practitioner.
A citizen of Botswana, discharged by a medical officer into CHBC, referred through a community social worker’s office for assessment and approved by the District or Town Council.
Ipelegeng/ Public Works
P567 per month for casual labourers and P651 per month for supervisors. Sustenance- indi-viduals supply Ipelegeng beneficiaries with a snack at P8 per person/day for a period of 3 months on a rotational basis.
Any citizen above the age of 18, who is able bodied and residing in a given locality where such public works are available.
Vulnerable Group Feeding Program
Under 5 feeding monthly ration of Tsabana 0-3 years, Malutu 3-5 years, 750ml cooking oil on a monthly basis.
Child under the age of 5 with a birth cer-tificate coming for weighing every month at a local clinic, Pregnant and lactating women, Tuberculosis (TB) and leprosy pa-tients from poor households.
Primary School Feeding Program
Mid-morning snack daily and during drought. In some selected areas children can also be provided with lunch.
All children attending Primary School.
Source MLGRD NB: Figures for school feeding included all children attending government schools (the total number of children in primary/secondary education).

Social Safety Nets Stats Brief4Statistics Botswana
2. Summary of Findings
2.1 Characteristics of HouseholdsThe module on safety nets and other government programmes requested households to indicate if any of the household members received transfers in the form of SSNs from the government. Table 2 presents results of the sampled and estimated totals of households which benefited, and those that did not benefit from social safety nets. The results show that during quarter three of 2019, a total of 3,240 households were sampled for the QMTS, which converted to an estimate of 669,429 households after weighting. The breakdown of the 3,240 households, shows that, 1,857 (57.3%) households benefitted from government transfers through safety nets and other government programmes, while 1,383 (42.7%) did not. The estimated 669,429 households yielded an estimate of 2,403,422 persons. An estimated 57.9% (387,503) of the total households received the social safety nets.
TABLE 2: THE NUMBER OF HOUSEHOLDS BENEFITING FROM SAFETY NETS AND OTHER GOVERNMENT PROGRAMMES
BenefitStatus
Sample Households Population Households
Number % Number %Did not benefit from Safety Nets 1,383 42.7 281,926 42.1
Benefitted from Safety Nets 1,857 57.3 387,503 57.9
Total 3,240 100.0 669,429 100.0
Table 3 summarises the distribution of the population which benefited from social safety nets and other government programmes by gender of household head. The results show that 216,759 (55.9%) of the households which received safety nets were female headed and 170, 410 (44.0%) were male headed. The bias of the distribution towards the female headed households is not surprising given that poverty is more prevalent in female headed households at 54.2% compared to their male counterparts with 45.8% (BMTHS 2015/16, 2018).
TABLE 3: BENEFICIARY HEADS OF HOUSEHOLDS BY GENDER
Gender
Population Households
Number %Male Headed Households 170,410 44.0
Female Headed Households 216,759 55.9
Not Stated 334 0.1
Total 387,503 100.0
2.2 ProportionofHouseholdswhichBenefittedfromSocialSafetyNetsProgrammesFigure 1 illustrates the proportion of households that acknowledged to have benefitted from the SSNs programmes, showing percentage coverage of each program. The results showed that school feeding covered a large proportion of households at 41.5%. This means that the other 58% of households did not have children attending public or government assisted primary and secondary schools. Vulnerable group feeding, old age pension and Ipelegeng followed with 23.7%, 15.9% and 14.9% coverage respectively. All the other programmes covered below 10% of the households. This may be due to various targeting mechanisms designed for the respective programmes, and, also, that most households do not have individuals eligible for the programmes as most programmes have special eligibility criteria. According to the Social Protection Sector Review (World Bank and BIPDA, 2013), the targeting mechanisms vary for each programme, some programs are universal (orphan care, needy students, school feeding, OAP, Veterans), categorical (VGFP), means-tested (destitute persons, CHBC) and self-selection (Ipelegeng).

Social Safety Nets Stats Brief5 Statistics Botswana
0.00.70.81.11.31.52.0
3.94.2
14.915.9
23.741.5
0.05 .0 10.0 15.0 20.0 25.0 30.0 35.0 40.0 45.0
Wordl War II Veterans AllowanceLivestock Management and
Community Home-Based PackageRemote Area Development Plan
Poverty Eradication ProgramDisability Package Allowance
Orphan Care ProgramNeedy Students PackageDestitute Persons Program
IpelegengOld Age Pension
Vulnerable Group FeedingSchool Feeding
Percentage Contribution
Typ
e o
f SSN
Figure1:ProportionofHouseholdsthatBenefittedfromEachSSN
2.3 ProportionofBeneficiariesbystrataFigure 2 shows the distribution of the social safety nets by strata. The assistance programmes that are more dominant in rural areas include amongst others RADP, poverty eradication programme, LIMID, destitute persons programme and Ipelegeng at 90.8%, 81.8%, 60.8%, 60.1%, & 58.7% respectively. Community home based package, school feeding, vulnerable group feeding and disability package allowances were the leading safety net in urban villages at 47.7%, 46.7%, 44.2% and 40.1% respectively while the dominant programmes in cities/towns includes school feeding, disability package allowance, vulnerable group feeding and orphan care programmes at 16.1%, 15.3%,12.1% and 11.2% respectively . As indicated in table IV in annexure 1, social assistance programmes benefits more households in rural areas as compared to urban areas and cities/towns. The proportion of SSN beneficiaries in rural areas is 68.3%, followed by urban villages and cities/town at 58.9% and 40% respectively. The rural population has consistently been less well-off than the urban population as shown in previous surveys (BCWIS 2009/10 & BMTHS 2015/16).This may explain why social safety nets interventions are dominant in the rural areas.
Figure2:ProportionofHouseholdsthatBenefittedFromEachSSNProgrambyStrata

Social Safety Nets Stats Brief6Statistics Botswana
2.4 Orphan Care ProgrammeWhile all SSNs were included in the survey, more details were covered for the orphan care programme. Below is a detailed analysis of the findings of the survey.
2.4.1 Proportion of Households that Received Orphan Care by StrataFigure 3 shows the proportion of households that benefitted from the orphan care programme. The results indicated that out of a population of 14,696 that benefited from orphan care, 6,844 (50.6%) were from rural areas followed by urban villages and cities/towns at 5,281(39.1%) and 1,389 (10.3%), respectively. Table (III) in annexure 1 further decomposes the orphan care figures by district.
Analysis of the various components of the orphan care programme by strata as presented in table 4 showed that households benefitted more from the food basket including toiletries at 87.9% followed by school uniforms, educational support and casual clothing at 44.1%, 40.8%, and 28.4% respectively. The analysis consistently shows that beneficiary households are dominant in rural areas as compared to urban villages and cities/towns.
Figure3:PercentageHouseholdsThatBeneffitedFromOrphanCareProgrammeByStrata
TABLE 4: PROPORTION OF HOUSEHOLDS THAT BENEFITTED FROM VARIOUS COMPONENTS OF THE ORPHAN CARE PROGRAMME BY STRATA
TYPE OF ORPHAN CARE PROGRAMMECities &
TownsUrban
VillagesRural Areas Total
Food Basket including Toiletries 10.8 38.3 50.9 87.9
School Uniforms 10.4 43.6 46.0 44.1
Educational Support (fees Development/Educational trips) 9.1 37.3 53.6 40.8
Transport to school 32.7 7.6 59.7 8.6
Pocket Money 24.7 39.3 36.0 5.1
Bedding 13.6 15.7 70.7 6.6
Casual Clothing 7.3 44.4 48.3 28.4
Other special needs for special orphan household e.g. health, water connection, rentals, utilities day care fees and all other unclassified cases of needs 0.0 26.6 73.4 2.5
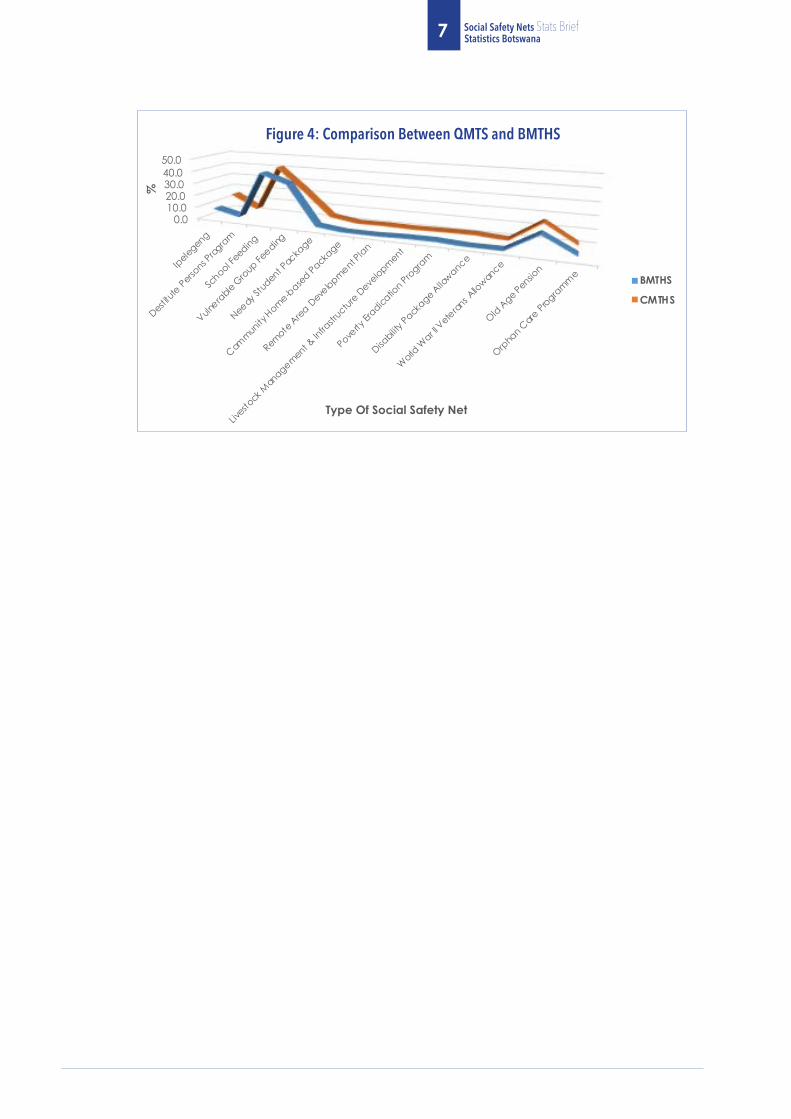
Figure 4 and table (II) in annexure 1 give a general picture of social safety nets coverage over two survey periods, BMTHS 2015/16 and QMTS-Q3-2019. The results show that in both surveys, school feeding covered a large proportion of households with 40.9% for the period 2015/16 and 41.5%in the third quarter of QMTS 2019. In 2015/16 BMTHS, vulnerable group feeding, old age pension and Ipelegeng follow at 33.9%, 14.4%, and 8.0% respectively depicting a similar pattern as in the QMTS with more beneficiary households in rural areas as compared to urban villages and cities/towns.
Social Safety Nets Stats Brief7 Statistics Botswana
Figure 4: Comparison Between QMTS and BMTHS

Social Safety Nets Stats Brief8Statistics Botswana
Annexure 1
TABLE I: NUMBER OF HOUSEHOLDS THAT BENEFITTED FROM VARIOUS TYPES OF ORPHAN CARE PROGRAMME BY STRATA
TYPEOFSOCIALSAFETYNET Cities & towns Urban Villages Rural Areas NationalIpelegeng 9,462 31,620 58,448 99,529
Destitute Persons Program 1,336 9,976 17,040 28,352
School Feeding 44,639 129,775 103,202 277,616
Vulnerable Group Feeding 19,162 70,115 69,207 158,484
Needy Student Package 921 11,221 14,297 26,439
Community Home-Based Package 201 2,477 2,519 5,197
Remote Area Development Plan 0 664 6,577 7,241
Livestock Management & Infrastructure Development 269 1,669 3,012 4,951
Poverty Eradication Program 228 1,350 7,091 8,669
Disability Package Allowance 1,574 4,124 4,578 10,276
World War II Veterans Allowance 0 237 0 237
Old Age Pension 8,662 42,447 55,209 106,318
Orphan Care Programme 1,389 5,281 6,844 13,514
Total Households 148,090 296,489 224,850 669,429
TABLE II: COMPARISON BETWEEN BMTHS AND QMTHS
TYPE OF SSN PROGRAMME
BMTHS past 12 months QMTHS past 3 months
Citie
s &
Town
s
Urb
an
Villa
ges
Rura
l Are
as
Natio
nal
Citie
s &
town
s
Urb
an
Villa
ges
Rura
l Are
as
Natio
nal
Ipelegeng 9.9 33.3 56.8 8.0 9.5 31.8 58.7 14.9
Destitute Persons Program 4.2 34.0 61.8 3.3 4.7 35.2 60.1 4.2
School Feeding 19.0 45.9 35.1 40.9 16.1 46.7 37.2 41.5
Vulnerable Group Feeding 19.9 43.2 36.9 33.9 12.1 44.2 43.7 23.7
Needy Student Package 5.4 44.0 50.5 2.5 3.5 42.4 54.1 3.9
Community Home-Based Package 9.6 24.7 65.7 0.2 3.9 47.7 48.5 0.8
Remote Area Development Plan 0.0 0.0 100.0 0.2 0.0 9.2 90.8 1.1
Livestock Management & Infrastructure Development 7.1 42.2 50.8 1.1 5.4 33.7 60.8 0.7
Poverty Eradication Program 7.9 33.3 58.8 1.3 2.6 15.6 81.8 1.3
Disability Package Allowance . . . . 15.3 40.1 44.6 1.5
World War II Veterans Allowance 4.2 48.2 47.7 0.2 0.0 100.0 0.0 0.0
Old Age Pension 7.2 40.8 52.0 14.4 8.1 39.9 51.9 15.9
Orphan Care Programme 11.3 49.0 39.7 2.5 10.3 39.1 50.6 2.0

Social Safety Nets Stats Brief9 Statistics Botswana
TABLE III: PROPORTION OF HOUSEHOLDS THAT BENEFITTED FROM VARIOUS TYPES OF SSN PROGRAMMES BY STRATA
District name IPEL DPP SF VGFP NSP CHC RADP LIMID PEP DPA WW2 OAP OCP TOTALBorolong 16.2 4.6 52.9 26.6 6.3 0.0 0.5 1.8 4.0 2.8 0.0 27.1 6.1 3.1
Central Bobonong 39.7 7.5 59.4 34.9 9.8 4.3 7.3 0.0 1.0 1.0 0.0 19.5 3.2 3.9
Central Boteti 28.5 8.2 45.0 40.4 14.9 3.1 13.8 3.6 7.0 1.8 0.0 15.7 5.9 3.7
Central Mahalapye 11.3 2.7 43.2 27.9 4.1 0.9 0.0 1.4 3.0 1.6 0.0 25.3 1.4 4.6
Central Tutume 25.4 6.7 55.2 30.7 3.8 0.8 0.6 0.0 1.9 1.0 0.0 26.7 6.3 7.0
Chobe 16.2 2.5 42.9 25.4 0.0 0.0 8.5 0.0 1.2 0.0 0.0 8.9 0.0 1.8
Francistown 9.4 1.8 35.8 13.7 0.6 0.6 0.0 0.6 0.7 2.2 0.0 6.1 2.5 4.8
Gaborone 2.3 0.6 23.1 8.9 0.3 0.0 0.0 0.0 0.0 0.9 0.0 5.5 0.0 12.4
Ghanzi 9.8 3.4 38.8 22.7 3.0 0.8 0.0 0.0 0.0 1.3 0.0 8.9 3.0 1.7
Jwaneng 3.6 0.0 36.3 22.9 0.0 0.0 0.0 0.0 0.0 0.0 0.0 0.0 0.0 1.0
Kgalagadi North 21.5 4.0 42.7 25.0 4.7 0.0 1.1 0.8 0.0 1.1 0.0 15.1 1.3 1.0
Kgalagadi South 26.9 8.1 36.6 17.0 4.3 0.0 1.5 0.0 0.0 1.9 0.0 14.9 8.1 1.0
Kgatleng 5.1 0.8 32.2 19.7 1.0 1.0 0.0 0.0 0.0 1.1 0.0 19.0 0.0 5.4
Kweneng East 10.1 3.2 38.2 19.3 3.6 0.0 0.0 0.2 0.7 1.7 0.0 10.5 0.2 13.0
Kweneng West 26.6 12.6 54.1 36.3 4.4 0.8 0.0 0.8 0.7 1.5 0.0 21.7 1.8 4.4
Lobatse 13.7 0.0 42.6 21.5 1.9 0.0 0.0 0.0 0.0 0.0 0.0 10.8 1.9 1.4
Ngamiland East 16.5 4.1 42.6 25.8 3.5 0.0 0.9 1.8 0.0 1.2 0.0 13.8 2.5 3.1
Ngamiland West 15.5 17.9 66.4 30.0 9.0 0.5 0.0 0.0 0.7 0.0 0.0 16.4 0.7 2.2
Ngwaketse South 12.7 5.4 42.5 17.0 7.4 0.0 0.0 2.0 1.0 3.7 0.0 29.5 2.4 4.8
Ngwaketse West 28.7 10.7 50.5 46.2 11.5 0.0 4.7 1.8 0.0 4.2 0.0 20.7 4.2 0.6
North East 22.7 6.0 48.1 30.0 2.2 5.2 0.0 2.4 3.0 2.0 0.0 33.7 1.6 2.6
Orapa 2.0 0.0 28.8 23.9 0.0 0.0 0.0 2.0 0.0 0.0 0.0 3.9 0.0 0.5
Selibe Phikwe 23.9 2.3 50.0 24.2 2.3 0.0 0.0 0.0 0.0 1.1 0.0 8.2 3.5 1.8
Serowe Palapye 20.2 5.8 49.7 30.1 5.9 0.8 0.0 1.9 3.5 1.3 0.5 24.0 2.8 7.7
South East 9.1 0.4 29.2 25.8 2.1 0.9 0.0 0.0 0.2 2.8 0.0 6.0 0.5 6.4
Sowa 3.4 0.0 37.0 6.9 0.0 0.0 0.0 0.0 0.0 0.0 0.0 1.9 0.0 0.2
TABLE (IV):PROPORTION OF BENEFICIARIES BY STRATA
Cities Urban Villages Rural Areas TotalBeneficiaries by strata 40.0 58.9 68.3 57.9

Social Safety Nets Stats Brief10Statistics Botswana
Annexure 2Quarterly Multi-Topic Survey (QMTS) Questionnaire: SAFETY NETS AND OTHER GOVERNMENT PROGRAMMES MODULE
[7] SAFETY NETS AND OTHER GOVERNMENT PROGRAMMESWho is responding?
In the last 3 months, has any member of your household received cash or other aid from Orphan care programs?
The respondent should be 12 years old or above, desirably the head of the household.
YESNO
1021 Orphan Care Programme: Food basket including toiletries1022 Orphan Care Programme: School uniforms1023 Orphan Care Programme: Educational support (Fees/Development/educational trips)1024 Orphan Care Programme: Transport to school1025 Orphan Care Programme: Pocket money1026 Orphan Care Programme: Bedding1027 Orphan Care Programme: Casual Clothing1028 Orphan Care Programme: PSS Outreach to OVCs and their families through one-on-one or family counselling/interventions, retreats and workshops, psycho education1029 Orphan Care Programme: Facilitation and material support to OVC Special Dispensation to access tertiary and vocational education (Graduated orphans)1030 Orphan Care Programme: Other special needs for special orphan households e.g. health (including reading glasses), water connection, rentals, utilities, Day Care Fees, and all other unclassified cases of needs.
In the last 3 months, has any member of your household received cash or other aid from?
Ask respondent to estimate monetary value if received in kind. Only include if provided by the program or government, NOT paid by the household.
YESNO
0101 Ipelegeng0103 Destitute Persons Programme0104 Vulnerable Groups Feeding Program0105 School Feeding (Government schools)0106 Needy student package0107 Community Home-based Care0108 Remote Area Development Program (RADP)0109 Livestock Management and Infrastructure Development (Specify project)0110 Poverty Eradication Programme (Specify project)0111 Disability Package Allowance0112 World War II Veteran’s Allowance0113 Old age pension

Social Safety Nets Stats Brief11 Statistics Botswana
References
Ministry of Local Government Lands and Housing: Short Term of Action on Care of Orphans in Botswana 1999-2001
Ministry of Agriculture: Livestock Management and Infrastructure Development (Phase II) Programme 2010

Private Bag 0024, Gaborone Tel: 3671300 Fax: 3952201 Toll Free: 0800 600 200
Private Bag F193, Francistown Botswana Tel. 241 5848, Fax. 241 7540
Private Bag 32 GhanziTel: 371 5723 Fax: 659 7506
Private Bag 47MaunTel: 371 5716 Fax: 686 4327
E-mail: [email protected]
Website: http://www.statsbots.org.bw