"social networks." (u. brandes, l. c. freeman and d. wagner)
TRANSCRIPT

26Social Networks
Ulrik BrandesUniversity of Konstanz
Linton C. FreemanUniversity of California, Irvine
Dorothea WagnerKarlsruhe Institute of
Technology
26.1 Social Network Analysis . . . . . . . . . . . . . . . . . . . . . . . . . . . . . . . . . . . 80326.2 Visualization Principles . . . . . . . . . . . . . . . . . . . . . . . . . . . . . . . . . . . 805
Illustrative Example • Substance, Design, Algorithm
26.3 Substance-based Designs . . . . . . . . . . . . . . . . . . . . . . . . . . . . . . . . . . 808Prominence • Cohesion • Two-mode networks • Dynamics
26.4 Trends and Challenges. . . . . . . . . . . . . . . . . . . . . . . . . . . . . . . . . . . . . 825References . . . . . . . . . . . . . . . . . . . . . . . . . . . . . . . . . . . . . . . . . . . . . . . . . . . . . . . . . . 826
Social networks provide a rich source of graph drawing problems, because they appear in anincredibly wide variety of forms and contexts. After sketching the scope of social networkanalysis, we establish some general principles for social network visualization before finallyreviewing applications of, and challenges for, graph drawing methods in this area. Otheraccounts more generally relating to the status of visualization in social network analysis aregiven, e.g., in [Klo81, BKR+99, Fre00, Fre05, BKR06]. Surveys that are more comprehensiveon information visualization approaches, interaction, and network applications from socialmedia are given in [CM11, RF10, CY10].
26.1 Social Network Analysis
The fundamental assumption underlying social network theory is the idea that seeminglyautonomous individuals and organizations are in fact embedded in social relations andinteractions [BMBL09]. The term social network was coined to delineate the relationalperspective from other research traditions on social groups and social categories [Bar54].
In general, a social network consists of actors (e.g., persons, organizations) and someform of (often, but not necessarily: social) relation among them. The network structureis usually modeled as a graph, in which vertices represent actors, and edges represent ties,i.e., the existence of a relation between two actors. Since traits of actors and ties may beimportant, both vertices and edges can have a multitude of attributes. We will use graphterminology for everything relating to the data model, and social network terminology whenreferring to substantive aspects.
While attributed graph models are indeed at the heart of formal treatments, it is worthnoting that theoretically justified data models are not as obvious as it may seem [But09].In fact, social network analysis is maturing into a paradigm of distinct structural theoriesand associated relational methods. General introductions and methodological overviewscan be found in [WB88, WF94, Sco00, CSW05, BE05], a historic account in [Fre04a], anda comprehensive collection of influential articles in [Fre08].
803
804 CHAPTER 26. SOCIAL NETWORKS
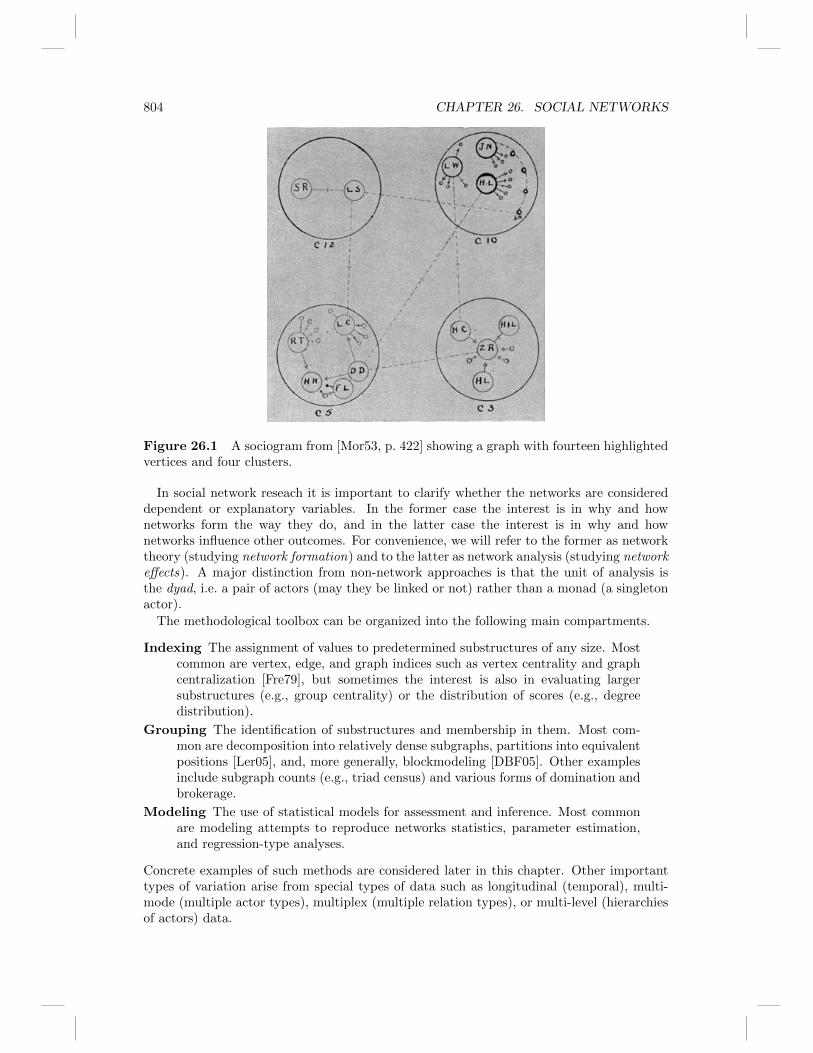
Figure 26.1 A sociogram from [Mor53, p. 422] showing a graph with fourteen highlightedvertices and four clusters.
In social network reseach it is important to clarify whether the networks are considereddependent or explanatory variables. In the former case the interest is in why and hownetworks form the way they do, and in the latter case the interest is in why and hownetworks influence other outcomes. For convenience, we will refer to the former as networktheory (studying network formation) and to the latter as network analysis (studying networkeffects). A major distinction from non-network approaches is that the unit of analysis isthe dyad, i.e. a pair of actors (may they be linked or not) rather than a monad (a singletonactor).
The methodological toolbox can be organized into the following main compartments.
Indexing The assignment of values to predetermined substructures of any size. Mostcommon are vertex, edge, and graph indices such as vertex centrality and graphcentralization [Fre79], but sometimes the interest is also in evaluating largersubstructures (e.g., group centrality) or the distribution of scores (e.g., degreedistribution).
Grouping The identification of substructures and membership in them. Most com-mon are decomposition into relatively dense subgraphs, partitions into equivalentpositions [Ler05], and, more generally, blockmodeling [DBF05]. Other examplesinclude subgraph counts (e.g., triad census) and various forms of domination andbrokerage.
Modeling The use of statistical models for assessment and inference. Most commonare modeling attempts to reproduce networks statistics, parameter estimation,and regression-type analyses.
Concrete examples of such methods are considered later in this chapter. Other importanttypes of variation arise from special types of data such as longitudinal (temporal), multi-mode (multiple actor types), multiplex (multiple relation types), or multi-level (hierarchiesof actors) data.
26.2. VISUALIZATION PRINCIPLES 805
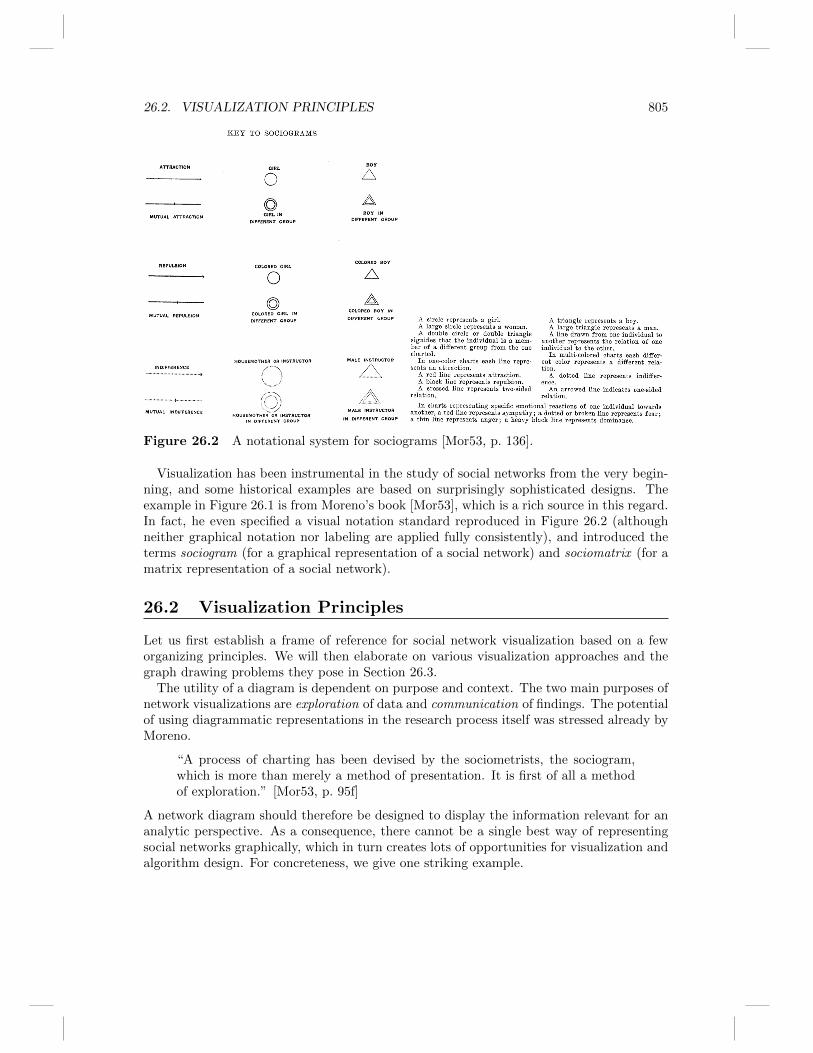
Figure 26.2 A notational system for sociograms [Mor53, p. 136].
Visualization has been instrumental in the study of social networks from the very begin-ning, and some historical examples are based on surprisingly sophisticated designs. Theexample in Figure 26.1 is from Moreno’s book [Mor53], which is a rich source in this regard.In fact, he even specified a visual notation standard reproduced in Figure 26.2 (althoughneither graphical notation nor labeling are applied fully consistently), and introduced theterms sociogram (for a graphical representation of a social network) and sociomatrix (for amatrix representation of a social network).
26.2 Visualization Principles
Let us first establish a frame of reference for social network visualization based on a feworganizing principles. We will then elaborate on various visualization approaches and thegraph drawing problems they pose in Section 26.3.
The utility of a diagram is dependent on purpose and context. The two main purposes ofnetwork visualizations are exploration of data and communication of findings. The potentialof using diagrammatic representations in the research process itself was stressed already byMoreno.
“A process of charting has been devised by the sociometrists, the sociogram,which is more than merely a method of presentation. It is first of all a methodof exploration.” [Mor53, p. 95f]
A network diagram should therefore be designed to display the information relevant for ananalytic perspective. As a consequence, there cannot be a single best way of representingsocial networks graphically, which in turn creates lots of opportunities for visualization andalgorithm design. For concreteness, we give one striking example.

806 CHAPTER 26. SOCIAL NETWORKS
26.2.1 Illustrative Example
The following social network study [Kra96] has been used for the same purpose severaltimes [BRW01, Bra08]. The study was conducted in an internal auditing unit of a largeindustrial company when organizational changes introduced by the newly assigned managerdid not improve the unit’s performance.
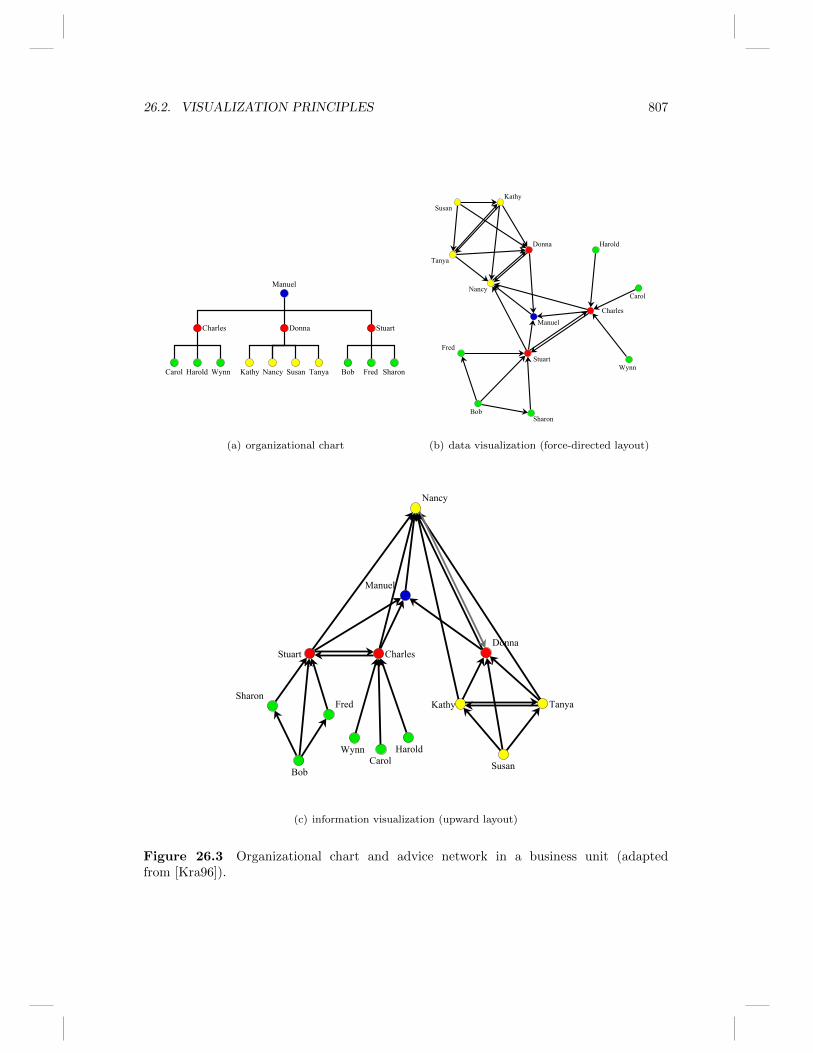
The formal hierarchy is shown in Figure 26.3(a), where made-up names are used toidentify employees. To assess the internal functioning of the group, employees were askedwho they would turn to for work related questions. The data obtained is an asymmetricadvice network,
Manuel . 0 0 0 0 0 0 0 0 0 0 1 0 0 managerCharles 1 . 0 1 0 0 0 0 0 0 0 1 0 0Donna 1 0 . 0 0 0 0 0 0 0 0 1 0 0 supervisorsStuart 1 1 0 . 0 0 0 0 0 0 0 1 0 0
Bob 0 0 0 1 . 0 1 0 1 0 0 0 0 0Carol 0 1 0 0 0 . 0 0 0 0 0 0 0 0Fred 0 0 0 1 0 0 . 0 0 0 0 0 0 0
Harold 0 1 0 0 0 0 0 . 0 0 0 0 0 0 auditorsSharon 0 0 0 1 0 0 0 0 . 0 0 0 0 0Wynn 0 1 0 0 0 0 0 0 0 . 0 0 0 0Kathy 0 0 1 0 0 0 0 0 0 0 . 1 0 1Nancy 0 0 1 0 0 0 0 0 0 0 0 . 0 0Susan 0 0 1 0 0 0 0 0 0 0 1 0 . 1 secretariesTanya 0 0 1 0 0 0 0 0 0 0 1 1 0 .
and the resulting directed network is shown in Figure 26.3(b). While the data is representedwith clarity, there are no obvious implications. The situation becomes much more compre-hensible when we understand that the rationale for looking at the advice network is theidentification of an informal work hierarchy. Rearranging the vertices such that a maximumnumber of edges is directed upwards (and thus aligns with what can be assumed to be aninformal work hierarchy) as in Figure 26.3(c) yields a strikingly clear picture with a singlerelation not in accordance with the informal hierarchy (but the formal): everyone, directlyor indirectly, and including the manager himself, is seeking advice from Nancy, a secretarythat was dismissive of the changes introduced. (Of course, after seeing a picture similarto this, the manager sat down with her, discussed her reservations and made sure that sheunderstood his good intentions and the long-term benefits of his plans, thus turning thesituation around.)
26.2.2 Substance, Design, Algorithm
The example above illustrates the importance of considering three key aspects in socialnetwork visualization [BKR+99].
Substance In general, the information to be conveyed in a network visualization ismore than just the underlying graph. The substantive interest of those whocollected network data typically necessitates the inclusion of attributes. More-over, additional data may have been generated as the result of an analysis. Inthe above example, the substance of interest is the informal hierarchy within abusiness unit, and only by considering it in the design of the visualization, thediagram becomes informative. Through the appreciation of relevant substance,i.e. the application-specific contexts and interests, data visualizations are turnedinto information visualizations.
26.2. VISUALIZATION PRINCIPLES 807
TanyaSusanNancy
Stuart Donna Charles
Fred SharonBobKathyCarol WynnHarold
Manuel
(a) organizational chart
Tanya
Susan
Nancy
Stuart
Donna
Charles
Fred
Sharon Bob
Kathy
Carol
Wynn
Harold
Manuel
(b) data visualization (force-directed layout)
Tanya
Susan
Nancy
Stuart Donna
Charles
FredSharon
Bob
Kathy
Carol Wynn Harold
Manuel
(c) information visualization (upward layout)
Figure 26.3 Organizational chart and advice network in a business unit (adaptedfrom [Kra96]).
808 CHAPTER 26. SOCIAL NETWORKS
Design Visualization design is the specification of a mapping from an informationspace to its graphical representation. The core choices are in assigning graphicalelements such as points, lines, and areas to data objects, and in defining theirgraphical attributes such as position, shape, size, color, and so on such that theinformation is perceived correctly (effectiveness) and with low cognitive effort(efficiency).Many overlapping and contradicting criteria need to be considered. In particu-lar, Tufte advocates general information design criteria such as parsimony andaccuracy [Tuf83, p. 51]. An important readability criterion is the avoidance ofcrossings [PCJ97], although finer distinctions may require more research: in astatement on the accurate representation of substance,
“The simplest, most efficient construction is one which presents thefewest meaningless intersections, while preserving the groupings, op-positions, or potential orders contained in the component. . . ” [Ber83,p. 271],
Bertin acknowledges implicitly that crossings may also be meaningful. The effi-ciency of information visualizations, and network visualizations in particular, isa wide open field. A recent suggestion includes the assessment of cognitive loadin user studies [HEH09].
Algorithm Suitable design is not necessarily realizable. Locally plausible designchoices such as certain desired edge lengths may be interdependent and evencontradicting. In the advice network example, the goal to direct as many edgesupward as possible corresponds to an NP-hard problem (FEEDBACK ARCSET) and may have multiple solutions of which a visualization will representonly one. Approximate solutions and non-representative solutions are highlyproblematic. If the advice network had been a directed cycle, all cyclic permuta-tions represent equally good solutions to the upward drawing problem, becauseonly one edge is pointing downward. Since each time a different actor ends up ontop and only one such permutation is represented, the drawing provides a ratherselective perspective. This is of course not due to the computational complexityof reversing the least number of edges; even if the advice network has an acyclicunderlying graph, the vertical order is not defined uniquely. Note that in Fig-ure 26.3(c), all secretaries could have been placed higher than the supervisors ofthe two auditing teams without reversing an edge.Computational complexity as well as existence of solutions, their non-uniqueness,and the possibility of artifacts therefore place major restrictions on possible de-signs.
The richness of substantive interests and the need for substance-based designs thus createsimmense potential for graph layout algorithms tailored to social networks.
26.3 Substance-based Designs
Depending on data, substantive interest, and presentation context, very different designsare required for effective and efficient exploration and communication of social networkinformation. Depending on the point of view, this is either a major burden or a horn ofplenty for algorithmic and design challenges.
In this section, we review examples of substance-based designs and corresponding graphdrawing approaches to demonstrate the richness of both, existing approaches and open
26.3. SUBSTANCE-BASED DESIGNS 809
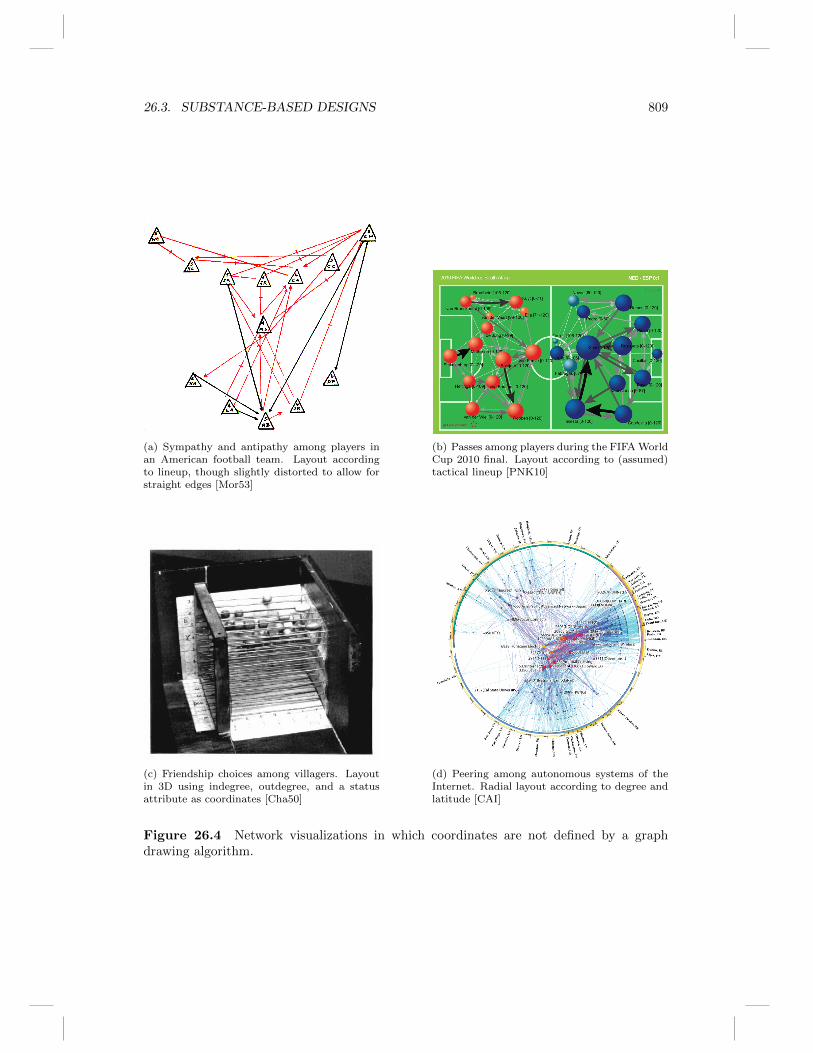
(a) Sympathy and antipathy among players inan American football team. Layout accordingto lineup, though slightly distorted to allow forstraight edges [Mor53]
(b) Passes among players during the FIFA WorldCup 2010 final. Layout according to (assumed)tactical lineup [PNK10]
(c) Friendship choices among villagers. Layoutin 3D using indegree, outdegree, and a statusattribute as coordinates [Cha50]
(d) Peering among autonomous systems of theInternet. Radial layout according to degree andlatitude [CAI]
Figure 26.4 Network visualizations in which coordinates are not defined by a graphdrawing algorithm.

810 CHAPTER 26. SOCIAL NETWORKS
problems. Our selection of examples is, of course, heavily biased by their algorithmicinterestingness. Figure 26.4 shows examples for designs we have excluded, because they donot require graph layout algorithms (although labeling and edge routing may be an issue).
We concentrate on two important analytical concepts (prominence and cohesion), andtwo data categories (two-mode and dynamic data). The designs we deal with are largelybased on intuition and plausibility rather than perceptual and cognitive theories and empir-ical evidence. Among the few attempts to evaluate effectiveness and efficiency of networkvisualization design are [Win94, PCJ97, MBK97, HHE07, HEH09].
26.3.1 Prominence
Prominence indices p : V → R≥0 are used to rank the vertices V according to theirstructural importance [KB83]. Since there is no unanimity about their conceptual founda-tions [Fre79, Fri91], numerous such indices exist, and their properties vary tremendously. Al-though terminology is not well-defined and more refined classifications exist [Bor05, BE06],we distinguish only two groups based on geometric metaphors frequently invoked in theirinterpretation.
Status
It is commonplace to differentiate status into “high” and “low,” so that it seemsalmost mandatory to exploit this geometric interpretation for network visualizations. Notsurprisingly, the apparent correspondence between substantive and geometric intuition hasbeen used in the design of network diagrams already in times when no layout algorithmswere available to social scientists. Figure 26.5 shows two historic examples, one with anextrinsic status attribute, and another with an intrinsic, structural one.
The advice network used for illustration above is an example in which a status hierarchyis conceived as emerging from an informal advice-seeking relation. Indeed, status is oftenanalyzed in networks with directed edges, and because of how status indices are defined, thedirection of an edge is generally aligned with the difference in status between the endpoints.
The simplest example of a structural status index is indegree, which was generalized innumerous ways. Katz [Kat53], for instance, defines status by taking into account all directedwalks ending at a vertex. the status of a vertex v ∈ V in a graph G = (V,E) is defined byp(v) =
∑u∈V
(∑∞k=1(αA)k
)uv
, where 1/α, 0 < α < 1, is an attenuation factor, and A the
adjacency matrix of G. Recall that the entries (Ak)uv give the number of walks of length kfrom vertex u to vertex v. Clearly, we obtain the same ranking as with indegree for verysmall α, and attentuation must be large enough to make sure that the sum converges.
A natural class of layout algorithms that can be adapted for status drawings is theso-called Sugiyama framework, which is described in detail in Chapter 13. Its use wasproposed in [BRW01], where the instantiation employs one-dimensional clustering of statusscores for layer asignment and standard approaches for crossing reduction and horizontalcoordinate assignment. Clustering is necessary since vertical coordinates are fixed anddifferences can be quite small, resulting in very close layers between which edges run almosthorizontally. However, clustering worsens another, more general, open problem, namelyhow to accomodate intra-layer edges in layered layouts.
Two different approaches are less sensitive to this kind of problem and in addition morescalable. The first and simpler one is to fix y-coordinates and to determine the x-coordinatesusing a one-dimensional layout algorithm [BC03b], possibly taking the fixed dimension intoaccount [KH05]. The second, more flexible, and likely to be more effective one is based onconstrained optimization of stress using a gradient projection method [DKM09].

26.3. SUBSTANCE-BASED DESIGNS 811
(a) extrinsically defined status [Why43]
(b) structurally defined status [Nor54]
Figure 26.5 Two status diagrams using the high-low metaphor.
812 CHAPTER 26. SOCIAL NETWORKS
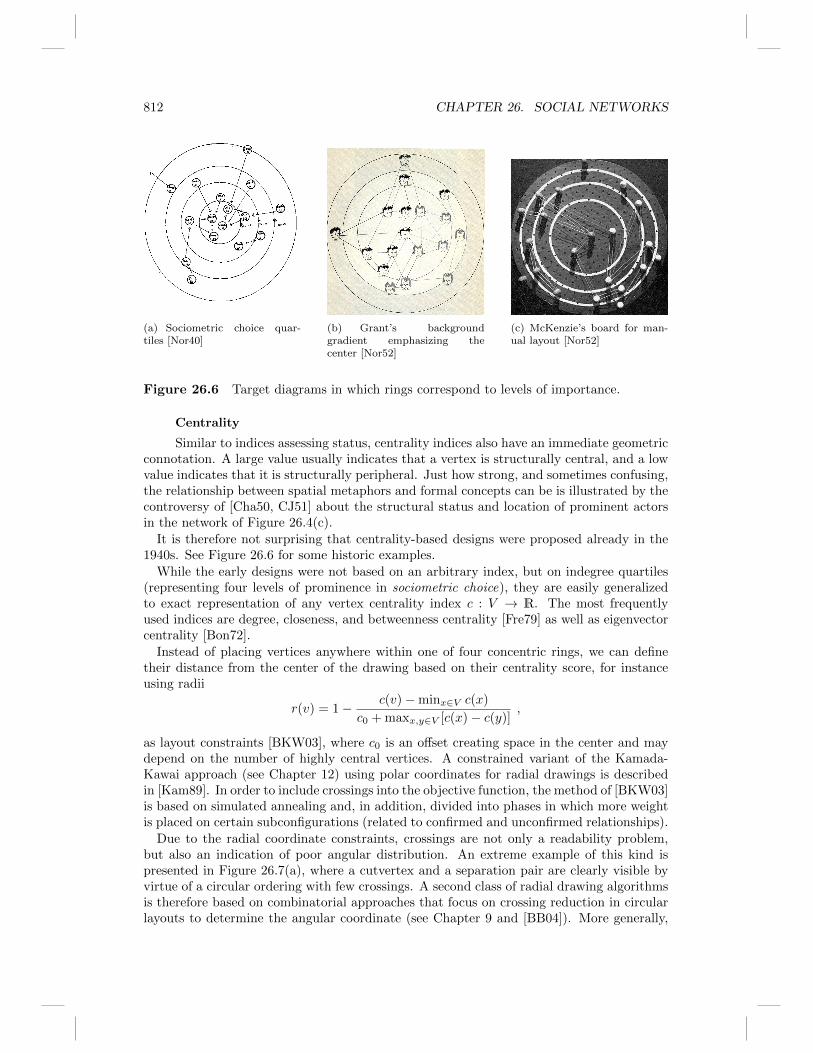
(a) Sociometric choice quar-tiles [Nor40]
(b) Grant’s backgroundgradient emphasizing thecenter [Nor52]
(c) McKenzie’s board for man-ual layout [Nor52]
Figure 26.6 Target diagrams in which rings correspond to levels of importance.
Centrality
Similar to indices assessing status, centrality indices also have an immediate geometricconnotation. A large value usually indicates that a vertex is structurally central, and a lowvalue indicates that it is structurally peripheral. Just how strong, and sometimes confusing,the relationship between spatial metaphors and formal concepts can be is illustrated by thecontroversy of [Cha50, CJ51] about the structural status and location of prominent actorsin the network of Figure 26.4(c).
It is therefore not surprising that centrality-based designs were proposed already in the1940s. See Figure 26.6 for some historic examples.
While the early designs were not based on an arbitrary index, but on indegree quartiles(representing four levels of prominence in sociometric choice), they are easily generalizedto exact representation of any vertex centrality index c : V → R. The most frequentlyused indices are degree, closeness, and betweenness centrality [Fre79] as well as eigenvectorcentrality [Bon72].
Instead of placing vertices anywhere within one of four concentric rings, we can definetheir distance from the center of the drawing based on their centrality score, for instanceusing radii
r(v) = 1− c(v)−minx∈V c(x)
c0 + maxx,y∈V [c(x)− c(y)],
as layout constraints [BKW03], where c0 is an offset creating space in the center and maydepend on the number of highly central vertices. A constrained variant of the Kamada-Kawai approach (see Chapter 12) using polar coordinates for radial drawings is describedin [Kam89]. In order to include crossings into the objective function, the method of [BKW03]is based on simulated annealing and, in addition, divided into phases in which more weightis placed on certain subconfigurations (related to confirmed and unconfirmed relationships).
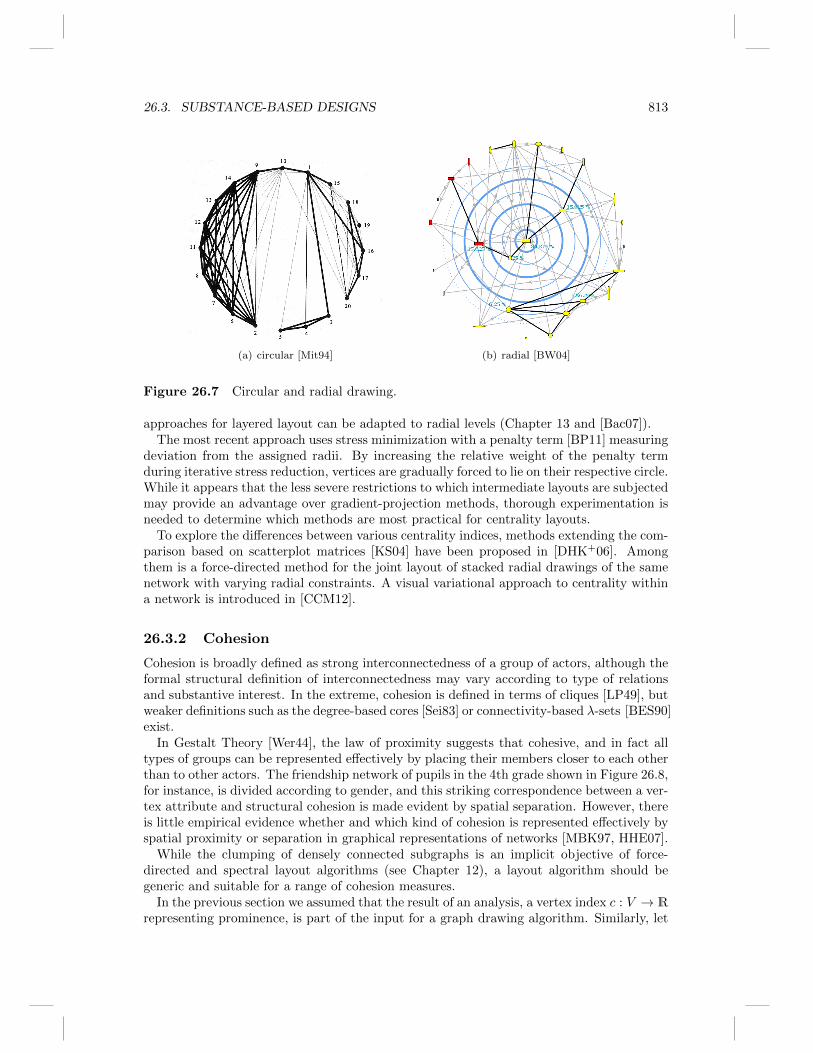
Due to the radial coordinate constraints, crossings are not only a readability problem,but also an indication of poor angular distribution. An extreme example of this kind ispresented in Figure 26.7(a), where a cutvertex and a separation pair are clearly visible byvirtue of a circular ordering with few crossings. A second class of radial drawing algorithmsis therefore based on combinatorial approaches that focus on crossing reduction in circularlayouts to determine the angular coordinate (see Chapter 9 and [BB04]). More generally,
26.3. SUBSTANCE-BASED DESIGNS 813
(a) circular [Mit94] (b) radial [BW04]
Figure 26.7 Circular and radial drawing.
approaches for layered layout can be adapted to radial levels (Chapter 13 and [Bac07]).The most recent approach uses stress minimization with a penalty term [BP11] measuring
deviation from the assigned radii. By increasing the relative weight of the penalty termduring iterative stress reduction, vertices are gradually forced to lie on their respective circle.While it appears that the less severe restrictions to which intermediate layouts are subjectedmay provide an advantage over gradient-projection methods, thorough experimentation isneeded to determine which methods are most practical for centrality layouts.
To explore the differences between various centrality indices, methods extending the com-parison based on scatterplot matrices [KS04] have been proposed in [DHK+06]. Amongthem is a force-directed method for the joint layout of stacked radial drawings of the samenetwork with varying radial constraints. A visual variational approach to centrality withina network is introduced in [CCM12].
26.3.2 Cohesion
Cohesion is broadly defined as strong interconnectedness of a group of actors, although theformal structural definition of interconnectedness may vary according to type of relationsand substantive interest. In the extreme, cohesion is defined in terms of cliques [LP49], butweaker definitions such as the degree-based cores [Sei83] or connectivity-based λ-sets [BES90]exist.
In Gestalt Theory [Wer44], the law of proximity suggests that cohesive, and in fact alltypes of groups can be represented effectively by placing their members closer to each otherthan to other actors. The friendship network of pupils in the 4th grade shown in Figure 26.8,for instance, is divided according to gender, and this striking correspondence between a ver-tex attribute and structural cohesion is made evident by spatial separation. However, thereis little empirical evidence whether and which kind of cohesion is represented effectively byspatial proximity or separation in graphical representations of networks [MBK97, HHE07].
While the clumping of densely connected subgraphs is an implicit objective of force-directed and spectral layout algorithms (see Chapter 12), a layout algorithm should begeneric and suitable for a range of cohesion measures.
In the previous section we assumed that the result of an analysis, a vertex index c : V → R
representing prominence, is part of the input for a graph drawing algorithm. Similarly, let

814 CHAPTER 26. SOCIAL NETWORKS
Figure 26.8 Friendship network of a 4th grade school class [Mor53, p. 163]. For graphicalnotation see Figure 26.2; note, though, the horizontal line delineating the class and themissing tick on the edge between NS and MP. The strong homophily effect is conveyedeffectively through spatial separation.
us now assume that a cohesion analysis resulted in a decomposition that can be describedin the following way.
A (hierarchically) clustered graph (G,T ) is a graph G = (V,E) together with a rootedtree T , the cluster tree, such that the leaves of T correspond to a partition of V and eachinner node is the union of the vertex sets of its children. Consequently, the root correspondsto the entire vertex set V . A clustered graph (G,T ) is called flat, if T has height one, i.e.it is equivalent to a graph G = (V,E) together with a partition of V .
Note that cohesion analysis may result in other types of data. But one example are setcovers of the vertices, which can be viewed as flat clustered graphs with overlapping clusters.They are equivalent to hypergraphs, which in turn are treated in Section 26.3.3.
Clustered drawings
In an inclusion drawing of a (cluster) tree, vertices are represented as areas, and theparent-child relation is represented by area inclusion. A straightforward representation ofclustered graphs consists of an inclusion drawing of the cluster tree overlayed on a drawingof the underlying graph such that vertices are inside their cluster boundaries and edges crosscluster boundaries at most once. Such a representation is called a clustered drawing , andat least topologically implements the idea that vertices of the same group belong together.Figures 26.1 and 26.9 provide examples.
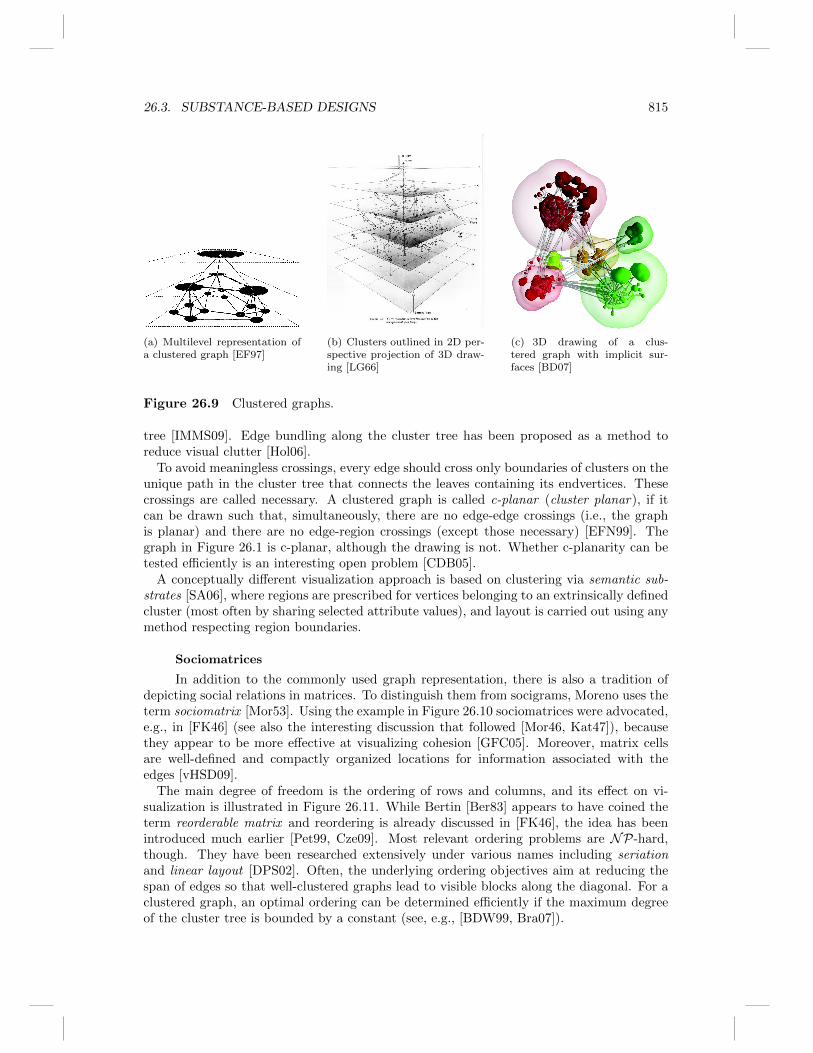
Often, especially when the notion of cohesion and the implicit criteria of general layoutalgorithms coincide sufficiently well, clustered drawings are obtained by adding boundarycurves to a layout obtained without consideration of the cluster tree. A typical exampleis the application of multidimensional scaling to a distance matrix with the addition ofhierarchical clusters based on connectedness as shown in Figure 26.9(b).
Multidimensional scaling based on stress minimization and, in fact, all force-directed ap-proaches can be customized to clustered graphs by adding cluster vertices that are connectedto cluster members via short edges, and to other cluster vertices via long edges or even re-pulsion (e.g., [WM96, PNR08]). Alternatively, cohesion-based proximity can be ensured bya combination of space-filling and force-directed techniques that explictly consider a cluster
26.3. SUBSTANCE-BASED DESIGNS 815
(a) Multilevel representation ofa clustered graph [EF97]
(b) Clusters outlined in 2D per-spective projection of 3D draw-ing [LG66]
(c) 3D drawing of a clus-tered graph with implicit sur-faces [BD07]
Figure 26.9 Clustered graphs.
tree [IMMS09]. Edge bundling along the cluster tree has been proposed as a method toreduce visual clutter [Hol06].
To avoid meaningless crossings, every edge should cross only boundaries of clusters on theunique path in the cluster tree that connects the leaves containing its endvertices. Thesecrossings are called necessary. A clustered graph is called c-planar (cluster planar), if itcan be drawn such that, simultaneously, there are no edge-edge crossings (i.e., the graphis planar) and there are no edge-region crossings (except those necessary) [EFN99]. Thegraph in Figure 26.1 is c-planar, although the drawing is not. Whether c-planarity can betested efficiently is an interesting open problem [CDB05].
A conceptually different visualization approach is based on clustering via semantic sub-strates [SA06], where regions are prescribed for vertices belonging to an extrinsically definedcluster (most often by sharing selected attribute values), and layout is carried out using anymethod respecting region boundaries.
Sociomatrices
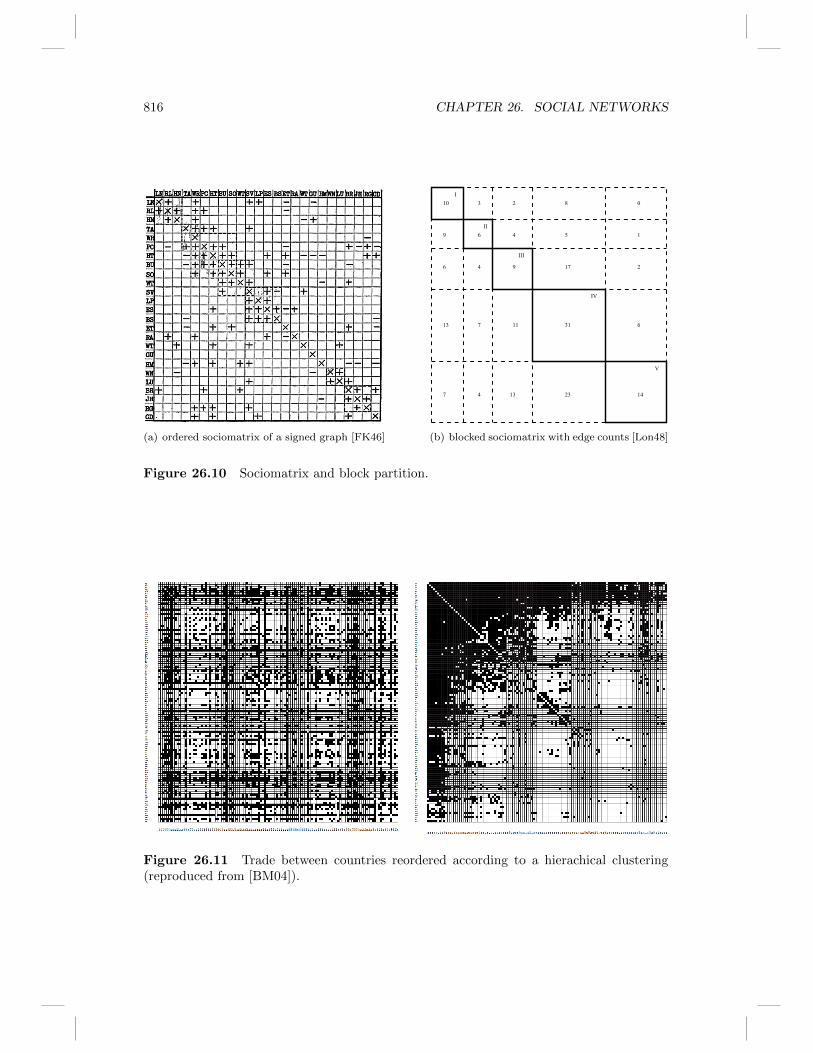
In addition to the commonly used graph representation, there is also a tradition ofdepicting social relations in matrices. To distinguish them from socigrams, Moreno uses theterm sociomatrix [Mor53]. Using the example in Figure 26.10 sociomatrices were advocated,e.g., in [FK46] (see also the interesting discussion that followed [Mor46, Kat47]), becausethey appear to be more effective at visualizing cohesion [GFC05]. Moreover, matrix cellsare well-defined and compactly organized locations for information associated with theedges [vHSD09].
The main degree of freedom is the ordering of rows and columns, and its effect on vi-sualization is illustrated in Figure 26.11. While Bertin [Ber83] appears to have coined theterm reorderable matrix and reordering is already discussed in [FK46], the idea has beenintroduced much earlier [Pet99, Cze09]. Most relevant ordering problems are NP-hard,though. They have been researched extensively under various names including seriationand linear layout [DPS02]. Often, the underlying ordering objectives aim at reducing thespan of edges so that well-clustered graphs lead to visible blocks along the diagonal. For aclustered graph, an optimal ordering can be determined efficiently if the maximum degreeof the cluster tree is bounded by a constant (see, e.g., [BDW99, Bra07]).
816 CHAPTER 26. SOCIAL NETWORKS
(a) ordered sociomatrix of a signed graph [FK46]
3 2 8 0
4 9 17 2
7 11 31 6
4 13 23 147
13
6
9
10
6 4 5 1
I
II
III
IV
V
(b) blocked sociomatrix with edge counts [Lon48]
Figure 26.10 Sociomatrix and block partition.
Figure 26.11 Trade between countries reordered according to a hierachical clustering(reproduced from [BM04]).
26.3. SUBSTANCE-BASED DESIGNS 817
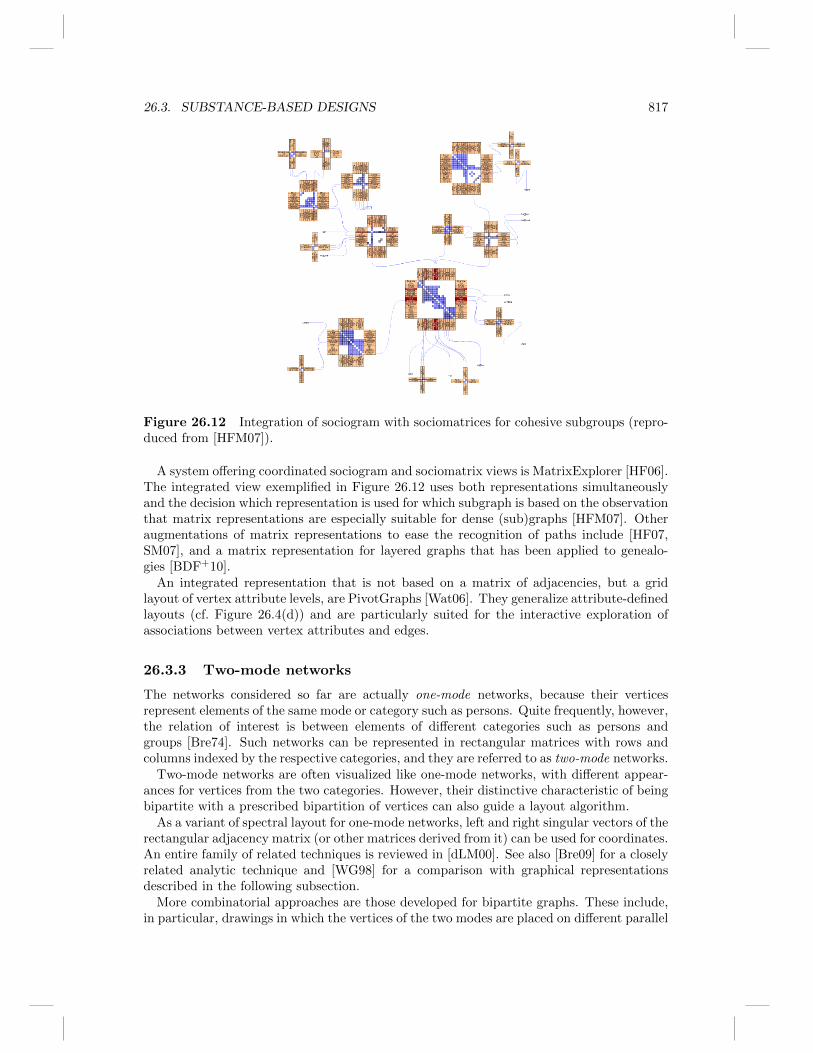
Figure 26.12 Integration of sociogram with sociomatrices for cohesive subgroups (repro-duced from [HFM07]).
A system offering coordinated sociogram and sociomatrix views is MatrixExplorer [HF06].The integrated view exemplified in Figure 26.12 uses both representations simultaneouslyand the decision which representation is used for which subgraph is based on the observationthat matrix representations are especially suitable for dense (sub)graphs [HFM07]. Otheraugmentations of matrix representations to ease the recognition of paths include [HF07,SM07], and a matrix representation for layered graphs that has been applied to genealo-gies [BDF+10].
An integrated representation that is not based on a matrix of adjacencies, but a gridlayout of vertex attribute levels, are PivotGraphs [Wat06]. They generalize attribute-definedlayouts (cf. Figure 26.4(d)) and are particularly suited for the interactive exploration ofassociations between vertex attributes and edges.
26.3.3 Two-mode networks
The networks considered so far are actually one-mode networks, because their verticesrepresent elements of the same mode or category such as persons. Quite frequently, however,the relation of interest is between elements of different categories such as persons andgroups [Bre74]. Such networks can be represented in rectangular matrices with rows andcolumns indexed by the respective categories, and they are referred to as two-mode networks.
Two-mode networks are often visualized like one-mode networks, with different appear-ances for vertices from the two categories. However, their distinctive characteristic of beingbipartite with a prescribed bipartition of vertices can also guide a layout algorithm.
As a variant of spectral layout for one-mode networks, left and right singular vectors of therectangular adjacency matrix (or other matrices derived from it) can be used for coordinates.An entire family of related techniques is reviewed in [dLM00]. See also [Bre09] for a closelyrelated analytic technique and [WG98] for a comparison with graphical representationsdescribed in the following subsection.
More combinatorial approaches are those developed for bipartite graphs. These include,in particular, drawings in which the vertices of the two modes are placed on different parallel

818 CHAPTER 26. SOCIAL NETWORKS
Figure 26.13 A two-mode network with straight-line edges drawn between attribute ta-bles of the two node sets, and its one-mode projections drawn with curved edges on thesides (reproduced from [SJUS08]).
lines (2-level drawings) or, more generally, in separable regions. As usual, graph drawingresearch in this area has focused on conditions under which the resulting drawings can bemade planar [Bie98, BKM98, CSW04, DGGL08] and on the difficulty of crossing minimiza-tion [ZSE05]. It would be interesting to identify criteria for informative visualization ofbipartite graphs.
An example of several methods combining ideas of spatial separation and relative place-ment are the anchored maps of [Mis07]. While one set of the bipartition is arranged on acircle, vertices in the other are placed relative to their neighbors. An interesting mixture of2-layer drawing and tabular representation is exemplified in Figure 26.13.
Hypergraphs
If it makes sense to consider the elements of one of the two modes as subsets of theother (as with groups and persons such as company boards and directors), a two-modenetwork can be treated as a hypergraph. In addition to those associated with the abovebipartite graph model, several other graphical representations are available.
A straightforward variant is the edge standard, which is based on an ordinary layout ofthe bipartite graph representation of the hypergraph, but with a different rendering of theinduced star subgraphs that represent hyperedges. This star may be substituted for a treeto shorten the total length of the hyperedge. For directed hypergraphs, layout constraintscan be used to enable directed edges to be rendered confluently [Mak90].
Subdivision drawings [KvKS09] are subdivisions of the plane such that each vertex cor-responds to a region and the set of regions corresponding to a hyperedge is connected.This requires that the hypergraph has a planar support, i.e. the existence of a planargraph on the same vertices such that each of the hyperedges of the original hypergraphinduces a connected subgraph. Deciding whether a hypergraph has a planar support isNP-complete [JP87]. Tree supports, on the other hand, are characterized by the existenceof an elimination ordering in which vertices contained in only one hyperedge, or in a subsetof the hyperedges containing some other vertex, are removed iteratively. The main open

26.3. SUBSTANCE-BASED DESIGNS 819
Figure 26.14 Post-hoc delineation of clusters with polygons (reproduced from [JK04]).
problem is whether the existence of an outerplanar support can be decided in polynomialtime [BvKM+10, BCPS11a]. Supports with more restrictive constraints on the subgraphsinduced by hyperedges are introduced in [BCPS11b].
The more general subset standard yields drawings also known as Euler diagrams [RZF08].Each hyperedge is represented as a simple closed curve containing exactly the verticesof that edge. Note that this is also the usual convention for cluster boundaries in flatoverlapping clustered graphs [DGL08]. For the example in Figure 26.14, cluster boundarieswere drawn as convex polygons simply after the underlying graph had been laid out [JK04].A more comprehensive postprocessing approach is proposed in [CPC09], and a restrictedvariant in which hyperedges are drawn as paths through already placed vertices is studiedin [ARRC11]. The resulting visualization look similar to the familiar metro map designs,and indeed layout algorithms for metro maps can be used to draw hypergraphs by firstordering the vertices in each hyperedge [Wol07].
As is common for problems that are difficult on general instances, many variant force-directed approaches have been devised [BE00, OS07, ST10, SAA09, KZ09]. While mostapproaches are based on dummy vertices and/or additional forces for the hyperedges, theapproach of [SAA09] is based on the intersection graph, which is a line graph of the hyper-graph. It is constructed by creating a vertex for each hyperedge and an edge between anytwo of them, if the corresponding hyperedges overlap.
Lattices
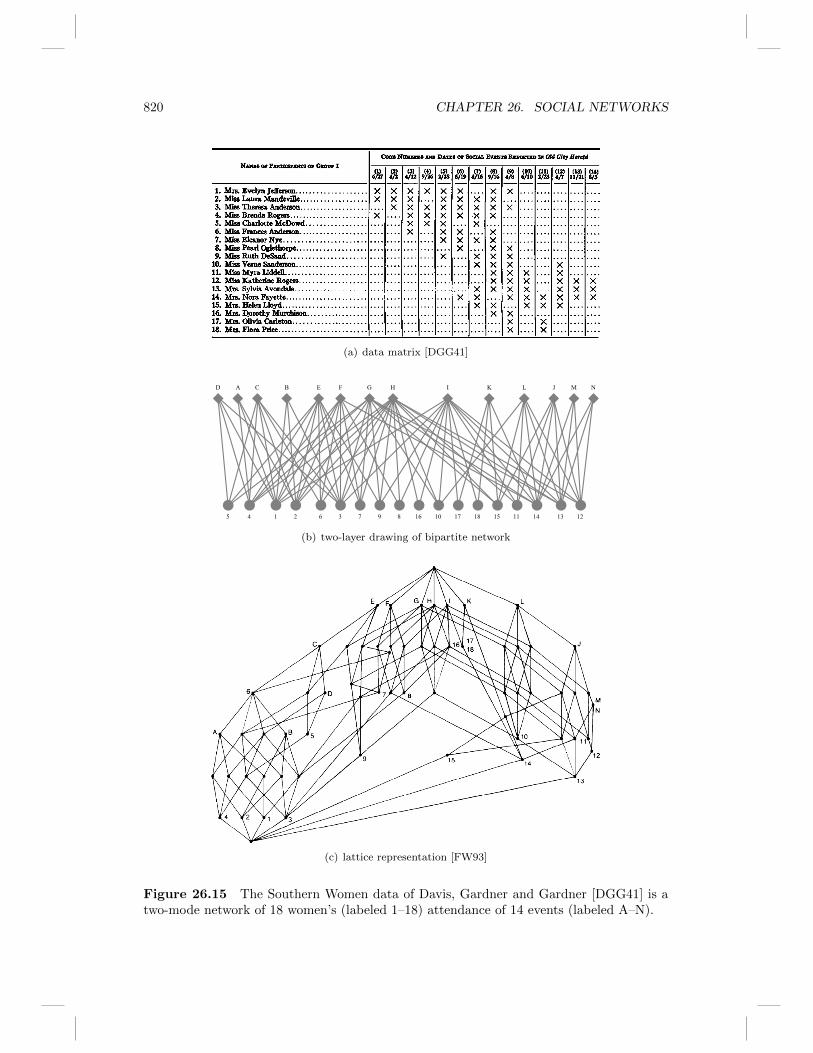
Inspired by their use in formal concept analysis [GW98], Galois lattices have beenproposed as an alternative representation for two-mode networks [FW93]. An overviewof the potential of lattices in data analysis and a standard tool, GLAD, are provided byDuquenne [Duq99].
Figure 26.15 shows an example of a two-mode network represented in a matrix, a bipartitegraph, and a Galois lattice. In the Galois lattice representation, a node simultaneouslyrepresents a subset of women and a subset of events. The women are exactly those attendingall of the corresponding events, and the events are exactly those attended by all of the
820 CHAPTER 26. SOCIAL NETWORKS
(a) data matrix [DGG41]
1
A BCD E F G H I JK L M N
2 345 6 7 89 10 11 1213141516 17 18
(b) two-layer drawing of bipartite network
(c) lattice representation [FW93]
Figure 26.15 The Southern Women data of Davis, Gardner and Gardner [DGG41] is atwo-mode network of 18 women’s (labeled 1–18) attendance of 14 events (labeled A–N).
26.3. SUBSTANCE-BASED DESIGNS 821
corresponding women. Nodes are ordered by set-inclusion, i.e. for each node the set ofwomen consists of those encountered on downward paths to the bottom, and the set ofevents consists of those encountered on upward paths to the top. A study essentiallyconcluded that users do understand such diagrams [EDB04].
Approaches for drawing lattices range from layer-constrained force-directed layout inthree dimensions [Fre04b] to enumeration and decomposition approaches [RCE06, BPS11].See the review in [MH01] for relations with other combinatorial structures.
26.3.4 Dynamics
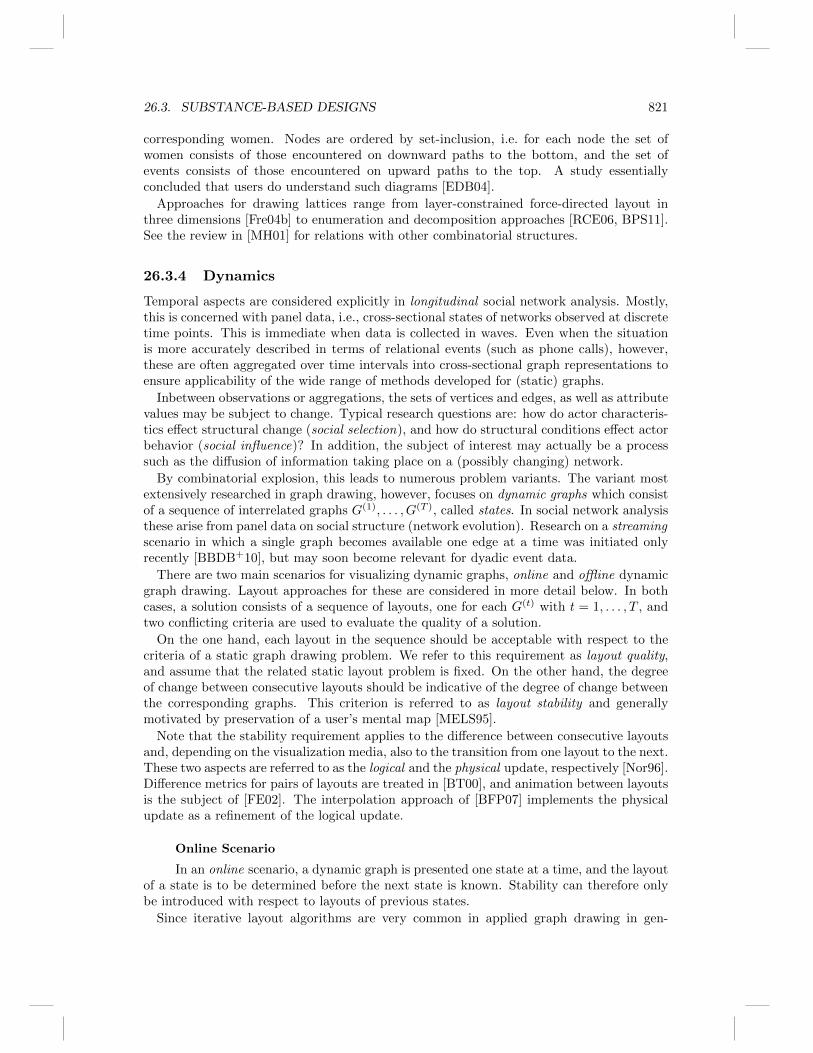
Temporal aspects are considered explicitly in longitudinal social network analysis. Mostly,this is concerned with panel data, i.e., cross-sectional states of networks observed at discretetime points. This is immediate when data is collected in waves. Even when the situationis more accurately described in terms of relational events (such as phone calls), however,these are often aggregated over time intervals into cross-sectional graph representations toensure applicability of the wide range of methods developed for (static) graphs.
Inbetween observations or aggregations, the sets of vertices and edges, as well as attributevalues may be subject to change. Typical research questions are: how do actor characteris-tics effect structural change (social selection), and how do structural conditions effect actorbehavior (social influence)? In addition, the subject of interest may actually be a processsuch as the diffusion of information taking place on a (possibly changing) network.
By combinatorial explosion, this leads to numerous problem variants. The variant mostextensively researched in graph drawing, however, focuses on dynamic graphs which consistof a sequence of interrelated graphs G(1), . . . , G(T ), called states. In social network analysisthese arise from panel data on social structure (network evolution). Research on a streamingscenario in which a single graph becomes available one edge at a time was initiated onlyrecently [BBDB+10], but may soon become relevant for dyadic event data.
There are two main scenarios for visualizing dynamic graphs, online and offline dynamicgraph drawing. Layout approaches for these are considered in more detail below. In bothcases, a solution consists of a sequence of layouts, one for each G(t) with t = 1, . . . , T , andtwo conflicting criteria are used to evaluate the quality of a solution.
On the one hand, each layout in the sequence should be acceptable with respect to thecriteria of a static graph drawing problem. We refer to this requirement as layout quality,and assume that the related static layout problem is fixed. On the other hand, the degreeof change between consecutive layouts should be indicative of the degree of change betweenthe corresponding graphs. This criterion is referred to as layout stability and generallymotivated by preservation of a user’s mental map [MELS95].
Note that the stability requirement applies to the difference between consecutive layoutsand, depending on the visualization media, also to the transition from one layout to the next.These two aspects are referred to as the logical and the physical update, respectively [Nor96].Difference metrics for pairs of layouts are treated in [BT00], and animation between layoutsis the subject of [FE02]. The interpolation approach of [BFP07] implements the physicalupdate as a refinement of the logical update.
Online Scenario
In an online scenario, a dynamic graph is presented one state at a time, and the layoutof a state is to be determined before the next state is known. Stability can therefore onlybe introduced with respect to layouts of previous states.
Since iterative layout algorithms are very common in applied graph drawing in gen-

822 CHAPTER 26. SOCIAL NETWORKS
eral, and social network visualization in particular, a simple approach to online drawingis the initialization of the layout algorithm for a state with the layout of the previousstate [MMBd05, HEW98]. This is a convenient, though indirect, approach to address thestability requirement. It does work fairly well when the iterations of the layout algorithmare used for the physical updates of an animation.
Explicit consideration of stability by defining a layout objective that trades off qualityand stability using a static objective and a difference metric is proposed in the Bayesianframework of [BW97]. A recent application of this is [FT08]. Since the employed differencemetric is penalizing vertex movement via (weighted) distances from previous positions, thisis a case of what is called anchoring [LMR98].
An unusual variant of online drawing is introduced in [DDBF+99], where drawings ofa state must keep the drawing of the previous state intact, and expectations (rather thanknowledge) about the additional subgraph to accomodate are available. However, thissituation has so far been considered only for descending traversals of trees.
Offline Scenario
In an offline scenario, the input given is a dynamic graph and the output soughtis a layout for each of its states. Except for streaming event data and some applicationsinvolving social networking sites, the offline scenario is the typical scenario in empiricalsocial network analysis. Since the entire sequence of states is known before any layoutneeds to be determined, the layout of a state may be determined with subsequent states inmind. In other words, we may use knowledge about the future.
Note that methods for online scenarios can be applied in offline scenarios, although atthe possible expense of both quality and stability, but the reverse is generally not possible.
In a recent review [BIM12], three primary approaches to offline dynamic graph drawingare distinguished:
Aggregation. All graphs in the sequence are aggregated into a single graph thathas one vertex for each actor. The position of each occurrence of vertex in astate is fixed by the layout of the aggregated graph. Variants of this approachare considered, e.g., in [BC03a, DG04, MMBd05], and it is referred to as theflip-book approach in the last reference.
Anchoring. Using auxiliary edges, vertices are connected to immobile copies fixedto a desired location which may be, for instance, the previous position as in anonline scenario, or a reference position determined from an aggregate layout inan offline scenario. This approach is used, e.g., in [LMR98, BW97, FT08].
Linking. All graphs in the sequence are combined into a single graph that has onevertex for each occurrence of an actor, and an edge is created between verticesrepresenting the same actor in consecutive graphs. A layout of this graph directlyyields positions for all vertex instances in the sequence. This approach is used,e.g., in [DG04, EKLN04, DHK+06].
Algorithmic experimental evidence [BM12] suggests that, at least for methods based onstress minimization [GKN04] and general conditions, linking dominates anchoring in termsof stability and quality. On the other hand, anchoring is computionally cheaper and espe-cially suited when a dynamic graph has rather persistent global structure. Evidence fromuser experiments, on the other hand, is inconclusive about the actual value of stability indynamic graph animation [PS08], and even animation itself [APP11].

26.3. SUBSTANCE-BASED DESIGNS 823
week stable no stability compromise
1
1
2
3
4
5
6
7
8
9
10
11
12
13
14
15
16
17
1
2
3
4
5
6
7
8
9
10
11
12
13
14
15
16
17 1
2
3
4
5
6
7
89
10
1112
13
14
15
16
17
4
1
2
3
4
5
6
7
8
9
10
11
12
13
14
15
16
17
1
2
3
4
5
6
7
8
9
10
11
12
13
14
15
16
17
1
2
3
4
56
7
8
9
10
11
12
13
14
15
16
17
7
1
2
3
4
5
6
7
8
9
10
11
12
13
14
15
16
171
2
3
4
5
6
7
8
9
10
11
12
13
14
15
16
17
1
2
3
4
5
6
7
89
10
11
1213
14
15
16
17
12
1
2
3
4
5
6
7
8
9
10
11
12
13
14
15
16
17
1
2
3
4 5
6
7
89
10
11
12
13
14
15
16
171
2
3
4
5
6
7
89
10
11
12
13
14
15
16
17
16
1
2
3
45
6
7
8
9
10
11
12
13
14
15
16
17
1
2
34
5
6
7
8
9
10
11
12
13
14
15
16
17
1
2
3
4
5
6
7
8
9
10
11
12
13
14
15
16
17
Figure 26.16 Five states of the dynamic graph obtained from top-3 choices in Newcomb’sfraternity data. Layout obtained by stress minimization on an aggregate graph (stable),initialized by previous layout (no stability), and with linking of consecutive layouts (com-promise).
824 CHAPTER 26. SOCIAL NETWORKS
17
4
9
2
12
7
11
13
1
6
8
5
14
15
3
16
10
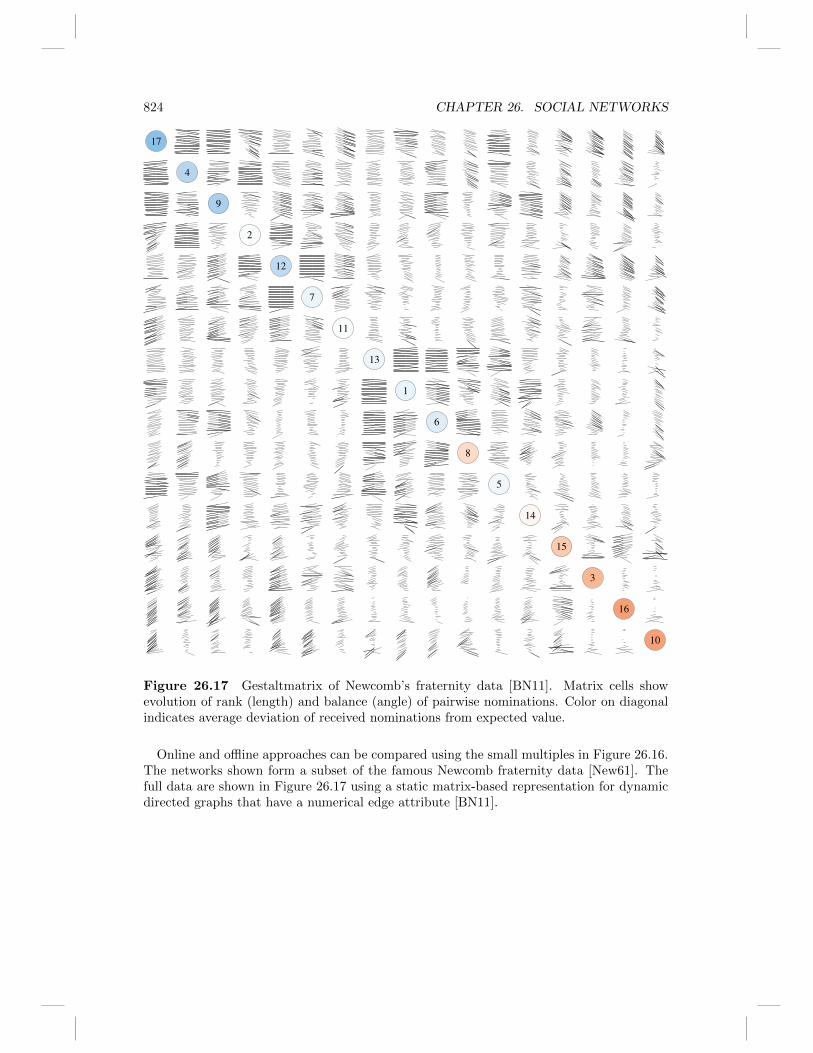
Figure 26.17 Gestaltmatrix of Newcomb’s fraternity data [BN11]. Matrix cells showevolution of rank (length) and balance (angle) of pairwise nominations. Color on diagonalindicates average deviation of received nominations from expected value.
Online and offline approaches can be compared using the small multiples in Figure 26.16.The networks shown form a subset of the famous Newcomb fraternity data [New61]. Thefull data are shown in Figure 26.17 using a static matrix-based representation for dynamicdirected graphs that have a numerical edge attribute [BN11].
26.4. TRENDS AND CHALLENGES 825
26.4 Trends and Challenges
While graphs arising from social networks across application domains exhibit some generaltendencies such as sparseness and local clustering, there is no formal characterization interms of structural requirements that delineates this class of graphs from others. Likewise,the information to be conveyed in a social network visualization differs by available data,interest, and domain.
Layout of social networks is therefore contingent on many factors, and comparison ofapproaches is possible only if scope and purpose are defined precisely. Identification ofpractically relevant and pragmatic tasks remains a challenge, though.
Despite the range of approaches presented in this chapter, force-directed methods – muchlike in other areas of applied graph drawing – are most commonly used for social networklayout. This is likely because of their generality, simplicity, adaptability, and above all theiravailability. While force-directed methods generally perform well in separating clusters ingraphs with varying local density, these methods are particularly troubled by small distancesand skewed degree distributions [BP09]. A fundamental challenge is therefore to identifyrepresentations and layout criteria that allow to deal with such structures [ACL07].
Another very general challenge involves the interplay between methods for hierachicalclustering of graphs and clustered graph layout. Especially for large graphs, hierarchicalclustering is frequently used as a tool in multilevel layout algorithms, but the artifactsresulting from the choice of clustering or filter methods are not yet understood well (see,e.g., [JHGH08, vHW08, HN07]).
Two research directions that are more closely related to the type of data (rather than itsproperties) encountered in social network analysis are the genuine treatment of two-modenetworks (Section 26.3.3) and visual means to support stochastic network modeling [BIM12].
Finally, there is also at least one example where artistic drawings of social networksinspired a new graph drawing convention, namely Lombardi drawings [Hob03, DEG+12].
Many software packages are available already for the analysis and visualization of socialnetworks, and many more are in introduced for specific application domains. Among so-cial scientists, UCINET [BEF99] is the most widely known. At the time of this writing,Pajek [BM04] is likely to be the most widely used across all disciplines, and visone [BW04]the social network analysis tool with the most sophisticated graph drawing features. Othercomprehensive and popular tools include Tulip [Aub04], NodeXL [HSS10], Gephi [BHJ09],and ORA [CRSC11]. A recent software review can be found in [HvD11], and a comparativeevaluation of some tools is attempted in [XTT+10]. A comprehensive list of software forsocial networks is maintained in Wikipedia.1
Very likely the most dominant force driving visualization research on social networks overthe next decade will be online social and other networks derived from social media [Fur10].This is in part because they combine virtually all the current challenges of size and dynam-ics with the more specific challenges that arise from multivariate complexity. Moreover,such research can be of economic relevance, draw large audiences, and make use of easilyaccessible data [LPA+09]. It will be exciting to witness whether graph drawing can makesignificant contributions to this area and thus challenge currently reigning adaptations ofits oldest methods (see [HB05] for one solid example). An example in this direction is alayout algorithm for digital social networks tailored to smartphone displays [DLDBI12].
1http://en.wikipedia.org/wiki/Social_network_analysis_software
826 CHAPTER 26. SOCIAL NETWORKS
References
[ACL07] Reid Andersen, Fan Chung, and Linyuan Lu. Drawing power law graphsusing a local/global decomposition. Algorithmica, 47(4):379–397, 2007.
[APP11] Daniel Archambault, Helen C. Purchase, and Bruno Pinaud. Animation,small multiples, and the effect of mental map preservation in dynamicgraphs. IEEE Transactions on Visualization and Computer Graphics,17(4):539–552, 2011.
[ARRC11] Basak Alper, Nathalie Riche, Gonzalo Ramos, and Mary Czerwinski. De-sign study of linesets, a novel set visualization technique. IEEE Transac-tions on Visualization and Computer Graphics, 17(12):2259–2267, 2011.
[Aub04] David Auber. Tulip – a huge graph visualisation framework. In Jungerand Mutzel [JM04], pages 105–126.
[Bac07] Christian Bachmaier. A radial adaptation of the Sugiyama framework forvisualizing hierarchical information. IEEE Transactions on Visualizationand Computer Graphics, 13(3):583–594, 2007.
[Bar54] John A. Barnes. Class and committees in a Norwegian island parish.Human Relations, 7:39–58, 1954.
[BB04] Michael Baur and Ulrik Brandes. Crossing reduction in circular layouts. InJuraj Hromkovic, Manfred Nagl, and Bernhard Westfechtel, editors, Pro-ceedings of the 30th International Workshop on Graph-Theoretical Con-cepts in Computer Science (WG’04), volume 3353 of Lecture Notes inComputer Science, pages 332–343. Springer-Verlag, 2004.
[BBDB+10] Carla Binucci, Ulrik Brandes, Giuseppe Di Battista, Walter Didimo,Marco Gaertler, Pietro Palladino, Maurizio Patrignani, Antonios Symvo-nis, and Katharina A. Zweig. Drawing trees in a streaming model.In Proceedings of the 17th International Symposium on Graph Drawing(GD’09), volume 5849 of Lecture Notes in Computer Science, pages 292–303. Springer-Verlag, 2010.
[BC03a] Ulrik Brandes and Steven R. Corman. Visual unrolling of network evo-lution and the analysis of dynamic discourse. Information Visualization,2(1):40–50, 2003.
[BC03b] Ulrik Brandes and Sabine Cornelsen. Visual ranking of link structures.Journal of Graph Algorithms and Applications, 7(2):181–201, 2003.
[BCPS11a] Ulrik Brandes, Sabine Cornelsen, Barbara Pampel, and Arnaud Sal-laberry. Blocks of hypergraphs (applied to hypergraphs and outerpla-narity). In Proceedings of the 21st International Workshop on Combi-natorial Algorithms (IWOCA 2010), volume 6460 of Lecture Notes inComputer Science, pages 201–211. Springer-Verlag, 2011.
[BCPS11b] Ulrik Brandes, Sabine Cornelsen, Barbara Pampel, and Arnaud Sal-laberry. Path-based supports for hypergraphs. In Proceedings of the 21stInternational Workshop on Combinatorial Algorithms (IWOCA 2010),volume 6460 of Lecture Notes in Computer Science, pages 20–33. Springer-Verlag, 2011.
[BD07] Michael Balzer and Oliver Deussen. Level-of-detail visualization of clus-tered graph layouts. In Proceedings of the 6th International Asia-PacificSymposium on Visualisation (APVis ’07), pages 133–140. IEEE, 2007.
REFERENCES 827
[BDF+10] Anastasia Bezerianos, Pierre Dragicevic, Jean-Daniel Fekete, Juhee Bae,and Ben Watson. GeneaQuilts: A system for exploring large genealogies.IEEE Transactions on Visualization and Computer Graphics, 16(6):741–748, 2010.
[BDW99] Rainer Burkhard, Vladimir G. Deıneko, and Gerhard Woeginger. Thetravelling salesman and the PQ-tree. Mathematics of Operations Research,24(1):262–272, 1999.
[BE00] Francois Bertault and Peter Eades. Drawing hypergraphs in the subsetstandard. In Proceedings of the 8th International Symposium on GraphDrawing (GD’00), volume 1984 of Lecture Notes in Computer Science,pages 164–169. Springer-Verlag, 2000.
[BE05] Ulrik Brandes and Thomas Erlebach, editors. Network Analysis: Method-ological Foundations, volume 3418 of Lecture Notes in Computer Science.Springer-Verlag, 2005.
[BE06] Stephen P. Borgatti and Martin G. Everett. A graph-theoretic perspectiveon centrality. Social Networks, 28:466–484, 2006.
[BEF99] Stephen P. Borgatti, Martin G. Everett, and Linton C. Freeman.UCINET 6.0 Version 1.00. Analytic Technologies, 1999.
[Ber83] Jacques Bertin. Semiology of Graphics: Diagrams, Networks, Maps. Uni-versity of Wisconsin Press, 1983.
[BES90] Stephen P. Borgatti, Martin G. Everett, and Paul R. Shirey. LS sets,lambda sets and other cohesive subsets. Social Networks, 12(4):337–357,1990.
[BFP07] Ulrik Brandes, Daniel Fleischer, and Thomas Puppe. Dynamic spectrallayout with an application to small worlds. Journal of Graph Algorithmsand Applications, 11(2):325–343, 2007.
[BHJ09] Mathieu Bastian, Sebastien Heymann, and Mathieu Jacomy. Gephi: anopen source software for exploring and manipulating networks. In Pro-ceedings of the 3rd International AAAI Conference on Weblogs and SocialMedia (ICWSM ’09), pages 361–362, 2009.
[Bie98] Therese C. Biedl. Drawing planar partitions I: LL-drawings and LH-drawings. In Proceedings of the 14th Annual ACM Symposium on Com-putational Geometry (SoCG’98), pages 287–296, 1998.
[BIM12] Ulrik Brandes, Natalie Indlekofer, and Martin Mader. Visualization meth-ods for longitudinal social networks and stochastic actor-oriented model-ing. Social Networks, 34(3):291–308, 2012.
[BKM98] Therese C. Biedl, Michael Kaufmann, and Petra Mutzel. Drawing planarpartitions II: HH-drawings. In Proceedings of the 24th International Work-shop on Graph-Theoretical Concepts in Computer Science (WG’98), vol-ume 1517 of Lecture Notes in Computer Science, pages 101–114. Springer-Verlag, 1998.
[BKR+99] Ulrik Brandes, Patrick Kenis, Jorg Raab, Volker Schneider, and DorotheaWagner. Explorations into the visualization of policy networks. Journalof Theoretical Politics, 11(1):75–106, 1999. Reprinted in Linton Freeman,ed., Social Network Analysis, vol. I (Data, Mathematical Models, andGraphics), Sage, 2007.
828 CHAPTER 26. SOCIAL NETWORKS
[BKR06] Ulrik Brandes, Patrick Kenis, and Jorg Raab. Explanation through net-work visualization. Methodology, 2(1):16–23, 2006. Spanish translation inREDES 9(6), 2005.
[BKW03] Ulrik Brandes, Patrick Kenis, and Dorothea Wagner. Communicating cen-trality in policy network drawings. IEEE Transactions on Visualizationand Computer Graphics, 9(2):241–253, 2003.
[BM04] Vladimir Batagelj and Andrej Mrvar. Pajek – analysis and visualizationof large networks. In Junger and Mutzel [JM04], pages 77–103.
[BM12] Ulrik Brandes and Martin Mader. A quantitative comparison of stress-minimization approaches for offline dynamic graph drawing. In Proceed-ings of the 19th International Symposium on Graph Drawing (GD 2011),volume 7034 of Lecture Notes in Computer Science, pages 99–110.Springer-Verlag, 2012.
[BMBL09] Stephen P. Borgatti, Ajay Mehra, Daniel J. Brass, and Giuseppe Labi-anca. Network analysis in the social sciences. Science, 323(5916):892–895,2009.
[BN11] Ulrik Brandes and Bobo Nick. Asymmetric relations in longitudinal socialnetworks. IEEE Transactions on Visualization and Computer Graphics,17(12):2283–2290, 2011.
[Bon72] Phillip Bonacich. Factoring and weighting approaches to status scoresand clique identification. Journal of Mathematical Sociology, 2:113–120,1972.
[Bor05] Stephen P. Borgatti. Centrality and network flow. Social Networks, 27:55–71, 2005.
[BP09] Ulrik Brandes and Christian Pich. An experimental study on distance-based graph drawing. In Proceedings of the 16th International Symposiumon Graph Drawing (GD’08), volume 5417 of Lecture Notes in ComputerScience, pages 218–229. Springer-Verlag, 2009.
[BP11] Ulrik Brandes and Christian Pich. More flexible radial layout. Journal ofGraph Algorithms and Applications, 15(1):157–173, 2011.
[BPS11] Anne Berry, Romain Pogorelcnik, and Alain Sigayret. Vertical decomposi-tion of a lattice using clique separators. In Proceedings of the 8th Interna-tional Conference on Concept Lattices and their Applications (CLA’11),pages 15–29, 2011.
[Bra96] Franz J. Brandenburg, editor. Proceedings of the 3rd International Sym-posium on Graph Drawing (GD ’95), volume 1027 of Lecture Notes inComputer Science. Springer, 1996.
[Bra07] Ulrik Brandes. Optimal leaf ordering of complete binary trees. Journalof Discrete Algorithms, 5(3):546–552, 2007.
[Bra08] Ulrik Brandes. Social network analysis and visualization. IEEE SignalProcessing Magazine, 25(6):147–151, 2008.
[Bre74] Ronald L. Breiger. The duality of persons and groups. Social Forces,53(2):181–190, 1974.
[Bre09] Ronald L. Breiger. On the duality of cases and variables. In David Byrneand Charles C. Ragin, editors, The SAGE Handbook of Case-Based Meth-ods, pages 243–259. Sage, 2009.

REFERENCES 829
[BRW01] Ulrik Brandes, Jorg Raab, and Dorothea Wagner. Exploratory networkvisualization: Simultaneous display of actor status and connections. Jour-nal of Social Structure, 2(4), 2001.
[BT00] Stina S. Bridgeman and Roberto Tamassia. Difference metrics for interac-tive orthogonal graph drawing algorithms. Journal of Graph Algorithmsand Applications, 4(3):47–74, 2000.
[But09] Carter T. Butts. Revisiting the foundations of network analysis. Science,325(5939):414–416, 2009.
[BvKM+10] Kevin Buchin, Marc van Kreveld, Henk Meijer, Bettina Speckmann, andKevin Verbeek. On planar supports or hypergraphs. In Proceedings of the17th International Symposium on Graph Drawing (GD’09), volume 5849of Lecture Notes in Computer Science, pages 345–356. Springer-Verlag,2010.
[BW97] Ulrik Brandes and Dorothea Wagner. A Bayesian paradigm for dynamicgraph layout. In Giuseppe Di Battista, editor, Proceedings of the 5thInternational Symposium on Graph Drawing (GD ’97), volume 1353 ofLecture Notes in Computer Science, pages 236–247. Springer, 1997.
[BW04] Ulrik Brandes and Dorothea Wagner. visone – analysis and visualizationof social networks. In Michael Junger and Petra Mutzel, editors, GraphDrawing Software, pages 321–340. Springer-Verlag, 2004.
[CAI] CAIDA. Cooperative association for internet data analysis. http://www.caida.org/research/topology/as_core_network/.
[CCM12] Carlos D. Correa, Tarik Crnovrsanin, and Kwan-Liu Ma. Visual reasoningabout social networks using centrality sensitivity. IEEE Transactions onVisualization and Computer Graphics, 18(1):106–120, 2012.
[CDB05] Pier Francesco Cortese and Giuseppe Di Battista. Clustered planarity.In Proceedings of the 21st Annual ACM Symposium on ComputationalGeometry (SoCG’05), pages 32–34, 2005.
[Cha50] F. Stuart Chapin. Sociometric stars as isolates. American Journal ofSociology, 56(3):263–267, 1950.
[CJ51] Joan H. Criswell and Helen Hall Jennings. A critique of chapin’s ‘socio-metric stars as isolates’. American Journal of Sociology, 57(3):260–264,1951.
[CM11] Carlos D. Correa and Kwan-Liu Ma. Visualizing social networks. InCharu C. Aggarwal, editor, Social Network Data Analytics, pages 307–326. Springer-Verlag, 2011.
[CPC09] Christopher Collins, Gerald Penn, and Sheelagh Carpendale. Bubble sets:revealing set relations with isocontours over existing visualizations. IEEETransactions on Visualization and Computer Graphics, 15(6):1009–1016,2009.
[CRSC11] Kathleen M. Carley, Jeff Reminga, Jon Storrick, and Dave Columbus.ORA user’s guide 2011. Technical Report CMU-ISR-11-107, CarnegieMellon University, Institute for Software Research, 2011.
[CSW04] Sabine Cornelsen, Thomas Schank, and Dorothea Wagner. Drawinggraphs on two and three lines. Journal of Graph Algorithms and Ap-plications, 8(2):161–177, 2004.

830 CHAPTER 26. SOCIAL NETWORKS
[CSW05] Peter J. Carrington, John Scott, and Stanley Wasserman, editors. Modelsand Methods in Social Network Analysis. Cambridge University Press,2005.
[CY10] Ing-Xiang Chen and Cheng-Zen Yang. Visualization of social networks. InHandbook of Social Network Technologies and Applications [Fur10], pages585–610.
[Cze09] Jan Czekanowski. Zur Differentialdiagnose der Neandertalgruppe.Korrespondenz-Blatt der Deutschen Gesellschaft fur Anthropologie, Eth-nologie and Urgeschichte, 40(6/7):44–47, 1909.
[DBF05] Patrick Doreian, Vladimir Batagelj, and Anuska Ferligoj. GeneralizedBlockmodeling. Cambridge University Press, 2005.
[DDBF+99] Camil Demetrescu, Giuseppe Di Battista, Irene Finocchi, Giuseppe Li-otta, Maurizio Patrignani, and Maurizio Pizzonia. Infinite trees and thefuture. In Proceedings of the 7th International Symposium on GraphDrawing (GD’99), volume 1731 of Lecture Notes in Computer Science,pages 379–391. Springer-Verlag, 1999.
[DEG+12] Christian A. Duncan, David Eppstein, Michael T. Goodrich, Stephen G.Kobourov, and Martin Nollenburg. Lombardi drawings of graphs. Journalof Graph Algorithms and Applications, 16(1):85–108, 2012.
[DG04] Tim Dwyer and David R. Gallagher. Visualising changes in fund man-ager holdings in two and a half-dimensions. Information Visualization,3(4):227–244, 2004.
[DGG41] Allison Davis, Burleigh B. Gardner, and Mary R. Gardner. Deep South:A Social Anthropological Study of Caste and Class. University of ChicagoPress, 1941.
[DGGL08] Emilio Di Giacomo, Luca Grilli, and Giuseppe Liotta. Drawing bipartitegraphs on two parallel convex curves. Journal of Graph Algorithms andApplications, 12(1):97–112, 2008.
[DGL08] Walter Didimo, Francesco Giordano, and Giuseppe Liotta. Overlap-ping cluster planarity. Journal of Graph Algorithms and Applications,12(3):267–291, 2008.
[DHK+06] Tim Dwyer, Seokhee Hong, Dirk Koschutzki, Falk Schreiber, and KaiXu. Visual analysis of network centralities. In Proceedings of the 2006Asia-Pacific Symposium on Information Visualisation (APVis ’06), pages189–197. Australian Computer Society, 2006.
[DKM09] Tim Dwyer, Yehuda Koren, and Kim Marriott. Constrained graph layoutby stress majorization and gradient projection. Discrete Mathematics,309(7):1895–1908, 2009.
[DLDBI12] Giordano Da Lozzo, Giuseppe Di Battista, and Francesco Ingrassia. Draw-ing graphs on a smartphone. Journal of Graph Algorithms and Applica-tions, 16(1):109–126, 2012.
[dLM00] Jan de Leeuw and George Michailides. Graph layout techniques and mul-tivariate data analysis. In F. Thomas Bruss and Lucien Le Cam, editors,Game theory, optimal stopping, probability and statistics: Papers in honorof Thomas S. Ferguson, pages 219–248. Beachwood, 2000.
[DPS02] Josep Diaz, Jordi Petit, and Maria Serna. A survey of graph layoutproblems. ACM Computing Surveys, 34:313–356, 2002.
REFERENCES 831
[Duq99] Vinvent Duquenne. Latticial structures in data analysis. Theoretical Com-puter Science, 217:407–436, 1999.
[EDB04] Peter Eklund, Jon Ducrou, and Peter Brawn. Concept lattices for in-formation visualization: Can novices read line-diagrams? In Proceed-ings of the 2nd International Conference on Formal Concept Analysis(ICFCA’04), volume 2961 of Lecture Notes in Computer Science, pages235–236. Springer-Verlag, 2004.
[EF97] Peter Eades and Qing-Wen Feng. Multilevel visualization of clusteredgraphs. In Proceedings of the 5th International Symposium on GraphDrawing (GD’97), volume 1190 of Lecture Notes in Computer Science,pages 101–112. Springer-Verlag, 1997.
[EFN99] Peter Eades, Qing-Wen Feng, and Hiroshi Nagamochi. Drawing clusteredgraphs on an orthogonal grid. Journal of Graph Algorithms and Applica-tions, 3(4):3–29, 1999.
[EKLN04] Cesim Erten, Stephen G. Kobourov, Vu Le, and Armand Navabi. Si-multaneous graph drawing: Layout algorithms and visualization schemes.In Proceedings of the 11th International Symposium on Graph Drawing(GD’03), volume 2912 of Lecture Notes in Computer Science, pages 437–449. Springer-Verlag, 2004.
[FE02] Carsten Friedrich and Peter Eades. Graph drawing in motion. Journal ofGraph Algorithms and Applications, 6(3):353–370, 2002.
[FK46] Elaine Forsyth and Leo Katz. A matrix approach to the analysis of so-ciometric data: Preliminary report. Sociometry, 9:340–347, 1946.
[Fre79] Linton C. Freeman. Centrality in social networks: Conceptual clarifica-tion I. Social Networks, 1:215–239, 1979.
[Fre00] Linton C. Freeman. Visualizing social networks. Journal of Social Struc-ture, 1(1), 2000.
[Fre04a] Linton C. Freeman. The Development of Social Network Analysis: AStudy in the Sociology of Scie nce. Empirical Press, 2004.
[Fre04b] Ralph Freese. Automated lattice drawing. In Proceedings of the 2ndInternational Conference on Formal Concept Analysis (ICFCA’04), vol-ume 2961 of Lecture Notes in Computer Science, pages 112–127. Springer-Verlag, 2004.
[Fre05] Linton C. Freeman. Graphic techniques for exploring social network data.In Carrington et al. [CSW05], pages 248–269.
[Fre08] Linton C. Freeman, editor. Social Network Analysis. Sage, 2008. Vol-umes I–IV.
[Fri91] Noah E. Friedkin. Theoretical foundations for centrality measures. Amer-ican Journal of Sociology, 96(6):1478–1504, May 1991.
[FT08] Yaniv Frishman and Ayellet Tal. Online dynamic graph drawing. IEEETransactions on Visualization and Computer Graphics, 14(4):727–740,2008.
[Fur10] Borko Furht. Handbook of Social Network Technologies and Applications.Springer-Verlag, 2010.
[FW93] Linton C. Freeman and Douglas R. White. Using Galois lattices to rep-resent network data. Sociological Methodology, 23:127–146, 1993.
832 CHAPTER 26. SOCIAL NETWORKS
[GFC05] Mohammad Ghoniem, Jean-Daniel Fekete, and Philippe Castagliola. Onthe readability of graphs using node-link and matrix-based representa-tions: a controlled experiment and statistical analysis. Information Visu-alization, 4(2):114–135, 2005.
[GKN04] Emden R. Gansner, Yehuda Koren, and Stephen C. North. Graph draw-ing by stress majorization. In Proceedings of the 12th International Sym-posium on Graph Drawing (GD’04), volume 3383 of Lecture Notes inComputer Science, pages 239–250. Springer-Verlag, 2004.
[GW98] Bernhard Ganter and Rudolf Wille. Formal Concept Analyis: Mathemat-ical Foundations. Springer-Verlag, 1998.
[HB05] Jeffrey Heer and Danah Boyd. Vizster: Visualizing online social net-works. In Proceedings of IEEE Symposium of Information Visualization(InfoVis’05), pages 32–39, 2005.
[HEH09] Weidong Huang, Peter Eades, and Seokhee Hong. Measuring effectivenessof graph visualizations: A cognitive load approach. Information Visual-ization, 8(3):139–152, 2009.
[HEW98] Mao Lin Huang, Peter Eades, and Junhu Wang. On-line animated visu-alization of huge graphs using a modified spring algorithm. Journal ofVisual Languages and Computing, 9(6):623–645, 1998.
[HF06] Nathalie Henry and Jean-Daniel Fekete. MatrixExplorer: a dual-representation system to explore social networks. IEEE Transactions onVisualization and Computer Graphics, 12(5):677–684, 2006.
[HF07] Nathalie Henry and Jean-Daniel Fekete. MatLink: Enhanced matrix vi-sualization for analyzing social networks. In Proceedings of the 11th IFIPConference on Human-Computer Interaction (INTERACT 2007), volume4663 of Lecture Notes in Computer Science, pages 288–302. Springer-Verlag, 2007.
[HFM07] Nathalie Henry, Jean-Daniel Fekete, and Michael J. McGuffin. NodeTrix:a hybrid visualization of social networks. IEEE Transactions on Visual-ization and Computer Graphics, 13(6):1302–1309, 2007.
[HHE07] Weidong Huang, Seokhee Hong, and Peter Eades. Effects of sociogramdrawing conventions and edge crossings in social network visualization.Journal of Graph Algorithms and Applications, 11(2):397–429, 2007.
[HN07] Mao Lin Huang and Quang Vinh Nguyen. A space efficient clusteredvisualization of large graphs. In Proceedings of the 4th International Con-ference on Image and Graphics (ICIG ’07), pages 920–927, 2007.
[Hob03] Robert Hobbs. Mark Lombard: Global Networks. Independent CuratorsInternational, New York, 2003.
[Hol06] Danny Holten. Hierarchical edge bundles: Visualization of adjacencyrelations in hierarchical data. IEEE Transactions on Visualization andComputer Graphics, 12(5):741–748, 2006.
[HSS10] Derek Hansen, Ben Shneiderman, and Marc A. Smith. Analyzing SocialMedia Networks with NodeXL: Insights from a Connected World. MorganKaufmann, 2010.
[HvD11] Mark Huisman and Marijtje A. J. van Duijn. A reader’s guide to SNAsoftware. In John Scott and Peter J. Carrington, editors, The SAGEHandbook of Social Network Analysis, pages 578–600. Sage, 2011.

REFERENCES 833
[IMMS09] Takayuki Itoh, Chris Muelder, Kwan-Liu Ma, and Jun Sese. A hybridspace-filling and force-directed layout method for visualizing multiple-category graphs. In Proceedings of the IEEE Pacific Visualization Sym-posium (PacificVis’09), pages 121–128, 2009.
[JHGH08] Yuntao Jia, Jared Hoberock, Michael Garland, and John C. Hart. On thevisualization of social and other scale-free networks. IEEE Transactionson Visualization and Computer Graphics, 14(6):1285–1292, 2008.
[JK04] Jeffrey C. Johnson and Lothar Krempel. Network visualization: The“Bush Team” in Reuters news ticker 9/11–11/15/01. Journal of SocialStructure, 5(1), 2004.
[JM04] Michael Junger and Petra Mutzel, editors. Graph Drawing Software.Springer-Verlag, 2004.
[JP87] David S. Johnson and Henry O. Pollak. Hypergraph planarity andthe complexity of drawing Venn diagrams. Journal of Graph Theory,11(3):309–325, 1987.
[Kam89] Tomihisa Kamada. Visualizing Abstract Objects and Relations. WorldScientific, 1989.
[Kat47] Leo Katz. On the matric analysis of sociometric data. Sociometry, 10:233–241, 1947.
[Kat53] Leo Katz. A new status index derived from sociometric analysis. Psy-chometrika, 18(1):39–43, 1953.
[KB83] David Knoke and Ronald S. Burt. Prominence. In Ronald S. Burt andMichael J. Minor, editors, Applied Network Analysis, pages 195–222. SagePublications, 1983.
[KH05] Yehuda Koren and David Harel. One-dimensional layout optimization,with applications to graph drawing by axis separation. ComputationalGeometry, 32(2):115–138, 2005.
[Klo81] Alden S. Klovdahl. A note on images of networks. Social Networks,3:197–214, 1981.
[Kra96] David Krackhardt. Social networks and the liability of newness for man-agers. In C. L. Cooper and D. M. Rousseau, editors, Trends in Organiza-tional Behavior, volume 3, pages 159–173. John Wiley & Sons, 1996.
[KS04] Dirk Koschutzki and Falk Schreiber. Comparison of centralities for bio-logical networks. In Proceedings of the German Conference on Bioinfor-matics 2004, volume P-53 of Lecture Notes in Informatics, pages 199–206.Springer-Verlag, 2004.
[KvKS09] Michael Kaufmann, Marc van Kreveld, and Bettina Speckmann. Subdi-vision drawings of hypergraphs. In Proceedings of the 16th InternationalSymposium on Graph Drawing (GD’08), volume 5417 of Lecture Notes inComputer Science, pages 396–407. Springer-Verlag, 2009.
[KZ09] Pushpa Kumar and Kang Zhang. Node overlap removal in clustereddirected acyclic graphs. Journal of Visual Languages and Computing,20(6):403–419, 2009.
[Ler05] Jurgen Lerner. Role assignments. In Brandes and Erlebach [BE05], pages216–252.

834 CHAPTER 26. SOCIAL NETWORKS
[LG66] Edward O. Laumann and Louis Guttman. The relative associational con-tiguity of occupations in an urban setting. American Sociological Review,31:169–178, 1966.
[LMR98] Kelly A. Lyons, Henk Meijer, and David Rappaport. Algorithms for clus-ter busting in anchored graph drawing. Journal of Graph Algorithms andApplications, 2(1):1–24, 1998.
[Lon48] T.Wilson Longmore. A matrix approach to the analysis of rank and statusin a community in peru. Sociometry, 11(3):192–206, 1948.
[LP49] R. Duncan Luce and Albert Perry. A method of matrix analysis of groupstructure. Psychometrika, 14:95–116, 1949.
[LPA+09] David Lazer, Alex Pentland, Lada Adamic, Sinan Aral, Albert-LaszloBarabasi, Devon Brewer, Nicholas Christakisand Noshir Contractor,James Fowler, Myron Gutmann, Tony Jebara, Gary King, Michael Macy,Deb Roy, and Marshall Van Alstyne. Computational social science. Sci-ence, 323(5915):721–723, 2009.
[Mak90] Erkki Makinen. How to draw a hypergraph. International Journal ofComputer Mathematics, 34(3-4):177–185, 1990.
[MBK97] Cathleen McGrath, Jim Blythe, and David Krackhardt. The effect ofspatial arrangement on judgments and errors in interpreting graphs. SocialNetworks, 19(3):223–242, 1997.
[MELS95] Kazuo Misue, Peter Eades, Wei Lai, and Kozo Sugiyama. Layout adjust-ment and the mental map. Journal on Visual Languages and Computing,6(2):183–210, 1995.
[MH01] Matthias Muller-Hannemann. Drawing trees, series-parallel digraphs, andlattices. In Michael Kaufmann and Dorothea Wagner, editors, DrawingGraphs: Methods and Models, volume 2025 of Lecture Notes in ComputerScience, pages 46–70. Springer, 2001.
[Mis07] Kazuo Misue. Anchored maps: Visualization techniques for drawing bi-partite graphs. In The Human-Computer Interaction International Con-ference Proceedings (HCII 2007), volume 4551 of Lecture Notes in Com-puter Science, pages 106–114. Springer-Verlag, 2007.
[Mit94] J. Clyde Mitchell. Situational analysis and network analysis. Connections,17(1):16–22, 1994.
[MMBd05] James Moody, Daniel A. McFarland, and Skye Bender-deMoll. Dynamicnetwork visualization. American Journal of Sociology, 110(4):1206–1241,2005.
[Mor46] Jakob L. Moreno. Sociogram and sociomatrix: a note to the paper byForsyth and Katz. Sociometry, 9:348–349, 1946.
[Mor53] Jakob L. Moreno. Who Shall Survive? Foundations of Sociometry, GroupPsychotherapy, and Sociodrama. Beacon House, 1953. Originally pub-lished in 1934.
[New61] Theodore M. Newcomb. The Acquaintance Process. Holt, Rinehart &Winston, 1961.
[Nor40] Mary L. Northway. A method for depicting social relationships obtainedby sociometric testing. Sociometry, 3(2):144–150, 1940.
[Nor52] Mary L. Northway. A Primer of Sociometry. University of Toronto Press,1952.

REFERENCES 835
[Nor54] Mary L. Northway. A plan for sociometric studies in a longitudinal pro-gramme of research in child development. Sociometry, 17(3):272–281,1954.
[Nor96] Stephen C. North. Incremental layout with DynaDag. In Brandenburg[Bra96], pages 409–418.
[OS07] Hiroki Omote and Kozo Sugiyama. Method for visualizing complicatedstructures based on unified simplification strategies. IEICE Transactionson Information and Systems, E90-D(10):1649–1656, 2007.
[PCJ97] Helen C. Purchase, Robert F. Cohen, and Murray James. An experimen-tal study of the basis for graph drawing algorithms. ACM Journal ofExperimental Algorithmics, 2(4), 1997.
[Pet99] W. M. Flinders Petrie. Sequences in prehistoric remains. Journal of theAnthropological Institute of Great Britain and Ireland, 29(3/4):295–301,1899.
[PNK10] Ruth Pfosser, Helmut Neundlinger, and Harald Katzmair. Die un-verbruchliche Solidaritat in einer Extremsituation und die Fahigkeit, sichzu befreien. Das ist Spanien. Der Standard, 13. Juli, 2010.
[PNR08] Christian Pich, Lev Nachmanson, and George G. Robertson. Visual anal-ysis of importance and grouping in software dependency graphs. In Pro-ceedings of the ACM 2008 Symposium on Software Visualization (SOFT-VIS 2008), pages 29–32, 2008.
[PS08] Helen C. Purchase and Amanjit Samra. Extremes are better: Investigat-ing mental map preservation in dynamic graphs. In Proceedings of the 5thInternational Conference on Diagrammatic Representation and Inference(Diagrams 2008), volume 5223 of Lecture Notes in Computer Science,pages 60–73. Springer-Verlag, 2008.
[RCE06] Jon Ducrou Richard Cole and Peter Eklund. Automated layout of smalllattices using layer diagrams. In Proceedings of the 4th International Con-ference on Formal Concept Analysis (ICFCA’06), volume 3874 of LectureNotes in Computer Science, pages 291–305. Springer-Verlag, 2006.
[RF10] Nathalie Riche and Jean-Daniel Fekete. Novel visualizations and inter-actions for social networks exploration. In Handbook of Social NetworkTechnologies and Applications [Fur10], pages 611–636.
[RZF08] Peter Rodgers, Leishi Zhang, and Andrew Fish. General Euler diagramgeneration. In Proceedings of the 5th International Conference on the The-ory and Application of Diagrams (Diagrams’08), volume 5223 of LectureNotes in Artificial Intelligence, pages 13–27. Springer-Verlag, 2008.
[SA06] Ben Shneiderman and Aleks Aris. Network visualization by semanticsubtrates. IEEE Transactions on Visualization and Computer Graphics,12(5):733–740, 2006.
[SAA09] Paolo Simonetto, David Auber, and Daniel Archambault. Fully automaticvisualisation of overlapping sets. Computer Graphics Forum, 28(3):967–974, 2009.
[Sco00] John Scott. Social Network Analysis: A Handbook. Sage, 2nd edition,2000.
[Sei83] Stephen B. Seidman. Network structure and minimum degree. SocialNetworks, 5:269–287, 1983.

836 CHAPTER 26. SOCIAL NETWORKS
[SJUS08] Hans-Jorg Schulz, Mathias John, Andrea Unger, and Heidrun Schu-mann. Visual analysis of bipartite biological networks. In Proceed-ings of the Eurographics Workshop on Visual Computing for Biomedicine(VCBM 2008), pages 135–142. Eurographics, 2008.
[SM07] Zeqian Shen and Kwan-Liu Ma. Path visualization for adjacency matri-ces. In Proceedings of the 9th Eurographics/IEEE-VGTC Symposium onVisualization (EuroVis ’07), pages 83–90. Eurographics, 2007.
[ST10] Rodrigo Santamarıa and Roberto Theron. Visualization of intersectinggroups based on hypergraphs. IEICE Transactions on Information andSystems, E93-D(7):1957–1964, 2010.
[Tuf83] Edward R. Tufte. The Visual Display of Quantitative Information. Graph-ics Press, 1983.
[vHSD09] Frank van Ham, Hans-Jorg Schulz, and Joan M. Dimicco. Honeycomb: Vi-sual analysis of large scale social networks. In Proceedings of the 13th IFIPConference on Human-Computer Interaction (INTERACT 2009), volume5727 of Lecture Notes in Computer Science, pages 429–442. Springer-Verlag, 2009.
[vHW08] Frank van Ham and Martin Wattenberg. Centrality based visualizationof small world graphs. Computer Graphics Forum, 27(3):975–982, 2008.
[Wat06] Martin Wattenberg. Visual exploration of multivariate graphs. In Proceed-ings of the SIGCHI Conference on Human Factors in Computing Systems(CHI ‘06), pages 811–819, 2006.
[WB88] Barry Wellman and Stephen D. Berkowitz, editors. Social Structures: ANetwork Approach. Cambridge University Press, 1988.
[Wer44] Max Wertheimer. Gestalt Theory. Hayer Barton Press, 1944.
[WF94] Stanley Wasserman and Katherine Faust. Social Network Analysis: Meth-ods and Applications. Cambridge University Press, 1994.
[WG98] Karl Erich Wolff and Siefgried Gabler. Comparison of visualizations in for-mal concept analysis and correspondence analysis. In Michael Greenacreand Jorg Blasius, editors, Visualization of Categorical Data, pages 85–97.Academic Press, 1998.
[Why43] William F. Whyte. Street Corner Society. University of Chicago Press,1943.
[Win94] William D. Winn. Contributions of perceptual and cognitive processes tothe comprehension of graphics. In W. Schnotz and R.W. Kulhavy, editors,Comprehension of Graphics, number 108 in Advances in Psychology, pages3–27. Elsevier, 1994.
[WM96] Xiaobo Wang and Isao Miyamoto. Generating customized layouts. InBrandenburg [Bra96], pages 504–515.
[Wol07] Alexander Wolff. Drawing subway maps: Asurvey. Informatik - Forschungund Entwicklung, 22(1):23–44, 2007.
[XTT+10] Kaikuo Xu, Changjie Tang, Rong Tang, Ghulam Ali, and Jun Zhu. Acomparative study of six software packages for complex network research.In Proceedings of the 2nd International Conference on CommunicationSoftware and Networks (ICCSN ’10), pages 350–354, 2010.
[ZSE05] Lanbo Zheng, Le Song, and Peter Eades. Crossing minimization problemsof drawing bipartite graphs in two clusters. In Proceedings of the 2005

REFERENCES 837
Asia-Pacific Symposium on Information Visualisation (APVis ’05), pages33–37. Australian Computer Society, 2005.