social media benchmarking: beyond sentiment and share of voice, presented by troy janisch
TRANSCRIPT

SOCIALMEDIA.ORG/SUMMIT2016ORLANDOJANUARY 25–27, 2016
Social media benchmarking: Beyond sentiment and shareof voice
TROY JANISCHU.S. BANK

Social Media Benchmarking: Beyond Sentiment
& Share of Voice
Troy Janisch,
Director of Social Intelligence
U.S. Bank

Data can be eye-opening
Not a Snoozer
Three ‘actionable’ insights: One… to find them. One… to gather them. One… to bind them. One to rule them all.

• Heavy focus on marketing as an ‘art.’
• Attempt to copy success without quantifying goals or using data to identify leading tactics
• Can articulate a desire to be more data driven
• Focus on high-level metrics
• Lacks an established cadence
• Lacks specific goals for metric improvements.
• Clear, regular cadence to measurement.
• Knows key metrics across channels and has specific goals for improvement
• Understands how to measure marketing ROI
• Benchmarking is ongoing and pervasive
• Periodic reporting is standard, though often over longer periods of time (quarterly)
• Patterns of successful tactics are identified but not translated to clear test cases.
The Evolution of Social Insight

• “I think we’re doing better than the se competitors”
• “These competitors are doing better than us. I think its because…”
• INSTINCT DRIVEN
• “DO SOMETHING”
• “These companies and competitors are ranked high. We can learn by watching what they are doing before we act.
• LEADER DRIVEN ANECDOTAL COMPARISON
• “KNOW SOMETHING”
• “These are the improvements we can make to gain market share and improve sentiment going forward. INTERPRETING DATA, LOOKING FORWARD DEEP, FOCUSED COMPARISON
• “WHAT WE CAN DO”
• Here’s how we compare against these competitors in Share of Voice and sentiment. INTERPRETING DATA, LOOKING BACKWARD HIGH LEVEL COMPARISON
• “HOW WE COMPARE”
The Evolution of Benchmarking

Problems we have
Strategy
Segmentation Targeting Positioning Product
Tactics
Social Channel Content Format Ad Format
Creative
Copy/Voice Images Video
Statistics
Not Enough Data Bad Experiment Design Video Correlation vs Cause
When you’re wrong, you don’t don’t know it.
OR
Real problems that we need to test Data problems

Social Data: Estimating a Proportion
•A less reliable sample
•Higher Probability of being wrong (and not knowing it)
•Easier & more affordable
Accept Raw Data
•A more reliable sample
•More confidence that you’re right
•Takes more work (resources or $$)
Adjust the Data

Danger Hidden Third Factor
Hidden Thing
Opportunity or Problem
Observable
Insight
Observable
Insight
Lurking Variables
The tendency for items that are correlated (best time to post on Facebook) to appear as causes (quality of content)

Sentiment:Don’t Work Without a Net
Using Net Sentiment
Calculate sentiment on a scale of -5. to +5, excluding mentions with neutral sentiment. Improves ‘readability’ and comparability over time.
Calculations difference = positive - negative sum = positive + negative net sentiment = (difference / sum)*5
Brand Negative Positive Total Volume Share of Voice Net
Sentiment
Bank of America 6.93% 11.42% 85,123 28.1% 1.2
Chase 7.18% 9.55% 43,875 14.5% 0.7
Citibank 3.98% 7.54% 41,110 13.6% 1.5
Fifth Third 5.42% 17.47% 3,046 1.0% 2.6
PNC 6.95% 11.65% 12,410 4.1% 1.3
U.S. Bank 10.32% 5.82% 10,329 3.4% -1.4
Wells Fargo 4.64% 7.53% 107,402 35.4% 1.2

Courtesy of Jessica Mack (@js_mack)

Optimize Listening: Auditing
Auditing Considerations
Auditing = Accuracy. You need to audit (verify and adjust) sentiment for all brand mentions. Unadjusted, totals were: 757 positive and 312 negative (net sentiment +2.08) Social data to the left has an adjusted net sentiment of -1.22 A difference of 3.3 points What do you do for Benchmarking?

Optimize Listening: Unique Authors Unique Authors
337 positive from 306 authors ( 1.1 posts/author) 554 negative from 371 authors ( 1.5 posts/author) Unadjusted Net Sentiment: +2.08 Adjusted Net Sentiment: - 1.22 Unique Net Sentiment: - .01 (adjusted) - Removes 'Loudness' of serial/duplicate posters - Identifies detractor strength (1.5) - Identifies promoter strength (1.1) - Easily calculated
EXCEL FORMULA FOR IDENTIFYING UNIQUE AUTHORS =SUM(IF(FREQUENCY(MATCH(begin:end,begin:end,0), MATCH(begin:end,begin:end,0))>0,1))

Share of Voice: Not All Mentions are Equal Eliminate “clutter”
- Job Postings - Checkins
Create Meaningful Categories
- Product - Customer Service - Philanthropy/Sponsorship/Event
Add Other Dimensions - Social Channel - Original vs Shared Content - Media Type

Share of Voice: Not All Mentions are Equal
Additional insights:
- Sentiment by Content Type - Engagement by Content Type

Social Media Benchmarking:
• Public “Influence” Scores, like Kred and Klout
– Pros: Publicly available, one score to compare across organizations
– Issues: Dependent on organizations connecting social networks with scoring system, scoring systems are vague “black boxes”, unable to cater to our needs
• Brandwatch Impact Score
– Pros: Takes into account time period defined to account for posting behavior and impact during that time
– Cons: Proprietary (dependent on our continued use of Brandwatch), scoring system still vague and unable to duplicate, unable to cater to our needs
• Build our own scoring system using Public data
– Pros: Public data always available, able to cater to specific needs/situation
– Cons: We need to create/update/calculate ourselves
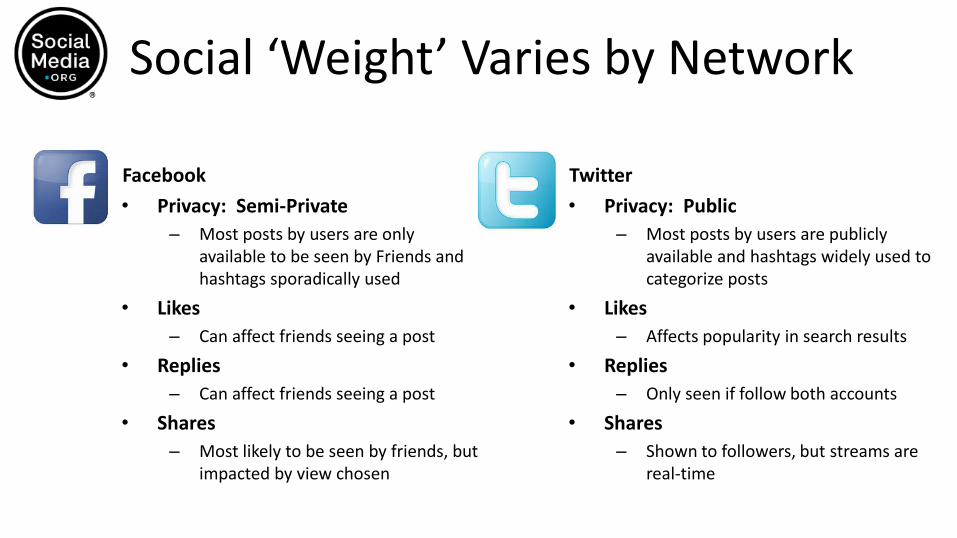
Social ‘Weight’ Varies by Network
• Privacy: Semi-Private
– Most posts by users are only available to be seen by Friends and hashtags sporadically used
• Likes
– Can affect friends seeing a post
• Replies
– Can affect friends seeing a post
• Shares
– Most likely to be seen by friends, but impacted by view chosen
• Privacy: Public
– Most posts by users are publicly available and hashtags widely used to categorize posts
• Likes
– Affects popularity in search results
• Replies
– Only seen if follow both accounts
• Shares
– Shown to followers, but streams are real-time

Not All Engagement is Equal
Number of Posts / Number of Comments (or Replies) = Conversation Rate
Posts / Number of Retweets (or Shares) = Amplification Rate
Number of Posts / Number of Likes (or Favorites) = Applause Rate

Three Kinds of Campaigns: Different types of campaigns. Each highlights different objectives and KPIs on their scorecard:
1 Awareness
2 Engagement
3 Acquisition

Awareness Awareness: How many people do we reach? – Measurements include: – Impressions – Organic Reach – Promoted Reach – Ad Reach – Buzz – Share of Voice
Consideration Consideration: How is the campaign being received and are we leveraging any influencers detractors?
Measurements include:
• Sentiment
• Clicks
• Comments/Replies
• Shares/Retweets
• Completions [Video/Quiz/activity]

Conversion
Conversion: How many people completed the action we predetermined during the objective phase?
Measurements include:
• Application Starts/Submits
• New Accounts
• View a video segment in its entirety or for :30+?
• Lead Form/Inquiry Completion
• Referral to MLO or Wealth Manager

Scorecards Vary: Consistently

Scorecards Vary: Consistently

Make Business Decisions with Social Data
Social Data is Business Data If you ONLY use social data to measure social performance YOU ARE MISSING THE MOST POWERFUL INSIGHTS. Social Data is an inventory of conversations of every conceivable topic, product, or idea Inventory varies. The more specific the topic is, the more further backwards in time you’ll need to look.

Challenges measuring the impact of social
• It’s easier to measure activity than impact and intent.
• The path from volume-based metrics (volume of impressions, engagement and clicks) to conversions is long and winding.
• Social activity today represents future revenue opportunities.
• Social metrics are often gathered and utilized at the end of a campaign.
• Integrating social metrics with offline performance metrics can be challenging
All Business is Social Business
Social Funnel
Engagement
Sentiment
Buzz
Impressions

Opportunities measuring the impact of social
• Attaching brand awareness to impressions demonstrates the impact of social content – Unaided/aided brand awareness (+/-)
• Attaching brand perception to sentiment, demonstrates the influence of social content – Brand perception (+/-)
• Attaching brand attachment to engagement demonstrates likeliness/intent to buy – Brand attachment (+/-)
Integrated Social Funnel
Consideration
[Engagement]
Attachment & Perception
[Sentiment & Buzz]
Awareness
[Impressions]
Socializing the Brand Funnel

Meet SessionM SessionM: A loyalty and engagement platform
• Reaches more than 100 million consumers monthly.
• Personalized, opt-in experience that rewards consumers for their participation.
• Users get rewarded with mPOINTS, a universal currency
• Consumers redeem those mPOINTS for gift cards, merchandise, entries into sweepstakes or charitable donations

Brand Perceptions of Customers 1. MEASURE BANKING BELIEFS & HABITS
• Leverage customer segmentation within SessionM’s mobile audience to measure effectiveness of social content
• Pre- and Post- Measurement: – brand awareness (+/-) – brand perception (+/-) – brand attachment (+/-)
• Benchmarking against competitors identified by customer segment

How Social Content Moves Customers 2. SHARE SOCIAL CONTENT & CAMPAIGNS
• Measure the overall effectiveness of social campaigns by delivering all content to customers.
• Measure the effectiveness of individuals videos, posts, and ads among customers
• Pre- and Post- Measurement: – brand awareness (+/-) – brand perception (+/-) – brand attachment (+/-)

Participant Survey 3. MEASURE THE IMPACT OF SOCIAL CAMPAIGNS & CONTENT
Integrated Social Funnel
Consideration
[Engagement]
Attachment & perception
[Sentiment & Buzz]
Awareness
[Impressions]

Advantages to This Approach
• Meaningful brand metrics for all social campaigns and content.
• Provides benchmarking against key competitors
• Tactic can be adapted to leverage other target markets
• Tactics can be expanded for all digital marketing tactics
• Limited/no additional funds required to implement.
Program Benefits:

Thank You Troy Janisch, Director of Social Analytics, US Bank [email protected] @socialmeteor www.socialmeteor.com

Learn more about past andupcoming events
SOCIALMEDIA.ORG/EVENTS
SOCIALMEDIA.ORG/SUMMIT2016ORLANDOJANUARY 25–27, 2016