social interactions between native and non-native students...
TRANSCRIPT
1
Social interactions between native and non-native students:
mechanisms and evidence
Marco Tonello1
Preliminary draft
This version: November 16, 2011
Abstract
This paper focuses on mechanisms of ‘social interactions’ between native and
non-native students. We present a theoretical framework based on Lazear (2001)
education production function and test the theoretical predictions exploiting an
extremely rich and totally new dataset of Italian junior high schools. Our results
show that non-native school share has small and negative impacts on Language test
scores of natives’ peers, while it does not significantly affect Math test scores. The
‘disruptive mechanism of native/non-natives peer interactions’ is partly rejected by
the empirical analysis, which rather support the ‘integration model’. In fact, as long
as non-native school share is sufficiently low, non-native students presence is not
able to generate negative spillovers on natives’ outcomes suggesting that an
‘integration mechanism’ is at work. In particular, for sufficiently low values of non-
native school share (below 10%), non-native students do not significantly affect
natives’ attainment. Interestingly, all the results show that Language skills are the
most influenced by peer interactions between natives and non-natives.
JEL Classification: J15, I21, I28
Keywords: peer effects, native and non-native students, social interactions mechanisms
1 DEFAP, Graduate School in Public Economics (Catholic University Milan, University of Milan-Bicocca). I would
like to thank Claudio Lucifora, Graziella Marzi, Paolo Sestito (Bank of Italy), Piero Cipollone (World Bank and Bank
of Italy), Simona Comi, Daniele Checchi; I am indebted to Claudio Rossetti (Luiss), Patrizia Falzetti (Invalsi) and
Marco Mignani (Invalsi) for their work in making available the dataset. I also thank participants to IV IEB Summer
School on ‘Immigration and Public Policy’, 14th
IZA Summer School in Labor Economics, Mauro Testaverde and
Paolo Ghinetti for helpful comments. The usual disclaimers apply.
2
1. Introduction and motivation
In the last two decades, a lot of Western countries have experienced massive immigration
waves. Despite the growing relevance of this phenomenon in Europe, and the well-established
desegregation literature in the U.S., studies investigating peer interactions between native and non-
native students in European schools are just a few. Although it is widely accepted that non-native
students typically face more problems at school and have lower scores in standardized tests, causes,
consequences and possible policy implications of such interactions are still unclear (OECD, 2010).
Moreover, while there is a vast literature on the effects of immigration on natives’ labour market
outcomes, economic literature on the effects of non-native students on native peers’ attainment
levels is quite limited, and the specific question of whether non-native peers affect natives’
educational outcomes has received relatively little attention and presents mixed evidence (Brunello
and Rocco, 2011; Gould et al., 20092).
The first study mentioning the contribution that the school ethnic composition has on the
individual achievement is the ‘Coleman Report’ (Coleman, 1966)3. Starting from Coleman (1966),
scholars in the sociology of education have long argued that, apart from students’ ability and
background, peers influence and class ethnic composition are important determinants of students’
achievement (Kramarz et al., 2008). However, there is not clear evidence on possible consequences
of social interactions between natives and non-natives in educational settings, and it might happen
that such interactions (if they exist) could tend either to increase or decrease the existing attainment
gaps. For instance, Jensen and Rasmussen (2011) find a negative effect of school ethnic
concentration on cognitive outcomes for Danish native students4. Brunello and Rocco (2011)
provide cross-country evidence of a negative but small effect of the share of immigrants on natives’
educational attainment exploiting PISA data for a sample of 27 countries (mainly from Europe and
the Anglo-Saxon world). On top of that, even less is known on the possible underlying mechanisms
that such peer interactions may follow (De Giorgi and Pellizzari, 2011).
The study of peer interactions between native and non-native students has also important
policy implications ranging from the implementation of re-allocation programs (e.g. the ‘Boston
2 “[...] the effect of immigration on the local labour market has received considerable attention in the literature, but
little is known about the impact of immigration on the school system”, Gould et al. (2009). 3 “[...] those inputs characteristics of schools that are most alike for Negroes and whites have least effect on their
achievement. The magnitudes of differences between schools attended by Negroes and those attended by whites were as
follows: least, facilities and curriculum; next, teacher quality; and greatest, educational backgrounds of fellow
students. The order of importance of these inputs on the achievement of Negro students is precisely the same: facilities
and curriculum least, teacher quality next, and backgrounds of fellow students, most”, Coleman (1966). 4 Evidence on school composition and immigrant lower test scores for Denmark and Switzerland is also provided by
Schindler (2007) and Meunier (2010), respectively.

3
Moving To Opportunity Program’, Angrist and Lang 2004, and many others implemented in the US
under a wide variety of desegregation programs), to non-native students allocation rules across
classes or schools, or even ‘share-cap’ rules that fix a maximum level to non-native students
concentration in each school. Nevertheless, economic literature has not yet find a clear answer to
the basic question of whether non-native students significantly affects natives’ attainment and the
effectiveness of desegregation programs is still a controversial issue (see, among others, Hanusheck
and Rivkin 2009, Fryer 2011).
The Italian context offers a particularly interesting case-study. Contrary to many other
European countries, immigration flows to Italy and the consequent presence of immigrant children
in the Italian school system have a relatively recent history. Italy experienced only limited
immigration before 1970, and until the early Nineties there was a substantial internal migration
(from the South to the North) and still relevant external migration. Massive immigration to Italy
from North Africa first, and Eastern countries then, only started in the Nineties, but sharply
increased over the last decade (Mencarini et al., 2009). The foreign resident population has risen
rapidly: in 1999 it only accounted for 1.9% of the total resident population in Italy, in 2008 the
share of foreign residents has grown up until 7.3% (Billari and Dalla Zuanna, 2008)5. As a
consequence, ‘non-native students’ are nowadays a relevant part of the total school population: in
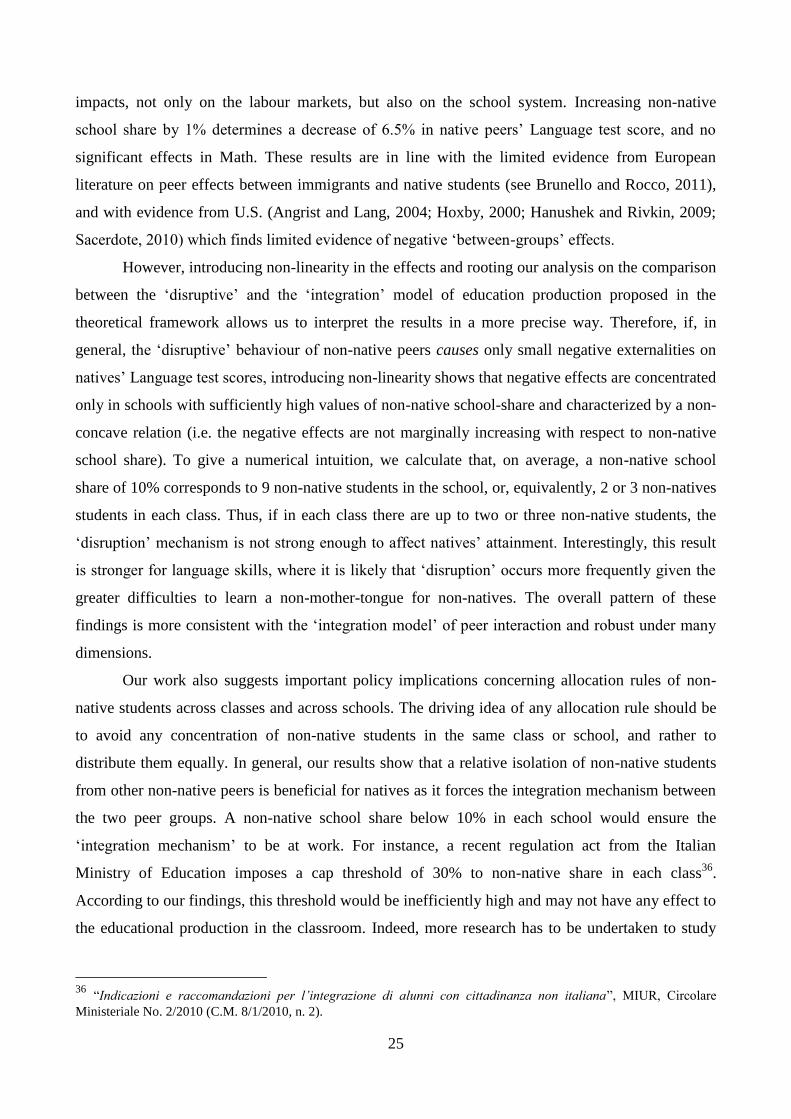
1996-97, only 0.7% of students in the Italian school system had a non-Italian citizenship, while in
2008-09 the average percentage has grown up to 7.0%, with peaks of more than 8% in primary and
junior high schools (Figure 1). In this setting, massive migration waves generate a wide range of
occasions of peer interactions between students of different ethnic origins giving rise to a
quantitatively large, but relatively unknown, phenomenon.
The aim of the paper is twofold. On the one hand, we propose a theoretical framework to
stylize the possible mechanisms of peer interactions between native and non-native students based
on ‘disruption’ vs. ‘integration’ models of education production. On the other hand, we test the
theoretical predictions identifying the causal link between non-natives’ school concentration and
native students’ educational outcomes6. The main research questions we want to answer are the
following: is the ‘disruption mechanism’ sufficient to explain peer effects between native and non-
5 Data from Billari and Dalla Zuanna (2008) are more realistic than the official Istat statistics as the foreign resident
population in Italy includes both documented and estimated undocumented non-Italian citizens. In the school context, it
is worthy to consider both documented and undocumented immigrants, given that all immigrant children, independently
from their legal or illegal residential status have the right and the duty to go to school (DPR 394/99, art. 45). 6 Data from Italian Ministry of Education generally only distinguish between Italian and non-Italian students, thus
referring to a pure citizenship criterion. In the reminder of the paper we define to as ‘non-native’ student an individual
enrolled in the Italian school system and having both parents without Italian citizenship. This definition coincides with
the definition of the Italian Ministry of Education Statistical Service (MIUR 2009a) of ‘non-Italian students’. Notice
that if a student has one of the parents who is Italian, he automatically gains the Italian citizenship (because of the ius
sanguinis rule) and so he is defined as ‘native student’ independently from the country of birth.
4
native students? Does non-native school share induce negative peer effects on natives’ attainment?
Do different levels of non-native school share have different impacts on natives’ attainments? We
use as outcome measure attainment levels contained in an extremely rich and totally new dataset
combining INVALSI First Cycle Exams (test scores of all 8th
grade students enrolled in Italian junior
high schools7) with census and administrative records on schools characteristics and socio-
economic environment.
In particular, the theoretical models are based on Lazear (2001) model of education
production. We assume that non-native and native students are characterized by different levels of
propensity to ‘disrupt’8 so that it is possible to identify two types of students. Thus, in mixed
schools, the presence of non-native students (i.e. the disruptive type) generate negative spill-overs
(i.e. peer effects) on natives’ attainment levels and this effect is marginally decreasing with respect
to non-native share. This framework stems from an underlying ‘bad apple principle’ which is
incorporated in the education production function à la Lazear proposed: one ‘disruptive student’ is
enough to generate bad spill-overs on all the class, and the greater is the concentration of more
‘disruptive types’, the lower will be the increase of the negative effects. This mechanism is partially
rejected by the empirical analysis proposed, which rather shows that, as long as non-native school
share is sufficiently low, non-native students presence is not able to generate negative peer effects
on natives’ outcomes. Thus, the ‘integration model’ is more consistent with the empirical findings
because it predicts that for ‘sufficiently low’ values of non-native school share, non-natives
students’ disruption is not able to hurt the educational production process because non-native are
more integrated with native peers. From the empirical point of view, solving serious problems of
sorting and omitted variables bias is crucial in the correct identification of the effect. Our
identification strategy exploits the within school idiosyncratic variation in non-native share between
adjacent cohorts and it is based on school-level averages in order to sidestep the non-random
allocation of non-native students across classes and school fixed effects and selection on
observables to control across school sorting and non-native students endogenous placement (Hoxby,
2000; Gould et al. 2009; Brunello and Rocco, 2011).
This paper contributes to the existing literature in a number of ways. It provides new
evidence on peer effects between native and non-native students linking the empirical results to a
clear theoretical framework in order to understand which possible mechanisms and which channels
peer effects are following and shed light on the interpretation of the results. Thanks to its wide and
7 8
th grade students, i.e. students finishing their third year of the Italian middle grade comprehensive school. The Italian
‘Junior High School Diploma’ corresponds to ISCED level 2. 8 This hypothesis can be justified in a number of ways, for instance, non-native students are more likely to interrupt the
class learning process because they typically need more help from teachers.
5
original dataset, it overcomes problems of under-representation of immigrant shares typical of
survey data. Moreover, to our knowledge, it is the first study on peer interactions in the Italian
junior-high schools contexts, and one of the few studies in the European contexts9. Our results show
that non-native school share has small and negative impacts on Language test scores of natives’
peers, while it does not significantly affect Math test scores. Negative effects on natives’ test scores
are significantly different from zero only for sufficiently high values of non-native school-share and
characterized by a convex relation (i.e. marginally increasing with respect to non-native school
share). To give a numerical intuition of these results, we estimate that, if in each class there are up
to two or three non-native students, the ‘disruption’ mechanism is not strong enough to affect
natives’ attainment.
The rest of the paper is organized as follows: Section 2 presents a review of the literature;
Section 3 explains the theoretical framework, Section 4 describes the econometric model and
identification strategy designed to test the stylized predictions of the theoretical framework; Section
5 discusses the main characteristics of the dataset and provides general descriptive evidence;
Section 6 and Section 7 discuss the results and conduct sensitivity checks. Section 8 concludes and
derives some policy implications.
2. Literature
Empirical literature in the U.S. traditionally focused on achievement gaps between black (or
other minority students) and white students, and only in the last decade peer interaction has started
to be seen as one of the possible causes of many observed different behaviours between white and
black students (Heckman, 2011)10
. Early contributions were given by Evans, Oates and Schwab
(1992) and Cutler and Glaeser (1997), while Hoxby (2000), Hanushek et al. (2009) and Hanushek
and Rivkin (2009) are the first to define ‘racial peer effects’ as a particular group of social
interactions taking place between students belonging to different ethnic groups. Hoxby (2000)
9 Evidence on educational peer effects and social interactions in Italy is also limited, and focuses on high school
(Cipollone and Rosolia, 2007) or university contexts (Brunello, De Paola and Scoppa, 2010; De Paola and Scoppa
2010; De Giorgi, Pellizzari and Redaelli 2010; De Giorgi and Pellizzari, 2010). 10
The empirical analysis of the effects of non-native students’ on native peers educational outcomes stems from the
‘desegregation’ literature, which examines the effect of minority students on the achievements of the other students in
the U.S. schools. Early desegregation literature proposes a variety of analyses on the relationship between ethnic origins
and achievement (among the others: Armor, 1995; Cook, 1984; Crain et al. 1978), but does not consider social
interactions between native and non-native students as a potential educational input to explain the persistent attainment
gap. For decades economists and sociologists studied the effects of desegregation plans imposed by U.S. Courts,
starting from Brown vs. Board of Education, 347 U.S. 483 (1954). The ruling in Brown v. Board of Education (1954)
held that ‘separate but equal’, while not inherently unconstitutional in all areas, was unconstitutional in the case of
education because separate education for blacks and whites could not be equal. This ruling led to dramatic changes in
schools throughout the country (Hanushek et al., 2009).
6
exploits idiosyncratic variation in the racial and gender composition of adjacent cohorts within the
same grade and within the same school to estimate the effects of exposure to minority school share
on achievement of both white and minority students. Her results show that immigrant school share
has weak effects on students’ achievement, but these effects are generally higher within students of
the same ethnic group than between students belonging to different ethnic groups. Hanushek et al.
(2009) and Hanushek and Rivkin (2009) base the estimation strategy on individual fixed effects
retrieved tracking the same students and cohorts over time: the estimation of peer group effects
relies therefore on cohort differences in the changes in racial composition as students’ progress
through school. They find that black students test scores are strongly decreasing in the black school
share: their estimates imply that excess exposure of black students to black grade mates causes the
black-white test score gap to grow by 0.07 standard deviations with each year in school, but no
effects on white students. Card and Rothstein (2007) address the endogeneity of school and
neighbourhood choice by aggregating to the metropolitan level and relating the black–white
achievement gap in different cities to the degree of racial segregation in the area, as measured by
the black–white difference in relative exposure to minority neighbours and schoolmates. They reach
two main conclusions. First, there is a robust and quantitatively important negative relationship
between black relative test scores and the degree of segregation in different metropolitan areas.
Second, neighbourhood segregation seems to matter more than school segregation. They estimate
that the move from a highly segregated city to an integrated city is associated with a 45 point
narrowing of the black–white SAT Test score gap, which corresponds to about one quarter of the
raw differential
Outside the U.S., empirical evidence is still quite limited and generally points to a negative
effects of non-native school shares on native students attainments. In order to identify the causal
link of the immigrant concentration on the outcomes of natives, Gould et al. (2009) exploit the
variation in the number of immigrants in 5th
grade conditional on the total number of immigrant
students in grades 4 to 6. The approach is interesting and new under two main aspects: first, they
use quasi-experimental evidence claiming that early ’90 immigration waves in Israeli can be
considered as an exogenous variation in immigrants’ flows; second, they focus on long-term
outcomes (rather than contemporaneous peers’ outcomes effects). Their results point to a strong
adverse effect of immigrant concentration on native outcomes. Jensen and Rasmussen (2011)
analyse the effect of school ethnic concentration on children cognitive outcomes. They use a rich
dataset for Danish ninth-grade students, based on PISA test scores matched with administrative and
census information. In order to correct for the endogeneity in school ethnic concentration authors
apply school fixed-effects and IV, using as instrumental variable the ethnic concentration in a larger
7
geographical area where school is located. Results show that there is a negative effect of ethnic
concentration on students’ outcomes, and that this is significant only for the native Danish children.
Brunello and Rocco (2011) study whether a higher share of immigrant pupils affects the school
performance of natives using aggregate multi-country data from PISA, and find a negative but small
effect. The analysis is conducted exploiting aggregation at the country level to avoid sorting
problems of immigrant students within each country, while fixed effects and country socio-
economic indicators are used to solve the problem of across country sorting and time trends in
immigrants residential choices. They also find evidence that, conditional on the average share of
immigrant pupils, a reduction of the dispersion of this share between schools would have small
positive effects on the test scores of natives.
Theoretical literature on peer effects is still limited although, as outlined by De Giorgi and
Pellizzari (2011), focusing on the mechanisms of educational social interactions is crucial in order
to provide consistent interpretations of the empirical evidence. One notable exception is Cooley
(2009) who defines and estimates a structural model to explain the achievement gap between black
and white students. Estimating the model using data from North Carolina elementary schools and an
exogenous variation due to the a policy implementation, she finds that endogenous peer effects
within the peer groups are much stronger than between effects. The simulation of a desegregation
policy with the estimated coefficients shows that desegregation does not have strong average effects
on educational achievement, while it has substantial distributional consequences in narrowing the
gap at lower percentiles of the achievement distribution.
3. Theoretical framework
Exploiting and education production function (EPF) à la Lazear (2001), we propose two
possible mechanisms of social interactions between native and non-native students. The simple
‘disruption’ model predicts marginally decreasing negative externalities due to the presence of
‘disruptive type’: just one non-native student (the ‘more disruptive type’) determines large negative
effects on all students’ attainment (Lazear, 2001). On the other hand, the ‘integration model’
embeds the ‘subcultural model’ of interaction between white and blacks students proposed in the
U.S. sociological literature (Fordham and Ogbu, 1986; Steele and Aronson, 1998): non-native
students are more likely to be integrated with native peers if they are relatively isolated, so that they
are forced to interact to natives and natives to not bear high effort costs in integrating them. From a
general perspective, in the ‘subculture model’ the native student (majority type) makes effort to
integrate non-native students (minority type) as long as the latter is relatively isolated (Hoxby and

8
Weinghart, 2006). When, minority students become prevalent enough to form a critical mass, the
majority type rejects them. The ‘subculture’ model can also explain the evidence of ‘acting-white’
behaviours recently found in U.S. schools (Austen-Smith and Fryer, 2005; Fryer and Torelli, 2010).
3.1 The ‘disruption’ model
Disruption is a possible mechanism of peer interaction that directly influences the learning
process and the attainment levels through externalities caused by peers’ behaviour11
. The basic
assumptions we made are two: (i) one child’s disruption hurts the learning process of all students
(including the disruptive one); (ii) non-native students have a higher propensity to cause
interruptions during the learning process. Indeed, the ‘disruption mechanism’ of peer interaction
may actually follow many different channels and should not be necessarily associated to non-native
students’ ‘bad’ behaviour. For instance, it could be simply thought as non-native students’ need of
additional help which causes the teacher to slow down the activity of the entire class, as well as
non-native students’ propensity to interrupt the teachers because of more difficulties to understand
due to poorer language skills. We want to point out that this basic assumption does not concern the
‘unobserved ability’ of the types of students, which is indeed the same. It represents a stylized
assumption on the different ‘behaviours’ in the class which distinguishes the two types. The
descriptive evidence and discussion in Section 5 corroborates these hypotheses.
Formally, we implement an education production function à la Lazear (2001) where two types,
with different propensity to disrupt or to interrupt the lessons (native and non-native students),
interact in the school so that the misbehaviour of the ‘more disruptive’ type determines negative
externalities on the learning production process which are captured by negative peer effects on per
student outcome. Define p as the probability that any student is not hurting his own learning or
other’s learning at any moment in the time spent at school, and (1 – p) as the probability that any
given student initiates a ‘disruption’. Given a class size of n, the probability that disruption occurs at
any moment in time t is (1 – pn). Define V as the value of a unit of learning, which is influenced by
the likelihood that a student is not engaged in a disruptive behaviour in the given instant t, and Z the
total number of student in the school. Then, the total output for each school is given by Y=ZVpn,
and the output per student by y=Vpn. As discussed above, we assume that non-native students (j=F)
tend to interrupt more frequently (on average) with respect to native peers (j=N), so that we can
identify to types of students (j=N, F) according to different values of pj, being pN > pF. Finally,
11
De Giorgi and Pellizzari (2011), Epple and Romano (2011) and Sacerdote (2010) point to Lazear (2001) model as
one of the potential model of peer interaction in the classroom, as well as Hoxby and Weinghart (2006) include the ‘Bad
Apple model’ in their analysis of possible model of peer interaction in the classroom.
9
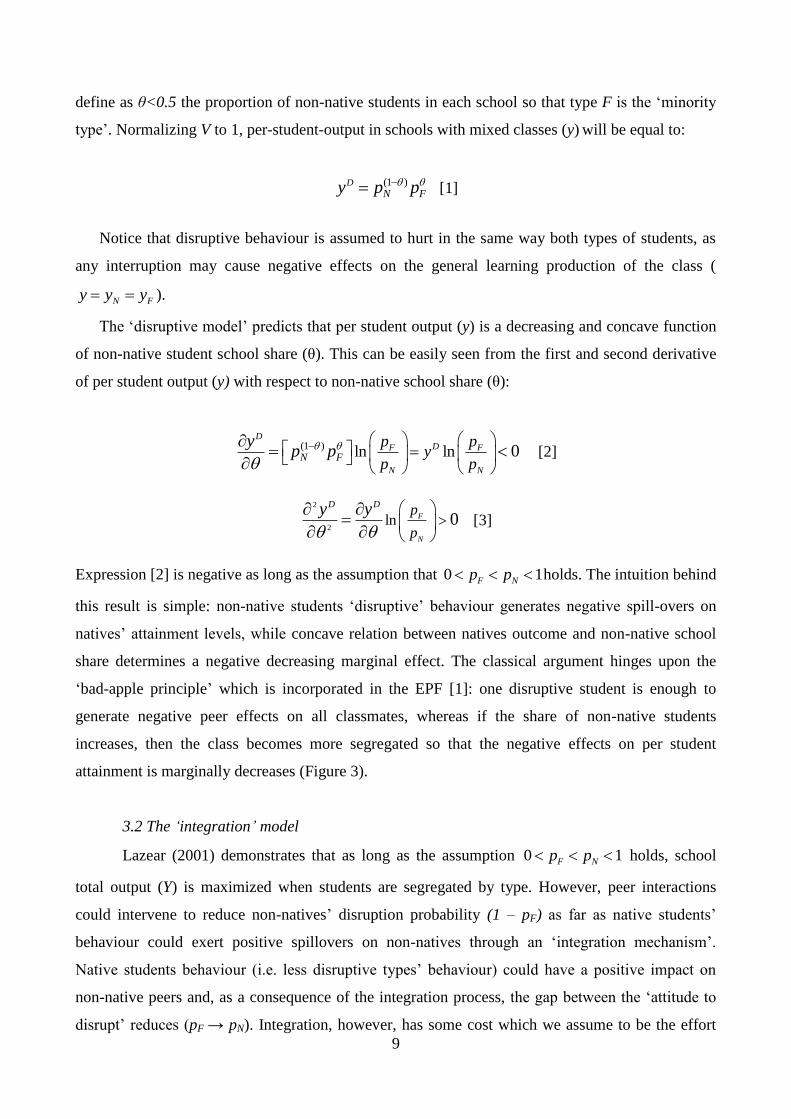
define as θ<0.5 the proportion of non-native students in each school so that type F is the ‘minority
type’. Normalizing V to 1, per-student-output in schools with mixed classes (y) will be equal to:
(1 )D
N Fy p p [1]
Notice that disruptive behaviour is assumed to hurt in the same way both types of students, as
any interruption may cause negative effects on the general learning production of the class (
N Fy y y ).
The ‘disruptive model’ predicts that per student output (y) is a decreasing and concave function
of non-native student school share (θ). This can be easily seen from the first and second derivative
of per student output (y) with respect to non-native school share (θ):
(1 ) ln ln 0D
DF F
N N
N F
p py
p p
yp p
[2]
2
2ln 0F
N
D Dp
p
y y
[3]
Expression [2] is negative as long as the assumption that 0 1F Np p holds. The intuition behind
this result is simple: non-native students ‘disruptive’ behaviour generates negative spill-overs on
natives’ attainment levels, while concave relation between natives outcome and non-native school
share determines a negative decreasing marginal effect. The classical argument hinges upon the
‘bad-apple principle’ which is incorporated in the EPF [1]: one disruptive student is enough to
generate negative peer effects on all classmates, whereas if the share of non-native students
increases, then the class becomes more segregated so that the negative effects on per student
attainment is marginally decreases (Figure 3).
3.2 The ‘integration’ model
Lazear (2001) demonstrates that as long as the assumption 0 1F Np p holds, school
total output (Y) is maximized when students are segregated by type. However, peer interactions
could intervene to reduce non-natives’ disruption probability (1 – pF) as far as native students’
behaviour could exert positive spillovers on non-natives through an ‘integration mechanism’.
Native students behaviour (i.e. less disruptive types’ behaviour) could have a positive impact on
non-native peers and, as a consequence of the integration process, the gap between the ‘attitude to
disrupt’ reduces (pF → pN). Integration, however, has some cost which we assume to be the effort
10
made by native students to integrate non-native peers. Intuitively, if non-native students are
relatively isolated, then the integration mechanism is less costly for native students, whereas
anytime non-native students become prevalent enough to form a critical mass, the native type
rejects them because the effort of integration becomes too high. Actually, the rejection may be due
to different reasons: natives may be willing to make sufficient effort to include a few minority
members but unwilling to make the effort to include numerous non-native schoolmates and but also
unwilling to include some non-native students while rejecting others (Hoxby and Weingarth, 2005).
Also a specular argument for non-native students is true: when non-native students are relatively
more isolated they are forced to interact with native peers.
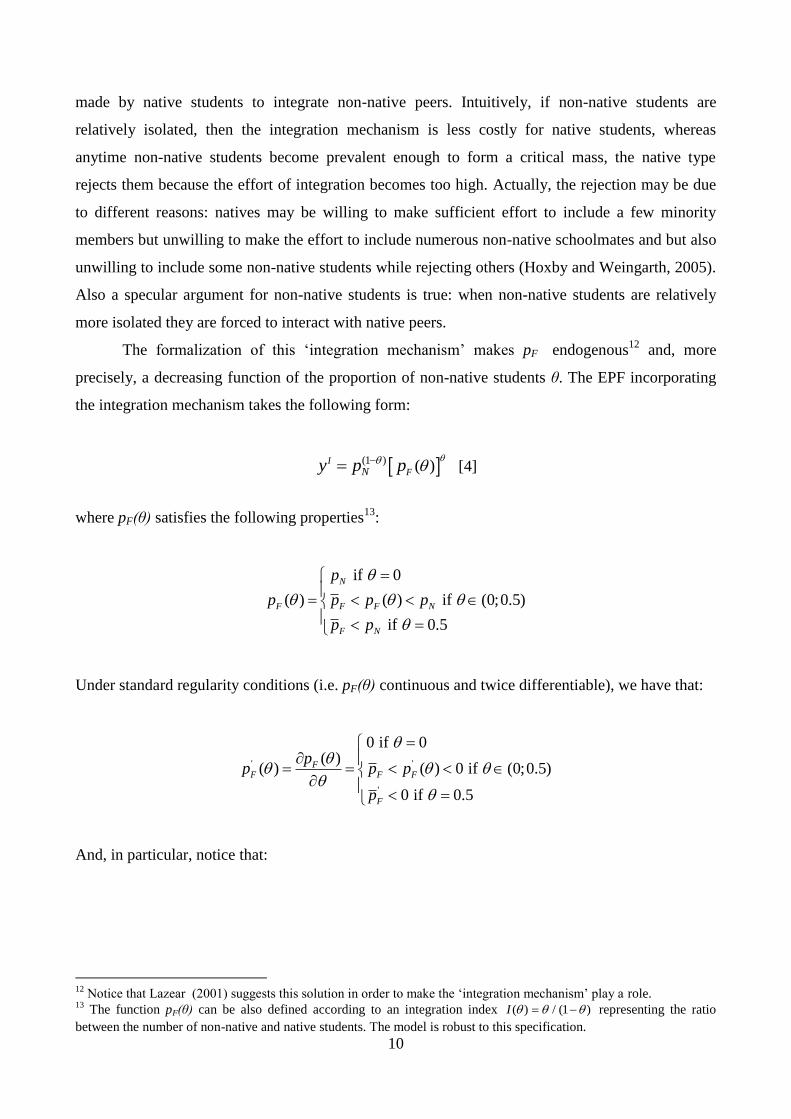
The formalization of this ‘integration mechanism’ makes pF endogenous12
and, more
precisely, a decreasing function of the proportion of non-native students θ. The EPF incorporating
the integration mechanism takes the following form:
(1 ) ( )I
FNy p p [4]
where pF(θ) satisfies the following properties13
:
if 0
( ) ( ) if (0;0.5)
if 0.5
N
F F F N
F N
p
p p p p
p p
Under standard regularity conditions (i.e. pF(θ) continuous and twice differentiable), we have that:
' '
'
0 if 0( )
( ) ( ) 0 if (0;0.5)
0 if 0.5
FF F F
F
pp p p
p
And, in particular, notice that:
12
Notice that Lazear (2001) suggests this solution in order to make the ‘integration mechanism’ play a role. 13
The function pF(θ) can be also defined according to an integration index ( ) / (1 )I representing the ratio
between the number of non-native and native students. The model is robust to this specification.
11
'
' '
if 0 ( ) and ( ) 0
if 0.5 ( ) and ( )
F N F
F F F F
p p p
p p p p
[5]
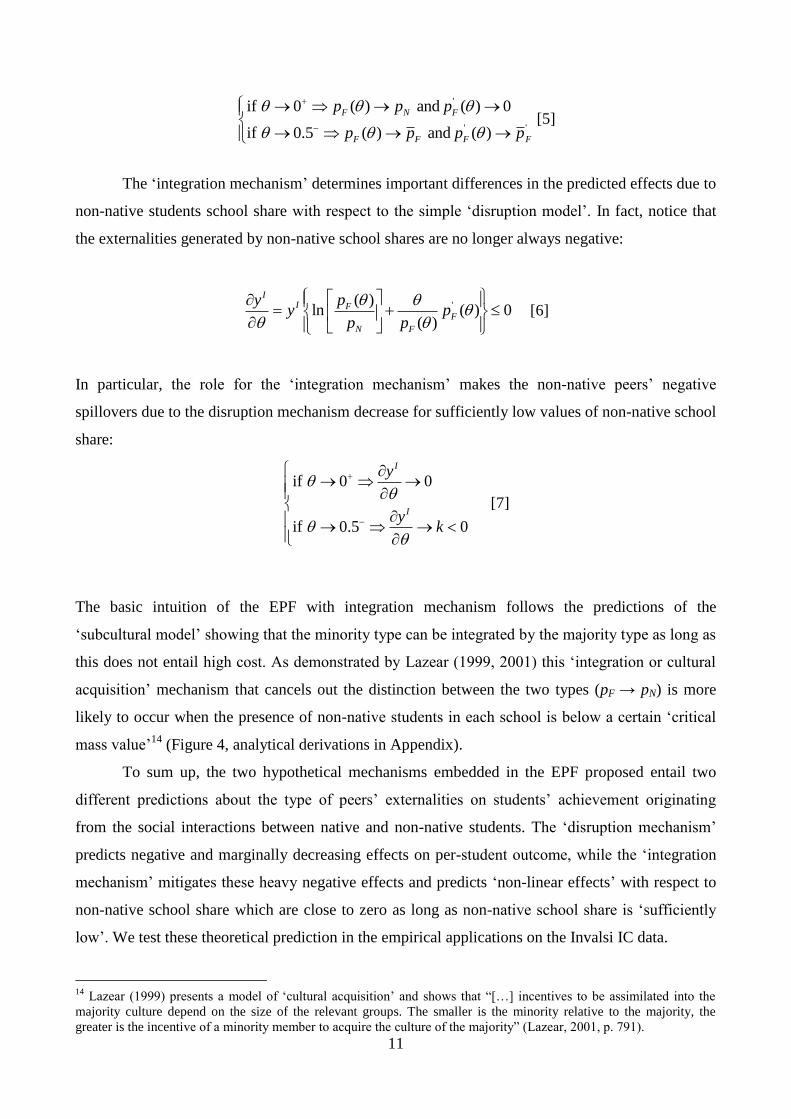
The ‘integration mechanism’ determines important differences in the predicted effects due to
non-native students school share with respect to the simple ‘disruption model’. In fact, notice that
the externalities generated by non-native school shares are no longer always negative:
'( )ln ( ) 0
( )
II F
F
N F
pyy p
p p
[6]
In particular, the role for the ‘integration mechanism’ makes the non-native peers’ negative
spillovers due to the disruption mechanism decrease for sufficiently low values of non-native school
share:
if 0 0
if 0.5 0
I
I
y
yk
[7]
The basic intuition of the EPF with integration mechanism follows the predictions of the
‘subcultural model’ showing that the minority type can be integrated by the majority type as long as
this does not entail high cost. As demonstrated by Lazear (1999, 2001) this ‘integration or cultural
acquisition’ mechanism that cancels out the distinction between the two types (pF → pN) is more
likely to occur when the presence of non-native students in each school is below a certain ‘critical
mass value’14
(Figure 4, analytical derivations in Appendix).
To sum up, the two hypothetical mechanisms embedded in the EPF proposed entail two
different predictions about the type of peers’ externalities on students’ achievement originating
from the social interactions between native and non-native students. The ‘disruption mechanism’
predicts negative and marginally decreasing effects on per-student outcome, while the ‘integration
mechanism’ mitigates these heavy negative effects and predicts ‘non-linear effects’ with respect to
non-native school share which are close to zero as long as non-native school share is ‘sufficiently
low’. We test these theoretical prediction in the empirical applications on the Invalsi IC data.
14
Lazear (1999) presents a model of ‘cultural acquisition’ and shows that “[…] incentives to be assimilated into the
majority culture depend on the size of the relevant groups. The smaller is the minority relative to the majority, the
greater is the incentive of a minority member to acquire the culture of the majority” (Lazear, 2001, p. 791).
12
4. Empirical strategy
In the specific case of the estimation of peer effects between native and non-native students,
there are different types of students’ sorting at work. First of all, one must account for the
endogenous placement of immigrants into some geographical areas that are usually more likely to
be populated also by lower-achieving native students, regardless of the local level of immigrant
concentration (Gould et al., 2009)15
. As a consequence, non-natives’ concentration in the schools
may be endogenous because of parents’ housing decisions: individuals sort into neighbourhoods
because they want - or do not want, or they are forced - to live in a ‘ghetto’ area, or in areas where
an occupation is more likely to be found, or in areas where renting houses is less expensive, and so
on. Second, the peer group can be the result of individual choices: for example, given the residential
choice of the household, individuals living in a given area choose a certain school on the basis of
some (perceived) school quality. Third, given the school choice, the allocation of non-native
students among the classes within a certain school is not random, but usually depends on school
staff choices, previous school path and law or compulsory regulations16
. Besides self-selection
issues, the estimation of a reduced form model retrieving the peer effect parameters is also hard
because of the problems arising from the presence of the correlated effects that will give rise to a
bias if they are correlated with peer group composition (Manski, 1993).
The sorting processes described and the difficulty to control for all possible correlated
effects may lead to a negative spurious correlation between attainments levels of native students and
non-native school share, independently from the fact that non-native students actually cause some
bad or good externalities on natives’. Our estimation strategy relies on the basic assumption that
changes in non-natives school shares17
between adjacent cohorts within the same school are not
correlated with pupils’ unobservable characteristics that may be relevant in the educational
production process. The strategy implemented rests on averaging procedures and selection on
observables to solve the sorting mechanisms described above (sorting across classes in the same
15
As widely recognized in the literature, the vast majority of cross-sectional variation in students’ peers is generated by
selection: students self-select into schools based on their family background and income, parents’ job locations,
residential preferences, school rules, educational preferences and even ability (Hoxby, 2000). 16
In Italy, Heads, School Boards and Municipalities must collaborate to allocate non-Italian students within schools and
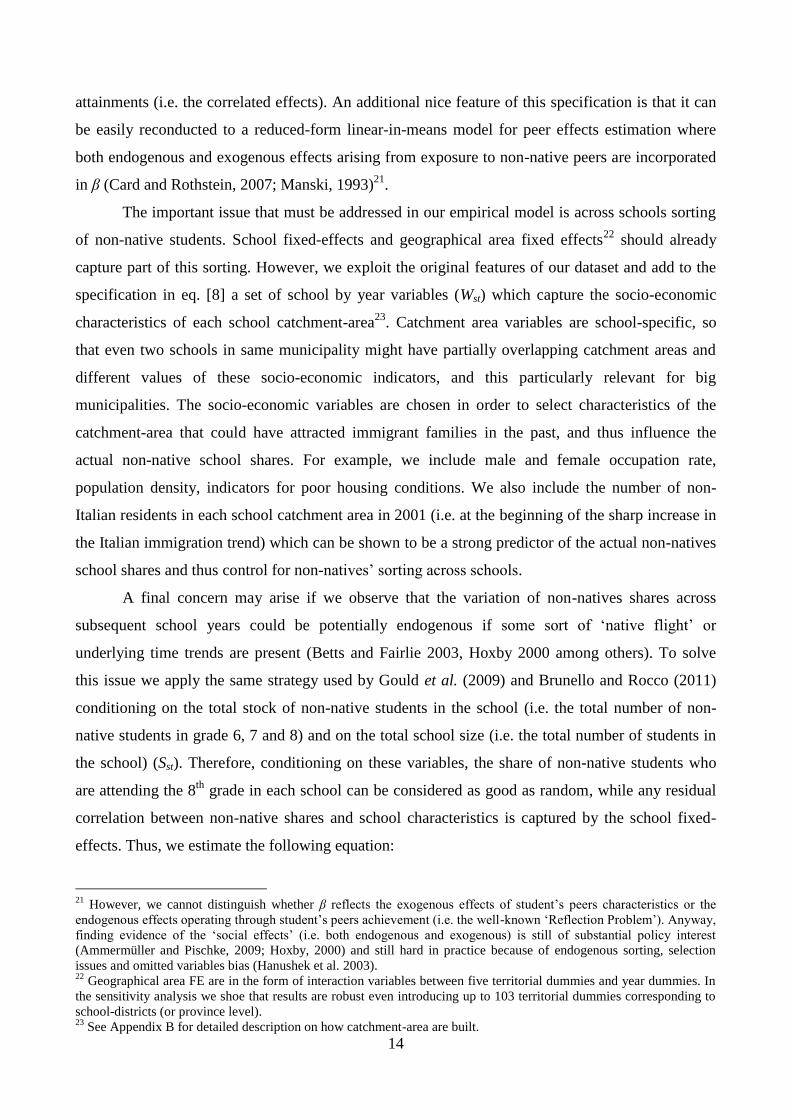
within classes in such a way to avoid segregation problems. 17
In the reminder of the paper we generally label as non-native school share our variable of interest (PstF).However, we
only focus on three subsequent cohorts of 8th
grade students, so that PstF corresponds to the share of 8
th grade non-
native students in school s and year t, i.e:
No. of Non-native students in grade 8 in school s*100
Total No. of students in grade 8 in school s
F
stP
13
school, sorting across schools in the same areas and endogenous placement across areas) and school
fixed-effects to limit possible bias due to omitted variables in correlated effects. Given that the
focus of this work is on peer effects on natives’ attainment due to non-native peers’ (negative) spill-
overs caused by the disruption mechanism, in the empirical specification we use as outcome
variable natives’ per student outcome (yN).
4.1 Baseline empirical model
Non-native students are not randomly allocated across classes in the same school (see the
institutional regulatory framework, Appendix A)18
. We solve sorting of non-native students across
classes within the same school using school level averages19
(Card and Rothstein, 2007) and we
identify the effect of non-native school share on natives’ attainment by exploiting school by time
variations in the data, using the following empirical specification:
N F N N
st st st s t sty P X [8]
where N
sty represents the school mean test score of all 8th
grade native (j=N) students in
school s and year t, F
stP is the share of 8
th grade non-native students in school s and year t (that in
the reminder of the paper we simply label ‘non-native school share’), N
stX is a vector containing
mean characteristics of native students in school s and year t, φs are school fixed-effects and the
term φt includes time and territorial fixed-effects20
. The intuition behind this procedure is that, at the
individual level, any non-randomness due to across classes sorting would give rise to a class-
specific error term correlated with the observed variables which potentially bias OLS estimates of β
and from individual-level data. Conducting our analysis at the school level, thus, solves the
sorting of non-natives across classes in the same school as long as we assume that: (i) the class-
specific error component averages to zero across all classes in the school; (ii) the individual-specific
error component are mean zero for all natives in each school (Card and Rothstein, 2007). Moreover,
given that it would be unlikely be able to control for all school level characteristics which may
influence native attainments: school fixed effects solve all possible omitted variable bias in
individual mean characteristics and school mean characteristics which may influence native
18
This is actually common in most European country. Ammermueller and Pischke (2009) provide evidence of the non-
random assignment of non-natives students within school and within classes in some European country. 19
This is true as long as we assume that: (i) the class-specific error component averages to zero across all classes in the
school; (ii) the individual-specific error component are mean zero for all natives in each school. 20
Territorial fixed-effects include five territorial dummies (North West, North East, Centre, South, Islands) interacted
with year dummies for the three Invalsi IC waves.
14
attainments (i.e. the correlated effects). An additional nice feature of this specification is that it can
be easily reconducted to a reduced-form linear-in-means model for peer effects estimation where
both endogenous and exogenous effects arising from exposure to non-native peers are incorporated
in β (Card and Rothstein, 2007; Manski, 1993)21
.
The important issue that must be addressed in our empirical model is across schools sorting
of non-native students. School fixed-effects and geographical area fixed effects22
should already
capture part of this sorting. However, we exploit the original features of our dataset and add to the
specification in eq. [8] a set of school by year variables (Wst) which capture the socio-economic
characteristics of each school catchment-area23
. Catchment area variables are school-specific, so
that even two schools in same municipality might have partially overlapping catchment areas and
different values of these socio-economic indicators, and this particularly relevant for big
municipalities. The socio-economic variables are chosen in order to select characteristics of the
catchment-area that could have attracted immigrant families in the past, and thus influence the
actual non-native school shares. For example, we include male and female occupation rate,
population density, indicators for poor housing conditions. We also include the number of non-
Italian residents in each school catchment area in 2001 (i.e. at the beginning of the sharp increase in
the Italian immigration trend) which can be shown to be a strong predictor of the actual non-natives
school shares and thus control for non-natives’ sorting across schools.
A final concern may arise if we observe that the variation of non-natives shares across
subsequent school years could be potentially endogenous if some sort of ‘native flight’ or
underlying time trends are present (Betts and Fairlie 2003, Hoxby 2000 among others). To solve
this issue we apply the same strategy used by Gould et al. (2009) and Brunello and Rocco (2011)
conditioning on the total stock of non-native students in the school (i.e. the total number of non-
native students in grade 6, 7 and 8) and on the total school size (i.e. the total number of students in
the school) (Sst). Therefore, conditioning on these variables, the share of non-native students who
are attending the 8th
grade in each school can be considered as good as random, while any residual
correlation between non-native shares and school characteristics is captured by the school fixed-
effects. Thus, we estimate the following equation:
21
However, we cannot distinguish whether β reflects the exogenous effects of student’s peers characteristics or the
endogenous effects operating through student’s peers achievement (i.e. the well-known ‘Reflection Problem’). Anyway,
finding evidence of the ‘social effects’ (i.e. both endogenous and exogenous) is still of substantial policy interest
(Ammermüller and Pischke, 2009; Hoxby, 2000) and still hard in practice because of endogenous sorting, selection
issues and omitted variables bias (Hanushek et al. 2003). 22
Geographical area FE are in the form of interaction variables between five territorial dummies and year dummies. In
the sensitivity analysis we shoe that results are robust even introducing up to 103 territorial dummies corresponding to
school-districts (or province level). 23
See Appendix B for detailed description on how catchment-area are built.
15
N F N N
st st st st st s t sty P X W S [9]
Table 5 contains the complete list and description of the variables included in the Xst, Wst
and Sst vectors. The estimation of in eq. [9] allows a causal interpretation of the effect of non-
native school share on natives’ attainment which we interpret as non-natives’ peer effects on
natives’ attainment. If < 0 we might conclude that the presence of non-native students causes
negative peer effects on the attainment of native peers and that a possible ‘disruption mechanism’ is
at work.
4.2 Non-linear effects: ‘disruption’ vs. ‘integration’ mechanism
The theoretical framework predicts that in case the ‘integration mechanism’ plays a
substantive role, the effects of non-native share are non-linear, and rather vary with respect to
different levels of F
stP . Therefore, to distinguish which of the two possible mechanisms is at work it
is crucial to test for possible non linearity in the peer effects. To this purpose, we introduce a linear
spline functional form in the non-native school share dividing the percentage range [0; 1] into two
intervals with boundaries , and , where and correspond, respectively, to 0 and 1:
1 2
1 2
where:
if 0
1 if 1
N F F N N
st st st st st st s t st
st stFi
st
st st
y P P X W S
P
[10]
Following the theoretical framework, we accept the hypothesis that a simple ‘disruption
mechanism’ is at work if 1<0 and 2<0 for every value of . Moreover, the strictly concave
relation between non-native school share and native educational outcome stemming from the ‘bad
apple principle’ implies that the estimated peer effects () should be greater for lower values of
non-native school shares so that |1| > |2|. On the other hand, accept the hypothesis that an
‘integration mechanism’ is at work if 1=0 and 2<0 for ‘sufficiently low’ values of . The
‘integration mechanism’ also entails a convex relation between non-native school share and native
educational outcome (at least) as θ→0. Thus, |1| < |2| for ‘sufficiently low’ values of .
5. Data and descriptive statistics

16
We exploit a unique dataset that combines the Invalsi First Cycle Final Exam data24
,
administrative records from Ministry of Education Statistical Office, and the Italian Population
Census Survey 200125
. Invalsi First Cycle Exam (from now on ‘First Cycle’ or ‘Invalsi IC’) data are
the first experience of testing attainment levels of all students enrolled in Italian junior high schools.
The census dimension of Invalsi IC tests allows us to overcome problems of underrepresentation of
immigrant individuals and measurement errors in sample surveys (Aydemir and Borjas, 2010).
Additional information about socio-economic family background are obtained as school-level
averages of Census variables linked to each school using an original matching technique that
identifies for each junior high school its ‘catchment area’. To our knowledge, this is the first time
that a dataset with such a variety of information and covering the universe of 8th
graders students is
made available for the Italian school system.
In detail, Invalsi IC dataset contains school level information, Math and Language test
scores results and individual information for each 8th
grade student enrolled in a public or private
Italian junior high school26
. Three waves are available, corresponding to 2007-08, 2008-09 and
2009-10 school years final exams (about 500,000 students per wave). Individual information covers
year of birth, gender, citizenship (Italian, non-Italian), place of birth; how long the student is in Italy
if born abroad (from primary school, for 1-3 years, less than 1 year); mother’s and father’s place of
birth (Italy, EU, European but non-EU, other non-European country), grade retention (if the student
is ‘regular’ i.e. if he/she is 14 years old at the end of the school year; ‘in advance’ i.e. younger than
‘regular’ students, or ‘retained’ i.e. older than ‘regular’ students), school identifier27
. Administrative
records from Ministry of Education Statistical Office provide general information about school
characteristics (i.e. type of school, public vs. private, number of students enrolled and number of
teachers, average class size) matched to Invalsi First Cycle data through an anonymous school
identifier. Finally, Census 2001 contains information about resident population in Italy in 2001.
Each school is matched to a group of census divisions through an original matching technique
designed to associate to each junior high school a group of census cells constituting its ‘catchment
area’ (Barbieri, Rossetti and Sestito, 2010)28
. This procedure allows matching to each junior high
24
INVALSI (Istituto Nazionale per la Valutazione del Sistema Educativo di Istruzione e di Formazione) is the
independent public institute carring out the evaluation of Italian school system and test students’ attainment levels. 25
Many people collaborate to make available the dataset used. We thank: Claudio Rossetti (Luiss), Patrizia Falzetti
(Invalsi) and Marco Mignani (Invalsi) for their work in merging Census and Miur data with the Invalsi IC datasets;
Paolo Sestito (Bank of Italy), Piero Cipollone (Invalsi and Bank of Italy) for fruitful discussions and data support. 26
Test scores range from 0 to 100 and refer to the fraction of right answers for each of the two subjects. 27
Data do not contain class identifiers so that it not possible to build a panel based on classes (or sections) within the
same school to implement an identification strategy based on a teacher fixed effects. 28
See Appendix B for a detailed description of data and matching techniques used.
17
school more than two hundreds variables from 2001 Italian Population Census Survey covering a
great variety of demographic and socio-economic information on resident population (gender, age,
ethnic origins, education, labour force participation, occupation, households’ composition and
houses characteristics).
5.1 Descriptive statistics
We exploit the panel dimension of the dataset constituted by 5771 junior high schools29
(s=1…5771) and three school years (t=2008, 2009, 2010). Mean test scores and mean individual
characteristics are obtained from all 8th
grade students enrolled in all Italian junior high schools30
in
2007-08, 2008-09 and 2009-10 (1,504,286 individuals), while school characteristics are matched
from Census and administrative school records as explained above.
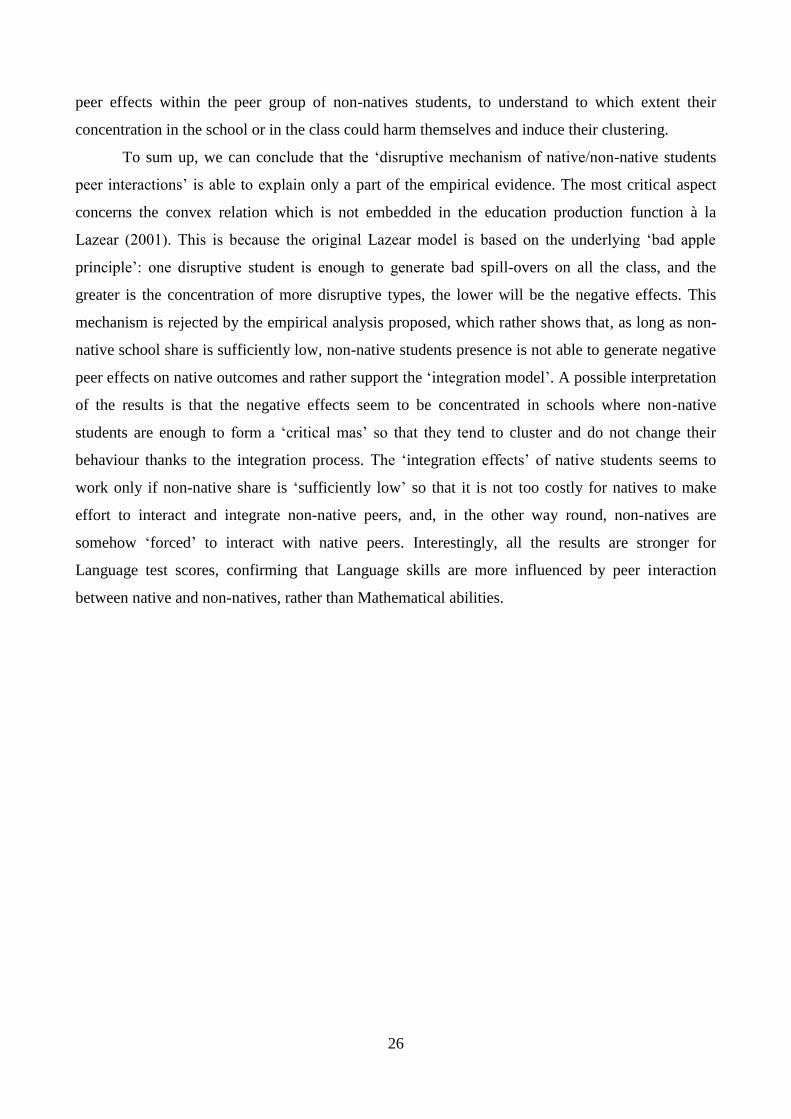
Table 1 describes general characteristics of the junior high schools in the dataset (percentage
of public schools, non-native school share, average school size, average class size) with respect to
macro-area and Invalsi IC wave, while Figure 2 shows the average percentage of non-native
students per school (i.e. ‘school shares’). The distribution of non-native students across Italian
territory is highly not homogenous: Northern and Centre regions experience the highest average
school share of non-native students (10.01% and 9.18% in 2010), while it dramatically falls in the
South (1.97%), while school characteristics, such as average school and class size are generally
equally distributed. Table 2 shows school average and standard deviation of test scores results
according to the native/non-native partition of each school population: gaps between mean test
scores for natives and non-natives are large and statistically significant. Descriptive evidence
confirms general results common in the European literature: first, non-native students perform
worse than their native peers; second, gaps are greater in Language and lower for Math. The
distribution of school mean test scores is also different: non-native students’ test score distribution
is more similar to a normal distribution, and shows a higher variance.
We focus on the test score gap between native and non-native students at the individual level
in Table 3 where we report the coefficient of the dummy variable ‘being non-native’ obtained
running descriptive (pooled) OLS regressions on the whole sample of IC 2009 and 2010 students.
We first show the row coefficient, i.e. the unconditioned attainment gap: non-native students have
test score results lower than native peers by 21.21% in Language, and 15.08% in Math. Then, we
progressively add controls for individual characteristics (gender, retention, parents’ origins, time
spent in the host country since birth), school characteristics (ownership, type, size, average class
29
From the original population of 6290 schools, almost 5% are dropped because they appear in only one wave. 30
We exclude all individuals who did not sit either Maths or Italian Language test (0.73% of the total students
population).
18
size, pupil-teacher ratio, support teacher-pupil ratio) and territorial dummies31
. The conditioned
gaps turn out to be smaller than the unconditioned one, but still significantly different from zero:
coeteris paribus, being non-native implies a 7% lower test score in Language and 4% in Math.
The behavioral assumption of the theoretical model (pN>pF) is actually corroborated by a
variety of international studies (see, among others, OECD 2010, NESSE 2008, Stanat and
Christensen 2006, Schnepf 2007) which underline how language, culture and previous school path
influence non-native students’ behaviour at school and contributes to affect negatively non-natives’
school performance. In order to bring additional evidence, Table 4 contains an elaboration from
PISA 2006 mean test scores results which tested Science skills of 15-years-old students in OECD
countries. Mean test scores are shown by country and with separate indication of native, first and
second generation students (where the distinction is possible). Although there are sharp differences
in the native-non-native gap depending on the specific immigration history of each country, non-
native students always perform worse than their native mates. Moreover, second generation students
show, on average, better results than first generation students and one may argue that this is driven
by an higher degree of integration (in terms of language and culture, especially) with the hosting
country language (Stanat and Christensen, 2006).
In the studies mentioned above, immigrant students’ lower educational attainment is
interpreted as a proxy for unobserved behavioural attitudes of non-natives which make them face
more difficulties at school (Cooley, 2010). However, there is also direct evidence of the fact that
minority students tend to show lower discipline with respect to natives. For instance, Kinsler (2010)
exploits rich dataset on North Carolina schools containing detailed information on students
discipline and behaviour in the class. He finds that discipline has an overall positive influence on
student performance while a substantive part of the attainment gap between white and minority
students is explained in his model by differences in behaviours. Descriptive statistics also show that
minority students tend to suffer suspensions or discipline punishments more frequently than white
students. Concerning the Italian context, data from a survey on non-native adolescent integration in
society (CNEL, 2011) confirms that non-native have more difficulties at school, and shyness,
language and discipline are important factors determining these difficulties. The representative
sample of 414 non-natives interviewed declared to have had attainment difficulties at school
(43.3%), difficulties in interactions with classmates (33.3%) and teachers (24%), difficulties in
31
For the complete list and explanation of control variables used see Table 5.
19
interactions due to language (30.2%), integration (28%) and discipline problems (44.5%)32
(CNEL,
2011).
Summing up, two main results may be drawn from these general descriptive evidence. First,
there exists a sizable gap in test scores results between native and non-native students, and this
attainment gap seems to be more critical in Language rather than in Math skills. Second, even after
taking into account individual characteristics, parental background, school characteristics and
territorial differences, the attainment gap is reduced but still persists. Moreover, given that the gap
does not disappear controlling for usual school and family background inputs, it is plausible to think
that ‘social’ inputs and peers’ externalities may play a crucial role in explaining these gaps (Akerlof
and Kranton 2000, 2002; Zenou and Patacchini 2006; Heckman 2011; Freyer 2011, among others).
Finally, Italian and international descriptive evidence supports the basic assumption of the
theoretical framework: coeteris paribus, non-native students may cause more occasions of
interruption in the classroom compared to native peers (pN>pF) for many reasons. For instance,
given of lower attainments levels (on average) and poorer language skills, they tend to interrupt
more and need more help from teachers slowing down the class learning process.
6. Results
In this section, we first present the baseline model results and then we test for non-linear
effects in order to find evidence to support or reject the theoretical models illustrated in Section 3.
As already outlined, the variable of interest is the non-native school share ( F
stP ) and the parameter
captures both the exogenous effects operating through student’s peers characteristics and the (pure)
endogenous effects operating through students’ peers achievement.
6.1 Baseline model results
Table 6 contains the results for the estimation of the parameter of interest from eq. [8] and
[9]. The dependent variable is the log of the Invalsi IC school mean test score for native students
(from now on, SMT), and we conduct our analysis separating the Language from the Math test
score. The rationale for doing it being that we expect peer effects to have greater impact on
Language tests as long as language skills are directly influenced by the use of Italian language with
native peers in the classroom. We progressively add school variables controls (Sst) in columns (II),
32
These percentages are statistically different (at 5 or 10% level) with respect to the same answers given by a control
group of 337 natives.
20
and catchment-area socio economic variables (Wst) in columns (III)33
. Thus, the coefficients
estimated in columns (I) correspond to eq. [8], while the ones estimated in columns (III) to eq. [9].
Adding school and catchment-area controls significantly influences the estimates, improving the
school fixed-effects basic framework and limiting the possible biases due to across school sorting.
In fact, focusing on the estimates of from eq. [9] (columns III) we have small and negative
effects, statistically different from zero only for Language test score. Thus, increasing non-native
school share by 1% determines a decrease of 6.5% in native peers’ Language test score, and no
significant effects in Math.
A first important result can be derived from the baseline model estimations: the ‘disruption
model’ cannot be accepted in general terms. Negative effects are small and only concentrated in
Language skills, while for Math test scores there are not significant negative spillovers. Thus, there
does not seem to be negative peer effects working through disruption and interruption mechanisms
in the education production of Math skills. This is somehow reasonable in our view, given that
mathematical skills are more intuitive and based on a ‘universal numerical alphabet’. These results
are in line with the evidence from U.S. (Hoxby, 2000; Hanushek and Rivkin, 2009; Hanushek et al.
2009) which generally highlights small and non-significant effects of black school shares on white
test scores results. The limited evidence from literature on peer effects between immigrants and
native students in EU context makes comparisons more difficult. Our results are similar to Brunello
and Rocco (2011) who exploit cross-country variation in PISA data for a panel of OECD countries,
although they cannot distinguish among the subjects tested due to the PISA survey structure. They
find that a one percentage point increase in the share of immigrants students is expected to reduce
the average test score of natives by 0.27%34
. Jansen and Rasmussen (2011) estimate effects of
immigrant school concentration on test scores both of native and non-native students in Denmark
using individual level data with an IV identification approach and distinguishing between
mathematical and language skills. Their evidence is less consistent with our analysis as they find
negative and significant effects only in Math, while the pattern of the results is not clear for
Language skills: they find that a 10% increase in immigrant school concentration reduces child’s
Math score by 8.6 points and 2.7 in Reading. The difference in the results can be attributed to
country specific characteristics as well as to differences due the identification approach and the use
of individual level data.
6.2 Disruption vs. integration mechanism
33
See Table 4 for the complete list of variables and description. 34
Brunello and Rocco (2011) also find that the attenuation bias correction à la Aydemir and Borjas (2010) does not
significantly change the size of the effect.
21
We test for non-linarites in the effects of non-native school share on natives’ test scores
estimating 1 and 2 in eq. [10] with a spline linear function with one break point (T= ). To seek
for structural changes in the effect we use different values of the break and report the results in
Table 7. This allows showing in a flexible way how effects are different above and below any given
threshold, and if they are statistically significant while in the sensitivity analysis (Section 7) we
present several results testing non-linear effects in non-native school share implementing different
methods (i.e. higher order terms of θ), and showing estimation results of spline functional forms
with percentiles and deciles intervals.
The effects are highly non-linear: we always reject the null that 1 - 2 = 0. For instance,
setting the threshold at the mean of the non-native school share distribution (T=0.065) we have that
increasing by 1% the non-native share has not significant effects if the non-native school share is
below 6.5% (T), while it decreases natives’ language test scores by 7.6% if the share is above 6.5%.
Thus, both in Language and Math, the general pattern of the results shows that the increase of non-
native share has negative and significant effects only for sufficiently large values of . To be more
precise, we cannot reject the null that 1=0 and 2<0 for T<0.20, while, if T>0.20 1 and 2 are both
negative and significant for Language test. Concerning the magnitude of the effects, it is clear that
effects are greater for greater values of non-native school share, thus rejecting the implication |1| >
|2|. As a general outline, we observe that the concave relation embedded in the ‘disruption model’
in is not found in the empirical estimation of the effects, which seem driven, on the contrary, by a
non-linear convex relation: negative marginal effects are present only for high levels of non-native
school share and are generally increasing with respect to non-native school share.
We go deeper into the analysis introducing a spline function with two break points, where
the first one is fixed at 10% (T1=0.10) and we set different values for the second (T2). The rationale
is the following: with one break point we exclude that the structural break ( ) is greater than the
threshold of 10%, indeed the effects above 10% are still unclear. Table 8 shows the results for three
possible break points for T2=0.20; 0.25; 0.3035
. Results for Math test score do not show clear
patterns, while for Language we always find negative and significant effects between 10% and 20,
25 and 30% levels of non-native school share.
Summing up and interpreting together the results from Table 8 and Table 7, we have that
non-linear effects are stronger for Language test score, while less clear for Math, and the hypothesis
of concave relation is rejected by the data. In details: for the Language test, we cannot reject the null
that 1=0 and 2<0 for < 0.10, while for Math the same result holds for < 0.20. To give a
35
Additional robustness checks for other thresholds between 0.20 and 0.30 are always consistent with these results.
22
numerical intuition, we calculate that, on average, a non-native school share of 10% corresponds to
nine non-native students in the school, or, equivalently, two or three non-natives students in each
class, on average. Thus, if in each class there are up to one or two non-native students, the
‘disruption’ mechanism is not strong enough to affect natives’ attainment. These findings are
consistent with the theoretical predictions of the ‘integration model’ of peer interaction.
Interestingly, this result is stronger for language skills, where the ‘disruption’ occurs more
frequently given the greater difficulties to learn a non-mother-tongue for non-natives.
7. Robustness checks
We test the robustness of our results under three main dimensions. First, we test the
robustness with respect to missing values in school and catchment-area variables due to the dataset
construction. Then we test for possible concerns due to the main source of endogeneity (across
school sorting) and the underlying phenomenon of ‘native flight’. Finally, we show further evidence
on non-linear effects
7.1 Missing values in school and catchment-area variables
Missing values in school and catchment-area variables are due to the construction of the
dataset. This fact causes the number of schools in the regression estimates to shrink from 6,289 in
the estimation of eq. [8] to 4827 in the estimation of eq. [9] (Table 6). We test the robustness of the
baseline results controlling for missing values and correcting missing values with some
approximations, where possible, to verify that the results are not driven by any kind of sample
selection or attrition. Indeed, a preliminary analysis with probit regressions excludes any particular
pattern in missing values due to geographical school location.
The variable containing the information about the ‘stock of non-native students’ in the
school is missing for 16% of schools due to school register data missing. We correct this variable in
two possible ways: (i) setting missing values to zero and creating an indicator variable taking value
1 when this information was corrected; (ii) replacing the missing values with the total stock of 8th
graders non-natives students, one year lagged and integrated with Invalsi data sources. Catchment-
area variables are missing because the matching procedure between the school identifier and the
census cells failed due to some non-perfect overlapping between the school identifier in the Invalsi
data and the one in the Census data. However, for more than half of them we can replace the
missing values of the socio-economic variables of the school catchment-area with the average value
of the same variables taken from the schools which are located in the same municipality. This
23
correction procedure shrinks missing data on catchment-area variables from 6.3% to 4.6% of
schools. Table 9 shows that implementing the correction procedures allows keeping all the
observations but does not modify previous results, which, in turn, are not due to some selection
pattern in the missing data.
7.2 Robustness to across schools sorting and ‘native flight’
The identification strategy implemented by eq. [9] is designed to control for across school
sorting through school fixed-effects, territorial by year fixed effects and school specific catchment-
area socio economic variables. To test that the identification strategy is suitable to capture this main
source of endogeneity, we split the sample of schools into two groups according to school location
in big or small municipalities. We define to as ‘big municipalities’ those having three or more
junior high schools in their territory, while ‘small municipalities’ have one or two junior high
schools. The enrolment rules are based on residency criteria, therefore students have to attend the
junior high school in the same municipality where they live with their family. If there is more than
one school, then families usually have to enrol the child to the school of the area where they reside,
otherwise they are allowed to enrol the child to another junior high school of the municipality, if
free slots are available.
Thus, the enrolment institutional framework limits per se across school sorting, however this
is still possible and more likely to happen in big municipalities, where there is a sufficiently large
number of junior high schools and families have some degree of ‘choice’. Moreover, ‘big
municipalities’ are the ones located in more urbanized areas, which benefit from higher public
transportation means that could favour, to some extent, the commuting process from the residency
place to a distant junior high school, alternative to the one nearby home. Thus, we run separately eq.
[2] on the subsample of small and big municipalities. If across school sorting is at work, the
estimations should differ substantially in the two groups of schools inducing a negative spurious
correlation between natives’ mean test scores and non-native shares, and downward bias in the
estimation of . Given that across school sorting is more likely to happen in urban areas (i.e. big
municipalities group), concerns for across school sorting would then arise if we systematically find
that _ _big municip small municip . Estimations in Table 10 reject this hypothesis: effects are similar in
the two subsamples, though slightly larger, in absolute terms, in small municipalities.
7.3 School-district fixed effects
An additional sensitivity check was carried out using instead of the five areas territorial
dummies (North East, North West, Centre, South, Islands), 103 territorial dummies corresponding

24
to junior-high school districts (which also correspond to Italian Provinces, NUT5). School districts
by year fixed-effects and school fixed-effects would capture any kind of across-school sorting
within each school district. Table 11 shows that the effects do not change with respect to the
baseline specification. Thus we can conclude that across schools sorting is not a huge concern in
our data and it seems adequately captured in our empirical model.
7.4 Tests for non-linear effects in non-native school share
In order to bring further evidence on non-linear effects between non-native school share and
natives’ attainments, we progressively add to the baseline model higher orders terms non-native
school share in order to test the possible concave relation predicted by the ‘disruptive model’ or
even any cubic or quadratic relevant relationship. Table 12 shows that higher order terms do not
have statistically significant coefficients neither for Language nor for Math. Focusing our attention
on the coefficient of the quadratic term, although not significant, it is also negative thus rejecting
the hypothetical concave relation predicted by the ‘bad apple principle’ in the ‘disruptive model’.
However, as the analysis using the spline function shows, effects are highly non-linear. This finding
also emerges from Table 13 and Table 14 where we use the spline functional form with very tiny
intervals in the non-native school share values distribution to test whether it is possible to find
evidence of statistically significant effects for some thinner intervals of the distribution of θ. We let
spline thresholds coincide with the 20th
, 40th
, 60th
and 80th
percentiles in Table 13, and with the first
up to the 9th
decile in Table 14. This test increment the robustness of the findings concerning the use
of only one threshold exogenously determined as results show once more that the only negative and
significant effects are concentrated in the upper percentiles or deciles of the distribution of non-
native school share.
8. Conclusions
This paper shed light on peer interaction between native and non-native students
contributing to the existing literature in three main aspects. First, we provide a theoretical
framework to interpret possible underlying social mechanisms that work through peer interactions;
second, we estimate the effect of non-native school share on natives’ attainments identifying the
social interaction parameter (); third, allowing for non-linear effects, we provide empirical
evidence to test the stylized predictions of the theoretical framework. The estimation results are of
substantial interest per se, given the limited evidence in European setting of peer effects between
natives and immigrants, and given the growing relevance of the immigration phenomenon and its
25
impacts, not only on the labour markets, but also on the school system. Increasing non-native
school share by 1% determines a decrease of 6.5% in native peers’ Language test score, and no
significant effects in Math. These results are in line with the limited evidence from European
literature on peer effects between immigrants and native students (see Brunello and Rocco, 2011),
and with evidence from U.S. (Angrist and Lang, 2004; Hoxby, 2000; Hanushek and Rivkin, 2009;
Sacerdote, 2010) which finds limited evidence of negative ‘between-groups’ effects.
However, introducing non-linearity in the effects and rooting our analysis on the comparison
between the ‘disruptive’ and the ‘integration’ model of education production proposed in the
theoretical framework allows us to interpret the results in a more precise way. Therefore, if, in
general, the ‘disruptive’ behaviour of non-native peers causes only small negative externalities on
natives’ Language test scores, introducing non-linearity shows that negative effects are concentrated
only in schools with sufficiently high values of non-native school-share and characterized by a non-
concave relation (i.e. the negative effects are not marginally increasing with respect to non-native
school share). To give a numerical intuition, we calculate that, on average, a non-native school
share of 10% corresponds to 9 non-native students in the school, or, equivalently, 2 or 3 non-natives
students in each class. Thus, if in each class there are up to two or three non-native students, the
‘disruption’ mechanism is not strong enough to affect natives’ attainment. Interestingly, this result
is stronger for language skills, where it is likely that ‘disruption’ occurs more frequently given the
greater difficulties to learn a non-mother-tongue for non-natives. The overall pattern of these
findings is more consistent with the ‘integration model’ of peer interaction and robust under many
dimensions.
Our work also suggests important policy implications concerning allocation rules of non-
native students across classes and across schools. The driving idea of any allocation rule should be
to avoid any concentration of non-native students in the same class or school, and rather to
distribute them equally. In general, our results show that a relative isolation of non-native students
from other non-native peers is beneficial for natives as it forces the integration mechanism between
the two peer groups. A non-native school share below 10% in each school would ensure the
‘integration mechanism’ to be at work. For instance, a recent regulation act from the Italian
Ministry of Education imposes a cap threshold of 30% to non-native share in each class36
.
According to our findings, this threshold would be inefficiently high and may not have any effect to
the educational production in the classroom. Indeed, more research has to be undertaken to study
36
“Indicazioni e raccomandazioni per l’integrazione di alunni con cittadinanza non italiana”, MIUR, Circolare
Ministeriale No. 2/2010 (C.M. 8/1/2010, n. 2).
26
peer effects within the peer group of non-natives students, to understand to which extent their
concentration in the school or in the class could harm themselves and induce their clustering.
To sum up, we can conclude that the ‘disruptive mechanism of native/non-native students
peer interactions’ is able to explain only a part of the empirical evidence. The most critical aspect
concerns the convex relation which is not embedded in the education production function à la
Lazear (2001). This is because the original Lazear model is based on the underlying ‘bad apple
principle’: one disruptive student is enough to generate bad spill-overs on all the class, and the
greater is the concentration of more disruptive types, the lower will be the negative effects. This
mechanism is rejected by the empirical analysis proposed, which rather shows that, as long as non-
native school share is sufficiently low, non-native students presence is not able to generate negative
peer effects on native outcomes and rather support the ‘integration model’. A possible interpretation
of the results is that the negative effects seem to be concentrated in schools where non-native
students are enough to form a ‘critical mas’ so that they tend to cluster and do not change their
behaviour thanks to the integration process. The ‘integration effects’ of native students seems to
work only if non-native share is ‘sufficiently low’ so that it is not too costly for natives to make
effort to interact and integrate non-native peers, and, in the other way round, non-natives are
somehow ‘forced’ to interact with native peers. Interestingly, all the results are stronger for
Language test scores, confirming that Language skills are more influenced by peer interaction
between native and non-natives, rather than Mathematical abilities.
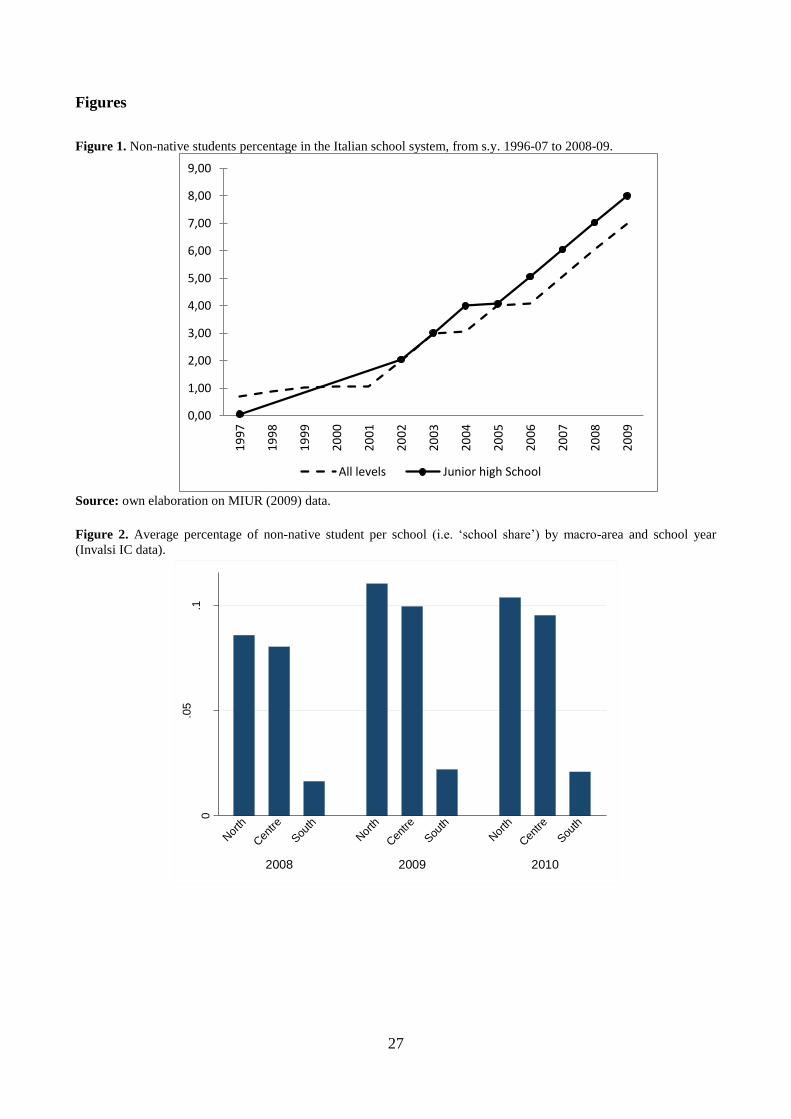
27
Figures
Figure 1. Non-native students percentage in the Italian school system, from s.y. 1996-07 to 2008-09.
Source: own elaboration on MIUR (2009) data.
Figure 2. Average percentage of non-native student per school (i.e. ‘school share’) by macro-area and school year
(Invalsi IC data).
0,00
1,00
2,00
3,00
4,00
5,00
6,00
7,00
8,00
9,00
19
97
19
98
19
99
20
00
20
01
20
02
20
03
20
04
20
05
20
06
20
07
20
08
20
09
All levels Junior high School
0
.05
.1
Non
-na
tives s
cho
ol sh
are
2008 2009 2010
Nor
th
Cen
tre
Sou
th
Nor
th
Cen
tre
Sou
th
Nor
th
Cen
tre
Sou
th
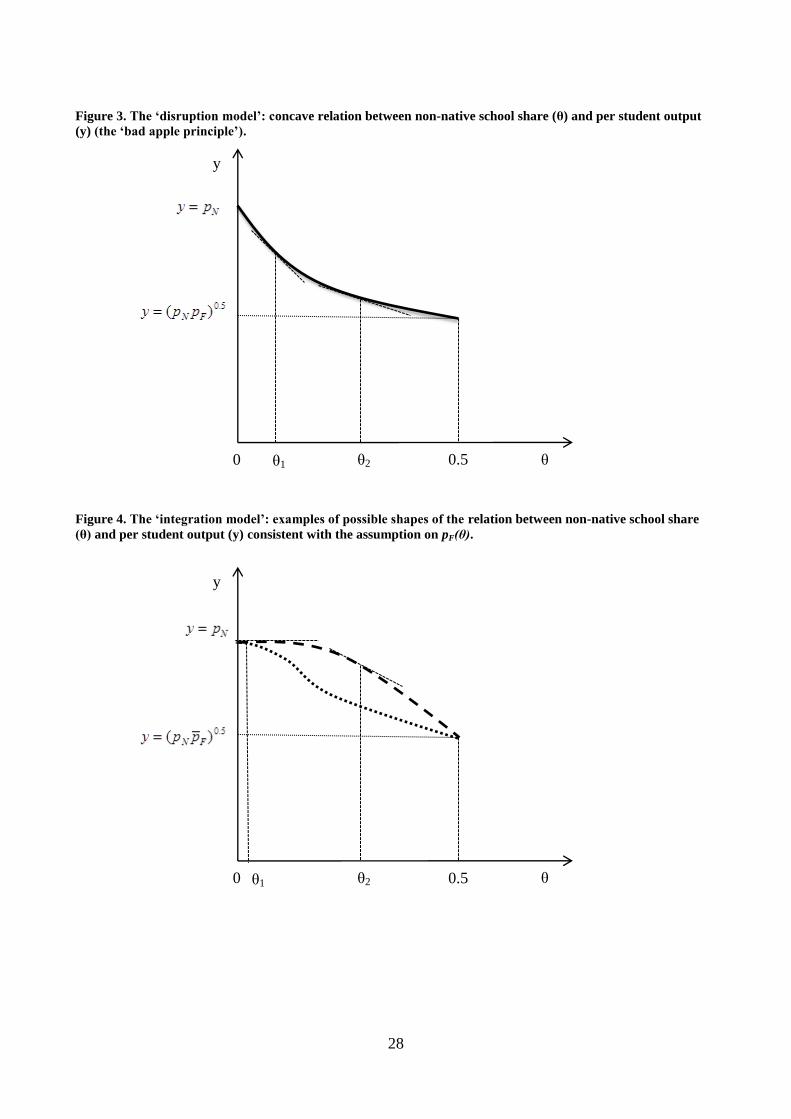
28
Figure 3. The ‘disruption model’: concave relation between non-native school share (θ) and per student output
(y) (the ‘bad apple principle’).
Figure 4. The ‘integration model’: examples of possible shapes of the relation between non-native school share
(θ) and per student output (y) consistent with the assumption on pF(θ).
y
θ 0 0.5 θ1 θ2
y
θ 0 0.5 θ1 θ2
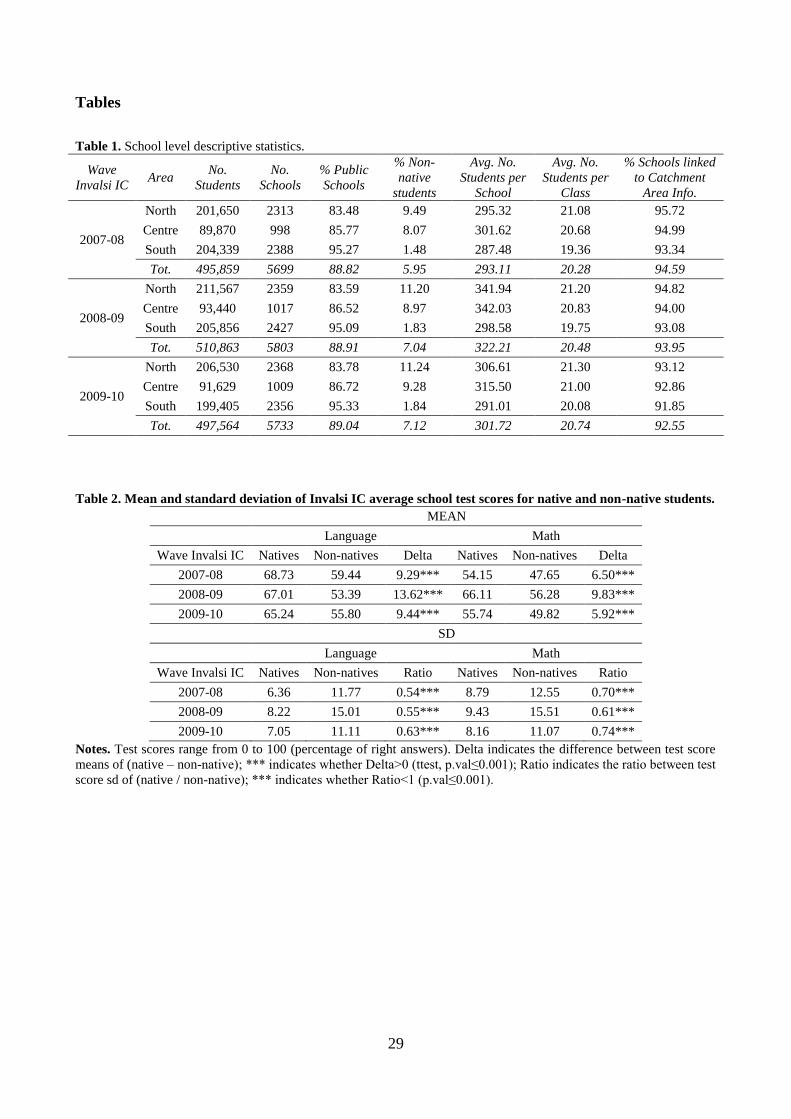
29
Tables
Table 1. School level descriptive statistics.
Wave
Invalsi IC Area
No.
Students
No.
Schools
% Public
Schools
% Non-
native
students
Avg. No.
Students per
School
Avg. No.
Students per
Class
% Schools linked
to Catchment
Area Info.
2007-08
North 201,650 2313 83.48 9.49 295.32 21.08 95.72
Centre 89,870 998 85.77 8.07 301.62 20.68 94.99
South 204,339 2388 95.27 1.48 287.48 19.36 93.34
Tot. 495,859 5699 88.82 5.95 293.11 20.28 94.59
2008-09
North 211,567 2359 83.59 11.20 341.94 21.20 94.82
Centre 93,440 1017 86.52 8.97 342.03 20.83 94.00
South 205,856 2427 95.09 1.83 298.58 19.75 93.08
Tot. 510,863 5803 88.91 7.04 322.21 20.48 93.95
2009-10
North 206,530 2368 83.78 11.24 306.61 21.30 93.12
Centre 91,629 1009 86.72 9.28 315.50 21.00 92.86
South 199,405 2356 95.33 1.84 291.01 20.08 91.85
Tot. 497,564 5733 89.04 7.12 301.72 20.74 92.55
Table 2. Mean and standard deviation of Invalsi IC average school test scores for native and non-native students.
MEAN
Language Math
Wave Invalsi IC Natives Non-natives Delta Natives Non-natives Delta
2007-08 68.73 59.44 9.29*** 54.15 47.65 6.50***
2008-09 67.01 53.39 13.62*** 66.11 56.28 9.83***
2009-10 65.24 55.80 9.44*** 55.74 49.82 5.92***
SD
Language Math
Wave Invalsi IC Natives Non-natives Ratio Natives Non-natives Ratio
2007-08 6.36 11.77 0.54*** 8.79 12.55 0.70***
2008-09 8.22 15.01 0.55*** 9.43 15.51 0.61***
2009-10 7.05 11.11 0.63*** 8.16 11.07 0.74***
Notes. Test scores range from 0 to 100 (percentage of right answers). Delta indicates the difference between test score
means of (native – non-native); *** indicates whether Delta>0 (ttest, p.val≤0.001); Ratio indicates the ratio between test
score sd of (native / non-native); *** indicates whether Ratio<1 (p.val≤0.001).
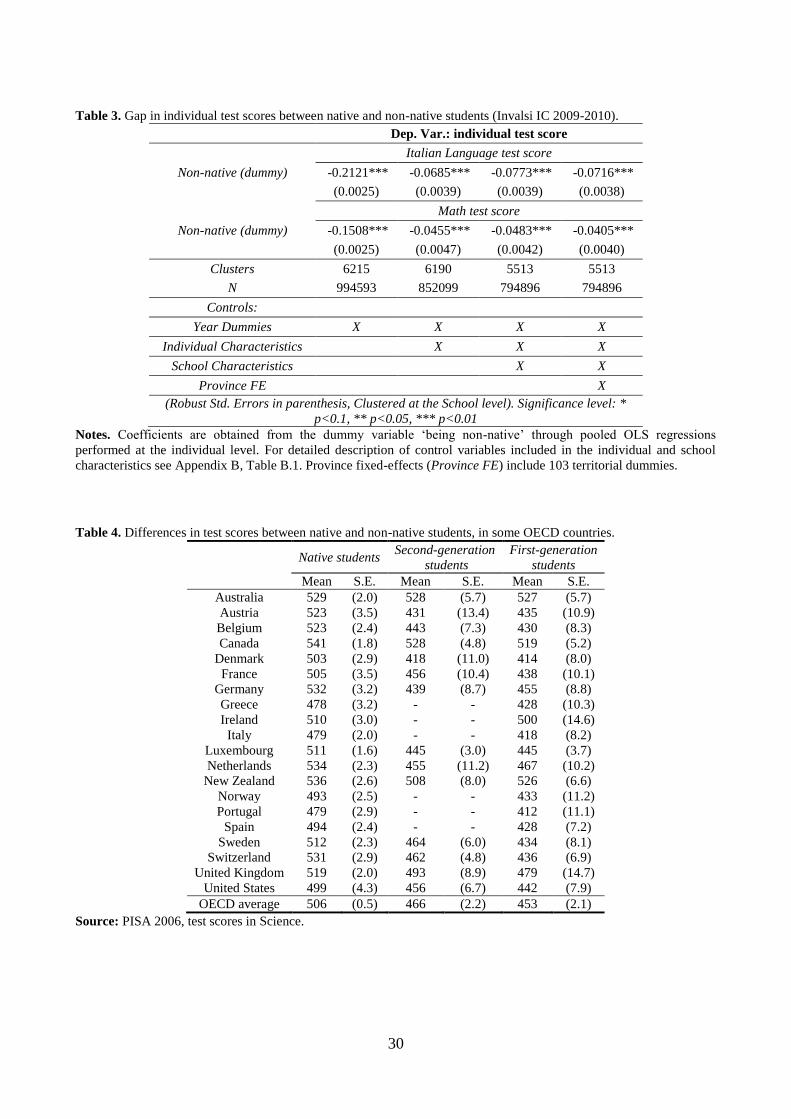
30
Table 3. Gap in individual test scores between native and non-native students (Invalsi IC 2009-2010).
Dep. Var.: individual test score
Italian Language test score
Non-native (dummy) -0.2121*** -0.0685*** -0.0773*** -0.0716***
(0.0025) (0.0039) (0.0039) (0.0038)
Math test score
Non-native (dummy) -0.1508*** -0.0455*** -0.0483*** -0.0405***
(0.0025) (0.0047) (0.0042) (0.0040)
Clusters 6215 6190 5513 5513
N 994593 852099 794896 794896
Controls:
Year Dummies X X X X
Individual Characteristics X X X
School Characteristics X X
Province FE X
(Robust Std. Errors in parenthesis, Clustered at the School level). Significance level: *
p<0.1, ** p<0.05, *** p<0.01
Notes. Coefficients are obtained from the dummy variable ‘being non-native’ through pooled OLS regressions
performed at the individual level. For detailed description of control variables included in the individual and school
characteristics see Appendix B, Table B.1. Province fixed-effects (Province FE) include 103 territorial dummies.
Table 4. Differences in test scores between native and non-native students, in some OECD countries.
Native students Second-generation
students
First-generation
students
Mean S.E. Mean S.E. Mean S.E.
Australia 529 (2.0) 528 (5.7) 527 (5.7)
Austria 523 (3.5) 431 (13.4) 435 (10.9)
Belgium 523 (2.4) 443 (7.3) 430 (8.3)
Canada 541 (1.8) 528 (4.8) 519 (5.2)
Denmark 503 (2.9) 418 (11.0) 414 (8.0)
France 505 (3.5) 456 (10.4) 438 (10.1)
Germany 532 (3.2) 439 (8.7) 455 (8.8)
Greece 478 (3.2) - - 428 (10.3)
Ireland 510 (3.0) - - 500 (14.6)
Italy 479 (2.0) - - 418 (8.2)
Luxembourg 511 (1.6) 445 (3.0) 445 (3.7)
Netherlands 534 (2.3) 455 (11.2) 467 (10.2)
New Zealand 536 (2.6) 508 (8.0) 526 (6.6)
Norway 493 (2.5) - - 433 (11.2)
Portugal 479 (2.9) - - 412 (11.1)
Spain 494 (2.4) - - 428 (7.2)
Sweden 512 (2.3) 464 (6.0) 434 (8.1)
Switzerland 531 (2.9) 462 (4.8) 436 (6.9)
United Kingdom 519 (2.0) 493 (8.9) 479 (14.7)
United States 499 (4.3) 456 (6.7) 442 (7.9)
OECD average 506 (0.5) 466 (2.2) 453 (2.1)
Source: PISA 2006, test scores in Science.
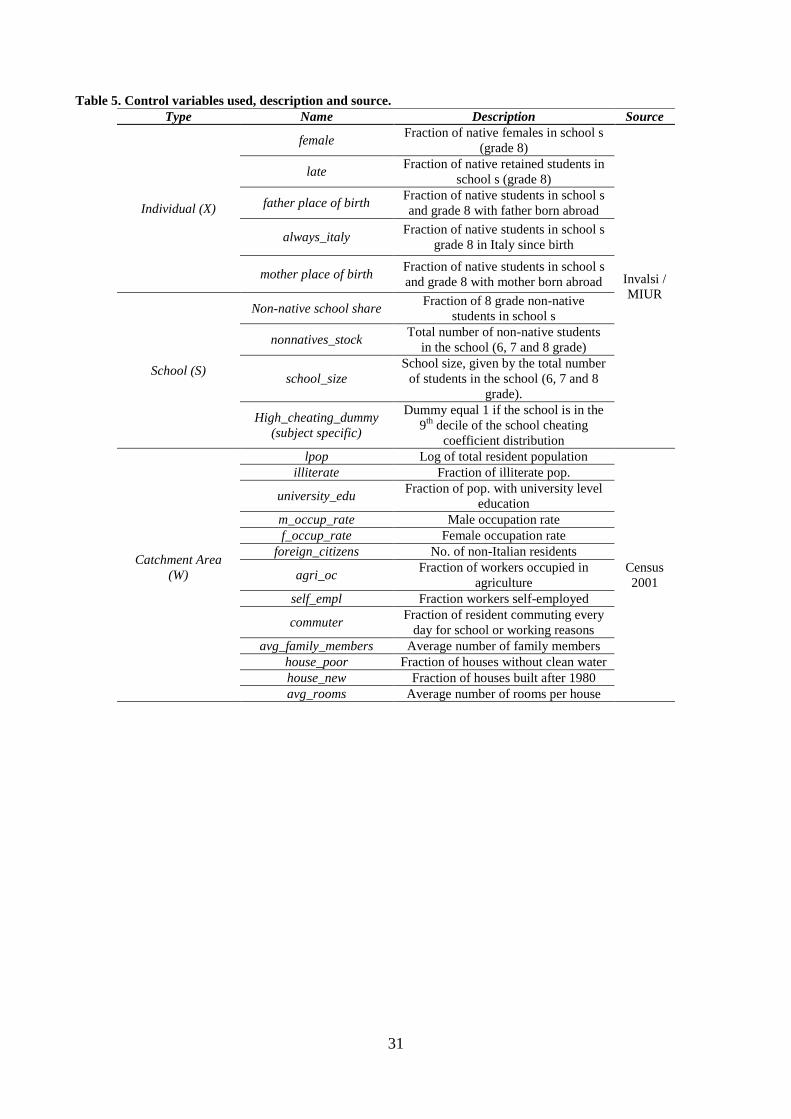
31
Table 5. Control variables used, description and source.
Type Name Description Source
Individual (X)
female Fraction of native females in school s
(grade 8)
Invalsi /
MIUR
late Fraction of native retained students in
school s (grade 8)
father place of birth Fraction of native students in school s
and grade 8 with father born abroad
always_italy Fraction of native students in school s
grade 8 in Italy since birth
mother place of birth Fraction of native students in school s
and grade 8 with mother born abroad
School (S)
Non-native school share Fraction of 8 grade non-native
students in school s
nonnatives_stock Total number of non-native students
in the school (6, 7 and 8 grade)
school_size
School size, given by the total number
of students in the school (6, 7 and 8
grade).
High_cheating_dummy
(subject specific)
Dummy equal 1 if the school is in the
9th
decile of the school cheating
coefficient distribution
Catchment Area
(W)
lpop Log of total resident population
Census
2001
illiterate Fraction of illiterate pop.
university_edu Fraction of pop. with university level
education
m_occup_rate Male occupation rate
f_occup_rate Female occupation rate
foreign_citizens No. of non-Italian residents
agri_oc Fraction of workers occupied in
agriculture
self_empl Fraction workers self-employed
commuter Fraction of resident commuting every
day for school or working reasons
avg_family_members Average number of family members
house_poor Fraction of houses without clean water
house_new Fraction of houses built after 1980
avg_rooms Average number of rooms per house
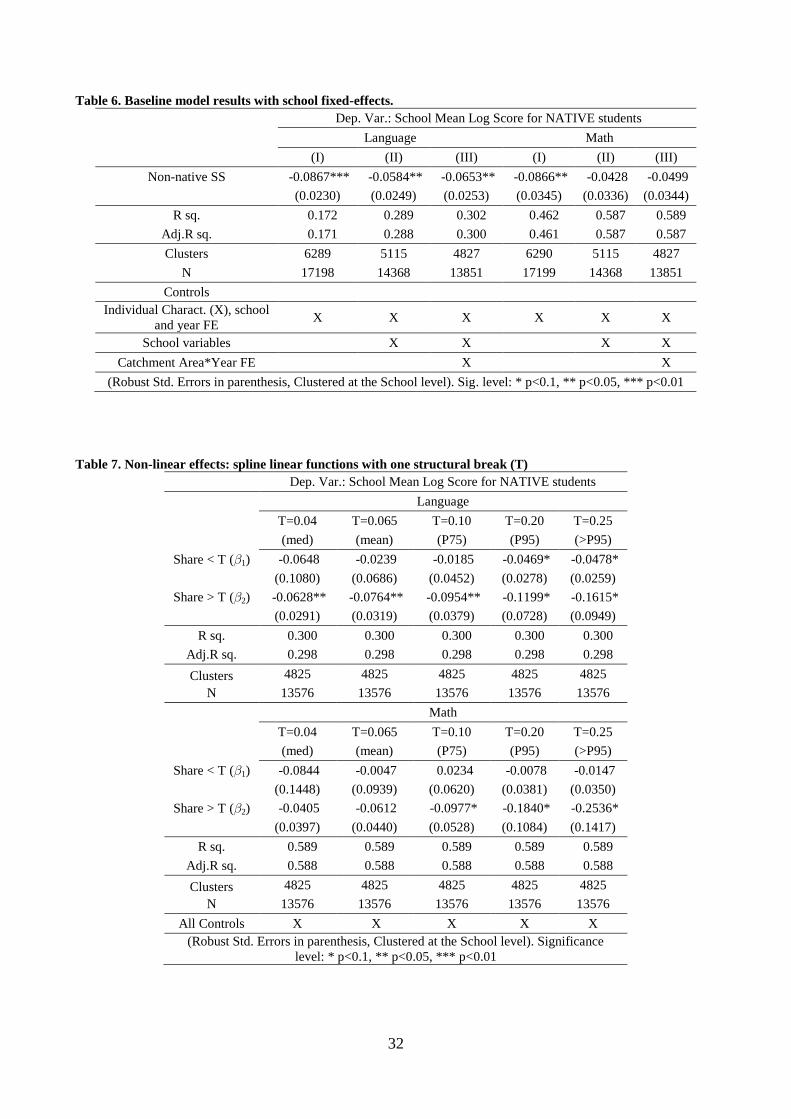
32
Table 6. Baseline model results with school fixed-effects.
Dep. Var.: School Mean Log Score for NATIVE students
Language Math
(I) (II) (III) (I) (II) (III)
Non-native SS -0.0867*** -0.0584** -0.0653** -0.0866** -0.0428 -0.0499
(0.0230) (0.0249) (0.0253) (0.0345) (0.0336) (0.0344)
R sq. 0.172 0.289 0.302 0.462 0.587 0.589
Adj.R sq. 0.171 0.288 0.300 0.461 0.587 0.587
Clusters 6289 5115 4827 6290 5115 4827
N 17198 14368 13851 17199 14368 13851
Controls
Individual Charact. (X), school
and year FE X X X X X X
School variables X X X X
Catchment Area*Year FE X X
(Robust Std. Errors in parenthesis, Clustered at the School level). Sig. level: * p<0.1, ** p<0.05, *** p<0.01
Table 7. Non-linear effects: spline linear functions with one structural break (T)
Dep. Var.: School Mean Log Score for NATIVE students
Language
T=0.04 T=0.065 T=0.10 T=0.20 T=0.25
(med) (mean) (P75) (P95) (>P95)
Share < T (1) -0.0648 -0.0239 -0.0185 -0.0469* -0.0478*
(0.1080) (0.0686) (0.0452) (0.0278) (0.0259)
Share > T (2) -0.0628** -0.0764** -0.0954** -0.1199* -0.1615*
(0.0291) (0.0319) (0.0379) (0.0728) (0.0949)
R sq. 0.300 0.300 0.300 0.300 0.300
Adj.R sq. 0.298 0.298 0.298 0.298 0.298
Clusters 4825 4825 4825 4825 4825
N 13576 13576 13576 13576 13576
Math
T=0.04 T=0.065 T=0.10 T=0.20 T=0.25
(med) (mean) (P75) (P95) (>P95)
Share < T (1) -0.0844 -0.0047 0.0234 -0.0078 -0.0147
(0.1448) (0.0939) (0.0620) (0.0381) (0.0350)
Share > T (2) -0.0405 -0.0612 -0.0977* -0.1840* -0.2536*
(0.0397) (0.0440) (0.0528) (0.1084) (0.1417)
R sq. 0.589 0.589 0.589 0.589 0.589
Adj.R sq. 0.588 0.588 0.588 0.588 0.588
Clusters 4825 4825 4825 4825 4825
N 13576 13576 13576 13576 13576
All Controls X X X X X
(Robust Std. Errors in parenthesis, Clustered at the School level). Significance
level: * p<0.1, ** p<0.05, *** p<0.01
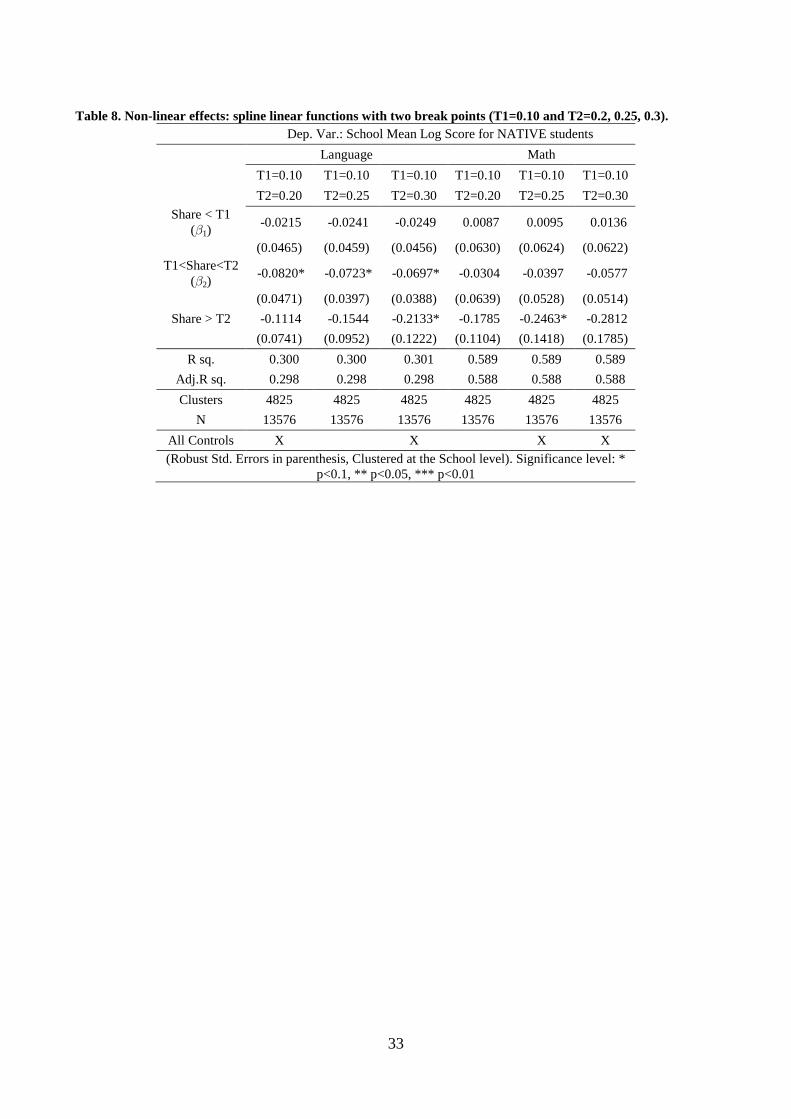
33
Table 8. Non-linear effects: spline linear functions with two break points (T1=0.10 and T2=0.2, 0.25, 0.3).
Dep. Var.: School Mean Log Score for NATIVE students
Language Math
T1=0.10 T1=0.10 T1=0.10 T1=0.10 T1=0.10 T1=0.10
T2=0.20 T2=0.25 T2=0.30 T2=0.20 T2=0.25 T2=0.30
Share < T1
(1) -0.0215 -0.0241 -0.0249 0.0087 0.0095 0.0136
(0.0465) (0.0459) (0.0456) (0.0630) (0.0624) (0.0622)
T1<Share<T2
(2) -0.0820* -0.0723* -0.0697* -0.0304 -0.0397 -0.0577
(0.0471) (0.0397) (0.0388) (0.0639) (0.0528) (0.0514)
Share > T2 -0.1114 -0.1544 -0.2133* -0.1785 -0.2463* -0.2812
(0.0741) (0.0952) (0.1222) (0.1104) (0.1418) (0.1785)
R sq. 0.300 0.300 0.301 0.589 0.589 0.589
Adj.R sq. 0.298 0.298 0.298 0.588 0.588 0.588
Clusters 4825 4825 4825 4825 4825 4825
N 13576 13576 13576 13576 13576 13576
All Controls X X X X
(Robust Std. Errors in parenthesis, Clustered at the School level). Significance level: *
p<0.1, ** p<0.05, *** p<0.01
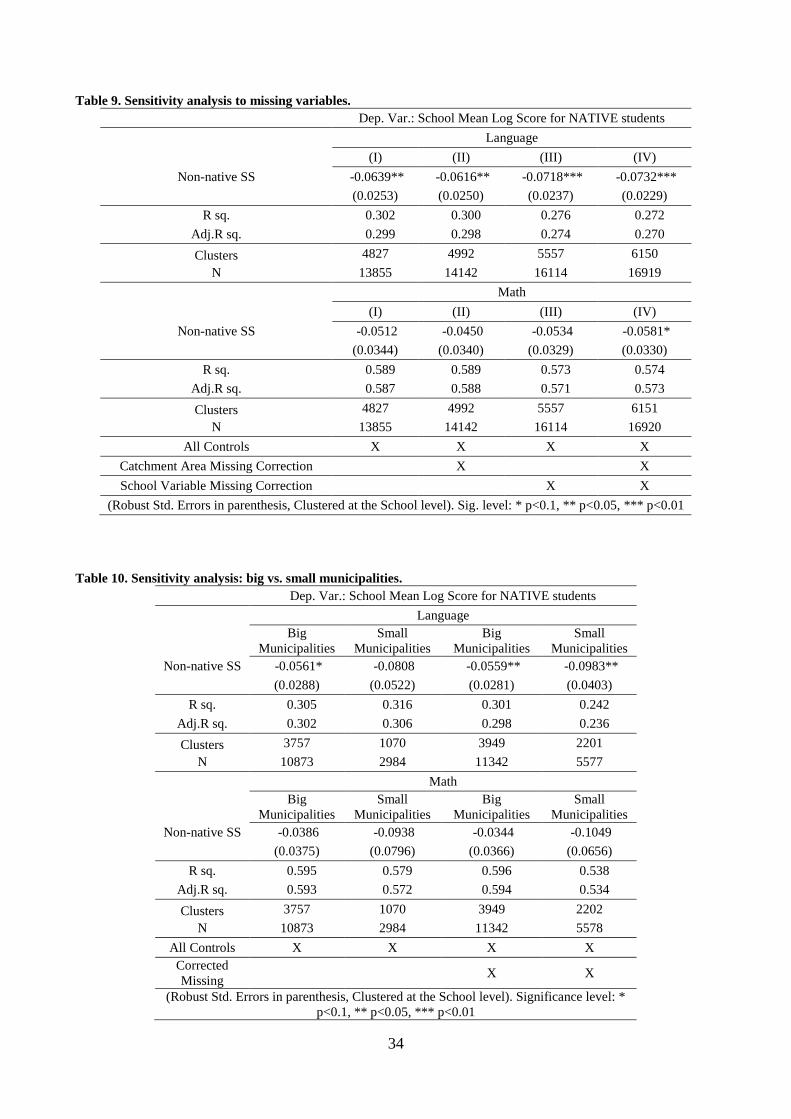
34
Table 9. Sensitivity analysis to missing variables.
Dep. Var.: School Mean Log Score for NATIVE students
Language
(I) (II) (III) (IV)
Non-native SS -0.0639** -0.0616** -0.0718*** -0.0732***
(0.0253) (0.0250) (0.0237) (0.0229)
R sq. 0.302 0.300 0.276 0.272
Adj.R sq. 0.299 0.298 0.274 0.270
Clusters 4827 4992 5557 6150
N 13855 14142 16114 16919
Math
(I) (II) (III) (IV)
Non-native SS -0.0512 -0.0450 -0.0534 -0.0581*
(0.0344) (0.0340) (0.0329) (0.0330)
R sq. 0.589 0.589 0.573 0.574
Adj.R sq. 0.587 0.588 0.571 0.573
Clusters 4827 4992 5557 6151
N 13855 14142 16114 16920
All Controls X X X X
Catchment Area Missing Correction X X
School Variable Missing Correction X X
(Robust Std. Errors in parenthesis, Clustered at the School level). Sig. level: * p<0.1, ** p<0.05, *** p<0.01
Table 10. Sensitivity analysis: big vs. small municipalities.
Dep. Var.: School Mean Log Score for NATIVE students
Language
Big
Municipalities
Small
Municipalities
Big
Municipalities
Small
Municipalities
Non-native SS -0.0561* -0.0808 -0.0559** -0.0983**
(0.0288) (0.0522) (0.0281) (0.0403)
R sq. 0.305 0.316 0.301 0.242
Adj.R sq. 0.302 0.306 0.298 0.236
Clusters 3757 1070 3949 2201
N 10873 2984 11342 5577
Math
Big
Municipalities
Small
Municipalities
Big
Municipalities
Small
Municipalities
Non-native SS -0.0386 -0.0938 -0.0344 -0.1049
(0.0375) (0.0796) (0.0366) (0.0656)
R sq. 0.595 0.579 0.596 0.538
Adj.R sq. 0.593 0.572 0.594 0.534
Clusters 3757 1070 3949 2202
N 10873 2984 11342 5578
All Controls X X X X
Corrected
Missing X X
(Robust Std. Errors in parenthesis, Clustered at the School level). Significance level: *
p<0.1, ** p<0.05, *** p<0.01
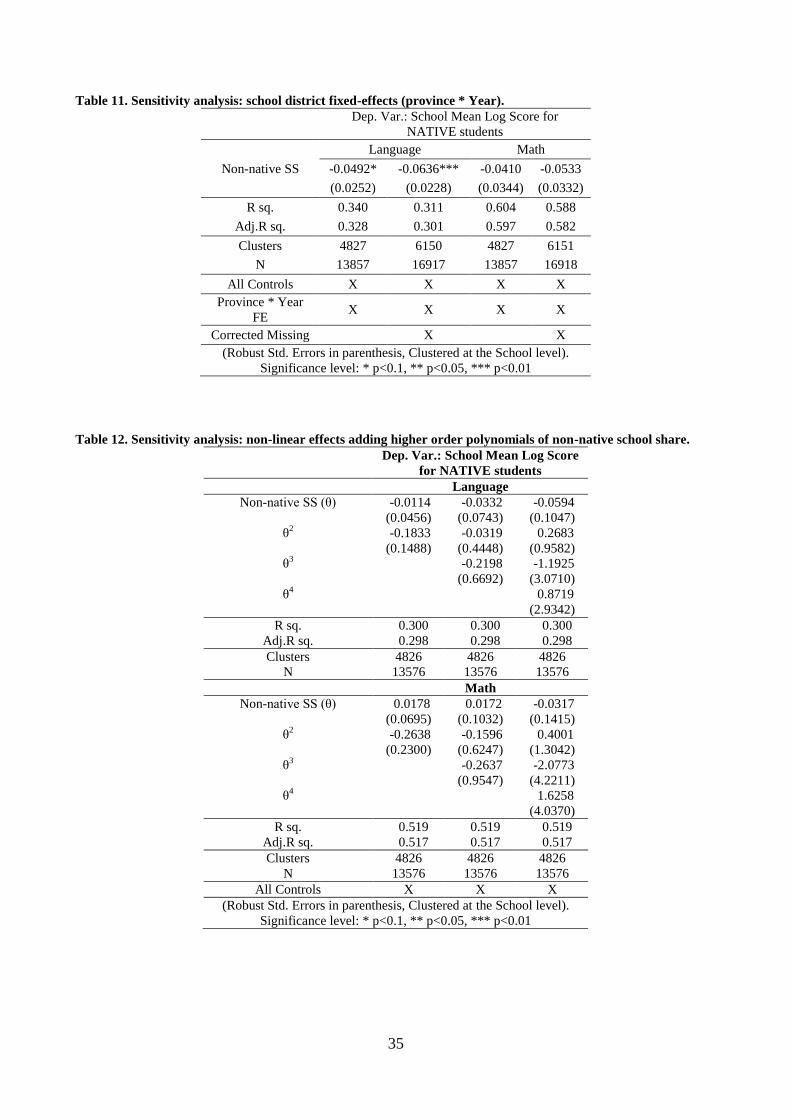
35
Table 11. Sensitivity analysis: school district fixed-effects (province * Year).
Dep. Var.: School Mean Log Score for
NATIVE students
Language Math
Non-native SS -0.0492* -0.0636*** -0.0410 -0.0533
(0.0252) (0.0228) (0.0344) (0.0332)
R sq. 0.340 0.311 0.604 0.588
Adj.R sq. 0.328 0.301 0.597 0.582
Clusters 4827 6150 4827 6151
N 13857 16917 13857 16918
All Controls X X X X
Province * Year
FE X X X X
Corrected Missing
X
X
(Robust Std. Errors in parenthesis, Clustered at the School level).
Significance level: * p<0.1, ** p<0.05, *** p<0.01
Table 12. Sensitivity analysis: non-linear effects adding higher order polynomials of non-native school share.
Dep. Var.: School Mean Log Score
for NATIVE students
Language
Non-native SS (θ) -0.0114 -0.0332 -0.0594
(0.0456) (0.0743) (0.1047)
θ2 -0.1833 -0.0319 0.2683
(0.1488) (0.4448) (0.9582)
θ3 -0.2198 -1.1925
(0.6692) (3.0710)
θ4 0.8719
(2.9342)
R sq. 0.300 0.300 0.300
Adj.R sq. 0.298 0.298 0.298
Clusters 4826 4826 4826
N 13576 13576 13576
Math
Non-native SS (θ) 0.0178 0.0172 -0.0317
(0.0695) (0.1032) (0.1415)
θ2 -0.2638 -0.1596 0.4001
(0.2300) (0.6247) (1.3042)
θ3 -0.2637 -2.0773
(0.9547) (4.2211)
θ4 1.6258
(4.0370)
R sq. 0.519 0.519 0.519
Adj.R sq. 0.517 0.517 0.517
Clusters 4826 4826 4826
N 13576 13576 13576
All Controls X X X
(Robust Std. Errors in parenthesis, Clustered at the School level).
Significance level: * p<0.1, ** p<0.05, *** p<0.01
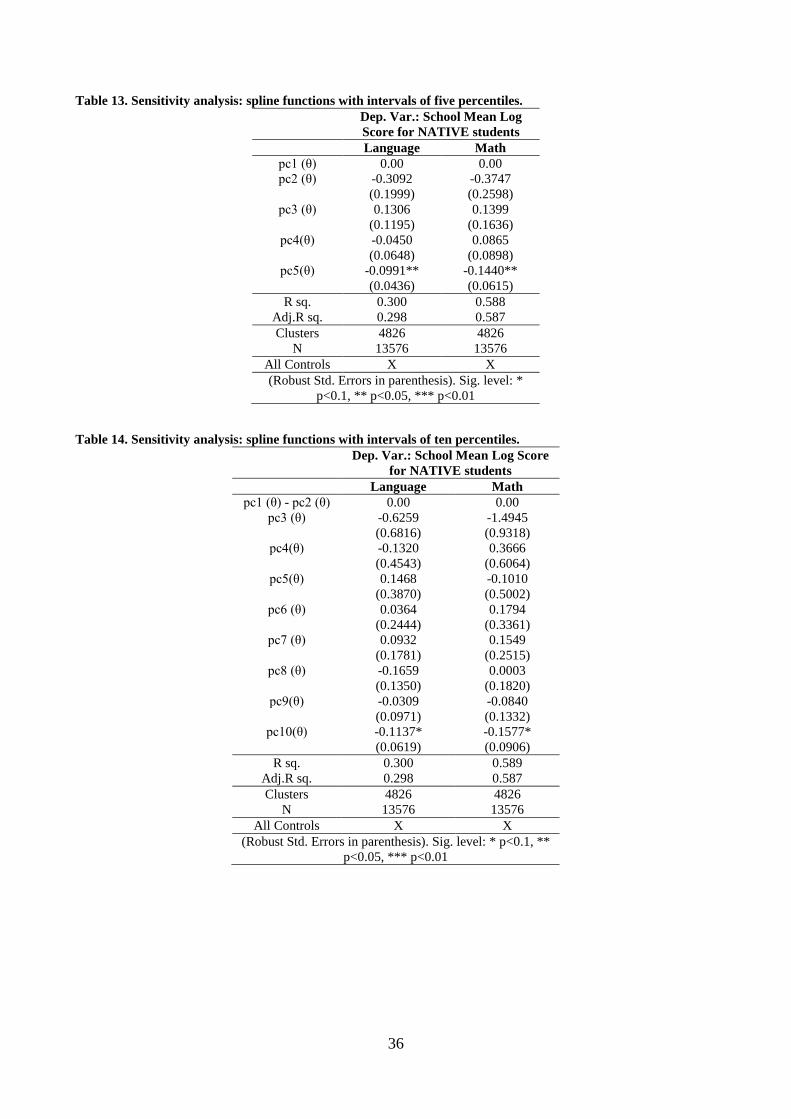
36
Table 13. Sensitivity analysis: spline functions with intervals of five percentiles.
Dep. Var.: School Mean Log
Score for NATIVE students
Language Math
pc1 (θ) 0.00 0.00
pc2 (θ) -0.3092 -0.3747
(0.1999) (0.2598)
pc3 (θ) 0.1306 0.1399
(0.1195) (0.1636)
pc4(θ) -0.0450 0.0865
(0.0648) (0.0898)
pc5(θ) -0.0991** -0.1440**
(0.0436) (0.0615)
R sq. 0.300 0.588
Adj.R sq. 0.298 0.587
Clusters 4826 4826
N 13576 13576
All Controls X X
(Robust Std. Errors in parenthesis). Sig. level: *
p<0.1, ** p<0.05, *** p<0.01
Table 14. Sensitivity analysis: spline functions with intervals of ten percentiles.
Dep. Var.: School Mean Log Score
for NATIVE students
Language Math
pc1 (θ) - pc2 (θ) 0.00 0.00
pc3 (θ) -0.6259 -1.4945
(0.6816) (0.9318)
pc4(θ) -0.1320 0.3666
(0.4543) (0.6064)
pc5(θ) 0.1468 -0.1010
(0.3870) (0.5002)
pc6 (θ) 0.0364 0.1794
(0.2444) (0.3361)
pc7 (θ) 0.0932 0.1549
(0.1781) (0.2515)
pc8 (θ) -0.1659 0.0003
(0.1350) (0.1820)
pc9(θ) -0.0309 -0.0840
(0.0971) (0.1332)
pc10(θ) -0.1137* -0.1577*
(0.0619) (0.0906)
R sq. 0.300 0.589
Adj.R sq. 0.298 0.587
Clusters 4826 4826
N 13576 13576
All Controls X X
(Robust Std. Errors in parenthesis). Sig. level: * p<0.1, **
p<0.05, *** p<0.01

37
References
Akerlof, George A. and Rachel E. Kranton (2000), “Economics and Identity”, The Quarterly
Journal of Economics, Vol. CXV, August 2000, Issue 3.
Akerlof, George A. and Rachel E. Kranton (2002), “Identity and Schooling: Some Lessons for the
Economics of Education”, Journal of Economic Literature, Vol. 40, No. 4, pp. 1167-1201.
Ammermüller, Andreas and Pischke Jörn-Steffen (2009), “Peer Effects in European Primary
Schools: Evidence from PIRLS”, Journal of Labour Economics, 27 (3). pp. 315-348.
Angrist Joshua D. and Pischke Jörn-Steffen (2008), “Mostly Harmless Econometrics: An
Empiricist’s Companion”, Princeton University Press.
Angrist, Joshua D., and Kevin Lang (2004), “Does School Integration Generate Peer Effects?
Evidence from Boston's Metco program”, American Economic Review, 94(5): 1613–1634.
Armor, David J. (1995), “Forced justice: School desegregation and the law”, New York: Oxford
University Press.
Aslund Olof, Per-Andersen Edin, Peter Fredriksson and Hans Gronqvist (2009), “Peers,
neighbourhoods and immigrant student achievement – evidence from a placement policy”, Uppsala
Universitet, Department of Economics WP 2009:17.
Austen-Smith, D., Fryer, R., (2005), “An economic analysis of ‘acting white”, Quarterly Journal of
Economics 551–583.
Aydemir Abdurrahman and George J. Borjas (2010), “A comparative analysis of the labor market
impact of international migration: Canada, Mexico and the United States”, Journal of the European
Economic Association 5, No. 4:663-708.
Barbieri, Gianna, Claudio Rossetti and Paolo Sestito (2010), “The determinants of teachers
mobility. Evidence from a panel of Italian teachers”, Bank of Italy Working Papers No. 761, June
2010.
Betts, J.R. and Fairlie, R.W. (2003), “Does immigration induce ‘native flight’ from public schools
into private schools?”, Journal of Public Economics, vol. 87(5-6) (May), pp. 987–1012.
Bramoullé, Yann, Habiba Djebbari, Bernard Fortin (2009), “Identification of peer effects through
social networks”, Journal of Econometrics 150 (2009) 41:55.
Brunello, Giorgio, Maria De Paola and Vincenzo Scoppa (2010), “Peer effects in higher education:
does the field of study matter?”, Economic Inquiry, Vol. 48, No. 3, July 2010, 621–634.
Brunello, Giorgio and Lorenzo Rocco (2011), “The Effect of Immigration on the School
Performance of Natives: Cross Country Evidence Using PISA Test Scores”, IZA DP No. 5479.
Card, David, and Jesse Rothstein (2007) “Racial Segregation and the Black-white Test Score Gap”
Journal of Public Economics, 91(11–12): 2158–2184.
38
Clotfelter, Charles T. (1999), “Public school segregation in metropolitan areas”, Land Economics,
75(4): 487-504.
CNEL(2011), “Le seconde generazioni e il problema dell’identità culturale”, a cura della
Fondazione Silvano Andolfi, National Council for Labour and Economics (CNEL).
Coleman, James S. (1966), “Equality of Educational Opportunity,” Washington D.C., U.S.,
Department of Health, Education and Welfare, Office of Education, OE-38001.
Cook, Thomas D. (1984), “What have black children gained academically from school
desegregation? A review of the metaanalytic evidence”, In School desegregation. Washington, DC:
National Institute of Education.
Cooley, Jane (2010), “Desegregation and the Achievement Gap: Do Diverse Peers Help”, Duke
University, unpublished.
Crain, Robert L., and Rita E. Mahard (1978), “Desegregation and black achievement: A review of
the research." Law and Contemporary Problems 42, No.3: 17-53.
Cutler, David M. and Edward L. Glaeser (1997), “Are Ghettos Good or Bad?”, Quarterly Journal of
Economics 112: 827-72.
De Giorgi, Giacomo, Michele Pellizzari and Silvia Redaelli (2010), “Identification of Social
Interactions through Partially Overlapping Peer Groups”, American Economic Journal: Applied
Economics, 2 (April 2010): 241–275.
De Giorgi, Giacomo and Michele Pellizzari (2011), “Understanding Social Interactions: Evidence
from the Classroom”, IZA DP No. 5624.
Durlauf, Steven N. (2004), “Neighbourhood effects”, in the Handbook of Regional and Urban
Economics, Volume 4, Economics, J. V. Henderson and j. F. Thisse Eds.
Durlauf, Steven N. and Yannis M. Ioannides (2009), “Social Interactions”, Tufts University,
Economic Department Working Paper. Forthcoming in Annual Review of Economics (2010).
Epple D. and Richard D. Romano (2011), “Peer effects in education: a survey of the theory and
evidence”, Handbook of Social Economics, Vol. 1B, Ch. 20.
Evans, William N., Wallace E. Oates and Robert M. Schwab (1992), “Measuring Peer Group
Effects: A Study of Teenage Behavior”, Journal of Political Economy 100(5): 966-91.
Fordham, S., Ogbu, J. (1986), “Black students' school successes: coping with the burden of ‘acting
white’, The Urban Review 18, 176–206.
Fryer, Roland G. Jr. (2011), “The importance of segregation, discrimination, peer dynamics, and
identity in explaining trends in the racial gap”, Handbook of Social Economics, Vol. 1B, Ch. 21.
Fryer, Roland G. Jr and Torelli, Paul (2010), “An empirical analysis of ‘acting white”, Journal of
Public Economics, 94 (2010) 380–396
39
Gibbons, Stephen and Telhaj Shqiponje (2006), “Peer effects and pupil attainment: evidence from
secondary school transition”, Centre for the Economics of Education Working Paper (LSE), May
2006.
Gould, Eric D., Victor Lavy and M. Daniele Paserman (2009), “Does immigration affect the long-
term educational outcomes of natives? Quasi-experimental evidence”, The Economic Journal
119(540): 1243-1269.
Heckman J. James (2011), “The American Family in Black and White: A Post-Racial Strategy for
Improving Skills to Promote Equality”, IZA DP. No. 5495.
Hanushek, Eric A., John F. Kain, Jacob M. Martin and Steven G. Rivkin (2003), “Does peer ability
affect student achievement?”, Journal of Applied Econometrics, 2003, 18: 527-544.
Hanushek, Eric A., John F. Kain and Steven G. Rivkin (2009), “New Evidence About Brown V.
Board of Education: The Complex Effects of School Racial Composition on Achievement”, Journal
of Labor Economics, 2009, vol. 27, no. 3.
Hanushek, Eric A., and Steven G. Rivkin (2009), “Harming the Best: How Schools Affect the
Black–White Achievement Gap”, Journal of Policy Analysis and Management, Vol. 28, No. 3,
366–393.
Hoxby, Caroline M. (2000), “Peer Effects in the Classroom: Learning from Gender and Race
Variation”, National Bureau of Economic Research: Working Paper No. 7867.
Hoxby, Caroline M. and Weingarth Gretchen (2006), “Taking race out of the equation: school
reassinment and the structure of peer effects” , unpublished working paper.
INVALSI (2008, 2009, 2010), “Esame di Stato di I Ciclo, Prova Nazionale: Rapporti Tecnici e
Analisi”, INVALSI online publication.
Jansen, Peter and Astrid W. Rasmussen (2011), “The effect of immigrant concentration in schools
on native and immigrant children’s reading and math skills”, Economics of Education Review,
August 2011, doi:10.1016/j.econedurev.2011.08.002.
Kinsler, Josh (2010), “School Discipline: A Source or Salve for the Racial Achievement Gap?”
November 12, 2010, Duke University Economics Department.
Kramarz, Francis, Stephen Machin and Amine Ouazad (2009), “What Makes a TestScore? The
Respective Contributions of Pupils, Schools, and Peers in Achievemen in English Primary
Education”, CEE Discussion Papers 102, Centre for Economics of Education, LSE.
Lazear, Edward P. (2001), “Educational production”, The Quarterly Journal of Economics, Vol.
CXVI, August 2001, Issue 3.
Lazear, Edward P. (1999), “Culture and Language,” Journal of Political Economy, CVII (1999),
95–126.
Manski Charles F., (1993), “Identification of Endogenous Social Effects: The Reflection Problem”,
Review of Economic Studies, vol. 60(3), pages 531-42, July.

40
Meunier, Muriel (2010), “Immigration and student achievement: evidence for Switzerland”, Haute
Ecole de Gestion de Genève, Centre de Recherche Appliquée en Gestion, Chaier de Recherche No.
10/3/01.
McKee, Graham, Steven Rivkin and Katharine Sims (2011), “Disruption, effort and Heterogeneous
benefits of smaller classes”, NBER WP 15812 (updated July 2011).
MIUR (2009a), “Alunni con cittadinanza non italiana Scuole statali e non statali. Anno scolastico
2007/2008”, Aprile 2009, MIUR: Servizio Statistico.
MIUR (2009b), “Gli alunni stranieri nel sistema scolastico italiano. Anno scolastico 2008/2009”,
Dicembre 2009, MIUR: Servizio Statistico.
MIUR (2010), “Focus in breve sulla scuola: la presenza degli alunni stranieri nelle scuole statali”,
Marzo 2010, MIUR: Servizio Statistico.
Neidell, Matthew and Jane Waldfogel (2010), “Cognitive and noncognitive peer effects in early
education”, The Review of Economics and Statistics, August 2010, 92(3): 562–576.
OECD (2010), “OECD Reviews of Migrant Education”, online publications, Paris: OECD.
Patacchini, Eleonora and Yves Zenou (2006), “Racial Identity and Education”, IZA DP. No. 2046.
Schnepf, S. Viola (2007), “Immigrants’ educational disadvantage: an examination across ten
countries and three surveys”, Journal of Population Economics 20: 527-545.
Stanat, P. and Christensen, G. (2006), “Where immigrant students succeed: A comparative review
of performance and engagement in PISA 2003”, Paris: Organisation for Economic Co-operation
and Development.
Steele, S., and Aronson, J., (1998), “Stereotype threat and the test performance of academically
successful African Americans”. In: Jencks, C., Phillips, M. (Eds.), The Black–White Test Score
Gap. Brookings Institution Press, Washington, DC, pp. 401–430
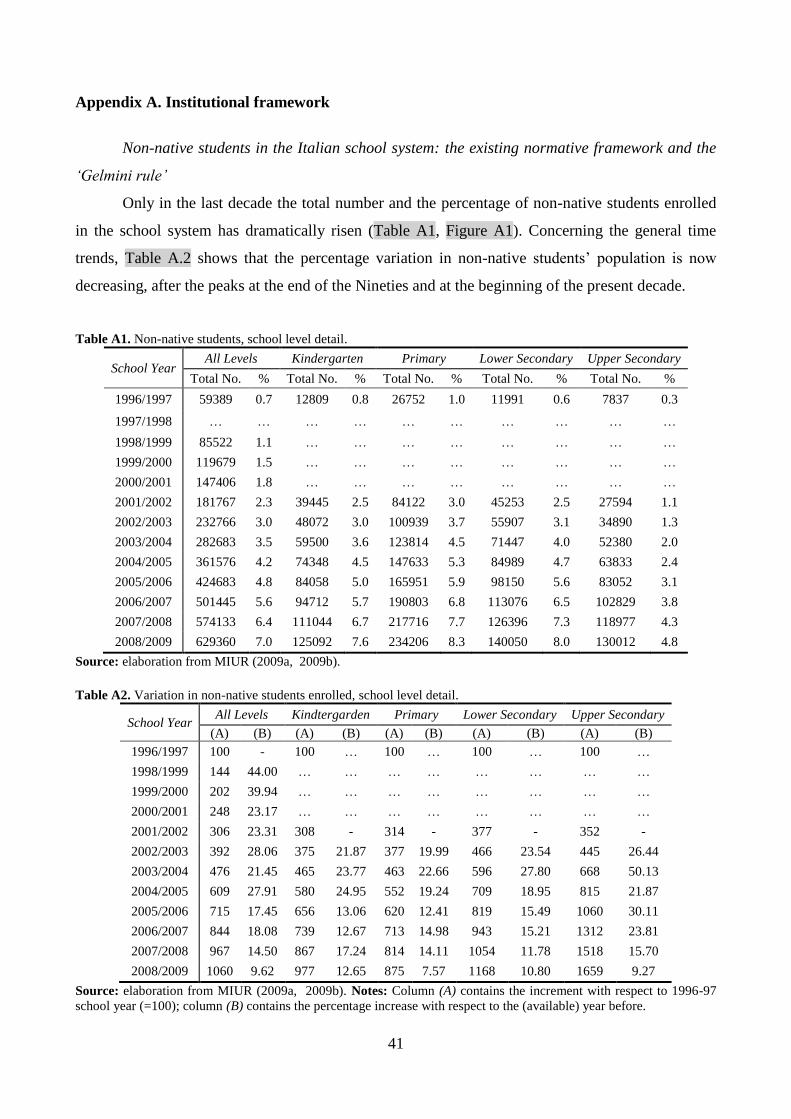
41
Appendix A. Institutional framework
Non-native students in the Italian school system: the existing normative framework and the
‘Gelmini rule’
Only in the last decade the total number and the percentage of non-native students enrolled
in the school system has dramatically risen (Table A1, Figure A1). Concerning the general time
trends, Table A.2 shows that the percentage variation in non-native students’ population is now
decreasing, after the peaks at the end of the Nineties and at the beginning of the present decade.
Table A1. Non-native students, school level detail.
School Year All Levels Kindergarten Primary Lower Secondary Upper Secondary
Total No. % Total No. % Total No. % Total No. % Total No. %
1996/1997 59389 0.7 12809 0.8 26752 1.0 11991 0.6 7837 0.3
1997/1998 … … … … … … … … … …
1998/1999 85522 1.1 … … … … … … … …
1999/2000 119679 1.5 … … … … … … … …
2000/2001 147406 1.8 … … … … … … … …
2001/2002 181767 2.3 39445 2.5 84122 3.0 45253 2.5 27594 1.1
2002/2003 232766 3.0 48072 3.0 100939 3.7 55907 3.1 34890 1.3
2003/2004 282683 3.5 59500 3.6 123814 4.5 71447 4.0 52380 2.0
2004/2005 361576 4.2 74348 4.5 147633 5.3 84989 4.7 63833 2.4
2005/2006 424683 4.8 84058 5.0 165951 5.9 98150 5.6 83052 3.1
2006/2007 501445 5.6 94712 5.7 190803 6.8 113076 6.5 102829 3.8
2007/2008 574133 6.4 111044 6.7 217716 7.7 126396 7.3 118977 4.3
2008/2009 629360 7.0 125092 7.6 234206 8.3 140050 8.0 130012 4.8
Source: elaboration from MIUR (2009a, 2009b).
Table A2. Variation in non-native students enrolled, school level detail.
School Year All Levels Kindtergarden Primary Lower Secondary Upper Secondary
(A) (B) (A) (B) (A) (B) (A) (B) (A) (B)
1996/1997 100 - 100 … 100 … 100 … 100 …
1998/1999 144 44.00 … … … … … … … …
1999/2000 202 39.94 … … … … … … … …
2000/2001 248 23.17 … … … … … … … …
2001/2002 306 23.31 308 - 314 - 377 - 352 -
2002/2003 392 28.06 375 21.87 377 19.99 466 23.54 445 26.44
2003/2004 476 21.45 465 23.77 463 22.66 596 27.80 668 50.13
2004/2005 609 27.91 580 24.95 552 19.24 709 18.95 815 21.87
2005/2006 715 17.45 656 13.06 620 12.41 819 15.49 1060 30.11
2006/2007 844 18.08 739 12.67 713 14.98 943 15.21 1312 23.81
2007/2008 967 14.50 867 17.24 814 14.11 1054 11.78 1518 15.70
2008/2009 1060 9.62 977 12.65 875 7.57 1168 10.80 1659 9.27
Source: elaboration from MIUR (2009a, 2009b). Notes: Column (A) contains the increment with respect to 1996-97
school year (=100); column (B) contains the percentage increase with respect to the (available) year before.
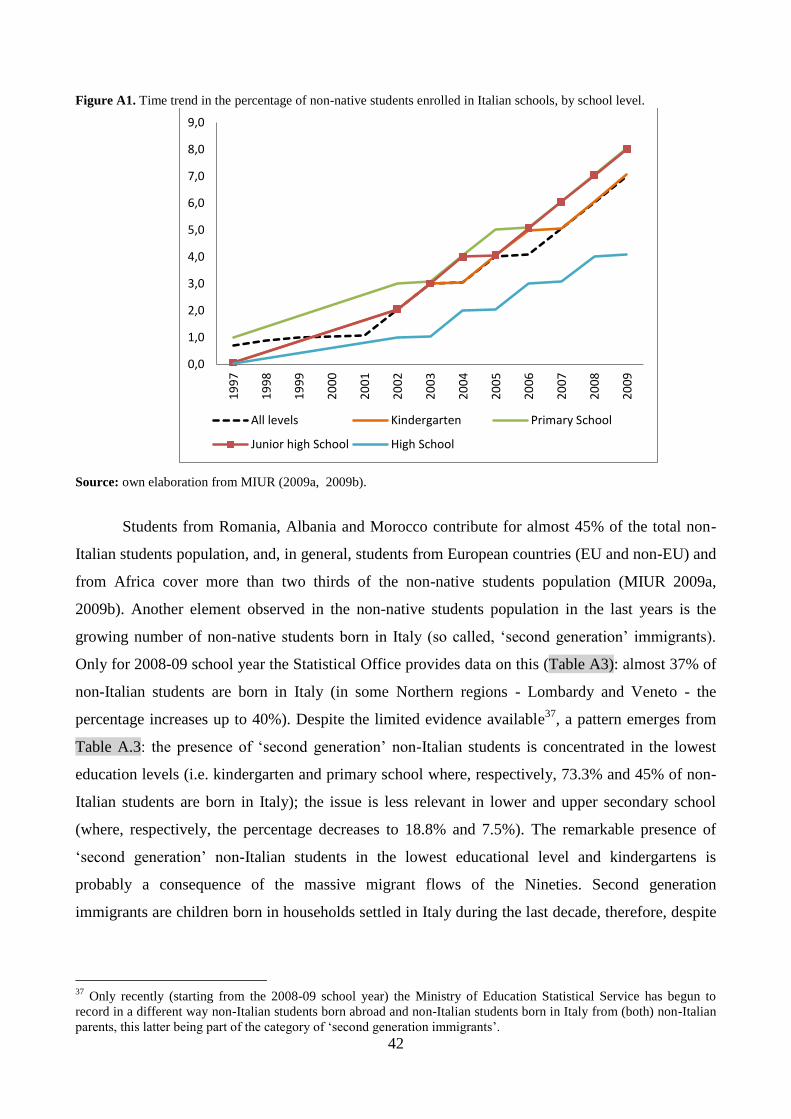
42
Figure A1. Time trend in the percentage of non-native students enrolled in Italian schools, by school level.
Source: own elaboration from MIUR (2009a, 2009b).
Students from Romania, Albania and Morocco contribute for almost 45% of the total non-
Italian students population, and, in general, students from European countries (EU and non-EU) and
from Africa cover more than two thirds of the non-native students population (MIUR 2009a,
2009b). Another element observed in the non-native students population in the last years is the
growing number of non-native students born in Italy (so called, ‘second generation’ immigrants).
Only for 2008-09 school year the Statistical Office provides data on this (Table A3): almost 37% of
non-Italian students are born in Italy (in some Northern regions - Lombardy and Veneto - the
percentage increases up to 40%). Despite the limited evidence available37
, a pattern emerges from
Table A.3: the presence of ‘second generation’ non-Italian students is concentrated in the lowest
education levels (i.e. kindergarten and primary school where, respectively, 73.3% and 45% of non-
Italian students are born in Italy); the issue is less relevant in lower and upper secondary school
(where, respectively, the percentage decreases to 18.8% and 7.5%). The remarkable presence of
‘second generation’ non-Italian students in the lowest educational level and kindergartens is
probably a consequence of the massive migrant flows of the Nineties. Second generation
immigrants are children born in households settled in Italy during the last decade, therefore, despite
37
Only recently (starting from the 2008-09 school year) the Ministry of Education Statistical Service has begun to
record in a different way non-Italian students born abroad and non-Italian students born in Italy from (both) non-Italian
parents, this latter being part of the category of ‘second generation immigrants’.
0,0
1,0
2,0
3,0
4,0
5,0
6,0
7,0
8,0
9,0
19
97
19
98
19
99
20
00
20
01
20
02
20
03
20
04
20
05
20
06
20
07
20
08
20
09
All levels Kindergarten Primary School
Junior high School High School
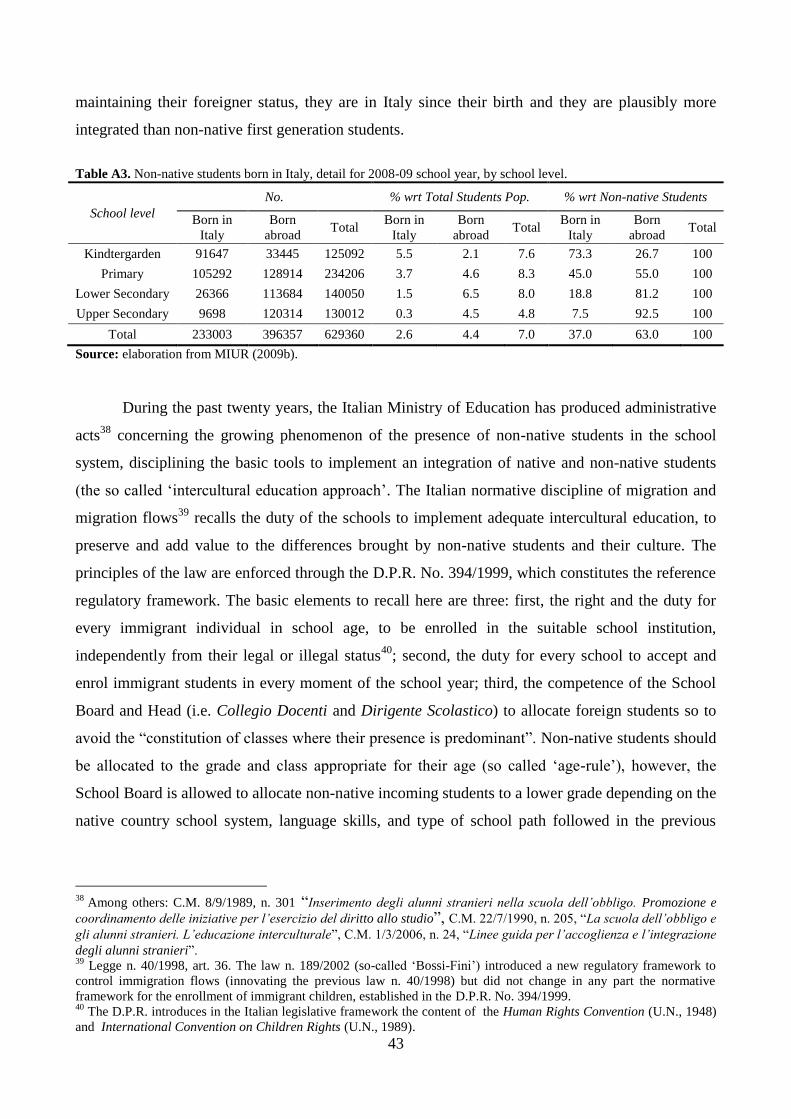
43
maintaining their foreigner status, they are in Italy since their birth and they are plausibly more
integrated than non-native first generation students.
Table A3. Non-native students born in Italy, detail for 2008-09 school year, by school level.
School level
No. % wrt Total Students Pop. % wrt Non-native Students
Born in
Italy
Born
abroad Total
Born in
Italy
Born
abroad Total
Born in
Italy
Born
abroad Total
Kindtergarden 91647 33445 125092 5.5 2.1 7.6 73.3 26.7 100
Primary 105292 128914 234206 3.7 4.6 8.3 45.0 55.0 100
Lower Secondary 26366 113684 140050 1.5 6.5 8.0 18.8 81.2 100
Upper Secondary 9698 120314 130012 0.3 4.5 4.8 7.5 92.5 100
Total 233003 396357 629360 2.6 4.4 7.0 37.0 63.0 100
Source: elaboration from MIUR (2009b).
During the past twenty years, the Italian Ministry of Education has produced administrative
acts38
concerning the growing phenomenon of the presence of non-native students in the school
system, disciplining the basic tools to implement an integration of native and non-native students
(the so called ‘intercultural education approach’. The Italian normative discipline of migration and
migration flows39
recalls the duty of the schools to implement adequate intercultural education, to
preserve and add value to the differences brought by non-native students and their culture. The
principles of the law are enforced through the D.P.R. No. 394/1999, which constitutes the reference
regulatory framework. The basic elements to recall here are three: first, the right and the duty for
every immigrant individual in school age, to be enrolled in the suitable school institution,
independently from their legal or illegal status40
; second, the duty for every school to accept and
enrol immigrant students in every moment of the school year; third, the competence of the School
Board and Head (i.e. Collegio Docenti and Dirigente Scolastico) to allocate foreign students so to
avoid the “constitution of classes where their presence is predominant”. Non-native students should
be allocated to the grade and class appropriate for their age (so called ‘age-rule’), however, the
School Board is allowed to allocate non-native incoming students to a lower grade depending on the
native country school system, language skills, and type of school path followed in the previous
38
Among others: C.M. 8/9/1989, n. 301 “Inserimento degli alunni stranieri nella scuola dell’obbligo. Promozione e
coordinamento delle iniziative per l’esercizio del diritto allo studio”, C.M. 22/7/1990, n. 205, “La scuola dell’obbligo e
gli alunni stranieri. L’educazione interculturale”, C.M. 1/3/2006, n. 24, “Linee guida per l’accoglienza e l’integrazione
degli alunni stranieri”. 39
Legge n. 40/1998, art. 36. The law n. 189/2002 (so-called ‘Bossi-Fini’) introduced a new regulatory framework to
control immigration flows (innovating the previous law n. 40/1998) but did not change in any part the normative
framework for the enrollment of immigrant children, established in the D.P.R. No. 394/1999. 40
The D.P.R. introduces in the Italian legislative framework the content of the Human Rights Convention (U.N., 1948)
and International Convention on Children Rights (U.N., 1989).
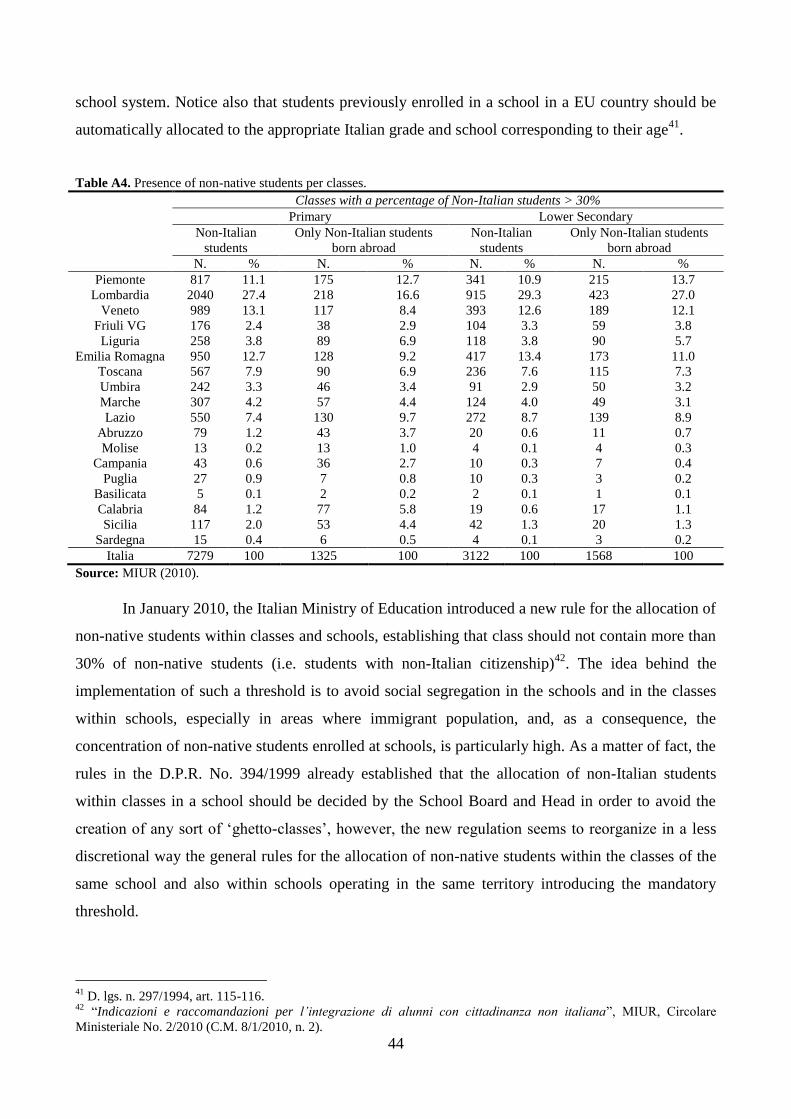
44
school system. Notice also that students previously enrolled in a school in a EU country should be
automatically allocated to the appropriate Italian grade and school corresponding to their age41
.
Table A4. Presence of non-native students per classes.
Classes with a percentage of Non-Italian students > 30%
Primary Lower Secondary
Non-Italian
students
Only Non-Italian students
born abroad
Non-Italian
students
Only Non-Italian students
born abroad
N. % N. % N. % N. %
Piemonte 817 11.1 175 12.7 341 10.9 215 13.7
Lombardia 2040 27.4 218 16.6 915 29.3 423 27.0
Veneto 989 13.1 117 8.4 393 12.6 189 12.1
Friuli VG 176 2.4 38 2.9 104 3.3 59 3.8
Liguria 258 3.8 89 6.9 118 3.8 90 5.7
Emilia Romagna 950 12.7 128 9.2 417 13.4 173 11.0
Toscana 567 7.9 90 6.9 236 7.6 115 7.3
Umbira 242 3.3 46 3.4 91 2.9 50 3.2
Marche 307 4.2 57 4.4 124 4.0 49 3.1
Lazio 550 7.4 130 9.7 272 8.7 139 8.9
Abruzzo 79 1.2 43 3.7 20 0.6 11 0.7
Molise 13 0.2 13 1.0 4 0.1 4 0.3
Campania 43 0.6 36 2.7 10 0.3 7 0.4
Puglia 27 0.9 7 0.8 10 0.3 3 0.2
Basilicata 5 0.1 2 0.2 2 0.1 1 0.1
Calabria 84 1.2 77 5.8 19 0.6 17 1.1
Sicilia 117 2.0 53 4.4 42 1.3 20 1.3
Sardegna 15 0.4 6 0.5 4 0.1 3 0.2
Italia 7279 100 1325 100 3122 100 1568 100
Source: MIUR (2010).
In January 2010, the Italian Ministry of Education introduced a new rule for the allocation of
non-native students within classes and schools, establishing that class should not contain more than
30% of non-native students (i.e. students with non-Italian citizenship)42
. The idea behind the
implementation of such a threshold is to avoid social segregation in the schools and in the classes
within schools, especially in areas where immigrant population, and, as a consequence, the
concentration of non-native students enrolled at schools, is particularly high. As a matter of fact, the
rules in the D.P.R. No. 394/1999 already established that the allocation of non-Italian students
within classes in a school should be decided by the School Board and Head in order to avoid the
creation of any sort of ‘ghetto-classes’, however, the new regulation seems to reorganize in a less
discretional way the general rules for the allocation of non-native students within the classes of the
same school and also within schools operating in the same territory introducing the mandatory
threshold.
41
D. lgs. n. 297/1994, art. 115-116. 42 “Indicazioni e raccomandazioni per l’integrazione di alunni con cittadinanza non italiana”, MIUR, Circolare
Ministeriale No. 2/2010 (C.M. 8/1/2010, n. 2).
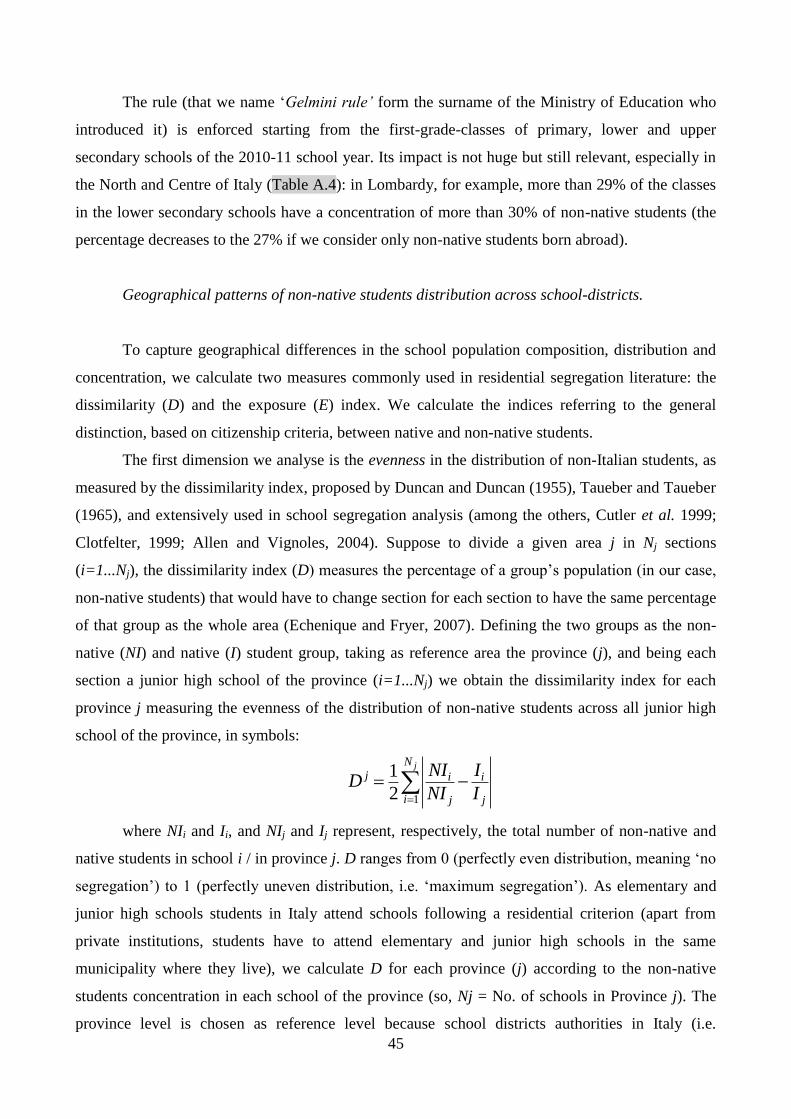
45
The rule (that we name ‘Gelmini rule’ form the surname of the Ministry of Education who
introduced it) is enforced starting from the first-grade-classes of primary, lower and upper
secondary schools of the 2010-11 school year. Its impact is not huge but still relevant, especially in
the North and Centre of Italy (Table A.4): in Lombardy, for example, more than 29% of the classes
in the lower secondary schools have a concentration of more than 30% of non-native students (the
percentage decreases to the 27% if we consider only non-native students born abroad).
Geographical patterns of non-native students distribution across school-districts.
To capture geographical differences in the school population composition, distribution and
concentration, we calculate two measures commonly used in residential segregation literature: the
dissimilarity (D) and the exposure (E) index. We calculate the indices referring to the general
distinction, based on citizenship criteria, between native and non-native students.
The first dimension we analyse is the evenness in the distribution of non-Italian students, as
measured by the dissimilarity index, proposed by Duncan and Duncan (1955), Taueber and Taueber
(1965), and extensively used in school segregation analysis (among the others, Cutler et al. 1999;
Clotfelter, 1999; Allen and Vignoles, 2004). Suppose to divide a given area j in Nj sections
(i=1...Nj), the dissimilarity index (D) measures the percentage of a group’s population (in our case,
non-native students) that would have to change section for each section to have the same percentage
of that group as the whole area (Echenique and Fryer, 2007). Defining the two groups as the non-
native (NI) and native (I) student group, taking as reference area the province (j), and being each
section a junior high school of the province (i=1...Nj) we obtain the dissimilarity index for each
province j measuring the evenness of the distribution of non-native students across all junior high
school of the province, in symbols:
1
1
2
jN
j i i
i j j
NI ID
NI I
where NIi and Ii, and NIj and Ij represent, respectively, the total number of non-native and
native students in school i / in province j. D ranges from 0 (perfectly even distribution, meaning ‘no
segregation’) to 1 (perfectly uneven distribution, i.e. ‘maximum segregation’). As elementary and
junior high schools students in Italy attend schools following a residential criterion (apart from
private institutions, students have to attend elementary and junior high schools in the same
municipality where they live), we calculate D for each province (j) according to the non-native
students concentration in each school of the province (so, Nj = No. of schools in Province j). The
province level is chosen as reference level because school districts authorities in Italy (i.e.
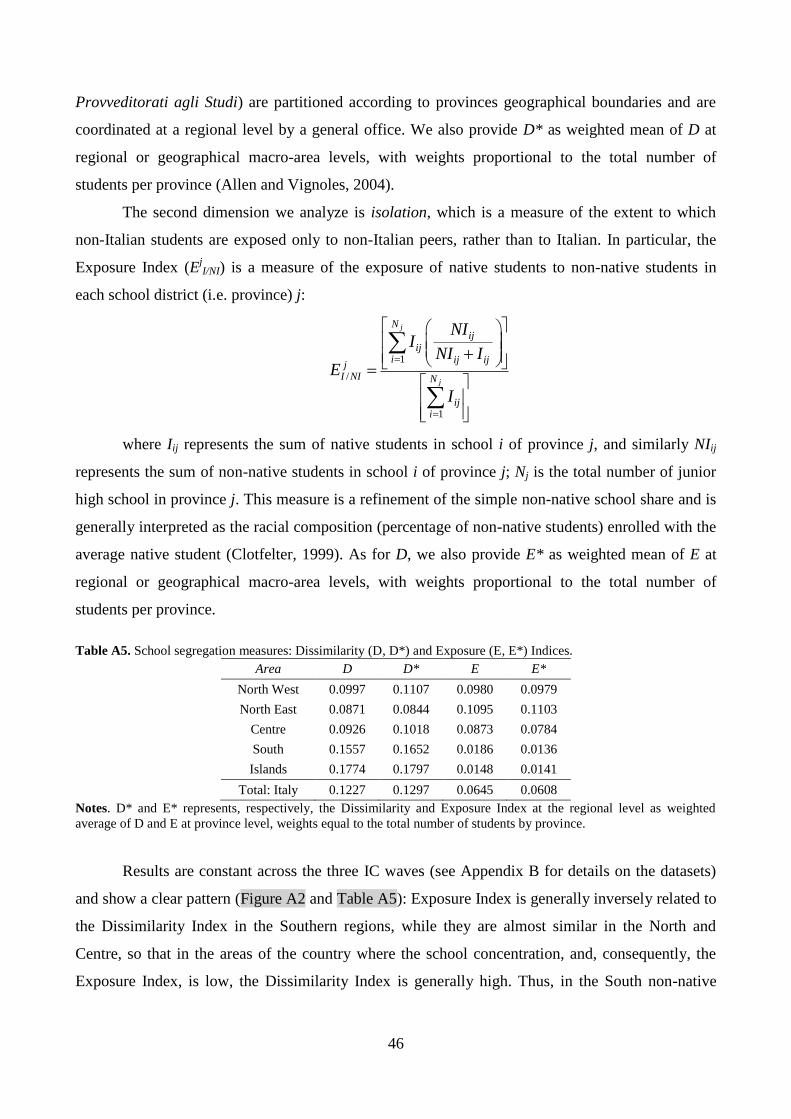
46
Provveditorati agli Studi) are partitioned according to provinces geographical boundaries and are
coordinated at a regional level by a general office. We also provide D* as weighted mean of D at
regional or geographical macro-area levels, with weights proportional to the total number of
students per province (Allen and Vignoles, 2004).
The second dimension we analyze is isolation, which is a measure of the extent to which
non-Italian students are exposed only to non-Italian peers, rather than to Italian. In particular, the
Exposure Index (EjI/NI) is a measure of the exposure of native students to non-native students in
each school district (i.e. province) j:
1
/
1
j
j
Nij
iji ij ij
jI NI N
iji
NII
NI IE
I
where Iij represents the sum of native students in school i of province j, and similarly NIij
represents the sum of non-native students in school i of province j; Nj is the total number of junior
high school in province j. This measure is a refinement of the simple non-native school share and is
generally interpreted as the racial composition (percentage of non-native students) enrolled with the
average native student (Clotfelter, 1999). As for D, we also provide E* as weighted mean of E at
regional or geographical macro-area levels, with weights proportional to the total number of
students per province.
Table A5. School segregation measures: Dissimilarity (D, D*) and Exposure (E, E*) Indices.
Area D D* E E*
North West 0.0997 0.1107 0.0980 0.0979
North East 0.0871 0.0844 0.1095 0.1103
Centre 0.0926 0.1018 0.0873 0.0784
South 0.1557 0.1652 0.0186 0.0136
Islands 0.1774 0.1797 0.0148 0.0141
Total: Italy 0.1227 0.1297 0.0645 0.0608
Notes. D* and E* represents, respectively, the Dissimilarity and Exposure Index at the regional level as weighted
average of D and E at province level, weights equal to the total number of students by province.
Results are constant across the three IC waves (see Appendix B for details on the datasets)
and show a clear pattern (Figure A2 and Table A5): Exposure Index is generally inversely related to
the Dissimilarity Index in the Southern regions, while they are almost similar in the North and
Centre, so that in the areas of the country where the school concentration, and, consequently, the
Exposure Index, is low, the Dissimilarity Index is generally high. Thus, in the South non-native
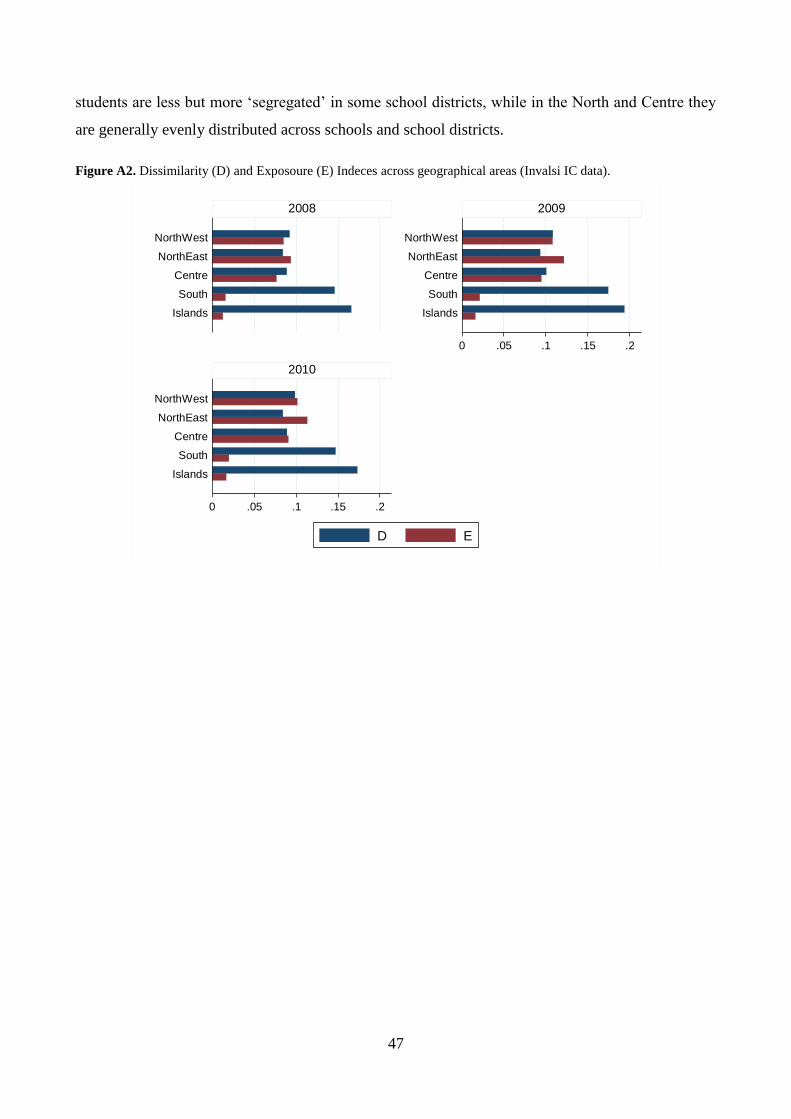
47
students are less but more ‘segregated’ in some school districts, while in the North and Centre they
are generally evenly distributed across schools and school districts.
Figure A2. Dissimilarity (D) and Exposoure (E) Indeces across geographical areas (Invalsi IC data).
0 .05 .1 .15 .2
0 .05 .1 .15 .2
Islands
South
Centre
NorthEast
NorthWest
Islands
South
Centre
NorthEast
NorthWest
Islands
South
Centre
NorthEast
NorthWest
2008 2009
2010
D E
48
Appendix B. Detailed data description, categories definitions and variables used
Detailed data description
We match three datasets containing individual level information on each 8th
grade student
who attended an Italian junior high school and sit the Invalsi First Cycle Final Exam in s.y. 2007-
08, 2008-09 and 2009-10, administrative school records from Ministry of Education Statistical
Office and information of each school ‘catchment-area’ collected from Census 2001 matched so to
re-create the potential intake territory of each school.
Individual level information. INVALSI First Cycle Final Exam Data is a newly available
census survey of Mathematics and Italian Language attainment levels for 8th
grade students (ISCED
2 level) enrolled in all Italian public and private junior high schools. INVALSI (Istituto Nazionale
per la Valutazione del Sistema Educativo di Istruzione e di Formazione) is the independent public
institute established in 2004 to start a rigorous and objective evaluation of the Italian school system
and Italian students’ attainment levels. Starting from school year 2009-10, census survey on
attainment levels and schools quality are conducted in grade 2 and 5 (primary schools), grade 6 and
8 (junior high schools) and grade 10 and 14 (high schools). As stated in the L. No. 176/2007, the
‘First Cycle Final Exam’ corresponds to 8th
graders test and has been conducted since 2007-08
school year. However, only starting from the 2009-10 s.y., test scores contribute for one sixth of the
final junior high school grade, while in previous years the test results did not enter directly in the
final grade. Invalsi IC data are the first experience of standardized test scores census survey taken
on all Italian students.
The dataset contains test scores and individual information on 1,504,286 8th
grade students,
aged between 13 and 14, who took the Invalsi standardized tests at the end of the ‘first cycle’ of
compulsory education in the Italian schools43
(i.e. after five years of primary education and three
years of junior high school). Data contain separate test scores for Maths and Italian Language44
ranging from 0 to 100, as they are expressed as percentage of right answers, and individual
information is provided by the school administrative staff through school administrative records
(thus, not directly asked to students). In addition, because of cheating evidence in preliminary data
analysis (Invalsi 2008a, b, 2009, 2010), for each student we have both the row and cheating-
43
Both Math and Italian Language First Cycle Invalsi Exam Test take place in all junior high schools in June. Each part
usually lasts one hour and between Language and Math test students have a fifteen minutes break. 44
Italian Language exam is divided into three parts: narrative text comprehension, expositive text comprehension and
grammar. The total Italian Language test score is obtained from the sum of the three parts.
49
corrected Maths and Language test score45
. For each student we know: year of birth, gender,
citizenship (Italian, non-Italian), place of birth46
; how long the student is in Italy if born abroad
(from primary school, for 1-3 years, less than 1 year); mother’s and father’s place of birth (Italy,
EU, European but non-EU, other non-European country) 47
, grade retention (if the student is
‘regular’ i.e. if, at the end of 2010, he/she is 14 years old; ‘in advance’ i.e. younger than ‘regular’
students, or ‘held back/retained’ i.e. older than ‘regular’ students), school and class identifier (so,
given a school, we can identify the class attended in that school by each student). Combining this
information and following the categorization implemented in OECD Pisa Program, we are able to
distinguish between Italian and non-Italian, native and non-native, immigrant and non-immigrant
students, and, amongst immigrant students, first and second generation students48
,49
.
School level information. Invalsi and MIUR Statistical Office provided us with additional
school level information. The census Invalsi IC Exam covers 5,699 junior high schools in 2007-08,
5,803 in 2008-09 and 5,733 in 2009-10. For each junior high school we know: ownership (i.e.
public (state) school or private (recognized) institution), administrative organization (i.e. whether it
is an institute having both elementary and junior high schools – that we define as ‘K-8 school’- or
whether it is a simple junior high school, administratively independent from other elementary
schools - that we define a ‘middle school’50
); the province where the school is located; total number
of students enrolled in 6, 7 and 8 grade, and the total number of classes for each grade
51; total
45
Sensitivity analysis confirm that raw and cheated-corrected results coincide once we control for geographical
differences (i.e. we introduce in the model macro-area, regional or province dummies). Therefore, we stick on the raw
test scores results and add geographical controls and a subject and school specific dummy indicating if the school has an
high-cheating evidence based on the cheating coefficients calculated by Invalsi on the basis of a fuzzy-logic correction
procedure explained in detail in Invalsi (2010, Appendix 9). In particular, the ‘high-cheating dummy’ identifies, for
each year and subject, the schools in the lowest decile of the distribution of the subject specific cheating coefficient (i.e.
the schools with the highest evidence of cheating behaviours). Robustness checks replicate the construction of the
‘high-cheating dummy’ with different percentiles (1-5, 1-15, 1-20) without showing differences in the results. 46
For IC 2007-08, and IC 2008-09 the students’ place of birth is indirectly obtained through the survey question “How
long is the student living in Italy?”. If the answer is “Always”, we define that the student’s place of birth is “Italy”,
otherwise the student is considered as “Born abroad”. With respect to previous waves, we only lack the information on
students’ month of birth, omitted because of Privacy Law restrictions. 47
Information concerning parents’ place of birth is not available for the IC 2007-08 wave. 48
‘First-generation immigrants’ refers to those persons who were born abroad and whose parents were also born
abroad, while ‘second-generation immigrants’ refers to persons who were themselves born inside the receiving country
but whose parents were born abroad. Together, the first- and second-generation immigrants constitute the ‘immigrant
students’ group. By contrast, all students born in the receiving country who have at least one parent who was also born
inside the country are referred to as ‘native’ (OECD, 2010). See Appendix B for details. 49
Besides being the most recent survey, Invalsi First Cycle 2009-10 wave has more precise information on relevant
variables (in terms of missing values). Missing values on relevant variables are due either because they might not be
reported by the school administrative staff or because parents decide not to provide it at the time of the student’s
enrolment. Moreover, cheating problems are less relevant with respect to the previous waves (see Invalsi 2010,
Appendix 9). 50
The terms K-8 school and middle school mimic the US traditional distinctions among different types of middle grade
schools configurations. 51
Junior high schools in Italy enroll students from grade 6 to 8. Thus, we have the total number of students enrolled and
the number of classes by each grade in each school.
50
number of teachers hired in the school; total number of support learning teachers for students with
handicaps or language difficulties; number of students with disabilities for each grade; total number
of class making ‘normal’ (i.e. 30-hours) or ‘extended’ (i.e. 40-hours) weekly time schedule52
.
Finally, we have the information of the municipality where a school is located only in the case in
which the school is located in a municipality with at least three junior high schools53
.
Catchment-area information. For each junior high school we define a ‘catchment area’
aimed at identifying the area where the majority of school attendants live54
. Each catchment area is
composed by a number of census divisions linked to each school according to a given algorithm.
The procedure for the association between school and census divisions assigns for each school the
closest divisions (in terms of geographic distance) so that the ‘relevant resident population’ living in
those divisions contains at least k>1 times the number of students enrolled in that particular school
(Barbieri et al., 2010). The ‘relevant population’ is defined according to the 10-14 years resident
population in the census data, while the multiplicative factor k is set equal to ten and it allows the
overlapping of census divisions among different (but geographically not distant) junior high
schools. As a result, the matching procedure links each school j with Nj census divisions
constituting the school ‘catchment area’ and for each school j the socio-economic background
variables are obtained as average of the socio-economic variables of each school catchment area.
Thus, we are able link to each school about two hundreds variables from 2001 Italian Population
Census Survey covering demographic and socio-economic information on resident population
(gender, age, ethnic origins, education, labour force participation, occupation), households
composition and houses characteristics.
Categories definitions
We partition students of Invalsi IC data into two main categories. The first category refers to
the simple student’s citizenship, thus we distinguish between native and non-native students. We
recall that Italian citizenship follows a, so called, ‘ius sanguinis’ rule: a student is native student if
at least one of the parent is an Italian citizen. Data from Italian Ministry of Education generally only
make this type of distinction. This first categorization is obtained thanks to the variable ‘student
citizenship’, which distinguishes between Italian and non-Italian students and it is available for all
the three IC data waves. The second category distinguishes between immigrant vs. non-immigrant
students: according to Pisa-OECD criteria (see, for example, OECD, 2010), individuals whose both
52
In most of the cases it is also possible to recover the information of whether a given class follows a ‘normal’ or
‘extended’ time schedule. 53
Restriction imposed by Italian Privacy Authority. In the end, we have the municipality information for more than
60% of the schools. 54
The matching procedure is used in Barbieri et al. (2010). See for details Barbieri et al. (2010), Appendix A.
51
parents were born abroad are defined to as ‘immigrants’. On the contrary, ‘non-immigrant’ students
have at least one parent born in Italy. This category is obtained through two variables containing the
information on the parents’ place of birth (Italy or abroad), and have a greater percentage of missing
(3.92% of the final student population). Immigrant students are then partitioned according to their
place of birth: ‘first generation immigrants’ are students born abroad, while ‘second generation
immigrants’ are students born the host country (Italy). Immigrant status does not depend on
citizenship criteria, but only on the student’s and parents’ place of birth in order to allow
international comparisons which must exclude citizenship criteria because citizenship is conferred
according to country-specific rules.
Notice that in OECD surveys, the native vs. non-native categorization follows different
criteria with respect to the ones we adopt in our analysis55
. However, the definition we adopt based
on the Italian citizenship is useful to allow comparisons and match data with Italian Ministry of
Education Statistical Office which generally only divide students according to origins following the
citizenship partition, and limit missing data problems. In fact, information concerning parents’ place
of birth and period stayed in Italy if born abroad – which show the highest percentage of missing
data – are not compulsory by law, so that parents can decide not to provide them to the school
administrative staff at the moment of the enrolment. Thus, missing data in individual information
may be due to different reasons: misreporting of school administrative staff, missing information, or
students’ parents refusal to provide information at the time of the enrolment. Exploiting the simple
citizenship criterion limits these problems.
Descriptive OLS regressions
We perform descriptive pooled OLS regressions on the students population in order to
provide a description of the individual determinants of the IC Invalsi test scores results. Table B.1
contains the complete list of the control variables used including a short description. We control for
regional differences in the test scores (dummies for 20 Italian regions) and high cheating schools
(dummy for cheating coefficient in the 9th decile of the cheating coefficients distribution). Results
are reported in Table B2.
55
Pisa OECD surveys define to as ‘native’ all students born in the receiving country who have at least one parent who
was also born inside the country are referred to as ‘native’. Thus, native vs. non-native categorization exploits both the
information on the student’s and parents’ place of birth

52
Table B1. Control variables description.
Coeteris paribus, non-native students score significantly lower than their native peers and
the gap is more pronounced in language skills (-15.9% in Language and -13.9% in Maths); females
have lower scores in Maths (-1.08%) and higher in Language (+1.01%) with respect to males;
students who enrolled earlier than natural age (i.e. students ‘in advance’) show a positive
differential in test scores results (+6.67% Language, +7.83% Maths). Finally, being ‘retained’
induces a strong and negative effect on test scores. The effects are however different with respect to
the Italian and non-native students: coeteris paribus, Italian students held back show results
Type Name Description Source
Individual (X)
female Fraction of group j females in school s
Invalsi
late Fraction of group j retained students
in school s
father place of birth Fraction of group j students in school
s with father born abroad
mother place of birth Fraction of group j students in school
s with mother born abroad
always_italy Fraction of group j students in school
s in Italy since birth
School level (S)
istituto Dummy equal 1 if “K-8 school” Invalsi
statale Dummy equal 1 if State school
tot_alunni
tot_alunni2
School size, given by the total number
of students in the school and its square
MIUR /
Invalsi
avg_class
avg_class2
Average class size in each school and
its square
handicap_percent Percent of students with disabilities in
the school
pt_ratio Pupil-to-teacher ratio
it_ratio Non-native students-to-support
Teacher ratio
tl_class_iii
Fraction of 40-hours classes in 8th
grade
High_cheating_dummy
(subject specific)
Dummy equal 1 if the school is in the
9th
decile of the school cheating
coefficient distribution
Province by year
Fixed Effects provyearFE_*
Interaction dummies for provinces
(103 dummies) and years (2 dummies)
Catchment Area
(W)
lpop Log of total resident population
Census
2001
illiterate Fraction of illiterate pop.
university_edu Fraction of pop. with university level
education
m_occup_rate Male occupation rate
f_occup_rate Female occupation rate
agri_oc Fraction of workers occupied in
agriculture
self_empl Fraction workers self-employed
commuter Fraction of resident commuting every
day for school or working reasons
avg_family_members Average number of family members
house_poor Fraction of houses without clean water
house_new Fraction of houses built after 1980
avg_rooms Average number of rooms per house
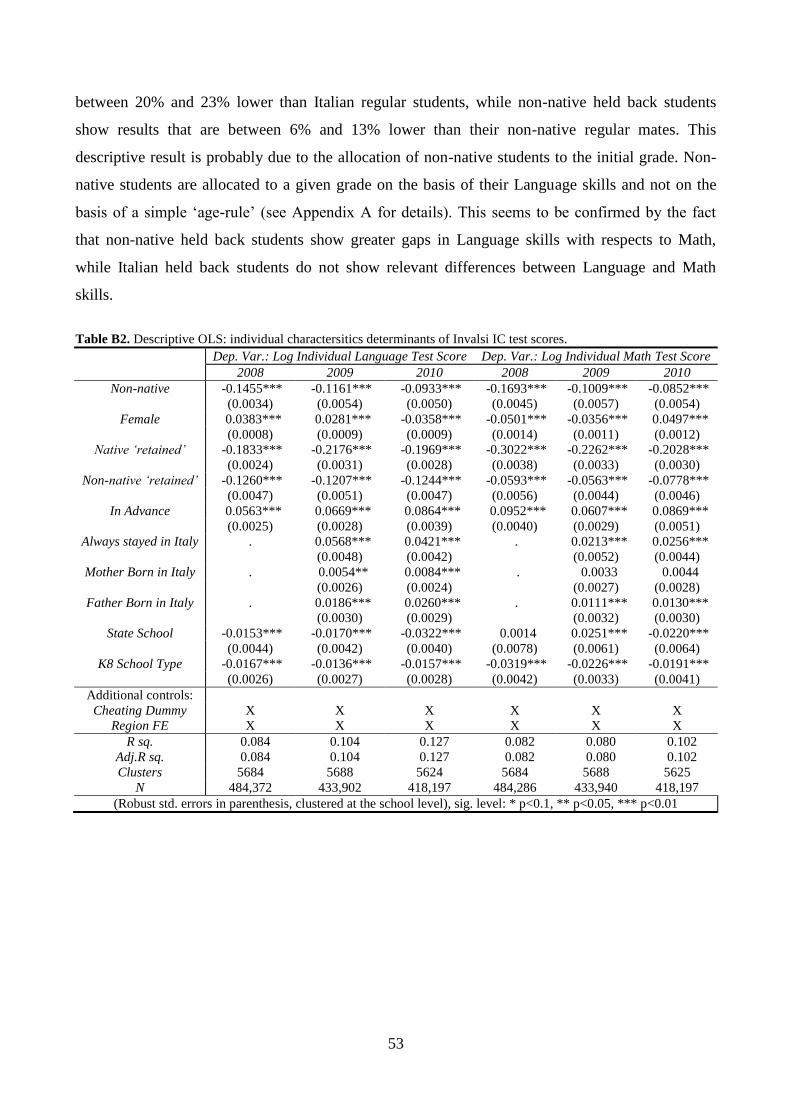
53
between 20% and 23% lower than Italian regular students, while non-native held back students
show results that are between 6% and 13% lower than their non-native regular mates. This
descriptive result is probably due to the allocation of non-native students to the initial grade. Non-
native students are allocated to a given grade on the basis of their Language skills and not on the
basis of a simple ‘age-rule’ (see Appendix A for details). This seems to be confirmed by the fact
that non-native held back students show greater gaps in Language skills with respects to Math,
while Italian held back students do not show relevant differences between Language and Math
skills.
Table B2. Descriptive OLS: individual charactersitics determinants of Invalsi IC test scores.
Dep. Var.: Log Individual Language Test Score Dep. Var.: Log Individual Math Test Score
2008 2009 2010 2008 2009 2010
Non-native -0.1455*** -0.1161*** -0.0933*** -0.1693*** -0.1009*** -0.0852***
(0.0034) (0.0054) (0.0050) (0.0045) (0.0057) (0.0054)
Female 0.0383*** 0.0281*** -0.0358*** -0.0501*** -0.0356*** 0.0497***
(0.0008) (0.0009) (0.0009) (0.0014) (0.0011) (0.0012)
Native ‘retained’ -0.1833*** -0.2176*** -0.1969*** -0.3022*** -0.2262*** -0.2028***
(0.0024) (0.0031) (0.0028) (0.0038) (0.0033) (0.0030)
Non-native ‘retained’ -0.1260*** -0.1207*** -0.1244*** -0.0593*** -0.0563*** -0.0778***
(0.0047) (0.0051) (0.0047) (0.0056) (0.0044) (0.0046)
In Advance 0.0563*** 0.0669*** 0.0864*** 0.0952*** 0.0607*** 0.0869***
(0.0025) (0.0028) (0.0039) (0.0040) (0.0029) (0.0051)
Always stayed in Italy . 0.0568*** 0.0421*** . 0.0213*** 0.0256***
(0.0048) (0.0042) (0.0052) (0.0044)
Mother Born in Italy . 0.0054** 0.0084*** . 0.0033 0.0044
(0.0026) (0.0024) (0.0027) (0.0028)
Father Born in Italy . 0.0186*** 0.0260*** . 0.0111*** 0.0130***
(0.0030) (0.0029) (0.0032) (0.0030)
State School -0.0153*** -0.0170*** -0.0322*** 0.0014 0.0251*** -0.0220***
(0.0044) (0.0042) (0.0040) (0.0078) (0.0061) (0.0064)
K8 School Type -0.0167*** -0.0136*** -0.0157*** -0.0319*** -0.0226*** -0.0191***
(0.0026) (0.0027) (0.0028) (0.0042) (0.0033) (0.0041)
Additional controls:
Cheating Dummy X X X X X X
Region FE X X X X X X
R sq. 0.084 0.104 0.127 0.082 0.080 0.102
Adj.R sq. 0.084 0.104 0.127 0.082 0.080 0.102
Clusters 5684 5688 5624 5684 5688 5625
N 484,372 433,902 418,197 484,286 433,940 418,197
(Robust std. errors in parenthesis, clustered at the school level), sig. level: * p<0.1, ** p<0.05, *** p<0.01
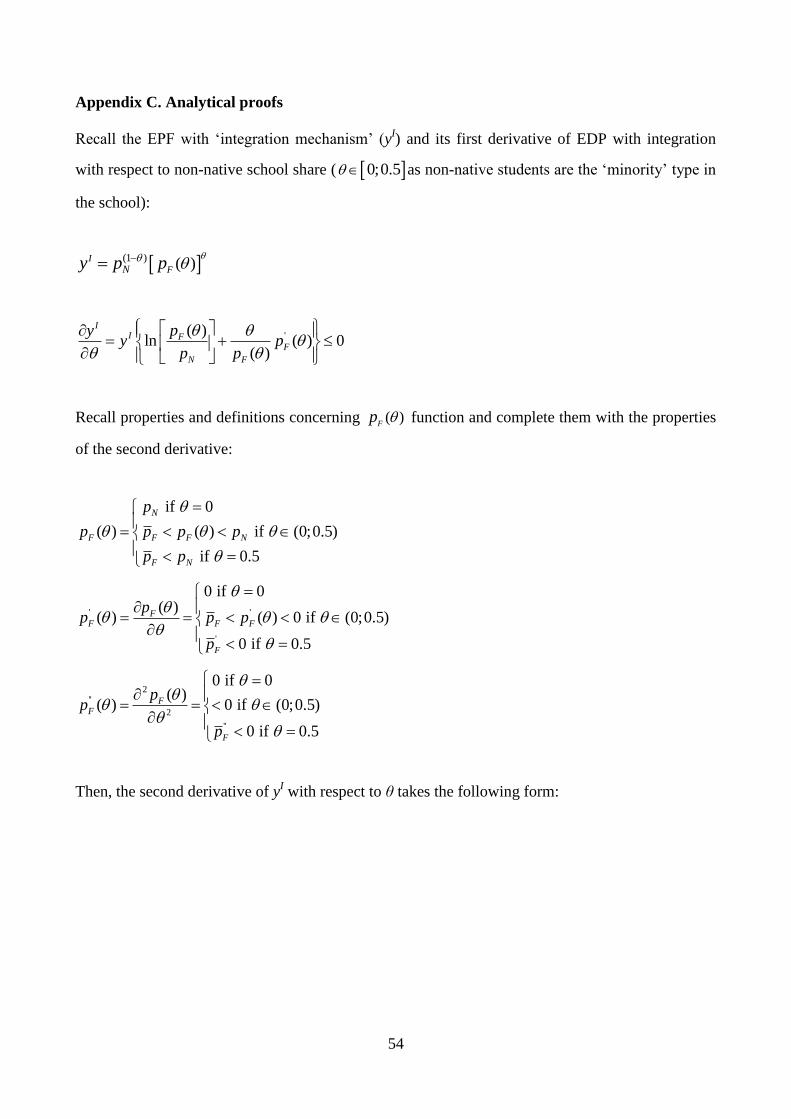
54
Appendix C. Analytical proofs
Recall the EPF with ‘integration mechanism’ (yI) and its first derivative of EDP with integration
with respect to non-native school share ( 0;0.5 as non-native students are the ‘minority’ type in
the school):
(1 ) ( )I
FNy p p
'( )ln ( ) 0
( )
II F
F
N F
pyy p
p p
Recall properties and definitions concerning ( )F
p function and complete them with the properties
of the second derivative:
if 0
( ) ( ) if (0;0.5)
if 0.5
N
F F F N
F N
p
p p p p
p p
' '
'
0 if 0( )
( ) ( ) 0 if (0;0.5)
0 if 0.5
FF F F
F
pp p p
p
2''
2
''
0 if 0( )
( ) 0 if (0;0.5)
0 if 0.5
FF
F
pp
p
Then, the second derivative of yI with respect to θ takes the following form:
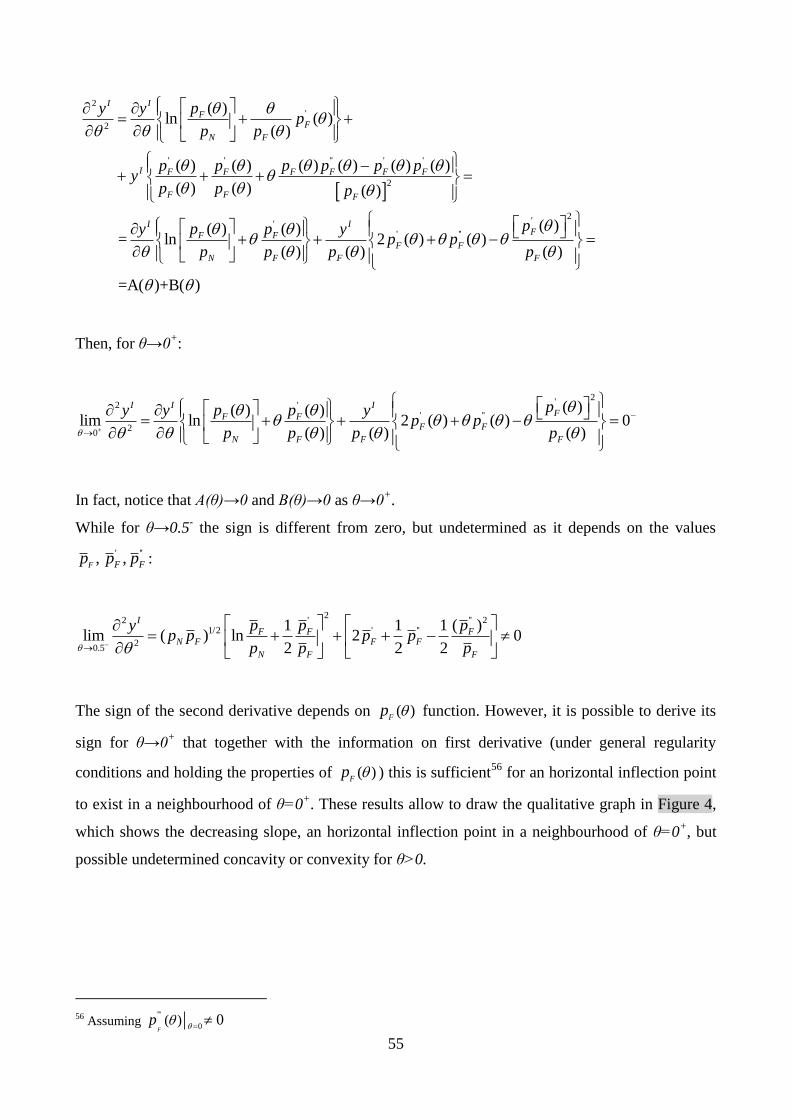
55
2'
2
' ' '' ' '
2
''
( )ln ( )
( )
( ) ( ) ( ) ( ) ( ) ( )
( ) ( ) ( )
( ) ( ) = ln 2 ( )
( ) ( )
I I
FF
N F
I F F F F F F
F F F
I I
F FF
N F F
py yp
p p
p p p p p py
p p p
p py yp
p p p
2'
''( )
( )( )
=A( )+B( )
F
F
F
pp
p
Then, for θ→0+:
2''2
' ''
20
( )( ) ( )lim ln 2 ( ) ( ) 0
( ) ( ) ( )
I I IFF F
F F
N F F F
pp py y yp p
p p p p
In fact, notice that A(θ)→0 and B(θ)→0 as θ→0+.
While for θ→0.5- the sign is different from zero, but undetermined as it depends on the values
' '', ,F F Fp p p :
2' '' 22
1/2 ' ''
20.5
( )1 1 1lim ( ) ln 2 0
2 2 2
I
F F FN F F F
N F F
p p pyp p p p
p p p
The sign of the second derivative depends on ( )F
p function. However, it is possible to derive its
sign for θ→0+ that together with the information on first derivative (under general regularity
conditions and holding the properties of ( )F
p ) this is sufficient56
for an horizontal inflection point
to exist in a neighbourhood of θ=0+. These results allow to draw the qualitative graph in Figure 4,
which shows the decreasing slope, an horizontal inflection point in a neighbourhood of θ=0+, but
possible undetermined concavity or convexity for θ>0.
56
Assuming '''
0( ) 0
F
p