social factors that influence consumers decisions when buying second hand cars … ·...
TRANSCRIPT

SOCIAL FACTORS THAT
INFLUENCE CONSUMERS' DECISIONS WHEN BUYING
SECOND-HAND CARS IN
CHINA
2015BBA04
Thesis for Bachelor's Degree
Business Administration
Xiangyu Wu Yi Zheng

I
Title: Social factors that influence consumers’ decisions when buying second-hand cars in
China—Based on EKB model
Publication year: 2016
Author: Xiangyu Wu, Yi Zheng
Supervisor: Rolf Appelkvist
Abstract
Today more and more people buy second-hand products on internet. As the typical durable
goods, second-hand cars are very popular among consumers. In recent years, the sale of second-
hand cars increases quickly in China. In addition, there is still potential in the second-hand
market. On the other hand, consumers are the subject in the second-hand market. So what
consumers take into consideration is important when buying second-hand cars. We have chosen
some social factors that influence consumers’ decision when they purchase second-hand cars.
Furthermore, we have analyzed the importance of these social factors and the relationship
between factors.
The purpose of this study is to give vehicle dealers a guide how consumers with different
characteristics will pay attention to different factors of the cars but also to guide consumers to
make a rational decision when they buy second-hand cars.
We have chosen the EKB model as our basic theory. A quantitative research approach and cross
sectional research design were used in this study. The link of our questionnaire was published
in Baidu Tieba after being designed by SOJUMP and we collected 151 responses. Then,
respondent demographics, cross tabulations analysis, one-way ANOVA analysis, Cronbach’s
alpha, and sorting analysis were analyzed.
The results show that information about the real condition of the car is the most important factor
influencing customers when purchasing second-hand cars, price is the second most influencing
factor, vehicle model and brand are the third and the fourth respectively, after-sales service
ranks the least as most influencing factor.
Keywords: Second-hand cars, social factors, EKB model, rank

II
Table of contents
1. Introduction ........................................................................................................................ - 1 -
1.1 Background ........................................................................................................................ - 1 - 1.2 Research overview ............................................................................................................. - 2 -
1.2.1 Automobile industry in China ....................................................................................... - 2 - 1.2.2 The trade volume of second-hand cars in China vs in America .................................... - 3 - 1.2.3 Some previous studies about consumers’ consumption behavior of second-hand cars in
China - 4 - 1.3 Problem .............................................................................................................................. - 6 - 1.4 Purpose and question ......................................................................................................... - 6 -
1.4.1 Main purpose of the research ......................................................................................... - 6 - 1.4.2 Research question .......................................................................................................... - 7 -
1.5 Delimitation .............................................................................................................................. - 7 - 2. Theoretical framework ........................................................................................................ - 8 -
2.1 New phenomenon appears in trade of second-hand cars ................................................... - 8 - 2.2 Lemon theory ..................................................................................................................... - 8 - 2.3 EKB model ......................................................................................................................... - 9 -
3. Methodology ..................................................................................................................... - 11 - 3.1 Research design ............................................................................................................... - 11 - 3.2 Samples ............................................................................................................................ - 12 - 3.3 Choices of data collection methods ................................................................................. - 12 - 3.4 Design of questionnaire ................................................................................................... - 13 - 3.5 Analysis techniques ......................................................................................................... - 14 - 3.6 Reliability ......................................................................................................................... - 14 -
4. Result and Analysis .......................................................................................................... - 16 - 4.1 Respondent demographics ............................................................................................... - 16 - 4.2 Cross tabulations analysis ................................................................................................ - 18 - 4.3 One-way ANOVA analysis .............................................................................................. - 19 - 4.4 Cronbach’s Alpha ............................................................................................................ - 21 - 4.5 Sorting Analysis ............................................................................................................... - 22 -
5. Conclusions and discussion .............................................................................................. - 24 - 5.1 Conclusions ...................................................................................................................... - 24 - 5.2 Discussion ........................................................................................................................ - 25 - 5.3 Suggestions for further research ...................................................................................... - 25 -
Reference: .................................................................................................................................. - 27 - Appendix 1
Appendix 2
- 1 -
1. Introduction
1.1 Background
With the improvement of people's living standards, replacing the older generations of products
by new ones has become more and more common. So a lot of used goods become available for
others to purchase. Those that are being purchased by or otherwise transferred to a second or
later end user are called second-hand goods or used goods and the numerous used goods form
a big market, the second-hand market. Flea market, for example, one of typical second-hand
markets, is the proverbial open-air market where people trade a wide range of goods, mostly
used ones such as collectibles and antiques.
In fact, trade of second-hand goods has been done for centuries and there are varieties of second-
hand goods for buying and selling such as clothing, shoes and bedding (Damme & Vermoesen,
2009). Nowadays, more and more people from different countries have joined in the second-
hand consumption. For example, according to Alam (2014), “In 2002, Mintel showed in a
survey that nearly 40% of UK customers were actively involved in the second-hand market and
nearly 28% of UK customers had made a purchase in a charity store”. The increasing forms of
second-hand and used product sales led to expansion in flea markets, second-hand markets and
antique dealers (Guiot & Roux, 2010). The same situation was come to China.
Second-hand markets in China have been growing gradually. According to Shi & Zhang (2006),
until October 2005, there are almost 3000 second-hand markets, more than 8000 second-hand
stores and above 5 million employees in this field. Besides, sales of second-hand goods reached
to 100 billion yuan per year and have increased at an annual rate of over 25%, during 2002 to
2005. Cars, the typical durable goods, their price are relatively high, people would like to take
second-hand cars into consideration when they want to purchase a transportation tool. As the
data show in a survey done by Wu in 2013, 35.6% of interviewees in He Fei city in China would
like to purchase second-hand vehicles, which ranked the first among numerous used goods such
as also second-hand electronic products and clothes.
As a result, among all second-hand markets in China, the development of second-hand car
market is prominent and the trading volume of used cars is increasing rapidly. In terms of the
statistics from Prospective Industry Research Institute, second-hand cars trade volume in 2001
to 2011 increased from 370 thousand units to 4,33 million units, an annual growth rate of more
than 30%.
Reasons why the scale of second-hand car market is expanding constantly are because of the
rapid increase of domestic car ownership and the amount of people who want to change a car.
According to data published by Ministry Of Public Security Bureau Of China, by the end of
June 2015, the volume of car ownership reached 271 million and according to data from China
Automotive Industry Association, the civil car population increased from 18.02 million to 93.5
million, with an average increment per year of 17.4% from 2001 to 2011. Moreover, on average,
60% of Chinese car owners replace their cars every three years – much more frequent than other
national car markets (Yang, et al., 2013). These situations mentioned above provide the room
and foundation for the development of used car market in China.
It also seems that Chinese consumers’ consumption concept of second-hand goods has changed,
which to some extent resulted in the rapid development of second-hand car market and an

- 2 -
increasing number of sale of second-hand cars in China. As professor Zhou from Renmin
University of China stated in Chinese Consumer News 2013, when people’s understanding of
commodities has exceeded satisfying physical needs, turning from survival to life, their
attitudes toward second-hand goods also transferred from disdain and contempt to todays’
approval. Chinese consumers’ consumption idea and consciousness has become more mature.
Cars are now increasingly being purchased for reasons of functionality and transportation,
rather than being viewed as status symbols (Yang, et al. 2013).
No matter of new goods or used goods, their ultimate fate is decided by consumers’
consumption decision. However, so far, the majority of existing writings about second-hand
products and second-hand markets in China researched how to expand the market according to
the current situation or made a comprehensive description of a particular second-hand market,
all in the perspective of manufacturers (Wu, 2013). As a result, it is interesting to make a study
from the perspective of consumers, investigating influential factors of consumers’ decision-
making when they buy a product. Second-hand cars will be chosen as the subject of
investigation because of its popularity and typicality as mentioned above.
1.2 Research overview
1.2.1 Automobile industry in China
The automobile industry in China started from 1953, and has had a rapid development.
According to data showed by China Automotive Industry Association (2012), the total yield of
cars were 5,7 million and the sale of domestic vehicles was 5,8 million in 2005, respectively
increased by 12.55% and 13.54% compared to 2004, shown in Figure 1. With addition of the
sale of around 160,000 imported cars, Chinese automobile market exceeded the one of Japan
with the total size of nearly 5,92 million cars, ranked second in the whole world. And the
production and sales of cars in China was over 18 million in 2010, resulting that China became
the biggest automotive market in the world (Chen, et al., 2012).
Figure 1. Auto trade volume from 2002 to 2011 (Yali Yang et al., 2013)
Note(s): Red section represents passenger car, yellow section represents commercial car, and
blue line represents increment for total car trade volume.
So far, the automobile industry has stepped into a steady stage of development (Zhang, 2006).
The share of Chinese automobile consumption in the global market rose to 8.7% in 2005 from
4.3% in 2001. The increment of Chinese automotive market also accounted for 23.2% in the
global auto market.

- 3 -
Contemporarily, the large market of automobile industry and the rapid growth of auto
ownership have injected new vitality for the second-hand car market (Yang, et al., 2013).
1.2.2 The trade volume of second-hand cars in China vs in America
In Figure 2 shows that second-hand passenger vehicles, as the main second-hand vehicles, were
sold in 3,04 million units in China in 2013, while new cars were sold in about 15 million
vehicles. So the sale of second-hand passenger vehicles is only 1/5 of the new cars sales.
Therefore, in the long run, China's second-hand cars sales in the future still have approximately
a tenfold growth space.
Regarding China's second-hand car prices of 50000 yuan on average, America’s second-hand
car prices of 10000 dollars on average (1 dollar equals 6.53 RMB), so the size of the market in
China is predicted to reach 2 trillion yuan per year (Xie, 2014). Compared with used-car market
in America, we can say that the one of China has a big potential to develop.
Figure 2, Sales of second-hand passenger vehicles from 2005 to 2014 in China (From
China Automobile Dealers Association)
In Figure 3, from Manheim 2013 Used Car Market Report, the largest second-hand car
auctioneer in the U.S., the U.S. auto industry started much earlier. The earliest data of second-
hand cars trade volume that we found is in 1976. The volume reached 25 million units in
second-hand cars sales, almost twofold of new cars sales in the same period. This ratio in 2012
has reached a threefold of the sales volume (Xie, 2014).

- 4 -
Figure 3, Sales of second-hand cars and new cars in America from 1976 to 2012 (From
Manheim 2013 used car market report)
Note(s): The scales of new vehicle sales and used vehicle sales are different.
In terms of the statistics from Prospective Industry Research Institute (2012), second-hand cars
trade volume from 2001 to 2011 increased from 370 thousand units to 4,33 million units in
China, and the average growth rate is more than 30% during this decade. And some other related
statistics showed that in all 6,88 million second-hand cars had been sold during the first 9
months in 2015 in China, 5,68% up over the same period in 2014, stated by China Automobile
Dealers Association (CADA). According to the same source, 6.05 million second-hand cars
were sold in 2014, showing a dramatic increase by 16.33% from 5,20 million units in 2013.
Although there is a little decrease of second-hand cars sales growth rate during the recent 5
years, the increase rate of second-hand cars trade volume is more than twofold the figure for
new cars. CAMM (China Association of Automobile Manufactures) showed that there is a
rough rise of the new cars trade volume in 2014, followed by a rise of 6.9% to 23,49 million
units from a year ago.
1.2.3 Previous studies about consumers’ consumption behavior of second-hand cars in China
Pei et al. (2015) talked about the current situation of purchasing second-hand cars in the 3rd and
4th tier provincial cities in China in their article. The researchers illustrate that the main reasons
why people in the 3rd and 4th tier provincial cities in China choose to buy second-hand cars are
because of used cars’ relatively low price and consumers’ functional requirements. The first
reason is easy to understand. Not only the price of second-hand cars themselves is low due to
depreciation but also consumers need to pay less vehicle purchase tax and transaction tax to
buy a second-hand car compared to a new one. Unlike citizens in big cities like Shanghai, the
consumption concept towards cars of people who live in small cites tend to be more practical.
External factors such as brands and decorations of cars will not be the first on their consideration
list when they purchase a car. To our study, this article has limitation as a reference because it
only focused on specific regions.
In another study on purchase decision-making of consumers for used-cars, Tong (2013) showed
the classification of people who would like to buy a second-hand car.

- 5 -
Young people and people without fixed job. The economic income and savings of this kind
of consumers is not very high, but they are eager to own a car like others do. So they prefer
to purchase a used car, and the price would be around 50,000 yuan. Otherwise, some young
people as new drivers buy a second-hand car only for the reason of low price, decreasing
property loss when cars are damaged and scratched.
Civil servant and self-employed. Their annual income is between 50,000 yuan and 150,000
yuan. Though this kind of consumers can afford new cars, they do not want to suffer losses
as price of new cars drop too fast.
Private business owners and white collars whose annual income reaches to over 150,000
yuan. They treat second-hand cars as a better choice to meet their demands of changing
cars and refitting vehicles.
This classification gives us hints why people with different educational background and income
level have total different reasons to purchase a second-hand car. In other words, people from
different environments may focus on different aspects of second-hand cars when they purchase
one.
Some studies have already figured out factors of second-hand cars themselves that consumers
will pay attention to when they purchase a second-hand car. For example, when Chen & Ma
(2013) made an investigation of affecting factors on acceptance-attitude toward used car
consumption in premium segment, they came up with 7 factors which related to second-hand
cars business. Those 7 factors include the condition of second-hand cars, reality of information
about second-hand cars, price of second-hand cars, after-sales service of second-hand cars and
so forth.
1.2.4 Previous studies about EKB model
In this study, we plan to make the research based on EKB model which is a holistic consumer
choice model, with a full description of the decision making problem, reflecting consumer
behavior process while choosing product or service. EKB model can also be called Engel model.
It was developed in 1968 by Engel, Kollat and Blackwell. The name comes from the first letter
of the name of its creators.
Cassill & Drake made an investigation of the relationship between lifestyle and evaluative
criteria for apparel in 1987, choosing EKB model as the conceptual model and focused on the
consumer decision making process of the individual. ‘This system model was selected because
consumer behavior is viewed as a process rather than a discrete act and is as concerned with
how the decision is reached as it is with the decision itself’. According to EKB model, both
evaluative criteria and lifestyle belong to decisional variables, and cultural norm and values are
one of external influences, which have impact on customers’ decision process. Cassill &
Drake’s research confirmed Engel and Blackwell’s (1982) theory that evaluative criteria reflect
a person’s lifestyle which impacts consumers’ apparel selection.
Liang & Lai (2001) also ‘adopted the EKB model as a base to derive user requirements for e-
stores’. Their purpose is to examine the effect of store design quality on consumer purchases.
In the study, EKB model was deeply analyzed from its five stages separately, which are problem
recognition, search information, evaluation of alternatives, choice, and outcome evaluation.
Liang & Lai explained relationships and sequence among these stages as well. For example,
‘when a problem is recognized, demand for products that eliminate the problem the problem
occurs’. After analyzing EKB model which is a representative consumer behavior model, these

- 6 -
two researchers were able to better understand what aspects or functions of online stores are
important to consumers and why certain ones are more crucial than others.
There are countless researchers using EKB model as their main tool. Some of them only focused
on specific part of EKB model, like Cassill & Drake (1987), and some of them went through
EKB model thoroughly, like Liang & Lai (2001), all depending on the purpose of their
researches.
1.3 Problem
According to Solomon et al. (2013), traditionally, consumers calmly and carefully gather as
much information as possible about the product, make comparisons among each alternative and
then arrive at a satisfactory decision. However, consumers will also be irrational sometimes.
For instance, Chinese consumers may choose to purchase something expensive and luxuries in
order to keep face or win respect, regardless of the practicability and requirement of products
and their economic status (Yu, 2013).
While in second-hand car industry, according to Gai & Shen (2009), consumers take some
specific factors into consideration that will influence the consumers’ consumption behavior
when they purchase a second-hand car. Data collected in their research showed that the most
important factor to consumers is the real condition of second-hand cars, and then comes price,
comprehensiveness of information and brand. However, according to Chen & Ma (2012), there
are 5 factors that consumers pay attention to most when they purchase a second-hand car.
Besides the factors that have been mentioned above, the style of used vehicles and after-sales
service are important. We chose five of these factors for our research. They are price,
information about the real condition of the car, vehicle model, after-sales service and brand.
However, so far, we haven’t found any researchers who made investigation on factors that will
influence consumers’ decision-making process when purchase second-hand cars. According to
the EKB model, during the procedure of decision making, consumers will be influenced by
social factors such as income, social class, family and education. That is to say, consumers with
different social backgrounds may make different decisions during consumption.
So, as we have already known the factors of second-hand cars for their own sake that will
influence consumers’ decision-making, we want to investigate relationships between them and
social factors. Or in other words, how will social factors influence consumers’ decision-making
when they purchase second-hand cars. For example, maybe consumers with high education
level will pay more attention to after-sales services of second-hand cars and high income earners
are not willing to buy second-hand cars.
1.4 Purpose and question
1.4.1 Main purpose of the research
Our main purpose is to find out how social factors will affect consumers’ decision-makings in
second-hand car industry. This research may provide more help to vehicle dealers than
consumers. We hope to give vehicle dealers a guide how consumers with different
characteristics could pay attention to which factors of the cars. Then more consumers would be
attracted and vehicle dealer also can save human costs and time. In addition, in the aspect of
- 7 -
consumers, we can guide consumers to use other consumers’ perspectives for reference and
make a rational decision when they buy second-hand cars.
1.4.2 Research question
According to the EKB model, social factors will influence consumers’ decision-making during
consumption. As the trade volume of second-hand cars in China is large now and Chinese
second-hand car market also has huge space to develop, it can be implied that lots of consumers
have already bought second-hand cars or been interested in purchasing ones. In consequence,
it is interesting to take second-hand cars as subjects, finding out the relationship between social
factors and consumers’ decision-making during consumption.
Our question is: how will social factors influence consumers’ decision-making when they
purchase second-hand cars in China?
Two parts of aspects were included in the consumers’ decision-making in this study. One is
consumers’ focus of second-hand cars when they purchase them. As mentioned above, they are
price, information about the real condition of the car, vehicle model, after-sales service and
brand. The other is whether consumers are willing to purchase second-hand cars. We think both
aspects are important because consumers’ focus of second-hand cars was based on former
researches, having theoretical foundation and consumers’ attitudes toward buying second-hand
cars will have direct impact on their decision-making.
1.5 Delimitation
From the beginning of deciding the subject of our thesis to the end of finishing this thesis, it
lasted about 3 month. As a result, we just chose several factors in this research because had
limited time to collect data and responses. There are some other factors can be chosen to
represent external factors based on EKB model.
In addition, consumers’ decision-making in this research focus on whether consumers are
willing to buy second-hand cars and what is the most important aspect of a second-hand car
consumers would consider when they purchase a second-hand car. These two points in decision-
making is not nearly enough. Therefore, this is just a basic simple research for consumers’
decision-making.

- 8 -
2. Theoretical framework
2.1 New phenomenon appears in trade of second-hand cars
With the development of Internet, people have more chances to buy second-hand products. In
China, websites that provide online service of second-hand cars can be roughly classified into
four types:
professional second-hand car websites,
second-hand car channels,
second-hand car substations of synthetic classified information-gathering websites,
brand second-hand car websites (Chen, et al., 2012).
There are some famous websites for trade of used-cars, such as Home For Cars, 58 City. Those
websites usually help people to evaluate used cars and both sell and purchase used cars and
solve frequently asked questions online.
What is more, second-hand cars are becoming viable and desirable options for an increasing
number of Chinese, especially as government policies are now helping car penetration deepen
and spread to the whole country. For instance, the Administrative Measures on Circulation of
Used Cars, released by Commerce Department and Ministry of Public Security in 2005, are the
primary regulation governing the used-car market. It standardizes the trade of used cars and
safeguards the legitimate rights and interests of both sellers and buyers.
Nowadays some internet platform of second hand cars provide C2B (Consumer to Business)
service that is the car owners can sell used cars to used car dealers. But based on Ganji.com
which is a platform for selling and buying all kinds of goods, from used books to second-hand
houses, like Cars (http://www.cars.com ) in the U.S., Blocket (http://www.blocket.se ) in
Sweden, car dealers can make profit from this mode, so C2C (Consumer to Consumer) mode
can be the final second-hand cars trade mode because of reduction of steps and cost. Therefore,
people can sell second-hand cars directly to avoid the mediators.
2.2 Lemon theory
According to the research done by Wang et al. 2015, though second-hand cars have distinct
advantage of price than new cars, consumers still pay more attention to the security of cars.
This means that the actual situation of second-hand car has the biggest impact on consumers’
purchasing behavior of used cars (Gai, et al., 2009). The other important factors that will
influence consumers’ decision making are the price and the comprehensiveness of information
of second-hand cars. In other words, whether dealers can offer complete, reliable and correct
information of second-hand cars is crucial to consumers to have a good knowledge of them.
However, during the procedure of trading used cars, the ‘bad’ cars tend to drive out the good
(in much the same way that bad money drives out the good) (Akerlof, 1970), because of the
asymmetry of information about second-hand cars between sellers and buyers (Gai, et al., 2009),
which is called ‘Lemon theory’ or the ‘Lemon Market’.
The lemon theory was created by the economist George Akerlof which examines how the
quality of goods traded in a market can degrade in the presence of information asymmetry
between buyers and sellers, leaving only "lemons" behind. A lemon is an American slang term
for a car that is found to be defective only after it has been bought.
- 9 -
Suppose buyers can't distinguish between a high-quality car (a "peach") and a "lemon". Then
they are only willing to pay a fixed price for a car that averages the value of a "peach" and
"lemon" together. But sellers know whether they hold a peach or a lemon. Given the fixed price
at which buyers will buy, sellers will sell only when they hold "lemons" and they will leave the
market when they hold "peaches".
2.3 EKB model
For families or individuals, buying a car belongs to a respectively large consumption. Although
second-hand cars markets in European countries have been quite mature, second-hand car
market is still in the exploratory stage in China, which will cause consumers to take a long time
to consider purchasing used cars, and some consumers may even give up buying a second-hand
car at last. Constructing consumers’ decision-making model and testing influential factors can
help second-hand car dealers to understand consumers’ consumption behavior and attract target
groups and help consumers to shorten decision-making time.
We will choose the EKB model which is one of the structure models of consumer behavior as
this study’s basic model. Because according to the research of theories of consumers’ decision-
making model, among numerous models, EKB model seems to be the most mature and
complete one (Tong, 2013).
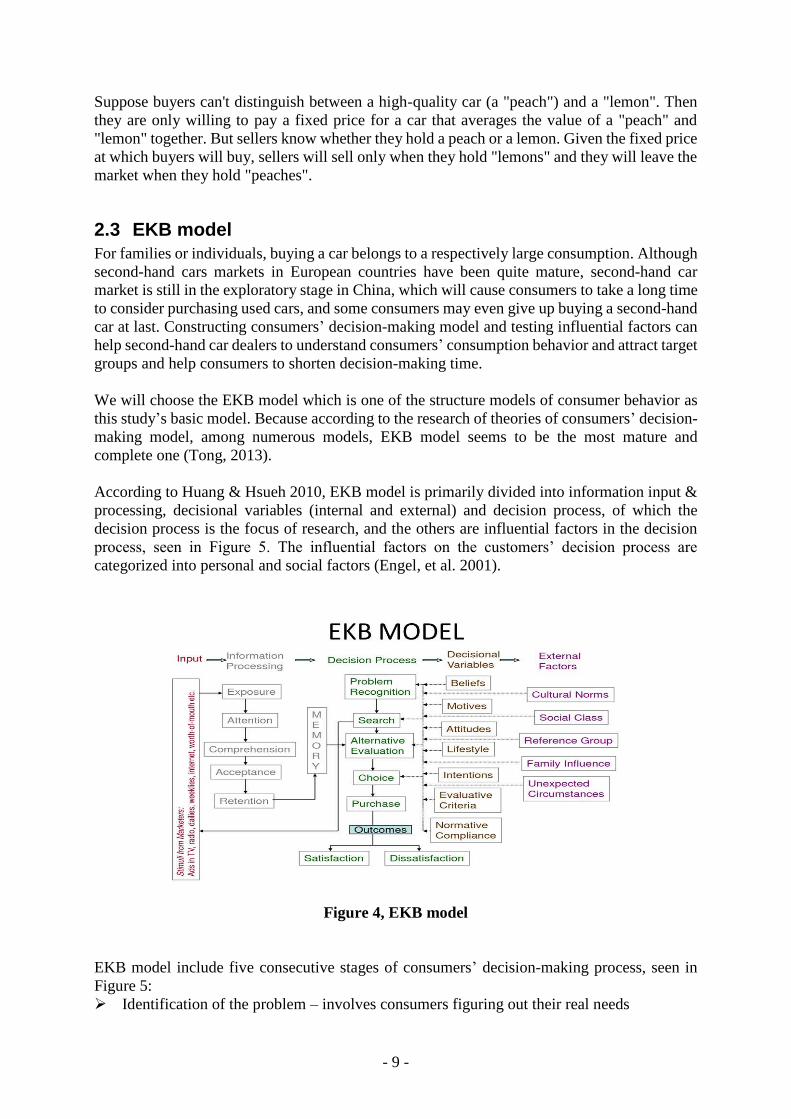
According to Huang & Hsueh 2010, EKB model is primarily divided into information input &
processing, decisional variables (internal and external) and decision process, of which the
decision process is the focus of research, and the others are influential factors in the decision
process, seen in Figure 5. The influential factors on the customers’ decision process are
categorized into personal and social factors (Engel, et al. 2001).
Figure 4, EKB model
EKB model include five consecutive stages of consumers’ decision-making process, seen in
Figure 5:
Identification of the problem – involves consumers figuring out their real needs
- 10 -
Search for problem – consumers searching for information about available alternatives
Assessment of options – consumers examined and evaluate possible choices in order to
make the best decisions
Choice (purchase decision) – consumers make final purchase decision according to the
assessment of goods in the last step
Effects of choice (decision) – including satisfaction and dissonance
As we mentioned above, researchers like Gai & Shen (2009) have already done the survey about
what factors of second-hand cars themselves will consumers pay attention to when they
purchase used cars. In other words, from other researchers’ study, we have already known that
customers will mainly concern about price, brand, real condition, after-sale service and model
of a second-hand car, when they picking one. And such behavior belongs to the ‘choice
(purchase decision)’ stage of consumers’ decision-making process.
According to EKB model, external factors, or social factors, with roots in people’s lives, will
affect consumers’ consumption decisions. We would like to check whether it is true and find
out how it works through our investigation. Among various social factors, such as people’s
income level, family and nationality, we will choose gender, annual family income, educational
level, age and whether own a car as social factors in this study, which are the most common
and can reflect car buyers’ characteristics better.

- 11 -
3. Methodology
3.1 Research design
According to Bryman & Bell (2011, pp.26), many authors argue to distinguish between
quantitative and qualitative research when they focus on methodological issues. By contrast,
some writers hold an opinion that the difference between quantitative and qualitative research
is not useful and others regard it as ‘false’ (Layder, 1993 cited in Bryman & Bell, 2011, p.26).
However, “the quantitative/qualitative distinction represents a useful means of classifying
different methods of business research and it is useful to consider a range of issues concerning
the practice of the business research” (Bryman &Bell, 2011, pp.26).
Our research needs to collect perspectives from many consumers to make a conclusion. So a
quantitative research was chosen for this study. So the first reason for choosing a quantitative
research strategy for this study is that it emphasizes quantification in the collection and analysis
of data. Considering our study, which needs a large number of data from second-hand users and
other people to be analyzed, the construction of quantitative research strategy meets our demand
(Bryman & Bell, 2011).
The second reason is that the principal orientation of the role of theory in relation to a
quantitative research strategy is deductive and testing of theory which means quantitative
research strategy entails a deductive approach to the relationship between theory and research
in which the latter is conducted with reference to hypotheses and ideas inferred from the former.
In contrast, qualitative research holds the inductive logic, especially the generation of theory.
Compared with deductive, inductive is an approach to the relationship between theory and
research in which theory is generated out of research (Bryman & Bell, 2011, pp.27). Therefore,
the quantitative research is suitable for our study, because our aim is to test theory.
The third one is that the epistemological orientation (“a theory of knowledge’’ or “acceptable
knowledge’’ (Bryman & Bell, 2011)) and ontological orientation, “theory of the nature of social
entities” (ibid.), for quantitative are positivism and objectivism. That means quantitative
research strategy has combined the practices and norms of the natural scientific model and
embodies a view of external, objective reality. “Positivism advocates the application of the
methods of the natural sciences to the study of social reality and beyond” (ibid.). According to
positivism theory, any social problem can be studied in the same way as natural science.
“Objectivism states that social phenomena and their meanings have an existence that is
independent of social actors” (ibid.). The alternative research method, qualitative research,
tends to interpretivism that means finding the subjective meaning of social response by social
scientists, and constructionism, which states social phenomena and their meanings by social
actors’ continuous achievement. Our data come from common people and reflect their views of
the factors which can influence the decision making for pursuing second-hand cars, so our study
is based on positivism and objectivism, because their choices are compared to external social
factors, regardless at their views.
In conclusion, quantitative research strategy is better for our study compared with qualitative
research strategy, and reality can be reflected sufficiently by a large number of data.

- 12 -
3.2 Samples
Sampling the population is one of the most important parts of the research process. According
to Bryman and Bell (2011, pp.175), “in social survey research, sampling constitutes a key step
in the research process”. So the target population need to be chosen before researching or do
our study in practice. Furthermore, the samples are focused on Chinese. So, the questionnaire
was written in Chinese, but it is translated to English to let people who read this report
understand it easily.
The next step we considered is sample size. According to Bryman and Bell (2011), “increasing
the size of a sample increases the precision of a sample”. Our sample size was defined as 1000
individuals in China originally, compared with the saying “a national probability sample of
1000 individuals in the UK has much validity as a national probability sample of 1000
individuals in the USA, even though the latter has a much larger population” (Bryman & Bell,
2011).
However, considered time and cost, there was almost just half of a month to collect the data,
which means the time to study was limited. So our sample size was defined as 400 individuals
in China finally, though the amount of sampling error in our study then would be larger.
Compared with a non-probability sample, “a sample that has not been selected using a random
sampling method, which means some units in the population are more likely to be selected than
others” (Bryman & Bell, 2011, pp.716). “Each unit in probability sample has a known
probability of being selected” (Bryman & Bell, 2011, pp.179.). Non-probability sample, like
convenience sampling, snowball sample and quota sample, may reflect similar or the same
views in most of the questions, because there are some relationships among the respondents in
non-probability sample. But the objects of our study are people in China, which are dispersive
in China, a whole country, therefor equal probability is important in our study and probability
sampling was chosen. However, we have the problem that we cannot control if the same
respondent answer our questionnaire more than once, because it is an online survey.
“The simple random sample is the most basic form of probability. With random sampling, each
unit of the population has an equal probability of inclusion in the sample”, written by Bryman
and Bell (2011, pp.179.). According to the data we prefer to collect, random samples were used
in our research. In this research, we focus initially on Chinese people in general. The feedback
from random people can make our conclusion more precise.
Furthermore, according to Zhao (2004), most netizens in China are teenagers who are under 25
years old and people from 26 years old to 30 years old are also the main population of internet-
users. As a result, respondents of our research may mostly tend to be young people, which lead
to the unbalanced distribution of age.
3.3 Choices of data collection methods
According to Bryman and Bell (2011, pp.53), the cross-sectional design is usually selected by
researchers with a quantitative research. “A cross-sectional design entails the collection of data
on more than one case and at a single point in time in order to collect a body of quantitative or
quantifiable data in connection with two or more variables, which are then examined to detect
patterns of association”, which provides a contribution to our aim.
Because we are studying in Sweden, it is impossible for us to make some interviews in China.
One the other hand, respondents and researchers can save time by using questionnaire.
- 13 -
Respondents can answer questionnaire online whenever they are free. For researchers, they just
need to label the order of questions, and then analyze data specifically. Moreover we can collect
data faster than interviews due to the fact that it is more convenient for respondents. “And self-
completion questionnaire is a questionnaire that the respondent answers without the aid of an
interview” (Bryman & Bell, 2011, pp.231). Respondents are more willing to join in our study
by self-completion questionnaires. Hence, a cross-sectional survey with self-completion
questionnaires was designed for getting all the information necessary for answering the research
questions.
The most feasible and efficient method for collecting data (the formal response received from
the respondents) is to use an electronic survey by publishing questionnaires on a questionnaire
platform. There is one for instance in Europe, “surveymonkey”, a very popular online survey
software. Respondents answer questions by completing a questionnaire themselves online. In
China, “sojump” has the same function as “surveymonkey”, and it has a large number of users.
So it is a very useful platform for a survey like ours. Then the link of our questionnaire was
posted on several relevant platforms like Baidu Tieba for second-hand cars (It is an online
community bound tightly with internet search services. The slogan of Baidu Tieba is "Born for
your interest"), where people discuss something about second-hand cars.
We chose closed questions, also named closed-ended questions, which limit respondents with
a list of answer choices from which they must choose to answer the questions (Dillman D., et
al., 2009). Therefore, respondents can complete more quickly and early (better response rate
and less missing data), it is easy for us to process data and compare answers as well (Bryman
& Bell, 2011).
However, on the other hand, because of the low response rate of online surveys (Evans &
Mathur, 2005), there will also be a possibility that respondents are not enough for us to make a
representative and deep analysis.
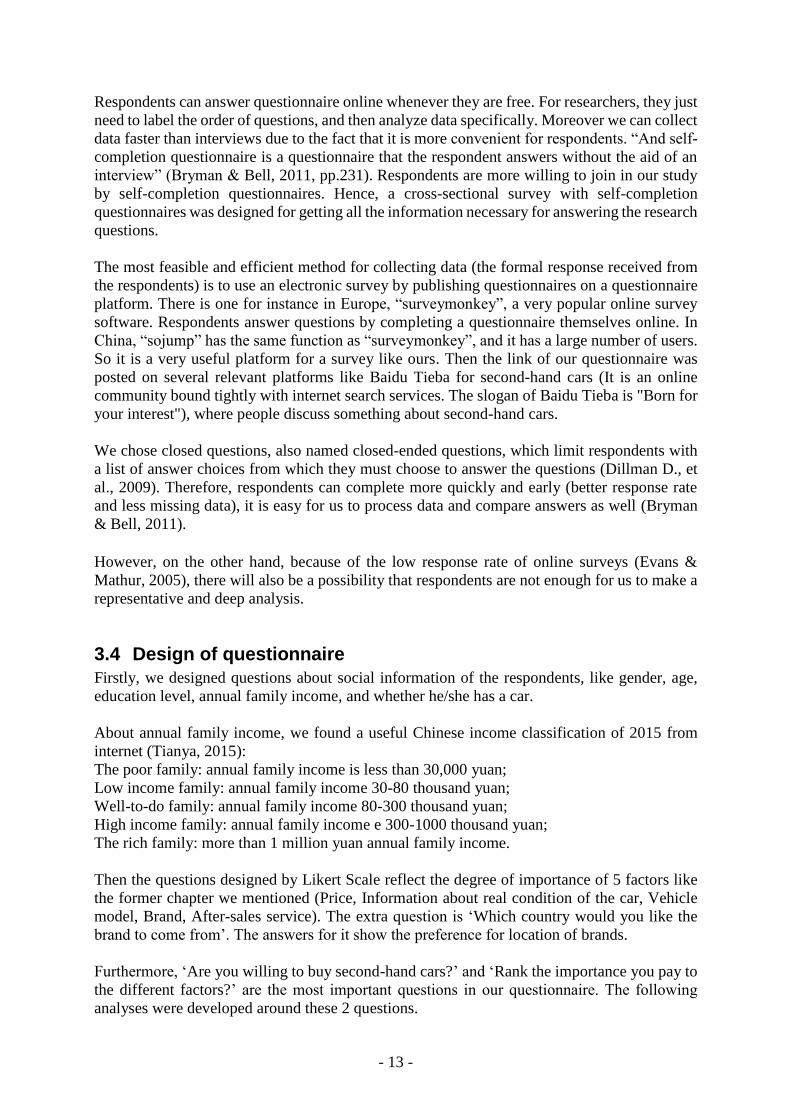
3.4 Design of questionnaire
Firstly, we designed questions about social information of the respondents, like gender, age,
education level, annual family income, and whether he/she has a car.
About annual family income, we found a useful Chinese income classification of 2015 from
internet (Tianya, 2015):
The poor family: annual family income is less than 30,000 yuan;
Low income family: annual family income 30-80 thousand yuan;
Well-to-do family: annual family income 80-300 thousand yuan;
High income family: annual family income e 300-1000 thousand yuan;
The rich family: more than 1 million yuan annual family income.
Then the questions designed by Likert Scale reflect the degree of importance of 5 factors like
the former chapter we mentioned (Price, Information about real condition of the car, Vehicle
model, Brand, After-sales service). The extra question is ‘Which country would you like the
brand to come from’. The answers for it show the preference for location of brands.
Furthermore, ‘Are you willing to buy second-hand cars?’ and ‘Rank the importance you pay to
the different factors?’ are the most important questions in our questionnaire. The following
analyses were developed around these 2 questions.
- 14 -
3.5 Analysis techniques
In order to convert and analyze the selected data, we plan to use SPSS to code. SPSS is a widely
used program for statistical analysis in social science. It is also used by market researchers,
health researchers, survey companies, government, education researchers, marketing
organizations, data miners, and others. “The formulate that underpin the techniques to be
discussed will not be presented, since the necessary calculation can easily be carried out by
using SPSS” (Bryman & Bell, 2011)
Respondent demographics were shown by bar charts and pie charts. Including gender, age,
education level, annual family income, whether he/she has a car and which country would
he/she like the brand to come from. So respondents were classified into different groups
according to these factors, like lowly educated people, highly educated people, the poor, and
the rich and so on.
Cross tabulations are a quantitative research method appropriate for analyzing the relationship
between two variables. Cross tabulations provide a way of analyzing and comparing the results
for one or more variables with the results of another.
Cross tabulations analysis were used to find out relationship between social factors for people
and five aspects of second-hand cars. According to this analysis, we knew the different ideas
for ‘which factor in second-hand cars is important’ among different groups of people.
In statistics, One-way ANOVA analysis is a technique used to compare means of three or more
samples (using the F distribution). This technique can be used only for numerical data. The one-
way analysis of variance (ANOVA) is used to determine whether there are any significant
differences between the means of three or more independent (unrelated) groups. In results of
One-way ANOVA analysis, “Sig.” means significance coefficient. So if “Sig.” < 0.05, there is
no significant relationship between items. In contrast, if “Sig.” > 0.05, there is a significant
relationship between items.
3.6 Reliability
Bryman & Bell (2011, pp. 158) state that ‘‘reliability refers to the consistency of a measure of
a concept’’. And “internal reliability is the degree to which the indicators that make up a scale
are consistent” (Bryman & Bell, 2011, pp.715). “Most researchers use a test of internal
reliability known as Cronbach’s alpha (its use has grown as a result of its incorporation into
computer software for quantitative data analysis)” (Bryman & Bell, 2011, pp.159). So
Cronbach’s alpha is our method to judge the reliability of our questionnaire.
Cronbach's alpha is the most common measure of internal consistency ("reliability"), that is,
how closely related a set of items are as a group. It is most commonly used when you have
multiple Likert questions in a survey/questionnaire that form a scale and you wish to determine
if the scale is reliable. It is considered to be a measure of scale reliability. A commonly accepted
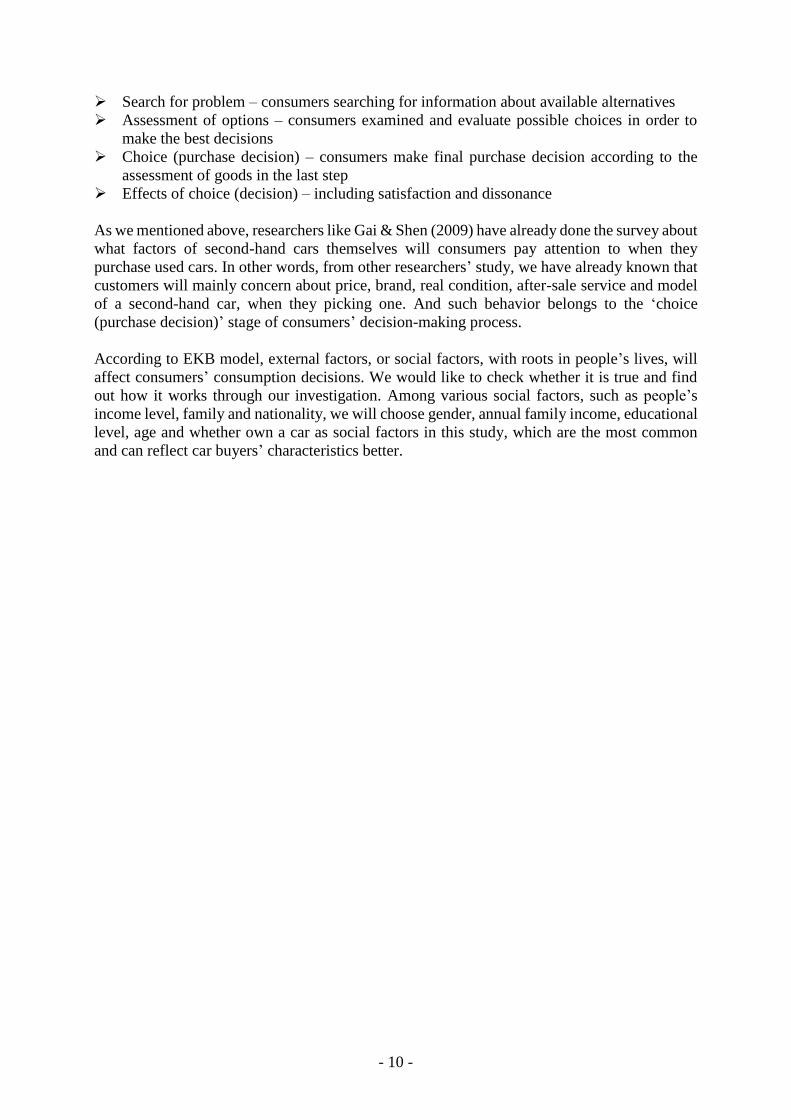
rule of thumb for describing internal consistency was shown in Figure 6.

- 15 -
Figure 5. A commonly accepted rule of thumb for describing internal consistency
(George & Mallery, 2003).
There is a standard of the Cronbach’s alpha coefficient. If the Cronbach’s alpha coefficient is
higher than 0.9, it implies reliability is excellent, higher than 0.8 is good, higher than 0.7 is
acceptable, higher than 0 .6 is questionable, higher than 0 .5 is poor, and lower than 0.5 is
unacceptable.
In addition, an item-total correlation provides to help evaluate the performance of questions.
Values for an item-total correlation between 0 and 0.19 may indicate that the question is not
discriminating well, values between 0.2 and 0.39 indicate good discrimination, and values 0.4
and above indicate very good discrimination.
- 16 -
4. Result and Analysis
4.1 Respondent demographics
The questionnaire has been produced on Sojump, an electronic questionnaire platform, as we
mentioned in the former chapter. Until the 3rd of January in 2016, the data from 151
respondents have been collected. Though the work of data collection keeps going, the present
study contains 151 respondents. As this study is based on the EKB model, focusing on finding
out the relationship between social factors and consumers’ focus of attention when they
purchase a second-hand car, we would like to give a general picture of the social factors
among gender, age, education level, annual family income and whether owning a car at first,
which will have impact on consumers’ decision-making when they buy products as mentioned
above.
Among all 151 respondents, most of them are male, accounting for 72.2%, and only 27.8% of
respondents are female (Table 1). So, there is possibility that gender bias may occur in this
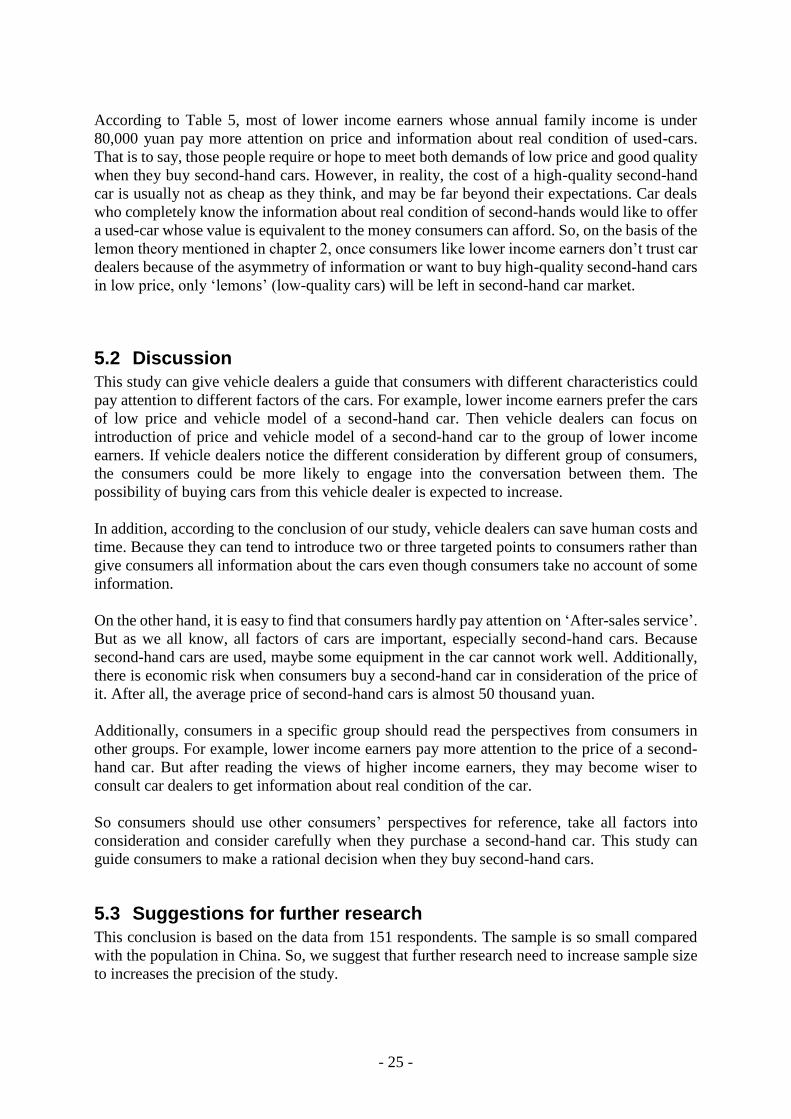
study. People from 18 to 25 years old account for the largest proportion in respondents, at
68.21%. The second is the group of 26-35 year-old people, at 17.22%. Additionally, there are
16 respondents aged over 35 (Figure 7). So, it is obvious that majority of respondents are
rather young people, which do cause the unbalanced distribution of age as mentioned in
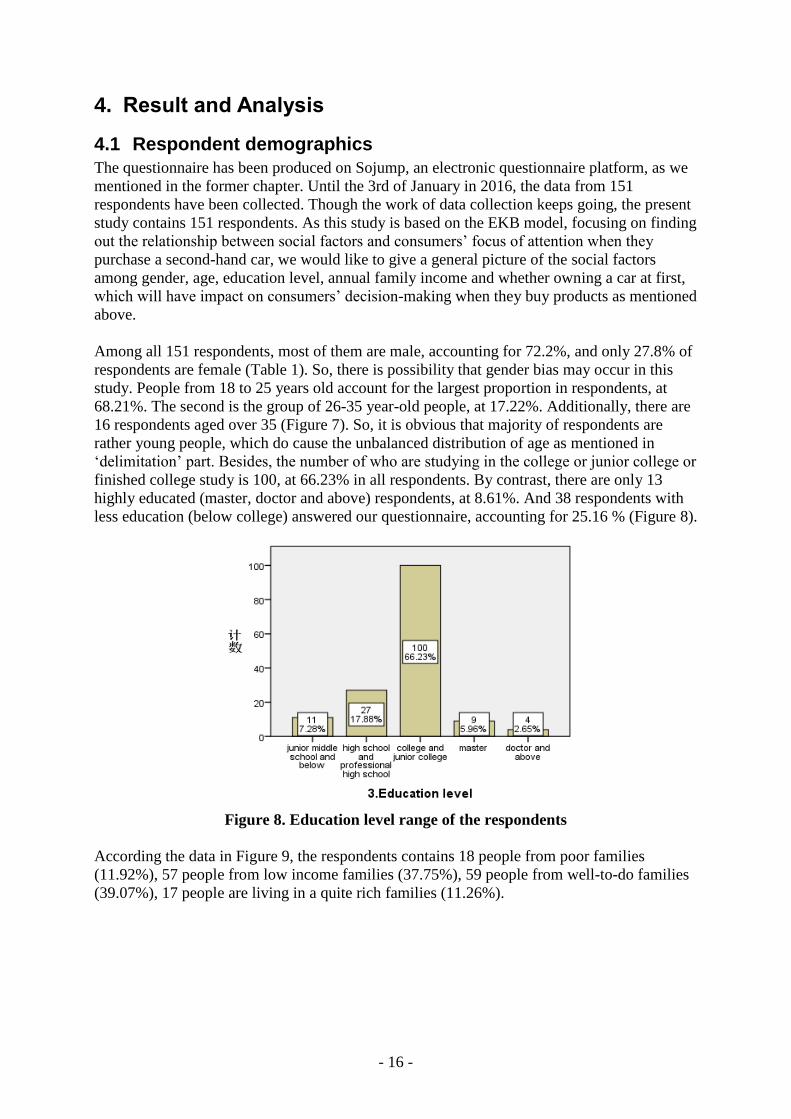
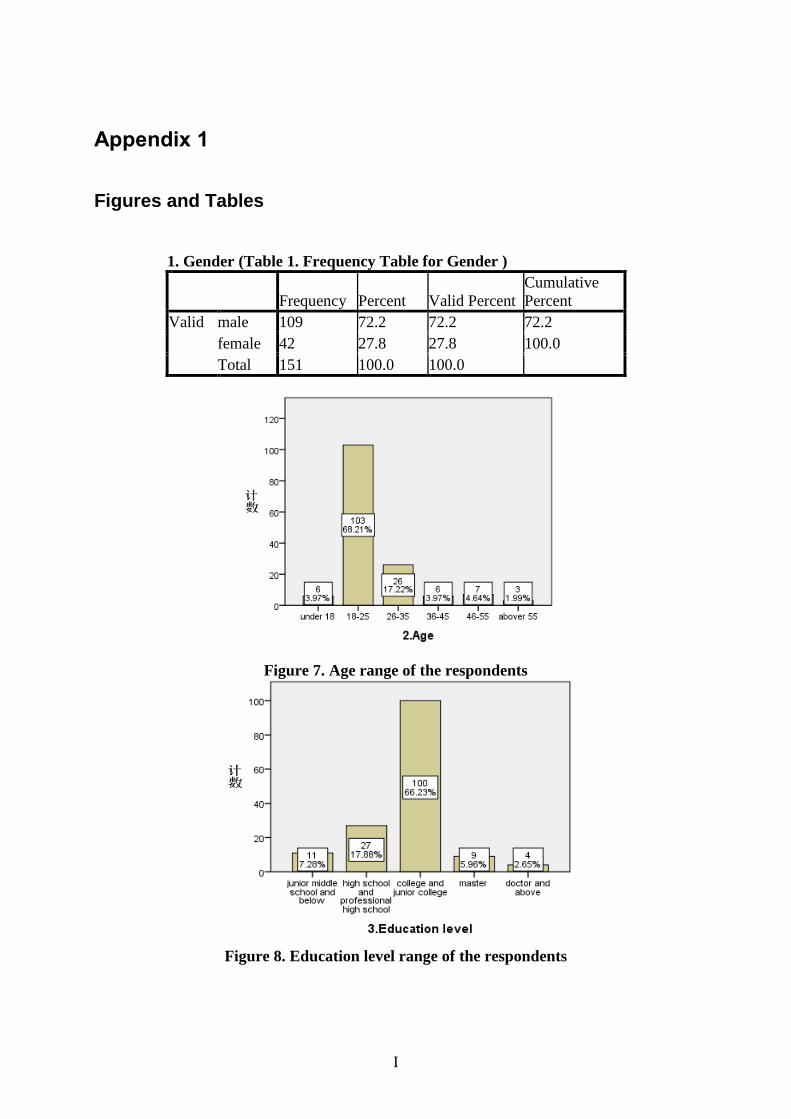
‘delimitation’ part. Besides, the number of who are studying in the college or junior college or
finished college study is 100, at 66.23% in all respondents. By contrast, there are only 13
highly educated (master, doctor and above) respondents, at 8.61%. And 38 respondents with
less education (below college) answered our questionnaire, accounting for 25.16 % (Figure 8).
Figure 8. Education level range of the respondents
According the data in Figure 9, the respondents contains 18 people from poor families
(11.92%), 57 people from low income families (37.75%), 59 people from well-to-do families
(39.07%), 17 people are living in a quite rich families (11.26%).
- 17 -
Figure 9. Annual family income range of the respondents
Table 2 shows the number of respondents who haven’t got a car is almost twice as many as
those who have a car, 100 and 51 respectively. Combined with data of ‘age’, the reason why
the majority of respondents haven’t owned a car may be because that people aged from 18 to
25 cannot afford a car as they have not or just started to make money. As mentioned in
chapter 1.2.3, according to Tong (2013), these people are great potential consumers who
would like to purchase a second-hand car, so it’s interesting and valuable for us to know what
the preference of this group of people is when they buy or consider buying a used car.
In addition, the most respondents (41.06%) are willing to buy a second-hand car, while those
who chose ‘uncertain’ and ‘no’ are nearly equal, 30.46% and 28.48% respectively (Figure
10).
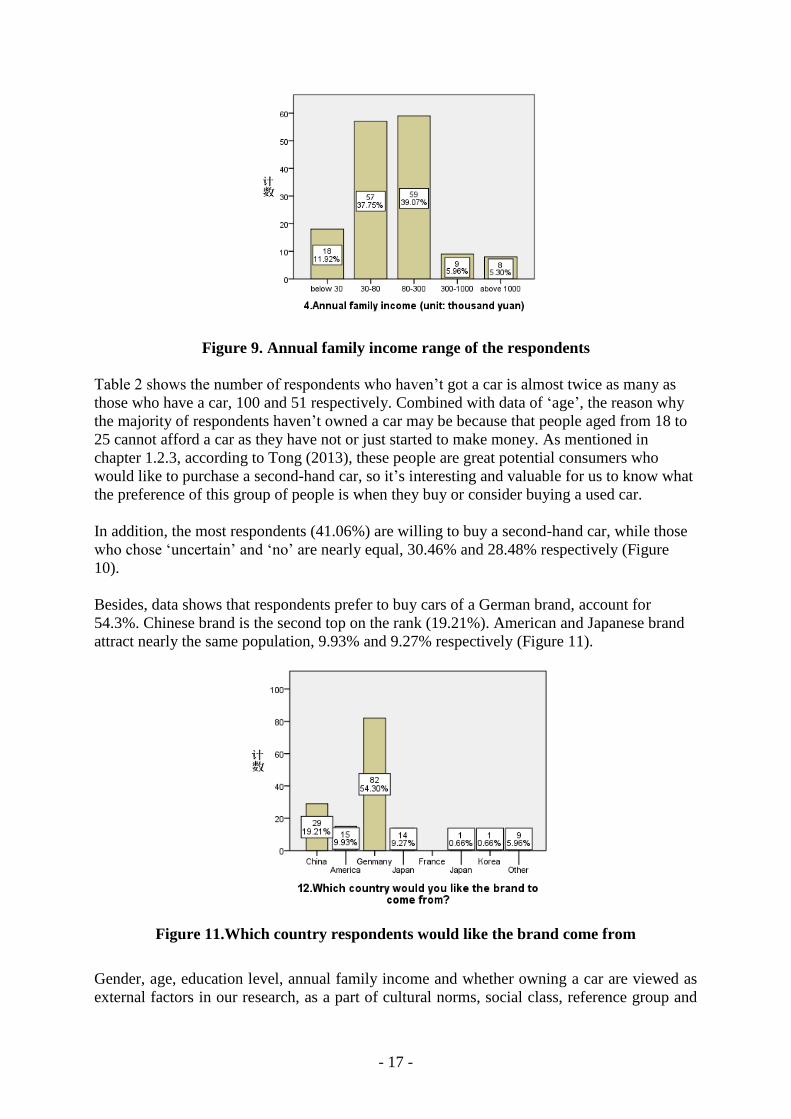
Besides, data shows that respondents prefer to buy cars of a German brand, account for
54.3%. Chinese brand is the second top on the rank (19.21%). American and Japanese brand
attract nearly the same population, 9.93% and 9.27% respectively (Figure 11).
Figure 11.Which country respondents would like the brand come from
Gender, age, education level, annual family income and whether owning a car are viewed as
external factors in our research, as a part of cultural norms, social class, reference group and
- 18 -
family influence. According to EKB model, consumers put these external factors into decisional
variables to help themselves in decision process when they purchase second-hand cars.
Therefore, we analyzed the data of respondent demographics in order to make the following
analysis more easily.
4.2 Cross tabulations analysis
On the basis of EKB model, as we want to find the relationship between social factors and
consumers’ decision-making when they purchase second-hand cars, after analyzing social
factors separately, such as age and education level, we started to combine both aspects to check
out whether consumers with different social backgrounds hold different attitudes and insights
toward purchasing second-hand cars.
According to former researches mentioned above, consumers pay most attention to information
about real condition of used-car and then price (Chen & Ma, 2012). Here comes the same result
in our study. Variable Q2 ‘what is your age and variable’ and Q14 ‘what is the most important
factor’ were put together to make analysis. Table 3 shows that the most respondents pay more
attention on information about real condition of the car, no matter how old they are. And the
next factor they are concerned about is price. Among all 129 respondents aged from 18-35 who
account for 85% of respondents, none of them think after-sales service is the most important
factor and the voting for information about real condition of the car and price is close, 55 versus
44.
However, the situation came to a little different when making cross tabulation analysis of
variable Q3 ‘what is your education level’ and Q14 ‘what is the most important factor’. Not all
of respondents consider the information about real condition of second-hand cars as the most
important factor when they buy used-cars. By contrast, those who are at a relatively lower
education level pay more attention to price and brand, though as the education level rising,
people tend to concern about information about real condition of the car.
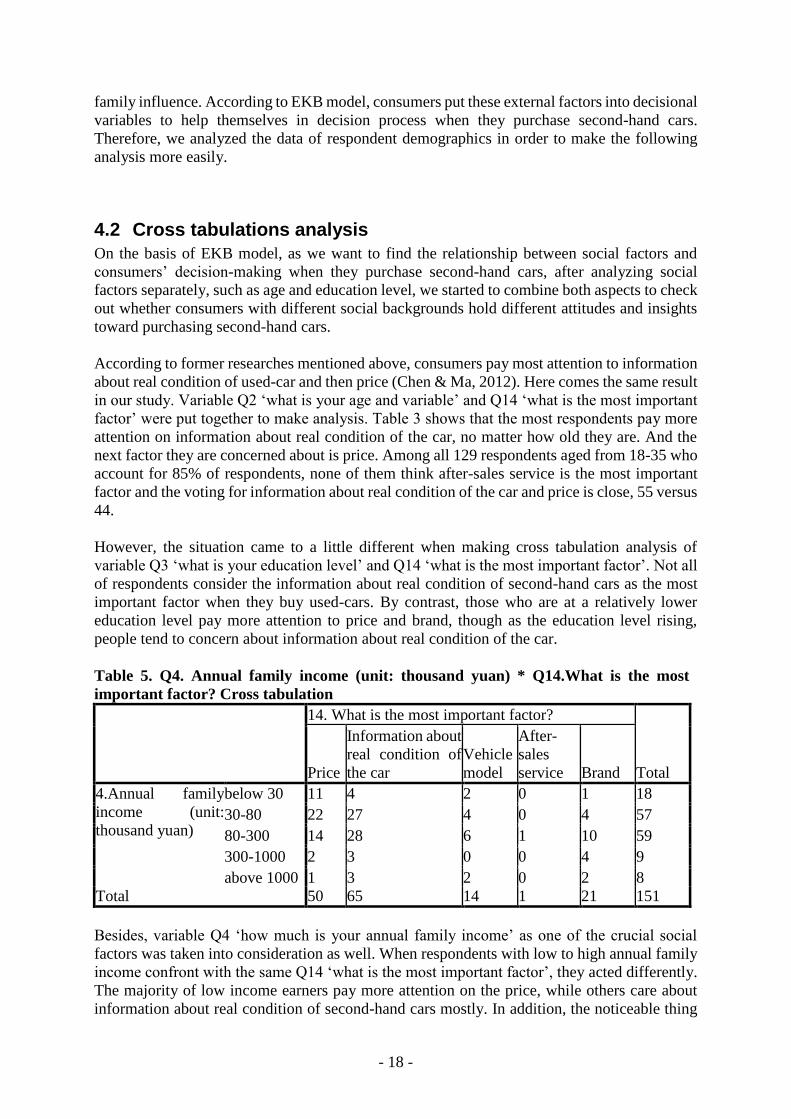
Table 5. Q4. Annual family income (unit: thousand yuan) * Q14.What is the most
important factor? Cross tabulation
14. What is the most important factor?
Total Price
Information about
real condition of
the car
Vehicle
model
After-
sales
service Brand
4.Annual family
income (unit:
thousand yuan)
below 30 11 4 2 0 1 18
30-80 22 27 4 0 4 57
80-300 14 28 6 1 10 59
300-1000 2 3 0 0 4 9
above 1000 1 3 2 0 2 8
Total 50 65 14 1 21 151
Besides, variable Q4 ‘how much is your annual family income’ as one of the crucial social
factors was taken into consideration as well. When respondents with low to high annual family
income confront with the same Q14 ‘what is the most important factor’, they acted differently.
The majority of low income earners pay more attention on the price, while others care about
information about real condition of second-hand cars mostly. In addition, the noticeable thing
- 19 -
is that except for information about real condition of used-cars, those high income earners with
above 300,000 yuan annual family income lay more emphasis on brand, instead of price. (Table
5)
The content showed above is the cross tabulations analysis between social factors and
consumers’ focus of attention when they buy second-hand cars, and the followings are analysis
of social factors and the other part of consumers’ decision-making, whether they are willing to
purchase second-hand cars.
Almost all of the youngest and the oldest people hold negative attitudes about purchasing a
second-hand car. Over 80% of those people whose age are under 18 years old and above 46
years old answered ‘no’ or ‘uncertain’ with Q6 ‘are you willing to buy second-hand cars’.
Among other respondents, people from 36 years old to 45 years old are the most willing to buy
second-hand cars, followed by 26-35-year-old group of people.
Calculated by ratio, people with high school and professional high school educational level
preferred to buy second-hand cars most among all respondents, reached to 55%, and the group
of respondents with master and above educational level had the least population that answered
‘yes’ with Q6 ‘are you willing to buy second-hand cars’. As mentioned in chapter 4.1, education
level of the majority of respondents is college and junior college, 39% of whose choices were
‘yes’, 30% were ‘no’ and 31% were ‘uncertain’ with Q6. (Table 7)
Last but not the least, data collected in Table 8 showed that the more annual family income
respondents own, the less desires they have to purchase second-hand cars. About half of
respondents with less than 80,000 yuan annual family income are willing to buy second-hand
cars without uncertainty.
Therefore, the results of cross tabulations analysis indicate the external factors which we chose
in this research do affect the choice in decision process of EKB model. In other words, our
analysis prove EKB model is correct.
4.3 One-way ANOVA analysis
In statistics, One-way ANOVA analysis is a technique used to compare means of three or more
samples (using the F distribution). This technique can be used only for numerical data. The one-
way analysis of variance (ANOVA) is used to determine whether there are any significant
differences between the means of three or more independent (unrelated) groups. In results of
One-way ANOVA analysis, “Sig.” means significance coefficient. So if “Sig.” < 0.05, there is
no significant relationship between items. In contrast, if “Sig.” > 0.05, there is a significant
relationship between items.
In the following 4 tables, from Table 10 to Table 13, it is easy to find that almost all Sig. are
above 0.05, except for the Sig. between ‘annual family income’ and ‘What is the most important
factor’. In conclusion, gender, education level and condition of owing a car have significant
effect on ‘What is the most important factor’. Additionally, ‘Are you willing to buy second-
hand cars’ is affected significantly by four social factors.

- 20 -
Table 10, ANOVA, effect by gender
Sum of Squares df Mean Square F Sig.
14. What is the most important factor? 10.299 5 2.060 1.239 .294
241.131 145 1.663
251.430 150
6. Are you willing to buy second-hand cars? 1.843 5 .369 .512 .767
104.462 145 .720
106.305 150
Table 10 shows gender which is one of social factors we choose has significant effect on ‘What
is the most important factor’, because the Sig. between them is 0.294 which is above 0.05.
Additionally, the Sig. between gender and ‘Are you willing to buy second-hand cars’ is 0.767,
which is above 0.05. So the relationship between them is significant. In a word, gender is an
important social factor to affect consumers’ decisions.
Table 11, ANOVA, effect by education level
Sum of Squares df Mean Square F Sig.
14. What is the most important factor?
14.983 4 3.746 2.313 .060
236.447 146 1.620
251.430 150
6. Are you willing to buy second-hand cars?
.639 4 .160 .221 .927
105.666 146 .724
106.305 150
Table 11 shows education level which is one of social factors we choose has significant effect
on ‘What is the most important factor’, because the Sig. between them is 0.06 > 0.05. In addition,
the Sig. between education level and ‘Are you willing to buy second-hand cars’ is 0.927, which
is greater than 0.05 as well. Therefore the relationship between them is significant. In
conclusion, education level is an important social factor to influence consumers’ decisions.
Table 12, ANOVA, effect by annual family income
Sum of Squares df Mean Square F Sig.
14. What is the most important factor?
24.061 4 6.015 3.863 .005
227.370 146 1.557
251.430 150
6. Are you willing to buy second-hand cars?
5.167 4 1.292 1.865 .120
101.138 146 .693
106.305 150
Table 12 shows annual family income which is one of social factors we choose has no
significant effect on ‘What is the most important factor’, because the Sig. between them is 0.005
< 0.05. But on the other hand, the Sig. between annual family income and ‘Are you willing to
buy second-hand cars’ is 0.12, which is above 0.05. So the relationship between them is
significant. In short, annual family income can only influence ‘What is the most important
factor’ when consumers buy second-hand cars.

- 21 -
Table 13, ANOVA, effect by condition of owing a car
Sum of Squares df Mean Square F Sig.
14. What is the most important factor?
1.993 1 1.993 1.191 .277
249.437 149 1.674
251.430 150
6. Are you willing to buy second-hand cars?
.005 1 .005 .007 .935
106.300 149 .713
106.305 150
Table 13 shows whether own a car has significant effect on ‘What is the most important factor’,
because the Sig. between them is 0.277 which is greater than 0.05. In addition, the Sig. between
whether own a car and ‘Are you willing to buy second-hand cars’ is 0.935, which is above 0.05.
So the relationship between them is significant. In conclusion, whether own a car is an important
social factor to influence consumers’ decisions.
4.4 Cronbach’s Alpha
Cronbach's alpha is the most common measure of internal consistency ("reliability"), that is,
how closely related a set of items are as a group. It is most commonly used when you have
multiple Likert questions in a survey/questionnaire that form a scale and you wish to determine
if the scale is reliable. It is considered to be a measure of scale reliability.
There is a standard of the Cronbach’s alpha coefficient. If the Cronbach’s alpha coefficient is
higher than 0.9, it implies reliability is excellent, higher than 0.8 is good, higher than 0.7 is
acceptable, higher than 0 .6 is questionable, higher than 0 .5 is poor, and lower than 0.5 is
unacceptable.
According to Bryman & Bell (2011, p. 158) ‘‘reliability refers to the consistency of a measure
of a concept’’. In order to get an idea of the strength of the internal reliability of the
measurements of 5 factors in the questionnaires.
The following Table 14 presents the Cronbach’s Alpha value for 5 factors in this study ('price’,
‘information about real condition of the car’, 'vehicle model', 'after-sales service' and 'brand').
In Table 14, Cronbach’s Alpha shows 5 factors are in-between 0.600 and 0.700. This indicates
a weak level of internal consistency between the items.
Cronbach's Alpha
Cronbach's Alpha Based on
Standardized Items N of Items
.618 .621 5
Table 14. Reliability Statistics
Additionally, an item-total correlation provides to help evaluate the performance of questions.
Values for an item-total correlation between 0 and 0.19 may indicate that the question is not
discriminating well, values between 0.2 and 0.39 indicate good discrimination, and values 0.4
and above indicate very good discrimination.
- 22 -
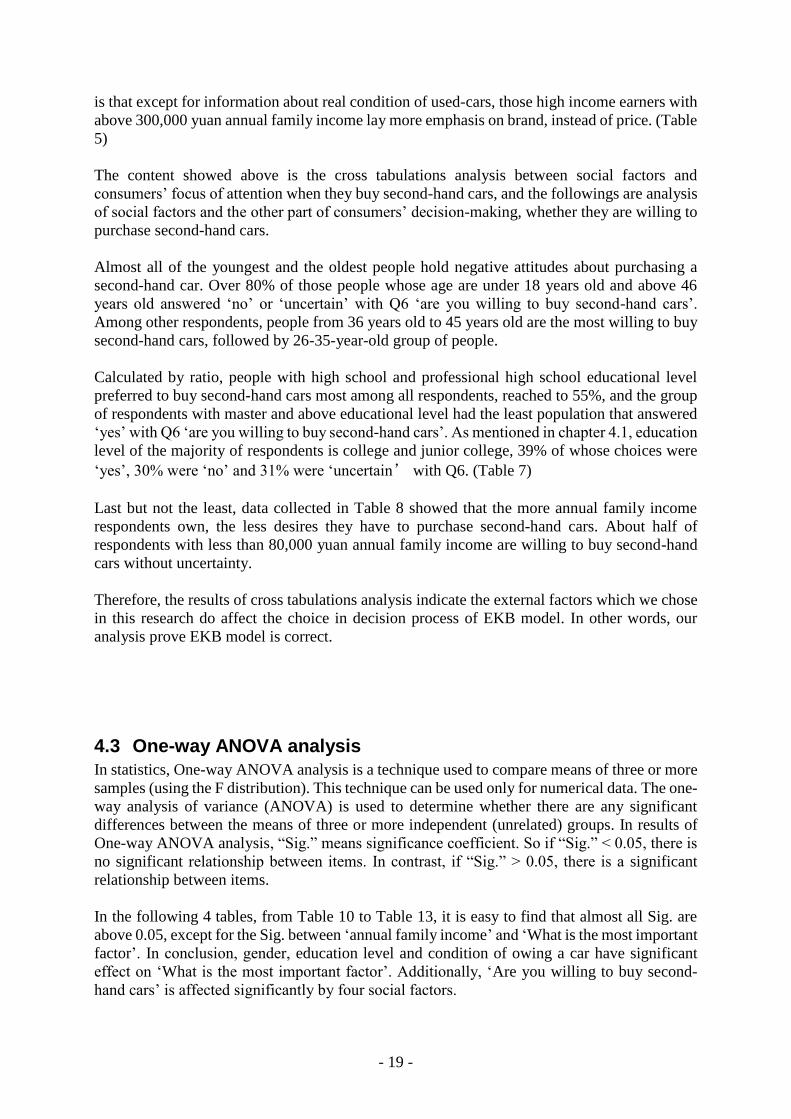
Scale Mean if
Item Deleted
Scale Variance
if Item Deleted
Corrected Item-
Total
Correlation
Squared
Multiple
Correlation
Cronbach's
Alpha if Item
Deleted
7. 'price' 7.79 8.368 .291 .112 .604
8. ‘information about real
condition of the car’ 8.61 8.986 .333 .192 .586
9. 'vehicle model'
7.72 7.045 .473 .233 .507
10. 'after-sales service'
8.14 7.574 .446 .267 .526
11. 'brand' 7.43 7.593 .338 .163 .586
Table 15. Item-Total Statistics
In Table 15, the Item-Total Statistics table presents the "Cronbach's Alpha if Item Deleted" in
the final column, as shown below. This column presents the value that Cronbach's alpha would
be if that particular item was deleted from the scale. We can see that removal of any question
would result in a lower Cronbach's alpha. Therefore, we would not want to remove these
questions.
Then we can see that the "Corrected Item-Total Correlation" values are high. 'Vehicle model'
and 'after-sales service' are greater than 0.4, which means this two questions have very good
discrimination in the questionnaire. Additionally, the values of ‘price’, ‘information about real
condition of the car’ and 'brand' are around 0.3, which indicates that the questions are
discriminating well.
In conclusion, these five factors we chose have strong relativity and internal reliability.
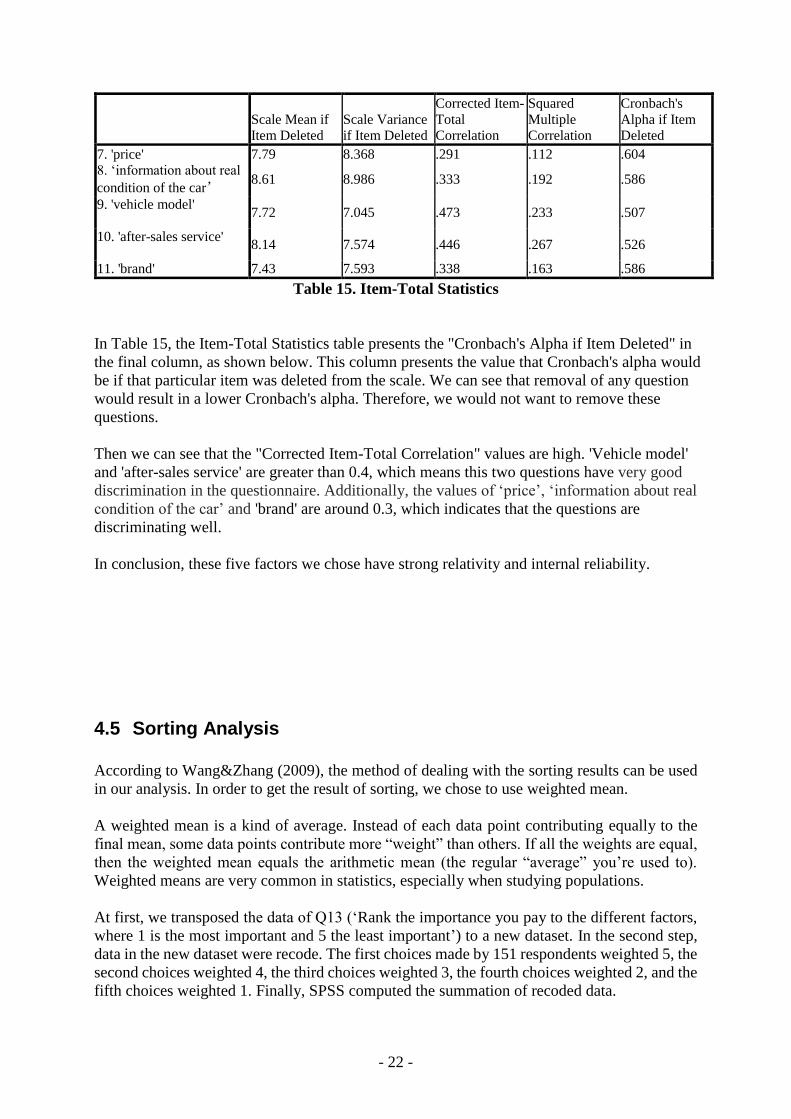
4.5 Sorting Analysis
According to Wang&Zhang (2009), the method of dealing with the sorting results can be used
in our analysis. In order to get the result of sorting, we chose to use weighted mean.
A weighted mean is a kind of average. Instead of each data point contributing equally to the
final mean, some data points contribute more “weight” than others. If all the weights are equal,
then the weighted mean equals the arithmetic mean (the regular “average” you’re used to).
Weighted means are very common in statistics, especially when studying populations.
At first, we transposed the data of Q13 (‘Rank the importance you pay to the different factors,
where 1 is the most important and 5 the least important’) to a new dataset. In the second step,
data in the new dataset were recode. The first choices made by 151 respondents weighted 5, the
second choices weighted 4, the third choices weighted 3, the fourth choices weighted 2, and the
fifth choices weighted 1. Finally, SPSS computed the summation of recoded data.
- 23 -
Table 16 shows the result of summation. And the following rank is shown more directly:
The first is Information about real condition of the car;
The second is Price;
The third is Vehicle model;
The fourth is Brand;
The fifth is After-sales service.
Table 16. The result of sorting

- 24 -
5. Conclusions and discussion
5.1 Conclusions
In former studies as we mentioned in chapter 1.2.3, researchers made investigations about what
aspects will consumers concern about when they purchasing second-hand cars and made a
classification and analysis about potential second-hand car buyers. In our research, we further
ranked those aspects of second-hand cars, finding out which one is most important to consumers.
Also, based on EKB model, characteristics about potential second-hand car buyers and aspects
of second-hand cars were putting together to analyze, as our main purpose is to figure out what
aspects of second-hand cars will consumers with specific different characteristics pay attention
to.
From the rank we have analyzed, information about real condition of the car is the most
important factors people will consider when they buy cars, and the second is price. The most
low income earners pay more attention on the price. As the income is increasing, information
about real condition of the car, brand and vehicle model is becoming important to respondents.
People who are at a lower educational level pay more attention on price and brand. But as the
education level rising, people lead to concern about information about real condition of the car.
Moreover, the rank isn’t affected by age.
In consequence, the conclusions can be shown clearly in an order like this:
NO.1 Information about real condition of the car (higher income earners, people who at higher
education level)
NO.2 Price (lower income earners, people who at lower education level)
NO.3 Vehicle model (higher income earners)
NO.4 Brand (higher income earners, people who at lower education level)
NO.5 After-sales service
Additionally, unlike the classification of people who would like to buy a second-hand car,
which was introduced in chapter 1.2.3, in this study, we find those who are more willing to buy
second-hand cars have 3 characteristics:
1. People whose annual family income is below 80,000 yuan
2. People from 26 to 45 years old
3. People who are at lower education level
For car dealers, these three groups of people can be seen as target groups when making or
conducting market strategies. As emphasized above, according to the EKB model, social factors
will influence consumers’ decision-making. So it is meaningful for us to find out what aspects
of second-hand cars do consumers from target groups concern about, whose social backgrounds
are quite different.
Although both groups of people whose annual family income is below 80,000 yuan and people
who are at lower education level take price as the most important factor and information about
real condition of the car as the second when purchasing second-hand cars, the former group
think vehicle model of a second-hand car is more significant than its brand while the latter
group think in the totally opposite way. By contrast, factor ‘information about real condition of
the car’ is on the top of list when people from 26 to 45 years old consider buying second-hand
cars, followed by price, brand, vehicle model and after-sales service. As a result, it turns out to
be true that social factors will to some extent influence consumers’ decision-making when they
purchase second-hand cars in China.
- 25 -
According to Table 5, most of lower income earners whose annual family income is under
80,000 yuan pay more attention on price and information about real condition of used-cars.
That is to say, those people require or hope to meet both demands of low price and good quality
when they buy second-hand cars. However, in reality, the cost of a high-quality second-hand
car is usually not as cheap as they think, and may be far beyond their expectations. Car deals
who completely know the information about real condition of second-hands would like to offer
a used-car whose value is equivalent to the money consumers can afford. So, on the basis of the
lemon theory mentioned in chapter 2, once consumers like lower income earners don’t trust car
dealers because of the asymmetry of information or want to buy high-quality second-hand cars
in low price, only ‘lemons’ (low-quality cars) will be left in second-hand car market.
5.2 Discussion
This study can give vehicle dealers a guide that consumers with different characteristics could
pay attention to different factors of the cars. For example, lower income earners prefer the cars
of low price and vehicle model of a second-hand car. Then vehicle dealers can focus on
introduction of price and vehicle model of a second-hand car to the group of lower income
earners. If vehicle dealers notice the different consideration by different group of consumers,
the consumers could be more likely to engage into the conversation between them. The
possibility of buying cars from this vehicle dealer is expected to increase.
In addition, according to the conclusion of our study, vehicle dealers can save human costs and
time. Because they can tend to introduce two or three targeted points to consumers rather than
give consumers all information about the cars even though consumers take no account of some
information.
On the other hand, it is easy to find that consumers hardly pay attention on ‘After-sales service’.
But as we all know, all factors of cars are important, especially second-hand cars. Because
second-hand cars are used, maybe some equipment in the car cannot work well. Additionally,
there is economic risk when consumers buy a second-hand car in consideration of the price of
it. After all, the average price of second-hand cars is almost 50 thousand yuan.
Additionally, consumers in a specific group should read the perspectives from consumers in
other groups. For example, lower income earners pay more attention to the price of a second-
hand car. But after reading the views of higher income earners, they may become wiser to
consult car dealers to get information about real condition of the car.
So consumers should use other consumers’ perspectives for reference, take all factors into
consideration and consider carefully when they purchase a second-hand car. This study can
guide consumers to make a rational decision when they buy second-hand cars.
5.3 Suggestions for further research
This conclusion is based on the data from 151 respondents. The sample is so small compared
with the population in China. So, we suggest that further research need to increase sample size
to increases the precision of the study.

- 26 -
In addition, this study only investigate some factors of cars and consumers. Further research
can focus on more factors and find the relationship between them. It could be more useful for
vehicle dealers to make some market strategy.
Furthermore, this survey didn’t mention why some people are not willing to buy second-hand
cars. Further research can investigate reasons for this question. We have a guess that “Lemon
Market” and “Face culture” would influence consumers’ decisions.

- 27 -
Reference:
Akerlof, G.A., 1970. The market for “Lemons”: quality uncertainty and the market mechanism.
The Quarterly Journal of Economics.
Alam, D., 2014. Factors that Influence the decision when buying second-hand products. DIVA
Bryman &Bell, 2011. Business Research Methods (3rd edition) Solomon, M. et al., 2013.
Consumer Behaviour: A European Perspective
Chen, R. & Ma, Z., 2013. Affecting factors on acceptance-attitude toward used car consumption
in premium segment (基于多属性态度模型的二手车交易主体分析 ). Available at: <
http://113.31.19.19:8084/articles/Article_Read.aspx?id=45019840> [Accessed 20 MAY 2016].
Cassill N L, Drake M F. Apparel selection criteria related to female consumers' lifestyle[J].
Clothing and Textiles Research Journal, 1987, 6(1): 20-28.
Damme, I. V., Vermoesen, R., 2009. Second-hand consumption as a way of life: public auctions
in the surroundings of Alost in the late eighteenth century. Continuity and Change, Vol.24 (2),
275-305.
Dillman D., Smyth J., & Christioan LM. 2009. Internet and Mixed-Mode Surveys. The Tailored
Design Method. John Wiley & Sons. New Jersey
Engel, J.F, and Blackwell, R.D. (1982). Consumer Behavior. 4th edition. Chicago: CBA College
Publishing.
Engel, J. F.; Kollat, D. T.; Blackwell, R. D. 2001. Consumer behavior. New Jersey: South-
Western.
Gai, G., & Shen, J., 2009. Analysis of factors that influence consumers’ purchasing behavior in
second-hand car market (影响二手车市场消费者购买行为的因子分析). JOURNAL OF
JILIN BUSINESS AND TECHNOLOGY COLLEGE, V01.25.No.5 (2009), pp16-19
George, D., & Mallery, P., 2003. SPSS for Windows step by step: A simple guide and reference.
11.0 update (4th ed.). Boston: Allyn & Bacon.
Huang C F, Hsueh S L. Customer behavior and decision making in the refurbishment industry‐a data mining approach[J]. Journal of Civil Engineering and Management, 2010, 16(1): 75-84.
Liang T P, Lai H J. Effect of store design on consumer purchases: an empirical study of on-line
bookstores[J]. Information & Management, 2002, 39(6): 431-444.
Lin, L., Xi, D. & Lueptow, R.M., 2013. Public face and private thrift in Chinese consumer
behaviour. , 37, pp.538–545.
Pan, X., 2013. A study on influencing factors of consumers’ purchase intention of used-cars
(基于计划行为理论的消费者二手车购买意向的影响因素研究 ). Available at: <
http://d.wanfangdata.com.cn/Thesis/Y2509968> [Accessed 20 May 2016].

- 28 -
Pei, P., Zhang Q., Wan, X. & Xiao, Z., 2015. The current situation and tendency of second-
hand car market in the 3rd and 4th cities in China (论二手车在三四线城市市场的现状和趋
势 ). Available at: <http://www.cnki.com.cn/Article/CJFDTotal-ZWQY201533019.htm>
[Accessed 20 May 2016].
Tianya, 2015. Chinese income classification of 2015. [online] Available at: <
http://bbs.tianya.cn/post-develop-1999388-1.shtml > [Accessed 24 February 2016].
Tong, J., 2013. Study on purchase decision-making model of consumers for used-car (二手车
消费者购买决策模型研究). Available at: < http://www.doc88.com/p-5146827202777.html>
[Accessed 20 May 2016].
Wang, Y., Zhang, M., & Zhang, L., 2009. SPPS processing on multiple choice and sorting (关
于 多 选 题 和 排 序 题 的 SPSS 处 理 ). Available at: <
http://xueshu.baidu.com/s?wd=paperuri%3A%289240df83c62f7e523f04829b89e267a3%29&
filter=sc_long_sign&tn=SE_xueshusource_2kduw22v&sc_vurl=http%3A%2F%2Fwenku.bai
du.com%2Fview%2F5ab60924376baf1ffc4fad92.html&ie=utf-
8&sc_us=4977083266703005693> [Accessed 20 May 2016].
Xie, C., 2014. Hundreds of millions of used car market, is the eve of the outbreak? Huxiu blog,
[blog] 28 October. Available at: <http://www.huxiu.com/article/45432/1.html> [Accessed 25
February 2016].
Yang, Y., Chen, H. & Zhang, R., 2013. Development of Used Car Market in China. Available
at: < http://www.scirp.org/journal/PaperDownload.aspx?DOI=10.4236/me.2013.4604>
[Accessed 25 February 2016].
I
Appendix 1
Figures and Tables
1. Gender (Table 1. Frequency Table for Gender )
Frequency Percent Valid Percent
Cumulative
Percent
Valid male 109 72.2 72.2 72.2
female 42 27.8 27.8 100.0
Total 151 100.0 100.0
Figure 7. Age range of the respondents
Figure 8. Education level range of the respondents
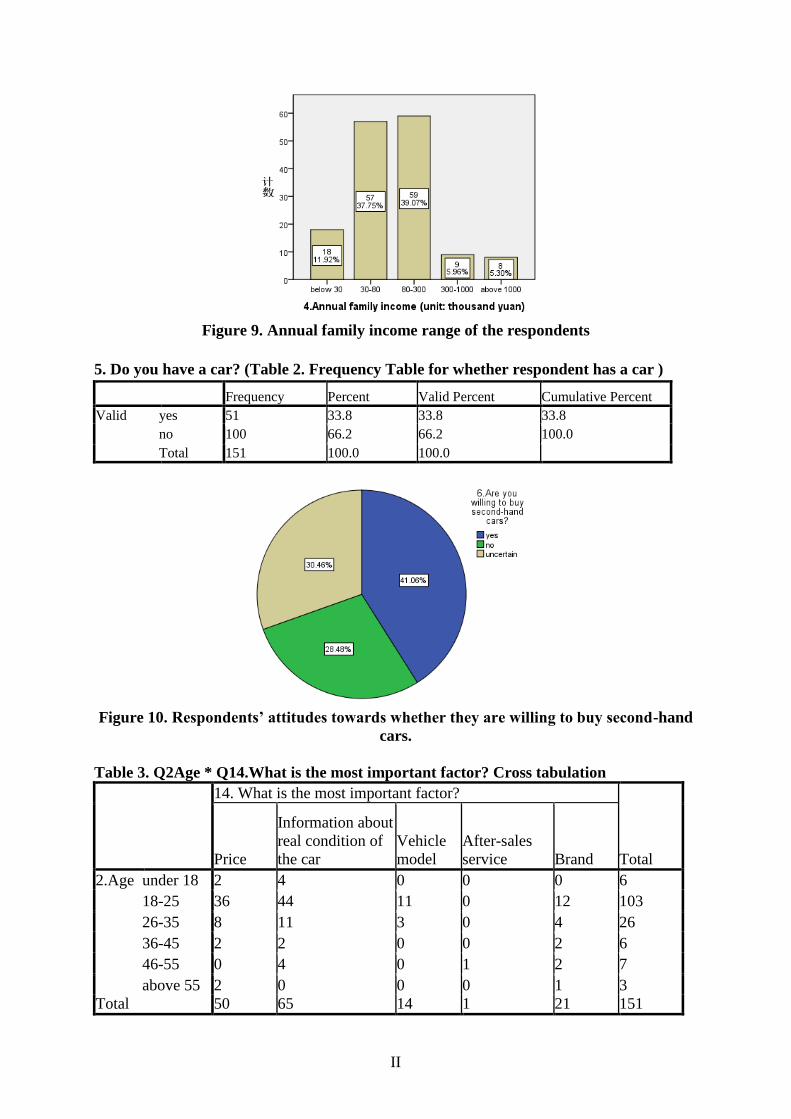
II
Figure 9. Annual family income range of the respondents
5. Do you have a car? (Table 2. Frequency Table for whether respondent has a car )
Frequency Percent Valid Percent Cumulative Percent
Valid yes 51 33.8 33.8 33.8
no 100 66.2 66.2 100.0
Total 151 100.0 100.0
Figure 10. Respondents’ attitudes towards whether they are willing to buy second-hand
cars.
Table 3. Q2Age * Q14.What is the most important factor? Cross tabulation
14. What is the most important factor?
Total Price
Information about
real condition of
the car
Vehicle
model
After-sales
service Brand
2.Age under 18 2 4 0 0 0 6
18-25 36 44 11 0 12 103
26-35 8 11 3 0 4 26
36-45 2 2 0 0 2 6
46-55 0 4 0 1 2 7
above 55 2 0 0 0 1 3
Total 50 65 14 1 21 151
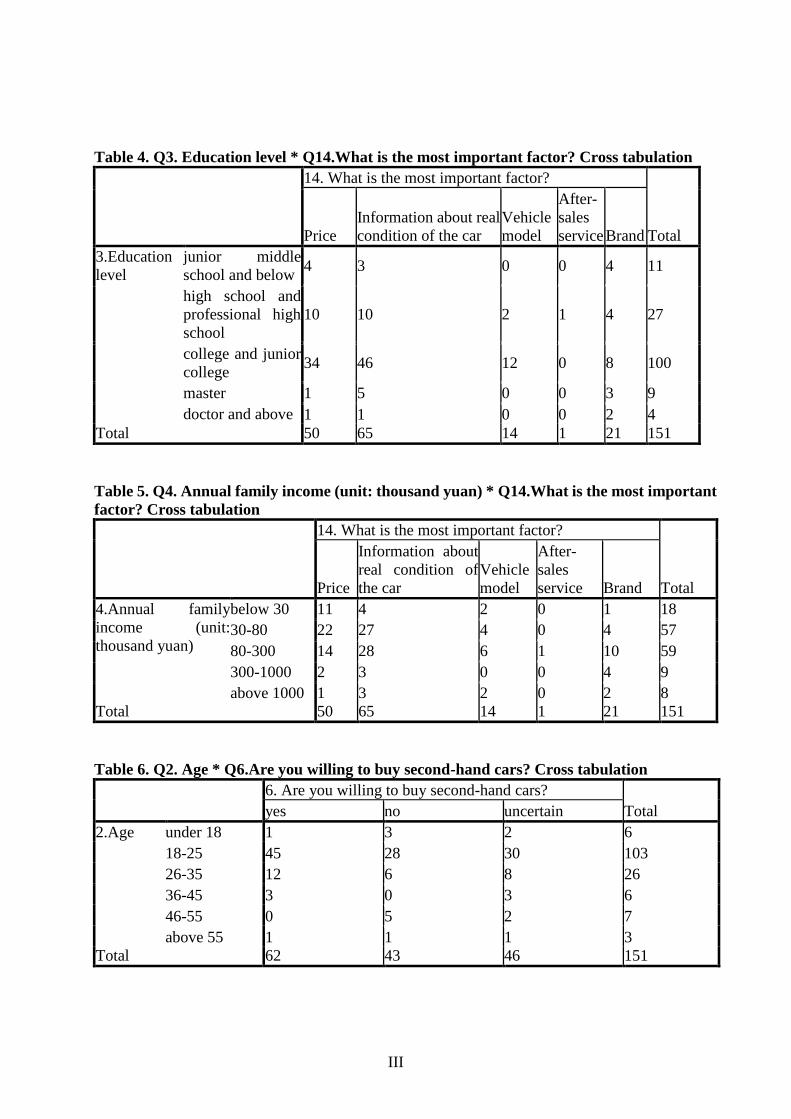
III
Table 4. Q3. Education level * Q14.What is the most important factor? Cross tabulation
14. What is the most important factor?
Total Price
Information about real
condition of the car
Vehicle
model
After-
sales
service Brand
3.Education
level
junior middle
school and below 4 3 0 0 4 11
high school and
professional high
school
10 10 2 1 4 27
college and junior
college 34 46 12 0 8 100
master 1 5 0 0 3 9
doctor and above 1 1 0 0 2 4
Total 50 65 14 1 21 151
Table 5. Q4. Annual family income (unit: thousand yuan) * Q14.What is the most important
factor? Cross tabulation
14. What is the most important factor?
Total Price
Information about
real condition of
the car
Vehicle
model
After-
sales
service Brand
4.Annual family
income (unit:
thousand yuan)
below 30 11 4 2 0 1 18
30-80 22 27 4 0 4 57
80-300 14 28 6 1 10 59
300-1000 2 3 0 0 4 9
above 1000 1 3 2 0 2 8
Total 50 65 14 1 21 151
Table 6. Q2. Age * Q6.Are you willing to buy second-hand cars? Cross tabulation
6. Are you willing to buy second-hand cars?
Total yes no uncertain
2.Age under 18 1 3 2 6
18-25 45 28 30 103
26-35 12 6 8 26
36-45 3 0 3 6
46-55 0 5 2 7
above 55 1 1 1 3
Total 62 43 46 151
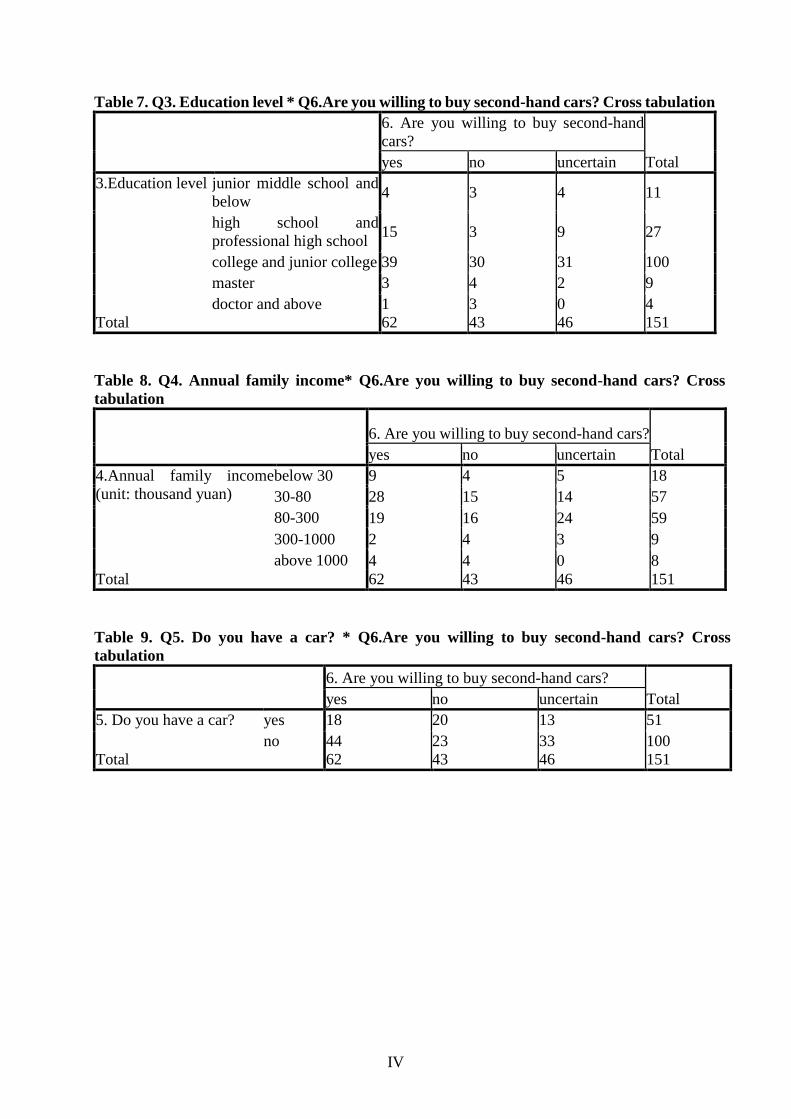
IV
Table 7. Q3. Education level * Q6.Are you willing to buy second-hand cars? Cross tabulation
6. Are you willing to buy second-hand
cars?
Total yes no uncertain
3.Education level junior middle school and
below 4 3 4 11
high school and
professional high school 15 3 9 27
college and junior college 39 30 31 100
master 3 4 2 9
doctor and above 1 3 0 4
Total 62 43 46 151
Table 8. Q4. Annual family income* Q6.Are you willing to buy second-hand cars? Cross
tabulation
6. Are you willing to buy second-hand cars?
Total yes no uncertain
4.Annual family income
(unit: thousand yuan)
below 30 9 4 5 18
30-80 28 15 14 57
80-300 19 16 24 59
300-1000 2 4 3 9
above 1000 4 4 0 8
Total 62 43 46 151
Table 9. Q5. Do you have a car? * Q6.Are you willing to buy second-hand cars? Cross
tabulation
6. Are you willing to buy second-hand cars?
Total yes no uncertain
5. Do you have a car? yes 18 20 13 51
no 44 23 33 100
Total 62 43 46 151
I
Appendix 2
Questionnaire
1. What is your gender?
A. Male B. Female
2. What is your age?
A. under 18 B. 18-25 C. 26-35 D.36-45 E. 46-55 F. above 55
3. What is your educational level?
A. junior middle school and below
B. high school and professional high school
C. college and junior college
D. master
E. doctor and above
4. What is your annual family income (unit: thousand yuan)?
A. below 30 B. 30-80 C. 80-300 D. 300-1000 E. above 1000
5. Do you have a car?
A. Yes B. No
6. Are you willing to buy second-hand cars?
A. Yes B. No C. Uncertain
7. When you purchase a second-hand car, how important is the 'price' to you?
A. very important B. quite important C. important D. just a little important E. not at all
8. When you purchase a second-hand car, how important is the ‘information about real
condition of the car’ to you (vehicle age, maintenance records, equipment information, etc.)?
A. very important B. quite important C. important D. just a little important E. not at all
9. When you purchase a second-hand car, how important is the 'vehicle model' to you (compact,
mid-size, standard, full-size, SUV, etc.)?
A. very important B. quite important C. important D. just a little important E. not at all
10. When you purchase a second-hand car, how important is the 'after-sales service' to you
(warranty, maintenance service, roadside assistance, etc.)?
A. very important B. quite important C. important D. just a little important E. not at all
11. When you purchase a second-hand car, how important is the 'brand' to you (Volkswagen,
Audi, Volvo, BMW, Cadillac, etc.)?
A. very important B. quite important C. important D. just a little important E. not at all
12. Which country would you like the brand to come from?
A. China B. America C. Germany D. Japan
E. France F. Italy G. Korea H. Other
II
13. Rank the importance you pay to the following different factors, where 1 is the most
important and 5 the least important.
__ Price
__ Information about real condition of the car
__ Vehicle model
__ After-sales service
__ Brand
14. What is the most important factor?
A. Price
B. Information about real condition of the car
C. Vehicle model
D. After-sales service
E. Brand

Visiting address: Allégatan 1 · Postal address: 501 90 Borås · Phone: 033-435 40 00 · E-mail: [email protected] · Webb: www.hb.se