social-emotional learning assessment measures for middle school youth
TRANSCRIPT
Social-Emotional Learning Assessment
Measures for Middle School Youth
Kevin Haggerty, MSW
Jenna Elgin, M.Ed.
Andrew Woolley
Social Development Research Group
University of Washington
July 30, 2010
Table of Contents
Executive Summary...................................................................................................................... ..................... 4
Introduction ......................................................................................................................................................... 6
Behavioral and Emotional Rating Scale: Second Edition (BERS-2)............................................... 12
Child Behavior Checklist (CBCL), Teacher Report Form (TRF), and
Youth Self-Report (YSR)................................................................................................................................... 16
Communities That Care (CTC) Survey...................................................................................................... 18
The Comprehensive School Climate Inventory (CSCI)........................................................................ 21
Developmental Assets Profile (DAP).......................................................................................................... 24
Devereux Student Strengths Assessment (DESSA)............................................................................. 27
School Social Behaviors Scale, Second Edition (SSBS-2)................................................................... 30
Social Skills Improvement System Rating Scales (SSIS-Rating Scale)......................................... 34
Washington State Healthy Youth Survey.................................................................................................. 37
Table 1: Summary of Recommended Measures.................................................................................... 41
Table 2: Summary of Rating Type and Core Competencies.............................................................. 42
References................................................................................................................... .......................................... 45
4 | P a g e
Executive Summary
Purpose:
Children with strong Social-Emotional Learning (SEL) skills have been shown to excel in
school, both socially and academically. SEL programs are imperative to address the social,
emotional, and academic needs of students. However, reliable and valid assessment tools
are necessary to conduct needs assessments and monitor the success of SEL programs over
time.
The purpose of the current review is to identify valid, reliable, and useable school-wide
assessments for social/emotional well-being of youth and to help schools and districts
identify tools that could be useful in determining the success of the programs created to
improve student social/emotional well-being.
Procedure:
The current report reviews many existing tools and instruments used to measure social
and emotional well-being of middle school youth. We conducted an extensive review of the
literature on social and emotional learning in middle school students. We identified and
evaluated 72 instruments and use the following criteria to determine whether or not to
recommend them for school–wide assessment.
In order to be recommended to be used with middle school students, an assessment needs
to have sound psychometric properties, be suited for program evaluation, be readily
available for schools to access and obtain information on, and not be designed to assess
specific programs. Of the 72 instruments reviewed, 9 met our criteria for inclusion in this
report.
Recommended Assessments:
The following assessments met the review criteria and were included in this report:
Behavioral and Emotional Rating Scale: Second Edition (BERS-2)
ASEBA: Child Behavior Checklist (CBCL), Teacher Report Form (TRF), and Youth
Self-Report (YSR)
Communities That Care (CTC) Survey
The Comprehensive School Climate Inventory (CSCI)
Developmental Assets Profile (DAP)
Devereux Student Strengths Assessment (DESSA)
School Social Behaviors Scale, Second Edition (SSBS-2)
Social Skills Improvement System Rating Scales (SSIS-Rating Scale)
Washington State Healthy Youth Survey
5 | P a g e
Future recommendations:
Overall, the review yielded relatively few strong assessment choices for middle schools to
choose from when conducting program evaluation that are not designed to be program specific.
The assessments that met our criteria and included in this report contain many of the
characteristics necessary to be useful for middle school interested in SEL program evaluation.
However, none of these assessment tools we reviewed will meet every school’s needs. For
example, some of the assessments do not have standard procedures and software to create reports
at the school level so some schools may need to have personnel who are capable of aggregating
survey data and putting it in a report format. In addition, some of the assessments are teacher
rating scales, which require more teacher time than self-report assessments. The DESSA is one
example of a teacher rating assessment. An area of future development in the field of SEL
assessment would be to turn the DESSA into a self-report assessment and conduct research on
the psychometric properties of the instrument. Our intention with this report is to provide a
manageable list for educators and others interested in SEL assessment of large populations
of students over time. We feel this report will be beneficial to schools interested in SEL
program evaluation.

6 | P a g e
Introduction
The purpose of the current report is to review the existing assessment tools used to
measure social and emotional well-being of middle school youth. Educators are concerned
with the social and emotional well-being of the youth they serve. Because of this, many
schools are implementing various Social-Emotional Learning (SEL) curricula and to
address the social and emotional needs of their students and the climate of their schools.
Social-Emotional Learning programs for elementary and middle school youth seek to
promote various social and emotional skills and have been linked to positive social and
academic outcomes (Payton et al., 2008). A review on SEL programming conducted by the
Collaborative for Academic, Social, and Emotional Learning (CASEL) found that SEL
programs yielded many benefits for children and adolescents (Payton et al., 2008). These
benefits were found for students in both school and after-school settings, and for students
with and without behavioral and emotional problems. Their review found that SEL
programs improved students’ social-emotional skills, attitudes about self and others,
connection to school, positive social behavior, and academic performance. They also found
reductions in conduct problems and emotional distress (Payton et al., 2008).
In addition to improving students’ social-emotional skills, the review found that SEL
programs improved students’ performance in the classroom (Payton et al., 2008).
Specifically, they found an increase of 11% to 17% in test scores (Payton et al., 2008). Thus,
research demonstrated that SEL is absolutely crucial to children’s success in school, both
academically and socially (Greenberg et al., 2003; Payton et al., 2008).
Children with strong SEL skills have been shown to excel in school, both socially and
academically. SEL programs are imperative to address the social, emotional, and academic
needs of students. However, reliable and valid assessment tools are necessary to conduct
needs assessments and to monitor the success of SEL programs over time. The goal of this
report is to assist middle school educators with choosing appropriate measures of social
and emotional skills over time.
For the purpose of this review, we used the social and emotional competencies identified
by the CASEL as a framework for identifying and reviewing various assessment measures.
The five interrelated social and emotional competencies as described by CASEL include:
Self-Awareness. Accurately assessing one’s feelings, interests, values, and
strengths; maintaining a well-grounded sense of self-confidence.
Self-Management. Regulating one’s emotions to handle stress, controlling
impulses, and persevering in addressing challenges; expressing emotions
7 | P a g e
appropriately; and setting and monitoring progress toward personal and
academic goals.
Social Awareness. Being able to take the perspective of and empathize with
others; recognizing and appreciating individual and group similarities and
differences; and recognizing and making the best use of family, school, and
community resources.
Relationship Skills. Establishing and maintaining healthy and rewarding
relationships based on cooperation; resisting inappropriate social pressure;
preventing, managing, and resolving interpersonal conflict, and seeking help
when needed.
Responsible Decision Making. Making decisions based on consideration of
ethical standards, safety concerns, appropriate social norms, respect for
others, and likely consequences of various actions; applying decision-making
skills to academic and social situations; and contributing to the well-being of
one’s school and community.
Current Review
The current landscape of tools to assess social and emotional competencies is broad and
includes instruments that look at population-level changes in social-emotional constructs,
program outcomes, and process outcomes. The measures come from multiple frameworks
such as youth risk and protective factors and youth developmental assets. The purpose of
the current review is to identify key assessment tools for evaluating changes in
social/emotional well-being of the youth served and to help districts identify tools that
could be useful in determining the success of the programs created from the perspective of
student social/emotional well-being.
The following assessment tools have been gathered in an attempt to find assessments for
researchers, schools, and educational and policy practitioners; to gauge the social and
emotional skills of middle school students; as well as to monitor the progress of SEL
programming. There are many compendia of measurement tools currently in existence, but
we feel that this report adds to these because (1) it focuses on tools available for middle
school students, (2) rather than being exhaustive, this review attempts to highlight those
tools with the most sound psychometric and technical properties, ease of use for schools,
and availability, and (3) this review focuses on tools that can be used for program
evaluation but are not focused on evaluating specific programs.
The current review focuses on measures of social and emotional competence using the
CASEL framework as a guide. Though we used the 5 social and emotional competencies as a

8 | P a g e
framework to identify measures, every instrument defines social and emotional constructs
in slightly different ways. In addition, the SEL measures come from multiple frameworks
and have slightly different theoretical underpinnings, and thus the taxonomy for each
assessment tool is slightly different. We used the taxonomy and constructs as defined by
the developers of the individual assessments when describing them in this report.
An in-depth review of the literature was conducted on social and emotional programming,
school climate, and related emotional well-being constructs in middle school youth. Our
review yielded 72 assessment measures. Of those 72 measures, 9 measures met our criteria
and were included in this report. A review of the current literature was conducted on key
measurement instruments that assess social and emotional well-being in school or in out-
of-school settings, using the CASEL definition of SEL competencies as a guide. After
reviewing all of the social-emotional assessments available, those that met the following
criteria were included in this report:
1. Intended Population:
a. Appropriate for middle school students
b. Universal assessment, meaning it can be used to assess all students, not just a clinical or targeted group
c. Not designed for a specific population
d. Not designed to evaluate a specific program
2. Monitors Change Over Time:
a. Assesses population-level change
b. Able to monitor program-level outcomes
c. Sensitive to change
3. Scientifically Sound:
a. Has been evaluated using a representative norm group (when applicable)
b. Good reliability. Reliability refers to an instrument’s ability to generate consistent answers or responses across situations where variation is not desired or expected. There are several types of reliability that are especially relevant for this review:
i. Internal Consistency (Reliability): measures whether items that propose to measure the same general construct produce similar scores and are positively correlated with their scale scores and the total test score. Internal consistency is usually measured with Cronbach’s Alpha, which ranges from 0 to 1.00.
9 | P a g e
1. Good: .70 and above
2. Adequate: .60 - .69
3. Poor: .59 and below
ii. Test-Retest Reliability: measures the consistency of an assessment over time. Results are typically presented as a correlation coefficient from 0 to 1.00. Because some SEL skills can change within a short amount of time, some assessments are expected to have lower test-retest reliability than others.
1. Good: .70 and above
2. Adequate: .60 - .69
3. Poor: .59 and below
c. Strong evidence of validity. Validity is the extent to which an assessment measures what it is intended to measure (American Educational Research Association, 1999). We considered several types of validity:
i. Criterion-Related Validity: Degree to which a measure is related in expected ways to some type of criterion or outcome, measured either at the same time (concurrent validity) or a later time (predictive validity).
ii. Convergent and/or Discriminant Validity: Convergent validity is the degree to which scores on a measure are associated positively with scores on measures of the same or highly similar constructs; discriminant validity is the degree to which scores on a measure are not associated at unexpectedly high levels with scores on measures of distinct constructs.
For each measure, we provide a brief description and the results of research demonstrating the measure’s criterion and convergent and/or discriminant validity.
4. Practical to Administer:
a. Content, format, and scoring are appropriate for school administration
b. The assessment tool and information on the tool is readily available and easy to access
For each measure that met criteria, a detailed examination of the tool was conducted. In
this report we present detailed information about each measure, including administration
(rater, format, length), scoring, psychometrics (reliability and validity), technical
10 | P a g e
assistance, overall strengths and weaknesses, pricing, source, and references. For most of
the measures, we also provide a sample of what the assessment
No attempt was made to be comprehensive; rather, we tried to find psychometrically very
good measures that match the constructs of importance here for middle school students. In
addition, some assessment tools are designed to measure multiple SEL constructs, whereas
others measure only a few. Also, some assessments also measure outcomes, such as
academics, substance use, alcohol use, and violence, while others do not.
The recommended assessment measures are not necessarily the best assessments available
for all purposes, and the recommended assessments may not be suitable for all schools and
their individual needs. In addition, if an assessment did not meet our criteria for inclusion
in this report, which does not necessarily indicate the assessment is not appropriate in
certain situations. For example, many assessments we looked at may be well suited for
clinical applications with individual students, but were not the best fit for larger groups of
students. Also, it was difficult to find comprehensive information on some of the
assessments we reviewed, which would likely impact the ability of a school to easily
implement the assessment, so we did not include them in our report. We also did not
include assessment tools that are intended to assess specific programs and program
outcomes. Our intention with this report is to provide a manageable list for educators and
others interested in SEL assessment of large populations of students over time.
Logistical Considerations
It is important to consider that schools can benefit by taking an inventory of already
existing data in their school(s), such as student demographics, school-level building
demographics, and student academic and behavioral outcome data. These data can be
important when schools combine their social and emotional data with important student
outcomes. In addition, this effort is important so that schools do not duplicate efforts or
collect redundant data. SEL assessment should be integrated with other survey efforts
taking place at that school.
Before choosing an assessment tool in a school, the scoring protocols, administration
manual, and the assessment reports should be reviewed so schools and educators
understand what the scores indicate and thus choose the most appropriate tool for their
needs. The normative scores from reports should aid schools and educators on interpreting
the scores. The assessment scoring reports should be reviewed to determine if the
assessment information is presented in ways that are easy for schools and educators to
understand. The reports and the accompanying manual should be reviewed to determine
how the scores for each of the assessed constructs are presented. The reports and results
should be reviewed to obtain information that can be used to help schools and educators
understand the current status of students’ SEL competencies. The assessment should aid
11 | P a g e
schools and educators in creating actionable steps to improve students’ SEL competencies
and have positive impacts on student outcomes. Where possible, the developers should be
contacted for consultation about how to best use the assessment for the particular school
and how the data from various sources can be related with each other.
The logistics of SEL assessment administration should be outlined beforehand. Schools
should identify personnel who can administer the assessment, arrange for any necessary
training, determine when the assessments can be administered during the school day, and
decide on the time frame for administration. The school should make plans for working
with the survey developers to understand their school’s SEL assessment results and decide
how the results can be used to make decisions about their SEL programs, policies, and
practices.
We should also note that schools may need to seek Institutional Review Board (IRB)
clearance or permission from their school districts for administering the some of the
surveys. Issues and logistics of obtaining parental consent need to be considered as well.

12 | P a g e
Behavioral and Emotional Rating Scale: Second
Edition (BERS-2)
Overview:
The Behavioral and Emotional Rating Scale, Second Edition (BERS-2; Epstein & Sharma, 1998) measures the personal strengths and competencies of children and adolescents in five areas. The BERS-2 is a multi-modal assessment system that measures children’s behavior from three perspectives: the child, parent, and teacher or other professional. It can be used as an evaluation measure, for planning interventions and services, and as an outcome measure. The BERS-2 has been widely adopted by local, state, and federal agencies to evaluate the outcomes of services.
Program Target Age:
The BERS-2 Parent Rating Scale and Teacher Rating Scale can be used to assess children and youth ages 5 to 18, and the Youth Rating Scale can be used to assess children ages 11 to 18.
Constructs Measured:
Interpersonal Strength: Ability to control emotions and behaviors in a social
situation.
Involvement with Family: Participation and relationship with his or her family.
Intrapersonal Strength: Outlook on his or her competence and accomplishment.
School Functioning: Competence in school and classroom tasks.
Affective Strength: Ability to express feelings towards others and to accept affection
from others.
Structure:
There are three forms that comprise the BERS-2 system: The child self-report (Youth
Rating Scale), the parent report (Parent Rating Scale), and teacher or other professional
report (Teacher Rating Scale). The three forms can be used in isolation or together to get a
more comprehensive picture.
Typically, the forms take less than 15 minutes to complete. There are 52 items and each
item is rated on a 4-point scale of 0 to 3 (not at all like the child, not much like the child, like
the child, very much like the child; not at all like me, not much like me, like me, very much
like me). In addition, there are eight open-ended questions on each version that ask about
child academic, social, athletic, family, and community strengths. The rater should have had
regular, daily contact with the child for at least a few months before responding to the
rating scale.

13 | P a g e
Scoring of the BERS-2 is done by hand. Scores on all items are scored to create an overall raw score. The rating scale sheet allows for scoring of the items. The BERS-2 Strength index converts raw subscale scores into a standard score with a mean of 100 and a standard deviation of 15. Normative tables are provided in the technical manual to convert the subscale raw scores to percentile ranks and scaled scores. Detailed scoring information can be found in the technical manual.
Technical Properties:
Reliability.
Internal Reliability: Good (Epstein & Sharma, 1998)
Test-Retest Reliability: Good (Epstein & Sharma, 1998; Epstein, Mooney, Ryser, and
Pierce, 2004)
Validity.
Criterion Validity: In a large national sample, the BERS-2 was shown to differentiate
between those with emotional-behavioral disorders and those without (Epstein,
Ryser, & Pearson, 2002)
Convergent and/or Discriminant Validity: Several studies have been conducted to
assess the convergent validity of the BERS-2 (Epstein, Nordness, Nelson, & Hertzog,
2002; Harniss, Epstein, Ryser, & Pearson, 1999). The BERS-2 consistently
demonstrated moderate to high correlations with competence-oriented scales on
the Social Skills Rating Scale and moderate to high negative correlations with
deficit-oriented scales across different age ranges (Epstein, Nordness, Nelson, &
Hertzog, 2002; Epstein, Mooney, Ryser, and Pierce, 2004).
Technical Support:
Information about the BERS-2 can be found on the ProEd website:
http://www.proedinc.com/
In addition, the technical manual has extensive information on reliability, validity,
administration, scoring, and interpretation.
Strengths:
The BERS-2 appears to be a psychometrically sound, strength-based rapid-assessment
instrument. It is widely used by schools and social service agencies. The technical adequacy
has been determined with respect to the instrument’s reliability and validity. The BERS-2
focuses on students’ strengths instead of deficits.
14 | P a g e
Weaknesses:
No provisions for how to coordinate results from parent, teacher, and student scales or
how to compile the information when using the scales for program-level evaluation.
Someone familiar with aggregating data may be necessary to compile the survey results for
school personnel to use.
Availability:
The BERS-2 is available for purchase from Pro Ed. The cost of the manual is $64.00, and a
package of 25 forms (Teacher, Parent, or Youth Rating Scales) is $34.00, and a pad of 50
summary forms is $34.00.
15 | P a g e
Child Behavior Checklist (CBCL), Youth Self-Report (YRS) and
Teacher Report Form (TRS) Part of the Achenbach System on Empirically Based Assessment (ASEBA)
Overview:
The Achenbach System of Empirically Based Assessment (ASEBA; Achenbach, & Rescorla,
2001) offers a comprehensive approach to assessing adaptive and maladaptive functioning
in children and adolescents. It is used in national surveys to track development and predict
competencies and problems. It is also supported by extensive research on service needs
and outcomes, diagnosis, prevalence of problems, medical conditions, treatment efficacy,
genetic and environmental effects, and epidemiology. The system provides optimal
evidence-based, normed tools for identifying intervention needs, monitoring progress, and
evaluating responses to interventions for behavioral, emotional, and social problems.
Program Target Age:
The Achenbach System can be used to assess children and youth ages 6-18.
Constructs Measured:
Empirically Based Syndromes Scales:
Anxious/Depressed
Withdrawn/Depressed
Somatic Complaints
Social Problems
Thought Problems
Attention Problems
Rule-Breaking Behavior
Aggressive Behavior
DSM-Orientated Scales (diagnostic):
Affective Problems
Anxiety Problems
Somatic Problems
Attention Deficit/Hyperactivity Problems
Oppositional Defiant Problems
Conduct Problems
Structure:
There are three forms: the Child Behavior Checklist (CBCL) is completed by parents, the
Youth Self-Report (YSR) is completed by the youth, and the Teacher Report Form (TRF)
16 | P a g e
completed by the teacher. The CBCL has 118 items, the YSR has 113 items, and the TRF has
112 items. All responses are on a 3-point scale (Not True, Somewhat or Sometimes True,
Very True, or Often True). The ASEBA system is also available in Spanish.
The CBCL, YSR, and TRF have been standardized to obtain normative points (i.e., what is
typically reported by such informants for normative samples of youth; see Achenbach &
Edelbrock, 1983, 1986; Edelbrock & Achenbach, 1984). Scoring is done by hand or by using
the optional scoring software. Standard T scores quantify a youth’s standing in relation to
other youth and determine whether elevated scores on a particular scale fall in a clinical
range.
See Figure 1 for a sample of the CBCL.
Technical Properties: (see Achenbach, & Rescorla, 2001)
Reliability.
Internal Reliability: Adequate to Good (with the exception of one subscale)
Test-Retest Reliability: Good
Validity.
Criterion Validity: Scores have been shown to differentiate between referred and
non-referred children.
Convergent and/or Discriminant Validity: To assess convergent validity, scores on
the CBCL and the TRF were compared with scores on the youth and teacher Conners
Scales (1997) and the Behavior Assessment System for Children (BASC). They found
moderate to strong correlations between analogous scales and subscales, indicating
strong convergent validity.
Technical Support:
Information can be found on the website: www. aseba.org.
Support can be obtained by calling 802-656-5130, or by emailing [email protected].
In addition, the technical manual has extensive information on reliability, validity,
administration, scoring, and interpretation.
Strengths:
There is extensive use and research demonstrating the psychometric properties of the
ASEBA system. The conceptualization, administration, and scoring are straightforward. The

17 | P a g e
ASEBA system has a long history of use by school practitioners and extensive research to
support its use.
Weaknesses:
The CBCL and TRF may be difficult to use with large numbers of children. The YSR would
be easier if many children were being surveyed, such as in program evaluation. It does not
appear that the software is able to generate reports for entire classrooms/schools to track
progress over time. Thus, knowledge of how to do this and separate data management
software may be necessary to compile and analyze results for monitoring the progress of
intervention and prevention programs.
Availability:
The Achenbach system is available for purchase through www.ASEBA.org. The cost is 50
forms for $25, Manual $40, and optional software scoring is $395.00.

18 | P a g e
Communities That Care (CTC) Youth Survey Developed by the Social Development Research Group
Overview:
The Communities That Care Youth Survey is designed to identify the levels of risk and
protective factors that predict problem behaviors such as alcohol, tobacco, and other drug
use, poor school achievement, and delinquency in young people (Arthur et al., 2002). The
survey is based upon an extensive research base, which ensures that assessment efforts are
based on prevention science, and has consistently demonstrated reliable and valid
measurements of these factors across grades, both genders, and racial and ethnic groups
(Glaser et al. 2005). In addition to measuring risk and protective factors, the survey also
measures the actual prevalence of drug use, violence, and other antisocial behaviors among
surveyed students.
Program Target Age:
The CTC Youth Survey can be used to assess middle and high school youth (Grades 6
through 12).
Constructs Measured:
Community Risk Factors
o Low Neighborhood Attachment, Community Disorganization, Transitions and
Mobility, Perceived Availability of Handguns, Laws and Norms Favorable to
Drug Use
Community Protective Factors
o Opportunities for Prosocial Involvement, Rewards for Prosocial Involvement
Family Risk Factors
o Family History of Antisocial Behavior, Poor Family Management, Family
Conflict, Parental Attitudes Favorable Towards Drug Use, Parent Attitudes
Favorable to Antisocial Behavior
Family Protective Factors
o Attachment, Opportunities for Prosocial Involvement, Rewards for Prosocial
Involvement
School Risk Factors
o Academic Failure, Low Commitment to School
School Protective Factors
o Opportunities for Prosocial Involvement, Rewards for Prosocial Involvement
Peer-Individual Risk Factors
o Rebelliousness, Gang Involvement, Perceived Risk of Drug Use, Early
Initiation of Drug Use, Early Initiation of Antisocial Behavior, Favorable
19 | P a g e
Attitudes Towards Drug Use, Favorable Attitudes Towards Antisocial
Behavior, Sensation Seeking, Rewards for Antisocial Involvement, Friends’
Use of Drugs, Interaction with Antisocial Peers, Intentions to Use
Peer-Individual Protective Factors
o Interaction with Prosocial Peers, Belief in the Moral Order, Prosocial
Involvement, Rewards for Prosocial Involvement, Social Skills, Religiosity
Outcome Measures
o Depression, High Substance Use Frequency, Substance Use Frequency,
Antisocial Behavior, Antisocial Behavior Frequency
Structure:
The CTC Youth Survey is a self-report instrument with a total of 142 items, and takes the
youth approximately 50 minutes to complete. The survey can be administered in large
groups. There are several different response options to the survey questions. A majority of
the questions use various 4-point response option scales (e.g., NO!, no, yes, YES!; OR Very
Wrong, Wrong, A Little Bit Wrong, Not Wrong At All; OR No Risk, Slight Risk, Moderate
Risk, Great Risk). Other questions are simply yes/no questions, while others seek a
response regarding the frequency of behaviors (e.g., Never, 1 or 2 times, 3 or 4 times, 5 or 6
times, 7 or more times).
The Bach Harrison, LLC company provides services for scoring, aggregating the data, and
generating reports for the school(s) to use for program planning and evaluation.
See Figure 2 for a sample of the CTC Youth Survey.
Technical Properties:
A distinguished body of research is available in support of the CTC Youth Survey. The
timeline of supporting data also charts the progression of the method used to publish the
results of the survey.
Reliability.
Internal Reliability: Good (Arthur et al., 2002)
Test-Retest Reliability: No information available
Validity.
Criterion Validity: Each of the risk and protective factors included in the CTC
Youth Survey has been found to predict later drug use or problem behavior
(Hawkins et al., 1992, 1995)
20 | P a g e
Convergent and/or Discriminant Validity: Glaser et al. (2005) concluded that the
CTC Youth Survey measures risk and protective factors equally well across gender
and ethnic/racial groups
Technical Support:
Information can be found on the following website:
http://ncadi.samhsa.gov/features/ctc/resources.aspx
In addition, Bach Harrison provides expertise in research services, program evaluation,
survey administration, data management systems, and web-based services. Contact
Dr. Steve Harrison at [email protected] or (801) 359-2064 for more information
and pricing.
Strengths:
The CTC Youth Survey is part of the Center for Substance Use Prevention (CSAP) Toolkit,
which is part of the Substance Abuse and Mental Health Services Administration
(SAMHSA). The CTC Survey, therefore, supports federal funding requirements and provides
a solid and objective foundation to potential grant applications.
There is extensive research supporting the validity, reliability, and the usefulness of the
CTC Youth Survey (Arthur et al. 2002; Arthur et al. 2007; and Glaser et al. 2005). The
survey is designed to support science-based prevention planning by facilitating the
assessment and prioritization of risk and protective factors in youth populations at the
community or school level. Also, in addition to examining social and emotional constructs,
the CTC Youth Survey includes outcome measures in the areas of mental health, substance
use, and antisocial behavior, which may be beneficial, as these areas are all related to SEL
skills.
Weaknesses:
Extensive information on the Communities That Care prevention framework and processes
is readily available, but information specific to the survey is more difficult to find online.
This survey is longer than many of the others included in this report.
Availability:
The CTC Youth Survey is available to the public for free; however, there may be costs if
services from Bach Harrison or other research contractors are needed.
*Information was reviewed by the Social Development Research Group
21 | P a g e
The Comprehensive School Climate Inventory (CSCI) Developed by the National School Climate Center (NSCC) (formerly, The Center for
Social and Emotional Education)
Overview:
The Comprehensive School Climate Inventory (CSCI) is a nationally-recognized, empirically-validated school climate survey that provides an in-depth profile of a school’s particular strengths and needs. School climate, as defined by the National School Climate Council, is the quality of school life as it relates to norms and values, interpersonal relations and social interactions, and organizational processes and structures. The CSCI provides an in-depth profile of a school community’s particular strengths and needs in four main areas.The CSCI allows schools to assess student, parent, and school personnel perceptions, and get detailed information needed to make informed decisions for lasting improvement.
Program Target Age:
The CSCI is designed to assess students in Grades 3 through 12, and K-12 parents and school personnel.
Constructs Measured:
Safety
o Rules and Norms
o Sense of Physical Security
o Sense of Social-Emotional Security
Teaching and Learning
o Support for Learning
o Social and Civic Learning
Interpersonal Relationships
o Respect for Diversity
o Social Support from Adults
o Social Support for Students
Institutional Environment
o School Connectedness/Engagement
o Physical Surroundings
Staff Only
o Leadership
o Professional Relationships
Structure:
The CSCI provides the option of paper or online versions of the surveys. It is a multi-modal
assessment, with student, parent, and school personnel forms. There are approximately 64
22 | P a g e
to 90 questions, depending on the population being assessed. The survey takes 15‐20
minutes to complete. It is available in English and Spanish-language.
Scoring is done by the National School Climate Center. Every school has access to a secure
online portal that includes step-by-step guidelines for administration, form letters to aid in
outreach, real-time response rates, best practices from the field, and detailed worksheets
for focused prioritizing and action planning based on results. In addition, each school
receives a comprehensive, customized report with graphic-rich data and recommended
guidelines. The report includes narrative and numerical analysis of major findings, a
summary of the report highlights, detailed data by sub-groups, item-by-tem responses, and
information-rich action charts to support schools in brainstorming next steps for targeted
action planning.
See Figure 3 for a sample of the CSCI.
Technical Properties:
The National School Climate Center has published the results of their empirical testing of
the CSCI conducted via a pilot test of 64 schools. The final report is available at
http://www.schoolclimate.org/climate/documents/ValidityAndReliability-CSCI.pdf
Reliability.
Internal Reliability: Good
Test-Retest Reliability: No information available
Validity.
Criterion Validity: As a school-level measure, the CSCI is able to discriminate among
schools.
Convergent and/or Discriminant Validity: Correlations between the CSCI and a
measure of nonacademic risk found 8 out of the 10 scale scores (as well as the
unified scale score) had correlations above .60. The unified climate scale was
significantly correlated with an index of academic performance, as well as high
school graduation rates.
Technical Support:
Detailed information and support for the CSCI can be found on the National School Climate
Center (NSCC) website:www.schoolclimate.org/programs/csci.php. For more information,
contact Darlene Faster, Director of Communications, 212-707-8799, ext 22 or 800-998-
4701, or [email protected].

23 | P a g e
NSCC also provides technical assistance to schools, districts and State Departments of
Education on how to (1) prepare and plan for the next phase of the school improvement
process in general and school climate assessment in particular; and, (2) a series of tasks
that support school personnel, students and parents/guardians understanding the school
climate findings and developing an evidence-based action plan.
Strengths:
The CSCI is yoked to a web-based portal system that supports schools to effectively
administer the survey and use the resulting data as a springboard for school improvement
efforts.
The CSCI includes action-planning worksheets as part of a comprehensive framework for
school climate improvement, which promotes the development of core priorities and
focused plans for sustained, measured progress over time.
The CSCI has been in development since 2002. In 2006, the following three independent researchers assessed how the CSCI had been developed: Kathy Burgoyne, Ph.D. (Senior Director of Capacity Building, Research, and Evaluation, Comprehensive Health Education Foundation), Madhabi Chatterji, Ph.D (Associate Professor of Measurement, Evaluation and Education, Teachers College, Columbia University), and, Chrys Dougherty, Ph.D. (Director of Research, National Center for Educational Accountability). All reported that the CSCI had been developed in a scientifically sound manner and initial indices of validity and reliability had been established. (For copies of these reports, please write to [email protected].)
The reliability and validity claims made by the National School Climate Center are based
upon a large pilot test of 64 schools (39 high schools, 25 middle schools), which yielded
roughly 27,000 observations.
Weaknesses:
The CSCI is recommended as a school climate measure, but not as a purely social-emotional
assessment. In addition, there is limited reliability and validity information on this
measure. The research that has been done indicates very strong psychometrics, but further
testing would be beneficial.
Professor Ann Higgins D'Alessandro (Director, Applied Psychology Program, Fordham
University) is now conducting further reliability and validity studies.
Availability:
The paper survey is $1.75 each. The online survey pricing is determined on a sliding scale.

24 | P a g e
Customization options are available for the survey, including open-ended or additional
demographic questions.
Additional reporting options are available, including District-wide reports highlighting key
trends and patterns across a network of schools and Aggregate reports displaying findings
at each level (elementary, middle, and high).
*Information was reviewed by the National School Climate Center

25 | P a g e
Developmental Assets Profile (DAP) Developed by the Search Institute
Overview:
The Developmental Assets Profile (DAP) is a survey designed to assess how youth are
faring personally, socially, and within the contexts of family, school, and community. The
DAP measures eight asset categories in a way that’s quickly administered and scored.
Developmental Assets are defined as positive experiences and qualities identified by the
Search Institute as being essential to healthy psychological and social development in
childhood and adolescence. These assets have the power to influence young people’s
developmental trajectories, protect them from a range of negative outcomes, and help them
become more productive, caring, and responsible adults. Developmental Assets represent
the positive relationships, opportunities, skills, and values that promote the positive
development of all children and adolescents. The DAP is designed to be sensitive to changes
in reported assets over time and it is suited to research and program evaluation. The DAP is
useful for studying effects of youth programs, curricula, and interventions that are
designed to enhance youth development and reduce negative outcomes.
Program Target Age:
The DAP can be used with youth ages 11 to 18 (Grades 6 to 12).
Constructs Measured:
There are two alternative ways of scoring and portraying reported assets.
Asset View:
Support
Empowerment
Boundaries and Expectations
Constructive Use of Time
Commitment to Learning
Positive Values
Social Competencies
Positive Identity
Context View:
Personal
Social
Family
School
Community

26 | P a g e
Structure:
There are 58 questions completed by the student, rated on a 4-point scale from ‘Not at All
or Rarely’ to ‘Extremely or Almost Always.’ Respondents are instructed to describe
themselves “now or within the past three months.” The survey is usually completed within
10 minutes. The survey can be completed on paper and hand scored or there is an option of
a web survey which allows for a secure environment in which to administer, score, view,
print, and export DAP results.
Scoring should be done by a qualified user. Materials and procedures for hand-scoring the
DAP are available. Alternatively, internet-based data entry and scoring are available. Prior
to scoring, the DAP is checked for data quality problems (too many blanks, multiple
responses, etc.) according to instructions in the manual. There are two scoring schemes
available for the DAP. The Asset View portrays scores on eight scales representing the asset
categories, whereas the Context View comprises scales representing five context areas. For
either view, scores are computed for each scale by averaging the scores for completed
items on the scale. If using the Asset View, an Internal Asset Score and an External Asset
Score can be derived.
The DAP allows for two methods of interpretation: Theoretical and Empirical. The
theoretical approach involves developing standards. There are some theoretically based
interpretive guidelines for interpretation. Once scored, the DAP asset category and context
area scales are divided into four ranges labeled Excellent, Good, Fair, and Low. The
empirical approach involves statistically based norms based on representative
standardization samples. The statistical norms are currently being constructed.
See Figure 4 for a sample of the DAP.
Technical Properties: (see Search Institute, 2005)
Reliability.
Internal Reliability: Good
Test-Retest Reliability: Good
Validity.
Criterion Validity: Students from two middle schools that were judged
independently to differ in the kinds of positive experiences afforded to youth were
compared. Youth from the more asset-rich school scored significantly higher on
every DAP scale (p < .001), indicating the DAP is sensitive to differences between
groups judged independently to differ in level of Developmental Assets.
27 | P a g e
Convergent and/or Discriminant Validity: The DAP was compared to the Attitudes
and Behaviors Scale, also developed by the Search Institute. The DAP total asset
score, as well as the External and Internal Asset Scores were found to correlate
strongly with the Attitudes and Behaviors survey overall score and corresponding
subscales. Also, scores on the DAP Positive Identity scale significantly correlated
with scores on Rosenberg’s Self-Esteem Scale, and with Harter’s Global Self-Worth
Scale, indicating considerable convergence between these measures.
Technical Support:
Information on scoring is provided in the technical manual. Information can also be found
on the Search Institute’s website at http://www.search-institute.org/. Additional
information can be obtained by calling customer support at 877-240-7251 ext. 1 or by
emailing Erika Klein at [email protected].
Strengths:
The DAP has strong psychometric properties and uses a strength-based perspective. It is
specifically designed for assessing change over time and evaluating SEL programming. In
addition, there is technical support available to schools wanting to use the DAP.
Weaknesses:
No validity information for the Context Assets. Also, norms are still currently being
developed and are not presented in the 2005 version of the manual, but they do give
general guidelines to interpret scores.
Availability:
The DAP is available for purchase through the Search Institute at
www.search-institute.org/. The cost is $50 for 50 surveys, and $75 for the user’s manual.

28 | P a g e
Devereux Student Strengths Assessment (DESSA) Developed by the Devereux Center for Resilient Children
Overview:
The Devereux Student Strengths Assessment (DESSA; LeBuffe, Shapiro, & Naglieri, 2008) is
a behavior rating scale that assesses the social-emotional competencies that serve as
protective factors for children in kindergarten through eighth grade. The assessment is
entirely strength-based and does not assess risk factors or maladaptive behaviors. The
DESSA defines social-emotional competence as the ability of the child to successfully
interact with other children and adults in a way that demonstrates an awareness of, and
ability to manage emotions in an age- and contextually appropriate manner. The DESSA
also considers competence to be a continuum ranging from incompetence to being fully
proficient.
The DESSA can be used to:
1. Identify social-emotional strengths and needs of elementary and middle school
children.
2. Produce classroom profiles that guide universal prevention strategies.
3. Identify at-risk children who have specific social-emotional needs.
4. Produce individual student profiles that guide targeted prevention strategies.
5. For special education students, identify important strengths that can be
incorporated into IEPs.
6. Evaluate social-emotional learning outcomes at the child, class, grade, school, and
district levels.
7. Enable the evaluation of social-emotional learning and positive youth development
programs by rigorously evaluating outcomes at the student, classroom, school/
program, and district/community levels.
Program Target Age:
Students in kindergarten through eighth grade.
Constructs Measured:
Self-Awareness: a child’s realistic understanding of her/his strengths and limitations
and consistent desire for self-improvement
Social-Awareness: a child’s capacity to interact with others in a way that shows
respect for their ideas and behaviors, recognizes her/his impact on them, and uses
cooperation and tolerance in social situations
Self-Management: a child’s success in controlling his or her emotions and behaviors,
to complete a task, or succeed in a new or challenging situation

29 | P a g e
Goal-Directed Behavior: a child’s initiation of and persistence in completing tasks of
varying difficulty
Relationship Skills: a child’s consistent performance of socially acceptable actions
that promote and maintain positive connections with others
Personal Responsibility: a child’s tendency to be careful and reliable in her/his
actions and in contribution to group efforts
Decision Making: a child’s approach to problem solving that involves learning from
others and from her/his own previous experiences, using values to guide action, and
accepting responsibility for decisions
Optimistic Thinking: a child’s attitude of confidence, hopefulness, and positive
thinking regarding herself/himself and her/his life situations in the past, present,
and future.
Structure:
The DESSA is completed by parents/guardians, teachers, or staff at schools and child-
serving agencies, including after-school, social service, and mental health programs. For
each of the 72 DESSA items, the rater is asked to indicate on a 5-point scale (Never, Rarely,
Occasionally, Frequently, Very Frequently) how often the student engaged in each behavior
over the past four weeks. Therefore, raters must know the child for at least four weeks. The
same rating form is used for children of all ages and all raters for ease of administration
and score comparison. Items were grouped based on CASEL 5 SEL core competencies with
the addition of optimism, an important concept from the resilience literature.
A standardized T-score for each of the eight scales and a total Social-Emotional Composite
score are derived. Profiles of individual students, classrooms, or other groups of students
are generated by hand or by using scoring software.
The DESSA-mini is an eight-item teacher rating form that allows teachers to screen their
entire classroom in a single planning period. The DESSA-mini has four alternative forms
that can be used interchangeably for frequent progress monitoring. The DESSA-mini does
not yield scale scores, but only a single Social-Emotional Total Score that classifies students
in the same way as the longer form 80% of the time.
The DESSA and the DESSA-mini is available in English and Spanish. Online administration,
scoring, interpretations and reporting program is available for the DESSA. The online
report provides data of entire individual students and entire classrooms. It was designed,
in part, for school-wide assessment.
See Figure 5 for a sample of the DESSA.

30 | P a g e
Technical Properties:
The DESSA standardization sample consists of 2,500 children matched to U.S. census data
(LeBuffe, Shapiro, & Naglieri, 2008).
Reliability.
Internal Reliability: Good
Test-Retest Reliability: Good
Validity.
Criterion Validity: A study conducted by the authors (LeBuffe, Shapiro, & Naglieri,
2008) compared DESSA scores of students who had already been identified as
having social, emotional, or behavioral disorders to their non-identified peers. The
results of the study show that the DESSA is very effective in differentiating between
students with and without social, emotional, and behavioral problems, and indicates
the DESSA has strong criterion validity.
Convergent Validity: Nickerson and Fishman (2009), in an article published in
School Psychology Quarterly, reported strong convergent validity of DESSA scores
with the Behavioral Assessment Scale for Children, Second Edition (BASC-2) and
BERS-2 scores.
Technical Support:
Manual provides user-friendly tools for detecting differences between raters and across
time. Fee-based in-service training is available, but not necessary. Free video and audio
training presentations are available online. For more information on the DCRC, visit the
website, www.centerforresilientchildren.org, or call 866-872-4687.
Strengths:
The DESSA is a the strengths-based assessment with strong psychometric properties. It has
solid conceptualization and ease of administration. In addition, the profiles are easy to read
and interpret, and online administration, scoring and reporting is available. Information on
the website is readily available and easy to access.
Weaknesses:
Does not assess risk factors or maladaptive behaviors, which are often of interest to schools
and districts. Teachers/parents have to complete, which requires a lot of time for teachers
and it may be difficult to get high response rates when assessing an entire school/district.
31 | P a g e
Availability:
For purchase through Kaplan (www.k5kaplan.com).
*Information was reviewed by the Devereux Center for Resilient Children
32 | P a g e
School Social Behaviors Scale, Second Edition (SSBS-2)
Overview:
The School Social Behavior Scale (SSBS-2), primarily designed as a behavior-rating
instrument for teachers or other school personnel of students in Grades K-12, can be used
as a screening instrument to identify possible at-risk students, determine student eligibility
for intervention programs, measure the effectiveness of interventions over time, remove
barriers to learning and help children reach their goals, bring families into the process to
provide the best support for children, and examine social competence and antisocial
behavior patterns of children and adolescents.
Teachers or other school personnel complete SSBS-2, a simple 2-page rating scale that
looks at both Social Competence and Antisocial Behavior. Specific items on both positive
and negative behaviors give users accurate results and provide direction for intervention
and support in school. In addition the SSBS-2:
1. Screens both positive and negative behaviors, so users get the big picture of a child's
social and emotional development
2. Is norm-referenced and standardized—norming sample included children from
diverse backgrounds and with a wide range of disabilities
3. Requires no training and very little time—is easy to complete in minutes
4. Screens behaviors inside and outside the classroom, so users get the full picture of the
child's behavior and can target interventions
Program Target Age:
The SSBS can be used with children and youth in Grades K through 12.
Constructs Measured: Scale A: Social Competence
Peer Relations
Self-Management/Compliance
Academic Behavior
Scale B: Antisocial Behavior
Hostile/Irritable
Antisocial/Aggressive
Defiant/Disruptive

33 | P a g e
Structure:
The SSBS differs from most other behavior-rating scales in that it contains two separate
major scales, both normed on the same population, for use in assessing both behavioral
domains. It also differs from many other behavior-rating scales in that it was designed
specifically for school-based use; the items therein contain behavioral descriptors relevant
to educational settings.
The SSBS has two scales: Social Competence and Antisocial Behavior. Each of these major scales contains three empirically derived subscales, which are useful in identifying specific social and antisocial behavior patterns.
The SSBS includes 65 items on two major scales (Social Competence, 32 items; and
Antisocial Behavior, 33 items) and items are rated using a 5-point scale, “1 = Never” to “5 =
Frequently.” The empirically derived structure for each scale includes three subscales and a
total score. All subscales and total scores are converted to Social Functioning Levels, which
serve as general indicators on the normative range of skill deficits and problem excesses.
Additionally, standard scores and percentile ranks are created by converting the total
scores for each scale.
The Social Competence scale has 32 items that represent adaptive and prosocial behavioral
competences as they generally transpire in the classroom. The Peer Relations subscale has
14 items that measure social competency in initiating and developing affirmative
relationships and earning social acceptance from peers. The Self-Management/Compliance
subscale has 10 items that measure social competency in cooperation, self-management
and regulation, and observance to established school rules and classroom boundaries. The
Academic Behavior subscale has 8 items relating to successful completion and engagement
on academic tasks.
The Antisocial Behavior scale has 33 items that describe problematic behaviors, either
other-directed (directed or guided chiefly by external standards as opposed to their own
standards or values) or likely to cause negative social interactions or environments. The
Hostile/Irritable subscale has 14 items that measure antisocial behavior in confrontational
and antagonistic trends in academic tasks and social interactions with peers. The
Antisocial/Aggressive subscale has 10 items that describe behaviors concerning
intimidation or harms to other children and deliberate infringement of rules and
boundaries. The Defiant/Disruptive subscale has 8 items that describe potentially
disruptive behaviors to the classroom climate and unacceptable demands on teacher and
child.
See Figure 6 for a sample of the SSBS.

34 | P a g e
Technical Properties:
The SBSS standardization sample consisted of 1,858 teacher ratings of students in Grades K
through 12 from 22 different public school districts in the United States. These school
districts were drawn from 18 different states, and the four U.S. geographical regions were
adequately represented. The 22 participating school districts were in a mix of urban,
suburban, small town, and rural communities.
Reliability: (see Merrell, 1993)
Internal Reliability: Good
Test-Retest Reliability: Adequate to Good
Validity.
Convergent and/or Discriminant Validity: Correlation studies conducted with the
SBSS and five other behavioral instruments indicated moderate to high correlations,
and that the scale has strong convergent and discriminant validity (Emerson,
Crowley, and Merrell 1994).
Other studies (cited by Merrell, 2003), have demonstrated that the scale has a high
degree of sensitivity and has the capacity to discriminate group differences with a
variety of educational subgroups, such as students with disabilities, gifted students,
at-risk students, and regular education students.
Technical Support:
Information on scoring is provided in the SBSS 2 technical manual, available for purchase
from Brookes Publishing.
Strengths:
The SBSS is a practical instrument that has the advantage of focusing solely on social
behaviors within the school context, and provides norm-referenced data on social
competence and antisocial problem behavior. It has adequate to good psychometric
properties, and the ease and simplicity of administration and scoring make the instrument
ideally suited to the demands of screening, classification, and the development of
interventions in middle schools. In addition, the revised second edition of the SSBS has
increased the ethnic and geographic diversity of the students rated in the standardization
sample.

35 | P a g e
Note: A cross-informant version of the SBSS has been developed for parents and
community-based informants. The Home and Community Social Behaviors Scale (HCSBS)
has the same general rating format and social competence/antisocial behavior scale
division.
Weaknesses:
Given the numbers of studies that have been conducted using the SBSS, there is an
inadequate number conducted by independent researchers. No provision for aggregating
data for a large number of students is given, so expertise in this area may be needed.
Availability:
For purchase through Brookes Publishing: http://www.brookespublishing.com

36 | P a g e
Social Skills Improvement System Rating Scales
(SSIS-Rating Scale)
Overview:
The Social Skills Improvement System (SSIS: Gresham & Elliot, 2008) Rating Scales enables targeted assessment of individuals and small groups to help evaluate social skills, problem behaviors, and academic competence. It was designed to replace the SSRS Social Skills Rating System.
The SSIS-Rating Scales can be used to assess children with behavioral and interpersonal
skills difficulties, screen for problem behaviors, and identify students at risk for social
behavior difficulties and poor academic performance. In addition, it can be used to identify
specific social behavior acquisition and performance deficits that can be addressed with
skill-building school and home interventions and identify social skills strengths. It is also
used to provide a baseline for post-intervention progress evaluation as well as to track
progress.
Program Target Age:
The SSIS can be used with students ages 3 to 18.
Constructs Measured:
Social Skills:
o Communication
o Cooperation
o Assertion
o Responsibility
o Empathy
o Engagement
o Self-Control
Problem Behaviors:
o Externalizing
o Bullying
o Hyperactivity/Inattention
o Internalizing
o Autism Spectrum
Academic Competence: (teacher form only)
o Reading Achievement
o Math Achievement
o Motivation to Learn

37 | P a g e
Structure:
There are forms for the student (ages 8-18 only), parents, and teacher. Each form takes 10
to 25 minutes to complete. The student and parent forms are available in Spanish. The
number of items differs based on the form and age of child. There are approximately 140
items per form. On the student form, students rate how true various sentences are about
them on a 4-point scale: not true, a little true, a lot true, very true. On the parent and
teacher forms, parents and teachers rate the frequency that various behaviors are
exhibited by the student on a 4-point scale.
The forms can be hand scored or computer scored. Reports are generated from the scoring
software. There are detailed instructions on scoring and interpreting the scores in the
manual. The manual also provides instructions when collecting data from multiple raters.
The normative sample included 4,700 students aged 3 through 18; 385 teachers; and 2,800
parents.
Technical Properties: (see Gresham & Elliott, 2008)
Reliability. (see Gresham & Elliott, 2008)
Internal Reliability: Good
Test-Retest Reliability: Good
Validity. (see Gresham & Elliott, 2008)
Criterion Validity: The manual demonstrates evidence of adequate criterion validity.
Convergent Validity: The SSIS manual reports adequate support for the convergent
and discriminant validity of the SSIS rating subscales. Correlations between SSIS and
other rating scales demonstrated low or moderate correlations.
Technical Support:
The technical manual provides detailed information on administration, scoring, and
interpreting results.
Strengths:
The SSIS is a revised version of the widely used SSRS, which has a strong history of use in
schools.
38 | P a g e
Weaknesses:
There is extensive research and information on the Social Skills Rating System, but not as
much has been done on the newer SSIS. Also, the cost of the SSIS is high compared to other
surveys. Knowledge of compiling data and creating reports may also be necessary, as this is
not included in the software package.
Availability:
The SSIS can be purchased from Pearson at www.pearsonassessments.com. The cost of the
SSIS Manual is $103.00 and a package of 25 forms is $42.60. The computer-assisted
software ranges from approximately $500 to $1,000, depending on the package.
39 | P a g e
Washington State Healthy Youth Survey
From the Washington State Department of Health
Overview:
The Washington State Healthy Youth Survey (HYS) assesses health risk behaviors that
contribute to morbidity, mortality, and social problems among youth in Washington State.
These behaviors include alcohol, tobacco, and other drug use; behaviors that result in
unintentional and intentional injuries (e.g., violence); dietary behaviors and physical
activity; and related risk and protective factors (see http://www.doh.wa.gov/
healthyyouth).
The survey produces estimates of the prevalence of major adolescent health risk behaviors
and provides crucial information to school officials, health professionals, human service
agencies, policymakers, and parents as they work together to ensure the optimum health of
young people across the state. In addition, the survey results also provide important needs
assessment data for program planning and offer insight into the effectiveness of statewide
prevention and health promotion initiatives designed to reach a range of education and
health-related goals at the federal and state levels.
The HYS is a collaborative effort of the Office of the Superintendent of Public Instruction,
the Department of Health, the Department of Social and Health Service's Division of
Behavioral Health and Recovery, the Department of Commerce, and the Liquor Control
Board.
The Washington State Healthy Youth Survey is available for schools and districts in
Washington State. Many other districts and states offer their own state surveys, including
The Illinois Youth Survey in Illinois; The Climate and Connectedness Survey in Anchorage,
Alaska; and the California Healthy Kids Survey in California.
Program Target Age:
The Healthy Youth Survey is conducted in Grades 6, 8, 10, and 12. It is highly
recommended that analysis be limited to a single grade. However there are situations in
which combining grades maybe desirable, for example when comparing to the high school
estimates from the Youth Risk Behavior Surveillance system, or if there are very small
numbers that cannot be reported.
Constructs Measured:
School Climate
40 | P a g e
Alcohol, Tobacco, and Other Drugs
Family Risk and Protective Factors
Demographics
Health
Quality of Life
Community Risk and Protective Factors
Peer and Individual Risk and Protective Factors
School Risk and Protective Factors
Structure:
The questionnaire items were derived primarily from four established surveys that have
been used throughout the United States—some for more than 25 years. Each of these
surveys has been subjected to scientific research regarding reliability and validity and has
been field tested extensively.
Communities That Care (Developed by the Social Development Research Group,
University of Washington)
Global Youth Tobacco Survey (Developed by the Centers for Disease Control and
Prevention)
Monitoring the Future (Developed by the Institute for Social Research, University of
Michigan)
Youth Risk Behavior Survey (Developed by the Centers for Disease Control and
Prevention)
The survey is given to 8th-, 10th-, and 12th-grade youth as a two-form “interleaved”
administration. To manage the length of the survey with the breadth of information
desired by agencies and stakeholders, there is a “form A” and a “form B” for the survey.
Alternately seated students receive “form A” and “form B,” but it is not obvious to youth
sitting next to each other that they have different versions. All youth have the same “core”
questions in their surveys. Youth who complete “form A” go on to answer additional
questions about risk/protective factors while youth who complete “form B” answer
additional questions about health risks and outcomes.
The 6th-grade survey is a single version with fewer questions. Questions are consistent
with the longer form A and form B questionnaires. These differences are because 6th-grade
youth do not have reading skills to complete a longer survey, because some questions
applicable to older youth are not appropriate for younger youth, and because there are
more small buildings for 6th graders than for older grades where giving results would be
impacted by having only half the youth take a particular version.

41 | P a g e
Note: Each form of the survey includes a perforated, optional tear-off page of relatively
sensitive questions that schools can remove prior to the survey administration if they
prefer not to present those questions to the students.
The RMC Research Corporation assists with the generation of reports and program
evaluation.
See Figure 6 for a sample of the Healthy Youth Survey.
Technical Properties:
The Washington State Department of Health does not report the technical properties of the
HYS. The HYS is not a single scale and so an overall test such as Cronbach's alpha would
not be meaningful. However, the HYS only uses items from established surveys such as the
CTC Youth Survey (pg X) and the Centers for Disease Control and Prevention's Youth Risk
Behavior Survey (YRBS), for which most of the items for which reliability and validity have
been assessed have shown moderate to high reliability/validity.
Technical Support:
The survey is conducted by the Washington State Department of Health in conjunction with
RMC Research Corporations. RMC specializes in research and evaluation to improve
education and other human service systems.
Training will soon be available and will be conducted online. To complete the training,
Survey Coordinators will review a Coordinator Training Presentation PowerPoint, Tips for
Training Survey Administrators, and review the administration instructions. After
reviewing all the materials, the Survey Coordinator will complete and submit the short quiz
that asks important questions about the HYS administration.
For more information, contact Kevin Beck at the Washington State Department of Health at
360-236-3492 or email him at [email protected].
To contact RMC Research Corporation, call 503-223-3492.
Strengths:
The Healthy Youth Survey produces estimates of the prevalence of major adolescent health
risk behaviors and provides crucial information to school officials, health professionals,
human service agencies, policymakers, and parents as they work together to ensure the
optimum health of young people across the state. The survey results are then calculated to
estimate the current status of these health risk behaviors and examine trends in the
behaviors over the past 20 years.

42 | P a g e
The survey results also provide important needs assessment data for program planning
and offer insight into the effectiveness of statewide prevention and health promotion
initiatives designed to reach a range of education and health-related goals at the state and
federal levels.
Weaknesses:
Even though the HYS is composed of reliable and valid questions from other well-known
surveys, there is limited psychometric data on the HYS.
Availability:
The Healthy Youth Survey is available to the public for free; however, there may be costs if
services from RMC Research Corporation or other research contractors are needed.
*Information was reviewed by the Washington State Department of Health

43 | P a g e
Table 1. Summary of Recommended Measures
Purpose Constructs
ASEBA System: Child Behavior Checklist, Youth Self-Report, Teacher Report Form
Assesses adaptive and maladaptive functioning of children and adolescents. It is a multi-modal assessment that measures the child’s behaviors from three perspectives: the child, teacher, and parent/guardian.
Syndrome Scales Anxious/Depressed Withdrawn/Depressed Somatic Complaints Social Problems Thought Problems Attention Problems Rule-Breaking Behavior Aggressive Behavior
Diagnostic Scales Affective Problems Anxiety Problems Somatic Problems Attention Deficit/
Hyperactivity Problems Oppositional Defiant
Problems Conduct Problems
Behavioral and Emotional Rating Scale: Second Edition (BERS-2)
Measures the personal strengths and competencies of children and adolescents in five areas. It is a multi-modal assessment that measures the child’s behaviors from three perspectives: the child, teacher, and parent/guardian.
Interpersonal Strength Involvement with Family Intrapersonal Strength School Functioning Affective Strength
44 | P a g e
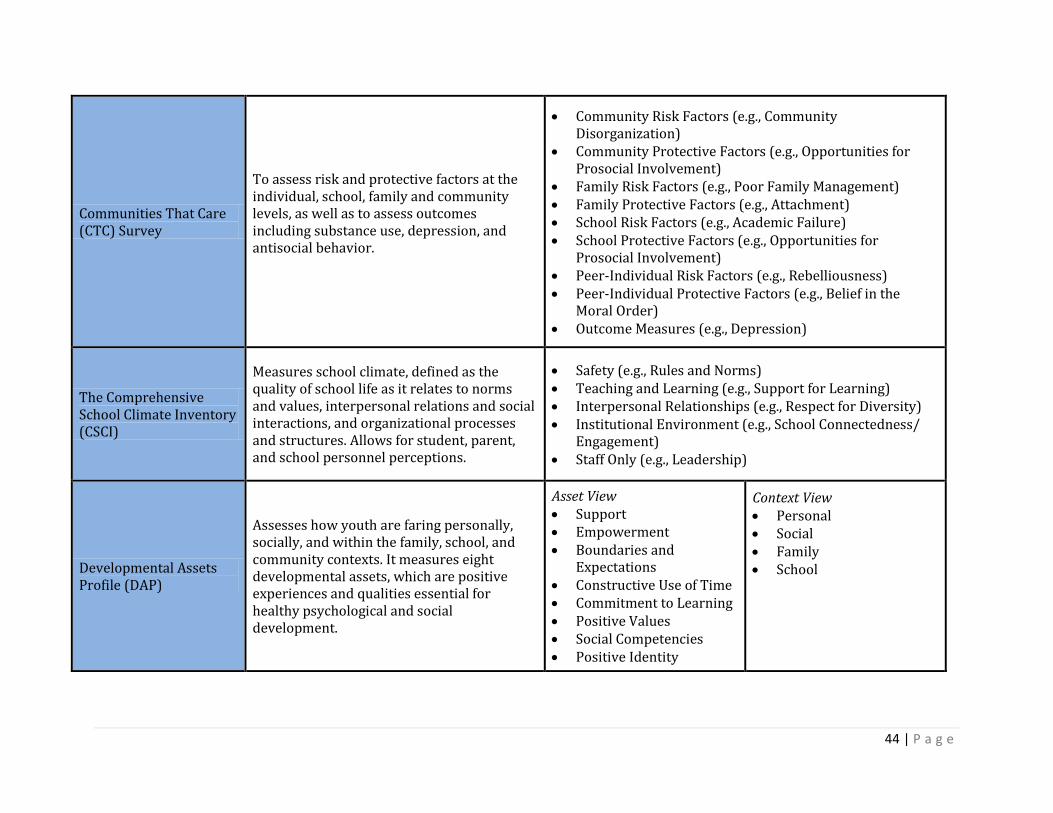
Communities That Care (CTC) Survey
To assess risk and protective factors at the individual, school, family and community levels, as well as to assess outcomes including substance use, depression, and antisocial behavior.
Community Risk Factors (e.g., Community Disorganization)
Community Protective Factors (e.g., Opportunities for Prosocial Involvement)
Family Risk Factors (e.g., Poor Family Management) Family Protective Factors (e.g., Attachment) School Risk Factors (e.g., Academic Failure) School Protective Factors (e.g., Opportunities for
Prosocial Involvement) Peer-Individual Risk Factors (e.g., Rebelliousness) Peer-Individual Protective Factors (e.g., Belief in the
Moral Order) Outcome Measures (e.g., Depression)
The Comprehensive School Climate Inventory (CSCI)
Measures school climate, defined as the quality of school life as it relates to norms and values, interpersonal relations and social interactions, and organizational processes and structures. Allows for student, parent, and school personnel perceptions.
Safety (e.g., Rules and Norms) Teaching and Learning (e.g., Support for Learning) Interpersonal Relationships (e.g., Respect for Diversity) Institutional Environment (e.g., School Connectedness/
Engagement) Staff Only (e.g., Leadership)
Developmental Assets Profile (DAP)
Assesses how youth are faring personally, socially, and within the family, school, and community contexts. It measures eight developmental assets, which are positive experiences and qualities essential for healthy psychological and social development.
Asset View Support Empowerment Boundaries and
Expectations Constructive Use of Time Commitment to Learning Positive Values Social Competencies Positive Identity
Context View Personal Social Family School

45 | P a g e
Devereux Student Strengths Assessment (DESSA)
Assesses social-emotional competencies that serve as protective factors. The assessment is entirely strength-based and does not assess risk factors or maladaptive behaviors.
Self-Awareness Social Awareness Self-Management Goal-Directed Behavior Relationship Skills Personal Responsibility Decision Making Optimistic Thinking
School Social Behaviors Scale, Second Edition (SSBS-2)
A behavior rating scale designed to identify possible at-risk students, help determine student eligibility for intervention, and measure the effectiveness of interventions over time.
Social Competence (Peer Relations, Self-Management/Compliance, and Academic Behavior)
Antisocial Behavior (Hostile/Irritable, Antisocial/Aggressive, and Defiant/Disruptive)
Social Skills Improvement System Rating Scales (SSIS-Rating Scale)
Enables targeted assessment of individuals and small groups to help evaluate social skills, problem behaviors, and academic competence.
Social Skills (e.g., Empathy) Problem Behaviors (e.g., Bullying) Academic Competence (e.g., Motivation to Learn)
Washington State Healthy Youth Survey (HYS)
Measures health risk behaviors that contribute to morbidity, mortality, and social problems among youth. The results are used to monitor the health status of adolescents and track progress on state and federal education and health-related goals.
School Climate Alcohol, Tobacco, and Other Drugs Family Risk and Protective Factors Demographics Health Quality of Life Community Risk and Protective Factors Peer and Individual Risk and Protective Factors School Risk and Protective Factors
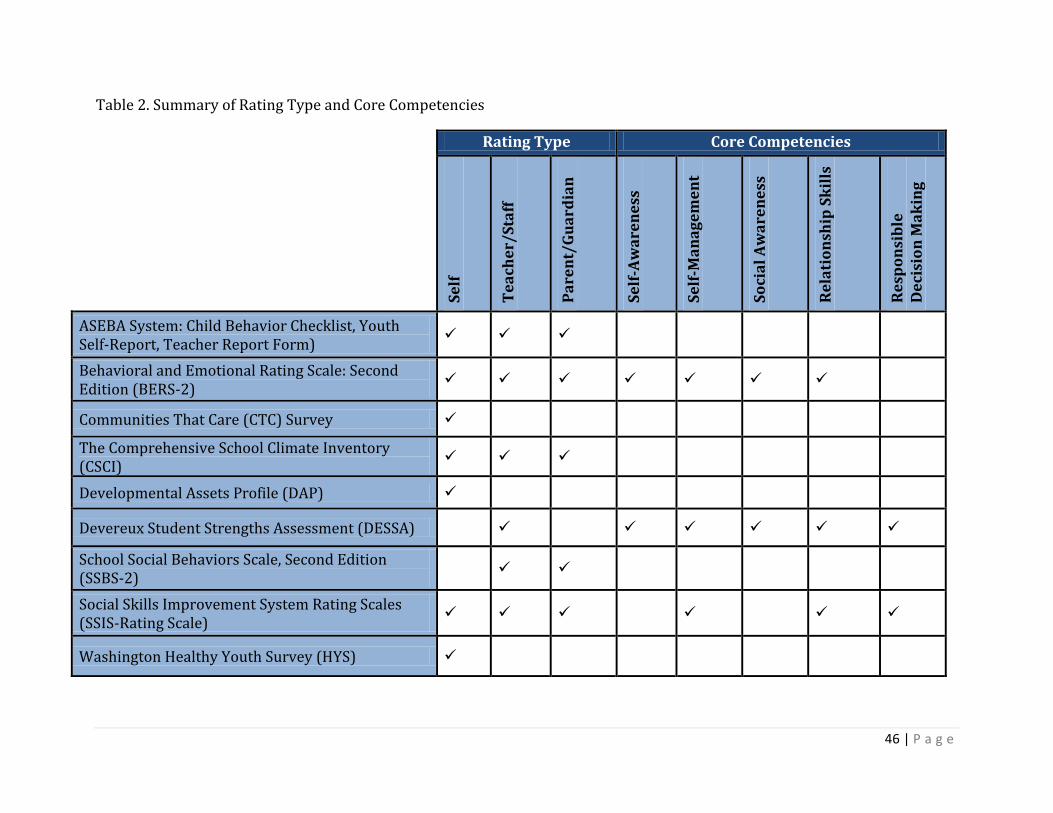
46 | P a g e
Table 2. Summary of Rating Type and Core Competencies
Rating Type Core Competencies
Se
lf
Te
ach
er/
Sta
ff
Pa
ren
t/G
ua
rdia
n
Se
lf-A
wa
ren
ess
Se
lf-M
an
ag
em
en
t
So
cia
l A
wa
ren
ess
Re
lati
on
ship
Sk
ills
Re
spo
nsi
ble
D
eci
sio
n M
ak
ing
ASEBA System: Child Behavior Checklist, Youth Self-Report, Teacher Report Form)
Behavioral and Emotional Rating Scale: Second Edition (BERS-2)
Communities That Care (CTC) Survey
The Comprehensive School Climate Inventory (CSCI)
Developmental Assets Profile (DAP)
Devereux Student Strengths Assessment (DESSA)
School Social Behaviors Scale, Second Edition (SSBS-2)
Social Skills Improvement System Rating Scales (SSIS-Rating Scale)
Washington Healthy Youth Survey (HYS)
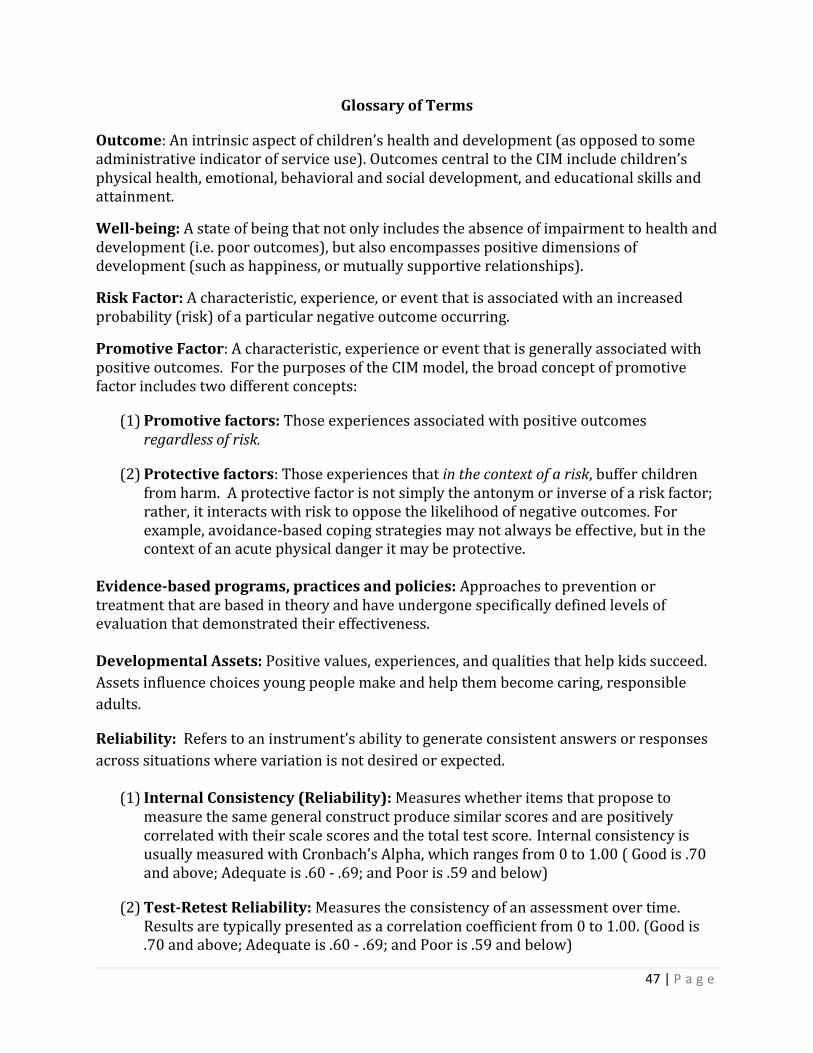
47 | P a g e
Glossary of Terms
Outcome: An intrinsic aspect of children’s health and development (as opposed to some administrative indicator of service use). Outcomes central to the CIM include children’s physical health, emotional, behavioral and social development, and educational skills and attainment.
Well-being: A state of being that not only includes the absence of impairment to health and development (i.e. poor outcomes), but also encompasses positive dimensions of development (such as happiness, or mutually supportive relationships).
Risk Factor: A characteristic, experience, or event that is associated with an increased probability (risk) of a particular negative outcome occurring.
Promotive Factor: A characteristic, experience or event that is generally associated with positive outcomes. For the purposes of the CIM model, the broad concept of promotive factor includes two different concepts:
(1) Promotive factors: Those experiences associated with positive outcomes regardless of risk.
(2) Protective factors: Those experiences that in the context of a risk, buffer children from harm. A protective factor is not simply the antonym or inverse of a risk factor; rather, it interacts with risk to oppose the likelihood of negative outcomes. For example, avoidance-based coping strategies may not always be effective, but in the context of an acute physical danger it may be protective.
Evidence-based programs, practices and policies: Approaches to prevention or treatment that are based in theory and have undergone specifically defined levels of evaluation that demonstrated their effectiveness.
Developmental Assets: Positive values, experiences, and qualities that help kids succeed.
Assets influence choices young people make and help them become caring, responsible
adults.
Reliability: Refers to an instrument’s ability to generate consistent answers or responses
across situations where variation is not desired or expected.
(1) Internal Consistency (Reliability): Measures whether items that propose to measure the same general construct produce similar scores and are positively correlated with their scale scores and the total test score. Internal consistency is usually measured with Cronbach’s Alpha, which ranges from 0 to 1.00 ( Good is .70 and above; Adequate is .60 - .69; and Poor is .59 and below)
(2) Test-Retest Reliability: Measures the consistency of an assessment over time. Results are typically presented as a correlation coefficient from 0 to 1.00. (Good is .70 and above; Adequate is .60 - .69; and Poor is .59 and below)

48 | P a g e
Validity: Is the extent to which an assessment measures what it is intended to measure (American Educational Research Association, 1999).
(3) Criterion-Related Validity: Degree to which a measure is related in expected ways to some type of criterion or outcome, measured either at the same time (concurrent validity) or a later time (predictive validity).
(4) Convergent and/or Discriminant Validity: Convergent validity is the degree to which scores on a measure are associated positively with scores on measures of the same or highly similar constructs; discriminant validity is the degree to which scores on a measure are not associated at unexpectedly high levels with scores on measures of distinct constructs.
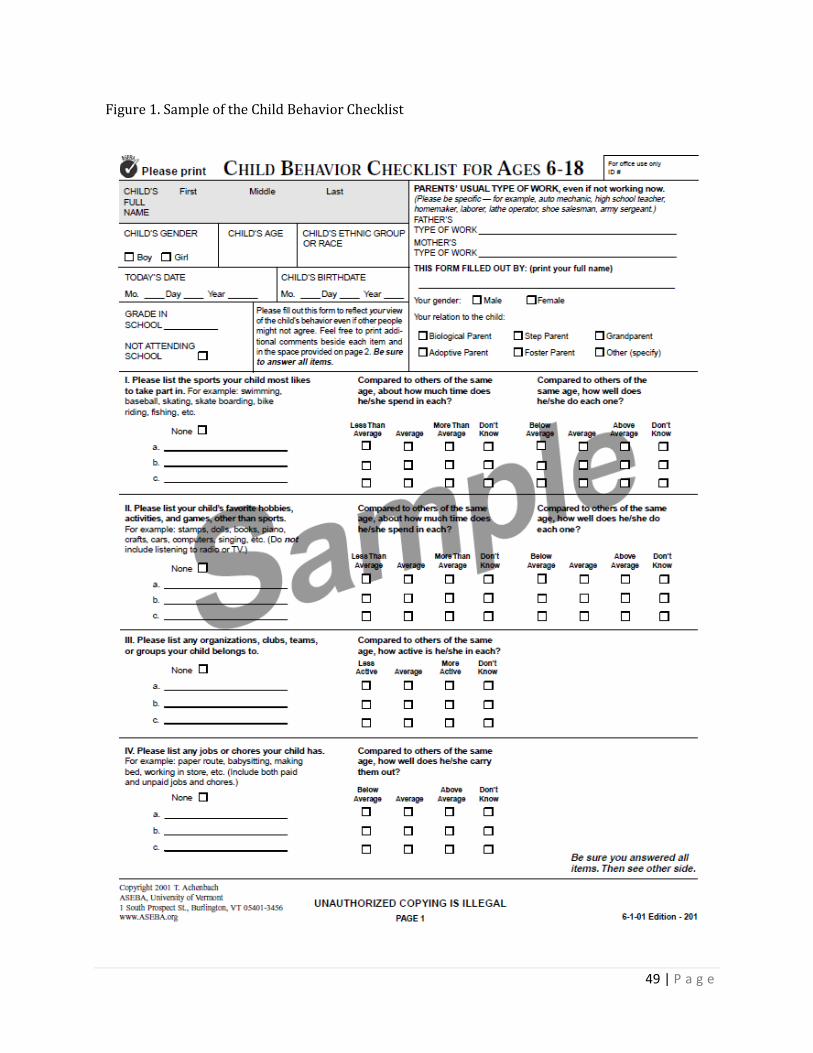
49 | P a g e
Figure 1. Sample of the Child Behavior Checklist
Figure 1. Sample of the Child Behavior Checklist
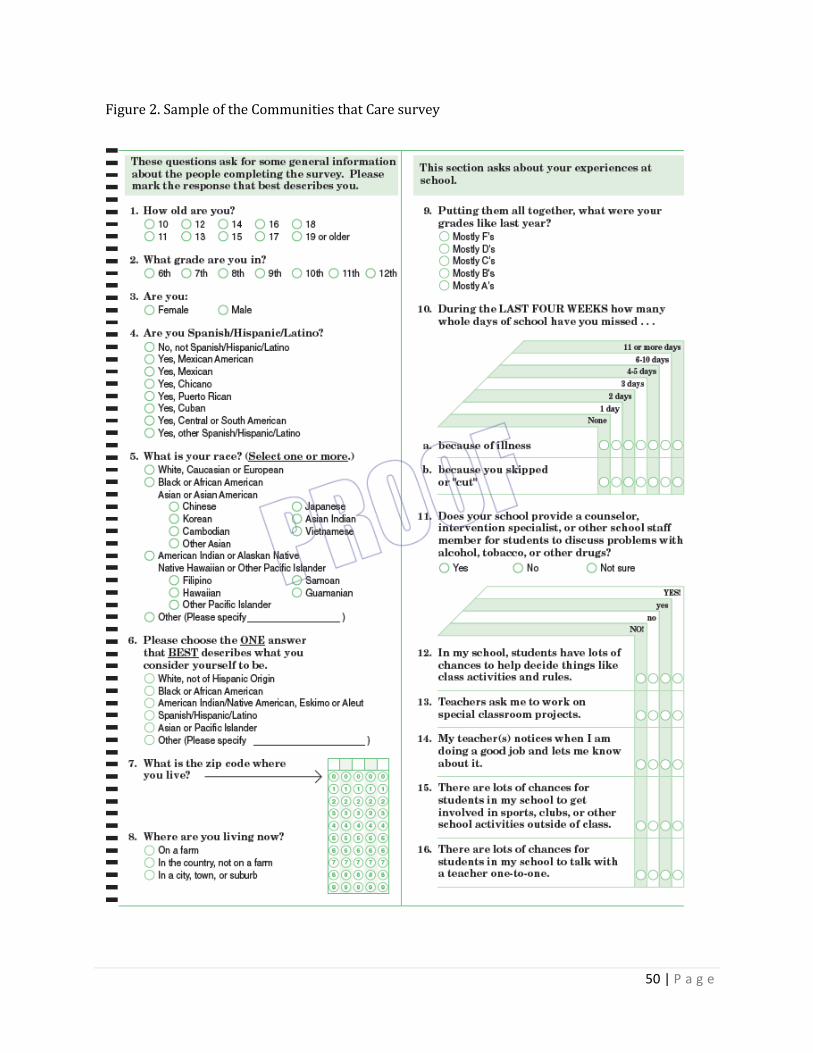
50 | P a g e
Figure 2. Sample of the Communities that Care survey

51 | P a g e
Figure 3. Sample of the Comprehensive School Climate Inventory
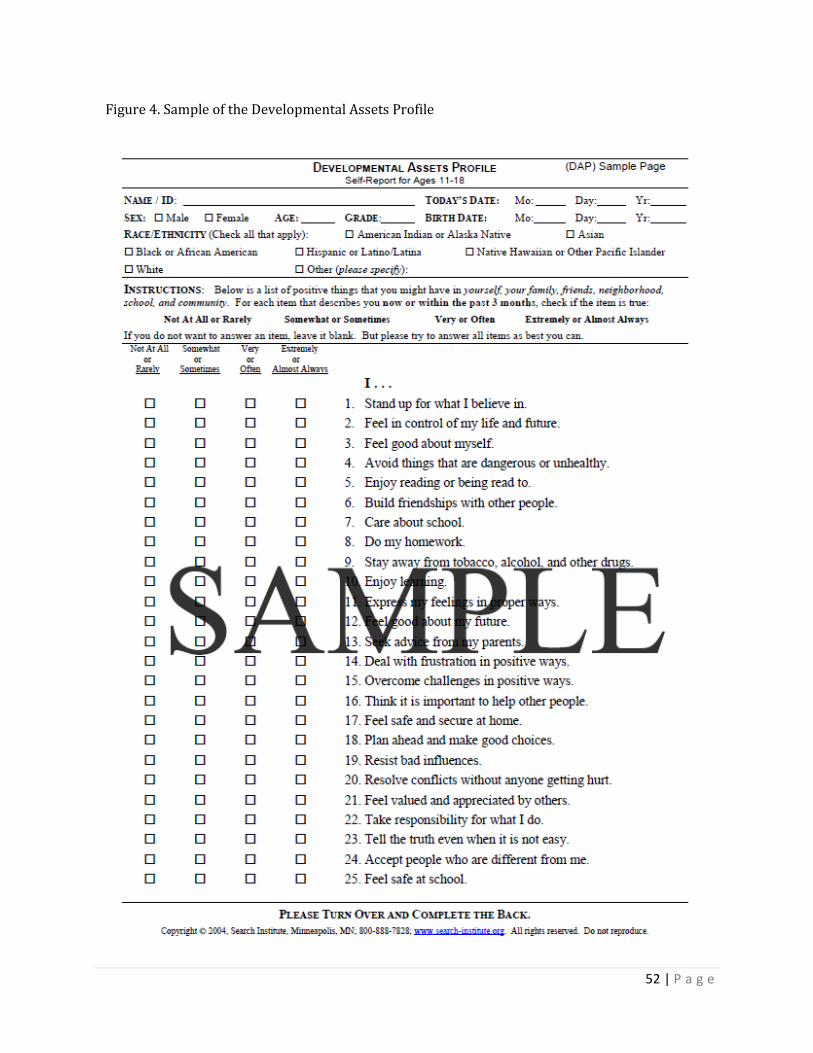
52 | P a g e
Figure 4. Sample of the Developmental Assets Profile
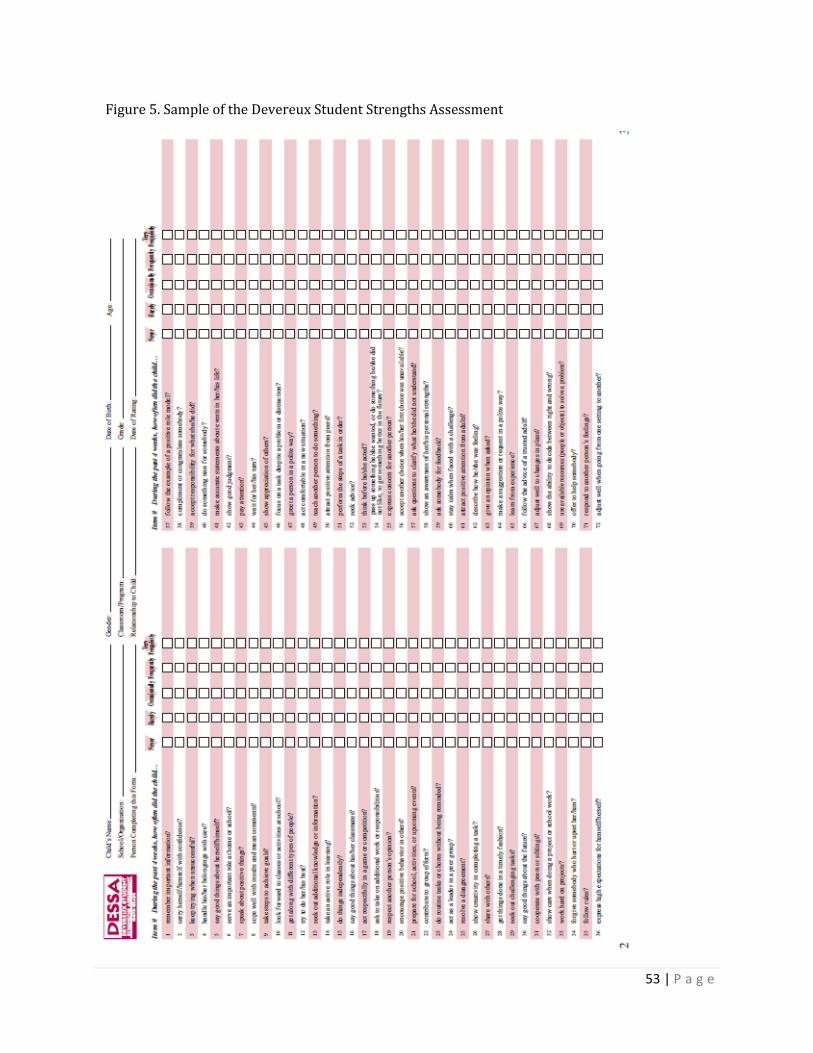
53 | P a g e
Figure 5. Sample of the Devereux Student Strengths Assessment
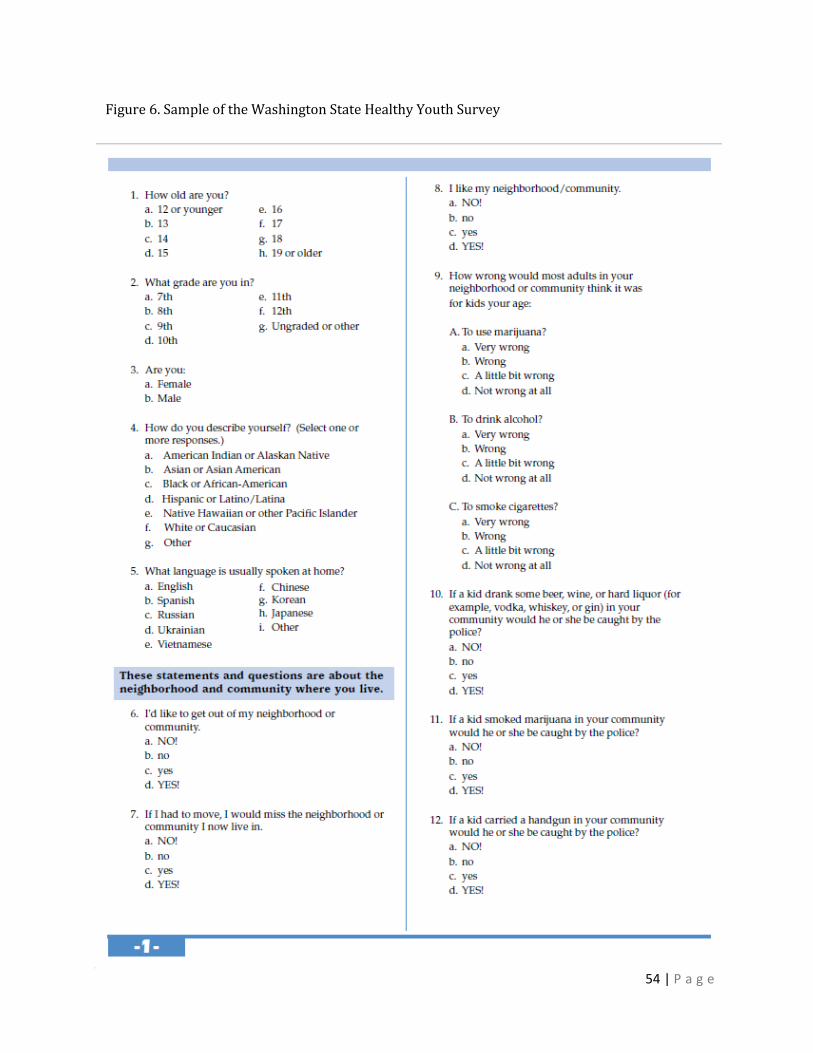
54 | P a g e
Figure 6. Sample of the Washington State Healthy Youth Survey

55 | P a g e
References
Achenbach, T. M., & Rescorla, L. A. (2001). Manual for the ASEBA School-Age Forms &
Profiles. Burlington, VT: University of Vermont, Research Center for Children, Youth,
and Families.
Arthur, M. W., Hawkins, J. D., Pollard, J. A., Catalano, R. F., & Baglioni, A. J. (2002). Measuring
risk and protective factors for substance use, delinquency, and other adolescent
problem behaviors: The Communities That Care Youth Survey. Evaluation Review,
26, 575-601.
Arthur, M. W., Briney, J. S., Hawkins, J. D., Abbott, R. D., Brooke-Weiss, B. L., Catalano, R. F.
(2007). Measuring risk and protection in communities using the Communities That
Care Youth Survey. Evaluation and Program Planning, 30, 197-211.
Cohen, J., Geier, V. K. (2010). School Climate Research Summary: January 2010. New York,
NY.
Epstein, M. H., Mooney, P., Ryser, G., & Pierce, C. D. (2004). Validity and reliability of the
Behavior and Emotional Rating Scale (2nd Edition): Youth Rating Scale. Research on
Social Work Practice, 14, 358-367.
Epstein, M. H., Nordness, P. D., Nelson, J. R., & Hertzog, M. (2002). Convergent validity of the
Behavioral and Emotional Rating Scale with primary grade-level students. Topics in
Early Childhood Special Education, 22, 114-121.
Epstein, M. H., Ryser, G., & Pearson, N. (2002). Standardization of the Behavioral and
Emotional Rating Scale: Factor structure, reliability and criterion validity. Journal of
Behavioral Health Services and Research, 29, 208-216.
56 | P a g e
Epstein, M. H., & Sharma, H. M. (1998). Behavioral and Emotional Rating Scale: A strength
based approach to assessment. Austin,TX: PRO-ED.
Emerson, E. N., Crowley, S. L., & Merrell, K. W. (1994). Convergent validity of the School
Social Behavior Scales with the Child Behavior Checklist and Teacher's Report Form.
Journal of Psychoeducational Assessment, 12, 372-380.
Glaser, R. R., Van Horn, M. L., Arthur, M. W., Hawkins, J. D., & Catalano, R. F. (2005).
Measurement properties of the Communities That Care® Youth Survey across
demographic groups. Journal of Quantitative Criminology, 21, 73-102.
Greenberg, M. T., Weissberg, R. P., O’Brien, M. U., Zins, J. E., Fredericks, L., Resnik, H., & Elias,
M. J. (2003). Enhancing school-based prevention and youth development through
coordinated social, emotional, and academic learning. American Psychologist, 58,
466-474.
Gresham, M. & Elliott, S. N. (2008). Rating Scales Manual. SSIS Social Skills Improvement
System. Minneapolis, Pearson.
Hawkins, J. D., Catalano, R. F., Miller, J. Y. (1992). Risk and protective factors for alcohol and
other drug problems in adolescence and early adulthood: Implications for
substance-abuse prevention. Psychological Bulletin, 112, 64-105.
Hawkins, J. D., Kosterman, R., Catalano, R. F., Hill, K. G., & Abbott, R. D. (2005). Promoting
positive adult functioning through social development interventions in childhood:
Long-term effects from the Seattle Social Development Project. Archives of Pediatrics
and Adolescent Medicine, 159, 25-31.

57 | P a g e
Harniss, M. H., Epstein, M. H., Ryser, G., & Pearson, N. (1999). The Behavioral and Emotional
Rating Scale: Convergent validity. Journal of Psychological Assessment, 17, 4-14.
Kerr, D., Ireland, E., Lopes, J., Craig, R., & Cleaver, E. (2004). Citizenship education
longitudinal study: Second annual report: First longitudinal study. National
Foundation for Educational Research, 1-154.
Kuperminc G., Leadbeater B. J., Emmons C., Blatt, S. J. (1997). Perceived school climate and
difficulties in the social adjustment of middle school students. Applied
Developmental Science, 1, 76-88.
Malecki, C. M., & Demaray, M. K. (2002). Measuring perceived social support: Development
of the child and adolescent social support scale (CASSS). Psychology in the Schools,
39, 1-18.
Merrell, K. W. (1993). Using behavior rating scales to assess social skills and antisocial
behavior in school settings: Development of the school social behavior scales. School
Psychology Review, 22, 115-133.
National School Climate Council. (2007). The School Climate Challenge: Narrowing the gap
between school climate research and school climate policy, practice guidelines and
teacher education policy. On www.schoolclimate.org/climate/policy.php.
Nickerson, A. B., & Fishman, C. (2009). Convergent and divergent validity of the Devereux
Student Strengths Assessment. School Psychology Quarterly, 24, 48-59.
Payton, J., Weissberg, R. P., Durlak, J. A., Dymnicki, A. B., Taylor, R. D., Schellinger, K. B., &
Pachan, M. (2008). The positive impact of social and emotional learning for
kindergarten to eighth-grade students: Findings from three scientific reviews. Chicago,
IL: Collaborative for Academic, Social, and Emotional Learning.

58 | P a g e
The Collaborative for Search Institute. (2005). Developmental assets profile user manual.
Minneapolis, MN: Search Institute.

59 | P a g e

60 | P a g e

61 | P a g e

62 | P a g e

63 | P a g e

64 | P a g e
Figure 3. Sample of the Communities that Care survey