social economic developments in rural europe arie oskam (professor emeritus agricultural economics...
TRANSCRIPT
Social economic developments in rural Europe
Arie Oskam (Professor Emeritus Agricultural Economics and Rural Policy, Wageningen University)
European Heritage Heads Forum, Amsterdam, 26 May 2011

Outline
What’s rural? Social economic developments Policies Conclusions

What’s rural?
Characteristics Large distance between activities Limited infrastructure Under use infrastructure Plenty of living space Selective number of activities
Conceptual approaches1. Geographical concept (region): ‘demographic rurality’2. Social representation: ‘social rurality’
Economists/’practical people’ prefer option 1

RuralityMost ruralIntermediate ruralMost urban Classification
of Regions
(2004)
Source: Eurostat; Adaptation LEI
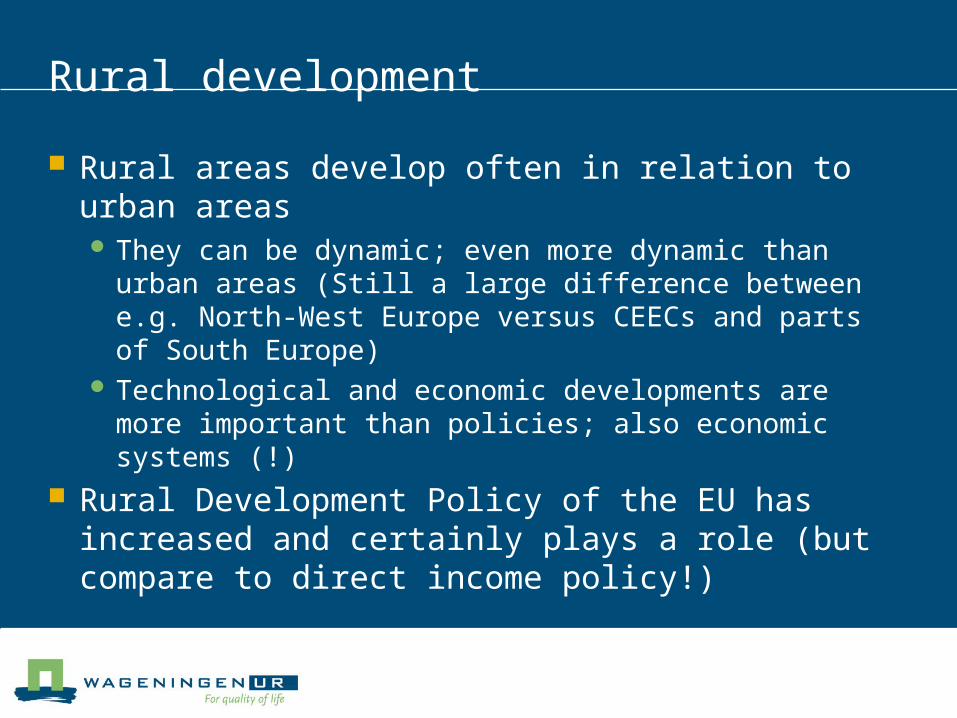
Rural development
Rural areas develop often in relation to urban areas They can be dynamic; even more dynamic than
urban areas (Still a large difference between e.g. North-West Europe versus CEECs and parts of South Europe)
Technological and economic developments are more important than policies; also economic systems (!)
Rural Development Policy of the EU has increased and certainly plays a role (but compare to direct income policy!)
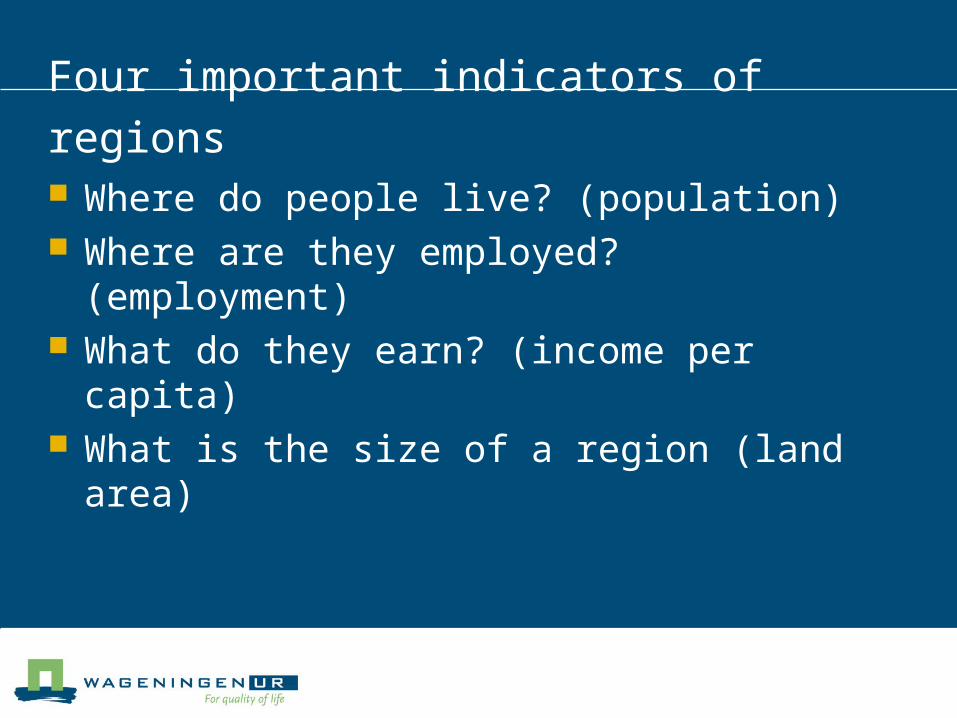
Four important indicators of regions
Where do people live? (population) Where are they employed? (employment) What do they earn? (income per capita) What is the size of a region (land area)
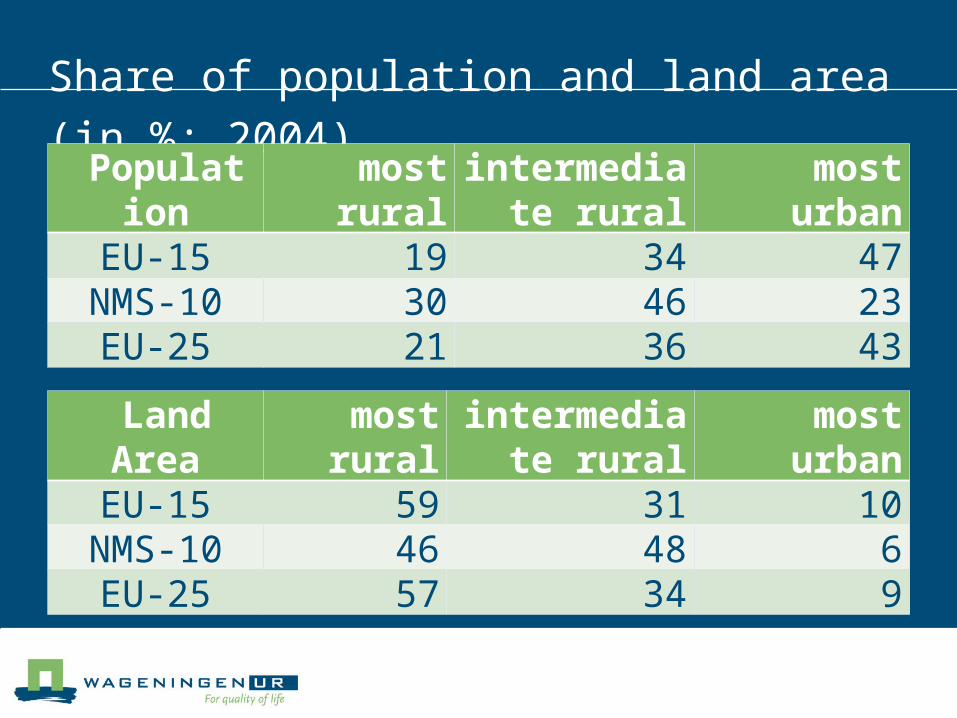
Share of population and land area (in %; 2004) Population most
ruralintermediate
ruralmost urban
EU-15 19 34 47NMS-10 30 46 23EU-25 21 36 43
Land Area mostrural
intermediate rural
most urban
EU-15 59 31 10NMS-10 46 48 6EU-25 57 34 9
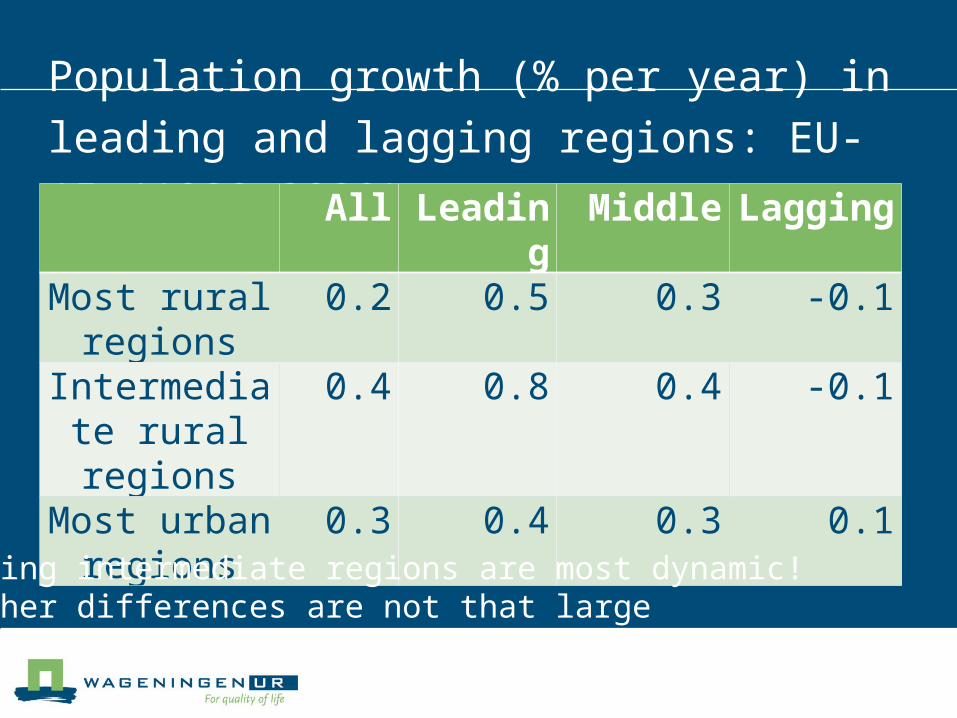
Population growth (% per year) in leading and lagging regions: EU-15 (1990-2000) All Leading Middle Lagging
Most rural regions
0.2 0.5 0.3 -0.1
Intermediate rural regions
0.4 0.8 0.4 -0.1
Most urban regions
0.3 0.4 0.3 0.1
Leading intermediate regions are most dynamic!Further differences are not that large
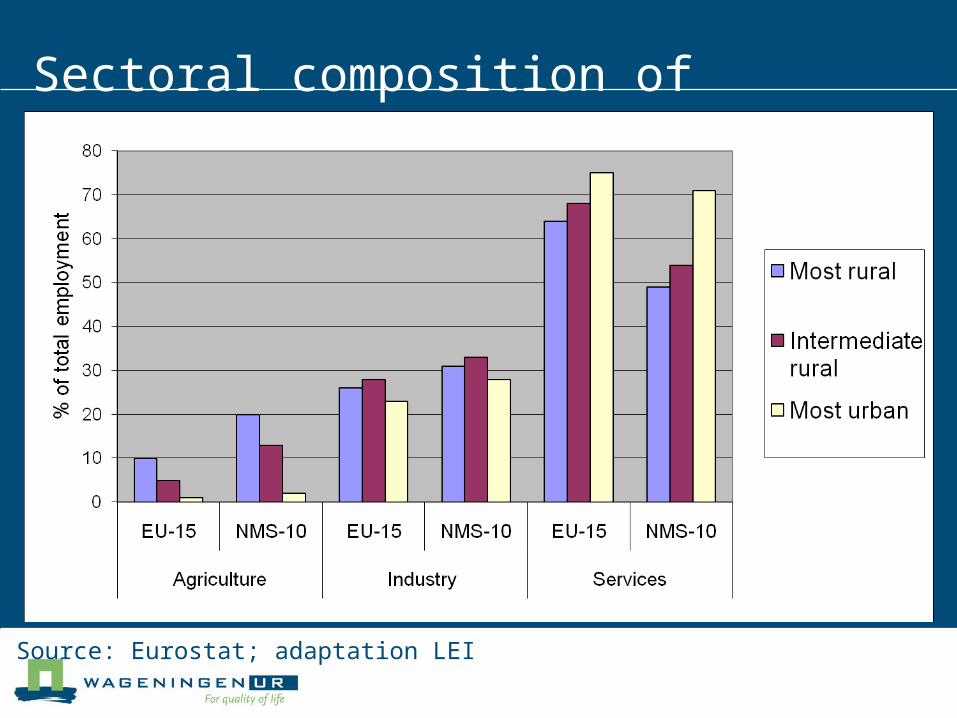
Sectoral composition of employment (2004)
Source: Eurostat; adaptation LEI
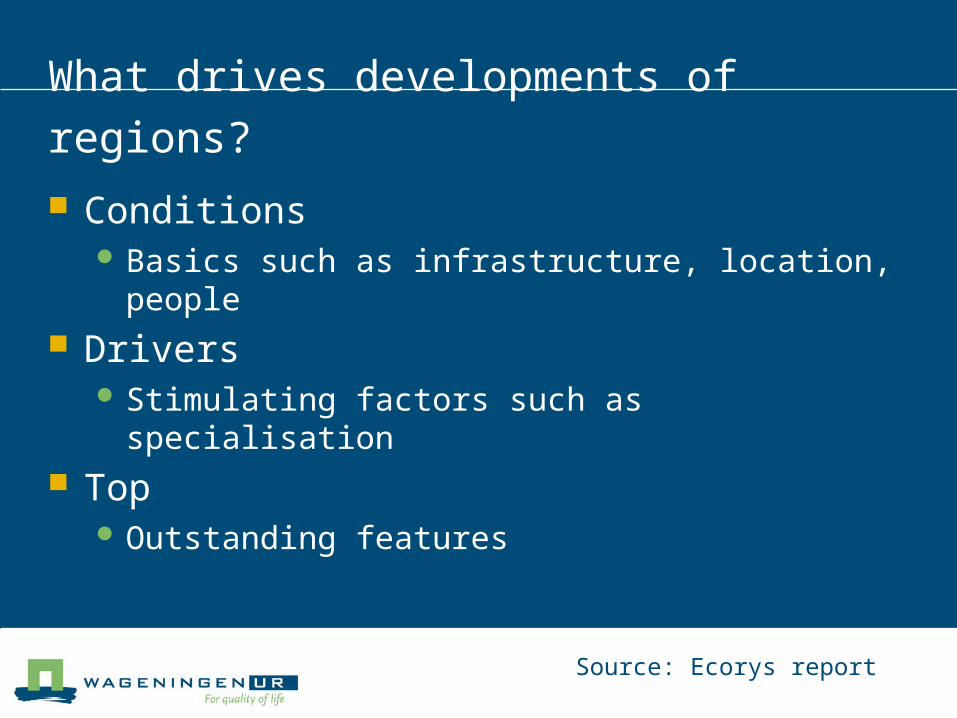
What drives developments of regions?
Conditions Basics such as infrastructure, location, people
Drivers Stimulating factors such as specialisation
Top Outstanding features
Source: Ecorys report
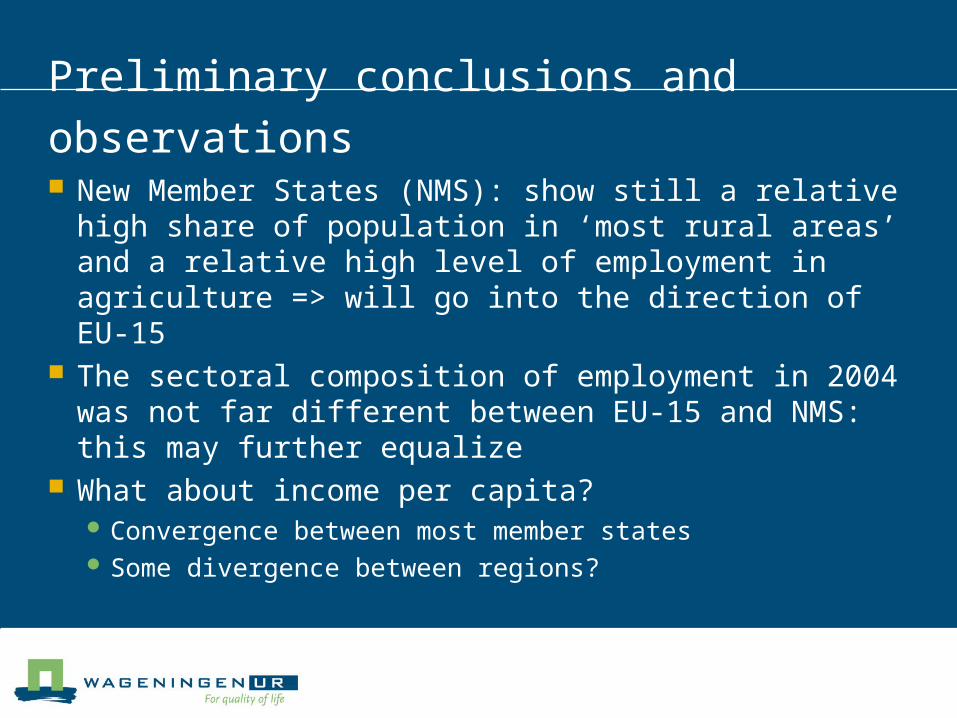
Preliminary conclusions and observations New Member States (NMS): show still a relative
high share of population in ‘most rural areas’ and a relative high level of employment in agriculture => will go into the direction of EU-15
The sectoral composition of employment in 2004 was not far different between EU-15 and NMS: this may further equalize
What about income per capita? Convergence between most member states Some divergence between regions?

What’s the influence of policies?
Agricultural Policy Presently mostly direct income support
Rural Development Policy Less Favoured Areas ‘Real’ RDP
Structural/Cohesion Policy

Let’s take a look at EU budget
Direct income payments >> Rural Development
Rural Development Policy (RDP)
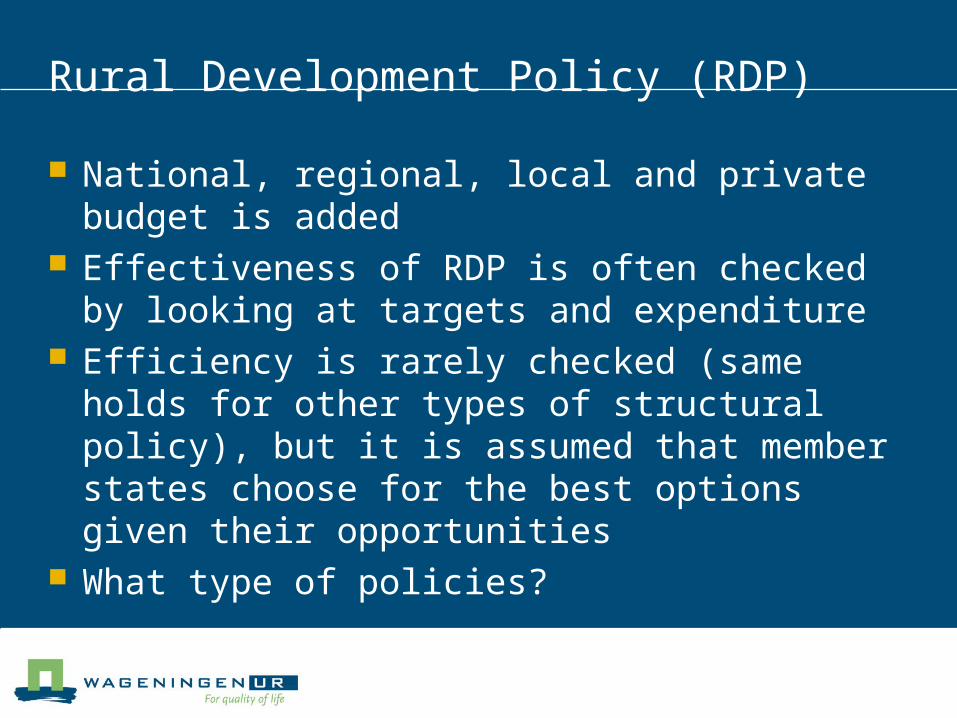
National, regional, local and private budget is added
Effectiveness of RDP is often checked by looking at targets and expenditure
Efficiency is rarely checked (same holds for other types of structural policy), but it is assumed that member states choose for the best options given their opportunities
What type of policies?
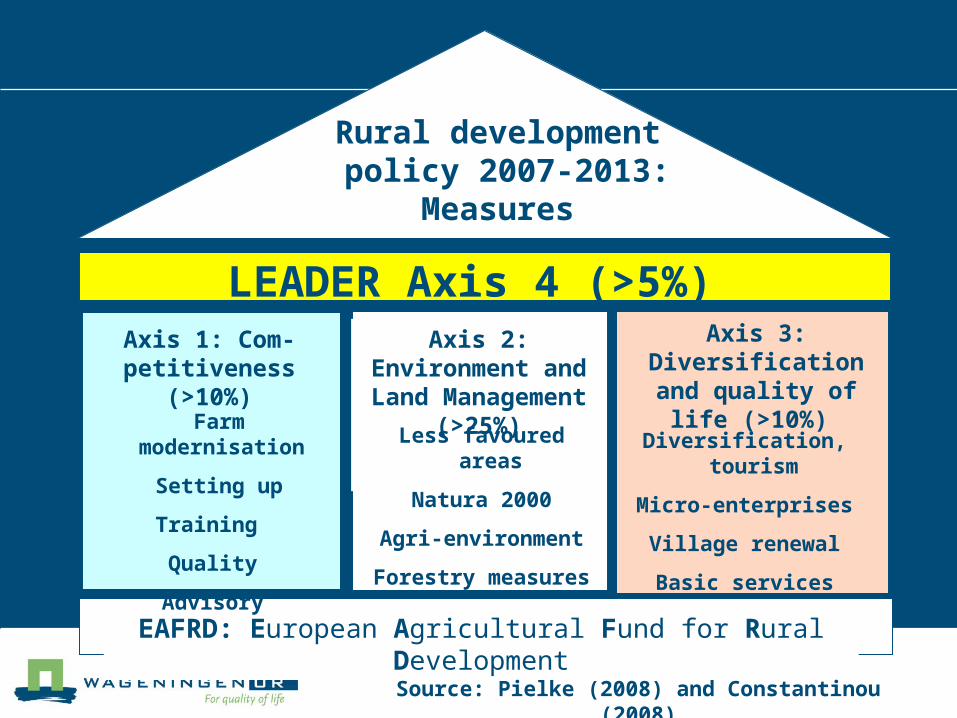
Rural development policy 2007-2013:
Measures
LEADER Axis 4 (>5%)Axis 1: Com-petitiveness
(>10%)
Axis 2: Environment and
Land Management
(>25%)
Axis 3: Diversification and quality of life (>10%)
EAFRD: European Agricultural Fund for Rural Development
Farm modernisation
Setting up
Training
Quality
Advisory
Less favoured areas
Natura 2000
Agri-environment
Forestry measures
Diversification, tourism
Micro-enterprises
Village renewal
Basic services
Source: Pielke (2008) and Constantinou (2008)
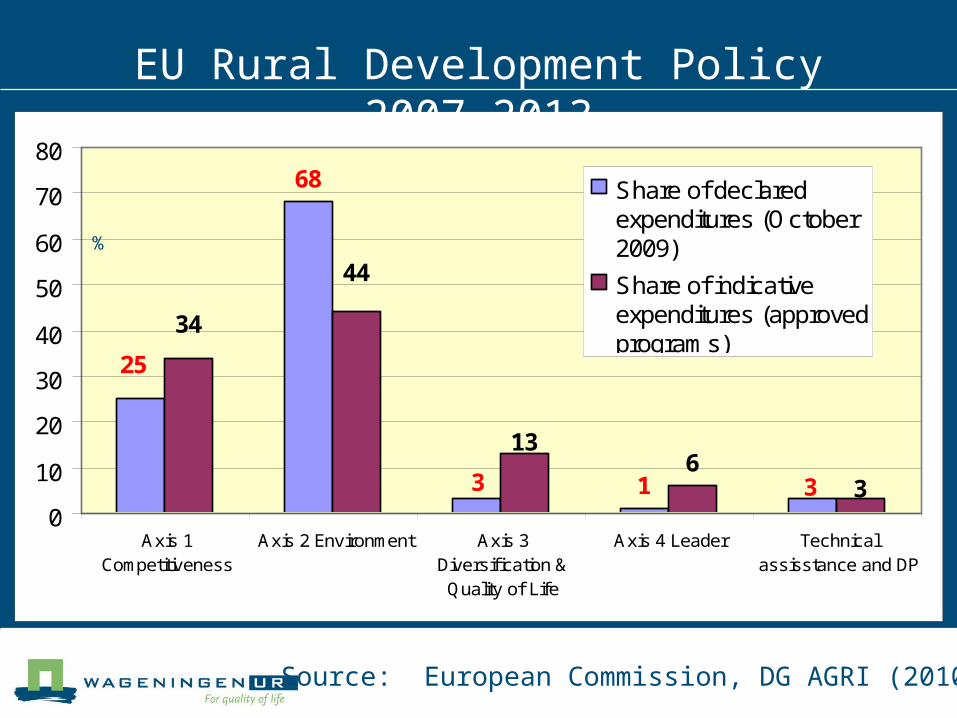
Comparison of EAFRD (EU- 27) expenditure distribution by axis: indicative (2007-13) versus declared (01/2007-
10/2009)
68
16
25
3 3
34
44
13
30
10
20
30
40
50
60
70
80
Axis 1Competitiveness
Axis 2 Environment Axis 3Diversif ication &Quality of Life
Axis 4 Leader Technicalassisstance and DP
Share of declaredexpenditures (October2009)
Share of indicativeexpenditures (approvedprograms)
%
EU Rural Development Policy 2007-2013
Source: European Commission, DG AGRI (2010)

Final remarks
Targeting policies: far ahead of actual expenditures Targeting gives both limits, but also freedom to
member states Local (‘grass roots’) initiatives are possible via
LEADER / Local Area Groups (LAGs) Rural heritage may fit into ‘Quality of life and
cultural capital’ (mainly in Axis 3 and 4) Both ‘driver’ and ‘barrier’ of economic development
It is not expected that the total Rural Development Budget will increase over the period 2014-2020

ThanksEmail: [email protected]: http://www.aep.wur.nl/UK/Staff/Oskam/ Book: http://www.wageningenacademic.com/eupolicy
© Wageningen UR
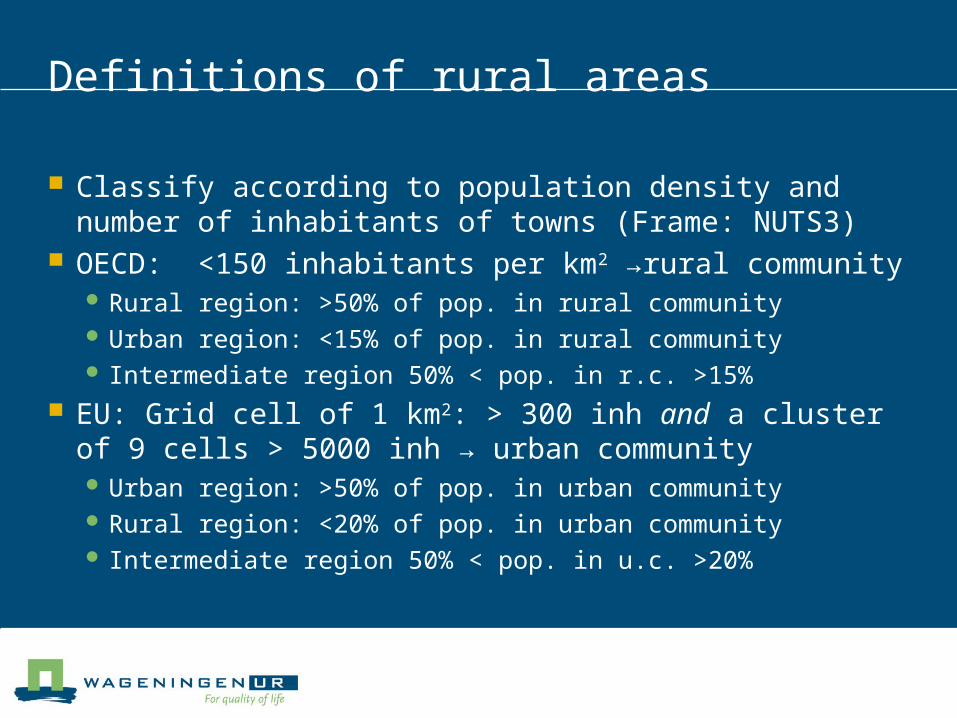
Definitions of rural areas
Classify according to population density and number of inhabitants of towns (Frame: NUTS3)
OECD: <150 inhabitants per km2 →rural community Rural region: >50% of pop. in rural community Urban region: <15% of pop. in rural community Intermediate region 50% < pop. in r.c. >15%
EU: Grid cell of 1 km2: > 300 inh and a cluster of 9 cells > 5000 inh → urban community Urban region: >50% of pop. in urban community Rural region: <20% of pop. in urban community Intermediate region 50% < pop. in u.c. >20%
Different approaches
Regional approach Takes particular areas as starting points (local,
regional) Within a regional approach:
• Looks at different activities (agriculture; industry; services), but also at ‘capital’, networks, etc.
Spatial approach Looks how different activities influence each
other because of distances (Von Thunen; Gravity, etc.)
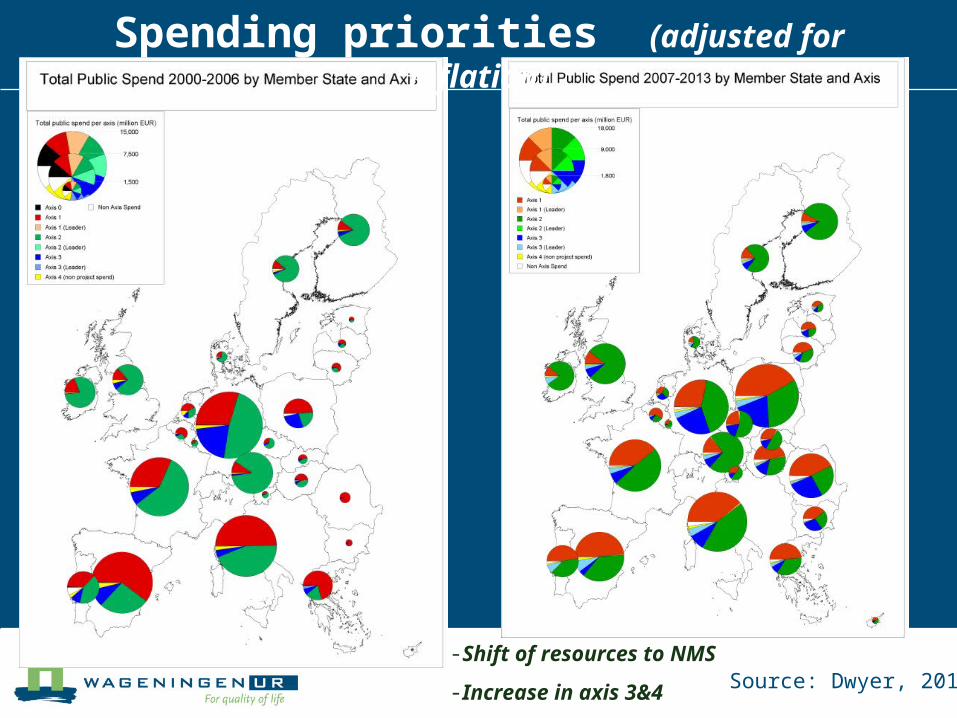
Spending priorities (adjusted for inflation)
-Shift of resources to NMS
-Increase in axis 3&4 Source: Dwyer, 2010
Slide with relevant links
Rural Development in the European Union - Statistical and Economic Information - Report 2010: http://ec.europa.eu/agriculture/agrista/rurdev2010/ruraldev.htm
Ecorys: Study on Employment, Growth and Innovation of Rural Areas (SEGIRA):http://ec.europa.eu/agriculture/analysis/external/employment/full-text_en.pdf
Definition of rural areas in the EU: http://epp.eurostat.ec.europa.eu/cache/ITY_OFFPUB/KS-HA-10-001-15/EN/KS-HA-10-001-15-EN.PDF