social capital in russia and denmark - gov · hjøllund, paldam & svendsen 2 social capital in...
TRANSCRIPT

Aarhus
9/7-2001
Social Capital in Russia and Denmark:
A comparative study
Lene HjøllundDepartment of Economics
The Aarhus School of Business
Fuglesangs Allé 20
8210 Aarhus V, Denmark
Martin PaldamDepartment of Economics
Aarhus University
8000 Aarhus C, Denmark
Gert Tinggaard SvendsenDepartment of Economics
The Aarhus School of Business
Fuglesangs Allé 20
8210 Aarhus V, Denmark
Abstract: Our main purpose in this paper is twofold: First, to compare the level of social capital in two
different political systems, namely the cases of a new and an old democracy Russia and Denmark.
Second, we will try to establish whether social capital matters for income generation and eventually
to economic growth. The two main results are: First, the level of beneficial social capital is roughly
three times higher in the old democracy than in the former communist dictatorship. Second, social
capital matters in the earnings equation. In both countries it explains roughly 2½% of income
differences, respectively, corresponding to 40% of what human capital explains in both countries.
JEL: A12, C71, D23, D70
Keywords: Social capital, capitalism, communism, principal component analysis, Russia.
*) This work is part of the book project Paldam, M. and Svendsen, G.T.: Trust, Social Capital and Economic
Growth: An International Comparison. Edward Elgar, Cheltenham, UK. Forthcoming 2003. We thank the
Rockwool Foundation which funds Martin Paldam’s part of the project and the Danish Social Science Research
Council and the Research Committee, Aarhus School of Business, for funding Gert Tinggaard Svendsen’s part
of the project.

Hjøllund, Paldam & Svendsen Social capital in Russia & Denmark2
1. In economic theory income of the household is the sum of the marginal products of the factors it supplies toproduction, but we only have measures of income at the moment. Thus, we estimate earnings functions only.
1. Introduction
Social capital is an old concept, but it is becoming increasingly popular, as a whole group of researchers
as J.S. Coleman, P. Bourdieu, R.D. Putnam, F. Fukuyama and others have provided new definitions that
suggest measurement, and have demonstrated that these measures can be used. Lately the World Bank
has added more approaches to measurement. We have surveyed the literature in Paldam & Svendsen
(2000a) and Paldam (2000) – to save space the reader is referred to these surveys.
Many definitions of social capital are still around, but most can be organized into three closely
related groups. Social capital is defined as either: (a) people’s ability to work together, (b) trust among
people, or (c) networks. The tree definitions are closely related: People, who trust each other form
networks and can work together. Some hopes have been raised by recent empirical research – especially
by the World Bank – that the two social capital dreams listed in Table 1 may be partially realistic.
Table 1. The two social capital dreams
D1 Social capital is a robust concept
D2 Social capital has considerable explanatory power
Robustness means that (most of) the different measures tap into the same latent variable. It would be
too good to be true if all measures would collapse to just one variable, but even if two or three are
found, one may dominate and constitute “social capital”, while the other(s) can be identified as
something else.
Economists want to explain production and income.1) They (we) hope that social capital can
help (us) to do that. Politologists want to explain civic participation and democracy, see Deth, Maraffi,
Newton & Whiteley (1999). We have taken advantage of their findings and include measures of civic
participation as a fourth group of social capital indicators. We consequently measure social capital by
a questionnaire that has items trying to catch each of the four groups of definitions (see 2.1). Then we
analyze the pattern in the answers to see whether one or a few dimensions can be extracted. Finally, we
try to explain income by the factors found, and other competing variables.
The data are collected in Russia and Denmark. The purpose in this paper is twofold: first, we
want to compare the level of social capital in two different political systems, namely that of former
communism (Russia) and that of capitalism (Denmark). In Paldam & Svendsen (2000b) we have
developed this theory of social capital destruction under dictatorship (see 2.2). Second, we want to
establish the importance of social capital to income. These ideas are tested empirically by using exactly
the same questionnaire in the two countries and comparing the answers.
The paper proceeds as follow: Section 2 looks at the four groups of social capital measures.
Section 3 (voluntary organizations and trust) and 4 (networks and civic action) compare the four social
capital measures for Russia and Denmark. Section 5 studies the interconnections between some of the
measures, to see how many dimensions the answers have. Section 6 analyses how well social capital –
as found – explains earnings. Human capital is used as the competing explanatory factor. Finally, Section

Hjøllund, Paldam & Svendsen Social capital in Russia & Denmark3
2. We are grateful to many researchers in the field for discussions as regards the best questions.
3. This section summarizes material covered in Paldam (2000).
7 summarizes the findings.
2. Four groups of definitions and the dictatorship theory
This section surveys two subjects covered in more detail elsewhere: The four groups of social capital
measures that can be applied in a questionnaire, and the dictatorship theory of social capital destruction.
The actual questions posed are given in the Appendix. A reference to ‘Q#’ is to question no. # in the
questionnaire. We have tried to make our results as comparable as possible to other social capital
research by choosing questions used by others as much as possible.2)
Many networks are benign for society, but others are harmful, even criminal. Hence, there is
bad social capital as well as good. We measure social capital by a questionnaire. It means that we can
hope to catch only good social capital. Bad social capital has to be measured by other methods such as
statistics for crime and corruption. Such attempts will not be made in the present article.
2.1 The four groups of social capital measures3)
We look at a polled person, A, living in a vicinity, V, that is a small part of a country, C. The social
capital measures considered are averages for all people polled in C. The four groups of measures of
social capital (g1) - (g4) are:
(g1) Putnam’s Instrument: The density of voluntary organizations. How many such organizations
does A belong to. See Q1 and Q2 (ie, questions 1 and 2 in the Appendix).
It is a way to measure an aspect of people’s ability to work together – Coleman’s definition of social
capital. The literature further suggests that it is a proxy for trust, and it is also a measure of (some)
networks. It is the easiest social capital measure to apply, but it is a proxy only. The main problem is to
delimit voluntary organizations from public organizations and firms. We want to include only what
people themselves consider as voluntary organizations. Also, it is sometimes found that it improves the
power of the measure to weight the numbers of contacts to each organization per time unit.
(g2) Trust: The “amount” of trust A has in either (g2.1): others in general (Q3), (g2.2): public insti-
tutions (Q4), or (g2.3): local people (Q5), i.e. within the vicinity, V.
Trust is a more abstract quantity to measure, and it is possible that it has several dimensions as indicated.
Fortunately, a number of questions have been developed and tested in studies from many countries. We
discuss the results reached using the first two groups of measures in Section 3.
(g3) Networks: The density of A’s links – weighted by strength – to other people. See Q6 to Q8.
This variable is developed by a whole school of network sociologists (see, eg Lin, 2001). They have
developed interviewing methods to map networks. However, these methods demand specially trained

Hjøllund, Paldam & Svendsen Social capital in Russia & Denmark4
4. This section summarizes material covered in Paldam & Svendsen (2000b).
5. Nothing seems more innocent than a choral society, but several examples can be listed where such societieshave been centers of national resistance against a foreign “oppressor”.
interviewers and long interviews. They are not applicable in polls conducted by commercial companies.
So, we have used more simple approaches involving subjective judgement by the respondents.
(g4) Civic participation: How many times has A participated in political and civic activities during
a certain time period, see Q9.
This is easy to measure as it deals with objective events. However, it is clearly a proxy only for social
capital. We discuss the results reached by the last two groups of measures in Section 4.
Note that both (g1) and (g4) are proxies, but they ask people about facts. In contrast (g2) and
(g3) are subjective questions asking people for evaluations. Further, it should be mentioned that both
trust and networks can be measured directly or by payoff questions of the type: How much do you think
you can borrow from your friends in time of need? Such questions may make the assessments more
concrete and thus more objective.
2.2 The dictatorship theory of social capital destruction4)
All dictators have good reasons to fear voluntary organizations and networks outside their control. The
most innocent organizations may become a focus of an anti-government movement, and thus it needs
to be observed.5) It appears that all dictatorships have used two instruments of intimidation:
(i1) It organizes one or more special police forces – controlled by the regime and outside the
control of the normal legal system – with secret information networks in order to control such organiza-
tions and networks.
(i2) It uses fear, by demonstrating that the regime is above the law. It can and will punish
people if it so desires. Most dictators use torture and execute enemies. If the concept of enemies is kept
vague and information is left to rumors, it is easy to create an atmosphere of fear.
Old well-established regimes with a clear system of succession as monarchies or theocracies
do not need to use these methods very much, but the 20th Century knew totalitarian systems that used
them to the extreme.
Totalitarian systems are dictatorships that try to control everything by bringing all organizations
into the system, and allowing no organization outside its control. In such systems no independent legal
system can exist. Trust, networks and voluntary cooperation among people become difficult and even
dangerous in such a system. They are described as “atomized societies”. That is, as societies with no
social capital.
Good social capital is reduced by dictatorship and destroyed by totalitarian systems.
Putnam (1993) analyzes social capital in Italy and finds it much smaller in the South than in the North.
The explanation offered is the different history of the North and the South. The North had mixed
regimes of which there were frequent republics. The South was for many years under the Kingdom of
Naples. The great puzzle of this case is that Italy was united in 1860, so – as Putnam stresses – the

Hjøllund, Paldam & Svendsen Social capital in Russia & Denmark5
6. Many polls have been made in Russia about people’s attitudes to democracy. They show that democracy is farfrom accepted by the Russians, but nor is any other political system. Source: Conference of Russian Pollstersat the Gorbachev Center, November 2000. See also APRI (2000), Colton (2000) and Wyman (1997).
7. The assessment is made by the use of a detailed checklist, also given at the web site. The detailed points aregiven as well. Even when some of the assessments can be discussed, it is clear that a serious effort is made.
effects of dictatorship must be very long.
While dictatorship destroys positive social capital, it is arguable that it creates negative social
capital. Paldam & Svendsen (2000b) argues that the transition from socialism is particularly likely to
create negative social capital, which may even block the creation of positive social capital. The main
point is that networks come to exist as a defense against the state. Such networks are illegal and thus
they have to be secret. In communist societies they are especially important as the supply of goods and
services are regulated, with little regard to demand. Hence people need connections to obtain goods and
services. Also, firms are under heavy pressure to produce even if this means using “grey” networks to
provide unavailable inputs.
2.3 The comparison of Russia and Denmark
The most simple of the two cases is the one of Denmark that became a formal democracy in 1849. It
took till 1901 before the system was really accepted, and there was even something like a royal coup
d’etat in 1920, though it quickly collapsed. For the last half century Denmark has been a textbook
democracy. Russia became a formal democracy in 1990. Since then a process of democratization has
taken place, but the new system is far from accepted.6)
Figure 1. The Gastil index of political and civil rights, 1972-2000, for four countries
The NGO Freedom House (see http://freedomhouse.org) annually assesses the state of political and civil
rights in all countries.7) In the Freedom House’s assessment the democratization of the Russian society

Hjøllund, Paldam & Svendsen Social capital in Russia & Denmark6
8. In Spain General Franco died in November 1975 and a reform process was carried out till the first election inJune 1977. The Polish transition to democracy started already with the formation of the independent trade unionSolidarno�� in 1980. The organization was allowed but not legalized from 1982 to 88. The governmentnegotiated with it in 1988 and it was allowed as a political party at the elections in 1989. In Russia the systemremained in place though it gradually weakened till the big “meltdown” in 1990.
9. The main principles making the system totalitarian – such as the principle of one tightly organized party witha central command structure – were laid down by Lenin well before the revolution. Also, the main instrumentof control – the Cheka/KGB – was founded in December 1917. The informer networks and the draconiansystem of punishments for political crimes (as defined by the party) was used from the start, and then followedcivil war, mass collectivization, the great purges, the world war and the cold war, all situations in which humanlife was considered a minor detail.
10. The results for Russia are much like the results for the three Baltic States, and the data for Denmark are likethe ones for the three other Scandinavian countries in Siisiäinen (1999).
is halfway, even when progress has been impressive. Figure 1 shows the composite indices from
Freedom House for Russia and Denmark and for comparison also Spain and Poland.8) The worst score
is 7 for no political and civic rights and the best score is 1 for all rights, as in Denmark – it appears that
Spain and Poland are almost as “good”, while Russia has some way to go.
Even when Russia is now well on the way to getting a normal democracy it is still a new and
only partly accepted system of government. The regime of the millennium before 1918 was a monarchy.
Even though it was not particularly hard, it did have a secret police, and people were jailed and sent to
Siberia for political crimes, etc. The Communist regime from 1918 to 1990 was, in principle, totali-
tarian.9) During the long reign of Josef Stalin (approx. 1929 to 53), it was one of the most extreme
systems known. Then, the Russian people thoroughly learned to take no initiative, to obey orders and
to fear everybody. Hence, we imagine that large scale destruction of social capital took place.
3. First two concepts: Voluntary organizations and trust
The present section compares the marginal distribution for the two countries of the items measuring the
density of voluntary organizations and trust. The analysis is based on a questionnaire posed to 2500
respondents in Russia and 1206 in Denmark.
3.1 The Putnam Instrument (Q1)
Table 2 shows the distribution of memberships of voluntary organizations and gives us the Putnam’s
Instrument. The average Russian is a member of 0.41 voluntary organizations, while the average Danish
citizen is a member of 1.7.10) In both cases the interviewer had a list of the possible categories of
organizations.
The right-hand column of the table compares the results from the two countries. Almost three
times as many in Russia as in Denmark are members of no organization. The average number of
memberships in the two countries differs by no less than 4.2 times. We compare these differences with
other differences in Section 3.3. They are parts of a consistent pattern.
Table 2. Results reached by Putnam’s Instrument (Q1)

Hjøllund, Paldam & Svendsen Social capital in Russia & Denmark7
Member-
ships
Russia (2500) Denmark (1206) Ratio:
Dk/RusFrequency Percent Frequency Percent
0 1692 67.68 282 23.38 0.35
1 626 25.04 351 29.1 1.2
2 152 6.08 263 21.81 3.6
3 25 1 160 13.27 13
4 4 0.16 82 6.8 42
5 1 0.04 40 3.32 1000
6 16 1.33 �
7 8 0.66 �
8 2 0.17 �
9 up 2 0.17 �
Average 0.41 1.72 4.2
It has often been argued that some kind of weighting according to the frequency with which an indivi-
dual is in contact with a specific organization would be an improvement of the measure. Table 3 shows
what happens when Putnam’s Instrument is weighted, as described in the note to the table. We have
experimented with both the weighted and the unweighted variable, but found the results rather similar
as shown in Table 3. A sensitivity analysis shows that the resulting measure depends on whether the limit
between “normal” and “high” is drawn before (weights 2) or after (weights 1) 12 contacts per year.
Table 3. Comparing the weighted and unweighted versions (Q2)
Russia Denmark Ratio
Unweighted
Weights 1
Weights 2
0.42
0.43
0.50
1.72
1.65
1.82
4.2
3.8
3.6
Note: The weights are 0.5, 1, and 1.5 for the answers: low, normal, and high level of contacts respectively.
3.2 Three dimensions of trust: (Q3) to (Q5)
The generalized trust question has been used in many studies and a whole book considers the question
(Uslaner, 2001) in many countries and variants. We have taken the formulation from the World Values
Survey. It is formulated as: Generally speaking, do you believe that most people can be trusted or can’t
you be too careful in dealing with people? The answers are given in Table 4. Once again the right-hand
column shows the difference between the two countries. It looks as expected.
Table 4. Generalized trust in Denmark and Russia (Q3)
Frequencies in percent Russia Denmark RatioCan trust 35 73.9 2.1 Can’t be too careful 64 21.3 0.33 Don’t know 1 4.8 -

Hjøllund, Paldam & Svendsen Social capital in Russia & Denmark8
11. At the time of our Social Capital poll the Danish Government was (still is) a Social Democrat minoritygovernment (supported by the small Radical Party). It has a majority in the parliament by relying on theopposition to the left, but at the polls this majority had disappeared at the time of our social capital poll.
Trust in institutions is measured by four variables. They can be separated into two groups, one consisting
of trust in the legal system and the police, and one consisting of trust in the administration and the
government. There is a clear difference in the distributions of the responses between these two groups,
especially in Denmark.
Table 5. Trust in institutions compared (Q4)
All frequencies
are in percent
Russia Denmark
a great
deal
quite
a lot
not very
much
none
at all
a great
deal
quite
a lot
not very
much
none
at alllegal system 8 22.5 47.8 21.8 31.5 58.9 7.1 2.6 police 5.7 16 45.7 32.5 35.1 60.4 3.1 1.4 administration 7.5 22.4 45.4 24.6 9.6 67.3 19.5 3.6 government 8.4 21.1 46.2 24.3 10.9 62.3 23.1 3.7 Average 7.4 20.5 46.3 25.8 21.9 62.2 13.1 2.8
Ratio 3 3 0.28 0.11
Notes: The category “don’t know” has been deleted in the above distributions. The shaded answers are
termed “distrust” in the text.
While the police is the least trusted institution in Russia, it is the most trusted in Denmark. Almost 80%
of the Russians distrust the Police, while only 4.5% of the Danes do so. This may be due to past history,
but it is also connected with the low salaries of the Russian militia (the ordinary police) that has turned
it into a “semi-privatized” agency and has turned ordinary traffic fines etc. into bribes. People know that
the system of justice has to be greased often in order to work. Maybe those who pay the most get the
best service. So it is not a trustworthy system.
The government and the administration have a low level of trust in Russia similar to the police
and the courts, but also here the Danes have somewhat less than full trust. It is interesting to note that
23% of the Danish population distrusts the administration.
In a democratic system many support the opposition against the government. At the time of the
poll other polls showed that the government was supported by 1/3 of the population.11) Nevertheless,
almost 3/4 of the population express trust in the government. This shows a great deal about the nature
of the seemingly big political disagreement in the country. The Parliament holds 10 parties, some of
which are quite radical, but even then none of the parties want to change the political system. So a great
deal of the trust in the government is actually support for the system.
In Russia things are different. Many polls have shown that people do not support “Western
political institutions”, and neither do several of the important political parties in the Duma. However,
there is even less support for any other political system. Hence, it is not so puzzling that trust in
government is low even though President Putin is supported by a majority of the voters (see note 6 for
sources). So a great deal of the distrust in the government is actually distrust in the system.
Hjøllund, Paldam & Svendsen Social capital in Russia & Denmark9
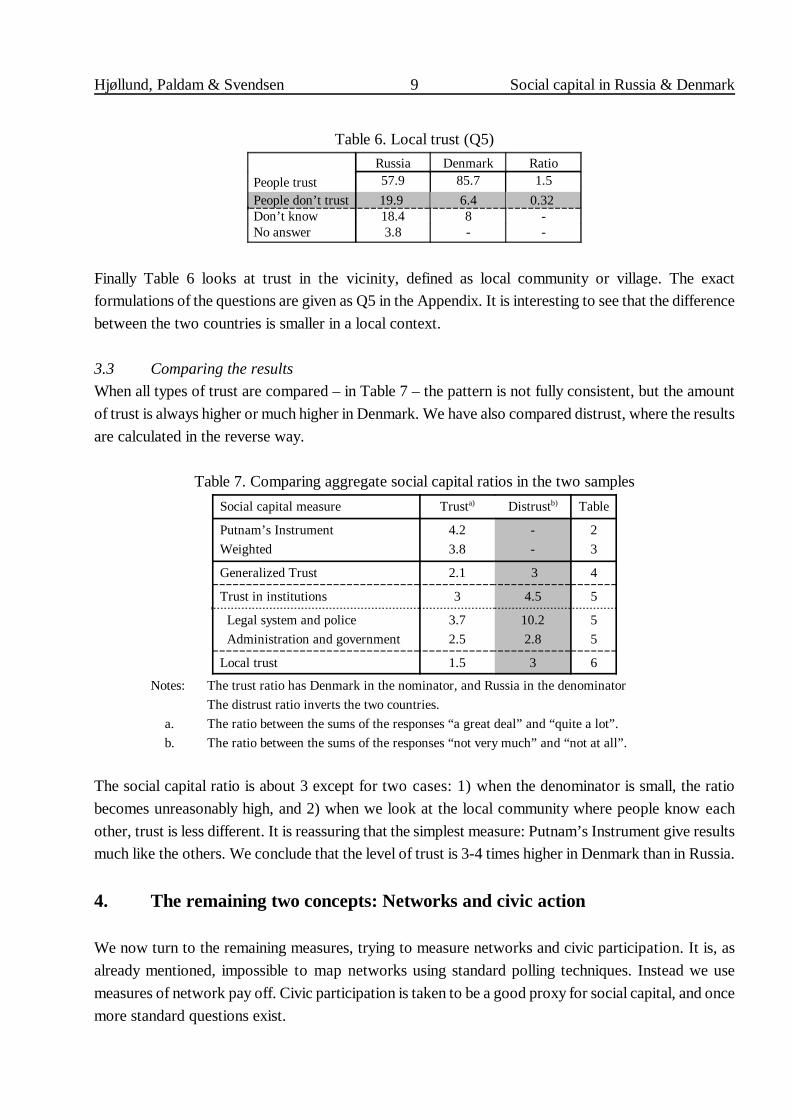
Table 6. Local trust (Q5)
People trust
Russia Denmark Ratio 57.9 85.7 1.5
People don’t trust 19.9 6.4 0.32 Don’t know 18.4 8 - No answer 3.8 - -
Finally Table 6 looks at trust in the vicinity, defined as local community or village. The exact
formulations of the questions are given as Q5 in the Appendix. It is interesting to see that the difference
between the two countries is smaller in a local context.
3.3 Comparing the results
When all types of trust are compared – in Table 7 – the pattern is not fully consistent, but the amount
of trust is always higher or much higher in Denmark. We have also compared distrust, where the results
are calculated in the reverse way.
Table 7. Comparing aggregate social capital ratios in the two samples
Social capital measure Trusta) Distrustb) Table
Putnam’s Instrument
Weighted
4.2
3.8
-
-
2
3
Generalized Trust 2.1 3 4
Trust in institutions 3 4.5 5
Legal system and police
Administration and government
3.7
2.5
10.2
2.8
5
5
Local trust 1.5 3 6
Notes: The trust ratio has Denmark in the nominator, and Russia in the denominator
The distrust ratio inverts the two countries.
a. The ratio between the sums of the responses “a great deal” and “quite a lot”.
b. The ratio between the sums of the responses “not very much” and “not at all”.
The social capital ratio is about 3 except for two cases: 1) when the denominator is small, the ratio
becomes unreasonably high, and 2) when we look at the local community where people know each
other, trust is less different. It is reassuring that the simplest measure: Putnam’s Instrument give results
much like the others. We conclude that the level of trust is 3-4 times higher in Denmark than in Russia.
4. The remaining two concepts: Networks and civic action
We now turn to the remaining measures, trying to measure networks and civic participation. It is, as
already mentioned, impossible to map networks using standard polling techniques. Instead we use
measures of network pay off. Civic participation is taken to be a good proxy for social capital, and once
more standard questions exist.

Hjøllund, Paldam & Svendsen Social capital in Russia & Denmark10
12. The data for this particular question have been constructed slightly differently for the two data sets due todifferent local conditions and the advise of the polling agencies. Still, the results are comparable.
13. Similarly for Russia, the conditional distribution of “the second answer” (conditional on the “first answer” being“family” which is the case for 71.8% of respondents), shows that 63.6% of the non-missing values (answers)are “friends” and 30.8% are “neighbors”. So, the 83.7% is presumably somewhat smaller. But it can definitelynot be any lower than 71.8% which is the number of respondents who put “family” as the first answer.
See Section 3 and the Appendix for details on the questionnaire. It is a problem for this section
that it uses calculations from Section 5, which in turn uses the data from this section. So the two sections
should be read simultaneously. Or rather – as the authors are Danes – the reader should know by now
that we can be trusted till next section.
4.1 General networks
Networks are important in times of emergency. They can be measured by asking about the most impor-
tant sources of financial assistance in case of an economic loss (for instance job loss or crop failure).12)
Table 8. Financial assistance in case of economic loss (Q6)Per cent Denmark Russia
family 34.7 42public support 27 1.7trade union 20.8 2.6friends 9.5 30.3neighbors 6.6 11.4others 5.0 0.1 don’t know 24.1 1.1Sum (6 items) 103.6 88.1
Note: The respondent can indicate up to 3 items, so the sum adds to more than 100
as given. The “don’t know” item is not included in sum.
Note that while both Russians and Danes know that they can rely upon their family, Russians rely much
more upon their friends, and Danes upon the public system (including Unions).The difference is
institutional: Danes do not need to rely upon friends when in need, while Russians have to rely on their
friends. And in a society with little trust it gives an interesting dichotomy of friendship, many observers
of Russia have noticed: on the one hand Russians appear cold, almost unfriendly, when you just meet
them, but once you “break through” there is no end to their helpfulness.
Two points are worth noting: (1) the “don’t know” fractions are different. The reason is not
obvious. (2) as explained in the note to the table, respondents can give 1, 2 or 3 answers. For example,
in the Danish data, out of the 34.7% having answered “family” as one of the three answers, 24.6% have
also answered “government support system”, and 15% have also answered “trade union”. However,
most respondents (47%) have given one answer only. This indicates that the total number of people
relying on one of the three sources of financial assistance is somewhat smaller than the immediate
impression of the simple marginal statistics.13)
4.2 Local community feeling (Q7)

Hjøllund, Paldam & Svendsen Social capital in Russia & Denmark11
14. The statistical method is explained in more detail in Hjøllund and Svendsen (2001).
Table 9 reports the question posed to measure the level of local community feeling. To make the table
self-explanatory the question is included in the table.
Table 9. Local community feeling (Q7)People here look out mainly for the welfare of their own families
and they are not much concerned with village/neighborhood
welfare. Do you agree or disagree with this statement?Denmark Russia
Strongly agree 25.5 37.3 Agree 60.5 42.9 Disagree 13.0 14.0 Strongly disagree 1.6 5.8
The answers look much like the answers to the questions about local trust in Table 6. So we have a good
control here.
4.3 Local networks (Q8)
Q8 is concerned with the respondent’s networks within the local area, ie the village or neighborhood.
In this sense it is an extended version of Q7 investigating the same phenomena, by specifying ten sub-
questions about different aspects of the respondent’s relationship with his/her local area. Including both
Q7 and Q8 makes it possible to test whether the simple question, Q7, can explain just as much as the
more detailed Q8.
The method of principal components is used to analyze the relationship among the ten variables.
The purpose is to look for underlying dimensions that could approximately describe all the variables and
accordingly reduce the number of variables.14) The detailed results are given in Section 5. We identify
two components in the Danish data and three in the Russian data.
Table 10. A comparison of the main components of local network in the two countries
Based on Tables
13a & b
Com1 Com2 Com3
Russia Denmark Russia Denmark Russia
Com1Russia 1
Denmark 0.94 1
Com2Russia -0.8 -0.65 1
Denmark -0.66 -0.79 0.29 1
Com3 Russia -0.06 -0.07 -0.08 -0.08 1
Note: The shaded cells of the table are uninteresting given the construction of the variables.
When Tables 13a and b are compared, it is obvious that Com1 in the two countries are similar. Table
10 reports the correlations among the 12 estimated correlations (that is, the columns in tables 13a & b).

Hjøllund, Paldam & Svendsen Social capital in Russia & Denmark12
It is obvious that Com1 in the 2 countries describes the same latent variable, while it is more dubious
whether Com2 is the same latent variable in the two countries – the correlation is 0.29 only.
The first component explains 27% of variation in the Danish case and 22% in the Russian case.
It represents mainly Q8a, e, g, i and j, which is evident from the correlation of the variables with the
components. The second component (or dimension) is made up mainly by Q8b, d, and f and explains
14% of the variation in Denmark and 16% in Russia.
4.4 Civic action (Q9)
The 13 sub-questions of Q9 measure the involvement in civic actions. Table 11 gives the number of
“yes” of the respondents to all the sub-questions. This is an aggregate measure of civic involvement.
Table 11. Civic action (Q9)
Denmark Russia Ratio
Yes 34.7 22 1.6
No 65.1 74.2 0.9
Don’t know 0.2 3.7
Further, this “collection” of civic action indicators can also be analyzed for underlying dimensions by
principal components analysis, in the same way as the local networks questions. Again, Section 5 gives
a more detailed description of this analysis.
Table 12. A comparison of the main components of civil participation in the two countries
Based on Tables
14a & b
Com1 Com2 Com3
Denmark Russia Denmark Russia Denmark Russia
Com1Denmark 1
Russia 0.79 1
Com2Denmark -0.71 -0.6 1
Russia -0.53 -0.37 0.7 1
Com3Denmark -0.13 0.2 -0.01 0.36 1
Russia -0.57 -0.63 0.52 -0.01 -0.47 1
Here it is clear that components Com1 and Com2 measure the same latent variable, while Com3 is
unrelated in the two countries.
Subsequently, we will test whether one or more of the components identified in the above will
be significant in explaining individual earnings.

Hjøllund, Paldam & Svendsen Social capital in Russia & Denmark13
15. Again, Q8h has been deleted for the previously mentioned reason.
5. How many social capitals do the data contain?
Principal components analysis is used to investigate the data set for underlying (unobserved) dimensions.
In the present context, ideally there would be only one clear dimension (or component) which we could
label “social capital”.
The method is particularly useful when exploring qualitative concepts. Q4, 8 and 9 (institutional
trust, local networks, and civic action) are well suited for this type of analysis, as their structure is
multidimensional. The local networks question will be treated thoroughly whereas Q9 will be discussed
more briefly.
5.1 Local networks
Looking first at the output from this analysis of the Danish data for Q8, there appears to be two possibly
three groups of variables, ie two or three dimensions that describe “local networks”. The first group is
made up by Q8a, e, g, i, and j. The second by Q8b, c, d, and f. Q8h has been deleted, since 35 % of the
respondents have answered “don’t know”, and therefore the information contained in this variable is
limited. Also, it is concerned with whether the neighborhood has prospered over the last five years,
which would be expected to be highly correlated with what we seek to explain. Analyzing the remaining
9 sub-questions yields the output:
Table 13a. Principal component analysis of the local network questions for Denmark
principal components, 2 comp. retained Eigenvectors
Comp. Eigenv. Diff. Propor. Cum. Question Com1 Com2
1 2.4 1.108 0.267 0.267 8a 0.428 0.134
2 1.292 0.35 0.144 0.41 8b -0.171 0.466
3 0.942 0.048 0.105 0.515 8c 0.185 0.524
4 0.894 0.047 0.1 0.614 8d -0.2 0.56
5 0.847 0.12 0.094 0.708 8e 0.401 -0.069
6 0.728 0.026 0.081 0.789 8f -0.218 0.35
7 0.702 0.068 0.078 0.867 8g 0.449 0.176
8 0.634 0.071 0.07 0.937 8i 0.387 0.023
9 0.563 - 0.063 1 8j 0.392 0.135
In order to contribute to the explanation of the variance, the eigenvalue of a component must exceed
unity. Otherwise, it contributes less than what would be expected to be observed randomly. Therefore,
we have identified the existence of two dimensions in the data. The eigenvectors of the components are
reported in the right-hand panel of the table. They give the correlation of the analyzed variables with the
components.15) The higher the correlation the better the variables are “represented” by the component.

Hjøllund, Paldam & Svendsen Social capital in Russia & Denmark14
Accordingly, it is clear that the variables can be separated into two groups, one consisting of variables
that are mainly correlated with the first component and one consisting of variables that mainly correlate
with the other component. Finally, the components are “constructed” as a weighted sum of all the
variables, with the weights given by the correlation of the variables with the components. In this way,
the variables that have the highest correlation with the specific component (or dimension) get the highest
weight.
Table 13b. Principal component analysis of the local network questions for Russia
principal components, 2 comp. retained Eigenvectors
Comp. Eigenv. Diff. Propor. Cum. Question Com1 Com2 Com3
1 1.873 0.456 0.208 0.208 8a 0.441 -0.127 -0.242
2 1.413 0.395 0.157 0.365 8b -0.136 0.359 0.595
3 1.018 0.024 0.113 0.478 8c 0.383 -0.062 -0.031
4 0.994 0.091 0.11 0.588 8d -0.283 0.549 -0.042
5 0.903 0.158 0.1 0.689 8e 0.337 0.194 0.407
6 0.745 0.023 0.083 0.771 8f -0.095 0.529 -0.34
7 0.722 0.044 0.08 0.852 8g 0.474 0.225 0.02
8 0.677 0.019 0.075 0.927 8i 0.387 0.165 0.313
9 0.659 - 0.073 1 8j 0.249 0.394 -0.453
Table 13b presents the same analysis of the Russian data. In this case 3 components have eigenvalues
larger than unity. The first component explains 21% of the variance. The second explains 16% and the
third accounts for 11%. And again, it is possible to group the variables according to which dimension
they are correlated with. As it is evident from the right-hand panel of the table, these groups of variables
are roughly identical to the ones in the Danish data set, as discussed in Section 4.2.
5.2 Civic Action
Like Q8 also the structure of Q9 (civic action) is a set of sub-questions. Again, we use principal
component analysis. The pattern is not quite as clear as for Q8, however.
Again, we first look at the Danish data for Q9. There is hardly any variation in the responses
to Q9i participation in sit-in or disruption of government meetings/offices. Hence, it will not be
correlated with any of the other variables, and therefore forms a dimension of it’s own. Consequently
this sub-question is removed from the set. This leaves us with 12 variables, and a principal component
analysis of these yields the results given in Tables 14a for Denmark and 14b for Russia.
The left-hand panel of the Table shows that the first component explains 22% and is by far the
most important. The second component explains only 10%. The eigenvectors of the components show
that the first component is mainly formed by Q9b, c, d, e, h. The second dimension (or component) is
mainly formed by Q9a, j, and l. The third component (explaining 9%) is correlated mainly with Q9a, g
and m. Again, we are now able to construct the three components as weighted sums, using the
correlations (eigenvectors) as weights for the variables.
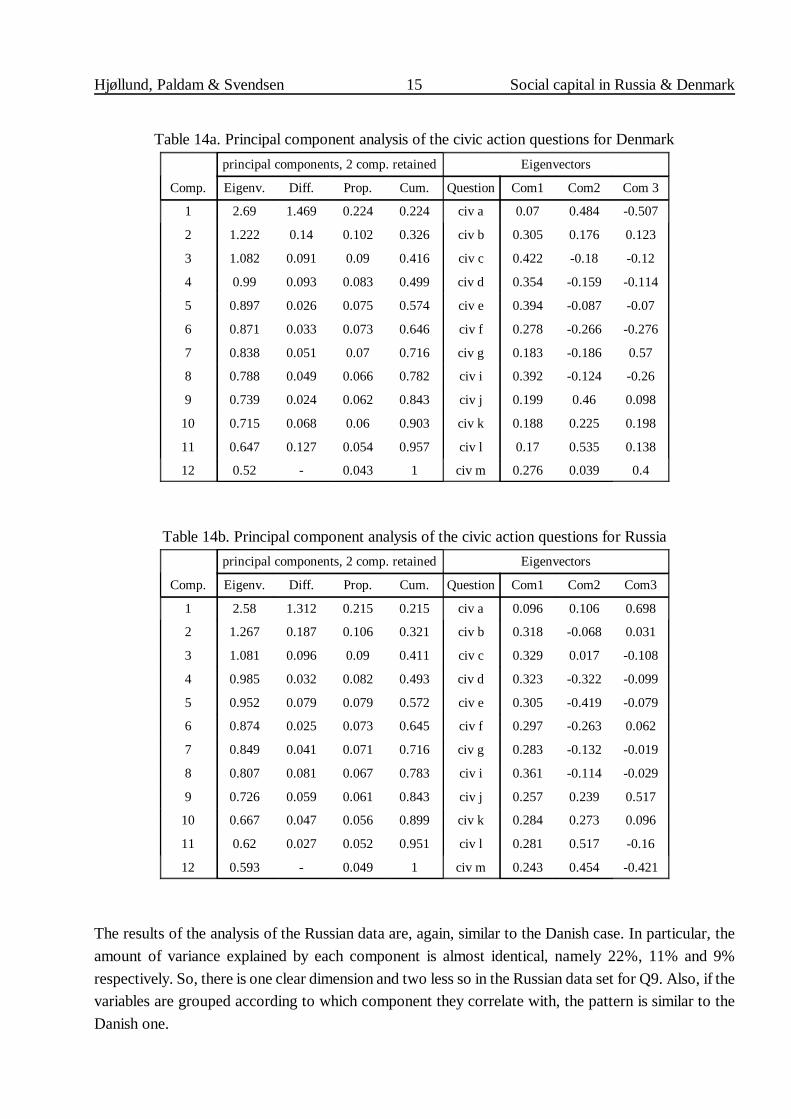
Hjøllund, Paldam & Svendsen Social capital in Russia & Denmark15
Table 14a. Principal component analysis of the civic action questions for Denmark
principal components, 2 comp. retained Eigenvectors
Comp. Eigenv. Diff. Prop. Cum. Question Com1 Com2 Com 3
1 2.69 1.469 0.224 0.224 civ a 0.07 0.484 -0.507
2 1.222 0.14 0.102 0.326 civ b 0.305 0.176 0.123
3 1.082 0.091 0.09 0.416 civ c 0.422 -0.18 -0.12
4 0.99 0.093 0.083 0.499 civ d 0.354 -0.159 -0.114
5 0.897 0.026 0.075 0.574 civ e 0.394 -0.087 -0.07
6 0.871 0.033 0.073 0.646 civ f 0.278 -0.266 -0.276
7 0.838 0.051 0.07 0.716 civ g 0.183 -0.186 0.57
8 0.788 0.049 0.066 0.782 civ i 0.392 -0.124 -0.26
9 0.739 0.024 0.062 0.843 civ j 0.199 0.46 0.098
10 0.715 0.068 0.06 0.903 civ k 0.188 0.225 0.198
11 0.647 0.127 0.054 0.957 civ l 0.17 0.535 0.138
12 0.52 - 0.043 1 civ m 0.276 0.039 0.4
Table 14b. Principal component analysis of the civic action questions for Russia
principal components, 2 comp. retained Eigenvectors
Comp. Eigenv. Diff. Prop. Cum. Question Com1 Com2 Com3
1 2.58 1.312 0.215 0.215 civ a 0.096 0.106 0.698
2 1.267 0.187 0.106 0.321 civ b 0.318 -0.068 0.031
3 1.081 0.096 0.09 0.411 civ c 0.329 0.017 -0.108
4 0.985 0.032 0.082 0.493 civ d 0.323 -0.322 -0.099
5 0.952 0.079 0.079 0.572 civ e 0.305 -0.419 -0.079
6 0.874 0.025 0.073 0.645 civ f 0.297 -0.263 0.062
7 0.849 0.041 0.071 0.716 civ g 0.283 -0.132 -0.019
8 0.807 0.081 0.067 0.783 civ i 0.361 -0.114 -0.029
9 0.726 0.059 0.061 0.843 civ j 0.257 0.239 0.517
10 0.667 0.047 0.056 0.899 civ k 0.284 0.273 0.096
11 0.62 0.027 0.052 0.951 civ l 0.281 0.517 -0.16
12 0.593 - 0.049 1 civ m 0.243 0.454 -0.421
The results of the analysis of the Russian data are, again, similar to the Danish case. In particular, the
amount of variance explained by each component is almost identical, namely 22%, 11% and 9%
respectively. So, there is one clear dimension and two less so in the Russian data set for Q9. Also, if the
variables are grouped according to which component they correlate with, the pattern is similar to the
Danish one.

Hjøllund, Paldam & Svendsen Social capital in Russia & Denmark16
16. We have discussed the results for human capital with several colleagues (Nina Smith and Michael Rosholm),who have estimated human capital models on other Danish data sets. It appears that the results for Denmarkare exactly as expected. Also, it appears that the level of explanatory power is as could be expected.
6. Social capital and earnings
Now, we are ready to investigate which measures perform best in explaining the level of income. As a
first step the indicators can be separated into four “families” of social capital measures as discussed in
Section 2: (1) Memberships of voluntary organizations Q1-2. (2) Trust measures Q3-5. (3) Network
measures Q6-8. (4) Civic action Q9. Note that we have decided to disregard the possibility that there
is a counter causality bias. We assume it is small and of the same size relatively as the counter causality
bias for human capital.
6.1 The set-up of the analysis
The aim is to identify the measure with the highest explanatory power within each family. We make
simple linear regressions of the variable of income on the various measures of social capital.
In practical terms, we try to determine how much each measure contributes to the explanation
of income. Therefore, we are interested in the partial R2s of the social capital measures. For both
countries, these are reported in Table 15 for the different variables as well as for the variable of
education. It is defined as three categories: shorter, middle and longer. Education was included in order
to be able to compare the contributions of social capital with that of human capital.16)
As there is an indication of some correlation between some of the variables, we have to
approach the analysis from (at least) two directions. As a first step, we perform univariate regressions
using each measure separately. This yields what we have called the partial R2. The partial R2 is included
to illustrate the correlation of the specific variable with the other explanatory variables. If, for instance,
the partial and marginal R2 for a variable are identical, this variable would be fully independent of all
other variables.
Subsequently, we have performed a multivariate regression, initially including all the possible
measures, and then removing the variables one at the time noting the change in R2. In this way we obtain
the marginal R2 for each variable, ie how much the variable adds given that all the other variables are
already included. This approach is an attempt to detect (and reduce) the effects from the correlation
between the variables, although it is rather limited for most cases.
It should be mentioned that the polled income in the Russian case is much lower than GDP per
capita, while the two numbers from Denmark are as alike as they should be. Our Russian pollster
reported that the numbers were the usual ones reported in Russian polls. The difference probably is that
Russians report their official salary. Many have additional incomes, but they are not reported.
The partial and marginal R2 are all low for two reasons. First, the results are in first differences.
We want to see how well the “production factor” of social capital can explain income. Second, the
partial and marginal R2s will inevitably come out low, because the level of social capital is actually split
between a range of aspects all concerning the same phenomenon. Accordingly, the contributions from
the various aspects should, in principle, be added up in order to get the total contribution from the

Hjøllund, Paldam & Svendsen Social capital in Russia & Denmark17
17. Social capital and human capital have some multicollinearity. Removing all the social capital variables fromthe multivariate regression, ie regressing income on education alone shows that the social capital variablesexplain 1.92% of the variance of the income variable. In the aggregate perspective, this is the number that iscomparable to the marginal contribution of human capital (5.03%).
18. Of course the usual “caution” is applicable. The number of measures that we will be left with depends on thedetermination of selection criteria which is a somewhat subjective exercise.
suggested social capital measures. This action requires, however, that the explanatory variables were
completely uncorrelated, which (as mentioned) they are not.17)
Table 15. Income effects of social capital measures
Dependent variable:
polled income
Denmark Russia
Partial R2 Marginal R2 Partial R2 Marginal R2
Putnam Instrument 2.54 0.57 3.74 1.96
weighted PI 1.98 -0.07 -0.04 -0.04
st. generalized trust 1.07 0.09 0.08 -0.24
institutional trust* 0.28 -0.05 0 -0.02
loan question 0.2 -0.07 -0.02 -0.01
local comm. feel -0.06 -0.07 -0.04 -0.03
local networks Com1 0.19 -0.08 0.1 0.14
local networks Com2 -0.03 -0.08 -0.01 -0.08
local networks Com3 - - -0.04 0
civi l engagement
Com1
1.96 0.03 0.46 -0.01
civi l en ga gement
Com2
0.36 -0.02 -0.01 -0.03
c ivi l engagem en t
Com3
1.25 1 0 -0.02
education 8.05 4.99 8.79 6.98
Note: For local networks and civic engagement the principal components from Tables 13 and 14 are used.
6.2 Discussing the results
The correlation between the variables is evident from the difference between the partial R2 from the
individual regressions and the marginal R2 from the full regression. It is noted that all variables decrease
their contributions to R2 when we go from the partial to the marginal perspective. This is, of course, due
to the presence of correlation between the variables.
It is an important finding that Putnam’s Instrument works better without intensity weights and
that it “swallows” the whole of the trust dimension in both countries. However, apart from Putnam’s
Instrument it varies which of the variables works best in the two countries.
There are several ways to select the social capital variables for best multivariate model.18) The
most straightforward approach is to consider all the explanatory variables at the same time and identify

Hjøllund, Paldam & Svendsen Social capital in Russia & Denmark18
the significance of the variables. As the negative contributions to R2 indicate insignificant variables, it
is easy to identify the significant explanatory variables. This restriction is the most appropriate as it takes
the correlation of the variables into account.
For Denmark, the significant explanatory variables are the Putnam Instrument, the standard
generalized trust measure, “civic involvement” and “civic involvement3”. For Russia the significant
variables are the Putnam Instrument and “local network1”. Table 16 compares the best regressions for
the two countries.
In the Danish data the four measures of social capital explain 2.3 % marginally, and education
explains 5.2 % marginally. Compared with the marginal contributions from table 15, this is slightly
overestimated which is, again, due to the presence of correlation between the variables.
Table 16. Social capital indicators and income (marginal R2)
dependent variable:
polled income
Russia Denmark
Putnam Instrument 2.16 0.72
generalized trust - 0.19
local networks 0.72 -
civic engagement 1 0.03
civic engagement 3 - 1.03
all soc. cap. indicators a) 2.75 2.29
education 7.42 5.2
a. Removing all variables at the same time.
For Russia the results are similar. Table 16 shows that the contribution from social capital to explaining
income is 2.8 % whereas human capital explains 7.4 %.
Accordingly, the overall result suggests that social capital is a new production factor at a 40%
level compared with the importance of human capital to income in both Russia and Denmark. It is worth
pointing out that human capital is a powerful variable in many connections, so 40% of human capital is
a substantial amount.
7. Conclusion
The main purpose of this paper was twofold: First, we wanted to compare the level of social capital in
two political systems with different histories. One is an old successful “capitalist” democracy. The other
is a former communist country with a short and not entirely happy history of democracy. The
comparison showed that the level of (good) social capital is roughly three times higher in Denmark than
in Russia. This result suggests that the slowness of the transition of the old communist countries of
Eastern and Central Europe could be caused by the lack of social capital. Though the former East Bloc
countries have started implementing market-based reforms since 1989, the stock of social capital has
presumably not changed yet as it takes a long time to build it. Putnam (1993) claims that it may even

Hjøllund, Paldam & Svendsen Social capital in Russia & Denmark19
19. The evidence is surveyed in Paldam (2000).
take centuries, but other evidence suggests it may take a few decades only.19)
Second, we wanted to establish whether social capital matters to earnings (and eventually
growth). Both in Russia and Denmark, social capital explains roughly 2½% of income. This corresponds
to 40% of what human capital explains of income in both countries. Many attempts have been made to
determine the importance of human capital to economic growth and in general, most experts agree that
human capital contributes about half of the total. It matters roughly twice as much as physical capital,
while many other factors share the remaining quarter. In other words, if social capital explains 40% of
what human capital explains in terms of income, then social capital may potentially be able to explain
most of the remaining quarter. This result is quite remarkable and demonstrates the potential of social
capital. However, more research in more countries is needed to test this preliminary proposition
thoroughly.

Hjøllund, Paldam & Svendsen Social capital in Russia & Denmark20
Literature
���� (APRI), 2000. ����������� ����� �����. Moscow
Colton, T.J., 2000. Transitional Citizens. Voters and What Influence Them in the New Russia. Harvard UP: Cambridge,
MA.
Deth, J.W.v., Maraffi, M., Newton, K., Whiteley, P.F., eds. 1999. Social Capital and European Democracy. Routledge/
ECPR Studies in European Political Science: London
Hjøllund, L., Svendsen, G.T., 2001. Social Capital Measurement? The Preliminary case of Russia. Paper for the European
Public Choice Society Meeting in Paris, April 2001
Inglehart, R., Basenez, M., Moreno, A., Moreno, M., 1998. Human Values and Beliefs: A Cross-Cultural Sourcebook:
Political, Religious, Sexual, and Economic Norms in 43 Societies: Findings from 1990-1993. University of
Michigan Press: Ann Arbor, MI
Krishna, A., Shrader, E., 1999. Social Capital Assessment Tool. The World Bank
Lin, N., 2001. Social Capital A Theory of Social Structure and Action. Cambridge UP: Cambridge UK
Paldam, M., 2000. Social Capital: One or Many? Definition and Measurement. Journal of Economic Surveys 14 (5): 629-
653. Special Issue on Political Economy.
Paldam, M., Svendsen, G.T., 2000a. An Essay on Social Capital. Looking for the fire behind the smoke.
European Journal of Political Economy 16 (2): 339-366. June 2000.
Paldam, M., Svendsen, G.T., 2000b. Missing social capital and the transition in Eastern Europe
Journal for Institutional Innovation, Development and Transition (IB Review), forthcoming.
Putnam, R.D., 1993. Making Democracy Work. Civic Traditions in Modern Italy. Princeton UP: Princeton, NJ
Siisiäinen, M., 1999. Voluntary associations and social capital in Finland. Cpt 6 in Deth, Maraffi, Newton & Whiteley
(1999)
Uslaner, E., 2001. The moral foundation of trust. Forthcoming from Cambridge UP
Wyman, M., 1997. Public Opinion in Postcommunist Russia. (CREES series). Macmillan: Houndmills.

Hjøllund, Paldam & Svendsen Social capital in Russia & Denmark21
Appendix. The questionnaire
The questionnaire had 2500 respondents in Russia and 1206 in Denmark. The interviews were conducted
by phone in Denmark and by face-to-face interviews in Russia, where phone ownership is not universal.
Our key explanatory variables have been selected from two existing questionnaires. First,
questions have been replicated from Krishna and Shrader (1999) concerning structural social capital,
namely Q1 and 5 through 9. Second, cognitive aspects Q3 and 4, are taken from the World Values
Survey, see Inglehart et al. (1998).
SOCIAL CAPITAL QUESTIONNAIRE AND MARGINALS (Russia, 27-03-01)
Putnam’s Instrument
1 – 2 How many voluntary organizations are you a member of:
Name Codefrom*
Frequency of Contacts
week month year
1
2
3
4
5
6
7
8 up
Frequency should be filled in only for lowest possibilityA contact is when the respondent takes part in an activity of the group

Hjøllund, Paldam & Svendsen Social capital in Russia & Denmark22
* Type codes% of those, participated in a orga-nization
1 Farmers’/fisherman’s group 11 Parent group
2 Traders’ association/business group 12 School committee
3 Cooperative 13 Health committee
4 Women’s group 14 Water/waste
5 Credit/finance group (formal) 15 Sports group
6 Political group 16 NGO
7 Youth group 17 Civic group (ie, Rotarian)
8 Religious group 18 Professional Association
9 Cultural Association 19 Trade Union
10 Neighborhood/village association 98 Other

Hjøllund, Paldam & Svendsen Social capital in Russia & Denmark23
Trust
3 Standard generalized trust
Generally speaking, do you believe that most people can be trusted or can’t you be too care
Most people can be trusted
You can’t be too careful
4 Trust in institutions
How much confidence do you have in the following institution?
Institution (1)A great
deal
(2)Quite a lot
(3)Not very much
(4)None at all
(5)Hard to answer
1 The legal system
2 The police
3 The administration
4 The government
5 Loan questionDo you think that in this neighbourhood/village people generally trust each other in
(1)Do trust
(2)Do not trust
(3)Don’t know/
not sure
(4)No answer

Hjøllund, Paldam & Svendsen Social capital in Russia & Denmark24
6 NetworksSuppose your neighbor suffered an economic loss, say (RURAL: “crop failure”;URBAN “job loss”). In that situation, who do you think would assist him/herfinancially? [Record first three mentioned.]
1 No one would help
2 Family
3 Neighbors
4 Friends
5 Religious leader or group
6 Community leader
7 Business leader
8 Police
9 Family court judge
10 Patron/employer/benefactor
11 Political leader
12 Mutual support group to which s/he belongs
13 Assistance group to which s/he belongs
14 Other
15 Don’t know/not sure
16 No answer

Hjøllund, Paldam & Svendsen Social capital in Russia & Denmark25
7. People here look out mainly for the welfare of their own families and they are notmuch concerned with village/neighborhood welfare. Do you agree or disagree withthis statement?
1 Strongly agree
2 Agree
3 Disagree
4 Strongly disagree
5 Don’t know/not sure
6 No answer

Hjøllund, Paldam & Svendsen Social capital in Russia & Denmark26
8
Please tell me whether in general you agree or disagree with the following state-ments:
StronglyAgree
Agree Disagree Strongly Disagree
a Most people in this village/neighborhoodare basically honest and can be trusted
b People are always interested only in theirown welfare
c Members in this village/neighborhood arealways more trustworthy than others
d In this village/neighborhood one has to bealert or someone is likely to take advantageof you
e If I have a problem there is always some-one to help you
f I do not pay attention to the opinions ofothers in the village/neighborhood
g Most people in this village/neighborhoodare willing to help if you need it
h This village/neighborhood has prospered inthe last five years
i I feel accepted as a member of this village/neighborhood
j If you drop your purse or wallet in theneighborhood, someone will see it and return it to you

Hjøllund, Paldam & Svendsen Social capital in Russia & Denmark27
9 Civic actions:
In the last three years have you personally done any of the following things
(1)Yes
(2)No
(3)Don’tKnow
a Voted in the election
b Actively participated in an association
c Made a personal contact with an influential person
d Made newspapers, radio and TV interested in a problem
e Actively participated in an information campaign
f Actively participated in an election campaign
g Taken part in a protest march or demonstration
h Contacted your elected representative
i Taken part in a sit-in or disruption of government meetings/offices
j Talked with other people in your area about a problem
k Notified the court or police about a problem
l Made a donation of money or in-kind
m Volunteered for a charitable organization

Hjøllund, Paldam & Svendsen Social capital in Russia & Denmark28
DEMOGRAPHICS
GenderMaleFemale
Age
18-2425-3435-4445-5960-
Education
Incomplete middleMiddle, specialized middleIncomplete higher, higher
Social position
BusinessmanManagerProfessional (with higher education)Blue collar workerSupporting personnel (no higher education)MilitaryStudentUnemployedPensionerHousewife
Monthly per capita income
Below 600 roubles600-10001000-15001500-2000Above 2000
Type of population center

Hjøllund, Paldam & Svendsen Social capital in Russia & Denmark29
Cities 1mln and above300,000-1,000,000100,000-300,000Towns below 100,000Rural
Regions (Federal Districts)
St.PetersburgMoscowUralsPrivolzhski (Volga)Yuzhnyi (Southern)Severo-Zapadnyi (North-Western)Tsentralnyi (Central)