soa international experience study estonia 2009 … international experience study estonia 2009...
TRANSCRIPT

SOA International Experience Study
Estonia 2009
Introduction
The 2009 Estonia experience study was undertaken as a joint research venture between the 4 Estonia insurance companies and the Society of Actuaries (SOA) International Experience Study (IES).
The 2009 Estonia experience study includes both mortality and persistency studies of policies in force any time during the 2006‐2008 study period. The study applies to the entire portfolios of the contributing companies and these companies represent the vast majority of the Estonia individual life insurance market. Separate studies were performed based upon policy counts and insurance in force. Actual mortality was compared to expected mortality based upon the SOA 1975‐80 select and ultimate mortality table.
Each of the contributing companies prepared a policy file of all policies in force during the study period that including policy, demographic and status information. These files were processed by each company using the SOA IES experience study tool and summary information was sent to the SOA Research Department for compilation. This report presents some of the summary information that was returned to the Estonia actuaries for their review.
The study relied primarily upon the company actuaries to validate the quality of the data submitted although members of the SOA International Experience Study Working Group did review the data submissions for high level consistency. This study is the first study performed in Estonia and although there were no known data issues it is still expected that data quality is likely to improve as subsequent studies are performed.

Results
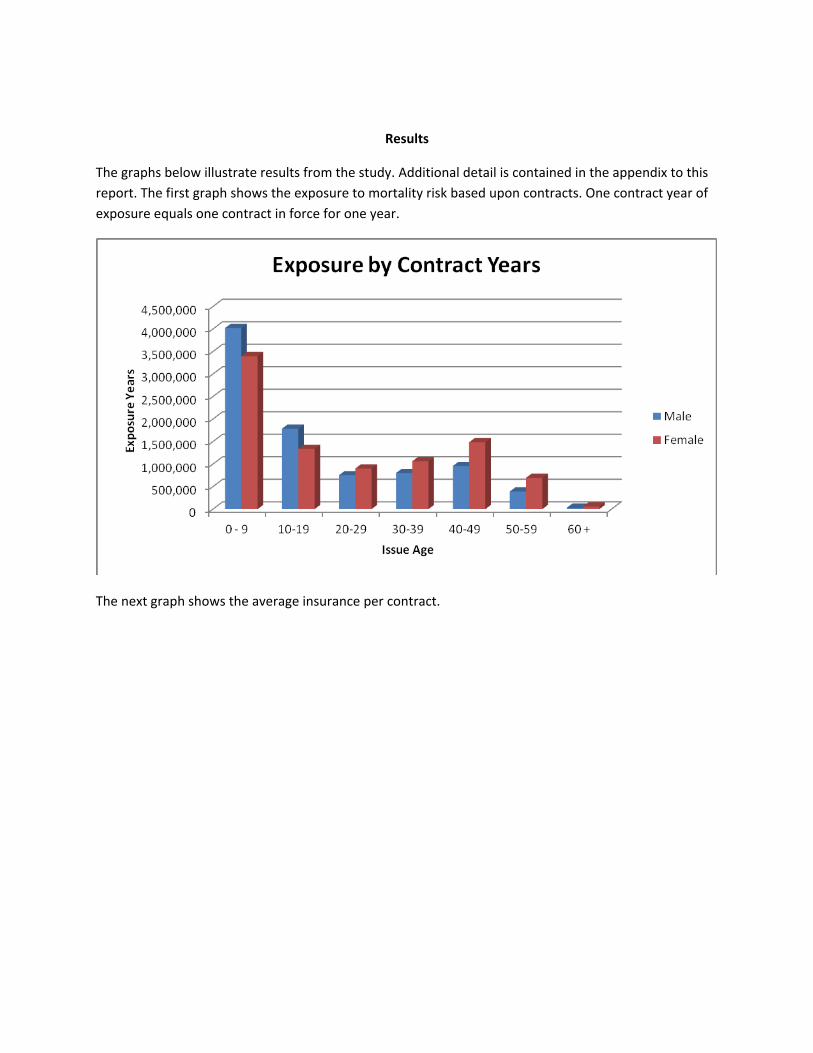
The graphs below illustrate results from the study. Additional detail is contained in the appendix to this report. The first graph shows the exposure to mortality risk based upon contracts. One contract year of exposure equals one contract in force for one year.
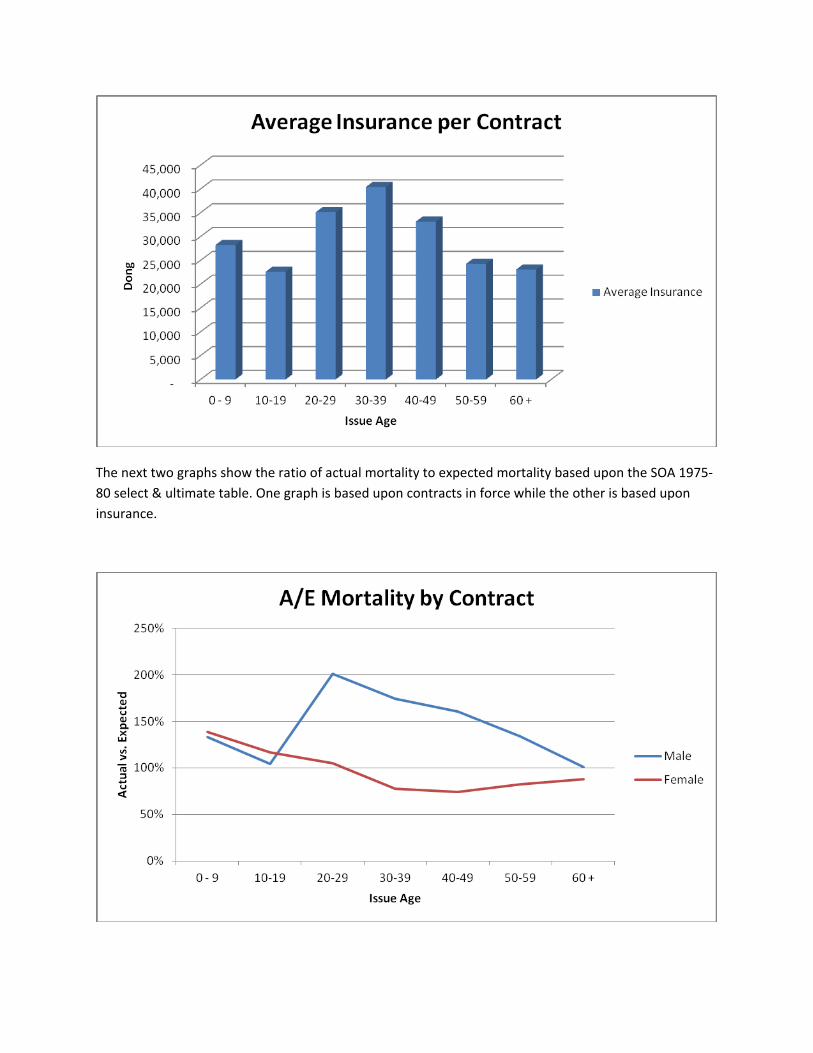
The next graph shows the average insurance (in thousand Kroons) per contract.
The next two graphs show the ratio of actual mortality to expected mortality based upon the SOA 1975‐80 select & ultimate table. One graph is based upon contracts in force while the other is based upon insurance.

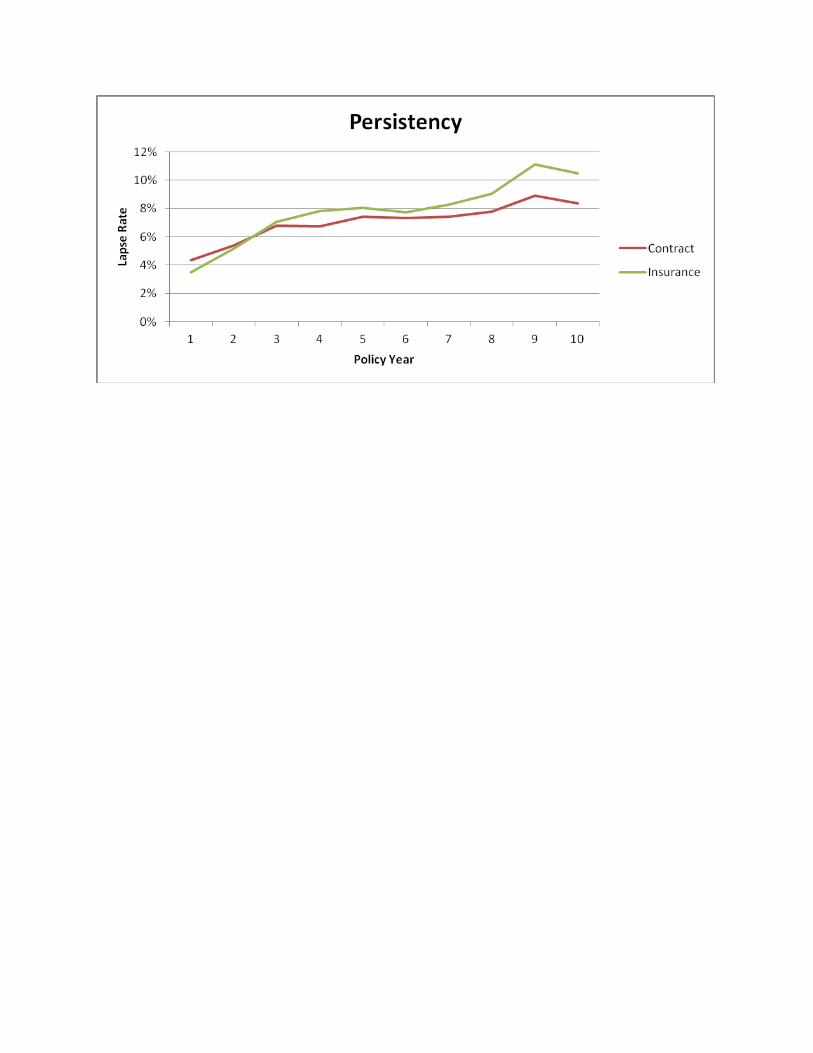
The final graph presents persistency by policy years

Appendix A: Mortality Data
Mortality By Contract ‐ Males
Age At Issue Exposure
Actual Claims
Expected Claims
Actual / Expected
0 ‐ 9 11,432 11 8 143% 10‐19 2,595 3 3 111% 20‐29 51,562 34 40 86% 30‐39 79,518 89 91 98% 40‐49 46,559 109 120 91% 50‐59 14,062 83 67 124% 60 + 1,958 20 20 100%
Total 207,686 349 348 100%
Mortality by Contract ‐ Females
Age At Issue Exposure
Actual Claims
Expected Claims
Actual / Expected
0 ‐ 9 11,095 14 4 371% 10‐19 2,793 2 1 168% 20‐29 50,220 14 23 62% 30‐39 76,937 36 67 54% 40‐49 52,478 78 100 78% 50‐59 16,973 47 49 96% 60 + 1,970 6 8 72%
Total
212,465 197 252 78%
Mortality by Insurance – Males (Amounts in Kroon)
Age At Issue Exposure
Actual Claims
Expected Claims
Actual / Expected
0 ‐ 9 257,085,273 154,234 142,761 108% 10‐19 146,493,994 65,992 150,828 44% 20‐29 9,645,195,535 5,161,009 7,151,245 72% 30‐39 13,030,590,469 11,208,194 13,207,852 85% 40‐49 5,296,317,043 13,392,495 11,920,866 112% 50‐59 1,175,782,074 2,935,585 5,575,418 53% 60 + 222,879,569 2,986,592 3,044,613 98%
Total 29,774,343,958 35,904,101 41,193,582 87%

Mortality by Insurance – Females
(Amounts in Kroon)
Age At Issue Exposure
Actual Claims
Expected Claims
Actual / Expected
0 ‐ 9 249,170,125 219,890 76,421 288% 10‐19 137,661,106 44,362 56,814 78% 20‐29 5,424,555,333 1,223,698 2,240,138 55% 30‐39 7,443,518,331 2,352,095 5,668,137 41% 40‐49 4,024,506,534 3,889,780 6,719,317 58% 50‐59 819,644,047 1,068,944 2,191,765 49% 60 + 78,752,150 83,829 388,511 22%
Total
18,177,807,626 8,882,597 17,341,103 51%

Appendix B: Persistency Data
Persistency by Contract
Policy Year Exposure Lapses Lapse Rate 1 87,489 3,810 4.4%2 67,322 3,644 5.4%3 53,101 3,600 6.8%4 44,814 3,030 6.8%5 38,321 2,838 7.4%6 36,904 2,701 7.3%7 34,097 2,526 7.4%8 27,533 2,141 7.8%9 16,612 1,478 8.9%10 8,134 681 8.4%
Total 414,328 26,449 6.4%
Persistency by Insurance (Amounts in Kroon)
Policy Year Exposure Lapses Lapse Rate 1 14,480,711,685 506,811,511 3.5%2 9,812,091,851 506,737,205 5.2%3 6,779,898,429 478,333,422 7.1%4 5,254,438,629 412,056,937 7.8%5 3,755,569,694 303,504,738 8.1%6 2,849,499,977 221,206,186 7.8%7 2,326,087,949 193,122,217 8.3%8 1,888,496,651 171,174,496 9.1%9 1,199,676,609 133,674,486 11.1%10 599,240,089 62,908,409 10.5%
Total 48,945,711,564 2,989,529,607 6.1%
Appendix C: Contributing Companies
Compensa Sampo SEB Swedbank

SOA International Experience Study
Philippines 2008
Introduction
The 2008 Philippines experience study was undertaken as a joint research venture between the Actuarial Society of the Philippines (ASP) and the Society of Actuaries (SOA) International Experience Study (IES).
The 2008 Philippines experience study includes both mortality and persistency studies of policies in force any time during the 2004‐2006 study period. The study applies to the entire portfolios of the 19 contributing companies and these companies represent roughly about three‐quarters of the entire Philippines individual life insurance market. Studies were performed based upon policy counts. Actual mortality was compared to expected mortality based upon the SOA 1975‐80 select and ultimate mortality table.
The policy types included in the study are Whole Life, Endowment, Term and Variable Life and are either Philippine Peso or US Dollar denominated. The majority of these policies are marketed through agency channels, while the remaining are either sold through bancassurance or alternative distribution. The data was also inclusive of both standard and substandard risk classes, as well as medical and non‐medically underwritten policies.
Each of the contributing companies prepared a policy file of all policies in force during the study period that including policy, demographic and status information. These files were processed by each company using the SOA IES experience study tool and summary information was sent to the SOA Research Department for compilation. This report presents some of the summary information that was returned to the Philippines actuaries for their review.
The study relied primarily upon the company actuaries to validate the quality of the data submitted although members of the SOA International Experience Study Working Group did review the data submissions for high level consistency. This study is the first study performed in Philippines and although there were no known data issues it is still expected that data quality is likely to improve as subsequent studies are performed.

Results
The graphs below illustrate results from the study. Additional detail is contained in the appendix to this report. The first graph shows the exposure to mortality risk based upon contracts. One contract year of exposure equals one contract in force for one year.
The next graph shows the ratio of actual mortality to expected mortality based upon the SOA 1975‐80 select & ultimate table. This graph is based upon contracts in force.

The final graph presents persistency by policy years

Appendix A: Mortality Data
Mortality By Contract ‐ Males
Age At Issue Exposure
Actual Claims
Expected Claims
Actual / Expected
0 ‐ 9 438,713 173 228 76% 10‐19 162,991 141 160 88% 20‐29 468,655 737 591 125% 30‐39 571,877 1,816 1,574 115% 40‐49 335,907 2,367 1,969 120% 50‐59 99,700 1,502 1,263 119% 60 + 25,342 762 646 118%
Total
2,103,185 7,498 6,431 117%
Mortality by Contract ‐ Females
Age At Issue Exposure
Actual Claims
Expected Claims
Actual / Expected
0 ‐ 9 406,039 127 121 105% 10‐19 140,905 57 63 90% 20‐29 534,824 394 435 91% 30‐39 563,273 885 1,004 88% 40‐49 369,746 1,195 1,322 90% 50‐59 137,937 785 852 92% 60 + 32,660 530 479 111%
Total
2,185,385 3,973 4,276 93%

Appendix B: Persistency Data
Persistency by Contract
Policy Year Exposure Lapses Lapse Rate 1 559,515 123,698 22.1%2 453,145 81,931 18.1%3 374,020 29,625 7.9%4 350,268 20,078 5.7%5 341,336 17,982 5.3%6 321,621 18,903 5.9%7 291,912 16,863 5.8%8 259,289 14,726 5.7%9 231,261 11,421 4.9%10 206,180 10,086 4.9%11 156,052 9,214 5.9%12 144,643 7,808 5.4%13 140,816 6,876 4.9%14 134,849 5,785 4.3%15 136,040 5,430 4.0%16 133,652 5,156 3.9%17 131,613 4,969 3.8%18 115,329 4,519 3.9%19 95,568 3,749 3.9%
Total 4,577,108 398,819 8.7%

Appendix C: Contributing Companies (in alphabetical order)
Asian Life Financial Asian Life and General Assurance Corp. Ayala Life Assurance Country Banker’s Life Insurance Corporation First Life Financial Company Great Life Financial Assurance Corp. Great Pacific Life Insular Life Assurance Manufacturers Life Insurance Co. National Life Insurance Co. of the Philippines Philam Life & Gen. Philippine AXA Life Paramount Life & Gen. Ins. Co. Pioneer Life Inc. Phil. International Life Insurance PNB Life Insurance, Inc. Pru Life Ins. Corp of UK Sony Life Insurance (Phils.) United Coconut Planters Life

SOA International Experience Study
Vietnam 2009
Introduction
The 2009 Vietnam experience study was undertaken as a joint research venture between the 9 Vietnamese insurance companies and the Society of Actuaries (SOA) International Experience Study (IES).
The 2009 Vietnam experience study includes both mortality and persistency studies of policies in force any time during the 2004‐2008 study period. The study applies to the entire portfolios of the contributing companies and these companies represent the entire Vietnam individual life insurance market. Separate studies were performed based upon policy counts and insurance in force. Actual mortality was compared to expected mortality based upon the SOA 1975‐80 select and ultimate mortality table.
Each of the contributing companies prepared a policy file of all policies in force during the study period that including policy, demographic and status information. These files were processed by each company using the SOA IES experience study tool and summary information was sent to the SOA Research Department for compilation. This report presents some of the summary information that was returned to the Vietnamese actuaries for their review.
The study relied primarily upon the company actuaries to validate the quality of the data submitted although members of the SOA International Experience Study Working Group did review the data submissions for high level consistency. This study is the second study performed in Vietnam and although there were no known data issues it is still expected that data quality is likely to improve as subsequent studies are performed.
Results
The graphs below illustrate results from the study. Additional detail is contained in the appendix to this report. The first graph shows the exposure to mortality risk based upon contracts. One contract year of exposure equals one contract in force for one year.
The next graph shows the average insurance per contract.
The next two graphs show the ratio of actual mortality to expected mortality based upon the SOA 1975‐80 select & ultimate table. One graph is based upon contracts in force while the other is based upon insurance.

The final graph presents persistency bay policy years

Appendix A: Mortality Data
Mortality By Contract ‐ Males
Age At Issue Exposure
Actual Claims
Expected Claims
Actual / Expected
0 ‐ 9 4,023,285 2,000 1,501 133% 10‐19 1,787,982 1,458 1,394 105% 20‐29 753,560 1,168 581 201% 30‐39 800,687 1,549 888 174% 40‐49 958,948 3,740 2,327 161% 50‐59 392,804 2,496 1,861 134% 60 + 30,607 290 287 101%
Total 8,747,872 12,701 8,840 144%
Mortality by Contract ‐ Females
Age At Issue Exposure
Actual Claims
Expected Claims
Actual / Expected
0 ‐ 9 3,397,775 1,201 867 138% 10‐19 1,336,951 552 474 116% 20‐29 901,467 394 374 105% 30‐39 1,062,165 673 868 77% 40‐49 1,485,154 1,849 2,493 74% 50‐59 695,234 1,643 1,995 82% 60 + 59,239 263 298 88%
Total 8,937,984 6,573 7,369 89%
Mortality by Insurance – Males (Amounts in 1 million VND)
Age At Issue Exposure
Actual Claims
Expected Claims
Actual / Expected
0 ‐ 9 115,650,517 83,486 42,942 194% 10‐19 40,766,344 30,199 31,904 95% 20‐29 28,509,086 31,940 21,691 147% 30‐39 35,947,939 50,355 38,454 131% 40‐49 35,705,786 113,117 83,815 135% 50‐59 10,870,332 55,854 48,096 116% 60 + 790,236 6,982 7,308 96%
Total
268,240,239 371,933
274,209 136%
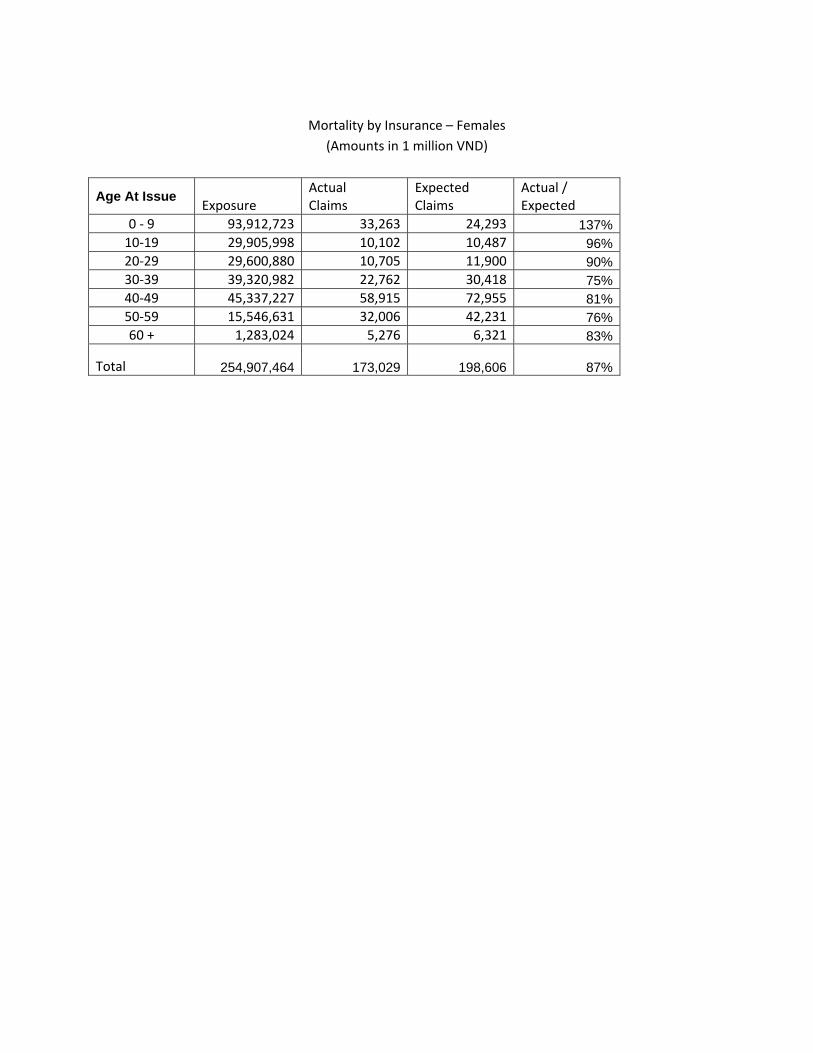
Mortality by Insurance – Females
(Amounts in 1 million VND)
Age At Issue Exposure
Actual Claims
Expected Claims
Actual / Expected
0 ‐ 9 93,912,723 33,263 24,293 137% 10‐19 29,905,998 10,102 10,487 96% 20‐29 29,600,880 10,705 11,900 90% 30‐39 39,320,982 22,762 30,418 75% 40‐49 45,337,227 58,915 72,955 81% 50‐59 15,546,631 32,006 42,231 76% 60 + 1,283,024 5,276 6,321 83%
Total
254,907,464 173,029
198,606 87%

Appendix B: Persistency Data
Persistency by Contract
Policy Year Exposure Lapses Lapse Rate 1 2,928,998 338,315 11.6%2 2,899,619 450,667 15.5%3 2,866,931 256,612 9.0%4 2,807,872 210,657 7.5%5 2,531,065 176,058 7.0%6 1,893,609 129,142 6.8%7 1,174,374 71,295 6.1%
Total 17,102,468 1,632,745 9.5%
Persistency by Insurance (Amounts in Dong)
Policy Year Exposure Lapses Lapse Rate 1 109,394,644 10,517,467 9.6%2 91,860,660 14,666,064 16.0%3 80,246,193 6,817,759 8.5%4 76,409,171 5,271,684 6.9%5 66,423,796 4,616,439 6.9%6 49,876,648 3,619,665 7.3%7 31,793,719 2,088,800 6.6%
Total 506,004,831 47,597,879 9.4%

Appendix C: Contributing Companies
ACE AIA BaoViet Cathy Dai‐Ichi Great Eastern Manulife Prevoir Prudential LLC

Countries with 3 companies (to
maintain confidentiality)
Excluding Western Europe & Japan
Exisiting Local Actuarial Society Studies 3 3
Current Sponsor Possibiliites 11 8
Additional Sponsors 28 13
Maximum Possible Studies 42 24
AfricaBeninBotswanaBurkina FasoCameroonCentral AfricaEgyptGabonGhanaIvory CoastMadagascarMaliMaltaMoroccoSenegalSouth AfricaTogoZimbawe
South AmericaArgentinaBoliviaBrazilChileColumbiaMexicoPeruUruguayVenezuela
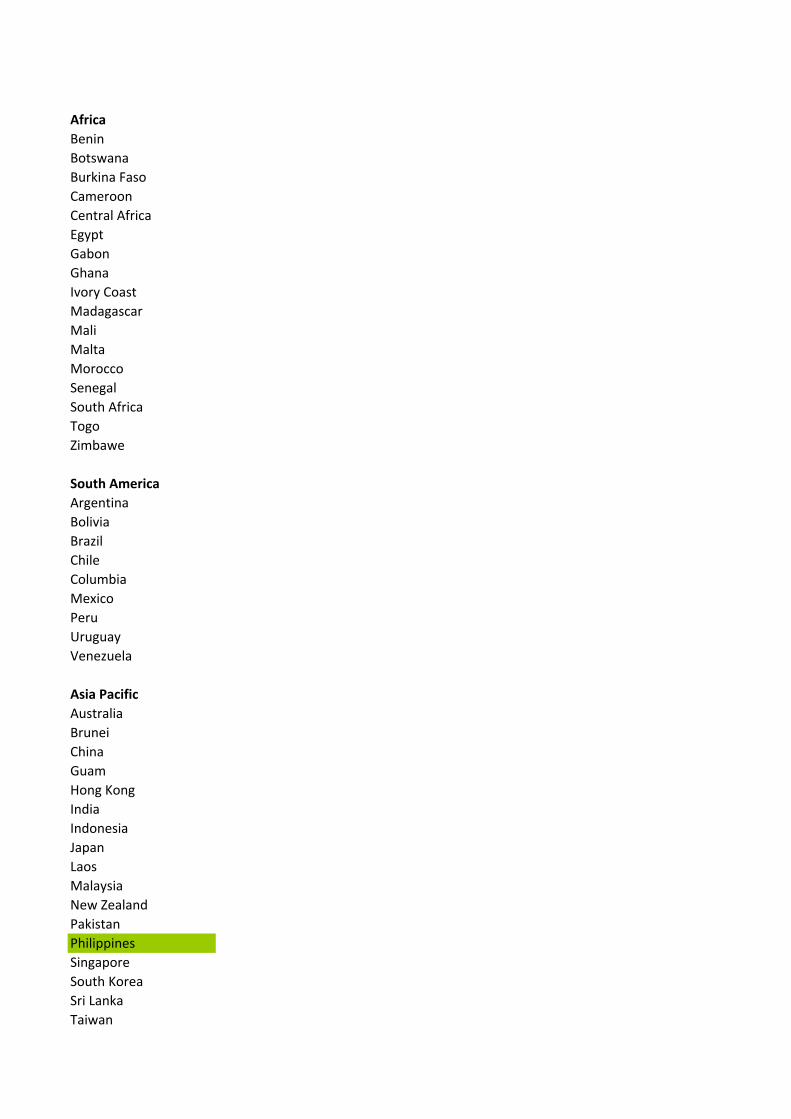
Asia PacificAustraliaBruneiChinaGuamHong KongIndiaIndonesiaJapanLaosMalaysiaNew ZealandPakistanPhilippinesSingaporeSouth KoreaSri LankaTaiwan

ThailandVietnam
Western EuropeAustriaBelgiumDenmarkFinlandFranceGermanyGreeceGuernseyIrelandItalyLiechtensteinLuxembourgMonacoNetherlandsNorwayPortugalSpainSwedenSwitzerlandUK
Central/Eastern EuropeAzerbajanBulgeriaCroatiaCyprusCzechEstoniaHungaryKazahkstanLatviaLithuaniaPolandRomaniaRussiaSlovakiaSloveniaTurkeyUkraine
Middle EastBehrainIsrealLebanonOmanQatar

Saudi ArabiaUnited Arab Emerites

AXA ING Met NYL Pru ZFS CommentAfricaBeninBotswana XBurkina FasoCameroon XCentral AfricaEgyptGabon XGhanaIvory Coast XMadagascarMaliMalta XMorocco X XSenegal XSouth Africa XTogoZimbawe X
South AmericaArgentina X X X X XBolivia XBrazil X X XChile X X XColumbiaMexico X X X X XPeru XUruguay X XVenezuela X
Asia PacificAustralia X X X X
Corporate Sponsors

BruneiChina X X X X XGuam XHong Kong X X X X X X HKAS produces studies currentlyIndia X X X X XIndonesia X X XJapan X X X X X JAS produces studies currentlyLaosMalaysia X X XNew Zealand X X XPakistanPhilippines X XSingapore X X XSouth Korea X X X X XSri LankaTaiwan X X X X XThailand X X X XVietnam
Western EuropeAustria XBelgium X X X XDenmarkFinland XFrance X X XGermany X X XGreece X XGuernseyIreland X X XItaly X X XLiechtenstein XLuxembourg X X XMonaco XNetherlands X X X
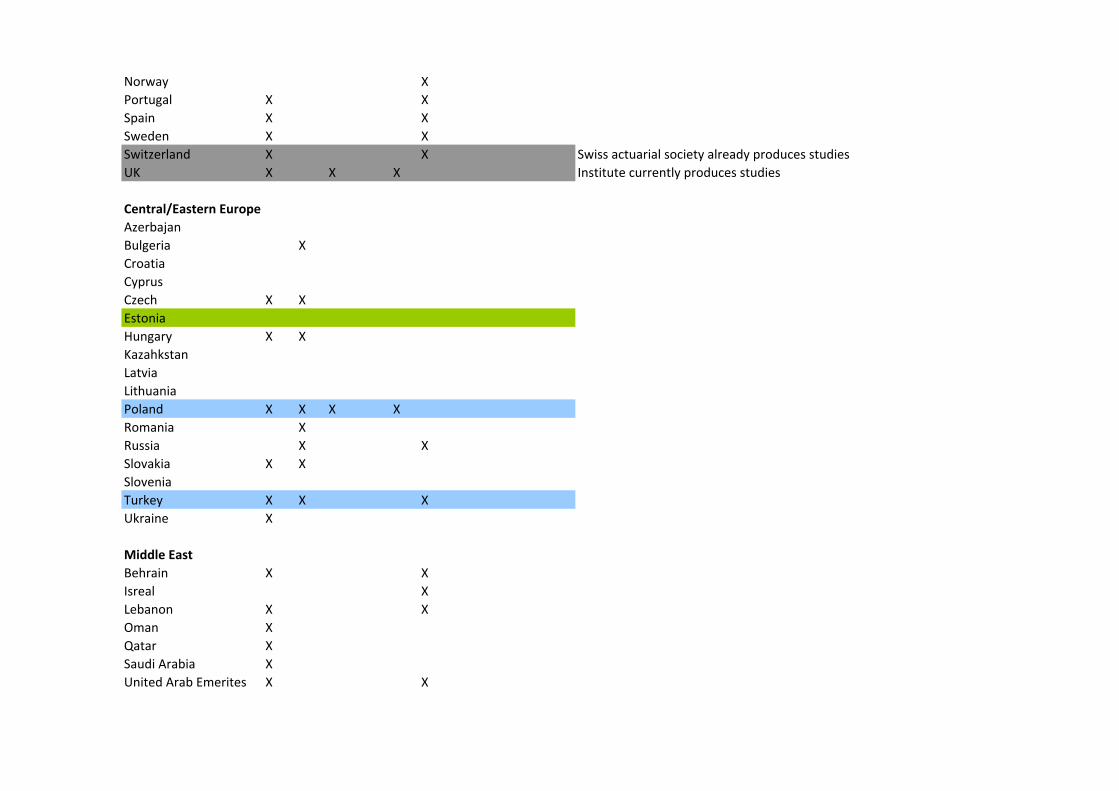
Norway XPortugal X XSpain X XSweden X XSwitzerland X X Swiss actuarial society already produces studiesUK X X X Institute currently produces studies
Central/Eastern EuropeAzerbajanBulgeria XCroatiaCyprusCzech X XEstoniaHungary X XKazahkstanLatviaLithuaniaPoland X X X XRomania XRussia X XSlovakia X XSloveniaTurkey X X XUkraine X
Middle EastBehrain X XIsreal XLebanon X XOman XQatar XSaudi Arabia XUnited Arab Emerites X X

AXA ING Met NYL Pru ZFS Allianz CommentsAfricaBenin XBotswana XBurkina Faso XCameroon X XCentral Africa XEgypt XGabon XGhana XIvory Coast X XMadagascar XMali XMalta XMorocco X X XSenegal X XSouth Africa X XTogo XZimbawe X
South AmericaArgentina X X X X X XBolivia XBrazil X X X XChile X X XColumbia XMexico X X X X X XPeru XUruguay X XVenezuela X X
Asia Pacific
Corporate Sponsors

Australia X X X X XBrunei XChina X X X X X XGuam XHong Kong X X X X X X X HKAS produces studies currentlyIndia X X X X X XIndonesia X X X XJapan X X X X X X JAS produces studies currentlyLaos XMalaysia X X X XNew Zealand X X X XPakistan XPhilippines X XSingapore X X X XSouth Korea X X X X X XSri Lanka XTaiwan X X X X X XThailand X X X X XVietnam
Western EuropeAustria X XBelgium X X X X XDenmark XFinland X XFrance X X X XGermany X X X XGreece X X XGuernsey XIreland X X X XItaly X X X XLiechtenstein X XLuxembourg X X X X

Monaco XNetherlands X X X XNorway X XPortugal X X XSpain X X XSweden X X XSwitzerland X X X Swiss actuarial society already produces studiesUK X X X X Institute already produces studies
Central/Eastern EuropeAzerbajan XBulgeria X XCroatia XCyprus XCzech X X XEstonia XHungary X X XKazahkstan XLatvia XLithuania XPoland X X X X XRomania X XRussia X X XSlovakia X X XSlovenia XTurkey X X X XUkraine X X
Middle EastBehrain X X XIsreal XLebanon X X XOman X
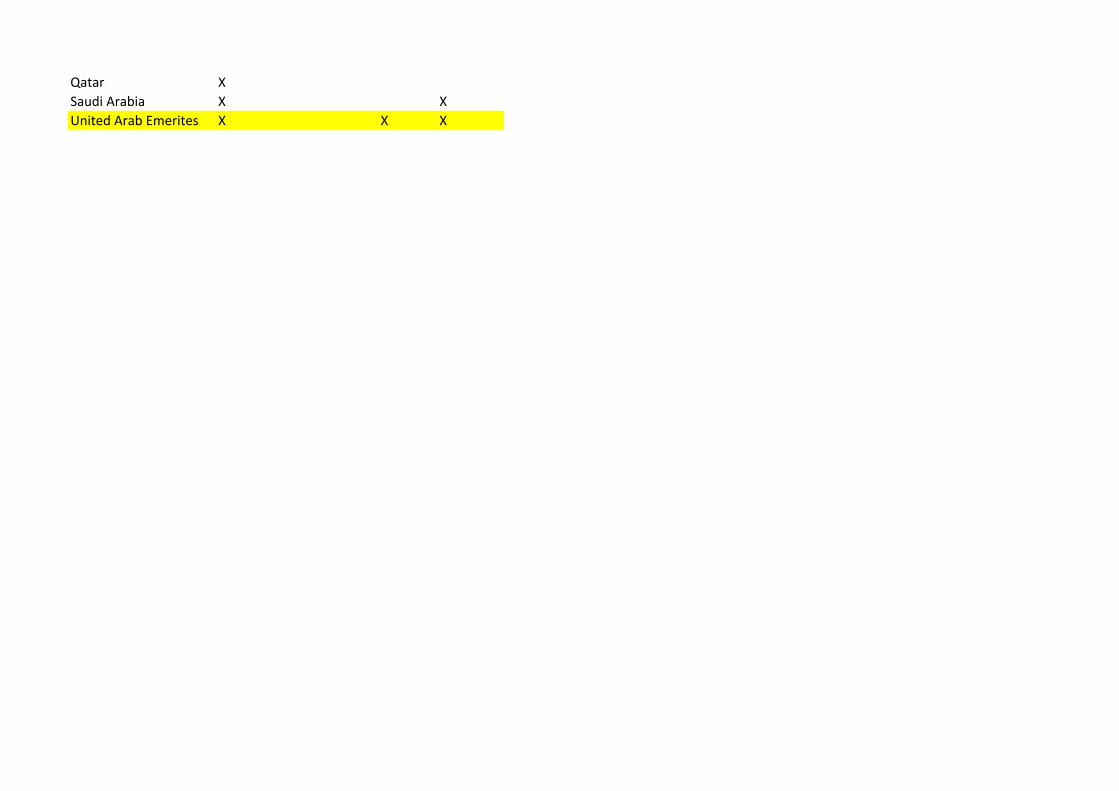
Qatar XSaudi Arabia X XUnited Arab Emerites X X X