soa gain recovery wavelength dependence: simulation and measurement using a single-color pump-probe...
TRANSCRIPT
SOA gain recovery wavelengthdependence: simulation and
measurement using a single-colorpump-probe technique
W. Mathlouthi, F. Vacondio, P. Lemieux, Leslie A. RuschCenter of optics, photonics and lasers, Department of electrical and computer engineering,
Universite Laval, Quebec, QC, G1V 0A6, Canada
Abstract: Measurements to date of the wavelength dependency of gainrecovery time in semiconductor optical amplifiers (SOAs) have mostlyused pump-probe techniques with a pump and probe operated on distinctwavelengths. Choice of pump wavelength, and its relative proximity to theprobe wavelength, could influence measurements and impede unambiguousobservation of wavelength dependence on recovery dynamics. We use asingle-color pump-probe measurement technique to directly access thewavelength dependence of the gain recovery time in bulk InGaAsP SOAs.We used ultrashort pulses from a single mode locked laser to measureunambiguously the spectral dependency and temporal behavior of SOAs.Simulation results using a model that takes into account intra-band andinter-band contributions to SOA saturation, as well as experimental resultsfor the SOA tested, show recovery rate dependency similar to gain spectrum.
© 2008 Optical Society of America
OCIS codes:(060.2360) Semiconductor optical amplifiers; (060.4510) Optical communica-tions; (320.7110) Ultrafast Nonlinear Optics; (070.4340) Nonlinear Optical Signal Processing.
References and links1. W. Mathlouthi, P. Lemieux, M. Salsi, A. Vannucci, A. Bononi, and L. A. Rusch,“Fast and efficient dynamic
WDM semiconductor optical amplifier model,” IEEE J. Lightwave Technol.24,4353–4365 (2006).2. K. L. Hall, G. Lenz, A. M. Darwish and E. P. Ippen,“Subpicosecond gain and index nonlinearities in InGaAsP
diode Lasers,” Opt. Commun.111,589–612 (1994).3. L. Occhi, Y. Ito, H. Kawaguchi, L. Schares, J. Eckner and G. Guekos,“Intraband gain dynamics in bulk semi-
conductor optical amplifiers: Measurement and simulations,” IEEE J. Quantum Electron.38,54–60 (2002).4. T. Katayama and H. Kawagachi,“Measurement of ultrafast cross-gain Saturation dynamics of semiconductor
optical amplifier using two-color pump-probe technique,” IEEE Photon. Technol. Lett.16,855–857 (2004).5. F. Ginovart, M. Amaya and A. Sharaiha,“Semiconductor optical amplifier studies under optical injection at the
transparency wavelength in copropagative configuration,” IEEE J. Lightwave Technol.25,840–849 (2007).6. J. Dailey and T. L. Koch,“Impact of carrier heating on SOA transmission dynamics for wavelength conversion,”
IEEE Photon. Technol. Lett.19,1078–1080 (2007).7. S. Philippe, F. Surre, A. L. Bradley, P. Landais, M. Martinez-Rozas,“Dynamic pump-probe studies of TE and
TM modes in semiconductor optical amplifiers,” Proc. of SPIE5825,267–274 (2005).8. J. Mark and J. Mork,“Subpicosecond gain dynamics in InGaAsP optical amplifiers: experiment and theory,”
Appl. Phys. Lett.61,2281–2283 (1992).9. K. L. Hall, J. Mark, E. P. Ippen and G. Eisenstein,“Femtosecond gain dynamics in InGaAsP optical amplifiers,”
Appl. Phys. Lett.56,1740–1742 (1990).10. C. T. Hultgren, D. J . Dougherty and E. P. Ippen,“Above and below-band femtosecond nonlinearities in active
AlGaAs waveguides,” Appl. Phys. Lett.61,2767–2769 (1992).
(C) 2008 OSA 8 December 2008 / Vol. 16, No. 25 / OPTICS EXPRESS 20656#99511 - $15.00 USD Received 4 Aug 2008; revised 15 Oct 2008; accepted 30 Oct 2008; published 1 Dec 2008
11. R. J. Manning, D. A. O. Davies and J. K. Lucek,“Recovery rate in semiconductor laser amplifiers: optical andelectrical bias dependencies,” IEE Electron. Lett.30,1233–1235 (1994).
12. F. Girardin, G. Guekos and A. Houbavlis,“Gain recovery of Bulk semiconductor optical amplifiers,” IEEE Pho-ton. Technol. Lett.10,784–786 (1998).
13. R. Giller, R. J. Manning and D. Cotter,“Gain and phase recovery of optically excited semiconductor opticalamplifiers,” IEEE Photon. Technol. Lett.9, 1061–1063 (2006).
14. F. Ginovart and J. C. Simon, “Wavelength dependence of gain recovery time in a semiconductor optical amplifierbased wavelength shifter,” Proc. IEEE CLEO 181 (2003).
15. F. Ginovart, M. Amaya, and A. Sharaiha,“Wavelength dependence of semiconductor optical amplifier gain re-covery time with optical injection at the transparency wavelength,” Proc. ICTTA2, 2073–2078 (2006).
16. X. Li, D. Alexandropoulos, M. J. Adams, I. F. Lealman,“Wavelength dependence of gain recovery time in semi-conductor optical amplifiers,” Proc. of the SPIE5722,343–350 (2005).
17. R. Giller, R. J. Manning G. Talli and R. P. Webb, M. J. Adams,“Analysis of the dimensional dependence ofsemiconductor optical amplifier recovery speeds,” Opt. Express15,1773–1782 (2007).
18. A. Mecozzi and J. Mork,“Saturation effects in nondegenerate four-wave mixing between short optical pulses insemiconductor laser amplifiers,” IEEE J. Sel. Top. Quantum Electron.3, 1190–1207 (1997).
19. K. Inoue, T. Mukai and T. Saitoh,“Gain saturation dependence on signal wavelength in a travelling-wave semi-conductor laser amplifier,” IEE Electron. Lett.23,328–329 (1987).
20. D. Cassioli, S. Scotti and A. Mecozzi,“A time-domain computer simulator of the nonlinear response of semicon-ductor optical amplifiers,” IEEE J. Quantum Electron.36,1072–1080 (2000).
21. J. Mork and J. Mark,“Time-resolved spectroscopy of semiconductor laser devices: experiments and modelling,”Proc. of SPIE2399,146–149 (1995).
22. G. P. Agrawal and N. A. Olsson, “Self phase modulation and spectral broadning of optical pulses in semiconduc-tor laser amplifier,” IEEE J. Quantum Electron.25,2297–2306 (1989).
1. Introduction
Semiconductor optical amplifiers (SOAs) are promising components for access networks andmuch work has been done to develop efficient numerical simulation tools [1]. These algorithmssolve differential equations to obtain the behavior of the carrier density through time. They relyon an empirical description of the carrier recovery time, which is presumed to depend onlyon the carrier density. We experimentally investigate the carrier recovery time dependence onwavelength using a single color, all-fiber, simple experimental setup capable of measuring accu-rately this time constant for a specific wavelength.We use a pump-probe technique, previouslyreported in the literature in both free-space [2-10] and fiber [11-16] embodiments. Typicallydifferent wavelengths are used for pump and probe, although some exceptions exist. We beginby reviewing these previous carrier recovery time characterization methods to highlight theirdifferences as compared with the method we propose.
Free-space experiments to characterize gain recovery are usually complex and require sen-sitive alignment using lenses for coupling the pump and probe beams. In [2, 3] the authorsused single-wavelength, sub-picosecond lasers. They separated the pump and probe beams bycross-polarizing them. Although pump and probe are at the same wavelength, the gain recov-ery will depend on the probe polarization, as demonstrated in [7]. Note that some polarizationconversion could occur because of the strain on the waveguide.
In [4], a free-space, two-color pump probe technique used spectrally slicing of a supercon-tinuum source. For this setup, the carrier recovery depends on the wavelength separation ofthe pump and probe [5]. This is useful to understand carrier dynamics in wavelength conver-sion experiments, however, does not permit measurement of the carrier recovery at the pumpwavelength. In [2], a more sophisticated co-polarized pump-probe method using heterodynetechniques was demonstrated. The wavelength dependency of the gain recovery above trans-parency was not investigated and the experimental setup was complex. In an interesting workby Philippe,et al. [7], polarization dependency of the recovery time was investigated in free-space. They demonstrated a co-polarized pump-probe technique where the beams were sep-arated by counter-propagating them through the device under test. They showed that the TM
(C) 2008 OSA 8 December 2008 / Vol. 16, No. 25 / OPTICS EXPRESS 20657#99511 - $15.00 USD Received 4 Aug 2008; revised 15 Oct 2008; accepted 30 Oct 2008; published 1 Dec 2008

mode recovers faster than the TE mode, possibly due to light holes dynamics as well as strain.The counter propagation configuration was used to separate pump and probe at the same po-larization. Wavelength dependency was not investigated. In [8, 10], the pump and probe wereorthogonally polarized. Results for different wavelengths above and below transparency werepresented, but the authors focused only on the fast dynamics near the zero delay for InGaAsPand AlGaAs waveguides respectively. Note that in our work hereafter we focus on the wave-length dependence of the long-lived changes of the gain (above transparency).
The second set of experiments use all-fiber setups that are simpler, more flexible and canexploit common fiber components such as WDM couplers and filters. However, we will seethat these experiments were usually: 1) complex, and 2) only interested in pump and probe atdistinct wavelengths.
Dynamics for continuous wave probe signals were tested in [11, 12] where it was demon-strated that a continuous-wave probe signal results in a lower gain recovery time due to shorterstimulated lifetimes. A CW probe will saturate the SOA to some extent [11]. To avoid saturationthe probe power needs to be low. Probe recovery can then be smeared by the electronic noise,specially when using a wideband photoreceiver. Pulsed probe signals also allow measuring therecovery time due to spontaneous emission, Auger effect and amplified spontaneous emission(ASE) [12]. Hence, our method adopts the pulsed probe.
Measurements with a pulsed probe signal using two mode-locked lasers (MLLs) at differentwavelengths were reported in [13]. This requires tunable pump and probe optical pulses withshort duration. Frequency dividers are also required. Moreover, the timing jitter and synchro-nization between the pump and probe pulses are delicate [4]. In [6] a spectrogram technique wasused with a mode locked laser for the pump and a CW laser followed by an electro-absorptionmodulator for the probe. Note that the measured gain recovery time is in this case a function ofthe spectral separation between the two lasers [14]. This could provide insight to gain recoveryduring wavelength conversion experiments. It also allows characterization of the recovery at thepump wavelength. Our method uses a single mode locked laser, greatly reducing complexityand can give recovery time at a arbitrary pump wavelength.
In [13, 15, 16] the pump-probe technique is used to measure the gain of the probe pulseas a function of the wavelength difference and the time delay between the pump and probepulses. The pump and probe wavelengths are necessarily distinct so they can be separated viaproper filtering. Since different wavelengths have different gain and saturation, this will resultin recovery times depending on wavelength separation.
Results on wavelength dependency of SOA gain recovery have been contradictory. In [17],although using pulsed signals, no change was observed in the recovery rate while varying theprobe wavelength and keeping the pump wavelength fixed. In contrast, [16, 14, 15, 5] observewavelength dependency; however, tunable CW probe signals were used at distinct wavelengthsfrom the pump which was placed at the shorter wavelengths than the peak gain wavelength.In such a configuration, moving the probe toward the peak gain increases the saturation. Thismay be the reason why they observe decreasing recovery time, in contradiction with results wepresent here. Clearly pump-probe techniques on separate wavelengths give ambiguous resultsfor SOA gain recovery dependence on wavelength, possibly due to the choice of the pumpwavelength relative to that of the probe. In order to investigate the wavelength dependency, wechose an experimental approach similar to [7]. Since we used an all-fiber experimental setupwe could separate counter propagating pump and probe signals using a circulator even thoughthey were at the same polarization and wavelength. This approach has three advantages:
(C) 2008 OSA 8 December 2008 / Vol. 16, No. 25 / OPTICS EXPRESS 20658#99511 - $15.00 USD Received 4 Aug 2008; revised 15 Oct 2008; accepted 30 Oct 2008; published 1 Dec 2008
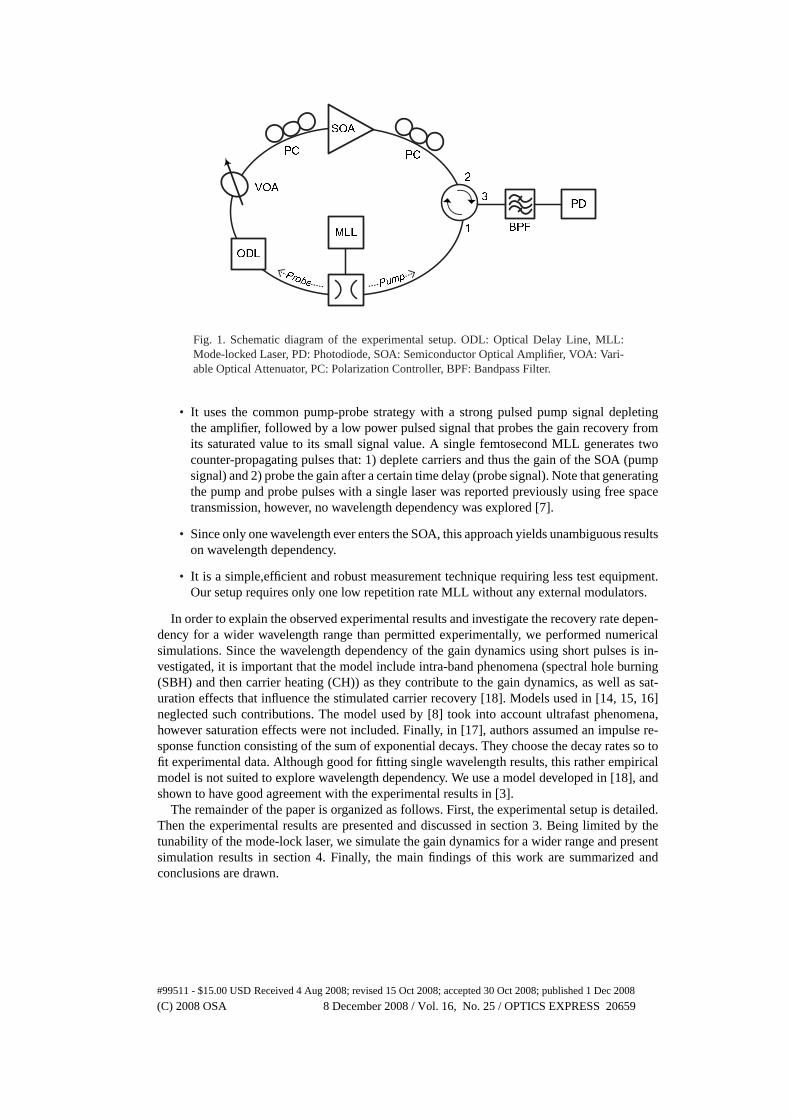
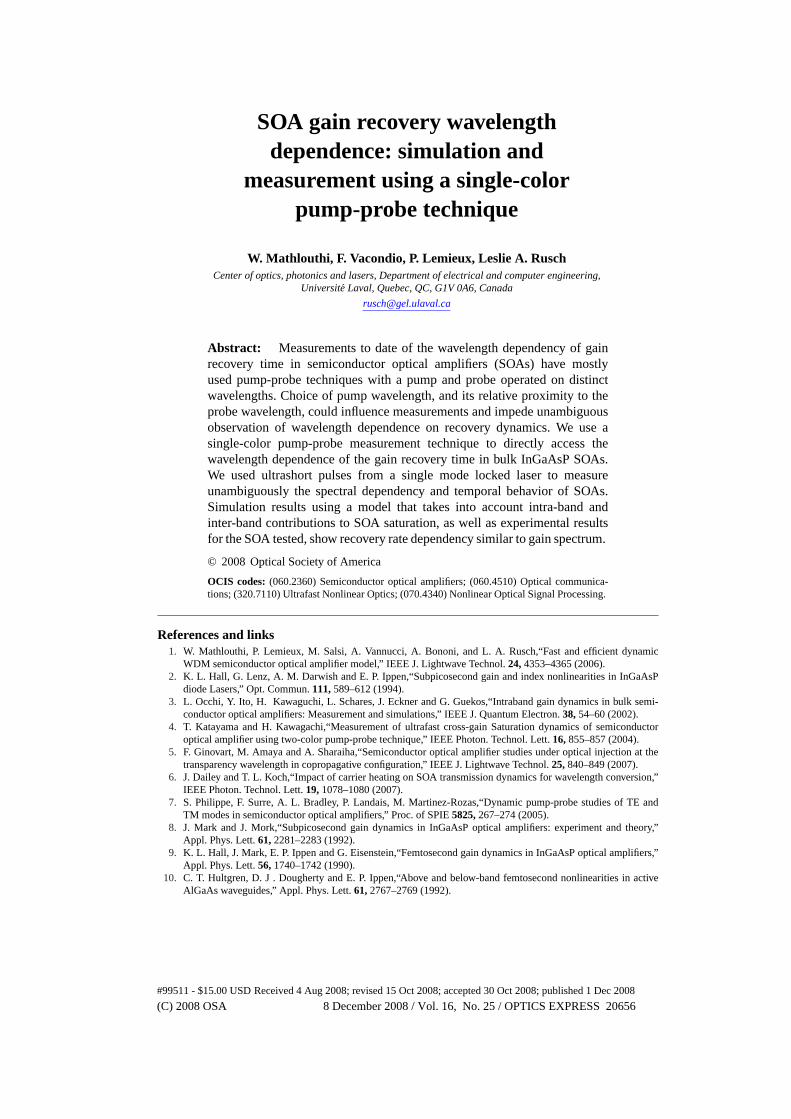
Fig. 1. Schematic diagram of the experimental setup. ODL: Optical Delay Line, MLL:Mode-locked Laser, PD: Photodiode, SOA: Semiconductor Optical Amplifier, VOA: Vari-able Optical Attenuator, PC: Polarization Controller, BPF: Bandpass Filter.
• It uses the common pump-probe strategy with a strong pulsed pump signal depletingthe amplifier, followed by a low power pulsed signal that probes the gain recovery fromits saturated value to its small signal value. A single femtosecond MLL generates twocounter-propagating pulses that: 1) deplete carriers and thus the gain of the SOA (pumpsignal) and 2) probe the gain after a certain time delay (probe signal). Note that generatingthe pump and probe pulses with a single laser was reported previously using free spacetransmission, however, no wavelength dependency was explored [7].
• Since only one wavelength ever enters the SOA, this approach yields unambiguous resultson wavelength dependency.
• It is a simple,efficient and robust measurement technique requiring less test equipment.Our setup requires only one low repetition rate MLL without any external modulators.
In order to explain the observed experimental results and investigate the recovery rate depen-dency for a wider wavelength range than permitted experimentally, we performed numericalsimulations. Since the wavelength dependency of the gain dynamics using short pulses is in-vestigated, it is important that the model include intra-band phenomena (spectral hole burning(SBH) and then carrier heating (CH)) as they contribute to the gain dynamics, as well as sat-uration effects that influence the stimulated carrier recovery [18]. Models used in [14, 15, 16]neglected such contributions. The model used by [8] took into account ultrafast phenomena,however saturation effects were not included. Finally, in [17], authors assumed an impulse re-sponse function consisting of the sum of exponential decays. They choose the decay rates so tofit experimental data. Although good for fitting single wavelength results, this rather empiricalmodel is not suited to explore wavelength dependency. We use a model developed in [18], andshown to have good agreement with the experimental results in [3].
The remainder of the paper is organized as follows. First, the experimental setup is detailed.Then the experimental results are presented and discussed in section 3. Being limited by thetunability of the mode-lock laser, we simulate the gain dynamics for a wider range and presentsimulation results in section 4. Finally, the main findings of this work are summarized andconclusions are drawn.
(C) 2008 OSA 8 December 2008 / Vol. 16, No. 25 / OPTICS EXPRESS 20659#99511 - $15.00 USD Received 4 Aug 2008; revised 15 Oct 2008; accepted 30 Oct 2008; published 1 Dec 2008

2. Single color pump-probe setup
Femtosecond pulses, generated by a single tunable mode-locked laser (Pritel) with a repetitionrate of20 MHz, are used to probe the gain recovery of a bulk SOA. The tuneable range ofthe laser is from1530nm up to1560nm. Thus, the experimental results were limited to thiswavelength range. To ensure perfect timing and exact wavelength match between probe andpump, a pulse emitted by the MLL is split by a3 dB coupler. The pump pulse, traveling counter-clockwise in Fig. 1, passes through an optical circulator then through a polarization controller(PC) and enters the SOA under test. The clockwise-traveling probe pulse exits the3 dB couplerand passes through an optical delay line (ODL), a variable optical attenuator (VOA) and a PC.The clockwise probe pulse then enters the device under test, an Optospeed SOA model1550MRI X1500, a bulk InP/InGaAsP amplifier with a peak gain wavelength at1560 nm whenbiased at500mA. After passing through the SOA, the probe pulse enters the circulator at port2, exits at port3, and then enters an optical tunable bandpass filter (BPF); the BPF is centered atthe maximum laser wavelength to reduce the amplified spontaneous emission (ASE) generatedby the SOA. The spectrum of the laser inside the loop was measured using an ANDO opticalspectrum analyzer with a resolution of0.01 nm. Based on the measured spectrum, the pumpand probe pulse widths were estimated to be2 ps (due to dispersion in the fiber). The temporalresolution of the ODL is3.3 ps.
Although the spectrum of the pulsed laser is larger than the3 dB bandwidth of the BPF(1.25 nm), the frequency content of the received signal is ultimately limited by the electricalbandwidth of the photodetector (PD) rather than by the optical BPF. The PD used is an Agilent86116A with a 3 dB bandwidth of50 GHz. Using the ODL, we can vary the relative delaybetween the probe and pump pulses. At each temporal step, the BPF is re-centered to maximizethe peak voltage of the electrical output pulse. The recovery curve is then built point by pointfor each pump-probe delay value. Hence, experimental results will not depend on the impulseresponse of the electronic circuitry. The temporal resolution is rather fixed by the minimalpump-probe time delay. Note that the SOA induced chirp will not affect the measured recoverysince the BPF is readjusted at each point. The probe polarization is set to maximize probepulse gain when the pump is not present at the amplifier (large delay between the pulses). Thepump polarization is adjusted to minimize the gain of the probe signal when both signals arepresent in the SOA. Thus, both probe and pump signals are aligned on the maximum SOA gainpolarization. We set mean probe power to−32dBm and mean pump power to−13dBm.
The time domain interpretation of our experiment is the following: the pump pulse has energyof approximately1.7 pJ (assuming a Gaussian pulse shape) and completely saturates the SOAas it passes through it and does not observe any significant gain. The counter-propagating probepulse has a much smaller energy than the pump, around20.5 fJ, and is amplified as it passesthrough the SOA. The gain the probe observes depends both on the time of its passage (relativeto that of the pump pulse) and its power. As the pulse has a FWHM (full width half maximum)of roughly 2 ps, it can sample the gain recovery with a high resolution in the time domain,limited by the precision of the delay line used (3.3 ps).
3. Experimental results
The gain recovery behavior of the SOA is sampled at five wavelengths in the tunable range ofthe MLL; detailed results are provided for1530, 1542and1555nm. The amplifier injectioncurrent is set at500 mA. We sweep the time delay between the arrival of the pump and theprobe signal at the SOA, with negative relative delay indicating the probe arriving before thepump. At the receiver, the gain of the probe signal is measured for the given relative time delay.As gain typically varies from wavelength to wavelength, we plot for each wavelength examined
(C) 2008 OSA 8 December 2008 / Vol. 16, No. 25 / OPTICS EXPRESS 20660#99511 - $15.00 USD Received 4 Aug 2008; revised 15 Oct 2008; accepted 30 Oct 2008; published 1 Dec 2008
-100 -50 0 50 100 150 200 250 300 350
90%
Gss
Pump-probe delay [ps]
No
rma
lized
pro
be g
ain
(A
U)
= 1530 nm
= 1542 nm
= 1555 nm
(a)
GSAT
10%
1525 1530 1535 1540 1545 1550 1555 1560
170
190
210
230
250
270
290
Wavelength (nm)
Ga
in R
eco
ve
ry T
ime (
ps
)
0
10
20
30
Ga
in [
dB
]
(b)
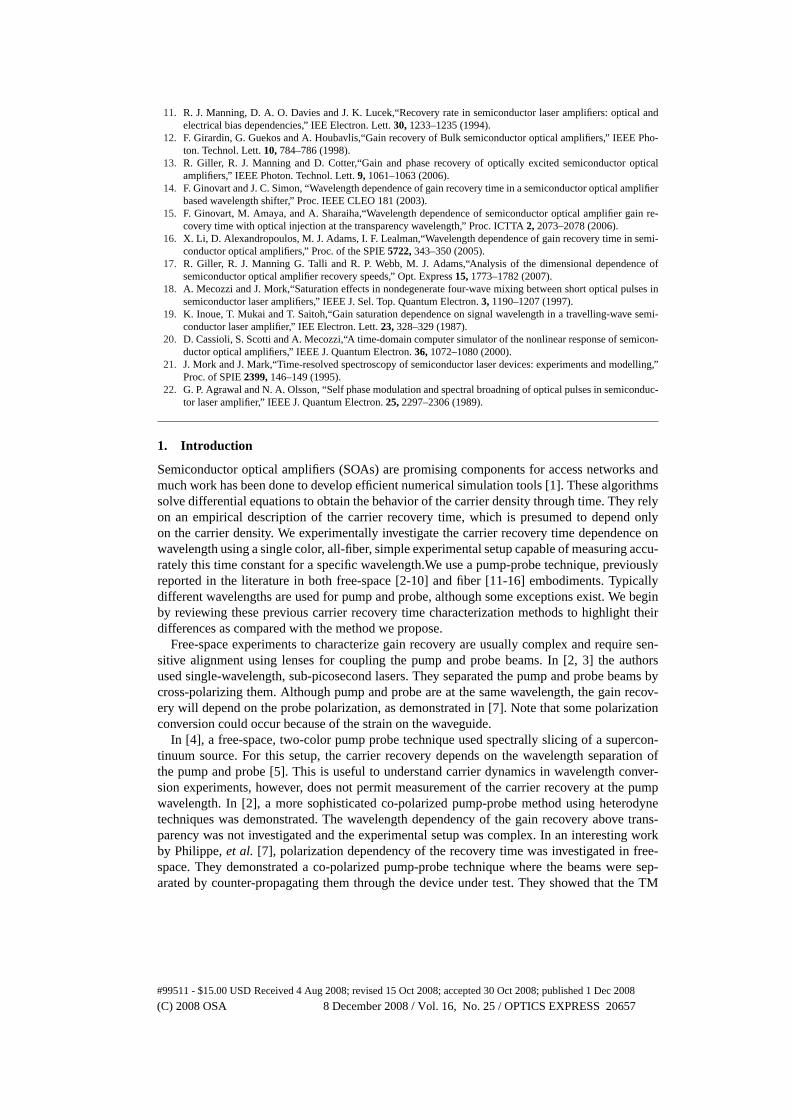
Fig. 2. (a) Measured change in the normalized probe gain versus pump-probe delay fordifferent wavelengths,GSS is the small signal gain, whileGSAT is the saturated gain; timeresolution is3.3 ps; (b) measured gain recovery time as a function of wavelength (squares)and SOA fiber-to-fiber gain spectrum (circles), continuous curves are a fit of the experi-mental points. Bias current is500mA and average pump power−13dBm.
the normalized gain defined by the following
G∆=
G−GSAT
GSS−GSAT=
V−Vmin
Vmax−Vmin(1)
At each wavelength,GSAT is the saturated gain,GSSis the small signal gain. These gain valuesare inferred from the measured photodetected voltages as indicated in (1) and explained inthe following. The peak voltage of the probe pulse is recorded for each relative delay. Theminimum peak voltage,Vmin, and the maximum peak voltage,Vmax, determine the saturated gainand small signal gain, respectively, for that wavelength. The gain recovery time (τ), defined as
τ ∆= t(G = 90%)− t(G = 10%) is then computed from our normalized gain curves.Figure 2(a) shows probe normalized gain versus relative pump-probe delay at1530, 1542
and1555nm. Note, that this experimental technique yields not only the time constantτ, butalso the complete gain recovery dynamics. These curves exhibit the typical time evolution ofsemiconductor amplifier gain: fast depletion (caused by the pump’s arrival when the probeis already at the SOA), followed by fast (first few ps) and slower recoveries (caused by theprobe arriving after the pump has depleted the carriers) [7]. As can be seen in this figure, wedid not detect any significant wavelength dependence in the fast recovery, within the3.3 psresolution of our measurements, as is also reported by others [4]. In [8],et al., however, avariation of this fast recovery with the wavelength was observed. Our work here focuses onthe slow component of the recovery for wavelengths above transparency. Unlike the initialfast recovery, the slow recovery due to injection, radiative and non-radiative recombination isclearly wavelength dependent. In Fig. 2(b), the solid line shows the gain recovery time,τ, as afunction of wavelength. Note that the solid line represents a spline fit to the experimental pointsshowed on the same figure. The fiber-to-fiber gain spectrum of our SOA is the dashed line inFig. 2(b), with the scale given to the right. We see that the gain recovery time as a functionof wavelength has a similar shape as the gain spectrum. Results show a variation of the gainrecovery constant ranging from193 to 230 ps. This is because recovering from a saturatedvalue (which varies slightly with wavelength [19]) to a lower steady state value is faster than
(C) 2008 OSA 8 December 2008 / Vol. 16, No. 25 / OPTICS EXPRESS 20661#99511 - $15.00 USD Received 4 Aug 2008; revised 15 Oct 2008; accepted 30 Oct 2008; published 1 Dec 2008
-20 0 20 40 60 80 100 120
No
rma
lize
d p
rob
e g
ain
(A
U)
Two exponential fitmeasurements
I = 410 mA = 1530 nm
(b)
GSAT
20%
60%
Pump-probe delay [ps]Pump-probe delay [ps]N
orm
ali
ze
d p
rob
e g
ain
(A
U)
Pavg
= -13 dBm
Pavg
= - 8 dBm
(a)Gss
GSAT
20%
80%
-100 0 100 200 300
I = 410 mA
I = 500 mA
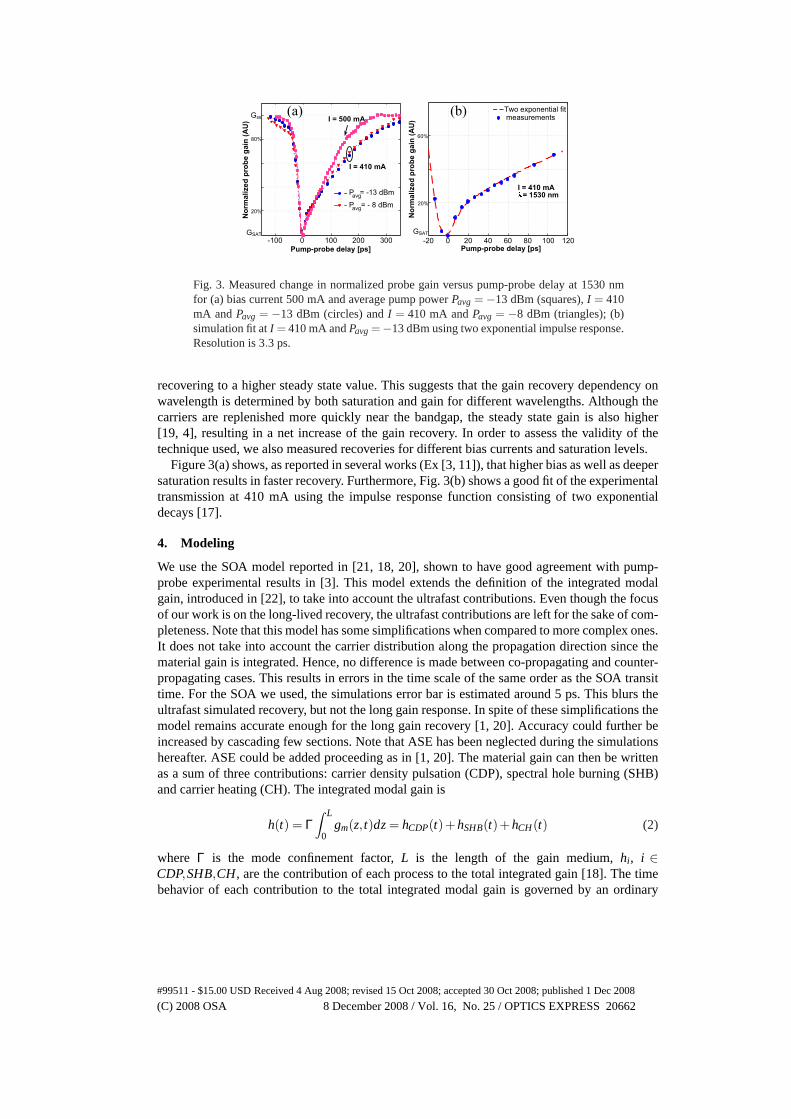
Fig. 3. Measured change in normalized probe gain versus pump-probe delay at1530nmfor (a) bias current500mA and average pump powerPavg =−13 dBm (squares),I = 410mA andPavg = −13 dBm (circles) andI = 410 mA andPavg = −8 dBm (triangles); (b)simulation fit atI = 410mA andPavg=−13dBm using two exponential impulse response.Resolution is3.3 ps.
recovering to a higher steady state value. This suggests that the gain recovery dependency onwavelength is determined by both saturation and gain for different wavelengths. Although thecarriers are replenished more quickly near the bandgap, the steady state gain is also higher[19, 4], resulting in a net increase of the gain recovery. In order to assess the validity of thetechnique used, we also measured recoveries for different bias currents and saturation levels.
Figure 3(a) shows, as reported in several works (Ex [3, 11]), that higher bias as well as deepersaturation results in faster recovery. Furthermore, Fig. 3(b) shows a good fit of the experimentaltransmission at410 mA using the impulse response function consisting of two exponentialdecays [17].
4. Modeling
We use the SOA model reported in [21, 18, 20], shown to have good agreement with pump-probe experimental results in [3]. This model extends the definition of the integrated modalgain, introduced in [22], to take into account the ultrafast contributions. Even though the focusof our work is on the long-lived recovery, the ultrafast contributions are left for the sake of com-pleteness. Note that this model has some simplifications when compared to more complex ones.It does not take into account the carrier distribution along the propagation direction since thematerial gain is integrated. Hence, no difference is made between co-propagating and counter-propagating cases. This results in errors in the time scale of the same order as the SOA transittime. For the SOA we used, the simulations error bar is estimated around5 ps. This blurs theultrafast simulated recovery, but not the long gain response. In spite of these simplifications themodel remains accurate enough for the long gain recovery [1, 20]. Accuracy could further beincreased by cascading few sections. Note that ASE has been neglected during the simulationshereafter. ASE could be added proceeding as in [1, 20]. The material gain can then be writtenas a sum of three contributions: carrier density pulsation (CDP), spectral hole burning (SHB)and carrier heating (CH). The integrated modal gain is
h(t) = Γ∫ L
0gm(z, t)dz= hCDP(t)+hSHB(t)+hCH(t) (2)
where Γ is the mode confinement factor,L is the length of the gain medium,hi , i ∈CDP,SHB,CH, are the contribution of each process to the total integrated gain [18]. The timebehavior of each contribution to the total integrated modal gain is governed by an ordinary
(C) 2008 OSA 8 December 2008 / Vol. 16, No. 25 / OPTICS EXPRESS 20662#99511 - $15.00 USD Received 4 Aug 2008; revised 15 Oct 2008; accepted 30 Oct 2008; published 1 Dec 2008

-35 -30 -25 -20 -15 -10 -5 00
5
10
15
20
25
30
Coupled input power [dBm]
Gain
[dB
]
1540 nm
1550 nm
1560 nm
1570 nm
1580 nm
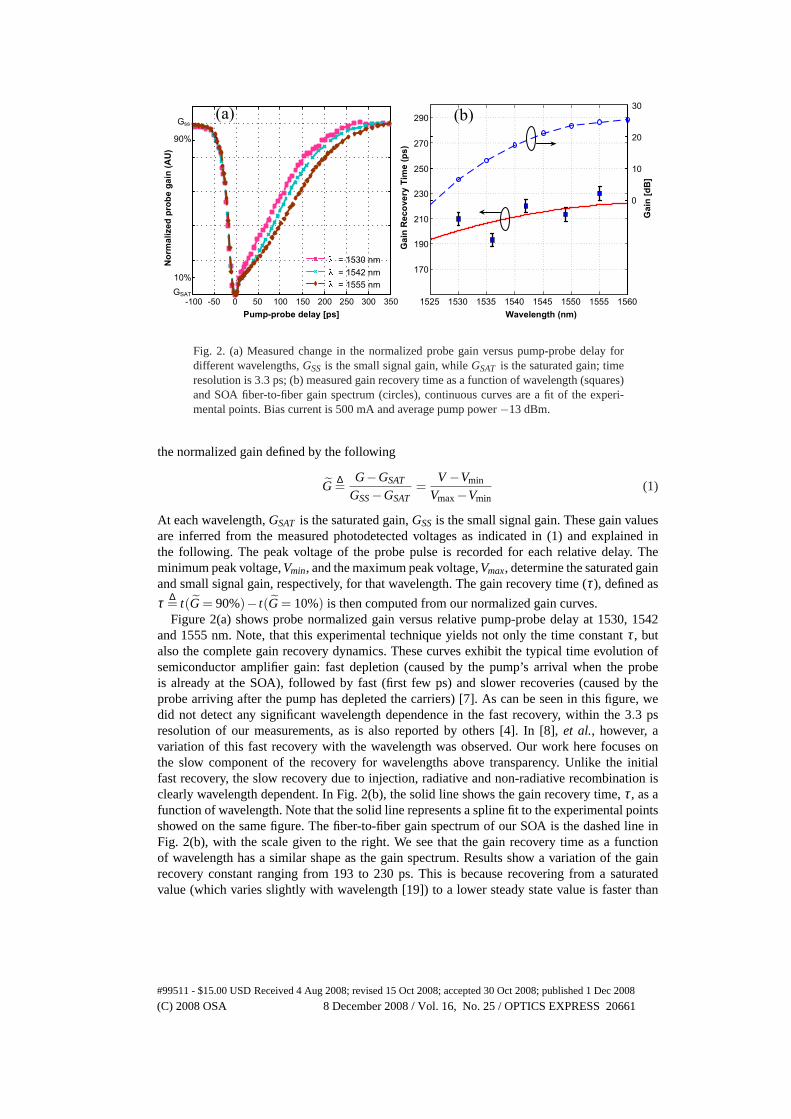
Fig. 4. SOA gain as a function of the input coupled power for several wavelengths . Biascurrent is500mA.
differential equation (ODE) as follows [18]
dhCDP(t)dt
=−hCDP(t)τCDP
− Pin(t)Psat(λ )τCDP
[G(t)−1]+ho(λ )τCDP
(3)
dhSHB(t)dt
=−hSHB(t)τSHB
− Pin(t)εSHB
τSHB[G(t)−1]− dhCDP(t)
dt− dhCH(t)
dt(4)
dhCH(t)dt
=−hCH(t)τCH
− Pin(t)εCH
τCH[G(t)−1] (5)
wherePin(t) is the input power,τCDP, τSHB andτCH are the carrier lifetime, carrier-carrierscattering time and temperature relaxation time respectively. The nonlinear compression factorsdue to spectral hole burning and carrier heating areεSHB andεCH, respectively. Note that thewavelength dependency of the gain recovery is introduced through the saturation powerPsat(λ )as well as the small-signal modal gainho(λ ) = ln(Go(λ )) in (3). The total gain is
G(t) = e(hCDP(t)+hSHB(t)+hCH(t)) (6)
5. Simulation results
Numerical simulations based on the model detailed in section 4 are used to calculate therecovery time for a range of wavelengths wider than we could achieve experimentally, inparticular, wavelengths longer than the peak gain. First, we measure the amplifier gain as afunction of the input power for several wavelengths from1540nm up to1580nm. This allowsus to set numerical values forho(λ ) andPsat(λ ). Results are presented in Fig. 4. We can see inthis figure that the steady-state gain drops quickly for the longer wavelengths. However the3dB output saturation power is larger for longer wavelengths. This is due to the gain peak shiftdue to the band-filling effect [19].
(C) 2008 OSA 8 December 2008 / Vol. 16, No. 25 / OPTICS EXPRESS 20663#99511 - $15.00 USD Received 4 Aug 2008; revised 15 Oct 2008; accepted 30 Oct 2008; published 1 Dec 2008
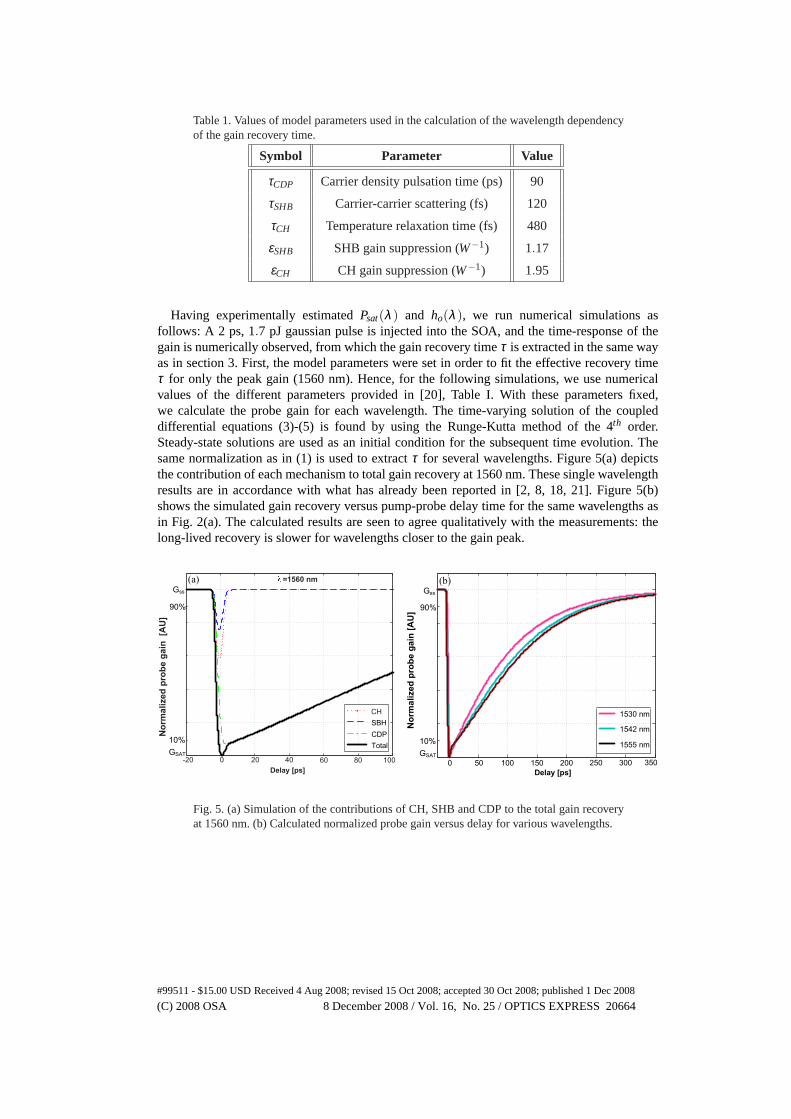
Table 1. Values of model parameters used in the calculation of the wavelength dependencyof the gain recovery time.
Symbol Parameter Value
τCDP Carrier density pulsation time (ps) 90
τSHB Carrier-carrier scattering (fs) 120
τCH Temperature relaxation time (fs) 480
εSHB SHB gain suppression (W−1) 1.17
εCH CH gain suppression (W−1) 1.95
Having experimentally estimatedPsat(λ ) and ho(λ ), we run numerical simulations asfollows: A 2 ps,1.7 pJ gaussian pulse is injected into the SOA, and the time-response of thegain is numerically observed, from which the gain recovery timeτ is extracted in the same wayas in section 3. First, the model parameters were set in order to fit the effective recovery timeτ for only the peak gain (1560 nm). Hence, for the following simulations, we use numericalvalues of the different parameters provided in [20], Table I. With these parameters fixed,we calculate the probe gain for each wavelength. The time-varying solution of the coupleddifferential equations (3)-(5) is found by using the Runge-Kutta method of the4th order.Steady-state solutions are used as an initial condition for the subsequent time evolution. Thesame normalization as in (1) is used to extractτ for several wavelengths. Figure 5(a) depictsthe contribution of each mechanism to total gain recovery at1560nm. These single wavelengthresults are in accordance with what has already been reported in [2, 8, 18, 21]. Figure 5(b)shows the simulated gain recovery versus pump-probe delay time for the same wavelengths asin Fig. 2(a). The calculated results are seen to agree qualitatively with the measurements: thelong-lived recovery is slower for wavelengths closer to the gain peak.
-20 0 20 40 60 80 100
Delay [ps]
No
rma
lize
d p
rob
e g
ain
[A
U]
=1560 nm
CH
SBH
CDP
Total
0 50 100 150 200 250 300 350
Delay [ps]
No
rma
lize
d p
rob
e g
ain
[A
U]
1530 nm
1542 nm
1555 nm
(a) (b)
90%
Gss
GSAT
10%
90%
Gss
GSAT
10%
Fig. 5. (a) Simulation of the contributions of CH, SHB and CDP to the total gain recoveryat 1560nm. (b) Calculated normalized probe gain versus delay for various wavelengths.
(C) 2008 OSA 8 December 2008 / Vol. 16, No. 25 / OPTICS EXPRESS 20664#99511 - $15.00 USD Received 4 Aug 2008; revised 15 Oct 2008; accepted 30 Oct 2008; published 1 Dec 2008
1530 1540 1550 1560 1570 1580
190
200
210
220
230
180
Wavelength [nm]
Gain
re
co
ve
ry t
ime
[p
s]
14
30
18
22
26
Ga
in [
dB
]
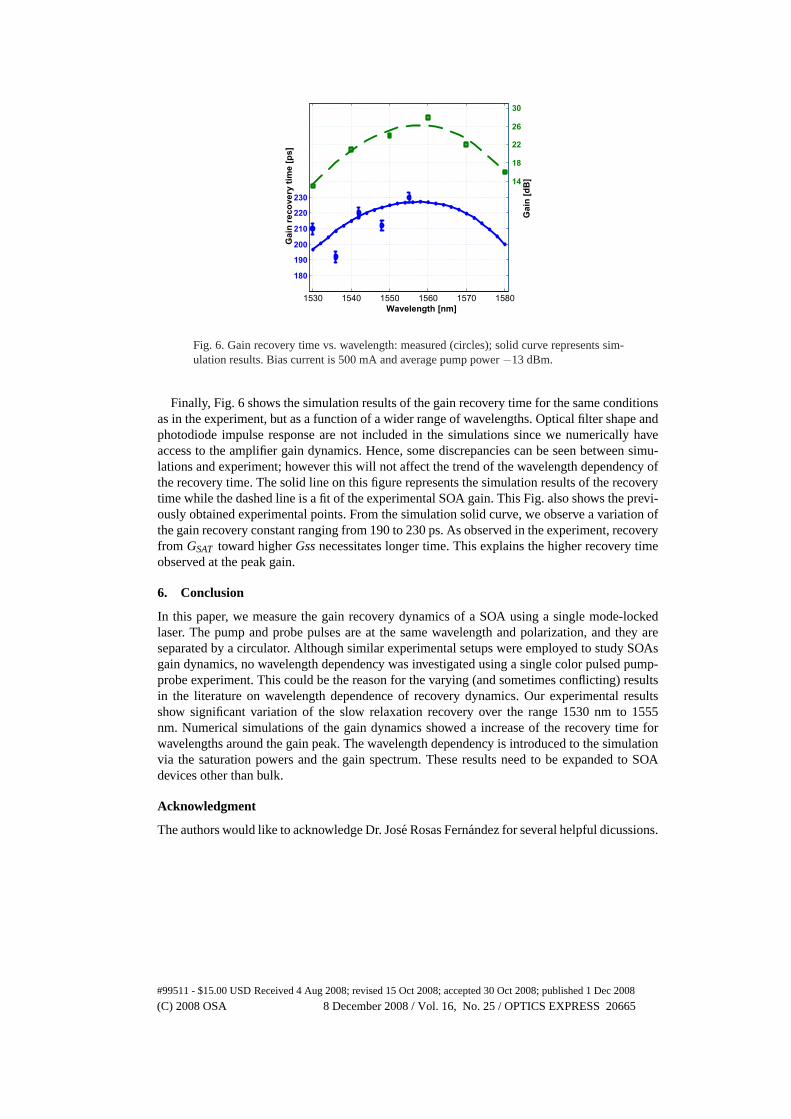
Fig. 6. Gain recovery time vs. wavelength: measured (circles); solid curve represents sim-ulation results. Bias current is500mA and average pump power−13dBm.
Finally, Fig. 6 shows the simulation results of the gain recovery time for the same conditionsas in the experiment, but as a function of a wider range of wavelengths. Optical filter shape andphotodiode impulse response are not included in the simulations since we numerically haveaccess to the amplifier gain dynamics. Hence, some discrepancies can be seen between simu-lations and experiment; however this will not affect the trend of the wavelength dependency ofthe recovery time. The solid line on this figure represents the simulation results of the recoverytime while the dashed line is a fit of the experimental SOA gain. This Fig. also shows the previ-ously obtained experimental points. From the simulation solid curve, we observe a variation ofthe gain recovery constant ranging from190to 230ps. As observed in the experiment, recoveryfrom GSAT toward higherGssnecessitates longer time. This explains the higher recovery timeobserved at the peak gain.
6. Conclusion
In this paper, we measure the gain recovery dynamics of a SOA using a single mode-lockedlaser. The pump and probe pulses are at the same wavelength and polarization, and they areseparated by a circulator. Although similar experimental setups were employed to study SOAsgain dynamics, no wavelength dependency was investigated using a single color pulsed pump-probe experiment. This could be the reason for the varying (and sometimes conflicting) resultsin the literature on wavelength dependence of recovery dynamics. Our experimental resultsshow significant variation of the slow relaxation recovery over the range1530 nm to 1555nm. Numerical simulations of the gain dynamics showed a increase of the recovery time forwavelengths around the gain peak. The wavelength dependency is introduced to the simulationvia the saturation powers and the gain spectrum. These results need to be expanded to SOAdevices other than bulk.
Acknowledgment
The authors would like to acknowledge Dr. Jose Rosas Fernandez for several helpful dicussions.
(C) 2008 OSA 8 December 2008 / Vol. 16, No. 25 / OPTICS EXPRESS 20665#99511 - $15.00 USD Received 4 Aug 2008; revised 15 Oct 2008; accepted 30 Oct 2008; published 1 Dec 2008