smedvig 1998 annual report on form 20-f
TRANSCRIPT

1
INTRODUCTION
Smedvig asa (the "Company") is a corporation incorporated in the Kingdom of Norway. The principalexecutive offices of the Company are located at Finnestadveien 28, P.O. Box 110, N-4001 Stavanger, Norway.
Except as otherwise specified, all amounts in this Annual Report are expressed in Norwegian kroner ("kroner","NOK" or "krone"). For the convenience of the reader, unless otherwise stated, translations of kroner amounts intoU.S. dollars ("U.S. dollars", "$" or "U.S.$") in this Annual Report have been made at the rate of NOK 7.5800 =U.S.$1.00 (U.S.$0.1319 = NOK 1), the noon buying rate in New York City for cable transfers payable in foreigncurrencies as certified for customs purposes by the Federal Reserve Bank of New York (the "Noon Buying Rate")on December 31, 1998. On June 9, 1999, such rate was NOK 7.87 = U.S.$1.00 (U.S.$0.1270 = NOK 1). TheNoon Buying Rate on December 31, 1998 differs from the actual rates used in the preparation of the Company'sFinancial Statements, and U.S. dollar amounts used in this Annual Report may differ from the actual U.S. dollaramounts that were translated into Norwegian kroner in the preparation of such Financial Statements. Translationsof kroner amounts into U.S. dollars in this Annual Report should not be construed as a representation that thekroner amounts have been or could be converted into U.S. dollars at the above rates or at any other rates. See"Item 8. Selected Financial Data — Exchange Rates".
As used in this Annual Report, the following customer names refer to the companies indicated:
"Amerada Hess" — Amerada Hess Limited (a subsidiary of Amerada Hess Corp.); "Amoco" — Amoco (UK)Exploration Company (a subsidiary of Amoco Corp.); "ARCO" — Atlantic Richfield Company; "BritishPetroleum" — BP Norge UA or BP Exploration Operating Company Limited (subsidiaries of The BritishPetroleum Company plc); "CMS NOMECO" — Walter International Congo Inc. (a subsidiary of CMS NOMECOOil & Gas Co.); "Elf" — Elf Aquitaine SA; "ENSCO" — ENSCO International Incorporated; "Esso" — EssoExploration and Production Norway AS or Esso Production Malaysia Inc. (subsidiaries of Exxon Corp.); "Mobil"— Mobil Exploration Norway Inc. (an affiliate of Mobil Corporation); "Navion" — Navion ASA, (a subsidiary ofStatoil); "Norsk Hydro" — Norsk Hydro Produksjon a. s. (a subsidiary of Norsk Hydro ASA); "Petronas" —Petronas Carigali Sdn. Bhd. (a subsidiary of Petroliam Nasional Bhd.); "Phillips Petroleum" — Phillips PetroleumCompany Norway (a subsidiary of Phillips Petroleum Co.); "Schlumberger" — Schlumberger Norge AS; "Shell"— Brunei Shell Petroleum Company Sdn Bhd or Shell Deepwater Development Inc. or Sarawak Shell Berhad orSabah Shell Petroleum Company Limited (subsidiaries of Royal Dutch Petroleum Co.); "Statoil" — Den norskestats oljeselskap a.s or Statoil (Thailand) Limited; "Thaipo" — Thaipo Ltd. (a subsidiary of Pogo ProducingCompany); "TOTAL" — TOTAL Exploration and Production Thailand (a subsidiary of TOTAL S.A.); and"Unocal" — Unocal Thailand, Ltd. (a subsidiary of Unocal Corp.).

2
PART I
ITEM 1. DESCRIPTION OF BUSINESS.
General
The Company is an offshore drilling contractor headquartered in Stavanger, Norway. The Company ownsand operates a fleet of high specification drilling rigs for offshore oil and gas exploration and development, whichare equipped for operations in harsh environments. The Company's primary activities are located in theNorwegian Sector of the North Sea and Southeast Asia (principally offshore Thailand, Brunei and Malaysia).Smedvig's fleet of mobile drilling units consists of one fourth-generation and two third-generation semi-submersible drilling rigs and one ultra-large jack-up rig, all of which are equipped for operations in harshenvironments. The Company operates its fleet under long-term contracts in the Norwegian shelf of the North Sea.One fifth-generation semi-submersible drilling rig and one drillship are under construction. These units are beingconstructed as deepwater drilling units and are expected to be among the most advanced units ever developed. TheCompany also provides platform drilling services, well services and well maintenance services on fixed platformsin the Norwegian Sector of the North Sea. The Company operates the world's largest fleet of self-erecting tenderrigs, primarily in Southeast Asia. The fleet consists of eleven units (ten of which are wholly or partially owned bythe Company), including two semi-submersible tender drilling rigs. One of the semi-submersible tender rigs,which was under construction in 1998, was delivered in March 1999. The Company also provides innovative andtechnologically advanced well construction services and reservoir and well technology products and services tothe offshore oil and gas industry worldwide through its Reservoir and Well Technology Division, which is beingmerged with Multi-Fluid ASA, a company listed on the Oslo Stock Exchange ("Multi-Fluid"), during 1999. See"—Recent Developments".
Historical Developments
The history of the Smedvig group dates back to 1915, when the Peder Smedvig Shipping Company wasestablished. The Smedvig group entered the offshore oil and gas market by investing in an exploration company in1965, at the start of offshore exploration and production activities in the North Sea. In 1973, further investment inthe offshore market was made through the design, development and construction of the first Norwegian-flaggedsemi-submersible drilling unit, West Venture. The Smedvig group expanded its drilling business with theconstruction of the West Vanguard in 1982 and the West Vision in 1986 and by purchasing one of the largestoperators of mobile drilling units in Norway in 1988. In 1989, the Company was organized to hold all of theSmedvig family's offshore drilling and oil services businesses. In a private placement followed by a listing on theOslo Stock Exchange in 1990, the Smedvig family's interest in the Company was reduced to approximately 49percent. In November 1996, the Company increased its equity capital through a U.S.$143 million stock offering toU.S., Norwegian and international investors, and by a listing of the Company's shares on the New York StockExchange. The Smedvig family sold one million shares in connection with the equity offering. In 1998, theSmedvig family purchased 425,300 Class A shares and currently owns approximately 39.7 percent of theoutstanding voting shares and 30.2 percent of the equity capital of the Company. See "Item 4. Control ofRegistrant". Today, the Company operates independently from the other Smedvig family businesses.
In 1990, the Company increased its international presence by acquiring Robray Offshore Drilling CompanyLtd. (the predecessor to Smedvig Asia Ltd.), a tender rig company headquartered in Singapore. The Company soldthree of its tender rigs in 1991 and one additional tender rig in 1994 to Varia Perdana Sdn. Bhd. ("VariaPerdana"), a Malaysian company established under a joint venture between the Company, which owns a 49percent interest, and an entity controlled by the Renong Group, a Malaysian industrial group. In February 1997,the Company enhanced its presence in the developing Southeast Asian market through the acquisition of PetrodrilHoldings, Inc. ("Petrodril"), the owner of one tender rig and one semi-submersible tender drilling rig. In January1998, the Company signed an agreement to build an advanced semi-submersible tender rig against a five-yearoperating contract in Southeast Asia. The unit was delivered in March 1999.
In mid-1994, the Company, in response to perceived changes in the market for mobile drilling units, made astrategic decision to concentrate on the upper-end of the worldwide offshore drilling market. As a result, the

3
Company restructured its semi-submersible and jack-up rig fleet and focused on those assets that are equipped forharsh environments, which require more advanced equipment and technological solutions. As a part of thisrestructuring, the Company sold four of its smaller jack-up rigs and one older semi-submersible rig and acquired a50 percent (now 52.4 percent) interest in West Alpha, its fourth-generation semi-submersible drilling rig, and theremaining 50 percent interest in West Delta, a third-generation semi-submersible drilling rig. In 1997, theCompany ordered a fifth-generation semi-submersible drilling rig and two deepwater drillships, all contractedagainst five year or longer operating contracts with major oil companies. In August 1998, the Companyterminated the construction project for one of these drillships with the consent of the operator. See "—RecentDevelopments". The remaining drilling units under construction are expected to be among the mosttechnologically advanced drilling units developed to date.
In 1994, the Company decided also to broaden its range of technology products and services both tocomplement its well construction services and to become a significant supplier of reservoir and well engineeringtechnology. In pursuit of this strategy, between 1995 and 1997, the Company acquired six reservoir software andmanagement companies and a drilling engineering company, which it combined under the name SmedvigTechnologies to offer reservoir technology products and services.
In 1991, due in part to its belief that mobile production solutions represented a growing new businessopportunity, the Company acquired an interest in a mobile production unit. Mobile production solutions capitalizeon advances in floating production technology which have reduced the capital requirements for, and lead time in,developing certain offshore oil and gas projects, such as those in remote locations or in deep water. The Companyincreased its involvement in this developing market in 1994 by committing to design, build and market the BalderFPU, which was subsequently sold to Esso. Lately, this market has experienced increasing competition with theentry of new market participants, resulting in reduced profit margins. In 1997, the Company decided to refrainfrom further investments in mobile production solutions. In April 1998, the Company decided to discontinue itsmobile production activities in response to deteriorating market conditions, low profitability and Esso'stermination of the Balder contracts. See "—Activities To Be Discontinued".
The Company performs drilling and maintenance services on fixed platforms in the North Sea. In November1998, pursuant to the Company's decision to concentrate on geographic markets in which it has a large businessvolume, the Company sold its platform drilling operations on the British Continental shelf, where the Companyonly offered platform drilling services. The Company intends to maintain its leading position in the Norwegiansector of the North Sea.
Recent Developments
Since 1997, the Company has experienced significant cost increases and delays for its newbuilding project,the West Navion, a deepwater drillship (formerly known as West Navion I), and significant delays for itsnewbuilding project, the West Venture (formerly known as West Future II), a fifth-generation semi-submersibledrilling rig.
In May 1999, the Company announced further increases in the total capital expenditure and further deliverydelay for West Navion. Revised total cost estimate is in the range of U.S.$560-600 million, depending on the finalcompletion date. Under the revised project schedule, the delivery of West Navion is expected during the fourthquarter of 1999. However, there are still uncertainties related to delivery and commissioning of certaincritical components. This includes the blow-out preventer and final commissioning of the Ramrig drillingpackage.
In June 1999, after negotiations with Statoil, the five-year drilling contract for the West Navion was replacedby a one-year contract. Terms and conditions for the new contract are substantially the same as for the originalcontract. The reason for the reduction in contract duration was the delayed delivery schedule for the drillship.At the same time, the Company's partner Navion ASA, a subsidiary of Statoil formerly known as StatoilShipping & Maritime Technology ("Navion"), which owns 50 percent of the West Navion, notified the Companythat they reserve their right to seek compensation from the Company for Navion's portion of the cost overrunsrelated to the construction and outfitting of the drillship. The Company believes that such claim would begroundless.
4
In April 1999, the Company, following a comprehensive and detailed review of the project, announced thatthe delivery of West Venture, which was ordered in 1997, will be further delayed because the shipyardresponsible for the completion and delivery of the rig has experienced delay in the execution of the project. TheCompany also announced that the delay will result in a further 5 percent cost increase due to time-related projectmanagement and financing costs.
In March 1999, the Company agreed to merge Smedvig Technologies (Holding) AS ("SmedvigTechnologies"), the Company's subsidiary holding the assets, rights and liabilities of the Company's Reservoir andWell Technology Division, with Multi-Fluid, a Norwegian company listed on the Oslo Stock Exchange. Theprimary business of Multi-Fluid is the production of multiphase flow-meters for the oil industry. Multi-Fluid willbe the surviving entity and will be renamed ROXAR ASA. The merger agreement provided for an exchange ratiowhereby the Company would own 57 percent of the merged company and Multi-Fluid shareholders would own 43percent. Prior to completion of the merger, the Company has proposed to distribute approximately 30 percent ofthe shares of Smedvig Technologies through a dividend distribution to the Company's shareholders. Thus, theCompany will have less than 50 percent ownership interest in the merged company, which will not beconsolidated as a subsidiary of the Company but will be reported as an associated company in the Company'sfinancial statements as of May 11, 1999. Shareholders of the Company will vote on the distribution at theextraordinary general meeting to be held on August 17, 1999. The merger was approved by the general meetingsof Multi-Fluid and Smedvig Technologies in May 1999. The merger is expected to be completed in August 1999and will be accounted for as a pooling of interests.
The Company believes that the strategic initiatives over the past year (exit from mobile production,termination of the West Navion II drillship, sale of the UK platform drilling activities and spin-off of the reservoirand well technology activities) will allow the Company to focus on its core business competencies, includingmobile drilling units, tender rigs and platform drilling in the Norwegian and Southeast Asian niche markets.
In March 1999, Christian Bull Eriksson was appointed new Chief Executive Officer of the Company. Mr.Bull Eriksson joined the Company on June 7, 1999.
Business Strategy
The Company's goal is to strengthen its position in the technologically advanced segment of the offshoredrilling industry by building on its solid market position in the Norwegian sector of the North Sea and SoutheastAsia.
The Company's activities are focused on well construction, well services and reservoir technology.
The Company pursues a strong earnings-driven growth strategy by offering innovative and cost-efficientsolutions to the oil and gas industry.
The Company seeks to achieve its profit and growth targets through organic growth and selected investmentsand acquisitions.
The Company is committed to serving its customers with a strong market presence, a sound technology baseand understanding of client needs.
The Company prefers long-term contracts and business relationships with its customers.
The Company aims at delivering products and services with a consistently high level of quality, efficiencyand safety in all its operations.
Industry Overview
The market for offshore drilling and oil services is fundamentally driven by the exploration, developmentand production expenditures of oil and gas companies and the availability of offshore drilling units. Industryexploration, development and production expenditures depend on the cash flow of oil and gas producers, which isprimarily determined by oil and gas prices and production volumes. Oil and gas prices are influenced by avariety of political and economic factors beyond the control of oil and gas companies, including worldwide

5
demand for oil and gas, production levels, governmental policies regarding exploration and development ofreserves, political factors in producing countries and weather conditions.
During the last decade, the offshore drilling and oil services industry has seen a number of restructurings,consolidations and mergers which were driven in part by overcapacity, low margins and the need for greater costefficiencies.
Increasing focus by the oil and gas companies on reducing their costs has had important implications for theoffshore drilling and oil services business. Some of the oil and gas producers have been redefining the core areasof their businesses and have downsized their organizations in order to concentrate their resources, maximizereturns from existing assets and focus on finding and developing new reserves. As a result, oil and gas producersare increasingly outsourcing responsibility for certain field exploration, development and production activities,including responsibility for the commercial and technical aspects of development and operation. This hascreated new opportunities for the offshore drilling and oil services sector.
In 1995, 1996 and early 1997, the economic fundamentals of the offshore drilling and oil services industryimproved considerably, due in part to favorable oil and gas prices. Exploration, production and developmentexpenditures increased, and the search for reserves in deep water and harsh environments, combined with thedevelopment of marginal fields, has increased demand for and utilization of high quality semi-submersible andjack-up drilling rigs. This resulted in higher dayrates for rigs. Other trends having a positive impact on theoffshore drilling and oil services sector include technological innovation and the opening of new areas forexploration. Since October 1997, oil prices have been declining and in late 1998, oil prices were at their lowestin this century in real terms. This led oil companies to defer their exploration programs and cut back on plannedinvestments. So far these reductions have mainly affected lower specification drilling units under short-termcontracts. However, a sustained low oil price is expected to have a negative impact on drilling services ingeneral. This could also lead to pressure from oil companies to modify or amend existing contractual terms.The Company's near term prospects are not expected to be significantly affected by the current market pessimism.This comes as a result of the Company's strategy of entering into long-term contracts when the marketis strong. As of December 31, 1998, the Company had an average remaining contract length ofapproximately three years for its mobile drilling units and approximately two years for its tender rigs. This isexpected to provide a strong and stable cash flow in the years ahead and will limit to some extent the Company'sexposure to changes in oil industry activity levels.
Technological Innovations
Technological innovations in the offshore drilling and oil services sector have improved oil and gasexploration success rates, lowered the cost of exploration and production and increased demand for services inmany phases of an oil and gas field's development. Specifically, advances such as three-dimensional (3-D)seismic surveying techniques, complex reservoir modeling and simulation techniques and advanced reservoirmonitoring techniques have reduced exploration and reservoir-related risks and improved well design andoperating efficiency. Extended-reach directional and multilateral drilling techniques and improved secondaryand tertiary recovery techniques have greatly increased recovery from existing fields. Technologies such as ultradeepwater wellheads, umbilicals and flowlines and subsea well completions have allowed operators to accessdeepwater fields that were technically unfeasible a few years ago. Advances in mobile production technologiesand subsea developments have reduced the capital requirements for developing certain offshore oil and gasprojects, such as those in remote locations or in deep water and can significantly reduce the time from discoveryto first production from such fields.
These technological innovations have been driven, in part, by the need to facilitate exploration for anddevelopment of new reserves and large fields in remote deepwater and harsh-environment offshore regions and bythe need to permit development and production of commercially marginal fields and extend production fromexisting fields. The Company believes that the development and improvement of these various enablingtechnologies (i) have positively affected long-term demand for offshore drilling and related services such as thoseprovided by the Company, particularly in remote locations, deepwater or harsh-environment geographies, and(ii) have contributed to the trend towards allocating more spending for development drilling. Development

6
drilling is less sensitive to industry cycles than exploration drilling since the oil companies which develop a fieldhave already made an initial investment in the exploration of such field and they are granted permits orconcessions of limited duration. At the same time, technological advances have reduced the capital investmentrequired for finding and developing reserves on a per barrel basis.
Additionally, technological developments have reduced the cost of developing offshore oil and gas fields,and smaller fields that previously would have been too costly to develop have become viable. Consequently, oiland gas producers have increased their offshore development and production activities, particularly for projectswithin reach of existing infrastructure, in order to exploit fully known resources.
Rig Dayrates
As expenditures by the oil and gas industry for exploration, development and production increased, thedemand for drilling rigs and worldwide utilization of the available rigs rose, leading to significant increases indayrates from 1995 to early 1998. Since early 1998, however, dayrates for new contracts have declined as a resultof lower oil prices that adversely affected the oil companies' capital expenditures. Over the past two years, thenumber of rigs under construction or conversion has increased somewhat as a result of increased demand.
In line with its strategy, the Company entered into long-term contracts for its drilling units during the periodof increasing dayrates and the Company is benefiting from this strategy in the current market where rates havedecreased.
After a decline in dayrates for tender rigs in Southeast Asia during 1995 and 1996, dayrates improved in1997 and first quarter of 1998. Since the first quarter of 1998, however, dayrates in this region have declined as aresult of the effect of lower oil prices on oil companies' expenditures as well as competition from small jack-uprigs.
Outlook
The Company believes that the long-term outlook for offshore drilling remains good, particularly in thedeepwater market. In order to maintain their reserves, the oil and gas companies need to increase their spendingon exploration drilling from mobile units in deeper waters and outside existing infrastructure, which, ifsuccessful, will further increase the demand for mobile units to perform developments drilling. The Company'sshort-term prospects are not expected to be significantly affected by the current market pessimism due to theCompany's strategy of entering into long-term contracts when the market is strong. At December 31, 1998, theCompany had an average contract length of approximately three years for its mobile drilling units andapproximately two years for its tender rigs. The Company believes this should provide a strong and stable cashflow during the next two to three years and should limit the Company's exposure to changes in oil industryactivity levels. The drilling units under construction West Navion and West Venture, have a one-year contractand a long-term contract, respectively.
The Platform Drilling Division is engaged in production drilling and maintenance operations from existinginstallations, and it is therefore less sensitive to changes in oil prices.
The Company believes that it is well positioned despite the current cyclical downturn in the market. Uponcompletion of its newbuilding program, the Company will have a large fleet of high specification drilling units, allof which are under contracts.
The Company's key priorities are to complete and deliver its newbuildings, in accordance with deliveryschedules and cost estimates, and commence drilling under the contracts. The Company aims at maintainingprofitability, safety and efficiency in ongoing operations.
For the Company's cautionary statement relating to the forward looking statements contained in thisdocument, see "—Industry and Operating Risks".

7
The Company's Business Divisions
At December 31, 1998, the Company had five business divisions. The business divisions were MobileUnits, Platform Drilling, Tender Rigs, Reservoir and Well Technology and Activities To Be Discontinued. InMarch 1999, the Company agreed to merge Smedvig Technologies (that constitutes its Reservoir and WellTechnology Division) with Multi-Fluid, a Norwegian public company. The Company will have less than50 percent ownership interest in the merged company, which will not be consolidated as a subsidiary of theCompany but will be reported as an associated company in the Company's financial statements as of May 11,1999. See "—Recent Developments". During 1996, 1997 and 1998, operations in the North Sea providedapproximately 84 percent, 81 percent and 80 percent, respectively, of the Company's revenues and accounted forapproximately 79 percent, 89 percent and 75 percent, respectively, of the Company's operating profit before gainson sale of assets. The rest of the world, principally Southeast Asia, provided approximately 16 percent, 19percent and 20 percent of such revenues in 1996, 1997 and 1998, respectively. Excluding gains on sale of assets,approximately 82 percent, 82 percent and 78 percent of the Company's North Sea revenues and almost all of itsNorth Sea operating profit were attributable to Norway in 1996, 1997 and 1998, respectively.
Mobile Units Division
The Company's strategy for its Mobile Units Division is to offer innovative and cost-effective servicesencompassing drilling, completion and maintenance of offshore wells in deep waters and harsh environments.The Company intends to maintain high utilization of its drilling units through long-term contracts, therebyensuring a stable cash flow. The Company is thus less exposed to market fluctuations and has laid the basis forlong-term investment and growth. In line with this strategy, the fleet is concentrated on high specificationdrilling rigs, all of which are employed under long-term contracts, mainly in production drilling. The Companyemphasizes high quality operations, stressing safety, health, efficiency and environmental considerations. TheCompany's drilling capacity is being expanded by the construction of advanced drilling units for efficientexploration and production drilling in deep waters and harsh environments.
As of December 31, 1998, the Company's mobile drilling rig fleet consisted of the three semi-submersibledrilling rigs, West Alpha, West Delta and West Vanguard, and the jack-up rig, West Epsilon. All the rigs areemployed in the Norwegian sector of the North Sea, and are engaged mainly in production drilling.
The fourth-generation rig West Alpha continued drilling production wells under a contract with Esso Norgeon the Balder field throughout the year. This assignment was completed in December 1998. The rig thenstarted on a three-year drilling contract with Amoco, and was sublet to Statoil for drilling of two wells on theStatfjord field. The rig is currently being classified and upgraded during a yard-stay in Norway, expected to becompleted before the end of June 1999.
The third-generation rigs West Delta and West Vanguard continued exploration and production drilling forNorsk Hydro throughout the year. The West Delta drilled production wells on the Visund field until a three-weekyard- stay in the third quarter for upgrades and modifications. Thereafter, the rig drilled two exploration wells onthe Oseberg field before being moved to Oseberg Syd to start a production drilling program expected to last 15months.
The West Vanguard operated on the Troll and Oseberg fields. In the second quarter, this rig completed thedrilling of a record-long 3,200 meter horizontal section of a well on the Troll field. Following a three-week yard-stay in the third quarter for upgrades and modifications, the rig was engaged in drilling and well maintenanceoperations on the Oseberg field. The rig returned to the Troll field at the end of the year, where the operator'splans call for its use in production drilling for two-to-three years in connection with Troll Phase II.
The West Epsilon drilled production wells for Statoil on Sleipner Vest during the year. This activity willcontinue until summer 1999. The drilling program for the remaining contract period until December 2002, has notyet been decided.
Operation of the Company's mobile units has proceeded satisfactorily during the year, yielding recordoperating profits. The quality of these operations has improved over the year as a result of systematic planningwith an emphasis on safety, quality and efficiency, and a continuous modernization and improvement of the rigs.

8
In 1997 and 1998, the Mobile Units Division accounted for approximately 32 percent and 31 percent of theCompany's revenues (excluding gains on sale of assets), respectively.
The newbuilding program for mobile units consists of a deepwater drillship, the West Navion, and a fifth-generation semi-submersible rig, the West Venture (formerly known as West Future II). These drilling units willbe among the most advanced ever built.
Semi-submersible rigs consist of an upper working and living quarters deck resting on vertical columnsconnected to lower hull members. Such rigs operate in a "semi-submerged" position, remaining afloat, off bottom,in a position in which the lower hull is below the water line and the upper deck protrudes high above the surface.The rig is typically anchored or dynamically positioned and remains stable for drilling in the semi-submerged floating position, due in part to its wave transparency characteristics at the water line.
In 1996, the Company, in close cooperation with Norsk Hydro, developed a new fifth-generation semi-submersible drilling rig concept intended for efficient development drilling in deep water and harsh environments.In February 1997, the Company ordered West Venture, a semi-submersible drilling rig designed for operations indeep water and harsh environments, on the basis of a long-term contract with Norsk Hydro. The rig will be one ofthe world's first fifth-generation rigs, and is to be provided with dual drilling derrick, full dynamic positioningsystem and a deep water capability of 1,500 meters. Its drilling efficiency is expected to surpass that of existingdrilling rigs. The rig is under construction at the Hitachi yard in Japan, and is approximately 86 percentcompleted. The shipyard has indicated that there will be delays, and the Company estimates delivery to take placein the fourth quarter of 1999. As a result, the contract has been shortened by approximately nine months.Estimated financial and project management costs have increased due to the delayed delivery schedule, and totalproject costs for the Company are estimated to be approximately U.S.$315 million, up from an original estimateof U.S.$280 million.
Drillships are ships equipped for drilling and are typically self-propelled and move from one location toanother under their own power. Drillships are positioned over the well through use of either an anchoring systemor computer controlled thruster system similar to those used on semi-submersible rigs. Certain drillships arecapable of drilling in water depths of more than 6,000 feet.
In 1997, the Company entered into agreements with Navion for the construction of two deepwater drillshipsagainst long-term contracts. The Company currently has one drillship under construction, the West Navion(formerly known as West Navion I). In February 1998, the hull of the deepwater drillship West Navion wasdelivered from the Korean shipyard Samsung. West Navion is owned by Navion and the Company, each with a50 percent ownership interest. The Company will also be responsible for operating the drillship. The vessel isbeing equipped with drilling equipment at the Offshore & Marine yard in Norway, and will have a dual drillingderrick, full dynamic positioning, a high deck load capacity and a deepwater drilling capability of initially1,500 meters, which may be increased to 2,500 meters. After delivery, the vessel will be employed under a one-year operating contract with Statoil. From the outset, the complexity and time frame of the project have beenconsiderably underestimated. The project costs have significantly increased and the delivery schedule has beendelayed. The increase in estimated costs is due to various factors, including design modifications, weightincreases, delayed delivery of equipment, higher water depth capacity than originally planned for, as well as tighttime schedules. All the modules have now been installed, and the vessel is approximately 88 percent completed.The current developments indicate further increases in total man-hours required to complete the vessel as well asdelayed delivery. In spring 1999, a review was undertaken and the review revealed additional cost increases anddelayed delivery of the vessel. The revised total cost estimate is in the range of U.S.$560-600 million, dependingon the final completion date. The revised project schedule implies delivery during the fourth quarter. However,there are still uncertainties related to delivery and commissioning of certain components. This includes the blow-out preventer and final commissioning of the Ramrig drilling package. The original cost estimate wasapproximately U.S.$250 million. The revised total project costs estimate includes all construction costs, interestexpenses, project management, contingencies and operational preparations. See "—Recent Developments".
In May 1998, the Company completed a comprehensive review of the costs, delivery schedules and projectmanagement of all of its newbuilding projects. The review resulted in increased cost estimates and delayed

9
delivery schedules for the drillship newbuildings. As a result, the Company implemented corrective actions toimprove performance and reduce its risk exposure. See "—Industry and Operating Risks".
In August 1998, Navion and the Company decided to terminate their jointly owned construction project forthe drillship West Navion II, due to major uncertainties regarding the total construction costs and anticipateddelivery date. This decision was made with the consent of the operator, Shell. The Company's share of the costsassociated with the termination amounted to NOK 535 million. Navion, which owned 50 per cent of the vessel,bore the remaining portion of such costs.
Jack-up rigs are mobile, self-elevating drilling platforms equipped with legs that are lowered to the oceanfloor. A jack-up rig is towed by tugboats to the drillsite with its hull riding in the sea as a vessel and its legs raised.Once over a drillsite, the legs are lowered until they rest on the seabed, and jacking continues until the hull iselevated above the surface of the water. After completion of drilling operations, the hull is lowered until it rests inthe water, and the legs are then raised for the rig to be relocated to another drillsite. The Company has one jack-uprig, West Epsilon, which is one of the world's largest and most advanced jack-ups, is capable of drilling at waterdepths of up to 380 feet and is outfitted for operations in harsh environments.
The following table sets forth certain information concerning the Company's mobile drilling units, includingunits currently under construction:
Mobile Drilling Units
Type and Name Ownership
Percent
MaximumWater Depth
Capability(ft)
VariableDeck Load
(MT) Attributes
Year Built/Latest
Enhancement
CurrentLocation/
Customer
Estimated Contract
Expiration
Semi-submersibles
West Venture 100.0% 5,000 5,500 DP, DD, TDS, 1999 Under 1st quarter (fifth-generation) 4M 15K construction/Norsk 2004 (1)/Options for Hydro further seven years
West Alpha 52.4 2,300 3,000 SP, TDS 1986/96 Norway/Amoco February 2002 (2) (fourth-generation)West Vanguard 100.0 1,480 2,000 SP, TDS 1982/85 Norway/Norsk Hydro April 2001/Option
(third-generation) until March 2006
West Delta 100.0 1,480 2,000 SP, TDS, 1981/97 Norway/Norsk Hydro March 2000/Option (third-generation) 3M, 15K until December 2000
DrillshipsWest Navion 50.0 8,200 7,500 DP, DD, 3M, 1999 Under construction/ December 2000 (3)
TDS, 15K StatoilUltra-large Jack-upWest Epsilon 90.1 380 3,700 IC, SO, TDS, 1992/95 Norway/Statoil December 2002/ Options
3M, 15K to June 2006
Attributes
DP = Dynamic Positioning IC = Independent-Leg SP = Self-Propelled 4M = Four Mud PumpsCantilevered Rig
DD = Dual Derrick SO = Skid-Off Capability TDS = Top-Drive Drilling 3M = Three Mud PumpsSystem
15K = 15,000 psi Blow-OutPreventer
_________________________
(1) Estimated start-up is the fourth quarter of 1999.
(2) A two month yard stay is being undertaken in the second quarter of 1999, resulting in the contract withAmoco being extended by two months to February 2002.
(3) Estimated contract start-up is December 1999.
The Company generally seeks to secure long-term contracts for its mobile drilling units under favorablemarket conditions that allow for attractive fixed and incentive type dayrates structures. The Company's contractsfor mobile drilling units provide for a basic drilling dayrate, and some provide for a lower or zero dayrate duringperiods of mobilization or when drilling operations are interrupted or restricted by equipment breakdowns,

10
adverse environmental conditions or other conditions beyond the control of the Company. The contracts alsocontain clauses pursuant to which the customer assumes responsibility for all or a substantial part of any changesin personnel, insurance or other costs, subject to certain limitations.
The initial terms of the Company's current mobile drilling contracts generally expire on the expiration datespecified in the table above, which may be extended by the customer through the exercise of options provided inthe contracts. Actual contract durations may vary depending on the number of wells involved and the timerequired for the particular drilling project. The contracts may be terminated by the customer in the event thedrilling unit is destroyed or lost, or if drilling operations are suspended for a specified period of time as a result ofa major equipment breakdown resulting from events beyond the control of either party. Under some contracts, thecustomer can also terminate at any time without cause, subject to the payment of certain termination fees whichare generally intended to minimize the financial impact of such termination on the Company. Under certain of theoperating contracts for the units under construction, the customer has the right to terminate the operating contractsif the Company fails to satisfy its contractual obligations, including its obligation to deliver such unit at aspecified time.
Upon the expiration of existing contracts, there can be no assurance that such contracts will be renewed orextended, that new contracts will be available or, if contracts are available, that they will provide revenuesadequate to cover all fixed and variable costs associated with the rigs.
The following table sets forth certain information comparing the Company's rig utilization to that of theoffshore drilling industry as a whole during the past five years:
Mobile Drilling Fleet Utilization (1)
Averages for Year Ended December 31, 1994 1995 1996 1997 1998 Company Industry Company Industry Company Industry Company Industry Company (2) Industry
Fourth-GenerationSemi-submersibles (3) Supply .................................. 1.0 13.7 1.0 14.2 1.0 17.1 1.0 17.9 1.0 23.9 Utilization .......................... 0% 91% 84% 99% 61% 98% 100% 100% 100% 94%Other Semi- submersibles (3) Supply .................................. 2.0 106.8 2.0 101.0 2.0 104.0 2.0 107.9 2.0 107.1% Utilization .......................... 67% 80% 87% 88% 79% 95% 92% 98% 100% 95%Total Semi- submersibles (3) Supply .................................. 3.0 120.5 3.0 115.2 3.0 121.1 3.0 125.8 3.0 131.0% Utilization .......................... 45% 81% 86% 89% 73% 95% 94% 98% 100% 95%Jack-ups (4) Supply .................................. 6.0 299.8 2.9 294.1 2.0 284.2 2.0 289.8 2.0 294.8% Utilization .......................... 65% 83% 96% 86% 100% 94% 100% 97% 100% 92%
__________
(1) Company data for each period is based on all rigs operated during such period. Industry statistics of rigutilization are from Offshore Data Services. Company and industry statistics have been determined under the"working method," which is the ratio of the number of rig days in operation to the total number of rig daysavailable. Total supply for each period includes only actively marketed rigs, i.e., excludes national oilcompany-owned and mothballed rigs, among others. Industry data is based upon competitive rigs (as definedby Offshore Data Services) of the types indicated and includes many rigs that may be dissimilar to theCompany's rigs in many significant respects, including performance capabilities, age, operational criteria andenvironmental capabilities.
(2) Under the "revenue method," which is the ratio of the contractual revenue actually generated to the maximumpotential revenue obtainable pursuant to the operating contract, in 1998, the utilization rates for theCompany's fourth-generation semi-submersible, other semi-submersibles, total semi-submersibles and jack-ups were 97 percent, 96 percent, 96 percent and 98 percent, respectively.
11
(3) The Company's fourth generation rig, West Alpha, was not employed during 1994 and was being mobilizedand upgraded in connection with the Esso contract during the majority of the first half of 1996. West Deltawas mobilized and upgraded in the second half of 1996 and the first two months of 1997 in connection witha new contract.
(4) Includes both shallow (less than 350 feet maximum depth capability) and deepwater (over 350 feet) jack-uprigs. Company data includes ENSCO 100, which has been operated as a water injection platform by theformer Mobile Production Division since April 1994 and Activities To Be Discontinued sinceJanuary 1, 1998.
Platform Drilling Division
Oil and gas fields in the North Sea have traditionally been developed through the use of permanentlyinstalled drilling and production platforms, with the drilling operations being performed by a drilling contractorsuch as the Company. However, the current trend favors floating production techniques and subsea productionsystems that require mobile drilling rigs for well construction. Thus, demand for traditional platform drillingservices is expected to decrease gradually in the future. In order to maintain and expand its activities in thismarket, the Company's strategy is to broaden its traditional offering of drilling and maintenance services. Otheroffered services include wireline operations (described below) and services related to the shut-down of productionwells, markets in which the Company sees a growth potential.
In connection with the discontinuation of the Mobile Production Division in the spring of 1998, theremaining operations, including the Janice Alpha, three production operations contracts and certain consultingservices, were included under the Platform Drilling Division as of January 1, 1998.
In the fourth quarter of 1998, the Company sold its platform drilling operation in the British continentalshelf, the operating contract for the Janice Alpha and the company Altra Consultants Limited to Deutag AG, aGerman company ("Deutag"). The sales price was NOK 340 million with a sales gain of NOK 165 million. Thesale was motivated by a strategic decision to concentrate operations in those geographic regions where theCompany conducts a major volume of its business. This provides a basis for offering a broad spectrum of productsand services to the oil companies, resulting in cost-effectiveness, synergies and profitability. The sale was also aconsequence of the Company's decision in early 1998 to discontinue its involvement in mobile production throughthe Mobile Production Division, which was headquartered in Aberdeen, Scotland. As a result of the foregoingdecision, the Company considered the high costs associated with maintaining the headquarters in Aberdeen to bedisproportionate to the low margins provided by the Company's platform drilling operations in the Britishcontinental shelf.
The Company will maintain its strong position in platform drilling in the Norwegian sector of the North Seaand this remains an essential factor in the Company's strategy.
During 1998, the Company performed drilling and maintenance operations on nine platforms in theNorwegian sector of the North Sea and, until mid-November 1998, on five installations in the British sector of theNorth Sea. The Company also provided well services from a number of mobile drilling rigs and fixedinstallations. These operations proceeded satisfactorily during the year, and the level of activity increasedcompared to the previous year.
The Company is developing more cost efficient drilling and maintenance techniques for use on fixedplatforms. The Company expects that the market for such services will grow as the North Sea fields are graduallydepleted and as the drilling equipment on these platforms no longer satisfies applicable regulatory requirements.The Company has also noted a possible growing market for plugging wells on platforms that are to be shut downand removed.
The Statfjord field saw a high level of drilling and maintenance activity throughout the year, as well asupgrades of the drilling facilities. In one period during the latter half of the year, the Company was drilling onthree platforms, rather than the customary two. The Company was engaged in drilling operations on theVeslefrikk field through-out the year. The level of activity is expected to diminish in 1999 in connection with adrilling halt for classification and maintenance of the Veslefrikk B platform. In 1996, Phillips Petroleum

12
awarded the Company a five-year well plugging and maintenance contract for the Ekofisk field. During 1997,Phillips Petroleum exercised its option to purchase the rig, which is being built in Canada by Hitec and Dreco. In1998, the Company assisted Phillips Petroleum in the construction, onshore completion and testing of themodularized rig, named Rig 66. Under the Agreement, this rig will carry out a two and a half-year drillingprogram on the Eldfisk field, with start-up scheduled for the end of the second quarter 1999. The Company willoperate the unit.
The Company's maintenance contract for Norsk Hydro's Oseberg C field expired in the first half of 1998.Over the year, the Company drilled an 8,750 meter well on the Gyda field at a distance of 7,000 meters from theplatform. This is the first ultra high-deviation well on the field, and the world's third longest well. The contract forthe Ula and Gyda fields expired in March 1999.
The Company also offers sales of equipment and services to the oil industry through Camco ServicesNorway A/S ("Camco Services Norway") and wireline operations. Wireline operations are an efficient andeconomical way of performing well interventions. The wire makes it possible to manipulate service tools severalthousand meters below the surface. 1999 was a positive year for the Company's wireline operations.
On May 11, 1999, the Company signed an agreement with Schlumberger Norge Holdings AS("Schlumberger") to sell its 50 per cent ownership in Camco Services Norway. The agreed sale price was U.S.$4million. The integration of accounts will be effective from March 31, 1999, and a final approval from theNorwegian Ministry of Industry and Trade is required. The Company and Schlumberger also signed a four yearagreement concerning wireline services in the Norwegian sector of the North Sea. This represents a continuationof the existing cooperation in this business. Camco Services Norway's activities consist of the sale and rental ofCamco products and related services.
The following table sets forth the status of the Company's contracts for fixed platform drilling projects:
Fixed Installations
Field Customer Contract Awarded Estimated Contract Duration NorwayStatfjord A, B and C Statoil July 1982 September 2002Veslefrikk A and B Statoil July 1987 Field lifetimeEkofisk Phillips Petroleum November 1992 November 2002Ekofisk, P&A Phillips Petroleum December 1996 June 1999 until December 2001 (1)
__________
(1) Contract start-up is estimated to be the second quarter of 1999. Since the fourth quarter of 1998, theCompany has operated a snubbing unit for Phillips Petroleum on the Ekofisk field.
Tender Rigs Division
Smedvig is one of the world's leading operators of self-erecting tender rigs. Through its wholly-ownedsubsidiary, Smedvig Asia Ltd., the Company has 26 years of offshore operating experience in Southeast Asia. TheCompany currently operates the world's largest fleet of self-erecting tender rigs. The company aims at furtherincreasing its involvement in production drilling in Southeast Asia. This strategy entails an expansion of thetender rig fleet to further strengthen its market position and profitability. The Company anticipates that the marketin Southeast Asia will demand more advanced units in the longer term. In order to meet this challenge, in 1998,the Company had one advanced semi-tender under construction.
As of June 6, 1999, the Company operates a fleet of eleven self-erecting tender drilling rigs (ten of which arewholly or partially owned by the Company). The fleet, which includes two semi-submersible tender drilling rigs,provides development drilling and well maintenance services in Southeast Asia and West Africa. The WestMenang, a semi-submersible tender drilling rig that was under construction in 1998, was delivered on budget andon schedule in March 1999. The West Menang started performing its operating contract on April 30, 1999.

13
The Company's tender rigs are engaged in production drilling and well maintenance in Southeast Asia andWest Africa. The self-erecting tender rigs are purpose-built barges designed with the capability of lifting thedrilling equipment packages from the tender to a fixed platform. Semi-submersible tender rigs have semi-submersible hulls and are equipped with equipment similar to that of the self-erecting tender rigs. The tender,which contains living quarters, power machinery for running the drilling equipment, other drilling and wellcompletion equipment and storage for drilling supplies, is moored next to the fixed platform during drillingoperations. Historically, the use of self-erecting tender rigs has been important in Southeast Asia because it allowsdevelopment and workover operations to be done on small fixed platforms, without the need for permanentlyinstalled drilling packages.
The table below sets forth certain information concerning the Company's tender rig fleet:
Tender Rig Fleet
Rig Designation Ownership Percent
YearBuilt/Latest
Enhancement Current
Location/Customer Estimated Contract Expiration (1) T-1 (2) Thailand/PTTEP
49% 1974/97 (3) October 1999T-2 (2) 49 1975/97 Malaysia/EPMI December 2000/Options toT-3 (2)(4) 49 1980/97 Brunei/Shell December 2001T-4 100 1981/98 Thailand/Thaipo January 2000T-5 (5) 100 1981/95 Congo/CMS Nomeco July 1999T-6 (2) 49 1983/98 Singapore/Shipyard October 2004
Malaysia/PetronasT-7 100 1983/90 Thailand/Unocal November 2000T-8 100 1982/98 Thaipo February 2001West Pelaut 100 1994 Brunei/Shell April 2000/Options to April 2009West Menang 100 1999 Brunei/Shell April 2004Teknik Berkat (6) 0 1991/98 Malaysia/Petronas September 2000
__________
(1) The duration of the contracts depends on the oil companies' drilling program. The above mentioned dates aretherefore estimated ending dates.
(2) T-1, T-2, T-3 and T-6 are owned by Varia Perdana, a Malaysian joint-venture company in which theCompany owns a 49 percent interest.
(3) PTT Exploration and Production Company Ltd.
(4) Began operations under a new contract in January 1999.
(5) T-5 is contracted to CMS Nomeco in Congo until August 1999.
(6) Teknik Berkat is operated by the Company.
In 1991, the Company sold three of its tender rigs to Varia Perdana, a Malaysian company established undera joint-venture between the Company, which owns a 49 percent interest, and an entity controlled by the RenongGroup, a Malaysian industrial group. In 1994, the Company sold an additional tender rig to Varia Perdana.Through its 49 percent interest in and agreement with the entity that manages the Varia Perdana fleet, theCompany continues to operate these tender rigs and receives a fee for such services. The Company believes thisarrangement has enhanced its local presence in the developing Southeast Asian market. In February 1997, theCompany expanded the scope of its operations in Southeast Asia through the acquisition of the assets of Petrodrilfor U.S.$69 million. Petrodril owned a large tender rig and a modern semi-submersible drilling tender.
In 1998, the Company signed with Shell a five-year drilling contract in connection with the construction of asemi-submersible rig for platform drilling assistance in Brunei. The rig, which is named the West Menang, wasdelivered as scheduled in March 1999. The total construction costs were U.S.$100 million, which is below theestimate of U.S.$105 million. The rig began operations under its contract at the end of April 1999.

14
In 1998, some of the Company's tender rigs were reclassified and/or upgraded in order to start theperformance of contracts entered into in 1997 and early 1998. These contracts were entered into at favorable termsdue to the good market conditions. All of the Company's tender rigs are under contract throughout 1999, with theexception of the T-1, T-2 and T-5, which are scheduled to complete their assignments in the latter half of 1999.The tender rig T-3 completed the contract with Sarawak Shell in June 1998 and underwent significantmodifications and a scheduled classification in connection with the contract with Brunei Shell, which commencedin January 1999. In February 1998, the T-4 began employment under a two-year drilling contract with Thaipo inThailand. The T-6 started its drilling contract with Petronas in July 1998. In June 1999, the contract was extendedby approximately four years until October 2004. The contract includes a three-month yard-stay for upgrading andclassification which is covered by Petronas. The T-8 began employment under a three-year contract with Thaipoin April 1998. Dayrates for new contracts have declined since the market peaked in February 1998, due to loweroil prices resulting in lower activity and increased competition from small jack-up rigs.
The demand for production drilling in Southeast Asia has been steady despite relatively low oil and gasprices. This is due primarily to requirements from the Thai and Malaysian governments to produce set minimumquotas. Secondly, the local governments prioritize oil production to meet their needs for hard currency in responseto the Asian economic set-back. Some multi-national oil companies that are involved in production-sharingagreements with national oil companies in the region are less inclined to continue field expansions given thecurrent market conditions. However, considerations of national interest and pressure from the national oilcompanies have resulted in the continuation of such an expansion, and production contracts have therefore beenextended. Thirdly, this region has a need to be as self-sufficient as possible from an energy standpoint. However,given the reserves that have already been discovered in Southeast Asia, the Company believes that the need fordrilling involving tender rigs is likely to continue.
The following table sets forth certain information comparing the Company's tender rig utilization to that ofthe tender rig industry as a whole for the past five years:
Tender Rig Utilization (1)
Averages for Year Ended December 31, 1994 1995 1996 1997 1998 Company Industry Company Industry Company Industry Company Industry Company (2) Industry
Supply ........... 8.0 26.8 8.0 28.0 8.0 26.6 10.0 26.6 10.0 26.3Utilization ... 89% 82% 75% 78% 88% 76% 70% 85% 88% 90%
__________
(1) Company data for each period is based on all rigs owned and operated during such period. Industry statisticsof rig utilization are from Offshore Data Services. Company and industry statistics have been determinedunder the "working method", which is the ratio of the number of rig days in operation to the total number ofrig days available. Total supply for each period includes only actively marketed rigs, i.e., excludes national oilcompany-owned and mothballed rigs, among others. Industry data is based upon competitive rigs (as definedby Offshore Data Services) of the types indicated and includes many rigs that may be dissimilar to theCompany's rigs in many significant respects, including performance capabilities, age, operational criteria andenvironmental capabilities.
(2) Under the "revenue method", which is the ratio of the full contractual revenue actually generated to themaximum potential revenue obtainable pursuant to the operating contracts, the tender rig utilization rate was86 percent in 1998.
Reservoir and Well Technology Division
The Company's Reservoir and Well Technology Division is involved in three business areas: reservoirmonitoring, reservoir modeling and reservoir services.

15
In 1997 and 1998, the Reservoir and Well Technology Division contributed approximately 13 percent and 12percent of the Company's revenues excluding gains on sale of assets, respectively. In 1996, the Reservoir andWell Technology Division consisted of three corporate entities: Smedvig Technology; Geomatic; and Prodrill.The Company also acquired Reservoir Simulation Research Corporation (RSRC) in Oklahoma, USA. These fourcompanies were consolidated to form Smedvig Technologies as of February 1997. The Company made furtherinvestments to be able to offer its products and services in selected international markets. In May 1997, theCompany acquired Petresim Integrated Technologies Inc. in Houston to strengthen its presence in North andSouth America. The division has also expanded through organic growth. The strategy of establishing aninternational network of sales offices has been successfully pursued and the division now has its own offices inthe United States, the United Kingdom, Norway, the United Arab Emirates, Malaysia, Australia and China. In1998, all the division's activities were organized under the legal entity Smedvig Technologies (Holding) AS. Atthe beginning of 1999, Smedvig Technologies had approximately 245 employees and consultants.
In March 1999, the Company agreed to merge Smedvig Technologies with Multi-Fluid. The primarybusiness of Multi-Fluid is the provision of multiphase flow-meters for the oil industry. Multi-Fluid will be thesurviving entity and will be renamed ROXAR ASA. See "—Recent Developments".
Smedvig Technologies' strategy is to deliver integrated products, software and services that enable increasedrecovery of oil and gas reservoirs. It is an international niche supplier in two fields of technology: computersoftware for reservoir modeling and permanently installed measuring equipment for monitoring production in thereservoir. The reservoir models estimate future production, while the measuring systems monitor the actualproduction conditions in each individual well. The long-term goal is to link these technologies in order to generatemore precise estimates and a better basis for production planning. This will make it possible to increase oil andgas recovery and, at the same time, cut associated technology costs. Smedvig Technologies also offers technologyto enable selective production management of different reservoir zones.
By combining modeling, measuring and down-hole management solutions, Smedvig Technology intends tooffer an integrated system for reservoir management, the IRMS (Intelligent Reservoir Management System). TheCompany's strategy is to tailor new technologies to the oil companies' needs, and to commercialize thesetechnologies in standardized products for sale through an international network of sales offices. In its productdevelopment efforts, Smedvig Technology sometimes works in cooperation with outside research experts andother technology companies.
Reservoir Monitoring. Smedvig Technologies' sales of reservoir monitoring systems increased by 52 percentduring 1998. Smedvig Technologies is a dominant supplier in the Norwegian reservoir monitoring market. In1998, Smedvig Technologies increased its sales of reservoir monitoring equipment in Southeast Asia, and hasformed a joint venture in Malaysia to further promote sales to national and international oil companies in theregion. As of December 31, 1998, Smedvig Technologies had an order back-log of 17 installations in SoutheastAsia, which represents a significant market share in that region of the world.
Smedvig Technologies developed a number of reservoir monitoring technologies. Hybrid electronics havenow been used in high temperature measuring sensors to increase their operational reliability. SmedvigTechnologies is developing a downhole "radar" to track the movements of the water/oil interface in the reservoir.Working together with Multi-Fluid, Smedvig Technologies has begun developing a downhole device to measurethe water content of the oil. These technologies will enable improved reservoir management and increasedrecovery. PROMAC, Smedvig Technologies' new technology for the selective guidance of oil flows fromdifferent production zones into the well, completed a successful test program and its trademark was registered in1998. The water/oil sensor being developed in cooperation with Multi-Fluid is PROMAC-compatible, and allowsthe operator to ascertain the water content produced by each zone.
Reservoir Modeling. Smedvig Technologies primary 3-D geological modeling products have beenimproved, and can now be linked to the industrial databases used by the oil companies to coordinate differentsoftware. New versions of the software products were launched in 1998. The integration of these various softwareproducts is almost complete. Smedvig Technologies has also developed a new and improved simulation modelthat makes it possible to plan reservoir production more quickly and comprehensively than earlier.

16
Software sales increased by 50 percent during the first half of the year, but decreased in the second half. Thisis due to lower exploration expenditures by the oil companies as a result of low oil prices. New versions of thesoftware and further improvements of the sales organization are expected to boost sales over the longer term.
Reservoir Services. In 1998, Smedvig Technologies carried out a number of projects associated with fielddevelopment and optimal reservoir exploitation in Venezuela, Thailand, Oman, Great Britain and Norway.Smedvig Technologies was responsible for well planning and follow-up of a number of drilling operations inMalaysia and Brunei. Smedvig Technologies has established its own service teams, offering expertise inoptimizing the use of its software. Such services are offered in the form of special studies and/or direct usersupport within the customer's own organization.
In November 1998, the division's well-engineering services in Great Britain and the Middle East were sold toDeutag AG, a German company. The remaining services relate to the division's core reservoir technology focus.In 1999, revenues from the division will decline as a result of the sale.
Activities To Be Discontinued
In April 1998, the Company made a strategic decision to discontinue its mobile production activities due todeteriorating market conditions, low profitability and Esso's termination of the Balder contracts. As a result, theCompany terminated its projects within the former Mobile Production Division. This entailed the cancellation ofthe construction contract for the production vessel SPU 550, the sale of the former storage vessel SPU 4, the saleof Altra Consultants Limited, three production contracts and the operating contract for the Janice Alpha. In thewake of these sales, the division is involved in the operation of the ENSCO 100 water-injection platform, and inpreparations for legal proceedings in connection with Esso's termination of the Balder contracts.
In 1998, the Company's operating contracts for the ENSCO 100, Balder FPU, SPU 4 and SPU 550 werereported under "Activities To Be Discontinued". The remaining production operations were reported under thePlatform Drilling Division. In November 1998, these activities were sold to Deutag. See "—Platform DrillingDivision". The Mobile Production Division/Activities To Be Discontinued accounted for approximately 13percent and 6 percent of the Company's revenues excluding gains on sale of assets in 1997 and 1998, respectively.
Set forth below is certain information concerning the Company's Activities To Be Discontinued:
ENSCO 100. The Company operates the jack-up rig ENSCO 100 (formerly West Omikron), which is one ofthe world's largest jack-up rigs. ENSCO 100 is performing water injection for Phillips Petroleum in the Ekofiskfield and has a water injection capacity of up to 350,000 barrels per day. In November 1997, the Company soldthe rig to ENSCO in order to improve the Company's financial position and reallocate capital to finance itsextensive newbuilding program. The gain from the sale totaled NOK 355 million (100 percent basis). TheCompany continues to operate the rig for Phillips Petroleum in the Ekofisk field under a bareboat charter withENSCO. The bareboat charter with ENSCO runs until the end of the operating contract with Phillips Petroleum,which expires in January 2000, with options for Phillips Petroleum to extend the contract for up to two additionalyears.
SPU 550. In 1996, the Company acquired a 50 percent ownership interest in the SPU 550, a productionvessel hull that was under construction in Japan, from the Norwegian Rasmussen Group. In April 1997, theRasmussen Group sold its 50 percent ownership interest in the SPU 550 to Navion. In April 1998, the Companyand Navion canceled the construction contract for the hull of the production vessel as a result of the Japaneseyard's failure to deliver the vessel hull within the scheduled time frame. The delivery of the vessel hull, originallyscheduled for the third quarter of 1997, was subsequently delayed. The yard accepted the cancellation andrefunded all installments.
SPU 4. In December 1996, through a joint venture, the Company and Navion purchased a 50 percentinterest each in a former storage vessel for conversion into a storage and/or production unit intended for use inareas with benign weather, such as Southeast Asia and West Africa. In April 1998, the Company and Navion soldthe former storage vessel at a loss of NOK 8 million for the Company's 50 percent interest.

17
Balder FPU. The production unit Balder FPU was designed by a company jointly owned by the Companyand Keppel FELS Limited (formerly Far East Levingston Shipbuilding Ltd.) ("KFELS") for continuous oilproduction in harsh environmental conditions. The Balder FPU was built by KFELS in Singapore and theOffshore & Marine AS yard in Norway, at a price of approximately U.S.$250 million, and was sold to Esso at aprice of U.S.$295 million. In March 1997, the Company delivered the production vessel Balder FPU to Esso. InJanuary 1997, it became evident that the total cost for completing the vessel would be higher than first estimated,and the capital gain previously booked on the vessel was therefore reversed effective in the fourth quarter of 1996.Some of the additional costs are related to guarantee works which the Company had advanced in order to securecompletion of the vessel and which the Company will seek to reclaim from its subcontractors. The Company andEsso have disagreed on the allocation of these and other costs related to the project.
In September 1997, the Company initiated limited arbitration proceedings against KFELS in London in orderto determine a procedure for enforcing the contractual warranty provisions. However, it was determined that theCompany was not entitled to establish such procedures. Consequently, the issue of the warranty provisionsremains unsettled. The Company intends to continue negotiations to settle the dispute.
In October 1997, Esso terminated the contract to operate the production vessel, along with the remainingportion of the sales contract. The termination does not mean that the vessel will be returned to the Company.Following the termination, Esso itself will perform the installation and operate the vessel on the Balder field.According to the sales contract, termination may be demanded only on grounds of substantial breach and, in theCompany's view, only prior to formal delivery. Following review of the Company's contractual obligations incomparison with the condition of the ship at the time of its delivery to Esso in March 1997, it is the Company'sview that it has satisfied its contractual obligations. The Company denies all allegations of a substantial breach ofcontract.
In April 1998, the Company brought a formal claim against Esso before the Stavanger City Court in Norwayfor unlawful termination and willful breach of the sales contract as well as the operating contract for theproduction vessel Balder FPU. In September 1998, Esso rejected the Company's claim and brought counterclaimsagainst the Company totaling approximately NOK 4 billion. See "Item 3. Legal Proceedings".
Business Development and Contracting
The Company markets its services to integrated oil and gas companies and selected exploration andproduction companies. The Mobile Units Division, Platform Drilling Division and Tender Rigs Division haveapproximately 18 existing customers, many of which have independently functioning divisions that contractseparately with the Company. As a result, most of these customers have more than one contract for the Company'sservices. The Reservoir and Well Technology Division services this same client base as well as other clients.
In the last five years, the Company has engaged in offshore drilling and other services for many leadinginternational oil and gas companies, including Statoil, Norsk Hydro, Phillips Petroleum, Esso, Elf, BritishPetroleum, Amerada Hess, Amoco, Unocal, Shell, ARCO, Petronas, TOTAL, Exxon, ENSCO, Thaipo and Mobil.The Company's three largest customers during 1998 were Statoil, Norsk Hydro and Phillips Petroleum, whichaccounted for 26 percent, 21 percent and 8 percent, respectively, of the Company's consolidated revenuesexcluding gains on sale of assets in 1998, as compared with 28 percent, 21 percent and 12 percent in 1997. Theloss of any significant customer, which could occur over time, could have a material adverse effect on theCompany's results of operations.
The Company's marketing staff and the senior executives of the Company and each division are in regularcontact with its existing and potential customers. In addition to responding to requests for tenders and proposals,through informal discussions and formal presentations, the Company actively seeks opportunities to promote theuse of its assets and services.
The Company's preference is to employ its assets through long-term contractual arrangements. In a marketwhere dayrates are profitable and rising, the Company seeks long-term contracts only, while in weaker markets itgenerally accepts only short-term contracts. Long-term contracts require less mobilization/de-mobilization costs,decrease volatility of return on assets, require less management time and, in the opinion of management,

18
enhance its customer relationships. Although this strategy affords some protection against the negative effects ofcyclicality and/or volatility in the industry, this preference for long-term asset utilization also limits the ability ofthe Company to participate fully in short-term upswings in the market. Management believes these advantagesoffset the possible foregone revenues from dayrates that in some periods may be lower than short-term marketpeaks.
Contracts for services of the Company's Mobile Units Division, Platform Drilling Division and Tender RigsDivision are typically multi-year. Actual contract durations generally vary depending on the number of wellsinvolved and the time required for the particular project. Contracts generally provide an established dayratestructure, payable monthly, and some provide for lower dayrates during periods of immobilization or undercertain circumstances when operations are interrupted or restricted. Under some contracts, the Company is entitledto additional payments for exceeding performance goals. The contracts also provide for the assumption by thecustomer of responsibility for changes in certain costs. Many contracts are extendable at the option of the otherparty. Such options may involve re-setting the dayrate based on current market rates. The contracts may beterminated by the customer upon the occurrence of certain events, including force majeure, and some contractspermit termination by the customer at any time without cause, subject to the payment of termination fees. Inaddition, some of the operating contracts for the units under construction may be terminated and provide forliquidated damages if the Company fails to deliver the units within the time frames specified in the contract.
Governmental Regulation and Environmental Matters
Many aspects of the Company's operations are affected by domestic and foreign political developments andare subject to numerous domestic and foreign laws and regulations that may relate directly or indirectly to theoffshore drilling and oil services industry, including, without limitation, laws and regulations controlling thedischarge of materials into the environment, requiring removal and cleanup or otherwise relating to environmentalprotection, and certification, licensing, safety and training and other requirements imposed by treaties, laws,regulations and conventions in the jurisdictions in which the Company operates. The offshore drilling and oilservices industry is dependent on demand for services from the oil and gas exploration industry and, accordingly,is affected by changing taxes, regulations and other laws relating to the oil and gas industry generally.
In recent years, increased concern has been raised over protection of the environment. Offshore drilling incertain areas has been opposed by environmental groups and, in certain areas, has been restricted. To date, theCompany has not had material operations in any areas where offshore drilling has been subject to such oppositionor restriction. Accordingly, such opposition and restriction has not had a material impact on the Company'soperations. However, to the extent new laws are enacted or other governmental actions are taken that prohibit orrestrict offshore drilling or impose additional environmental protection requirements that result in increased coststo the oil and gas industry in general and the offshore drilling industry in particular, the business and prospects ofthe Company could be adversely affected.
The Company's operations may involve the use or handling of materials that may be classified asenvironmentally hazardous substances. Environmental laws and regulations applicable in the countries in whichthe Company conducts operations have generally become more stringent. Such laws and regulations may exposethe Company to liability for the conduct of or conditions caused by others, or for acts of the Company which werein compliance with all applicable laws at the time such acts were taken. While the Company does not believe thatenvironmental regulations have had any material adverse effect on its capital expenditures, results of operations orcompetitive position, the Company has invested and will continue to invest in capital expenditures necessary forthe protection of life, health and the environment. However, the modification of existing laws or regulations or theadoption of new laws or regulations curtailing or further regulating exploratory or development drilling andproduction for oil and gas for political, economic, environmental or other reasons could have a material adverseeffect on the Company's operations. The Company cannot predict the extent to which future earnings may beaffected by compliance with such new legislation or regulations. In addition, the Company may become subject toadditional laws and regulations as a result of future rig relocations.
Whenever possible, the Company generally seeks to obtain indemnity agreements from the Company'scustomers requiring such customers to hold the Company harmless in the event of liability for pollution that

19
originates below the water surface, and maintains marine liability insurance and additional expense coveragewhich affords limited protection to the Company. There can be no assurance that such contractual indemnificationor insurance coverage will be sufficient or effective to protect the Company from liability or exposure toadditional expense.
With effect from 1996, a new tax scheme for shipowning and offshore companies was introduced in 1997 inNorway. According to the principles of the new tax scheme, no income tax is assessed on the income of thosecompanies that qualify and elect to participate in the scheme. Taxation will occur when dividends are paid bycompanies within the scheme or when a company elects to withdraw from the scheme. The Company joined thenew tax scheme with effect from 1996 for the majority of its fleet. For companies entering the scheme deferredtax on temporary differences are reversed. Since the Company deems it preferable to stay within the new schemefor a long time no provision for taxes has been provided for those companies within the scheme.
Competition
The Company is faced with competition that varies in nature in each of its business divisions. Whileconsolidation in the offshore drilling and oil services industry has decreased the number of competitors over thepast few years, some of the Company's competitors may have significantly greater financial, marketing, personneland other resources than the Company. As a result, such competitors may be better able to withstand cyclicalfluctuations in demand for offshore drilling and oil services or to compete for existing demand for such services.
The Company's Mobile Units Division, Platform Drilling Division and Tender Rigs Division operate in theoffshore drilling industry, which historically has been highly cyclical, with periods of high demand, short rigsupply and high dayrates followed by periods of low demand, excess rig supply and low dayrates. The mobiledrilling and tender rigs market is characterized by high capital costs, long lead times for construction of new rigsand significant competition for relatively few customers. The offshore drilling business is influenced by manyfactors, including the current and anticipated prices of oil and gas (which affect the expenditures by oil and gascompanies for exploration and production) and the availability of drilling units. Drilling contracts are traditionallyawarded on a competitive bid basis. While an operator selecting a rig may consider, among other things, thequality of service and equipment, price competition is often the primary factor in determining which amongqualified contractors is awarded a job. However, it is not unusual for contracts for technically-advanced drillingunits to be awarded on a negotiated basis rather than through competitive bidding.
Competition in the Reservoir Technology Division comes from a variety of sources, including a few largeintegrated oil services companies, as well as independent consulting companies.
Order Backlog
The Company's total order backlog (based on the value of firm contracts and excluding any options) wasNOK 6.5 billion, NOK 14.1 billion and NOK 11.0 billion, as of December 31, 1996, 1997 and 1998, respectively.The decrease in order backlog from December 31, 1997, to December 31, 1998, primarily related to the decreasein the number of new contracts that were entered into during 1998. The decrease in new contracts was due to theCompany's obligations under existing contracts. In 1996 and 1997, the Company experienced an increase inoperating contracts primarily due to the five-year operating contracts concerning the Company's new vessels.Most of the Company's units are now committed to perform such contracts and it would not be available to beused in the performance of new contracts for the next few years, thus reducing the Company's ability to enter intonew contracts. Moreover, new contracts are not negotiated until six to twelve months prior to the expiration ofexisting contracts and most of the Company's existing contracts will expire within more than twelve months. Theoptions of the Company's clients to extend such contracts would amount to approximately NOK 9.0 billion ofadditional order backlog at the end of 1998, but are subject to repricing in certain cases.
Industry and Operating Risks
In order to utilize the "Safe Harbor" provisions of the United States Private Securities Litigation Reform Actof 1995, the Company is providing the following cautionary statement. This document contains certain forward-looking statements with respect to the financial condition, results of operations and business of the

20
Company and certain of the plans and objectives of the Company with respect to these items. In particular, amongother statements, certain statements in "Item 1. Description of Business" and "Item 9. Management's Discussionand Analysis of Financial Condition and Results of Operations" with regard to management aims and objectives,planned investments and projects, expected or targeted utilization or dayrates, the date or period in which a projector action is scheduled or expected to be completed, cost estimates for newbuilding projects, industry outlook andthe statements in "Item 9. Management's Discussion and Analysis of Financial Condition and Results ofOperations" with regard to trends in results of operations, margins, overall market trends, risk management andexchange rates are forward-looking in nature. By their nature, forward-looking statements involve risk anduncertainty because they relate to events and depend on circumstances that will occur in the future. There are anumber of factors that could cause actual results and developments to differ materially from those expressed orimplied by these forward-looking statements. In addition to factors set forth elsewhere in this Annual Report, thefollowing are important factors, although not exhaustive, that may cause actual results and developments to differmaterially from those expressed or implied by these forward-looking statements.
The Company's business and operations depend principally upon conditions prevailing in the oil and gasindustry and, in particular, the exploration, development and production expenditures of oil and gas companiesand the availability of offshore drilling units. The offshore drilling and oil services industry is influenced by manyfactors, including the current and anticipated prices and demand for oil and gas, which in turn affect theexpenditures by oil and gas companies for exploration, development and production. Low oil prices typicallymean that exploration drilling is curtailed as a result of limited oil and gas company capital expenditure budgets.The Company cannot predict the future level of demand for its services or future conditions of the oil and gasindustry. While the Company believes that its long-term contracts reduce its exposure in the near term tofluctuations in oil and gas prices and changes in oil companies' spending, decreases in exploration, developmentand production expenditures could have a material adverse effect on the Company's business and results ofoperations.
Approximately 88 percent, 87 percent and 88 percent of the Company's revenues excluding gains on sale ofassets for the three years ended December 31, 1996, 1997 and 1998, respectively, were derived from offshoreexploration and production activities, which are characterized by high capital costs, long lead times forconstruction of new rigs and significant competition. Historically, the offshore drilling industry has been highlycompetitive and cyclical, with periods of high demand, short rig supply and high dayrates followed by periods oflow demand, excess rig supply and low dayrates.
Demand for the Company's offshore drilling and oil services has historically been volatile. Market conditionswill remain dependent on a variety of political and economic factors beyond the Company's control, includingworldwide demand for oil and gas, the ability of OPEC to set and maintain production levels, the level ofproduction of non-OPEC countries, the prices of oil and gas and the policies of the various governments regardingexploration and development of their oil and gas reserves. See "—Industry Overview".
The Company's international operations are also subject to political, economic and other uncertainties,including, among others, risks of war, expropriation, nationalization, renegotiation or nullification of existinglicenses or treaties, taxation and resource development policies, foreign exchange restrictions, changing politicalconditions, international monetary fluctuations and other risks relating to foreign governmental sovereignty overcertain areas in which the Company conducts operations.
As a result of extensive review of the costs, delivery schedule and project management of all of itsnewbuilding projects, the Company has revised its total project cost estimates and delivery schedules for thedrillship West Navion and the semi-submersible West Venture. While the Company believes that such revisedestimates now represent total project costs, including interest expense, project management, contingencies andoperation preparations, no assurance can be given, however, that further cost increases will not result. In view ofthe current project construction status, combined with the risks associated with final hook-up and commissioning,there still remains uncertainties concerning the final completion, delivery and costs of the two units underconstruction. No assurance can be given that further cost increases or delays will not have a material effect on theCompany's business and results of operations.

21
The Company has planned capital expenditures of approximately U.S.$280 million in 1999. In order tofinance these expenditures, the Company has raised additional funds through bank borrowing and asset sales in1998. The Company is of the opinion that the current revolving credit facility and cash-flow from operations aresufficient to finance the newbuilding program. See "Item 9. Management's Discussion and Analysis of FinancialCondition and Results of Operations—Liquidity and Capital Resources".
Several of the Company's contracts contain cancellation clauses that permit the customers to terminate thecontract upon the occurrence of specified events. Significantly, the West Venture operating contract providesNorsk Hydro a right to terminate in the event that the commencement date is delayed more than a specifiednumber of days. There can be no assurance that such clauses will not become effective and if it becomes effectivesuch party will not exercise its cancellation right. In addition, cancellation of any of these contracts could have amaterial adverse effect on the Company's business and results of operations.
Employees
At June 1, 1999, the Company had approximately 3,351 employees, consisting of approximately 1,724employees in Norway and approximately 1,627 outside Norway. Approximately 1,101 of the Company'semployees in Norway are represented by unions pursuant to industry-wide collective bargaining arrangements.The Company considers its employee relations to be good.
ITEM 2. DESCRIPTION OF PROPERTY
The Company's principal executive offices are located in Stavanger, Norway, and are under a lease with A/SVeni which will expire in June 2000 and is for approximately 1,800 square meters of space at the same location.Smedvig Offshore has entered into separate leases with A/S Veni for the base at Dusavik and for the offices,expiring in October 1998 and January 2008, respectively. A/S Veni is a real estate company wholly owned byPeter T. Smedvig and other members of the Smedvig family. See "Item 13. Interest of Management in CertainTransactions". Other leased facilities of the Company are located in Stavanger, Bergen, Oslo, London, Houston,Singapore, Kuala Lumpur and Bangkok. The Company believes that all of its owned and leased properties arewell maintained and are suitable and adequate for the present activities of the Company.
ITEM 3. LEGAL PROCEEDINGS
In late 1995, the Company sold the production vessel Balder FPU to Esso. In March 1997, the vessel wasdelivered to Esso for final completion by Esso in Scotland. In October 1997, Esso notified Smedvig that thecompany was terminating the contract to operate the production vessel, along with the remaining portion of thecontract to sell the ship. Pursuant to the review of the Company's contractual obligations in comparison with thecondition of the ship at the time of her delivery to Esso in March 1997, Smedvig believes that the Company hasfulfilled its contractual obligations. In April 1998, the Company brought a formal claim against Esso before theStavanger City Court in Norway for unlawful termination and willful breach of the sales contract as well as theoperating contract for the production vessel Balder FPU. In the claim, the Company claims payment of the finalsettlement under the sales contract plus compensation for unlawful termination and willful breach of contracts upto a total of approximately NOK 2.6 billion. In its reply, filed in September 1998, Esso rejected the Company'sclaim and brought counterclaims totaling some NOK 4 billion against the Company, based mainly on Esso's claimthat the Company substantially breached the sales and purchase contract and was grossly negligent in its handlingof the Balder project. The Company rejects this claim as unfounded, and a formal response was filed at the end ofMarch 1999. The Company maintains that Esso undertook comprehensive modifications and upgrades of thevessel above and beyond those specified in the construction contract, and that the oil company is liable for thecosts thereof. The Stavanger City Court requested Esso and the Company to initiate negotiations in October 1999with the aim of narrowing the scope of the dispute. The Stavanger City Court scheduled to hear the case betweenMarch and October 2000. The Company believes that provisions for loss are not necessary.
The Company initiated arbitration proceedings against KFELS in London in September 1997 in order todetermine a procedure for enforcing the warranty provisions independent of other conditions about which theparties are in disagreement. In November 1997, the arbitration proceedings ended and the Company's claim was
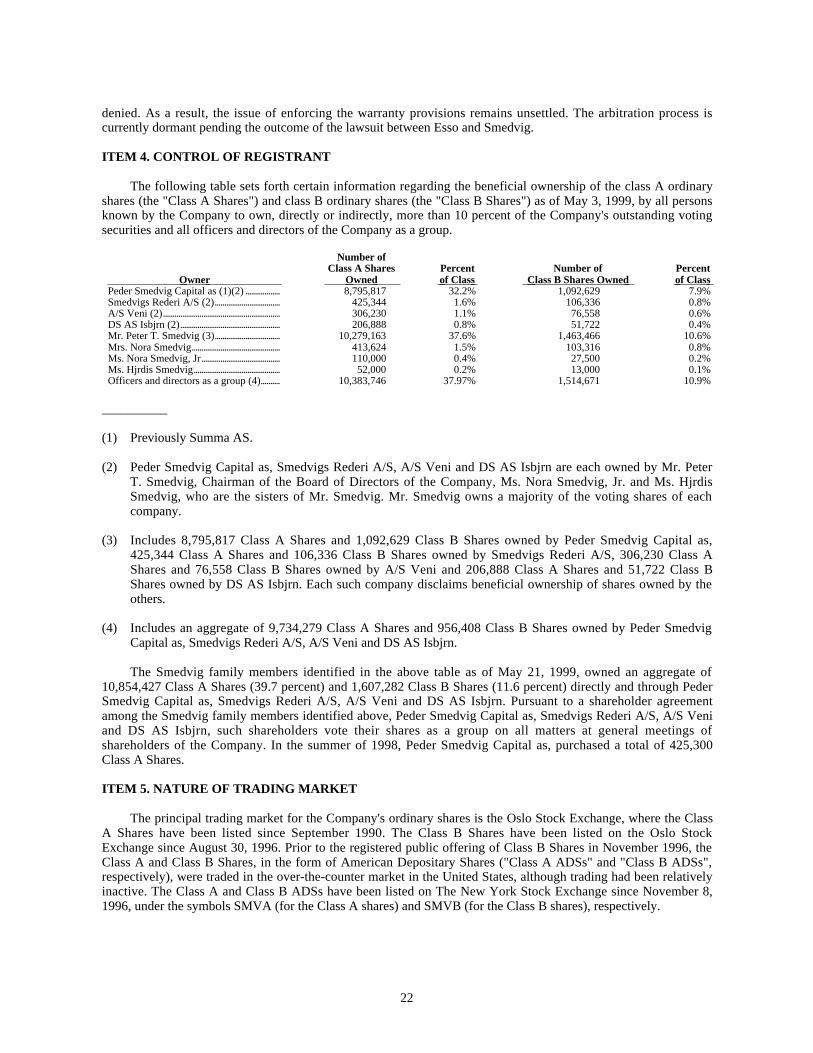
22
denied. As a result, the issue of enforcing the warranty provisions remains unsettled. The arbitration process iscurrently dormant pending the outcome of the lawsuit between Esso and Smedvig.
ITEM 4. CONTROL OF REGISTRANT
The following table sets forth certain information regarding the beneficial ownership of the class A ordinaryshares (the "Class A Shares") and class B ordinary shares (the "Class B Shares") as of May 3, 1999, by all personsknown by the Company to own, directly or indirectly, more than 10 percent of the Company's outstanding votingsecurities and all officers and directors of the Company as a group.
Owner
Number ofClass A Shares
Owned Percent of Class
Number of Class B Shares Owned
Percent of Class
Peder Smedvig Capital as (1)(2) .................. 8,795,817 32.2% 1,092,629 7.9%Smedvigs Rederi A/S (2).................................. 425,344 1.6% 106,336 0.8%A/S Veni (2)............................................................. 306,230 1.1% 76,558 0.6%DS AS Isbjrn (2).................................................... 206,888 0.8% 51,722 0.4%Mr. Peter T. Smedvig (3).................................. 10,279,163 37.6% 1,463,466 10.6%Mrs. Nora Smedvig.............................................. 413,624 1.5% 103,316 0.8%Ms. Nora Smedvig, Jr......................................... 110,000 0.4% 27,500 0.2%Ms. Hjrdis Smedvig............................................. 52,000 0.2% 13,000 0.1%Officers and directors as a group (4).......... 10,383,746 37.97% 1,514,671 10.9%
__________
(1) Previously Summa AS.
(2) Peder Smedvig Capital as, Smedvigs Rederi A/S, A/S Veni and DS AS Isbjrn are each owned by Mr. PeterT. Smedvig, Chairman of the Board of Directors of the Company, Ms. Nora Smedvig, Jr. and Ms. HjrdisSmedvig, who are the sisters of Mr. Smedvig. Mr. Smedvig owns a majority of the voting shares of eachcompany.
(3) Includes 8,795,817 Class A Shares and 1,092,629 Class B Shares owned by Peder Smedvig Capital as,425,344 Class A Shares and 106,336 Class B Shares owned by Smedvigs Rederi A/S, 306,230 Class AShares and 76,558 Class B Shares owned by A/S Veni and 206,888 Class A Shares and 51,722 Class BShares owned by DS AS Isbjrn. Each such company disclaims beneficial ownership of shares owned by theothers.
(4) Includes an aggregate of 9,734,279 Class A Shares and 956,408 Class B Shares owned by Peder SmedvigCapital as, Smedvigs Rederi A/S, A/S Veni and DS AS Isbjrn.
The Smedvig family members identified in the above table as of May 21, 1999, owned an aggregate of10,854,427 Class A Shares (39.7 percent) and 1,607,282 Class B Shares (11.6 percent) directly and through PederSmedvig Capital as, Smedvigs Rederi A/S, A/S Veni and DS AS Isbjrn. Pursuant to a shareholder agreementamong the Smedvig family members identified above, Peder Smedvig Capital as, Smedvigs Rederi A/S, A/S Veniand DS AS Isbjrn, such shareholders vote their shares as a group on all matters at general meetings ofshareholders of the Company. In the summer of 1998, Peder Smedvig Capital as, purchased a total of 425,300Class A Shares.
ITEM 5. NATURE OF TRADING MARKET
The principal trading market for the Company's ordinary shares is the Oslo Stock Exchange, where the ClassA Shares have been listed since September 1990. The Class B Shares have been listed on the Oslo StockExchange since August 30, 1996. Prior to the registered public offering of Class B Shares in November 1996, theClass A and Class B Shares, in the form of American Depositary Shares ("Class A ADSs" and "Class B ADSs",respectively), were traded in the over-the-counter market in the United States, although trading had been relativelyinactive. The Class A and Class B ADSs have been listed on The New York Stock Exchange since November 8,1996, under the symbols SMVA (for the Class A shares) and SMVB (for the Class B shares), respectively.

23
The following tables below set forth, for the periods indicated, the high and low closing prices on the OsloStock Exchange for the Class A and Class B Shares and the highest and lowest closing sales prices of ADSs asreported on the New York Stock Exchange composite tape.
Class A Shares Oslo Stock Exchange New York Stock Exchange Pric e per Class A Share Price per Class A ADS (2) High Low High Low
NOK NOK U.S.$ U.S.$1997First Quarter........................................................................................... 178.50 139.00 27.00 20.88Second Quarter..................................................................................... 193.00 156.00 25.75 22.13Third Quarter......................................................................................... 223.00 183.00 29.75 24.13Fourth Quarter ...................................................................................... 243.00 155.00 34.00 19.631998First Quarter........................................................................................... 181.00 133.00 24.88 16.63Second Quarter..................................................................................... 176.00 91.00 23.63 12.63Third Quarter......................................................................................... 102.00 58.00 13.65 7.75Fourth Quarter ...................................................................................... 83.50 55.00 11.12 7.131999First Quarter........................................................................................... 87.00 75.00 11.24 7.50Second Quarter (through June 9, 1999)................................ 105.00 79.00 12.87 10.06
Class B Shares Oslo Stock Exchange New York Stock Exchange Price per Class B Share Price per Class B ADS (2) High Low H igh Low
NOK NOK U.S.$ U.S.$1997First Quarter........................................................................................... 176.00 131.00 26.25 20.00Second Quarter..................................................................................... 190.00 152.00 26.25 21.88Third Quarter......................................................................................... 226.00 180.00 29.63 24.75Fourth Quarter ...................................................................................... 239.00 155.00 33.94 20.881998First Quarter........................................................................................... 175.00 130.00 23.25 15.88Second Quarter..................................................................................... 164.00 95.00 21.63 11.63Third Quarter......................................................................................... 94.00 82.00 12.92 6.45Fourth Quarter ...................................................................................... 73 00 50.00 10.62 6.131999First Quarter........................................................................................... 75.00 47.50 9.37 6.31Second Quarter (through June 9, 1999)................................ 93.00 66.50 11.75 8.50
__________
(1) Each Class A ADS represents one Class A share.
(2) Each Class B ADS represents one Class B Share.
The Company has entered into two deposit agreements with Citibank, N.A., as depositary (the "Depositary"),and the holders from time to time of American Depositary Receipts issued thereunder pursuant to which aseparate sponsored American Depositary Receipt facility was made available with respect to each of the Class AShares and the Class B Shares.
Based upon information available from the Norwegian share registry, Verdipapirsentralen ("VPS"), as ofMay 12, 1999, the Company had 2,119 holders of record of Class A Shares, of which 20 had registered addresses

24
in the United States and held a total of 2,962,620 Class A Shares, and 1,565 holders of record of Class B Shares,of which 16 had registered addresses in the United States and held a total of 1,056,665 Class B Shares. Citibank,N.A., as Custodian, is the registered holder for holders of Class A ADSs representing 503,200 Class A Shares andthe holders of Class B ADSs representing 1,994,960 Class B Shares. According to Citibank's registry, there werethree registered holders of Class A ADSs and there were six registered holders of Class B ADSs. Holders ofrecord of Class A Shares and Class B Shares having registered addresses in the United States, together with theregistered holders of Class A ADSs and Class B ADSs in Citibank's registry, held an aggregate of approximately12.7 percent and 22.0 percent of the total number of Class A Shares and Class B Shares, outstanding on such date,respectively. The above numbers may not be representative of the actual number of U.S. beneficial holders or thenumber of Class A Shares and Class B Shares beneficially held by U.S. persons.
ITEM 6. EXCHANGE CONTROLS AND OTHER LIMITATIONS AFFECTINGSECURITY HOLDERS
Under Norwegian foreign exchange controls, transfers of capital to and from Norway are not subject to priorgovernment approval, except for the physical transfer of payments in currency, which is restricted to licensedbanks. Consequently, a non-Norwegian resident may only receive dividend payments without a Norwegianexchange control consent if such payment is made through a licensed bank.
Under the articles of association of the Company (the "Articles of Association"), the holders of Class BShares are not entitled to vote at general meetings of shareholders. However, under Norwegian law, the holders ofClass B Shares are entitled to vote under certain limited circumstances. In November 1997, the shareholdersapproved an Amendment to the Articles of Association, and as a result, in order to participate in and vote at thegeneral meetings, shareholders must notify the Company in advance of their intent to do so. Pursuant to theArticles of Association, ownership of shares is subject to approval by the Board of Directors of the Company.Such approval requirement applies to all prospective shareholders. There are no limitations, under eitherNorwegian law or the constituent documents of the Company, on the right of non-resident or foreign owners tohold or vote the Class A Shares or Class B Shares.
ITEM 7. TAXATION
The following is a summary of certain United States federal income and Norwegian tax consequences ofownership of Class A Shares or Class B Shares ("Class A or B Shares") or Class A ADSs or Class B ADSs("Class A or B ADSs") by an investor that is not a resident of Norway for tax purposes and holds such Class A orB Shares or Class A or B ADSs as capital assets. This summary does not purport to address all material taxconsequences of the ownership of Class A or B Shares or Class A or B ADSs, and does not take into account thespecific circumstances of any particular investors (such as tax-exempt entities, certain insurance companies,broker-dealers, investors liable for alternative minimum tax, investors that actually or constructively own 10percent or more of the voting shares of the Company, investors that hold Class A or B Shares or Class A or BADSs as part of a straddle or a hedging or conversion transaction or investors whose functional currency is not theU.S. dollar), some of which may be subject to special rules. This summary is based on the tax laws of the UnitedStates (including the Internal Revenue Code of 1986, as amended, its legislative history, existing and proposedregulations thereunder, published rulings and court decisions) and Norway as in effect on the date hereof, as wellas on the Convention Between the United States of America and the Kingdom of Norway for the Avoidance ofDouble Taxation and the Prevention of Fiscal Evasion with respect to Taxes on Income and Property (the"Treaty"), all of which are subject to change (or changes in interpretation). In addition, the summary is based inpart upon the representations of the Depositary and the assumption that each obligation in the Deposit Agreementand any related agreement will be performed in accordance with its terms.
For purposes of this discussion, a "U.S. Holder" is any beneficial owner of Class A or B Shares or Class A orB ADSs that is (i) a citizen or resident of the United States, (ii) a corporation organized under the laws of theUnited States or any State or (iii) otherwise subject to United States federal income taxation on a net income basisin respect of a Class A or B Share or Class A or B ADS.

25
The discussion does not address any aspects of United States taxation other than federal income taxation orany aspects of Norwegian taxation other than income taxation, transfer taxation, property taxation, gift andinheritance taxation and capital taxation. Investors are urged to consult their tax advisors regarding the UnitedStates federal, state and local and the Norwegian and other tax consequences of their ownership of Class A or BShares and Class A or B ADSs.
In general, and taking into account the earlier assumptions, for United States federal income and Norwegiantax purposes, holders of Class A or B ADRs evidencing Class A or B ADSs will be treated as the owners of theClass A or B Shares represented by those Class A or B ADSs, and exchanges of Class A or B Shares for Class Aor B ADSs, respectively, and Class A or B ADSs for Class A or B Shares, respectively, will not be subject toUnited States federal income or to Norwegian tax.
Taxation of Dividends
Norwegian Taxation
Under Norwegian tax law, dividends paid to foreign shareholders of Norwegian corporations are, unlessotherwise provided for in an applicable tax treaty, subject to a withholding tax in Norway of 25 percent. Pursuantto the Treaty, the maximum rate of withholding tax is 15 percent on dividends paid by a Norwegian corporation toa person resident (for purposes of the Treaty) in the United States, provided that such person does not have apermanent establishment in Norway with which the dividends are effectively connected. The 15 percentwithholding rate will apply to dividends paid on Class A or B Shares held directly by U.S. Holders who properlydemonstrate to the Company and to the Norwegian tax authorities that they are entitled to the benefits of theTreaty. In particular it should be noted that certain entities only qualify to the extent such entities are subject to taxon their income. Additionally, according to recently established Norwegian tax practice, the 15 percentwithholding tax rate will also apply on dividends paid to the Depositary, but only if the Depositary has obtained aconsent in advance (upon fulfillment of certain conditions) from the Norwegian Tax Directorate. If such consentis not obtained in advance, dividends paid to the Depositary will be subject to withholding at the 25 percent rate.U.S. Holders of Class A or B ADSs who believe they are entitled to the benefits of the Treaty may apply to theNorwegian tax authorities for a refund of amounts withheld in excess of 15 percent. The application has to be filedwith the Norwegian Tax Directorate.
The Company intends to file any reports with the Norwegian authorities or agencies necessary to obtain thebenefits of the Treaty for those U.S. Holders who are entitled to them. The Company will exercise its right underthe Deposit Agreement to reasonably request from the Depositary such information from its records to enable theCompany to file such reports.
If, however, the recipient of a dividend is a U.S. Holder who is determined to be engaged in a businessactivity taxable in Norway and the Class A or B Shares or Class A or B ADSs with respect to which the dividendis paid are effectively connected with such activity, then the amount distributed to such U.S. Holder will betreated as taxable domestic dividend income in Norway, subject to the provisions of the Treaty, where applicable.
United States Federal Income Taxation
Under the United States federal income tax laws, and subject to the passive foreign investment company("PFIC") and foreign personal holding company rules discussed below, U.S. Holders will include in gross incomethe gross amount of any dividend paid (before reduction for Norwegian withholding taxes) by the Company out ofits current or accumulated earnings and profits (as determined for United States federal income tax purposes) asordinary income when the dividend is actually or constructively received by the U.S. Holder, in the case of ClassA or B Shares, or by the Depositary, in the case of Class A or B ADSs. The dividend will not be eligible for thedividends-received deduction generally allowed to United States corporations in respect of dividends receivedfrom other United States corporations. The amount of the dividend distribution includible in income of a U.S.Holder will be the U.S. dollar value of the Norwegian krone payments made, determined at the spot Norwegiankrone/U.S. dollar rate on the date such dividend distribution is includible in the income of the U.S. Holder,regardless of whether the payment is in fact converted into U.S. dollars. Generally, any gain or loss resulting fromcurrency exchange fluctuations during the period from the date the dividend payment is includible

26
in income to the date such payment is converted into U.S. dollars will be treated as ordinary income or loss. Suchgain or loss will generally be income from sources within the United States for foreign tax credit limitationpurposes.
Subject to certain limitations, the Norwegian tax withheld in accordance with the Treaty and paid over toNorway will be creditable against the U.S. Holder's United States federal income tax liability. To the extent arefund of the tax withheld is available to a U.S. Holder under the laws of Norway or under the Treaty, the amountof tax withheld that is refundable will not be eligible for credit against the U.S. Holder's United States federalincome tax liability.
For foreign tax credit limitation purposes, the dividend will be income from sources without the UnitedStates, but generally will be treated separately, together with other items of "passive income" (or, in the case ofcertain holders, "financial services income").
Distributions of additional Class A or B Shares to U.S. Holders with respect to their Class A or B Shares orClass A or B ADSs that are made as part of a pro rata distribution to all shareholders of the Company generallywill not be subject to United States federal income tax.
Taxation of Capital Gains
Norwegian Taxation
A U.S. Holder normally is not taxed in Norway on gains from the sale or other disposal of Class A or B Sharesor Class A or B ADSs. Such U.S. Holder may, however, be subject to taxation if the shareholding is effectivelyconnected with a business carried out by the U.S. Holder through a permanent establishment in Norway. Inaddition, a U.S. Holder may be subject to taxation on gains if the U.S. Holder is an individual who is or has been aresident of Norway for income tax purposes and the disposal takes place within five years after the calendar yearin which such U.S. Holder ceased to be a resident of Norway. Under the Treaty, gains realized by a resident of theUnited States from the sale or other disposal of Class A or B Shares or Class A or B ADSs generally are notsubject to Norwegian taxation unless the shareholding is effectively connected with a permanent establishment inNorway or the U.S. Holder is an individual who (i) maintains for at least 183 days during the taxable year a fixedbase in Norway with which such gains are effectively connected or (ii) is physically present in Norway for at least183 days during the taxable year. The same rules apply to gains realized upon complete liquidation of theCompany or upon redemption of Class A or B Shares. Repayment in connection with a reduction of the sharecapital by reducing the nominal value of the A or B Shares is, however, subject to withholding tax as dividenddistribution, if exceeding paid-in capital.
Deposits and withdrawals of Class A or B Shares in exchange for Class A or B ADSs will not result intaxable gain or loss for Norwegian tax purposes.
United States Federal Income Taxation
Subject to the PFIC rules discussed below, upon a sale or other disposition of Class A or B Shares or Class Aor B ADSs, a U.S. Holder will recognize gain or loss for United States federal income tax purposes in an amountequal to the difference between the U.S. dollar value of the amount realized and the U.S. Holder's tax basis(determined in U.S. dollars) in such A or B Shares or Class A or B ADSs. Generally, such gain or loss will becapital gain or loss, will be long-term capital gain or loss if the U.S. Holder's holding period for such Class A or BShares or Class A or B ADSs exceeds one year and such gain will be income from sources within the UnitedStates for foreign tax credit limitation purposes.
Additional United States Federal Income Tax Considerations
PFIC Rules
The Company believes that Class A or B Shares and Class A or B ADSs should not be treated as stock of apassive foreign investment company (a "PFIC") for United States federal income tax purposes, but this conclusionis a factual determination made annually and thus may be subject to change.

27
In general, the Company will be a PFIC with respect to a U.S. Holder if, for any taxable year in which theU.S. Holder held the Company's Class A or B ADSs or A or B Shares, either (i) at least 75 percent of the grossincome of the Company for the taxable year is passive income or (ii) at least 50 percent of the value (determinedon the basis of a quarterly average) of the Company's assets is attributable to assets that produce or are held for theproduction of passive income. For this purpose, passive income generally includes dividends, interest, royalties,rents (other than certain rents and royalties derived in the active conduct of a trade or business), annuities andgains from assets that produce passive income. If a foreign corporation owns at least 25 percent by value of thestock of another corporation, the foreign corporation is treated for purposes of the PFIC tests as owning itsproportionate share of the assets of the other corporation, and as receiving directly its proportionate share of theother corporation's income.
If the Company is treated as a PFIC, a U.S. Holder would be subject to special rules with respect to (a) anygain realized on the sale or other disposition of Class A or B Shares or Class A or B ADSs and (b) any "excessdistribution" by the Company to the U.S. Holder (generally, any distributions to the U.S. Holder in respect of theClass A or B Shares or Class A or B ADSs during a single taxable year that are greater than 125 percent of theaverage annual distributions received by the U.S. Holder in respect of the Class A or B Shares or Class A or BADSs during the three preceding taxable years or, if shorter, the U.S. Holder's holding period for the Class A or BShares or Class A or B ADSs). Under these rules, (i) the gain or excess distribution would be allocated ratablyover the U.S. Holder's holding period for the Class A or B Shares or Class A or B ADSs, (ii) the amount allocatedto the taxable year in which the gain or excess distribution was realized would be taxable as ordinary income, (iii)the amount allocated to each prior year, with certain exceptions, would be subject to tax at the highest tax rate ineffect for that year, and (iv) the interest charge generally applicable to underpayments of tax would be imposed inrespect of the tax attributable to each such year.
Special rules apply with respect to the calculation of the amount of the foreign tax credit with respect toexcess distributions by a PFIC.
A U.S. Holder who owns Class A or B Shares or Class A or B ADSs during any year that the Company is aPFIC must file Internal Revenue Service Form 8621.
Foreign Personal Holding Company Rules
The Company believes that it is not and is not likely to become a foreign personal holding company forUnited States tax purposes, but this conclusion is a factual determination made annually and thus subject tochange. In general, if the Company were a foreign personal holding company, U.S. Holders of Class A or BShares or Class A or B ADSs would be taxed currently on certain categories of undistributed passive income ofthe Company and a U.S. person who acquires shares from a decedent would not have a stepped-up basis in theClass A or B Shares or Class A or B ADSs but would have a tax basis equal to the lower of the fair market valueof the Class A or B Shares or Class A or B ADSs or the decedent's basis in the Class A or B Shares or Class A orB ADSs.
Additional Norwegian Tax Considerations
Transfer Tax
There is currently no Norwegian share transfer tax on the transfer of shares.
Inheritance Tax
When Class A or B Shares or Class A or B ADSs are transferred, either through inheritance or as a gift, suchtransfer may give rise to inheritance tax in Norway if the deceased, at the time of death, or the donor, at the timethe gift is made, is a resident or citizen of Norway. However, if the deceased, at the time of death, is not a residentof Norway but rather a citizen of Norway, Norwegian inheritance tax will not be levied if inheritance tax, or asimilar tax, is levied in the country of residence. Irrespective of residency or citizenship, Norwegian inheritancetax may be levied if the Class A or B Shares or Class A or B ADSs are effectively connected to a permanentestablishment in Norway.

28
Wealth Tax
Norway does not levy any property tax or similar tax on the Class A or B Shares. A holder of Class A or BShares or Class A or B ADSs who is not a resident or citizen of Norway is not subject to Norwegian wealth taxwith respect to such Class A or B Shares or Class A or B ADSs unless such holder is an individual or entity otherthan a corporation and his shareholding is effectively connected with a business carried out by the holder througha permanent establishment in Norway.
ITEM 8. SELECTED FINANCIAL DATA
The following selected financial data should be read in conjunction with, and is qualified in its entirety byreference to, the Consolidated Financial Statements and the Notes thereto and the other financial informationincluded herein. The selected consolidated financial data for each of the years in the five year period endedDecember 31, 1998, has been derived from the audited Consolidated Financial Statements of the Company asrestated to conform with the accounting presentation adopted in this Annual Report. See Note 1 to the auditedConsolidated Financial Statements—Basis of Consolidation. The Company's audited Consolidated FinancialStatements have been prepared in accordance with generally accepted accounting principles in Norway, whichdiffer in certain respects from generally accepted accounting principles in the United States. See Note 30 to theaudited Consolidated Financial Statements.
The selected financial data should be read in conjunction with, and are qualified in their entirety by referenceto, the financial statements and notes included elsewhere herein.
Year End ed December 31, 1994 1995 1996 (1) 1997 1998 1998 (2)
INCOME STATEMENT DATA:Amounts in Accordance with Norwegian GAAPRevenues................................................................. NOK 1,953 NOK 2,116 NOK 2,451 NOK 3,084 NOK 3,679 U.S.$485Operating expenses........................................... 1,607 1,701 1,911 2,377 2,818 371Depreciation.......................................................... 345 340 332 354 288 38Operating profit................................................... 1 75 208 353 573 76Financial income (expense) ......................... (65) 2 (23) (51) 7 1Other items (3)..................................................... 101 195 — 390 (372) (49)Income taxes......................................................... (4) (80) 35 (58) 16 2Minority interests............................................... 20 13 (10) (48) (11) (2)Net income............................................................. 53 205 210 586 213 28Earnings per share (4)...................................... 1.76 6.12 6.06 14.30 5.17 0.68Dividends per share (4)(5)............................ .60 1.60 2.00 2.25 1.75 0.23Amounts in Accordance with U.S. GAAPNet income............................................................. 142 204 98 233 189 25Basic earnings per share (4)......................... 4.67 6.09 2.83 5.68 4.59 0.61Diluted earnings per share (6)..................... 4.67 6.06 2.81 5.66 4.59 0.61
OTHER FINANCIAL DATA:Amounts in Accordance with Norwegian GAAPCapital expenditures......................................... 537 1,220 871 1,830 2,631 347Adjusted EBITDA (7)..................................... 346 415 540 707 861 114Net cash flow provided by operating activities ......................................... 175 416 350 475 742 98Net cash provided by (used in) investing activities................................... (280) (1,315) 807 (998) (2,529) (334)Net cash provided by (used in) financing activities.................................. 347 632 (1,216) 970 1,568 207

29
Year Ended December 31, 1994 19 95 1996 (1) 1997 1998 1998 (2)
BALANCE SHEET DATAAmounts in Accordance with Norwegian GAAPCash, cash equivalents and short-term investments......... NOK 711 NOK 954 NOK 534 NOK 1,074 NOK 882 U.S.$116Working capital.................................... 660 1,079 788 1,442 1,281 169Fixed assets............................................. 2,425 2,554 2,777 2,674 2,733 361New building contract..................... 1,166 1,463 422 3,525 4,228 558Total assets ............................................. 4,977 5,640 5,236 8,668 9,239 1,219Long-term debt..................................... 1,712 1,568 862 1,913 3,853 508Shareholders' equity .......................... 1,650 1,804 2,899 3,417 3,597 475Amounts in Accordancewith U.S. GAAPShareholders' equity .......................... 1,722 1,913 2,948 3,123 3,254 429
__________
(1) In 1996, a new interpretation of Norwegian accounting rules permitted the use of a proportionate methodwhen consolidating participation in jointly owned limited companies. The financial result of Varia PerdanaSdn. Bhd. have been proportionately consolidated in accordance with this new interpretation. Smedvig'sfinancial statements have been restated accordingly for prior years.
(2) Translations of amounts from Norwegian kroner into U.S. dollars and from U.S. dollars into Norwegiankroner have been made solely for the convenience of the reader at an exchange rate of U.S.$1.00 = NOK7.5800, the Noon Buying Rate on December 31, 1998.
(3) The Company terminated the newbuilding project West Navion II and expensed the full amount of costsincurred, (NOK 535 million), in 1998. In 1998, projects related to the previous Mobile Production Division,SPU 550 and SPU 4, were also terminated. As a result, a gain of NOK 6 million was realized on the SPU550, whereas the sale of SPU 4 resulted in a loss of NOK 8 million.
In November 1998, the Company sold its platform drilling operation in the United Kingdom and realized again of NOK 165 million. Some activities related to the Reservoir and Well Technology Division wereincluded in the sale.
In the third quarter of 1997, the Company sold the rig West Royal. The sale resulted in a capital gain ofNOK 33 million. In the fourth quarter of 1997, the jack-up rig West Omikron was sold. This sale resulted ina capital gain of NOK 357 million.
(4) Earnings and dividends per share in accordance with Norwegian accounting rules have been calculated usingthe average number of shares outstanding, retroactively adjusted for (i) a two-for-one share split effected inApril 1994 and (ii) the one-for-four bonus issue of B Shares to holders of A Shares effected in August 1996.The average numbers of shares outstanding for the years ended December 31, 1994 through 1998, as soadjusted, were 30,390,080, 33,495,108, 34,645,529, 41,023,375 and 41,179,115 respectively. Basic earningsper share in accordance with U.S. GAAP have been calculated using the average number of sharesoutstanding adjusted as above.
(5) Dividends in respect of a fiscal year are paid during the following fiscal year. The payment dates were May16, 1995, May 21, 1996, May 21, 1997, May 19, 1998, and May 19, 1999, for the dividends relating to fiscalyears 1994, 1995, 1996, 1997 and 1998, respectively. The Norwegian kroner/U.S. dollar exchange rate(Noon Buying Rate) on each of the respective payment dates was 6.3830, 6.6130, 7.0260, 7.5130 and7,7425. The dividends per share, expressed in U.S. dollars based on the exchange rate at each respectivepayment date, were U.S.$0.09, U.S.$0.24, U.S.$0.28 U.S.$0.30 and U.S.$0.23.
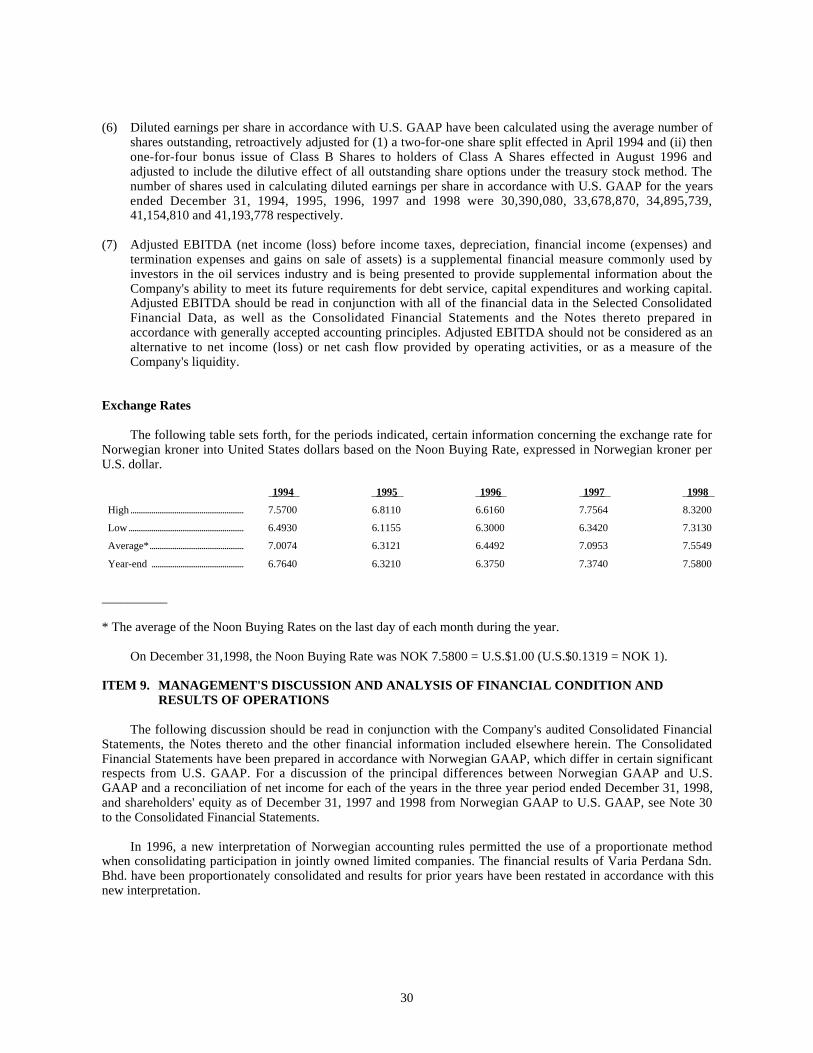
30
(6) Diluted earnings per share in accordance with U.S. GAAP have been calculated using the average number ofshares outstanding, retroactively adjusted for (1) a two-for-one share split effected in April 1994 and (ii) thenone-for-four bonus issue of Class B Shares to holders of Class A Shares effected in August 1996 andadjusted to include the dilutive effect of all outstanding share options under the treasury stock method. Thenumber of shares used in calculating diluted earnings per share in accordance with U.S. GAAP for the yearsended December 31, 1994, 1995, 1996, 1997 and 1998 were 30,390,080, 33,678,870, 34,895,739,41,154,810 and 41,193,778 respectively.
(7) Adjusted EBITDA (net income (loss) before income taxes, depreciation, financial income (expenses) andtermination expenses and gains on sale of assets) is a supplemental financial measure commonly used byinvestors in the oil services industry and is being presented to provide supplemental information about theCompany's ability to meet its future requirements for debt service, capital expenditures and working capital.Adjusted EBITDA should be read in conjunction with all of the financial data in the Selected ConsolidatedFinancial Data, as well as the Consolidated Financial Statements and the Notes thereto prepared inaccordance with generally accepted accounting principles. Adjusted EBITDA should not be considered as analternative to net income (loss) or net cash flow provided by operating activities, or as a measure of theCompany's liquidity.
Exchange Rates
The following table sets forth, for the periods indicated, certain information concerning the exchange rate forNorwegian kroner into United States dollars based on the Noon Buying Rate, expressed in Norwegian kroner perU.S. dollar.
1994 1995 1996 1997 1998
High ........................................................... 7.5700 6.8110 6.6160 7.7564 8.3200
Low............................................................ 6.4930 6.1155 6.3000 6.3420 7.3130
Average*................................................. 7.0074 6.3121 6.4492 7.0953 7.5549
Year-end ................................................ 6.7640 6.3210 6.3750 7.3740 7.5800
__________
* The average of the Noon Buying Rates on the last day of each month during the year.
On December 31,1998, the Noon Buying Rate was NOK 7.5800 = U.S.$1.00 (U.S.$0.1319 = NOK 1).
ITEM 9. MANAGEMENT'S DISCUSSION AND ANALYSIS OF FINANCIAL CONDITION ANDRESULTS OF OPERATIONS
The following discussion should be read in conjunction with the Company's audited Consolidated FinancialStatements, the Notes thereto and the other financial information included elsewhere herein. The ConsolidatedFinancial Statements have been prepared in accordance with Norwegian GAAP, which differ in certain significantrespects from U.S. GAAP. For a discussion of the principal differences between Norwegian GAAP and U.S.GAAP and a reconciliation of net income for each of the years in the three year period ended December 31, 1998,and shareholders' equity as of December 31, 1997 and 1998 from Norwegian GAAP to U.S. GAAP, see Note 30to the Consolidated Financial Statements.
In 1996, a new interpretation of Norwegian accounting rules permitted the use of a proportionate methodwhen consolidating participation in jointly owned limited companies. The financial results of Varia Perdana Sdn.Bhd. have been proportionately consolidated and results for prior years have been restated in accordance with thisnew interpretation.

31
Overview
The Company's business is dependent on exploration, development and production spending by its customerbase of integrated oil and gas companies and independent exploration and production companies. Industryexploration, development and production spending depends on the earnings and cash flow of oil and gasproducers, which are determined primarily by oil and gas prices and production volumes. Oil and gas prices areinfluenced by a variety of political and economic factors beyond the control of oil and gas companies, includingworldwide demand for oil and gas, production levels, governmental policies regarding exploration anddevelopment of reserves, political conditions in producing countries and weather conditions. As a result of oilprice fluctuations, oil wells may become economically unfeasible to operate, which may have an adverse effect onthe Company's results of operations. Further, there can be no assurance that any customer would not terminate itscontractual arrangements with the Company upon the occurrence of such event.
The Company's business is capital intensive and requires significant capital outlays for equipment, such asvessels, mobile drilling units, tender rigs and other fixed assets. As a result, the Company incurs high fixed costsin its operations. Any inability of the Company to secure contracts and maintain high utilization rates for its fixedassets and crews will have an adverse impact on the Company's operating results. There can be no assurance thatthe Company's existing and future contracts will provide revenues adequate to cover all fixed and variable costsassociated with its rigs, or that such contracts will be renewed, extended or replaced upon expiration. In addition,capital expenditures for newbuilding projects are variable and initial estimates have increased as a result of manyfactors, including delayed delivery, project complexity and project management. Further increased costs anddelivery delays may also have an adverse effect on the Company's results of operations and liquidity. Noassurance can be given that the Company will not incur further capital expenditures or delays associated with itsnewbuilding projects. See "Item 1. Description of Business — Recent Developments". Several of the Company'scontracts contain cancellation clauses that permit the customers to terminate the contract on the occurrence ofspecified events. The Company can give no assurance that any such party will not exercise its cancellation right inthe event that such clause becomes effective.
The Company owns and operates a fleet of high specification drilling rigs for offshore oil and gasexploration, provides tender rig drilling services and provides reservoir and well technology products and servicesto the offshore oil and gas industry worldwide. Most of the Company's revenues and operating profits arecurrently attributable to operations in the North Sea (principally offshore Norway and the United Kingdom) andSoutheast Asia (principally offshore Thailand and Brunei), although a substantial portion of the Company's assetsare mobile. Approximately 84 percent, 81 percent and 80 percent of the Company's revenues excluding gains onsale of assets for the years ended December 31, 1996, 1997 and 1998, respectively, were attributable to the NorthSea. Approximately 82 percent, 82 percent and 78 percent, respectively, of such North Sea revenues wereattributable to Norway. The Company also has significant operations in Southeast Asia, principally offshoreThailand. Excluding gains on sale of assets, revenues attributable to Thailand represented approximately 7percent, 5 percent and 6 percent of the Company's revenues (excluding such gains) for the years ended December31, 1996, 1997 and 1998, respectively. See Note 2 to the Consolidated Financial Statements.
As of December 31, 1997, and effective as of January 1997, the Company divided its operations into fivebusiness divisions, three of which (Mobile Units Division, Platform Drilling Division and Tender Rigs Division)were the former subdivisions of the former Well Construction Division. The five divisions reported by theCompany as of December 31, 1997, were: Mobile Units Division; Platform Drilling Division; Tender RigsDivision; Reservoir and Well Technology Division; and Mobile Production Division. On April 27, 1998, theCompany's Board of Directors decided to discontinue a substantial portion of the operations of its MobileProduction Division, effective as of January 1, 1998. The operations that were discontinued included ENSCO 100,Balder FPU, SPU 4 and SPU 550. The Board also decided to report these businesses as Activities to beDiscontinued and the Company's internal reporting was changed to comply with the Board's decision. Theremaining operations, which consisted of the Company's businesses in the UK (mainly Altra and SRM) from thattime were transferred from the Mobile Production Division to the Platform Drilling Division. In November 1998,after some months of negotiations, these remaining operations were sold to Deutag. See "Item 1. Description ofBusiness—Recent Developments" and "Item 1. Description of Business—Activities To Be Discontinued".
32
Revenues. Excluding gains on sale of assets, approximately 30 percent, 32 percent and 31 percent of theCompany's revenues for the years ended December 31, 1996, 1997 and 1998, respectively, were derived from theMobile Units Division.
Substantially all of the Company's revenues excluding gains on sale of assets are derived from drillingcontracts, production contracts or other service contracts, with additional revenues being generated from the saleof software and other technology products. Revenues from contracts are recognized during the period in which theservices are rendered at the rate structures stipulated in the contracts. Revenues are primarily a function ofdayrates and utilization, which can vary considerably over time depending on market demand. Contracts forservices of the Company's Mobile Units, Platform Drilling and Tender Rigs divisions are typically multi-year.Actual contract duration generally varies depending on the number of wells involved and the time required for theparticular project. Contracts generally provide an established dayrate structure, payable monthly, and someprovide for lower dayrates during periods of mobilization or under certain circumstances when operations areinterrupted or restricted. Under some contracts, the Company is entitled to additional payments for exceedingperformance goals. The contracts also provide for the assumption by the customer of responsibility for changes incertain costs. Many contracts are extendable at the option of the other party. Such options may involve re-settingthe dayrate based on current market rates. The contracts may be terminated by the customer upon the occurrenceof certain force majeure events, and some contracts permit termination by the customer at any time without cause,subject to the payment of termination fees.
All of the Company's semi-submersible and jack-up rigs are currently employed offshore Norway underlong-term contracts (generally two to four years), the earliest of which expires in 2000. During the periodspresented, the Company also had a semi-submersible rig employed offshore Vietnam. The Company believes thatthe employment of its mobile drilling assets under long-term contracts will reduce the Company's exposure tomarket variations and fluctuations in oil prices over the next several years. Revenues are also affected by rigmobilizations, demobilizations and time out of service. The termination of certain contracts, or expiration if notrenewed or replaced, can also adversely affect the Company's results of operations and liquidity. See the tablecaptioned Mobile Drilling Units under "Item 1. Description of Business—Mobile Units Division".
The Company has a portfolio of high quality long-term contracts for platform drilling operations in the NorthSea. The market for platform drilling is relatively mature. However, the Company believes that the current levelof activity on fixed installations can be maintained by expanding its traditional line of drilling and maintenanceservices to include well workovers from existing platforms and new methods to increase the recovery rate ofexisting fields or to access untapped areas in the reservoirs. See the table captioned Fixed Installations under "Item1. Description of Business—Platform Drilling Division".
Substantially all of the Company's revenues from tender rig operations are attributable to Thailand, Bruneiand Malaysia. The Company also currently employs one tender rig offshore Congo. Tender rig contracts providedapproximately NOK 414 million and NOK 662 million in revenues and approximately NOK 46 million and NOK169 million in operating profit for the years ended December 31, 1997 and 1998, respectively. The Companybelieves that the contracts entered into in 1998 will increase revenues and operating profit for the next couple ofyears. See the table captioned Tender Rig Fleet under "Item 1. Description of Business—Tender Rigs Division".The Company believes the market outlook for tender rigs in the region should improve over the longer term due inpart to rising energy consumption and an anticipated increase in new field developments in Southeast Asia.However, future developments in this market are difficult to predict. The Company owns a 49 percent interest inVaria Perdana, which owns four tender rigs. The Company believes this arrangement has enhanced its localpresence in the developing Southeast Asian market. In 1997, the Company expanded its operation in this regionwith the acquisition of Petrodril, which owned one tender rig and one semi-submersible tender rig. In 1998, theCompany signed an agreement to build another semi-submersible tender rig, further increasing its fleet of self-erecting tender units. This unit was delivered in March 1999.
Revenues from Reservoir and Well Technology are generated primarily through sales of software andservice contracts for reservoir monitoring, reservoir engineering services and other related technology. Asignificant percentage of the revenues generated from sales of these products and services are attributable to theNorth Sea, primarily Norway. However, the share of sales abroad is increasing.

33
In 1997, revenues from Activities To Be Discontinued were generated primarily through the operation ofWest Omikron, now renamed ENSCO 100, and, until its cancellation in October 1997, the Balder FPU pre-operation contract. In 1998, revenues from Activities To Be Discontinued were generated primarily through theoperation of ENSCO 100.
As part of its strategy, the Company acquires and disposes of assets from time to time. Gains on sale ofassets have historically had a significant impact on the Company's net income, particularly in recent years duringwhich the Company actively restructured its fleet. Capital gains in 1997 were NOK 390 million and resulted fromthe sale of two units from the Mobile Production Division. Excluding gains on sale of assets, the Companyestimates that net income for the year ended December 31, 1997, would have been approximately NOK 266million, compared to NOK 586 million, including such gains. In 1998, there was a loss of NOK 372 million. See"—Results of Operations—Year Ended December 31, 1998 Compared to Year Ended December 31, 1997—Termination Expenses and Gains on Sales of Assets".
During the period from 1991 to 1995, the Company's drilling units have been depreciated over an assumedeconomic life of 20 years. Similarly, costs for upgrading rigs have been capitalized and depreciated over theremaining economic life of the unit. Because the actual lives of the Company's drilling units have generally beenlonger than their estimated useful lives for depreciation purposes, this depreciation policy proved to beconservative, resulting in significant gains on sale of such assets. As a result, effective January 1, 1996, theCompany's fourth generation semi-submersible and ultra-large jack-up rigs are being depreciated over an assumedeconomic life of 25 years. Commencing January 1, 1996 and 1997, respectively, the third generation rigs, WestDelta and West Vanguard, are being depreciated over 25 years. See Note 1 to the Consolidated FinancialStatements.
Operating Expenses. The Company's operating expenses are relatively constant in nature, although expensesvary from region to region. Operating expenses are generally higher in Norway and the United Kingdom than inSoutheast Asia, due to the harsh environment in the North Sea and to higher personnel costs resulting from higherNorth Sea wages and other worker benefits in the United Kingdom and Norway. In general, operating expensesare not normally affected by changes in dayrates or significantly impacted by fluctuations in utilization, but tendto be higher during periods when rigs are operated under shorter term contracts. The largest expense items arepersonnel costs and depreciation. Other operating expenses include repair and maintenance, insurance andadministrative costs. Personnel costs vary depending on headcount, geographic region and complexity ofoperations. The Company is generally able to offset in part the impact of pay increases for crews employed inplatform drilling and mobile drilling operations, since most of its contracts for such services contain clauses thatcompensate the Company by an increase in dayrates for a portion of any such increases. Depreciation costs areaffected by acquisitions, upgradings and disposals of assets. Goodwill arising from acquisitions is typicallyamortized over an assumed economic life of four to ten years. Costs for periodic rig overhauls, which aregenerally conducted every fourth or fifth operating year for semi-submersibles and jack-up rigs, are accrued andexpensed annually based upon the estimated annual portion of such costs. Such costs may vary in accordance withthe schedule for rig overhauls and actual disbursements. Effective January 1, 1998, the Company increased theannual provision for periodic overhauls to approximately NOK 82 million, compared to approximately NOK 40million in 1997 and NOK 36 million in 1996. The increase in the provision is primarily the result of morestringent safety regulations for the mobile units to which the Company is subject and a change in the Company'spolicy with respect to periodic overhauls of tender rigs (including the tender rigs owned by Varia Perdana), whichare now performed at regularly scheduled intervals rather than in connection with mobilizations under newcontracts. As a result, operating expenses for subsequent periods will reflect higher provisions for repair andmaintenance. Overall, insurance costs are relatively constant although premiums as a percentage of insured assetvalues have declined since 1991.
Operating Profit. Operating profit is a function of revenues and operating expenses. Fluctuations inoperating profit are primarily caused by changes in revenues, since normal operating expenses tend to berelatively constant.
Minority Interest. At December 31, 1998, third parties owned minority interests in one of the Company'smobile units and KS Smedvig Production Contracting, which was responsible for the completion and delivery of

34
the Balder FPU to Esso. In addition, at December 31, 1997, and prior to October 1996, there were minorityinterests in KS West Omikron and in the Company's subsidiary, Geomatic.
The following table sets forth certain income and expense items as a percentage of total revenues for theperiods indicated:
Year ended December 31,
1996 1997 1998
Revenues.................................................................................................................................................................................................... 100% 100% 100%
Personnel costs ....................................................................................................................................................................................... 49 51 40
Other operating expenses ................................................................................................................................................................. 29 27 36
Depreciation............................................................................................................................................................................................. 14 11 8
Total operating expenses .................................................................................................................................................................. 92 89 84
Operating profit...................................................................................................................................................................................... 8 11 16
Interest income....................................................................................................................................................................................... 3 3 1
Foreign exchange gains (losses)................................................................................................................................................... 1 0 1
Interest expense...................................................................................................................................................................................... (4 ) (4 ) (2 )
Net financial items ............................................................................................................................................................................... 0 (1 ) 0
Income before other items ............................................................................................................................................................... 8 10 16
Termination expenses and gains on sale of assets.............................................................................................................. — 12 (10 )
Income before income taxes........................................................................................................................................................... 8 22 6
Income taxes............................................................................................................................................................................................ 1 (2) 0
Minority interests.................................................................................................................................................................................. 0 (1) 0
Net income................................................................................................................................................................................................ 9 % 19 % 6 %
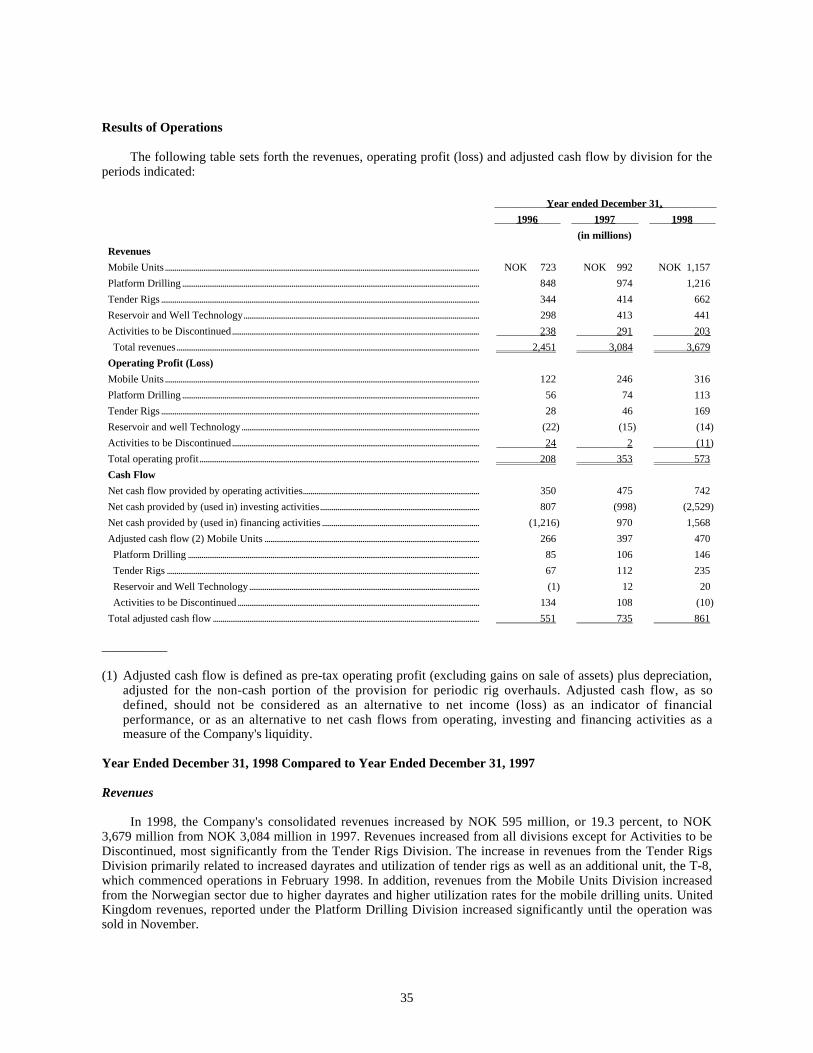
35
Results of Operations
The following table sets forth the revenues, operating profit (loss) and adjusted cash flow by division for theperiods indicated:
Year ended December 31,
1996 1997 1998
(in millions)
Revenues
Mobile Units.................................................................................................................................................................... NOK 723 NOK 992 NOK 1,157
Platform Drilling ........................................................................................................................................................... 848 974 1,216
Tender Rigs ...................................................................................................................................................................... 344 414 662
Reservoir and Well Technology........................................................................................................................... 298 413 441
Activities to be Discontinued................................................................................................................................. 238 291 203
Total revenues.............................................................................................................................................................. 2,451 3,084 3,679
Operating Profit (Loss)
Mobile Units.................................................................................................................................................................... 122 246 316
Platform Drilling ........................................................................................................................................................... 56 74 113
Tender Rigs ...................................................................................................................................................................... 28 46 169
Reservoir and well Technology............................................................................................................................ (22) (15) (14)
Activities to be Discontinued................................................................................................................................. 24 2 (11 )
Total operating profit.................................................................................................................................................. 208 353 573
Cash Flow
Net cash flow provided by operating activities............................................................................................ 350 475 742
Net cash provided by (used in) investing activities................................................................................... 807 (998) (2,529)
Net cash provided by (used in) financing activities .................................................................................. (1,216) 970 1,568
Adjusted cash flow (2) Mobile Units ................................................................................................................ 266 397 470
Platform Drilling ........................................................................................................................................................ 85 106 146
Tender Rigs ................................................................................................................................................................... 67 112 235
Reservoir and Well Technology........................................................................................................................ (1) 12 20
Activities to be Discontinued .............................................................................................................................. 134 108 (10)
Total adjusted cash flow ........................................................................................................................................... 551 735 861
__________
(1) Adjusted cash flow is defined as pre-tax operating profit (excluding gains on sale of assets) plus depreciation,adjusted for the non-cash portion of the provision for periodic rig overhauls. Adjusted cash flow, as sodefined, should not be considered as an alternative to net income (loss) as an indicator of financialperformance, or as an alternative to net cash flows from operating, investing and financing activities as ameasure of the Company's liquidity.
Year Ended December 31, 1998 Compared to Year Ended December 31, 1997
Revenues
In 1998, the Company's consolidated revenues increased by NOK 595 million, or 19.3 percent, to NOK3,679 million from NOK 3,084 million in 1997. Revenues increased from all divisions except for Activities to beDiscontinued, most significantly from the Tender Rigs Division. The increase in revenues from the Tender RigsDivision primarily related to increased dayrates and utilization of tender rigs as well as an additional unit, the T-8,which commenced operations in February 1998. In addition, revenues from the Mobile Units Division increasedfrom the Norwegian sector due to higher dayrates and higher utilization rates for the mobile drilling units. UnitedKingdom revenues, reported under the Platform Drilling Division increased significantly until the operation wassold in November.

36
Mobile Units. In 1998, revenues from the Mobile Units Division increased by NOK 165 million, or 16.6percent, to NOK 1,157 million from NOK 992 million in 1997. This increase primarily was due to higher dayratesfor all mobile drilling units as well as an increased NOK/U.S.$ exchange rate. The increase was strongest forWest Delta and West Vanguard, but also West Alpha and West Epsilon achieved higher revenues in 1998.
Platform Drilling. In 1998, revenues from the Platform Drilling Division increased by NOK 242 million, or24.9 percent, to NOK 1,216 million from NOK 974 million in 1997. The increase primarily was due to increasedactivities on the Ekofisk field, and was partially offset by decreased activity on the Oseberg and Veslefrikk fields.Revenues from operations on the British sector increased significantly until the operations were sold inNovember.
Tender Rigs. In 1998, revenues from the Tender Rigs Division increased by NOK 248 million, or 59.9percent, to NOK 662 million from NOK 414 million in 1997. All the rigs except T-3 achieved higher revenuesthan in 1997 due to higher dayrates and increased utilization. The T-8, which started on a new contract inFebruary following a major upgrading, had the largest increase, but also T-1, T-4 and T-6 experienced significantincreases.
Reservoir and Well Technology. In 1998, revenues from the Reservoir and Well Technology Divisionincreased by NOK 28 million, or 6.8 percent, to NOK 441 million from NOK 413 million in 1997, primarily dueto growth in sales internationally of reservoir monitoring systems. Software sales also increased whereas the saleof services decreased due to the disposal of parts of the well engineering activities in November.
Activities to be Discontinued. In 1998, revenues from the Activities to be Discontinued Division decreasedby NOK 88 million, or 30.2 percent, to NOK 203 million from NOK 291 million in 1997, due to the cancellationby Esso of the Balder contracts in October 1997.
Operating Expenses
In 1998, the Company's total operating expenses increased by NOK 375 million, or 13.7 percent, to NOK3,106 million from NOK 2,731 million in 1997, primarily as a result of greater business volume. Depreciationexpenses decreased by NOK 66 million, or 18.6 percent, to NOK 288 million from NOK 354 million in 1997. Thedecrease relates to the sale of West Omikron in 1997, partly offset by increases due to additional investments in1998.
Mobile Units. In 1998, operating expenses excluding depreciation for units in the Mobile Units Divisionincreased by NOK 78 million, or 12.8 percent, to NOK 687 million from NOK 609 million in 1997. A substantialpart of the increase is attributable to increased personnel costs partly compensated for by higher dayrates.Operating expenses for West Delta increased compared to last year due to higher maintenance costs andmiscellaneous equipment repairs in connection with the yard-stay in September. The Company's other mobiledrilling units experienced only modest increases in operating expenses. Depreciation expenses increased by NOK17 million, or 12.4 percent, to NOK 154 million from NOK 137 million in 1997. The increase is due to additionalinvestments in 1998.
Platform Drilling. In 1998, operating expenses excluding depreciation for units in the Platform DrillingDivision increased by NOK 202 million, or 23.3 percent, to NOK 1,070 million from NOK 868 million in 1997.The increase reflects a greater business volume. Depreciation expenses for Platform Drilling increased by NOK 1million, or 3 percent, to NOK 33 million from NOK 32 million in 1997.
Tender Rigs. In 1998, operating expenses, excluding depreciation for tender rigs in the Tender RigsDivision, increased by NOK 115 million, or 36.9 percent, to NOK 427 million from NOK 312 million in 1997.After giving effect to the increase in utilization rate, operating expenses remained stable. Depreciation expensesincreased by NOK 10 million, or 17.9 percent, to NOK 66 million from NOK 56 million in 1997, primarily due tothe upgrade of T-8.
Reservoir and Well Technology. In 1998, operating expenses excluding depreciation for equipment andGoodwill in the Reservoir and Well Technology Division increased by NOK 20 million, or 5.0 percent, to

37
NOK 421 million from NOK 401 million in 1997. The increase primarily was due to increased business volume,but the increase was lower than the increase in revenues due to reduced overhead costs. Depreciation expensesincreased by NOK 7 million, or 25.9 percent, to NOK 34 million from NOK 27 million in 1997, primarily due toincreased amortization of goodwill.
Activities to be Discontinued. In 1998, operating expenses excluding depreciation for units in the Activitiesto be Discontinued Division increased by NOK 26 million, or 13.9 percent, to NOK 213 million from NOK 187million in 1997. Ordinary operating expenses decreased in line with the reduction of business volume. Theincrease is, however, a consequence of the sale of West Omikron in December 1997. In 1998, the Companyoperated the rig under a Bareboat agreement and the capital expenses were recorded as operating expenseswhereas the corresponding cost in 1997 was depreciation expenses. Consequently, depreciation expensesdecreased by NOK 101 million, or 99.0 percent, to NOK 1 million from NOK 102 million in 1997.
Operating Profit
In 1998, the Company's operating profit increased by NOK 220 million, or 62.3 percent, to NOK 573 millionfrom NOK 353 million in 1997. This increase primarily was due to the increased revenues from Tender RigsDivision generated by increased dayrates and higher utilization as well as one more unit in operation, whileoperating costs remained relatively stable. In addition, to a lesser extent, the increase in revenues from the MobileUnits Division and Platform Drilling Division also contributed to the increase in operating profit.
Interest Income
In 1998, interest income decreased by NOK 45 million, or 48.9 percent, to NOK 47 million from NOK 92million in 1997. The decrease was due primarily to a lower average cash and cash equivalent balance in 1998.
Foreign Exchange
In 1998, net foreign exchange gain amounted to NOK 20 million compared to a net foreign exchange loss ofNOK 1 million in 1997. The improvement was due to a strengthening of NOK compared to U.S.$ during 1998.
Interest Expense
In 1998, interest expense decreased by NOK 82 million, or 57.8 percent, to NOK 60 million from NOK 142million in 1997. Long-term debt increased during the year, but interest expenses decreased as a larger portion ofinterest was capitalized on the newbuilding projects.
Termination Expenses and Gains on Sale of Assets
In 1998, Other Items amounted to a loss of NOK 372 million compared to a gain of NOK 390 million in1997. In 1998, the Company terminated the newbuilding project West Navion II and expensed in this connectionNOK 535 million. In addition, the projects SPU 550 and SPU 4 were terminated at a gain of NOK 6 million and aloss of NOK 8 million, respectively. In November 1998, the Company sold its platform drilling operation in theUK and realized a gain of NOK 165 million. In 1997, the Company had gains on sale of assets of NOK 390million from the sales of West Omikron and West Royal.
Income Taxes
In 1998, income taxes were positive by NOK 16 million, which represented an improvement of NOK 74million from 1997. The decrease is due primarily to the West Navion II termination expenses which are taxdeductible; in addition, several of the mobile units and tender rigs are organized under the Norwegian zerotaxation scheme, thus producing a positive net tax for the year.

38
Minority Interest
In 1998, minority interests accounted for a decrease in net income of NOK 11 million, primarily due to theallocation to the minority holders of net income from KS Smedvig Production Contracting and West Epsilon AS.
Net Income
The Company reported consolidated net income of NOK 213 million in 1998, a NOK 373 million decreasecompared to 1997. The decrease was due to net expenses of NOK 372 million associated with the termination ofthe construction contract for a drillship, which was in part offset by the gain from the sale of the UK platformdrilling division.
Year Ended December 31, 1997, Compared to Year Ended December 31, 1996
Revenues
Management discussion and analysis for 1997 have been restated to reflect that the Company as of January1, 1998, changed accounting principles for the accounting of "Termination Expenses and Gains on Sale of Assets"as well as the discontinuation of the Mobile Production Division and the establishment of a new division,Activities to be Discontinued. This change has also had an impact on the numbers and analysis for the PlatformDrilling Division.
In 1997, the Company's consolidated revenues increased by NOK 633 million, or 25.8 percent, to NOK3,084 million from NOK 2,451 million in 1996. Revenues increased from all divisions, most significantly fromthe Mobile Units Division. The increase in revenues from the Mobile Units Division primarily related to increasesin revenues in the Norwegian sector due to higher dayrates and higher utilization rates for the mobile drillingunits. In addition, Southeast Asia and Congo revenues increased due to increased rates and utilization of tenderrigs, while Thailand revenues decreased due to lower utilization of tender rigs. United Kingdom revenuesincreased primarily due to increased sales of consultancy services.
Mobile Units. In 1997, revenues from the Mobile Units Division increased by NOK 269 million, or 37.2percent, to NOK 992 million from NOK 723 million in 1996. This increase primarily was due to higher dayratesand improved utilization rates of all mobile drilling units. In particular, West Delta's revenues increased by 295.6percent as a result of being utilized for 10 months in 1997, compared to six months in 1996. Revenues from WestEpsilon also increased significantly.
Platform Drilling. In 1997, revenues from the Platform Drilling Division increased by NOK 126 million, or14.9 percent, to NOK 974 million from NOK 848 million in 1996. The increase primarily was due to increasedactivities on the Statfjord and Veslefrikk fields, and was partially offset by decreased activity on the Osebergfield. Revenues from operations on the British sector increased also due to the full year consolidation of AltraConsultants and increased activities on the platform operations.
Tender Rigs. In 1997, revenues from the Tender Rigs Division increased by NOK 70 million, or 20.4percent, to NOK 414 million from NOK 344 million in 1996. This increase primarily relates to the acquisition ofPetrodril as well as improved utilization rates for T-3, which were partially offset by reductions in utilization ratesfor T-1 and T-4.
Reservoir and Well Technology. In 1997, revenues from the Reservoir and Well Technology Divisionincreased by NOK 115 million, or 38.6 percent, to NOK 413 million from NOK 298 million in 1996, primarilydue to growth in sales and services and, to a lesser extent, the sales of software and reservoir monitoring systemsfrom 1996.
Activities to be Discontinued. In 1997, revenues from the Activities to be Discontinued Division increasedby NOK 53 million, or 22.3 percent, to NOK 291 million from NOK 238 million in 1996, primarily due toincreased revenues from the Balder contract.

39
Operating Expenses
In 1997, the Company's operating expenses increased by NOK 488 million, or 21.8 percent, to NOK 2,731million from NOK 2,243 million in 1996, primarily as a result of greater business volume by each division.Depreciation expenses increased by NOK 22 million, or 6.6 percent, to NOK 354 million from NOK 332 millionin 1996. The increase relates primarily to increased depreciation for tender rigs due to the acquisition of Petrodril.
Mobile Units. In 1997, operating expenses excluding depreciation for units in the Mobile Units Divisionincreased by NOK 148 million, or 32.1 percent, to NOK 609 million from NOK 461 million in 1996. The increaseprimarily was due to the operation of West Delta in Norway in 1997, which generally has higher operatingexpenses than other geographical areas. The Company's other mobile drilling units experienced only modestincreases in operating expenses, primarily due to increased personnel expenses. However, in the case of WestAlpha, which was upgraded in 1996, this increase was partially offset by reduced operating costs.
Platform Drilling. In 1997, operating expenses excluding depreciation for units in the Platform DrillingDivision increased by NOK 108 million, or 14.2 percent, to NOK 868 million from NOK 760 million in 1996.The increase primarily was due to increased sales and platform drilling services on Statfjord and Veslefrikk aswell as increased business volume in the British sector. Depreciation expenses for Platform Drilling of NOK 32million remained unchanged.
Tender Rigs. In 1997, operating expenses, excluding depreciation for tender rigs in the Tender RigsDivision, increased by NOK 32 million, or 11.4 percent, to NOK 312 million from NOK 280 million in 1996.Depreciation expenses increased by NOK 20 million, or 55.6 percent, to NOK 56 million from NOK 36 million in1996, primarily due to the acquisition of West Pelaut and T-8, which increased depreciation expenses by NOK 17million. After giving effect to the acquisition and the change in utilization rate, operating expenses remainedstable.
Reservoir and Well Technology. In 1997, operating expenses excluding depreciation for equipment in theReservoir and Well Technology Division increased by NOK 102 million, or 34.1 percent, to NOK 401 millionfrom NOK 299 million in 1996. The increase primarily was due to increased sales volume to higher expensesrelated to product development and establishment of an international sales network. Depreciation expensesincreased by NOK 6 million or 28.6 percent to NOK 27 million from NOK 21 million in 1996, primarily due tothe amortization of goodwill related to the acquisition of Petresim Integrated.
Activities to be Discontinued. In 1997, operating expenses excluding depreciation for the Activities to beDiscontinued Division increased by NOK 76 million or, 68.5 percent, to NOK 187 million from NOK 111 millionin 1996. This increase was due primarily to increased costs related to the Balder contract as a consequence of thecancellation of this contract in October 1997.
Operating Profit
In 1997, the Company's operating profit increased by NOK 145 million, or 69.7 percent, to NOK 353 millionfrom NOK 208 million in 1996. This increase in operating profits primarily was due to the increased revenuesfrom Mobile Units generated by increased dayrates, while operating costs remained relatively stable. In addition,to a lesser extent, the increase in revenues from the Platform Drilling Division and the Tender Rigs Division alsocontributed to the increase in operating profit.
Interest Income
Interest income in 1997 increased by NOK 23 million, or 33.3 percent, to NOK 92 million from NOK 69million in 1996. The increase was due primarily to a higher average cash and cash equivalent balance in 1997 aswell as marginally higher interest rates.

40
Foreign Exchange
In 1997, net foreign exchange loss amounted to NOK 1 million compared to a net foreign exchange gain ofNOK 16 million in 1996.
Interest Expense
Interest expense in 1997 increased by NOK 34 million, or 31.5 percent, to NOK 142 million from NOK 108million in 1996, primarily due to an increase in long-term debt incurred in connection with the acquisition ofPetrodril and, to a lesser extent, cash payments on new buildings and a slight increase in interest rates.
Termination Expenses and Gains on Sale of Assets
The Company had gains on sale of assets of NOK 390 million in 1997, compared to no gains in 1996. Thegains related to the sale of West Omikron and the sale of West Royal.
Income Taxes
Income tax expense in 1997 was NOK 58 million, which represented an increase of NOK 93 million from1996. Norway introduced a new tax scheme for shipping and offshore companies which came into effect in 1996for parts of the Company's activities. This entailed adjustments to the provisions for deferred taxes madepreviously consisting of a write-back of deferred taxes in the amount of NOK 84 million. As a result, the totalincome tax expense for 1996 resulted in a benefit of NOK 35 million including the deferred income tax benefit.The current income tax expense amounted to NOK 37 million and NOK 24 million in 1997 and 1996,respectively. The increase reflects higher taxable income from the tender rig operations.
Minority Interest
In 1997, minority interests accounted for a decrease in net income of NOK 48 million, primarily due to theallocation to the minority holders of net income from KS Smedvig Production Contracting, West Omikron andWest Epsilon.
Net Income
The Company reported consolidated net income of NOK 586 million in 1997, a NOK 376 million increasecompared to 1996. The increase was due to a NOK 145 million increase in operating profits from 1996, whichwas only in part offset by the NOK 28 million increase in net financial expenses.
Liquidity and Capital Resources
The Company's principal sources of funds are cash generated from operations as well as proceeds fromborrowings and, from time to time, the sale of assets. The Company's principal requirements for funds are forcapital expenditures. Net cash provided by operating activities increased to NOK 742 million in 1998 from NOK475 million in 1997, primarily as a result of increased cash flow from ordinary operations.
Net cash used in investing activities in 1998 was NOK 2,529 million, compared to NOK 998 million in1997. Capital expenditures in 1998 increased to NOK 2,631 million, from NOK 1,830 million in 1997. Theincrease in capital expenditures is primarily related to progress payments relating to the newbuilding projects,West Venture (NOK 897 million), West Navion (NOK 865 million) and West Menang (NOK 512 million). Inaddition, the Company has upgraded mobile units for NOK 139 million and Tender Rigs for NOK 110 million.
Net cash provided by financing activities amounted to NOK 1,568 million in 1998, compared toNOK 970 million in 1997. In 1998, primarily to finance capital expenditures, the Company borrowedNOK 2,320 million in long-term debt and repaid NOK 634 million of long-term debt, compared to NOK 1,484and NOK 431 million in 1997, respectively. Proceeds from the sale of fixed assets relates to the proceeds fromthe disposal of the British platform drilling operations and well engineering services for approximately U.S.$45million in November 1998. At December 31, 1998, the Company had cash, cash equivalents and short-term

41
investments of NOK 882 million, with long-term debt of NOK 3,853 million. At December 31, 1997, cash, cashequivalents and short-term investments were NOK 1,074 million, with long-term debt of NOK 1,913 million.
At December 31, 1998, the Company had planned capital expenditures of approximately U.S.$200 million in1999. In April and May 1999, the Company revised its plan of capital expenditures for 1999. The Company nowplans to spend approximately U.S.$280 million in 1999. The increase is due to higher cost projections for WestNavion and West Venture. The main part of the payments is progress payments for the newbuilding projects WestNavion, West Venture and West Menang which are due in 1999.
The Company expects to fund capital expenditures, required debt and interest payments and working capitalrequirements through 2000 out of cash flow from operations, amounts remaining under the U.S.$650 millionrevolving credit facility (as defined below), sale of assets, additional funds raised in the capital markets or acombination of thereof.
The Company from time to time also reviews possible acquisitions of or investments in businesses, drillingunits and other assets, and may in the future make capital commitments for such purposes. Any such acquisitioncould involve the payment by the Company of a substantial amount of cash financed by cash flows fromoperations, the issuance of additional equity or the incurrence of additional indebtedness.
On September 4, 1998, the Company entered into a secured U.S.$650 million reducing and revolving creditloan and guarantee facility (the U.S.$650 million Revolving Credit Facility) with a group of banks, for whomSkandinaviska Enskilda Banken AB (Publ.), Christiania Bank og Kreditkasse ASA, Citibank N.A., and Dennorske Bank ASA acted as co-arrangers, which replaced most of the Company's existing loan facilities. Thisfacility replaced the existing U.S.$250 million and U.S.$400 million unsecured revolving credit facilities. Thenew terms provide an amortization arrangement better targeted to the Company's financial needs. At the sametime, the loan was secured and repriced at a somewhat higher interest rate margin. The U.S.$650 millionRevolving Credit Facility has a final maturity date five years after the date of the agreement and provides forrepayments or facility reductions, beginning 18 months after the date of the agreement, in six equal semi-annualinstallments or reductions of U.S.$60 million each, followed by a balloon repayment or reduction of the balanceon the final maturity date. The U.S.$650 million Revolving Credit Facility bears interest at LIBOR plus 1.00percent per annum until completion and charterer's acceptance of the drillship West Navion currently underconstruction and delivery and charterer's acceptance of the fifth generation semi-submersible drilling rig WestVenture currently under construction, following which the rate will decrease by 0.125 percent per annum witheffect from July 15, 2000. The U.S.$650 million Revolving Credit Facility contains certain financial and othercovenants, including covenants requiring it to maintain (i) a minimum value adjusted net worth equal to thegreater of U.S.$250 million, and 37.5 percent of its total value adjusted assets until October 10, 1999, increasingto U.S.$300 million and 40 percent, respectively, thereafter, (ii) a minimum liquidity balance (cash and cashequivalents) of U.S.$50 million and (iii) certain minimum current assets to current liabilities and interest coverageratios. The Company is not permitted to declare or pay dividends in respect of any year in excess of 50 percent ofaverage income before income taxes for such year and the two preceding years, nor to enter into any mergerunless the Company will be the surviving entity and remain bound by the terms of the U.S.$650 millionRevolving Credit Facility, and such merger would not reasonably be expected to adversely affect the Company'sability to comply with the financial covenants under the U.S.$650 million Revolving Credit Facility. At April 20,1999, the Company had drawn down U.S.$530 million under the U.S.$650 million Revolving Credit Facility. Theremaining portion under the U.S.$650 million Revolving Credit Facility will be used to finance capitalexpenditures for its construction projects.
Exposure to Currency Fluctuations
The Company is exposed to the risk of fluctuations in foreign currency exchange rates due to theinternational nature and scope of its operations. A substantial portion of the Company's revenues and expenses aredenominated in U.S. dollars. The Company also incurs certain expenses in local currencies of the other countriesin which it operates, although such expenses, except for those in Norwegian Kroner, do not constitute a materialportion of the Company's expenses. The Company's foreign currency risks arise from; (i) fluctuations

42
in exchange rates on the value of the Company's sales and purchases in foreign currencies (transaction exposure)and certain financial assets and liabilities (translation exposure) and (ii) the Company's investment in certainsubsidiaries' net assets (translation exposure). The Company primarily uses U.S. dollar-denominated forwardexchange contracts and foreign currency options to manage its foreign currency exposure. The Company's policyis to try to hedge most of its transaction risk primarily on its net exposure. The Company hedges part of thetransaction risk of future cash flows from firm commitments such as contracts for mobile units. All realized andunrealized gains and losses on hedges of firm commitments are deferred and recognized in the period in which thehedged cash flows are received. It is the policy of the Company to hedge part of the translation risk of the netinvestment in the assets of certain subsidiaries, most of which are valued in U.S. dollars, through the designationof certain long-term borrowings in the same currency. See Note 20 to the Consolidated Financial Statements.
In general, a weakening of the Norwegian krone against other currencies in which the Company conductsoperations tends to affect operating income positively, while a strengthening of the Norwegian krone against suchother currencies tends to affect operating income negatively.
Interest Rate Risk Management
The Company uses certain financial instruments, including interest rate swaps and interest rate caps, tomanage its exposure to changes in interest rates. The amount and nature of interest rate swaps and interest ratecaps utilized by the Company is determined by management based upon an analysis of relevant factors, such asfuture cash flow forecasts, the amount and nature of the Company's financing activities and prevailing marketconditions. See Note 20 to Consolidated Financial Statements.
Net Operating Loss Tax Carry Forwards
At December 31, 1998, the Company had net tax loss carry forwards of NOK 386 million. The loss carryforwards expire in varying amounts between 2004 and 2008. Norway introduced a new tax scheme for shippingand offshore companies which came into effect in 1996 for parts of the Company's activities, these activities aretaxed at a zero rate.
Inflation
Inflation has not had a significant impact on the Company's operations and results during the periodspresented. The inflation rates in Norway, according to the Norwegian Central Bureau of Statistics, were 1.3percent, 2.6 percent and 2.3 percent in 1996, 1997 and 1998, respectively,
Year 2000
The so-called Year 2000 issue concerns computer applications that include only the last two digits in thenumber of the year. Without proper adjustments, such applications could mistake the year 2000 for the year 1900,thus creating serious operational problems.
The Company has recognized that Year 2000 could potentially cause problems to electronic, electro-mechanical and data processing systems, and has instructed its corporate departments and business divisions totake action in order to identify critical areas, map consequences of potential problems and implement correctiveactions. Because the Year 2000 problem is a challenge faced by most companies, the Company is working withother organizations, suppliers, and competitors, to help resolve the problem on a cost effective basis for all theparties concerned.
The corporate departments and Business Divisions of the Company have established special Year 2000projects (the "Millennium Projects") which consist of mapping, planning and following up activities related toYear 2000 issues with the objective to resolve potential problems and reduce the risk of system malfunctions.
The costs associated with the reprogramming are estimated to be NOK 19 million and will be expensed asthey accrue. NOK 2 million were expensed in 1998.

43
Smedvig Offshore. Smedvig Offshore, together with its business partners, is currently mapping and dealingwith the implications for its business activities in the event of potential problems with its electronic and electro-mechanical equipment as a result of computer data processing, in general, and the Year 2000, in particular. InMarch 1998, Smedvig Offshore set up a special Millennium Project Group, whose responsibility is to plan theactivities of the Millennium (Year 2000) Project, and to work with its suppliers to bring this issue to a timely andsuccessful conclusion. The focus is on Smedvig Offshore's major systems that have been identified as critical. TheProject will also demand status reports from Smedvig Offshore's suppliers and its customers.
Smedvig Offshore's Millennium Project covers two main areas. One concerns the rig systems and includessuch systems on the rig as drilling equipment and marine, positioning and communications systems. The otherconcerns the IT systems and includes such administrative systems as standard software and LAN/WAN.
The Millennium Project is also divided into two phases. Phase 1, which started on March 2, 1998, and wascompleted on September 21, 1998, included the registration and verification of equipment and components, riskevaluation, contacts with suppliers and tests. Phase 2, which started on July 13, 1998, and is expected to becompleted on August 31, 1999, includes the implementation of problem testing and solutions.
Smedvig Asia. Smedvig Asia has been actively pursuing a program to identify and rectify possible problemswith equipment on its rigs that may be adversely affected by a failure to recognize the millennium date change.The program has been implemented since April 1998.
Smedvig Asia recognizes that any piece of equipment containing process control chips incorporating datesensitive functions, even if those functions are dormant, may be vulnerable to failure. Smedvig Asia's program isbuilt on a systematic approach aiming at ensuring that all such equipment onboard the rig, that is essential for thesafe and proper operation of the rig, will function without fault in relation to the millennium date change. Itsapproach is to ensure that: (a) the manufacturers of any such vulnerable equipment give Smedvig Asia a writtenconfirmation that the equipment will function properly in relation to the millennium date change; and (b) theequipment, to the extent that the manufacturers cannot or will not give such confirmation, is tested in order todetermine whether it, separately or in combination with other equipment, will function properly in relation to themillennium date change. If the foregoing confirmation and/or tests show that the equipment might not functionproperly, then necessary steps will be taken to solve the problem.
Each rig manager working in conjunction with toolpushers, senior maintenance personnel and SmedvigAsia's technical manager, has produced rig specific lists of equipment that is essential for the safe and normaloperations of the rig and that could be affected by the millennium date change. The manufacturers of the listedequipment have been asked to provide written confirmation that the specific piece of equipment will functionproperly in relation to the millennium date change. Each rig manager is responsible for following up on theconfirmation process and setting up the testing of equipment if a written confirmation may not be obtained fromthe manufacturer. Each rig manager is also responsible for taking action to correct any problem so identified andkeeping the client informed on the status of the relevant rig's compliance program.
Similarly, Smedvig Asia has carried out controls on office equipment in area offices such as its Kuala Belaitoffice as well as its logistics office in Loyang and its main office in Singapore to ensure that its computer andcommunications equipment is year 2000 compliant.
Smedvig Technologies. Smedvig Technologies is currently running a Year 2000 compliance project assistedby Allianse IT, a consultancy firm, focusing on computing hardware, operating systems and software. The firstphase of the project has involved detailed mapping of the foregoing systems and testing of Year 2000 compliancein close cooperation with the vendors. Non-compliant items have been identified and remedial action has beenprescribed. This test in Norway will serve as the model for other geographical divisions in Smedvig Technologies.The plan is to complete the full project for Smedvig Technologies during the third quarter of 1999. SmedvigTechnologies has sent a standard Year 2000 reply to clients and a standard request letter to suppliers.
In order to certify that all Smedvig Technologies' software products are year 2000 compliant, SmedvigTechnologies has undertaken, in close cooperation with Cap Gemini, a systems evolutions phase, a systemsmodifications phase and a systems validations phase.

44
All Smedvig Technologies' software products rely on a variable number of third party software products.Therefore, any year 2000 problem related to the use of Smedvig Technologies software products may be causedby such third party products as well as by the Smedvig Technologies products themselves. However, to assist itscustomers in avoiding any year 2000 problems when using Smedvig Technologies software products, SmedvigTechnologies has enclosed statements received from its major third party software vendors.
Based on the foregoing Year 2000 compliance projects, the Company believes that once the correcting andtesting of computer systems is complete, internal systems and equipment will not give rise to significantoperational problems as a result of the Year 2000 issue.
However, due to the general uncertainty inherent in the Year 2000 problem and about the readiness of theCompany's external business partners, the Company is unable at this time to determine whether Year 2000 failureswill have a material impact on its operations, liquidity or financial condition. Scenarios under considerationinclude: corruption of data in internal information systems; hardware failures; the failure of infrastructure servicesprovided by governmental agencies, public utilities and other third party suppliers including energy andtelecommunications; and health, safety and environmental issues relating to company facilities. If any of thesewere to occur, operations within the Company could be interrupted, in some cases for a prolonged period of time.If the Company's operations on rigs and platforms should come to a halt due to the operators not having adoptedtheir systems, the Company's contracts include force majeure clauses which could result in reduced revenues forthe Company. The global nature of the Company's operations adds to the risks currently being assessed. Extensivework is therefore in progress to help reduce the level of uncertainty and to establish most likely risk scenariosfrom which the Company will develop contingency plans. The Company offers services which to a limited extentare dependent on complex IT systems which could cause systematic or long-term problems for the Company'sbusiness operations as a whole. Therefore, the most reasonable likely worst case scenario consists of disruptionsof the foregoing systems that could affect specific business processes, facilities or suppliers for a short time. TheCompany's operations are to a very limited extent dependent on external suppliers, except for the supply of spareparts and the Company believes that any disruptions caused by the key suppliers due to lack of Year 2000compliance, will be insignificant.
In 1998 and 1999, the Company has implemented a new financial management system for the Group whichis fully Year 2000 compliant. The Company does therefore not foresee any significant disruptions in its financialmanagement processes. The Year 2000 compliance project has not delayed any other IT projects.
Companies within the drilling industry have to operate very strict contingency plans as failures of theiroperations can cause series damages to personnel, environment and equipment. The Company's contingency planshave been updated to take into account Year 2000 risks. The Company has tested and replaced criticalcomponents onboard its units to minimise risks. In addition, the Company and its suppliers have a large number ofspares on stock as most of the components are standardized. In addition, plans are at present being drawn up toevaluate the necessity of bringing onboard additional personnel as well as additional spare parts.
The Company has made forward-looking statements regarding its Year 2000 program. Those statementsinclude: the Company's expectations about the timetable for completion of each phase of its program andcontingency plans; the estimated costs associated with the Year 2000 program; the Company's belief that itsinternal system and equipment will not give rise to significant operational problems as a result of the Year 2000issue. The Company has described many of the risks associated with those forward-looking statements above.However, the Company wishes to caution the reader that there are many factors that could cause its actual resultsto differ materially from those stated in the forward-looking statements. This is especially the case because manyaspects of its Year 2000 program are outside its control such as the performance of its third party suppliers,partners and customers. As a global company it operates in many different countries, some of which may not beaddressing the Year 2000 problem to the same extent as in the United States. As a result, there may be unforeseenproblems in different parts of the world. All of these factors make it impossible for the Company to ensure that itwill be able to resolve all year 2000 problems in a timely manner to avoid materially adversely affecting itsoperations or business or exposing the group to third party liability.

45
Reconciliation of Norwegian GAAP to U.S. GAAP
In June 1998, the Financial Accounting Standards Board issued Statement of Financial AccountingStandards No. 133 ("SFAS 133"), "Accounting for Derivative Instruments and Hedging Activities." Thisstatement establishes accounting and reporting standards for derivative instruments, including certain derivativeinstruments embedded in other contracts (collectively referred to as "derivatives"), and for hedging activities. Itrequires that an entity recognize all derivatives as either assets or liabilities in the statement of financial positionand measure those instruments at fair value. This statement is effective for all fiscal quarters of fiscal yearsbeginning after June 15, 1999. Management has not determined the effect of the adoption of SFAS 133.
During January 1998, the American Institute of Certified Public Accountants (AICPA) issued Statement ofPosition 98-1 Accounting for the Costs of Computer Software Developed or Obtained for Internal Use ("SOP 98-1") which becomes effective for all fiscal years beginning after December 15, 1998. Under SOP 91-1, computersoftware costs that are incurred in the preliminary project stage are expensed as incurred. Once specificcapitalization criteria have been met, external direct costs of materials and service consumed in developing orobtaining internal-use computer software, certain personnel costs, and interest costs incurred when developingcomputer software for internal use are capitalized. Training costs and data conversion costs are generallyexpensed as incurred. Such capitalized costs are amortized over the estimated useful life of the software. TheCompany is evaluating the effect of the pronouncement.
The AICPA issued Statement of Positions 98-5, Reporting on the Costs of Start-Up Activities ("SOP 98-5")in April 1998 and is effective for fiscal periods beginning after December 15, 1998 SOP 98-5 provides guidanceon the financial reporting of start-up costs and organization costs. It requires costs of start-up activities andorganization costs to be expenses as incurred. The Company is evaluating the effect of the pronouncement.
ITEM 9A. QUALITATIVE AND QUANTITATIVE DISCLOSURE OF MARKET RISK
Financial Instruments and Risk Management
The Company has operations and assets in a number of countries world-wide. Consequently, the Company'sresults from operations are affected, when measured in NOK, by fluctuations in currency exchange rates,primarily relative to the U.S. dollar. When the NOK appreciates against other currencies, the Company's profitsfrom operations in foreign currencies reported in NOK may decrease. Likewise, when the NOK depreciatesagainst other currencies, the Company's profits from operations in foreign currencies reporting in NOK mayincrease. The Company is also exposed to changes in interest rates. Different financial instruments are used by theCompany to manage these foreign currency and interest rate risks as summarised below:
Foreign Currency Risk Management
The Company's contract portfolio, forward contracts on currencies and foreign currency options are used tohedge the future value of income and expenses denominated in foreign currencies and the foreign exchange risk ofSmedvig's assets and liabilities. The Company's foreign currency risks arise from: (i) fluctuations in exchangerates on the value of the Company's sales and purchases in foreign currencies (transaction exposure) and certainfinancial assets and liabilities (translation exposure) and (ii) the Company's investment in certain foreignsubsidiaries' net asset (translation exposure).
The Company is hedging most of its transaction risk by way of its net exposure. At the end of 1998, theCompany's long-term interest bearing debt was hedged against foreign currency fluctuations by operatingcontracts in the same currency which ensures sufficient cash flow to settle operating expenses, interest andinstallment payments. Foreign currency exposure related to long-term debt was eliminated by having operatingincome and expenses, interest expenses, installment payments and interest bearing debt being recorded at fixedexchange rates. Of the revolving credit facility with a limit of U.S.$650 million, U.S.$505 million was drawn atDecember 31, 1998.

46
Interest Rate Risk Management
The extent of the utilization of financial instruments for interest rate risk management is determined byreference to the Company's net debt exposure and the Company's views regarding future interest rates. At the endof 1998, approximately 70 percent of the Company's U.S. dollar interest bearing debt was hedged with interestrate swap agreements. This implies that the Company for this part of the debt has a fixed interest rate. Most ofthese contracts have a term of three to five years. If an interest rate swap agreement is terminated, the Companywill continue to account for the gain or loss in accordance with the swap agreement for as long as the underlyingloan still exists. In the case the Company terminates the underlying loan, the effect of the financial instrument isbooked to the income statement. The Company's loans are denominated in U.S. dollars.
Sensitivity Analysis
The analysis below presents the sensitivity of the market or fair value of the Company's financial instrumentsto selected changes in market rates and prices. The range of changes chosen reflects the Company's view ofchanges that are reasonably possible over a one year period.
Interest Rates Sensitivity
The Company's interest bearing debt totalled NOK 3,749 million at year-end (corresponding toapproximately U.S.$518 million), all of which is denominated in U.S.$. All loans have floating rates. However, atthe end of the year, the Company had entered into interest swap arrangements for U.S.$359 million. A change ofone percentage point (100 basis points) in the interest rate would result in a change of approximately NOK 2.9million the Company's annual interest expenses. The effect is somewhat moderated by corresponding changes ininterest income from the Company's cash and short-term investments.
Exchange Rates Sensitivity
A significant portion of the Company's revenues is generated in U.S.$. Similarly, its fixed assets are financedmainly in U.S.$. The Company's operating cash flow in U.S.$ exceeds annual installments and interest paymentson the Company's debt. A strong U.S.$ therefore has a positive effect on the Company's financials, businessstatements and operations. This effect is somewhat moderated as a consequence of the Company's foreignexchange accounting policy (see Note 1 to the Consolidated Financial Statements). A 10% change in theNOK/U.S.$ exchange rate would alter the operating profit for the year by approximately NOK 60 million.

47
ITEM 10. DIRECTORS AND OFFICERS OF REGISTRANT
The principal executive officers and the directors of the Company at June 1, 1999, were:
Name Age Position
Date First Electedor AppointedDirector or
Executive Officer Peter T. Smedvig.......................................................... 52 Chairman of Board of Directors 1989
Raymond De Smedt.................................................... 60 Director 1994
Odd Martinsen............................................................... 63 Director 1989
J. Larry Nichols............................................................. 55 Director 1996
Andrew C. Salvesen ................................................... 52 Director 1990
Christian Bull Eriksson............................................. 42 Chief Executive Officer 1999
Stale Rd ............................................................................. 49 Executive Vice President 1989
Ketil Lenning.................................................................. 48 Executive Vice President Projects 1989
Ole Gladhaug.................................................................. 44 Chief Financial Officer 1995
Einar Bryne...................................................................... 51 Human Resource Director 1989
Torkell Gjerstad............................................................ 44 Managing Director, Smedvig Technologies 1995
(Holding) AS
Kjell E. Jacobsen.......................................................... 42 Managing Director, Smedvig Offshore AS 1991
Larry Robbins ................................................................ 51 Acting Managing Director, Smedvig Asia Ltd 1998
Petter Aalvik................................................................... 33 Company Secretary 1997
Peter T. Smedvig has served as Chairman of the Board of the Company since 1989, and as Chairman of theBoard in the private Smedvig companies since 1977. In 1987, on behalf of the private Smedvig companies, Mr.Smedvig acquired and merged ScanArmatur and ScanPaint to form Scana Industrier asa and listed the companyon the Oslo Stock Exchange in 1995. The private Smedvig companies retain a 50.7 percent interest in ScanaIndustrier asa, and Mr. Smedvig has served as Chairman of the Board since 1991. Further, in connection with theprivate Smedvig companies' venture capital activity, Mr. Smedvig serves inter alia as Non-Executive Director ofShield Diagnostics Group plc, a company listed on the London Stock Exchange and as Non-Executive Director ofApax Partners Corporate Finance Limited, the corporate finance arm of Apax Partners & Co. Ventures Limited, aleading London-based venture capital organization.
Mr. Smedvig was President of the Norwegian Shipowners Association for the years 1986 and 1987. He wasintroduced to the oil and gas industry through his internships with Petrofina in 1971 and Elf Aquitaine in 1972 to1973. Mr. Smedvig earned a Bachelor of Arts degree from the University of Newcastle upon Tyne in 1970 and aMaster of Business Administration degree from the Wharton School of Finance and Commerce, University ofPennsylvania in 1972.
Raymond De Smedt joined the Company's Board of Directors in 1994. He is a Director and Executive ViceChairman of Bitech Corporation, a public Canadian company. Mr. De Smedt is the Chairman of the Board ofNorbay Oil Limited, a privately held company involved in oil and gas exploration and production with interestsprimarily in South America. He has over 35 years experience in the oil service industry, having held seniorexecutive positions in various global regions with the Schlumberger group. Mr. De Smedt is a Civil Engineer whograduated from the (I.R.A.M.) University of Mons in Belgium in 1962.
Odd Martinsen has been a Director of the Company since 1989. After joining the Smedvig group in 1968,Mr. Martinsen has served as Executive Finance Officer and Chief Executive Officer of various Smedvig familycompanies. Until 1998, Mr. Martinsen was Chief Executive Officer of the Smedvig family companies: SmedvigsRederi A/S, A/S Veni and Peder Smedvig Capital as. He is still employed as consultant to these companies. He isalso a Director of the Board of Scana Industrier asa. Mr. Martinsen graduated from the Norwegian School ofEconomics and Business Administration in 1962.
J. Larry Nichols became a Director of the Company in 1996. He co-founded Devon Energy Corporation, apublic U.S. oil and gas exploration and production company. He has been a Director of such entity since 1971

48
and President and Chief Executive Officer since 1980. He serves as a director of the Independent PetroleumAssociation of America. Mr. Nichols is the President of the Domestic Petroleum Council, and is also a Director ofthe National Petroleum Council and the National Association of Manufacturers. Mr. Nichols holds a geologydegree from Princeton University and a law degree from the University of Michigan. He served as a law clerk toMr. Chief Justice Earl Warren of the U.S. Supreme Court.
Andrew C. Salvesen has been a Director of Smedvig since 1990. Following three and a half years in themerchant navy, Mr. Salvesen joined Christian Salvesen plc, a large diversified Scottish company in 1970 and wasresponsible for the development of that company's oil field service interests headquartered in Aberdeen over a 17year period. He was a director from 1989 until 1997 and joined the Board of Aggreko plc following the spinoff ofthis company from Christian Salvesen plc in September 1997. Mr. Salvesen is Chairman of Canvas Holidays andRoberston Research Holdings. He is also a director of Stirling Shipping, a leading North Sea supply shipoperation. Mr. Salvesen was born in Edinburgh and educated in Scotland.
Christian Bull Eriksson joined the Company as new Chief Executive Officer on June 7, 1999. He has 16years of experience in the oil and gas industry. From 1995 until he joined the Company, he served as ProjectManager (1996-1998) and Country Director Norway (1998-1999) in Rockwater A/S Brown and Root EnergyServices (Halliburton). From 1992 until 1995, he was Managing Director of RC Subsea A/S. He held severalpositions in Cameron, Saga Petroleum and Elf Aquitaine. Mr. Eriksson graduated from the Norwegian TechnicalInstitute in Chemical Engineering/Petroleum Engineering in 1982.
Stale Rd acted as the Chief Executive Officer of the Company from the end of March 1998 until June 7,1999. Mr. Rd is at present the Executive Vice President. Mr. Rd will return to his previous position as ManagingDirector of Smedvig Asia. Mr. Rd joined the Company in 1981 and served as Manager of Drilling from 1987 to1990. From 1990 to 1996, Mr. Rd served first as the Company's Chief Financial Officer and then as theCompany's Chief Operating Officer. From 1996 to 1998, he served as the Managing Director of Smedvig AsiaLtd., the Company's principal operating subsidiary for the Tender Rigs Division. Mr. Rd earned a degree inengineering and a degree in economics from the Norwegian School of Business Administration. He also receiveda Master of Business Administration degree from the University of Wisconsin in 1980.
Ketil Lenning is the Executive Vice President Projects. He joined the Company in 1989 and has served invarious senior positions, including as Chief Operating Officer of the Company and Managing Director of SmedvigProduction Contracting AS. He has 24 years of experience in the oil and gas industry, including 13 years withNorsk Hydro. He received a Bachelor of Science degree from Texas A&M University.
Ole Gladhaug is the Chief Financial Officer. He joined the Company in 1995. Mr. Gladhaug has 13 yearsexperience from senior positions in banking, the securities industry, and the fund management industry. He servesas a non-Executive Director of the Board of the bank Sparebanken Rogaland. Mr. Gladhaug graduated from theNorwegian School of Economics and Business Administration in 1981, and also holds a degree in PoliticalScience from the University of Bergen.
Einar Bryne is the Human Resource Director. He joined the Company in 1985. Previously, he served asPersonnel and Administration Manager with Aker Norsco from 1978 to 1985. He earned a Bachelor of Artsdegree in 1974.
Torkell Gjerstad serves as the Managing Director of Smedvig Technologies, the Company's principaloperating subsidiary for the Reservoir and Well Technology Division. Prior to joining the Company in 1995, hemanaged Technica Ltd., a U.K. based consulting company with a worldwide presence within industrial riskmanagement and associated software development. Mr. Gjerstad's previous experience includes petroleumresearch in Norway and employment with the French oil company Elf. He received a Master of Science degreefrom the Norwegian Institute of Technology in 1977.
Kjell E. Jacobsen is the Managing Director of Smedvig Offshore AS, the Company's principal operatingsubsidiary for the Norwegian operations of the Mobile Units Division and Platform Drilling Division. He joinedthe Company in 1991. Previously, he was employed by Statoil from 1981 to 1986 and in the corporate financedepartment of Citicorp in both Oslo and London from 1986 to 1991. Mr. Jacobsen graduated from the

49
Norwegian Naval Academy in 1976 and from the Norwegian School of Economics and Business Administrationin 1981.
Larry Robbins is the Acting Managing Director of Smedvig Asia Ltd., the Company's principal operatingsubsidiary for the Tender Rigs Division. He joined Smedvig Asia Ltd. (formerly Robray Drilling Company) in1981 and served as Area Manager in Kuala Lumpur, Malaysia from 1981 to 1993. From 1993 until 1998, heserved as Operations Manager in Singapore. He earned a Bachelor of Science degree in Engineering from theUniversity of Texas in 1972 and has been involved in offshore drilling operations since then.
Petter Aalvik joined the Company in 1997 and serves as the Company Secretary. Previous experienceincludes management consulting with the Boston Consulting Group in Stockholm and Oslo and a position asVessel Manager for Stolt Comex Seaway S.A. in Haugesund. Mr. Aalvik graduated from the Norwegian NavalAcademy in 1986 and received a Bachelor of Engineering degree from Glasgow University in 1990. He received aMaster of Business Administration degree from INSEAD in 1994.
ITEM 11. COMPENSATION OF DIRECTORS AND OFFICERS
The aggregate amount of compensation paid by the Company and its subsidiaries for the year endedDecember 31, 1998, to all directors and officers of the Company as a group (13 persons) was approximately NOK16 million, of which NOK 14 million consisted of salaries and NOK 2 million consisted of benefits in relation toexercised stock options in 1998. For the year ended December 31, 1998, the Chief Executive Officer receivedNOK 1.9 million in remuneration.
ITEM 12. OPTIONS TO PURCHASE SECURITIES FROM REGISTRANT OR SUBSIDIARIES
The Company currently has four share option plans. As of December 31, 1998, a total of 434,250 options,which are exercisable for an aggregate of 137,500 A Shares and 276,750 B Shares, were outstanding under suchplans. Share options held by directors and officers of the Company as of December 31, 1998, are as follows: PeterT. Smedvig, 0; Raymond De Smedt, 0; Odd Martinsen, 0; Andrew C. Salvesen, 0; J. Larry Nichols, 0; Stale Rd,101,500; Ketil Lenning, 57,750; Ole Gladhaug, 14,000; Einar Bryne, 17,125; Torkell Gjerstad, 1,500; Kjell E.Jacobsen, 39,000; Larry Robbins, 2,625; and Petter Aalvik, 1,125. As of December 31, 1998, the Board ofDirectors of the Company was authorized to grant a further 100,000 options, which are exercisable for anaggregate of 0 A Shares and 100,000 B Shares, from such plans. All share options are exercisable. See Note 19 tothe Consolidated Financial Statements.
ITEM 13. INTEREST OF MANAGEMENT IN CERTAIN TRANSACTIONS
The Company and certain of its subsidiaries lease certain properties, including the Company's principalexecutive offices, from A/S Veni, which is a real estate company wholly owned, directly or indirectly, by Peter T.Smedvig and members of the Smedvig family and of which Odd Martinsen, a director of the Company, is aconsultant. The aggregate amounts of rent paid in respect of such properties were NOK 13.9 million, NOK 16.0million and NOK 11.0 million for 1996, 1997 and 1998, respectively.
The Smedvig family members identified in the above table own an aggregate of 10,854,427 Class A Shares(39.7 percent) and 1,607,282 Class B Shares (11.6 percent) directly and through Peder Smedvig Capital as,Smedvigs Rederi A/S, A/S Veni and DS AS Isbjrn. Pursuant to a shareholder agreement among the Smedvigfamily members identified above, Peder Smedvig Capital as, Smedvigs Rederi A/S, A/S Veni and DS AS Isbjørn,such shareholders vote their shares as a group on all matters at general meetings of shareholders of the Company.

50
PART III
ITEM 15. DEFAULTS UPON SENIOR SECURITIES
None.
ITEM 16. CHANGES IN SECURITIES AND CHANGES IN SECURITIES FOR REGISTERED SECURITIES
None.
PART IV
ITEM 18. FINANCIAL STATEMENTS
See pages F-1 through F-32 incorporated herein by reference.
ITEM 19. FINANCIAL STATEMENTS AND EXHIBITS
(a) Financial Statements.
The following financial statements and the notes thereto, together with the report of KPMG a/s, independentpublic accountants, thereon, are included herein:
Page Report of independent accountants of Smedvig asa ................................................................................................................................................................................... F-1Consolidated financial statements: Consolidated income statements for the years ended December 31, 1996, 1997 and 1998.............................................................................................. F-2 Consolidated balance sheets as at December 31, 1997 and 1998..................................................................................................................................................... F-3 Consolidated statements of cash flows for the years ended December 31, 1996, 1997 and 1998................................................................................. F-4 Notes to consolidated financial statements.................................................................................................................................................................................................... F-5
(b) Exhibits.
1. English translation of Certificate of Registration, dated May 22, 1999.
2. Amendment No. 2 to Contract No. NH10604420, dated November 13, 1998, between Norsk HydroProduksjon a.s. and Smedvig Offshore AS.*
3. U.S.$650 million Reducing and Revolving Credit Loan and Guarantee Facility Agreement, datedSeptember 4, 1998, between the Company and a group of banks for whom Christiania Bank ogKreditkasse ASA, Citibank N.A., Den norske Bank ASA and Skandinaviska Enskilda Banken AB (Publ.)acted as Co-Arrangers.*
____________________
* Certain portions of these documents have been omitted pursuant to a request for confidential treatment.

51
SIGNATURES
Pursuant to the requirements of Section 12 of the Securities Exchange Act of 1934, the Registrant certifiesthat it meets all of the requirements for filing this Annual Report on Form 20-F and has duly caused this AnnualReport to be signed on its behalf by the undersigned, thereunto duly authorized.
SMEDVIG asa(Registrant)
By : /s/ OLE GLADHAUGName: Ole GladhaugTitle: Chief Financial Officer
Dated: June 22, 1999

52
REPORT OF INDEPENDENT ACCOUNTANTS
THE BOARD OF DIRECTORSSmedvig asa
We have audited the consolidated balance sheets of Smedvig asa and subsidiaries as at December 31, 1997,and 1998, and the related consolidated statements of income and cash flows for each of the years in the three-yearperiod ended December 31, 1998. These consolidated financial statements are the responsibility of the Company'smanagement. Our responsibility is to express an opinion on these consolidated financial statements based on ouraudits.
We conducted our audits in accordance with auditing standards generally accepted in Norway, which aresubstantially the same as those generally accepted in the United States of America. Those standards require thatwe plan and perform the audit to obtain reasonable assurance about whether the financial statements are free ofmaterial misstatement. An audit includes examining, on a test basis, amounts and disclosures in the financialstatements. An audit also includes assessing the accounting principles used and significant estimates made bymanagement as well as evaluating the overall financial statement presentation. We believe that our audits providea reasonable basis for our opinion.
In our opinion, the consolidated financial statements present fairly, in all material respects, the financialposition of Smedvig asa and subsidiaries as at December 31, 1997 and 1998, and the results of their operationsand their cash flows for each of the years in the three-year period ended December 31, 1998, in conformity withgenerally accepted accounting principles in Norway.
Generally accepted accounting principles in Norway vary in certain significant respects from generallyaccepted accounting principles in the United States. Application of generally accepted accounting principles in theUnited States would have affected results of operations for each of the years in the three-year period endedDecember 31, 1998 and shareholders' equity as at December 31, 1997 and 1998 to the extent summarized in Note30 to the Consolidated Financial Statements.
Stavanger, Norway KPMG asMarch 26, 1999
Aage K. SeldalState Authorized Public Accountant
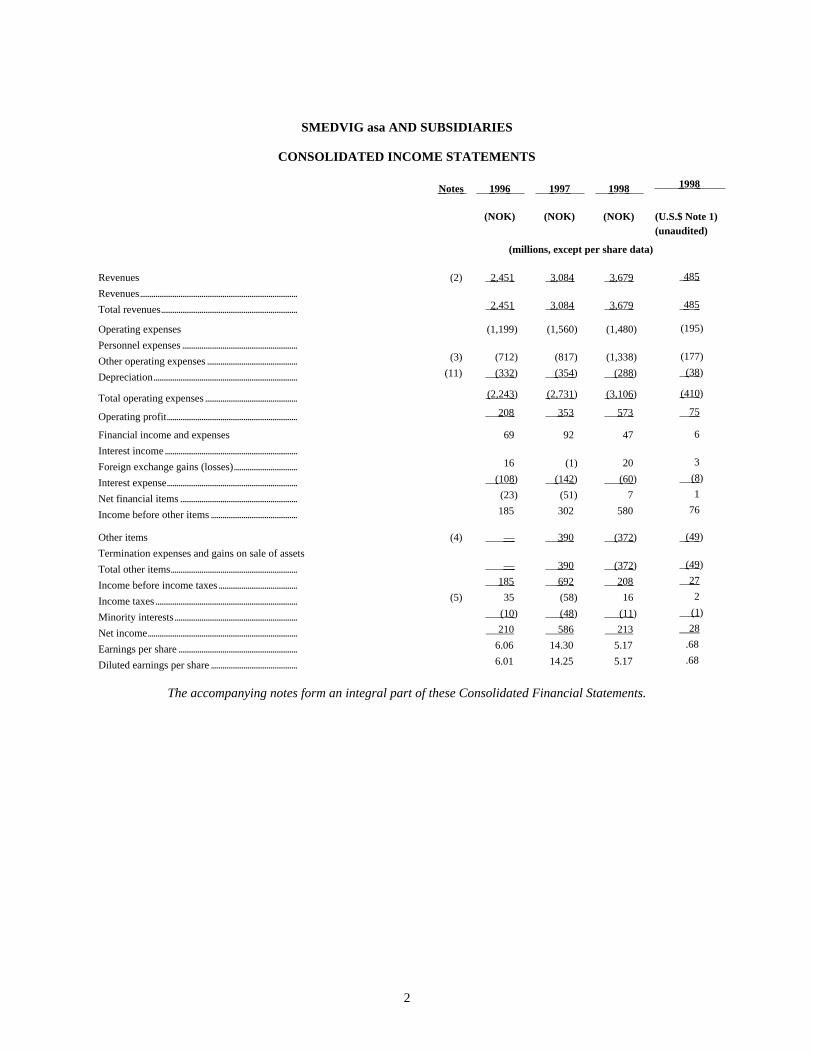
2
SMEDVIG asa AND SUBSIDIARIES
CONSOLIDATED INCOME STATEMENTS
Notes 1996 1997 1998 1998
(NOK) (NOK) (NOK) (U.S.$ Note 1)(unaudited)
(millions, except per share data)
Revenues
Revenues..................................................................................
(2) 2,451 3,084 3,679 485
Total revenues....................................................................... 2,451 3,084 3,679 485
Operating expenses
Personnel expenses ............................................................
(1,199) (1,560) (1,480) (195)
Other operating expenses ............................................... (3) (712) (817) (1,338) (177)
Depreciation........................................................................... (11) (332 ) (354 ) (288 ) (38 )
Total operating expenses ................................................ (2,243 ) (2,731 ) (3,106 ) (410 )
Operating profit.................................................................... 208 353 573 75
Financial income and expenses
Interest income.....................................................................
69 92 47 6
Foreign exchange gains (losses)................................. 16 (1) 20 3
Interest expense.................................................................... (108 ) (142 ) (60 ) (8 )
Net financial items ............................................................. (23) (51) 7 1
Income before other items ............................................. 185 302 580 76
Other items
Termination expenses and gains on sale of assets
(4) — 390 (372 ) (49 )
Total other items.................................................................. — 390 (372 ) (49 )
Income before income taxes......................................... 185 692 208 27
Income taxes.......................................................................... (5) 35 (58) 16 2
Minority interests................................................................ (10 ) (48 ) (11 ) (1 )
Net income.............................................................................. 210 586 213 28
Earnings per share .............................................................. 6.06 14.30 5.17 .68
Diluted earnings per share ............................................. 6.01 14.25 5.17 .68
The accompanying notes form an integral part of these Consolidated Financial Statements.

3
SMEDVIG asa AND SUBSIDIARIES
CONSOLIDATED BALANCE SHEETS
As at December 31, Notes 1997 1998 1998
(NOK) (NOK) (U.S.$ Note 1)(Unaudited)
(in millions)ASSETS
Current assets Cash and cash equivalents................................................................................................................................ (6) 767 579 76 Short-term investments...................................................................................................................................... (7) 307 303 40 Accounts receivable............................................................................................................................................. (8) 1,042 1,028 136 Spare parts................................................................................................................................................................. 105 141 19 Total current assets........................................................................................................................................... 2,221 2,051 271 Long-term assets Shares, investments in and receivables from associated companies and long-term investments.................................................................................................. (9) 158 177 23 Goodwill..................................................................................................................................................................... (10) 90 50 7 Mobile units and tender rigs ........................................................................................................................... (11) 2,509 2,550 336 Other tangible assets............................................................................................................................................ (11) 165 183 24 Newbuilding contracts........................................................................................................................................ (12) 3,52 5 4,228 558 Total long-term assets .................................................................................................................................... 6,447 7,188 948 Total assets .................................................................................................................................................................. 8,668 9,239 1,219 LIABILITIES AND SHAREHOLDERS' EQUITYCurrent liabilities Short-term interest bearing debt ................................................................................................................... (13) 1 — — Income taxes payable.......................................................................................................................................... (5) 25 26 3 Dividends payable ................................................................................................................................................ 93 72 10 Accounts payable .................................................................................................................................................. 151 130 17 Other current liabilities ...................................................................................................................................... (14) 509 542 72 Total current liabilities................................................................................................................................... 779 770 102 Long-term liabilities Long-term debt ....................................................................................................................................................... (15) 1,913 3,853 508 Newbuilding contracts........................................................................................................................................ (12) 2,019 800 106 Deferred income tax ............................................................................................................................................ (5) 59 7 1 Other long-term liabilities................................................................................................................................ (16) 378 130 17 Total long-term liabilities............................................................................................................................. 4,369 4,790 632 Minority interests..................................................................................................................................................... 103 82 11 Shareholders' equity Share capital (27,349,502 class A shares at NOK 3.00 and 13,864,125 class B shares at NOK 3.00)............................................................................................. 123 124 16 Other equity.............................................................................................................................................................. 3,294 3,473 458 Total shareholders' equity ............................................................................................................................ (18) 3 ,417 3,597 474 Total liabilities and shareholders' equity .................................................................................................... 8,668 9,239 1,219 Mortgages..................................................................................................................................................................... (28) — 3,853 508Limited partnerships capital not paid ........................................................................................................... (28) 613 479 63Guarantees.................................................................................................................................................................... (28) 390 412 54Off balance sheet items ........................................................................................................................................ (29)
The accompanying notes form an integral part of these Consolidated Financial Statements.

4
SMEDVIG asa AND SUBSIDIARIES
CONSOLIDATED STATEMENTS OF CASH FLOWS
Year ended December 31, 1996 1997 1998 1998 (NOK) (NOK) (NOK) (U.S.$ Note 1)
(Unaudited)(in millions)
Cash flows from operating activities Net income..................................................................................................................................................................... 210 586 213 28 Adjustments to reconcile net income to net cash provided by operating activities: Depreciation and amortization ....................................................................................................................... 332 354 288 38 Gains on sale of assets ........................................................................................................................................ — (390) (167) (22) Gains on sale of securities ................................................................................................................................ (7) (1) — — Loss on termination of newbuilding projects......................................................................................... — — 537 71 Provision for periodic overhauls ................................................................................................................... 11 28 6 1 Deferred income taxes ........................................................................................................................................ (59) 21 (52) (7) Minority interests................................................................................................................................................... 16 21 (21) (3) Change in assets and liabilities, net of effect of acquisitions: Accounts receivable ............................................................................................................................................. (631) 163 (116) (15) Spare parts.................................................................................................................................................................. (15) (29) (44) (6) Income taxes payable........................................................................................................................................... (36) 25 19 3 Accounts payable................................................................................................................................................... (51) 81 (9) (1) Other current liabilities....................................................................................................................................... 580 (384 ) 88 12 Net cash provided by operating activities................................................................................................ 350 475 742 99 Cash flows from investing activities Capital expenditures long-term investments .............................................................................................. (155) (1) (19) (3) Capital expenditures on fixed assets and newbuilding contracts.................................................... (871) (1,830) (2,631) (347) Proceeds from sale of subsidiary, net of cash............................................................................................ — — 269 35 Proceeds from sale of fixed assets.................................................................................................................... 1,469 1,066 4 1 Paid upon termination of newbuilding projects........................................................................................ — — (156) (21) Proceeds from sale and maturity of securities........................................................................................... 1,003 255 123 16 Purchase of securities .............................................................................................................................................. (617) (270) (119) (16) Purchase of subsidiary, net of cash acquired.............................................................................................. (22 ) (218 ) — — Net cash provided by (used in) investing activities............................................................................ 807 (998 ) (2,529 ) (335 )Cash flows from financing activities Long-term debt borrowings.................................................................................................................................. 1,871 1,484 2,320 306 Payments of long-term debt................................................................................................................................. (3,913) (431) (634) (84) Equity issue ................................................................................................................................................................... 937 27 6 1 Minority's share of cash paid (cash received) in limited partnership................................................................................................................................................. (57) (28) (31) (4) Dividends........................................................................................................................................................................ (54 ) (82 ) (93 ) (12 ) Net cash provided by (used in) financing activities ........................................................................... (1,216 ) 970 1,568 207 Effect of exchange rate changes........................................................................................................................... 18 77 31 4 Net increase (decrease) in cash and cash equivalents.............................................................................. (41 ) 524 (188 ) (25 )Cash and cash equivalents at beginning of year.......................................................................................... 284 243 767 101 Cash and cash equivalents at end of year........................................................................................................ 243 767 579 76
The accompanying notes form an integral part of these Consolidated Financial Statements.
5
SMEDVIG asa AND SUBSIDIARIES
NOTES TO CONSOLIDATED FINANCIAL STATEMENTS
Note 1 — SUMMARY OF SIGNIFICANT ACCOUNTING POLICIES
The accompanying consolidated financial statements present the financial position of Smedvig asa andconsolidated subsidiaries (the "Company" or "Smedvig"). The accounts have been prepared in accordance withgenerally accepted accounting principles in Norway ("Norwegian GAAP"). These accounting principles vary incertain significant respects from accounting principles generally accepted in the United States ("U.S. GAAP").See Note 30 for a discussion of the principal differences between Norwegian GAAP and U.S. GAAP that affectthe Company's consolidated net income and shareholders' equity.
Solely for the convenience of the reader, the consolidated financial statements as at and for the year endedDecember 31, 1998 have been translated from Norwegian kroner ("NOK") into United States dollars ("U.S.$")using the December 31, 1998 Noon Buying Rate of the Federal Reserve Bank of New York of U.S.$1.00 = NOK7.580.
Nature of Operation
Smedvig is an offshore drilling contractor that has been a supplier to the oil and gas industry since 1965. Itprovides well construction and reservoir technology services to the oil and gas industry.
In addition to owning and operating mobile drilling rigs, Smedvig has contracts for production drilling andmaintenance on fixed installations on the Norwegian shelf of the North Sea. The Company also pursuessubstantial drilling operations in Southeast Asia. In the technological field, the Company is involved withreservoir modeling and monitoring as well as related services.
Due to the international nature of the Company's operations, exchange rate movements give rise to foreigncurrency transaction risk and translation risk when revenues, costs and net assets of foreign subsidiaries areconverted into Norwegian kroner. The Company seeks to hedge certain parts of its exposures to adversemovements in foreign exchange rates, see Note 20.
Use of Estimates
The preparation of financial statements is in conformity with generally accepted accounting principlesrequires the Company to make estimates and assumptions that effect the reported amounts of assets and liabilitiesand disclosure of contingent assets and liabilities as of the date of the financial statements, and the reportedamounts of revenues and expenses during the reported period. Actual results could differ from those estimates.
Basis of Consolidation
Subsidiaries in which the Company's holding exceeds 50 percent are consolidated in the financial statements.
The Company also consolidates certain limited partnerships and subsidiaries, in which the Company'sholding is less than 50 percent, in accordance with the proportionate consolidation method.
The equity method of accounting is used for investments in associated companies in which the investmentprovides the Company with the ability to exercise significant influence over operating and financial policies of theinvestee company. Such influence is presumed to exist for investments in companies in which the Company'sdirect or indirect ownership is between 20 and 50 percent. Under the equity method, the Company's share ofprofits and losses of associated companies is included in the consolidated income statement under financial items.
As a result of changes in Norwegian GAAP, the Company in 1996 changed the reporting of its ownershipinterest in Varia Perdana Sdn. Bhd. Smedvig considers its participation in this company to be an integral part ofits operations. The Company has therefore changed the accounting for this investment from using the equitymethod to using the proportionate consolidation method.

6
The cost method of accounting is used for investments in associated companies during which the Company'sownership is less than 20 percent.
All material intercompany transactions and internal sales have been eliminated during consolidation.
Revenue Recognition
The substantial majority of the Company's revenues are derived from dayrate-based drilling contracts or otherservice contracts. Revenues are recognized in the period that services are rendered at the rates established in thecontracts.
Other items
Sale of material assets or parts of a business division is classified as "Other items" in the Income Statements,and presented in the Income Statements between Financial items and Income before income taxes.
Foreign Currencies
Bank deposits, short-term receivables and short-term liabilities denominated in foreign currency aretranslated at year-end exchange rates. Long-term liabilities which are not hedged are translated at the higher ofeither the foreign exchange rate at the date the liability was accrued or the year-end exchange rate. Smedvig doesnot record unrealized foreign exchange loss/gain on long-term debt where the rig securing the debt has anemployment contract that provides a net cash flow in the same currency sufficient to retire the debt.
Foreign Subsidiaries
In the consolidated financial statements, the balance sheets of foreign subsidiaries are translated intoNorwegian kroner at the foreign exchange rate at the balance sheet date, and the income statements are translatedat the average exchange rate prevailing during the year. Exchange rate differences arising on the translation offinancial statements of foreign subsidiaries are recorded as a separate component of shareholders' equity.
Cash and Bank Deposits
Cash and cash equivalents include other highly liquid investments with an original maturity of ninety days orless.
Short-term Investments
Short-term investments are recorded at the lower of cost or market value determined on a portfolio basis. Acharge against income is recorded in the period in which the market value of the investment portfolio is less thancost. Single investments with material and permanent decline in value are written down separately.
Accounts Receivable
Accounts receivable are recorded net of an allowance for doubtful accounts, if any.
Spare Parts
Spare parts are generally recorded at the lower of cost or market value. Spare parts are shown net of areserve for obsolete parts and parts with low turnover rate.
Fixed Assets and Depreciation
Fixed assets are recorded at historical cost less accumulated depreciation. Fixed assets are depreciated on astraight line basis over the economic life of the assets. The Company's mobile units and semi-tenders aredepreciated over 25 years while the rest of the tender rigs are depreciated over 20 years. Drilling equipment andfixtures are estimated to have useful lives ranging from three to ten years, depending upon their use.

7
Towards the end of a rig's operating life the Company may in certain situations decide to upgrade a rig inorder to extend the lifetime of the unit or find alternative employment for the rig. If the Company deems itfinancially justifiable to undertake the upgrading, the associated cost will be capitalized and depreciated over theremaining life of the unit.
Newbuilding Contracts
Newbuilding contracts are included in fixed assets at their full contractual value and the correspondingliability is entered as newbuilding contract under long-term liabilities. Other expenditures and interest expensesrelated to the construction of the vessel during the construction period are capitalized. Installments to the yard arerecorded at the exchange rate at the date of payment, whereas outstanding contract liabilities are recorded at theyear-end exchange rate.
Capitalized Interests
Interest expenses relating to upgradings and newbuildings are capitalized based on the amount ofaccumulated expenditures for the applicable project during the construction period using the Company's currentavailable rate of borrowing.
Pensions
The Company has several defined benefit plans with retirement, death and termination benefits. Theretirement benefits are generally a function of years of employment and amount of compensation. The plans areprimarily funded through payments to insurance companies.
The Company records its pension costs in the period during which the services are rendered by employeesand amounts are based on actuarial calculations.
Long-term Maintenance
Provision for periodic overhauls on mobile units and tender rigs is accrued evenly over the anticipated periodbetween repairs, generally five years. On disposal of a mobile unit or tender rig, the related provision for majorrepairs is included in the calculation of the gain or loss on disposal.
All other maintenance and repair costs are expensed when incurred.
Derivative Financial Instruments
Forward exchange contracts
Unrealized gains on forward exchange contracts and currency options are deferred and recognized only whenrealized while net unrealized losses on forward exchange contracts and currency options are expensed as theyoccur. The Company's forward exchange contracts do not qualify for hedge accounting treatment, as they are notdesignated as hedges of specific assets, liabilities or firm commitments.
The Company's criteria to qualify for hedge accounting are:
— The instrument must be related to a foreign currency asset, liability or firm commitment whosecharacteristics have been identified;
— The nominal amount of the instrument cannot exceed the amount of the hedged item;
— It must involve the same currency as the hedged item; and
— It must reduce the risk of foreign currency exchange movements on the Company's operations.

8
Interest rate swap and forward rate agreements
Interest rate swap agreements and forward rate agreements that are designated as a hedge of a debt obligationare accounted for on an accrual basis. That is, the interest payable and interest receivable under the agreements areaccrued and recorded as an adjustment to the interest expense of the designated liability.
Amounts due from or payable to the counterparties of interest rate swaps and forward rate agreements arerecorded on an accrual basis at each reporting date based on amounts computed by reference to the respectiveagreement.
It is the policy of the Company that the terms and the contractual maturities of the interest rate swapagreements must correspond to the underlying debt obligation to which the swap relates in order to qualify forhedge accounting.
The Company's criteria to qualify for hedge accounting are:
— The instrument must be related to an asset or a liability;
— The nominal amount of the instrument cannot exceed the amount of the hedged item;
— The terms and the contractual maturities of the instrument must correlate to the underlying hedged item; and
— It must change the character of the interest rate by converting a variable rate to a fixed rate or vice versa.
Income Taxes
Income tax expense consists of taxes currently payable and changes in deferred tax assets and liabilities.Deferred tax assets and liabilities are based on temporary differences that arise between the book basis and taxbasis of assets and liabilities and the future tax benefit of tax loss carry forwards.
Deferred tax assets in a specific tax jurisdiction can only be recognized if it is probable that the future benefitwill be realized. Such assets cannot exceed the amount of deferred tax liabilities in that tax jurisdiction.
With effect from 1996 a tax scheme for shipowning and offshore companies was introduced in Norway.According to the principles of the scheme no income tax is assessed on the income of those companies thatqualify and elect to participate in the scheme. Under the scheme taxation will occur when dividends are paid bycompanies within the scheme or when a company decides to withdraw from the scheme.
Smedvig has joined the tax scheme for the majority of its fleet. For companies entering the scheme deferredtax on temporary differences was reversed. Since Smedvig deems it preferable to stay within the new scheme for along time, no provision for taxes has been provided for on the subsidiaries within the scheme.
The Company aims to distribute a dividend every year. The dividend for each year will depend on theCompany's earnings and financial situation. The dividend will primarily be taken from earnings which have beensubject to ordinary taxation, from distributable reserves and finally from earnings under the Norwegian zerotaxation scheme.
Earnings per Share
Earnings per share are calculated as net income divided by the weighted average number of sharesoutstanding. The average number of shares has been adjusted for the bonus issue in August 1996 and the issue ofB-shares in November 1996. The average number of shares for the years 1996, 1997 and 1998 is consequently:34,645,529, 41,023,375 and 41,179,115 respectively.
Diluted Earnings per Share
Diluted earnings per share takes into account all potential outstanding shares in the period which have adilutive effect. The calculation does not take into account 214,875 share options which at December 31, 1998 areaccretive to earnings per share. At December 31, 1997 31,500 share options were accretive to earnings per share.

9
Goodwill
Acquisitions are accounted for using the purchase method. The excess of the purchase price over the fair valueof the net assets acquired is recorded as goodwill and amortized on a straight-line basis, generally over periods offour to ten years.
Note 2 — SEGMENT INFORMATION
The Company provides well construction services and reservoir and well technology products and services tothe offshore oil and gas industry. There has not been any intersegment sales. The accounting principles for thesegments are the same as for consolidated accounts.
Geographic segment data
The following presents the Company's revenues, earnings and assets by geographic area:
Revenues from unaffiliated customers
Year ended December 31, 1996 1997 1998
(NOK in millions)Norway............................................................................................................................................................................................................. 1,685 2,049 2,288Brunei ............................................................................................................................................................................................................... — 102 122United Kingdom......................................................................................................................................................................................... 363 440 644Thailand........................................................................................................................................................................................................... 178 160 224Other (principally Southeast Asia)................................................................................................................................................... 225 333 401 Total............................................................................................................................................................................................................ 2,451 3,084 3,679
Earnings before income taxes
Year ended December 31, 1996 1997 1998
(NOK in millions)Norway (1)..................................................................................................................................................................................................... 164 711 (122)Brunei ............................................................................................................................................................................................................... — 12 35United Kingdom (2) ................................................................................................................................................................................. 1 (6) 186Thailand........................................................................................................................................................................................................... 15 12 63Other (principally Southeast Asia) (3)........................................................................................................................................... 28 14 39 Operating profit........................................................................................................................................................................................... 208 743 201Other income (expense) ......................................................................................................................................................................... (23 ) (51 ) 7 Earnings before income taxes............................................................................................................................................................. 185 692 208
Tangible assets (4)
Year ended December 31, 1996 1997 199 8
(NOK in millions)Norway (5)..................................................................................................................................................................................................... 2,946 5,419 5,371Brunei (6) ....................................................................................................................................................................................................... — 350 1,130United Kingdom......................................................................................................................................................................................... 24 29 —Thailand........................................................................................................................................................................................................... 129 86 96Other (principally Southeast Asia)................................................................................................................................................... 100 315 364 Total............................................................................................................................................................................................................ 3,199 6,199 6,961
__________
(1) Included in these amounts are termination expenses of NOK 529 million in 1998 and gains on sale of assets ofNOK 390 million for the year ended December 31, 1997.

10
(2) Included in these amounts are gains on sale of the platform drilling operation in UK of NOK 165 millionfor the year ended December 31, 1998.
(3) Included in these amounts are termination expenses of NOK 8 million for the year ended December 31,1998.
(4) A substantial portion of the Company's assets are mobile. Asset locations at the end of a period are notnecessarily indicative of the geographic distribution of the revenues or operating profits generated by suchassets during such period.
(5) Included in these amounts are newbuilding contract amounts of NOK 3,453 million, NOK 3,525 millionand NOK 422 million for the years ended December 31, 1998, 1997 and 1996, respectively.
(6) Included in these amounts is a newbuilding contract of NOK 775 million for the year ended December 31,1998.
Industry segment data
Information regarding the Company's industry segments is as follows:
Revenues from unaffiliated customers
Year ended December 31,
1996 1997 1998
(NOK in millions)
Mobile Units................................................................................................................................................................................................. 723 992 1,157
Platform Drilling ........................................................................................................................................................................................ 848 974 1,216
Tender Rigs ................................................................................................................................................................................................... 344 414 662
Reservoir and Well Technology........................................................................................................................................................ 298 413 441
Activities to be Discontinued (1) ...................................................................................................................................................... 238 291 203
Total............................................................................................................................................................................................................ 2,451 3,084 3,679
Depreciation and amortization
Year ended December 31,
1996 1997 1998
(NOK in millions)
Mobile Units................................................................................................................................................................................................. 140 137 154
Platform Drilling ........................................................................................................................................................................................ 32 32 33
Tender Rigs ................................................................................................................................................................................................... 36 56 66
Reservoir and Well Technology........................................................................................................................................................ 21 27 34
Activities to be Discontinued (1) ...................................................................................................................................................... 103 102 1
Total............................................................................................................................................................................................................ 332 354 288

11
Earnings before income taxes
Year ended December 31 ,
1996 1997 1998
(NOK in millions)
Mobile Units................................................................................................................................................................................................. 122 246 316
Platform Drilling ........................................................................................................................................................................................ 56 74 113
Tender Rigs ................................................................................................................................................................................................... 28 46 169
Reservoir and Well Technology........................................................................................................................................................ (22) (15) (14)
Activities to be Discontinued (1) ...................................................................................................................................................... 24 2 (11 )
Operating profit........................................................................................................................................................................................... 208 353 573
Net financial items .................................................................................................................................................................................... (23) (51) 7
Other items (2) and (3)............................................................................................................................................................................ — 390 (372 )
Total............................................................................................................................................................................................................ 185 692 208
Total assets
Year ended December 31,
1996 1997 1998
(NOK in millions)
Mobile Units (4) ......................................................................................................................................................................................... 2,881 5,423 6,530
Platform Drilling ........................................................................................................................................................................................ 255 305 148
Tender Rigs (5) ........................................................................................................................................................................................... 420 1,414 2,059
Reservoir and Well Technology........................................................................................................................................................ 194 257 275
Activities to be Discontinued (1) and (6)..................................................................................................................................... 1,486 1,269 227
Total............................................................................................................................................................................................................ 5,236 8,668 9,239
Capital expenditures
Year ended December 31,
1996 1997 1998
(NOK in millions)
Mobile Units................................................... 451 1,587 1,943
Platform Drilling .......................................... 16 33 46
Tender Rigs ..................................................... 3 126 625
Reservoir and Well Technology.......... 56 21 17
Activities to be Discontinued (1) ........ 345 63 0
Total.............................................................. 871 1,830 2,631 __________
(1) On April 27, 1998, the Board of Directors decided to discontinue a substantial portion of the operations in itsMobile Productions segment. The businesses that were discontinued included ENSCO 100, Balder FPU, SPU4 and SPU 550. The Board also decided to report these businesses as Activities To Be Discontinued and theCompany's internal reporting was changed to comply with the Board's decision. The remaining operationswhich consisted of the Company's businesses in the UK (mainly Altra and SRM) from that time weretransferred from Mobile Production to Platform Drilling. In November 1998, after some months withnegotiations, these remaining operations were sold to Deutag.
(2) Included in these amounts are gains on sale of the platform drilling operation in UK of NOK 165 million forthe year ended December 31, 1998.
(3) Included in these amounts are termination expenses related to a newbuilding project of NOK 537 million forthe year ended December 31, 1998. For 1997, a gain on sale of assets of NOK 390 million is included.
(4) Included in these amounts are newbuilding contract amounts of NOK 3,453 million and NOK 3,041 millionfor the years ended December 31, 1998 and 1997, respectively.

12
(5) Included in these amounts are newbuilding contract amounts of NOK 775 million for the year endedDecember 31, 1998.
(6) Included in these amounts are newbuilding contract amounts of NOK 484 million and NOK 422 million forthe years ended December 31, 1997 and 1996, respectively.
Note 3 — PROVISION FOR PERIODIC OVERHAUL
Year ended December 31,
1996 1997 1998
(NOK in millions)
Changes in the provision for periodic overhaul:
Balance at the beginning of the year............................................................................................................................................... 24 35 69
Provided from acquisitions................................................................................................................................................................... — 6 —
Provisions....................................................................................................................................................................................................... 36 40 82
Costs incurred .............................................................................................................................................................................................. (25 ) (12 ) (76 )
Balance at the end of the year............................................................................................................................................................. 35 69 75
Note 4 — TERMINATION EXPENSES AND GAINS ON SALE OF ASSETS
The Company terminated the newbuilding project West Navion II and expensed in this connection the fullamount, NOK 535 million, in 1998. During the year projects also related to the previous Mobile ProductionDivision, SPU 550 and SPU 4, were terminated. As a result a gain of NOK 6 million was realized on the SPU 550,whereas the sale of SPU 4 resulted in a loss of NOK 8 million.
Mid-November, the Company sold its platform drilling operation in the United Kingdom and realized a gainof NOK 165 million. Some activities related to the Reservoir and Well Technology Division were included in thesale.
In the third quarter of 1997, the Company sold the rig West Royal. The sale resulted in a capital gain ofNOK 33 million. In the fourth quarter of 1997, the jack-up rig West Omikron was sold. This sale resulted in acapital gain of NOK 357 million.

13
Reconciliation of remaining — and discontinuing operations:
Year ended December 31,
Remaining operations Discontinuing operations
1996 1997 1998 1996 1997 1998
(NOK in millions)
Revenues
Revenues ........................................................................................................................ 2,111 2,558 3,092 340 526 587
Operating expenses
Personnel costs ............................................................................................................ (1,025) (1,273) (1,134) (174) (287) (346)
Other operating expenses....................................................................................... (671) (699) (1,139) (41) (118) (199)
Depreciation.................................................................................................................. (215 ) (233 ) (266 ) (117 ) (121 ) (22 )
Total operating expenses ................................................................................... (1,911 ) (2,205 ) (2,539 ) (332 ) (526 ) (567 )
Operating profit.............................................................................................................. 200 353 553 8 0 20
Financial income and expenses
Interest income ............................................................................................................ 66 90 44 3 2 3
Foreign exchange gains .......................................................................................... 18 — 22 (2) (1) (2)
Interest expense........................................................................................................... (103) (135) (56) (5) (7) (4)
Net financial items..................................................................................................... (19) (45) 10 (4) (6) (3)
Other items
Termination expenses and gains on sale of assets............................. — — — — 390 (372)
Total other items..................................................................................................... — — — — 390 (372 )
Income before income taxes................................................................................... 181 308 563 4 384 (355 )
Income taxes.................................................................................................................... 36 (53) (89) (1) (5) 105
Minority interests.......................................................................................................... (10 ) (48 ) (11 ) — — —
Net income........................................................................................................................ 207 207 463 3 379 (250 )
Note 5 — INCOME TAXES
Allocation of income before income taxes:
Year ended December 31,
1996 1997 1998
(NOK in millions)
Norway............................................................................................................................................................................................................................ 177 773 28
Outside Norway......................................................................................................................................................................................................... 8 (81 ) 180
Total........................................................................................................................................................................................................................... 185 692 208
Income tax expense (benefit) consists of the following:
Year ended December 31,
1996 1997 1998
(NOK in millions)
Payable tax:
Norway............................................................................................................................................................................................................................ — 12 1
Outside Norway......................................................................................................................................................................................................... 24 25 35
Total payable tax....................................................................................................................................................................................................... 24 37 36
Total deferred income tax expense (benefit) Norway.......................................................................................................................... (59 ) 21 (52 )
Total........................................................................................................................................................................................................................... (35 ) 58 (16 )

14
The principal differences between the expected tax expense computed by applying the Norwegian statutorytax rate of 28 percent to income before income taxes and the actual tax expense are as follows:
Year ended December 31, 1996 1997 1998
(NOK in millions)"Expected" income taxes............................................................................................................................................................................ 52 194 58Foreign tax rate differential....................................................................................................................................................................... 27 44 (1)Shipowners' taxation in Norway ............................................................................................................................................................ (84) (196) (130)Tax deductible expenses ............................................................................................................................................................................. (30) — —Other....................................................................................................................................................................................................................... — 16 11 Total................................................................................................................................................................................................................. (35 ) 58 (62 )Valuation allowances (1)............................................................................................................................................................................ — — 46Income taxes...................................................................................................................................................................................................... (35) 58 (16)
Deferred income taxes reflect the impact of temporary differences between the amount of assets andliabilities recognized for financial reporting purposes and such amounts recognized for tax purposes. The netdeferred tax liability consists of the following:
Year ended December 31, 1997 1998 (NOK in
millions)Deferred tax assets: Tax loss carry forward............................................................................................................................................................................................................. 81 108 Provisions ....................................................................................................................................................................................................................................... 23 30 Other.................................................................................................................................................................................................................................................. 1 — Gross deferred tax assets .......................................................................................................................................................................................................... 105 138 Valuation allowance (1)............................................................................................................................................................................................................ — (46 )Net deferred tax assets ............................................................................................................................................................................................................... 105 92 Deferred tax liabilities: Fixed assets.................................................................................................................................................................................................................................... 68 37 Other.................................................................................................................................................................................................................................................. 96 62 Gross deferred tax liabilities................................................................................................................................................................................................ 164 99 Net deferred tax liabilities........................................................................................................................................................................................................ 59 7
__________
(1) Norwegian GAAP do not allow deferred income tax assets. NOK 46 million is therefore recorded as avaluation allowance.
At December 31, 1998, the Company's deferred tax asset of NOK 108 million consists of NOK 386 million intax loss carry forward, which expire in varying amounts between 2004 to 2008. The Company is of the opinionthat the remaining balance of deferred tax assets is expected to be realized through future profits and the reversalof taxable temporary differences.

15
Note 6 — CASH AND CASH EQUIVALENTS
Year ended December 31, 1997 1998 (NOK in millions)
Cash ...................................................................................................................................................................................................................................................... 49 378Certificates of deposit................................................................................................................................................................................................................. 718 201 Total............................................................................................................................................................................................................................................... 767 579
The Company has NOK 42 million and NOK 37 million deposited in banks as of December 31, 1998 and1997, respectively, related to withholding taxes.
Note 7 — SHORT-TERM INVESTMENTS
As at December 31, 1997 1998 Book value
Unrealized gains
Unrealized losses
Fair value
Book value
Unrealized Gains
Unrealized losses
Fair value
(NOK in millions)Debt securities (bonds) ................... 307 2 — 309 303 — — 303
The maturity dates of the Company's short-term investments in debt securities with an original maturity ofgreater than ninety days as of December 31, 1998, were:
(NOK in millions)
Less than one year ..................................................................................................................................................................................................................................................... 401 — 5 years.................................................................................................................................................................................................................................................................... 1885 — 10 years................................................................................................................................................................................................................................................................. 75 Total............................................................................................................................................................................................................................................................................ 303
Other information regarding the short-term investments:
As at December 31, 1996 1997 1998
(NOK in millions)Purchases ............................................................................................................................................................................................................................ 617 270 119Proceeds from sales ...................................................................................................................................................................................................... 993 255 123Proceeds from maturities........................................................................................................................................................................................... 10 — —Realized gains.................................................................................................................................................................................................................. 8 1 —Realized losses ................................................................................................................................................................................................................ — (1) —
Realized gains and losses on the sale of securities are determined by reference to the carrying value at thetime when the specific security is sold.

16
Note 8 — ACCOUNTS RECEIVABLE
As at December 31, 1997 1998
(NOK in millions)Trade receivables ..................................................................................................................................................................................................................... 767 608Other receivables...................................................................................................................................................................................................................... 275 420 Total.......................................................................................................................................................................................................................................... 1,042 1,028
The trade receivables are primarily from major international oil and gas companies. The Companycontinually evaluates the credit risk associated with each customer and, when considered necessary, requirescertain guarantees. At December 31, 1998 and 1997 no "Provision for doubtful accounts" was considerednecessary. Of other receivables, approximately net NOK 175 million are from Esso Norge/Keppel-Fels. See Note29 for further details regarding this issue.
The following table summarizes revenues from major customers as a percentage of total revenues (revenuesin excess of 10 percent for the period):
Year ended December 31, 1996 1997 1998
Statoil..................................................................................................................................................................................................................... 30% 28% 26%Norsk Hydro ...................................................................................................................................................................................................... 7% 20% 21%Phillips Petroleum .......................................................................................................................................................................................... 10% 12% 8%
Note 9 — SHARES, INVESTMENTS IN AND RECEIVABLES FROM ASSOCIATED COMPANIESAND LONG-TERM INVESTMENTS
As at December 31, 1997 1998
(NOK in millions)Shares North Norway Drilling Co. AS........................................................................................................................................................................ 2 2Shares Offshore & Marine ASA ..................................................................................................................................................................................... 20 23Receivables KS West Alpha.............................................................................................................................................................................................. 126 112Other................................................................................................................................................................................................................................................ 10 40 Total.......................................................................................................................................................................................................................................... 158 177
The company has financed KS West Alpha. The rig is in operation, and the debt is being repaid inaccordance with the loan agreement.
Note 10 — GOODWILL
As at December 31, 1997 1998
(NOK in millions)Cost .................................................................................................................................................................................................................................................. 183 204Goodwill from acquisitions during the year............................................................................................................................................................. 21 6Reduction due to sale of companies.............................................................................................................................................................................. — (39)Accumulated amortization.................................................................................................................................................................................................. (114 ) (12 1 )Net book value........................................................................................................................................................................................................................... 90 50 Amortization............................................................................................................................................................................................................................... 27 28

17
Note 11 — MOBILE UNITS, TENDER RIGS AND OTHER TANGIBLE ASSETS
Mobile units and tender rigs
Drilling equipmentinventory and
fixtures Buildings Total Original cost January 1, 1998 ....................................................................................................... 4,365 320 30 4,715Additions................................................................................................................................................... 249 104 5 358Disposals................................................................................................................................................... — (155) (18) (173)Cost December 31, 1998.................................................................................................................. 4,614 269 17 4,900Accumulated depreciation December 31, 1998 ...................................................................... (2,064 ) (102 ) (1 ) (2,167 )Net value at December 31, 1998................................................................................................. 2,550 167 16 2,733Depreciation for the year 1998..................................................................................................... 197 62 1 260Percentage depreciation.................................................................................................................... 4-13% 10-30% 4%
Investments and sales of fixed assets:
1997 1998 Investment Sales Investment Sales
Mobile units and tender rigs ...................................................................................................................................................... 864 1,060 249 —Drilling equipment, inventory, and fixtures...................................................................................................................... 109 6 104 214Buildings............................................................................................................................................................................................... — — 5 12 Total.................................................................................................................................................................................................. 973 1,066 358 226
Note 12 — NEWBUILDING CONTRACTS
At December 31, 1998, the company had the following newbuilding contracts:
Unit Yard
Newbuildingcontract
assets
Newbuildingcontract
liabilities West Venture......................... Hitachi, Japan 2,028 537West Navion (1)................... Samsung, South Korea/Offshore & Marine, Norway 1,425 —West Menang......................... Keppel Shipyard, Singapore 775 263 Total..................................... 4,228 800
__________
(1) Navion ASA has an option to purchase the Company's 50 percent share of West Navion. This option can beexercised at the earliest four years and at the latest six years subsequent to the start of the drilling contractwith Statoil.
Note 13 — SHORT-TERM INTEREST BEARING DEBT
At December 31, 1998, the Company had an undrawn amount of NOK 100 million on an overdraft facility.
Note 14 — OTHER CURRENT LIABILITIES
As at December 31, 1997 1998
(NOK in millions)Withheld taxes, social security and holiday pay .................................................................................................................................................... 142 131Accrued interest expenses................................................................................................................................................................................................... 37 72Other current liabilities......................................................................................................................................................................................................... 330 339 Total.......................................................................................................................................................................................................................................... 509 542
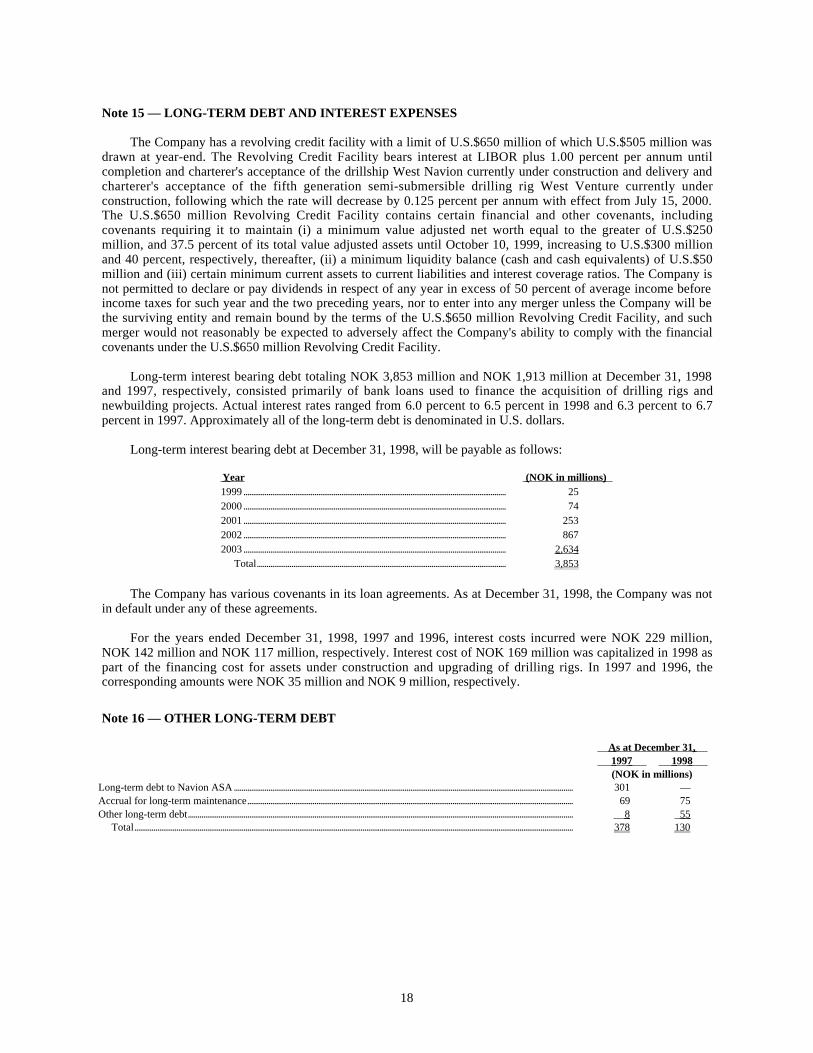
18
Note 15 — LONG-TERM DEBT AND INTEREST EXPENSES
The Company has a revolving credit facility with a limit of U.S.$650 million of which U.S.$505 million wasdrawn at year-end. The Revolving Credit Facility bears interest at LIBOR plus 1.00 percent per annum untilcompletion and charterer's acceptance of the drillship West Navion currently under construction and delivery andcharterer's acceptance of the fifth generation semi-submersible drilling rig West Venture currently underconstruction, following which the rate will decrease by 0.125 percent per annum with effect from July 15, 2000.The U.S.$650 million Revolving Credit Facility contains certain financial and other covenants, includingcovenants requiring it to maintain (i) a minimum value adjusted net worth equal to the greater of U.S.$250million, and 37.5 percent of its total value adjusted assets until October 10, 1999, increasing to U.S.$300 millionand 40 percent, respectively, thereafter, (ii) a minimum liquidity balance (cash and cash equivalents) of U.S.$50million and (iii) certain minimum current assets to current liabilities and interest coverage ratios. The Company isnot permitted to declare or pay dividends in respect of any year in excess of 50 percent of average income beforeincome taxes for such year and the two preceding years, nor to enter into any merger unless the Company will bethe surviving entity and remain bound by the terms of the U.S.$650 million Revolving Credit Facility, and suchmerger would not reasonably be expected to adversely affect the Company's ability to comply with the financialcovenants under the U.S.$650 million Revolving Credit Facility.
Long-term interest bearing debt totaling NOK 3,853 million and NOK 1,913 million at December 31, 1998and 1997, respectively, consisted primarily of bank loans used to finance the acquisition of drilling rigs andnewbuilding projects. Actual interest rates ranged from 6.0 percent to 6.5 percent in 1998 and 6.3 percent to 6.7percent in 1997. Approximately all of the long-term debt is denominated in U.S. dollars.
Long-term interest bearing debt at December 31, 1998, will be payable as follows:
Year (NOK in millions) 1999 ......................................................................................................................................... 252000 ......................................................................................................................................... 742001 ......................................................................................................................................... 2532002 ......................................................................................................................................... 8672003 ......................................................................................................................................... 2,634 Total.................................................................................................................................. 3,853
The Company has various covenants in its loan agreements. As at December 31, 1998, the Company was notin default under any of these agreements.
For the years ended December 31, 1998, 1997 and 1996, interest costs incurred were NOK 229 million,NOK 142 million and NOK 117 million, respectively. Interest cost of NOK 169 million was capitalized in 1998 aspart of the financing cost for assets under construction and upgrading of drilling rigs. In 1997 and 1996, thecorresponding amounts were NOK 35 million and NOK 9 million, respectively.
Note 16 — OTHER LONG-TERM DEBT
As at December 31, 1997 1998
(NOK in millions)Long-term debt to Navion ASA ................................................................................................................................................................................. 301 —Accrual for long-term maintenance.......................................................................................................................................................................... 69 75Other long-term debt......................................................................................................................................................................................................... 8 55 Total..................................................................................................................................................................................................................................... 378 130

19
Note 17 — PENSION PLANS
The Company has a pension plan that covers approximately 1,000 employees. The funded status of the planis as follows:
Disclosure about pensions and other postretirement benefit according to Statement of Financial AccountingStandards (SFAS) no. 132.
As at December 31,
Change in Projected Benefit Obligat ion 1997 1998
(NOK in millions)
PBO at the start of the year ................................................................................................................................................................................................ 54 82
Service cost.................................................................................................................................................................................................................................. 19 22
Interest cost.................................................................................................................................................................................................................................. 3 7
Plan amendments*................................................................................................................................................................................................................... 0 49
Actuarial loss/(gain) ............................................................................................................................................................................................................... 6 (9)
PBO at the end of the year.................................................................................................................................................................................................. 82 151__________
* The plan amendment of NOK 49 million is in respect of an early retirement plan implemented on January 1,1998, for the employees of AS Smedvig Prodrill.
As at December 31,
Change in plan assets 1997 1998
(NOK in millions)
Fair value of the assets at the start of the year.................................................................................................................................................... 44 61
Accrual return on plan assets ....................................................................................................................................................................................... 4 0
Employer contributions ................................................................................................................................................................................................... 13 27
Fair value of the assets at the end of the year ..................................................................................................................................................... 61 88
As at December 31,
1997 1998
(NOK in millions)
Funded status............................................................................................................. 21 63
Unrecognised Net Loss/(Gain)........................................................................ 12 9
Unrecognised Prior Service Cost................................................................... 0 41
Unrecognised Transition Obligation/(Asset) .......................................... 6 4
Net amount recognised ........................................................................................ 3 9
Amounts recognised in the statement of financial position consist of:
Accrued benefit liability................................................................................ (3) (27)
Intangible asset ................................................................................................... 0 18
Net amount recognised ........................................................................................ (3) (9)

20
Assumptions:
1996 1997 1998 Discount rate at end of the year ....................................................................................................................................................................................... 6.00% 5.50% 5.50%Expected return on plan assets for the year............................................................................................................................................................... 6.50% 7.00% 7.00%Rate of compensation increase at end of the year ................................................................................................................................................. 3.50% 3.50% 3.50%
Year ended December 31,
Components of net periodic benefit cost 1996 1997 1998 (NOK in millions)
Service cost.................................................................................................................................................................................................................................... 7 19 22Interest cost.................................................................................................................................................................................................................................... 3 3 7Expected return on plan assets ........................................................................................................................................................................................... (3) (4) (5)Amortisation of transition obligation (asset).............................................................................................................................................................. 0 1 1Amortisation of prior service cost.................................................................................................................................................................................... 0 0 8 Total net periodic benefit cost ............................................................................................................................................................................................ 7 19 33
Note 18 — SHAREHOLDERS' EQUITY
The company has two classes of common stock, Class A Shares and Class B Shares. The Class B Shares donot carry a right to vote at the general meetings. Otherwise, holders of Class B Shares have the same rights andprivileges as the holders of Class A Shares.
Changes in the number of Class A Shares (par value NOK 3 per share), Class B Shares (par value NOK 3 pershare) and share capital are as follows:
Number ofClass A
Shares
Number ofClass B
Shares Share Capital (NOK in millions)
Balance at January 1, 1993 and December 31, 1993.......................................................................................... 20,838,912 5,209,728 78Public rights issue in 1994................................................................................................................................................. 5,953,974 1,488,494 22 Balance at December 31, 1994 and 1995.................................................................................................................. 26,792,886 6,698,222 100New share issuance in 1996.............................................................................................................................................. 241,116 7,060,278 22 Balance at December 31, 1996........................................................................................................................................ 27,034,002 13,758,500 122New share issuance in 1997.............................................................................................................................................. 248,500 88,875 1 Balance at December 31, 1997........................................................................................................................................ 27,282,502 13,847,375 123New share issuance in 1998.............................................................................................................................................. 67,000 16,750 1 Balance at December 31, 1998........................................................................................................................................ 27,349,502 13,864,125 124

21
Changes in additional paid-in capital, retained earnings and accumulated other comprehensive income:
Additional paid-in capital
Retained earnings
Accumulatedother comprehensive
income (1) Other equity
Balance at January 1, 1996......................................................................................... 1,513 227 (16) 1,724Comprehensive income Net income........................................................................................................................ — 210 — 210 Foreign exchange translation.................................................................................. — — 29 29 Comprehensive income................................................................................................ 239 Dividend................................................................................................................................ — (81) — (81)Bonus issue.......................................................................................................................... (20) — — (20)Equity issue ......................................................................................................................... 915 — — 915 Balance at December 31, 1996................................................................................. 2,408 356 13 2,777 Comprehensive income Net income........................................................................................................................ — 586 — 586 Foreign exchange translation.................................................................................. — — (2) (2 )Comprehensive income................................................................................................ 584 Dividend................................................................................................................................ — (93) — (93)Equity issue ......................................................................................................................... 26 — — 2 6 Balance at December 31, 1997................................................................................. 2,434 849 11 3,294 Comprehensive income Net income........................................................................................................................ — 213 — 213 Foreign exchange translation.................................................................................. — — 32 32 Comprehensive income................................................................................................ 245 Dividend................................................................................................................................ — (72) — (72)Equity issue ......................................................................................................................... 6 — — 6 Balance at December 31, 1998................................................................................. 2,440 990 43 3,473 __________
(1) Accumulated other comprehensive income consists solely of the Company's cumulative foreign currencyadjustments.
Note 19 — STOCK OPTION PLANS AND STOCK SAVINGS SCHEME
Based on a resolution by the General Meeting on June 14, 1990, Smedvig established a Board andManagement Share Option Plan for senior management and board members (the "1990 Program"). The exerciseprice of the options issued under the 1990 Program was NOK 94.50. Options issued under the 1990 Program wereto be exercised up to June 30, 1998. The remaining outstanding options under the 1990 Program were exercised in1998.
Based on a resolution by the Annual General Meeting on April 26, 1995 Smedvig introduced a secondManagement Share Option Plan for senior management (the "1995 Program"). Options issued under the 1995Program may be exercised over a five year period ending April 26, 2000. The exercise price is NOK 111 up toJune 30, 1999 and NOK 115 up to the date of expiry. Options issued under the 1995 Program are not transferable.Options may be withdrawn upon termination of employment at Smedvig. Grantees who exercise options areobliged to maintain ownership for at least two calendar years to at least 10 percent of the shares acquired.
On August 13, 1996, the Company issued 140,000 share options under the 1995 Program to management.All options granted were exercised by August 14, 1996.

22
As a result of the bonus issue and the introduction of two share classes, each option issued under the 1990Program and the 1995 Program, and each unallocated option issuable under the 1995 Program, are exercisable forone Class A Share and one-fourth of one Class B Share, without adjustment of the exercise price.
Based on a resolution by the General Meeting on November 4, 1997, a new option program was introducedfor managers employed in the company's foreign operations (the "1997 Program"). Options issued under the 1997Program are exercisable for one Class B Share and may be exercised over a five year period ending November 3,2002. The exercise price of the options allotted under this plan in 1997 is NOK 193.00. The options issued underthe 1997 Program are not transferable. Options may be withdrawn upon termination of employment at Smedvig.Grantees who exercise options are obliged to maintain an ownership for at least three calendar years to at least 25percent of the shares acquired by exercising the option.
Based on the authorization by the General Meeting on November 4, 1997, it was resolved to offermanagement in Norway Class B Shares as part of a stock savings scheme. The price per share was NOK 75 andon December 6, 1997, 26,750 Class B Shares were subscribed for. The employees are obliged to maintainownership for at least three calender years to at least 25 percent of the shares acquired.
Based on the resolution by the General Meeting on November 4, 1997, two new option programs wereintroduced in 1998, one for the Chief Executive Officer of 50,000 options (the "1998 (I)-Program") and one forsenior management of 69,375 options (the "1998 (II)-Program"). The options issued under the 1998 Programsoffer the right to buy one Class B Share per option. The options are not transferable. Options may be withdrawnupon termitation of employment at Smedvig. Grantees who exercise options are obliged to maintain ownership forat least three calendar years to at least 25 percent of the shares acquired by exercising the options.
Options issued under the 1998 (I)-Program may be exercised up to October 5, 2001. The share price on thedate of issue was NOK 56 per share. The exercise price increases by one percent per month.
Options issued under the 1998 (II)-Program may be exercised up to November 3, 2002. The share price onthe date of issue was NOK 50 per share. The exercise price increases by one percent per month.
Exercise
price range
per option
Number of
Class A
Shares
Number of
Class B
Shares
Outstanding at January 1, 1996........................................................................................................................................... 94.50 — 98.00 574,000 143,500
Options granted 1996................................................................................................................................................................ 102.00 140,000 35,000
Options exercised 1996 ........................................................................................................................................................... 94.50 — 120.00 241,000 60,250
Outstanding at December 31, 1996 .................................................................................................................................. 94.50 — 120.00 473,000 118,250
Options granted 1997................................................................................................................................................................ 193.00 31,500
Options exercised 1997 ........................................................................................................................................................... 94.50 — 107.00 24 8,500 62,125
Outstanding at December 31, 1997 .................................................................................................................................. 94.50 — 193.00 224,500 87,625
Options granted 1998................................................................................................................................................................ 50.50 — 57.68 119,375
Options exercised 1998 ........................................................................................................................................................... 94.50 67,000 16,750
Withdrawn....................................................................................................................................................................................... 13,500
Outstanding at December 31, 1998 .................................................................................................................................. 50.50 — 193.00 15 7,500 176,750
As of December 31, 1998, the Board could grant a further 135,875 options or shares under the 1997authorization and 5,000 options under the 1995 authorization.
All issued share options are exercisable.
The Company does not record as compensation expenses benefits arising from granting or exercising ofoptions. However, national insurance contribution arising from options and shares subscribed for is treated ascompensation expenses.
23
FAS 123 Disclosure
In October 1995, the Financial Accounting Standards Board issued Statement of Financial AccountingStandards No. 123, "Accounting for Stock-Based Compensation" (SFAS No. 123), which encouraged the use of afair value based method of accounting for compensation expense associated with stock options and similar plans.However, SFAS No. 123 permits the continued use of the intrinsic value based method prescribed by AccountingPrinciples Board Opinion No. 25, "Accounting for Stock Issued to Employees," but requires additionaldisclosures, including pro forma calculations of net earnings and earnings per share as if the fair value method ofaccounting prescribed by SFAS No. 123 had been applied in 1995, 1996 and 1997. The pro forma data presentedbelow is not representative of the effects on reported amounts for future years, since SFAS No. 123 does not applyto awards prior to 1995 and additional awards are expected in the future.
As Reported Pro Forma 1996 1997 1998 1996 1997 1998
Net income (in millions)............................................. 210 586 213 206 584 210Earnings per share .......................................................... 6.06 14.30 5.17 5.96 14.24 5.11Average shares outstanding ...................................... 34,645,529 41,023,375 41,179,115 34,645,529 41,023,375 41,179,115Average fair value of grants during the year ............................................................... — — — NOK 22 NOK 52 NOK 22Black sholes option pricing model assumptions: Risk free interest rate ................................................. 3.5 4.5 6.5 Expected life (years)................................................... 1 - 4 5 3Volatility .............................................................................. 30% 33% 55%
Note 20 — FINANCIAL INSTRUMENTS AND RISK MANAGEMENT
The Company has operations and assets in a number of countries worldwide. Consequently, the Company'sresults from operations are affected, when measured in NOK, by fluctuations in currency exchange rates,primarily relative to the U.S. dollar. When the NOK appreciates against other currencies, the Company's profitfrom operations in foreign currencies reported in NOK may decrease. Likewise, when the NOK depreciatesagainst other currencies, the Company's profit from operations in foreign currencies reported in NOK mayincrease. The Company is also exposed to changes in interest rates. Different financial instruments are used by theCompany to manage these foreign currency and interest rate risks as summarized below:
Notional amounts and credit exposure
The notional amounts of off balance sheet financial instruments presented in this Note represent the face orcontractual amounts and thus are not a measure of the exposure of the Company through its use of such financialinstruments. The actual amounts exchanged are calculated on the basis of the notional amounts and the otherterms of the financial instruments, which relate to interest rates and exchange rates.
The Company is exposed to credit related losses in the event that counterparties to the off balance sheetfinancial instrument contracts do not perform according to the terms of the contract.
In the opinion of the management, the counterparties to the financial instrument contracts are creditworthyfinancial institutions, and the Company does not expect any significant loss to result from non-performance bysuch counterparties. The Company, in the normal course of business, does not demand collateral. The creditexposure of interest rate swaps and foreign currency contracts is represented by the fair value of contracts with apositive fair value at the end of each period, reduced by the effects of master netting agreements. It is theCompany's policy to enter into master netting agreements with the counterparties to financial instrument contracts.These master netting agreements give the Company the legal right to discharge all or a portion of the amountsowed to a counterparty by offsetting it against amounts that the counterparty owes to the Company.

24
Foreign currency risk management
Smedvig's contract portfolio, forward contracts on currencies, and foreign currency options are used to hedgethe future value of income and expenses denominated in foreign currencies and the foreign exchange risk ofSmedvig's assets and liabilities. The Company's foreign currency risk arises from:
— fluctuations in exchange rates on the value of the Company's sales and purchases in foreign currencies(transaction exposure) and certain financial assets and liabilities (translation exposure); and
— the Company's investment in certain foreign subsidiaries' net asset (translation exposure).
The Company is hedging most of its transaction risk by way of its net exposure. At the end of 1998, theCompany's long-term interest bearing debt is hedged against foreign currency fluctuations by operating contractsin the same currency which ensures sufficient cash flow to settle operating expenses, interest and installmentpayments. Foreign currency exposure related to long-term debt has been eliminated by having operating incomeand expenses, interest expenses, installment payments and interest bearing debt being recorded at fixed exchangerates. Of the revolving credit facility with a limit of U.S.$650 million, U.S.$505 million was drawn at December31, 1998.
Realized gains and losses on forward exchange contracts and foreign currency options are recognized in theincome statement in the period such items are closed or settled. Unrealized gains that are considered hedges of netcurrency exposures are deferred while unrealized losses are expensed in the income statement.
Premiums paid or received for the purchase or sale of options are deferred and charged or credited to theincome statement at the expiration of the options.
The following table presents information regarding the contract amount in NOK equivalent amounts and theestimated fair value of all of the Company's foreign currency options with a positive fair value (assets) and anegative fair value (liabilities) as at December 31, 1998 and 1997.
As at D ecember 31, 1997 1998 Notional
amount Fair
value Notional
amount Fair
value
(NOK in millions)Foreign currency optionsLiabilities..................................................................................................................................................................................... 825 (23) 0 0
The major currency of the Company's option contracts is U.S. dollar.
Interest rate risk management
The following is a summary of interest rate swaps and interest rate caps of the Company. Swaps and capsthat have a positive fair value are listed as assets while swaps and caps with a negative fair value are listed asliabilities.
As at December 31, 1997 1998 Notional
amount Fair
value Notional
amount Fair
value
(NOK in millions)Interest rate swapsLiabilities..................................................................................................................................................................................... 1,359 (27) 2,695 (85)
The extent of the utilization of financial instruments is determined by reference to the Company's net debtexposure and the Company's views regarding future interest rates. At the end of 1998, approximately 70 percentof the Company's U.S. Dollar interest bearing debt was hedged with interest rate swap agreements. This impliesthat the Company for this part of the debt has a fixed interest rate. Most of these contracts have a term of three to

25
five years. If an interest rate swap agreement is terminated, the Company will continue to account for the gain orloss in accordance with the swap agreement for as long as the underlying loan still exists. In the case the Companyterminates the underlying loan the effect of the financial instrument is booked to the income statement. TheCompany's loans are denominated in U.S. dollars.
The Company had the following interest rate swap agreements as of December 31, 1998:
Notional amount Receive rate Pay rate Length of contract (NOK in millions)190........................................ 6 month LIBOR 5.96% January 10, 1996 - January 10, 2001238........................................ 6 month LIBOR 7.86% February 15, 1996 - August 15,2000124........................................ 6 month LIBOR 5.65% May 3, 1996 - November 3, 2000238........................................ 3 month LIBOR 7.45% July 15, 1994 - July 15, 2004381........................................ 6 month LIBOR 5.64% February 18, 1998 - February 18, 2003381........................................ 3 month LIBOR 5.42% February 18, 1998 - February 18, 2003381........................................ 3 month LIBOR 5.97% August 18, 1998 - August 18, 2003381........................................ 3 month LIBOR 5.88% June 2, 1998 - June 2, 2003381........................................ 3 month LIBOR 5.87% June 2, 1998 - June 2, 2003
The primary loan is obtained by the parent company and not the rig owning companies. The interest rateswap agreements are therefore not any longer linked to individual rigs or ships.
Concentration of credit risk
As at December 31, 1998, the Company had approximately 50 percent of its receivables from two customers.Nevertheless, the Company perceives the concentration of credit risk as low due to the solidity of the twocompanies, whose majority shareholder is the Norwegian Government.
Note 21 — FAIR VALUE OF FINANCIAL INSTRUMENTS
The Company has used a variety of methods and assumptions, which are based on market conditions andrisks existing at the time, to estimate the fair value of the Company's financial instruments as at December 31,1998 and December 31, 1997. For certain instruments, including cash and cash equivalents, accounts payable andaccruals, it was assumed that the carrying amount approximated fair value due to the short-term maturity of thoseinstruments. The difference between carrying value and fair value for cash and cash equivalents and long-termdebt is due to the hedged NOK/U.S. Dollar exchange rate for the book value of the long-term debt.

26
Quoted market prices or dealer quotes for the same or similar financial instruments were used to estimate thefair value of the marketable securities, long-term investments, and long-term debt. The estimated value of theCompany's off balance sheet financial instruments are primarily based on settlement values. These valuesrepresent the estimated amount that would be received or paid in the event of termination of the contract, takinginto consideration current interest rates, the creditworthiness of the counterparties and current foreign currencyexchange rates.
As at December 31, 1997 1998 Carrying value
Fair value
Carrying value
Fair value
(NOK in millions)Assets: Cash and cash equivalents.......................................................................................................................................... 767 928 579 579 Short-term investments................................................................................................................................................ 307 309 303 303 Receivables......................................................................................................................................................................... 1,042 1,042 1,028 1,028Liabilities: Accounts payable ............................................................................................................................................................ 151 151 130 130 Long-term debt ................................................................................................................................................................. 1,913 2,149 3,853 3,944Off balance sheet financial instrumentsInterest rate risk management..................................................................................................................................... — (27) — —Foreign currency risk management ......................................................................................................................... (8) (23) — (85)
See Note 20 for further details regarding fair values of off balance sheet financial instruments.
Note 22 — LEASES
The Company has signed operating leases for certain premises. The majority of the premises are leased fromthe Smedvig family's real estate company, A/S Veni. See Note 26 related party transactions. Smedvig OffshoreAS has a lease with A/S Veni lasting until 2007 for the offices at Dusavik, Stavanger.
Rental expenses amounts to NOK 27 million for 1998, which is an increase of NOK 4 million from 1997,and an increase of NOK 6 million from 1996.
Note 23 — PROPORTIONATE CONSOLIDATION
The Company consolidates certain joint-stock companies and limited partnerships in accordance withproportionate consolidation principles. The Company's ownership interest in such companies and partnerships isapproximately 50 percent. The table below presents the Company's pro rata share of the condensed financialinformation of the companies that have been proportionally consolidated.
As at December 31, 1997 1998
(NOK in millions)Balance Current assets .......................................................................................................................................................................................................................... 85 166 Non-current assets ................................................................................................................................................................................................................ 2,102 1,796 Current liabilities................................................................................................................................................................................................................... 39 62 Non-current liabilities......................................................................................................................................................................................................... 1,314 167

27
Year ended December 31, 1996 1997 1998
(NOK in millions)Income statement Revenues................................................................................................................................................................................................................ 274 242 332 Operating profit (loss) .................................................................................................................................................................................... 28 23 58 Income (loss) before income taxes.......................................................................................................................................................... 9 (8) 7
Note 24 — REMUNERATION TO THE BOARD OF DIRECTORS ANDCHIEF EXECUTIVE OFFICER
1998
(NOK)
Remuneration expensed in 1998:
Board of Directors..................................................................................................................................................................................................................................................... 600,000
Chief Executive Officer ......................................................................................................................................................................................................................................... 1,925,621
The Chairman of the Board, Peter T. Smedvig, has not received any remuneration in 1998.
Note 25 — AUDITOR'S REMUNERATION
1998 (NOK)
Audit of parent company....................................................................................................................................................................................................................................... 380,000Advisory services in connection with reporting to the Securities and Exchange Commission ........................................................................................................................................................................................................ 242,500Audit of subsidiaries ................................................................................................................................................................................................................................................ 1,707,500Other advisory services .......................................................................................................................................................................................................................................... 2,856,000
Note 26 — RELATED PARTY TRANSACTIONS
The Company has signed miscellaneous lease agreements with A/S Veni. A/S Veni is a real estate companywholly owned by the Smedvig family which is the largest shareholder in Smedvig asa. The lease agreementsprimarily relate to office premises and expire at various dates through 2007. The lease payments to A/S Veni forthe year ended December 31, 1998 were NOK 11 million. Corresponding figures for each of the years endedDecember 31, 1997 and 1996 were NOK 16 million and NOK 14 million, respectively.
Note 27 — SUPPLEMENTAL CASH FLOW INFORMATION
The following is a summary of investing activities related to the acquisition of certain subsidiaries in 1998and 1997:
As of December 31, 1997 1998
(NOK in millions)Assets acquired (sold) ................................................................................................................................................................................................................ 538 (347)Liabilities assumed....................................................................................................................................................................................................................... (320) 78Cash paid, net of cash acquired............................................................................................................................................................................................. 218 (269)
Cash paid for interest and taxes are as follows:
Year ended December 31, 1996 1997 1998
(NOK in millions)Interest paid.................................................................................................................................................................................................................. 134 101 188Taxes paid ..................................................................................................................................................................................................................... 58 12 25

28
Note 28 — MORTGAGE, GUARANTEES AND CAPITAL NOT CALLED IN FROMLIMITED PARTNERSHIPS
Mortgages
As of December 31, 1998
(NOK in millions)Mortgages.......................................................................................................................................................................................................................................... 3,853 Pledged mobile units and tender rigs................................................................................................................................................................................. 2,550Pledged newbuilding projects................................................................................................................................................................................................ 3,428 Book value pledged assets....................................................................................................................................................................................................... 5,978
Guarantees
The Company has issued guarantees in favor of third parties amounting to NOK 412 million. The majority ofthe guarantees are limited performance guarantees issued to the Company's customers. In addition to the limitedguarantees, the Company has issued a performance guarantee in favor of Phillips Petroleum Company Norway forthe fulfillment of the water injection contract for ENSCO 100 (ex West Omikron). The parent company has issueda performance guarantee in favor of Statoil in connection with a contract entered into by its subsidiary SmedvigTechnologies AS for the installation of permanent pressure gauge systems.
Capital not called in from limited partnerships
The Company's committed, but not called in, capital in limited partnerships amounts to NOK 479 million asat December 31, 1998.
Note 29 — OFF BALANCE SHEET ITEMS
Balder FPU
The production vessel Balder FPU was constructed by Keppel Fels in Singapore. The vessel was sold toEsso Norge AS. The costs related to the completion of the vessel were considerably higher than expected. Someof the additional costs are related to works which the Company had advanced in order to secure completion of thevessel and which the Company will seek to reclaim from Esso/Keppel Fels. The Company has withheld paymentof the final installment to Keppel Fels, which amount has been offset against the Company's claim regarding thesaid work.
Balder FPU was delivered to Esso in March 1997 with required certificates. Esso moved the vessel to ashipyard in Scotland to complete their modification program in connection with adaptation to certain new Balder-specific requirements, and to carry out other remaining work. At the shipyard in Scotland, Esso claims to havediscovered a number of defects in the vessel. On October 17, 1997, Esso notified the Company that it terminatedthe operating contract for the Balder FPU, as well as the remaining part of the sales contract, which can only beterminated in the event of substantial breach. The termination will not result in the vessel being redelivered to theCompany. As of December 31, 1998, amounts owed to the Company by Esso under the sales contract totalledU.S.$46.5 million (NOK 340 million).
Smedvig and Esso are in agreement that certain work was incomplete when the vessel was delivered to Esso,and that this work should be performed by Esso for Smedvig's account. However, the parties disagree as to theamount of the outstanding work and the costs required for completion.
In April 1998, Smedvig filed a complaint against Esso in Stavanger City Court for unlawful termination andwillful breach of the sales contract and operating contract for the Balder FPU. In the complaint, Smedvig claimspayment of the final settlement under the sales contracts plus compensation for unlawful termination and willfulbreach of contract up to a total of approximately NOK 2.6 billion. In its reply, filed in September 1998, Essorejected Smedvig's claim and brought counterclaims totaling some NOK 4 billion against Smedvig, based mainly

29
on Esso's assertion that Smedvig substantially breached the sales and purchase agreement and exhibited grossnegligence in its handling of the Balder project. Smedvig rejects this claim as unjustified, and a formal responsewas filed at the end of March 1999. Smedvig maintains that Esso undertook comprehensive modifications andupgrades of the vessel above and beyond those specified in the construction contract, and that the oil company isliable for the associated costs.
The dispute between Esso and Smedvig is expected to be tried at Stavanger City Court during year 2000.
Other receivables include a net claim of approximately NOK 175 million against Esso and Keppel Fels.
Based on the Company's review of its contractual obligations and consideration of the state of the vessel atdelivery to Esso, the Company believes that it has complied with its material obligations under these contracts.Although the ultimate outcome of this dispute may result in a material charge to results of operations in aparticular year, the Company does not believe that the ultimate outcome of this dispute will have a materialadverse effect on the financial position of the Company.
Note 30 — THE APPROXIMATE EFFECT ON NET INCOME OF SIGNIFICANT DIFFERENCESBETWEEN NORWEGIAN AND U.S. ACCOUNTING PRINCIPLES
Norwegian GAAP differs in certain respects from U.S. GAAP. Differences which have significant effect onthe Company's consolidated net income and shareholder's equity are set out below:
Reference to note below 1996 1997 1 998
Net income in accordance with Norwegian GAAP................................................................................................................ 210 586 213 Adjustment for U.S. GAAP:Foreign currency......................................................................................................................................................................................... (a) (20) (87) 23Bonds and shares........................................................................................................................................................................................ (b) — — 2Financial instruments............................................................................................................................................................................... (c) (15) — —Provision for periodic overhauls ....................................................................................................................................................... (e) 20 25 (15)Compensation expenses ......................................................................................................................................................................... (f) (7) (3) —Disposal of vessel ...................................................................................................................................................................................... (g) — (151) 76Other.................................................................................................................................................................................................................. (1) (1) (2)Deferred taxes.............................................................................................................................................................................................. (h) (93 ) (196 ) (84 )The tax effect of U.S. GAAP adjustments................................................................................................................................... (h) 4 60 (24 )Approximate net income in accordance with U.S. GAAP................................................................................................. 98 233 189 Approximate basic earnings per share in accordance with U.S. GAAP ................................................................................................................................................................................................. 2.83 5.68 4.59Approximate diluted earnings per share in accordance with U.S. GAAP...................................................................................................................................................................................... 2.81 5.66 4.59

30
The approximate effect on shareholders' equity of significant differences between Norwegian GAAP andU.S. GAAP is as follows:
Reference to note below 1997 1998
Shareholder equity in accordance with Norwegian GAAP .............................................................................................................. 3,417 3,597 Adjustment for U.S. GAAP:Foreign currency........................................................................................................................................................................................................ (a) (114) (91)Equity and debt securities .................................................................................................................................................................................... (b) 2 0Dividends....................................................................................................................................................................................................................... (d) 93 72Provision for periodic overhauls ...................................................................................................................................................................... (e) 100 85Disposal of vessel ..................................................................................................................................................................................................... (g) (151) (75)Other................................................................................................................................................................................................................................. 6 4Deferred taxes............................................................................................................................................................................................................. (h) (230 ) (338 )
Approximate shareholders' equity in accordance with U.S. GAAP............................................................................................. 3,123 3,254
Principal differences between Norwegian GAAP and U.S. GAAP
a) Foreign exchange
In accordance with Norwegian GAAP long-term debt denominated in foreign currencies is reported at thehigher of either the foreign exchange rate at the date the debt was incurred or the exchange rate at year-end. UnderU.S. GAAP, in accordance with Statement of Financial Accounting Standards (SFAS), No. 52, "Foreign CurrencyTranslation," assets and liabilities denominated in a foreign currency are recorded at period-end rates with anyresulting unrealized gain or loss recognized in the income statement.
In accordance with Norwegian GAAP certain long-term debt denominated in foreign currencies is recordedat the exchange rate that existed at the origination of the debt, as drilling contracts denominated in the samecurrency existed that effectively hedged the foreign exchange risk. These transactions do not comply with thehedge criteria under the U.S. GAAP, therefore the long-term debt denominated in foreign currency would berecorded at year-end exchange rates with any resulting unrealized gain or loss recognized in the income statementunder U.S. GAAP.
Under Norwegian GAAP unrealized gains on forward exchange contracts and foreign currency options aredeferred and recognized only when realized. Under U.S. GAAP unrealized gains on forward exchange contractsand foreign currency options which do not qualify for hedge accounting treatment would be recognized as incomewhen they occur. The amounts of unrealized gains were immaterial.
b) Equity and debt securities
Under Norwegian GAAP, short-term investments are recorded at the lower of cost or market valuedetermined on a portfolio basis. For U.S. GAAP purposes, all investments in debt and equity securities with areadily determinable market value are classified as "available for sale" and are recorded at fair value with changesin unrealized appreciation or depreciation recorded directly to shareholders' equity, net of applicable deferredincome tax.
c) Interest rate swaps
Under Norwegian GAAP when debt is refinanced the related interest rate swap agreement can be designatedas a hedge of the new debt without any impact to the income statement. Under U.S. GAAP, when debt isrefinanced the related interest rate swap agreement should be marked-to-market with the resulting unrealized gainor loss being credited or charged to the income statement.
d) Dividends
Under Norwegian law, dividends are payable out of annual earnings. The dividend is subject to approval bythe Annual General Meeting following the fiscal year to which the dividend relates. Under Norwegian GAAP,dividends are recorded when declared. Accordingly, under U.S. GAAP, dividends are recorded in the yearfollowing the year they are recorded under Norwegian GAAP.

31
e) Provision for periodic overhauls
Under Norwegian GAAP, a provision for periodic overhauls on mobile units and tender rigs is accruedevenly over the anticipated period between overhauls, generally five years. Under U.S. GAAP, the costs of suchoverhauls would be capitalized when incurred and depreciated over the estimated future period benefited by suchcosts, generally five years.
f) Compensation expenses
If stock options are granted at a point in time where the prevailing market price exceeds the exercise price, orif shares are offered at a purchase price below prevailing market price, Smedvig does not charge to income theemployee benefits in accordance with this difference. Under U.S. GAAP, however, such benefits must be chargedto income in accordance with this difference. The associated social security costs, however, are expensed aspersonnel costs both under Norwegian GAAP and U.S. GAAP.
g) Disposal of vessel
In December 1997, the Company sold the West Omikron to ENSCO for approximately NOK 750 million. Atthe time the vessel was sold it was under contract to a customer. The Company has leased the vessel back fromENSCO in order to fulfill its obligations under the contract. Under Norwegian GAAP, the entire amount of thegain was recognized at the time of the sale. Under U.S. GAAP, only a portion of the gain would be recognized atthe time of the sale and the remainder would be amortized into income ratably over the period of the lease.
h) Deferred taxes
The income tax effects of other U.S. GAAP adjustments are recorded as deferred tax expense, whereappropriate.
In 1996, Norway introduced new rates for taxation of shipping and offshore companies. According to thenew tax rules, taxation will be based upon funds distributed to shareholders. Thus, under Norwegian GAAP suchincome is not taxable. However, under U.S. GAAP, a deferred tax liability and tax charge should be recognizedon such income.
In 1998, Smedvig has a net tax asset related to the operation in Norway. In 1996 there was a similar situationin the United Kingdom. Under Norwegian GAAP the benefit of deferred tax assets is not recognized because thereis no corresponding deferred tax liability within the same tax jurisdiction against which the assets can be offset.Under U.S. GAAP the benefit of the deferred tax asset may be recognized if it is more likely than not that theasset will be realized. The Company has determined that it is more likely than not that it will realize the benefit ofthis deferred tax asset through future taxable earnings. At year end 1998 net tax asset is calculated at NOK 46million.
i) First year's installment on long-term debt
Under Norwegian GAAP, the first year's installment on long-term debt is included in long-term debt. Theinstallments due in 1999 of NOK 25 million would be classified as short-term debt, under U.S. GAAP.
j) Newbuilding contracts
According to Norwegian GAAP, the entire construction contract value is included in the balance sheet fromthe start of the construction. The contractual obligation is also recorded as a liability. Other cost, including interestunder construction, are capitalized when they occur. Under U.S. GAAP, only accrued expenses at the period-endwould be capitalized.
Newbuilding contracts at December 31, 1998, of NOK 4,228 million are specified in Note 12. According toU.S. GAAP the amount in the accounts would have been approximately NOK 3,400 million without anycorresponding liability.

32
k) Proportionate consolidation method
Under Norwegian GAAP the Company consolidates certain joint stock companies and limited partnerships,in which the Company's holdings are 50 percent or less, in accordance with the proportionate consolidationmethod. Condensed financial information for the companies and partnerships that have been proportionallyconsolidated is included in Note 23.
Under U.S. GAAP the Company's ownership interest in these companies and partnerships would beaccounted for under the equity method. The effect on total assets, shareholders' equity and net income of using theproportionate consolidation method versus the equity method would not be material as of and for the years endedDecember 31, 1998, 1997 and 1996.
l) Other items
Other items in the 1998 income statement include termination expenses and a gain from the sale of the UKplatform drilling operation. Gains on sale of assets in previous years have been reclassified correspondingly. Inaccordance with U.S. GAAP such amounts should be classified as operating expenses, respectively income.
m) Accounting standards issued but not yet adopted
In June 1998, the Financial Accounting Standards Board issued Statement of Financial AccountingStandards No. 133 ("SFAS 133"), "Accounting for Derivative Instruments and Hedging Activities." Thisstatement establishes accounting and reporting standards for derivative instruments, including certain derivativeinstruments embedded in other contracts (collectively referred to as derivatives), and for hedging activities. Itrequires that an entity recognize all derivatives as either assets or liabilities in the statement of financial positionand measure those instruments at fair value. This statement is effective for all fiscal quarters of fiscal yearsbeginning after June 15, 1999. Management has not determined the effect of the adoption of SFAS 133.
During January 1998, the American Institute of Certified Public Accountants (AICPA) issued Statement ofPosition 98-1 Accounting for the Costs of Computer Software Developed or Obtained for Internal Use ("SOP 98-1") which becomes effective for all fiscal years beginning after December 15, 1998. Under SOP 98-1,computer software costs that are incurred in the preliminary project stage are expensed as incurred. Once specificcapitalization criteria have been met, external direct costs of materials and service consumed in developing orobtaining internal-use computer software, certain personnel costs, and interest costs incurred when developingcomputer software for internal use are capitalized. Training costs and data conversion costs are generallyexpensed as incurred. Such capitalized costs are amortized over the estimated useful life of the software. TheCompany is evaluating the effect of the pronouncement.
The AICPA issued Statement of Positions 98-5, Reporting on the Costs of Start-Up Activities ("SOP 98-5) inApril 1998 and is effective for fiscal periods beginning after December 15, 1998 SOP 98-5 provides guidance onthe financial reporting of start-up costs and organization costs. It requires costs of start-up activities andorganization costs to be expensed as incurred. The Company is evaluating the effect of the pronouncement.
Note 31 — SUBSEQUENT EVENT (UNAUDITED)
In June 1999, after negotiations with Statoil, the five-year drilling contract for the West Navion was replacedby a one-year contract. Terms and conditions for the new contract are substantially the same as for the originalcontract. The reason for the reduction in contract duration was the delayed delivery schedule for the drillship.At the same time, the Company's partner Navion, which owns 50 percent of the West Navion, notified theCompany that they reserve their right to seek compensation from the Company for Navion's portion of the costoverruns related to the construction and outfitting of the drillship. The Company believes that such claim wouldbe groundless.
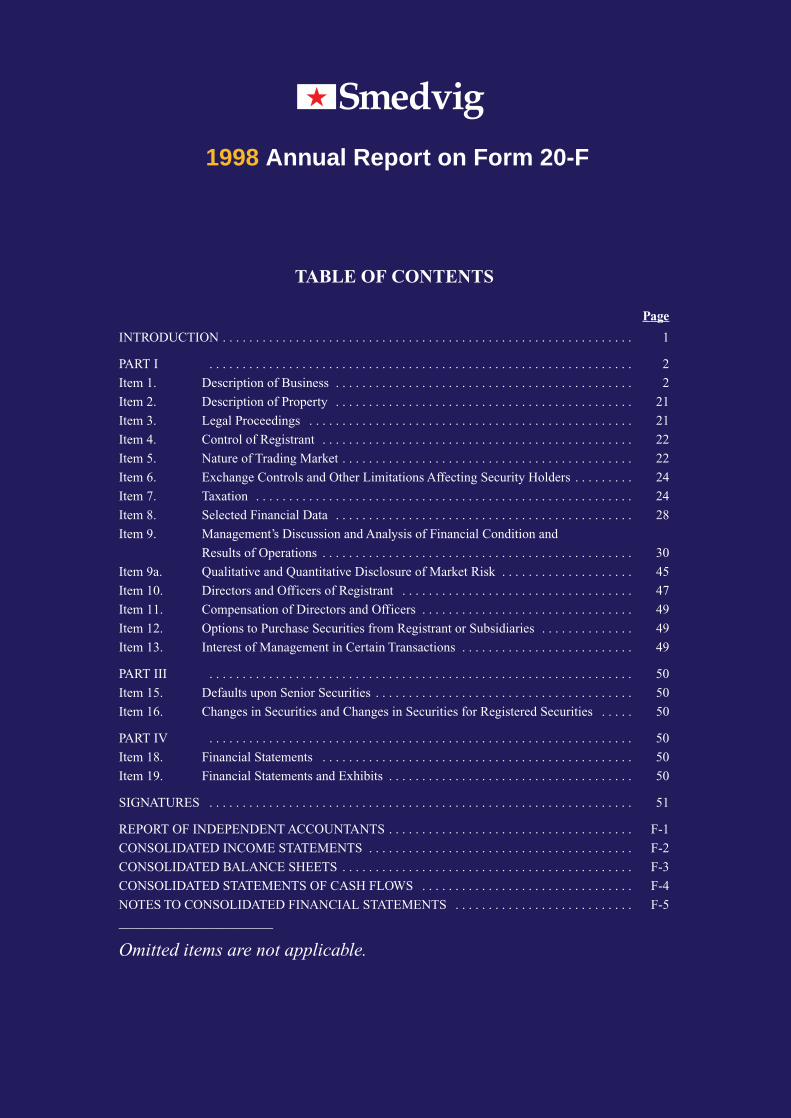
1998 Annual Report on Form 20-F
TABLE OF CONTENTS
Page
INTRODUCTION . . . . . . . . . . . . . . . . . . . . . . . . . . . . . . . . . . . . . . . . . . . . . . . . . . . . . . . . . . . . . . 1
PART I . . . . . . . . . . . . . . . . . . . . . . . . . . . . . . . . . . . . . . . . . . . . . . . . . . . . . . . . . . . . . . . . 2
Item 1. Description of Business . . . . . . . . . . . . . . . . . . . . . . . . . . . . . . . . . . . . . . . . . . . . . 2
Item 2. Description of Property . . . . . . . . . . . . . . . . . . . . . . . . . . . . . . . . . . . . . . . . . . . . . 21
Item 3. Legal Proceedings . . . . . . . . . . . . . . . . . . . . . . . . . . . . . . . . . . . . . . . . . . . . . . . . . 21
Item 4. Control of Registrant . . . . . . . . . . . . . . . . . . . . . . . . . . . . . . . . . . . . . . . . . . . . . . . 22
Item 5. Nature of Trading Market . . . . . . . . . . . . . . . . . . . . . . . . . . . . . . . . . . . . . . . . . . . . 22
Item 6. Exchange Controls and Other Limitations Affecting Security Holders . . . . . . . . . 24
Item 7. Taxation . . . . . . . . . . . . . . . . . . . . . . . . . . . . . . . . . . . . . . . . . . . . . . . . . . . . . . . . . 24
Item 8. Selected Financial Data . . . . . . . . . . . . . . . . . . . . . . . . . . . . . . . . . . . . . . . . . . . . . 28
Item 9. Management’s Discussion and Analysis of Financial Condition and
Results of Operations . . . . . . . . . . . . . . . . . . . . . . . . . . . . . . . . . . . . . . . . . . . . . . . 30
Item 9a. Qualitative and Quantitative Disclosure of Market Risk . . . . . . . . . . . . . . . . . . . . 45
Item 10. Directors and Officers of Registrant . . . . . . . . . . . . . . . . . . . . . . . . . . . . . . . . . . . 47
Item 11. Compensation of Directors and Officers . . . . . . . . . . . . . . . . . . . . . . . . . . . . . . . . 49
Item 12. Options to Purchase Securities from Registrant or Subsidiaries . . . . . . . . . . . . . . 49
Item 13. Interest of Management in Certain Transactions . . . . . . . . . . . . . . . . . . . . . . . . . . 49
PART III . . . . . . . . . . . . . . . . . . . . . . . . . . . . . . . . . . . . . . . . . . . . . . . . . . . . . . . . . . . . . . . . 50
Item 15. Defaults upon Senior Securities . . . . . . . . . . . . . . . . . . . . . . . . . . . . . . . . . . . . . . . 50
Item 16. Changes in Securities and Changes in Securities for Registered Securities . . . . . 50
PART IV . . . . . . . . . . . . . . . . . . . . . . . . . . . . . . . . . . . . . . . . . . . . . . . . . . . . . . . . . . . . . . . . 50
Item 18. Financial Statements . . . . . . . . . . . . . . . . . . . . . . . . . . . . . . . . . . . . . . . . . . . . . . . 50
Item 19. Financial Statements and Exhibits . . . . . . . . . . . . . . . . . . . . . . . . . . . . . . . . . . . . . 50
SIGNATURES . . . . . . . . . . . . . . . . . . . . . . . . . . . . . . . . . . . . . . . . . . . . . . . . . . . . . . . . . . . . . . . . 51
REPORT OF INDEPENDENT ACCOUNTANTS . . . . . . . . . . . . . . . . . . . . . . . . . . . . . . . . . . . . . F-1
CONSOLIDATED INCOME STATEMENTS . . . . . . . . . . . . . . . . . . . . . . . . . . . . . . . . . . . . . . . . F-2
CONSOLIDATED BALANCE SHEETS . . . . . . . . . . . . . . . . . . . . . . . . . . . . . . . . . . . . . . . . . . . . F-3
CONSOLIDATED STATEMENTS OF CASH FLOWS . . . . . . . . . . . . . . . . . . . . . . . . . . . . . . . . F-4
NOTES TO CONSOLIDATED FINANCIAL STATEMENTS . . . . . . . . . . . . . . . . . . . . . . . . . . . F-5
_____________________________
Omitted items are not applicable.

______________________________________________________________________________________________________________________________________________________________________________________________________________________________________________________________________________________________________________________________________________________________
SECURITIES AND EXCHANGE COMMISSIONWashington, D.C. 20549
FORM 20-F(Mark One)[ ] REGISTRATION STATEMENT PURSUANT TO SECTION 12(b) OR (g)
OF THE SECURITIES EXCHANGE ACT OF 1934
OR
[X] ANNUAL REPORT PURSUANT TO SECTION 13 OR 15(d) OF THE SECURITIES EXCHANGE ACT OF 1934
For the fiscal year ended December 31, 1998
OR
[ ] TRANSITION REPORT PURSUANT TO SECTION 13 OR 15(d) OF THESECURITIES EXCHANGE ACT OF 1934
For the transition period from to
Commission file number: 1-14532
SMEDVIG asa(Exact name of Registrant as specified in its charter)
Kingdom of Norway(Jurisdiction of incorporation or organization)
Finnestadveien 28, P.O. Box 110, N-4001, Stavanger, Norway(Address of principal executive offices)
Securities registered or to be registered pursuant to Section 12(b) of the Act: Title of each class Name of each exchange on which registered Class A Ordinary Shares, par value NOK 3.00 per share New York Stock Exchange, Inc.*Class A American Depositary Shares, each representing one New York Stock Exchange, Inc.Class A Ordinary ShareClass B Ordinary Shares, par value NOK 3.00 per share New York Stock Exchange, Inc.*Class B American Depositary Shares, each representing one New York Stock Exchange, Inc.Class B Ordinary Share
_____________
* Not for trading, but only in connection with registration of American Depositary Shares representing suchClass A and Class B Shares, pursuant to the requirements of the Securities and Exchange Commission.
Securities registered or to be registered pursuant to Section 12(g) of the Act:
None
Securities for which there is a reporting obligation pursuant to Section 15(d) of the Act:
None
Indicate the number of outstanding shares of each of the issuer's classes of capital or common stock as of theclose of the period covered by the annual report:
27,349,502 Class A Ordinary Shares, with nominal value of NOK 3.00 per share13,864,125 Class B Ordinary Shares, with nominal value of NOK 3.00 per share
Indicate by check mark whether the registrant (1) has filed all reports required to be filed by Section 13 or15(d) of the Securities Exchange Act of 1934 during the preceding 12 months (or for such shorter period thatthe registrant was required to file such reports), and (2) has been subject to such filing requirements for thepast 90 days.
Yes X No ____
Indicate by check mark which financial statement item the registrant has elected to follow.
Item 17 ____ Item 18 X ______________________________________________________________________________________________________________________________________________________________________________________________________________________________________________________________________________________________________________________________________________________________