smart traffic management with ptv optima can the …
TRANSCRIPT

www.ptvgroup.com
SMART TRAFFIC MANAGEMENT WITH
PTV OPTIMA
CAN THE ROADS BE 1 STEP AHEAD?
Prabhu TD – Transport Planner
Sonal Ahuja – Regional Director
Florian Weichenmeier – Realtime Traffic Software
www.ptvgroup.com Page 2
On-line Traffic Data Amplifier for:
Real-time Traffic prediction
Traffic Data Hub (multiple Data Sources)
Real-time Data fusion (GIS based)
Real-time Traffic Scenario Comparison and
Evaluation
Traffic Scenario & Action management
Traffic Information and Control Tool
Emergency and Evacuation Control Hub
Based on sound traffic modelling methods
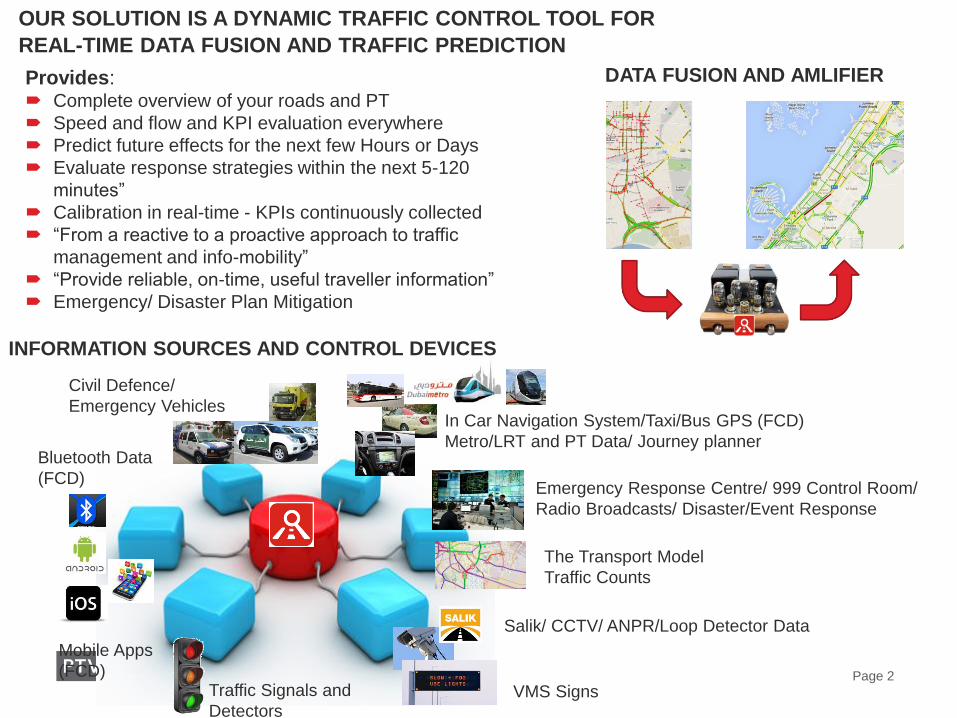
OUR SOLUTION IS A DYNAMIC TRAFFIC CONTROL TOOL FOR
REAL-TIME DATA FUSION AND TRAFFIC PREDICTION
In Car Navigation System/Taxi/Bus GPS (FCD)
Metro/LRT and PT Data/ Journey planner
Emergency Response Centre/ 999 Control Room/
Radio Broadcasts/ Disaster/Event Response
The Transport Model
Traffic Counts
Bluetooth Data
(FCD)
Mobile Apps
(FCD)
Salik/ CCTV/ ANPR/Loop Detector Data
Traffic Signals and
Detectors
Civil Defence/
Emergency Vehicles
INFORMATION SOURCES AND CONTROL DEVICES
DATA FUSION AND AMLIFIER
VMS Signs
Provides: Complete overview of your roads and PT
Speed and flow and KPI evaluation everywhere
Predict future effects for the next few Hours or Days
Evaluate response strategies within the next 5-120
minutes”
Calibration in real-time - KPIs continuously collected
“From a reactive to a proactive approach to traffic
management and info-mobility”
“Provide reliable, on-time, useful traveller information”
Emergency/ Disaster Plan Mitigation

www.ptvgroup.com Page 3vision-traffic.ptvgroup.com

www.ptvgroup.com Page 4
www.ptvgroup.com Page 5
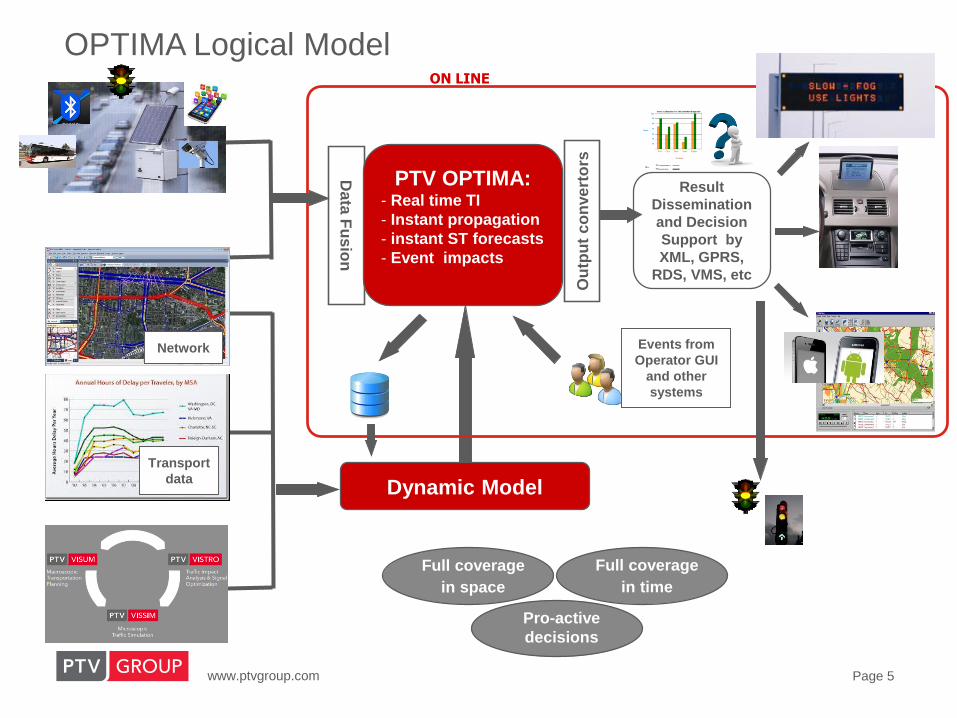
Dynamic Model
Data
Fu
sio
n
PTV OPTIMA:- Real time TI
- Instant propagation
- instant ST forecasts
- Event impacts
Full coverage
in space
Full coverage
in time
Pro-active
decisions
OPTIMA Logical ModelON LINE
Events from
Operator GUI
and other
systems
Transport
data
Network
Ou
tpu
t c
on
ve
rto
rs
Result
Dissemination
and Decision
Support by
XML, GPRS,
RDS, VMS, etc

www.ptvgroup.com Page 6
<<AUGMENTED>> INFOMOBILITY
7:00 AM: HYDE PARK … INPUT FROM DETECTORS7:00 AM: HYDE PARK … MEASURES PROPAGATION… FORECAST FOR 7:30 AM … SPACE AND TIME EXPANSION

www.ptvgroup.com Page 7
DECISION SUPPORT
CONGESTION
SUGG. DIVERSION
VIA SPARTACO ←
SCENARIO SIMULATION
WITHIN 5 MINUTES:
CHANGING SIGNAL PLANS
AND PUBLISHING DIVERSION
ON VMS

www.ptvgroup.com Page 8
PTV OPTIMA - KEY FUNCTIONS
DECISION SUPPORT SYSTEM - COMPARISON OF RESULTS
Background image from OpenStreepMap
8:00:00+30 min
Incident forecast
Do-nothing

www.ptvgroup.com Page 9
REAL-TIME
Upgradability from PTV Visum to PTV Optima
Revolutionary real-time traffic management

www.ptvgroup.com Page 10
COMPARING APPROACHES
FOR TRAFFIC FORECAST
Objective
Method
Traffic Estimation
“What is going on?”
Traffic Forecast
“What is going to
happen?”
Scenario Evaluation &
Decision Support
“What would happen if?”
“What should we do?”
Observed
data
Statistical
approach
Simulation
Approach
Maybe with
extensive
measuresNo No
YES"usual" conditions
onlyNo
YES YES YES
EASY
ROBUST
EFFECTIV
E

www.ptvgroup.com Page 11
OPTIMA REFERENCES
Paris: 2016
Dubai: 2017
London: 2016
Munich: 2015
Turino (ITALY) : 2014
ERFURT (GERMANY) : 2014
VIENNA (AUSTRIA) : 2015
CATANIA (ITALY) : 2015
RUSSIAN HIGHWAYS : 2015
MOSCOW (RUSSIA) : 2014 - 2015
SACHSEN ANHALT REGION (GERMANY) : 2015 - 2016
ABU DHABI (UAE): 2016
REAL INSTALLATIONS and not PILOT or small areas

www.ptvgroup.com Page 12
REAL-TIME DISASTER MANAGEMENT CENTER
Smart Traffic Solutions for Smart Cities – PTV GroupProject EC3 - Dubai
www.ptvgroup.com Page 13
WHY IMPLEMENT THE SYSTEM
• PREDICT AND PREVENT ROAD DISASTERS
• CREATE POSTIVE AND GOOD GOVERNANCE IMAGE
• IMPROVE QUALITY OF LIFE
• PROVIDE BACKBONE FOR POLICY FRAMEWORK
• HELP DEVELOP WORLD CLASS INFRASTRUCTURE
• SMART TRAFFIC MANAGEMENT FOR SMART CITIES
SAVE PRECIOUS LIVES

www.ptvgroup.com
SMART SIGNALLING WITH PTV BALANCE
AND PTV EPICS
WHO KEEPS CITY’S RHYTHM FLOWING?
www.ptvgroup.com Page 15
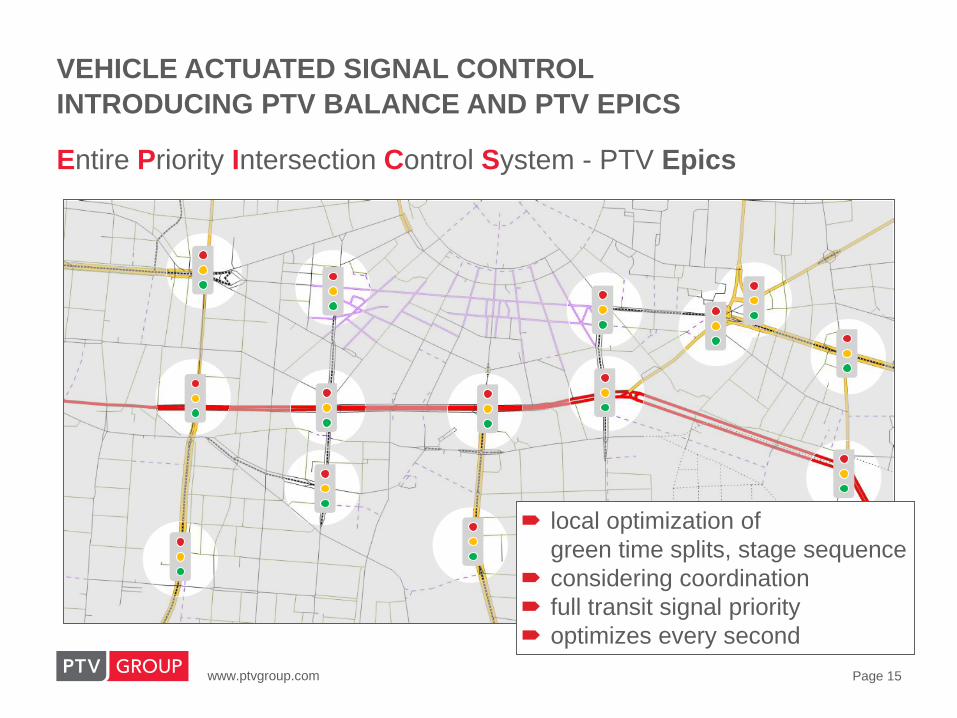
VEHICLE ACTUATED SIGNAL CONTROL
INTRODUCING PTV BALANCE AND PTV EPICS
Entire Priority Intersection Control System - PTV Epics
local optimization of
green time splits, stage sequence
considering coordination
full transit signal priority
optimizes every second
www.ptvgroup.com Page 16
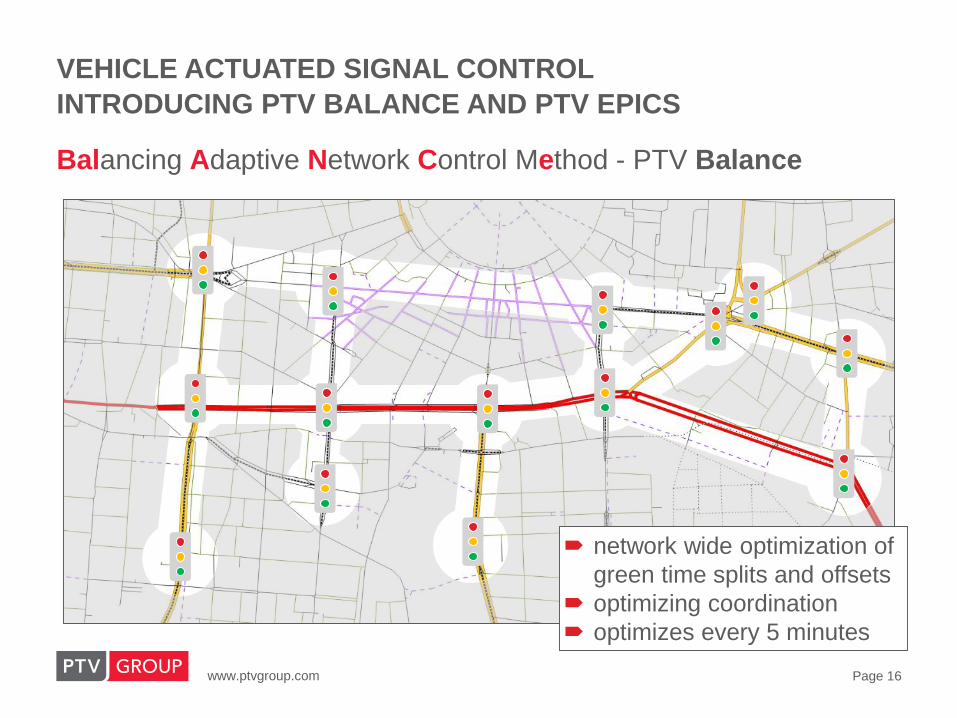
VEHICLE ACTUATED SIGNAL CONTROL
INTRODUCING PTV BALANCE AND PTV EPICS
Balancing Adaptive Network Control Method - PTV Balance
network wide optimization of
green time splits and offsets
optimizing coordination
optimizes every 5 minutes

www.ptvgroup.com Page 17
VEHICLE ACTUATED SIGNAL CONTROL
ADAPTIVE (MODEL-BASED) CONTROL
Measure
Act
Evaluate & Optimize
Traffic Model
Impact Model
Control Model
Signal Plans
Calculates and evaluates
impact of control on
objective
Allows true optimization
under arbitrary conditions
www.ptvgroup.com Page 18
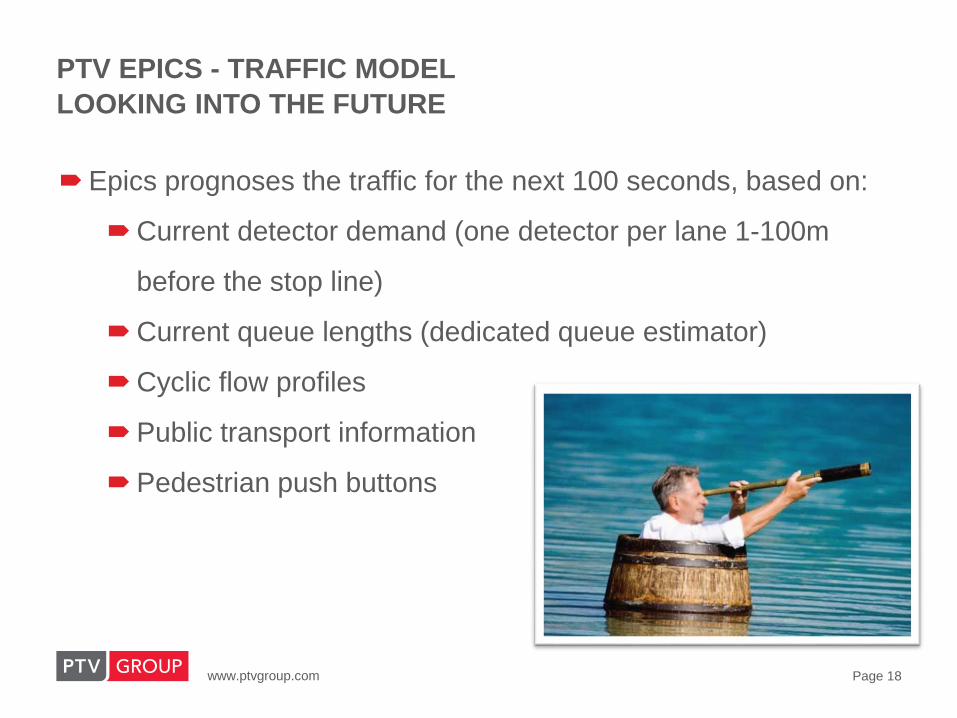
PTV EPICS - TRAFFIC MODEL
LOOKING INTO THE FUTURE
Epics prognoses the traffic for the next 100 seconds, based on:
Current detector demand (one detector per lane 1-100m
before the stop line)
Current queue lengths (dedicated queue estimator)
Cyclic flow profiles
Public transport information
Pedestrian push buttons

www.ptvgroup.com Page 19
Check-in point Main check-in Check-out point
Probability distribution for travel
time
arrival time
arrival time
PTV EPICS - TRAFFIC MODEL FOR PUBLIC TRANSPORT
www.ptvgroup.com Page 20
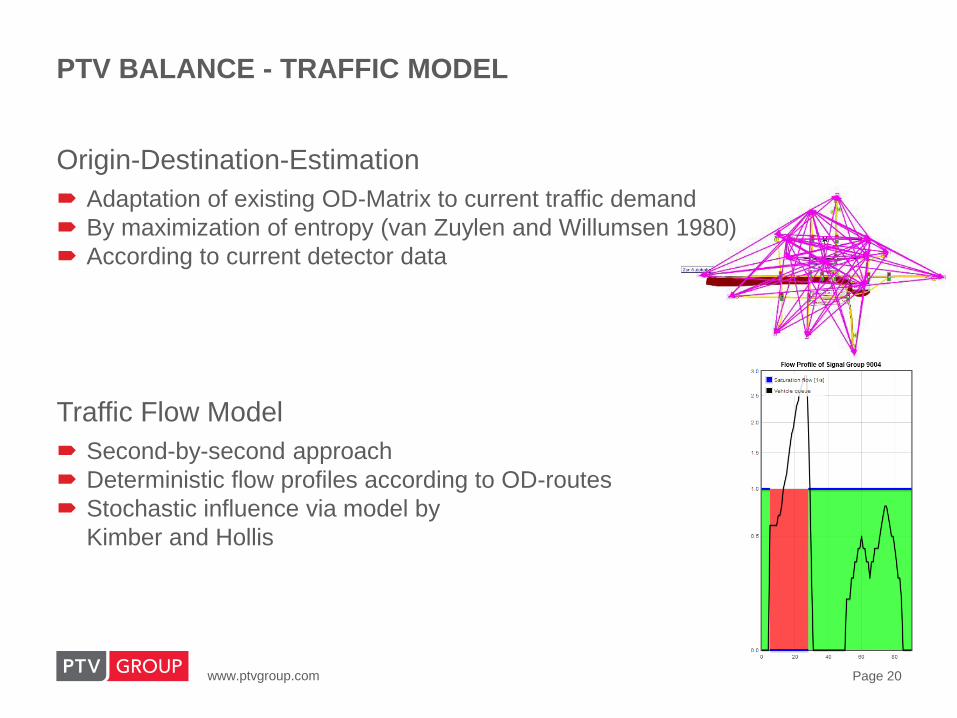
PTV BALANCE - TRAFFIC MODEL
Origin-Destination-Estimation
Adaptation of existing OD-Matrix to current traffic demand
By maximization of entropy (van Zuylen and Willumsen 1980)
According to current detector data
Traffic Flow Model
Second-by-second approach
Deterministic flow profiles according to OD-routes
Stochastic influence via model by
Kimber and Hollis
www.ptvgroup.com Page 21
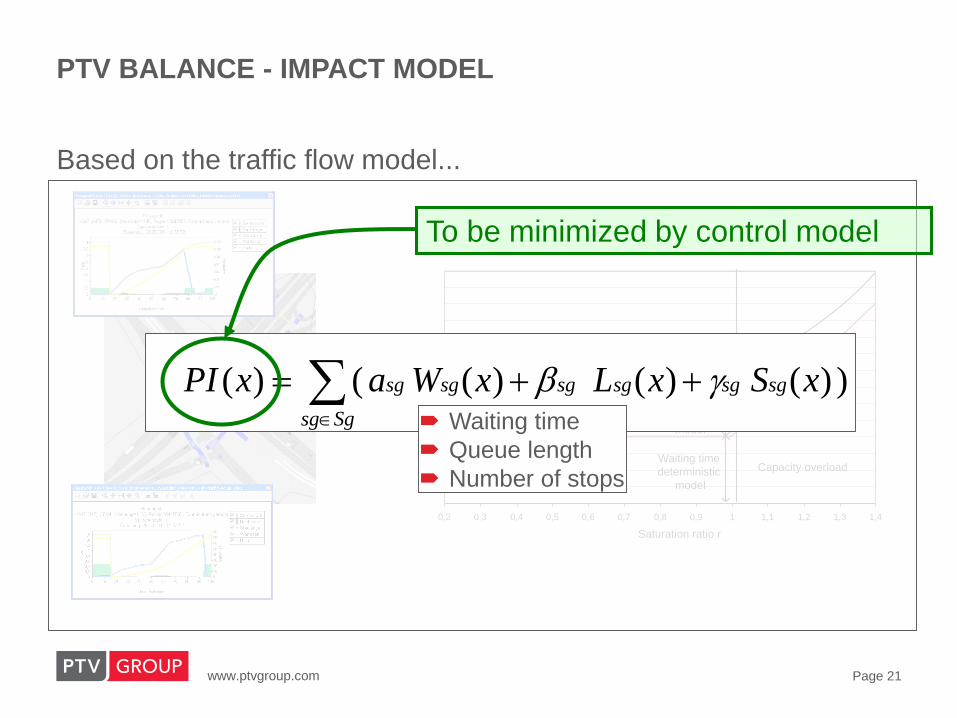
PTV BALANCE - IMPACT MODEL
0,2 0,3 0,4 0,5 0,6 0,7 0,8 0,9 1 1,1 1,2 1,3 1,4
Auslastung r
Total waiting time
Waiting time
stochastic
model
Waiting time
deterministic
model
Capacity overload
Saturation ratio r
))()()(()( xSxLxWaxPI sgsgsgsg
Sgsg
sgsg
Based on the traffic flow model...
Waiting time
Queue length
Number of stops
To be minimized by control model

www.ptvgroup.com Page 22
PTV BALANCE - CONTROL MODEL
METHODOLOGY
Network Wide Optimization of “Green Waves” Based on Genetic
Algorithms (GA)
Mimicking the evolutionary process of nature
Heuristic optimization with a wide number of applications
“Smart” Trial and Error
Advantages
Fast search in big solution spaces
Simultaneous optimization of all parameters
Risk of „local optimum" reduced

www.ptvgroup.com Page 23
PTV BALANCE - CONTROL MODEL
CAPABILITIES
Mathematically established - genetic algorithms
Simultaneous optimization of split und offset
Optimization of cycle time through choice of signal plan
Network wide assessment of traffic impact
New frame signal plan every 5 minutes
Local adaptation by PTV Epics
Central
Controller
Traffic data Optimized
control parameters
Sensors
(20-60m before
Stopline)
www.ptvgroup.com Page 24
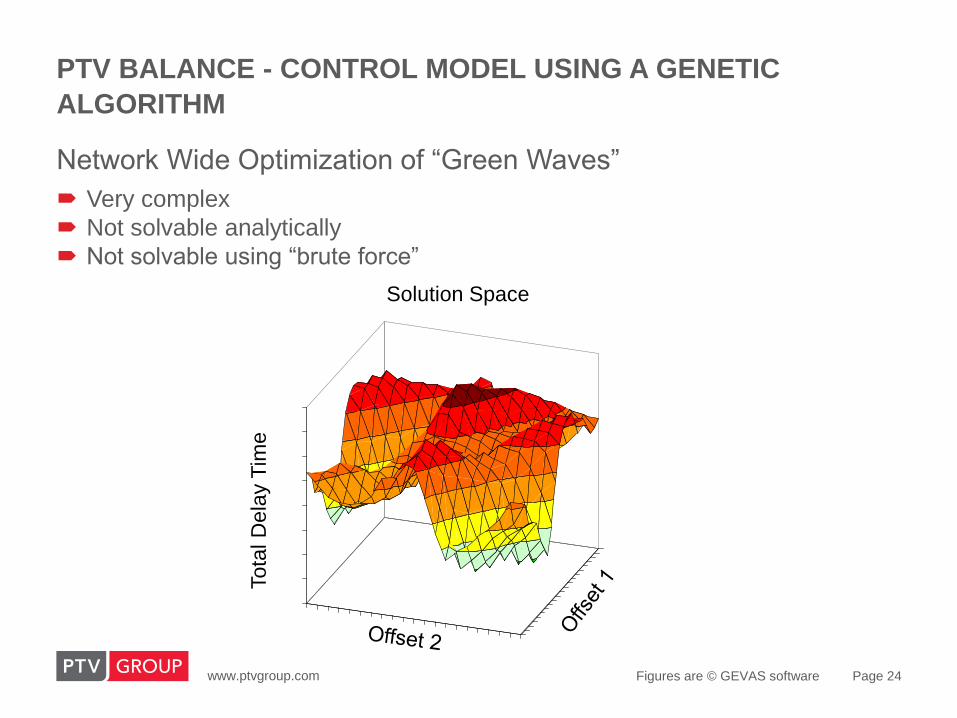
PTV BALANCE - CONTROL MODEL USING A GENETIC
ALGORITHM
Figures are © GEVAS software
Network Wide Optimization of “Green Waves”
Very complex
Not solvable analytically
Not solvable using “brute force”W
art
eze
its
um
me
LösungsraumSolution Space
Tota
l D
ela
y T
ime

www.ptvgroup.com Page 25
WHY ARE WE BETTER?
25
In a nutshell
Actuated and Predictive Control
OD Matrix and Travel Time Estimation
using BT/ GPS/ RFID data/ Wifi
Emissions Optimisation
Multiple Users Multiple Objectives
Any Detection system
Non lane based traffic
Slow moving vehicles
Non Deterministic equations
Evolutionary algorithms larger search
space
Local Adaptation
Latest Traffic Optimisation
Safety Solutions Integrated
Not exclusive to signal manufacturer
Low cost!!! Higher Benefit
We are the LOCAL!

www.ptvgroup.com Page 26
PROPOSED INFRASTRUCTURE LAYOUT WITH ISSD

www.ptvgroup.com Page 27
PROPOSED SYSTEM ARCHITECTURE
www.ptvgroup.com Page 28
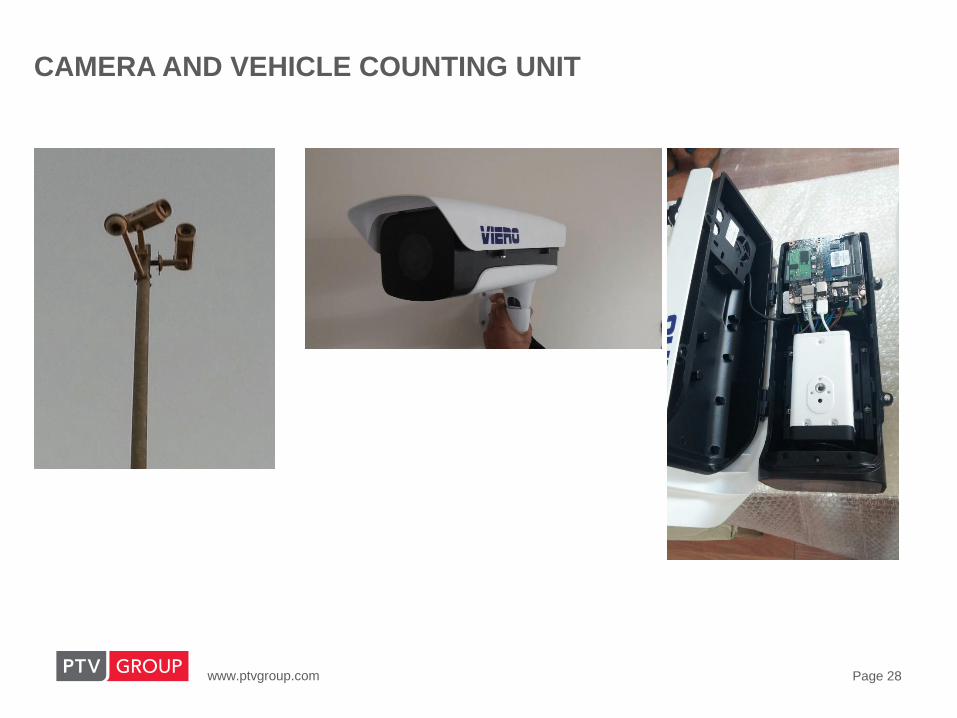
CAMERA AND VEHICLE COUNTING UNIT
www.ptvgroup.com Page 29

www.ptvgroup.com Page 30
INTEGRATED CITRIS EPICS UNIT WITH BLUE TOOTH
DETECTION UNIT WITH SIEMENS MAESTRO CONTROLLERS
www.ptvgroup.com Page 31
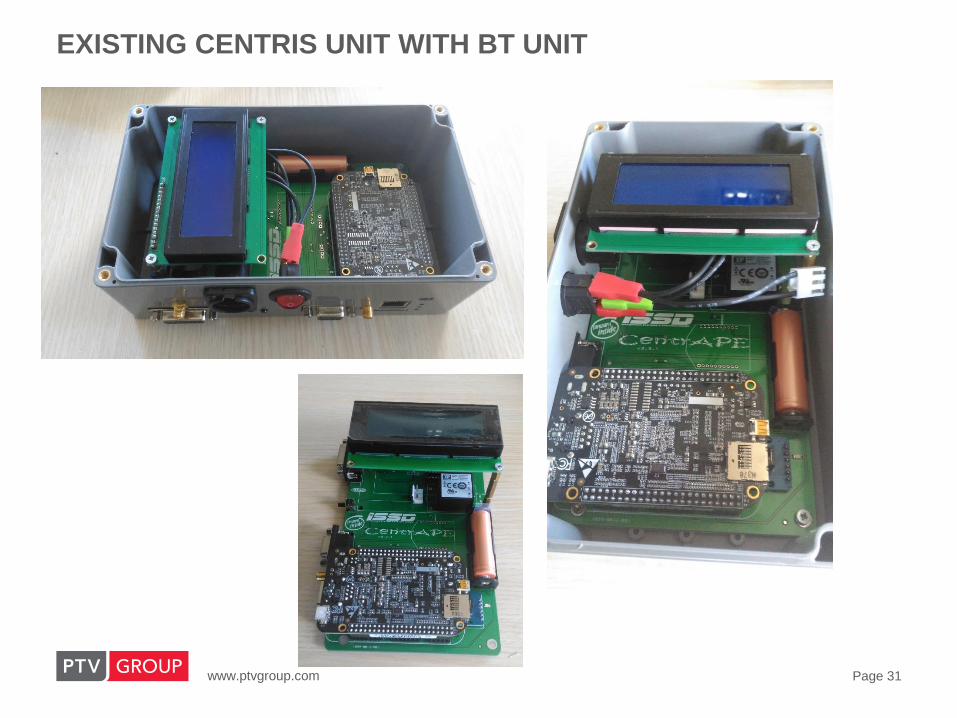
EXISTING CENTRIS UNIT WITH BT UNIT

www.ptvgroup.com Page 32
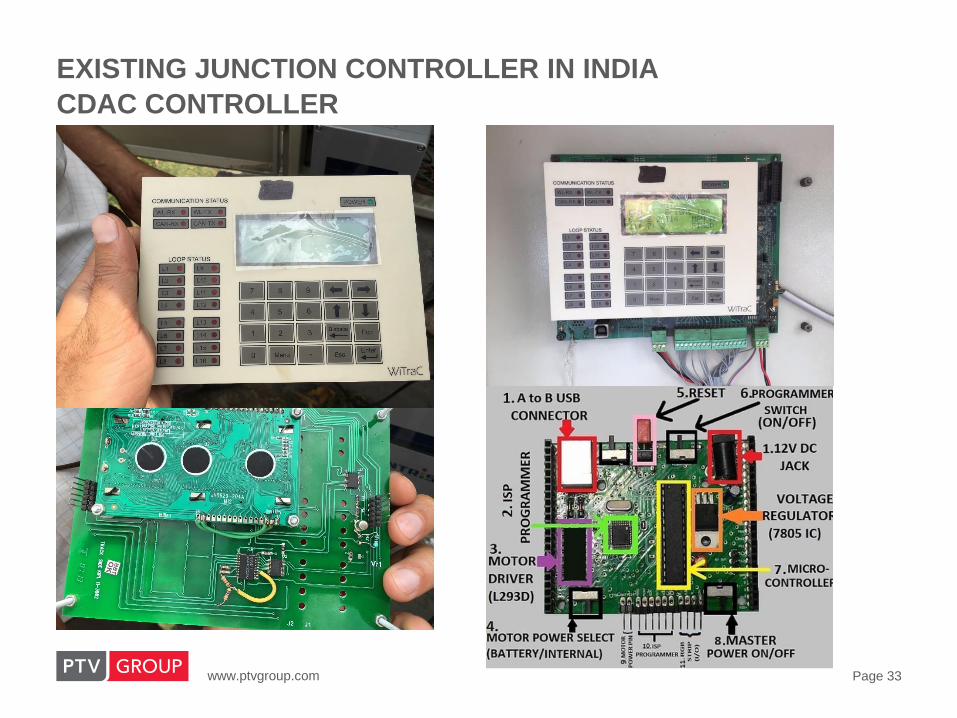
EXISTING JUNCTION CONTROLLER IN INDIA
2 MAIN DEVELOPERS : CDAC (GOVT), CMS
4 MAIN SUPPLIERS: ONRYX (CDAC), KELTRON (CDAC), DIMTS
(CDAC) AND CMS
www.ptvgroup.com Page 33
EXISTING JUNCTION CONTROLLER IN INDIA
CDAC CONTROLLER

www.ptvgroup.com Page 34
EXISTING JUNCTION CONTROLLER IN INDIA
CDAC CONTROLLER
www.ptvgroup.com Page 35
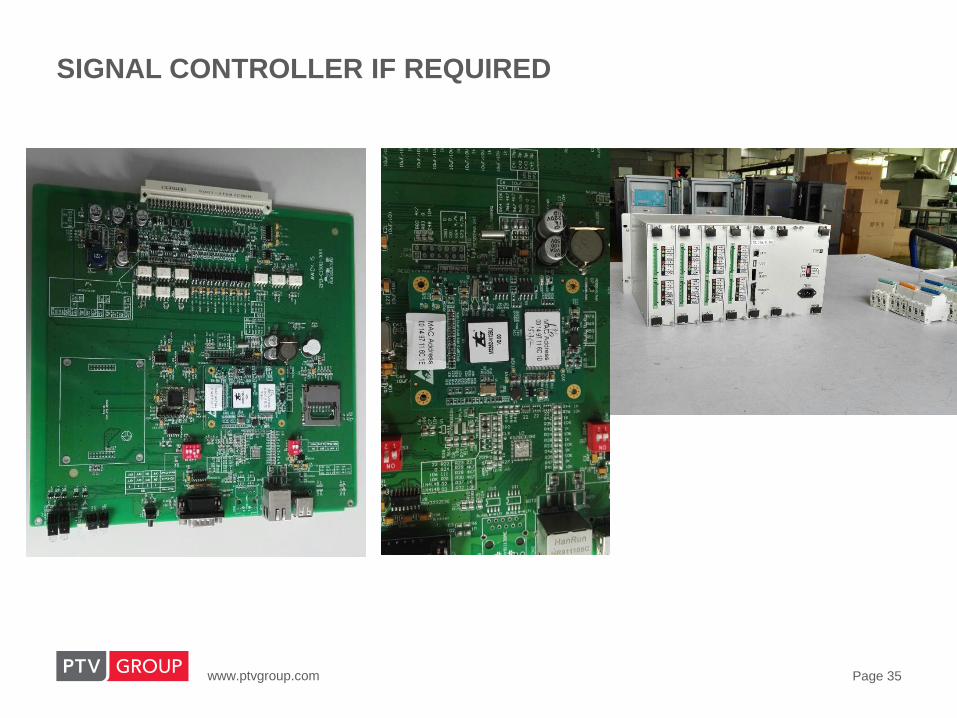
SIGNAL CONTROLLER IF REQUIRED
www.ptvgroup.com Page 36
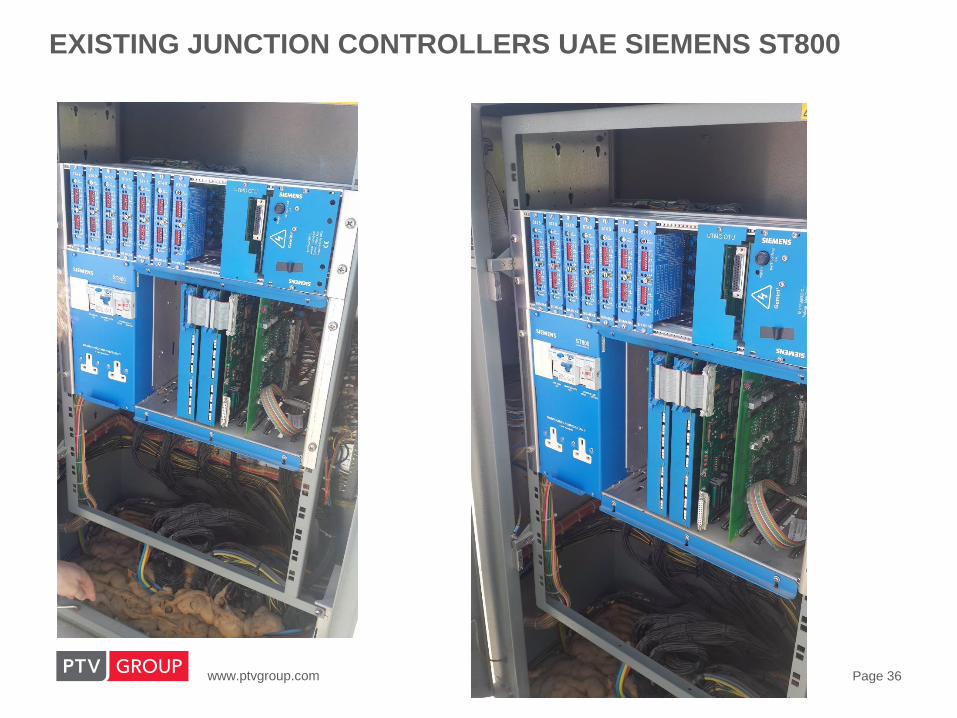
EXISTING JUNCTION CONTROLLERS UAE SIEMENS ST800

www.ptvgroup.com Page 37
MID-LOW COST TRAFFIC CONTROL CENTER

www.ptvgroup.com Page 38
DEMO STUDY SECTION
LODHI ROAD which falls under Zonal D has been selected for a Demo
study on Adaptive Traffic Signal Control.
It is one of the major arterial road in Delhi with 45m ROW.
A stretch of 2.5 km covering 6 signalized intersection is selected.
The predominant land use along the corridor is residential and
Institutional.

www.ptvgroup.com Page 39
DEMO STUDY SECTION

www.ptvgroup.com Page 40
DATA COLLECTION
The primary traffic survey have been conducted for 16 hour time frame.
Turning Movement Count
Travel Time
Speed and Delay
Signal Timing (Morning, Afternoon and Evening peak and Non-peak)
Sample Videos at Every intersection for Driving Behaviour Parameter.

www.ptvgroup.com Page 41
DATA COLLECTION – JUNCTION LEVEL SUMMARY - DELHI
Safdarjung Tomb Junction holds maximum traffic with 96,227 Vehicles
during 16 hours.
The maximum peak hour share of 9.4% was observed at Safdarjung
Tomb Junction.
Junction NameTotal Junction
Volume
Peak Hour Junction Volume
Peak Hour Share
Safdarjung Tomb 96,227 9056 9.4%
Indian Habitat Centre 78,287 6906 8.8%
Dayal Singh College 76,343 6417 8.4%
CGO Complex 70,165 5826 8.3%
Golf Course 62,440 5495 8.8%

www.ptvgroup.com Page 43
BASE MODEL - DELHI
Model was coded between 1715-1830 with 15 minutes buffer time and
results are extracted from 1730 to 1830 and it was validated with
observed data.

www.ptvgroup.com Page 44
BASE MODEL- VALIDATION (TRAFFIC VOLUME) - DELHI
The data are extracted every 15 minutes (900 seconds) from the
simulated model and it is observed that 95.8% of the flow was under <5
GEH value.
GEH Value Percentage
< 5 95.83%> 5 to < 10 4.17%
> 10 0%
www.ptvgroup.com Page 45
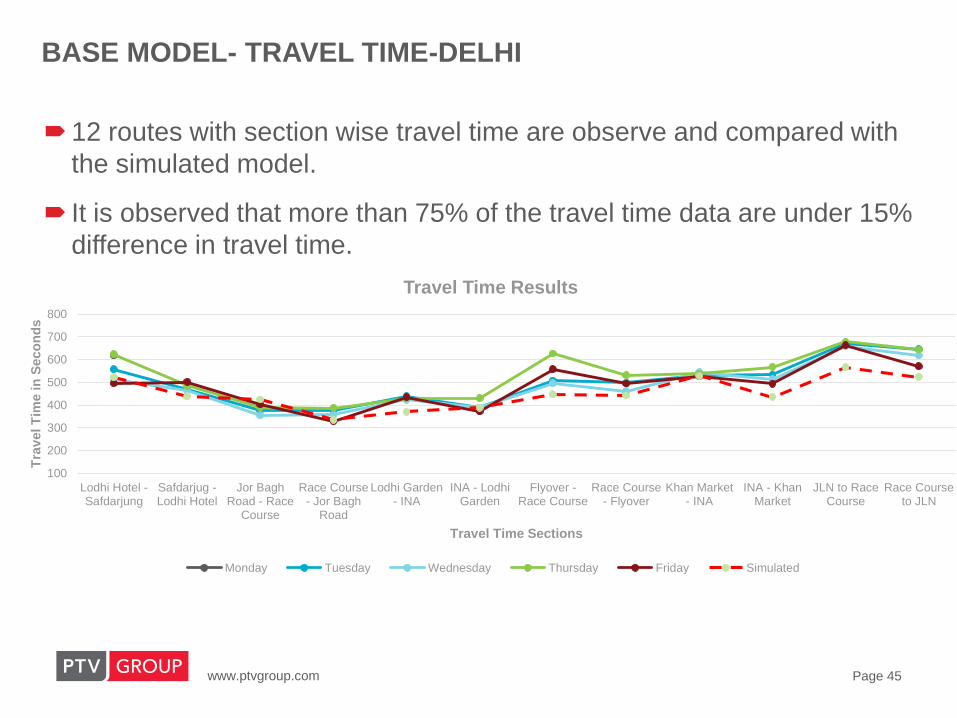
BASE MODEL- TRAVEL TIME-DELHI
12 routes with section wise travel time are observe and compared with
the simulated model.
It is observed that more than 75% of the travel time data are under 15%
difference in travel time.
100
200
300
400
500
600
700
800
Lodhi Hotel -Safdarjung
Safdarjug -Lodhi Hotel
Jor BaghRoad - Race
Course
Race Course- Jor Bagh
Road
Lodhi Garden- INA
INA - LodhiGarden
Flyover -Race Course
Race Course- Flyover
Khan Market- INA
INA - KhanMarket
JLN to RaceCourse
Race Courseto JLN
Tra
vel T
ime in
Seco
nd
s
Travel Time Sections
Travel Time Results
Monday Tuesday Wednesday Thursday Friday Simulated
www.ptvgroup.com Page 46
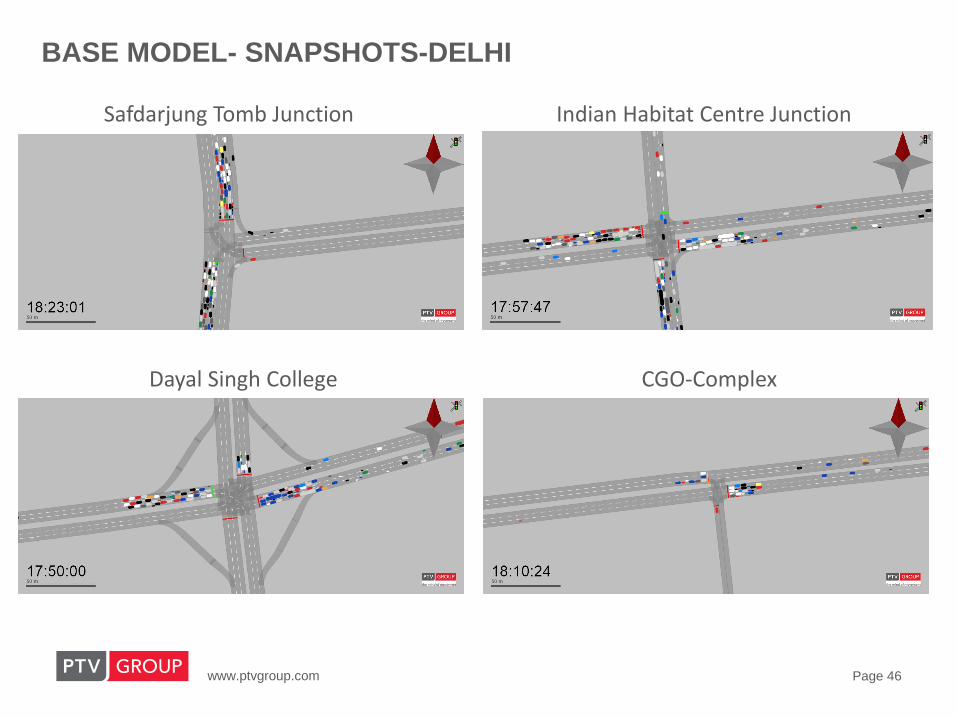
BASE MODEL- SNAPSHOTS-DELHI
Safdarjung Tomb Junction Indian Habitat Centre Junction
Dayal Singh College CGO-Complex
www.ptvgroup.com Page 48
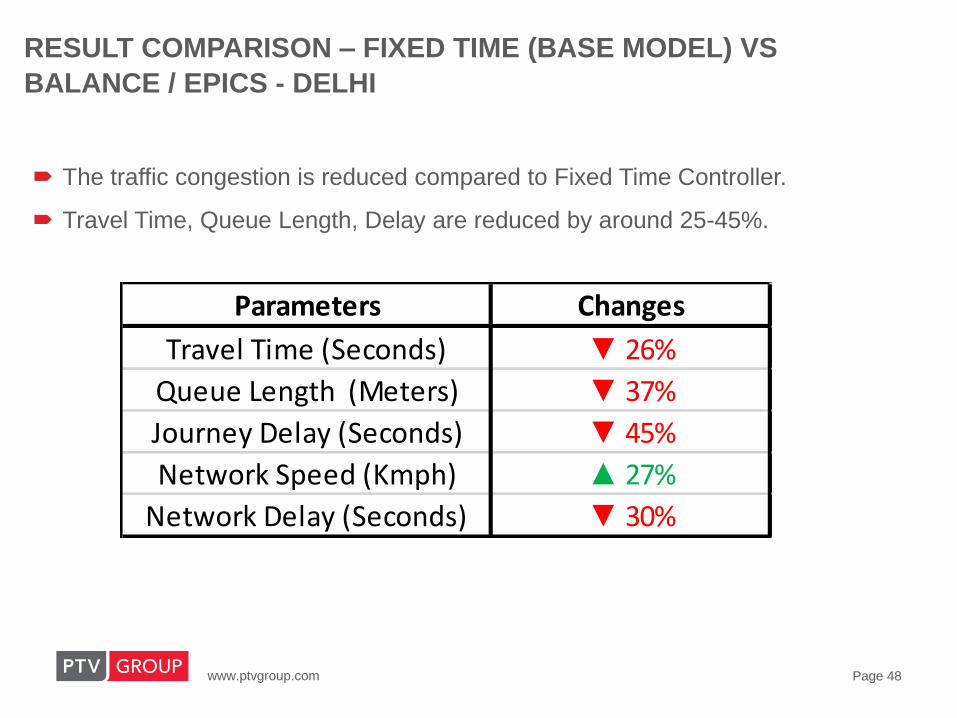
RESULT COMPARISON – FIXED TIME (BASE MODEL) VS
BALANCE / EPICS - DELHI
The traffic congestion is reduced compared to Fixed Time Controller.
Travel Time, Queue Length, Delay are reduced by around 25-45%.
Parameters Changes
Travel Time (Seconds) ▼ 26%
Queue Length (Meters) ▼ 37%
Journey Delay (Seconds) ▼ 45%
Network Speed (Kmph) ▲ 27%
Network Delay (Seconds) ▼ 30%

www.ptvgroup.com Page 49
RESULT COMPARISON – TRAVEL TIME-DELHI
Travel Time from all the observed journey routes are decreased by 26%
compared to Fixed Time Controller.
100
200
300
400
500
600
700
Lodhi Hotel -Safdarjung
Safdarjug -Lodhi Hotel
Jor BaghRoad - Race
Course
Race Course- Jor Bagh
Road
Lodhi Garden- INA
INA - LodhiGarden
Flyover -Race Course
Race Course- Flyover
Khan Market- INA
INA - KhanMarket
JLN to RaceCourse
Race Courseto JLN
Tra
vel T
ime in
Seco
nd
s
Travel Time Sections
Travel Time Comparison
Fixed Time Observed Simulated Balance Results

www.ptvgroup.com Page 50
RESULT COMPARISON – AVERAGE QUEUE LENGTH-DELHI
An average queue length is decreased by 37% compared to base model.
At JorBagh Post Office, IHC Junction, Dayal Singh College junction queue
lenght is reduced by 50%.
0
10
20
30
40
50
60
70
80
Safdarjung Tomb JorBagh Po IHC Dayal Singh College CGO Golf Course
Mete
rs
Average Queue Length
Base Model Balance

www.ptvgroup.com Page 51
RESULT COMPARISON – AVERAGE DELAY-DELHI
The average journey delay from the Balance model is 45% decrease from the
base model.
0
50
100
150
200
250
300
350
400
Safdarjug -Lodhi Hotel
Lodhi Hotel -Safdarjung
Race Course- Jor Bagh
Road
Jor BaghRoad - Race
Course
INA - LodhiGarden
LodhiGarden - INA
Race Course- Flyover
Flyover -Race Course
INA - KhanMarket
Khan Market- INA
Race Courseto JLN
JLN to RaceCourse
Seconds
Average Delay
Base Model Balance

www.ptvgroup.com Page 52
RESULT COMPARISON – NETWORK PERFORMANCE-DELHI
From 99 seconds to 69 sec average network delay is observed from balance
model.
Overall network speed has been increased from 19 mph to 24 kmph
Base Model
Balance
0.0
5.0
10.0
15.0
20.0
25.0
30.0
Speed (
km
ph)
Average Network Speed
Base Model
Balance
0
10
20
30
40
50
60
70
80
90
100
Seconds
Average Network Delay/Vehicle
www.ptvgroup.com Page 53
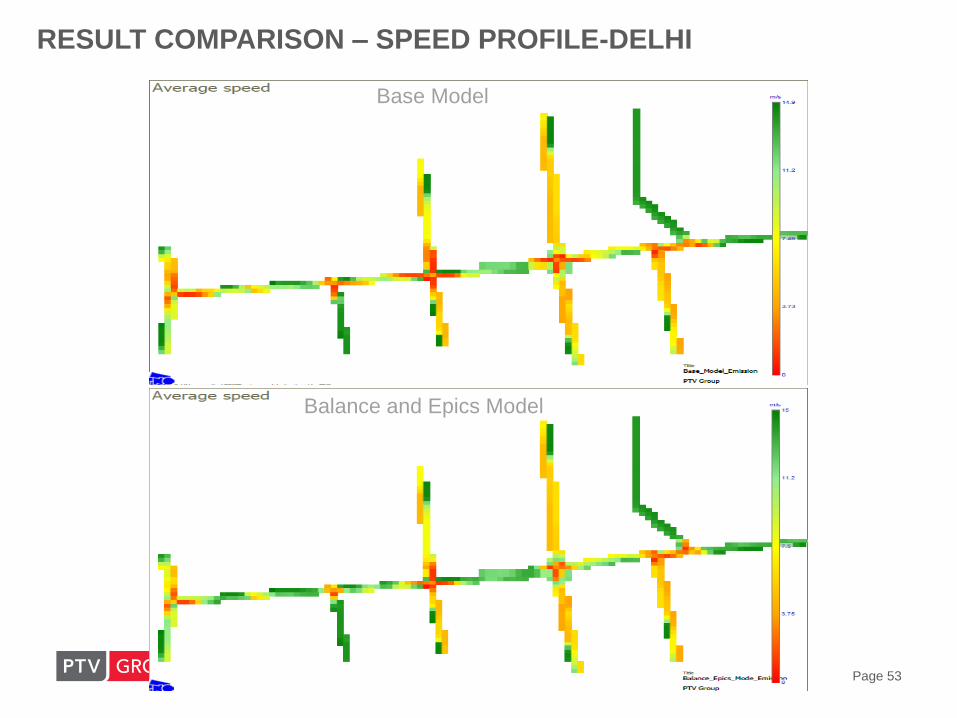
RESULT COMPARISON – SPEED PROFILE-DELHI
Balance and Epics Model
Base Model

www.ptvgroup.com Page 54
RESULT COMPARISON – EMISSION ANALYSIS-DELHI
Classes Vehicles Co2 (Kg) Nox (g) PM10 (g)
Light Duty City 2013Private
Vehicles▼13.6% ▼11.3% ▼14.9%
HD Medium City 2013 Buses ▼8.3% ▼8.6% ▼7.1%
HD Heavy City 2013Commercial
Vehicle▼6.5% ▼2.7% ▼10.7%
The vehicles are classified into Light, Medium and Heavy Duty vehicles.
Air quality in Delhi can be improved by 10%-15% by smart signaling.
Predominant AQI like Co2, Nox and PM10 has a significant reduction.
Emission per Km

www.ptvgroup.com Page 55
PROJECT BACKGROUND - PUNE
Pune is the second largest city in the state of Maharashtra next to its
Capital Mumbai. Pune is spread over an area of 479 km2
Vehicle density in Pune is 1014 vehicle/km.
Total length of road in Pune is same as Chennai 1800 km within its
boundary.
Pune have 2.8 million registered vehicles. Two-Wheeler accounts 8%
annual growth rate followed by Car.
Pune have more than 350 signalized intersections with fixed time for
different peaks and non-peak hours.

www.ptvgroup.com Page 56
DEMO STUDY SECTION - PUNE
Karve Road was selected for a Demo study on Adaptive Traffic Signal
Control.
It is one of the major daily commuting road in Pune.
A stretch of 3.2 km covering 10 signalized intersection is selected.
The predominant land use along the corridor is commercial.

www.ptvgroup.com Page 57
DEMO STUDY SECTION - PUNE
www.ptvgroup.com Page 58
DATA COLLECTION
The primary traffic survey have been conducted for 16 hour time frame.
Turning Movement Count
Travel Time
Speed and Delay
Signal Timing (Morning, Afternoon and Evening peak and Non-peak)
Sample Videos at Every intersection for Driving Behaviour Parameter.
www.ptvgroup.com Page 59
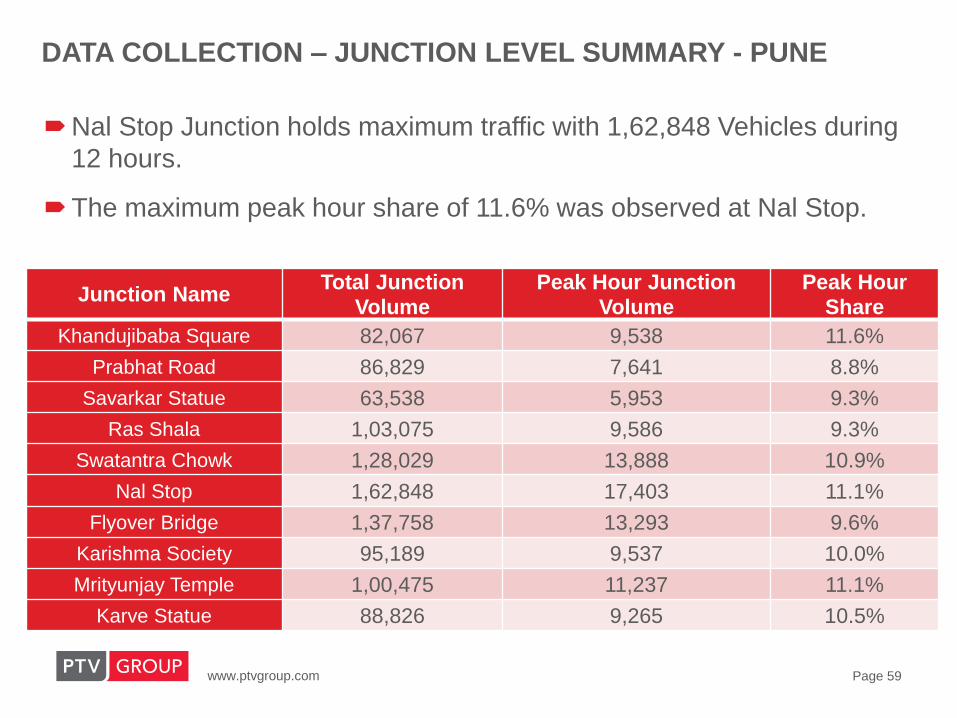
DATA COLLECTION – JUNCTION LEVEL SUMMARY - PUNE
Nal Stop Junction holds maximum traffic with 1,62,848 Vehicles during
12 hours.
The maximum peak hour share of 11.6% was observed at Nal Stop.
Junction NameTotal Junction
Volume
Peak Hour Junction
Volume
Peak Hour
Share
Khandujibaba Square 82,067 9,538 11.6%
Prabhat Road 86,829 7,641 8.8%
Savarkar Statue 63,538 5,953 9.3%
Ras Shala 1,03,075 9,586 9.3%
Swatantra Chowk 1,28,029 13,888 10.9%
Nal Stop 1,62,848 17,403 11.1%
Flyover Bridge 1,37,758 13,293 9.6%
Karishma Society 95,189 9,537 10.0%
Mrityunjay Temple 1,00,475 11,237 11.1%
Karve Statue 88,826 9,265 10.5%

www.ptvgroup.com Page 61
BASE MODEL - PUNE
Model was coded between 1800-1915 with 15 minutes buffer time and
results are extracted from 1815 to 1915 and it was validated with
observed data.
www.ptvgroup.com Page 62
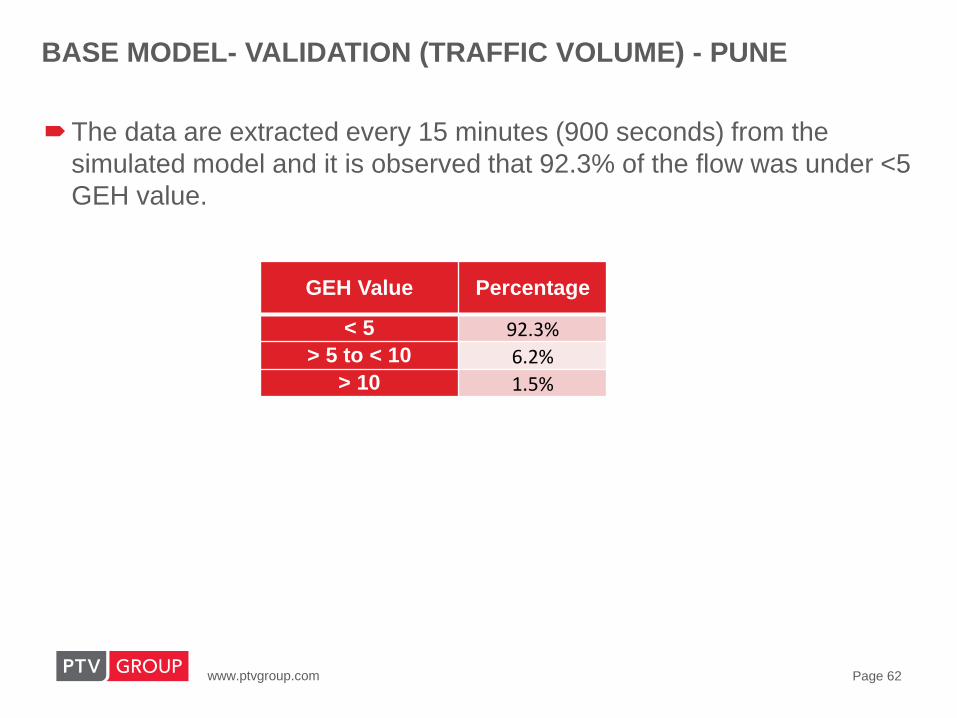
BASE MODEL- VALIDATION (TRAFFIC VOLUME) - PUNE
The data are extracted every 15 minutes (900 seconds) from the
simulated model and it is observed that 92.3% of the flow was under <5
GEH value.
GEH Value Percentage
< 5 92.3%> 5 to < 10 6.2%
> 10 1.5%
www.ptvgroup.com Page 63
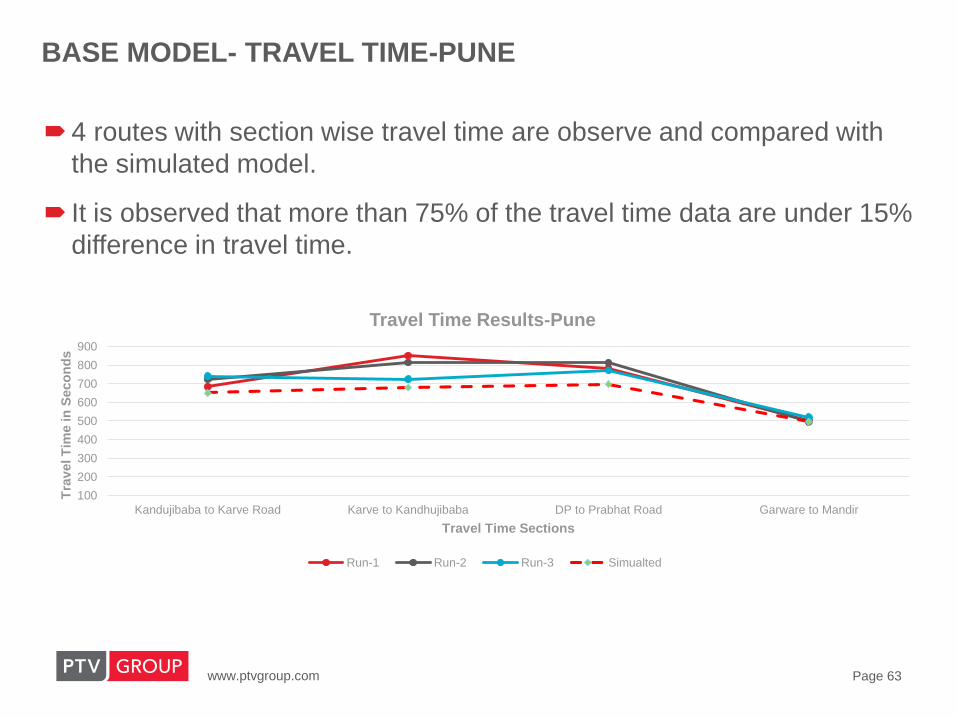
BASE MODEL- TRAVEL TIME-PUNE
4 routes with section wise travel time are observe and compared with
the simulated model.
It is observed that more than 75% of the travel time data are under 15%
difference in travel time.
100
200
300
400
500
600
700
800
900
Kandujibaba to Karve Road Karve to Kandhujibaba DP to Prabhat Road Garware to Mandir
Tra
vel T
ime in
Seco
nd
s
Travel Time Sections
Travel Time Results-Pune
Run-1 Run-2 Run-3 Simualted
www.ptvgroup.com Page 64
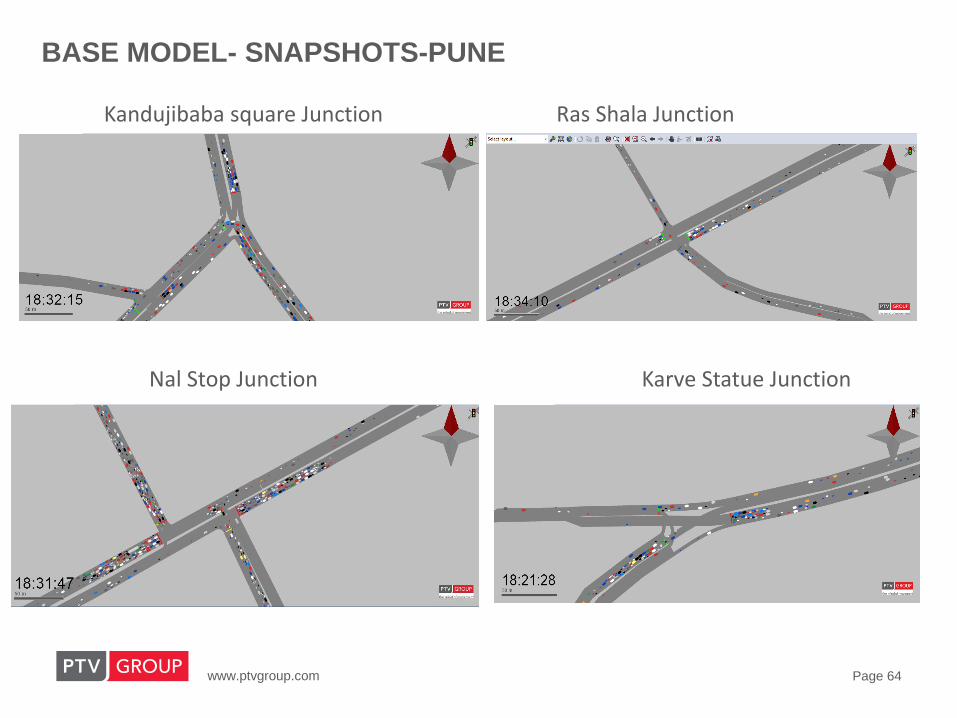
BASE MODEL- SNAPSHOTS-PUNE
Kandujibaba square Junction Ras Shala Junction
Nal Stop Junction Karve Statue Junction
www.ptvgroup.com Page 66
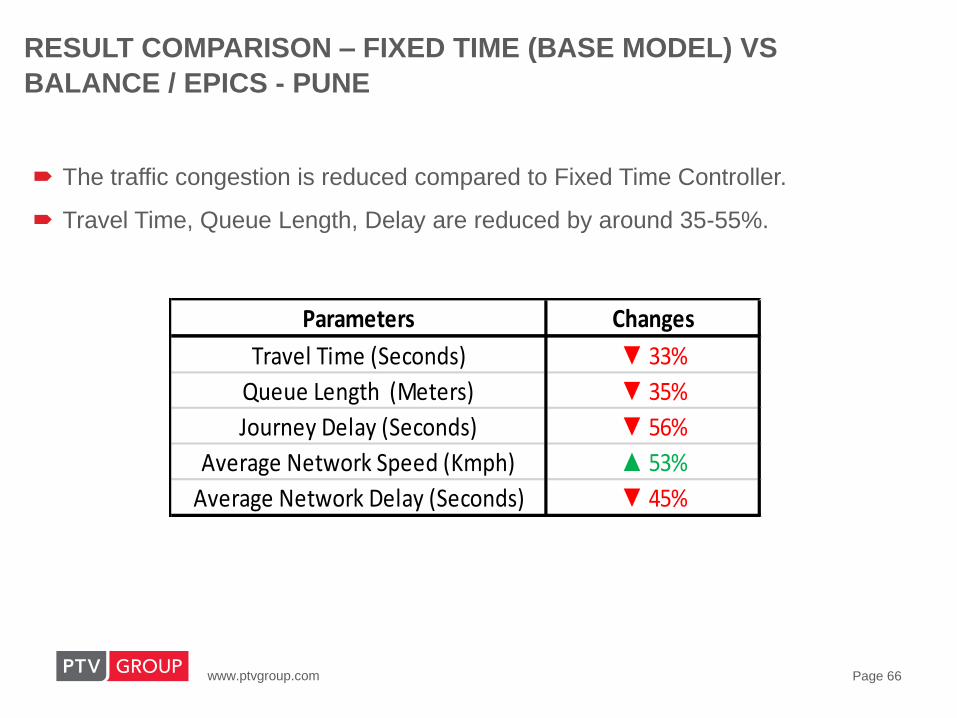
RESULT COMPARISON – FIXED TIME (BASE MODEL) VS
BALANCE / EPICS - PUNE
The traffic congestion is reduced compared to Fixed Time Controller.
Travel Time, Queue Length, Delay are reduced by around 35-55%.
Parameters Changes
Travel Time (Seconds) ▼ 33%
Queue Length (Meters) ▼ 35%
Journey Delay (Seconds) ▼ 56%
Average Network Speed (Kmph) ▲ 53%
Average Network Delay (Seconds) ▼ 45%

www.ptvgroup.com Page 67
RESULT COMPARISON – TRAVEL TIME-PUNE
Travel Time from all the observed journey routes are decreased by 33%
compared to Fixed Time Controller.
100
200
300
400
500
600
700
800
900
Kandujibaba to Karve Road Karve to Kandhujibaba DP to Prabhat Road Garware to Mandir
Tra
vel T
ime in
Seco
nd
s
Travel Time Sections
Travel Time Comparison Results-Pune
Observed Average Simualted Balance
www.ptvgroup.com Page 68
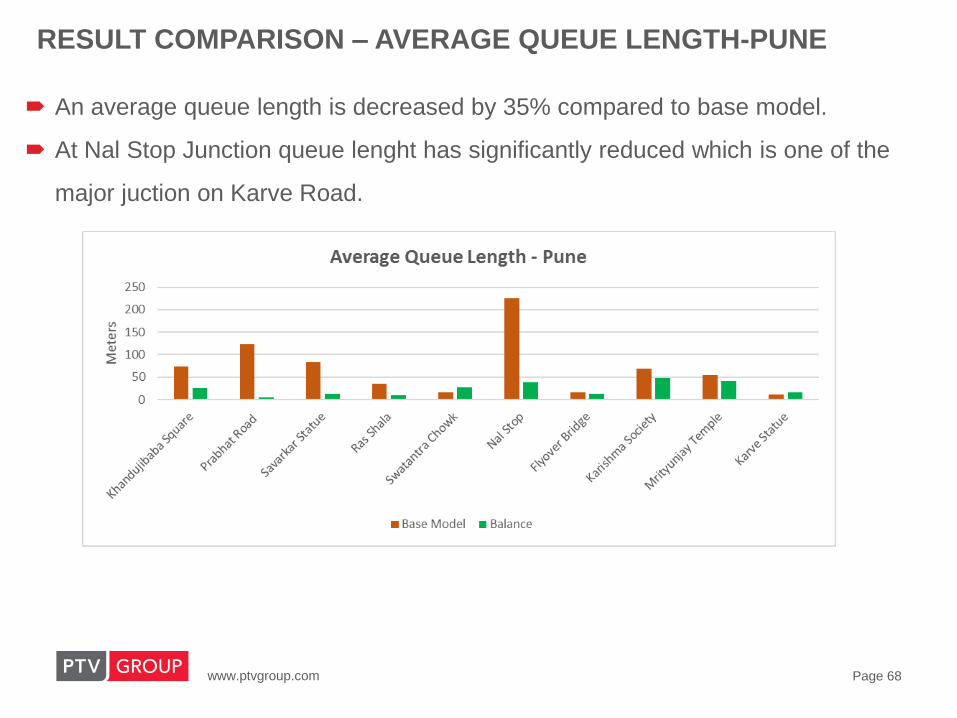
RESULT COMPARISON – AVERAGE QUEUE LENGTH-PUNE
An average queue length is decreased by 35% compared to base model.
At Nal Stop Junction queue lenght has significantly reduced which is one of the
major juction on Karve Road.
www.ptvgroup.com Page 69
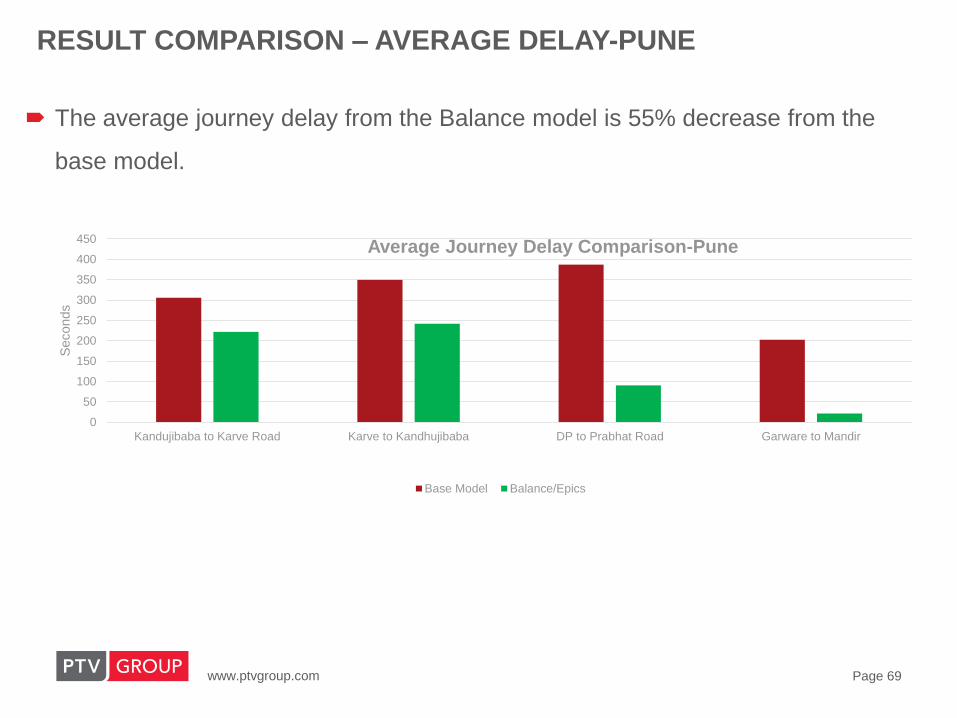
RESULT COMPARISON – AVERAGE DELAY-PUNE
The average journey delay from the Balance model is 55% decrease from the
base model.
0
50
100
150
200
250
300
350
400
450
Kandujibaba to Karve Road Karve to Kandhujibaba DP to Prabhat Road Garware to Mandir
Seconds
Average Journey Delay Comparison-Pune
Base Model Balance/Epics

www.ptvgroup.com Page 70
RESULT COMPARISON – NETWORK PERFORMANCE-PUNE
From 160 seconds to 90 sec average network delay is observed from balance
model.
Overall network speed has been increased from 18 mph to 28 kmph
Base Model
Balance
0
20
40
60
80
100
120
140
160
180
Seconds
Average Network Delay/Vehicle-Pune
Base Model
Balance
0.0
5.0
10.0
15.0
20.0
25.0
30.0
Speed (k
mph)
Average Network Speed-Pune

www.ptvgroup.com Page 71
RESULT COMPARISON – FIXED TIME (BASE MODEL) VS BALANCE /
EPICS
Parameters Changes
Travel Time (Seconds) ▼ 33%
Queue Length (Meters) ▼ 35%
Journey Delay (Seconds) ▼ 56%
Average Network Speed (Kmph) ▲ 53%
Average Network Delay (Seconds) ▼ 45%
PUNE
Parameters Changes
Travel Time (Seconds) ▼ 26%
Queue Length (Meters) ▼ 37%
Journey Delay (Seconds) ▼ 45%
Network Speed (Kmph) ▲ 27%
Network Delay (Seconds) ▼ 30%
DELHI

www.ptvgroup.com Page 72
www.ptvgroup.com Page 73
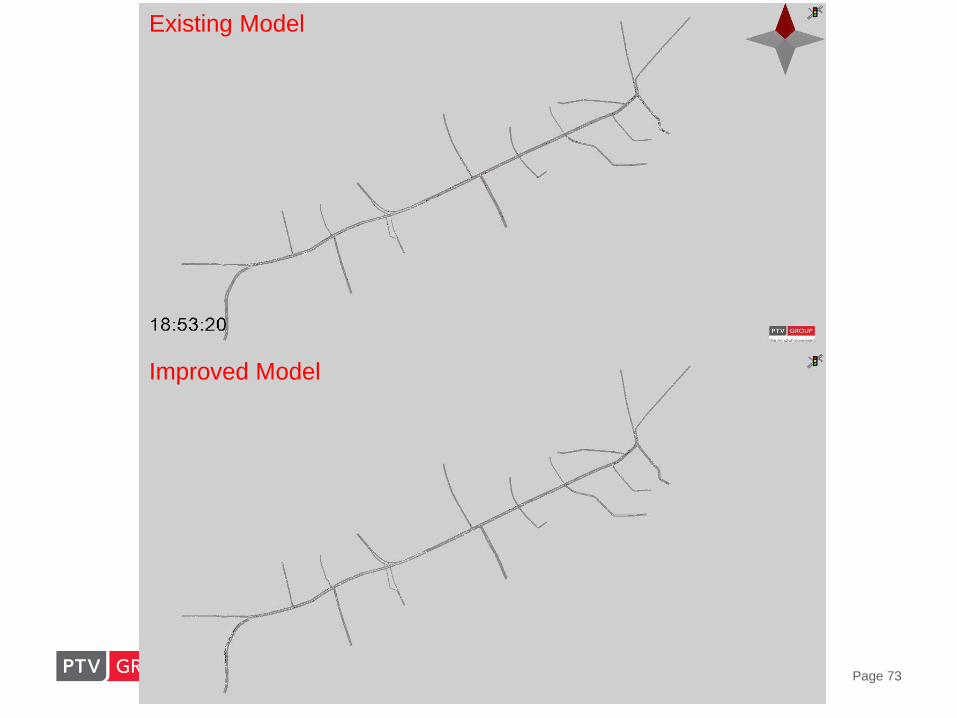
Existing Model
Improved Model
www.ptvgroup.com Page 74
Economic benefits of implementing such a signal optimisation system are
significant
Using the results obtained in the Lodhi Road pilot corridor, the economic
impact of PTV Balance+Epics system being implemented across 857
signalised junctions in Delhi can be estimated
Annual CO2 savings across the network is estimated to be USD $66 million or
INR 440 Crores per year.
Yearly Savings of US$2.7 Billion or INR 1,800 Crores per year in reducing
traffic congestion including travel time congestion for Citizens
TOTAL COST SAVINGS IF PTV BALANCE + EPICS IS
IMPLEMENTED IN DELHI

www.ptvgroup.com Page 75
PTV SOFTWARE
SMART TRAFFIC SOLUTIONS FOR SMART CITIES
THANK YOU!