smart frequency control - national grid...frequency response is less well known and this project...
TRANSCRIPT
Event Detection Development Report
Copyright © 2015, Alstom. All rights reserved. 1
Public
Document Type Technical Report for Knowledge Dissemination
Title Event Detection
SMART Frequency Control
Synopsis This document describes the principles behind the event detection algorithms specifically for the SMART Frequency Control project. The document also describes results of the algorithm when used with simulated test cases.
Document Status Public
Document ID NG-EFCC-SPEC-043
Date 02/10/2015
Alstom Grid - Psymetrix
1 Tanfield Edinburgh EH3 5DA Scotland, UK
General
Telephone Fax Support
Telephone Email
+44 (0)131 510 0700 +44 (0)131 555 5185 +44 (0)131 510 0709 [email protected]

Event Detection Development Report
Copyright © 2015, Alstom. All rights reserved. 2
Public
Document Control
Prepared by: Dr. Seán Norris, Kyriaki Maleka
Reviewed by: Dr. Oleg Bagleybter
Approved by: Dr. Renan Giovanini
Document Change History
Event_detection_public_release_v1c.docx 02/10/2015 Version 1 for public release
No Part of this document may be reproduced or transmitted in any form or by any means, electronic or mechanical, for any purpose without the express written permission of Alstom
Event Detection Development Report
Copyright © 2015, Alstom. All rights reserved. 3
Public
Table of Contents
1 Introduction ......................................................................................................................... 4
1.1 Background ........................................................................................................................... 4
1.2 Problem Description.............................................................................................................. 4
1.3 Algorithm Objectives ............................................................................................................. 5
2 High-level Concept Overview ............................................................................................ 6
3 Requirements .................................................................................................................... 10
3.1 High-Level Requirements ................................................................................................... 10
3.2 Events requiring Detection .................................................................................................. 10
3.3 Events not required Detection ............................................................................................ 10
3.4 Data Quality ........................................................................................................................ 11
3.5 Downstream Application Requirements ............................................................................. 11
3.6 Networking Requirements .................................................................................................. 11
4 Principle ............................................................................................................................. 12
4.1 Principle of Operation ......................................................................................................... 12
5 Algorithm Description ...................................................................................................... 14
5.1 Implementing Aggregation .................................................................................................. 14 5.1.1 Removing Oscillations ........................................................................................................ 15 5.1.2 Fault Handling ..................................................................................................................... 16 5.1.3 Regional Aggregator ........................................................................................................... 17 5.1.4 System Aggregator ............................................................................................................. 18
5.2 Event Detection ................................................................................................................... 19 5.2.1 Event Detection Algorithm .................................................................................................. 19 5.2.2 Frequency Gradient Calculation ......................................................................................... 20
6 Results from Simulated Test Cases................................................................................ 21
6.1 Description of Test Model ................................................................................................... 21
6.2 Simulated Test Cases ......................................................................................................... 21
6.3 Results from test cases ...................................................................................................... 21
7 Discussion ......................................................................................................................... 23
7.1 Implementation ................................................................................................................... 23
7.2 Discussion of Results ......................................................................................................... 23
7.3 Next Stages ........................................................................................................................ 23
8 Conclusions ...................................................................................................................... 24
9 Abbreviations .................................................................................................................... 25
10 Terminology ...................................................................................................................... 26
11 References ......................................................................................................................... 27
Event Detection Development Report
Copyright © 2015, Alstom. All rights reserved. 4
Public
1 Introduction
1.1 Background
Alstom Grid (AG) is a partner with National Grid (NG), Flexitricity (FLX), Belectric (Bel), Centrica (Cen), University of Strathclyde (UoS) and the University of Manchester (UoM) to deliver the SMART Frequency Control (SFC) Project.
Alstom has committed to delivering consulting services and providing support for project partner demonstrations, and will contribute development of a Monitoring and Control System (MCS) platform (both hardware and software applications). Alstom have proposed a distributed control scheme for the purposes of SFC which offers greater resilience and minimal latency in delivering control instructions. Alstom are delivering a hardware platform, PhasorController, and SFC applications which will be implemented on the PhasorController. This document describes one such application: the event detection. . Information on the tests and the results are also described which were performed in a simulated model environment.
The content of this document provides a summary of the event detection algorithms created for the SFC project, which is covered under patent application (UK, 2015).
1.2 Problem Description
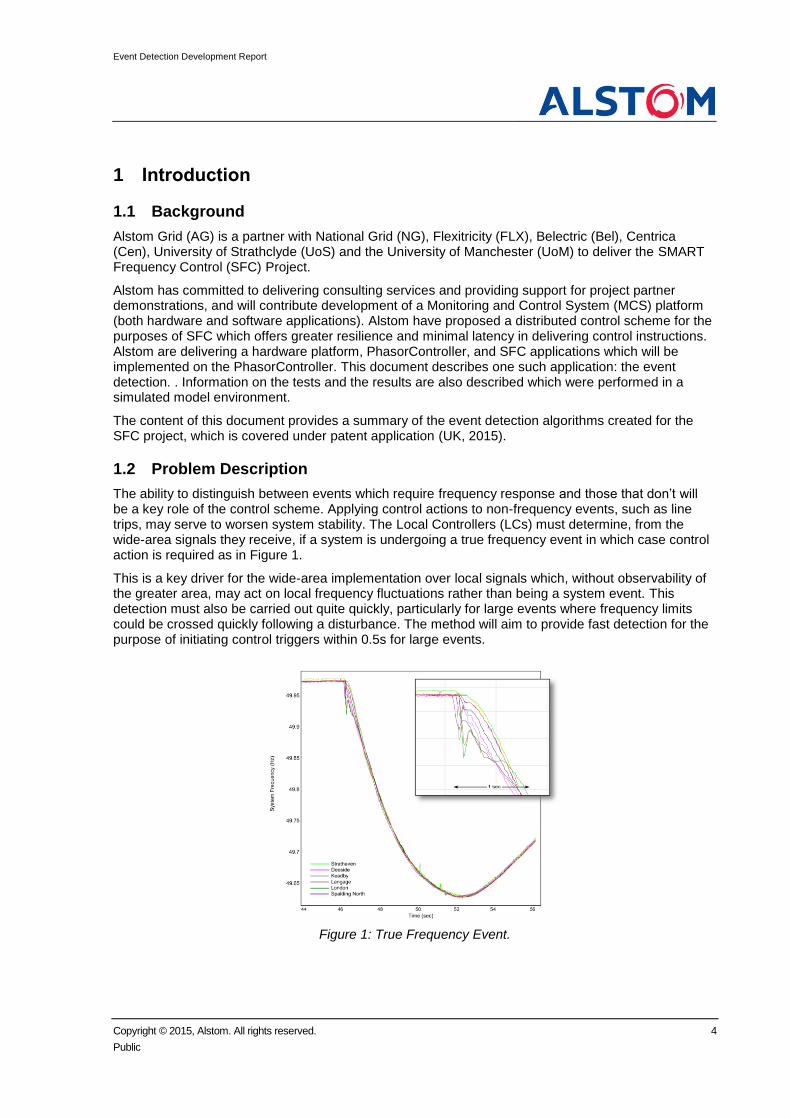
The ability to distinguish between events which require frequency response and those that don’t will be a key role of the control scheme. Applying control actions to non-frequency events, such as line trips, may serve to worsen system stability. The Local Controllers (LCs) must determine, from the wide-area signals they receive, if a system is undergoing a true frequency event in which case control action is required as in Figure 1.
This is a key driver for the wide-area implementation over local signals which, without observability of the greater area, may act on local frequency fluctuations rather than being a system event. This detection must also be carried out quite quickly, particularly for large events where frequency limits could be crossed quickly following a disturbance. The method will aim to provide fast detection for the purpose of initiating control triggers within 0.5s for large events.
Figure 1: True Frequency Event.

Event Detection Development Report
Copyright © 2015, Alstom. All rights reserved. 5
Public
1.3 Algorithm Objectives
The key objectives of this project in terms of Event Detection are to:
Detect, as quickly as possible, events which warrant a system response
Not trigger on non-frequency events such as faults or line trips

Event Detection Development Report
Copyright © 2015, Alstom. All rights reserved. 6
Public
2 High-level Concept Overview
In a power system, the system frequency is governed by the generation and load balance, where a balanced system would operate close to 50Hz (in the UK). For conventional generation such as those driven by steam turbines or hydro-turbines, the 50Hz frequency is directly related to the speed of rotation of the generators. These types of conventional generation have generally been associated with having large inertia, due to the rotating mass of the turbines and large generator rotors. When a generator is lost from the system, there will be an imbalance between the generation and load, excess load. In the initial moments after the generator loss, there will be increased power demand from the remaining generators where the energy is extracted from the kinetic energy of the rotating machines. As the machines release the kinetic energy they will start to slow down and due to the relationship between the speed of rotation and the system frequency, the system frequency will start to fall. The rate at which this frequency falls depends on a number of factors including the system inertia and the size of the generation loss. For a generator with high inertia, it will not slow down as quickly compared to those with lower inertias; therefore for a system with more high-inertia generators, the system frequency will not fall as quickly.
When the frequency of the system starts to drop there are a number of measures in place to recover or limit the effects of the drop. The first is primary frequency response provided through generator governor controls which will increase the mechanical power input to the generator and thus produce more electrical power. This can be in the form of opening a steam valve further allowing more steam through the turbine. However, governor response takes time as it is a mechanical action, when the extra steam flows into the turbines, they will start to accelerate but this takes time due to the inertia. It typically takes 2s before the governors start to have a noticeable effect on the frequency. An emergency method of frequency response is load-shedding, when the frequency drops to emergency limits as shown in Figure 2, load in the system automatically trips with the aim of reducing the generation load imbalance. Load shedding is typically done in a staged approach depending on the severity of the event.
Figure 2 System Frequency Limits
Up to now, the level of inertia in the system has been adequate to prevent the frequency dropping too quickly to the emergency limits when the largest conceivable loss occurs, allowing time for governors to act. However, as the expected levels of inertia are expected to reduce, it means that frequency will start to fall faster for an equivalent loss and the risk of hitting the emergency limits before governors can respond becomes much more likely.
The SFC project aims to tackle this problem of reduced inertia by using non-conventional resources for frequency response such as battery/PV, Demand Side Response (DSR), wind and fast-acting CCGT. These resources have the potential to respond much faster than the conventional governor controlled generation, hence arresting the frequency sooner before it reaches the emergency limits. While the use of governor control is well established, the use of non-conventional resources for
Event Detection Development Report
Copyright © 2015, Alstom. All rights reserved. 7
Public
frequency response is less well known and this project aims to design a control scheme by which to use such resources for fast frequency response.
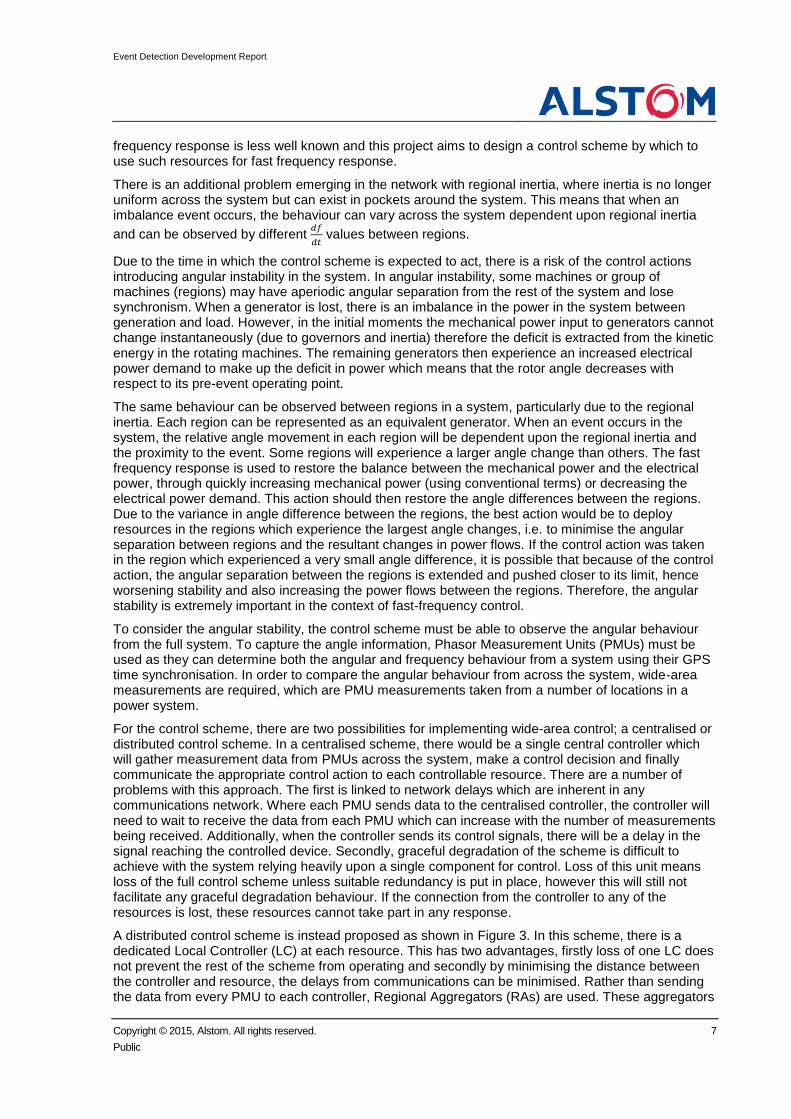
There is an additional problem emerging in the network with regional inertia, where inertia is no longer uniform across the system but can exist in pockets around the system. This means that when an imbalance event occurs, the behaviour can vary across the system dependent upon regional inertia
and can be observed by different 𝑑𝑓
𝑑𝑡 values between regions.
Due to the time in which the control scheme is expected to act, there is a risk of the control actions introducing angular instability in the system. In angular instability, some machines or group of machines (regions) may have aperiodic angular separation from the rest of the system and lose synchronism. When a generator is lost, there is an imbalance in the power in the system between generation and load. However, in the initial moments the mechanical power input to generators cannot change instantaneously (due to governors and inertia) therefore the deficit is extracted from the kinetic energy in the rotating machines. The remaining generators then experience an increased electrical power demand to make up the deficit in power which means that the rotor angle decreases with respect to its pre-event operating point.
The same behaviour can be observed between regions in a system, particularly due to the regional inertia. Each region can be represented as an equivalent generator. When an event occurs in the system, the relative angle movement in each region will be dependent upon the regional inertia and the proximity to the event. Some regions will experience a larger angle change than others. The fast frequency response is used to restore the balance between the mechanical power and the electrical power, through quickly increasing mechanical power (using conventional terms) or decreasing the electrical power demand. This action should then restore the angle differences between the regions. Due to the variance in angle difference between the regions, the best action would be to deploy resources in the regions which experience the largest angle changes, i.e. to minimise the angular separation between regions and the resultant changes in power flows. If the control action was taken in the region which experienced a very small angle difference, it is possible that because of the control action, the angular separation between the regions is extended and pushed closer to its limit, hence worsening stability and also increasing the power flows between the regions. Therefore, the angular stability is extremely important in the context of fast-frequency control.
To consider the angular stability, the control scheme must be able to observe the angular behaviour from the full system. To capture the angle information, Phasor Measurement Units (PMUs) must be used as they can determine both the angular and frequency behaviour from a system using their GPS time synchronisation. In order to compare the angular behaviour from across the system, wide-area measurements are required, which are PMU measurements taken from a number of locations in a power system.
For the control scheme, there are two possibilities for implementing wide-area control; a centralised or distributed control scheme. In a centralised scheme, there would be a single central controller which will gather measurement data from PMUs across the system, make a control decision and finally communicate the appropriate control action to each controllable resource. There are a number of problems with this approach. The first is linked to network delays which are inherent in any communications network. Where each PMU sends data to the centralised controller, the controller will need to wait to receive the data from each PMU which can increase with the number of measurements being received. Additionally, when the controller sends its control signals, there will be a delay in the signal reaching the controlled device. Secondly, graceful degradation of the scheme is difficult to achieve with the system relying heavily upon a single component for control. Loss of this unit means loss of the full control scheme unless suitable redundancy is put in place, however this will still not facilitate any graceful degradation behaviour. If the connection from the controller to any of the resources is lost, these resources cannot take part in any response.
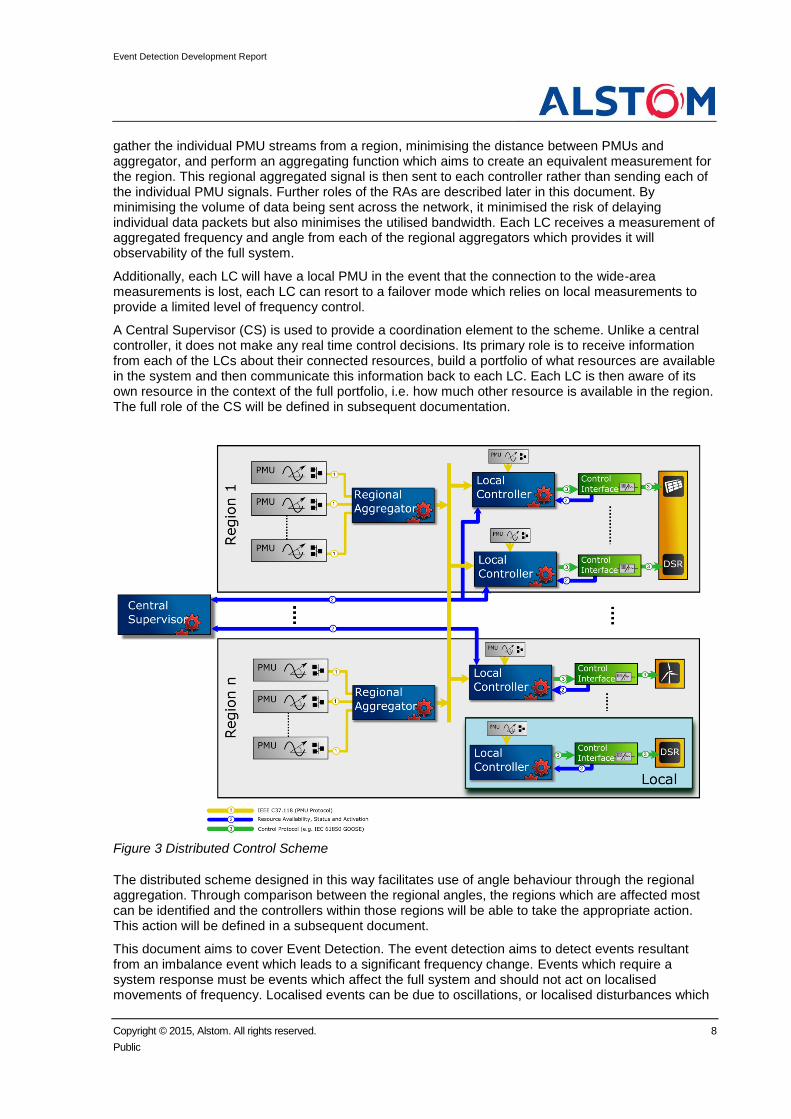
A distributed control scheme is instead proposed as shown in Figure 3. In this scheme, there is a dedicated Local Controller (LC) at each resource. This has two advantages, firstly loss of one LC does not prevent the rest of the scheme from operating and secondly by minimising the distance between the controller and resource, the delays from communications can be minimised. Rather than sending the data from every PMU to each controller, Regional Aggregators (RAs) are used. These aggregators
Event Detection Development Report
Copyright © 2015, Alstom. All rights reserved. 8
Public
gather the individual PMU streams from a region, minimising the distance between PMUs and aggregator, and perform an aggregating function which aims to create an equivalent measurement for the region. This regional aggregated signal is then sent to each controller rather than sending each of the individual PMU signals. Further roles of the RAs are described later in this document. By minimising the volume of data being sent across the network, it minimised the risk of delaying individual data packets but also minimises the utilised bandwidth. Each LC receives a measurement of aggregated frequency and angle from each of the regional aggregators which provides it will observability of the full system.
Additionally, each LC will have a local PMU in the event that the connection to the wide-area measurements is lost, each LC can resort to a failover mode which relies on local measurements to provide a limited level of frequency control.
A Central Supervisor (CS) is used to provide a coordination element to the scheme. Unlike a central controller, it does not make any real time control decisions. Its primary role is to receive information from each of the LCs about their connected resources, build a portfolio of what resources are available in the system and then communicate this information back to each LC. Each LC is then aware of its own resource in the context of the full portfolio, i.e. how much other resource is available in the region. The full role of the CS will be defined in subsequent documentation.
Figure 3 Distributed Control Scheme
The distributed scheme designed in this way facilitates use of angle behaviour through the regional aggregation. Through comparison between the regional angles, the regions which are affected most can be identified and the controllers within those regions will be able to take the appropriate action. This action will be defined in a subsequent document.
This document aims to cover Event Detection. The event detection aims to detect events resultant from an imbalance event which leads to a significant frequency change. Events which require a system response must be events which affect the full system and should not act on localised movements of frequency. Localised events can be due to oscillations, or localised disturbances which

Event Detection Development Report
Copyright © 2015, Alstom. All rights reserved. 9
Public
may not be significant events in the context of a large system. The event detection application is located on each LC where each LC makes an independent decision about when an event is detected however, for each LC which is receiving wide-area signals, they should all share the same input data and should therefore detect an event together (subject to any delays in receiving the data). Given the short time in which to take control in a low inertia scenario, detection must be achieved within a very short time with a target of detecting an event and initiating a control output within 500ms for significant events. This document will describe the methods by which Event detection was developed for SFC.

Event Detection Development Report
Copyright © 2015, Alstom. All rights reserved. 10
Public
3 Requirements
3.1 High-Level Requirements
The event detection algorithm was designed in accordance with a set of requirements which have been created based on the need for faster frequency response due to reduced inertia in the future as presented in EFCC submission document to OFGEM (National Grid, 2014).
Events which require a system response must be events which affect the full system and should not act on localised movements of frequency. Events should therefore be visible by the whole system for it to warrant response. This means that the system frequency should move with a distinct RoCoF value which is observed by all LCs and will be a function of the loss of energy.
A large event in the system is generally well understood from modelling, such as the impact that the largest loss of generation would have. This knowledge of the events which warrant a response will be used to characterise the system to define a threshold RoCoF value for significant events, i.e. those which will require control action. This RoCoF threshold must be configurable within the LC allowing users to define the scale for large events to which it implies.
For the purpose of this report, the following configuration was chosen:
According to the EFCC submission document (National Grid, 2014), from the 2014 Gone Green future energy scenarios (Grid, 2014), large events may lead to a 0.3Hz/s RoCoF from loss of major generation. Events of this nature shall require detection and response from the LC within 500ms. The algorithm must also detect less severe events, but the constraints on detection time shall be reduced.
The detection function must not be triggered by events which are non-frequency events such as faults (e.g. phase-ground, 3 phase-ground, phase to phase) or line trips. Both faults and line trips can have an impact on the frequency but would not require a response from the system. Faults can have similar behaviour to over-frequency events, however after fault clearing the system should stabilise if no generation is lost. The system must be able to detect frequency events which occur after (or during) a fault, such as a generator loss as a result of a fault, and should be detected within 500ms (for large events) after fault clearing or the frequency event occurrence, whichever happens later. Subsequent frequency events after a line/transformer trip must also be detected within 500ms for large events.
3.2 Events requiring Detection
The following events should be detected by the algorithm:
Loss of significant generation1
Loss of significant loads1
Loss of significant generation/load following faults, lines/transformer trips or small generation/load loss
Loss of HVDC interconnectors to other Power Systems
3.3 Events not required Detection
The following events should not be triggered by the event detection algorithm:
Faults (three phase, phase-to-ground etc.)
1 Significant events imply that a measureable change is seen by the system. Based future energy scenarios (Grid,
2014), a large event could result in 0.3Hz/s, a significant event can be set at a value less than this, e.g.
0.2Hz/s. This value shall be configurable within the controller.
Losing a small generator or load may not have a significant impact upon the system and therefore would not, and
should not, be detected. These are defined as < RoCoF threshold. (0.2Hz/s in the above example)

Event Detection Development Report
Copyright © 2015, Alstom. All rights reserved. 11
Public
Line/Transformer trips (which do not lead to significant energy imbalance)
Small generation/load losses (see 1)
Frequency oscillations caused by inter-area or local modes
3.4 Data Quality
The event detection function must be able to handle exceptional data and continue functioning through certain data quality issues. The loss of some PMUs will reduce the observability of the system. The algorithm must be capable of determining if there is sufficient observability for detection.
In the event that connection to the wide-area measurements is lost, event detection must still be possible via the local measurements. In these cases, event detection will be significantly slower due to local signals requiring filtering to remove the local effects oscillations and disturbances which can cause spurious triggering.
3.5 Downstream Application Requirements
It must be possible to identify the affected regions with the information produced by the event detection functions. Initiating control in the locations affected by the disturbance forms a major component of the project proposal.
It must be possible to calculate and continually produce a frequency gradient upon detection of an event which should use suitable methods to provide ‘reasonable’ assessments of the system behaviour. The term ‘reasonable’ describes the trade-off between a fast assessment and an accurate assessment that may be required.
3.6 Networking Requirements
There is a requirement to minimise traffic and network configuration (minimising routing) for scheme robustness and speed. The event detection algorithm must work in a way compatible with minimal data whilst retaining the locational element for downstream logical functions. This translates into a requirement for physical allocation of logical functions on different components within the distributed control scheme.

Event Detection Development Report
Copyright © 2015, Alstom. All rights reserved. 12
Public
4 Principle
4.1 Principle of Operation
In a future Business as Usual (BaU) case, the method will require signals taken from multiple points across the system to achieve system observability, i.e. visibility of system frequency and angular behaviour. To implement this, data aggregation is used, Regional and System as shown in Figure 4. The aggregation is also used to address local and inter-area modes and the locational elements described in section 2: Regional aggregation will gather PMU data from the field directly and perform aggregating functions on the individual PMU streams. It will reduce the effects of local-modes of oscillation with the aim to represent the regions (which should be tightly coupled) by a single equivalent generator. The aggregation will be implemented such that data bandwidth can be minimised. System aggregation will use the individual regional aggregated signals to produce a system equivalent which will reduce the effects of inter-area modes. The aim is to represent the full system as a single equivalent machine in order to focus on system wide events. Through comparison between the system and regional signals, it will be possible to identify the locations which are affected by the disturbance.
Figure 4: Aggregation Flow Chart.
While the event which requires detection must be a system event (an event observed across the full system and not just within single regions), the locational element (information on areas worst affected) must be retained for the later stages of control initiation. Initiating response based on location of the disturbance will be the role of a future control initiation application. However event detection provides the control initiation application with the information required for areas affected by the disturbance based on angle behaviour. The regions will be selected based on network-coupling where elements within a region should be tightly coupled (very difficult to pull apart) – linked to coherent groups of generators. The coupling between regions should be weaker, therefore increased risk of separation. The risk of separation between regions should be more likely than separation within a region due to this weaker coupling and thus forms the objective of the locational response between regions. As the risk is lower within a region, there is less concern about location where resources within regions do not require the locational element as it is anticipated that angle differences will be relatively small between locations in
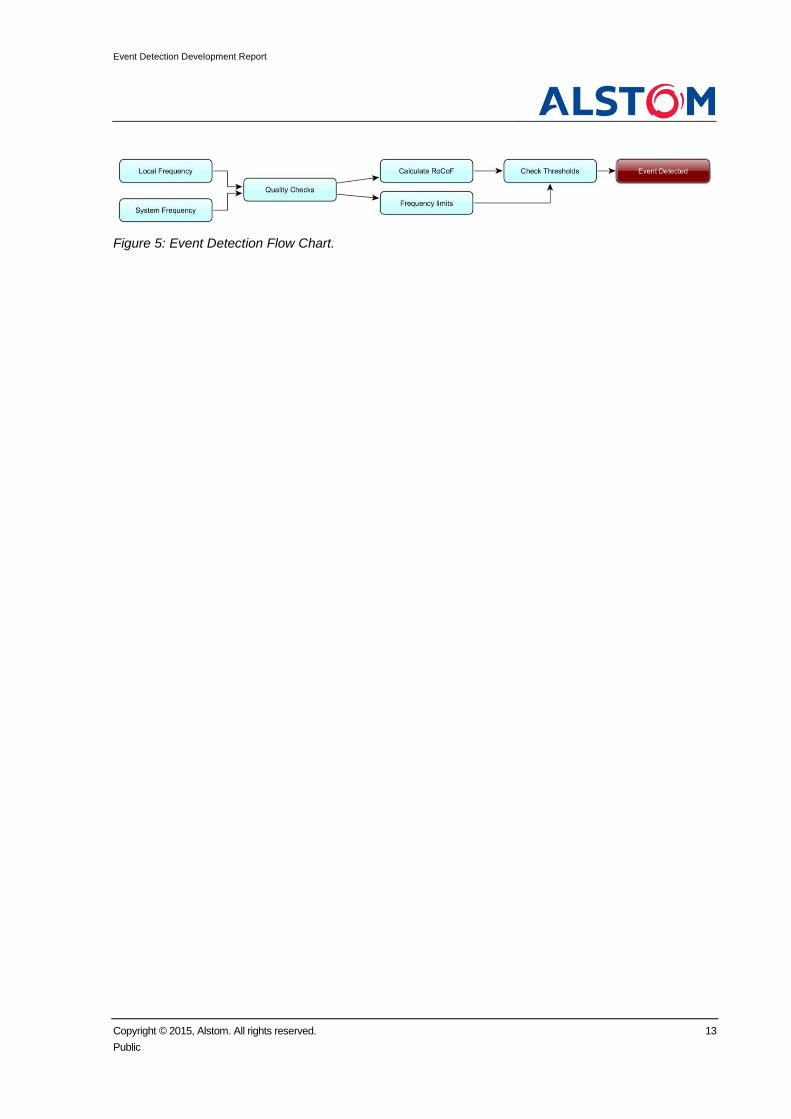
a region and therefore less prone to instability. The high-level flow-chart for the event detection algorithm is shown in Figure 5. For the wide-area BaU case, the LCs will receive the signals from the wide-area measurements. If the LC cannot receive wide-area signals, only the local PMU signal will be received. The signal from the local PMU must be filtered to remove the local effects of disturbances and oscillations. The quality of the available data is assessed before detection algorithms are applied. The event detection is based on a fast RoCoF detection approach which continuously measures the incoming data to determine when the gradients have been exceeded. Frequency limits are applied to detect slow events which may have a slower RoCoF, but may still be frequency events. High and a low limits are set with hysteresis where a number of consecutive measurements beyond the limits triggers detection.
𝑓, 𝑉, 𝛿
Event Detection Development Report
Copyright © 2015, Alstom. All rights reserved. 13
Public
Figure 5: Event Detection Flow Chart.
Event Detection Development Report
Copyright © 2015, Alstom. All rights reserved. 14
Public
5 Algorithm Description
The event detection algorithms contain the following functions:
Regional Aggregation
System Aggregation
Event Detection
Calculating and Continue Producing Frequency Gradient value
5.1 Implementing Aggregation
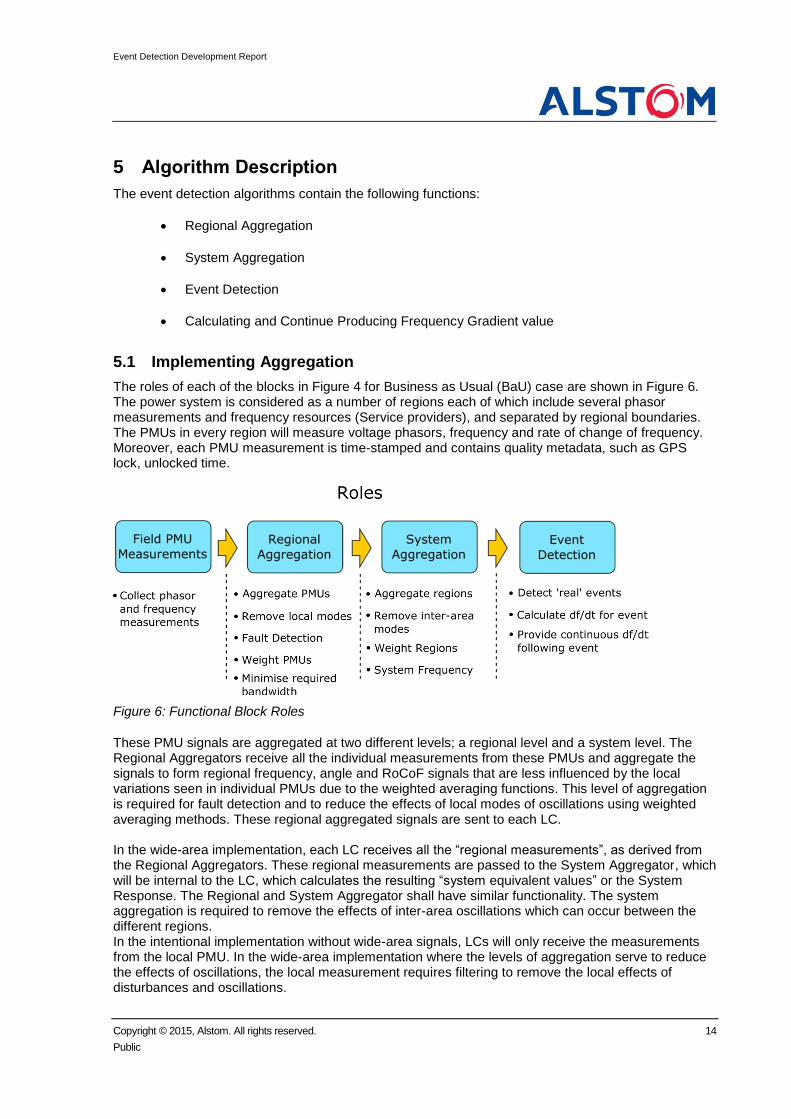
The roles of each of the blocks in Figure 4 for Business as Usual (BaU) case are shown in Figure 6. The power system is considered as a number of regions each of which include several phasor measurements and frequency resources (Service providers), and separated by regional boundaries. The PMUs in every region will measure voltage phasors, frequency and rate of change of frequency. Moreover, each PMU measurement is time-stamped and contains quality metadata, such as GPS lock, unlocked time.
Figure 6: Functional Block Roles
These PMU signals are aggregated at two different levels; a regional level and a system level. The Regional Aggregators receive all the individual measurements from these PMUs and aggregate the signals to form regional frequency, angle and RoCoF signals that are less influenced by the local variations seen in individual PMUs due to the weighted averaging functions. This level of aggregation is required for fault detection and to reduce the effects of local modes of oscillations using weighted averaging methods. These regional aggregated signals are sent to each LC. In the wide-area implementation, each LC receives all the “regional measurements”, as derived from the Regional Aggregators. These regional measurements are passed to the System Aggregator, which will be internal to the LC, which calculates the resulting “system equivalent values” or the System Response. The Regional and System Aggregator shall have similar functionality. The system aggregation is required to remove the effects of inter-area oscillations which can occur between the different regions. In the intentional implementation without wide-area signals, LCs will only receive the measurements from the local PMU. In the wide-area implementation where the levels of aggregation serve to reduce the effects of oscillations, the local measurement requires filtering to remove the local effects of disturbances and oscillations.

Event Detection Development Report
Copyright © 2015, Alstom. All rights reserved. 15
Public
The final block performs the event detection on the system aggregated signals (or filtered local signal) where it has the role of detecting real event, those which require frequency response. It must provide a value for the system (local) RoCoF upon detection of an event, but must also continuously produce a value as the event progresses.
5.1.1 Removing Oscillations
Both the regional and system aggregation performs the important function of minimising the effects of local and inter-area modes of oscillation. If these modes of oscillations were present in the event detector input, LCs may respond to local oscillations rather than real frequency events. The oscillations can also produce larger df/dt values which may cause LCs to over-respond or vice-versa. Consider Figure 7 where all signals except the black dashed line are individual PMU frequency values. There is dispersion between the signals but the effects of the oscillations are also visible resulting in some signals to change sign on the df/dt values during backswings. This behaviour can cause incorrect detection but also incorrect estimates of the required system response. To remove the oscillations, a weighted averaging algorithm is used.
The regional inertia problem is also accommodated using the aggregation. Signals measured in areas with low inertia can change more rapidly and hence give a false representation of the full system behaviour. By weighting the signals with inertia, signals linked to the larger inertia measurements will have greater weight as they better represent the system behaviour. This is equivalent to taking the frequency and angle for the centre of inertia of a system.
The individual signals within each region are weighted to provide regional aggregated signals. For the system aggregation, the regional aggregated signals are sent with a regional weight resultant from the sum of the individual weights within the regions. Therefore, system aggregation uses the regional weight and aggregates to perform a second level of weighted averaging as shown in Figure 7 where it can be seen that many of the effects of the oscillations are successfully averaged out. The advantage of aggregation as opposed to filtering is that weighted averaging functions can be performed much faster than low-pass filtering, therefore minimising the data processing delays.
For the intentional implementation without wide-area signals, or where loss of communications to the wide-area signals is experienced, this aggregation cannot be performed and the LC will rely on the local PMU. In these cases, low-pass filtering is unavoidable and must be performed to reduce the local effects of disturbances and oscillations for the reasons previously described.

Event Detection Development Report
Copyright © 2015, Alstom. All rights reserved. 16
Public
Figure 7: Plot showing frequencies measured at generator buses and the system aggregated frequency based on the centre of inertia technique
5.1.2 Fault Handling
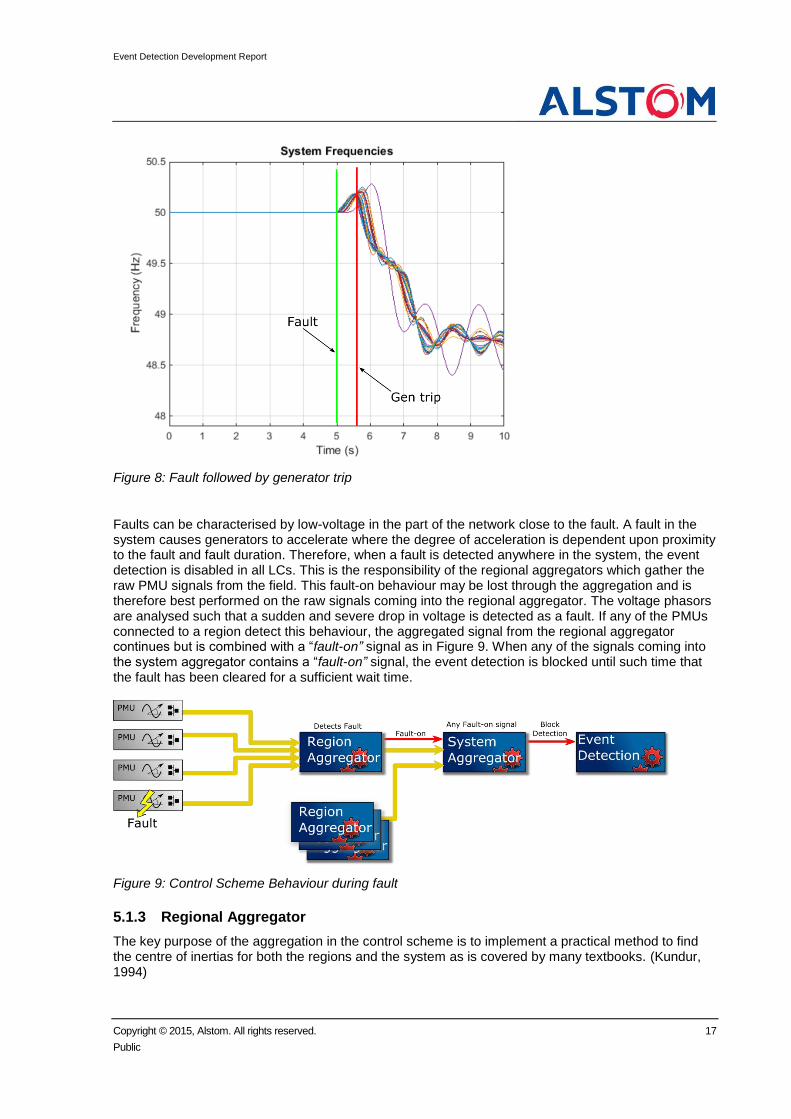
When a fault occurs in the system (e.g. short circuit), the mechanical power of the generator remains unchanged. In the three-phase short circuit close to generator terminals example, the equivalent fault reactance tends to∞, thus power transfer from the generator to the power system is completely blocked and the electrical power at the generator drops to zero. The resulting imbalance between the mechanical and electrical power manifests itself as generator acceleration, increasing the voltage phase angle with respect to the system phase angle. This acceleration of the generators may be observed as an over-frequency event as the frequency increases. However it should not be acted upon as it is a characteristic of fault-on behaviour rather than being a true loss of load event. When the fault is cleared, the generators should stabilise back to nominal frequency assuming no load or generation was lost during the fault. While the fault remains on the system, event detection must be disabled. After the fault is cleared, the algorithm waits for a set time (in the order of 20-40ms) before re-enabling the event detection function on the LC, to allow the fault measurement values to pass through the PMU fully and for some of the accelerating units start slowing down. This will allow the detection algorithms to process events only after faults have been cleared. Consider Figure 8 where a fault occurs and generators accelerate, upon clearing of the fault a generator is lost which results in a true under-frequency event. By blocking the fault on behaviour, the detection will only become active after the fault has cleared and should detect the falling frequency as a result of the generator trip, therefore detecting an underfrequency event as opposed to an over-frequency event.
Event Detection Development Report
Copyright © 2015, Alstom. All rights reserved. 17
Public
Figure 8: Fault followed by generator trip
Faults can be characterised by low-voltage in the part of the network close to the fault. A fault in the system causes generators to accelerate where the degree of acceleration is dependent upon proximity to the fault and fault duration. Therefore, when a fault is detected anywhere in the system, the event detection is disabled in all LCs. This is the responsibility of the regional aggregators which gather the raw PMU signals from the field. This fault-on behaviour may be lost through the aggregation and is therefore best performed on the raw signals coming into the regional aggregator. The voltage phasors are analysed such that a sudden and severe drop in voltage is detected as a fault. If any of the PMUs connected to a region detect this behaviour, the aggregated signal from the regional aggregator continues but is combined with a “fault-on” signal as in Figure 9. When any of the signals coming into the system aggregator contains a “fault-on” signal, the event detection is blocked until such time that the fault has been cleared for a sufficient wait time.
Figure 9: Control Scheme Behaviour during fault
5.1.3 Regional Aggregator
The key purpose of the aggregation in the control scheme is to implement a practical method to find the centre of inertias for both the regions and the system as is covered by many textbooks. (Kundur, 1994)

Event Detection Development Report
Copyright © 2015, Alstom. All rights reserved. 18
Public
In the BaU case, the Regional Aggregator receives the individual PMU measurements within a region. The PMU measurements will consist of a voltage phasor from which voltage magnitude, voltage angle and frequency can be obtained. Additionally, IEEE C37.118 streams contain metadata describing the quality of the stream which contains information on the GPS lock, the time the signal is unsynchronised and whether the signal is a test signal or not. The full description can be found in the IEEE C37.118 standard. Each region can receive up to a specific maximum number of PMU measurements (e.g. 30 different PMU measurements). The Regional Aggregator uses a weighted average, where the weights will be determined as a function of inertia:
𝑊𝑒𝑖𝑔ℎ𝑡 = 𝑓(𝐻) (1)
The quality of the signals is an extremely important consideration for any control scheme. The quality metadata that is sent from the PMU is generic but can be manipulated for the specific purposes of the control scheme. An example is assigning individual quality metadata to the frequency and angle signals, as each will have a different definition of what a good quality signal is. The angle is only good quality if it synchronised with only very small unlock-time, however, the frequency signal can retain good quality for a longer unsynchronised time as frequency is less susceptible to drift within a PMU. Different functions within a control scheme may then operate in a particular state based on the quality of the signal. A confidence level is assigned to the region based on the availability of valid measurements. In the region, there exists some physical inertia quantity which is proportionally assigned to each of the PMU measurements feeding the aggregator. These proportions are based on the proximity of PMUs to the different inertias within the region. Therefore, when a PMU is located close to a generator with large inertia, it is given a larger weighting. The aim of the aggregators is to aggregate data to create a single equivalent generator for that region, or regional centre of inertia. The individual PMU measurements provide a proportion of a regions observable inertia, therefore, loss of a single measurement means loss of the inertia observability at that location. It does not mean that the inertia is lost, only the observability of it, i.e. a bad PMU measurement does not explicitly mean that the generator it was measuring was lost, where the only certainty is that the generator is no longer visible by that PMU. As each PMU’s weighting is a function of inertia, the loss of a PMU will be related to the proportion of observability that is lost. Therefore, a confidence value is assigned on the proportion of total regional inertia that is observable through the good quality measurements. If a PMU near a generator with large inertia is lost, it will have a larger impact on the aggregated signal; therefore, there is lower confidence in the aggregated signal. However, if a PMU near a low inertia generator is lost, it will have a minimal impact on the aggregated signal and there remains high confidence in the aggregated signal. The output from the Regional Aggregators comprise the weighted average frequency, the weighted average angle, the time stamp of the measurements and the quality of the region measurements sent as a new C37.118 stream which represents the region. The Regional Aggregators must also pass as an output the sum of weights of regional PMU measurements, which now represents the weight of the region.
5.1.4 System Aggregator
The system Aggregator will be located on the LC. It receives all the “regional measurements” that are derived from the Regional Aggregators. The basic functionality of the two Aggregators is similar; however the weights are instead propagated from the regional aggregators. The role of the system aggregator is to perform the system centre of inertia function based on the regional inputs. The output of the System Aggregator is equivalent to a “System PMU measurement”, a signal which intends to represent the full system as a single equivalent machine, or the centre of inertia.
Event Detection Development Report
Copyright © 2015, Alstom. All rights reserved. 19
Public
5.2 Event Detection
5.2.1 Event Detection Algorithm
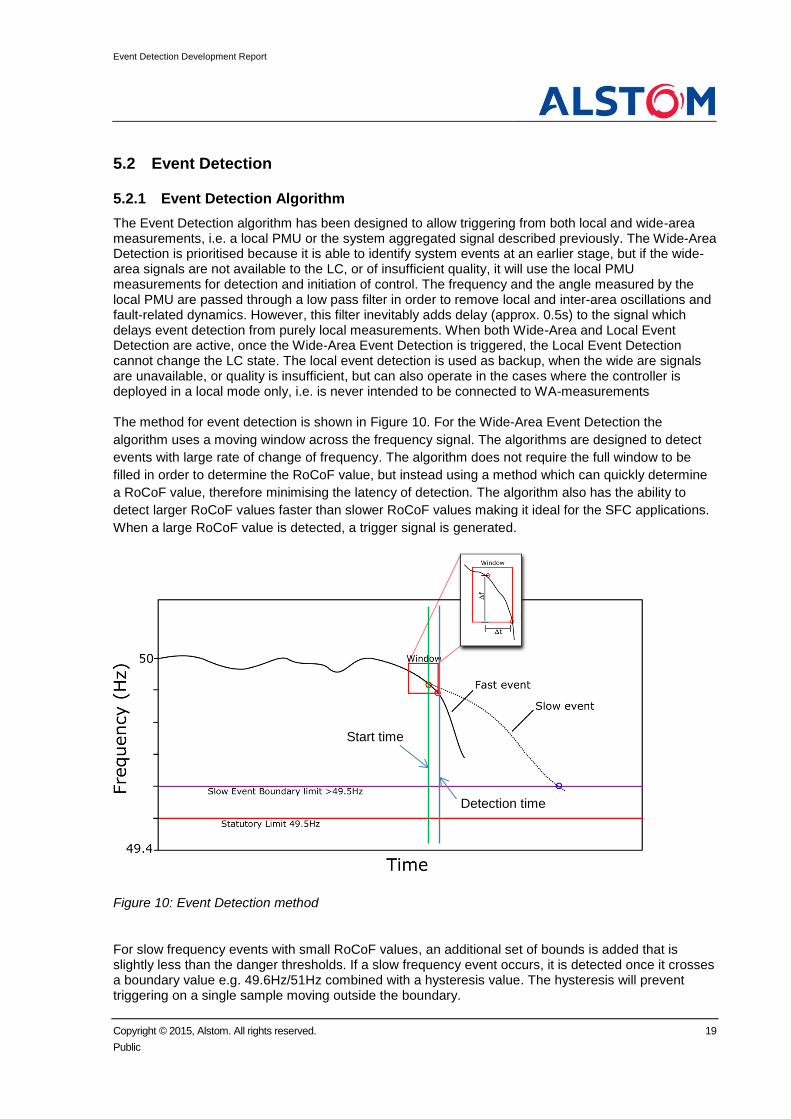
The Event Detection algorithm has been designed to allow triggering from both local and wide-area measurements, i.e. a local PMU or the system aggregated signal described previously. The Wide-Area Detection is prioritised because it is able to identify system events at an earlier stage, but if the wide-area signals are not available to the LC, or of insufficient quality, it will use the local PMU measurements for detection and initiation of control. The frequency and the angle measured by the local PMU are passed through a low pass filter in order to remove local and inter-area oscillations and fault-related dynamics. However, this filter inevitably adds delay (approx. 0.5s) to the signal which delays event detection from purely local measurements. When both Wide-Area and Local Event Detection are active, once the Wide-Area Event Detection is triggered, the Local Event Detection cannot change the LC state. The local event detection is used as backup, when the wide are signals are unavailable, or quality is insufficient, but can also operate in the cases where the controller is deployed in a local mode only, i.e. is never intended to be connected to WA-measurements The method for event detection is shown in Figure 10. For the Wide-Area Event Detection the
algorithm uses a moving window across the frequency signal. The algorithms are designed to detect
events with large rate of change of frequency. The algorithm does not require the full window to be
filled in order to determine the RoCoF value, but instead using a method which can quickly determine
a RoCoF value, therefore minimising the latency of detection. The algorithm also has the ability to
detect larger RoCoF values faster than slower RoCoF values making it ideal for the SFC applications.
When a large RoCoF value is detected, a trigger signal is generated.
Figure 10: Event Detection method
For slow frequency events with small RoCoF values, an additional set of bounds is added that is slightly less than the danger thresholds. If a slow frequency event occurs, it is detected once it crosses a boundary value e.g. 49.6Hz/51Hz combined with a hysteresis value. The hysteresis will prevent triggering on a single sample moving outside the boundary.
Start time
Detection time

Event Detection Development Report
Copyright © 2015, Alstom. All rights reserved. 20
Public
For Local Event Detection, the logic remains the same; however, instead of using the system frequency, the algorithm uses the filtered local frequency.
5.2.2 Frequency Gradient Calculation
The frequency gradient provides an important measure into the size of the event and thus, size of response required. The gradient is calculated using a least-squares best fit method applied to the system frequency data. The algorithm will determine in real-time, a suitable window-length based on analysis of the signals in which to apply a RoCoF algorithm. A real-time RoCoF value will be produced which will be used for downstream applications in the control scheme. The algorithm will ensure that as much data as possible is available for the calculation hence providing the best estimates for frequency gradient.
Event Detection Development Report
Copyright © 2015, Alstom. All rights reserved. 21
Public
6 Results from Simulated Test Cases
6.1 Description of Test Model
The model used for the testing is based on a 124-bus version of the WECC system. The system has been divided into 5 regions for the purposes of the SFC control scheme. The model contains 34 generators, 23 loads. The model has been adapted for the purposes of the SFC project to provide governor response similar to what would be expected in the NG system. Additionally, 10 resources were added which will be used for response in later tests. These consist of both loads and low inertia generators. The inertia has been adapted to provide similar behaviour to a future NG system, in particular a 0.3Hz/s frequency gradient as a consequence of a loss of 5% generation (equivalent to a 2GW loss in a 40GW system)..
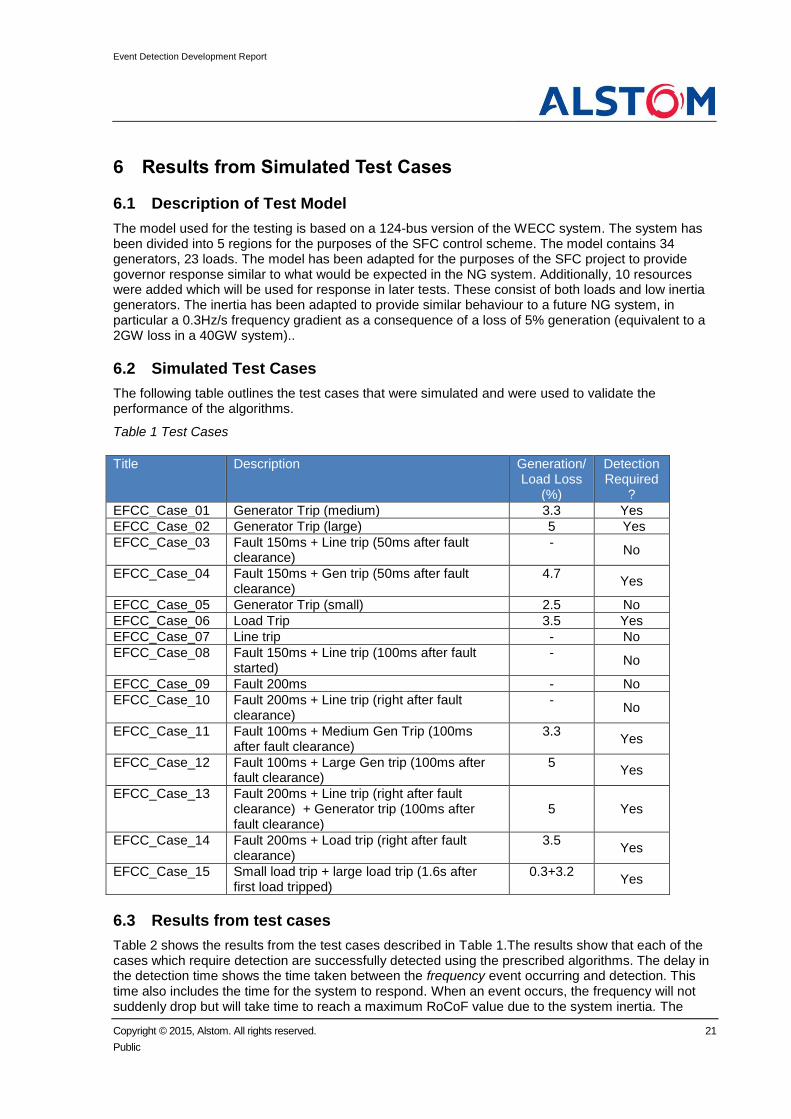
6.2 Simulated Test Cases
The following table outlines the test cases that were simulated and were used to validate the performance of the algorithms.
Table 1 Test Cases
Title Description Generation/Load Loss
(%)
Detection Required
?
EFCC_Case_01 Generator Trip (medium) 3.3 Yes
EFCC_Case_02 Generator Trip (large) 5 Yes
EFCC_Case_03 Fault 150ms + Line trip (50ms after fault clearance)
- No
EFCC_Case_04 Fault 150ms + Gen trip (50ms after fault clearance)
4.7 Yes
EFCC_Case_05 Generator Trip (small) 2.5 No
EFCC_Case_06 Load Trip 3.5 Yes
EFCC_Case_07 Line trip - No
EFCC_Case_08 Fault 150ms + Line trip (100ms after fault started)
- No
EFCC_Case_09 Fault 200ms - No
EFCC_Case_10 Fault 200ms + Line trip (right after fault clearance)
- No
EFCC_Case_11 Fault 100ms + Medium Gen Trip (100ms after fault clearance)
3.3 Yes
EFCC_Case_12 Fault 100ms + Large Gen trip (100ms after fault clearance)
5 Yes
EFCC_Case_13 Fault 200ms + Line trip (right after fault clearance) + Generator trip (100ms after fault clearance)
5 Yes
EFCC_Case_14 Fault 200ms + Load trip (right after fault clearance)
3.5 Yes
EFCC_Case_15 Small load trip + large load trip (1.6s after first load tripped)
0.3+3.2 Yes
6.3 Results from test cases
Table 2 shows the results from the test cases described in Table 1.The results show that each of the cases which require detection are successfully detected using the prescribed algorithms. The delay in the detection time shows the time taken between the frequency event occurring and detection. This time also includes the time for the system to respond. When an event occurs, the frequency will not suddenly drop but will take time to reach a maximum RoCoF value due to the system inertia. The

Event Detection Development Report
Copyright © 2015, Alstom. All rights reserved. 22
Public
frequency at detection shows the system frequency value at the detection time which shows that events can be detected before frequency falls (or rises) excessively, such as below 49.5Hz.
Table 2 Results from Test cases
Case Detection Required
Event Detected
Detected <500ms
Frequency at Event Detection
(Hz)
Initial Frequency Gradient
(Hz/s)
Case 1 Yes Yes yes 49.93 -0.2089
Case 2 Yes Yes yes 49.94 -0.2772
Case 3 No No - - -
Case 4 Yes Yes yes 50.08 -0.2862
Case 5 No No - - -
Case 6 Yes Yes yes 50.05 0.2512
Case 7 No No - - -
Case 8 No No - - -
Case 9 No No - - -
Case 10 No No - - -
Case 11 Yes Yes yes 50.05 -0.2347
Case 12 Yes Yes yes 50.04 -0.3302
Case 13 Yes Yes yes 50.15 -0.3731
Case 14 Yes Yes yes 50.18 0.4047
Case 15 Yes Yes yes 50.11 0.2851
Event Detection Development Report
Copyright © 2015, Alstom. All rights reserved. 23
Public
7 Discussion
7.1 Implementation
Once completed, the algorithms will be generated for execution on the Controller’s hardware and software platform, Alstom’s e-terraphasorcontroller.
Event detection is implemented through the use of PMUs, regional aggregators, system aggregators and event detection functions. The PMUs within a region will stream data to their regional aggregator using C37.118 protocol. The regional aggregation functions are located on physical units located in the regions, while system aggregation and event detection functions are located together on different physical units to those for RA, close to the related resources and are termed LCs. There will be a number of regional aggregators covering a system where each deployment of a system aggregator will receive data from a regional aggregator in each region. In a future Business
7.2 Discussion of Results
A number of test scenarios were designed to validate the performance of the designed application. These tests were outlined in Table 1. The objective of the algorithm defined in the requirements from Section 2 was to detect large events within 500ms from the generation/load loss, including events following a fault or line trip.
From the results shown in Table 2, all of the large events, defined as having a RoCoF >= 150% RoCoF threshold, are detected within the 500ms. Therefore, for the prescribed cases, the detection times meet the requirements specifications. In operation, the detection must balance thresholds against requirements which translate into accuracy vs. time.
7.3 Next Stages
The algorithms have been completed and the development will now focus on implementing the algorithms on the e-terraphasorcontroller hardware.
Event Detection Development Report
Copyright © 2015, Alstom. All rights reserved. 24
Public
8 Conclusions
Event detection in less than 0.5s from the generation/load loss is feasible, and achieved by
the proposed method
The event detection process covered in this description includes the chain of functions using
PMU measurements as inputs, through aggregation to the core event detection and
characterisation of the event in terms of a system-wide RoCoF. The further process to call on
resources will be addressed in a separate specification for Resource Allocation.
The use of two-stage aggregation (regional and system) accelerates the process by:
o Reducing the effects of local disturbance and noise
o Reducing the influence of oscillations
Aggregation is also useful in the system architecture for data quality and reliability, and
reduced data communication requirements
The process of aggregation allows weighting of the PMU measurements. Further work on
optimising the weighting coefficients is recommended.
Test cases show complex dynamic behaviour in the early stages of the event (particularly in
the first second), which are accommodated in the process. Further exercising of the method
with real events and more complex models would be useful to tune and validate the method
for the current and future GB grid scenarios
The method can be tuned by parameter selection for the expected level of inertia and
maximum disturbance size, and level of sensitivity to events.
Event Detection Development Report
Copyright © 2015, Alstom. All rights reserved. 25
Public
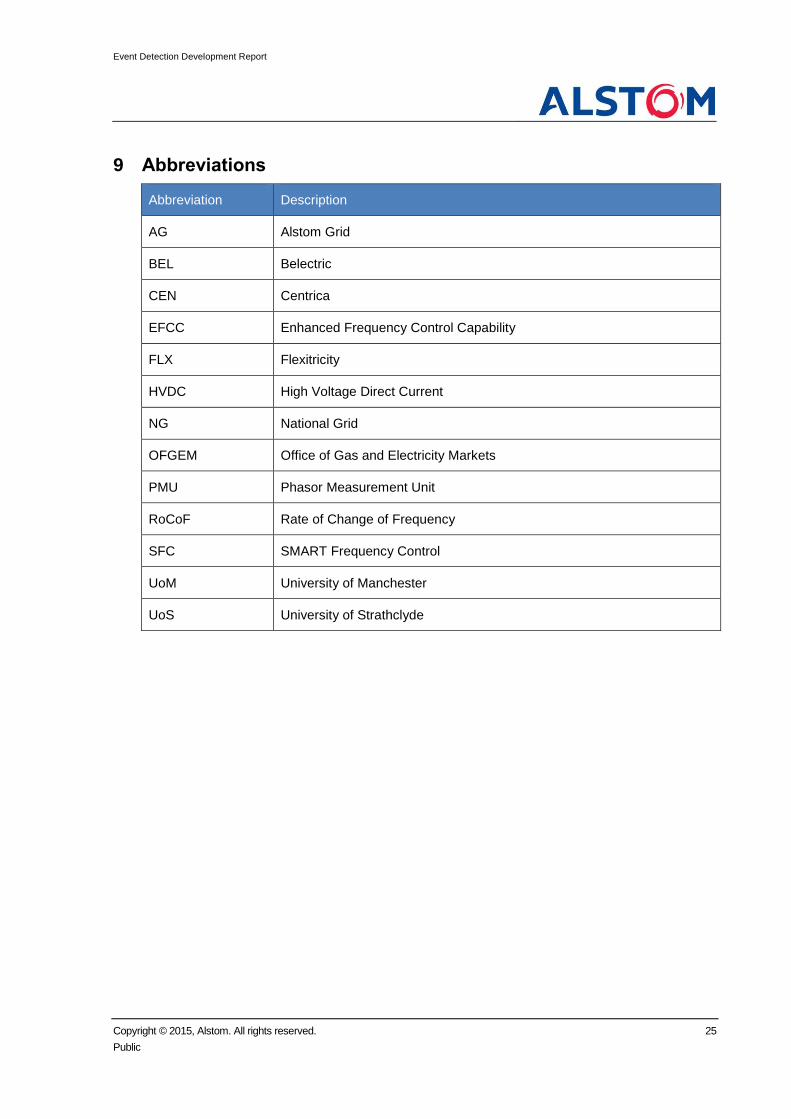
9 Abbreviations
Abbreviation Description
AG Alstom Grid
BEL Belectric
CEN Centrica
EFCC Enhanced Frequency Control Capability
FLX Flexitricity
HVDC High Voltage Direct Current
NG National Grid
OFGEM Office of Gas and Electricity Markets
PMU Phasor Measurement Unit
RoCoF Rate of Change of Frequency
SFC SMART Frequency Control
UoM University of Manchester
UoS University of Strathclyde
Event Detection Development Report
Copyright © 2015, Alstom. All rights reserved. 26
Public
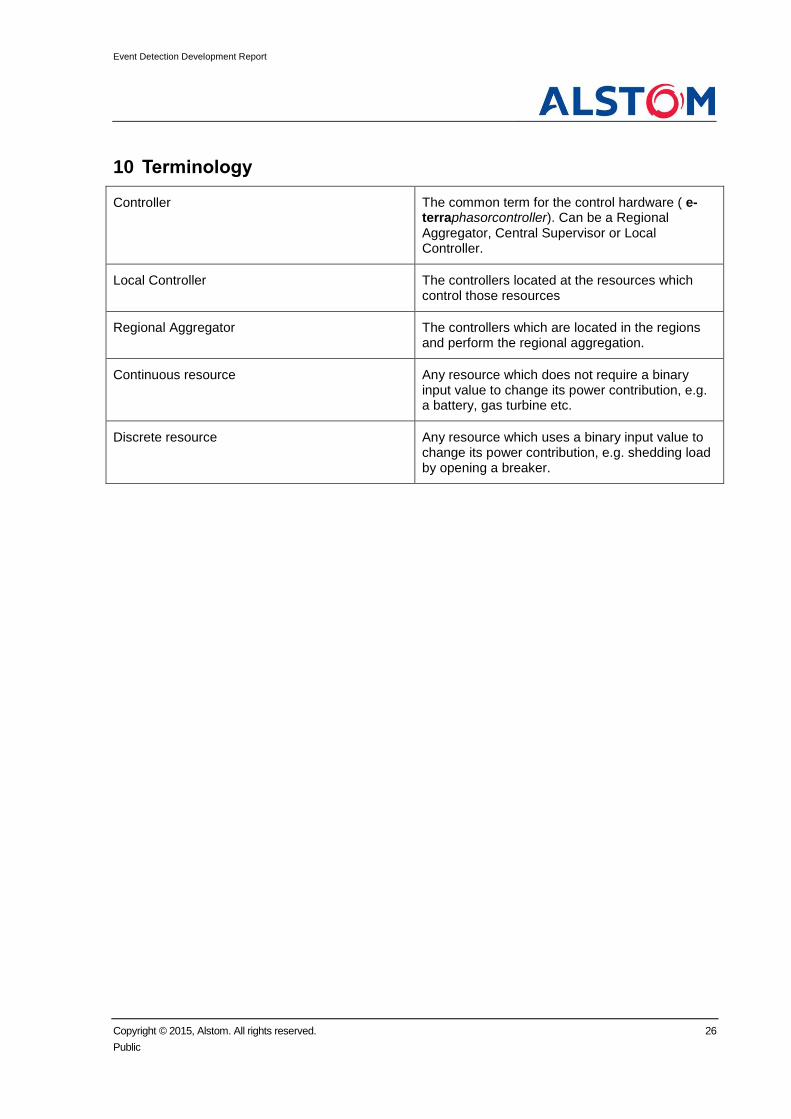
10 Terminology
Controller The common term for the control hardware ( e-terraphasorcontroller). Can be a Regional Aggregator, Central Supervisor or Local Controller.
Local Controller The controllers located at the resources which control those resources
Regional Aggregator The controllers which are located in the regions and perform the regional aggregation.
Continuous resource Any resource which does not require a binary input value to change its power contribution, e.g. a battery, gas turbine etc.
Discrete resource Any resource which uses a binary input value to change its power contribution, e.g. shedding load by opening a breaker.

Event Detection Development Report
Copyright © 2015, Alstom. All rights reserved. 27
Public
11 References
Grid, N. (2014). UK Future Energy Scenarios. Kundur, P. (1994). Power System Stability and Control . EPRI. National Grid. (2014). Enhanced Frequency Control Capability - Electricity Network Innovation
Competition Full Submission Pro-forma. UK, A. G. (2015). Patent No. PATENT APPLICATION NUMBER 1507349.7. UK.