slope of a line from 2 points slope – the measure of steepness, slant, or tilt of a line the...
TRANSCRIPT

SLOPE of a Line from 2 Points
SLOPE – the measure of steepness, slant, or tilt of a line
The letter m is used to represent slope in equations

SLOPE of a Line from 2 Points
SLOPE – the measure of steepness, slant, or tilt of a line
The letter m is used to represent slope in equations
x
ym
in change
in change

SLOPE of a Line from 2 Points
SLOPE – the measure of steepness, slant, or tilt of a line
The letter m is used to represent slope in equations
x
ym
in change
in change
SLOPE EQUATION The slope, m , of a non-vertical line that contains the points P1 ( x1 , y1 ) and P2 ( x2 , y2 ) is :
12
12
xx
yym

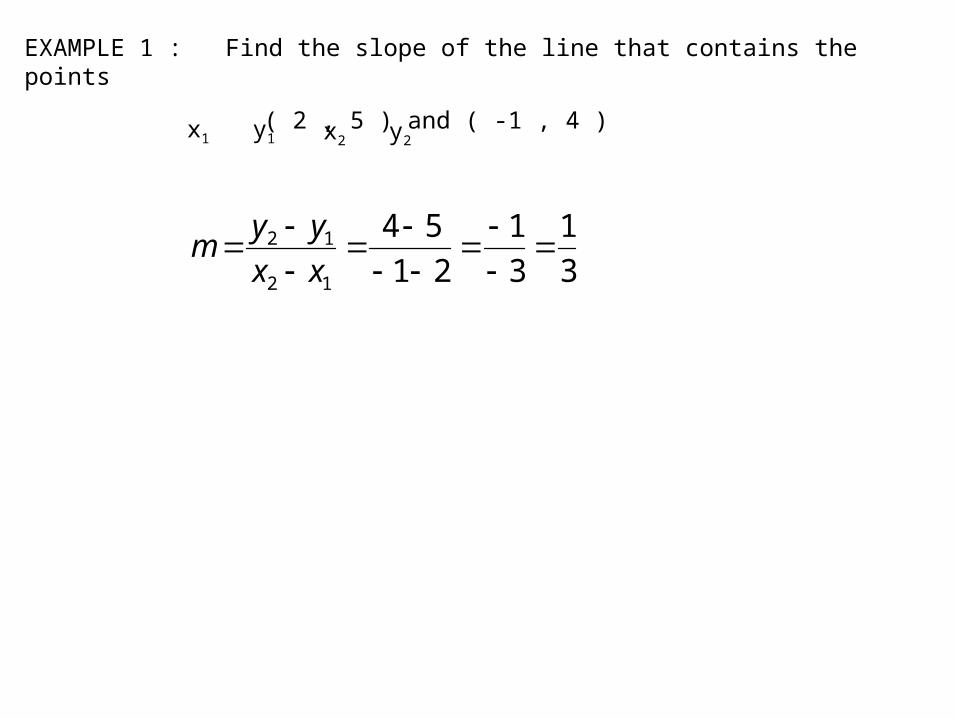
EXAMPLE 1 : Find the slope of the line that contains the points
( 2 , 5 ) and ( -1 , 4 )

EXAMPLE 1 : Find the slope of the line that contains the points
( 2 , 5 ) and ( -1 , 4 )
1212
12 54
xxxx
yym
x1 y1 x2 y2

EXAMPLE 1 : Find the slope of the line that contains the points
( 2 , 5 ) and ( -1 , 4 )
21
54
12
12
xx
yym
x1 y1 x2 y2
EXAMPLE 1 : Find the slope of the line that contains the points
( 2 , 5 ) and ( -1 , 4 )
3
1
3
1
21
54
12
12
xx
yym
x1 y1 x2 y2

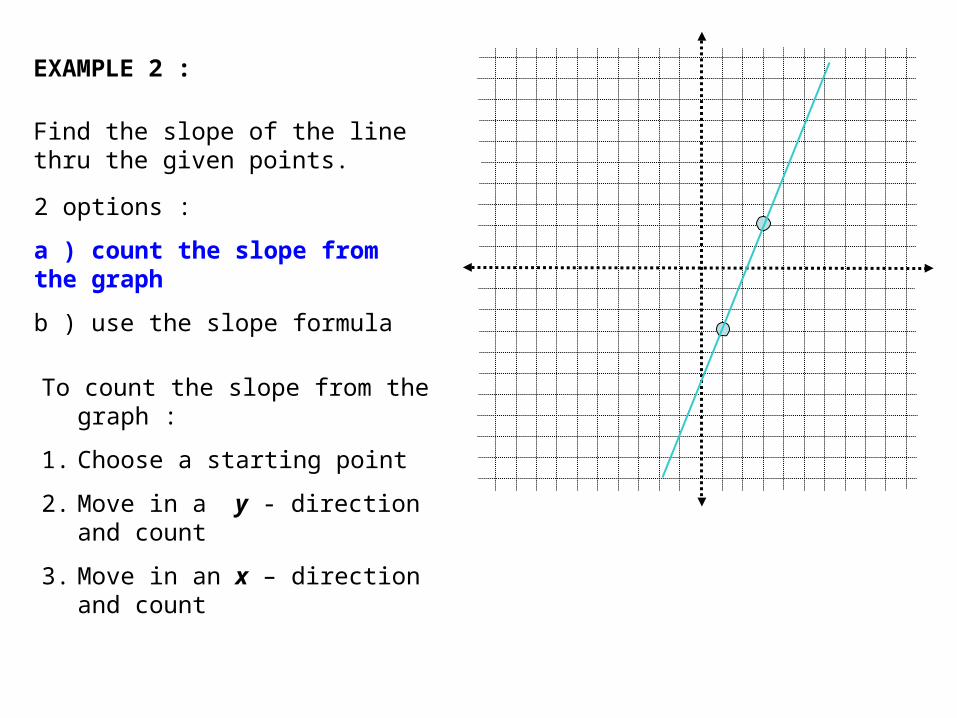
EXAMPLE 2 :
Find the slope of the line thru the given points.

EXAMPLE 2 :
Find the slope of the line thru the given points.
2 options :
a ) count the slope from the graph
b ) use the slope formula
EXAMPLE 2 :
Find the slope of the line thru the given points.
2 options :
a ) count the slope from the graph
b ) use the slope formula
To count the slope from the graph :
1. Choose a starting point
2. Move in a y - direction and count
3. Move in an x – direction and count
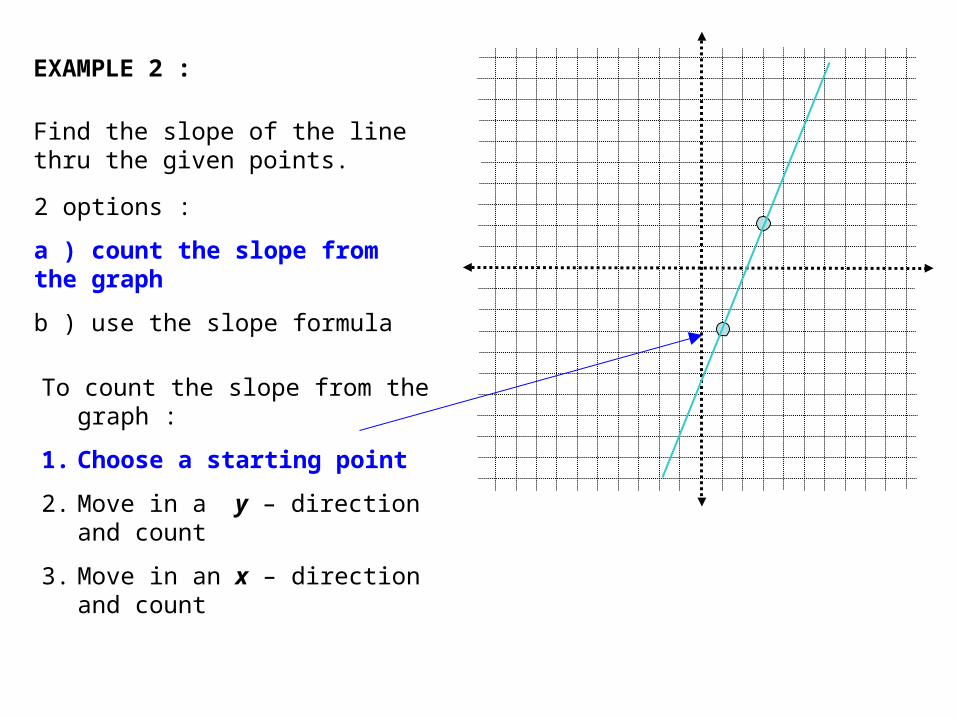
EXAMPLE 2 :
Find the slope of the line thru the given points.
2 options :
a ) count the slope from the graph
b ) use the slope formula
To count the slope from the graph :
1. Choose a starting point
2. Move in a y – direction and count
3. Move in an x – direction and count
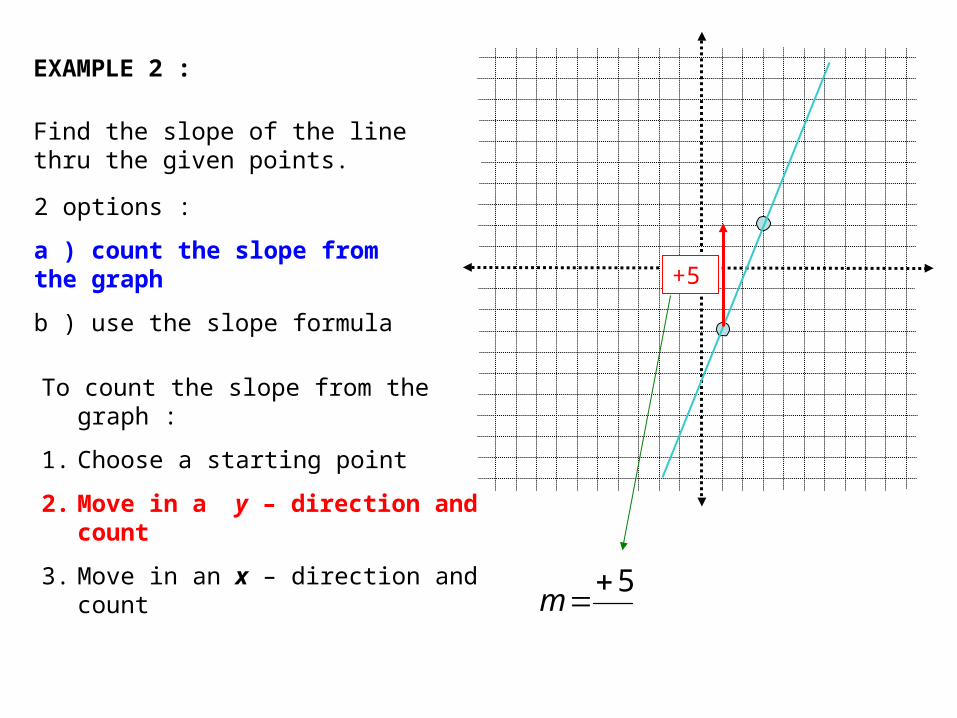
EXAMPLE 2 :
Find the slope of the line thru the given points.
2 options :
a ) count the slope from the graph
b ) use the slope formula
To count the slope from the graph :
1. Choose a starting point
2. Move in a y – direction and count
3. Move in an x – direction and count
+5
5m

EXAMPLE 2 :
Find the slope of the line thru the given points.
2 options :
a ) count the slope from the graph
b ) use the slope formula
To count the slope from the graph :
1. Choose a starting point
2. Move in a y – direction and count
3. Move in an x – direction and count
+5
2
5
m
+2

EXAMPLE 2 :
Find the slope of the line thru the given points.
2 options :
a ) count the slope from the graph
b ) use the slope formula
P1 ( 1 , -3 )
P2 ( 3 , 2 )
12
12
xx
yym

EXAMPLE 2 :
Find the slope of the line thru the given points.
2 options :
a ) count the slope from the graph
b ) use the slope formula
P1 ( 1 , -3 )
P2 ( 3 , 2 )
2
5
13
)3(2
12
12
xx
yym

SOME hints on slope…
( + ) positive slope :
- always uphill from left to right
- when counting, go up, and then right… OR down, and then left
( - ) negative slope :
- always downhill from left to right
- when counting : go down, then right… OR, up, and then left

SPECIAL slopes…
Horizontal lines have zero slope.

SPECIAL slopes…
Horizontal lines have zero slope.
Y doesn’t change on a horizontal line.
P1 ( -5 , 3 ) P1 ( 2 , 3 )

SPECIAL slopes…
Horizontal lines have zero slope.
Y doesn’t change on a horizontal line.
When you subtract your y – values in the slope equation, you get zero. P1 ( -5 , 3 ) P1 ( 2 , 3 )
7
0
25
33
12
12
xx
yym
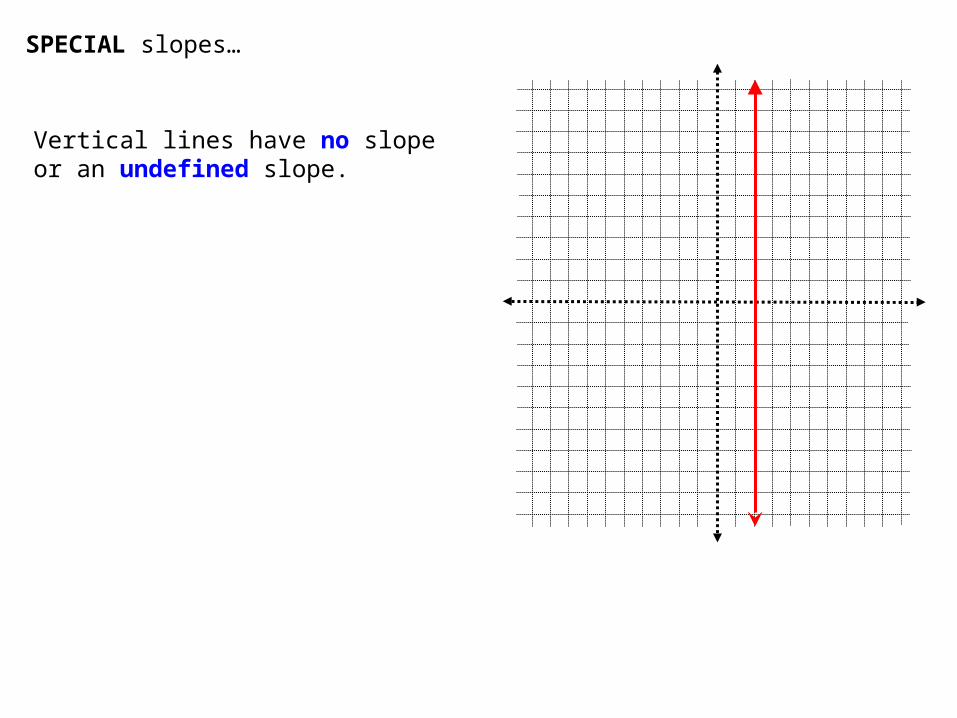
SPECIAL slopes…
Vertical lines have no slope or an undefined slope.

SPECIAL slopes…
Vertical lines have no slope or an undefined slope.
X doesn’t change on a vertical line.
P1 ( 2 , -3 )
P2 ( 2 , 4 )
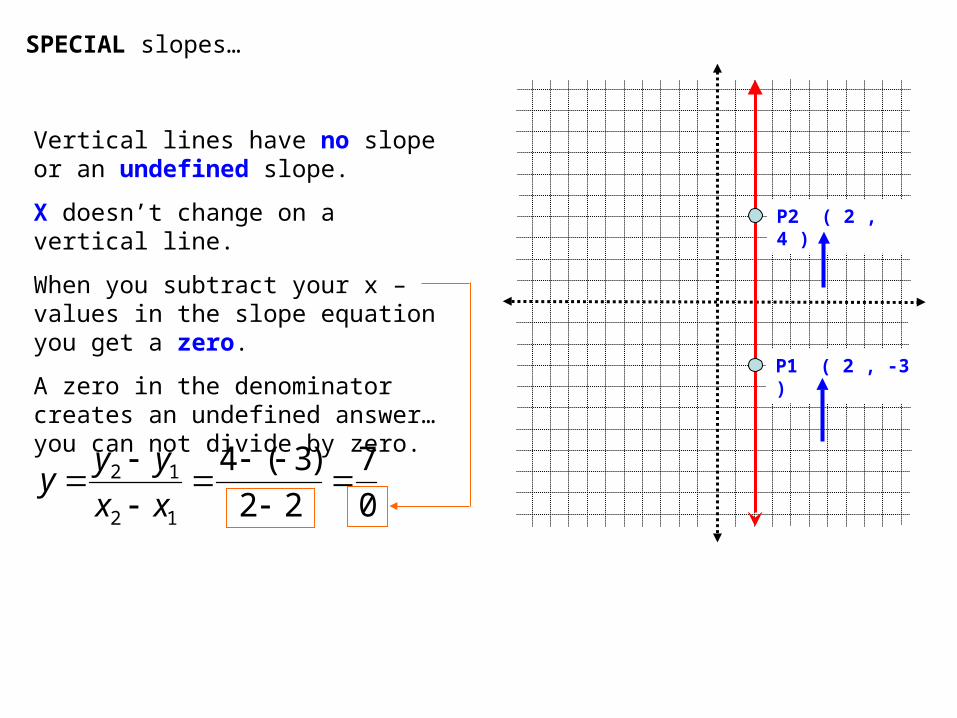
SPECIAL slopes…
Vertical lines have no slope or an undefined slope.
X doesn’t change on a vertical line.
When you subtract your x – values in the slope equation you get a zero.
A zero in the denominator creates an undefined answer…you can not divide by zero.
P1 ( 2 , -3 )
P2 ( 2 , 4 )
0
7
22
)3(4
12
12
xx
yyy

Graphing slopes…
EXAMPLE 3 : From the point ( -1 , 3 )
graph a slope of m = 3
2

Graphing slopes…
EXAMPLE 3 : From the point ( -1 , 3 )
graph a slope of m = 3
2
STEPS :
1. Graph the given point

Graphing slopes…
EXAMPLE 3 : From the point ( -1 , 3 )
graph a slope of m = 3
2
STEPS :
1. Graph the given point
2. Plot another point by following the given slope

Graphing slopes…
EXAMPLE 3 : From the point ( -1 , 3 )
graph a slope of m = 3
2
STEPS :
1. Graph the given point
2. Plot another point by following the given slope
- negative slope so…down 2, then right 3
- 2
+ 3

Graphing slopes…
EXAMPLE 3 : From the point ( -1 , 3 )
graph a slope of m = 3
2
STEPS :
1. Graph the given point
2. Plot another point by following the given slope
- negative slope so…down 2, then right 3
- plot your new point
- 2
+ 3