slide 1 – brisbane labour market · web viewbrisbane is defined as the greater capital city...
TRANSCRIPT

Slide 1 – Brisbane Labour Market
Presented on 27 June 2014 by Ivan Neville, Labour Market Research and Analysis Branch, Department of Employment
Brisbane is defined as the Greater Capital City Statistical Area of Greater Brisbane.
Greater Brisbane Includes the following SA4 regions:Brisbane - EastBrisbane - NorthBrisbane - SouthBrisbane - WestBrisbane Inner CityIpswichLogan - BeaudesertMoreton Bay - NorthMoreton Bay - South

Slide 2 – Australian labour market overview
Source: ABS, Labour Force, May 2014 (Seasonally adjusted)
Labour market conditions in Australia have remained reasonably soft over the year to May 2014.Employment growth – up by a modest 98 700 (or 0.9 per cent). Unemployment rate – up from 5.5 per cent to 5.8 per cent.Participation rate – down from 65.0 per cent to 64.6 per cent.
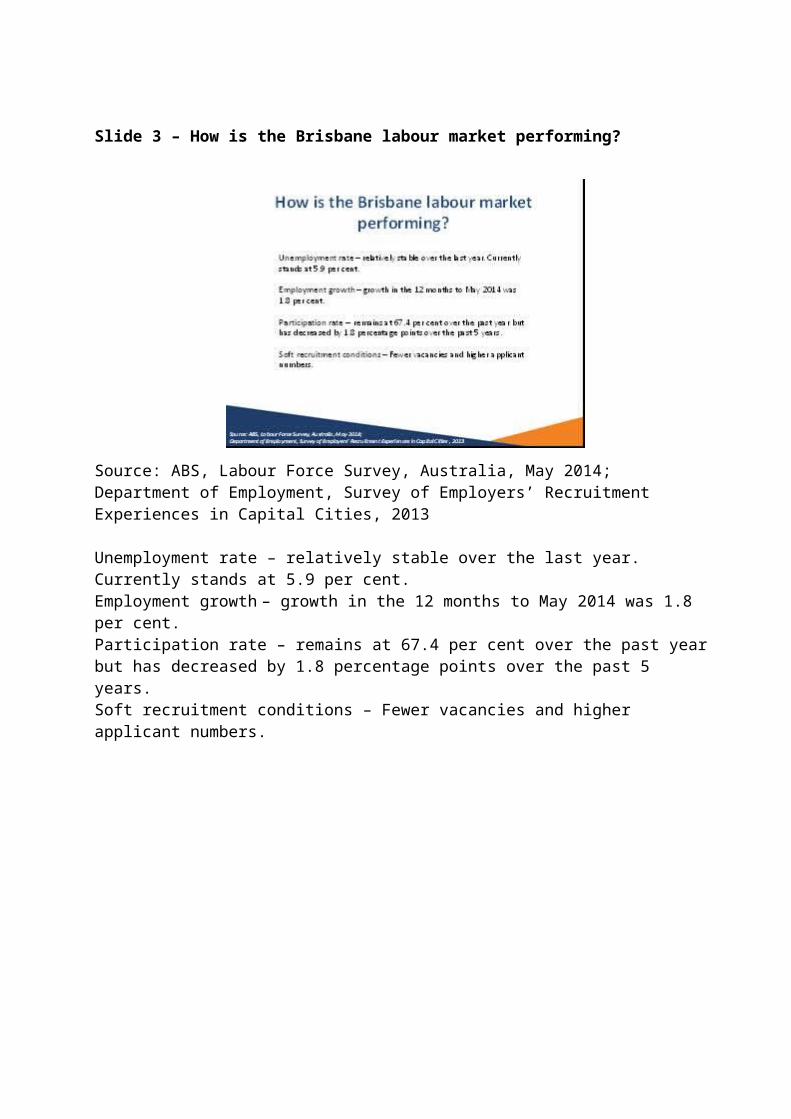
Slide 3 – How is the Brisbane labour market performing?
Source: ABS, Labour Force Survey, Australia, May 2014; Department of Employment, Survey of Employers’ Recruitment Experiences in Capital Cities, 2013
Unemployment rate – relatively stable over the last year. Currently stands at 5.9 per cent.Employment growth – growth in the 12 months to May 2014 was 1.8 per cent.Participation rate – remains at 67.4 per cent over the past year but has decreased by 1.8 percentage points over the past 5 years.Soft recruitment conditions – Fewer vacancies and higher applicant numbers.
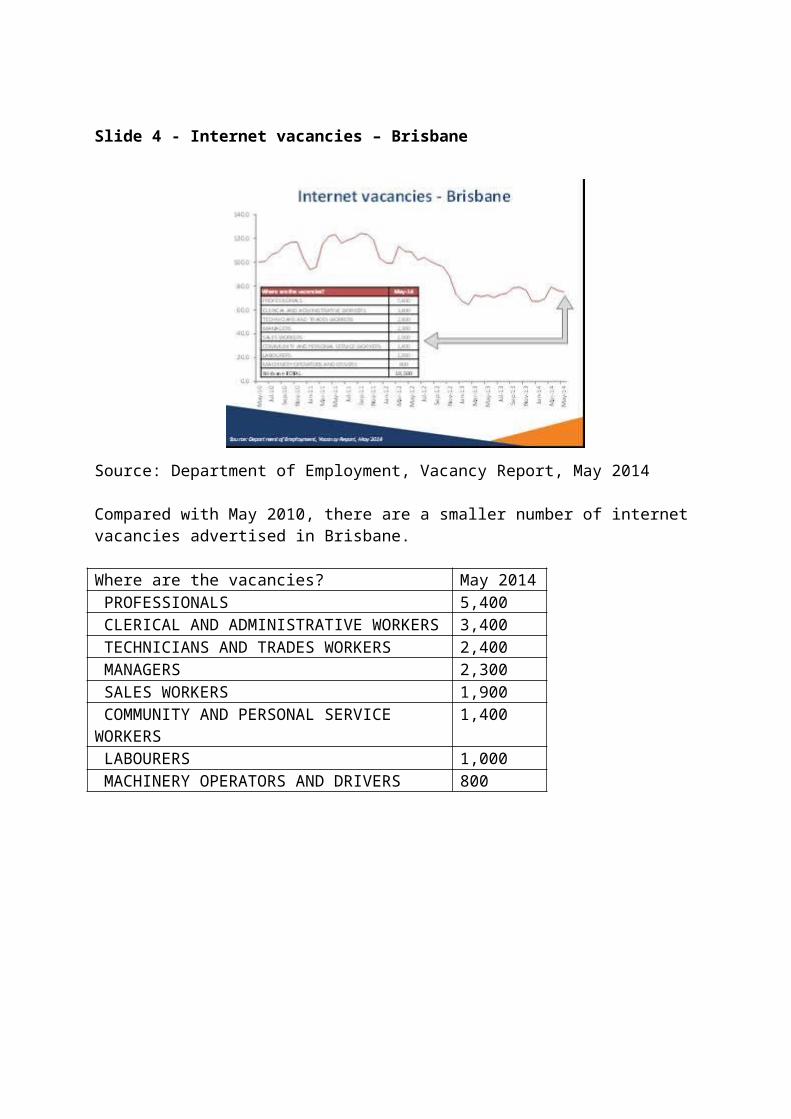
Slide 4 - Internet vacancies – Brisbane
Source: Department of Employment, Vacancy Report, May 2014
Compared with May 2010, there are a smaller number of internet vacancies advertised in Brisbane.
Where are the vacancies? May 2014 PROFESSIONALS 5,400 CLERICAL AND ADMINISTRATIVE WORKERS 3,400 TECHNICIANS AND TRADES WORKERS 2,400 MANAGERS 2,300 SALES WORKERS 1,900 COMMUNITY AND PERSONAL SERVICE WORKERS 1,400 LABOURERS 1,000 MACHINERY OPERATORS AND DRIVERS 800
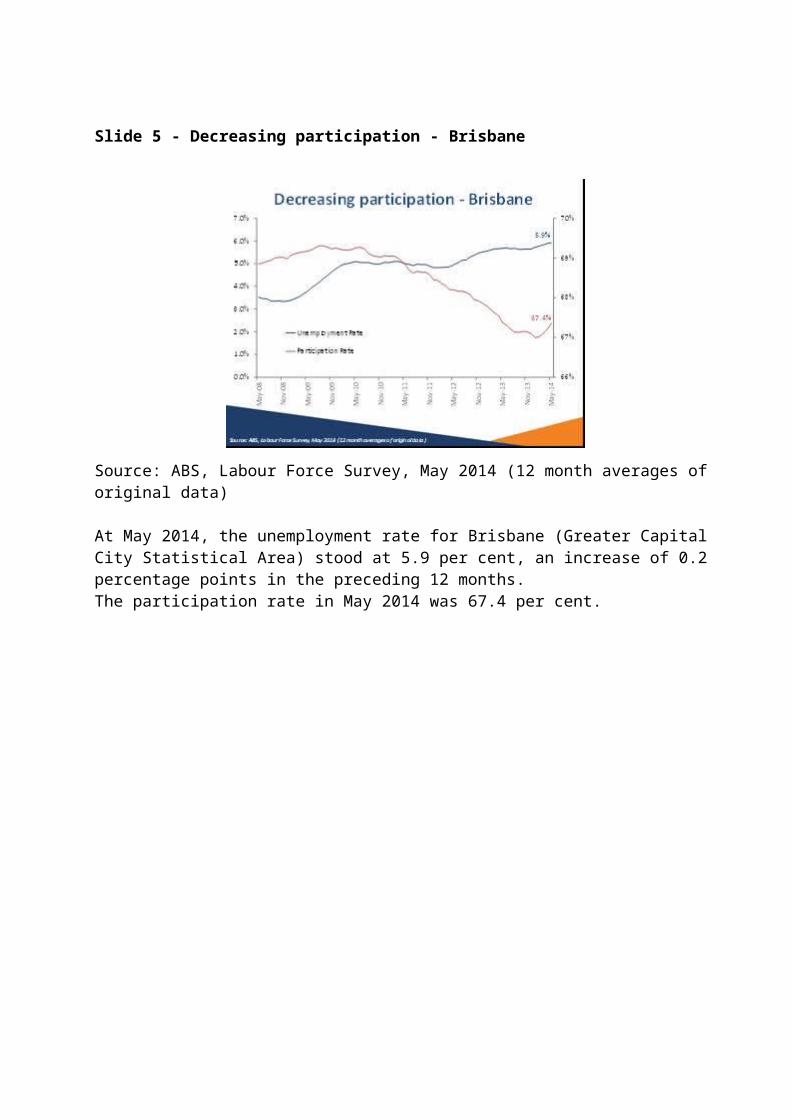
Slide 5 - Decreasing participation - Brisbane
Source: ABS, Labour Force Survey, May 2014 (12 month averages of original data)
At May 2014, the unemployment rate for Brisbane (Greater Capital City Statistical Area) stood at 5.9 per cent, an increase of 0.2 percentage points in the preceding 12 months.The participation rate in May 2014 was 67.4 per cent.
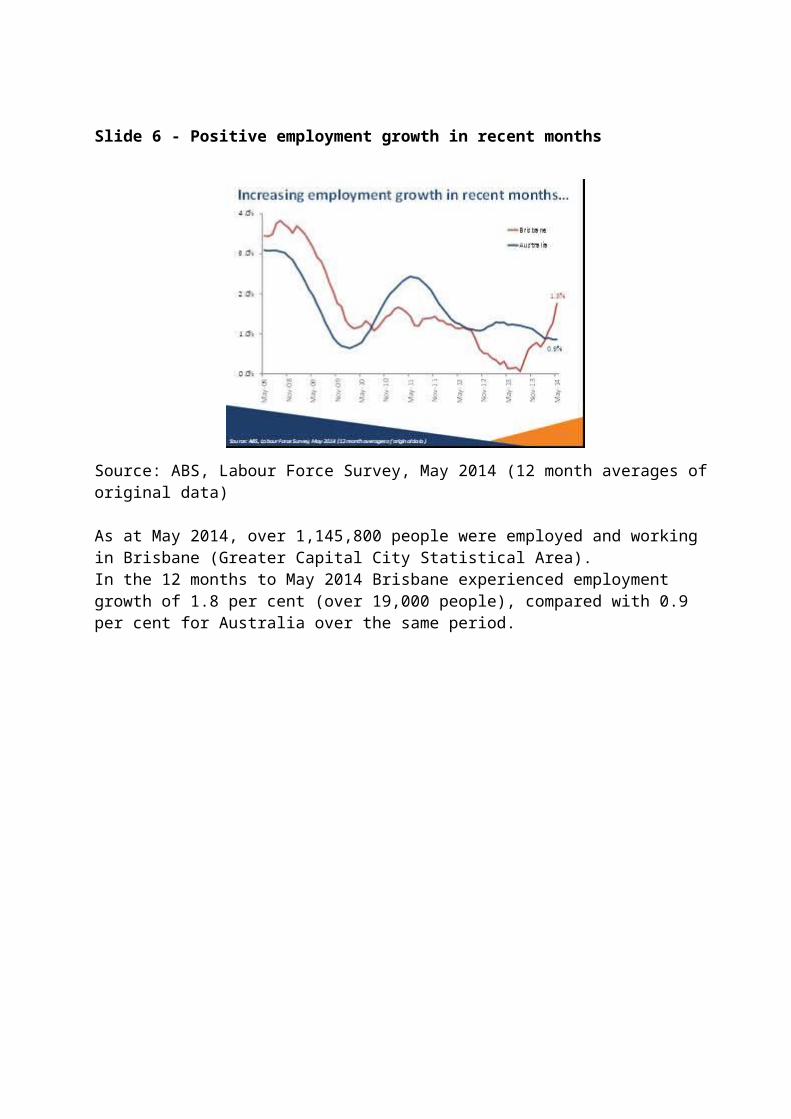
Slide 6 - Positive employment growth in recent months
Source: ABS, Labour Force Survey, May 2014 (12 month averages of original data) As at May 2014, over 1,145,800 people were employed and working in Brisbane (Greater Capital City Statistical Area). In the 12 months to May 2014 Brisbane experienced employment growth of 1.8 per cent (over 19,000 people), compared with 0.9 per cent for Australia over the same period.
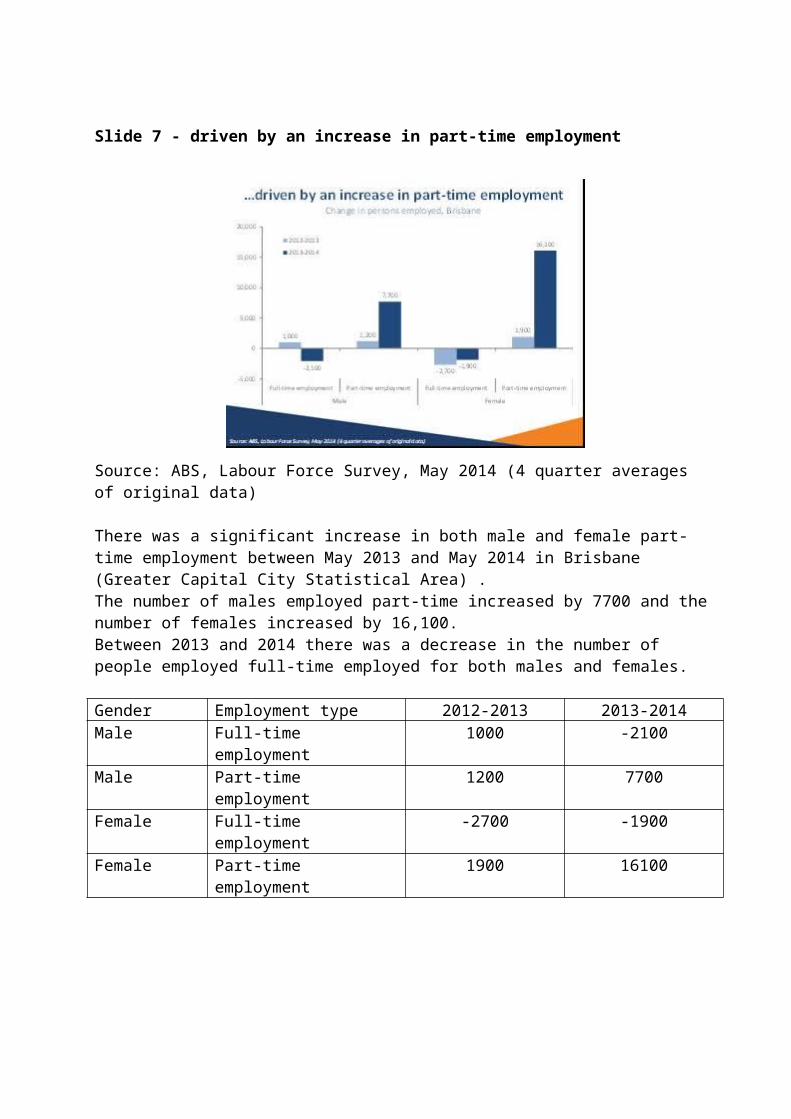
Slide 7 - driven by an increase in part-time employment
Source: ABS, Labour Force Survey, May 2014 (4 quarter averages of original data)
There was a significant increase in both male and female part-time employment between May 2013 and May 2014 in Brisbane (Greater Capital City Statistical Area) . The number of males employed part-time increased by 7700 and the number of females increased by 16,100.Between 2013 and 2014 there was a decrease in the number of people employed full-time employed for both males and females.
Gender Employment type 2012-2013 2013-2014Male Full-time employment 1000 -2100Male Part-time employment 1200 7700Female Full-time employment -2700 -1900Female Part-time employment 1900 16100
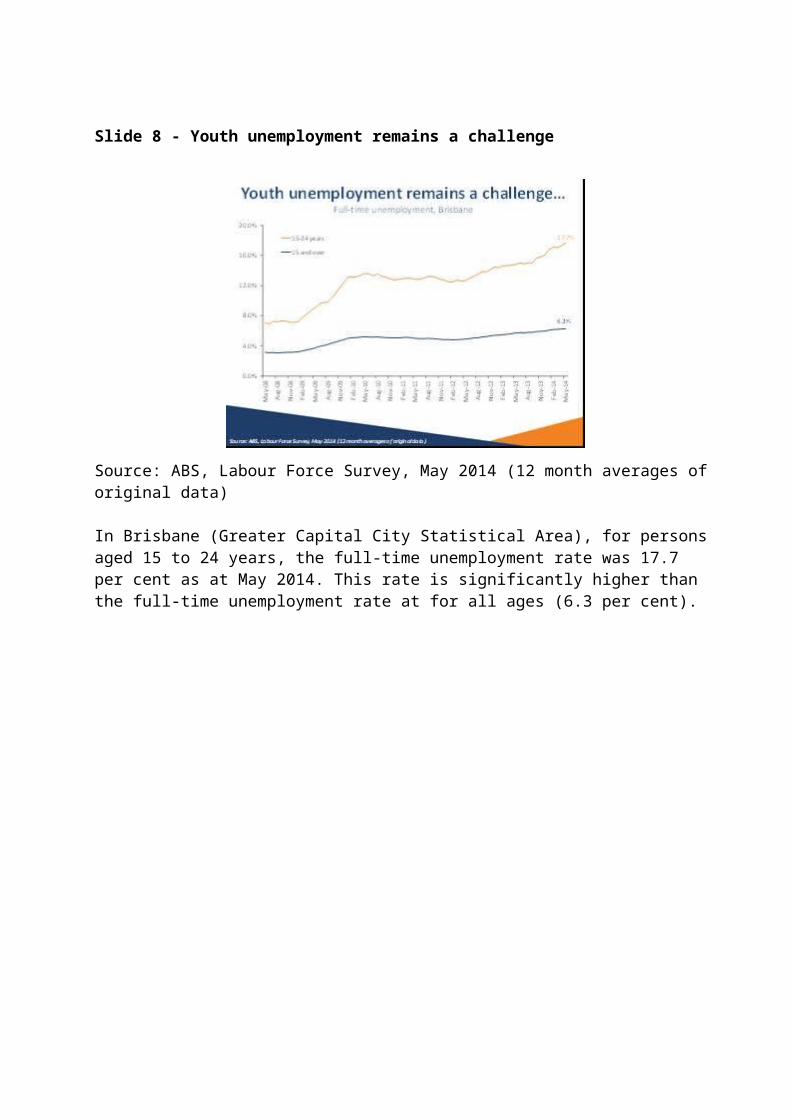
Slide 8 - Youth unemployment remains a challenge
Source: ABS, Labour Force Survey, May 2014 (12 month averages of original data)
In Brisbane (Greater Capital City Statistical Area), for persons aged 15 to 24 years, the full-time unemployment rate was 17.7 per cent as at May 2014. This rate is significantly higher than the full-time unemployment rate at for all ages (6.3 per cent).
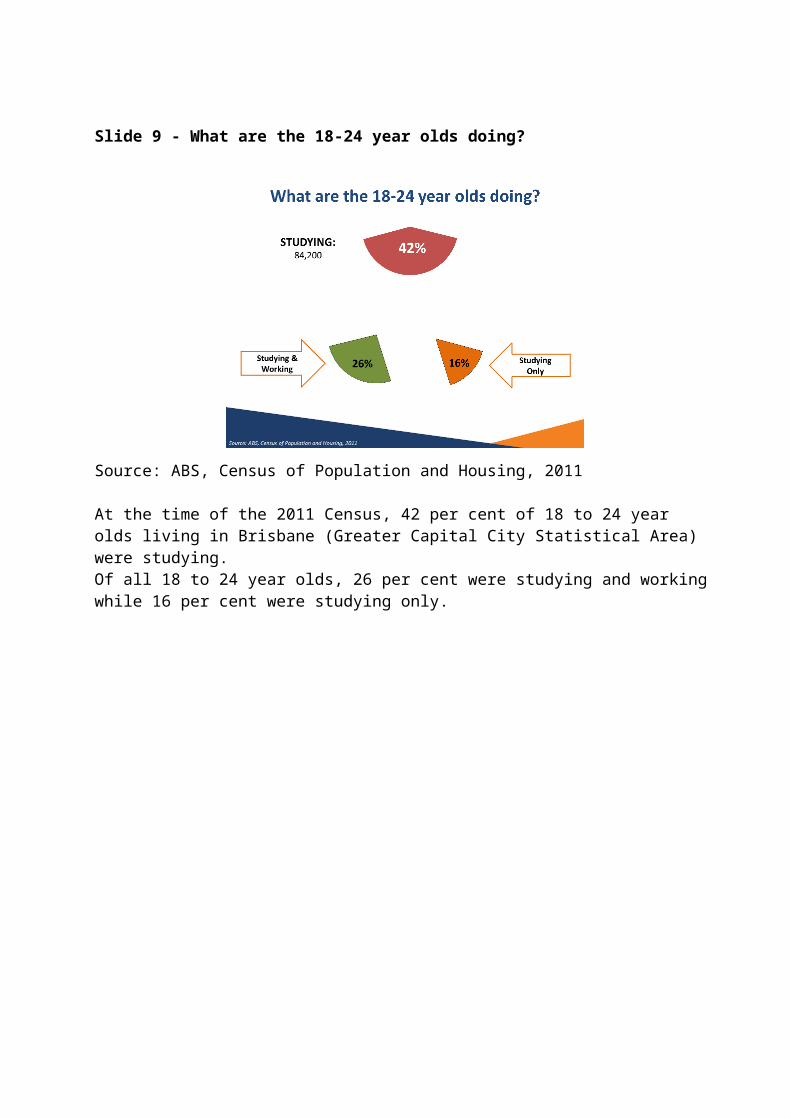
Slide 9 - What are the 18-24 year olds doing?
Source: ABS, Census of Population and Housing, 2011
At the time of the 2011 Census, 42 per cent of 18 to 24 year olds living in Brisbane (Greater Capital City Statistical Area) were studying. Of all 18 to 24 year olds, 26 per cent were studying and working while 16 per cent were studying only.
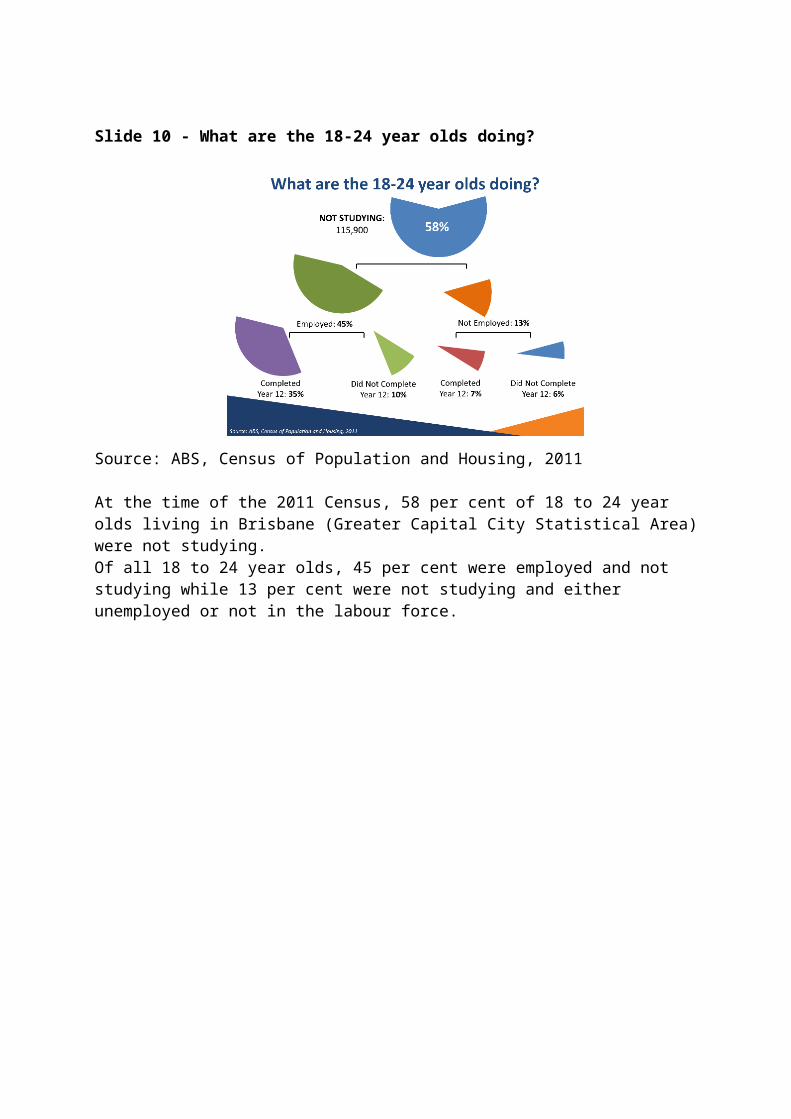
Slide 10 - What are the 18-24 year olds doing?
Source: ABS, Census of Population and Housing, 2011
At the time of the 2011 Census, 58 per cent of 18 to 24 year olds living in Brisbane (Greater Capital City Statistical Area) were not studying. Of all 18 to 24 year olds, 45 per cent were employed and not studying while 13 per cent were not studying and either unemployed or not in the labour force.
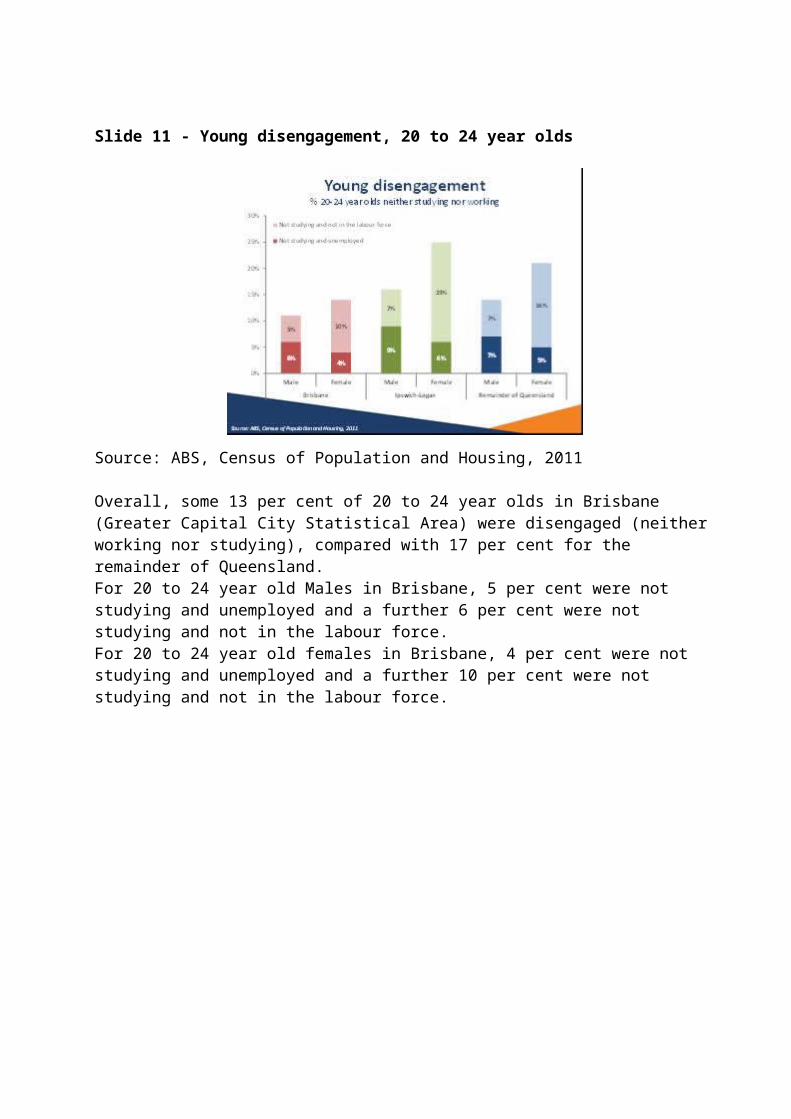
Slide 11 - Young disengagement, 20 to 24 year olds
Source: ABS, Census of Population and Housing, 2011
Overall, some 13 per cent of 20 to 24 year olds in Brisbane (Greater Capital City Statistical Area) were disengaged (neither working nor studying), compared with 17 per cent for the remainder of Queensland.For 20 to 24 year old Males in Brisbane, 5 per cent were not studying and unemployed and a further 6 per cent were not studying and not in the labour force.For 20 to 24 year old females in Brisbane, 4 per cent were not studying and unemployed and a further 10 per cent were not studying and not in the labour force.
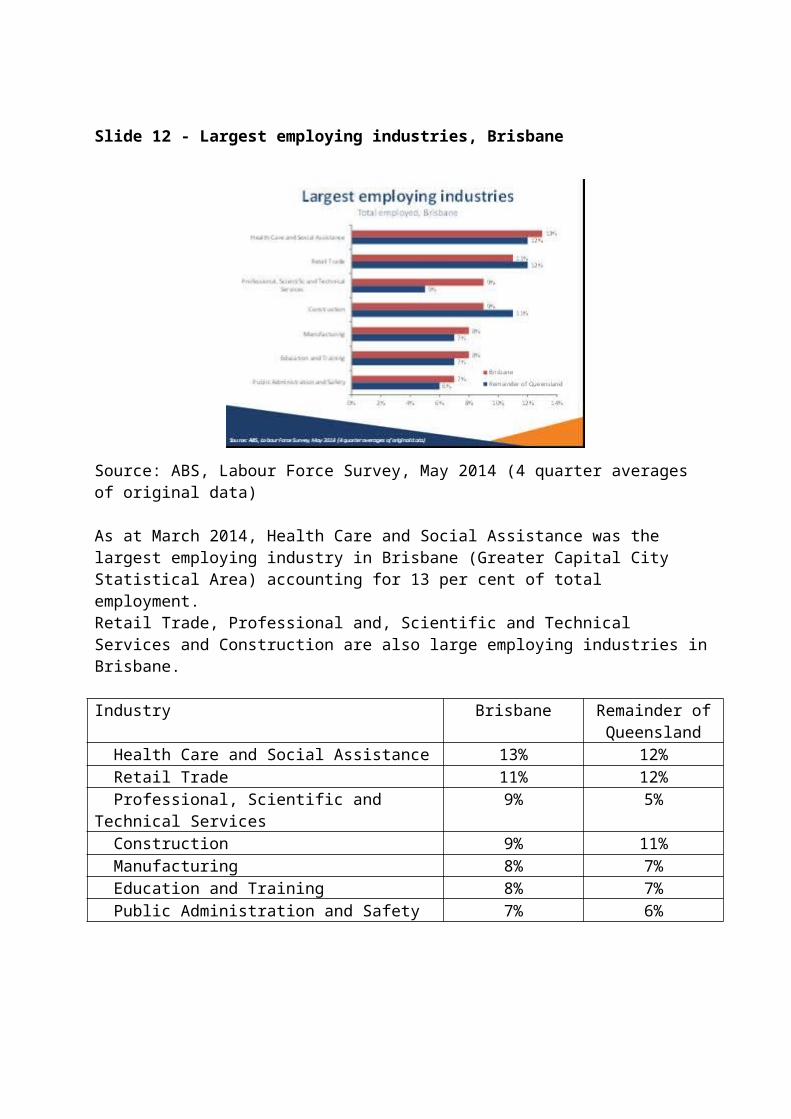
Slide 12 - Largest employing industries, Brisbane
Source: ABS, Labour Force Survey, May 2014 (4 quarter averages of original data)
As at March 2014, Health Care and Social Assistance was the largest employing industry in Brisbane (Greater Capital City Statistical Area) accounting for 13 per cent of total employment. Retail Trade, Professional and, Scientific and Technical Services and Construction are also large employing industries in Brisbane.
Industry Brisbane Remainder of Queensland
Health Care and Social Assistance 13% 12% Retail Trade 11% 12% Professional, Scientific and Technical Services 9% 5% Construction 9% 11% Manufacturing 8% 7% Education and Training 8% 7% Public Administration and Safety 7% 6%
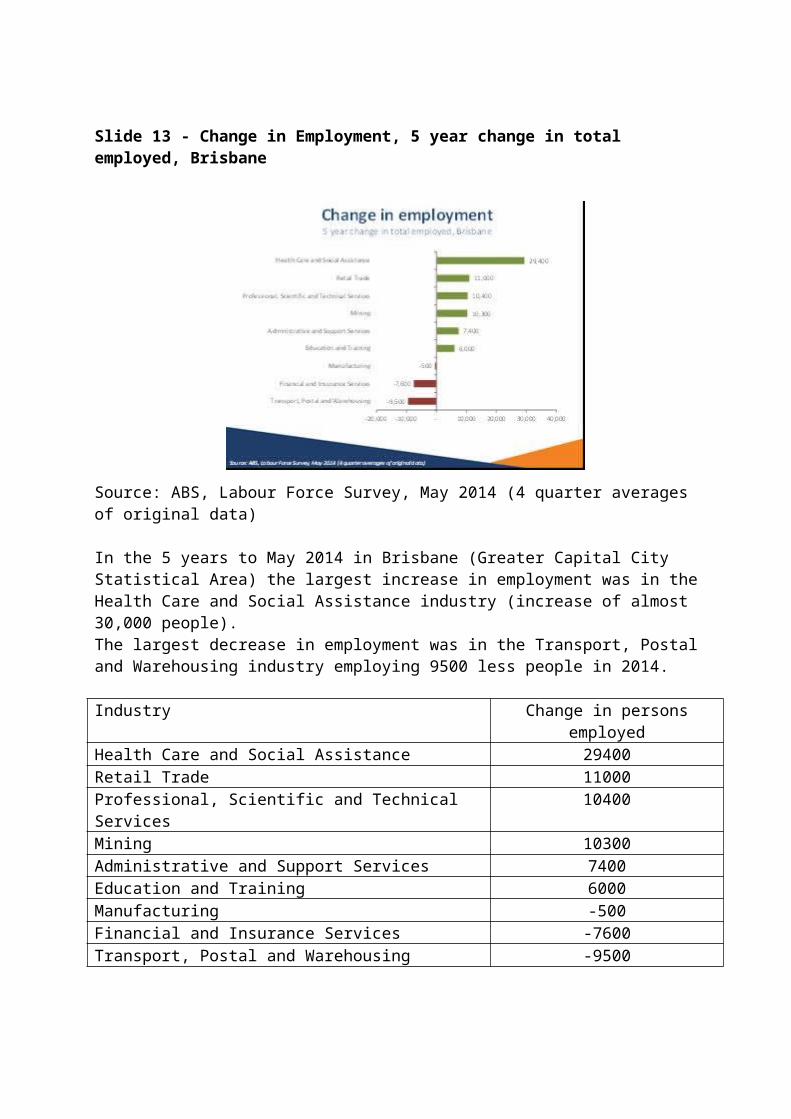
Slide 13 - Change in Employment, 5 year change in total employed, Brisbane
Source: ABS, Labour Force Survey, May 2014 (4 quarter averages of original data)
In the 5 years to May 2014 in Brisbane (Greater Capital City Statistical Area) the largest increase in employment was in the Health Care and Social Assistance industry (increase of almost 30,000 people).The largest decrease in employment was in the Transport, Postal and Warehousing industry employing 9500 less people in 2014.
Industry Change in persons employedHealth Care and Social Assistance 29400Retail Trade 11000Professional, Scientific and Technical Services 10400Mining 10300Administrative and Support Services 7400Education and Training 6000Manufacturing -500Financial and Insurance Services -7600Transport, Postal and Warehousing -9500
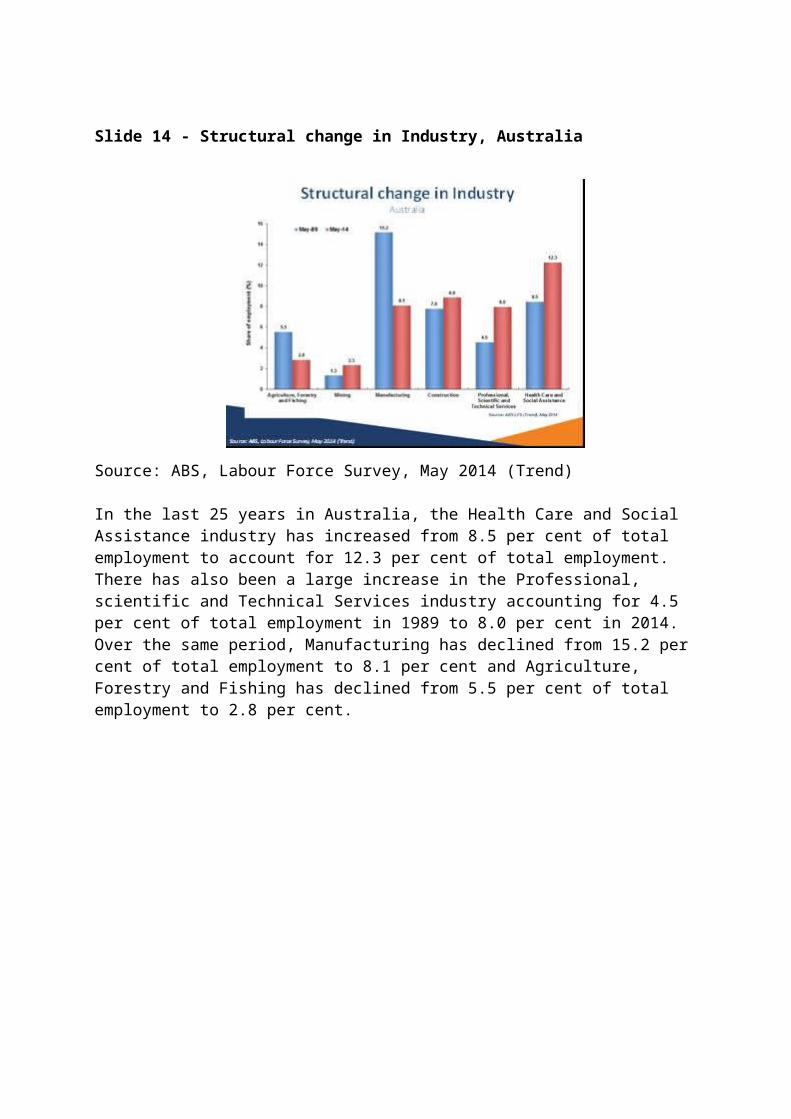
Slide 14 - Structural change in Industry, Australia
Source: ABS, Labour Force Survey, May 2014 (Trend)
In the last 25 years in Australia, the Health Care and Social Assistance industry has increased from 8.5 per cent of total employment to account for 12.3 per cent of total employment.There has also been a large increase in the Professional, scientific and Technical Services industry accounting for 4.5 per cent of total employment in 1989 to 8.0 per cent in 2014.Over the same period, Manufacturing has declined from 15.2 per cent of total employment to 8.1 per cent and Agriculture, Forestry and Fishing has declined from 5.5 per cent of total employment to 2.8 per cent.
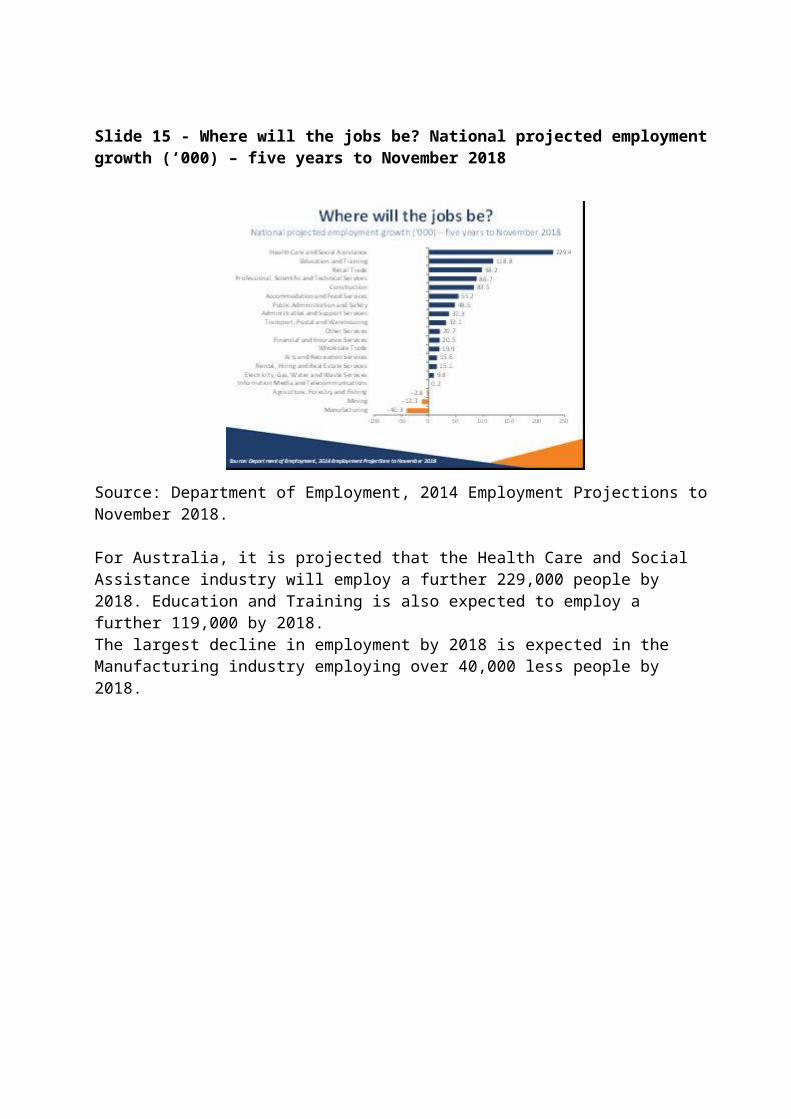
Slide 15 - Where will the jobs be? National projected employment growth (‘000) – five years to November 2018
Source: Department of Employment, 2014 Employment Projections to November 2018.
For Australia, it is projected that the Health Care and Social Assistance industry will employ a further 229,000 people by 2018. Education and Training is also expected to employ a further 119,000 by 2018.The largest decline in employment by 2018 is expected in the Manufacturing industry employing over 40,000 less people by 2018.
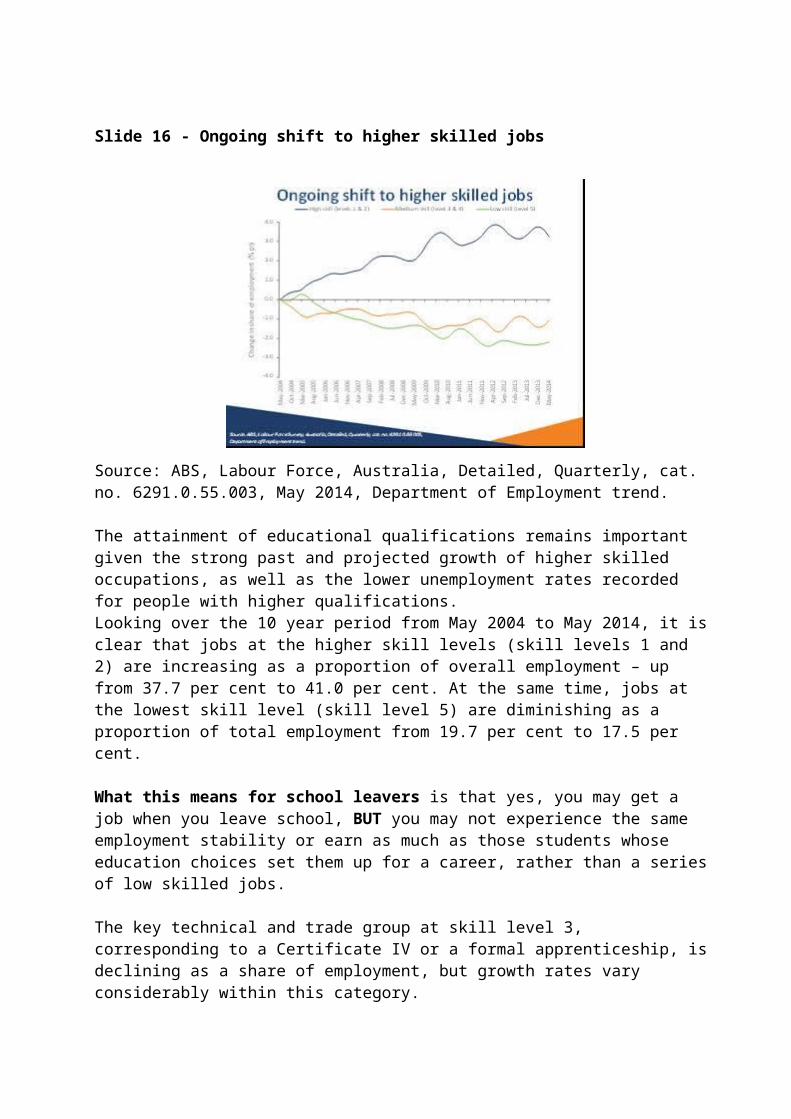
Slide 16 - Ongoing shift to higher skilled jobs
Source: ABS, Labour Force, Australia, Detailed, Quarterly, cat. no. 6291.0.55.003, May 2014, Department of Employment trend.
The attainment of educational qualifications remains important given the strong past and projected growth of higher skilled occupations, as well as the lower unemployment rates recorded for people with higher qualifications. Looking over the 10 year period from May 2004 to May 2014, it is clear that jobs at the higher skill levels (skill levels 1 and 2) are increasing as a proportion of overall employment – up from 37.7 per cent to 41.0 per cent. At the same time, jobs at the lowest skill level (skill level 5) are diminishing as a proportion of total employment from 19.7 per cent to 17.5 per cent.
What this means for school leavers is that yes, you may get a job when you leave school, BUT you may not experience the same employment stability or earn as much as those students whose education choices set them up for a career, rather than a series of low skilled jobs.
The key technical and trade group at skill level 3, corresponding to a Certificate IV or a formal apprenticeship, is declining as a share of employment, but growth rates vary considerably within this category.
Note:Skill Level 1 is commensurate with a Bachelor degree or higher qualification Skill Level 2 is commensurate with an Advanced Diploma or Diploma Skill Level 3 is commensurate with a Certificate IV or III (including at least 2 years of on-the-job training)Skill Level 4 is commensurate with a Certificate II or III Skill Level 5 is commensurate with a Certificate I or secondary education

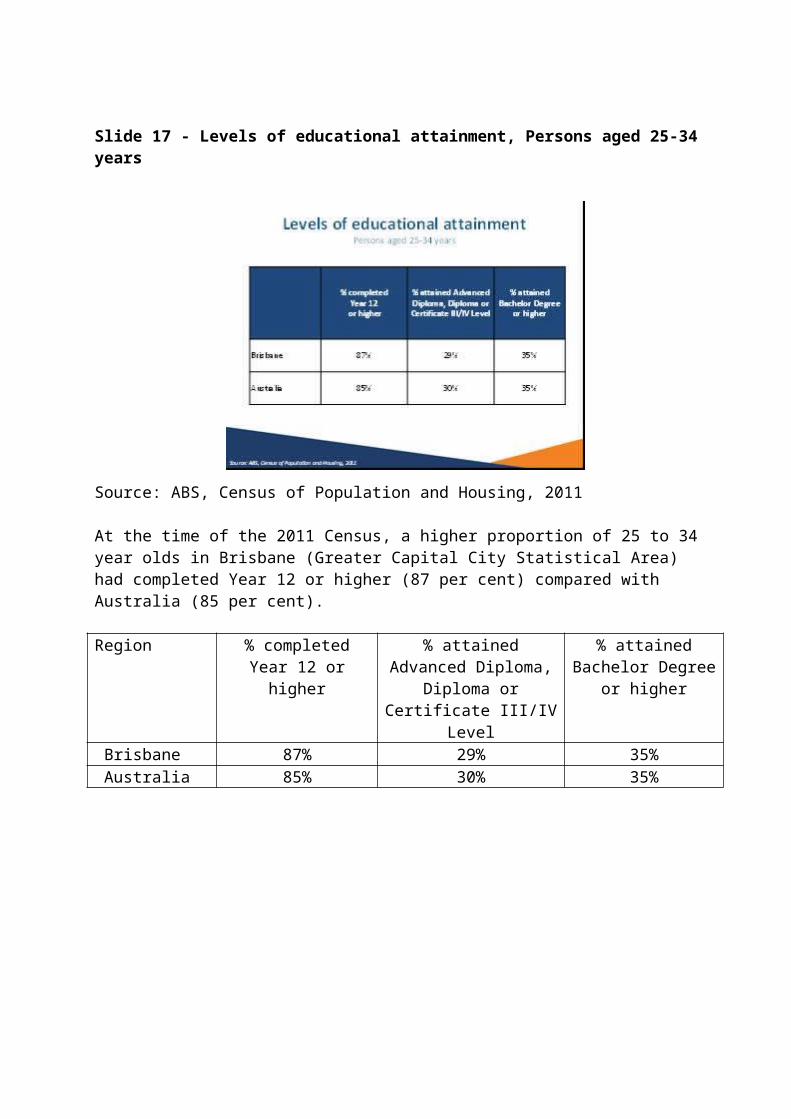
Slide 17 - Levels of educational attainment, Persons aged 25-34 years
Source: ABS, Census of Population and Housing, 2011
At the time of the 2011 Census, a higher proportion of 25 to 34 year olds in Brisbane (Greater Capital City Statistical Area) had completed Year 12 or higher (87 per cent) compared with Australia (85 per cent).
Region % completed Year 12 or higher
% attained Advanced Diploma, Diploma or Certificate III/IV Level
% attained Bachelor Degree or higher
Brisbane 87% 29% 35% Australia 85% 30% 35%
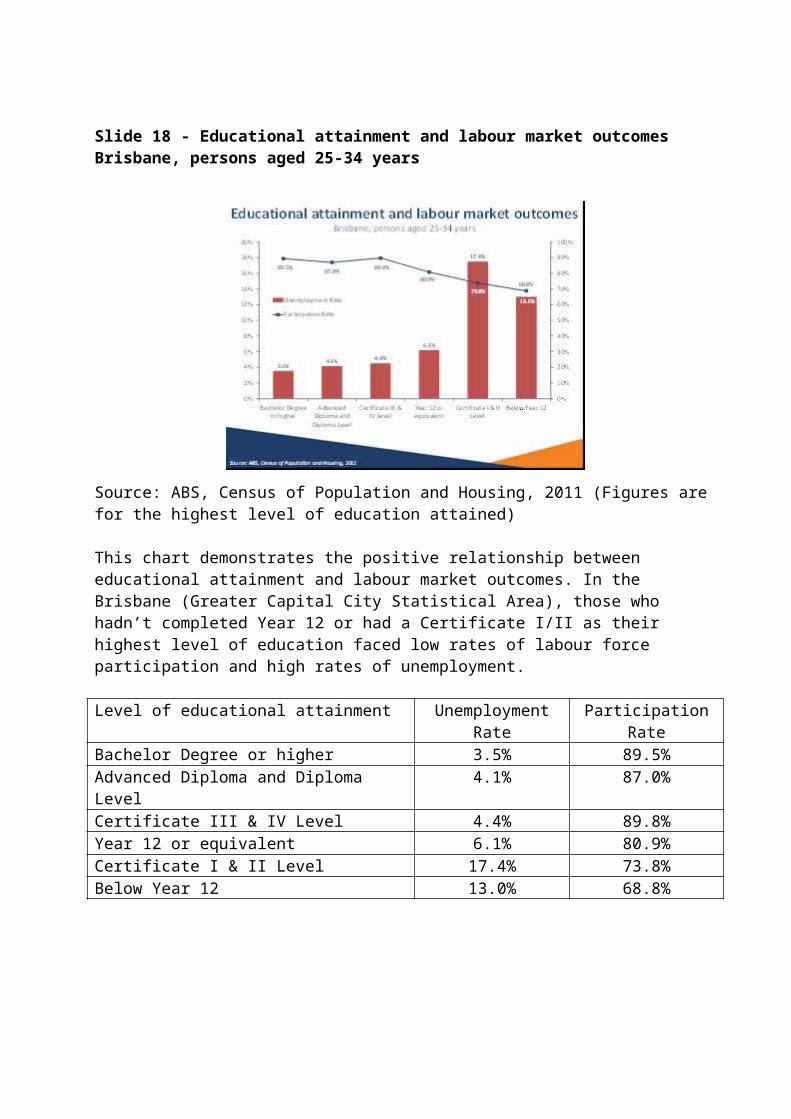
Slide 18 - Educational attainment and labour market outcomes Brisbane, persons aged 25-34 years
Source: ABS, Census of Population and Housing, 2011 (Figures are for the highest level of education attained)
This chart demonstrates the positive relationship between educational attainment and labour market outcomes. In the Brisbane (Greater Capital City Statistical Area), those who hadn’t completed Year 12 or had a Certificate I/II as their highest level of education faced low rates of labour force participation and high rates of unemployment.
Level of educational attainment Unemployment Rate Participation RateBachelor Degree or higher 3.5% 89.5%Advanced Diploma and Diploma Level 4.1% 87.0%Certificate III & IV Level 4.4% 89.8%Year 12 or equivalent 6.1% 80.9%Certificate I & II Level 17.4% 73.8%Below Year 12 13.0% 68.8%
Slide 19 - What are employers telling us?
Slide 20 - Reasons applicants didn’t get an interview
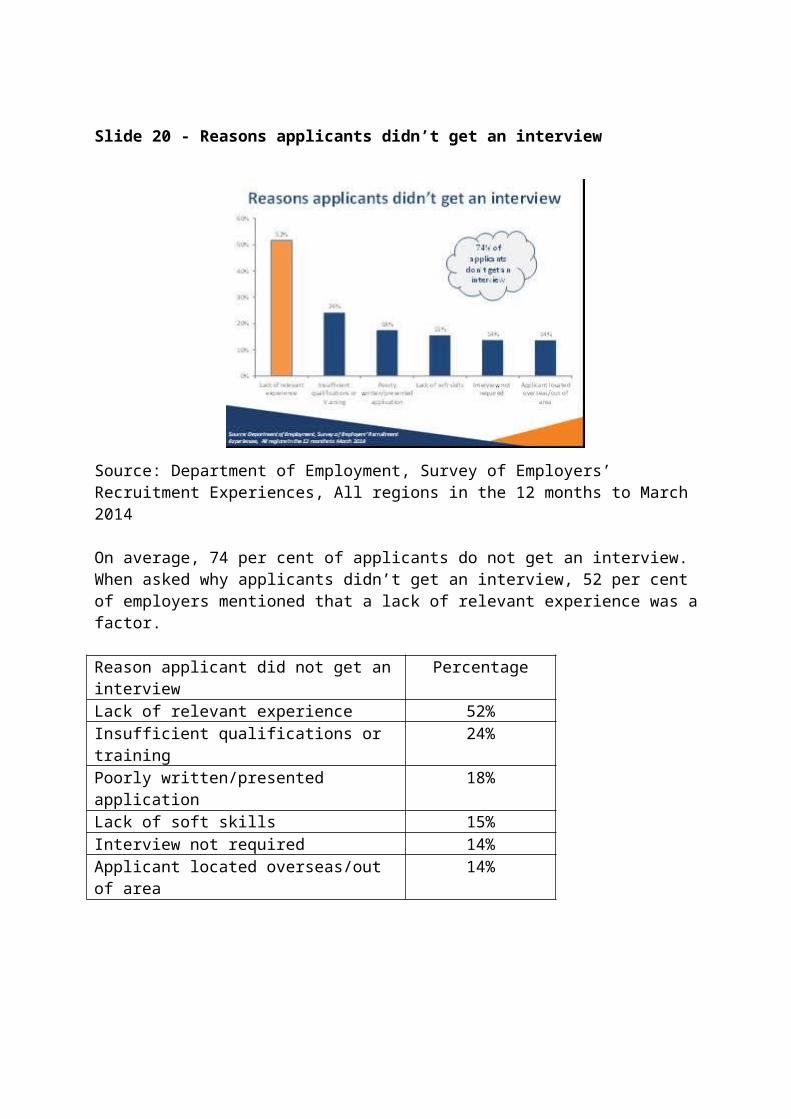
Source: Department of Employment, Survey of Employers’ Recruitment Experiences, All regions in the 12 months to March 2014
On average, 74 per cent of applicants do not get an interview.When asked why applicants didn’t get an interview, 52 per cent of employers mentioned that a lack of relevant experience was a factor.
Reason applicant did not get an interview PercentageLack of relevant experience 52%Insufficient qualifications or training 24%Poorly written/presented application 18%Lack of soft skills 15%Interview not required 14%Applicant located overseas/out of area 14%
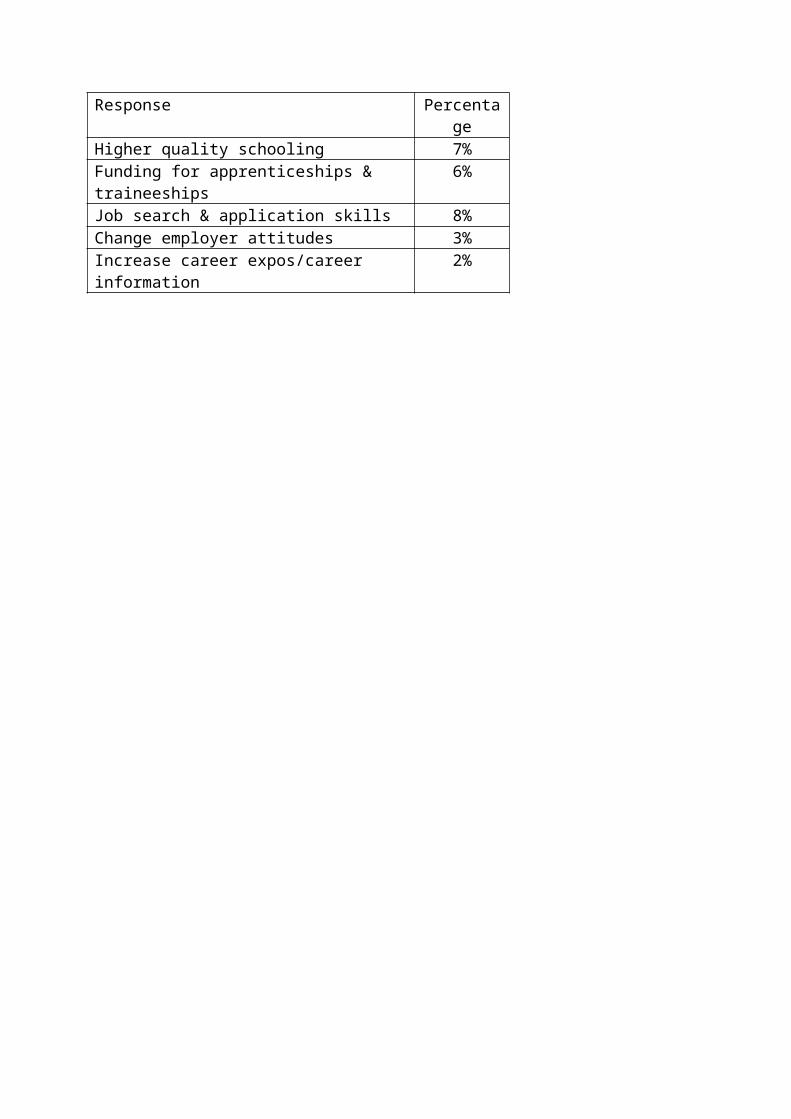
Slide 21- Improving young people’s chances of getting a job – employers’ views
Source: Department of Employment, Survey of Employers’ Recruitment Experiences, various regions, October 2013 to April 2014
The results in this graph are based on 3142 responding employers who were surveyed between October 2013 and April 2014 in the Gladstone Employment Service Area (ESA), Bundaberg ESA, Central Victoria Priority Employment Area (PEA), Port Augusta – Whyalla – Port Pirie PEA, Sydney West and Blue Mountains PEA, Illawarra PEA, Caboolture-Sunshine Coast PEA, and Tasmania (excluding Hobart Statistical District). Some employers provided more than one response.
Response PercentageAttitude 36%Reliability & responsibility 12%Physical presentation 11%Realistic role/salary expectations 5%Literacy & numeracy 4%Communication 3%Work experience 13%Further education & training 10%Higher quality schooling 7%Funding for apprenticeships & traineeships 6%Job search & application skills 8%Change employer attitudes 3%Increase career expos/career information 2%

Slide 22 - Employability skills essential
Source: Department of Employment, Survey of Employers’ Recruitment Experiences, December 2013; Department of Employment, Survey of Employers’ Recruitment Experiences, All regions surveyed in the 12 months to December 2010
71 per cent of employers said that personality traits/qualities are more or equally important as technical skills
Employers want people who can/have:• Enthusiastic/positive attitude• Interact/connect with others/teamwork• Hardworking/good work ethic• Communicate (higher order skill – e.g. hold an argument)• Make good decisions• Reliable
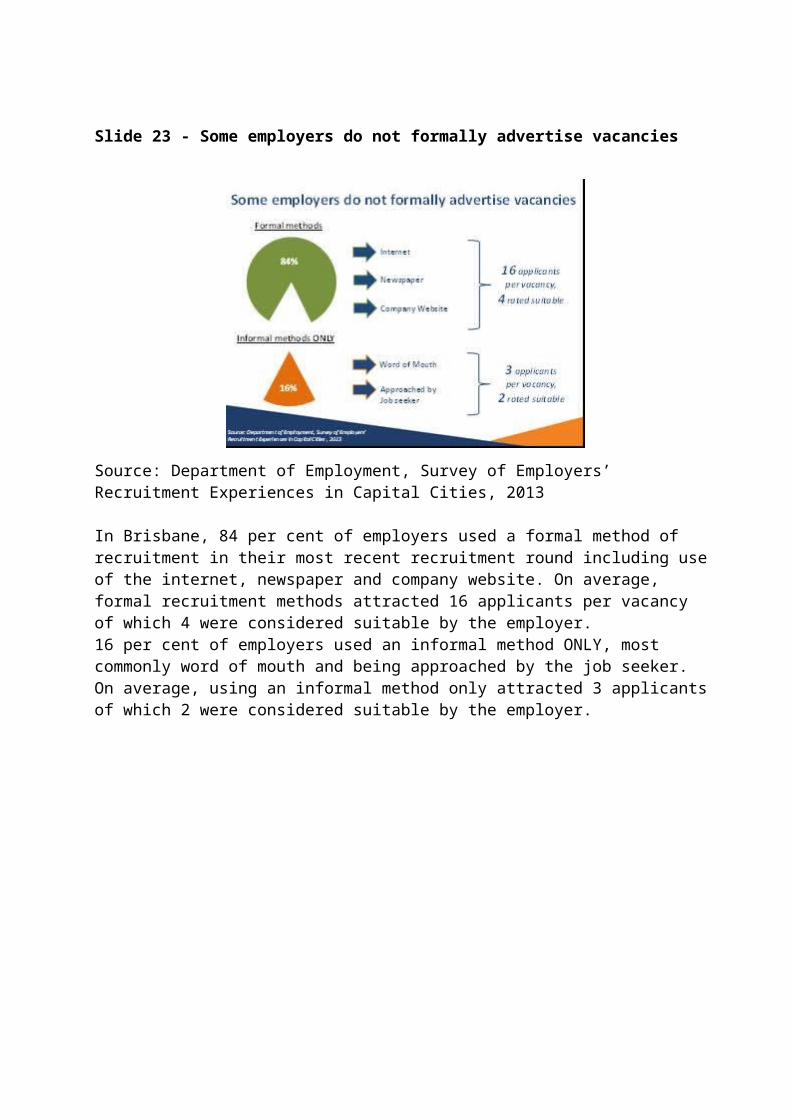
Slide 23 - Some employers do not formally advertise vacancies
Source: Department of Employment, Survey of Employers’ Recruitment Experiences in Capital Cities, 2013
In Brisbane, 84 per cent of employers used a formal method of recruitment in their most recent recruitment round including use of the internet, newspaper and company website. On average, formal recruitment methods attracted 16 applicants per vacancy of which 4 were considered suitable by the employer.16 per cent of employers used an informal method ONLY, most commonly word of mouth and being approached by the job seeker. On average, using an informal method only attracted 3 applicants of which 2 were considered suitable by the employer.

Slide 24 - Conclusion
Labour market conditions are mixed• Recent employment growth • Vacancies falling• High competition for jobs
Challenges for the region• Unemployment rate for young people much higher and increasing • Shift to services sector and higher skilled jobs
Opportunities • Strong growth industries: Health Care and Social Assistance• Unfilled vacancies for many higher skilled occupations, particularly Trades Workers
Job seekers require• Education / training• Employability skills• Work experience / apprenticeships
Slide 25 - Further Information
More information on labour market conditions and other research on small areas can be found on these web sites:
• www.employment.gov.au/LMIP• www.employment.gov.au/SkillShortages• www.employment.gov.au/RegionalReports• www.employment.gov.au/australianjobs• www.joboutlook.gov.au
A report on the survey findings for the fourth annual Survey of Employers’ Recruitment Experiences in Capital Cities has been placed on the regional reports section of the Department of Employment - Regional Reports web site.
Slide 26 – Australian Government Department of Employment