skin in the game: incentives in crowdfunding - duke …mpuri/papers/skininthegame.pdf · skin in...
TRANSCRIPT
Skin in the Game:
Incentives in Crowdfunding
Thomas Hildebrand,† Manju Puri,‡ and Jörg Rocholl§
October 2011
This paper analyses the incentives in the new and significantly growing markets for crowdfunding. In these consumer lending markets, lenders can give their money directly to borrowers without the intermediation of a financial institution. We are able to take advantage of the elimination of origination fees (group leader rewards) in an online social lending market and use a difference-in-difference approach to see how the same lenders behave when the origination fees are eliminated. The results show that there is a marked change in the incentives of these group leaders, which affect the kind of loans being originated and the performance of these loans. When group leaders earn rewards, the default rates are substantially higher for the loans that they originate, while, after the abolition of rewards, group leaders originate loans with significantly lower borrower default rates. We also find that, in the presence of rewards, only when group leaders have a substantial share of the originated loan are the default rates lower. The results provide important implications for the incentives in crowdfunding as well as the question of how retail consumers can be protected against unscrupulous lending and thus the ongoing debate about the proper regulatory framework for consumer lending.
We thank Tim Adam, Arnoud Boot, Christian Ehm, Masami Imai, Michael Koetter, Benjamin Klaus, Nagpurnanand R. Prabhala, Enrichetta Ravina, Yishay Yafeh, and seminar participants at the American Economic Association (AEA) meetings, Western Finance Association (WFA) meetings, 11th Annual Bank of Finland/CEPR Conference, German Finance Association (DGF) meetings, European Finance Association (EFA) meetings, Financial Management Association (FMA) meetings, 21st Annual Conference on Financial Economics and Accounting (CFEA) at the University of Maryland, DIW Berlin Finance Conference 2011, London School of Economics, Tilburg University, BI Oslo, Duke University, ESMT Berlin, Humboldt University Berlin, University of Karlsruhe, University of Tübingen, University of Mannheim, and University of Maastricht. † ESMT European School of Management and Technology. Email: [email protected]. Tel: +49 30 21231-5612. ‡ Duke University and NBER. Email: [email protected]. Tel: (919) 660-7657. § ESMT European School of Management and Technology. Email: [email protected]. Tel: +49 30 21231-1292.

2
1. Introduction
The issue of consumer protection has been at the forefront of the current regulatory and
academic debate. The idea that consumers need protection and can be taken advantage of
by unscrupulous lenders has been expounded by a large number of regulators and
academicians.1 These concerns have led to the creation of the Consumer Financial
Protection Bureau (CFPB) in the 2010 Dodd-Frank Act, which aims to protect consumers
by regulating and enforcing consumer financial laws and thus restricting unfair treatment.
While the issue of consumer protection pervades lending markets of all kinds, it is
particularly pertinent in the new and significantly growing market for crowdfunding, in
which individuals can directly finance other individuals without financial intermediation,
making use of the growing availability and verifiability of information on these
individuals. Crowdfunding, with its applicability to various areas and its significant
potential pool of capital, has recently received strong bipartisan support as a means to
alleviate constraints for the financing of individuals and small business and thus of
economic growth. For example, the SEC has been considering several proposals in this
context, in line with President Obama’s advocating of exemptions from existing rules.2
As of date, crowdfunding in the form of online lending in peer-to-peer transactions has
grown into a billion-dollar industry, which, according to the CFPB, “could have
significant implications for consumers seeking alternative sources of credit.”3 Despite
the growing importance of these markets there has been relatively little discussion on the
appropriate level of regulation. Our understanding of these markets is limited because
they differ from traditional lending markets in a number of ways. An important feature
of these markets is that investors act as both lenders and borrowers with little or no
1 For example, President Obama motivated the creation of the Consumer Financial Protection Bureau as
follows: “Millions of Americans who have worked hard and behaved responsibly have seen their life
dreams eroded by the irresponsibility of others and the failure of their government to provide adequate
oversight. Our entire economy has been undermined by that failure.” 2 See for example, “Pennies from Many“, New York Times, September 25, 2011. 3 GAO Report to Congressional Commitees, Person to Person Lending, July 2011, Page 56.

3
institutional lending. Often retail investors act as group leaders or certification agents.
What are the incentives of players in such markets? Are sophisticated investors taking
advantage of unsophisticated investors? What are the implications for the kinds of loans
originated and default rates? The answer to such questions would be a first step towards
understanding the appropriate regulatory framework for such markets.
In this paper we take advantage of a unique opportunity to study some of these questions.
We examine a clearly defined major change on the online social lending platform
Prosper.com, on which lenders can give their money directly to borrowers without the
intermediation of a financial institution. Prosper.com is the market leader for online
social lending and provides a clean, close to ideal opportunity for our analysis as it
provides on its webpage detailed information on individual borrowers, their loan
requests, funding success, interest rates, and subsequent loan performance. In particular
we are able to take advantage of the elimination of origination fees (group leader
rewards) and use a difference-in-difference approach to see how the same lenders behave
when the origination fees are eliminated.
We find a marked change in the incentives of these group leaders, which affect the kind
of loans being originated, and the performance of these loans. When group leaders can
earn rewards, the default rates are substantially higher for the loans that they originate.
From an economic standpoint, it still pays for the group leader to originate these loans as
his reward exceeds the losses from the increased likelihood of default, while other lenders
and borrowers lose on these loans. In strict contrast, after the abolition of rewards, group
leader behave much more responsibly and originate loans with significantly lower
borrower default rates.
Our results also suggest that, with the existence of rewards or origination fees, a group
leader has the right incentives to screen only if he has substantial skin in the game, i.e.
when he contributes a substantial fraction of the requested loan amount and is thus
severely hurt by losing money when a borrower defaults. In this case, the default rates are
significantly lower than for other loans and almost identical to those for loans after the

4
elimination of group leader rewards. A group leader with a substantial share of the
originated loan thus makes responsible lending decisions that do not hurt borrowers and
co-lenders.
Our paper is related to a number of different literatures. First, our paper relates to
growing literature on irresponsible advice and lending by financial intermediaries and the
resulting need for regulatory intervention and consumer protection, such as for example
Bolton, Freixas, and Shapiro (2007), Bergstresser, Chalmers, and Tufano (2009), and
Inderst and Ottaviani (2009).
Second, it is related to the classic literature that theorizes how incentives shape behavior
to draw implications for financial markets. In theory there are a host of papers that look
at how information asymmetry can result in agency problems and the mechanisms needed
to overcome them e.g., Holmstrom and Tirole (1997); Gorton and Pennacchi (1995)
model the importance of skin in the game i.e., of the informed lender or monitor taking
enough of a financial interest in the firm to reassure investors to solve the classic
problems of adverse selection and moral hazard. Empirical work documenting how
theorized effects translate into reality have lagged behind, largely because there are few
natural experiments or settings where one can directly test for incentive effects. There
are a few notable exceptions e.g. in a recent JPE issue, Muralidharan and Sundararaman
(2011), examine an experiment testing incentive effects in teacher pay performance
program. By examining a setting where there is a change in rules that disallow
origination fees we can see if for the same lenders there is a distinct change in behavior
that would correspond to theory.
Third, our paper is related to the growing literature on the differences between kinds of
information e.g., hard and soft, and how these are incorporated in the face of new
technology. Finally, there are a growing number of paper that analyze online peer to peer
lending. Hulme and Wright (2006) provide an overview of the historical origins and
contemporary social trends of online social lending. Ravina (2008) and Pope and Sydnor
(2009) analyze whether there is discrimination on Prosper.com in terms of socio-

5
demographic variables such as race and gender. These characteristics are taken care of by
the difference-in-difference methodology employed in this paper. Iyer, Khwaja, Luttmer,
and Shue (2009) test whether lenders can infer soft information in Prosper. Lin,
Prabhala, and Viswanathan (2009) test which role social networks and in particular “the
company that borrowers keep”, i.e. the borrowers’ friends, play for the lending outcome.
Unlike other papers, we focus on a rule change to analyze cleanly the impact of
incentives on loan origination and performance.
The rest of the paper is structured as follows. The next section describes the institutional
setting on the platform and provides an overview over the data. Section 3 presents the
analysis and the univariate and multivariate results. In section 4, we provide a number of
robustness tests. Section 5 concludes.
2. Institutional Setting and Data
2.1. The General Setup
Prosper.com provides a basis for the interaction between two sides: on the one side the
potential borrowers, who are looking for money for some specific purpose; on the other
side the potential lenders, who are interested in opportunities and projects to invest their
money into.4 After registering on the platform, borrowers can post a listing in which they
ask for money and provide different types of information so that potential lenders can
better assess their creditworthiness. These types of information can be classified into hard
and soft information:
• Hard information
o On the borrower: Prosper.com assigns a unique identification number to each
borrower and requires him to provide his social security number, driver’s
license number, and bank account information so that Prosper.com can verify
4 Institutions are not allowed on Prosper.com during the sample period, so only private persons may serve as borrowers or lenders.

6
his identity and obtain his Experian Scorex PLUSSM credit report. Of
particular importance here is the credit grade, which ranges from AA for the
best customers over A, B, C, D, and E to HR for the worst customers and
which is assigned to potential borrowers based on their Experian credit score.
The credit report, which is not reviewed or verified by Prosper.com, also
includes the borrower’s default history, which is thus observable by potential
lenders.
o On the listing: Borrowers set the amount they request, which is between
$1,000 and $25,000, as well as the maximum interest rate they are willing to
pay. In some states, there are interest rate caps, while in the other states the
maximum interest rate may go up to 35% – an interest rate cap set by
Prosper.com.
• Soft information
This information is provided by the borrower herself and only some of it is
verified. Examples of this soft information are borrower state, income range, and
house ownership. Additionally, the borrower has the possibility to post one or
more photos, e.g. of her or the object that she wants to finance with the loan.
Borrowers can explain what they want to spend the money on, how they intend to
pay it back by providing a budget, and why they are particularly reliable and
trustworthy.
Lenders have the possibility to screen the listings and can place one or several bids of at
least $50 on any of them at any interest rate below or equal to the maximum interest rate
requested by the borrower. These bids cannot be canceled or withdrawn. The bidding on
the listing is performed as an open uniform-price auction in which everybody can observe
each other’s actions. As long as the aggregate supply on a listing does not exceed the
borrower’s demand, bidders can see the amount of the other bids, but not the interest
rates of those bids. They only observe the maximum interest rate that the borrower is
willing to pay. Once the aggregate supply exceeds the borrower’s demand, bidders can
also see the marginal interest rate so that they know which rate they have to underbid to

7
be able to serve as a lender. As a consequence, lenders who offer the highest interest rates
are outbid, so that the resulting interest rate is bid down until the duration of the listing
expires and the listing becomes a loan. Alternatively, borrowers can also choose that the
listing is closed and the loan is funded as soon as the total amount bid reaches the amount
requested. In the end, all winning bidders receive the same interest rate, which is the
marginal interest rate. In case the total amount bid does not reach or exceed the amount
requested within the duration time, the listing expires and no transaction takes place. All
loans on Prosper.com are 36-months annuity loans, which can be paid back in advance
though. The platform makes money from charging fees to borrowers and lenders once a
listing is completely funded and becomes a loan. Borrowers pay – depending on their
credit grade – a one-time fee (between 1% and 5% of the loan amount), which is
subtracted from the gross loan amount. Lenders pay a 1% annual servicing fee.
A borrower who defaults on his loan is reported to credit bureaus so that this information
is recorded in the borrower’s credit report. Prosper.com uses collection agencies to
recover the outstanding balances, and the fees for these agencies are borne by the
defaulting borrowers’ lenders. Loans are unsecured and there is no second market for
these loans unless they become overdue; Prosper.com then reserves the right to sell the
loans to outside debt buyers.
On Prosper.com, platform members can organize themselves in groups in order to
facilitate the process of borrowing and lending as well as the interaction between each
other. Each user can form a group by defining the purpose of the group as well as the
nature and interests of its members and thus become a group leader. Each user can be
member (and thus group leader) of at most one group. The group leader administers her
group and can additionally act as a lender and / or borrower on the platform.
Furthermore, the group leader has the right to grant or deny other users access to her
group and ask for verification of the information that these users provide. Many group
leaders request additional information from potential borrowers, and this process is
referred to as “Vetting”. Furthermore, some group leaders request to review every listing

8
before it is posted in the group. Finally, there are group leaders who explicitly offer help
to the potential borrower in writing and designing the listing.
The group leader can exploit this potential informational advantage and the fact that
everybody can observe each other’s actions to promote in different ways the listings
posted in her group among potential lenders: she can place a bid on the respective listing,
thereby potentially signaling a financial commitment to the trustworthiness of the
borrower. Furthermore, the group leader can write an endorsement for the potential
borrower, i.e. a short text in which she describes why this respective borrower is
particularly trustworthy. While bids and endorsements can also be made by other
members of Prosper.com, we concentrate on the analysis of bids and endorsements by the
informationally advantaged group leaders, who are also much more active than other
group members and are the key facilitators in their respective groups. Group leader bids
and group leader endorsements are often given together. We thus use the following
approach. First, in the univariate analysis, we consider the two signaling mechanisms
separately. Later, in the multivariate analysis, we analyze group leader bids and group
leader endorsements simultaneously.
2.2. Reward Groups, No-Reward Groups, and the Elimination of Group Leader Rewards
Apart from the fact that groups aim at different purposes and people, they are very
heterogeneous by nature: Group leaders may either provide their service for free, for
example because of the interest they can earn on the loans to which they lend money or
simply the benefits from social interaction or prestige, or charge a fee on loans closed in
their group.5 Therefore, in our analysis we distinguish between no-reward groups and
reward groups. More precisely, we define a group as a reward group if the group leader
requires a group leader reward at least for one listing in her group. Otherwise, the group
is defined as a no-reward group.
5 The group leader obtains a one-time reward (“match reward”, 0.5% of the loan amount except for E-loans and HR-loans) once the listing is completely funded and a monthly payment (“payment reward”, 1% p.a. for AA-loans and A-loans, 2% p.a. for B-loans, C-loans and D-loans, 4% p.a. for E-loans and HR-loans.). Alternatively, the group leader can also choose to only partly capture this reward.

9
Prosper.com started its business officially in 2006. Since then, there have been several
policy changes on the platform to adjust the business model to changes in the
macroeconomic environment and to the constantly better understanding of how online
social lending works. Figure 1 provides a corresponding timeline of these policy changes.
In our analysis, we focus on one specific policy change: the elimination of group leader
rewards, which takes place on 09/12/2007. Prosper.com motivates the elimination of
group leader rewards in its announcement by “(t)he original philosophy … to enable
borrowers in close-knit communities to leverage the reputation and peer pressure of their
group…, where compensation is not the dominant motivation for the group leader’s
services.” This event constitutes an imposed change on leaders of reward groups and
systematically changes their incentives in the loan granting process. It thus represents an
ideal event to analyze how group leaders react to a sudden change in incentives. To
exclude possible influences of other significant policy changes, we restrict our analysis to
the loans originated between 02/13/2007 and 04/15/2008 in which no other significant
policy change occurs and follow their performance until 03/01/2010.6 On 02/12/2007,
Prosper.com redefines the credit grades E and HR, excludes borrowers without any credit
grade from the platform, changes the borrower closing fee from 1% to 2% for the credit
grades E and HR and the lender servicing fee from 0.5% to 1% for the credit grades B-
HR. Also, endorsements for friends are introduced in addition to group leader
endorsements. On 04/15/2008, Prosper.com increases the lender servicing fee for AA-
loans from 0% to 1%. The policy change of interest in our study – the elimination of
group leader rewards – is thus well centered in the sample period.
2.3. Descriptive Statistics 6 During the sample period, there are two minor policy changes: On 10/30/2007, Prosper.com changes the lender servicing fee from 0.5% to 1% for A-loans and from 0.5% to 0% for AA-loans. Moreover, from this date on Prosper.com allows borrowers who already have a current loan to create a new listing in order to obtain a second loan. Second loans are allowed only for borrowers whose first loan has been active for some time and whose two loans together do not exceed the maximum amount of $25,000. To control for this latter policy change, we remove from the analysis the corresponding listings in which borrowers apply for second loans. On 01/04/2008, Prosper.com changes the borrower closing fees from 1% to 2% for the credit grades A and B, from 1% to 3% for the credit grades C and D, and from 2% to 3% for the credit grades E and HR. We provide further evidence for the robustness of our results to these additional changes in the robustness section.

10
Until today, 36,268 loans have been originated out of more than 385,000 listings on
Prosper.com. The total amount funded exceeds $211,000,000. The company makes a
snapshot of its entire public data available on its website for download and data analysis.
After restricting the sample period as discussed above, we obtain a final sample of
153,541 listings, 34,858 of which are posted in groups.
Table 1 provides the summary statistics for the most important variables.7 Panel A shows
the distribution of listings by credit grades and by groups. Most listings are either posted
outside a group (118,683) or in a reward group (32,966); much fewer listings are posted
in no-reward groups (1,892). Listings with the credit grade HR present by far the most
dominant group of listings with 66,734 observations, again mostly outside a group and in
reward groups.
From panel B of Table 1 we see that this does not hold true for the distribution of loans.
From the 12,183 loans, only 1,167 originate from successfully funded HR-listings, while
there are by far more AA/A-loans (3,143). Only for E-loans, the number of loans is
smaller than for HR-loans. The results in panel B also suggest that the listing probability
is highest in no-reward groups, followed by that in reward groups and outside groups.
The number of loans in no-reward groups of 654 constitutes almost 35% of the number of
listings of 1,892 in these groups, while this rate decreases to about 12% for reward
groups and 6% outside groups.
In panel C of Table 1, the information on group-specific characteristics is summarized.
Despite the fact that they are not compensated for their work, group leaders are relatively
more active in no-reward groups than in reward groups in terms of bidding and endorsing
listings. They are also more involved in terms of vetting, i.e. they review and certify the
information given to them by the potential borrowers, reviewing listings, and offering
help to the borrower. For example, the share of listings with at least one group leader bid
is considerably higher in no-reward groups (45.8%) than in reward groups (32.0%). 7 Variable definitions for all variables in the tables of the paper are given in Table 9.

11
3. Empirical Analysis and Results
3.1. Univariate Analysis
3.1.1. Group Leader Bids and Group Leader Endorsements
Group leaders can use bids and endorsements as two important mechanisms to promote
listings in their groups. However, the existence of rewards for group leaders may create
adverse incentives for these group leaders. Rewards for successful listings may induce
them to use bids and endorsements to persuade other lenders to bid even on weak listings,
by making other lenders believe that these listings are creditworthy. Thus, in the first
step, it is important to understand how bids and endorsements are used in no-reward and
reward groups and which outcomes are associated with them. In the observed period,
group leaders bid on 32.7% of the listings and these bids tend to be successful: among all
first group leader bids on a listing, only 13% are outbid. Mostly, these bids constitute
small amounts – very often $50 or $100 – so that the median amount of the first group
leader bid is $70. Usually, these bids are placed very fast. Indeed, if a group leader bids,
her first bid is typically also the first overall bid on the respective listing.
Table 2 analyzes for no-reward and reward groups the listing success, interest rates, and
loan performance based on whether the group leaders bids on or endorses a listing or
whether he abstains from either of the two.
Panel A of Table 2 shows how success rates of listings are related to group leader bids
and group leader endorsements. In no-reward groups, success rates for listings with a
group leader bid (52.8%) or a group leader endorsement (60.6%) are much higher than
for those which have neither (16.6%). This is true for all credit grades, which shows that
both group leader bids and group leader endorsements increase the probability of funding
regardless of the riskiness of the listing. The analysis of reward groups draws a similar

12
picture: here, only 6.9% of the listings without a group leader bid and without a group
leader endorsement are funded, while the listing success is significantly increased by
group leader bids (22.4%) and group leader endorsements (39.3%).
From panel B of Table 3 we observe that in no-reward groups, neither group leader bids
nor group leader endorsements significantly influence the interest the borrower has to
pay, except for slightly lower interest rates for credit grades D and HR. The effect is more
pronounced for reward groups. The analysis by credit grade reveals that loans with a
group leader bid or a group leader endorsement are associated with significantly smaller
interest rates, in particular for the riskier credit grades. For example, borrowers with a
loan in the credit grade HR pay on average 26.1% if the listing has neither a group leader
bid nor a group leader endorsement, but only 24.2% if the group leader bids on the listing
and only 24.3% if the group leader writes an endorsement.
From panel C of Table 3 we see that in no-reward groups, loans of the riskier credit
grades E and HR have lower failure rates if they have a group leader bid or a group leader
endorsement. By sharp contrast, loans in reward groups with a group leader bid or a
group leader endorsement in general have significantly higher failure rates than loans
without any of these two (18.9 / 19.0 vs. 15.7). This is the case for almost all credit
grades. Apparently, group leader bids and group leader endorsements do not work as
credible signals in reward groups.
Taken together, in both group types the success rates of listings with group leader bids
and endorsements are much higher than for listings without group leader bids and
endorsements. Yet, while in no-reward groups these two promotion mechanisms are
associated with listings of good quality despite their bad credit grade E or HR, in reward
groups failure rates are systematically increased for listings with a group leader bid or a
group leader endorsement. Group leader bids and endorsements thus lead to adverse
outcomes in reward groups. If this is due to adverse incentives for group leaders, then we
should expect to see a change in behavior with a change in reward structure.

13
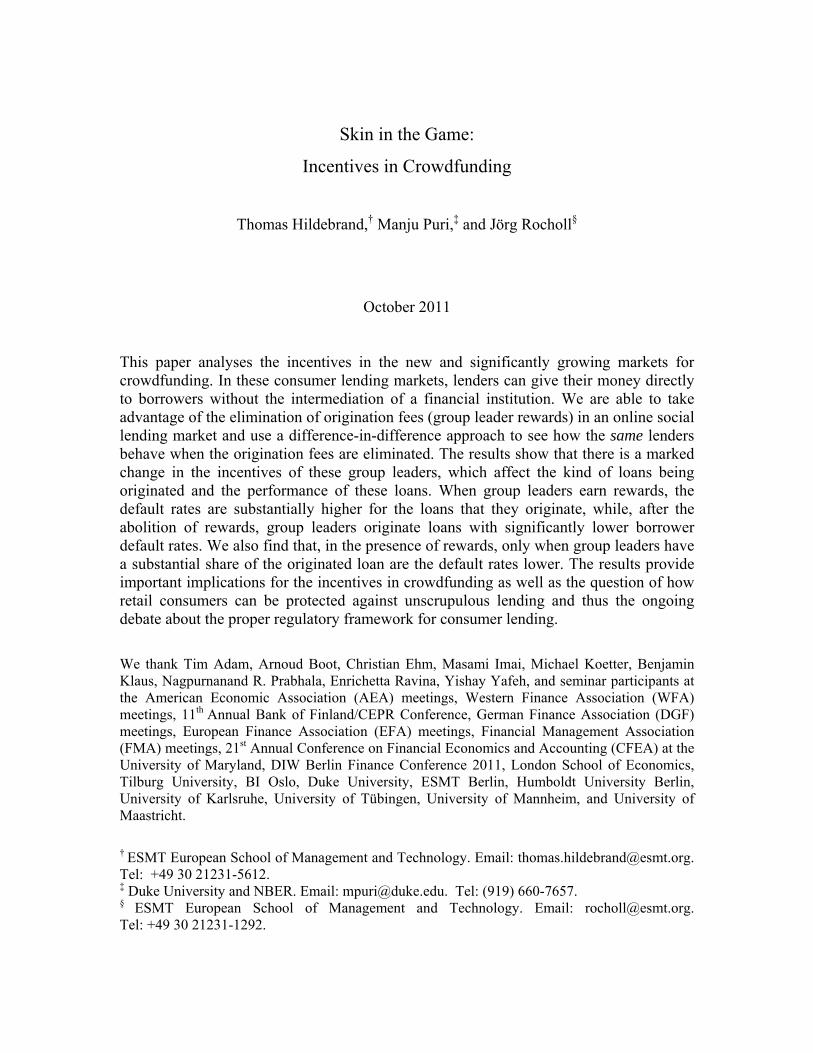
3.1.2. Group Leader Behavior Before and After the Elimination of Group Leader
Rewards
We thus analyze next whether and how the change in reward structure affects the group
leader behavior. Panel A of Figure 2 shows the weekly share of listings with at least one
group leader bid in no-reward groups and in reward groups over the sample period. In no-
reward groups, the share of listings with at least one group leader bid does not show any
remarkable trend over the sample period. By sharp contrast, in reward groups this share
decreases dramatically from about 40% to less than 10% once group leader rewards are
eliminated.
Panel B of Figure 2 draws a similar picture for the other important mechanism: group
leader endorsements. In particular, the share of listings with a group leader endorsement
decreases significantly in reward groups from about 20% to less than 10% after the
elimination of group leader rewards. The slight and rather slow increase of the respective
share in the no-reward groups can be explained by the fact that friend endorsements were
introduced only shortly before the beginning of our sample period (also see Figure 1), so
that if nothing had changed – i.e. if group leader rewards had not been eliminated – we
would have expected the same trend for no-reward groups and reward groups.
Table 3 confirms the results from Figure 2 by considering different credit grades. The
results in panel A suggest that the share of listings with a group leader bid in no-reward
groups does not change significantly after the elimination of group leader rewards for any
credit grade. It remains at a level of about 45%. In strict contrast, the decrease in reward
groups is significant for all credit grades, and it is most distinct for riskier credit grades.
For example, it decreases from 34.7% to 3.9% for credit grade HR.

14
Panel B shows the respective results for the group leader endorsements. In no-reward
groups, the share of listings with group leader endorsements increases on average after
the elimination of group leader rewards, consistent with Figure 2. In contrast, in reward
groups, the share of listings with a group leader endorsement decreases after the
elimination of group leader rewards from 13.9% to 6.8%, which is especially due to the
significant decrease in the corresponding shares of the high-risk listings with credit
grades C, D, E and HR.
In sum, these results indicate that group leaders of reward groups significantly lower the
effort they put into listings and in particular risky listings after the elimination of group
leader rewards – as opposed to group leaders of no-reward groups who do not change
their behavior. The resulting open question is how this change in behavior affects
outcomes.
3.1.3. Effect of Change in Group Leader Behavior
A first price of evidence for the effect of the change in group leader behavior on
outcomes is provided by Figure 3, which shows success rates of listings posted outside
groups as well as of listings posted in no-reward groups and in reward groups. As shown
before, success rates of listings in no-reward groups are generally the highest ones: they
are significantly higher than those of listings in reward groups and those of listings posted
outside groups. Success rates of listings in reward groups are also higher than those not
posted in groups, but, most importantly for the purpose of this study, only before group
leader rewards are eliminated and in a short transition period after the change.
The changes in outcome patterns are analyzed in more detail in Table 4. Panel A of
Table 4 shows that the overall success rate remains constant at 34.6% in no-reward
groups before and after the elimination of group leader rewards. The results are also very
similar for each of the different credit grades, with the exception of HR. In strict contrast
to no-reward groups, success rates in reward groups decrease significantly from 13.4% to
8.6%. This decrease is particularly pronounced in the risky credit grades C to HR, while

15
there is no significant change for the credit grades AA/A and B. This means that worse
credit grades have a substantially lower chance of getting funded after the elimination of
group leader rewards.
Panel B of Table 4 suggests that interest rates do not significantly change after the
elimination of group leader rewards, neither in no-reward groups nor in reward groups.
The only exceptions are interest rates for credit grade B in no-reward groups and credit
grades E and HR in reward groups, which pay slightly more after the change.
As shown in panel C of Table 4, failure rates in reward groups consistently decrease after
the elimination of group leader rewards across all credit grades. The average decrease in
failure rates of loans per 1,000 loan-days amounts to about 4. In the extreme case, failure
rates decrease from 17.9 to 11.2 for credit grade D. In no-reward groups, no systematic
pattern can be found. While failure rates increase for credit grades AA/A, they decrease
for credit grade HR.
Taken together, these results show that no-reward groups work the same way before and
after the elimination of group leader rewards. In contrast, reward groups work much
better after the elimination of group leader rewards than before, as failure rates are
substantially lower. A decrease in listing success along with a decrease in failure after the
elimination of group leader rewards suggests that group leaders now much more carefully
screen and choose the listings that are funded. An open question is why – before the
elimination of group leader rewards – the listing success in reward groups is high despite
the fact that the resulting loans also have a high likelihood of defaulting. This suggests
that co-lenders do not fully foresee the consequences of the adverse incentives created by
upfront rewards, most likely because of the short period between the creation of the
webpage and the point of time when these lenders have to make their decisions.8
3.2. Multivariate Analysis
8 Lenders do not possess the full information that is used in this paper, as their decisions are made within the sample period, while the data for this paper cover the whole sample period.

16
In order to determine the driving factors behind the results described above and to control
for the joint influences, we now turn to the multivariate analysis.
3.2.1. Listing Success
Table 5 shows odds ratios of logistic regressions of listing success. In specification (1),
we consider all listings, i.e. those posted in groups as well as those posted outside groups.
Almost all covariates are highly significant and go into the expected direction: Listing
success is decreasing in credit grade risk, debt-to-income ratio, and the number of
historical and current records in the credit report; it is increasing in homeownership and
in income. Self-employed and in particular retired or unemployed borrowers face a
particularly low funding probability. In terms of the listing characteristics, listing success
is decreasing in the amount requested and increasing in the duration of the listing.
Potential borrowers who decide to close their listing as soon as it is funded also exhibit
higher chances to have their listing funded; obviously potential lenders tend to jump on
these listings as there is a good chance to earn high interest rates given that one cannot be
outbid.
Specification (1) considers all listings – independently of whether they are posted inside
or outside groups – and shows that listings that are not posted in a group (No Group) or
that are posted in a reward group (Reward Group) have significantly lower funding
probabilities than those posted in no-reward groups, which is the reference group in all
our regressions. Moreover, after the elimination of group leader rewards (After), listing
success decreases.
In specifications (2) to (4) of Table 5, we concentrate on those listings that are posted in
groups and analyze in particular the different group-specific variables.9 The probability
that the listing is funded increases significantly if the group leader requires the listing to
be reviewed before it is posted in the group (Listing Review Requirement) or if the group 9 The results obtained with respect to the other covariates are robust across the different specifications.

17
leader offers help in designing the listing (Group Leader Offers Help). Vetting, i.e. the
verification of the information by the group leader, seems surprisingly unimportant for
the success of the listing. However, by far the most important group variables in terms of
listing success are group leader bids and group leader endorsements at the top of
specifications (2) to (4), which we analyze now more closely.
In specification (2), we include dummy variables for group leader bids and group leader
endorsements into the regression and distinguish between Only GL Bid, Only GL
Endorsement and GL Bid & GL Endorsement. Listings that have GL Bid & GL
Endorsement exhibit particularly high funding probabilities. Listings with just one of
these two elements are still about two to three times more likely to be funded than listings
without any of these two. When comparing the coefficients for Only GL Endorsement
and Only GL Bid, it may seem surprising at first sight that Only GL Endorsement – where
there is no monetary commitment by the group leader at stake, i.e. where group leaders
do not have “skin in the game” – has an even slightly higher positive influence on the
funding probability than Only GL Bid has. We analyze this observation more carefully in
the next specification.
In specification (3), we break down the influence of group leader bids and group leader
endorsements for reward and no-reward groups. The results show that Only GL Bid, Only
GL Endorsement and GL Bid & GL Endorsement work in the same way in reward and
no-reward groups. However, Only GL Endorsement works particularly well in reward
groups, while Only GL Bid works better in no-reward groups. The larger coefficient for
Only GL Endorsement in specification (2) is thus solely due to its higher listing success
in reward groups. We will later analyze whether these endorsements eventually also lead
to loans with lower failure rates, or whether the group leader simply persuades potential
lenders to participate in a loan so that he can earn the upfront reward associated with a
successful listing.
Finally, specification (4) constitutes the key part of our analysis and employs a
difference-in-difference methodology with two sources of identifying variation: (i) the

18
time before and after the removal of group leader rewards, (ii) the distinction between
listings inside and outside reward groups. Our inference is based on evaluating whether
reward groups perform differently after the elimination of group leader rewards. It shows
that after this event the influence of the combination of a group leader bid and a group
leader endorsement in the reward groups is significantly higher than before.10 The result
indicates that – after the elimination of group leader rewards – potential lenders trust
much more than before the correctness of the group leader’s signal that comes from his
bid and endorsement. This suggests that after this change, lenders might be less
concerned about the group leader behaving opportunistically and promoting listings only
for his own benefit.
3.2.2. Interest Rates of Loans
In order to determine the influence of the different variables on the interest rates that
borrowers have to pay to the lenders if their listing is funded, we run Tobit regressions of
this interest rate (in percent) on the same independent variables as in the regressions in
Table 5. Table 6 reports the results, where the dependent variable is truncated at left at
0% and at right at 35%, which is the maximum interest rate possible on Prosper.com.11
Naturally, the sample is restricted to those listings that are completely funded and
therefore become loans.
The interest rate of loans in the reference group, which are AA/A-loans, is about 5%. As
before, most covariates are significant and have the expected signs. The borrower’s credit
grade is by far the most important influencing factor for the interest rate charged to the
borrower. Apart from that, the borrower interest rate is increasing in the debt-to-income
ratio and in the number of historical and current records in the credit report. It is also
decreasing in income, although this effect becomes insignificant if only group loans in
10 Due to the high correlation of group leader bids and group leader endorsements and the resulting low sample size for Only GL Bid and Only GL Endorsement after the elimination of group leader rewards, we do not distinguish the two variables Only GL Bid and Only GL Endorsement in the reward groups between before and after the elimination of group leader rewards. 11 OLS regression results differ only marginally and are therefore not reported here.

19
specifications (2) to (4) are considered. Furthermore, a higher amount requested typically
increases the interest rate. The interest rate increases by about 3% if the borrower chooses
that the listing shall be closed as soon as it is completely funded; the interest rates cannot
be bid down in this case.
Specification (1) shows that interest rates of loans funded outside groups (No Group) or
in reward groups (Reward Group) are higher than those of loans in no-reward groups.
Specification (2) shows that loans originated from listings with Only GL Bid benefit from
particularly low interest rates, and interest rates are even lower for loans with GL Bid &
GL Endorsement. We also find that the interest rate of the loan is significantly lower if
the group leader claims to verify additional information from the borrower (Vetting) or if
the group leader offers help in designing the listing (Group Leader Offers Help).
Specification (3) shows the results for reward and no-reward groups. Loans with Only GL
Endorsement do not benefit from significantly lower interest rates. Otherwise, group
leader bids and endorsements lead to lower interest rates both in reward and no-reward
groups.
Finally, from specification (4), which uses again a difference-in-difference methodology,
we deduce that after the elimination of group leader rewards, the interest rate of loans
with GL Bid & GL Endorsement in reward groups is about 1% smaller than before. This
result indicates that after this event, group leader bids and group leader endorsements
have a significantly higher influence on the resulting interest rate in this group type. This
suggests again that the signal of a group leader bid and endorsement is much more
credible after the elimination of group leader rewards than before.
3.2.3. Loan Performance
In order to analyze the determinants of loan performance, we specify Cox proportional
hazards models with the same independent variables as before. The underlying
assumption of the models is that the coefficients are not time-varying, i.e. the importance

20
of a variable for the probability of defaulting or being late is constant over time.12 Loans
are exposed to the process from the time they are originated until they are either
completely paid back, they default or their data runs out. The results of the Cox
proportional hazards models are reported in Table 7.
Specification (1) of Table 7 shows that hazard rates are increasing in the credit grade risk
and the debt-to-income ratio. Borrowers who use their bankcard exhibit lower hazard
rates. Hazard rates are decreasing in income, whereas borrowers who are unemployed or
retired have higher hazard rates. In terms of the listing characteristics, hazard rates are
increasing in the loan amount. Furthermore, if the listing has a short duration or if it is
closed as soon as it is funded, the corresponding loan is potentially exposed to a higher
hazard rate. Together, this suggests that borrowers in urgent need of money exhibit
higher hazard rates. For the key variables of interest, the group type significantly
influences hazard rates even after controlling for other factors. Loans in reward groups
(Reward Group) and loans resulting from listings posted outside groups (No Group)
exhibit significantly higher hazard rates than loans in no-reward groups as the reference
group.
The results in specifications (2) to (5) suggest that hazard rates are also reduced if the
group leader verifies the information provided (Vetting) or if he generally offers help in
designing the listing (Group Leader Offers Help). Most importantly for the purpose of
this study, specification (2) shows that while Only GL Bid is insignificant in explaining
the failure rate of a loan, the opposite is the case for Only GL Endorsement or the
combination GL Bid & GL Endorsement, which increase failure rates. Obviously, group
leader endorsements do not work properly as a signal of good listing quality.
From specification (3) we see that this is only a problem in reward groups, whereas in no-
reward groups Only GL Bid, Only GL Endorsement as well as the combination GL Bid &
12 If e.g. a loan with credit grade HR is more susceptible to have a failure than a loan of the reference group AA/A, the strength of this relationship does not depend on time. Thus, for example, the HR-loan does not become more susceptible to fail over time, compared to the AA/A-loan.

21
GL Endorsement significantly lower the hazard rate of the loan. One may wonder
whether before the elimination of group leader rewards it is profitable for the group
leaders of reward groups to promote listings in their groups by placing a group leader bid
on them. Further analysis shows that in this time period the group leader rewards more
than compensate for the slightly higher failure rates in these groups.13
Most importantly, the influence of the elimination of group leader rewards on loan
performance in reward groups can be deduced from the difference-in-difference
specification (4): while before this policy change the combination of GL Bid & GL
Endorsement hints at a ceteris paribus higher hazard rate (coefficient of 1.154), after this
event the hazard rate is significantly smaller not only than before the change but also than
the benchmark of 1 (coefficient of 0.823). Consequently, the results suggest that – before
the elimination of group leader rewards – group leaders of reward groups overpromote
bad listings with the help of group leader bids and especially group leader endorsements,
which lead to higher failure rates for these types of loans. In contrast, after this policy
change, the mechanism works properly as the group leader has now no incentive any
more to behave opportunistically.
The evidence so far suggests that rewards give group leaders an incentive to promote and
bid even on bad listings as these rewards more than offset the losses due to the higher
likelihood of failure. This behavior changes once the reward is eliminated, which changes
the group leaders’ trade-off between rewards and losses. An alternative way to align
incentives, i.e. to make group leaders screen listings very carefully, is that – even before
the elimination of group leader rewards – group leaders participate to a large fraction in
the loan and thus have substantial skin in the game. We therefore further differentiate in
specification (5) whether a group leader participates in more or less than 33% of the
13 To be specific, we calculate the median internal rate of return (IRR) of three different investments the group leader can make: (i) investment in a listing in her reward group by placing a group leader bid, (ii) investment in a listing in a no-reward group and (iii) investment in a listing not posted in any group. The median IRRs of investments (ii) and (iii) are negative with -22.4% and -37.0% as most loans are not yet paid back completely. Only the median IRR of investment (i) is already positive with 7.2% – due to the additional reward the group leader obtains. This clearly shows that it is profitable for the group leader of a reward group to promote listings in her group so that she obtains the group leader reward.

22
loan.14 The results show that the failure rates decrease substantially when the group
leader participates in more than 33% of the loan; this holds for no-reward groups as well
as reward groups before and after the elimination of group leader rewards. However, only
in reward groups before the event, the failure rate is higher than 1 if the group leader
participates in less than 33% of the loan. This means that the potential losses in this case
are not high enough to outweigh the rewards. Or, interpreted differently, only a large
commitment and thus substantial skin in the game induces a group leader to carefully
screen borrowers and promote the creditworthy listings, even if he can earn rewards. The
coefficient of 0.821 in this case is almost identical to that of 0.823 in specification (4),
which captures the failure probability after the elimination of the rewards. These results
suggest that a high bid by the group leader serves indeed as a signal about the quality of
screening, as the other lenders correctly assume that a higher participation leads to more
skin in the game and thus a more careful screening process.
4. Robustness
In this section, we provide a number of analyses on the robustness of our results. In
particular, we show that our results are not driven by other policy changes that are made
on Prosper.com during our sample period (see Figure 1). We also investigate the choice
of the timespan used for the analysis of the loan performance. 14 The threshold of 33% is obtained as follows: A listing yields a negative payoff to a regular bidder under the following simplified condition: –α + α I (1 – p) + α (1 – p) < 0, where α = share of the loan amount supplied by this bidder, I = interest rate obtained, p = probability of default. The recovery rate is assumed to be zero. This can be simplified to –α (I p + p – I) < 0, so that α > 0 implies (I p + p – I) > 0 for a listing with a negative payoff. Suppose the group leader knows p and I from historical data. To make it profitable for him to still bid on a listing with a negative payoff, group leader fees and upfront payment have to outweigh the loss: F (1 – p) + U > α (I p + p – I), where F = group leader fee (interest rate paid on the full loan amount), and U = upfront payment to the group leader (relative to the loan amount). Since (I p + p – I) > 0 as before, (F (1 – p) + U) / (I p + p – I) > α yields an upper bound for a profitable group leader bid on this listing. For each credit grade we compute the critical value α according to this last formula. As an example, consider a borrower with the credit grade B in a reward group. For this borrower, we have the average interest rate I = 15%, the probability of default p = 18%, the group leader fee F = 2% and the upfront fee U = 0.5%. According to the formula above this yields a cutoff criterion of (0.02 x (1 – 0.18) + 0.005) / (0.15 x 0.18 + 0.18 – 0.15) = 0.37 > α. Consequently, the group leader should not participate in more than 37% of B-loans in which a regular bidder would lose money. The resulting overall critical value of 33% is the weighted average over these critical values of the credit grades.

23
4.1. Second Loans
As indicated before, Prosper.com allows borrowers with an existing loan to demand a
second loan after 2007/10/30. In the analyses in section 3, we control for this fact by
removing second loans from the sample. We further test the robustness of our results with
respect to this policy change by completely removing from the sample all members with
more than one loan – i.e. not only their second loans but also their first ones as well as the
corresponding listings. Our results do not change.
4.2. Fee Changes During the Sample Period
We also test whether the two fee changes after the elimination of group leader rewards –
i.e. the change of lender fees on 2007/10/30 and the change of borrower fees on
2008/01/04 – influence our results. For this purpose we split the sample after the
elimination of group leader rewards into three sub-samples; the first sub-sample covering
the period between the elimination of group leader rewards on 2007/09/12 and the change
of lender fees on 2007/10/30, the second one between this change of lender fees and the
change of borrower fees on 2008/01/04, and the third one between this change of
borrower fees and the end of our sample period. The analysis shows that our results are
not different across these three sub-samples, providing further evidence that the change in
group leader behavior is indeed driven by the elimination of group leader rewards and not
by any other change on the platform.
4.3. Choice of Timespan for Analysis of Loan Performance
In the analysis of the loan performance, we use the maximum number of months
available for each loan. While this approach allows us to exploit the maximum amount of
available information, its drawback is that there are more observations per loan for loans
originated at the beginning of our sample period than for loans originated towards the end
of our sample period. To test for the robustness of our results with respect to this

24
approach, we rerun the analysis restricting the maximum performance evaluation time to
an equal number of 22 months for all loans. We find that our results are again not
affected by this change.
5. Conclusion
Consumer protection has become one of the most important topics in the current
regulatory and academic debate on which lessons should be drawn from the financial and
economic crisis. This debate has been fueled by the idea that consumers need to be
protected in their financial decision-making against unscrupulous agents who would
otherwise take advantage of them. This debate, which has resulted for example in the
creation of the Consumer Financial Protection Bureau (CFPB) in the 2010 Dodd-Frank
Act, is particularly warranted for emerging markets such as the billion-dollar and
significantly growing market for crowdfunding, which receives strong bipartisan political
support as a significant potential market of the future. This market, despite having
developed into a billion-dollar industry, has received relatively little attention with
respect to its appropriate regulation and not much is known about the involved agents’
actions.
The analyses in this paper shed light on the lenders’ incentives in this market. We provide
evidence from a difference-in-difference analysis by taking advantage of the elimination
of group leader rewards. We find that the incentives for the group leaders change
substantially when their rewards, which are similar to origination fees, are eliminated.
Before the elimination, the default rates are substantially higher for the loans that they
originate, while, after the elimination, group leaders originate loans with significantly
lower borrower default rates. Further, before the elimination, group leaders have the right
incentives to screen only if they have substantial skin in the game. These results show
that only a considerable fraction of the loan retained by group leaders in reward groups
induces them to efficiently and responsibly screen loan listings and thus to make
responsible lending decisions.

25
The results provide at least two important implications for the question of how retail
consumers can be protected against unscrupulous lending and thus the ongoing debate
about the proper regulatory framework for consumer lending. First, the results have direct
relevance for the question of how to protect retail customers in the substantially growing
crowdfunding markets. Second, while they cannot be simply generalized to other
financial markets in which consumer protection is also of vital interest, our results
provide evidence from a clean experiment that shows that proper incentives are crucial
for giving borrowers access to credit and to induce lenders to carefully screen loan
applicants. Our results suggest the importance of further research on the necessary
incentives to improve consumer protection in the finance and lending industry more
generally.

26
References
Berger, A. N., Miller, N. H., Petersen, M. A., Rajan, R. G., and Stein, J. C. (2005). Does function follow organizational form? Evidence from the lending practices of large and small banks. Journal of Financial Economics, 76(2): 237-269. Bergstresser D., Chalmers, J., and Tufano, P. (2009). Assessing the costs and benefits of brokers in the mutual fund industry. Review of Financial Studies, 22(10): 4129-4156. Bolton, P., Freixas, X., and Shapiro, J. (2007). Conflicts of interest, information provision, and competition in banking. Journal of Financial Economics, 85(2): 297-330. Bolton, P. and Scharfstein, D. S. (1996). Optimal debt structure and the number of creditors. The Journal of Political Economy, 104(1): 1-25. Gorton, G. B. and Pennacchi, G. G. (1995). Banks and loan sales Marketing nonmarketable assets. Journal of Monetary Economics, 35(3): 389-411. Holmstrom, B. (1979), Moral hazard and observability, Bell Journal of Economics, 10(1): 74-91. Holmstrom, B. and Tirole, J. (1997), Financial intermediation, loanable funds, and the real sector, Quarterly Journal of Economics, 112(3): 663-691. Hulme, M. K. and Wright, C. (2006). Internet based social lending: Past, present and future. Working paper. Inderst, R. and Ottaviani, M. (2009). Misselling through agents. The American Economic Review, 99(3): 883-908. Iyer, R., Khwaja, A., Luttmer, E., and Shue, K. (2009). Screening in new credit markets: Can individual lenders infer borrower creditworthiness in peer-to-peer lending?” Working paper. Lin, M., Prabhala, N. R., and Viswanathan, S. (2009). Judging borrowers by the company they keep: Social networks and adverse selection in online peer-to-peer lending. Working paper. Muralidharan, K. and Sundararaman, V. (2011). Teacher Performance Pay: Experimental Evidence from India. The Journal of Political Economy, 119(1): 39-77.

27
Pope, D. G. and Sydnor, J. R. (2009). What’s in a picture? Evidence of discrimination from Prosper.com. Journal of Human Resources, 46(1): 53-92. Ravina, E. (2008). Love & loans: The effect of beauty and personal characteristics in credit markets. Working paper. Stein, J. C. (2002). Information Production and Capital Allocation: Decentralized versus Hierarchical Firms. Journal of Finance, 57(5): 1891-1921. Sufi, A. (2007). Information Asymmetry and Financing Arrangements: Evidence from Syndicated Loans, Journal of Finance, 62(2): 629-668. United States Government Accountability Office (2011). Person-to-Person Lending: New Regulatory Challenges Could Emerge as the Industry Grows. Report to Congressional Committees.

28
Figure 1: Timeline of Policy Changes on Prosper.com
2006/05/30
Added: Delinquency
Variables
2006/08/16
Added: Group Leader Endorsements
2006/10/19
Added: Group Ratings
2007/09/12
Eliminated: Group Leader
Rewards
2007/10/30
Added: 2nd Loans Changed:
Lender Fees
2008/01/04
Changed: Borrower Fees
2007/02/12
Added: Friend
Endorsements Changed:
Credit Grades Borrower Fees,
Lender Fees
2006/04/19
Added: Homeowner
Status Verified Bank
Account
Sample Period 2008/04/15
Changed: Lender Fees
Time
2005/11/09
Start of Test Period
2006/02/13
Official Start

29
Figure 2: Group Leader Bids and Group Leader Endorsements
In this figure we report – by group type – the weekly share of listings (i.e. of requests for borrowing money) with at least one group leader bid (Panel A) / with a group leader endorsement (Panel B).

30
Figure 3: Listing Success
In this figure we report – by group type – the weekly share of successful listings, i.e. the weekly share of the successfully and completely funded requests for borrowing money.

31
Table 1: Summary Statistics In this table we report – by group type – summary statistics on the most important variables. Panel A shows the distribution of listings (i.e. of requests for borrowing money) by the different credit grades from AA/A (best) to HR (worst). Panel B shows the corresponding distribution of loans (i.e. of successfully and completely funded requests for borrowing money). Panel C reports general group-specific shares, in particular the share of listings with at least one group leader bid and the share of listings with a group leader endorsement. “Vetting” denotes that the group leader claims to review information sent by the borrower (e.g. diploma or certificates). “Listing Review Requirement” denotes that the group leader checks the listing before it is opened for bidding by potential lenders. “Group Leader Offers Help” denotes that the group leader offers to support the borrower in writing and designing the listing.
No Group No-Reward Groups
Reward Groups Overall
PANEL A: DISTRIBUTION OF LISTINGS (I.E. OF REQUESTS FOR BORROWING MONEY)
AA/A 7,641 301 1,641 9,583B 6,532 146 1,839 8,517C 12,572 293 3,648 16,513D 18,896 346 5,529 24,771E 21,005 261 6,157 27,423HR 52,037 545 14,152 66,734
Total Number of Listings 118,683 1,892 32,966 153,541
PANEL B: DISTRIBUTION OF LOANS (I.E. OF SUCCESSFULLY AND COMPLETELY FUNDED REQUESTS FOR BORROWING MONEY)
AA/A 2,303 181 659 3,143B 1,366 73 540 1,979C 1,572 119 839 2,530D 1,258 130 904 2,292E 514 63 495 1,072HR 432 88 647 1,167
Total Number of Loans 7,445 654 4,084 12,183
PANEL C: GROUP-SPECIFIC INFORMATION
Share of Listings with at Least One Group Leader Bid 45.8% 32.0% 32.7%Share of Listings with a Group Leader Endorsement 32.8% 12.4% 13.5%Share of Listings with “Vetting” 28.6% 9.4% 10.4%Share of Listings with Listing Review Requirement 66.0% 40.7% 42.1%Share of Listings where Group Leader Offers Help 18.1% 7.8% 8.3%

32
Table 2: Listing Success, Interest Rates, and Loan Performance by Listing Promotion
Mechanism (Group Leader Bids and Group Leader Endorsements) In this table we report univariate results by listing promotion mechanism (group leader bids / group leader endorsements) and credit grade. The table distinguishes between No-Reward Groups and Reward Groups. Panel A shows success rates of listings (i.e. of the requests for borrowing money) by the different credit grades from AA/A (best) to HR (worst). Panel B shows the corresponding interest rates of loans (i.e. of the successfully and completely funded requests for borrowing money). Panel C shows failure rates of loans (per 1,000 loan-days). In this panel, any payment which is not made on time is considered as a failure, so that failure events are late payments, charge-offs and defaults. T-statistics of the test on equality between “With GL-Bid” and “None” as well as between “With GL-Endorsement” and “None” are reported in parentheses for both No-Reward Groups and Reward Groups. ***, **, and * indicate significance at the 1%, 5%, and 10% levels, respectively. PANEL A: LISTING SUCCESS No-Reward Groups Reward Groups (N=1,892) (N=32,966) Credit Grade None With GL-Bid
With GL-Endorsement None With GL-Bid
With GL-Endorsement
AA/A 39.5% 78.1% (-6.81)*** 81.9% (-7.54)*** 31.2% 50.0% (-7.56)*** 69.6% (-13.29)*** B 34.3% 64.6% (-3.67)*** 76.6% (-5.00)*** 20.8% 38.5% (-8.06)*** 60.7% (-13.87)*** C 21.3% 60.6% (-7.31)*** 70.8% (-8.31)*** 14.9% 33.2% (-12.21)*** 54.0% (-17.61)*** D 13.2% 56.0% (-9.37)*** 68.9% (-10.97)*** 9.7% 26.4% (-15.04)*** 45.5% (-19.43)*** E 9.5% 42.5% (-6.22)*** 55.4% (-7.25)*** 3.4% 18.0% (-15.49)*** 31.2% (-15.28)*** HR 4.3% 32.4% (-8.38)*** 33.1% (-7.58)*** 2.0% 11.1% (-17.54)*** 19.6% (-16.03)***
Total 16.6% 52.8% (-17.22)*** 60.6% (-18.97)*** 6.9% 22.4% (-35.17)*** 39.3% (-41.37)*** PANEL B: INTEREST RATES No-Reward Groups Reward Groups (N=654) (N=4,084) Credit Grade None With GL-Bid
With GL-Endorsement None With GL-Bid
With GL-Endorsement
AA/A 9.3% 9.3% (-0.11) 9.5% (-0.37) 11.0% 11.4% (-2.10)** 11.7% (-2.79)*** B 13.4% 12.4% (1.34) 12.9% (0.61) 15.2% 14.6% (1.65)* 14.9% (0.85) C 15.8% 15.6% (0.22) 15.6% (0.17) 18.2% 16.8% (4.73)*** 17.1% (3.49)*** D 19.2% 17.4% (1.94)* 17.1% (2.10)** 20.9% 19.7% (3.97)*** 19.6% (4.22)*** E 21.5% 20.6% (0.62) 20.4% (0.72) 24.8% 23.8% (2.24)** 23.5% (2.58)*** HR 24.7% 19.7% (2.37)** 20.7% (1.89)* 26.1% 24.2% (4.50)*** 24.3% (4.06)***
Total 14.8% 15.5% (-1.20) 15.4% (-1.03) 18.7% 18.8% (-0.53) 18.5% (0.77) PANEL C: LOAN PERFORMANCE No-Reward Groups Reward Groups (N=654) (N=4,084) Credit Grade None With GL-Bid
With GL-Endorsement None With GL-Bid
With GL-Endorsement
AA/A 2.8 6.3 (7.70)*** 4.5 (3.97)** 6.6 10.6 (14.16)*** 11.0 (14.26)*** B 7.7 3.5 (-5.54)*** 7.0 (-0.81) 13.3 15.8 (6.42)*** 15.5 (5.27)*** C 8.8 10.3 (2.04)** 8.7 (-0.09) 16.7 16.8 (0.34) 16.3 (-1.21) D 9.6 10.5 (1.02) 9.5 (-0.13) 16.8 17.5 (2.05)** 16.9 (0.21) E 19.4 13.2 (-4.33)*** 12.4 (-4.79)*** 18.5 22.9 (9.21)*** 25.5 (12.89)*** HR 31.4 21.1 (-5.66)*** 22.9 (-4.62)*** 23.7 26.4 (5.70)*** 29.1 (10.26)***
Total 10.6 11.4 (2.10)** 10.9 (0.87) 15.7 18.9 (20.79)*** 19.0 (19.98)***

33
Table 3: Use of Group Leader Bids and Group Leader Endorsements In this table we report the share of listings (i.e. of requests for borrowing money) with at least one group leader bid (panel A) and the share of listings with a group leader endorsement (panel B) by group type and credit grade. T-statistics of the test on equality (before vs. after the elimination of group leader rewards) are reported in parentheses. ***, **, and * indicate significance at the 1%, 5%, and 10% levels, respectively. No-Reward Groups Reward Groups (N=1,892) (N=32,966)
Credit Grade Before After t-statistic Before After t-statistic PANEL A: SHARE OF LISTINGS WITH A GROUP LEADER BID AA/A 42.6% 42.4% (0.02) 43.3% 24.0% (6.70)*** B 44.2% 45.0% (-0.10) 45.4% 15.1% (12.37)*** C 52.2% 42.5% (1.63) 42.7% 10.4% (21.67)*** D 57.3% 52.0% (0.90) 44.2% 5.9% (37.25)*** E 45.0% 39.5% (0.83) 37.6% 5.2% (35.45)*** HR 40.1% 44.0% (-0.84) 34.7% 3.9% (54.03)***
Total 46.5% 44.3% (0.92) 38.8% 6.4% (77.10)*** PANEL B: SHARE OF LISTINGS WITH A GROUP LEADER ENDORSEMENT AA/A 40.6% 34.3% (1.06) 22.0% 19.8% (0.85) B 26.7% 40.0% (-1.66) 20.1% 16.4% (1.53) C 27.8% 34.5% (-1.20) 17.0% 9.9% (5.26)*** D 30.5% 47.0% (-2.84)*** 16.4% 6.2% (11.25)*** E 23.9% 38.3% (-2.28)** 12.2% 6.3% (7.46)*** HR 25.9% 44.6% (-4.18)*** 10.8% 4.6% (12.93)***
Total 29.1% 40.2% (-4.72)*** 13.9% 6.8% (18.97)***

34
Table 4: Listing Success, Interest Rates, and Loan Performance Before and After
Elimination of Group Leader Rewards In this table we report univariate results by group type and credit grade. We also distinguish whether the listing (i.e. the request for borrowing money) or the loan (i.e. the successfully and completely funded request for borrowing money) was created before or after the elimination of group leader rewards. Panel A shows success rates of listings by the different credit grades from AA/A (best) to HR (worst). Panel B shows the corresponding interest rates of loans. Panel C shows failure rates of loans (per 1,000 loan-days). In this panel, any payment which is not made on time is considered as a failure, so that failure events are late payments, charge-offs and defaults. T-statistics of the test on equality (before vs. after the elimination of group leader rewards) are reported in parentheses for both No-Reward Groups and Reward Groups. ***, **, and * indicate significance at the 1%, 5%, and 10% levels, respectively. PANEL A: LISTING SUCCESS No-Reward Groups Reward Groups (N=1,892) (N=32,966)
Credit Grade Before After t-statistic Before After t-statistic AA/A 59.9% 60.6% (-0.12) 40.0% 41.0% (-0.31) B 47.7% 53.3% (-0.67) 29.4% 29.1% (0.10) C 40.6% 40.7% (-0.03) 24.1% 18.0% (3.64)*** D 36.6% 40.0% (-0.59) 17.7% 11.0% (6.16)*** E 23.3% 25.9% (-0.44) 9.2% 4.2% (7.37)*** HR 19.3% 9.0% (3.39)*** 5.0% 3.0% (5.31)***
Total 34.6% 34.6% (0.00) 13.4% 8.6% (12.06)*** PANEL B: INTEREST RATES No-Reward Groups Reward Groups (N=654) (N=4,084)
Credit Grade Before After t-statistic Before After t-statistic AA/A 9.1% 9.7% (-1.16) 11.3% 11.2% (0.36) B 12.5% 13.6% (-1.70)* 14.9% 15.3% (-0.90) C 15.1% 16.3% (-1.30) 17.4% 18.1% (-1.52) D 17.4% 18.4% (-1.24) 20.1% 20.1% (0.17) E 21.3% 20.0% (0.91) 23.9% 25.4% (-1.79)* HR 20.2% 21.7% (-0.72) 24.5% 26.8% (-3.07)***
Total 15.1% 15.2% (-0.09) 18.7% 18.9% (-0.78) PANEL C: LOAN PERFORMANCE No-Reward Groups Reward Groups (N=654) (N=4,084)
Credit Grade Before After t-statistic Before After t-statistic AA/A 3.5 6.7 (6.37)*** 9.0 8.0 (-2.56)** B 7.3 7.3 (-0.06) 14.9 13.8 (-2.22)** C 9.6 9.8 (0.25) 17.3 13.4 (-9.08)*** D 10.2 10.1 (-0.11) 17.9 11.2 (-17.32)*** E 14.2 13.7 (-0.42) 22.2 17.1 (-7.75)*** HR 24.3 14.2 (-7.80)*** 26.2 22.5 (-6.12)***
Total 11.6 9.5 (-6.61)*** 18.1 14.0 (-20.43)***

35
Table 5: Listing Success – Multivariate Analysis In this table we report odds ratios of the logistic regression of funding success, i.e. the exponentiated regression coefficients. Coefficients larger (respectively smaller) than 1 indicate relatively higher (respectively smaller) success probabilities than in the reference group. In specification (1) all listings (i.e. all requests for borrowing money) are considered, in specifications (2) to (4) only group listings are analyzed. Specification (2) reports the overall effect of a group leader bid and / or a group leader endorsement on listing success. Specification (3) additionally distinguishes whether the group leader bid and / or the group leader endorsement occurs in a listing in a no-reward group or in a reward group. Specification (4) compares the joint effect of a group leader bid and a group leader endorsement before and after the elimination of group leader rewards on listing success in the reward groups. The reference is AA/A-listings before the elimination of group leader rewards in no-reward groups without a group leader bid or a group leader endorsement. T-statistics are reported in parentheses. ***, **, and * indicate significance at the 1%, 5%, and 10% levels, respectively.
All Listings Only Listings in Groups (1) (2) (3) (4) Group Leader Bids and Group Leader Endorsements Only GL Bid 1.829*** (12.64) Only GL Bid: No-Reward 2.192*** (4.85) 2.172*** (4.80)Only GL Bid: Reward 1.796*** (11.82) 1.772*** (11.53)Only GL Endorsement 2.919*** (12.06) Only GL Endorsement: No-Reward 1.913** (2.56) 1.916** (2.56)Only GL Endorsement: Reward 3.149*** (12.22) 3.157*** (12.24)GL Bid & GL Endorsement 7.739*** (38.53) GL Bid & GL Endorsement: No-Reward 11.584*** (16.11) 11.580*** (16.11)GL Bid & GL Endorsement: Reward 7.368*** (35.86) GL Bid & GL Endorsement: Reward, Before 7.038*** (33.89)GL Bid & GL Endorsement: Reward, After 11.801*** (15.27)
Group Characteristics No Group 0.162*** (-29.83) Reward Group 0.414*** (-14.18) 0.573*** (-8.56) 0.669*** (-3.76) 0.661*** (-3.87)Vetting 1.085 (1.40) 1.099 (1.61) 1.071 (1.15)Listing Review Requirement 1.492*** (9.64) 1.494*** (9.65) 1.491*** (9.61)Group Leader Offers Help 1.375*** (5.08) 1.336*** (4.56) 1.334*** (4.53)
Listing Characteristics After Elimination of Group Leader Rewards 0.857*** (-6.09) 0.790*** (-4.50) 0.781*** (-4.70) 0.740*** (-5.41)Amount Requested (in $1,000) 0.887*** (-57.39) 0.894*** (-29.83) 0.893*** (-29.82) 0.893*** (-29.90)Duration 1.063*** (11.67) 1.036*** (3.70) 1.038*** (3.82) 1.038*** (3.82)Listing Closed As Soon As Funded 1.140*** (5.13) 0.939 (-1.38) 0.938 (-1.40) 0.938 (-1.40)
Borrower Characteristics Credit Grade: B 0.612*** (-12.81) 0.663*** (-5.20) 0.656*** (-5.33) 0.658*** (-5.29)Credit Grade: C 0.302*** (-32.71) 0.426*** (-11.91) 0.419*** (-12.10) 0.422*** (-11.99)Credit Grade: D 0.153*** (-47.83) 0.237*** (-19.44) 0.234*** (-19.61) 0.236*** (-19.48)Credit Grade: E 0.060*** (-56.96) 0.102*** (-26.60) 0.100*** (-26.73) 0.101*** (-26.61)Credit Grade: HR 0.027*** (-71.02) 0.055*** (-33.19) 0.055*** (-33.29) 0.055*** (-33.21)Debt-to-Income Ratio 0.900*** (-9.89) 0.967** (-2.48) 0.967** (-2.52) 0.966*** (-2.60)Is Borrower Home Owner 1.167*** (6.22) 1.160*** (3.45) 1.163*** (3.52) 1.164*** (3.53)$1-24,999 1.316*** (2.70) 0.827 (-1.20) 0.830 (-1.17) 0.830 (-1.18)$25,000-49,999 1.895*** (6.35) 1.233 (1.32) 1.231 (1.31) 1.234 (1.33)$50,000-74,999 2.391*** (8.54) 1.658*** (3.14) 1.657*** (3.14) 1.661*** (3.15)$75,000-99,999 3.000*** (10.42) 2.038*** (4.23) 2.040*** (4.23) 2.049*** (4.26)$100,000 3.409*** (11.42) 2.432*** (5.12) 2.434*** (5.12) 2.451*** (5.16)Part-Time 1.000 (0.00) 0.864 (-1.40) 0.854 (-1.50) 0.853 (-1.51)Self-Employed 0.924* (-1.86) 1.074 (1.00) 1.070 (0.94) 1.071 (0.96)Retired 0.643*** (-5.72) 0.692*** (-2.84) 0.686*** (-2.90) 0.688*** (-2.88)Not Employed 0.632*** (-3.18) 0.597** (-2.38) 0.591** (-2.43) 0.593** (-2.41)Current Delinquencies 0.917*** (-14.53) 0.961*** (-4.91) 0.961*** (-4.91) 0.962*** (-4.86)Delinquencies Last 7 Years 0.995*** (-5.07) 0.997 (-1.63) 0.997 (-1.62) 0.997 (-1.59)Public Records Last 10 Years 0.970** (-2.38) 0.959** (-1.97) 0.959** (-1.97) 0.958** (-2.00)Total Credit Lines 0.993*** (-5.57) 0.994*** (-3.22) 0.993*** (-3.30) 0.993*** (-3.31)Inquiries Last 6 Months 0.974*** (-8.93) 0.986*** (-3.29) 0.986*** (-3.24) 0.986*** (-3.19)Amount Delinquent (in $1,000) 0.993*** (-2.89) 0.991** (-2.46) 0.991** (-2.46) 0.990** (-2.51)Public Records Last 12 Months 1.084* (1.88) 1.087 (1.21) 1.089 (1.24) 1.091 (1.27)Current Credit Lines 1.004 (0.59) 1.034*** (3.34) 1.033*** (3.31) 1.033*** (3.29)Open Credit Lines 0.973*** (-4.25) 0.957*** (-4.09) 0.957*** (-4.04) 0.958*** (-4.02)Revolving Credit Balance (in $1,000) 1.000 (1.09) 0.999 (-1.31) 0.999 (-1.40) 0.999 (-1.40)Bankcard Utilization 1.081** (2.43) 1.005 (0.09) 1.003 (0.06) 1.005 (0.10)Months in Current Occupation 1.000*** (-2.62) 0.999** (-2.34) 0.999** (-2.28) 0.999** (-2.31)
N 153,541 34,858 34,858 34,858 pseudo R² 0.258 0.275 0.276 0.276 Note: In specification (4), the difference between the regression coefficients of “GL Bid & GL Endorsement: Reward, Before” and “GL Bid & GL Endorsement: Reward, After” is significant at 1%.

36
Table 6: Interest Rates – Multivariate Analysis In this table we report the regression coefficients from Tobit regressions of the lender interest rate of loans (i.e. of successfully and completely funded requests for borrowing money). In specification (1) all loans are considered, in specifications (2) to (4) only group loans are analyzed. Specification (2) reports the overall effect of a group leader bid and / or a group leader endorsement on the borrower interest rate. Specification (3) additionally distinguishes whether the group leader bid and / or the group leader endorsement occurs in a loan in a no-reward group or in a reward group. Specification (4) compares the joint effect of a group leader bid and a group leader endorsement before and after the elimination of group leader rewards on the borrower interest rate of loans in the reward groups. The reference is AA/A-loans before the elimination of group leader rewards in no-reward groups without a group leader bid or a group leader endorsement. T-statistics are reported in parentheses. ***, **, and * indicate significance at the 1%, 5%, and 10% levels, respectively.
All Loans Only Loans in Groups (1) (2) (3) (4) Group Leader Bids and Group Leader Endorsements Only GL Bid -0.713*** (-5.07) Only GL Bid: No-Reward -1.320*** (-3.22) -1.285*** (-3.14)Only GL Bid: Reward -0.642*** (-4.35) -0.595*** (-4.01)Only GL Endorsement 0.213 (0.95) Only GL Endorsement: No-Reward -0.067 (-0.12) -0.052 (-0.09)Only GL Endorsement: Reward 0.242 (0.99) 0.261 (1.07)GL Bid & GL Endorsement -0.886*** (-6.27) GL Bid & GL Endorsement: No-Reward -1.076*** (-3.11) -1.061*** (-3.06)GL Bid & GL Endorsement: Reward -0.878*** (-5.90) GL Bid & GL Endorsement: Reward, Before -0.755*** (-4.90)GL Bid & GL Endorsement: Reward, After -1.807*** (-5.24)
Group Characteristics No Group 2.060*** (12.76) Reward Group 1.342*** (8.14) 1.263*** (8.41) 1.010*** (3.45) 1.052*** (3.60)Vetting -0.501*** (-3.50) -0.496*** (-3.44) -0.421*** (-2.88)Listing Review Requirement 0.118 (0.98) 0.128 (1.07) 0.130 (1.09)Group Leader Offers Help -0.721*** (-4.72) -0.712*** (-4.62) -0.713*** (-4.63)
Listing Characteristics After Elimination of Group Leader Rewards 1.345*** (15.42) 1.499*** (10.59) 1.500*** (10.58) 1.691*** (10.88)Amount Requested (in $1,000) 0.253*** (36.49) 0.290*** (29.02) 0.290*** (29.03) 0.291*** (29.18)Duration -0.007 (-0.39) 0.009 (0.37) 0.008 (0.32) 0.009 (0.36)Listing Closed As Soon As Funded 3.286*** (37.07) 2.961*** (22.85) 2.971*** (22.90) 2.977*** (22.96)
Borrower Characteristics Credit Grade: B 3.619*** (31.20) 2.896*** (15.69) 2.895*** (15.67) 2.880*** (15.60)Credit Grade: C 6.299*** (54.49) 5.732*** (33.47) 5.729*** (33.36) 5.706*** (33.23)Credit Grade: D 9.586*** (74.34) 8.634*** (47.41) 8.635*** (47.36) 8.611*** (47.23)Credit Grade: E 13.580*** (80.37) 12.249*** (54.57) 12.241*** (54.51) 12.206*** (54.33)Credit Grade: HR 13.420*** (75.66) 12.917*** (55.77) 12.916*** (55.76) 12.892*** (55.67)Debt-to-Income Ratio 0.157*** (4.70) 0.162*** (4.45) 0.161*** (4.43) 0.166*** (4.57)Is Borrower Home Owner -0.152* (-1.82) -0.500*** (-4.35) -0.499*** (-4.34) -0.502*** (-4.37)$1-24,999 0.220 (0.64) 0.971** (2.27) 0.966** (2.26) 0.956** (2.24)$25,000-49,999 -0.340 (-1.00) 0.455 (1.08) 0.456 (1.08) 0.449 (1.06)$50,000-74,999 -0.473 (-1.38) 0.232 (0.54) 0.235 (0.55) 0.226 (0.53)$75,000-99,999 -0.733** (-2.08) -0.180 (-0.41) -0.181 (-0.41) -0.194 (-0.44)$100,000 -1.132*** (-3.16) -0.579 (-1.27) -0.580 (-1.27) -0.594 (-1.31)Part-Time -0.423** (-2.19) -0.034 (-0.12) -0.041 (-0.15) -0.047 (-0.17)Self-Employed 0.221 (1.55) 0.145 (0.75) 0.136 (0.71) 0.132 (0.69)Retired 0.129 (0.49) -0.258 (-0.72) -0.246 (-0.68) -0.248 (-0.69)Not Employed 0.605 (1.18) 1.125* (1.81) 1.123* (1.81) 1.095* (1.76)Current Delinquencies 0.072*** (4.15) 0.069*** (3.28) 0.068*** (3.28) 0.068*** (3.28)Delinquencies Last 7 Years 0.025*** (7.07) 0.021*** (4.57) 0.020*** (4.54) 0.020*** (4.55)Public Records Last 10 Years 0.203*** (4.70) 0.224*** (3.70) 0.224*** (3.70) 0.226*** (3.74)Total Credit Lines 0.019*** (4.83) 0.013** (2.48) 0.014** (2.53) 0.014** (2.53)Inquiries Last 6 Months 0.141*** (14.18) 0.076*** (6.16) 0.076*** (6.14) 0.075*** (6.09)Amount Delinquent (in $1,000) 0.018*** (3.14) 0.015 (1.55) 0.015 (1.58) 0.016 (1.63)Public Records Last 12 Months 0.445*** (2.83) 0.179 (0.83) 0.177 (0.82) 0.171 (0.79)Current Credit Lines -0.054*** (-2.59) -0.028 (-1.02) -0.029 (-1.06) -0.028 (-1.02)Open Credit Lines 0.054** (2.40) 0.023 (0.80) 0.024 (0.81) 0.022 (0.76)Revolving Credit Balance (in $1,000) 0.001 (1.29) 0.004** (2.00) 0.004** (1.98) 0.004* (1.95)Bankcard Utilization 0.416*** (3.73) 0.449*** (3.09) 0.445*** (3.07) 0.443*** (3.05)Months in Current Occupation 0.001 (0.97) 0.001 (0.91) 0.001 (0.93) 0.001 (0.98)
Constant 5.087*** (12.68) 5.817*** (11.73) 6.053*** (10.99) 5.957*** (10.81)
N 12,183 4,738 4,738 4,738 pseudo R² 0.160 0.180 0.180 0.180 Note: In specification (4), the difference between the regression coefficients of “GL Bid & GL Endorsement: Reward, Before” and “GL Bid & GL Endorsement: Reward, After” is significant at 1%.

37
Table 7: Loan Performance – Multivariate Analysis In this table we report the exponentiated regression coefficients obtained from a Cox Proportional Hazards Model. Any payment which is not made on time is considered as a failure, so that failure events are late payments, charge-offs and defaults. In specification (1) all loans (i.e. all successfully and completely funded requests for borrowing money) are considered, in specifications (2) to (5) only group loans are analyzed. Specification (2) reports the overall effect of a group leader bid and / or a group leader endorsement on the failure probability of loans. Specification (3) additionally distinguishes whether the group leader bid and / or the group leader endorsement occurs in a loan in a no-reward group or in a reward group. Specification (4) compares the joint effect of a group leader bid and a group leader endorsement before and after the elimination of group leader rewards on the failure probability of loans in the reward groups. Finally, specification (5) analyzes whether before the elimination of group leader rewards, the group leader participates with more than 33% of the loan amount in the loan, if she places a bid and an endorsement on the listing (i.e. whether she “has skin in the game”). The reference is AA/A-loans before the elimination of group leader rewards in no-reward groups without a group leader bid or a group leader endorsement. T-statistics are reported in parentheses. ***, **, and * indicate significance at the 1%, 5%, and 10% levels, respectively.
All Loans Only Loans in Groups (1) (2) (3) (4) (5) Group Leader Bids and Group Leader Endorsements Only GL Bid 0.998 (-0.14) Only GL Bid: No-Reward 0.906* (-1.85) 0.914* (-1.68) 0.951 (-0.94)Only GL Bid: Reward 1.001 (0.05) 1.013 (0.90) 1.014 (0.97)Only GL Endorsement 1.106*** (4.25) Only GL Endorsement: No-Reward 0.814** (-2.35) 0.816** (-2.33) 0.847* (-1.89)Only GL Endorsement: Reward 1.124*** (4.79) 1.128*** (4.94) 1.134*** (5.16)GL Bid & GL Endorsement 1.105*** (7.23) GL Bid & GL Endorsement: No-Reward 0.841*** (-3.80) 0.845*** (-3.71) GL Bid & GL Endorsement: No-Reward, Participation ≤ 33% 0.950 (-1.12)GL Bid & GL Endorsement: No-Reward, Participation > 33% 0.337*** (-8.73)GL Bid & GL Endorsement: Reward 1.125*** (8.39) GL Bid & GL Endorsement: Reward, Before 1.154*** (9.94) GL Bid & GL Endorsement: Reward, Before, Participation ≤ 33% 1.172*** (10.92)GL Bid & GL Endorsement: Reward, Before, Participation > 33% 0.821*** (-3.85)GL Bid & GL Endorsement: Reward, After 0.823*** (-4.60) GL Bid & GL Endorsement: Reward, After, Participation ≤ 33% 0.869*** (-3.30)GL Bid & GL Endorsement: Reward, After, Participation > 33% 0.084*** (-4.95)
Group Characteristics No Group 1.307*** (15.12) Reward Group 1.419*** (20.02) 1.425*** (19.34) 1.172*** (4.04) 1.182*** (4.26) 1.225*** (5.10)Vetting 0.865*** (-9.61) 0.856*** (-10.23) 0.874*** (-8.84) 0.882*** (-8.23)Listing Review Requirement 0.994 (-0.51) 0.997 (-0.24) 0.997 (-0.26) 0.993 (-0.64)Group Leader Offers Help 0.947*** (-3.53) 0.957*** (-2.82) 0.957*** (-2.83) 0.941*** (-3.91)
Listing Characteristics After Elimination of Group Leader Rewards 0.836*** (-20.37) 0.825*** (-11.83) 0.830*** (-11.48) 0.883*** (-6.96) 0.884*** (-6.93)Amount Requested (in $1,000) 1.062*** (89.84) 1.061*** (60.08) 1.061*** (60.10) 1.062*** (60.38) 1.061*** (59.57)Duration 0.983*** (-10.81) 0.979*** (-8.73) 0.978*** (-8.97) 0.979*** (-8.87) 0.979*** (-8.82)Listing Closed As Soon As Funded 1.357*** (40.29) 1.171*** (13.44) 1.172*** (13.47) 1.173*** (13.51) 1.174*** (13.62)
Borrower Characteristics Credit Grade: B 1.747*** (40.83) 1.774*** (24.59) 1.773*** (24.57) 1.770*** (24.51) 1.764*** (24.35)Credit Grade: C 2.305*** (62.86) 2.330*** (39.21) 2.333*** (39.23) 2.318*** (38.92) 2.305*** (38.65)Credit Grade: D 2.792*** (72.11) 2.627*** (43.00) 2.633*** (43.08) 2.621*** (42.87) 2.604*** (42.56)Credit Grade: E 3.812*** (81.09) 3.757*** (52.53) 3.760*** (52.54) 3.729*** (52.20) 3.717*** (52.06)Credit Grade: HR 4.741*** (92.24) 5.019*** (63.39) 5.030*** (63.46) 4.992*** (63.14) 4.977*** (62.99)Debt-to-Income Ratio 1.017*** (6.43) 1.022*** (6.48) 1.022*** (6.64) 1.023*** (6.82) 1.024*** (7.13)Is Borrower Home Owner 1.151*** (17.70) 1.109*** (9.32) 1.110*** (9.36) 1.111*** (9.48) 1.108*** (9.20)$1-24,999 1.126*** (3.76) 1.122** (2.50) 1.118** (2.42) 1.117** (2.39) 1.107** (2.21)$25,000-49,999 1.074** (2.29) 1.050 (1.08) 1.051 (1.09) 1.050 (1.06) 1.036 (0.77)$50,000-74,999 0.939** (-2.01) 0.938 (-1.40) 0.937 (-1.40) 0.935 (-1.45) 0.928 (-1.62)$75,000-99,999 0.935** (-2.08) 0.986 (-0.31) 0.985 (-0.31) 0.984 (-0.33) 0.971 (-0.63)$100,000 0.827*** (-5.74) 0.855*** (-3.23) 0.852*** (-3.29) 0.847*** (-3.40) 0.840*** (-3.58)Part-Time 0.991 (-0.48) 1.122*** (4.04) 1.131*** (4.30) 1.132*** (4.35) 1.120*** (3.98)Self-Employed 1.106*** (7.82) 0.952*** (-2.68) 0.952*** (-2.63) 0.951*** (-2.69) 0.948*** (-2.85)Retired 1.119*** (4.71) 1.315*** (8.79) 1.315*** (8.78) 1.317*** (8.83) 1.324*** (9.00)Not Employed 1.333*** (6.58) 1.326*** (4.54) 1.324*** (4.50) 1.319*** (4.44) 1.351*** (4.81)Current Delinquencies 1.023*** (20.59) 1.025*** (17.85) 1.025*** (18.02) 1.025*** (17.98) 1.025*** (17.83)Delinquencies Last 7 Years 0.998*** (-7.21) 0.998*** (-5.25) 0.998*** (-5.41) 0.998*** (-5.43) 0.998*** (-4.99)Public Records Last 10 Years 1.046*** (14.87) 1.074*** (15.05) 1.075*** (15.14) 1.076*** (15.35) 1.076*** (15.28)Total Credit Lines 1.006*** (16.79) 1.005*** (11.05) 1.005*** (11.02) 1.005*** (11.14) 1.005*** (11.19)Inquiries Last 6 Months 1.047*** (71.17) 1.043*** (49.79) 1.043*** (49.76) 1.043*** (49.76) 1.043*** (49.91)Amount Delinquent (in $1,000) 1.000 (-0.31) 1.003*** (4.43) 1.003*** (4.45) 1.003*** (4.56) 1.003*** (4.44)Public Records Last 12 Months 0.962*** (-3.09) 0.947*** (-2.98) 0.948*** (-2.96) 0.945*** (-3.08) 0.946*** (-3.07)Current Credit Lines 1.002 (1.17) 1.005** (1.99) 1.006** (2.18) 1.005** (2.10) 1.005** (1.98)Open Credit Lines 0.986*** (-6.79) 0.987*** (-4.45) 0.987*** (-4.61) 0.987*** (-4.59) 0.988*** (-4.41)Revolving Credit Balance (in $1,000) 1.000*** (5.24) 1.001*** (6.11) 1.001*** (6.16) 1.001*** (6.05) 1.001*** (6.11)Bankcard Utilization 0.935*** (-6.83) 0.924*** (-5.95) 0.924*** (-5.92) 0.923*** (-5.99) 0.924*** (-5.93)Months in Current Occupation 1.000*** (-2.80) 1.000 (-1.61) 1.000* (-1.77) 1.000* (-1.81) 1.000** (-1.99)
N 374,235 161,000 161,000 161,000 161,000 Note: In specification (4), the difference between the regression coefficients of “GL Bid & GL Endorsement: Reward, Before” and “GL Bid & GL Endorsement: Reward, After” is significant at 1%.

38
Table 8: Variable Definitions Variable Definition Group Leader Bid The group leader places a bid on the listing. Group Leader Endorsement The group leader writes an endorsement (a short text statement) on the borrower / her listing (before
the loan is funded or the listing expires). Only GL Bid The group leader places a bid on the listing but does not write an endorsement. Only GL Endorsement The group leader writes an endorsement for the listing but does not place a bid. GL Bid & GL Endorsement The group leader places a bid on the listing and writes an endorsement. Before / After The listing is created before / after the elimination of group leader rewards. “Before“ is the reference
in the multivariate analyses. No Group The listing is not posted in any group. No-Reward (Group) / Reward (Group) If the group leader does not request a reward for any listing posted in the group in the sample period,
the group is considered as a no-reward group. Otherwise the group is considered as a reward group. “No-Reward Group” is the reference in the multivariate analyses.
Vetting The group leader asks the borrower to provide information. Listing Review Requirement The group leader reviews the listing before it is open for bidding by the lenders. Group Leader Offers Help The group leader provides help in designing and writing the listing. Credit Grade: AA/A, B, C, D, E, HR Each borrower is assigned a credit grade based on her Experian credit score. AA designates the lowest
risk, HR the highest. “Credit Grade: AA/A” is the reference in the multivariate analyses. Debt-to-Income Ratio The debt-to-income ratio of the borrower at the time the listing was created. This value is capped at
1.01. Is Borrower Home Owner Specifies whether or not the member is a verified homeowner at the time the listing is created. Income Information Unavailable / $1-24,999 / $25,000-49,999 / $50,000-74,999 / $75,000-99,999 / $100,000+
The income range of the borrower at the time the listing is created. “Income Information Unavailable” is the reference in the multivariate analyses.
Full-Time / Part-Time / Self-Employed / Retired / Not Employed
The occupation status of the borrower at the time the listing is created. „Full-Time“ is the reference in the multivariate analyses.
Current Delinquencies Number of current delinquencies at the time the listing is created. Delinquencies Last 7 Years Number of delinquencies in the last 7 years at the time the listing is created. Public Records Last 10 Years Number of public records in the last 10 years at the time the listing is created. Total Credit Lines Number of total credit lines at the time the listing is created. Inquiries Last 6 Months Number of inquiries in the last 6 months at the time the listing is created. Amount Delinquent (in $1,000) The monetary amount delinquent at the time this listing is created. (in $1,000) Public Records Last 12 Months Number of public records in the last 12 months at the time the listing is created. Current Credit Lines Number of current credit lines at the time the listing is created. Open Credit Lines Number of open credit lines at the time the listing is created. Revolving Credit Balance (in $1,000) The monetary amount of revolving credit balance at the time the listing is created. (in $1,000) Bankcard Utilization Describes whether the borrower uses a banking card for her transactions. Length Status Months The length in months of the employment status of the borrower at the time the listing is created. Amount Requested (in $1,000) The amount requested by the borrower in the listing. (in $1,000) Duration The time for which the listing is open for bidding by potential lenders. Listing Closed As Soon As Funded The listing is automatically closed as soon as it is completely funded, i.e. once the total amount bid
reaches or exceeds the amount requested.