size, growth rate and distribution of population ppt 2011... · · 2011-04-05size, growth rate...
TRANSCRIPT

3SIZE, GROWTH RATE AND DISTRIBUTION OF POPULATION
Figures ! Maps "#Tables/Statements $ Notes

36
! Map 4
Population, 2001 (States/Union Territories)
Arunachal Pradesh10,97,968
INDIA
Population, 2001
(States/Union Territories)
Population
1, 00,00,000 and below
1, 00,00,001 - 2, 50,00,000
2, 50,00,001 - 5, 00,00,000
5, 00,00,001 - 10, 00,00,000
10, 00,00,001 and above
Jammu & Kashmir1,01,43,700
Punjab2,43,58,999
Rajasthan5,65,07,188
Gujarat5,06,71,017
Maharashtra9,68,78,627
Goa13,47,668
Karnataka5,28,50,562
Kerala3,18,41,374
Tamil Nadu6,24,05,679
Andhra Pradesh7,62,10,007
Chhattisgarh2,08,33,803
Orissa3,68,04,660
Tripura31,99,203
Jharkhand2,69,45,829
(P)Puducherry9,74,345
(P)
(P)
(P)
Lakshadweep60,650
Andaman & Nicobar Islands3,56,152
Indira Point
Barren I.(India)
Narcondam I.(India)
BAY OF BENGAL
INDIAN OCEAN
ARABIAN SEA
Daman & Diu1,58,204
Himachal Pradesh60,77,900
Chandigarh9,00,635
Uttarakhand84,89,349
Haryana2,11,44,564
Uttar Pradesh16,61,97,921
Dadra & Nagar Haveli2,20,490
West Bengal8,01,76,197
Madhya Pradesh6,03,48,023
Sikkim5,40,851
Bihar8,29,98,509
NCT of Delhi1,38,50,507
Meghalaya23,18,822
Assam2,66,55,528
Mizoram8,88,573
Manipur22,93,896
Nagaland19,90,036
0100 50050
Kilometres

Size, Growth Rate and Distribution of Population
PROVISIONAL POPULATION TOTALS – INDIA 37
! Map 5
Population, 2011 (States/Union Territories)
1, 00,00,000 and below
1, 00,00,001 - 2, 50,00,000
2, 50,00,001 - 5, 00,00,000
5, 00,00,001 - 10, 00,00,000
10, 00,00,001 and above
Arunachal Pradesh13,82,611
INDIA
Population, 2011
(States/Union Territories)
Population
Jammu & Kashmir1,25,48,926
Punjab2,77,04,236
Rajasthan6,86,21,012
Gujarat6,03,83,628
Maharashtra11,23,72,972
Goa14,57,723
Karnataka6,11,30,704
Kerala3,33,87,677
Tamil Nadu7,21,38,958
Andhra Pradesh8,46,65,533
Chhattisgarh2,55,40,196
Orissa4,19,47,358
Tripura36,71,032Jharkhand
3,29,66,238
(P)Puducherry12,44,464
(P)
(P)
(P)
Lakshadweep64,429
Andaman & Nicobar Islands3,79,944
Indira Point
Barren I.(India)
Narcondam I.(India)
BAY OF BENGAL
INDIAN OCEAN
ARABIAN SEA
Daman & Diu2,42,911
Himachal Pradesh68,56,509
Chandigarh10,54,686
Uttarakhand1,01,16,752
Haryana2,53,53,081
Uttar Pradesh19,95,81,477
Dadra & Nagar Haveli3,42,853
West Bengal9,13,47,736
Madhya Pradesh7,25,97,565
Sikkim6,07,688
Bihar10,38,04,637
NCT of Delhi1,67,53,235
Meghalaya29,64,007
Assam3,11,69,272
Mizoram10,91,014
Manipur27,21,756
Nagaland19,80,602
0100 50050
Kilometres

38
3Size, Growth Rate and Distribution of Population
ABSOLUTE NUMBERS
�e population of India at 0:00 hours of 1st March, 2011, as per the provisional population totals of Census 2011, is 1,210,193,422 compared to a total of 1,028,737,436 in 20011 . In absolute terms, the population of India has increased by more than 181 million during the decade 2001-2011. �e absolute addition to the population during the decade 2001-2011 is slightly lower than the population of Brazil, the ��h most populous country in the world!
INDIA IN WORLD POPULATION
�e estimated global population in 2010 was 6908.72 million. �e population of the ten most populous countries of the world are given in Statement 1. �eir relative share in the global population is shown in Figure 1. Population of these 10 countries have all grown over the last decade, except in Russian Federation, which has declined. At present, these ten countries account for nearly three-��h of the world population. �e three most populous ones, namely, China, India and USA, together account for four of every ten persons of the world. At present, a little more than one out of every six persons in the world is from India.
$ Notes
1 For comparability with earlier
results, the 2011 and 2001
totals include estimated
population of Purul, Pao Mata
and Mao Maran sub-divisions
of Senapati district of Manipur.
$ Source
2 Population Division of the
Department of Economic and
Social Affairs of the United
Nations Secretariat, World
Population Prospects: The 2008
Revision.
Figure 1
India in World Population
The population of India has increased by more than 181 million during the decade 2001-2011. The absolute addition is slightly lower than the population of Brazil, the fifth most populous country in the world!
The population of India, at 1210.2 million, is almost equal to the combined population of U.S.A., Indonesia, Brazil, Pakistan, Bangladesh and Japan put together- the population of these six countries totals 1214.3 million!
Japan 1.9% U.S.A 4.5%
Nigeria 2.3% Brazil 2.8%
Russian Fed 2.0% Indonesia 3.4%
India 17.5%Other Countries 41.2%
China 19.4%
Bangladesh 2.4% Pakistan 2.7%

Size, Growth Rate and Distribution of Population
PROVISIONAL POPULATION TOTALS – INDIA 39
�e gap between India, the country with the second largest population in the world and China, the country with the largest population in the world has narrowed from 238 million in 2001 to nearly 131 million in 2011. On the other hand, the gap between India and the United States of America, which has the third largest population, has now widened to about 902 million from 741 million in 2001. In 1950, China with 22 percent share of the world population was the world’s most populous country, followed by India, which had a share of 14.2 percent. �e population of India is almost equal to the combined population of U.S.A., Indonesia, Brazil, Pakistan, Bangladesh and Japan put together- the population of these six countries totals 1214.3 million!
A point that is striking is that while India accounts for a meagre 2.4 percent of the world surface area of 135.79 million square kms, it supports and sustains a whopping 17.5 percent of the world population. In contrast, the USA accounts for 7.2 percent of the surface area with only 4.5 percent of the world population. As such, among the ten most populous countries of the world, only Bangladesh has a higher population density compared to India9 .
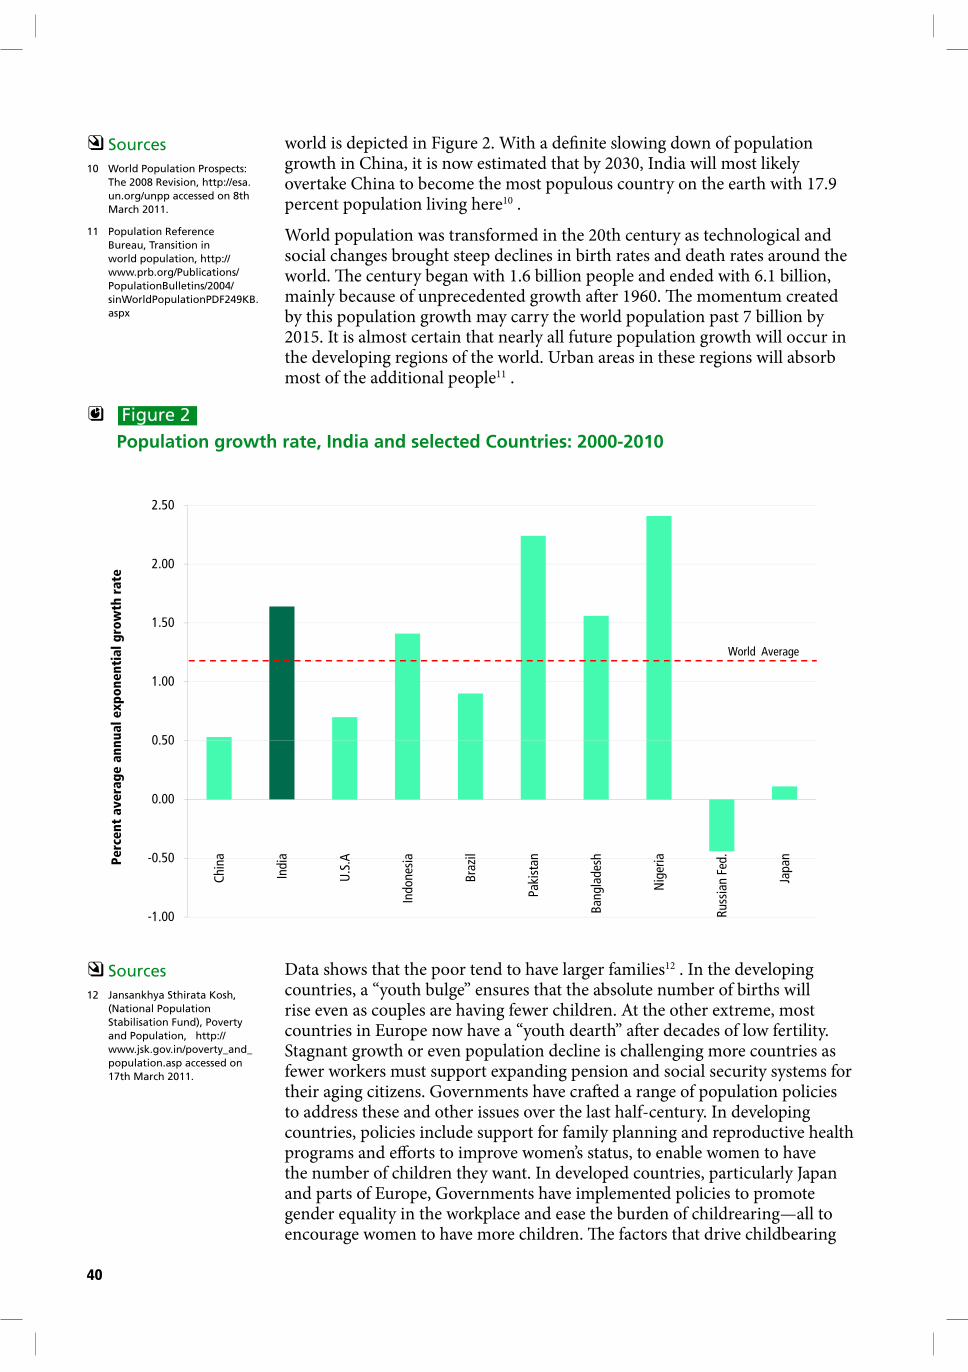
�e United Nations has estimated that the world population grew at an annual rate of 1.23 percent during 2000-2010. China registered a much lower annual growth rate of population (0.53 percent) during 2000-2010, as compared to India (1.64 percent during 2001-2011). In fact, the growth rate of China is now third lowest among the ten most populous countries, behind Russian Federation and Japan and it is substantially lower than the USA (0.7 percent). �e average annual exponential growth rate for selected countries and the
" Statement 1
Population of selected countries
$ Notes
1. For China3 , USA4 , Indonesia5 , Brazil6 and Japan7 , population are
as per the preliminary/ provisional Census figures provided in the
respective Govt. websites. For comparability with Census 2000 figures,
the population of Japan before adjustment has been considered.
2. Source for other countries: World Population Prospects8 : 2008 updated
in May 2010 by United Nations Population Division. The estimates are
medium Variant.
3. The percent decadal changes for China, Indonesia and Brazil have
been adjusted to take care of the change in reference dates of two
consecutive censuses of 2000 and 2010.
$ Sources
3 http://www.stats.gov.cn/
english/newsandcomingevents/
t20110228_402705764.htm
paragraph XI, accessed on 14th
March 2011
4 http://www.census.gov/
the figure is US resident
population.
5 http://dds.bps.go.id/
eng/tab_sub/view.
php?tabel=1&daftar=1&id_
subyek=12¬ab=1 accessed
on 23rd March 2011.
6 http://www.ibge.gov.br/
censo2010/primeiros_dados_
divulgados/index.php?uf=00
accessed on 9th March 2011.
7 http://www.stat.go.jp/english/
data/kokusei/index.htm
accessed on 17th March 2011.
8 Population Division of the
Department of Economic and
Social Affairs of the United
Nations Secretariat, World
Population Prospects: The 2008
Revision, http://esa.un.org/
UNPP/p2k0data.asp accessed
on 17th March 2011
9 Ibid.
Sl. No Country Reference date Population
(In millions)
Decadal change
(in %)
1 China 01.11.2010 1,341.0 5.43
2 India 01.03 2011 1,210.2 17.64
3 U.S.A 01.04.2010 308.7 7.26
4 Indonesia 31.05.2010 237.6 15.05
5 Brazil 01.08.2010 190.7 9.39
6 Pakistan 01.07.2010 184.8 24.78
7 Bangladesh 01.07.2010 164.4 16.76
8 Nigeria 01.07.2010 158.3 26.84
9 Russian Fed. 01.07.2010 140.4 -4.29
10 Japan 01.10.2010 128.1 1.1
Other Countries 01.07.2010 2844.7 15.43
World 01.07.2010 6908.7 12.97
40
$ Sources
10 World Population Prospects:
The 2008 Revision, http://esa.
un.org/unpp accessed on 8th
March 2011.
11 Population Reference
Bureau, Transition in
world population, http://
www.prb.org/Publications/
PopulationBulletins/2004/
sinWorldPopulationPDF249KB.
aspx
world is depicted in Figure 2. With a de�nite slowing down of population growth in China, it is now estimated that by 2030, India will most likely overtake China to become the most populous country on the earth with 17.9 percent population living here10 .
World population was transformed in the 20th century as technological and social changes brought steep declines in birth rates and death rates around the world. �e century began with 1.6 billion people and ended with 6.1 billion, mainly because of unprecedented growth a�er 1960. �e momentum created by this population growth may carry the world population past 7 billion by 2015. It is almost certain that nearly all future population growth will occur in the developing regions of the world. Urban areas in these regions will absorb most of the additional people11 .
Figure 2
Population growth rate, India and selected Countries: 2000-2010
0 50
1.00
1.50
2.00
2.50
ua
l e
xp
on
en
tia
l g
row
th r
ate
World Average
-1.00
-0.50
0.00
0.50
Chi
na
Indi
a
U.S
.A
Indo
nesi
a
Bra
zil
Paki
stan
Ban
glad
esh
Nig
eria
Rus
sian
Fed
.
Japa
nPe
rce
nt
ave
rag
e a
nn
Data shows that the poor tend to have larger families12 . In the developing countries, a “youth bulge” ensures that the absolute number of births will rise even as couples are having fewer children. At the other extreme, most countries in Europe now have a “youth dearth” a�er decades of low fertility. Stagnant growth or even population decline is challenging more countries as fewer workers must support expanding pension and social security systems for their aging citizens. Governments have cra�ed a range of population policies to address these and other issues over the last half-century. In developing countries, policies include support for family planning and reproductive health programs and e"orts to improve women’s status, to enable women to have the number of children they want. In developed countries, particularly Japan and parts of Europe, Governments have implemented policies to promote gender equality in the workplace and ease the burden of childrearing—all to encourage women to have more children. �e factors that drive childbearing
$ Sources
12 Jansankhya Sthirata Kosh,
(National Population
Stabilisation Fund), Poverty
and Population, http://
www.jsk.gov.in/poverty_and_
population.asp accessed on
17th March 2011.

Size, Growth Rate and Distribution of Population
PROVISIONAL POPULATION TOTALS – INDIA 41
" Statement 2
Population and its growth, India : 1901-2011
Absolute Percent Absolute Percent
1 2 3 4 5 6 7 8
1901 23,83,96,327 - - - - -
1911 25,20,93,390 1,36,97,063 5.75 - - 0.56 5.75
1921 25,13,21,213 -7,72,177 (0.31) -14469240 -6.05 -0.03 5.42
1931 27,89,77,238 2,76,56,025 11.00 28428202 11.31 1.04 17.02
1941 31,86,60,580 3,96,83,342 14.22 12027317 3.22 1.33 33.67
19511 36,10,88,090 4,24,27,510 13.31 2744168 -0.91 1.25 51.47
19611 43,92,34,771 7,81,46,681 21.64 35719171 8.33 1.96 84.25
1971 54,81,59,652 10,89,24,881 24.80 30778200 3.16 2.20 129.94
19812 68,33,29,097 13,51,69,445 24.66 26244564 -0.14 2.22 186.64
19913 84,64,21,039 16,30,91,942 23.87 2,79,22,497 17.12 2.16 255.05
20014 1,02,87,37,436 18,23,16,397 21.54 1,92,24,455 10.54 1.97 331.52
20114 1,21,01,93,422 18,14,55,986 17.64 -8,60,411 -0.47 1.64 407.64
Population and its growth, India : 1901-2011
Decadal growth Change in decadal
growth
Average annual
exponential
growth rate
(percent)
Progressive growth
rate over 1901
(percent)
PopulationCensus
Years
2001-2011 is the first decade (with the exception of 1911-1921) which has actually added lesser population compared to the previous decade.
trends—such as the economy, education, gender relations, and access to family planning—are numerous and complex, and public policies and programs to in#uence population trends must address many issues at once. Demographic changes o�en take years to be evident, making it di$cult to predict how today’s actions will a"ect the future size and distribution of populations. Small changes in childbearing trends today have huge implications for future population size.13
POPULATION GROWTH: INDIA 1901 TO 2011
�e population of India, at the turn of the twentieth century, was only around 238.4 million. �is has increased by more than four times in a period of one hundred and ten years to reach 1210 million in 2011. Interestingly, the population of India grew by one and half times in the �rst half of the twentieth century, while in the later half it recorded a phenomenal three-fold increase. Statement 2 presents the population of India as recorded in each decadal Census since 1901. Some other indicators of growth rate such as decadal growth rate, change in decadal growth, average annual exponential growth rate and progressive growth rate over 1901 during each decade have also been presented in this statement. Figure 3 shows the decadal growth of population for India during 1901-2011.
$ Sources
13 Population Reference
Bureau, Transition in
world population, http://
www.prb.org/Publications/
PopulationBulletins/2004/
sinWorldPopulationPDF249KB.
aspx, pp 4
$ Notes
1. In working out’Decadal Growth’ and ‘Percentage Decadal Growth’
For India 1941-51 and 1951 -61 the population of Tuensang district for
1951 (7,025) and the population of Tuensang (83,501) and Mon (5,774)
districts for 1961 Census of Nagaland state have not been taken into
account as the areas were censused for the first time in 1951 and the
same are not comparable.
2. The 1981 Census could not be held owing to disturbed conditions
prevailing in Assam. Hence the population figures for 1981 Census of
Assam have been worked out by ‘interpolation.
3. The 1991 Census could not be held owing to disturbed conditions
prevailing in Jammu and Kashmir. Hence the population figures
for 1991 Census of Jammu and Kashmir have been worked out by
‘interpolation.’
4. Includes estimated population of Paomata, Mao Maram and Purul sub-
divisions of Senapati District of Manipur for 2001.
5. Includes estimated population of Paomata, Mao Maram and Purul sub-
divisions of Senapati District of Manipur for 2011.
6. The percentage decadal growth shown in column 4 of Statement 2
indicates a decline from 24.80 percent during the decade 1961-71 to
24.66 percent during the decade 1971-81, while the average annual
exponential growth rate presented in column 7 of this statement
shows an increase from 2.20 to 2.22. This is because the percent
decadal variation has not been adjusted for the shift in reference data
in 1971. The decadal variation for 1961-71 relates to 121 months while
that 1971-81 relates to 119 months. If we adjust for this difference, the
percentage decadal growth works out to 24.59 percent for 1961-71 and
24.87 percent for the decade 1971-81.

42
! Map 6
Growth of Population, 1991-2001 (States/Union Territories)
Arunachal Pradesh27.0
INDIA
Growth of Population,1991-2001
(States/Union Territories)
Growth of Population (in %)
10 15 20 250
National Average : 21.5
Jammu & Kashmir29.4
Punjab20.1
Rajasthan28.4
Gujarat22.7
Maharashtra22.7
Goa15.2
Karnataka17.5
Kerala9.4
Tamil Nadu11.7
Andhra Pradesh14.6
Chhattisgarh18.3
Orissa16.3
Tripura16.0Jharkhand
23.4
(P)Puducherry20.6
(P)
(P)
(P)
Lakshadweep17.3
Andaman & Nicobar Islands26.9
Indira Point
Barren I.(India)
Narcondam I.(India)
BAY OF BENGAL
INDIAN OCEAN
ARABIAN SEA
Daman & Diu55.7
Himachal Pradesh17.5
Chandigarh40.3 Uttarakhand
20.4Haryana28.4
Uttar Pradesh25.9
Dadra & Nagar Haveli59.2
West Bengal17.8
Madhya Pradesh24.3
Sikkim33.1
Bihar28.6
NCT of Delhi47.0
Meghalaya30.7
Assam18.9
Mizoram28.8
Manipur24.9
Nagaland64.5
0100 50050
Kilometres

Size, Growth Rate and Distribution of Population
PROVISIONAL POPULATION TOTALS – INDIA 43
! Map 7
Growth of Population, 2001-2011 (States/Union Territories)
Arunachal Pradesh25.9
INDIA
Growth of Population, 2001-2011
(States/Union Territories)
Growth of Population (in %)
10 15 20 250
National Average : 17.6
Loss
Jammu & Kashmir23.7
Punjab13.7
Rajasthan21.4
Gujarat19.2
Maharashtra16.0
Goa8.2
Karnataka15.7
Kerala4.9
Tamil Nadu15.6
Andhra Pradesh11.1
Chhattisgarh22.6
Orissa14.0
Tripura14.7Jharkhand
22.3
(P)Puducherry27.7
(P)
(P)
(P)
Lakshadweep6.2
Andaman & Nicobar Islands6.7
Indira Point
Barren I.(India)
Narcondam I.(India)
BAY OF BENGAL
INDIAN OCEAN
ARABIAN SEA
Daman & Diu53.5
Himachal Pradesh12.8
Chandigarh17.1 Uttarakhand
19.2Haryana19.9
Uttar Pradesh20.1
Dadra & Nagar Haveli55.5
West Bengal13.9
Madhya Pradesh20.3
Sikkim12.4
Bihar25.1
NCT of Delhi21.0
Meghalaya27.8
Assam16.9
Mizoram22.8
Manipur18.7
Nagaland-0.5
0100 50050
Kilometres

44
Figure 3
India Population (in millions): 1901-2011
1210.19
1200.00
1400.00
252 09 251 32
278.98
318.66
361.09
439.23
548.16
683.33
846.42
1028.74
400.00
600.00
800.00
1000.00
N M
ILLIO
N)
238.40252.09 251.32
0.00
200.00
1901 1911 1921 1931 1941 1951 1961 1971 1981 1991 2001 2011
PO
PU
LA
TIO
N (
IN

Size, Growth Rate and Distribution of Population
PROVISIONAL POPULATION TOTALS – INDIA 45
One of the important features of the present decade is that, 2001-2011 is the �rst decade (with the exception of 1911-1921) which has actually added lesser population compared to the previous decade. �is implies that as a result of the combination of population momentum and somewhat impeded fertility, although India continues to grow in size, its pace of net addition is on the decrease.
In absolute terms, the population of India has increased by about 181 million during the decade 2001-2011. Although, the net addition in population during each decade has increased consistently, the changes in net addition has shown a steady declining trend over the decades starting from 1961. While 27.9 million more people were added between the decade 1981-1991 than between 1971-1981, this number declined to 19.2 million for the decades between 1981-1991 and 1991-2001. �e provisional results of 2011 shows that between 2001 and 2011, the net addition is less than that of the previous decade by 0.86 million.
POPULATION GROWTH RATES
It is signi�cant that the percentage decadal growth during 2001-2011 has registered the sharpest decline since independence. It declined from 23. 87 percent for 1981-1991 to 21.54 percent for the period 1991-2001, a decrease of 2.33 percentage point. For 2001-2011, this decadal growth has become 17.64 percent, a further decrease of 3.90 percentage points.
Similarly, the average exponential growth rate for 2001-2011 has declined to 1.64 percent per annum from 1.97 percent per annum during 1991-2001. �e average annual exponential growth rate during 1981-1991 was 2.16. Figure 4 depicts the percentage decadal growth rate of independent India.
Figure 4
Percentage decadal growth rates of population, India: 1951-1961 to 2001-2011
21.64
24.8 24.66
23.87
21.54
17.64
16
18
20
22
24
26
28
CEN
TA
GE D
EC
AD
AL G
RO
WTH
RA
TE
14
1951-1961
1961-1971
1971-1981
1981-1991
1991-2001
2001-2011
PE
RC
India
The percentage decadal growth during 2001-2011 has registered the sharpest decline since independence. For 2001-2011, this decadal growth has become 17.64 percent, a decrease of 3.90 percentage points from 21.54 percent for the period 2001-2011.

46
POPULATION: STATES AND UNION TERRITORIES
Uttar Pradesh continues to be the most populous State in the country with almost 200 million people living here, which is more than the population of Brazil, the ��h most populous country in the world. �e combined population of Uttar Pradesh and Maharashtra (the second most populous State), at 312 million, is substantially greater than the population of USA, the third most populous country of the world. Twenty States and Union Territories now have a population of over ten million. On the other extreme, there are �ve States and Union Territories in the country that are yet to reach the one million mark. Statement 3 and Figure 5 show the relative share of population of the States and Union Territories to the total population of India as per Census 2011. �e statement also provides the ranking of these States and Union Territories by Population size in 2001 and 2011.
While Uttar Pradesh (199.6 million), Maharashtra (112.4 million), Bihar (103.8 million), West Bengal (91.3 million) and Andhra Pradesh (84.7 million) have all held on to the top �ve slots in terms of their ranking in 2011 as compared to 2001, Madhya Pradesh (72.6 million), which has moved on to take the sixth position from its seventh position, pushing Tamil Nadu (72.1 million) now to the seventh spot. A little more than six of every ten Indians live in one of these seven States.
Figure 5
Population share of States and Union Territories, India: 2011
Uttar Pradesh continues to be the most populous State in the country with almost 200 million people living here, which is more than the population of Brazil. The combined population of Uttar Pradesh and Maharashtra (the second most populous State), at 312 million, is substantially greater than the population of USA.
A little more than six of every ten Indians live in one of the seven States:
Uttar Pradesh:
Maharashtra:
Bihar:
West Bengal:
Andhra Pradesh:
Madhya Pradesh:
Tamil Nadu:
199.6 million
112.4 million
103.8 million
91.3 million
84.7 million
72.6 million
72.1 million
Tamil Nadu 6%
Rajasthan 6%
Bihar 9%
Karnataka 5%
Maharashtra 9%Orissa 3%
Kerala 3%
Jharkhand 3%
Assam 3%
Punjab 2%
Gujarat 5%
Uttar Pradesh 16%
Madhya Pradesh 6%
And ra Pradesh 7%
West Bengal 8%
Haryana 2%
Chhattisgarh 2%
Uttarakhand 1%
Jammu & Kashmir 1%
Delhi 1%
Other States & UTs 2%
h

Size, Growth Rate and Distribution of Population
PROVISIONAL POPULATION TOTALS – INDIA 47
! Statement 3
Ranking of States and Union Territories by population: 2001 and 2011
Rank
In
2011
India/State/Union Territory #
2011 2001
1 2 3 4 5 6
INDIA 1,21,01,93,422 100.00 100.00
1 Uttar Pradesh 19,95,81,477 16.49 16.16 1
2 Maharashtra 11,23,72,972 9.29 9.42 2
3 Bihar 10,38,04,637 8.58 8.07 3
4 West Bengal 9,13,47,736 7.55 7.79 4
5 Andhra Pradesh 8,46,65,533 7.00 7.41 5
6 Madhya Pradesh 7,25,97,565 6.00 5.87 7
7 Tamil Nadu 7,21,38,958 5.96 6.07 6
8 Rajasthan 6,86,21,012 5.67 5.49 8
9 Karnataka 6,11,30,704 5.05 5.14 9
10 Gujarat 6,03,83,628 4.99 4.93 10
11 Orissa 4,19,47,358 3.47 3.58 11
12 Kerala 3,33,87,677 2.76 3.10 12
13 Jharkhand 3,29,66,238 2.72 2.62 13
14 Assam 3,11,69,272 2.58 2.59 14
15 Punjab 2,77,04,236 2.29 2.37 15
16 Chhattisgarh 2,55,40,196 2.11 2.03 17
17 Haryana 2,53,53,081 2.09 2.06 16
18 NCT of Delhi # 1,67,53,235 1.38 1.35 18
19 Jammu & Kashmir 1,25,48,926 1.04 0.99 19
20 Uttarakhand 1,01,16,752 0.84 0.83 20
21 Himachal pradesh 68,56,509 0.57 0.59 21
22 Tripura 36,71,032 0.30 0.31 22
23 Meghalaya 29,64,007 0.24 0.23 23
24 Manipur 27,21,756 0.22 0.22 24
25 Nagaland 19,80,602 0.16 0.19 25
26 Goa 14,57,723 0.12 0.13 26
27 Arunachal pradesh 13,82,611 0.11 0.11 27
28 Puducherry # 12,44,464 0.10 0.09 28
29 Mizoram 10,91,014 0.09 0.09 30
30 Chandigarh # 10,54,686 0.09 0.09 29
31 Sikkim 6,07,688 0.05 0.05 31
32 Andaman & Nicobar Islands # 3,79,944 0.03 0.03 32
33 Dadra & Nagar Haveli # 3,42,853 0.03 0.02 33
34 Daman & Diu # 2,42,911 0.02 0.02 34
35 Lakshadweep # 64,429 0.01 0.01 35
Percent to total
population of
India
Population 2011 Rank in
2001
" Notes: See notes 4 & 5 below Statement 2

48
POPULATION GROWTH RATES: EAG STATES AND NON-EAG STATES
A�er the Aryan migration about 3500 years ago, there occurred a fundamental shi� in the demographic centre of gravity from the Indus valley into the Gangetic plain14 . �e growth of India’s population has, since then, followed a pattern similar to those observed in this area. To analyse this a bit more closely, the growth rates of eight States popularly referred to in administrative parlance as the eight Empowered Action Group (EAG) States, namely, Rajasthan, Uttar Pradesh, Uttarakhand, Bihar, Jharkhand, Madhya Pradesh, Chhattisgarh and Orissa is compared with the rest of the States and Union Territories. �e EAG group, from 1951 till 2011, have hosted between forty three to forty six percent of India’s population. Figure 6 depicts the growth trajectory of India, the EAG group and the non-EAG group during the decades 1951-1961 to 2001-2011.
Figure 6
Growth rates of India, EAG States and non-EAG States and Union Territories, 1951-1961 to 2001-2011
Between 1951 and 1971, both the EAG and non-EAG States and Union Territories have grown resulting in an increase in the overall population of India. During this phase, the growth rate for the non-EAG States and Union Territories was more than that of the EAG States. From 1971 onwards, as a result of fertility decline in the non-EAG States and Union Territories there was a continuous fall in their growth. �e growth rates in the EAG States stagnated around twenty �ve percent till 1981-1991. As a result, the decadal growth rate of India, till 1991, was almost at a constant level !uctuating around twenty four percent. During 1991-2001, the growth rate for the EAG States remained same as that in the previous decade, whereas there was continuous reduction in the growth rate of non-EAG States and Union Territories. �is was primarily responsible to bring about a signi�cant fall of about 2.3 percent in the growth rate of the country as a whole. During 2001-2011, for the �rst time, the growth
" Sources
14 Tim Dyson, India’s Population -
The Past, Twenty-first Century
India, Population, Economy,
Human Development, and the
Environment, edited by Tim
Dyson, Robert Cassen & Leela
Visaria, Oxford University Press,
pp16
Census 2011 marks a milestone in the demographic history of the country as it is perhaps for the first time, there is a significant fall in growth rate of population in the EAG States after decades of stagnation.
" Notes: See notes 1 to 6
below Statement 2
EAG States: Rajasthan, Uttar
Pradesh, Uttarakhand, Bihar,
Jharkhand, Madhya Pradesh,
Chhattisgarh and Orissa
21.64
24.8
24.6623.87
21.54
17.6419.91
23.01
25.43
25.12
24.99
20.92
23.00
26.17
24.08
22.92
18.90
14.99
14
16
18
20
22
24
26
28
PER
CEN
TA
GE D
EC
AD
AL G
RO
WTH
RA
TE
India
EAG States
Non-EAG
States/UTs
1951-1
961
1961-1
971
1971-1
981
1981-1
991
1991-2
001
2001-2
011
P
Size, Growth Rate and Distribution of Population
PROVISIONAL POPULATION TOTALS – INDIA 49
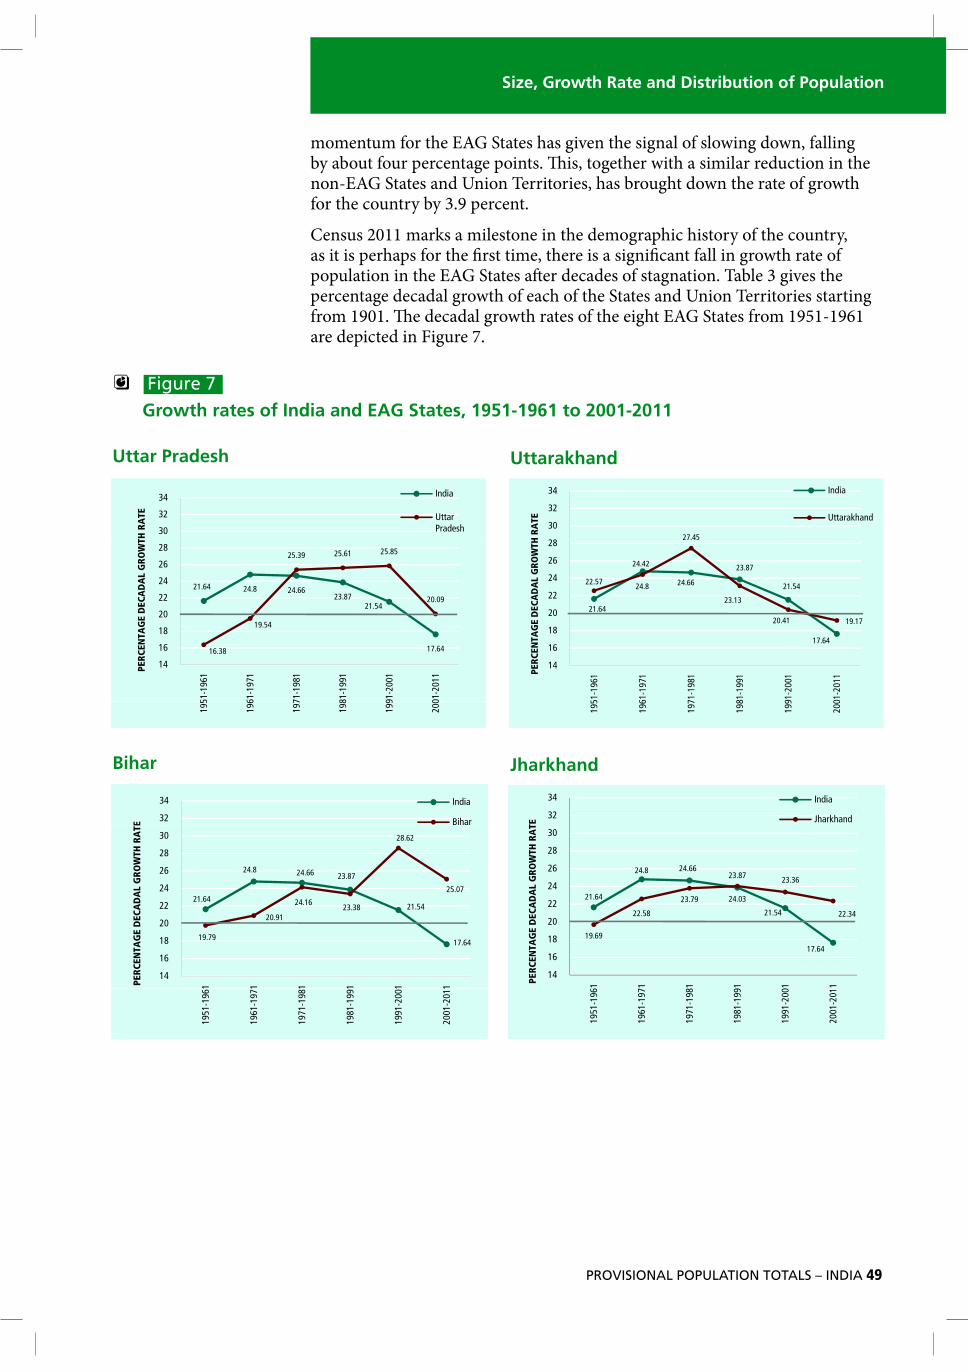
momentum for the EAG States has given the signal of slowing down, falling by about four percentage points. �is, together with a similar reduction in the non-EAG States and Union Territories, has brought down the rate of growth for the country by 3.9 percent.
Census 2011 marks a milestone in the demographic history of the country, as it is perhaps for the �rst time, there is a signi�cant fall in growth rate of population in the EAG States a�er decades of stagnation. Table 3 gives the percentage decadal growth of each of the States and Union Territories starting from 1901. �e decadal growth rates of the eight EAG States from 1951-1961 are depicted in Figure 7.
Figure 7
Growth rates of India and EAG States, 1951-1961 to 2001-2011
Uttar Pradesh Uttarakhand
Bihar Jharkhand
30
32
34
TH
RA
TE
India
Uttar
Pradesh
21.64 24.8 24.6623.87
21.54
17.6416.38
19.54
25.39 25.61 25.85
20.09
14
16
18
20
22
24
26
28
51-1
961
61-1
971
71-1
981
81-1
991
91-2
001
01-2
011
PE
RC
EN
TA
GE
DE
CA
DA
L G
RO
WT
195
196
197
198
199
200
32
34
E
India
Uttarakh
21.64
24.824.66
23.87
21.54
17.64
22.57
24.42
27.45
23.13
20.41 19.17
14
16
18
20
22
24
26
28
30
1 1 1 1 1 1
PE
RC
EN
TA
GE
DE
CA
DA
L G
RO
WTH
RA
T Uttarakhand
1951-196
1961-197
1971-198
1981-199
1991-200
2001-201
32
34
E
India
Bihar
21.64
24.8 24.6623.87
21.54
17.6419.79
20.91
24.1623.38
28.62
25.07
14
16
18
20
22
24
26
28
30
1 1 1 1 1 1PE
RC
EN
TA
GE
DE
CA
DA
L G
RO
WTH
RA
T
1951-1961
1961-1971
1971-1981
1981-1991
1991-2001
2001-2011
28
30
32
34
H R
ATE
India
Jharkhand
21.64
24.8 24.6623.87
21.54
17.64
19.69
22.58
23.79 24.03
23.36
22.34
14
16
18
20
22
24
26
28
51-1961
61-1971
71-1981
81-1991
91-2001
01-2011
PE
RC
EN
TA
GE
DE
CA
DA
L G
RO
WTH
195
196
197
198
199
200

50
Among the EAG States, Uttarakhand and Orissa seem to be performing better than the rest, with the latter registering consistently lower growth rates than the Nation since 1971.
During 2001-2011, the growth rates of almost all States and Union Territories have registered a lower �gure compared to the previous decade, namely, 1991-2001. �e percentage decadal growth rates of the six most populous States, namely, Uttar Pradesh, Maharashtra, Bihar, West Bengal, Andhra Pradesh and Madhya Pradesh have all fallen during 2001-2011 compared to 1991-2001, the fall being the lowest for Andhra Pradesh (3.5 percentage points) and highest for Maharashtra (6.7 percentage points). Tamil Nadu (3.9 percentage points) and Puducherry (7.1 percentage points) have registering some increase during 2001-2011 over the previous decade. Growth rates for some of the more populous non-EAG States and Union Territories are represented in Figure 8.
Rajasthan Orissa
Figure 7
Growth rates of India and EAG States, 1951-1961 to 2001-2011
The percentage decadal growth rates of the six most populous States, namely, Uttar Pradesh, Maharashtra, Bihar, West Bengal, Andhra Pradesh and Madhya Pradesh have all fallen during 2001-2011 compared to 1991-2001, the fall being the lowest for Andhra Pradesh (3.5 percentage points) and highest for Maharashtra (6.7 percentage points).
Madhya Pradesh Chhattisgarh
29.28
27 16 27 2428
30
32
34
TH
RA
TE
India
Madhya Pradesh
21.64
24.8 24.6623.87
21.54
17.64
24.73
27.16 27.24
24.26
20.3
14
16
18
20
22
24
26
28
51-1
961
61-1
971
71-1
981
81-1
991
91-2
001
01-2
011
PE
RC
EN
TA
GE
DE
CA
DA
L G
RO
WT
195
196
197
198
199
200
32
34
ATE
India
21.64
24.8 24.6623.87
21.54
17.64
22.77
27.12
20.39
25.73
18.27
22.59
14
16
18
20
22
24
26
28
30
961
971
981
991
2001
2011
PE
RC
EN
TA
GE
DE
CA
DA
L G
RO
WTH
RA
1951-1
1961-1
1971-1
1981-1
1991-2
2001-2
Chhattisgarh
32
34
RA
TE India
R j th
21.64
24.8 24.6623.87
21.54
17.64
26.2
27.83 32.97 28.4428.41
21.44
14
16
18
20
22
24
26
28
30
1961
1971
1981
1991
2001
2011
PE
RC
EN
TA
GE
DE
CA
DA
L G
RO
WTH
R Rajasthan
1951-
1961-
1971-
1981-
1991-
2001-
32
34
ATE
India
Orissa
21.64
24.8 24.6623.87
21.54
17.6419.82
25.05
20.17
20.06
16.25
14
16
18
20
22
24
26
28
30
1 1 1 1 1 1
PE
RC
EN
TA
GE
DE
CA
DA
L G
RO
WTH
RA Orissa
1951-196
1961-197
1971-198
1981-199
1991-200
2001-201

Size, Growth Rate and Distribution of Population
PROVISIONAL POPULATION TOTALS – INDIA 51
Maharashtra Gujarat
Figure 8
Growth rates of India and some of the more populous non-EAG States and Union Territories, 1951-1961 to 2001-2011
Andhra Pradesh
Tamil Nadu
Karnataka
Kerala
40 India
Maharasht
21.64
24.8 24.6623.87
21.54 17.64
23.6
27.45
24.5425.73
22.73
15.99
5
10
15
20
25
30
35
961
971
981
991
001
011
AG
E D
EC
AD
AL G
RO
WTH
RA
TE
Maharashtra
0
5
1951-19
1961-19
1971-19
1981-19
1991-20
2001-20
PER
CEN
TA
40 India
Gujarat
21.64
24.8 24.66
23.87
21.54
17.64
26.88
29.3927.67
21.19
22.66
19.17
5
10
15
20
25
30
35
961
971
981
991
2001
2011
AG
E D
EC
AD
AL G
RO
WTH
RA
TE
Gujarat
0
5
1951-1
1961-1
1971-1
1981-1
1991- 2
2001-2
PER
CEN
TA
40
India
21.64
24.8 24.66 23.87
21.54
17.64
15.65
20.9
23.124.2
14.59 11.1
10
15
20
25
30
35
61
71
81
91
01
11
AG
E D
EC
AD
AL G
RO
WTH
RA
TE
Andhra Pradesh
0
5
1951-1
9
1961-1
9
1971-1
9
1981-1
9
1991-2
0
2001-2
0
PER
CEN
TA
40 India
Karnataka
21.64
24.8
24.66
23.87
21.54
17.6421.57
24.22
26.75
21.12
17.51
15.67
5
10
15
20
25
30
35
961
971
981
991
2001
2011
AG
E D
EC
AD
AL G
RO
WTH
RA
TE
Karnataka
0
5
1951-1
1961-1
1971-1
1981-1
1991-2
2001-2
PER
CEN
TA
35
40 India
Tamil Nadu
21.64
24.8 24.6623.87
21.54
17.64
11.85
22.3 17.5
15.39
11.72 15.6
5
10
15
20
25
30
35
961
971
981
991
2001
2011
NTA
GE
DE
CA
DA
L G
RO
WTH
RA
TE
Tamil Nadu
0
5
1951-1
1961-1
1971-1
1981-1
1991- 2
2001-2
PER
CE
N
35
40
India
Kerala
21.64
24.8
24.66
23.87
21.5417.64
24.7626.29
19.24
14.32
9.43
4.86
0
5
10
15
20
25
30
RC
EN
TA
GE
DE
CA
DA
L G
RO
WTH
RA
TE
0
1951-1961
1961-1971
1971-1981
1981-1991
1991-2001
2001-2011
PE

52
Figure 8
Growth rates of India and some of the more populous non-EAG States and Union Territories, 1951-1961 to 2001-2011
West Bengal Assam
Punjab
Delhi
Haryana
Jammu & Kashmir
35
40 India
West
21.6424.8
24.66
23.87
21.54
17.64
32.8
26.87
23.17
24.73
17.77
13.9310
15
20
25
30
35
961
971
981
991
001
011
AG
E D
EC
AD
AL G
RO
WTH
RA
TE
West Bengal
0
5
1951
-19
1961
-19
1971
-19
1981
-19
1991
-20
2001
-20
PER
CEN
TA
34.95
35
40
India
A
21.64
24.8
24.66
23.87
21.54
17.64
34.98
23.36
24.24
18.9216.93
10
15
20
25
30
35
961
971
981
991
001
011
GE
DE
CA
DA
L G
RO
WTH
RA
TE
Assam
0
5
1951-19
1961-19
1971-19
1981-19
1991-20
2001-20
PER
CEN
TA
G
35
40India
21.64
24.8 24.66 23.87
21.54
17.6421.56 21.7
23.89
20.81 20.1
13.73
10
15
20
25
30
35
961
971
981
991
001
011
AG
E D
EC
AD
AL G
RO
WTH
RA
TE
Punjab
0
5
1951-19
1961-19
1971-19
1981-19
1991-20
2001-20
PER
CEN
TA
33 935
40 India
Haryana
21.64
24.8 24.6623.87
21.54
17.64
33.7932.22
28.7527.41 28.43
19.9
10
15
20
25
30
35
961
971
981
991
001
011
TA
GE
DE
CA
DA
L G
RO
WTH
RA
TE
Haryana
0
5
1951-19
1961-19
1971-19
1981-19
1991-20
2001-20
PE
RC
EN
T
60India
Delhi
21.64
24.8 24.66 23.87
21.5417.64
52.44 52.93 5351.45
47.02
20.96
10
20
30
40
50
TA
GE
DE
CA
DA
L G
RO
WTH
RA
TE
Delhi
0
1951-1961
1961-1971
1971-1981
1981-1991
1991-2001
2001-2011
PE
RC
EN
T
40
India
Jammu &
K h i
21.6424.8 24.66
23.87
21.54
17.64
9.44
29.65 29.69 30.34 29.43
23.71
5
10
15
20
25
30
35
961
971
981
991
2001
2011
TA
GE
DE
CA
DA
L G
RO
WTH
RA
TE
Kashmir
0
5
1951-1
1961-1
1971-1
1981-1
1991-2
2001-2
PER
CEN
T
3

Size, Growth Rate and Distribution of Population
PROVISIONAL POPULATION TOTALS – INDIA 53
Figures 7 and 8 also show that among the EAG States, the growth of Orissa also started to fall from 1971, and its growth rate during 2001-2011, at fourteen percent, is lower than the average of the non-EAG States. On the other, among the non-EAG States, the growth rates of Gujarat, Haryana, Delhi and Jammu & Kashmir are higher than the current National average. �e reasons for the same might be di�erent for di�erent States.
POPULATION GROWTH: ALL STATES AND UNION TERRITORIES
Exactly half of the twenty most populous States, each with a population of ten million or more, have added lesser persons in the decade 2001-2011 compared to the previous one. Had these ten States added the same number of persons during 2001-2011 as they did in the previous decade, everything else remaining the same, India would have added another 9.7 million more persons during this decade. �e phenomenon of low growth have started to spread beyond the boundaries of the Southern States during 2001-11, where in addition to Andhra Pradesh, Tamil Nadu and Karnataka in the South, Himachal Pradesh and Punjab in the North, West Bengal and Orissa in the East, and Maharashtra in the West have registered a growth rate between eleven to sixteen percent in 2001-2011 over the previous decade. �e Provisional Population Totals of Census 2001 predicted this: “It is also obvious that in the contiguous four major South Indian States fertility decline appears to have well established, stretching to neighbouring Maharashtra on the west and Orissa and West Bengal in the east, whereas in other regions it is rather scattered15.”
Among the smaller States and Union Territories, Dadra and Nagar Haveli and Daman and Diu registered very high growth rates of more than !"y three percentage points. In contrast, Lakshadweep, Andaman & Nicobar Islands and Goa have registered single digit decadal growth. Nagaland is the only State which has registered a small negative growth during 2001-2011 a"er very high growths in all the previous decades.
Statement 4 gives the selected indicators of population growth in di�erent States and Union territories of India. �e percentage decadal growth of population in the inter-Censal period 2001-2011, among the more populous States and Union Territories, varied from a low of 4.86 in Kerala to a very high 25.07 in Bihar. Jammu & Kashmir with 23.71 percent, Chhattisgarh with 22.59 and Jharkhand with 22.34 also registered very high growth rates.
�e percentage decadal growth has declined during the census decade 2001-2011 as compared to the previous census decade in all the States and Union Territories except Chhattisgarh, Tamil Nadu and Puducherry, which together constitute about 8.17 percent of India’s population.
A decline of more than !ve percentage points in decadal growth rate from the previous census decade was recorded for !"een States and Union Territories, namely, for the States Jammu & Kashmir, Punjab, Haryana, Rajasthan, Uttar Pradesh, Sikkim, Nagaland, Manipur, Mizoram, Maharashtra and Goa, and also for the Union Territories of Delhi, Chandigarh, Lakshadweep and Andaman and Nicobar Islands. �ese !"een States and Union Territories together account for more than thirty nine per cent of the country’s population. Among the larger States and Union Territories, Delhi has registered the sharpest drop of twenty six percentage points during the said period followed by Haryana (8.53), Rajasthan (6.97) and Maharashtra (6.74).
! Sources
15 Census of India 2001,
Provisional Population Totals,
Paper 1 of 2001, pp 50.
More than nine out of every ten Indians live in States and Union Territories which have shown a declining trend in population growth.

54
2001 2011 1991
-2001
2001
-2011
1991
-2001
2001
-2011
1 2 3 4 5 6 7 8 9
INDIA 1,02,87,37,436 1,21,01,93,422 21.54 17.64 -3.9 1.97 1.64
1 Jammu & Kashmir 10143700 12548926 29.43 23.71 -5.72 2.61 2.15
2 Himachal Pradesh 60,77,900 68,56,509 17.54 12.81 -4.73 1.63 1.21
3 Punjab 2,43,58,999 2,77,04,236 20.1 13.73 -6.37 1.85 1.3
4 Chandigarh # 9,00,635 10,54,686 40.28 17.1 -23.18 3.44 1.59
5 Uttarakhand 84,89,349 1,01,16,752 20.41 19.17 -1.24 1.87 1.77
6 Haryana 2,11,44,564 2,53,53,081 28.43 19.9 -8.53 2.53 1.83
7 NCT of Delhi # 1,38,50,507 1,67,53,235 47.02 20.96 -26.06 3.93 1.92
8 Rajasthan 5,65,07,188 6,86,21,012 28.41 21.44 -6.97 2.53 1.96
9 Uttar Pradesh 16,61,97,921 19,95,81,477 25.85 20.09 -5.76 2.33 1.85
10 Bihar 8,29,98,509 10,38,04,637 28.62 25.07 -3.55 2.55 2.26
11 Sikkim 5,40,851 6,07,688 33.06 12.36 -20.7 2.9 1.17
12 Arunachal Pradesh 10,97,968 13,82,611 27 25.92 -1.08 2.42 2.33
13 Nagaland 19,90,036 19,80,602 64.53 -0.47 -65 5.11 -0.05
14 Manipur 22,93,896 27,21,756 24.86 18.65 -6.21 2.25 1.72
15 Mizoram 8,88,573 10,91,014 28.82 22.78 -6.04 2.57 2.07
16 Tripura 31,99,203 36,71,032 16.03 14.75 -1.28 1.5 1.39
17 Meghalaya 23,18,822 29,64,007 30.65 27.82 -2.83 2.71 2.49
18 Assam 2,66,55,528 3,11,69,272 18.92 16.93 -1.99 1.75 1.58
19 West Bengal 8,01,76,197 9,13,47,736 17.77 13.93 -3.84 1.65 1.31
20 Jharkhand 2,69,45,829 3,29,66,238 23.36 22.34 -1.02 2.12 2.04
21 Orissa 3,68,04,660 4,19,47,358 16.25 13.97 -2.28 1.52 1.32
22 Chhattisgarh 2,08,33,803 2,55,40,196 18.27 22.59 4.32 1.69 2.06
23 Madhya Pradesh 6,03,48,023 7,25,97,565 24.26 20.3 -3.96 2.2 1.87
24 Gujarat 5,06,71,017 6,03,83,628 22.66 19.17 -3.49 2.06 1.77
25 Daman & Diu # 1,58,204 2,42,911 55.73 53.54 -2.19 4.53 4.38
26 Dadra & Nagar Haveli # 2,20,490 3,42,853 59.22 55.5 -3.72 4.76 4.51
27 Maharashtra 9,68,78,627 11,23,72,972 22.73 15.99 -6.74 2.07 1.49
28 Andhra Pradesh 7,62,10,007 8,46,65,533 14.59 11.1 -3.49 1.37 1.06
29 Karnataka 5,28,50,562 6,11,30,704 17.51 15.67 -1.84 1.63 1.47
30 Goa 13,47,668 14,57,723 15.21 8.17 -7.04 1.43 0.79
31 Lakshadweep # 60,650 64,429 17.3 6.23 -11.07 1.61 0.61
32 Kerala 3,18,41,374 3,33,87,677 9.43 4.86 -4.57 0.9 0.48
33 Tamil Nadu 6,24,05,679 7,21,38,958 11.72 15.6 3.88 1.11 1.46
34 Puducherry # 9,74,345 12,44,464 20.62 27.72 7.1 1.89 2.48
35 Andaman & Nicobar Islands # 3,56,152 3,79,944 26.9 6.68 -20.22 2.41 0.65
Average annual
exponential
growth rate
Total Population Percentage
decadal
growth
India/State/Union
Territory #
State/
UT
Code
Change in
percentage
decadal
growth
" Statement 4
Population, percentage decadal growth and average annual exponential growth rates 1991-2001 and 2001-2011
! Notes: See notes 3,4 & 5 below Statement 2

Size, Growth Rate and Distribution of Population
PROVISIONAL POPULATION TOTALS – INDIA 55
�e remaining seventeen States and Union Territories have shown a decline of one to !ve percentage points in their growth rates during 2001-2011 as compared to 1991-2001. �ese seventeen States and Union Territories together account for more than !"y two per cent of total population. �us more than nine out of every ten Indians live in States and Union Territories which have shown a declining trend in population growth.
Statement 5 gives the distribution of States and Union Territories by ranges of percentage decadal growth and the percentage of population of these States/Union Territories. It brings out the major shi" in distribution of States and Union Territories by the ranges of growth rates between 1991-2001 and 2001-2011. �e number of States and Union Territories with percentage decadal growth below eighteen percent, the current National average, has increased substantially from ten in 1991-2001 to seventeen in the decade 2001-2011, whereas the number of States/Union Territories with percentage decadal growth more than eighteen percent has reduced signi!cantly from twenty !ve to eighteen. �e sum total of the population of the States and Union Territories that registered less than the national growth rate has shown an impressive increase from about thirty four percent in 2001 to forty seven percent in 2011. Twelve States and Union Territories, with a combined population amounting to a little more than twenty four percent of India has grown by less than !"een percent during 2001-2011. �e number of such States and Union Territories was only three during 1991-2001. �e relative situation across the States and Union Territories in terms of decadal growth rates can be seen at Figure 9.
Uttarakhand
ManipurINDIA
Chandigarh #Assam
MaharashtraKarnataka
Tamil NaduTripuraOrissa
West BengalPunjab
Himachal PradeshSikkim
Andhra PradeshGoa
Andaman & Nicobar Islands #Lakshadweep #
KeralaNagaland
-10 -5 0 5 10 15 20 25 30 35 40 45 50 55 60
Dadra & Nagar Haveli #Daman & Diu #
MeghalayaPuducherry #
Arunachal Pradesh
BiharJammu & Kashmir
MizoramChhattisgarh
JharkhandRajasthan
DelhiMadhya Pradesh
Uttar PradeshHaryanaGujarat
PERCENTAGE INCREASE
STA
TES
/UN
ION
TER
RIT
OR
IES
Figure 9
Decadal growth rate of population, India, States and Union Territories: 2001-2011

56
" Statement 5
Number of States and Union Territories by range of percentage decadal growth rates: 1991-2001 and 2001-2011
Percentage
decadal
growth
Number of States
/Union Territories
1991-2001
Percentage of
population to
total population
2001
Number of States
/Union Territories
2001-2011
Percentage of
population to
total population
2011
1 2 3 4 5
<12 2 9.16 6 10.08
12-15 1 7.41 6 14.22
15-18 7 17.55 5 22.96
18-21 5 7.9 7 32.02
21-24 3 16.96 5 11.63
24-27 4 22.28 2 8.69
27-30 6 16.8 2 0.35
30+ 7 1.94 2 0.05
A similar inference could be drawn from Statement 6 in which the States and Union Territories have been classi!ed by ranges of the average annual exponential growth rates for these decades. �e proportion of population of the States and Union Territories in each of these categories to the total population has also been shown. During the period 1991-2001, !"een States and Union Territories, with a share of about forty two percent of India’s population, registered an annual growth rate of less than two percent. During 2001-2011, as many as twenty !ve States and Union Territories with a share of about eighty !ve percent fall in this category. Fi"een States and Union Territories have grown by less than 1.5 percent per annum during 2001-2011, while the number of such States and Union Territories was only four during the previous decade.
" Statement 6
Number of States and Union Territories by range of average annual exponential growth rates: 1991-2001 and 2001-2011
Average
annual
exponential
growth rate
Number of States/
Union Territories
1991-2001
Percentage
of population
to total
population
Number of States/
Union Territories
2001-2011
Percentage
of population
to total
population
1 2 3 4 5
<1.0 1 3.10 5 3.08
1.0-1.4 3 13.61 10 41.52
1.5-1.9 11 25.32 10 40.35
2.0-2.4 8 39.35 8 15
2.5-2.9 7 16.97 0 0
3.0+ 5 1.66 2 0.05
During 2001-2011, as many as twenty five States and Union Territories with a share of about eighty five percent registered an annual growth rate of less than two percent. During the period 1991-2001, fifteen States and Union Territories, with a share of about forty two percent of India’s population, were in this category.
! Notes: See notes 3,4 & 5 below Statement 2
! Notes: See notes 3, 4 & 5 below Statement 2

Size, Growth Rate and Distribution of Population
PROVISIONAL POPULATION TOTALS – INDIA 57
" Statement 7
Decadal growth of population and percentage contribution to total growth of India: 1991-2001 and 2001-2011
1991-2001 2001-2011 1991-2001 2001-2011
654321
INDIA 18,23,16,397 18,14,55,986 100.00 100.00
33.172.1622,50,42946,60,32rimhsaK & ummaJ1
34.05.0906,87,7320,70,9hsedarP lahcamiH2
48.142.2732,54,33030,77,04bajnuP3
4 Chandigarh # 2,58,620 1,54,051 0.14 0.08
9.097.0304,72,61517,83,41dnahkarattU5
23.275.2715,80,24619,08,64anayraH6
7 NCT of Delhi # 44,29,863 29,02,728 2.43 1.60
86.668.6428,31,12,1891,10,52,1nahtsajaR8
04.8127.81655,38,33,3862,63,14,3hsedarP rattU9
74.1131.01821,60,80,2559,76,48,1rahiB01
40.070.0738,66493,43,1mikkiS11
61.031.0346,48,2014,33,2hsedarP lahcanurA21
10.0-34.0434,9-094,08,7dnalagaN31
42.052.0068,72,4747,65,4rupinaM41
11.011.0144,20,2718,89,1maroziM51
62.042.0928,17,4899,14,4arupirT61
63.03.0581,54,6440,44,5ayalahgeM71
94.233.2447,31,54602,14,24massA81
61.646.6935,17,11,1232,89,02,1lagneB tseW91
23.38.2904,02,06819,10,15dnahkrahJ02
429,44,15assirO12 51,42,698 2.82 2.83
578,81,23hragsittahhC22 47,06,393 1.77 2.59
187,18,71,1hsedarP ayhdaM32 1,22,49,542 6.46 6.75
534,16,39tarajuG42 97,12,611 5.13 5.35
25 Daman & Diu # 56,618 84,707 0.03 0.05
26 Dadra & Nagar Haveli # 82,013 1,22,363 0.04 0.07
044,14,97,1arthsarahaM72 1,54,94,345 9.84 8.54
999,10,79hsedarP arhdnA82 84,55,526 5.32 4.66
163,37,87akatanraK92 82,80,142 4.32 4.56
578,77,1aoG03 1,10,055 0.10 0.06
31 Lakshadweep # 8,943 3,779 - 0
658,24,72alareK23 15,46,303 1.50 0.85
337,64,56udaN limaT33 97,33,279 3.59 5.36
34 Puducherry # 1,66,560 2,70,119 0.09 0.15
35 Andaman & Nicobar Islands # 75,491 23,792 0.04 0.01
Decadal growth of population
(Absolute)
Percentage contribution
to total growth of India
statement 2
India/State/Union Territory #State/
UT
Code
! Notes: See notes 3, 4 & 5 below Statement 2

58
Statement 7 presents the absolute increase in population of the States/Union Territories of India during the Census decades 1991-2001 and 2001-2011. �e percentage contributions of each of the States and Union Territories to the total growth of India for the decades 1991-2001 and 2001-2011 have also been shown in Statement 7.
It took four decades for Kerala to reach a decadal growth of less than ten percent from a high growth rate of 26.29 percent during 1961-71 to 9.43 during 1991-2001. Although Kerala has continued with this impressive show to register a growth rate of just above 4.9 percent during 2001-2011, the decadal growth rates in Bihar, Chhattisgarh, Jharkhand, Rajasthan, Uttar Pradesh and Madhya Pradesh are still above 20 percent, a level where Kerala and Tamil Nadu were forty years ago. However, the International experience is (European Fertility Project) that once the fertility transition had been established in a linguistic or cultural area, it spread rapidly and independently of socio-economic level achieved16 . Perhaps the policy measures taken in the decade have prepared the basic ground for a similar situation in India and, one may expect a faster rate of fall in growth rates in the remaining States and Union Territories with increase in literacy and child care facilities and a reduction in poverty. �e road to a stationary population before 2060 is long and arduous and would require intense e�orts17 .
THE WAY FORWARD
“Demographic transition” is a model that describes population change over time. �ere are several expositions of demographic transition theory. �e theory mainly describes and analyses the transition from a stable population with high mortality and high fertility to a stable population with low mortality and low fertility. �e stages of demographic transition have, however, been di�erently analysed by di�erent demographers. A commonly accepted theory de!nes four clear stages of population growth18. �e four stages are:
Stage 1 : Typically seen in less developed countries where birth rates are high but a large number of people die of preventable causes leading to a stable population.
Stage 2 : Death rates fall steeply as deaths from preventable causes are reduced by better food supply and improved public health, but birth rates remain high due to high fertility, poor social development and limited access to health and contraceptive services. �is o"en leads to a spurt in population.
Stage 3 : Birth rates fall but population continues to grow because there are a large number of people in the reproductive age group due to the high fertility of the previous generations.
Stage 4 : Countries achieve a stable population once again with low birth and low death rates but at a higher level of social and economic development. Population is stable but higher than in stage one.
�is transition from a stable population with high mortality and high fertility to a stable population with low mortality and low fertility is called demographic transition. India is currently at the third stage19, with some of the States and Union territories already into stage 4.
�e National Population Policy (NPP), 2000 adopted by the Government of India states that ‘the long-term objective is to achieve a stable population by 2045, at a level consistent with the requirements of sustainable economic
! Notes
16 Dudley Kirk, Demographic
Transition Theory, Population
Studies, 50 (1996), pp 379.
17 M. K. Premi, India’s Changing
Population Profile (2009), pp
204.
! Source
18 Jansankhya Sthirata Kosh
(National Population
Stabilisation Fund), What is
demographic transition, http://
www.jsk.gov.in/faq.asp#b1
accessed on 17th March 2011.
19 ibid.
Fifteen States and Union Territories have grown by less than 1.5 percent per annum during 2001-2011, while the number of such States and Union Territories was only four during the previous decade.

Size, Growth Rate and Distribution of Population
PROVISIONAL POPULATION TOTALS – INDIA 59
growth, social development, and environment protection’. �e crucial question is when will this objective be achieved? It has been assumed in the policy document that the medium-term objective of bringing down the Total Fertility rate (TFR) to replacement level of 2.1 by 2010 will be achieved. It was envisaged that if the NPP is fully implemented, the population of India should be 1013 million by 2002 and 1107 million by 2010. �e time bound objectives set out for the XIth 5-year plan also envisaged achieving a Total Fertility Rate of 2.1 by the year 201220 . However, in 2001 itself, India exceeded the estimated population for the year 2002 by about 14 million and, the provisional population in 2011 is higher by about 110 million compared to the target set for the year 2010. It will no doubt be an uphill task on the part of the Government and the people to achieve the much cherished goal of a stable population.
Population variables are both determinants and consequences of the development process. Figure 10 attempts to compare the decadal growth of population, Gross Domestic product at factor cost at constant prices and food grain production over time starting from 1950-51. It helps to understand whether country’s economic development and food grain production has been able to keep pace with its burgeoning population. On the economic front, the GDP at factor cost at constant prices has grown annually by more than 10.2 percent during 2001-10. As a result, the per capita Net National Product has more than doubled during this period, from `16,172 in 2000-0121 to `33,731 in 2009-10. During the same period, the food grain production has reached 218.2 million tonnes in 2009-10 from 196.8 million tonnes in 2000-01 , showing an annual exponential growth rate of food grain production during 2001-2010 at 1.15 per cent, still a shade lower than the population growth rate during 2001-2011. However, if the targeted improvement in food-grain production of 8.5%, as envisaged in the Union Budget document 2011-12, is actually achieved for the two successive years of 2010-11 and 2011-12, the average annual growth in food-grain production for 2001-12 would touch about 1.5 per cent, making it somewhat similar to the growth in population during this period. However, a comparison among the ten most populous countries of the World, in terms of both the Human Development Index and the per capita GDP in PPP$ shows India has a long way to go22.
�e provisional population totals of Census 2011 brings a ray of hope with de!nite signs that the growth rate of population is tapering o� especially in areas where it had been stagnant for several decades. �ere is also a marked decline in fertility as evidenced by the declining proportion of child population in the age group of 0-6 years. Independent India, urged by the !rst Census Commissioner Shri. R.A. Gopalaswami, who referred to “improvident maternity”23 as the primary cause of the population problem became the !rst country in 1952 to establish a policy for population control. For the world as a whole, demographers are generally con!dent that by the second half of this century we will be ending one unique era in history – the population explosion – and entering another, in which population will level out or even fall. Population pessimists have warned the congenital optimists, not to believe that humanity will !nd ways to cope and even improve its lot. Still, Malthus noted: “�e exertions that men !nd it necessary to make, in order to support themselves or families, frequently awaken faculties that might otherwise have lain for ever dormant, and it has been commonly remarked that new and extraordinary situations generally create minds adequate to grapple with the di#culties in which they are involved”24. A feature of both mortality and fertility transitions has been their increasingly faster tempo25. Targeted programmes like those on female literacy, improving general health care,
! Source
20 Planning Commission of India,
Eleventh Five Year Plan 2007-
12, Volume 2, Social Sector,
Paragraph 3.1.48.
21 Estimated GDP, NNP and
food-grain production are
from Economic Survey 2010-11,
Statistical appendix 0.1 Select
Indicators.
! Notes
22 United Nations Development
Programme, Human
Development Report 2009
23 Administrative Report of
Census of India 1951, pp
24 Quoted by Robert Kunzig,
National Geographic, January
2011, Seven Billion special issue
25 Dudley Kirk, Demographic
Transition Theory, Population
Studies, 50(1996), pp 368

60
improving female employment rates, minimum years of schooling, advocacy through village groups, etc. is slowly rede!ning motherhood from childbearing to child rearing. Census 2011 is perhaps an indication that the country has reached a point of in*exion.
Year Population
(in millions)
GDP at factor cost
(at constant prices in ` Crore)
Output of foodgrains
(million tons)
1950-1951 361 224,786 50.8
1960-1961 439 329,825 82
1970-1971 548 474,131 108.4
1980-1981 683 641,921 129.6
1990-1991 846 1,083,572 176.4
2000-2001 1,028.7 1,864,300 196.8
2010-2011 1,210.2 4,493,743 218.2
900
1000
1100
1200
1300
1400
1500
1600
1700
1800
1900
2000
2100
BA
SE
19
50
-19
51
AS
10
0)
0
100
200
300
400
500
600
700
800
900
1950-1951
1960-1961
1970-1971
1980-1981
1990-1991
2000-2001
2010-2011
GR
OW
TH
(W
ITH
Figure 10
Growth of population, GDP and foodgrain production, India: 1950-1951 to 2010-2011
! Notes
1. See notes 1 to 6 below
Statement 2
2. Source: GDP and Output of
foodgrains from Economic
Survey, 2010-11. GDP (quick
estimate) and foodgrain
production (4th advance
estimate) correspond to 2009-
2010
900900
Population
GDP at factor cost (at constant prices)
Output of foodgrains