situation and prospects for forest conservation€¦ · · 2005-02-25situation and prospects for...
TRANSCRIPT
iii
Foreword
The State of the World’s Forests (SOFO) provides information on the current status of the world’sforests, as the name implies, but also discusses recent major policy and institutional
developments, future directions in forestry and external influences on the sector. The purpose is tomake current, reliable and policy-relevant information available to policy-makers, foresters andother natural-resource managers, academics, the forest industry and civil society. In doing so, it ishoped that SOFO will help facilitate informed discussion and decision-making.
SOFO was conceived in 1994 in response to a growing demand for reliable information on theworld’s forests and the absence of periodic reports giving a global and comprehensive view offorestry. The FAO Forestry Department consequently undertook to publish such a report every twoyears. The first SOFO was published in 1995. It was followed by a more comprehensive edition in1997, which attempted to provide an overall view of the forest sector and to put forestry into alonger-term perspective by examining trends from 1970 to the present and by looking ahead to 2010.SOFO 1997 serves as a benchmark document. SOFO 1999 takes a different approach: it concentrateson significant events and developments of the last two years and focuses on a limited number ofselected topical issues meriting a more in-depth look.
SOFO 1999 examines developments in the sector from the perspective of sustainable forestmanagement. It sheds light on policy reforms, institutional developments, international conventions,economic changes and other factors affecting forests, forest resources and their provision of socialand environmental services. SOFO 1999 addresses several questions: Are the changes taking place inforestry today bringing the world’s forests closer to being sustainably managed? Do these changesincrease forests’ contribution to sustainable development? Are international initiatives to supportthis process helping to move the sector in the right direction?
Information is a theme that runs through this issue of SOFO. Information and its analysis are thebasis for accurate planning and appropriate policy-making. SOFO 1999 takes a closer look at theneed for different types of forest information, the scope of databases, national and internationalcapabilities to collect and analyse information and international efforts to make it more accessible.Other topics addressed by SOFO 1999 include changing sources of wood supply, increased people’sparticipation in forest planning and management, and formal and informal instruments forachieving sustainable forest management.
The FAO Forestry Department hopes that SOFO will succeed in increasing awareness of key issuesfacing the forest sector today and in providing readers with valuable information. We hope that thiswill contribute to national, regional and international efforts to work towards sustainable forestmanagement, and thus towards sustainable human development.
As with the previous two reports, readers are encouraged to send FAO their comments on SOFO1999. Additional or updated information that may be incorporated into SOFO 2001 would be mostwelcomed.
M. Hosny El-LakanyAssistant Director-GeneralFAO Forestry Department
v
Contents
Foreword iiiAcknowledgements viiExecutive summary viii
PART ISITUATION AND PROSPECTS FOR FOREST CONSERVATION
AND DEVELOPMENT
The status of forest resources 1Status of forest resources and recent developments in forest condition 1Status of efforts to assess global forest resources 5
Status and trends in forest management 12Management of natural forests 12Forest plantations 19
Environmental and social services of forests 24The role of forest resources in fragile ecosystems 24Forests’ roles in mitigating global climate change 30
Global trends in forest products 34Non-wood forest products: a look at medicinal plants 35Contribution of woodfuels to the energy sector 37Trade in forest products: current issues and influences 40Future supply and demand for industrial roundwood and wood products 47
PART IIPOLICY, PLANNING AND INSTITUTIONAL ARRANGEMENTS
Issues in national forest planning, policy and legislation 61Developments related to national forest planning 61Recent policy issues 63Emerging trends in forest legislation 64
Evolving institutional framework 72New role and structure for forest administrations 72Effects of decentralization on forest management 73Trends in forestry research and technology transfer 76Preparing foresters for change: adapting education and training programmesto new demands 78
vi
PART IIITHE INTERNATIONAL DIALOGUE AND INITIATIVES ON FORESTS
UNCED follow-up: an update of the IPF/IFF process 81
Other global and regional initiatives in support of sustainableforest management 84Developments in international conventions and agreements 84Developments in criteria and indicators for sustainable forest management 86Other initiatives 88
Issues and options for international instruments to support sustainableforest management 92Background 92Analysis of the adequacy of legal instruments 93Identifying international forest issues 94Prerequisites for further progress 94Options for an international forest regime 95Some key questions for consideration 98
PART IVFORESTRY IN REGIONAL ECONOMIC GROUPS
European Union (EU) 101Commonwealth of Independent States (CIS) 102Economic Community of West African States (ECOWAS) 103Common Market for Eastern and Southern Africa (COMESA) 104League of Arab States 105South Asian Association for Regional Cooperation (SAARC) 106Association of Southeast-Asian Nations (ASEAN) 107South Pacific Forum (SPF) 108Latin American Economic System (SELA) 109Caribbean Community and Common Market (CARICOM) 110North American Free Trade Agreement (NAFTA) 111
ANNEXESAnnex 1: Acronyms 114Annex 2: Definitions 116Annex 3: Data tables 119
BIBLIOGRAPHY 151
vii
SOFO 1999 owes its existence to the efforts of many individuals both within and outside FAO. Overall coordination and editing of the publication was carried out by S.M. Braatz. The
following FAO staff members and consultants were involved in collecting data, drafting sections orreviewing the document: G. Allard, J. Anderson, J. Ball, J. Balsiger, S. Bass, L.S. Botero, J. Bourke,S.M. Braatz, C. Brown, G. Bull, C.M. Carneiro, F. Castañeda, L. Christy, J. Clément, A. Contreras,R. Davis, P. Durst, C. Eckelmann, M. Hosny El-Lakany, L. Ferroukhi, T. Frisk, T. Hofer, M. Gauthier,S. Hald, R. Heinrich, H. Hilmi, V. Johnston, P. Koné, J. Lahaussois, M. Laverdière, J. Lindsay, L. Lintu,L. Ljungman, P. Lowe, G. Lund, Q. Ma, M. Malagnoux, M. Martin, D. McGuire, A. Mekouar,T. Michaelsen, M. Morell, H. Ortiz-Chour, F. Padovani, C. Palmberg-Lerche, M. Paveri, F. Pontecorvi,C. Prins, H. Qwist-Hoffmann, P. Qwist-Hoffmann, R. Romeo, L. Russo, K.H. Schmincke, E.H. Sène,O. Serrano, D. Shallon, A. Sherwood, P. Sigaud, H. Simons, O. Souvannavong, K. Thelen,M.A. Trossero, P. Vantomme, K. Warner, A. Whiteman, M.L. Wilkie and D. Williamson.
A number of outside collaborators contributed various pieces. H. Gillett (World ConservationMonitoring Centre, United Kingdom) prepared the piece on assessing biological diversity at thespecies and ecosystem level. B. Schlamadinger and G. Marland (Oak Ridge National Laboratory,United States) and C. Leining and B. Braatz (ICF Incorporated, United States) contributed the pieceon forests’ role in mitigating global climate change. D. Heuer (Precious Woods Ltd., Switzerland)prepared the box on certification of Precious Woods. D. Barron (Canadian Pulp and PaperAssociation) and H.S. Leng (Malaysia Timber Council) provided input for the piece on private-sectorinitiatives. N. Dudley (Equilibrium, United Kingdom) contributed the piece on NGOs for the sectionon initiatives in the international forestry debate.
The following members of the Internal Advisory Committee provided technical oversight inplanning and reviewing the document: J. Anderson, J. Ball, J. Bourke, S. Dembner, M. Paveri,P. Vantomme and K. Warner.
FAO wishes to acknowledge the extremely valuable guidance given by the members of SOFO’sExternal Review Committee: D. Barron, S. Bass, M. Dourojeanni, M. Goumandakoye, H. Gregersen,M. Hadley, J.P. Lanly, J. Maini, O. M’Hirit, C. Prins, M.N. Salleh and M. Simula. D. Kneeland alsoprovided helpful comments.
Many thanks are due to S. Dembner and to the staff of the Editorial Group, FAO Publishing andMedia Support Service for production and publication support. L. Ransom and E. Rubini providedessential secretarial assistance.
Acknowledgements
viii
The State of the World’s Forests (SOFO) isproduced by FAO every two years for the
purpose of making current, reliable and policy-relevant information available to policy-makers,foresters and other natural resource managers,academics, forest industry and the public. SOFO1999, the third in the series, examines the currentstatus of the world’s forests, recent policy andinstitutional developments and external impacts onthe sector. It concentrates on significant events anddevelopments of the 1997-1998 period and onselected topical issues.
This two-year period was marked by extremes:record high global temperatures; devastating floodsand severe droughts; widespread forest fires andheavy ice storms; and rapid global economicgrowth abruptly disrupted by the Asian economiccrisis. Forests have felt the impact of these climaticand economic phenomena.
Significant changes have also been driven bydevelopments within the forest sector. Policy-makers and forest managers have been respondingto changing national priorities and to internationalcommitments made at, and since, the UnitedNations Conference on Environment andDevelopment (UNCED) in 1992, aimed towardssustainable management of all types of forests. Abroader approach to forest management is beingsought, balancing social, economic andenvironmental objectives. The concerns of a widerrange of interest groups are being taken intoconsideration, and local communities areincreasingly becoming directly involved in forestplanning and management.
SOFO 1999 discusses the state and change offorests worldwide, new developments in forestmanagement and issues and trends related toforest goods and services. It also examines recentpolicy trends and institutional changes which arehaving an impact on how, for what purposes andby whom forests are being managed. This globalview of forestry today is augmented byinformation about the forest sector at the regionaland subregional levels.
Executive summary
CHANGES IN FOREST COVER ANDCONDITIONThe latest global figures on forest cover indicatethat in 1995 there were 3 454 million hectares offorest (including natural forests and forestplantations) worldwide. Between 1990 and 1995,the total area of forests decreased by 56.3 millionhectares – the result of a loss of 65.1 million hectaresin developing countries and an increase of8.8 million hectares in developed countries. Majorcauses of forest cover change include conversion offorests to agricultural land and large infrastructuraldevelopment in developing countries, and forestgrowth on abandoned agricultural land indeveloped countries.
The many causes of forest degradation includeoverharvesting of industrial wood and fuelwood,overgrazing, fire, insect pests and diseases, stormsand air pollution; of these, forest fires were the mostvisible in 1997-1998. These were the worst twoyears for wildfires and forest fires in recent times.Millions of hectares of forest burned. All regions ofthe world were affected and nearly all types offorests burned. National disasters were declared,and national and international resources weremobilized to fight the fires. Vast areas of forestburned in Brazil, Indonesia, Mexico and theRussian Federation. Although the exact areas arestill unknown, estimates are 2 million hectares inIndonesia in 1997 and perhaps more in 1998, and2 million hectares each in Brazil and the RussianFederation in 1998. While droughts associated withthe unusually strong El Niño weather patterncontributed to the increased number, size, intensityand duration of fires, land use practices, mainly inagriculture and forestry, were clearly major causesof many fires. The fires have catalysed national andinternational initiatives to encourage appropriatepolicy responses and operational measures forpreventing and controlling fires in the future.
TRENDS IN FOREST MANAGEMENTForest management objectives, managementpractices and the managers themselves have

ix
changed dramatically in the past decade in manycountries. Increased emphasis on environmentalvalues has resulted in significant expansion of theprotected area systems (including forest lands) ofsome countries over the past few years. Greateremphasis on management of natural forests formultiple purposes and increased attention toenvironmental factors have led, in some places, toreduced intensities of timber harvesting andchanges in management practices. Logging bans innatural forests have been announced in severalcountries. The increased emphasis on the use ofnatural forests for environmental protection,conservation of biological diversity and recreationhas increased the reliance on forest plantations andother sources of wood supply in some countries.
Efforts to improve the stewardship of forestsdesignated for wood production includesilvicultural improvements and the adoption ofenvironmentally sound timber harvesting practices.Operational guidelines and codes of practice forforest management have been adopted in Europeand North America. New silvicultural systems havebeen developed for temperate and boreal forests inNorth America and for tropical forests. Codes ofpractice and guidelines for forest harvesting haverecently been drafted for tropical forests, mostnotably in the Asia and the Pacific region.
Changing patterns of forest ownership, increasingsupport for locally based forest management andgreater participation of the private sector in forestmanagement have influenced how forests aremanaged and by whom. Changes leading toincreased local forest management in variouscountries include:
• a proliferation of new mechanisms for thedevolution of forest management to localcommunities or user groups;
• increased recognition of the historicalterritorial claims of local peoples;
• restoration of the lands (including forests) ofdispossessed communities and individuals.
SOCIAL AND ENVIRONMENTAL SERVICESOF FORESTSRecognition of the social and environmentalservices of forests – such as mitigation of globalclimate change, conservation of soil and water
resources, enhancement of agricultural systems,conservation of biological diversity, improvementof urban and peri-urban living conditions,protection of natural and cultural heritage,generation of employment and provision ofrecreational opportunities – continues to grow.
As the emphasis on these important services oftrees and forests has increased, more attention hasbeen focused on forests in fragile ecosystems –including mountains, drylands and small islandStates – and in countries with low forest cover.Although these forests generally have relativelylow timber value, their important social andenvironmental functions have been increasinglyrecognized in management decisions. Forests’ rolein water conservation is expected to be given moreprominence as international attention increasinglyturns to freshwater resource issues.
The role of forests in mitigating global climatechange was given greater prominence with theadoption of the Kyoto Protocol of the FrameworkConvention on Climate Change in 1997 and thedeliberations of the fourth Conference of the Partiesin Buenos Aires, Argentina in November 1998. TheKyoto Protocol establishes legally bindingcommitments for reduced emissions of greenhousegases from industrialized countries and permits theuse of a limited list of activities in the land usechange and forest sector to meet thesecommitments. The protocol thus providesindustrialized countries incentives to invest, in boththeir own and other countries, in forestry activitieswhich increase carbon sequestration and/or reducecarbon emissions. While many details of the KyotoProtocol remain to be clarified, if ratified it shouldoffer possibilities for investment in forestry.
FOREST PRODUCTSMeeting the needs for wood and non-wood forestproducts while at the same time fulfilling demandsfor environmental and social services from forestsremains a major challenge.
While wood is the predominant commercialproduct from most forests, increased attention isbeing paid to non-wood forest products (NWFPs),whose main importance currently lies in theircontribution to household and local economies,particularly among the poor in developing
x
countries. Recent regional and international forahave addressed the needs to conserve non-woodresources while ensuring local peoples’ equitableaccess to and use of the resources, to improvemarket information and to develop appropriate andfair pricing mechanisms for NWFPs (includingroyalties on intellectual property rights). SOFO1999 focuses specifically on medicinal plants, whichas a group are among the most valuable NWFPsfrom forests. Most medicinal plants gathered fromthe wild come from forest lands.
Fuelwood and charcoal are expected to continue tobe important sources of household energy indeveloping countries. Moreover, recent policychanges and experiences with wood-basedbio-energy programmes in several countries indicatethat woodfuels may become increasingly attractive tosome countries as industrial energy sources.
Developed regions continue to dominate heavilyin production and consumption of industrial woodproducts. FAO has projected that demand forindustrial roundwood will increase by 1.7 percentannually between now and the year 2010, drivenboth by population increases and economic growth.While recent studies suggest that supplies aresufficient to meet this demand, the situation willvary among countries and will depend greatly onmarket conditions, government policies,technological improvements and human resourcedevelopment. Production of industrial roundwoodis expected to continue to exceed consumption inall regions except Asia, which will continue to relyon imports to make up the difference.
Recent trends which are expected to continue tohelp in meeting the increasing demand forprocessed wood products include:
• improved management of forests designatedfor wood production;
• increased production from plantations andfrom trees outside forests, particularly onagricultural land;
• new forest product technologies and gains inefficiency in wood processing;
• greater use of recovered paper and woodprocessing residues;
• increased use of wood and fibre from “non-forest” species (e.g. rubber, oil palm) in forestindustries.
Trade will help balance deficits of wood fibre inone place with surpluses elsewhere.
The Asian economic crisis, which began in mid-1997, has seriously disrupted forest products tradein the Asia and the Pacific region. The main impactson countries within the region have been:
• reduced demand for all forest products;• increased competitiveness of exporting
countries whose currencies have depreciated;• falling prices for forest products throughout
the region;• reduced earnings in the forest sector, resulting
in reduced harvests, mill closures andworkforce lay-offs.
While Asian wood markets have been the mostseverely affected, the effects have spread outsidethe region to countries that either depend heavilyon, or compete with, Asian markets. Woodexporters from Africa to New Zealand and fromNorth to South America have been affected.
Certification remains a high-profile but complexand often controversial issue. Various international,regional and national certification systems havebeen developed. The area of forests certified hasincreased considerably in the past two years,although significant volumes of certified productsapparently are not yet entering the market. It isunclear whether the demand for certified wood willincrease and whether certification will, in fact,significantly contribute to improved forestmanagement where deforestation is greatest, i.e. indeveloping countries.
RECENT CHANGES IN FOREST POLICY,LEGISLATION AND INSTITUTIONALFRAMEWORKEvident trends in forest policy reform includeattempts to privatize State forest resources andpublic forest-based companies, to decentralizecertain functions of central governmentadministrations and to eliminate some “perversesubsidies”, including the underpricing of forestconcessions.
Revision of forest-related laws around the worldhas accelerated significantly in recent years. Thelegal changes reflect commitments to:
• promote local forest management;• enhance the environmental functions of forests;
xi
• reinforce forest management planning,increasing consideration of environmental andsocial issues in management plans andsupporting public participation in the planningprocess;
• increase transparency in awarding forestconcessions.
Institutional changes in the forest sector –particularly privatization and the decentralizationand devolution of forest managementresponsibilities to the local level – have closelyparalleled these policy and legislative trends.Decentralization and privatization are also affectingforest research systems. Forest education andextension are responding to changing objectives forforest management, new forest owners and/ormanagers and the forest-related concerns of anincreased number of interest groups.
INTENSIFIED EFFORTS TO DEVELOPFOREST-RELATED INFORMATIONMany organizations have made substantial effortsover the past few years to collect and disseminateglobal forest-related information. Major initiativeshave been undertaken in forest cover assessmentand mapping, forest resources assessment, study ofwood supply and data collection on biologicaldiversity. Complementing these global efforts arevarious initiatives to collect and analyseinformation at the regional level and to strengthennational capacity in the collection, analysis and useof forest-related information.
INTERNATIONAL INITIATIVES ONFORESTSMany recent international initiatives are aimed atfostering sustainable forest management. More than150 countries are currently participating ininternational processes to develop and implementnational-level criteria and indicators for sustainableforest management. Various efforts at the forestmanagement unit level are being coordinated bythe Center for International Forestry Research(CIFOR), the International Tropical TimberOrganization (ITTO) and the African TimberOrganization (ATO). Other international initiativesinclude the establishment and management ofmodel and demonstration forests, ITTO’s “Year
2000 Objective” and the G8 countries’ actionprogramme on forests which was approved in May1998. Developments in the implementation of thethree international conventions arising fromUNCED (the Framework Convention on ClimateChange, the Convention on Biological Diversityand the Convention to Combat Desertification) andthe International Tropical Timber Agreementprovide additional support for certain elements offorest management. Non-governmentalorganizations and the private sector continue to beactive in the international forest debate and inefforts to improve forest management at the fieldlevel.
The post-UNCED international dialogue onforests led by the Intergovernmental Panel onForests (IPF) from 1995 to 1997 resulted in over 100negotiated proposals for action. Work continuesunder the Intergovernmental Forum on Forests(IFF), established in mid-1997. In 2000, IFF willpresent its final report to the United NationsCommission on Sustainable Development on itsthree major areas of work:
• the implementation of IPF’s proposals for action;• issues on which international consensus has
yet to be achieved;• the identification of possible elements of, and
work towards, consensus on internationalarrangements and mechanisms for themanagement, conservation and sustainabledevelopment of forests.
The issue of international instruments forsupport of forests first arose in 1990. Since then, anumber of such instruments, both legally and non-legally binding, have been developed. Consensuson whether additional international instruments areneeded, and if so, what they would cover, remainselusive. Discussion of whether to rely on existingmechanisms, to enhance them or to developadditional ones – such as a legally bindinginstrument on all types of forests – promises toremain high on the international forest agenda forat least the next few years. ◆
STATE OF THE WORLD’S FORESTS 1999
PART ISITUATION ANDPROSPECTS FORFOREST CONSERVATIONAND DEVELOPMENT
PART I SITUATION AND PROSPECTS FOR FOREST CONSERVATION AND DEVELOPMENT 1
The status of forestresources
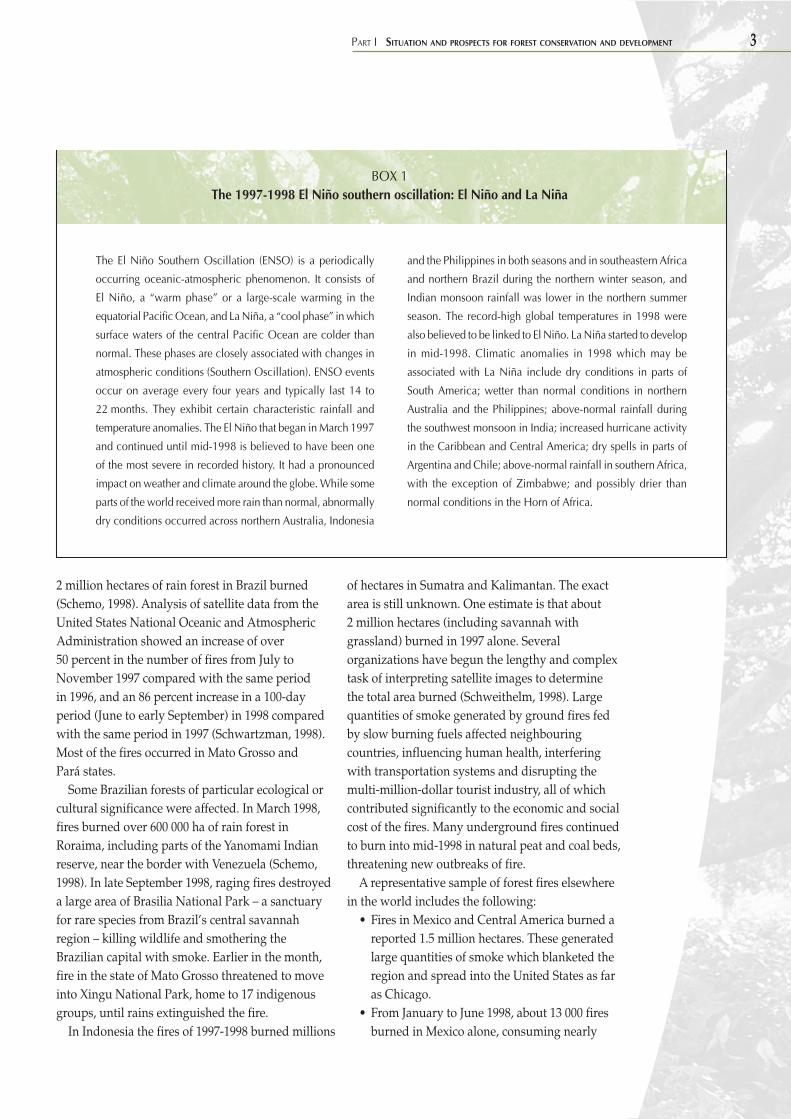
by region between 1980 and 1995 is shown inFigure 2.
Between 1990 and 1995, there was an estimatednet loss of 56.3 million hectares of forestsworldwide. This represented a decrease of65.1 million hectares in developing countries andan increase of 8.8 million hectares in developedcountries. Although the global loss of forests wasstill very high, the figures suggest that the rate ofdeforestation might be slowing. The estimate offorest cover change in natural forests of developingcountries (which is where most deforestation istaking place) was an annual loss of 13.7 millionhectares between 1990 and 1995, compared with15.5 million hectares per year over the decade 1980-1990. It will be difficult to know if this is a trend,however, until a comparable global data set isavailable from the Global Forest ResourcesAssessment 2000 (see following discussion).
The major causes of change in forest cover in thetropics appear to be expansion of subsistenceagriculture in Africa and Asia and large economicdevelopment programmes involving resettlement,agriculture and infrastructure in Latin America andAsia (FAO, 1996a). The net increase in forest area indeveloped countries is largely a result ofafforestation and reforestation, including naturalregrowth on land abandoned by agriculture. Thisincrease has more than compensated for theclearing of some areas of forest in variousdeveloped countries, mainly for urban expansionand infrastructure development.
Forest condition: fire, ice and forest pestsThe causes of forest degradation vary from place toplace, and the magnitude and duration of the
Information on the status of the world’s forests –their extent, location, type and condition – is
important for efforts to improve forest managementworldwide and for assessments of forests’ ability toprovide the goods and services demanded of them.The following discussion focuses on two subjects:the area and condition of forest resourcesworldwide, and the status of the information baseon global forest resources, particularlyconcentrating on information on forest area andforest-based biological diversity.
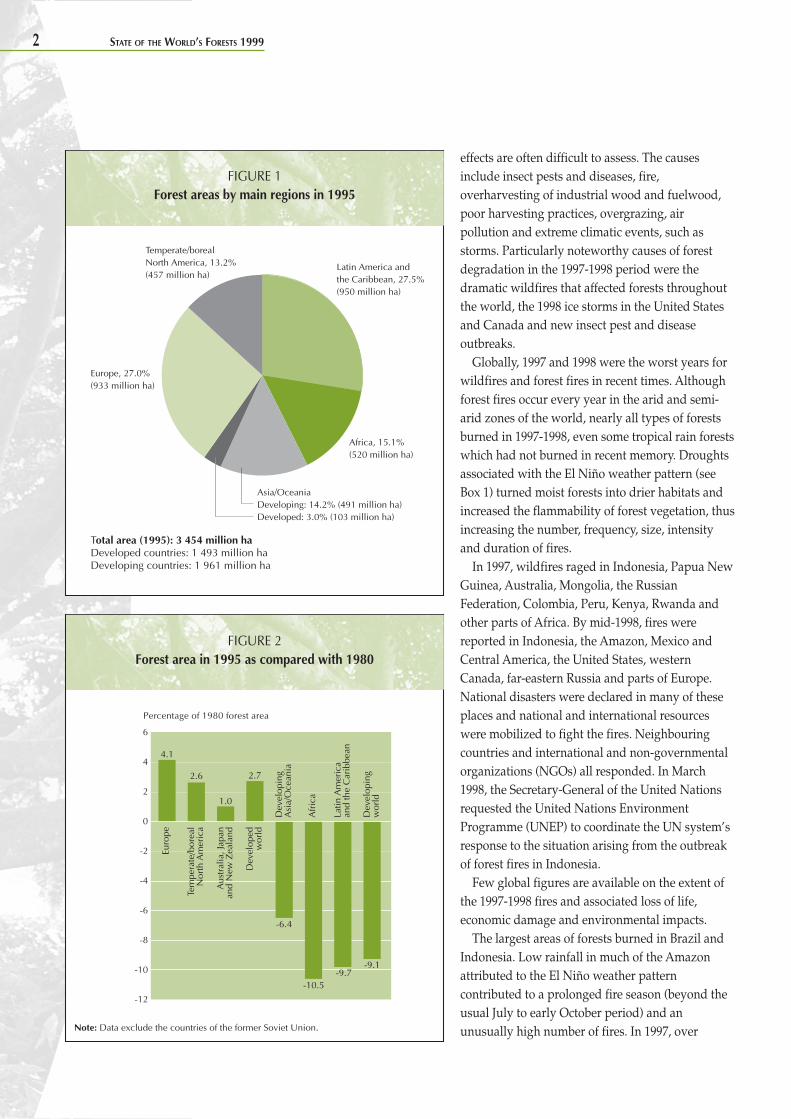
STATUS OF FOREST RESOURCES ANDRECENT DEVELOPMENTS IN FORESTCONDITIONForest cover1
The area of the world’s forests, including naturalforests and forest plantations, was estimated to be3 454 million hectares in 1995, or about one-fourthof the land area of the Earth. About 55 percent ofthe world’s forests are located in developingcountries, with the remaining 45 percent indeveloped countries (Figure 1) (see Table 2 ofAnnex 3 for country data). The world’s forests arealmost equally divided between tropical/subtropical forests and temperate/boreal forests.Only about 3 percent of the world’s forests areforest plantations. The remaining 97 percent arenatural or semi-natural forests.
Change in forest coverData published in the State of the World’s Forests1997 (FAO, 1997d) provide a picture of the trendsin forest cover over a 15-year interval (1980-1995)and allow a comparison between the 1980-1990and 1990-1995 periods. Between 1980 and 1995,the extent of the world’s forests (including bothnatural forests and forest plantations) decreasedby some 180 million hectares. There was a netincrease of 20 million hectares in developedcountries, but a net loss of 200 million hectaresin developing nations. The change in forest area
1 The State of the World’s Forests 1997 provided the most recentdata available on global forest cover. As no new global data seton forest resources will be available until the results of the ForestResources Assessment 2000 study are published, a summary ofthe 1995 figures published in SOFO 1997 is provided in thissection.
2 STATE OF THE WORLD’S FORESTS 1999
FIGURE 1Forest areas by main regions in 1995
Note: Data exclude the countries of the former Soviet Union.
effects are often difficult to assess. The causesinclude insect pests and diseases, fire,overharvesting of industrial wood and fuelwood,poor harvesting practices, overgrazing, airpollution and extreme climatic events, such asstorms. Particularly noteworthy causes of forestdegradation in the 1997-1998 period were thedramatic wildfires that affected forests throughoutthe world, the 1998 ice storms in the United Statesand Canada and new insect pest and diseaseoutbreaks.
Globally, 1997 and 1998 were the worst years forwildfires and forest fires in recent times. Althoughforest fires occur every year in the arid and semi-arid zones of the world, nearly all types of forestsburned in 1997-1998, even some tropical rain forestswhich had not burned in recent memory. Droughtsassociated with the El Niño weather pattern (seeBox 1) turned moist forests into drier habitats andincreased the flammability of forest vegetation, thusincreasing the number, frequency, size, intensityand duration of fires.
In 1997, wildfires raged in Indonesia, Papua NewGuinea, Australia, Mongolia, the RussianFederation, Colombia, Peru, Kenya, Rwanda andother parts of Africa. By mid-1998, fires werereported in Indonesia, the Amazon, Mexico andCentral America, the United States, westernCanada, far-eastern Russia and parts of Europe.National disasters were declared in many of theseplaces and national and international resourceswere mobilized to fight the fires. Neighbouringcountries and international and non-governmentalorganizations (NGOs) all responded. In March1998, the Secretary-General of the United Nationsrequested the United Nations EnvironmentProgramme (UNEP) to coordinate the UN system’sresponse to the situation arising from the outbreakof forest fires in Indonesia.
Few global figures are available on the extent ofthe 1997-1998 fires and associated loss of life,economic damage and environmental impacts.
The largest areas of forests burned in Brazil andIndonesia. Low rainfall in much of the Amazonattributed to the El Niño weather patterncontributed to a prolonged fire season (beyond theusual July to early October period) and anunusually high number of fires. In 1997, over
FIGURE 2Forest area in 1995 as compared with 1980
Temperate/borealNorth America, 13.2%(457 million ha)
Europe, 27.0%(933 million ha)
Africa, 15.1%(520 million ha)
Latin America andthe Caribbean, 27.5%(950 million ha)
Total area (1995): 3 454 million haDeveloped countries: 1 493 million haDeveloping countries: 1 961 million ha
Asia/OceaniaDeveloping: 14.2% (491 million ha)Developed: 3.0% (103 million ha)
Percentage of 1980 forest area
Latin
Am
eric
aan
d th
e C
arib
bean
Dev
elop
ing
wor
ld
Afr
ica
Dev
elop
ing
Asi
a/O
cean
ia
Aus
tral
ia, J
apan
and
New
Zea
land
Dev
elop
edw
orld
Tem
pera
te/b
orea
lN
orth
Am
eric
a
Euro
pe
6
4
2
0
-2
-4
-6
-8
-10
-12
4.1
2.6
1.0
2.7
-6.4
-10.5-9.7
-9.1
PART I SITUATION AND PROSPECTS FOR FOREST CONSERVATION AND DEVELOPMENT 3
2 million hectares of rain forest in Brazil burned(Schemo, 1998). Analysis of satellite data from theUnited States National Oceanic and AtmosphericAdministration showed an increase of over50 percent in the number of fires from July toNovember 1997 compared with the same periodin 1996, and an 86 percent increase in a 100-dayperiod (June to early September) in 1998 comparedwith the same period in 1997 (Schwartzman, 1998).Most of the fires occurred in Mato Grosso andPará states.
Some Brazilian forests of particular ecological orcultural significance were affected. In March 1998,fires burned over 600 000 ha of rain forest inRoraima, including parts of the Yanomami Indianreserve, near the border with Venezuela (Schemo,1998). In late September 1998, raging fires destroyeda large area of Brasilia National Park – a sanctuaryfor rare species from Brazil’s central savannahregion – killing wildlife and smothering theBrazilian capital with smoke. Earlier in the month,fire in the state of Mato Grosso threatened to moveinto Xingu National Park, home to 17 indigenousgroups, until rains extinguished the fire.
In Indonesia the fires of 1997-1998 burned millions
of hectares in Sumatra and Kalimantan. The exactarea is still unknown. One estimate is that about2 million hectares (including savannah withgrassland) burned in 1997 alone. Severalorganizations have begun the lengthy and complextask of interpreting satellite images to determinethe total area burned (Schweithelm, 1998). Largequantities of smoke generated by ground fires fedby slow burning fuels affected neighbouringcountries, influencing human health, interferingwith transportation systems and disrupting themulti-million-dollar tourist industry, all of whichcontributed significantly to the economic and socialcost of the fires. Many underground fires continuedto burn into mid-1998 in natural peat and coal beds,threatening new outbreaks of fire.
A representative sample of forest fires elsewherein the world includes the following:
• Fires in Mexico and Central America burned areported 1.5 million hectares. These generatedlarge quantities of smoke which blanketed theregion and spread into the United States as faras Chicago.
• From January to June 1998, about 13 000 firesburned in Mexico alone, consuming nearly
and the Philippines in both seasons and in southeastern Africa
and northern Brazil during the northern winter season, and
Indian monsoon rainfall was lower in the northern summer
season. The record-high global temperatures in 1998 were
also believed to be linked to El Niño. La Niña started to develop
in mid-1998. Climatic anomalies in 1998 which may be
associated with La Niña include dry conditions in parts of
South America; wetter than normal conditions in northern
Australia and the Philippines; above-normal rainfall during
the southwest monsoon in India; increased hurricane activity
in the Caribbean and Central America; dry spells in parts of
Argentina and Chile; above-normal rainfall in southern Africa,
with the exception of Zimbabwe; and possibly drier than
normal conditions in the Horn of Africa.
The El Niño Southern Oscillation (ENSO) is a periodically
occurring oceanic-atmospheric phenomenon. It consists of
El Niño, a “warm phase” or a large-scale warming in the
equatorial Pacific Ocean, and La Niña, a “cool phase” in which
surface waters of the central Pacific Ocean are colder than
normal. These phases are closely associated with changes in
atmospheric conditions (Southern Oscillation). ENSO events
occur on average every four years and typically last 14 to
22 months. They exhibit certain characteristic rainfall and
temperature anomalies. The El Niño that began in March 1997
and continued until mid-1998 is believed to have been one
of the most severe in recorded history. It had a pronounced
impact on weather and climate around the globe. While some
parts of the world received more rain than normal, abnormally
dry conditions occurred across northern Australia, Indonesia
BOX 1The 1997-1998 El Niño southern oscillation: El Niño and La Niña
4 STATE OF THE WORLD’S FORESTS 1999
500 000 ha and killing more than 70 fire-fighters and local residents.
• Between December 1997 and April 1998, morethan 13 000 fires burned in Nicaragua, the mostin any Central American country, destroyingvegetation on more than 800 000 ha of land.The Nicaraguan Ministry of Environment andNatural Resources (MARENA) recorded over11 000 fires in the month of April 1998 alone.
• In the southeastern United States, severe firesin Florida in 1998 burned a reported 200 000 haof forest by May (The Economist, 4-10 July 1998).
• More than 150 000 ha of coniferous forest andfarmland were burned in various parts ofGreece in August 1998, including the blackpine forest on Mount Taygetos, site of morethan 160 endemic species and 36 endangeredspecies of fauna (Guardian Weekly, 30 July 1998).
• In July 1998, devastating forest fires affectedmore than 100 000 ha in far-eastern Russia.Coniferous forest burned in more than 150places around Vladivostok, Sakhalin andKamchatka Peninsula. Fires in the southwest ofthe Volgograd region destroyed 9 000 ha offorest, at an estimated cost of US$6 million(BBC World Service, 27 July 1998). InSeptember, fires swept across Russia’s Pacificisland of Sakhalin, burning over 25 000 ha bythe end of the month (Reuters News Service,21 September 1998).
Active media coverage of the unusually largefires in Indonesia, the Amazon and Mexicoincreased public awareness of these predominantlyman-made environmental disasters. The smokefrom the fires, which endangered public health andeconomies beyond national borders, also helpedfocus public attention on the fires and the need todeal with policy issues related to fire outbreaks.
The use of fire is an integral part of landmanagement in both agriculture and forestry. Someforests are ecologically adapted to fire, andprescribed burning is an important component offorest management practices in some places.However, there is ample evidence that a largeproportion of the wildfires that occur each year arecaused by human intervention. A seven-year fieldstudy of fire in the Amazon carried out by theWoods Hole Research Center, United States, shows
that about half of the wildfires in the region werecaused by fires set by farmers and ranchers to clearold cattle pasture and to burn newly cut forestwhich subsequently burned out of control. Theeffects of drought in 1997-1998 were aggravated byshifting cultivation (particularly slash-and-burnagricultural practices), pasture management,improperly executed timber harvesting operationsand large-scale land clearance under agriculturalconversion schemes. A considerable number of firesthat burned around the world in 1997-1998 (as inother times) were cases of arson. The fires of 1997-1998 clearly highlight the need to improve planningand management of agricultural land use practicesto reduce the risk of wildfires; to addressdeficiencies in forest management systems; and toexamine policies and regulations related both toconversion of forest land to agriculture and toimprovement of forest stewardship.
The fires of 1997 and 1998 have stimulatedvarious international efforts related to fires. Aglobal system of early warning to indicate thepotential fire risk related to climatic conditions isbeing investigated by several internationalorganizations, including the World HealthOrganization (WHO), the World ConservationUnion (IUCN), UNEP and FAO. A national systemfor advance warning by radio linked tometeorological forecasts from satellite imagery hasbeen successfully tried in Burkina Faso. WHO hasproduced guidelines for forest fire emergencies.Many national and international meetings wereorganized in 1998 for fire-fighting and healthexperts, potential donors and, perhaps moresignificant, policy-makers to address the control,effects and underlying causes of fires. UN agenciesthat organized fire meetings in 1998 include UNEPand the United Nations Office for the Coordinationof Humanitarian Affairs (Geneva, Switzerland,April 1998), WHO and the Pan-American HealthOrganization (Lima, Peru, August 1998) and FAO(Rome, October 1998, on public policies affectingforest fires).
Apart from the fires, 1998 was notable for anothertype of disaster which severely affected forests: ice.A series of ice storms in January 1998 resulted inextensive damage to forests in the northeasternUnited States and eastern Canada (see Box 2). An
PART I SITUATION AND PROSPECTS FOR FOREST CONSERVATION AND DEVELOPMENT 5
estimated 10 million hectares of forests and treeswere affected, extending from Ontario to Quebecand New Brunswick in Canada and across northernNew England in the United States (Irland, 1998).
While less visible than the wildfires and icestorms within the last two years, recent outbreaksof insect pests and diseases in forests may result insubstantial economic loss and environmentaldamage. Although insect pests and diseases areoften integral components of forest dynamics,severe outbreaks can be damaging and requirecostly control efforts. Their incidence and economicimpact may be highest on plantations establishedfor the purpose of wood production. Some newpest outbreaks reported in the last few years arenoted in Box 3.
Climatic extremes associated with El Niño in1997-1998 (see Box 1) are thought to be linked tosome of the current severe pest outbreaks affectingforests and trees. For example, a serious outbreak ofgypsy moth (Lymantria dispar) which is posing arisk to northern European forests is believed tohave been exacerbated by increased temperaturesand prolonged drought conditions over the last twoyears. The outbreak, which started in 1996 and wasstill ongoing in mid-1998, is affecting thousands ofhectares of valuable hardwoods (particularly oaks)in Bulgaria, Croatia, Romania and Serbia.
STATUS OF EFFORTS TO ASSESS GLOBALFOREST RESOURCESForest resources assessmentForest resources assessments generally provideinformation on forest extent and location, types,condition, wood volume, and/or biomass. Theymay be done on a subnational, national, regional orglobal level. Global assessments are done in one oftwo ways: using a bottom-up approach whichharmonizes and sums national statistics, or using atop-down approach in which data are generated atthe regional, continental or global level. Nationalforest inventories are fundamental to bottom-upapproaches to forest resources assessment(see Box 4).
The major global forest cover assessment effortsare being carried out by FAO, the InternationalGeosphere-Biosphere Programme (IGBP), theEuropean Commission’s Joint Research Centre
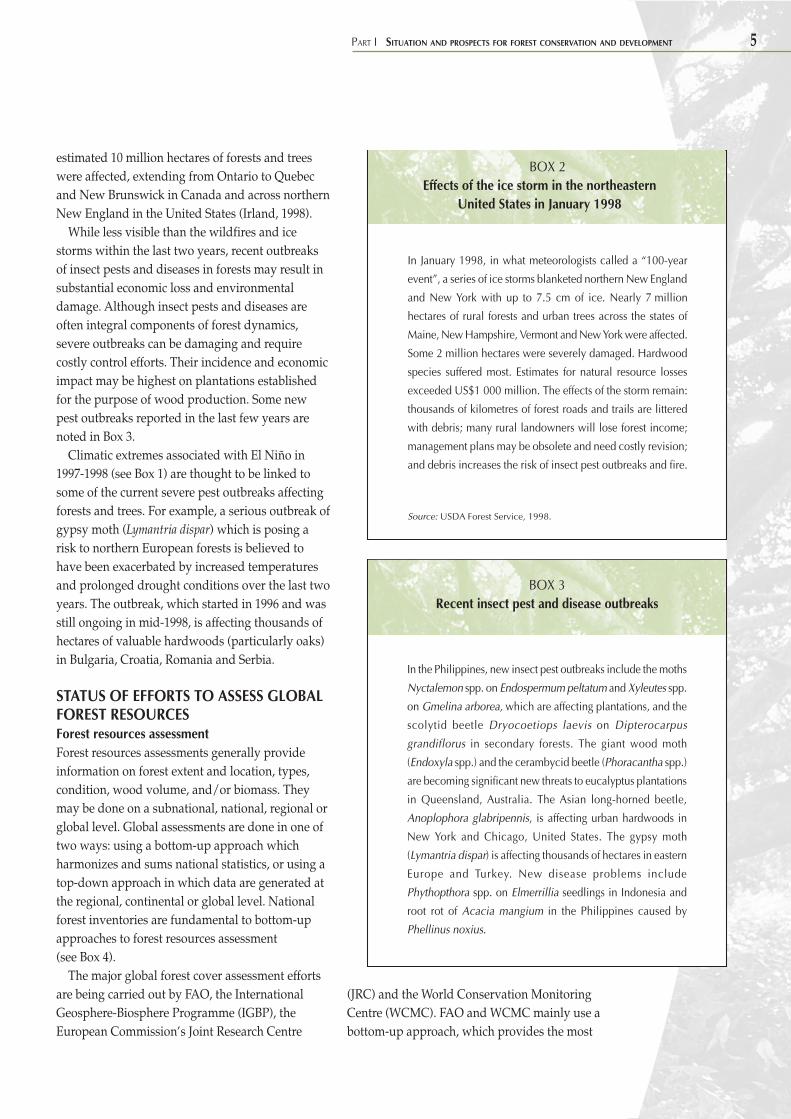
BOX 2Effects of the ice storm in the northeastern
United States in January 1998
In January 1998, in what meteorologists called a “100-year
event”, a series of ice storms blanketed northern New England
and New York with up to 7.5 cm of ice. Nearly 7 million
hectares of rural forests and urban trees across the states of
Maine, New Hampshire, Vermont and New York were affected.
Some 2 million hectares were severely damaged. Hardwood
species suffered most. Estimates for natural resource losses
exceeded US$1 000 million. The effects of the storm remain:
thousands of kilometres of forest roads and trails are littered
with debris; many rural landowners will lose forest income;
management plans may be obsolete and need costly revision;
and debris increases the risk of insect pest outbreaks and fire.
Source: USDA Forest Service, 1998.
BOX 3Recent insect pest and disease outbreaks
In the Philippines, new insect pest outbreaks include the moths
Nyctalemon spp. on Endospermum peltatum and Xyleutes spp.
on Gmelina arborea, which are affecting plantations, and the
scolytid beetle Dryocoetiops laevis on Dipterocarpus
grandiflorus in secondary forests. The giant wood moth
(Endoxyla spp.) and the cerambycid beetle (Phoracantha spp.)
are becoming significant new threats to eucalyptus plantations
in Queensland, Australia. The Asian long-horned beetle,
Anoplophora glabripennis, is affecting urban hardwoods in
New York and Chicago, United States. The gypsy moth
(Lymantria dispar) is affecting thousands of hectares in eastern
Europe and Turkey. New disease problems include
Phythopthora spp. on Elmerrillia seedlings in Indonesia and
root rot of Acacia mangium in the Philippines caused by
Phellinus noxius.
(JRC) and the World Conservation MonitoringCentre (WCMC). FAO and WCMC mainly use abottom-up approach, which provides the most
6 STATE OF THE WORLD’S FORESTS 1999
detail at the country level. IGBP and JRC use a top-down method, which provides spatial informationon forest cover over broad areas. The FAO, JRC andIGBP assessments are ongoing, long-termprogrammes.
Currently available information. FAO, incollaboration with other partners, has beenconducting global forest resources assessmentsabout every ten years since 1947. The latest ForestResources Assessment (FRA), which was done for1990, was carried out jointly by FAO, the UnitedNations Economic Commission for Europe (ECE)and their member countries (FAO, 1995).2 FRA 1990was divided into two parts: one for theindustrialized countries (the temperate and borealforests) and the other for developing countries(mainly tropical and subtropical, but also sometemperate forests). ECE and FAO conducted thetemperate/boreal forest resources assessment(TBFRA) through the use of a questionnaire. Thetropical assessment was based on existing reliable
information and a remote-sensing-based samplingdesign for study of land cover changes. Theassessment for developing countries producedinformation primarily about the area of forest in1990 and the change since 1980, with data fromdifferent years adjusted to these reference points.This information is available by country and byecofloristic zone. TBFRA includes data on state andchange of forest area (which have not been adjustedto a given reference year) and gives additionalinformation on ownership and management status,growing stock, annual growth and fellings. FRA1990 is currently the most comprehensive source ofglobal-, regional- and national-level information onforest state and change available. It does not,however, show the spatial distribution of forests.
Since FRA 1990, new information requirementshave emerged, including location-specific or spatialdata which support efforts in sustainable forestmanagement and assessment of forests’environmental functions (e.g. conservation ofbiological diversity, mitigation of global climatechange). As a consequence, several groups,including IGBP, JRC and WCMC, have embarkedupon additional global assessments of forest coverand deforestation. All are assessing various aspectsof the spatial distribution of forest cover, althoughnone are as comprehensive as the FRA programmeor present the same information.
IGBP, an international consortium of scientificorganizations, developed a global low-resolutionsatellite image-mapping project. The work is basedon interpretation and classification of advancedvery-high-resolution radiometer (AVHRR) satelliteimagery which has a 1-km resolution. The IGBPland cover data set and maps and a related GlobalLand Cover Characterization database are beingvalidated. While the main objective of these projectsis not to provide information on forest area per se,estimates of forest area may be generated from thedatabase and biomass estimates may be derivedfrom modelling.
The JRC TREES (Tropical Resources andEnvironment monitoring by Satellites) project,
2 A partial, interim assessment using modelling was done forforest cover and forest cover change for the reference year 1995;the results were published in SOFO 1997.
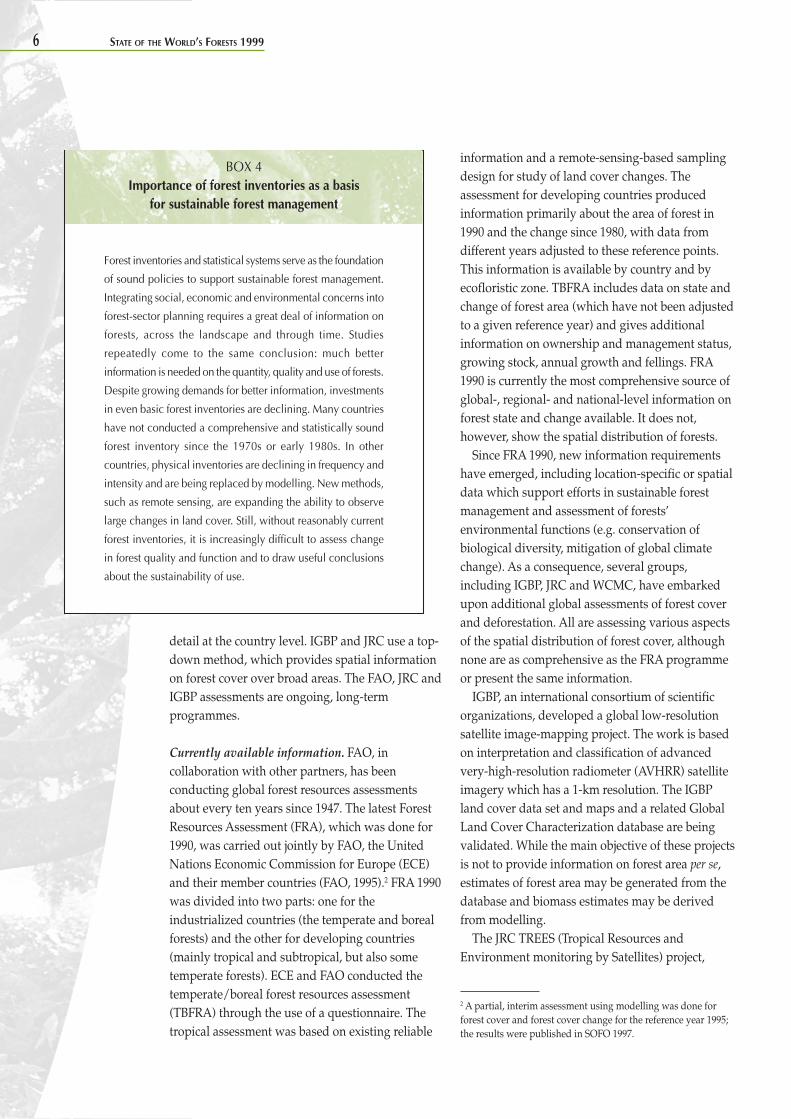
BOX 4Importance of forest inventories as a basis
for sustainable forest management
Forest inventories and statistical systems serve as the foundation
of sound policies to support sustainable forest management.
Integrating social, economic and environmental concerns into
forest-sector planning requires a great deal of information on
forests, across the landscape and through time. Studies
repeatedly come to the same conclusion: much better
information is needed on the quantity, quality and use of forests.
Despite growing demands for better information, investments
in even basic forest inventories are declining. Many countries
have not conducted a comprehensive and statistically sound
forest inventory since the 1970s or early 1980s. In other
countries, physical inventories are declining in frequency and
intensity and are being replaced by modelling. New methods,
such as remote sensing, are expanding the ability to observe
large changes in land cover. Still, without reasonably current
forest inventories, it is increasingly difficult to assess change
in forest quality and function and to draw useful conclusions
about the sustainability of use.
PART I SITUATION AND PROSPECTS FOR FOREST CONSERVATION AND DEVELOPMENT 7
established in 1991, develops forest coverassessment techniques for the tropical belt. Theproject includes:
• a baseline inventory of forest area (using amultispectral 1-km AVHRR data set);
• continuous monitoring which would directattention to the areas undergoing the mostactive land cover change (i.e. deforestation);
• analysis of the derived information in terms ofspatio-temporal patterns of deforestationthrough the comprehensive Tropical ForestInformation System (TFIS).
A multiyear set of AVHRR data was acquiredover the whole tropical belt during the period 1991-1994. This global assessment has been furthercalibrated using high-resolution image maps forselected sites. The main outputs of this effortinclude a global tropical forest cover base map at1-km resolution (the first such forest map at thisresolution) and related figures at the regional tonational levels.
The second phase (1996-1999) of the TREESproject is directed at developing a prototype thatcan regularly produce relevant and accurateinformation on the state of tropical forestecosystems. A panel of international experts hasidentified “hot spots” where deforestation is themost active. JRC is developing more automaticmethods of forest monitoring using a range ofremote-sensing and other spatial data and hasdeveloped a new sampling scheme to measurechanges using different types of high-resolutionsatellite imagery.
TFIS organizes the data (remote-sensing orcartographic) and current knowledge (reports, fieldobservations, etc.) in a systematic manner. Work isbeing done to allow an interface between TFIS andinformation systems of the European Commissionand other regional and international organizations.
In 1996, WCMC, in collaboration with the WorldWide Fund for Nature (WWF), compiled a WorldForest Map showing forest extent and protectedareas with forested land. The map is the product ofa global geographic information system (GIS)containing more detailed maps and digital filesfrom the best available national and internationalsources, compiled mainly between the early 1980sand early 1990s by WCMC in collaboration with
IUCN. WCMC used a nominal scale of 1:1 million,adjusting input data of varying scales (rangingfrom 1:100 000 to 1:5 million).
The digital information was used to estimate thearea of each major forest type in the world underprotection and to provide a baseline for futuremonitoring of forests. The spatial data have formedthe basis for a major statistical analysis of forestprotection in the world, carried out by WCMC inconjunction with the Center for InternationalForestry Research (CIFOR), and have beenpublished on CD-ROM. The digital map ismaintained at WCMC.
WCMC recently produced a new set of national-level forest statistics derived from the land covermaps overlaid with the political boundaries ofcountries. This could provide area estimates at thenational level.
WCMC has also developed a GIS databaseshowing an estimate of forest cover some8 000 years ago for the World Resources Institute(WRI) and WWF. Using the data from WCMC,WRI, under its Frontier Forests Initiative,3
developed another global map comparing the largetracts of forest lands remaining today with thoseexisting 8 000 years ago. The Frontier ForestsInitiative assessed three attributes: historic forestlost, forest condition (the amount of the world’scurrent forest cover remaining in large tracts ofintact natural forest) and threats to frontier areas.The WRI/WCMC map may be considered a globalassessment of natural forest change over a largetime span.
As a follow-up, WRI has launched the majorGlobal Forest Watch project to monitor forestdevelopment globally. Currently WRI is workingwith some 20 NGO partners in Cameroon, Gabon,Canada and Indonesia to map concessions, roadsand other developments. The goal is to carry out asimilar effort in all major forested countries withinthe next five years.
Each of the above-mentioned efforts usesdifferent definitions, sources and methods forclassifying the vegetation. Their estimates of forest
3 The Frontier Forests Initiative is a five-year, multidisciplinaryeffort to promote stewardship in and around the world’s lastmajor frontier forests by investment, policy and public opinion.

8 STATE OF THE WORLD’S FORESTS 1999
cover are thus not directly comparable. The qualityof information from any assessment dependslargely on the quality of the basic input data. Themaps from WCMC and WRI were compiled fromexisting data sources, which could reflect landcover, land use and/or land potential.Consequently, they suffer from the same problems ofharmonization as do most bottom-up approaches.
The Global Observation of Forest Cover (GOFC),a new effort of an international partnership ofinstitutions including FAO, will build on previousglobal forest assessments using earth satellites.GOFC has a goal of stimulating the production ofglobally consistent products derived from satellitedata, supplemented by in situ data, by 2002. Thiswill be achieved by facilitating the provision offorestry information and satellite data toorganizations such as FAO and UNEP, the GlobalClimate Observing System (GCOS) and the GlobalTerrestrial Observing System (GTOS), NGOs andnational forest ministries through partnershiparrangements with space agencies.
Information to be available through FRA 2000. TheFAO Global Forest Resources Assessment 2000(FRA 2000) will be the most comprehensive andcomplete assessment yet. As envisioned, FRA 2000will consist of:
• a common set of definitions and standards forboth tropical and temperate/boreal forests;
• a common set of parameters to be assessed,including not only the traditional timberinformation, but also information, whereavailable, on non-wood forest products,naturalness, biological diversity, protectedareas, carbon sequestration functions, forestcondition and socio-economic functions;
• a remote-sensing-based “wall-to-wall” globalforest map keyed to forest classes used in theassessment, an ecoregion map and a databaseat 1-km resolution;
• a global sample of satellite data to measurechanges in forest cover over the past 20 years.
As the data will be spatially registered,researchers may be able to measure changes in landcover over time; thus a base may be established forimproved comparisons for beyond 2010.
FRA 2000 will make further improvements on the
data-gathering techniques used in 1990 and willalso make use of the data and technologies of otherorganizations. FAO will use some of the imageryand GIS data sets of IGBP, JRC, the Earth ResourcesObservation Systems (EROS) Data Center of theUnited States Geological Survey and others todevelop the global forest cover map and databasefor FRA 2000.
EROS Data Center, FAO and WCMC aredeveloping the Global Forest Map, which will bethe first globally consistent small-scale mapshowing forest cover distribution. The map is beinggenerated through refinement and modelling ofIGBP’s Global Land Cover Characterizationdatabase using advanced image processing and GIStechniques, combined with validation by nationalexperts and existing reliable information.
In the past, an update on global forest resourceswas possible only every ten years. Institutionaldevelopment and communication technologies mayeventually make it possible to have much morefrequent updates and much better quality of data.While technological gains have improved theprecision of the estimates and the range ofinformation that can be collected, many countriesstill need assistance in the planning, execution andfinancing of their own national forest inventories.
These assessment efforts will continue to providevital information on the location and extent offorests at the global level. Even more valuable willbe the information on net change in extent andcondition of forests over time, which addresses theheart of the problem – what is happening to theworld’s forests and consequently to forests’ abilityto provide the range of goods and servicesdemanded of them.
Assessments of forest-based biological diversityNatural forests are arguably the single mostimportant repository of terrestrial biologicaldiversity (diversity of ecosystems, species andgenetic resources). Diversity is an essential factor inmaintaining forest function. Conservation andmanagement of biological diversity are, therefore,important issues in forest planning. Global,regional and national planning, priority-setting anddecision-making related to the conservation ofbiological diversity all depend on an understanding
PART I SITUATION AND PROSPECTS FOR FOREST CONSERVATION AND DEVELOPMENT 9
of the distribution of species and ecosystems, theirprotection status and the threats to them, and oninformation on the status of the conservation anduse of forest genetic resources.
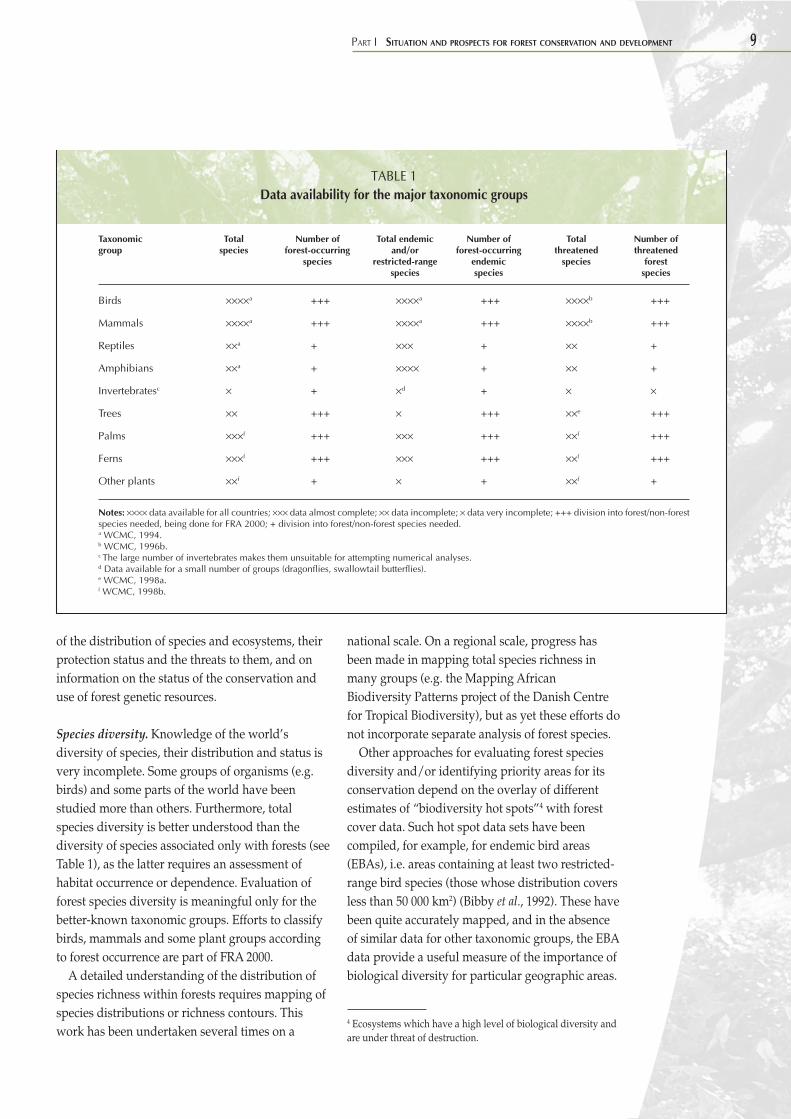
Species diversity. Knowledge of the world’sdiversity of species, their distribution and status isvery incomplete. Some groups of organisms (e.g.birds) and some parts of the world have beenstudied more than others. Furthermore, totalspecies diversity is better understood than thediversity of species associated only with forests (seeTable 1), as the latter requires an assessment ofhabitat occurrence or dependence. Evaluation offorest species diversity is meaningful only for thebetter-known taxonomic groups. Efforts to classifybirds, mammals and some plant groups accordingto forest occurrence are part of FRA 2000.
A detailed understanding of the distribution ofspecies richness within forests requires mapping ofspecies distributions or richness contours. Thiswork has been undertaken several times on a
national scale. On a regional scale, progress hasbeen made in mapping total species richness inmany groups (e.g. the Mapping AfricanBiodiversity Patterns project of the Danish Centrefor Tropical Biodiversity), but as yet these efforts donot incorporate separate analysis of forest species.
Other approaches for evaluating forest speciesdiversity and/or identifying priority areas for itsconservation depend on the overlay of differentestimates of “biodiversity hot spots”4 with forestcover data. Such hot spot data sets have beencompiled, for example, for endemic bird areas(EBAs), i.e. areas containing at least two restricted-range bird species (those whose distribution coversless than 50 000 km2) (Bibby et al., 1992). These havebeen quite accurately mapped, and in the absenceof similar data for other taxonomic groups, the EBAdata provide a useful measure of the importance ofbiological diversity for particular geographic areas.
4 Ecosystems which have a high level of biological diversity andare under threat of destruction.
TABLE 1Data availability for the major taxonomic groups
Taxonomic Total Number of Total endemic Number of Total Number ofgroup species forest-occurring and/or forest-occurring threatened threatened
species restricted-range endemic species forestspecies species species
Birds ××××a +++ ××××a +++ ××××b +++
Mammals ××××a +++ ××××a +++ ××××b +++
Reptiles ××a + ××× + ×× +
Amphibians ××a + ×××× + ×× +
Invertebratesc × + ×d + × ×
Trees ×× +++ × +++ ××e +++
Palms ×××f +++ ××× +++ ××f +++
Ferns ×××f +++ ××× +++ ××f +++
Other plants ××f + × + ××f +
Notes: ×××× data available for all countries; ××× data almost complete; ×× data incomplete; × data very incomplete; +++ division into forest/non-forestspecies needed, being done for FRA 2000; + division into forest/non-forest species needed.a WCMC, 1994.b WCMC, 1996b.c The large number of invertebrates makes them unsuitable for attempting numerical analyses.d Data available for a small number of groups (dragonflies, swallowtail butterflies).e WCMC, 1998a.f WCMC, 1998b.
10 STATE OF THE WORLD’S FORESTS 1999
Other hot spot data sets include WCMC andIUCN’s Centres of plant diversity (WWF/IUCN,1994), WWF-US’s Global 200 ecoregions5 andConservation International’s Hotspots.6
Mapping could also be used to identify areaswhere threatened and endangered forest species areconcentrated. This would require categorization ofspecies according to their forest occurrence and,ideally, relatively detailed data on theirdistributions. Nonetheless, some advances could begained simply from addressing presence/absencedata at the national or provincial level.
A country may have high forest species diversityeither because it has a wide range of different foresttypes each with its own distinct biota (e.g. theUnited States) or because individual forest typesare highly diverse in species (e.g. some lowlandtropical moist forest). The former characteristic isgenerally related to the size of the country, the latternot necessarily so. Countries with very high forestdiversity usually combine the two characteristics.
Forest ecosystem diversity. Ecosystem diversity inforests is important not only in its own right butalso as a predictor of species diversity. However,assessing ecosystem diversity requires meaningfulsystems of classification of forests, and these areincreasingly difficult to generate as thegeographical scale increases. Scientists may developschemes that are useful in local or national contextsfor expressing differences between forestecosystems, based on combinations ofphysiognomy, phenology and floristics. However,harmonizing several different schemes to produceoverviews on a continental or global scale is adifficult task which may entail so muchsimplification as to eliminate any real utility inexpressing ecosystem diversity.
For example, the harmonization of forest coverdata from 70 different sources to produce the firstglobal map of closed forest distribution, The WWFworld forest map (WCMC, 1996a), resulted in asimplistic classification with only five classes(temperate needleleaf, temperate broadleaf andmixed, tropical moist, tropical dry and mangroveforests), reflecting the difficulty of combining themany much more detailed classification systemsused throughout the world. A more detailed
classification involving 25 classes which was usedby WCMC and CIFOR in the production of asubsequent digital data set on global forest cover(Iremonger, Ravilious and Quinton, 1997) is moremeaningful in biodiversity terms but is still verysimplistic.
Remote sensing data are potentially a powerfulsource of information on forest ecosystemdistribution and diversity. However, manyregionally focused programmes, such as TREES andPathfinder,7 have been forced to use simplifiedclassification schemes because of the analyticalcomplexity of extracting more detail from satellitedata. Global satellite-derived land cover data areavailable from the EROS Data Center inpreliminary form. This data set helps to provide aconsistent global view of forests’ location andinformation about their diversity according to anumber of classification schemes ranging from thesimple to the complex, based on phenology as wellas spectral response. The greatest advance inexamining forest ecosystem diversity on a broadgeographic scale is likely to come through thecombination of remote sensing data withecoregional classifications as envisaged in FRA 2000.
Forest genetic resources. FAO, the InternationalPlant Genetic Resources Institute (IPGRI) and theInternational Centre for Research in Agroforestry(ICRAF) are facilitating regional initiatives to assessthe status of genetic resources of forest trees atspecies and provenance levels; to identify gaps oroverlaps in protection and development efforts; andto elaborate action plans for the conservation,management, sustainable utilization andenhancement of genetic resources of priorityspecies. Regional syntheses will be prepared fromdata provided by the countries.
At the global level, FAO is developing the GlobalInformation System on Forest Genetic Resources(REFORGEN) for monitoring the status of genetic
5 See WWF-US’s Web site: http://www.worldwildlife.org.6 For more information, see Conservation International’s Website: http://www.conservation.org.7 Pathfinder is the Humid Tropical Forest Inventory Project, acollaborative research effort of the University of NewHampshire, the University of Maryland and the NationalAeronautics and Space Administration, United States.
PART I SITUATION AND PROSPECTS FOR FOREST CONSERVATION AND DEVELOPMENT 11
resources of woody species at the national level (seeBox 5). This is the only global effort that specificallytargets forest genetic resources.
A global perspective on biological diversity.Assembling a global perspective on biologicaldiversity is a slow and complex task. Majoradvances have been made in compiling global datasets on current and original forest cover, but aglobal vegetation classification is still lacking. Otheradvances at the global level have come from theidentification of areas important for speciesdiversity in key groups, but congruence of diversitypatterns between groups has been addressed onlyat the regional level, and even then not thoroughly.
The increasing volumes of data involved in theanalysis and management of global forest biologicaldiversity require new approaches to datamanagement. National capacities to gather andmanage data to generate useful information – bothfor national use and to contribute to understandingof the global picture – will need to be built. Recentexperiences show that the greatest challenges areorganizational, not technological. By focusing onthe processes involved in creating environmentalinformation, rather than concentrating on data,international efforts such as the Biodiversity DataManagement Project (UNEP/WCMC, 1996) aremaking useful contributions.
In addition to information from national sources,international research and other efforts can make auseful contribution to improvement of the globalbiological diversity information base. Likelysources of such improvement in the near futureinclude:
• FRA 2000, which will include a number ofparameters related to biological diversity;
• results from national reporting efforts withinthe framework of the Convention on BiologicalDiversity, and national policies and plans onbiological diversity elaborated within theframework of the convention;
• additional research aimed at examining thecongruence of diversity patterns amongtaxonomic groups, species distributions andhabitat requirements, the effects of differentforest management practices on biologicaldiversity and biological diversity’s impact on
forest functions and contribution to socio-economic development;
• REFORGEN for forest genetic resources.Combining these and other initiatives should
produce a more coherent global view of biologicaldiversity in forests. However, the crucial step inmaintaining biological diversity in forests is thetranslation of this knowledge into improved forestmanagement and conservation practicesthroughout the world. ◆
BOX 5REFORGEN: the FAO database on forest
genetic resources
Forest genetic resources, including the diversity present in the
thousands of useful tree species, constitute a resource of
tremendous social, economic and environmental importance.
Efforts to conserve and use forest genetic resources wisely are
assisted by the Global Information System on Forest Genetic
Resources (REFORGEN), which provides reliable and up-to-
date information on the status of these resources and on related
activities and programmes. FAO’s Forestry Department, in close
collaboration with governments and national institutes of many
countries, has been working since 1993 on the development
of the system, which now covers more than 1 600 species
from 144 countries. It includes information on:
• institutions dealing with conservation and utilization of
forest genetic resources in a given country;
• the main native and introduced tree species in the country
and their major uses;
• tree species endangered at the species and/or population
level;
• tree species managed for in situ conservation;
• ex situ conservation activities in vivo and in vitro;
• tree improvement programmes;
• availability of forest reproductive materials for
conservation and research purposes.
Linkages to complementary data systems of other
organizations are being developed. REFORGEN will soon be
accessible through the Internet and on CD-ROM.
12 STATE OF THE WORLD’S FORESTS 1999
Sustainable forest management entails thebalancing of the economic, environmental and
social functions and values of forests for the benefitof present and future generations – a complex andchallenging task in the face of the Earth’s rapidlyexpanding population and increasing demands forforest products and services. However, a number ofpositive developments give cause for cautiousoptimism. Among these is the unprecedented levelof attention, energy and commitment fromthousands of formal and informal, global to local,governmental and non-governmental organizationsaround the world (see Part III for discussion ofinternational initiatives).
While frequent reference is made in the literatureto areas where forests are not being managed in asustainable manner, the magnitude of the problemglobally is not known at present. A previous studyby FAO (1982) estimated that less than 5 percent ofthe world’s tropical forest classified as productivewas under intensive management in 1980.8 FRA2000 will assess both quantitative and qualitativedata pertaining to sustainable forest managementworldwide. Recent figures indicate that almost allEuropean forests are managed,9 i.e. have a formal orinformal management plan for one or acombination of objectives (e.g. wood production,conservation of biological diversity, soil and waterconservation, recreation) (Third MinisterialConference on the Protection of Forests in Europe/Ministry of Agriculture, Rural Development andFisheries of Portugal, 1998a).
Sustainable management of forests implies theprovision of a range of goods and services. Whileall forests, by their nature, are multipurpose, andwhile more emphasis is given to management formultiple functions, most managed forests have aprimary management objective: production (ofwood and/or non-wood products), protection(mainly for soil and water conservation) orconservation (of biological diversity, culturalheritage sites, etc.). The following discussions of
natural forests and forest plantations focus onmanagement where wood production is theprimary objective, as issues related to timberharvesting are among the more contentious in theforest debate today. Social and environmentalfunctions of forests are treated in a subsequentsection.
MANAGEMENT OF NATURAL FORESTSThere is a global commitment to improve themanagement of forests. This improvement entails arebalancing of forest management objectives, whichis bringing about changes in the way forests aremanaged and, in some places, a reallocation offorest areas between different uses. This may resultin reduced timber harvests in natural forests, butincreased production of other goods and services.Implementing sustainable forest management maylead to reduced volumes harvested in the shortterm, yet there is an expectation that it will increasewood supply over the long term.
Natural forest management is currently beingaffected by changes in resource availability,developments in management objectives andpractices, and institutional changes which have ledto a more diverse set of forest managers.
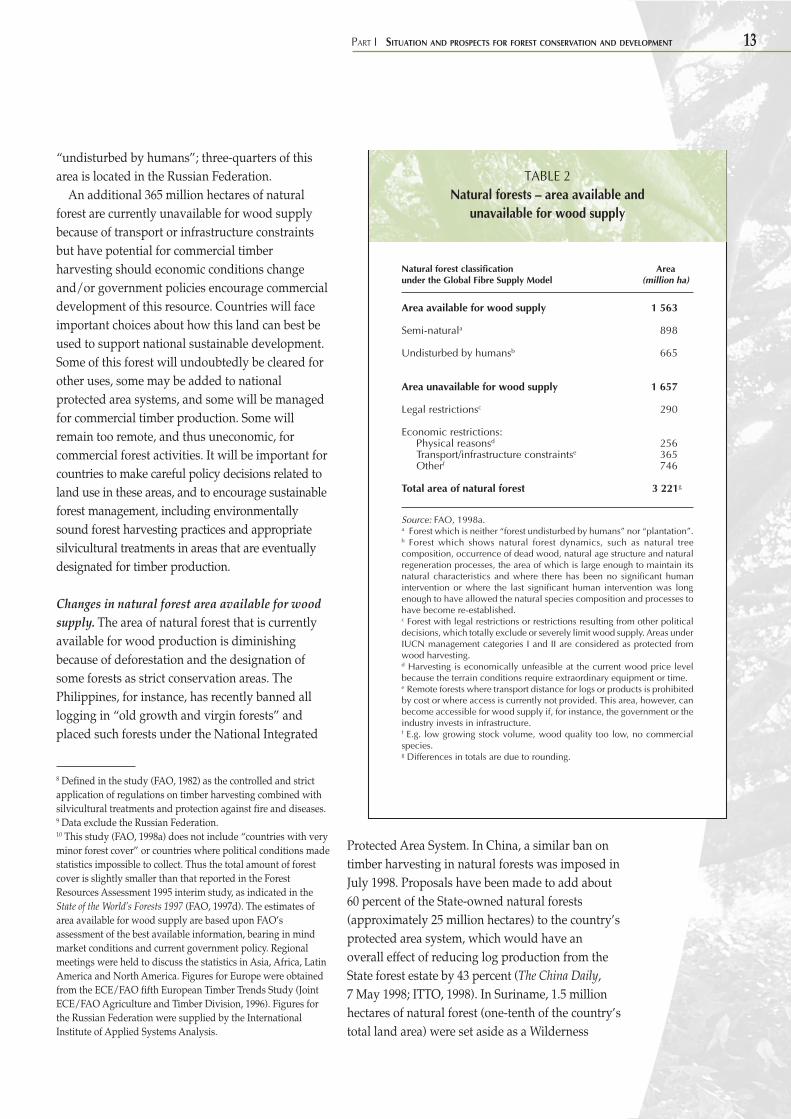
Trends in resource availability and in woodsupplyArea of natural forest available for wood supply.Nearly one-half (1 563 million hectares) of the areaof natural forests worldwide (an estimated3 221 million hectares) is considered to be availablefor wood supply under current legal and marketconditions (i.e. there are no legal restrictions andforest cover is both economically and physicallyaccessible) (FAO, 1998a)10 (see Table 2). Concernsrelated to timber harvesting and the need toencourage the use of environmentally sound forestharvesting practices apply to this area. At least42 percent (665 million hectares) of the areaavailable for wood supply is estimated to be
Status and trends in forestmanagement
PART I SITUATION AND PROSPECTS FOR FOREST CONSERVATION AND DEVELOPMENT 13
8 Defined in the study (FAO, 1982) as the controlled and strictapplication of regulations on timber harvesting combined withsilvicultural treatments and protection against fire and diseases.9 Data exclude the Russian Federation.10 This study (FAO, 1998a) does not include “countries with veryminor forest cover” or countries where political conditions madestatistics impossible to collect. Thus the total amount of forestcover is slightly smaller than that reported in the ForestResources Assessment 1995 interim study, as indicated in theState of the World’s Forests 1997 (FAO, 1997d). The estimates ofarea available for wood supply are based upon FAO’sassessment of the best available information, bearing in mindmarket conditions and current government policy. Regionalmeetings were held to discuss the statistics in Asia, Africa, LatinAmerica and North America. Figures for Europe were obtainedfrom the ECE/FAO fifth European Timber Trends Study (JointECE/FAO Agriculture and Timber Division, 1996). Figures forthe Russian Federation were supplied by the InternationalInstitute of Applied Systems Analysis.
TABLE 2Natural forests – area available and
unavailable for wood supply
Natural forest classification Areaunder the Global Fibre Supply Model (million ha)
Area available for wood supply 1 563
Semi-naturala 898
Undisturbed by humansb 665
Area unavailable for wood supply 1 657
Legal restrictionsc 290
Economic restrictions: Physical reasonsd 256 Transport/infrastructure constraintse 365 Otherf 746
Total area of natural forest 3 221g
Source: FAO, 1998a.a Forest which is neither “forest undisturbed by humans” nor “plantation”.b Forest which shows natural forest dynamics, such as natural treecomposition, occurrence of dead wood, natural age structure and naturalregeneration processes, the area of which is large enough to maintain itsnatural characteristics and where there has been no significant humanintervention or where the last significant human intervention was longenough to have allowed the natural species composition and processes tohave become re-established.c Forest with legal restrictions or restrictions resulting from other politicaldecisions, which totally exclude or severely limit wood supply. Areas underIUCN management categories I and II are considered as protected fromwood harvesting.d Harvesting is economically unfeasible at the current wood price levelbecause the terrain conditions require extraordinary equipment or time.e Remote forests where transport distance for logs or products is prohibitedby cost or where access is currently not provided. This area, however, canbecome accessible for wood supply if, for instance, the government or theindustry invests in infrastructure.f E.g. low growing stock volume, wood quality too low, no commercialspecies.g Differences in totals are due to rounding.
“undisturbed by humans”; three-quarters of thisarea is located in the Russian Federation.
An additional 365 million hectares of naturalforest are currently unavailable for wood supplybecause of transport or infrastructure constraintsbut have potential for commercial timberharvesting should economic conditions changeand/or government policies encourage commercialdevelopment of this resource. Countries will faceimportant choices about how this land can best beused to support national sustainable development.Some of this forest will undoubtedly be cleared forother uses, some may be added to nationalprotected area systems, and some will be managedfor commercial timber production. Some willremain too remote, and thus uneconomic, forcommercial forest activities. It will be important forcountries to make careful policy decisions related toland use in these areas, and to encourage sustainableforest management, including environmentallysound forest harvesting practices and appropriatesilvicultural treatments in areas that are eventuallydesignated for timber production.
Changes in natural forest area available for woodsupply. The area of natural forest that is currentlyavailable for wood production is diminishingbecause of deforestation and the designation ofsome forests as strict conservation areas. ThePhilippines, for instance, has recently banned alllogging in “old growth and virgin forests” andplaced such forests under the National Integrated
Protected Area System. In China, a similar ban ontimber harvesting in natural forests was imposed inJuly 1998. Proposals have been made to add about60 percent of the State-owned natural forests(approximately 25 million hectares) to the country’sprotected area system, which would have anoverall effect of reducing log production from theState forest estate by 43 percent (The China Daily,7 May 1998; ITTO, 1998). In Suriname, 1.5 millionhectares of natural forest (one-tenth of the country’stotal land area) were set aside as a Wilderness
14 STATE OF THE WORLD’S FORESTS 1999
Nature Reserve in 1998. In April 1998, theGovernment of Brazil announced its intention toput 25 million hectares of rain forest underprotected area status. In addition, Brazil,Cambodia, New Zealand, Sri Lanka, Thailand andthe United States, among others, have recentlyeither banned or severely restricted timberharvesting in primary forests.
Other recent developments which may affect thearea of natural forest available for wood supply arethe restitution of large forest areas to past owners inEastern Europe; devolution and decentralization ofresponsibility for forest management (e.g. in thePhilippines); and the designation of large areas ofpublic forests for the use of native communities(e.g. in countries in the Amazon region, thePhilippines and Canada). New owners of smallareas of forests or woodlands in many developedcountries are increasingly likely to use the forest foraesthetic or recreational purposes rather than fortimber production. Changing ownership patterns,in which larger areas of natural forest are dividedinto smaller, individually owned forest units, mayin some cases make timber productionuneconomical. The overall effect is expected to be areduction in the area of natural forest available forwood supply.
Changes in the types of forest available for woodsupply. Timber harvesting is gradually shiftingfrom forests undisturbed by humans to semi-natural forests,11 plantations and trees outsideforests. Factors driving this shift includedeforestation, past timber harvesting and the recentinclusion of areas of natural forest that werepreviously available for timber production intocountries’ protected area systems. (See also thesection on global trends in forest products, below.)The shift has already taken place in Europe, wherean estimated 85 percent of forests are consideredsemi-natural (Third Ministerial Conference on theProtection of Forests in Europe/Ministry ofAgriculture, Rural Development and Fisheries of
Portugal, 1998a). The area of semi-natural forestsand forest fallows on agricultural land is expectedto increase, mainly in the developing world. As aresult, interest in managing this resource for woodproduction has grown in recent years, andconsiderable effort has been devoted to identifyingmeans by which this can be done sustainably.
The impact of sustainable forest management onfuture wood supply. More than 150 countries areparticipating in regional and ecoregional processesto establish criteria and indicators for sustainableforest management (see Part III). Member countriesof the International Tropical Timber Organization(ITTO), which account for more than 80 percent ofthe world’s tropical forests and more than95 percent of the global tropical timber trade, havemade a commitment to have their exports oftropical timber and tropical timber products comefrom sustainably managed sources by the year2000. ITTO consumer countries have made acommitment to maintain or achieve sustainablemanagement of their own forests by 2000. TheWorld Bank and WWF have joined forces in arecently announced programme aiming for a targetof 200 million hectares of certifiable forests by 2005.(Certification is discussed below under “Globaltrends in forest products”.) A variety of otherefforts, ranging from model forests to researchefforts to NGO initiatives, are helping to promotesustainable forest management.
A study carried out in conjunction with the FAOGlobal Fibre Supply Model reviewed recent effortsto estimate how implementation of sustainableforest management might affect wood supply(FAO, 1997a). Much of the information availablewas based on simulation models and trialoperations, and should be interpreted with caution.Nonetheless, the review indicated thatimplementing sustainable forest managementwould lead to reductions in harvest volume,particularly over the short term, and thatmanagement costs could be expected to rise onaverage between 5 and 25 percent.
There is, however, an expectation that long-termsupply will increase through application ofsustainable forest management. In the tropics,
11 “Semi-natural” forests are natural forests where the impact of(prior) human intervention is still evident (i.e. forests that areneither “undisturbed by humans” nor plantations).
PART I SITUATION AND PROSPECTS FOR FOREST CONSERVATION AND DEVELOPMENT 15
much of this increase is expected to be realizedthrough improved harvesting methods leading tothe maintenance of site productivity and preventionof damage to immature stems. In temperate foreststhe long-term increase is expected to be lesspronounced because of the high level ofproductivity already reached, and increases may becaptured only by intensified silviculture.12
Recent developments in natural forestmanagement and silvicultureMany wood producing countries will continue torely on natural forests as the main source of theirwood supply, at least for the short term; only a fewcountries currently harvest the majority of theirwood from forest plantations and trees outsideforests.13 The challenge, therefore, is to managenatural forests designated for wood production insuch a way as to meet economic and socio-culturalneeds, while maintaining and enhancing theforests’ ecological and environmental functions.
Increasingly, the trend in many countries istowards multipurpose management of forestecosystems. Consideration of long-term impacts ofmanagement interventions is made at thelandscape, subnational and national levels. Thistrend has been reinforced by recent efforts toidentify and apply criteria and indicators forsustainable forest management.
The emphasis on sustainable forest managementhas led to changes both in silvicultural systems andin timber harvesting practices. At the operationallevel, the persons responsible for harvestingoperations are increasingly being tasked with pre-and postharvesting silvicultural actions as anintegral part of the harvesting system in countrieswhere this has not traditionally been the case.
Recent developments in silviculture. Changes insilvicultural systems are occurring in all types offorests – temperate, boreal, tropical and subtropical.
In the temperate zone, revised silviculturalguidelines are being developed by several countriesand groups of countries as an outcome of recentinitiatives related to identification and use ofcriteria and indicators for sustainable forestmanagement. The Pan-European Operational Level
Guidelines for Sustainable Forest Management,14
for instance, addresses regeneration, choice ofsilvicultural systems, tending and harvesting, theuse of pesticides and herbicides, protection of keybiotopes, sensitive areas and sites of specifichistorical, cultural or spiritual significance, amongothers. The new United Kingdom ForestryStandard (DANI, 1998) is one example of nationalguidelines prepared in accordance with the Pan-European guidelines.
Concepts which reflect silvicultural managementchanges adopted in North American temperate andboreal forests in the late 1980s and 1990s include“sustainable forestry”, “ecological integrity”,“mimicking natural disturbances” and “ecosystemmanagement”. The corresponding silviculturalsystems are identified with another set of termssuch as “new forestry”, “variable retentionsilvicultural system” and “improvement cutting”.Codes of best management practices or forestpractices codes have been developed for virtuallyall regions of Canada and the United States. Thesecodes, which can be voluntary or prescribed instatutes and regulations, have had a significantimpact on forest management in both countries.
In the tropics, there are clear indicators ofgradual change towards silvicultural practices thatbetter reflect the multiple goals of sustainable forestmanagement. The CELOS management system,15
which has been undergoing field trials for severalyears in Suriname, is being adopted in other partsof Latin America and in Asia. For example,Indonesia and Nepal have developed shelterwood/enrichment planting in dipterocarps, and Malaysiaand Uganda are moving to the Selective
12 In some temperate countries – notably in Europe – whereforests have been intensively managed for a long time, anincrease in wood supply may depend on more intensivemanagement of small, privately owned woodlands. Theconversion of marginal agricultural areas to forests may alsoresult in increased wood supply.13 E.g. Bangladesh, Chile, Japan, New Zealand, Pakistan, SouthAfrica, Sri Lanka and Zambia.14 Endorsed at the Third Ministerial Conference on the Protectionof Forests in Europe, Lisbon, Portugal, 1998.15 The CELOS harvesting and silvicultural system is apolycyclical selection system based on 20- to 25-year cuttingintervals and a minimum harvest size of 35 cm diameter atbreast height (DBH).
16 STATE OF THE WORLD’S FORESTS 1999
Management System.16 Recent attention has alsobeen paid to improved management of secondaryforests, particularly forests that have developed onagricultural land either as a fallow (i.e. forestfallow) or following abandonment of the land.17
Efforts to improve forest harvesting practices.Various efforts are under way to develop methodsof timber harvesting that maintain both thepotential for future production and theenvironmental services that forests provide. At theinternational level, FAO and CIFOR have beenworking on codes and guidelines forenvironmentally sound forest harvesting. FAOpublished a Model Code of Forest HarvestingPractices in 1996 (FAO, 1996b). CIFOR recentlydeveloped guidelines for reduced-impact loggingin dipterocarp forests in Indonesia (Sist, Dykstraand Fimbel, 1998). A regional Code of Practice forForest Harvesting developed for the Asia and thePacific region under the auspices of the Asia-PacificForestry Commission (APFC) was adopted by themember countries at APFC’s seventeenth session inFebruary 1998. National codes in line with theregional code are currently being developed byseveral countries in the region, and a number oftraining workshops on implementation have beenheld. Box 6 reports on some of the expected resultsof implementing the FAO Model Code of ForestHarvesting Practices and the guidelines developedby CIFOR.
New managers and new management roles: afocus on people’s participation in forestmanagementRecent changes in forest policy and legislationreflect support for increased involvement of theprivate sector (forest owners, forest industries,NGOs and community-based organizations,indigenous people and the general public) and localgovernment units in forest management.Privatization, devolution and decentralization,recognition of indigenous peoples’ rights toancestral land and participatory approaches toforest management have all led to changing roles offorest administrations and a new type of forestmanager (see also Part II).
As a result of both internal and external
pressures, stemming from the growing recognitionover the past two decades that active stakeholderparticipation is a key element of sustainable forestmanagement, a variety of approaches to increasingthe participation of local communities in naturalforest management have been developed. The pastfew years have seen a significant acceleration in theimplementation of community-based forestmanagement programmes and considerableimprovement in the results as experience, bothgood and bad, has accumulated.
Asia has been at the forefront of participatoryforest management. Joint forest management inIndia, whose roots date back to the early 1970sin West Bengal, was one of the first initiatives.Under joint forest management, communities aregiven rights to manage areas of forest, asdetailed in a management plan, in return forwhich they receive a portion of the resultingbenefits. Through Nepal’s community forestryprogramme (see Box 7), user groups manageforests according to a management plan drawnup with and approved by the District ForestOfficer. In the Philippines, some forestmanagement functions have recently beendevolved to local government. A community-basedforest management strategy has been adopted as
16 Similar to CELOS, the Selective Management System is apolycyclical system in which a lower volume of wood isremoved at each cut, especially in the first cycle, in order tosustain the long-term harvestable volumes. The system is basedon 25- to 30-year cutting intervals and a minimum harvest sizeof 35 cm DBH (see FAO, 1997l).17 Secondary forests have been defined in various ways. Somedefinitions include previously harvested primary forests, whileothers include only forests that develop on agricultural land,either as fallow or following abandonment of the land. Recentevents and activities regarding secondary forests include a sidemeeting on tropical secondary forest at the eleventh WorldForestry Congress; the FAO/Netherlands InternationalWorkshop on the Sustainable Development of TropicalSecondary Forests in Pucallpa, Peru, June 1997; theestablishment of a Tropical Secondary Forest Network; andprojects implemented by the Tropical Agriculture Research andHigher Education Center (CATIE) and the Organization ofTropical Studies (OTS/OET) in Costa Rica, the Center forInternational Forestry Research (CIFOR) in Indonesia and theInternational Cooperation Centre on Agrarian Research forDevelopment (CIRAD-Forêt) in West and Central Africa. Theimportance of secondary forests and their management is alsoreceiving high priority in the framework of the AmazonCooperation Treaty.
PART I SITUATION AND PROSPECTS FOR FOREST CONSERVATION AND DEVELOPMENT 17
least 50 percent in comparison with conventional logging
operations where the guidelines are not applied;
• limit overall direct impacts to the forest to less than
25 percent;
• conserve wildlife and other forest resources, including
non-wood forest products, threatened and endangered
species, keystone plant resources and water;
• diminish direct logging costs by at least 15 percent;
• protect the long-term integrity and value of the permanent
forest estate.
A critical requirement for the effective application of
advanced technology capable of reducing environmental
impacts associated with logging is a well-designed and
continuous programme of training for the logging crews, their
supervisors and the persons responsible for harvest planning.
Achievements in environmentally sound road construction
using hydraulic excavators and advanced blasting techniques
have been thoroughly documented by recent case studies in
Austria (FAO, 1998b) and Bhutan (FAO, 1998d). Trials with
central tyre inflation (CTI) on a timber hauling truck (which
allows the driver to vary the tyre pressure while the truck is in
motion) found that a road that normally would have been
closed during a period of reduced bearing capacity (e.g. spring
thaw) coped comfortably with 30 passes by a CTI-equipped
truck. A conventional truck with normal tyre pressure
would have caused deep ruts in the road in just six trips
(SkogForsk, 1998).
A requirement for the widespread adoption of environmentally
sound timber harvesting technologies is the demonstration that
such operations can be economically feasible, environmentally
sound and socially acceptable. In response to this need, case
studies sponsored by private enterprises have been undertaken
in tropical forests in the Congo (FAO, 1997b), Brazil (FAO,
1997c) and Indonesia (FAO, 1998c) to test some of the
applications suggested in the FAO Model Code of Forest
Harvesting Practices.
These studies have found that:
• environmentally sound timber harvesting is not
necessarily more expensive than traditional timber
harvesting methods;
• use of the environmentally sound practices reduced
damage to standing stock as much as 60 percent (from
51.5 to 22.2 percent in the Brazil study) relative to
traditional harvesting methods;
• appropriate preharvest planning reduced the area of forest
roads, skid trails and landings considerably (from 20 to
4.5 percent in the study in Brazil);
• disturbance of the canopy was reduced from 25 to
11 percent;
• total timber loss was reduced by more than 50 percent
(from 8.5 to 3.9 percent of utilizable stem volume).
These findings correlate well with the expectations for
reduced-impact logging for lowland and hill dipterocarp forests
in Indonesia as stated in the CIFOR guidelines (Sist, Dykstra
and Fimbel, 1998). The endorsed practices were expected to:
• reduce disturbances to soil and residual vegetation by at
the main approach to sustainable development ofthe country’s public forest resources.
Other regions are also seeing participatoryapproaches to forest management. In Africa, forexample, several countries have adoptedcommunity-based forest management as their mainstrategy for managing forest resources.Participatory forest management is also beingextensively used in Latin America, where efforts toinvolve indigenous peoples have been particularlynoteworthy. Collaborative management of
protected areas has become the primary approachof international NGOs such as WWF and IUCN inprojects in Asia, Africa and Latin America.
These initiatives have certain features incommon. For example, the community gains securerights to the use of resources on forest land, ratherthan ownership of the land itself. Another is thateven though the responsibility for managing forestareas is either shared or shifted primarily to theuser manager, the authority in most cases continuesto lie with State forest administrations. Thus, if
BOX 6Environmentally sound forest harvesting
18 STATE OF THE WORLD’S FORESTS 1999
conflicts arise between the State agency and theuser group, the State agency usually has theauthority to resolve the dispute. In general,government support of local forest management isincreasing, partly as a consequence of the positiveresults being obtained, but also because ofdiminishing financial and human resources at thecentral level.
Although participatory forest management hasbeen implemented over a relatively short period,information is emerging which indicates that theseapproaches are having a positive effect on thecondition of forest resources. This is partly becausethe direct accrual of benefits to local communities
gives them greater incentive to manage andconserve forest resources actively. Several studieshave been made of the benefits of shared forestmanagement. For example, the OverseasDevelopment Agency of the United Kingdom(ODA, 1996) concluded from the review of itsprojects in community-based forestry that severalhad positive environmental impacts, benefitingwater supply, soil erosion control and biologicaldiversity. The review also found that the projectshad social and economic benefits, includingstrengthened local institutional capacity, improvedrelations among stakeholders (particularlycommunities and forest departments), increased
BOX 7Examples of community-based forest management
Nepal
Under community forestry, the government may assign local
forest users the right to manage an area of State forest. Users
form forest user groups, which are responsible for setting and
enforcing forest management rules, designed to ensure that
extraction of forest products is limited to sustainable levels.
The rules are included in a forest operational plan, which must
be approved by the District Forest Office. The user group can
sell the forest products, including timber, at prices that it sets,
and it may use the income for forestry and community
development activities.
The Gambia
Establishing community ownership of forest land has been an
important strategy in promoting sustainable forest management
practices in the Gambia. Local inhabitants previously had little
incentive to conserve public forest resources and often
overexploited resources on State forest lands. Recognition that
access to forest ownership serves as motivation for preserving
forests has led to the development of community forestry
activities within the Gambia. The Gambian-German Forestry
Project has sought collaboration between local forest
committees and the Forestry Department in developing local
management plans. These plans, known as Preliminary
Community Forest Management Agreements, provide for
community-based forest management over a three-year period.
If the community displays an ability to manage the forest well,
it is granted forest resources ownership rights. Communities
are entitled to keep the benefits derived from the forest in
exchange for managing the forest according to the established
plan. Over 300 villages are currently involved in this project
and numerous others also wish to participate.
Guatemala
In 1994, the Guatemalan Parliament approved a law enabling
local communities to apply for forest concessions in the buffer
zones of the Maya biosphere reserve, a protected area in
northern Guatemala. A community must legally register its
organization or association, apply for use of a specific area,
develop a forest management plan for 30 or 40 years and
elaborate a one-year operational plan. All these documents
are presented to the National Council of Protected Areas
(Consejo Nacional de Areas Protegidas – CONAP). CONAP
technicians help with the development of the management
plans and an NGO advises the community on both technical
and legal aspects. The community organization agrees to pay
CONAP 1 percent of the revenue generated by the forest. The
community contracts private companies to harvest timber and
non-wood forest products and monitors the forest
management. To date, approximately 92 000 ha have been
given over to such local concessions.
PART I SITUATION AND PROSPECTS FOR FOREST CONSERVATION AND DEVELOPMENT 19
product flows, greater product diversity and betteraccess to markets.
A major challenge to be met in the future is toimprove links between forest policy and ground-level implementation. Policy formulation needs toincorporate the experience of local-level forest usersand managers, both traditional and non-traditional,and forest policies need to be better understood,accepted and effectively implemented at the locallevel.
FOREST PLANTATIONSForest plantations have attracted both considerablepositive attention and criticism in recent years.Plantations will be increasingly important sourcesof industrial wood in the future, thus potentiallyallowing reduced levels of timber harvesting innatural forests. Some groups, however, opposethem as unsustainable monocultures unable toprovide the multiple goods and services availablefrom natural forests. There is concern that somenatural tropical forests are being cleared andreplaced with forest plantations. A closer look canshed some light on questions about the potential ofplantations to meet demands for industrial woodproducts and thus their indirect role in conservingnatural forest resources.
The area of plantationsThe area of forest plantations in the world has beenincreasing for the past two decades, and this trendis expected to continue (see section on global trendsin forest products). Viet Nam, for example, recentlyannounced plans for the rehabilitation of 5 millionhectares of forest land, of which about 3 millionhectares would be forest plantations. Othercountries with continuing afforestationprogrammes include (among others) Argentina,Brazil, Chile, China, India, Indonesia, Morocco,Thailand and Uruguay.
Several developed countries in the temperate andboreal regions have forests of native species that arelargely regenerated naturally, but withsupplementary planting as necessary. The difficultyof distinguishing forest plantations from naturalforests – or rather, the fact that a hybrid of the twoprevails in many countries, particularly in Europe,has made it impossible to get exact figures on the
area of forest plantations in the developed world.An estimate, however, is that there are over60 million hectares of forest plantations, of whichabout 29 million hectares are in European countries(including over 17 million hectares in the RussianFederation), over 13 million hectares in the UnitedStates, over 10 million hectares in Japan (ThirdMinisterial Conference on the Protection of Forestsin Europe/Ministry of Agriculture, RuralDevelopment and Fisheries of Portugal, 1998b),18
1.5 million hectares in New Zealand (New ZealandMinistry of Forestry, 1997)19 and 1 million hectaresin Australia (Bureau of Resource Sciences, 1997).20
Forest plantations make up a large proportion ofsome countries’ total forest cover (e.g. 44 percent inJapan and 19 percent in New Zealand). Not all ofthese plantations have been established for woodsupply, however; many have been planted forprotection functions, such as soil and waterconservation, slope stabilization and windprotection.
There is a clearer distinction between naturalforest and forest plantations in developingcountries.
Table 3 shows the regional totals derived from arecent FAO review of the literature of forestplantations established for wood supply. Almost75 percent of forest plantations are located in theAsia and the Pacific region (with 21 million hectaresin China and 20 million hectares in India), whileabout 15 percent are in Latin America and10 percent are in Africa. The reported annualafforestation rate in the tropics and subtropics in1995 was about 3 million hectares per year.
An estimated 57 percent of the plantation area isplanted with hardwood species and 43 percent withsoftwoods. Various species of pines make up themajority (61 percent) of the softwoods. Eucalyptscomprise the largest area of hardwood plantationsplanted for industrial use (30 percent), followed byacacias (12 percent) and teak (about 7 percent).Short-rotation plantations of hardwood specieshave been grown for many years, but until recentlythere has been little interest in growing valuable
18 Figure for 1997.19 Figure for 1996.20 Figure for 1994.
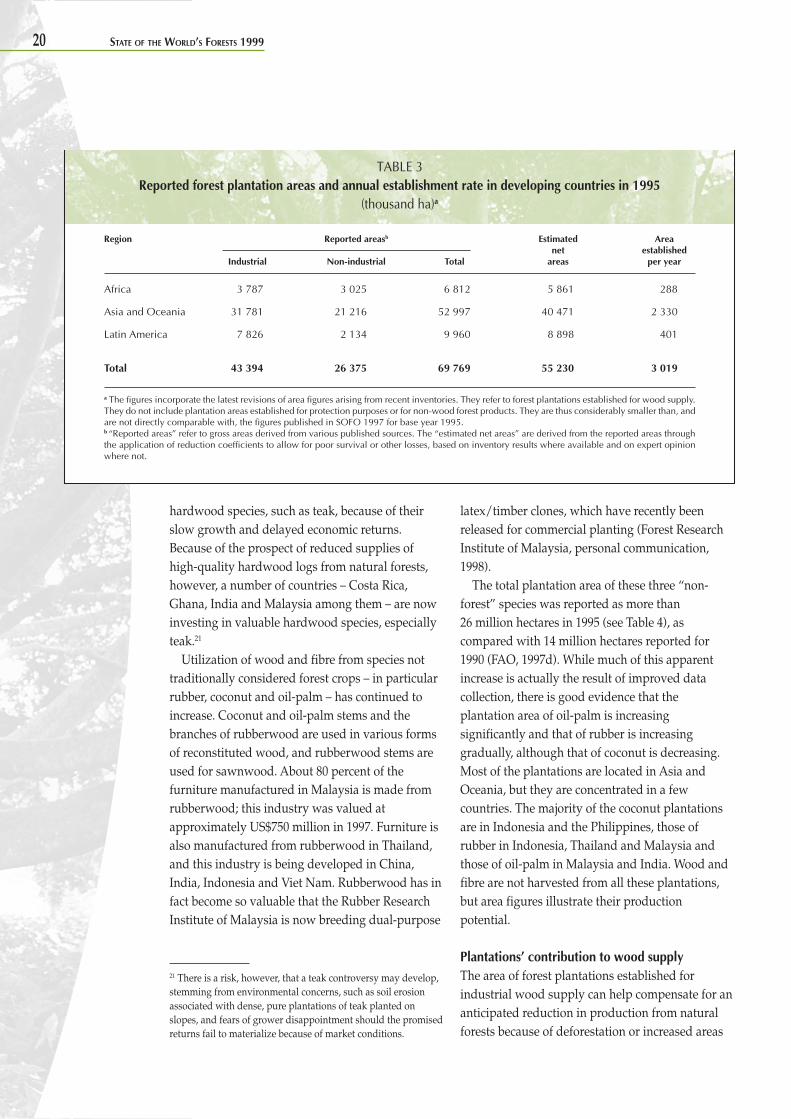
20 STATE OF THE WORLD’S FORESTS 1999
hardwood species, such as teak, because of theirslow growth and delayed economic returns.Because of the prospect of reduced supplies ofhigh-quality hardwood logs from natural forests,however, a number of countries – Costa Rica,Ghana, India and Malaysia among them – are nowinvesting in valuable hardwood species, especiallyteak.21
Utilization of wood and fibre from species nottraditionally considered forest crops – in particularrubber, coconut and oil-palm – has continued toincrease. Coconut and oil-palm stems and thebranches of rubberwood are used in various formsof reconstituted wood, and rubberwood stems areused for sawnwood. About 80 percent of thefurniture manufactured in Malaysia is made fromrubberwood; this industry was valued atapproximately US$750 million in 1997. Furniture isalso manufactured from rubberwood in Thailand,and this industry is being developed in China,India, Indonesia and Viet Nam. Rubberwood has infact become so valuable that the Rubber ResearchInstitute of Malaysia is now breeding dual-purpose
latex/timber clones, which have recently beenreleased for commercial planting (Forest ResearchInstitute of Malaysia, personal communication,1998).
The total plantation area of these three “non-forest” species was reported as more than26 million hectares in 1995 (see Table 4), ascompared with 14 million hectares reported for1990 (FAO, 1997d). While much of this apparentincrease is actually the result of improved datacollection, there is good evidence that theplantation area of oil-palm is increasingsignificantly and that of rubber is increasinggradually, although that of coconut is decreasing.Most of the plantations are located in Asia andOceania, but they are concentrated in a fewcountries. The majority of the coconut plantationsare in Indonesia and the Philippines, those ofrubber in Indonesia, Thailand and Malaysia andthose of oil-palm in Malaysia and India. Wood andfibre are not harvested from all these plantations,but area figures illustrate their productionpotential.
Plantations’ contribution to wood supplyThe area of forest plantations established forindustrial wood supply can help compensate for ananticipated reduction in production from naturalforests because of deforestation or increased areas
TABLE 3Reported forest plantation areas and annual establishment rate in developing countries in 1995
(thousand ha)a
Region Reported areasb Estimated Areanet established
Industrial Non-industrial Total areas per year
Africa 3 787 3 025 6 812 5 861 288
Asia and Oceania 31 781 21 216 52 997 40 471 2 330
Latin America 7 826 2 134 9 960 8 898 401
Total 43 394 26 375 69 769 55 230 3 019
a The figures incorporate the latest revisions of area figures arising from recent inventories. They refer to forest plantations established for wood supply.They do not include plantation areas established for protection purposes or for non-wood forest products. They are thus considerably smaller than, andare not directly comparable with, the figures published in SOFO 1997 for base year 1995.b “Reported areas” refer to gross areas derived from various published sources. The “estimated net areas” are derived from the reported areas throughthe application of reduction coefficients to allow for poor survival or other losses, based on inventory results where available and on expert opinionwhere not.
21 There is a risk, however, that a teak controversy may develop,stemming from environmental concerns, such as soil erosionassociated with dense, pure plantations of teak planted onslopes, and fears of grower disappointment should the promisedreturns fail to materialize because of market conditions.
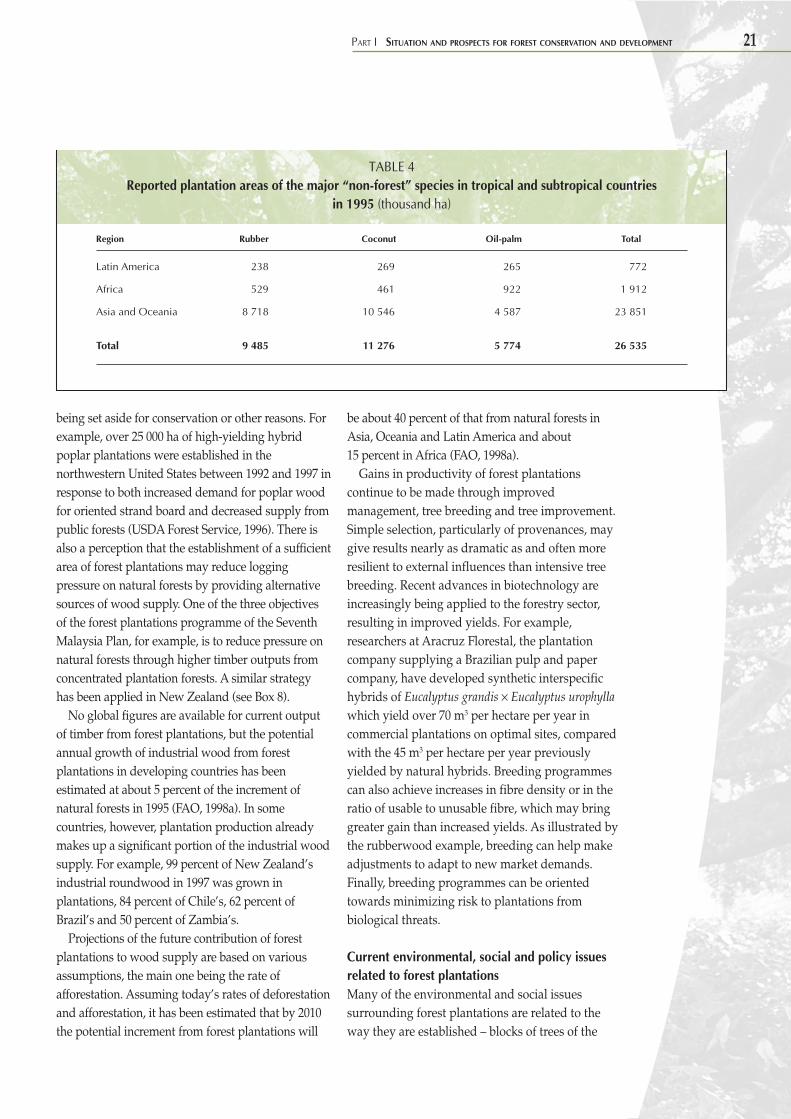
PART I SITUATION AND PROSPECTS FOR FOREST CONSERVATION AND DEVELOPMENT 21
being set aside for conservation or other reasons. Forexample, over 25 000 ha of high-yielding hybridpoplar plantations were established in thenorthwestern United States between 1992 and 1997 inresponse to both increased demand for poplar woodfor oriented strand board and decreased supply frompublic forests (USDA Forest Service, 1996). There isalso a perception that the establishment of a sufficientarea of forest plantations may reduce loggingpressure on natural forests by providing alternativesources of wood supply. One of the three objectivesof the forest plantations programme of the SeventhMalaysia Plan, for example, is to reduce pressure onnatural forests through higher timber outputs fromconcentrated plantation forests. A similar strategyhas been applied in New Zealand (see Box 8).
No global figures are available for current outputof timber from forest plantations, but the potentialannual growth of industrial wood from forestplantations in developing countries has beenestimated at about 5 percent of the increment ofnatural forests in 1995 (FAO, 1998a). In somecountries, however, plantation production alreadymakes up a significant portion of the industrial woodsupply. For example, 99 percent of New Zealand’sindustrial roundwood in 1997 was grown inplantations, 84 percent of Chile’s, 62 percent ofBrazil’s and 50 percent of Zambia’s.
Projections of the future contribution of forestplantations to wood supply are based on variousassumptions, the main one being the rate ofafforestation. Assuming today’s rates of deforestationand afforestation, it has been estimated that by 2010the potential increment from forest plantations will
be about 40 percent of that from natural forests inAsia, Oceania and Latin America and about15 percent in Africa (FAO, 1998a).
Gains in productivity of forest plantationscontinue to be made through improvedmanagement, tree breeding and tree improvement.Simple selection, particularly of provenances, maygive results nearly as dramatic as and often moreresilient to external influences than intensive treebreeding. Recent advances in biotechnology areincreasingly being applied to the forestry sector,resulting in improved yields. For example,researchers at Aracruz Florestal, the plantationcompany supplying a Brazilian pulp and papercompany, have developed synthetic interspecifichybrids of Eucalyptus grandis × Eucalyptus urophyllawhich yield over 70 m3 per hectare per year incommercial plantations on optimal sites, comparedwith the 45 m3 per hectare per year previouslyyielded by natural hybrids. Breeding programmescan also achieve increases in fibre density or in theratio of usable to unusable fibre, which may bringgreater gain than increased yields. As illustrated bythe rubberwood example, breeding can help makeadjustments to adapt to new market demands.Finally, breeding programmes can be orientedtowards minimizing risk to plantations frombiological threats.
Current environmental, social and policy issuesrelated to forest plantationsMany of the environmental and social issuessurrounding forest plantations are related to theway they are established – blocks of trees of the
TABLE 4Reported plantation areas of the major “non-forest” species in tropical and subtropical countries
in 1995 (thousand ha)
Region Rubber Coconut Oil-palm Total
Latin America 238 269 265 772
Africa 529 461 922 1 912
Asia and Oceania 8 718 10 546 4 587 23 851
Total 9 485 11 276 5 774 26 535
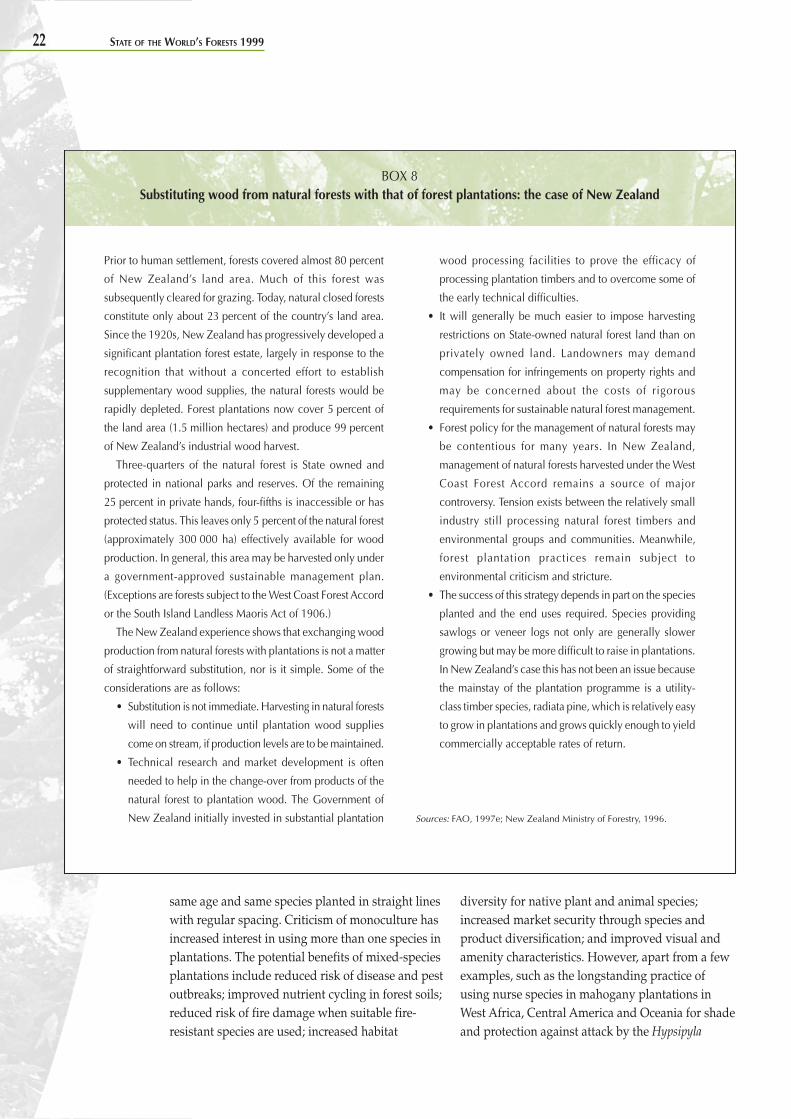
22 STATE OF THE WORLD’S FORESTS 1999
same age and same species planted in straight lineswith regular spacing. Criticism of monoculture hasincreased interest in using more than one species inplantations. The potential benefits of mixed-speciesplantations include reduced risk of disease and pestoutbreaks; improved nutrient cycling in forest soils;reduced risk of fire damage when suitable fire-resistant species are used; increased habitat
diversity for native plant and animal species;increased market security through species andproduct diversification; and improved visual andamenity characteristics. However, apart from a fewexamples, such as the longstanding practice ofusing nurse species in mahogany plantations inWest Africa, Central America and Oceania for shadeand protection against attack by the Hypsipyla
Prior to human settlement, forests covered almost 80 percent
of New Zealand’s land area. Much of this forest was
subsequently cleared for grazing. Today, natural closed forests
constitute only about 23 percent of the country’s land area.
Since the 1920s, New Zealand has progressively developed a
significant plantation forest estate, largely in response to the
recognition that without a concerted effort to establish
supplementary wood supplies, the natural forests would be
rapidly depleted. Forest plantations now cover 5 percent of
the land area (1.5 million hectares) and produce 99 percent
of New Zealand’s industrial wood harvest.
Three-quarters of the natural forest is State owned and
protected in national parks and reserves. Of the remaining
25 percent in private hands, four-fifths is inaccessible or has
protected status. This leaves only 5 percent of the natural forest
(approximately 300 000 ha) effectively available for wood
production. In general, this area may be harvested only under
a government-approved sustainable management plan.
(Exceptions are forests subject to the West Coast Forest Accord
or the South Island Landless Maoris Act of 1906.)
The New Zealand experience shows that exchanging wood
production from natural forests with plantations is not a matter
of straightforward substitution, nor is it simple. Some of the
considerations are as follows:
• Substitution is not immediate. Harvesting in natural forests
will need to continue until plantation wood supplies
come on stream, if production levels are to be maintained.
• Technical research and market development is often
needed to help in the change-over from products of the
natural forest to plantation wood. The Government of
New Zealand initially invested in substantial plantation
wood processing facilities to prove the efficacy of
processing plantation timbers and to overcome some of
the early technical difficulties.
• It will generally be much easier to impose harvesting
restrictions on State-owned natural forest land than on
privately owned land. Landowners may demand
compensation for infringements on property rights and
may be concerned about the costs of rigorous
requirements for sustainable natural forest management.
• Forest policy for the management of natural forests may
be contentious for many years. In New Zealand,
management of natural forests harvested under the West
Coast Forest Accord remains a source of major
controversy. Tension exists between the relatively small
industry still processing natural forest timbers and
environmental groups and communities. Meanwhile,
forest plantation practices remain subject to
environmental criticism and stricture.
• The success of this strategy depends in part on the species
planted and the end uses required. Species providing
sawlogs or veneer logs not only are generally slower
growing but may be more difficult to raise in plantations.
In New Zealand’s case this has not been an issue because
the mainstay of the plantation programme is a utility-
class timber species, radiata pine, which is relatively easy
to grow in plantations and grows quickly enough to yield
commercially acceptable rates of return.
Sources: FAO, 1997e; New Zealand Ministry of Forestry, 1996.
BOX 8Substituting wood from natural forests with that of forest plantations: the case of New Zealand
PART I SITUATION AND PROSPECTS FOR FOREST CONSERVATION AND DEVELOPMENT 23
insect, both experience and quantitativeinformation on the establishment and managementof such mixed-species plantations are limited.
The availability of land for forest plantations is ofgrowing concern. Private enterprise is increasinglyconscious of environmental and social issuesrelated to the establishment of large blocks of trees.The clearing of forest for plantations is reported tohave ceased in Chile, Argentina and Brazil,although it is still continuing in Indonesia and someother countries. Large blocks of unencumberedland, even of low fertility, are increasingly difficultto find, particularly in Asia where the area underforest plantations has expanded most rapidly. Thispaucity of land has led to the growing of trees forindustrial roundwood production on land outsideforests, such as farmland, where trees are eitherplanted as small blocks or integrated withagriculture in agroforestry systems. In Pakistan, forexample, 45 percent of respondents to a survey onfarm trees grew trees for timber production onirrigated farmland, which made a significantcontribution to wood supplies (Leach, 1993).
“Outgrower” schemes encourage farmers toraise trees on their own land for sale toprocessing companies. There are many suchschemes, for example Populus deltoides grown forpeeler logs in India, Albizzia falcataria grown forpulpwood in the Philippines, and Acacia mearnsiigrown for tan bark and eucalypts for pulp inSouth Africa. Under these schemes, outgrowersusually receive loans, improved planting stock,technical advice and a guaranteed price for theproduct.
Contract reforestation schemes allot plots ofpublic land to farmers or other individuals onwhich they grow trees in return for part of theprofit received from the sale of the product. Suchschemes are found mainly in Asia, for example inThailand, Indonesia and Viet Nam, supported to agreat extent through loans provided by the AsianDevelopment Bank.
The involvement of the private sector, from large-scale commercial industries to small-scaleoutgrowers, in the establishment of forestplantations throughout the world is of considerableand increasing importance. In most countriesvarious incentives in the form of public subsidies
are given for the establishment or management offorest plantations.
Lack of finances, however, may be less of aconstraint to forest plantation investment thaninsecure tenure and lack of suitable lands. In aregional study of Asia and the Pacific (Chipeta,1996), a sample of countries, donors andinternational organizations identified the mainconstraints for forestry investment (not only inforest plantations) to be inappropriate policies, poorinstitutional capacity and difficult bureaucraticprocedures. Key problems faced by manydeveloping countries in the region were weakbusiness orientation of forest administrations;bureaucratic delays; and unsuitable tenure policies,laws or practices. The respondents noted thatfarmers and rural communities, who have animportant investment potential in forestplantations, suffered from interim cash flowproblems before harvesting the tree crop and lackedaccess to credit. The future development ofplantation programmes around the world willdepend upon countries’ ability to resolve theseproblems. In addition, if plantation areas increaseas expected, efforts to ensure their sustainablemanagement will be given more emphasis. Themaintenance of productivity and plantationmanagement in general are likely in future to bemeasured against criteria and indicators ofsustainability. ◆

24 STATE OF THE WORLD’S FORESTS 1999
The environmental and social services of forestsand trees include, among others, the
conservation of biological diversity, carbon storageand sequestration for mitigation of global climatechange, soil and water conservation, provision ofemployment and recreational opportunities,enhancement of agricultural production systems,improvement of urban and peri-urban livingconditions and protection of natural and culturalheritage. These services have received increasingemphasis and, in some cases, global legalcommitment since the United Nations Conferenceon Environment and Development (UNCED).
The following section focuses on environmentaland social services provided by forests and trees infragile and/or marginal ecosystems: in drylands,on mountains and in small island states. A secondmajor topic discussed below is the role of forests inmitigating global climate change, a subject givengreater prominence with the signing of the KyotoProtocol of the Framework Convention on ClimateChange (FCCC) in 1997.
THE ROLE OF FOREST RESOURCES INFRAGILE ECOSYSTEMSThe three post-UNCED conventions – FCCC, theConvention on Biological Diversity (CBD) and theConvention to Combat Desertification (UNCCD) –are relevant to some of the environmental servicesof forests (see Part III for more detail). Concern forthe conservation of biological diversity, which arosein the 1980s and has been strongly voiced by thepublic, NGOs and the media in many countries, hasfocused attention mainly on moist tropical forests(extending more recently to temperate and borealforests) and has influenced much of the debatesurrounding forest management. UNCED’s Agenda21 and the three conventions, by giving greaterimportance to a range of environmental and socialfunctions of all forests, have been instrumental inwidening the focus from moist tropical forests toinclude forests and trees in “fragile ecosystems”,
including drylands and mountains (covered byAgenda 21’s Chapters 12 and 13, respectively).Small island ecosystems were not made the subjectof a chapter of Agenda 21, but the Programme ofAction for the Sustainable Development of SmallIsland Developing States, which was developed in1994, provides a similar international frameworkfor action.
Although forests in arid zones, in some mountainareas and on small islands generally have lowereconomic value in terms of timber resources thando humid lowland forests, they often have highenvironmental and social importance at the locallevel. These environmentally fragile areas tend tobe isolated and economically marginalized. Undersuch conditions, people generally have a relativelyhigh dependence on local forest resources forvarious goods.
Greater international emphasis on fragileecosystems and on social and environmentalaspects of the forest sector has resulted in anelevated awareness of the importance of treesoutside forests (e.g. trees in agricultural lands, thosescattered in the rural landscape and those located inurban and peri-urban environments). Theseresources have often been overlooked becauseforests have tended to dominate the attention ofnational forest administrations, have driven muchof the international forest debate in the past andhave captured the public attention in manycountries.
Mountain forests: freshwater resources and otherenvironmental benefitsMountains occupy one-fifth of the world’s landsurface and are home to one-tenth of the world’spopulation (Messerli and Ives, 1997). Large areas ofthe world’s mountain and upland areas are coveredby forest. These forests have local, regional and insome cases global value as sources of watersupplies, centres of biological diversity, providersof a range of wood and non-wood products, sites
Environmental and socialservices of forests

PART I SITUATION AND PROSPECTS FOR FOREST CONSERVATION AND DEVELOPMENT 25
for recreation and stabilizers of land againsterosion.
Global concern over water resources – reflectedin the choice of “Strategic approaches to freshwatermanagement” as the theme for the sixth session ofthe UN Commission for Sustainable Developmentin July 1998 – stems from the fact that inadequateand unsafe water supplies are aggravatingproblems of ill health and food insecurity amongincreasing numbers of people worldwide. It ispredicted that by 2025 as much as one-third of theworld’s population may suffer from watershortages (Lininger, Weingartner and Grosjean,1998).
Mountain catchment areas have a critical role inhydrology. Mountains, which have higher levels ofprecipitation and (particularly cloud forests)capture atmospheric water more effectively thanlowland areas, are the source of more than half ofthe world’s freshwater and supply all the world’smajor rivers and many smaller ones. Mountainsprovide critical storage of freshwater in lakes,wetlands and reservoirs and in winter as ice andsnow, which is later released to rivers and streams.Many streams would cease to flow altogetherduring the dry season if their headwaters did notsupply this delayed flow. In semi-arid and aridregions over 90 percent of river flow comes fromthe mountains. Although the alpine catchment ofthe Rhine River occupies only 11 percent of theriver basin, it supplies 31 percent of the annual flowand more than 50 percent of the summer flow(Price, 1998).
Mountain ecosystems are important globally ascentres of biological diversity. The greatest diversityof vascular plant species is found in mountains,notably in Costa Rica, the tropical eastern Andes,the Atlantic forest of Brazil, the eastern Himalayan-Yunnan region, northern Borneo and Papua NewGuinea (Barthlott, Lauer and Placke, 1996). Otherimportant centres are found in arid subtropicalmountains. Many of these areas are included innational protected area systems. Several are alsobiosphere reserves under the Man and theBiosphere Programme of the United NationsEducational, Scientific and Cultural Organization(UNESCO).
Major land cover and land use changes are
occurring in mountains and highlands throughoutthe world. Mountain areas in many developingcountries are characterized by a high rate ofpopulation increase and resulting land scarcity,poverty and natural resource degradation. The rateof deforestation and the degree of forestdegradation of these mountain areas areconsiderable. While deforestation of tropical rainforests remains the focus of public attention,tropical upland forests had the highest rate ofdeforestation of any biome – 1.1 percent per year –between 1980 and 1990 (FAO, 1995). Rates ofclearing are particularly high in Central America,East and Central Africa, Southeast Asia and theAndes. While deforestation in and of itself does notimply increased erosion, the risk is likely to behigher if it is followed (as it often is) byinappropriate land management (including poorcultivation practices), insufficient vegetative coverand/or lack of appropriate mechanical soilprotection measures. Decreased tree and forestcover can also contribute to shortages of fuelwoodand other wood and non-wood forest products.
The general trend in developed countries overthe past several decades has largely been in theopposite direction: mountain communities areundergoing depopulation as people move to citiesor elsewhere for better employment opportunities.In some places, permanent residents have beenreplaced with owners of second homes. Mountainareas abandoned by people and taken out ofagriculture are often recolonized by trees andshrubs. In many places the management objectivesof mountain forests are changing. Less emphasis isplaced on production of wood and non-woodproducts for local use, and more on recreation andnature conservation. These forests have newmanagement and protection needs.
Valuation of watershed protection and otherenvironmental services can help illustrate theeconomic importance of mountain areas and lendsupport for financing conservation and sustainabledevelopment efforts in mountain areas. Anenvironmental valuation study revealed that theSierra Nevada ecosystem in the United Statesproduces commodities and services valued at aboutUS$2 200 million annually, of which 61 percentcomprises water resources. Yet only minor
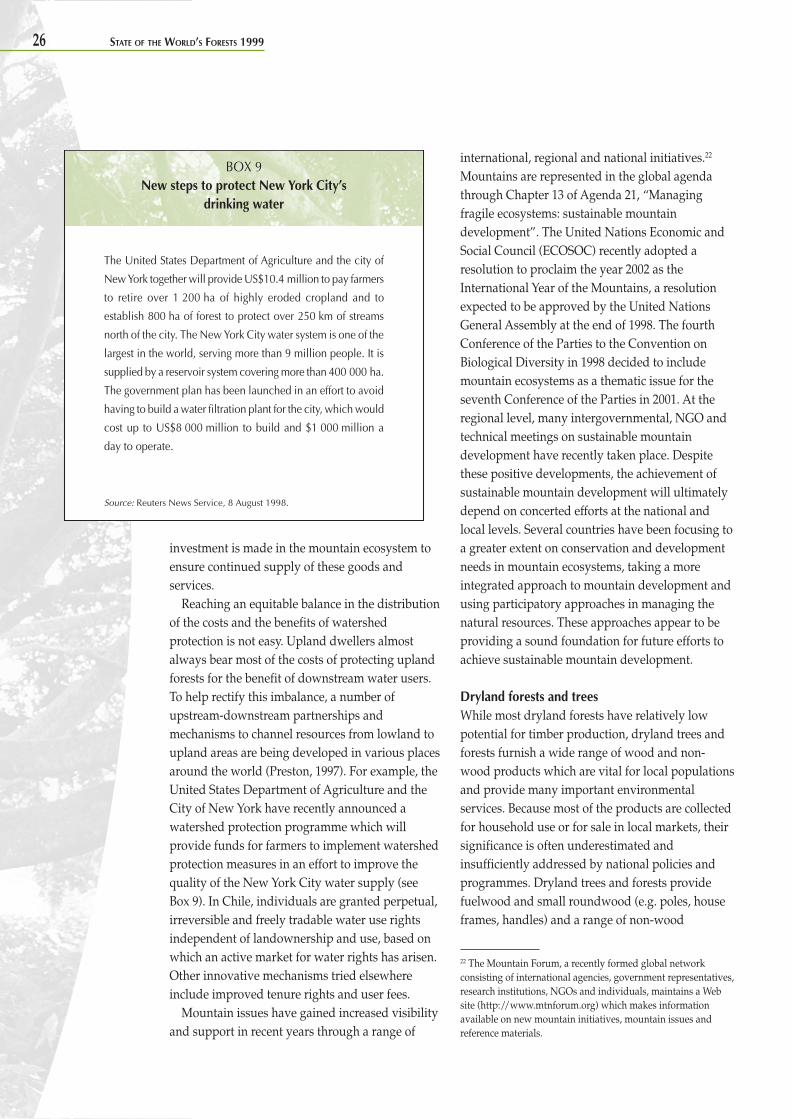
26 STATE OF THE WORLD’S FORESTS 1999
investment is made in the mountain ecosystem toensure continued supply of these goods andservices.
Reaching an equitable balance in the distributionof the costs and the benefits of watershedprotection is not easy. Upland dwellers almostalways bear most of the costs of protecting uplandforests for the benefit of downstream water users.To help rectify this imbalance, a number ofupstream-downstream partnerships andmechanisms to channel resources from lowland toupland areas are being developed in various placesaround the world (Preston, 1997). For example, theUnited States Department of Agriculture and theCity of New York have recently announced awatershed protection programme which willprovide funds for farmers to implement watershedprotection measures in an effort to improve thequality of the New York City water supply (seeBox 9). In Chile, individuals are granted perpetual,irreversible and freely tradable water use rightsindependent of landownership and use, based onwhich an active market for water rights has arisen.Other innovative mechanisms tried elsewhereinclude improved tenure rights and user fees.
Mountain issues have gained increased visibilityand support in recent years through a range of
international, regional and national initiatives.22
Mountains are represented in the global agendathrough Chapter 13 of Agenda 21, “Managingfragile ecosystems: sustainable mountaindevelopment”. The United Nations Economic andSocial Council (ECOSOC) recently adopted aresolution to proclaim the year 2002 as theInternational Year of the Mountains, a resolutionexpected to be approved by the United NationsGeneral Assembly at the end of 1998. The fourthConference of the Parties to the Convention onBiological Diversity in 1998 decided to includemountain ecosystems as a thematic issue for theseventh Conference of the Parties in 2001. At theregional level, many intergovernmental, NGO andtechnical meetings on sustainable mountaindevelopment have recently taken place. Despitethese positive developments, the achievement ofsustainable mountain development will ultimatelydepend on concerted efforts at the national andlocal levels. Several countries have been focusing toa greater extent on conservation and developmentneeds in mountain ecosystems, taking a moreintegrated approach to mountain development andusing participatory approaches in managing thenatural resources. These approaches appear to beproviding a sound foundation for future efforts toachieve sustainable mountain development.
Dryland forests and treesWhile most dryland forests have relatively lowpotential for timber production, dryland trees andforests furnish a wide range of wood and non-wood products which are vital for local populationsand provide many important environmentalservices. Because most of the products are collectedfor household use or for sale in local markets, theirsignificance is often underestimated andinsufficiently addressed by national policies andprogrammes. Dryland trees and forests providefuelwood and small roundwood (e.g. poles, houseframes, handles) and a range of non-wood
BOX 9New steps to protect New York City’s
drinking water
The United States Department of Agriculture and the city of
New York together will provide US$10.4 million to pay farmers
to retire over 1 200 ha of highly eroded cropland and to
establish 800 ha of forest to protect over 250 km of streams
north of the city. The New York City water system is one of the
largest in the world, serving more than 9 million people. It is
supplied by a reservoir system covering more than 400 000 ha.
The government plan has been launched in an effort to avoid
having to build a water filtration plant for the city, which would
cost up to US$8 000 million to build and $1 000 million a
day to operate.
Source: Reuters News Service, 8 August 1998.
22 The Mountain Forum, a recently formed global networkconsisting of international agencies, government representatives,research institutions, NGOs and individuals, maintains a Website (http://www.mtnforum.org) which makes informationavailable on new mountain initiatives, mountain issues andreference materials.
PART I SITUATION AND PROSPECTS FOR FOREST CONSERVATION AND DEVELOPMENT 27
products, including foods, medicinal products, rawmaterial for handicrafts, bushmeat and fodder.Among the many environmental services theyprovide, the most critical in many places are soilconservation (i.e. protection against erosion andmaintenance of fertility), shelter against wind andshade.
Much of the early attention on dryland forests,dating from the early 1970s, was focused onfuelwood needs. Concerns about fuelwood suppliesfor both rural and urban populations led to theestablishment of fuelwood plantations in manydeveloping countries. Poor results, however, causeda subsequent shift in strategy for meeting fuelwooddemands away from plantations and towardsimproved management of existing forest and treeresources (including encouragement of natural andassisted regeneration). Other more recent trendsinclude greater emphasis on multiple usemanagement for various wood and non-woodproducts throughout the world; agroforestrydevelopment, both crop- and animal-based systems(in Australia, China and India, for example);consolidation of participatory forest managementmodels (e.g. Burkina Faso, the Gambia and Mali);and support for production and marketingcooperatives for fuelwood and poles (e.g. BurkinaFaso, India, the Niger). These approaches haveincreasingly been institutionalized and a legal basisfor participatory management of dryland resourceshas been strengthened in many countries. Severalgovernments have been transferring responsibilityfor forest management to populations and privatepartners while maintaining an oversight role.Security of land and tree tenure and access tocommon property resources, including silvipastoralresources, have been recognized as critical issues.
FAO, the Swedish International DevelopmentAgency, the Swedish University for AgriculturalSciences and the International Cooperation Centreon Agrarian Research for Development (CIRAD-Forêt), in cooperation with many experts fromAfrica, Asia and Latin America, have documentedthe situation and latest developments in naturaldryland forest management (FAO, 1997f). Thepublication reviews the biological and ecologicalconditions of natural dryland forests in Africa, Asiaand Latin America and the processes affecting
them. It examines the silviculture and managementtechniques that are, or can be, used to conserve anddevelop them. Various participatory models usedfor involving local communities in forest resourcesmanagement and efforts to provide thecommunities with organizational and marketingsupport are also discussed.
The results of this study were discussed, alongwith other issues related to dryland conservationand forest management, at the International ExpertConsultation on the Role of Forestry in CombatingDesertification, a satellite meeting of the eleventhWorld Forestry Congress (see Part III). The meetingrecognized the need to continue gathering basicinformation on the status and management ofdryland forest resources, to adapt managementapproaches to changes brought about bydemocratization and decentralization and toprovide support to help local communities manageand benefit from these forest resources.
Management of dryland forest and tree resourcescontinues to receive significant attention at thenational level and through international efforts,including the work of the Intergovernmental Panelon Forests (IPF) and the Intergovernmental Forumon Forests (IFF) as well as the Convention toCombat Desertification (see Part III). An expertmeeting on rehabilitation of degraded forestecosystems was held in Lisbon, Portugal in June1996 in response to IPF’s recommendation thatdryland forest-related issues be further examined.The meeting made recommendations concerningthe needs for a supportive policy framework, clearand simple technical packages, environmentalplanning and precautions and adoption ofparticipatory approaches to resource management.The results of the meeting provided input to the IPFreport Fragile ecosystems affected by desertification andthe impact of air-borne pollution on forests (IPF, 1996)and were reflected in IPF’s subsequent proposalsfor action. The second session of IFF (Geneva,Switzerland, 24 August to 4 September 1998)reviewed progress in implementing IPF’s proposalsfor action, including those related to fragileecosystems affected by desertification and droughtand those regarding countries with low forestcover.
Participatory methods promoted by UNCCD and
28 STATE OF THE WORLD’S FORESTS 1999
the partnerships among populations, local andnational governments, NGOs and the donorcommunity provide important opportunities toensure that ecological and social services indrylands are considered in efforts to combatdesertification. Forest conservation anddevelopment, agroforestry and vegetative methodsof soil and water conservation have been includedin most of the national planning exercises to launchimplementation of UNCCD. Strongrecommendations have been made to coordinateUNCCD implementation and the recommendationsof IPF regarding the restoration of degraded forestecosystems and initiatives in countries of low forestcover. Expected future developments will certainlyconfirm further integration of forest activities indesertification control, strengthen the synergybetween the IPF and IFF processes and theimplementation of UNCCD and help reinforce linksamong various international frameworks dealingwith natural resources management in dry areas.
Role of forests and trees in small island StatesAttention to small island States has increasedsubstantially since the early 1990s. Small islandStates were given an international political identitywith the establishment of the Alliance of SmallIsland States (AOSIS) in 1991.23 The GlobalConference on the Sustainable Development ofSmall Island Developing States, held in Barbados inApril 1994, resulted in the Barbados Programme ofAction for the Sustainable Development of SmallIsland Developing States. A comprehensive reviewof the implementation of the Barbados Programmeis currently under way, and the results are to bepresented at a UN General Assembly SpecialSession in 1999. Other events in 1999 will include adonor conference with UNDP and AOSIS inFebruary and a Special Conference at MinisterialLevel for Small Island Developing Statesorganized by FAO in March. The latter conferencewill focus on the development of a Plan of Action,as follow-up to UNCED and the World FoodSummit, and on issues related to the World TradeOrganization (WTO) negotiations on agriculture,forestry and fisheries.
While forest cover on the 52 small island States
and dependent territories24 is insignificant inglobal terms (representing less than 1 percent ofthe forest area of the world), forests and trees onthese islands are extremely important for the well-being of the local inhabitants. In addition, forestresources on several islands have globalsignificance for the conservation of biologicaldiversity.
As a group, the small island States and territoriesare relatively well endowed with forests (seeTable 5 for regional figures and Tables 2 and 3 ofAnnex 3 for country figures). In 1995 it wasestimated that forests covered 34 percent of thetotal land area of these islands, compared with theworld average of 26 percent. Within the group thereis a great deal of variability; forest cover rangesfrom over 70 percent of land area in SolomonIslands and Vanuatu to under 10 percent in many ofthe smaller States and territories – particularly inOceania and Africa – and less than 1 percent inHaiti. Although average forest cover is relativelyhigh, the annual deforestation rate from 1990 to1995 was almost three times higher than the worldaverage (0.8 percent compared with 0.3 percent).The highest rates of deforestation between 1990 and1995 were found in various Caribbean islands andin the Comoros. The main causes of deforestationincluded conversion of forested land foragricultural use and for infrastructuredevelopment. Some heavily forested countries inthe South Pacific are experiencing significant forestdegradation because of heavy exploitation oftimber resources (FAO, 1997g). Deforestation andforest degradation affect not only the socio-economic well-being of local populations, but theenvironmental conditions on the islands and insurrounding marine ecosystems.
23 AOSIS is a grouping within the G77 countries composed of33 independent island nations and four low-lying coastal States,with five dependent territories as observers.24 Several definitions exist for the term “small island States”. Thediscussion here refers to the 52 developing and developed smallisland States and dependent territories that have an upper limitof land area of 50 000 km2. Most of the environmental and socialservices discussed in relation to these entities apply to smallislands in general, including those that are part of a largercountry.
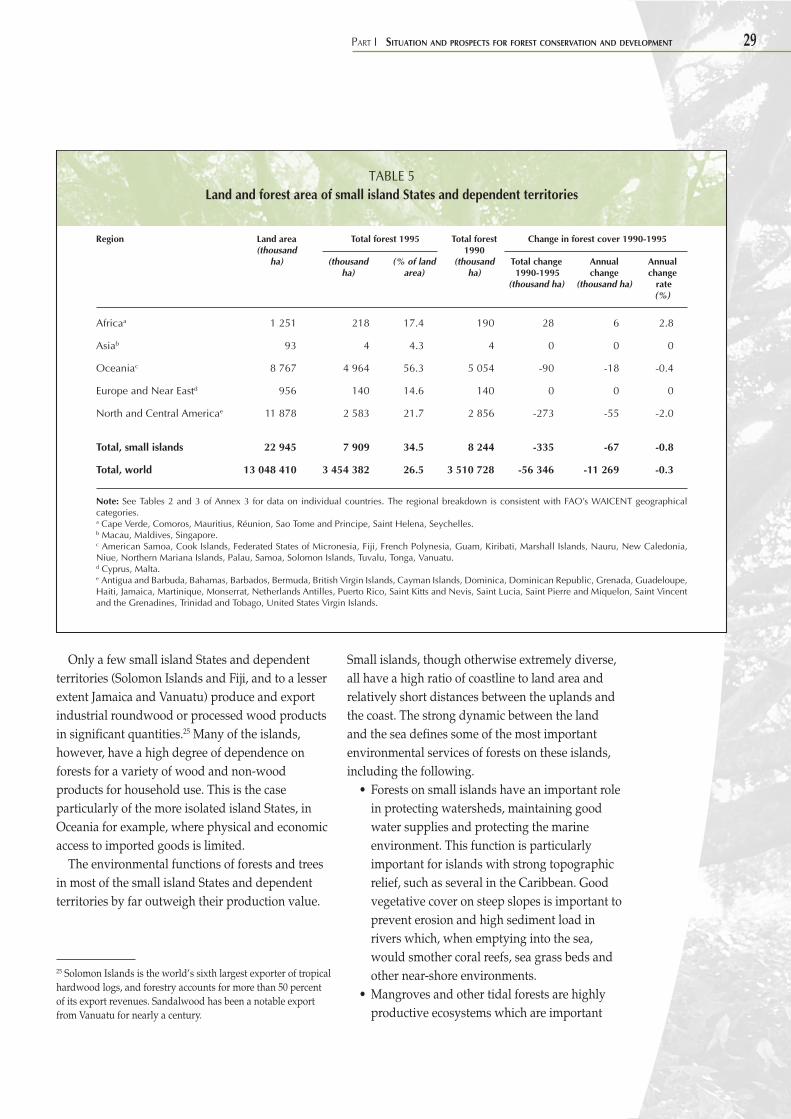
PART I SITUATION AND PROSPECTS FOR FOREST CONSERVATION AND DEVELOPMENT 29
Only a few small island States and dependentterritories (Solomon Islands and Fiji, and to a lesserextent Jamaica and Vanuatu) produce and exportindustrial roundwood or processed wood productsin significant quantities.25 Many of the islands,however, have a high degree of dependence onforests for a variety of wood and non-woodproducts for household use. This is the caseparticularly of the more isolated island States, inOceania for example, where physical and economicaccess to imported goods is limited.
The environmental functions of forests and treesin most of the small island States and dependentterritories by far outweigh their production value.
Small islands, though otherwise extremely diverse,all have a high ratio of coastline to land area andrelatively short distances between the uplands andthe coast. The strong dynamic between the landand the sea defines some of the most importantenvironmental services of forests on these islands,including the following.
• Forests on small islands have an important rolein protecting watersheds, maintaining goodwater supplies and protecting the marineenvironment. This function is particularlyimportant for islands with strong topographicrelief, such as several in the Caribbean. Goodvegetative cover on steep slopes is important toprevent erosion and high sediment load inrivers which, when emptying into the sea,would smother coral reefs, sea grass beds andother near-shore environments.
• Mangroves and other tidal forests are highlyproductive ecosystems which are important
25 Solomon Islands is the world’s sixth largest exporter of tropicalhardwood logs, and forestry accounts for more than 50 percentof its export revenues. Sandalwood has been a notable exportfrom Vanuatu for nearly a century.
TABLE 5Land and forest area of small island States and dependent territories
Region Land area Total forest 1995 Total forest Change in forest cover 1990-1995(thousand 1990
ha) (thousand (% of land (thousand Total change Annual Annualha) area) ha) 1990-1995 change change
(thousand ha) (thousand ha) rate(%)
Africaa 1 251 218 17.4 190 28 6 2.8
Asiab 93 4 4.3 4 0 0 0
Oceaniac 8 767 4 964 56.3 5 054 -90 -18 -0.4
Europe and Near Eastd 956 140 14.6 140 0 0 0
North and Central Americae 11 878 2 583 21.7 2 856 -273 -55 -2.0
Total, small islands 22 945 7 909 34.5 8 244 -335 -67 -0.8
Total, world 13 048 410 3 454 382 26.5 3 510 728 -56 346 -11 269 -0.3
Note: See Tables 2 and 3 of Annex 3 for data on individual countries. The regional breakdown is consistent with FAO’s WAICENT geographicalcategories.a Cape Verde, Comoros, Mauritius, Réunion, Sao Tome and Principe, Saint Helena, Seychelles.b Macau, Maldives, Singapore.c American Samoa, Cook Islands, Federated States of Micronesia, Fiji, French Polynesia, Guam, Kiribati, Marshall Islands, Nauru, New Caledonia,Niue, Northern Mariana Islands, Palau, Samoa, Solomon Islands, Tuvalu, Tonga, Vanuatu.d Cyprus, Malta.e Antigua and Barbuda, Bahamas, Barbados, Bermuda, British Virgin Islands, Cayman Islands, Dominica, Dominican Republic, Grenada, Guadeloupe,Haiti, Jamaica, Martinique, Monserrat, Netherlands Antilles, Puerto Rico, Saint Kitts and Nevis, Saint Lucia, Saint Pierre and Miquelon, Saint Vincentand the Grenadines, Trinidad and Tobago, United States Virgin Islands.
30 STATE OF THE WORLD’S FORESTS 1999
feeding, breeding and nursery grounds fornumerous commercial fish and shellfish,including most commercial tropical shrimp.Coastal forests also act as sediment traps forupland runoff sediments, thus protecting seagrass beds, near-shore reefs and shipping lanesfrom siltation.
• Forests in small islands are extremelyimportant for coastal protection againstcyclones, hurricanes and strong windscombined with high rainfall and storm surges.Mangroves and other coastal forests providesome protection to the coastline, and trees canshelter agricultural land from the effects of saltspray.
Perhaps the most important globalenvironmental service provided by forests on smallislands is the conservation of biological diversity,both in the forest and in associated ecosystems suchas coral reefs. In recognition of their importantheritage, most small island States are signatory tothe Convention on Biological Diversity and almostall of the Pacific nations are signatory to theConvention for the Protection of the NaturalResources and Environment of the South PacificRegion. Small islands, because of their size andtheir physical isolation from other land masses,generally have lower species diversity of plants andanimals but a higher percentage of endemism thando continental masses. For example, in theDominican Republic, Fiji, Haiti, Jamaica andMauritius more than 30 percent of the higher plantspecies are endemic. As for bird species, SolomonIslands and Fiji have 24 percent and 20 percentendemism respectively. States with ahigh percentage of endemic mammals includeMauritius (50 percent), Solomon Islands(36 percent) and Fiji (25 percent) (WRI/UNEP/UNDP/World Bank, 1996). Many of these plant andanimal species are found in forests or aredependent on them.
Many small island nations are economicallyhighly dependent on tourism. Although the forestson these small islands are rarely the primaryattraction for overseas visitors, they may contributeto the islands’ touristic appeal. Islands such asPohnpei in the Federated States of Micronesia,Dominica, Jamaica and Saint Lucia have made
efforts to develop the tourism potential of theirforest areas. The role of coastal forests inmaintaining the health of coral reefs, which in turnprotect beaches from sand erosion, is indirect butcritical to the tourism industry in some countries,for example in the Caribbean and some Pacificareas.
The many and important roles of trees andforests on small islands call for a holistic andintegrated approach to forest management whichtakes into account not only the direct benefitsobtainable from the forests but also the indirectbenefits and the links with associated naturalecosystems and other economic sectors.
FORESTS’ ROLES IN MITIGATINGGLOBAL CLIMATE CHANGEThe concentrations of greenhouse gases in theEarth’s atmosphere have increased since the onsetof the industrial revolution, largely because ofhuman activities such as fossil fuel combustion andland use conversion. The concentration of carbondioxide (CO2), the main greenhouse gas emitted byhuman activities, increased by nearly 80 partsper million by volume (ppmv) between 1880 and1994, after having fluctuated within a range ofabout 10 ppmv over the previous 1 000 years(Schimel et al., 1996). The precise impact ofincreased greenhouse gas concentrations on globalclimate patterns remains difficult to predict.However, there has been an observable increase inthe global average surface temperature, and theIntergovernmental Panel on Climate Change(IPCC) has concluded, “The balance of evidencesuggests that there is a discernible human influenceon climate” (Houghton et al., 1996).
Forests can serve as reservoirs, sinks and sourcesof greenhouse gases and thus have a significant rolein moderating the net flux of greenhouse gasesbetween the land and the atmosphere. Forests act asreservoirs by storing carbon in biomass and soils.They are sinks of carbon when their area orproductivity is increased, resulting in the uptake ofatmospheric CO2. Conversely, they are sourceswhen the burning and decay of biomass anddisturbance of soil result in emissions of CO2 andother greenhouse gases. Net CO2 emissions fromchanges in land use (primarily deforestation
PART I SITUATION AND PROSPECTS FOR FOREST CONSERVATION AND DEVELOPMENT 31
occurring mainly in tropical areas) currentlycontribute about 20 percent of global anthropogenicCO2 emissions (Schimel et al., 1996).
Various practices related to the forest sector canbe grouped according to their roles in helping toslow the accumulation of CO2 in the atmosphere(Brown et al., 1996).
• Conservation management. Existing stocks ofcarbon in forests can be maintained throughforest preservation, sustainable harvesting andincreased productivity on existing agriculturalland which can reduce the rate of deforestationand forest degradation and prevent associatedCO2 emissions.
• Storage management. Activities that increasecarbon storage in forests and forest productsinclude increasing the forest area, increasingthe forest carbon stored per unit of areathrough silvicultural measures (e.g. longerrotations, increased tree stocking densities,reduced impact logging) and extending thetime over which harvested wood remains inuse. These activities lead to a net uptake of CO2
from the atmosphere.• Substitution management. Substituting
fuelwood from sustainably managed forests forfossil fuels produces a CO2 benefit when theemissions from biomass combustion are offsetby biomass growth, and emissions from fossilfuel combustion are avoided. Substitutingwood products for more energy-demandingproducts, such as steel and concrete, canreduce the CO2 emissions from the productmanufacturing industries.
The CO2 benefits from these managementstrategies vary considerably in terms of theirtiming, magnitude and permanence. For example,the timing and magnitude of CO2 benefits fromincreased forest production (i.e. storagemanagement) depend on the rate and duration ofbiomass growth. In the case of both conservationand storage management projects, the permanenceof the CO2 benefits depends on the protection ofcarbon stocks against natural threats (e.g. forestfires, storms and diseases) and human threats (e.g.clearance of the forest and conversion to anotherland use). For example, the CO2 benefits of forestconservation may be negated if the forest is
eventually burned or overharvested, or if decreasedwood harvesting there results in more harvestingelsewhere. In the case of substitution of fuelwoodfor fossil fuels, the CO2 benefits occur at the timewhen fossil fuel combustion is avoided. Thesebenefits are considered permanent, and fossil fuelsubstitution can be achieved repeatedly withcontinuing cycles of forest harvest. The CO2 benefitsfrom wood product substitution vary according tothe type and quantity of material displaced, theuseful lifetime of the product (including recycling)and the method of wood product disposal.
There are obvious trade-offs among these threetypes of forest management strategy. For example,maximizing production of wood for storage orsubstitution management is likely to result in lowerstanding stocks of forest carbon than conservationmanagement. Conversely, maximum protection offorests can result in increased use of non-renewablefossil fuels and emission-intensive non-woodmaterials. Substitution management may be anoptimal strategy in cases where biomass growthrates are high and biomass efficiently displaceshigh-emission fuels or products. In the case ofprimary forests in regions with inefficientharvesting and manufacturing processes, forestconservation may provide more CO2 benefits thansubstitution management. It is important, however,to recognize that these management strategies neednot be mutually exclusive. For example,afforestation in combination with subsequentharvest can offer CO2 benefits when the harvestedwood either displaces fossil fuel use or offsetsdemand for wood from mature forests with highstanding biomass.
Using forests to mitigate CO2 emissions willclearly require comprehensive accounting of theassociated carbon sources and sinks over time andcomprehensive analysis of the other environmentaland socio-economic criteria that influence forestmanagement choices.
The Kyoto ProtocolIPCC has estimated, with a medium level ofconfidence, that globally, carbon sequestration fromreduced deforestation, forest regeneration andincreased development of plantations andagroforestry between 1995 and 2050 could amount
32 STATE OF THE WORLD’S FORESTS 1999
to 12 to 15 percent of fossil fuel carbon emissionsover the same period (Brown et al., 1996). However,the future use of forest management strategies tomeet national greenhouse gas reduction goals maydepend in large part on the implementation of theKyoto Protocol to the Framework Convention onClimate Change (see also Part III).
Negotiated during the third Conference of theParties to FCCC in December 1997, the KyotoProtocol, if ratified, would provide legally bindinglimits to greenhouse gas emissions by Annex IParties.26 The Kyoto Protocol makes provision foranthropogenic land use change and forestryactivities to be used to define and meet nationalemission reduction targets in the first commitmentperiod (2008 to 2012). It requires that countriesaccount for fossil fuel emissions. As a consequence,there is an incentive to substitute wood and otherbiomass for more energy-intensive materials andfossil fuels. The Kyoto Protocol also provideslimited encouragement for storage management byaccounting for verifiable changes in carbon stocksfrom afforestation and reforestation. It gives limitedencouragement for conservation activities becausecountries must report deforestation. Articles 2, 3and 6 of the Kyoto Protocol specifically deal withland use change and forestry.
• Under Article 2, each Party agrees to protectand enhance greenhouse gas sinks andreservoirs and to promote sustainable forestmanagement practices, afforestation andreforestation. This article does not appear torestrict the scope of land use change andforestry activities that may be implemented tomitigate greenhouse gas emissions.
• According to Article 3.3, “The net changes ingreenhouse gas emissions by sources andremovals by sinks resulting from directhuman-induced land use change and forestryactivities, limited to afforestation, reforestationand deforestation since 1990, measured asverifiable changes in carbon stocks in eachcommitment period, shall be used to meet thecommitments under this Article of each Party”.
This language restricts the scope of land usechange and forestry activities that may be usedto meet national emission reductioncommitments.
• Article 3.4 states that the meeting of the Partiesshall “decide on which additional human-induced activities [besides afforestation,reforestation and deforestation] related tochanges in greenhouse gas emissions andremovals by sinks in the agricultural soil andland use change and forestry categories shallbe added to, or subtracted from, the assignedamount for Parties included in Annex I”. Thisdecision will be taken by the first meeting ofthe Parties after the Kyoto Protocol has enteredinto force, based on the findings of a specialreport that IPCC will prepare by the year 2000.
• Under Article 3.7, those Parties with netgreenhouse gas emissions from land usechange and forestry in 1990 are instructed toinclude those net emissions in their 1990 base-year emissions inventory. However, thoseParties with net sequestration from land usechange and forestry in 1990 are not to includethis net sequestration in their 1990 inventory.Therefore, Parties may receive credit forreducing the rate of emissions from land usechange activities, but they are not penalized ifthe rate of sequestration resulting from theseactivities is decreasing over time.
• Article 6 grants Annex I Parties the ability totransfer to, or acquire from, any other Annex IParty emission reduction units resulting fromprojects aimed at reducing anthropogenicemissions by sources or enhancinganthropogenic removals by sinks. Theseemission reduction units may be used to meetnational commitments. The emissionreductions or sink enhancements from theseprojects must be additional to those that wouldoccur in the absence of these projects.
Article 12 provides for a Clean DevelopmentMechanism (CDM) which enables Annex I andnon-Annex I Parties to undertake greenhouse gasemission reduction projects in non-Annex Icountries. These projects must also achieve othersustainable development goals. The certifiedemission reductions produced by these projects
26 The Annex I Parties include developed countries and countrieswith economies in transition.
PART I SITUATION AND PROSPECTS FOR FOREST CONSERVATION AND DEVELOPMENT 33
may be used by Annex I Parties to meet theirnational commitments. However, it is not specifiedwhich emission reduction activities are included inCDM or whether CDM includes projects to increasecarbon sequestration. The emission reductions fromthese projects must be additional to those thatwould occur in the absence of these projects.
The language used in the Kyoto Protocol isundergoing intense scrutiny and many key issueshave yet to be resolved. IPCC was asked to preparea special report on carbon emissions from sourcesand removals by sinks from land use, land usechange and forestry, to address issues such as thefollowing.
• The Revised 1996 IPCC guidelines for nationalgreenhouse gas inventories (IPCC, 1996) have notbeen designed for land use change and forestryinventories restricted to direct, human-inducedactivities since 1990, such as afforestation,reforestation and deforestation. Therefore,additional work may be needed to put in placemodalities, rules and guidelines forimplementing the land use change and forestryprovisions of the Kyoto Protocol.
• The greenhouse gas benefits from land usechange and forestry activities may involve ahigher level of uncertainty and a lower level ofpermanence than the greenhouse gas benefitsfrom activities in other sectors, particularly theenergy sector. Therefore, some Parties haveexpressed concern about relying on emissionreductions in the land use change and forestrysector.
• Further work is needed to clarify which landuse change and forestry activities may qualifyfor inclusion in domestic greenhouse gasmitigation programmes, in the exchange ofproject-based greenhouse gas emissionreductions among Annex I Parties and in CDMprojects under the Kyoto Protocol.
• Key terms in the Kyoto Protocol, such as“reforestation” and “forest”, are to be defined.
Prospects for forests to provide additional carbonbenefitsIt is clear that fossil fuel combustion accounts forthe majority of CO2 emissions globally, that it willcontinue to do so in the future and that the primary
response for reducing net CO2 emissions will haveto come from controlling the release of fossil fuelcarbon. Nevertheless, forest management decisionscan be cost-effective means of reducing netemissions, either by diminishing the contribution offorests to global net emissions or by enhancing theirimportance as carbon sinks. The long-termcontribution of forests for mitigating climatechange will be to provide renewable materials andfuels that reduce reliance on fossil fuels, while stillmaintaining the role of forests as carbon reservoirs.
Analyses to date suggest that there may be someinexpensive opportunities to reduce current netCO2 emissions through forest managementactivities and that these projects could haveadditional environmental benefits throughprotection of biological diversity, protection ofwatersheds, etc. If forestry projects can beintegrated with the social, cultural anddevelopmental needs of developed and developingcountries, they could offer very attractiveopportunities for providing carbon benefits,especially in the short term, while alternativeenergy system options are developed and theunderstanding of the costs of global climate changeimproves. The magnitude of benefits availablethrough forest-sector activities will depend on theamount of land available, improvements of forestproductivity and technical developments in theefficiency with which forest products are harvestedand used. ◆
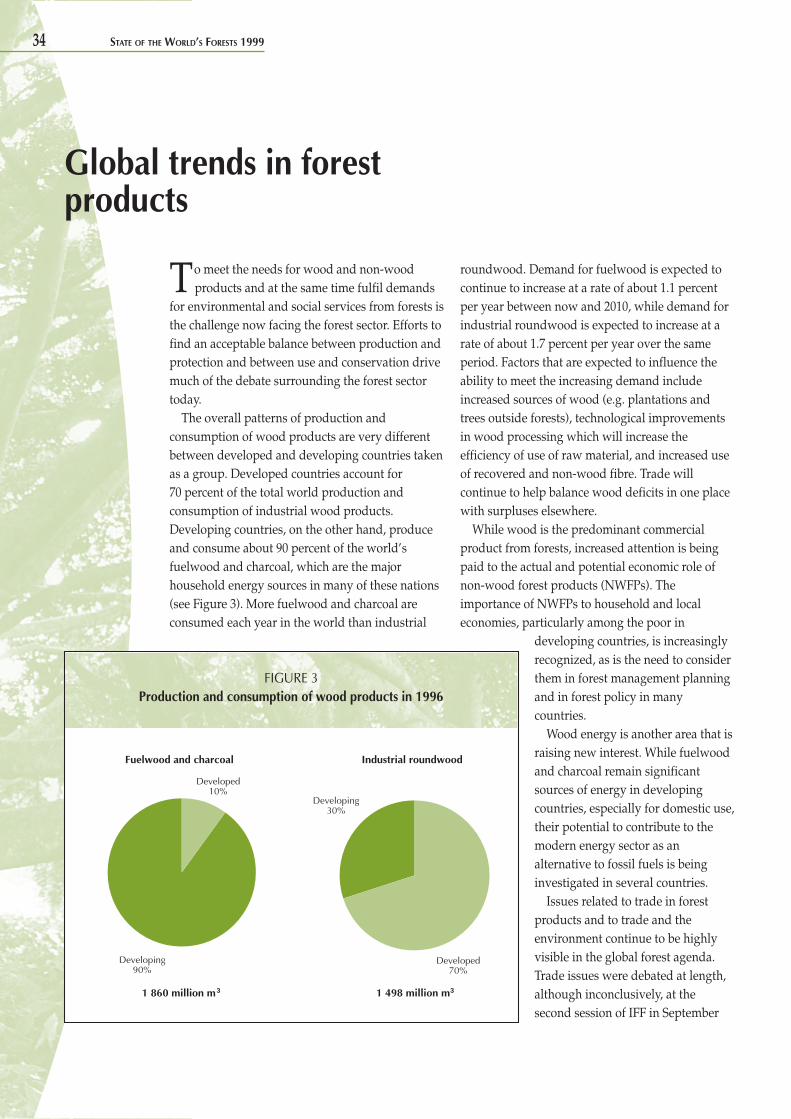
34 STATE OF THE WORLD’S FORESTS 1999
To meet the needs for wood and non-woodproducts and at the same time fulfil demands
for environmental and social services from forests isthe challenge now facing the forest sector. Efforts tofind an acceptable balance between production andprotection and between use and conservation drivemuch of the debate surrounding the forest sectortoday.
The overall patterns of production andconsumption of wood products are very differentbetween developed and developing countries takenas a group. Developed countries account for70 percent of the total world production andconsumption of industrial wood products.Developing countries, on the other hand, produceand consume about 90 percent of the world’sfuelwood and charcoal, which are the majorhousehold energy sources in many of these nations(see Figure 3). More fuelwood and charcoal areconsumed each year in the world than industrial
roundwood. Demand for fuelwood is expected tocontinue to increase at a rate of about 1.1 percentper year between now and 2010, while demand forindustrial roundwood is expected to increase at arate of about 1.7 percent per year over the sameperiod. Factors that are expected to influence theability to meet the increasing demand includeincreased sources of wood (e.g. plantations andtrees outside forests), technological improvementsin wood processing which will increase theefficiency of use of raw material, and increased useof recovered and non-wood fibre. Trade willcontinue to help balance wood deficits in one placewith surpluses elsewhere.
While wood is the predominant commercialproduct from forests, increased attention is beingpaid to the actual and potential economic role ofnon-wood forest products (NWFPs). Theimportance of NWFPs to household and localeconomies, particularly among the poor in
developing countries, is increasinglyrecognized, as is the need to considerthem in forest management planningand in forest policy in manycountries.
Wood energy is another area that israising new interest. While fuelwoodand charcoal remain significantsources of energy in developingcountries, especially for domestic use,their potential to contribute to themodern energy sector as analternative to fossil fuels is beinginvestigated in several countries.
Issues related to trade in forestproducts and to trade and theenvironment continue to be highlyvisible in the global forest agenda.Trade issues were debated at length,although inconclusively, at thesecond session of IFF in September
Global trends in forestproducts
FIGURE 3Production and consumption of wood products in 1996
Fuelwood and charcoal
1 498 million m3
Industrial roundwood
Developed10%
Developing90%
Developing30%
Developed70%
1 860 million m3
PART I SITUATION AND PROSPECTS FOR FOREST CONSERVATION AND DEVELOPMENT 35
1998. A number of developments have occurred inthe past two years regarding certification of forestproducts, one of the most complex and, in manycases, controversial issues in the forest sector. TheAsian economic crisis has had the most unexpectedand disruptive impact on forest products trade ofany development in the 1997-1998 period.
NON-WOOD FOREST PRODUCTS:A LOOK AT MEDICINAL PLANTSPeople have innumerable uses for the many plantand animal resources found in forests. Althoughseveral species have been domesticated andintegrated into agricultural production schemesover the centuries, others, referred to as non-woodforest products, continue to be gathered from wildsources. In many parts of the world, NWFPsprovide food (bushmeat, mushrooms, fruits, nuts,animal fodder), construction materials, fibres(bamboo, rattan, palm leaves), medicines and otherhealth care products and goods of religious orspiritual significance. While the bulk of theseproducts are gathered for household use or for salein local markets, some enter national andinternational trade in significant quantities. NWFPproduction is often characterized by a large numberof suppliers, each with a small scale of operationand a lack of industrial development. A globaloverview of major NWFPs, summarizing knowninformation about their production status, valueand trade and factors affecting their developmentwas provided in the State of the World’s Forests 1997(FAO, 1997d).
Various issues related to NWFPs are currentlybeing discussed in regional and international fora.One issue relates to the need to ensure theconservation of forest-based biological diversitywhile still ensuring equitable access to forestresources (including NWFPs), particularly by localpeople. The development of appropriate and fairpricing methodologies for NWFPs (includingroyalties on intellectual property rights) is anotherneed. Difficult access and/or insecure tenure rightsto the resources and the absence of relevant marketinformation, including fair market access, areamong the key constraints faced by the subsector.
Medicinal plants are among the most valuable of
the NWFPs. Not all, but most medicinal plantsgathered from the wild come from forest lands.Their high value can provide an additionalincentive for sustainable management of forestresources and for the conservation of specifichabitats.
Use of medicinal plantsMore than 10 000 plant species (of both forest andnon-forest origins) are used for medicinal purposes,mainly as traditional medicines. WHO hasestimated that 80 percent of people in developingcountries rely on traditional medicines, which aremostly plant derived, for primary health care. Theuse of medicinal plants is by no means restricted todeveloping countries and traditional medicine,however; at least 25 percent of the drugs in themodern pharmacopoeia are derived from plants.Many others are synthetic analogues built onprototype compounds isolated from plants. Thedemand for medicinal plants is increasing in bothdeveloping and developed countries.
Collection and production of medicinal plantsThe majority of plant material used for medicinalpurposes comes from developing countries. Most ofit is gathered from the wild, mainly from forests, forhousehold use. Few medicinal species arecultivated, because the low price of materialharvested from the wild still makes cultivationfinancially unattractive. It is expected that more ofthese species will be cultivated in the future,however, because sources of wild material arediminishing and cultivated material is farpreferable to wild material for large-scaleproduction of commercial drugs for reasons ofefficiency and quality control. Standardization,whether for pure products, extracts or crude drugs,is critical and will become increasingly so as qualityrequirements continue to become more stringentthroughout the world.
Wild sources of medicinal plants will continue tobe important at least in the short term, and willremain so for much longer in developing areas ofthe world and for the poorer sectors of society. Inaddition, some species will be difficult to cultivate,and synthesis of some active ingredients will be
36 STATE OF THE WORLD’S FORESTS 1999
problematic. It is therefore critical to ensure acombination of cultivation and/or sustainable wildharvesting of medicinal plants. Only the latter canserve, through sound management of theseresources, to provide additional incentives toconserve the habitats with the broadest geneticvariation.
Not only are millions of people dependent onthese plants for health care, but harvestingmedicinal plant material for commercial purposesmay be one of the few opportunities for paidemployment or for earning supplementary incomein some remote rural areas. When a speciesbecomes commercially interesting, however,control over the resource may be transferred to aconcessionaire system (involving individuals, acompany or a kind of “extractive reserve”community scheme) or a trading board, oftendepriving some local people of access to theresource, either for household use or as a source ofincome.
Policy and regulation of trade in medicinal plantsMost end users are unaware of the extent to whichthe expanding demand in medicinal plants isthreatening the survival of several plant species.The prices paid to gatherers tend to be very low,and resources are frequently openly accessible orcommon property. As a result, commercial plantgatherers often mine the resources rather thanmanaging them. The species most vulnerable toextinction are those that are in high demand,reproduce slowly and have specific habitatrequirements and a limited distribution (e.g.Warburgia salutaris in eastern and southern Africa).There is also a clear relation between the part of theplant collected or the collection method used andthe impact of harvesting. For example, heavycommercial exploitation of the bark of Prunusafricana, which is used in an anti-cancer drug, hasdevastated populations of this tree throughouthumid Africa.
Most countries have few or no regulationscontrolling the collection and trade of material fromthe wild, and exisiting national legislation may beinsufficient or ineffective. In Bhutan, laws passed toban collection of specific plants effectively
increased their price and stimulated illegalharvesting, which virtually drove them toextinction locally. The introduction of harvestingrestrictions or bans in one country can resultin overharvesting in other exportingcountries.
Most medicinal plants are traded in local ornational markets; relatively few are tradedinternationally in significant volume. There are fewreliable global or even national data on productionand trade of wild harvested medicinal plants, and itis difficult to distinguish wild from cultivatedsources in existing trade statistics on medicinalplant material. According to data compiled fromthe COMTRADE database of the United NationsConference on Trade and Development (UNCTAD),the total value of medicinal plant exports in 1995from approximately 100 countries amounted toUS$880 million. Regionally, Asia leads in the supplyand consumption of medicinal plants, followed byNorth America. Germany dominates the Europeantrade in medicinal plants, importing plant materialfrom over 100 countries and re-exporting one-thirdof it as finished products.
International trade in certain medicinal plants ismonitored and regulated mainly through theConvention on International Trade in EndangeredSpecies of Wild Fauna and Flora (CITES). Severalnational and international initiatives bygovernmental and/or non-governmentalorganizations are emerging to address theunsustainable rates of exploitation of manymedicinal plant species. At the global level, amongthe most significant are the Medicinal PlantSpecialist Group of IUCN and TRAFFIC, a wildlifetrade monitoring programme of WWF and IUCN,which closely cooperates with the CITESSecretariat. TRAFFIC has recently launched apriority programme on medicinal wildlife trade,whose objectives for the 1997-2000 period are: toidentify and predict possible threats posed to wildspecies by the medicinal trade and to indicatepossible solutions; to examine existing local,national and international regulatory measures forwildlife medicinals and to seek modifications asrequired to assist in maintaining trade withinsustainable levels; and to promote enforcement of

PART I SITUATION AND PROSPECTS FOR FOREST CONSERVATION AND DEVELOPMENT 37
and adherence to regulatory measures intended toconserve wild species in trade.
Clearly, achieving sustainable management ofNWFPs in general, and medicinal plants inparticular, will be a continuing challenge requiringconcerted local, national and international action.
CONTRIBUTION OF WOODFUELS TOTHE ENERGY SECTORMuch of the wood harvested in the world each yearis used for energy production. Of the estimated3 350 million cubic metres of wood harvested in1995, about 2 100 million cubic metres, or63 percent, was used as woodfuel.27 While indeveloped countries only 33 percent of the woodproduced was used for energy purposes, indeveloping countries woodfuels accounted for81 percent (91 percent in Africa, 82 percent in Asiaand 70 percent in Latin America) of the woodharvested. The figures illustrate the importance ofwoodfuels in total wood production and theirrelevance for the forestry sector.28
Woodfuels remain significant sources of energyin developing countries, especially in the rural anddomestic sectors. In recent years, however, theyhave been attracting attention as environmentallyfriendly modern energy carriers. Changes in energypolicies have favoured the development of woodenergy systems, and new biomass energytechnologies are improving the economic feasibilityof wood energy, particularly in countries that areheavily forested and have well-established woodprocessing industries. The environmental costs offossil fuels are also making woodfuels moreattractive.
Role of woodfuels in the forest and energy sectorsWoodfuels consist of fuelwood, charcoal and blackliquor (a by-product of pulp and paper). Table 6
shows the consumption of different woodfuel typesby region and provides a picture of forestry’scontribution to the energy sector.
Woodfuels account for an estimated 7 percent ofthe world’s total energy supply. In developingcountries, however, where fuelwood is a majorsource of fuel for household use, the average shareof woodfuels in total energy use is 15 percent. In34 developing countries, fuelwood and charcoalsupply more than 70 percent of national energydemand. Woodfuels constitute the major source ofenergy for most countries of sub-Saharan Africa,Central America and continental Southeast Asia.While fuelwood is the predominant form of woodenergy used in rural areas of developing countries,charcoal remains a significant source of energy formany African, Asian and Latin American countries,mainly for urban households.
Woodfuels account for only 2 percent of the totalenergy used in developed countries. This figure,however, conceals great differences in use at thenational and subnational levels. For example, inEurope, relatively small quantities of woodfuel areused in Belgium, Germany and the UnitedKingdom, while large amounts are consumed in thedensely forested countries of Austria, Finland andSweden. In Finland, wood energy supplies anestimated 17 percent of the national energy demand(FAO, 1997h). Black liquor accounts for a highproportion of the total woodfuels used in mostdeveloped countries; it is used by large pulp andpaper industries to meet their needs for heat andpower.
Recent developments in wood energyWoodfuel consumption in developing countries hasincreased steadily along with growth in population,although the share of woodfuels in the nationalenergy balance of these countries has progressivelydiminished as a result of the increased use of fossilfuels such as oil, coal and gas. Fossil fuels havecontinued to fulfil most of the increased demandfor energy in most developed countries.
Actions by many countries to deregulate,liberalize and privatize energy markets over thepast two decades have stimulated competitionamong energy suppliers and have presented new
27 The difference between this figure and that provided inFigure 1 results from the inclusion of black liquor derived fromwood in the calculation of the amount of wood used for energygeneration.28 The source of these figures is FAO’s Wood Energy InformationSystem (FAO-WEIS). For additional details on the figures refer tothe Web site: http://www-data.fao.org/waicent/faoinfo/forestry/energy/feforum.htm.
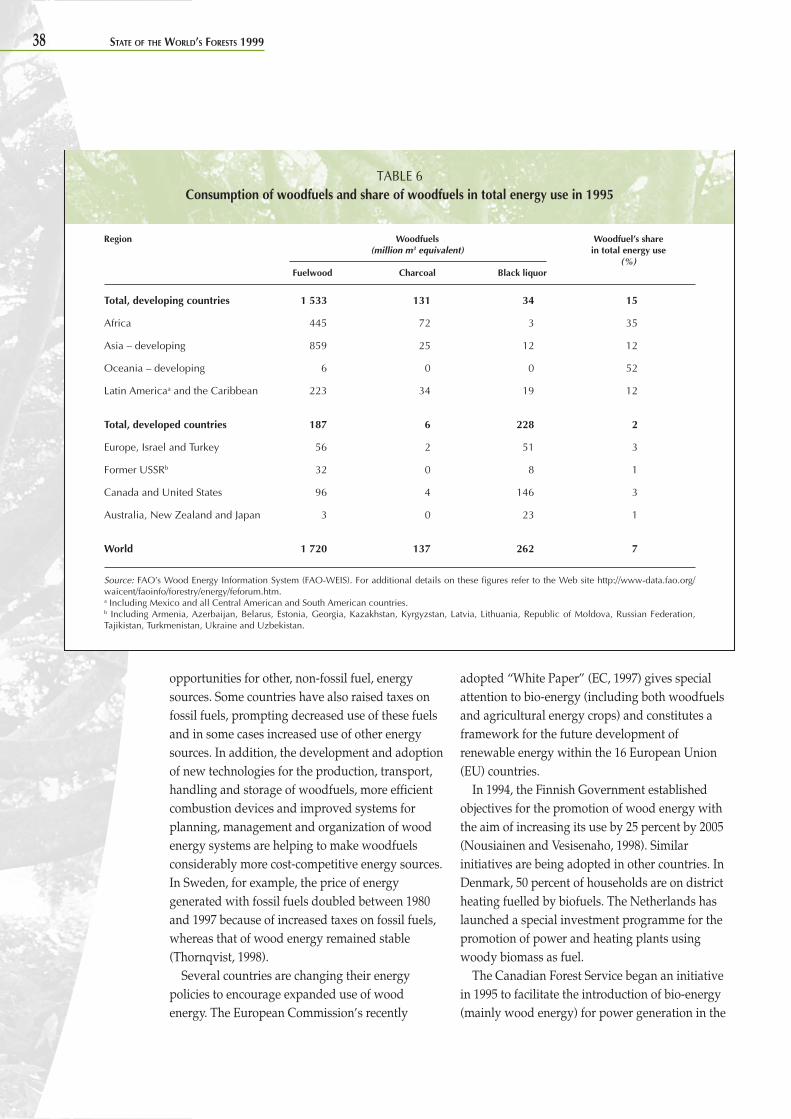
38 STATE OF THE WORLD’S FORESTS 1999
opportunities for other, non-fossil fuel, energysources. Some countries have also raised taxes onfossil fuels, prompting decreased use of these fuelsand in some cases increased use of other energysources. In addition, the development and adoptionof new technologies for the production, transport,handling and storage of woodfuels, more efficientcombustion devices and improved systems forplanning, management and organization of woodenergy systems are helping to make woodfuelsconsiderably more cost-competitive energy sources.In Sweden, for example, the price of energygenerated with fossil fuels doubled between 1980and 1997 because of increased taxes on fossil fuels,whereas that of wood energy remained stable(Thornqvist, 1998).
Several countries are changing their energypolicies to encourage expanded use of woodenergy. The European Commission’s recently
adopted “White Paper” (EC, 1997) gives specialattention to bio-energy (including both woodfuelsand agricultural energy crops) and constitutes aframework for the future development ofrenewable energy within the 16 European Union(EU) countries.
In 1994, the Finnish Government establishedobjectives for the promotion of wood energy withthe aim of increasing its use by 25 percent by 2005(Nousiainen and Vesisenaho, 1998). Similarinitiatives are being adopted in other countries. InDenmark, 50 percent of households are on districtheating fuelled by biofuels. The Netherlands haslaunched a special investment programme for thepromotion of power and heating plants usingwoody biomass as fuel.
The Canadian Forest Service began an initiativein 1995 to facilitate the introduction of bio-energy(mainly wood energy) for power generation in the
TABLE 6Consumption of woodfuels and share of woodfuels in total energy use in 1995
Region Woodfuels Woodfuel’s share(million m3 equivalent) in total energy use
(%)Fuelwood Charcoal Black liquor
Total, developing countries 1 533 131 34 15
Africa 445 72 3 35
Asia – developing 859 25 12 12
Oceania – developing 6 0 0 52
Latin Americaa and the Caribbean 223 34 19 12
Total, developed countries 187 6 228 2
Europe, Israel and Turkey 56 2 51 3
Former USSRb 32 0 8 1
Canada and United States 96 4 146 3
Australia, New Zealand and Japan 3 0 23 1
World 1 720 137 262 7
Source: FAO’s Wood Energy Information System (FAO-WEIS). For additional details on these figures refer to the Web site http://www-data.fao.org/waicent/faoinfo/forestry/energy/feforum.htm.a Including Mexico and all Central American and South American countries.b Including Armenia, Azerbaijan, Belarus, Estonia, Georgia, Kazakhstan, Kyrgyzstan, Latvia, Lithuania, Republic of Moldova, Russian Federation,Tajikistan, Turkmenistan, Ukraine and Uzbekistan.
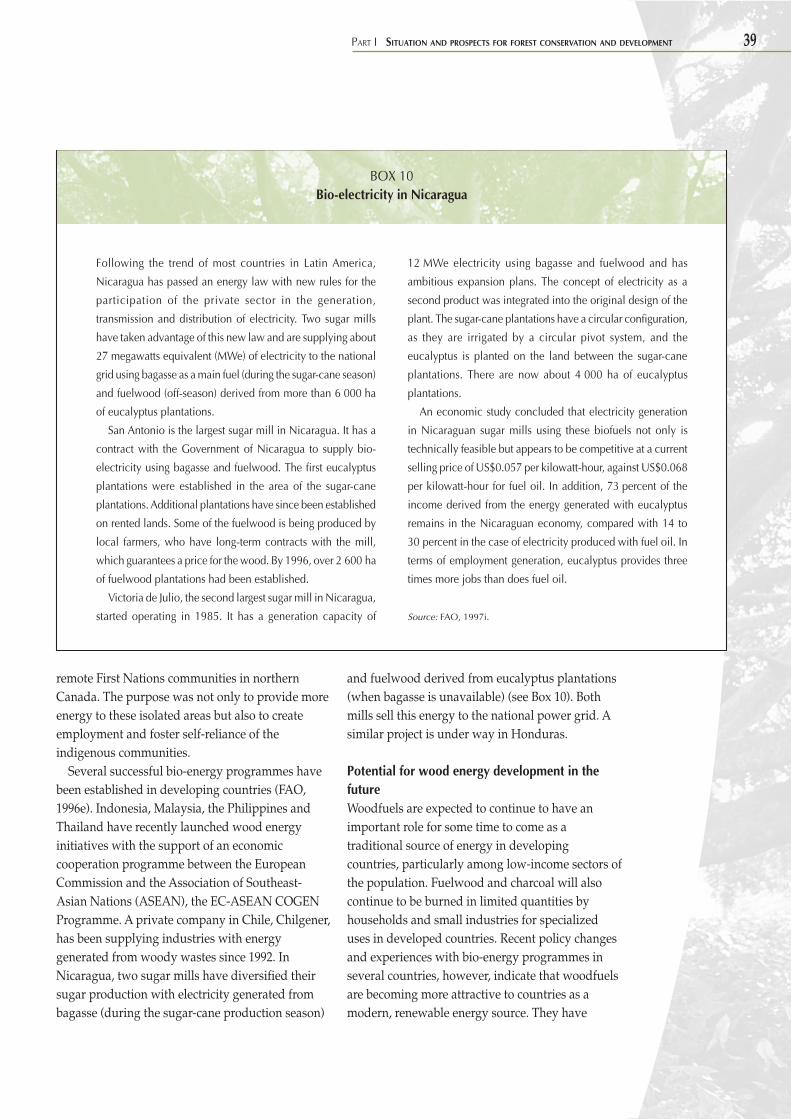
PART I SITUATION AND PROSPECTS FOR FOREST CONSERVATION AND DEVELOPMENT 39
remote First Nations communities in northernCanada. The purpose was not only to provide moreenergy to these isolated areas but also to createemployment and foster self-reliance of theindigenous communities.
Several successful bio-energy programmes havebeen established in developing countries (FAO,1996e). Indonesia, Malaysia, the Philippines andThailand have recently launched wood energyinitiatives with the support of an economiccooperation programme between the EuropeanCommission and the Association of Southeast-Asian Nations (ASEAN), the EC-ASEAN COGENProgramme. A private company in Chile, Chilgener,has been supplying industries with energygenerated from woody wastes since 1992. InNicaragua, two sugar mills have diversified theirsugar production with electricity generated frombagasse (during the sugar-cane production season)
and fuelwood derived from eucalyptus plantations(when bagasse is unavailable) (see Box 10). Bothmills sell this energy to the national power grid. Asimilar project is under way in Honduras.
Potential for wood energy development in thefutureWoodfuels are expected to continue to have animportant role for some time to come as atraditional source of energy in developingcountries, particularly among low-income sectors ofthe population. Fuelwood and charcoal will alsocontinue to be burned in limited quantities byhouseholds and small industries for specializeduses in developed countries. Recent policy changesand experiences with bio-energy programmes inseveral countries, however, indicate that woodfuelsare becoming more attractive to countries as amodern, renewable energy source. They have
Following the trend of most countries in Latin America,
Nicaragua has passed an energy law with new rules for the
participation of the private sector in the generation,
transmission and distribution of electricity. Two sugar mills
have taken advantage of this new law and are supplying about
27 megawatts equivalent (MWe) of electricity to the national
grid using bagasse as a main fuel (during the sugar-cane season)
and fuelwood (off-season) derived from more than 6 000 ha
of eucalyptus plantations.
San Antonio is the largest sugar mill in Nicaragua. It has a
contract with the Government of Nicaragua to supply bio-
electricity using bagasse and fuelwood. The first eucalyptus
plantations were established in the area of the sugar-cane
plantations. Additional plantations have since been established
on rented lands. Some of the fuelwood is being produced by
local farmers, who have long-term contracts with the mill,
which guarantees a price for the wood. By 1996, over 2 600 ha
of fuelwood plantations had been established.
Victoria de Julio, the second largest sugar mill in Nicaragua,
started operating in 1985. It has a generation capacity of
12 MWe electricity using bagasse and fuelwood and has
ambitious expansion plans. The concept of electricity as a
second product was integrated into the original design of the
plant. The sugar-cane plantations have a circular configuration,
as they are irrigated by a circular pivot system, and the
eucalyptus is planted on the land between the sugar-cane
plantations. There are now about 4 000 ha of eucalyptus
plantations.
An economic study concluded that electricity generation
in Nicaraguan sugar mills using these biofuels not only is
technically feasible but appears to be competitive at a current
selling price of US$0.057 per kilowatt-hour, against US$0.068
per kilowatt-hour for fuel oil. In addition, 73 percent of the
income derived from the energy generated with eucalyptus
remains in the Nicaraguan economy, compared with 14 to
30 percent in the case of electricity produced with fuel oil. In
terms of employment generation, eucalyptus provides three
times more jobs than does fuel oil.
Source: FAO, 1997i.
BOX 10Bio-electricity in Nicaragua
40 STATE OF THE WORLD’S FORESTS 1999
potential to become more competitive with fossilfuels in certain situations, both for economicreasons (as fast-growing fuelwood plantations,thinnings from timber plantations and residuesfrom forest industries serve as locally available andinexpensive sources of energy) and forenvironmental reasons (related to efforts tomitigate global warming). The FrameworkConvention on Climate Change has recognized thepotential role of woodfuels as part of asubstitution strategy to reduce emissions of CO2
from fossil fuels (see discussion of forests’ role inmitigating global climate change, above). TheKyoto Protocol of the FCCC, if ratified, has thepotential to play a catalytic role in the furtherdevelopment of wood energy.
In response to these recent developments, boththe forest and energy sectors are likely to giveincreased consideration to woodfuels in the future.Improved planning will depend in part on a soundinformation base, but at present the globalinformation on woodfuels is extremely weak (seeBox 11). Continued efforts to improve informationcollection and analysis will be essential, as will befurther assessment of the relative costs and benefitsof woodfuels, fossil fuels and alternative sources offuels as economic conditions and environmentalcommitments evolve.
TRADE IN FOREST PRODUCTS:CURRENT ISSUES AND INFLUENCES29
Growth in the production of tropical forestproducts has slowed over the past three to fiveyears. The export of most products has followed asimilar trend; export volumes of tropical logs,sawnwood and wood-based panels have decreased.Some of the trends reflect major structural changesthat are unlikely to be reversed, while others are aresponse to normal short-term changes in marketconditions. Factors influencing the changes include:
• increasing domestic consumption in importantdeveloping producer countries;
• reduced harvest levels because of bothenvironmental concerns and export marketconditions;
• a shift in exports from logs, and to a lesserextent sawnwood, towards higher-valueproducts;
• most recently, marked reductions in demand inAsia, especially in Japan.
Asian economic crisisThe most dramatic of the short-term effects beganin mid-1997 when a number of key Asian currencies
There are major weaknesses and gaps in information on
woodfuels, which make planning for current woodfuel
production and use and modelling of future wood energy
scenarios problematic. Lack of good data on woodfuel
production and flows makes it difficult to address crucial issues
on woodfuel supply, trade, use and substitution. The problems
stem from methodologies and weak national capabilities in
woodfuel data collection, compilation and presentation. The
use of different terms, definitions and units makes it extremely
hard to exchange and compare information available from
different agencies at the national and international levels.
Various regional and international organizations – including
FAO, the International Energy Agency (IEA), the Asian Institute
of Technology (AIT), the Latin American Energy Organization
(OLADE) and the European Statistical Office (EUROSTAT) –
collect and disseminate data on fuelwood and charcoal
production and use. To enable comparison of national and
international statistics on woodfuels, FAO, in conjunction with
other relevant agencies, is now working on the development
of unified wood energy terminology and conversion factors.
This undertaking, combined with ongoing efforts to strengthen
national capabilities in the collection and analysis of woodfuel
data, should improve the quality and availability of information
on woodfuels.
BOX 11Status of information on woodfuels and efforts to improve it
29 All figures quoted in this section are from various issues of theFAO Yearbook of Forest Products, FAO, Rome.
PART I SITUATION AND PROSPECTS FOR FOREST CONSERVATION AND DEVELOPMENT 41
suffered significant depreciation, signalling thebeginning of what is now recognized as a majorrecession. In May 1998 the currencies of Malaysia,the Philippines, the Republic of Korea and Thailandwere trading at about two-thirds their value of oneyear before. The Indonesian rupiah was then worth25 percent of its May 1997 value. Major economicand structural problems became evident in most ofthese countries as liquidity tightened and majorrecessionary conditions took hold.
Key variables determining the effect of theeconomic crisis on trade in forest products includedthe dramatic changes in currency relativities; theextent to which Japan, the dominant importer, wasaffected by the recession; and the effects of the crisisin other regions. Until about September 1998, therecession was confined largely to the Asia and thePacific region, but by then there were signs that theeffects were beginning to extend to manyother regions. The major impacts on forestryhave been:
• overall reduced demand for all forest products,affecting most significantly China, Japan, theRepublic of Korea and Thailand;
• increased competitiveness of affected exportingcountries (including Indonesia and Malaysia)through exchange rate depreciation, but in theface of reduced demand;
• falling prices for forest products throughoutthe region;
• reduced earnings in the forestry sectorresulting in closure of mills, reduced harvestsand workforce lay-offs.
These effects have spread outside Asia to anumber of countries that have heavy tradedependence on Asian markets or are in competitionwith them.
The Asian crisis is of considerable importance todeveloping countries’ trade in forest products. Mostexports (by value) from developing countries arefrom Asian countries, which dominate developingcountry exports of wood-based panels, logs,sawnwood and paper products. South Americancountries, however, are the major developingcountry exporters of wood pulp.
Since Asia accounts for about 80 percent oftropical wood exports and more than 70 percent oftropical wood imports by value (Japan alone
accounted for 42 percent of tropical wood importsin 1996), the Asian crisis is likely to disrupt trade intropical wood products more severely than in non-tropical wood products. Weak demand in keymarkets and disruptions in key producer countriesare likely to affect this trade most severely.
An important effect of the Asian difficulties hasbeen changes to Indonesian forest policies resultingfrom the Indonesian Government’s efforts to meetInternational Monetary Fund loan requirements.These include:
• reduction of export taxes on logs and rattan toa maximum of 10 percent by March 1998(previously, very high export taxes made legalexport of unprocessed logs or rattan almostimpossible);
• elimination of the APKINDO (IndonesianPlywood Association) monopoly over plywoodexports;
• establishment of new resource rent taxes ontimber resources, including increased timberstumpage fees and a new auction system toallocate concessions.
In the short term, at least, adjustment to theseconditions is likely to constrain Indonesianproduction.
The effects of the Asian crisis have been felt intrade in other markets and by exporters rangingfrom Africa to New Zealand to North and SouthAmerica. Price drops and attempts by Asianexporters to maintain sales have resulted in fallingprices for exporters in other (mainly tropical)regions. Market levels have dropped, but marketshares have also changed as prices have fallen.African and South American exporters, forexample, have been affected by lower Asian prices,the latter particularly by cheaper Asian plywood.
In summary, the main effects of the economiccrisis have been lower demand, especially in Asianmarkets, disruption of supplies, weakenedcurrencies in most developing export countries,lower prices and intense competition. Market pricesfor tropical products have fallen significantly. ITTOstatistics indicate that prices of many tropical forestproducts fell by up to 60 percent in early 1998. Thesituation improved in mid-1998, but additionalpolitical and financial difficulties seen in theautumn of 1998 in many countries – including the
42 STATE OF THE WORLD’S FORESTS 1999
Russian Federation, China, many other Asiancountries and some in South America – have causedwidespread uncertainty in forest product markets.
Developments in trade liberalizationMoves to reduce trade restrictions that limit anddistort free trade in forest products have continuedto receive considerable attention.30 Both developedand developing countries have begun to implementthe global reductions in tariffs agreed to by theUruguay Round in 1994. These tariff reductionshave been supplemented by others stimulated byregional discussions such as the Asia-PacificEconomic Cooperation (APEC) and SouthernCommon Market (MERCOSUR) agreements. Theterms of the Uruguay Round require thatcommitments to tariff reductions be fulfilled by2004. Some countries have even advanced the datesfor achieving these reductions. For example,Canada, Japan, the United States and the EUcountries have agreed to eliminate all tariffs onpulp and paper products. As tariff rates on forestproducts in the main importing countries weregenerally quite low before the Uruguay Round,changes in these markets have not, in general, beensubstantial.
Some developing countries have also agreed tomake substantial reductions in their tariff rates.Major reductions in forest products tariffs in Indiaand negotiations on the accession of China to WTOare of particular significance. Removal of othertrade restrictions, such as import licensing, has, forexample, triggered the recommencement of theIndian log trade during the past three years.Similarly, negotiations with China on forestproducts tariffs appear to be close to settlement,and some relatively substantial reductions arelikely; early reports suggest that Chinese tariffs onwood and pulp products may be halved (onaverage) while paper products may be reduced byslightly more (on average). The enormouspopulations and demand potential in India andChina give these changes obvious importance.
Improvements to non-tariff barriers are moredifficult to identify, but the Uruguay Roundagreements have given the subject more visibility.Several of the agreements subsidiary to theUruguay Round settlement are important to theforest sector, most notably the Agreement onTechnical Barriers to Trade and the Agreement onthe Application of Sanitary and PhytosanitaryMeasures.
The most significant benefit related to theUruguay Round agreements appears to be theimpetus that the negotiations have given tocontinued reductions in tariffs and improvementsin access.
At present, issues of general significance for theforest sector being discussed in WTO include thosebeing considered in the Committee on Trade andEnvironment (see below) and the possible initiationof a new round of multilateral trade talks on tradeliberalization (similar to the Uruguay Round). Anumber of countries are promoting a “MillenniumRound” which would start in 2000. Others are ofthe opinion that the full implementation of theUruguay Round agreements and the resolution ofproblems faced by developing countries shouldtake place before any new negotiations begin. Noagreement has been reached on this issue.
In addition to the reductions resulting from theUruguay Round, an increasing number of regionaltrade agreements are establishing preferential termsof trade or, often, free-trade blocs. The list includesAPEC, ASEAN, the Australia-New Zealand CloserEconomic Relations Trade Agreement(ANZCERTA), the Caribbean Community andCommon Market (CARICOM), EU, MERCOSUR,the North American Free Trade Agreement(NAFTA) and the South Pacific Regional Trade andEconomic Cooperation Agreement (SPARTECA).All of these include reductions affecting the forestsector.
For example, APEC has proposed a timetable forthe liberalization of trade across the region underwhich member countries are committed to creatinga region of free and open trade and investment nolater than 2010 for industrialized economies and2020 for developing economies. In November 1997,the forest products sector was selected as one of the
30 See FAO, 1998e for a detailed analysis of trade restrictionsaffecting forest products.
PART I SITUATION AND PROSPECTS FOR FOREST CONSERVATION AND DEVELOPMENT 43
15 sectors for Early Voluntary SectoralLiberalization (EVSL), under which membercountries will be asked to implement voluntarily anaccelerated programme of trade liberalization.Development of proposals on this subject isexpected to be completed by the end of 1998, withthe main objective being to achieve a free marketfor forest products within APEC economies by themiddle of the next decade.
As another example, preparations are currentlyunder way to negotiate a Free Trade Area of theAmericas, with negotiations planned to conclude in2004.
Some concern has been expressed that aproliferation of such regional trade agreements mayadversely affect global trade liberalization efforts.Another fear is that the effects of the Asian crisisand, in particular, the current problems in Japanwill increase the difficulties faced by the tradingsystem. A particular concern is that the economicdownturn will result in a resurgence ofprotectionist measures as countries attempt toprotect themselves against competition from lower-priced imports.
Trade and environment – impacts anddevelopmentsAlthough there is general agreement that trade andenvironment considerations should be mutuallysupportive, there are widely differing views onhow far this can be achieved and how this objectivemight be approached. Other important issues ofdebate are what areas should be given mostattention, and whether trade bodies orenvironmental bodies should predominate whenconflicts arise.
The conjunction of trade and the environmentwas considered important enough that it was madeone of the programme areas of theIntergovernmental Panel on Forests (IPF). Thecomplex and contentious nature of the issues isillustrated by the fact that IPF could not reachagreement on many of them, and the subject waspassed to the Intergovernmental Forum on Forests(IFF) for further consideration.
The lack of consensus continued when IFF metand again discussed these issues in September 1998.
Subjects on which no agreement was reachedinclude market access, trade and sustainable forestmanagement, the relationship between obligationsunder international agreements and national trademeasures, and illegal trade.
Efforts to clarify the issues and seek agreementwill be made at a meeting on trade-related aspectsof sustainable management of all types of forests, tobe hosted by the Government of Brazil, UNCTADand ITTO in February 1999. The topic will again bediscussed by IFF at its third session in May 1999.
Certification (see the following section) is one ofthe controversial issues concerning trade and theenvironment. Producer countries and trade groupshighlight its trade-restrictive aspects; consumercountries with strong environmental lobbieshighlight the environmental advantages; and manyconsumer interests see eco-labelling31 as a means ofovercoming a variety of problems.
Some of the issues involved in the trade-environment debate are under further discussion inWTO’s Committee on Trade and Environment(CTE); these include eco-labelling, market access,the effects of trade liberalization and the effects ofWTO agreements (see e.g. WTO, 1998). AlthoughCTE’s main focus is on general trade issues ratherthan on specific sectors, forestry is emerging as oneof the sectors where many of these issues cometogether, because most aspects of the forest sectorhave clear links to the environment. Some of thepoints being debated in CTE, most of which haverelevance to forestry, are:
• the impact of trade liberalization on theenvironment;
• whether non-governmental actions such ascertification, which are outside internationaltrade rules, act as non-tariff barriers to trade;
• the closeness of the link between trade and theenvironment;
31 Eco-labelling refers to a guarantee that certain environmentalstandards have been met at all stages leading to the finalproduct, including production, transport and processing. It thushas broader coverage than certification, which indicates that theproduct comes from forests managed according to a definedenvironmental standard but implies nothing about postharvestpractices.
44 STATE OF THE WORLD’S FORESTS 1999
• whether actions such as eco-labelling andcertification affect trade positively ornegatively;
• if actions that are taken for environmentalreasons, and restrict trade, are contrary to WTOrules;
• which multilateral agreement should bedominant in the case of conflict – themultilateral environment agreement (MEA) orthe multilateral trade agreement.
Forest products certification – an updateCertification of forest products continues to be ahigh-profile and often controversial subject in theforest sector. In addition, tentative efforts are beingmade to extend certification to non-wood forestproducts, which would raise new issues.
Accurate statistics on the area of forests andvolume of wood certified are difficult to obtain, andthe figures are often difficult to interpret. The ForestStewardship Council (FSC) reports that about10.3 million hectares have been certified by FSC-accredited certifiers.32 It is significant that90 percent of this area is in temperate developedcountries, largely in Europe and North America.Sweden and Poland alone account for 58 percent ofthe total. Thus only a minor part is in tropicalcountries, where the problem of deforestation isgreatest. The volume of wood involved and thevolumes entering or about to enter the market areunknown, but are still insignificant in global andregional terms. The area of forests certified is not asound indicator of the volume of wood entering themarket, since parts of the certified areas may not beat harvestable age, may not contain commercialspecies or in extreme cases may not even have treeson them.
Certification efforts are being made at all levels.International efforts include those of FSC and theInternational Organization for Standardization(ISO); regional initiatives include those of theAfrican Timber Organization (ATO) and EU’s
Eco-Management and Auditing Scheme (EMAS)and Eco-Labelling Scheme; and countries withnational programmes include Brazil, Canada,Finland, Ghana, Indonesia and Sweden. In the lasttwo years there have been many new initiatives,and a number of additional forests have beencertified or are in the process of being certified.Among importing countries, interest continues tobe greatest in Europe, especially Germany, theNetherlands and the United Kingdom. Theexporting countries showing the most interest incertification are those whose main export marketsare European countries and to a lesser extent theUnited States; hence the considerable effort Canada,Finland, Indonesia, Malaysia and Sweden have putinto developing national certification systems.
Certification systems are based on evaluating thestandard of forest management being practised.The two main approaches, whose relative meritsare a subject of considerable disagreement, arethose of FSC and ISO. FSC favours a performance-based approach, i.e. stipulating that a specifiedlevel of forest management, covering all aspects –including social aspects – must be achieved. ISO’sapproach is based on the management system, i.e.stipulating that specific management systems andcommitment to specified actions and proceduresmust be in place. The FSC approach also considerschain-of-custody monitoring as an essential part ofthe process, while other certification approaches donot. Many consider chain-of-custody too difficultand expensive to contemplate.
Countries use one of these approaches or amodified version as appropriate to their owncircumstances. While many consider the twoapproaches incompatible, there appears to begrowing recognition that they may in fact bemutually supportive, and that a degree of mutualacceptance could eventually be achieved. It is alsorecognized that without this mutual acceptance,progress will be fragmented and difficult.
Even within an individual country, differentapproaches are being followed by different groups.Sweden, for example, recently announced thatagreement had been reached between the largeforestry companies and FSC on a certificationsystem based on FSC’s principles. Small forest
32 As at 15 May 1998. In 1996, the area of forests certified, underboth FSC and other certification schemes, was given as 2.3 to4 million hectares (FAO, 1997d).
PART I SITUATION AND PROSPECTS FOR FOREST CONSERVATION AND DEVELOPMENT 45
owners in Sweden have rejected this system,however, and are following their own approach.
For many countries an important aspect ofcertification is its relevance and impact for smallforest owners. This is an important issue incountries where a high proportion of the forest landis owned by a large number of owners, many ofwhom have very small areas of forest – often lessthan 10 ha. For example, in Finland 62 percent ofthe forest land is owned by some 440 000 privateforest owners, with an average forest holding ofabout 26 ha. (Of the rest, the State owns 25 percent,large companies 8 percent and others, includingmunicipalities, parishes, common forest ownersand other bodies, 5 percent.) Similarly, in France,almost 10 million hectares of forests are owned bysome 4 million private owners – an average holdingof 2.8 ha per owner. Even in the United States,where large private companies own substantialforest areas, some 60 percent of the commercial
forest land is owned by 10 million small-scalefarmers and landowners.
Small owners are concerned that the certificationsystems being promoted may discriminate againstthem, restrict their freedom, exclude them frommarkets or be excessively costly to implement. Theyfeel that many of the principles developed areeither impossible for small producers to meet orinappropriate to their situation (see Box 12).
Many forest and paper processors use materialfrom many small suppliers which is thus difficult orexpensive to identify and track. It may also includewaste, recycled or reused material. Materials fromvarious sources are often combined in themanufacturing process, components are sold forremanufacture, and some products are recycled andmanufactured into new products. The need toaddress these problems is resulting in continualmodification of certification rules and procedures.Included in this adaptation is a move towards
While not opposed to certification as a process, many small
forest owners are opposed to the systems being proposed or
to the way in which they have been developed. Many believe
that the schemes have been designed to fit the circumstances
of large forest owners and have not taken the special features
of small-scale ownership into consideration.
The concerns of small forest owners include the following.
• Many principles and criteria of certification do not reflect
forest management practices that are appropriate to small
forests.
• Many social and environmental requirements are
inappropriate to small owners (rather, they are relevant
to large forest areas or the country as a whole).
• Tracking wood flows from small forests is difficult.
• Certification requirements discriminate against planted
forests, especially small planted forests.
• Certification procedures and the control of the
certification processes limit the freedom of small owners
to make decisions about alternative land uses.
• Certification of small forests is prohibitively expensive;
the cost for the initial certifying cost and the annual
monitoring of small forests is substantially greater per
hectare than for large forest areas.
These concerns have prompted efforts in a number of
countries (e.g. Finland, France, Norway, Portugal, Spain and
Sweden) to develop certification systems that are more
applicable to small forest owners. In Finland’s proposed
national system, voluntary certification would be possible at
three different levels: certification of individual forest owners;
group certification in a Forest Management Associations area,
which covers on average 80 000 ha and has some 1 500
owners; and group certification at the level of a Finnish Forestry
Centre area, which comprises an average forest area of
approximately 1.5 million hectares and has 30 000 owners.
The registration authority in Finland would be the Finnish
Environment Institute, while the accreditation body for the
certification bodies would be the Finnish Accreditation Service.
BOX 12Certification and small forest owners
46 STATE OF THE WORLD’S FORESTS 1999
certification based on the proportion of certifiedmaterial in the final product. This would allowcertification of products without requiring that100 percent of the material used comes fromcertified sources.
The following are some of the most significantdevelopments that have occurred in the past twoyears.
• In Canada, an ISO-based certification systemhas been developed by the Canadian StandardsAssociation (CSA). The system allowsindividual companies to be certified by a thirdparty assessor using standards developed byCSA. No forests have been reported as certifiedunder this system to date.
• In a related move, an ISO Forestry WorkingGroup has prepared a technical report to assistforestry organizations in implementing theISO-14001 Environmental Management SystemStandard. The report provides information onforest principles, criteria and indicators ofsustainable forest management that have beendeveloped by various other groups.
• The Netherlands and Germany have beenworking on the development of methods ofvalidating the certificates provided bysuppliers (both domestic and foreign) to theirmarkets and of linking these certificates to finalproducts in their markets. The KeurhoutFoundation in the Netherlands has developeda system which will assess suppliers’certificates (from any certified source) andmonitor the chain of custody (i.e. track the rawmaterial through to the final product form) tothe end user. A “hallmark stamp” (i.e. a label)is available for final products.
• The American Forest and Paper Association(AF&PA) has developed a Sustainable ForestryInitiative (SFI) by which its member companiescommit themselves to move towardssustainable forestry. This commitment is acompulsory requirement of membership inAF&PA. It is not a certification process, but theprinciples and guidelines that companiesespouse may serve as a basis for futurecertification by an independent body.
• FSC has continued to expand its countrycoverage and has developed an FSC label to be
placed on certified final products. This label isavailable for use on supplies certified by FSC-accredited certifiers.
Despite these efforts, there are still unresolved orunanswered questions surrounding certificationand uncertainty as to how it may develop in thefuture. There is still little evidence of the marketimpacts of certification, positive or negative. Themost obvious sign of growth in certificationactivities is the area of forests certified, but there arefew signs of significant volumes of certifiedproducts entering the market. In part, this isbecause certified supplies remain limited, but itmay also reflect a lack of buyer interest.
It remains unclear whether demand for certifiedwood will increase, and whether a price premium islikely. Even in the markets showing the greatestinterest in certification, there is little sign of asubstantial or increasing demand, or any pricepremium paid. A number of market studies (e.g.Brockmann, Hemmelskamp and Hohmeyer, 1996)have concluded that there is little evidence of asignificant demand for certified products.
Another unanswered question is whethercertification will, in fact, significantly contribute toimproved forest management where deforestationis greatest – in the developing countries.Certification was originally promoted byenvironmental groups as a market-based lever toimprove forest management and reducedeforestation. At present, those certifying or tradingin certified products seem to be using it more as amarketing tool either to generate an increasingmarket share or to ensure continued or improvedaccess to markets. Some forest owners, however,see certification as benefiting their forestmanagement practices in addition to providingmarket benefits (see Box 13).
Despite these uncertainties, interest incertification continues to grow. It seems clear that atleast in the short to medium term the area of forestsbeing certified will continue to expand as majorproducing countries such as Canada, Finland,Indonesia and Malaysia finalize the systems theyare developing. It is still difficult, however, topredict where certification will finally arrive andwhat type of system, or combination of systems,will be favoured. The results will depend heavily
PART I SITUATION AND PROSPECTS FOR FOREST CONSERVATION AND DEVELOPMENT 47
on which markets institute it; the degree of supportgiven by consumers, legislators and traders in thesemarkets; and the extent to which harmonization, orat least mutual recognition of different practices, isachieved. Certification may expand and have asignificant impact in some markets; equally, it couldremain limited to a few markets and a few specificend uses (e.g. high-value furniture). It is alsopossible that in the long term it could fail to haveany significant impact. The deciding factor will beconsumer reaction to the products, which is farfrom clear at this stage.
FUTURE SUPPLY AND DEMAND FORINDUSTRIAL ROUNDWOOD ANDWOOD PRODUCTSFAO has recently completed two new globalsupply and demand studies: the Global FibreSupply Model (GFSM) (FAO, 1998a) and the
Global Forest Products Outlook Study (FAO,1999). A major and more detailed forestry sectorstudy for the Asia and the Pacific region has alsorecently been produced (FAO, 1998f). Ratherthan dwelling too intently on market forecastswhich will be vulnerable to macroeconomicshifts (such as those recently experienced inAsia), these new studies focus more on the likelypolicy implications of forest product marketdevelopments. The following text brieflydescribes the main market developments thatare expected in the future and discusses theimplications of these developments within thecontext of sustainable forest management.
Future forest product production andconsumption by regionThe current and projected level of wood productionand consumption in 2010 is shown by region in
In 1997, the Brazilian subsidiary of Precious Woods,
Madeireira Itacoatiara Ltda. (MIL), was certified in accordance
with the principles of the Forest Stewardship Council (FSC).
The decision to go ahead with certification was based on the
company’s expectation that although certification meant a
long-term (at least five years) commitment of staff and finances,
it would provide the company with both internal improvements
and market benefits. Precious Woods felt that certification was
a means of highlighting the company’s long-term commitment
to ecological and socially correct behaviour and could
potentially bring the following benefits.
A marketing advantage
With the trend in some of the company’s target markets towards
boycotts or restrictions on tropical timber, the company felt
that it was important to have a “green label” which indicated
its use of ecologically sound harvesting methods. The
certification process was seen as likely to facilitate the
company’s marketing activities. A revival of markets for tropical
timber products was considered possible, both in completely
new markets and in markets that were lost during boycott
campaigns. A certificate would assist the company in exporting
tropical timber to ecologically sensitive markets, particularly
those in central and northern Europe. Certification was seen
as a means of indicating to the public the company’s
commitment to sound management of its tropical forests. It
was felt that making certification methods, results and
conditions regularly available to the public would provide
promotional benefits.
Internal company improvement
The company foresaw internal benefits from the assessment
process and from having its major forest activities, especially
those in ecologically sensitive forest areas, checked by outside
independent experts. The evaluation by external assessors was
expected to provide a good opportunity for the company to
modify its operations in order to minimize ecological
problems. It was felt that the assessment process, carried out
over a significant period, would benefit both the company
and the certifier.
Source: Text provided by Precious Woods (Switzerland) Ltd.
BOX 13Why Precious Woods decided to apply for FSC certification
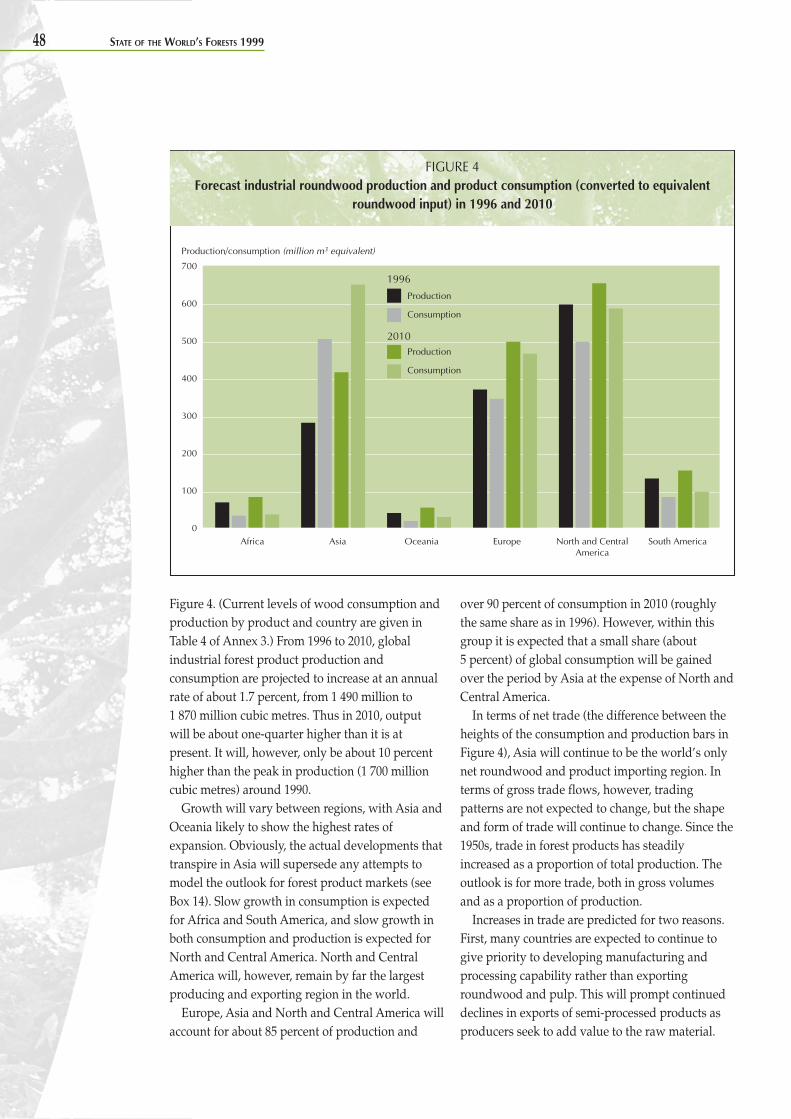
48 STATE OF THE WORLD’S FORESTS 1999
Figure 4. (Current levels of wood consumption andproduction by product and country are given inTable 4 of Annex 3.) From 1996 to 2010, globalindustrial forest product production andconsumption are projected to increase at an annualrate of about 1.7 percent, from 1 490 million to1 870 million cubic metres. Thus in 2010, outputwill be about one-quarter higher than it is atpresent. It will, however, only be about 10 percenthigher than the peak in production (1 700 millioncubic metres) around 1990.
Growth will vary between regions, with Asia andOceania likely to show the highest rates ofexpansion. Obviously, the actual developments thattranspire in Asia will supersede any attempts tomodel the outlook for forest product markets (seeBox 14). Slow growth in consumption is expectedfor Africa and South America, and slow growth inboth consumption and production is expected forNorth and Central America. North and CentralAmerica will, however, remain by far the largestproducing and exporting region in the world.
Europe, Asia and North and Central America willaccount for about 85 percent of production and
over 90 percent of consumption in 2010 (roughlythe same share as in 1996). However, within thisgroup it is expected that a small share (about5 percent) of global consumption will be gainedover the period by Asia at the expense of North andCentral America.
In terms of net trade (the difference between theheights of the consumption and production bars inFigure 4), Asia will continue to be the world’s onlynet roundwood and product importing region. Interms of gross trade flows, however, tradingpatterns are not expected to change, but the shapeand form of trade will continue to change. Since the1950s, trade in forest products has steadilyincreased as a proportion of total production. Theoutlook is for more trade, both in gross volumesand as a proportion of production.
Increases in trade are predicted for two reasons.First, many countries are expected to continue togive priority to developing manufacturing andprocessing capability rather than exportingroundwood and pulp. This will prompt continueddeclines in exports of semi-processed products asproducers seek to add value to the raw material.
FIGURE 4Forecast industrial roundwood production and product consumption (converted to equivalent
roundwood input) in 1996 and 2010
Production
Consumption
Production
Consumption
1996
2010
700
600
500
400
300
200
100
0Africa Asia Oceania Europe North and Central
AmericaSouth America
Production/consumption (million m3 equivalent)
PART I SITUATION AND PROSPECTS FOR FOREST CONSERVATION AND DEVELOPMENT 49
The model used to produce the supply and demand forecasts
of the Global Forest Products Outlook Study was also used
to estimate the potential long-term impact of the recent
Asian crisis on global markets. The estimate looks at the
consequences for the forestry sector up to 2010. No attempt
was made to forecast near-term market fluctuations.
In April 1998, analysts were projecting a resumption of
economic growth in Asia after a period of retrenchment whose
length and severity were in question. Under a projection of
more measured economic growth in Indonesia, Malaysia, the
Republic of Korea and Thailand, plus knock-on effects in some
other countries in the region, overall consumption in the region
across all wood product categories is estimated to be roughly
4 to 5 percent lower than the baseline projection for the year
2010.
Slower economic growth in these countries, compounded
by the effects of competitive devaluation, is expected to
suppress imports as a share of overall consumption in the
region, which has been such a large importer. Countries in
the region that are less affected economically by the crisis are
likely to increase forest product imports if offshore prices fall,
although this could come at the expense of domestic
production. These counterbalancing effects illustrate the
difficulties of modelling structural adjustment.
In general, the outlook remains murky because of the
difficulty of foreseeing the types of currency adjustments that
may emerge and their competitive effects on trade.
Compounding the confusion in this type of assessment is the
inability to understand or project the impacts of the financial
crisis on the availability of capital to the region. Any outlook
for growth is founded on the assumption of ample supplies of
development capital at market clearing prices. The trademark
of this financial crisis is a dramatic shift and reassessment of
the role of global capital markets and the respective roles,
responsibilities and liabilities of governments, financial
institutions, entrepreneurs and investors. Until these roles are
clarified, the supplies of financial capital to the region may
remain constrained. Under a scenario of scarce capital, forest
products output in the region is likely to show little growth,
and consumption only very slight increases.
BOX 14The impact of the recent Asian crisis on supply and demand projections
For example, a greater proportion of commoditiessuch as sawnwood and panels will be processedfurther into furniture and joinery products. Second,an expansion of domestic markets is expected asdeveloping countries’ economies grow and mature.Maturation of these markets will give rise toeconomies of scale in processing, product design,assembly, manufacture and distribution. Theincreasing specialization, market segmentation andcompetition will promote higher levels of trade,both within regions and internationally.
On the supply side, the factors leading to greaterproduction of both roundwood and products in thefuture will differ widely among countries. In somecountries, roundwood production will be increasedby supply-side factors, such as the opening-up ofnew areas of forest and the maturation of extensiveplantation resources (e.g. in countries around thesouthern Pacific Rim). However, more typically,production will be driven up by increased demand
as a result of high rates of economic growth (e.g. inmost European and many Asian economies). Incountries where there is considerable demandpull, and particularly where forest resources arelimited, wood product producers will start toconsider using a broader range of wood and fibreraw materials than they have in the past(see Box 15).
Future forest product production andconsumption by product categoryCurrent estimates and future forecasts of globalforest product production and consumption byproduct category are shown in Table 7. As in thepast, the market for paper and paperboard isexpected to have the most rapid growth, at anannual rate of 2.4 percent (see Table 7 and Figures 5to 10). In contrast, production of pulp for paper isexpected to grow by only 1.1 percent per year,reflecting an expected increase in the use of
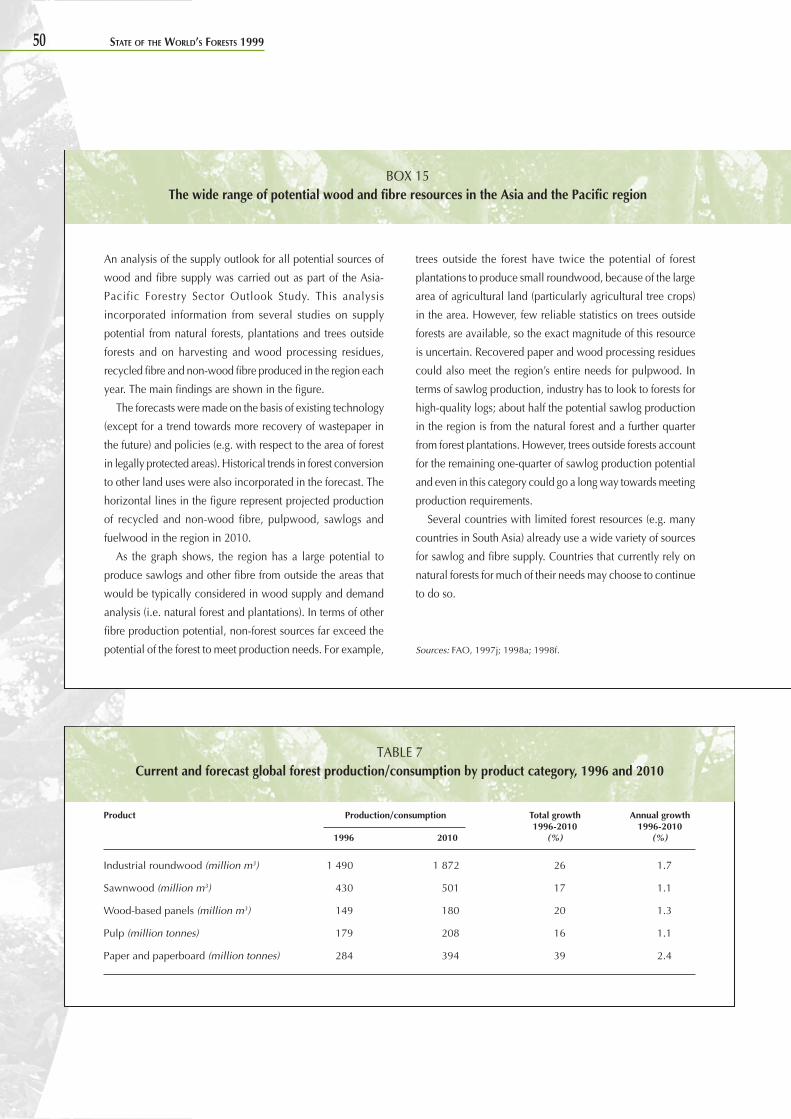
50 STATE OF THE WORLD’S FORESTS 1999
An analysis of the supply outlook for all potential sources of
wood and fibre supply was carried out as part of the Asia-
Pacific Forestry Sector Outlook Study. This analysis
incorporated information from several studies on supply
potential from natural forests, plantations and trees outside
forests and on harvesting and wood processing residues,
recycled fibre and non-wood fibre produced in the region each
year. The main findings are shown in the figure.
The forecasts were made on the basis of existing technology
(except for a trend towards more recovery of wastepaper in
the future) and policies (e.g. with respect to the area of forest
in legally protected areas). Historical trends in forest conversion
to other land uses were also incorporated in the forecast. The
horizontal lines in the figure represent projected production
of recycled and non-wood fibre, pulpwood, sawlogs and
fuelwood in the region in 2010.
As the graph shows, the region has a large potential to
produce sawlogs and other fibre from outside the areas that
would be typically considered in wood supply and demand
analysis (i.e. natural forest and plantations). In terms of other
fibre production potential, non-forest sources far exceed the
potential of the forest to meet production needs. For example,
trees outside the forest have twice the potential of forest
plantations to produce small roundwood, because of the large
area of agricultural land (particularly agricultural tree crops)
in the area. However, few reliable statistics on trees outside
forests are available, so the exact magnitude of this resource
is uncertain. Recovered paper and wood processing residues
could also meet the region’s entire needs for pulpwood. In
terms of sawlog production, industry has to look to forests for
high-quality logs; about half the potential sawlog production
in the region is from the natural forest and a further quarter
from forest plantations. However, trees outside forests account
for the remaining one-quarter of sawlog production potential
and even in this category could go a long way towards meeting
production requirements.
Several countries with limited forest resources (e.g. many
countries in South Asia) already use a wide variety of sources
for sawlog and fibre supply. Countries that currently rely on
natural forests for much of their needs may choose to continue
to do so.
Sources: FAO, 1997j; 1998a; 1998f.
BOX 15The wide range of potential wood and fibre resources in the Asia and the Pacific region
TABLE 7Current and forecast global forest production/consumption by product category, 1996 and 2010
Product Production/consumption Total growth Annual growth1996-2010 1996-2010
1996 2010 (%) (%)
Industrial roundwood (million m3) 1 490 1 872 26 1.7
Sawnwood (million m3) 430 501 17 1.1
Wood-based panels (million m3) 149 180 20 1.3
Pulp (million tonnes) 179 208 16 1.1
Paper and paperboard (million tonnes) 284 394 39 2.4
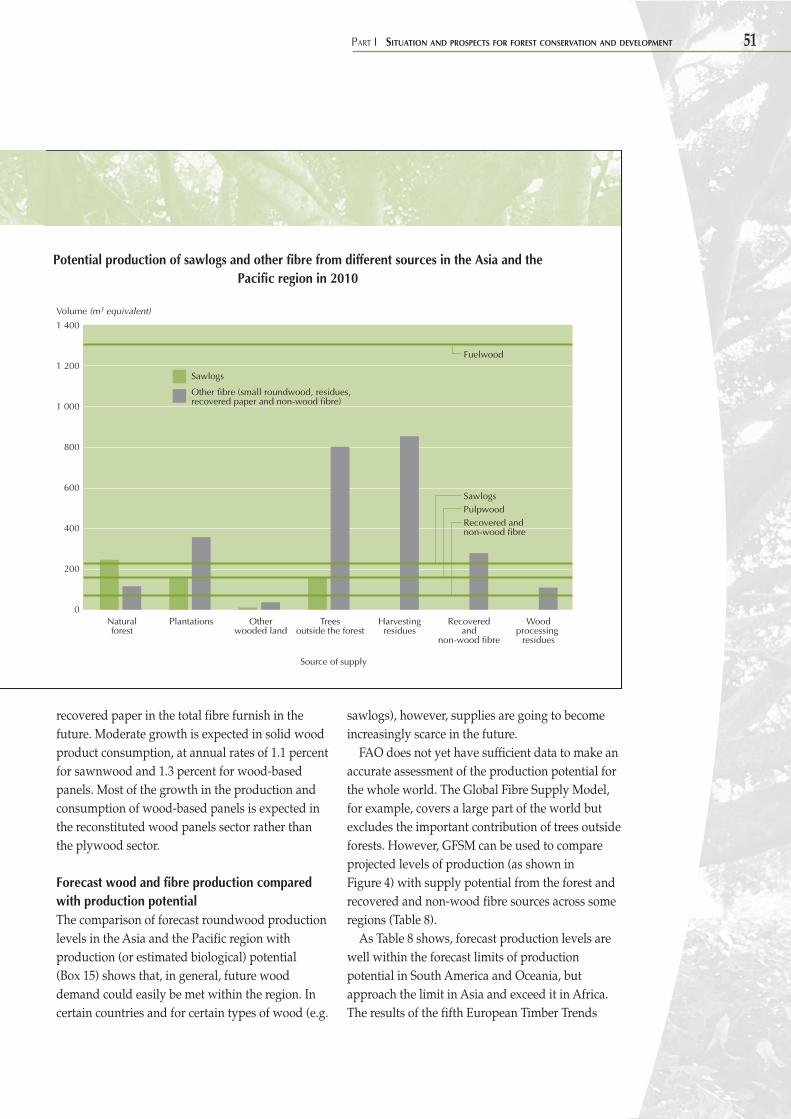
PART I SITUATION AND PROSPECTS FOR FOREST CONSERVATION AND DEVELOPMENT 51
Potential production of sawlogs and other fibre from different sources in the Asia and thePacific region in 2010
recovered paper in the total fibre furnish in thefuture. Moderate growth is expected in solid woodproduct consumption, at annual rates of 1.1 percentfor sawnwood and 1.3 percent for wood-basedpanels. Most of the growth in the production andconsumption of wood-based panels is expected inthe reconstituted wood panels sector rather thanthe plywood sector.
Forecast wood and fibre production comparedwith production potentialThe comparison of forecast roundwood productionlevels in the Asia and the Pacific region withproduction (or estimated biological) potential(Box 15) shows that, in general, future wooddemand could easily be met within the region. Incertain countries and for certain types of wood (e.g.
sawlogs), however, supplies are going to becomeincreasingly scarce in the future.
FAO does not yet have sufficient data to make anaccurate assessment of the production potential forthe whole world. The Global Fibre Supply Model,for example, covers a large part of the world butexcludes the important contribution of trees outsideforests. However, GFSM can be used to compareprojected levels of production (as shown inFigure 4) with supply potential from the forest andrecovered and non-wood fibre sources across someregions (Table 8).
As Table 8 shows, forecast production levels arewell within the forecast limits of productionpotential in South America and Oceania, butapproach the limit in Asia and exceed it in Africa.The results of the fifth European Timber Trends
Sawlogs
Other fibre (small roundwood, residues,recovered paper and non-wood fibre)
Fuelwood
SawlogsPulpwoodRecovered andnon-wood fibre
1 400
1 200
1 000
800
600
400
200
0
Volume (m3 equivalent)
Naturalforest
Plantations
Source of supply
Otherwooded land
Treesoutside the forest
Harvestingresidues
Recoveredand
non-wood fibre
Woodprocessing
residues
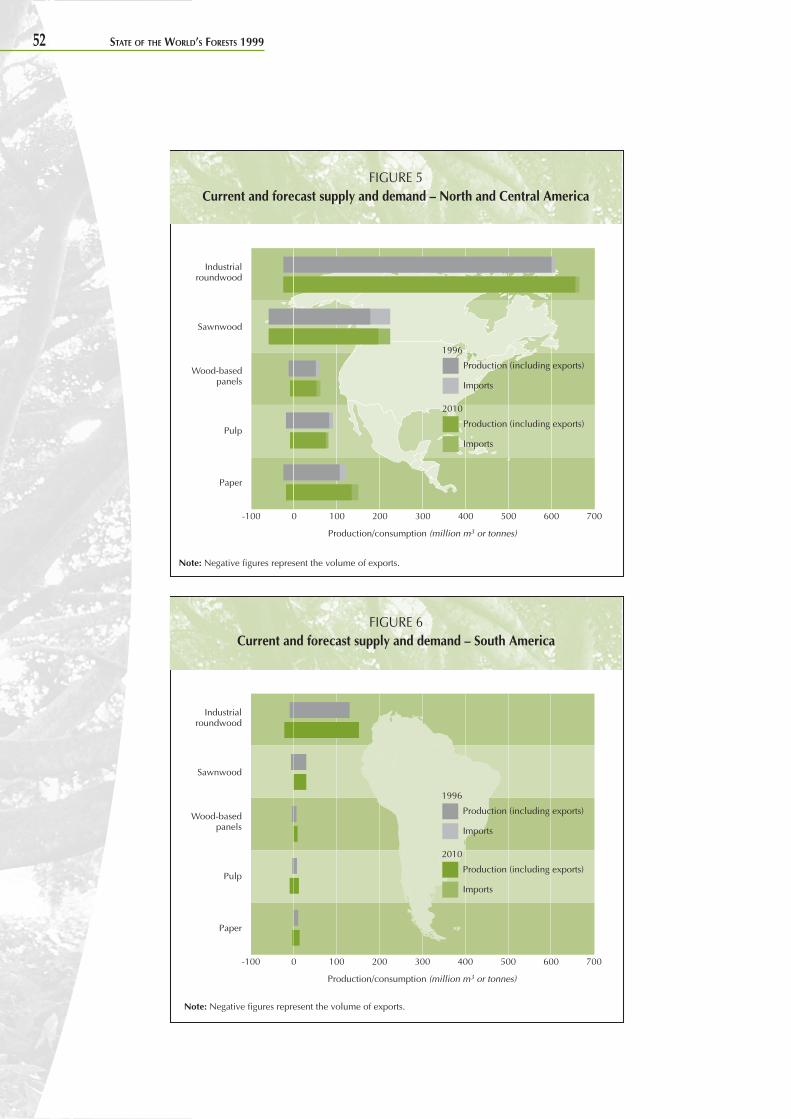
52 STATE OF THE WORLD’S FORESTS 1999
FIGURE 5Current and forecast supply and demand – North and Central America
Note: Negative figures represent the volume of exports.
Note: Negative figures represent the volume of exports.
FIGURE 6Current and forecast supply and demand – South America
-100 0 100 200
Production/consumption (million m3 or tonnes)
300 400 500 600 700
Industrialroundwood
Sawnwood
Wood-basedpanels
Pulp
Paper
1996
2010
Production (including exports)
Imports
Production (including exports)
Imports
-100 0 100 200
Production/consumption (million m3 or tonnes)
300 400 500 600 700
Industrialroundwood
Sawnwood
Wood-basedpanels
Pulp
Paper
1996
2010
Production (including exports)
Imports
Production (including exports)
Imports
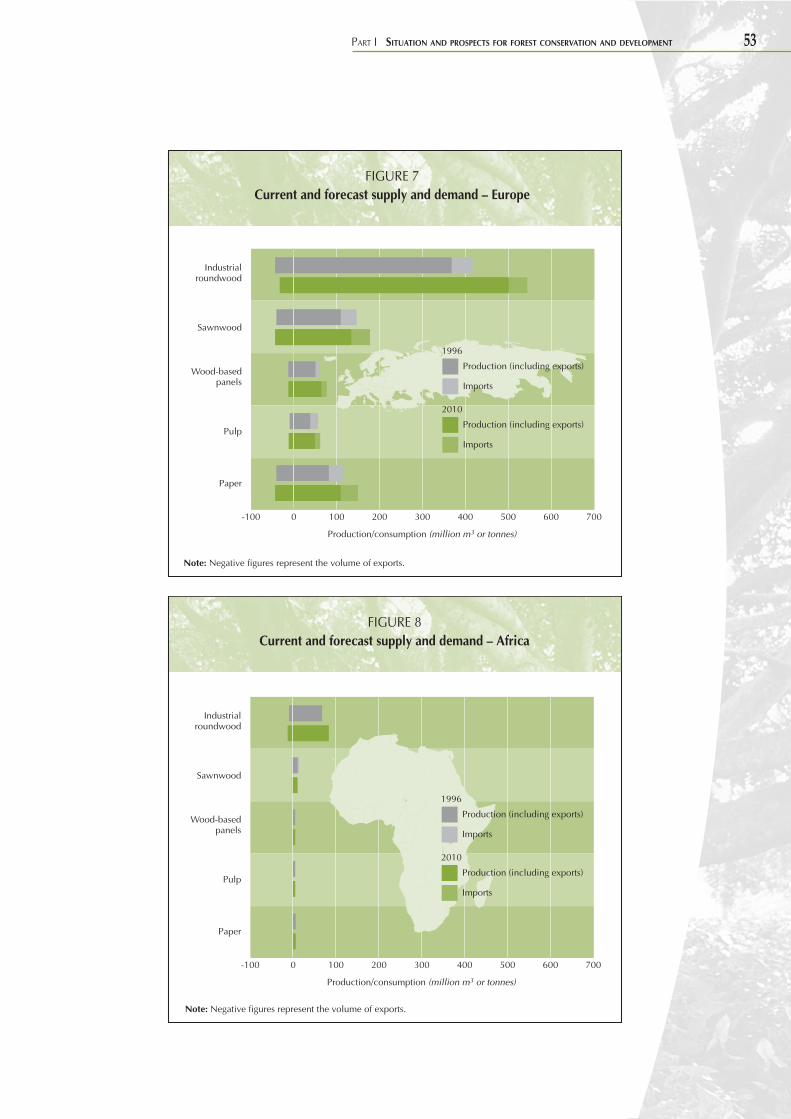
PART I SITUATION AND PROSPECTS FOR FOREST CONSERVATION AND DEVELOPMENT 53
Note: Negative figures represent the volume of exports.
FIGURE 7Current and forecast supply and demand – Europe
Note: Negative figures represent the volume of exports.
FIGURE 8Current and forecast supply and demand – Africa
-100 0 100 200
Production/consumption (million m3 or tonnes)
300 400 500 600 700
Industrialroundwood
Sawnwood
Wood-basedpanels
Pulp
Paper
1996
2010
Production (including exports)
Imports
Production (including exports)
Imports
-100 0 100 200
Production/consumption (million m3 or tonnes)
300 400 500 600 700
Industrialroundwood
Sawnwood
Wood-basedpanels
Pulp
Paper
1996
2010
Production (including exports)
Imports
Production (including exports)
Imports
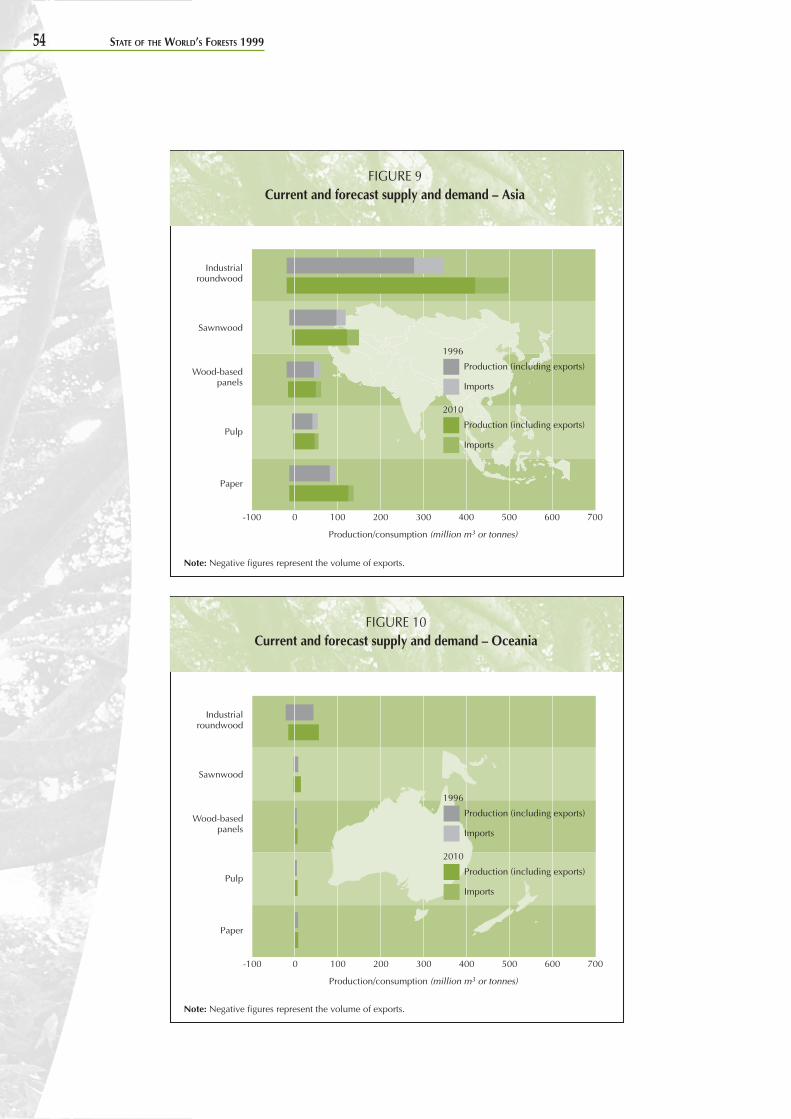
54 STATE OF THE WORLD’S FORESTS 1999
Note: Negative figures represent the volume of exports.
FIGURE 9Current and forecast supply and demand – Asia
Note: Negative figures represent the volume of exports.
FIGURE 10Current and forecast supply and demand – Oceania
-100 0 100 200
Production/consumption (million m3 or tonnes)
300 400 500 600 700
Industrialroundwood
Sawnwood
Wood-basedpanels
Pulp
Paper
1996
2010
Production (including exports)
Imports
Production (including exports)
Imports
-100 0 100 200
Production/consumption (million m3 or tonnes)
300 400 500 600 700
Industrialroundwood
Sawnwood
Wood-basedpanels
Pulp
Paper
1996
2010
Production (including exports)
Imports
Production (including exports)
Imports
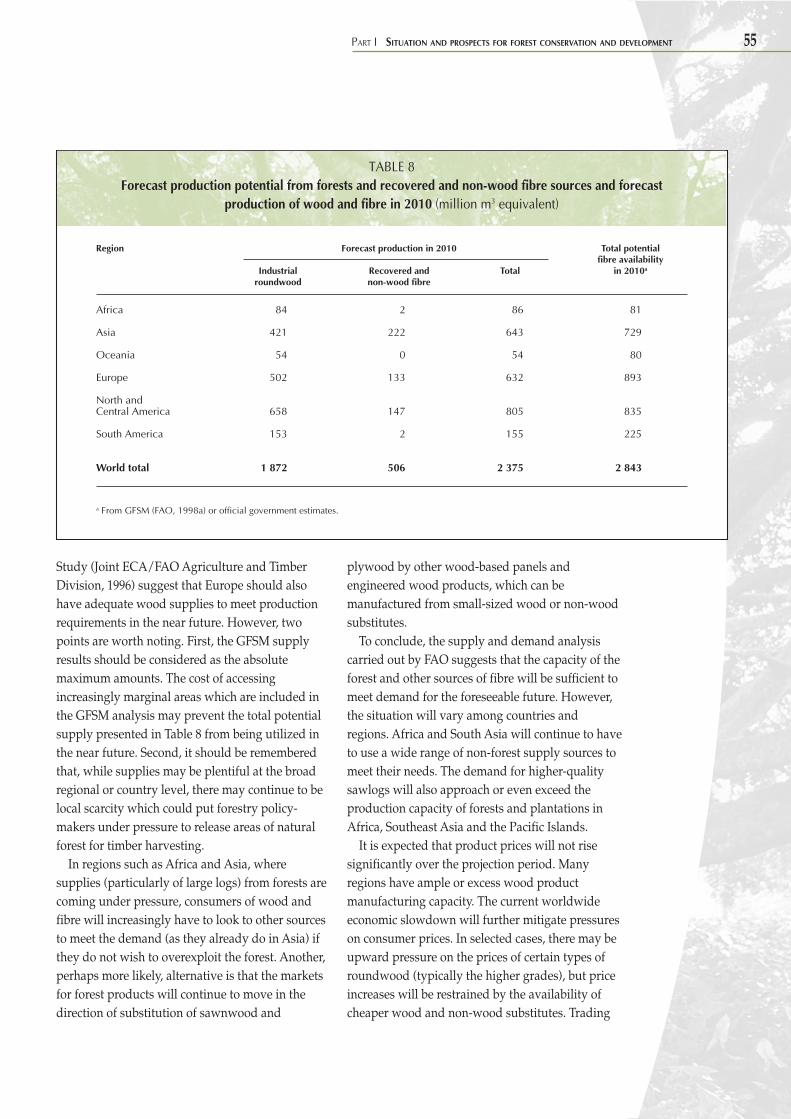
PART I SITUATION AND PROSPECTS FOR FOREST CONSERVATION AND DEVELOPMENT 55
TABLE 8Forecast production potential from forests and recovered and non-wood fibre sources and forecast
production of wood and fibre in 2010 (million m3 equivalent)
Region Forecast production in 2010 Total potentialfibre availability
Industrial Recovered and Total in 2010a
roundwood non-wood fibre
Africa 84 2 86 81
Asia 421 222 643 729
Oceania 54 0 54 80
Europe 502 133 632 893
North andCentral America 658 147 805 835
South America 153 2 155 225
World total 1 872 506 2 375 2 843
a From GFSM (FAO, 1998a) or official government estimates.
Study (Joint ECA/FAO Agriculture and TimberDivision, 1996) suggest that Europe should alsohave adequate wood supplies to meet productionrequirements in the near future. However, twopoints are worth noting. First, the GFSM supplyresults should be considered as the absolutemaximum amounts. The cost of accessingincreasingly marginal areas which are included inthe GFSM analysis may prevent the total potentialsupply presented in Table 8 from being utilized inthe near future. Second, it should be rememberedthat, while supplies may be plentiful at the broadregional or country level, there may continue to belocal scarcity which could put forestry policy-makers under pressure to release areas of naturalforest for timber harvesting.
In regions such as Africa and Asia, wheresupplies (particularly of large logs) from forests arecoming under pressure, consumers of wood andfibre will increasingly have to look to other sourcesto meet the demand (as they already do in Asia) ifthey do not wish to overexploit the forest. Another,perhaps more likely, alternative is that the marketsfor forest products will continue to move in thedirection of substitution of sawnwood and
plywood by other wood-based panels andengineered wood products, which can bemanufactured from small-sized wood or non-woodsubstitutes.
To conclude, the supply and demand analysiscarried out by FAO suggests that the capacity of theforest and other sources of fibre will be sufficient tomeet demand for the foreseeable future. However,the situation will vary among countries andregions. Africa and South Asia will continue to haveto use a wide range of non-forest supply sources tomeet their needs. The demand for higher-qualitysawlogs will also approach or even exceed theproduction capacity of forests and plantations inAfrica, Southeast Asia and the Pacific Islands.
It is expected that product prices will not risesignificantly over the projection period. Manyregions have ample or excess wood productmanufacturing capacity. The current worldwideeconomic slowdown will further mitigate pressureson consumer prices. In selected cases, there may beupward pressure on the prices of certain types ofroundwood (typically the higher grades), but priceincreases will be restrained by the availability ofcheaper wood and non-wood substitutes. Trading
56 STATE OF THE WORLD’S FORESTS 1999
patterns are not expected to change significantly,apart from the continuing trend towards morein-country processing of wood raw materials. Thisshould lead to less trade in semi-processed andcommodity-grade wood products and more tradein higher-value products.
Possible future market developmentsWood supply. The sources of wood and other fibresused in production are likely to change in thefuture. It is expected that in most countries therewill be a move away from the use of forestresources for wood and fibre production towardsother land-based and non-land-based sources ofsupply. The greatest change by far will be theincreased use of wood processing residues andrecycled fibres in the product input mix. The use ofsuch secondary sources is likely to continue toexpand in the more developed parts of NorthAmerica, Europe and Asia, while trees outsideforests are likely to have an increasingly importantrole as forest resources decline in some of the lessdeveloped regions of the world.
Within the forest, supply patterns are also likelyto change in the future. The next ten years or so willsee large areas of commercial short-rotationplantations (for pulpwood) come on stream in theSouthern Hemisphere (see discussion onplantations above). Greater areas of olderplantations established for the production ofsawlogs will also start to be harvested in countriessuch as Australia, Chile, New Zealand, SouthAfrica, the United Kingdom and the United States.These plantations will provide the greatest share ofthe expanded wood production potential expectedin the future. In contrast, very few countries arelikely to be able to expand production sustainablyfrom the natural forest without considerableinvestment in silviculture.
Greater areas of natural forest are likely to bemade legally protected areas. Many of the areasthat are likely to be chosen for preservation are notcurrently harvested and are consideredunexploitable for economic reasons (physicalconstraints, transport limitations, low timbervalue). A decrease in harvesting intensities in theexploitable natural forest would have a greater
impact on future supply potential. Harvestingintensities might fall in the future for two reasons:
• tropical countries may modify existingharvesting regulations to reduce the volume oftimber that may be felled in a given area, inresponse to environmental concerns;
• stocking levels may fall as forest operationsmove out of virgin forest and into secondaryforest.
The combination of these factors could have adramatic effect on future timber availability andwill reinforce the expected switch from naturalforest to plantations and non-forest supply sourcesoutlined above.
Technological change. Technological change hasbeen incorporated in the above supply and demandanalysis only in the pulp and paper sector, where ithas been assumed that current trends in the use ofrecovered paper in the total fibre furnish willcontinue in the future. For example, 1 tonne ofpaper and paperboard in 1970 was made up of over80 percent wood pulp. By 1997, this figure haddropped to 56 percent and by 2010 it is expected tofall to below 50 percent. This trend is partly a resultof the increased use of recovered paper, but is also aresult of shifts in market shares, whereby theproportion of printing and writing papers (whichhave a lower fibre content) in the overall markethas increased and is expected to continue to do so.
Other technological changes which the model hasnot included may also occur in the future. First,improvements in harvesting practices couldincrease log recovery and reduce logging residuesin many of the world’s forests. Many developingcountries have substantial scope to increase theirlog recovery rates. Even a modest increase in logrecovery rates in countries with high annual fellinglevels could increase production and contributesignificantly to meeting the projected growth inindustrial roundwood demand.
Better mill recovery rates could also havesignificant effects by reducing the amount ofroundwood required to manufacture products (seeBox 16). In addition, residues could be used moreeffectively to meet the demands of other woodprocessors. Not much is currently known about the
PART I SITUATION AND PROSPECTS FOR FOREST CONSERVATION AND DEVELOPMENT 57
Technological developments in wood processing continue to
keep pace with market, environmental and raw material
resource trends. The increased production of reconstituted
panels such as oriented strand board and medium-density
fibreboard and developments in the manufacturing of
engineered wood products will continue to increase the
efficiency of using raw material. Engineered wood products
increase opportunities for using small-diameter logs of lower
quality and less-used species. The use of microprocessors in
almost every step of the production cycle increases product
quality and minimizes the amount of residues generated.
Much of the technological development in wood processing
is concentrated in industrialized countries, and the extent to
which the technologies are used in non-industrialized countries
is not known. Wider adoption of current technologies and
development of new ones which increase processing efficiency
could help slow the increasing demand for raw materials to
supply finished wood-based products. Below are some
examples of technologies that illustrate the opportunities.
• Technology developments in laminated veneer lumber
include increasing use of ultrasonic veneer graders so
that a substantial part of the veneer supply is routinely
tested for possible use as laminated veneer lumber, rather
than only for plywood. This development has contributed
to a 75 percent increase in production of laminated
veneer lumber and a threefold increase in I-joists in the
United States from 1990 to 1996.
• New oriented strand board technologies include more
efficient glue distribution on the strands, which makes it
possible to achieve target properties with lower mat
densification than before; larger panel sizes, resulting in
less trim waste; new dryers that break and pulverize
strands less; and widespread adoption of long log flakers
which reduce log trim and kerf loss. Mills using the older
processes achieve recoveries estimated at around 55 to
60 percent, while those using the newer ones report
recoveries of 60 to 63 percent (ratio of wood volume in
to product volume out).
• New technologies developed in medium-density
fibreboard (used particularly for furniture components)
include three-dimensional thermoform laminating,
surface printing and wet finishing techniques. The
production of medium-density fibreboard in Europe
increased threefold from 1990 to 1997.
• The increasing volume of small-diameter material at
sawmills is driving some technological developments.
Mills specializing in manufacturing narrow-dimension
lumber from small-diameter stems are adopting curve
sawing. Scanning and optimization at the primary headrig
and the secondary breakdown centres (edging, trimming,
resawing, cant breakdown) are becoming standard. The
manufacture of finger-jointed studs from small lengths
salvaged from jacket boards and slabs which would have
been chipped in the past is becoming increasingly
common.
• The use of fibre other than wood for the production of
particleboard is increasing. Plants using wheat straw for
production of boards have been built in the United States
and Canada within the past decade. Particleboard plants
using cotton stalks have been built in India. Medium-
density fibreboard plants are operating in Malaysia using
oil-palm residues as a raw material. The product is based
entirely on fibre strands of the oil-palm’s fruit husks, which
are a residue from the processing of the fruits. The
characteristics of the fibre strands are comparable to those
of local timber and the strands can be converted to quality
panel products.
• The major development in the pulp and paper sector is a
continued increase in the use of recovered paper.
Increased customer acceptance of recycled paper and
more efficient de-inking systems have contributed to the
increased proportion of waste paper being reused. Other
technologies which may result in decreased fibre demand
per unit output are carbonation in reactor tanks, which
improves the utilization of non-wood fibres by allowing
the recovery of cooking chemicals (previously quite
difficult because of the silica in the plants), and increased
use of high-yield mechanical pulps, which have higher
yield than chemical pulps.
BOX 16Recent developments in forest products processing with potential to decrease use of raw materials
58 STATE OF THE WORLD’S FORESTS 1999
utilization of mill residues outside a few of thelarge developed countries. However, it is suspectedthat large volumes of residues are wasted or leftunused. As the Asia-Pacific Forestry Sector OutlookStudy has shown, all of these sources could make asignificant contribution to wood supply.
A third technological change which might occuris a move towards greater use of reconstitutedpanels because of two factors: upward pricepressure resulting from the increasing scarcity oflarge-diameter logs, and technologicaldevelopments in construction and other wood-using industries which would allow the use ofsuch products where only plywood or sawnwoodare currently used. This shift will also have theeffect of extending the use of resources (recoveryrates for reconstituted panels are typically higherthan for sawnwood and plywood) as well asproviding a ready market for residues from otherindustries.
Policy implicationsThe preceding analysis has discussed two broadstructural changes expected to take place in theforest sector in the future. It is not possible to beprecise about when and where these changes willtake place (many of them already have occurred inEurope, for example), but it is certain that they willoccur at some time. The important question formany forest policy-makers around the world ishow to manage the change process. The analysis offuture timber markets would suggest that threetopics – pricing, human resource development andstructural change – deserve the immediate attentionof policy-makers. (See Part II for discussion ofrecent policy and institutional changes in thesector.)
Pricing. Prices are a powerful indicator of scarcity,and when they are wrong they can lead to seriousmisallocations of investment and resources. About40 percent of the world’s timber supply comes fromprivate forests, and probably about the sameproportion of supply is sold in competitive markets(or in a way that approximates competitivemarkets). However, governments largely controlthe pricing of wood extracted from the remainder
of the forest (mostly natural forest), and prices areoften set low to stimulate industrial development.
Setting low stumpage rates may satisfy certaindevelopment objectives but also often leads toundesirable effects, some of which are beginning toappear in many countries now. Underpricing of theresource discourages efficiency in harvesting andprocessing, reduces the incentive to invest inplantations and places alternative suppliers such assmallholders and recyclers at a disadvantage. Thus,designing better pricing policies will be crucial forstimulating the broadening of supply sources andfor encouraging the efficiency improvements thatwill be required in the future.
One of the greatest challenges that forest policy-makers and forest managers will face in the futurewill be to generate the revenues necessary tofinance sustainable forest management.Competitive market-based pricing of the resourcewill be an important first step in this process.Forestry policy-makers should consider how theycan create competitive markets for the roundwoodextracted from the natural forest so that the leviesthey set reflect the market value of the resource andremove the distortion in favour of harvesting woodfrom the natural forest.
Human resource development. Forestry is a labour-intensive activity. In order to introducetechnological improvements and to meet theincreasing demands placed on the sector for betterstandards of management and harvesting, the levelof skills in the sector will have to be increaseddramatically.
This is a massive task considering how manypeople are employed in the sector. For example,employment in industrial forestry has beenestimated at approximately 1 million full-timeequivalent (FTE) jobs in developed countries and2.7 million FTE jobs in developing countries(Poschen, 1997). Furthermore, the need forupgraded skills does not stop at the productionsector. An increased range of supply sources anddesirable improvements in management,such as community involvement, will alsogenerate a need for significant upgrading of theskills of staff in many countries’ forest
PART I SITUATION AND PROSPECTS FOR FOREST CONSERVATION AND DEVELOPMENT 59
administrations and other organizations involvedin forest management.
Structural change. The final pressing need of thesector will be an increased capacity to cope with thestructural changes that are likely to take place.Many governments already have a wide range ofmeasures designed to stimulate the development ofcertain types of domestic wood processingindustries (e.g. preferential tax breaks, conditionsattached to concession contracts, export bans).These should be reviewed to take intoconsideration the expected changes in patterns ofwood supply (fewer large logs from the naturalforest, more plantation-grown wood, more recycledpaper). In addition, governments should considerthe levels of investment that will be needed tofinance the structural changes.
As noted above, forest administrations are goingto be expected to deal with a wider range of issuesin the future. To increase the social andenvironmental performance of the sector, sectionswithin forest agencies that deal with conservation,community relations, watershed management andextension will be likely to require more resources inthe future. Changes are likely to be required withinthe traditionally powerful harvesting andutilization sections of forest administrations.Officials concerned with wood supply will have toadjust to a move away from having strong controlover a small number of concessionaires, towardshaving much less control over a larger number ofsmaller suppliers. They should consider devolvingsome aspects of control to regional, local and evencommunity-based authorities, to cope with theseexpected changes. ◆
STATE OF THE WORLD’S FORESTS 1999
PART IIPOLICY, PLANNINGAND INSTITUTIONALARRANGEMENTS
PART II POLICY, PLANNING AND INSTITUTIONAL ARRANGEMENTS 61
Issues in national forestplanning, policy andlegislation
DEVELOPMENTS RELATED TONATIONAL FOREST PLANNINGProgress in national forest programmesThe significance of comprehensive national forestsector planning processes and an enabling policyenvironment to sustainable forest management isnow widely recognized. Various sector planningefforts around the world are focusing to asignificant extent on a common set of principlesand approaches, characterized as national forestprogrammes (NFPs).
“National forest programme” is a generic termfor a wide range of approaches used by countries inplanning, programming and implementing forestactivities. Among the strategic frameworksconsidered as NFPs are: national forestry actionplans started under the Tropical Forests ActionProgramme or the later country-led nationalforestry action programmes; forestry sector masterplans; forestry sector reviews; national plans tocombat desertification; national biodiversitystrategies; national environmental action plans;national environmental management strategies;national conservation strategies; and forestry or
forest components of national sustainabledevelopment strategies or national Agenda 21strategies. Some 128 countries have developed orupdated their NFPs within the past 13 years, and 13countries have initiated NFPs within the past twoyears (see Table 5 of Annex 3).
These strategic frameworks represent means ofensuring consistency between national forest plansand programmes and the recommendations of theUnited Nations Conference on Environment andDevelopment (UNCED) concerning sustainableforest management. NFPs have been endorsed bythe Intergovernmental Panel on Forests (IPF) andthe Intergovernmental Forum on Forests (IFF).
IPF endorsed the basic principles of NFPs asidentified by FAO (see Box 17). It also emphasizedthe importance of considering certain factors inimplementing NFPs, as follows:
• use of appropriate participatory mechanisms toinvolve all interested parties;
• decentralization where applicable andempowerment of regional and localgovernment structures;
• recognition and respect for traditional andcustomary rights of, inter alia, indigenousgroups, local communities, forest dwellers andforest owners;
• secure land tenure arrangements;• establishment of effective coordination
mechanisms and conflict-resolution schemes.The basic principles of NFPs as defined by FAO
(1996c) were also endorsed by IPF.The second session of IFF recognized NFPs “to be
a viable framework for addressing forest sectorissues, including implementation of the IPF’sproposals for action in a holistic, comprehensiveand multisectoral manner”. IFF agreed on theimportance of mobilizing new and additionalresources to support NFPs in developing countriesand in countries with economies in transition, in
BOX 17Basic principles of national forest
programmes
• National sovereignty and country leadership
• Consistency with national policies and international
commitments
• Integration with the country’s sustainable development
strategies
• Partnership and participation
• Holistic and intersectoral approaches
• Policy and institutional reform and capacity building
62 STATE OF THE WORLD’S FORESTS 1999
particular countries with low forest cover and withfragile forest ecosystems. IFF has asked FAO topresent the results of a survey on the status ofimplementation of NFPs in all countries concernedto the third session of IFF in May 1999.
Improved accessibility of information on forestsThe importance of accurate data and informationon forest resources for national forest planning andglobal policy dialogue is increasingly recognized.Intensified efforts are being made to identifyinformation gaps, to improve the information base,to harmonize information from different sourcesand to strengthen national capacities in informationcollection and analysis. Information managementand dissemination are also regarded as increasinglycritical. A current initiative to address the problemof information availability is the Global ForestInformation System (see Box 18).
As important as reliable information is to effortsin sustainable forest management, lack of
information should not be used as an excuse forinaction. Perfect information will never beavailable. The collection and management ofinformation is often expensive. Every country mustmake choices about what information to collect andmust weigh the potential benefit of the informationwith the cost of collecting and managing it. Somecountries will simply be unable to afford theinformation they would ideally like to have.Particularly for these countries, it will be importantto develop techniques for planning andmanagement in “information-poor” environments.
Even as the information base improves, it isimportant to recognize that information is only atool for analysis. It is the analysis that is critical forsector planning and policy formulation. Thecapacity of countries to manage and analyseinformation and to deal with varyinginterpretations of the same data will becomeincreasingly important as information becomesmore accessible.
Research (CIFOR) and the World Conservation Monitoring
Centre (WCMC) hosted a Workshop on Provision of Forest
Information on the Web at the eleventh World Forestry
Congress in October 1997. The concept of a global forest
information system was well received and the organization of
a task force to develop it was recommended. Subsequently,
the Executive Board of the International Union of Forestry
Research Organizations (IUFRO) directed one of its working
groups to organize a task force. The task force prepared a
proposal for the establishment of the Global Forest Information
System. The proposal was discussed and supported by the
International Consultation on Research and Information
Systems, which was held in Ort-Gmunden, Austria in
September 1998 as an intersessional meeting of IFF. In looking
at the range of users and their extensive demands, one thing is
quite clear: as society gains a better understanding of the value
and role of forests, the numbers of those seeking forest
information will grow, as will the list of their requirements.
The final report of the Intergovernmental Panel on Forests (IPF)
underscored the need to improve access to information on
forests: “The Panel emphasized the need to review and improve
information systems. Attention should be given to worldwide
access to information systems that would encourage effective
implementation of national forest programmes, increased
private-sector investment, efficient development and transfer
of appropriate technologies, and improved cooperation”
(Commission on Sustainable Development, 1997).
In 1997, several organizations that gather and publish
information on forests began to examine the possibility of
collaborating on a global forest information system. The
proposal for the system responded to the need for accurate,
current and accessible information on forest resources. It
implicitly recognized the growing significance of electronic
information systems, specifically the Internet, as a logical
vehicle through which this information could be shared.
To advance this idea, the Center for International Forestry
BOX 18The Global Forest Information System
PART II POLICY, PLANNING AND INSTITUTIONAL ARRANGEMENTS 63
RECENT POLICY ISSUESRapidly evolving international economicrelationships, such as trade liberalization and thedynamic movement of capital and corporationsacross borders, and above all, national policyconcerns, continue to drive national policy agendas.
Despite great variability among countries, threebroad shifts are apparent. National policy-makershave become more aware of the complex nature ofpolicy reforms and the uncertainty of their effects.The interrelationships between forests and othersectors of the economy are also better understood.Finally, there is a greater recognition that policystatements mean little in practice without stronginstitutional capacity to implement them.
Complexity and uncertain consequences offorest policy reformsDebates focusing on policies for sustainable forestmanagement have highlighted the complexity ofcause and effect relationships and the uncertainconsequences of policy reforms. During the pastfew years, policy analysts have focused on suchissues as the underlying causes of deforestation, theeffects of trade liberalization and the impact ofstructural adjustment policies, but the practicalpolicy implications of these analyses are still farfrom clear. Their differing conclusions havehighlighted the fact that the same policy measurescan produce very different results depending on thenational (and local) circumstances.
For example, there is intense argument aboutwhether trade liberalization leads to better forestmanagement and conservation or, instead, to forestdepletion. Many environmentalists warn that tradeliberalization policies facilitate the unrestrictedoperation of some transnational forest corporationsthat have a history of using economically andenvironmentally unsustainable and sociallyregressive methods of production. However,advocates of free trade argue that tradeliberalization policies result in economic expansionand that – as demonstrated by the experience ofindustrialized countries – greater income levelslead eventually to more sustainable forestmanagement.
Also, some analysts have pointed out thateconomic adjustment programmes promoted by
international institutions have augmented pressureon forest resources. They contend that theseprogrammes have often resulted in higherunemployment and the collapse of small businessenterprises, which in turn lead to unsustainable useof forest resources, i.e. increased clearing of forestsfor agriculture and/or overharvesting of forestproducts, particularly fuelwood (as people fall backon it as a household energy source). Others observethat greater economic affluence resulting fromeconomic adjustment leads to improved long-termenvironmental management and lower rates ofdeforestation and degradation.
These examples illustrate the great uncertaintyabout the consequences of national policies. It isextremely difficult to isolate the effects ofindividual policies.
Intersectoral policy linkagesThe complexity of policy effects is leading toincreased attempts to account for intersectorallinkages in the design of national forest policies.Some countries have accepted that, despiteexpected increases in agricultural productivity,additional forest lands will inevitably be convertedto agricultural uses. Relatively limited attention,however, is accorded to the design of sound policieswhich would contribute to more effective land usetransitions. The situation is similar with othersectors that have considerable impact on forests,such as mining, oil and natural gas exploitation,agribusiness expansion and infrastructuredevelopment. Attempts to integrate intersectoralconsiderations into policy design for greaterefficiency and effectiveness are still comparativelyweak. Similarly, policy reforms in other sectorsgenerally still give little importance to spillovereffects on the sustainability of forests. There have,however, been some initiatives to providecompensation in return for benefits provided byforests to other sectors. For example, Costa Rica hascreated a system of payment for hydrologicalservices of forests, and in the United States, NewYork City has created markets for forests’watershed protection services. In other cases,pressure from environmental groups has forcedpolicy-making bodies to give greater attention tothese issues.
64 STATE OF THE WORLD’S FORESTS 1999
Policy reform and the changing public/privateinterfaceVarious governments have tried to deal withweaknesses in policy implementation bybroadening the responsibilities of the private sectorand by focusing on a few key areas of the interfacebetween the public and private sectors. Somecountries have launched initiatives to privatizecontrol and management of forest resources andfunctions traditionally in the hands of the publicsector. Many governments have also attempted toimprove the interaction between the private andpublic sectors, mainly by eliminating some“perverse” subsidies, by tackling illegal andcorrupt activities and by rationalizing forestconcession policies.
Privatization. Some countries, disappointed withthe poor results and inefficiencies of governmentagencies’ management of public forest resourcesand forest-based companies, have taken someradical steps to privatize these resources. Colombiahas recognized and assigned formal property rightsto lands that have been held by rural populationsunder traditional land tenure systems. Hondurashas experimented with the privatization of largeareas of the country’s pine forests and has soldvarious public forest-based companies to privateinterests. The United Kingdom and New Zealandhave further consolidated their privatizationprogrammes started in the 1980s (see Box 19).Other countries, such as Peru, have given seriousconsideration to the privatization of a number offorest areas and functions.
Perverse subsidies. Some countries have takensteps to eliminate or substantially reduce subsidiesin the forest sector or in other sectors (e.g.transportation, agriculture and cattle ranching) thathave had unintended negative effects on forests.These policy reforms have frequently been helpedby the spread of fiscal austerity measures and insome circumstances by the reduction ofinternational markets for the subsidized products.(Arguably, this was the case of policy reforms thateliminated subsidies to cattle ranching, whichcoincided with receding international markets forbeef.)
Illegal and corrupt activities. Illegal and corruptactivities have acquired greater visibility in anumber of countries. Brazil has formed aPresidential Commission to investigate themagnitude and effect of illegal and corruptactivities in the forest sector, with a view toreducing their incidence through policy reform.Malaysia has taken decisive steps to recapturerevenues lost because some 20 unscrupulouscorporations had actively engaged in transferpricing. The World Bank has formally declared anattack on illegal activities and has begun to imposeloan conditions to induce the creation ofmechanisms for reducing the impact of corruption,based on independent third-party scrutiny.
Forest concessions. During the past few yearsBolivia, Brazil, Cameroon, Canada, Costa Rica,Malaysia, Suriname and other countries havechanged their forest concession policies in order toreduce or eliminate waste, foster more sustainableforest utilization and management and promote thewell-being of local populations. New policiesincorporate various mechanisms (which had beensuggested by experts repeatedly in the past butrarely adopted in practice) for assessing concessionvalues on the basis of timber volumes extractedrather than areas involved, for establishingperformance bonds and for supporting third-partymonitoring (see Box 20).
EMERGING TRENDS IN FORESTLEGISLATION33
As a corollary to the policy and institutionaldevelopments discussed above, recent years havewitnessed a significant acceleration in the revisionof forest-related laws around the world. Not
33 This section is based primarily on a review of laws and lawreform processes under way in Africa, Latin America, NorthAmerica and central and eastern Europe. As used in thissummary, the terms “law” and “legislation” generally refer toprincipal legislation as well as associated regulations and othersubsidiary legal documents. “Forest law” should not be thoughtof as a stand-alone body of legislation that is specific to theforestry sector. Though most countries have principal forestlaws, the legal framework governing forest resources is properlyconceived of as comprising laws covering a wide range of issuesof relevance to forests, from trade and taxation to environment,land use and agriculture.
PART II POLICY, PLANNING AND INSTITUTIONAL ARRANGEMENTS 65
Both the United Kingdom and New Zealand have privatized
significant portions of their State-owned forest resources since
the early 1980s. The approaches taken to privatization differed
between the two countries, with the United Kingdom pursuing
a gradual disposal policy and the New Zealand Government
choosing to sell most of its forest plantations over a short period.
United Kingdom
Privatization was introduced as a major policy initiative of
the incoming Conservative government in 1979. Sale of State-
owned forests started in the mid-1980s, with the intention of
rationalizing the management of the State’s 900 000-ha forest
estate. Targets for the revenue from sales of forest and the area
to be sold were set by the government (£150 million, or about
US$315 million, and 100 000 ha by the year 2000).
Forests were sold by competitive tender or negotiation. By
March 1997, the Forestry Commission had sold 66 000 ha
and raised £75 million (about US$120 million). The forests
sold were mostly the conifer plantations furthest away from
district offices or those that in some other way were difficult
to manage. Forests providing significant non-timber benefits
generally were not sold. Nevertheless, concerns began to be
raised in the early 1990s about the loss of public access to
privatized forests – outdoor recreation being a major use of
State-owned forests in the United Kingdom. In response, the
Forestry Commission initiated a policy of giving local
government the opportunity to enter into formal and legally
binding access agreements for areas of forest about to be sold.
Complete privatization of the remaining State-owned forest
estate was considered in 1994. This was rejected, however,
on the grounds that: it was unlikely that the whole resource
could be sold all at once for a reasonable amount; the sale
would be legally and administratively complicated, and thus
expensive; and the public would resist such a move.
The policy of gradual disposal therefore remained, with
annual area targets similar to before. The new Labour
government, however, has halted all sales for the time being.
New Zealand
The New Zealand Government announced in December 1987
its intention to privatize public assets that had commercial
functions, including forests. The primary reason for selling
government assets was to reduce public debt. The main
rationale for forest asset sales, however, was probably
ideological – namely, the belief that it was inappropriate for
the State to own commercial forests. Only forest plantations,
which supply most of the country’s wood production, were
sold; all publicly owned natural forests were transferred to the
Department of Conservation. A series of sales took place
between 1990 and 1996, resulting in the purchase of about
510 000 ha of forest plantations.
A major objective was to produce a more efficient,
internationally competitive forest sector. A particular concern
was the need to provide security of supplies to processors in
order to attract new investment in forestry value-adding
industries. The sale of forests to enable processors to integrate
supplier functions into their current operations was seen as a
means of achieving this end.
The process had two phases. First, government forest
plantations (and processing facilities) were transferred to a
government-owned corporation. Following the development
of commercially viable operations, the assets were put up for
sale. The purchaser bought the trees and fixed assets, but
acquired only a lease on the forest land from the government
under a tradable Crown Forestry Licence. The buyers included
New Zealand forestry corporations, several Asian-based
companies and an American company.
An important question in any privatization process is
whether the sale should be open to foreign investors. In New
Zealand the decision was relatively straightforward. Revenue
maximization was most likely to be achieved by placing as
few constraints on the process as possible and by maximizing
bidding competition. The government recognized that overseas
investors had potentially greater access to capital and were
consequently more likely to invest in new processing facilities.
This has generally proved to be the case. The entry of foreign
investors into the forestry sector has had a number of positive
effects: it has encouraged introduction of new technologies,
improved market awareness and opportunities and increased
efficiency through enhanced domestic competition. The major
drawback was a negative public perception of foreign control
of resources.
BOX 19Privatization of public forests in the United Kingdom and New Zealand
66 STATE OF THE WORLD’S FORESTS 1999
BOX 20Pricing forest concessions
The government is the main owner of forest resources in most
countries. Governments issue formal permits – forest
concessions – to individuals or private corporations to manage
certain areas of public forest for timber production. Forest
concessions grant exclusive rights to assess forest production
potential, to harvest wood or other forest products and to
manage a specified area of public forests for a certain period.
Here, the term is taken to be synonymous with “forest
utilization contracts”.
Harvesting of forests creates forest economic rents, which
are returns from forest harvesting beyond those that could be
earned by the best alternative use of productive resources
elsewhere in the economy. Governments can capture part or
all of the economic rent through a variety of forest charges,
including taxes, charges per volume harvested, area charges
and exploration fees. If these rents are not captured by
government, they accrue to private concessionaires in the form
of exceptional profits.
The amount of money paid to the government by the
concessionaire through the various forest charges often bears
little relationship to the market value of the resources and to
the forest rents generated. This unsatisfactory situation is
common in both developed and developing countries. As a
result, during the past few years several forested countries have
reformed their forest concession policies. These reforms should
increase economic efficiency, improve forest management and
lessen social and environmental impacts of concessions on
public forest lands.
Large areas of forest are under concessions in some
countries, and various companies are aggressively seeking new
concession contracts in resource-rich countries. In Guyana,
one company in 1991 obtained logging rights for almost
1.7 million hectares, or 8 percent of the country’s land area.
By 1997, about 30 percent of Guyana’s forests were reported
to be under concession contracts. More than half the closed
forests in Indonesia are managed under timber concession
schemes. In 1995, 2.4 million hectares of Suriname’s forests,
or 16 percent of the country’s resources, were under
concession management. Venezuela’s forest concessions
covered some 3 million hectares in 1995, but the five-year
National Development Plan contemplates an expansion to
10 million hectares. Virtually all of Cambodia’s forests, except
those in national parks and protected areas, are now under
forest concessions.
Various analyses have indicated that governments granting
forest concessions often capture only a small proportion of
the forest value. While the estimates (and the assumptions
used to make the estimates) are frequently debated, evidence
strongly suggests that in many cases governments capture less
than 50 percent of forest rents, and often much less.
Why is this underpricing in forest concessions important?
Underpricing encourages logging companies to use wood
wastefully because it is inexpensive. Companies may obtain
access to public forest areas that are far larger than they could
otherwise afford, and they may rush to harvest only the most
valuable wood. Inefficient wood processing companies survive
because the raw material is inexpensive. Exceptional profits
also create greater uncertainty about how long the
concessionaire will be able to hold the profitable public
concession, thus creating an incentive for quick and careless
logging. In short, underpricing of wood reduces the
concessionaire’s incentive to invest in more sustainable forest
management practices. Furthermore, and particularly in the
case of developing countries that face a chronic shortage of
funds, undercharging for timber concessions deprives
governments of a source of revenue, thus making it more
difficult for them to fulfil their responsibilities as stewards of
the nation’s forest wealth. Difficulties created by less than
satisfactory rent capture become more serious in situations
where structural adjustment policies have reduced forest
department budgets. In these situations, the need to increase
forest rent capture in timber concessions is more acute. Failure
to capture economic rents also considerably weakens the case
of forest departments in developing countries seeking increased
financial support from the national treasury or from
international donors.
Underpricing in forest concessions is one of the many
“perverse” policy interventions that make sustainable
management of forest resources difficult to achieve. Remedial
actions in forest concessions must include much more than
just getting prices right. Other dimensions of concession
policies such as the type of charge introduced (area fees,
PART II POLICY, PLANNING AND INSTITUTIONAL ARRANGEMENTS 67
volume charges, taxes, etc.), the length of concession contracts,
procedures to avoid or minimize corruption and the degree of
competition encouraged in forest markets are also important.
However, establishing prices that would increase the
government capture of economic rents is, without question,
an important step for improved forest management and
economic efficiency.
A number of countries are actively trying to introduce policy
reforms to eliminate pricing and other policy distortions in
forest concessions. In 1994, the Government of the Canadian
Province of British Columbia, convinced that forest charges
were far too low, nearly doubled stumpage prices. This led to
a dramatic 120 percent increase in forest revenues, with no
indication that less wood was harvested by private corporations
in the two years after the stumpage price increase. In 1993,
investors reportedly offered Guyana area fees that were 150
times established rates (Sizer, 1996). Cameroon, following
advice from the World Bank, implemented a bidding process
in 1995 to assign concessions. Bidding was expected to
increase competition and produce prices closer to the
economic value of timber. It did; government revenues rose
more than fourfold between 1995 and 1996. These are clear
indications that forest charges were far too low before the
policy reforms were introduced.
Similar steps taken in Costa Rica, Ghana and Malaysia
succeeded in dramatically increasing the government capture
of economic rents from forest concessions. Guyana and
Suriname have also attempted, with varying degrees of success,
to stop indiscriminate granting of forest concessions at very
low prices until procedures and institutions could be put in
place to price and administer forest concession contracts
effectively.
One may ask why such reforms have not been more
common or have not been initiated sooner. In many cases,
underpricing of wood arises from a desire to promote forest-
based industrial development, to increase log exports or to
make forest lands more accessible to poor rural populations.
At least part of the reason for the persistence of underpriced
wood in timber concessions lies in the political complexities
of introducing reforms that would increase prices to
concessionaires. The faulty forest concession systems that
predominate in many forested countries of the world owe their
existence and persistence to the influence of powerful vested
interests that benefit from the perpetuation of the agreements.
These interests exert their political muscle to prevent change.
Another plausible reason in developing countries is related to
the weakness of public forest administrations. Improved forest
pricing in forest concessions requires the institutional capacity
to assess values, to negotiate agreements and to monitor and
impose implementation of the new rules. This institutional
capacity is weak or non-existent in many developing countries.
The fact that some developing countries are effectively
implementing pricing reforms despite institutional weakness,
however, indicates that when the political will exists,
substantial improvements are feasible.
surprisingly, the results of these law reform effortshave been extremely varied. They have taken placewithin the context of vastly different legal andpolitical traditions, reflecting a wide range ofeconomic, ecological and social variables.
It is possible, nevertheless, to identify severaltrends that have achieved prominence over the lastdecade. Broadly speaking, forest law in the 1990s ismoving away from a regulatory approach focusedprimarily on government management andpolicing of forests as economic resources. Itincreasingly recognizes the multiple interestsinvolved in or affected by forest management, withgreater attention given to the environmental andsocial roles of forest resources and a new emphasis
on the involvement of a wider range of public andprivate actors.
This section reports on four areas in which areorientation of national forest laws is evident: localforest management, the environmental functions offorests, forest management planning and thegranting of forest utilization contracts.
Promoting local forest managementLocal forest management has received a great dealof attention in recent forest law reforms, especiallywith respect to community-based activities and therealignment of power and responsibilities betweencentral and local governments.
Historically, forest laws in many countries have
68 STATE OF THE WORLD’S FORESTS 1999
tended to be inhospitable to local forestmanagement. Although older laws have often givenrecognition to limited usage rights, they haveprovided little scope for local people to play ameaningful part in the planning and managementof forest resources on which they may havedepended for generations. In many cases, the Statehas arrogated this role to itself through the creationof State forests. In other contexts, national law mayhave left the tenurial status of forest areas unclear,giving weak or no legal protection to existingcommunity-based tenure systems and providing noalternative mechanisms by which local groups orindividuals might assert effective control.
Efforts to address these shortcomings in recentlegal changes have taken various forms.
First, there has been a proliferation of newmechanisms for the devolution of forestmanagement to local communities, user groups orhouseholds through site-specific arrangements suchas co-management agreements, community forestryleases, the delineation and titling of villageterritories and related devices. Nepal’s 1993 ForestAct offers a notable example of this approach,providing for the turning over of portions ofnational forest to local user groups which agree tomanage the areas in accordance with an approvedplan. A range of variations on this approach may befound in recent laws or regulations in a growingnumber of countries or jurisdictions, including (toname only a few) Cameroon, Guinea, India, Laos,Madagascar, the Philippines, South Africa, theUnited Republic of Tanzania, the Province of BritishColumbia in Canada and a number of countries inLatin America.
Second, some countries have accorded increasingrecognition to the historical land or territorialclaims of local peoples. The 1997 IndigenousPeoples’ Rights Act in the Philippines is animportant recent example of this phenomenon. Therights of indigenous communities figureprominently in several Latin American laws. Anumber of other countries, including Australia,Canada, South Africa and several countries incentral and eastern Europe, are engaged inrestoring the lands of dispossessed communitiesand individuals, which may include natural forestsor commercial plantations.
Third, as discussed in detail in the previoussection, many countries have moved to decentralizevarious aspects of forest administration to localgovernment bodies. This change may be reflectedeither specifically within forest legislation or moregenerally as part of an overall revision of localgovernment law. Again, examples can be found inall regions, from the Sahel to Southeast Asia toLatin America.
These three categories are indicative only; theydo not capture the full variety of approaches beingtried throughout the world. Moreover, they are notmutually exclusive, and often overlap or operateconcurrently. For example, in the case of severalWest African laws, where management of someforests has been decentralized to the level of thecommune, the local government may have theopportunity further to devolve management overspecific subareas through a contract with localusers.
While there is unmistakably a higher profilegiven to local forest management in recentlegislation, many of the reforms are characterizedby significant limitations and ambivalence, both onpaper and in practice. Forest authorities in somecountries, for example, have embraced the conceptof community-based management mainly in areaswhere forest resources are already depleted; there isfrequently a reluctance to share control over richer,more intact areas, even where there is evidence thatthe health of the resource is due in large part to thelong-established informal stewardship of localpeople. In many co-management schemes,government forest departments continue to retainmost of the important decision-making power,including the power to draft and approvemanagement plans and to decide about theselection of species, the marketing of harvestedproducts and the use of benefits by the contractinggroup. The long-term security of the rights grantedor recognized under local arrangements may beunclear, either because the term of the agreement isvery short or because the government has widepower to terminate the agreement for poorlydefined reasons. And in some instances, legalprovisions that appear to protect the traditionalrights of indigenous peoples may be so weakly orambiguously drafted as to be unusable.
PART II POLICY, PLANNING AND INSTITUTIONAL ARRANGEMENTS 69
In short, there is a continuing need to findworkable legal arrangements that provide orrecognize meaningful and secure rights for localforest managers while allowing a flexible responseto vastly different local conditions and anappropriate balance between various interests. It isvery likely, therefore, that this will be an area of lawthat continues to experience significant evolution inthe years ahead.
Enhancing the environmental functions of forestsEnvironmental concerns have never been absentfrom forest legislation. Nevertheless, particularly inthe aftermath of UNCED, national forest laws nowmore explicitly reflect the environmentalimportance of forests than they did in the past. Thisconcern is prominently articulated in the preambleor statement of objectives of many new laws, whichnow routinely refer to environmental objectives offorest management and to the country’sinternational environmental obligations.
How these general goals are given specific legalcontent varies greatly from country to country. Avariety of techniques is used in recent legislation:
• Inventory, planning and classificationprovisions. In recent laws these are oftenstrongly tied to environmental considerations.For example, a requirement to collect andcollate information concerning biologicaldiversity and other environmental attributesmay be included in legally mandated forestinventory provisions. Laws are alsoincreasingly specific in prescribing thatenvironmental criteria be taken intoaccount in the drafting of forest managementplans (see below). In addition, forest laws arenow more likely to contain forest classificationcategories that explicitly embodyenvironmental objectives, and to require that aforest under a given classification must bemanaged according to certain principles.Examples from recent forest laws are forestnature reserves, watershed forests and othercategories designed to protect certain forestsfrom commercial logging.
• Environmental impact assessment. This arelated tool that is finding its way into forestmanagement, either by explicit reference in
forest legislation or in more generalenvironmental legislation that would coveractivities in forest areas. In some cases, theholders of large-scale concessions are requiredto prepare environmental management plansas a condition of their contract. In Bolivia, a1996 act provides for forest inspections andaudits, which among other things wouldperiodically assess the environmental effects offorestry activities. An interesting feature of thislegislation is that it allows community forestrygroups to substitute a certification finding froman internationally accredited certificationprogramme in place of the otherwisemandated audit (Markopoulos, 1998). (To date,certification has not figured prominently inforest legislation, although it is referred to inSouth Africa’s National Forests Bill and inrecent proposals in a number of othercountries. It would not be surprising to seeincreasing references to certification in futurelegislative drafting.)
The increasingly environmental slantof forest legislation, coupled with the emergenceof environmental law in many countriesaround the world, has led in some cases tosignificant, if avoidable, legislative confusion.Forest laws and general environmental lawsare not infrequently drafted with overlappingand conflicting provisions, reflecting unclearmandates and institutional jealousies. As forestlaw continues to develop in scope and complexity,it is increasingly important for lawmakersto strive to calibrate its provisions more preciselywith related bodies of law.
Management planningForest management plans have long been a featureof forest laws. Nevertheless, there is a discernibletrend towards more widespread and detailedattention to planning in forest legislation and abroadening of the objectives of the planningprocess. Laws increasingly require planners toconsider a wide range of ecological and socialissues that might previously have been outside thepurview of traditional forest managementplanning. In addition, a hierarchy of plans may becalled for, with plans for local management units
70 STATE OF THE WORLD’S FORESTS 1999
required to be consistent with an umbrella regionalor national plan.
Planning procedures in recent forest laws canalso provide an important point of intervention forpublic participation in the design of forestmanagement. It is increasingly common for laws torequire public notice at various stages during theplanning process, opportunities to comment, publicmeetings and access to preliminary drafts of plans.
It is difficult to generalize about the legal statusaccorded to management plans. In governmentforest contexts, where a forest department isresponsible for producing a plan, laws have oftenbeen silent about the plan’s legal effect.Nevertheless, even in such cases a number of forestlaws now specifically require that administrativeaction on the part of forestry officials – such as thegranting of licences or other permissions – must beconsistent with an approved plan. In othersituations, such as timber concessions orcommunity forestry agreements, the plan may inessence be considered part of the contract itself.
Despite the prominence given to managementplans in legislation, their application on the groundhas tended to lag far behind in many countries. Inthis area, there is often a disparity between thevision of those drafting the law and the capacity ofgovernment or private forest managers toimplement it. Part of the problem may be interminology, where reference to a “managementplan” conjures up a more complicated andexpensive instrument than is feasible or desirable toprepare in a particular context. Cameroon dealswith this issue by requiring relatively simple plansin community or private forestry.
Granting of forest utilization contractsThe importance of sound policies concerning thepricing and award of concessions and other forestutilization contracts has been discussed in detailabove. From a legislative perspective, many olderforest laws and regulations are remarkably silent asto what procedures and criteria should govern theawarding of forestry contracts. As a result, in manyparts of the world the granting of forestryconcessions tends to be a secretive affair, oftenconducted at high political levels on an ad hocbasis. Not infrequently foresters find that
concessions are presented to them as a fait accompliby their political superiors, without technicalcriteria taken into account.
The general trend in recent years has been in thedirection of spelling out in some detail the stepsleading up to the awarding of a contract, sometimesin principal legislation, sometimes in regulations, ormost often in a combination of the two. Such legalframeworks set forth, for example, the basicmechanical elements of an auction and biddingsystem, such as the content of the call for bids, theform and content of submissions, deadlines anddecision-making time frames and the professionalqualifications and independence of auctioneers.Laws may also specify when government can usenon-economic criteria to distinguish amongcompeting bids. A country may, for example, wantto give weight to certain non-quantifiablecharacteristics of the bidding entity; for instance,the Bolivia law of 1996 gives certain preferences inconcession awards to indigenous people in thevicinity.
Specifying the process of awarding contracts maybe helpful in a number of ways. It promotes greatertransparency and accountability in decision-makingand helps provide a level playing field for potentialcontractors. It can also help ensure that technicalspecialists are involved in the decision-makingprocess, as opposed to simply finding decisionsfoisted on them. Finally, a well-ordered, consistentprocess of evaluating and granting contracts maybetter promote the interests of third parties and thepublic at large. It can contribute to reducing thechaos and conflict that has emerged in somecountries where carelessness or worse has led to theissuing of overlapping concessions or to the partialor complete disregard of existing rights within aconcession area.
Putting legislation into practiceThe purpose of this brief survey has been toprovide a sampling of recent developments innational forest laws. It is, of course, not exhaustivein either geographic coverage (the emphasis hasbeen on developing countries and countries intransition) or the issues discussed. As is alsoevident, the focus here has been on written law.There are of course often great discrepancies

PART II POLICY, PLANNING AND INSTITUTIONAL ARRANGEMENTS 71
between the content of law and its implementationon the ground. Any number of factors maycontribute to this discrepancy – insufficient politicalwill, weak institutional capacities, overburdenedcourt systems, the absence of suitable incentives forparticipation or compliance by stakeholders,financial difficulties, corruption, etc. These factorsdo not lessen the importance of establishing soundand coherent legal frameworks. They do serve as areminder, however, that law reform should, above
all, be an exercise in realism. Laws that rely onresources that governments do not have or thatrequire abrupt reorientations of institutional orsocial behaviour are likely to fail. Effective legalreform requires an assessment of the capacity andwillingness of government and others to implementnew legal strategies, a commitment to monitoringthe effects of legal changes over time and aresponsiveness to the results of that monitoring. ◆

72 STATE OF THE WORLD’S FORESTS 1999
Changes in national economic policies and societaldemands on forests are having direct andsubstantial impacts on government forestinstitutions and administrative arrangements forforest management. These include modifications inthe role of forest administrations, a move towardsdecentralization and changes in forest research andeducation orientations and structures.
NEW ROLE AND STRUCTURE FORFOREST ADMINISTRATIONSIn many countries, central forest administrationshave moved away from their traditional role assupreme forest guardians. In some places, thenormative functions of policy formulation havebeen separated from operational responsibilities,which increasingly have been passed to the privatesector, non-governmental organizations (NGOs)and local groups.
This deliberate shift of responsibilities away fromcentralized public management has taken fourmain forms:
• In the most extreme form of privatization,government has transferred significant areas offorest and public forest companies to theprivate sector (e.g. New Zealand and theUnited Kingdom – see Box 19, above),relinquishing to a great extent both normativeand operational responsibilities. It hasgenerally been production forests or forestswith lower social or environmental value thathave been privatized. Unprofitable andinefficient public companies have also beenprivatized.
• In a second scenario, government has kept thenormative responsibility of deciding howforest resources should be managed, but hasentrusted the private sector with implementinggovernment-designed plans, as in the case ofcontract logging.
• Central government has in other casesentrusted to local governments and local
communities the responsibility of designingand implementing forest managementstrategies and plans (see section ondecentralization which follows).
• Some governments (e.g. Ghana, Papua NewGuinea, Suriname, Uganda, Zambia andZimbabwe) have experimented with theestablishment of semi-autonomous entities andprivate-public joint ventures. Forestryadministrations in Indonesia, Malaysia andUganda have developed partnerships with theprivate sector and NGOs in such areas asresearch, extension, revenue collection andpolicy enforcement.
Many industrialized countries have movedsubstantially towards privatization anddecentralization. The shift in public forestryadministrations’ role has been more gradual indeveloping countries, where necessary policy andlegislative reform and implementation havefrequently been subject to delays, and where thehistorical context is different.
Moves towards decentralization have coincidedwith increased efforts by public administrations toinvolve a range of interest groups in public debateabout forests and in decision-making processes. Theforestry sector today is characterized by apluralistic or multistakeholder environment inwhich an increasing number of independent groups(NGOs, different levels and branches ofgovernment, rural people’s organizations, private-sector concerns, political parties, unions, etc.) aredemanding, and often obtaining, a greater role indecision-making about forests, forestry and ruraldevelopment.
These groups often have widely differingopinions, objectives and knowledge about forestry.Traditional decision-making mechanisms are beingstrained by the conflicting interests. Somemechanisms even seem on the verge of paralysis, aswitnessed by the large number of forestmanagement plans stalled in the courts in the
Evolving institutionalframework
PART II POLICY, PLANNING AND INSTITUTIONAL ARRANGEMENTS 73
United States and resistance to decisions andactions by forestry departments in manycountries.
The existence of multiple and competing interestsundoubtedly adds to the richness of the forestrydebate. It provides an institutional system of checksand balances, assuring that decisions are closelymonitored and questioned. The question is notwhether to accommodate multiple interests buthow. Without coordination and collaborativemechanisms, potential fragmentation oforganizational responsibility poses a clear risk tosustainable forestry and rural development. Manyefforts in eliciting public participation and usingparticipatory approaches have not been verysuccessful, partly because they have sometimesbeen processes of co-option and “rubber-stamping”instead of negotiation and dialogue. Methods andtools developed for participatory approaches andconflict management can be useful in developingcollaborative mechanisms (see Box 21).Communication and learning seem to be at thecentre of any attempt at coordination in pluralisticenvironments.
The role of forest institutions as facilitatorsamong a range of stakeholders has becomeincreasingly important. This is evident, for instance,in North America and Scandinavia, where forestinstitutions are becoming brokers amongcompeting positions on best approaches to forestresource utilization. Conflict managementtechniques are increasingly being used in the forestsector, at both the local and national levels and indeveloped and developing countries alike (seeBox 22).
EFFECTS OF DECENTRALIZATION ONFOREST MANAGEMENTCountries’ efforts to decentralize certain functionsof central government administrationshave included changes in the forestry sector. InWest Africa the process has taken off over the pastfew years, particularly in French-speaking countriessuch as Burkina Faso, Mali and Senegal. Bolivia andthe Philippines are also often cited as countriesactively promoting greater involvement of localgovernment in natural resource management.
A number of factors are likely to support
BOX 21Tools and fora for accommodating multiple
interests in forestry
Tools and methods have been developed to deal with
multistakeholder situations. They include:
• collaborative learning: techniques for building agreement
using tools from conflict management and multi-
disciplinary systems methodologies, which have been used
to plan and implement forest fire recovery programmes
in the United States;
• patrimonial mediation and management subsidiarity:
mechanisms for reaching agreement on historical
processes and future scenarios and for promoting
decentralization of decision-making to the lowest
competent level, which are being used in forestry
programmes in Madagascar;
• co-management of protected areas: collaborative
management which combines participatory methods with
distribution of responsibility and formal vesting of authority
in local groups and communities, as in programmes
supported by the World Conservation Union (IUCN);
• adaptive management of renewable resources:
management that consciously promotes continuous
learning and adaptation, as has been used in Queensland,
Australia and the Columbia Basin of the United States
and Canada, among other places.
These methods, although still evolving and imperfect, reflect
a growing recognition of the necessity of incorporating and
influencing social processes in forestry. They are all multistage
and iterative processes, with an emphasis on learning and
dialogue. They also accept some degree of power sharing
among interest groups.
Various fora at all levels are providing increased
opportunities for groups to interact and negotiate. These
include a whole range of local processes as well as national
forest programmes, the Intergovernmental Forum on Forests,
model forest programmes and the World Commission on
Forests and Sustainable Development (see Part III).
Despite the growing set of means for assessing multiple
interests, strengthening cooperation and developing
collaborative mechanisms, further research and development
are still needed. Accommodating multiple interests may be
complicated and will not always be successful, but it appears
to be unavoidable.
74 STATE OF THE WORLD’S FORESTS 1999
continued decentralization efforts. These includesome factors specific to the forest sector:
• the realization that in many countries forestprotection and management have not beenvery effective when centrally controlled;
• the need for clear separation of functions andsystematic organizational checks and balances;
• the inability of governments at the central levelto address adequately the growing number ofconflicts over forest resources at the local level;
• reduced budgets and staffing levels in forestservices at the central level.
Other factors are related to political processes(empowerment and participation):
• increased recognition of the rights ofindigenous people;
• the realization that in order to achieve effective
Many countries and institutions recognize the need to
understand the causes and consequences of conflicts over the
ownership, management and use of natural resources,
including forests and trees, and to incorporate conflict
management mechanisms into natural resource planning and
management. Conflict management is based on a dialogue
leading to a mutually acceptable solution. Institutions around
the world are focusing on capacity building, community
empowerment and policy and legislative reform in support of
this approach.
In Asia, for example, the Regional Community Forestry
Training Centre (RECOFTC) in Bangkok, Thailand is developing
a conflict resolution training manual series, which covers basic
resolution techniques as well as intervention skills for dealing
with environmental, economic, gender and cultural conflicts.
Other institutions working on capacity building for conflict
management are Environment and Development in the Third
World Sahel and West Africa’s Forum de groupes de recherche
action formative (ENDA GRAF Sahel), working with national
networks in West Africa, and the Universidad de la Paz in
Costa Rica and the Universidad Politécnica Salesiana in
Ecuador which have developed training programmes.
It is necessary to reduce power disparities before parties
can engage in effective dialogue. Women and marginalized
groups in particular are often disadvantaged in this respect. In
Ecuador, Bolivia and Peru, a working group involving the
Instituto Latinoamericano de Investigaciones Sociales (ILDIS),
IUCN, FAO’s Forests, Trees and People Programme (FTPP) and
other institutions has helped indigenous communities
strengthen their positions and negotiating skills in conflicts
with oil companies over petroleum exploitation in forest areas.
In Ecuador, the process has resulted in the creation of an
Environmental Technical Committee with representatives of
the indigenous peoples, the oil company and the government.
National laws that recognize and support community-based
forest management and property rights, such as the newly
enacted Indigenous Peoples’ Rights Act of 1997 in the
Philippines, provide a means for more equitable processing
of conflicts. Moreover, conflict management techniques can
be used to formulate policy in a participatory manner. For
example, the Fundación Futuro Latinoamericano (FFLA), a
private organization based in Ecuador and specialized in
conflict resolution and participatory policy review processes,
facilitated negotiation of the revision of Bolivia’s forestry
legislation.
BOX 22Natural resource conflict management
forest management, all stakeholders need to beinvolved in the decision-making process;
• a desire to promote more equitable sharing ofbenefits from forest resources;
• growing pressure for greater access to, andcontrol over, forest resources by local entities(local authorities, community-based groups,forest user groups, etc.).
Others are related to national or internationalpriorities:
• the desire to promote more balanced socio-economic development in a national context;
• increased pressure by donor countries forcountries to engage in decentralizationprocesses.
The impact of decentralization on naturalresource management is difficult to assess, partly
PART II POLICY, PLANNING AND INSTITUTIONAL ARRANGEMENTS 75
because it has been initiated only relatively recently.In addition, the decentralization process differsfrom country to country and from sector to sector,which makes comparison and evaluation betweencountries, or even between sectors in the samecountry, difficult. Analysis is also hindered by thevariability in capacity and resources of the lowerlevels of government, communities and newlycreated governance entities to whom the power andresponsibility are given.
Although it may still be too early to conduct athorough assessment of the impact ofdecentralization on forest management, certainlessons are emerging. Often, when authority andresponsibility have been shifted to the locallevel, additional human and financial resourcescommensurate with the new responsibilitieshave not been provided. This was the case withthe Integrated Social Forestry (ISF) programmein the Philippines. The Department ofEnvironment and Natural Resources, prior to theLocal Governance Code of 1991, recommendedthat the ISF programme be decentralized so as tobe more responsive to diverse local needs andconditions. When decentralization was officiallyimplemented, however, not all the provincesreceived their share of personnel, materials andequipment. Without adequate human, financialand technical resources, local governments haddifficulties coping with the volume anddemands of ISF activities. In addition, localgovernments assigned low priority to ISF, aswith other non-revenue generating projects.Several years after the Local Governance Codehad been enacted, it was found that theperformance of ISF projects had declined.
This example and experiences elsewhere, such asin Bolivia (see Box 23), illustrate that certainconditions need to be met for decentralization tohave a positive impact on forest management.These include:
• sufficient transfer of authority, in addition toresponsibility, from central forestry agencies tothe local level;
• sufficient financial resources and mechanismsfor generation of local revenue accompanyingthe transfer of responsibilities (i.e. fiscaldecentralization);
BOX 23Decentralization: the example of Bolivia
With the expectation that decentralization could lead to more
efficient natural resource management, several Latin American
countries have recently transferred rights and responsibilities
for forest management and conservation to municipal and
lower-level local governments. Nowhere has this process gone
as far as in Bolivia. The country’s 1994 Popular Participation
Law devolved a broad range of responsibilities to municipal
governments, including education, health and urban
infrastructure, and guaranteed them a certain percentage of
the national budget. The 1996 Forestry Law allocated 20
percent of public forests to municipal administrations for use
by community groups and gave local governments direct
control over 25 percent of the royalties from these forest
concessions.
The impacts of these changes so far have been mixed.
Previously marginalized groups, such as indigenous people,
small farmers and small-scale timber producers, have benefited
from increased access to forest resources and from greater
opportunity to influence municipal governments on decisions
related to local forest management. Several municipalities have
established municipal forestry units, and local governments
have become more involved in a wide variety of activities
related to forest management, agroforestry, protected areas and
land use planning.
Not all local groups, however, have been equally well
positioned to take advantage of the opportunities, and
improvements in forest management have not always been
achieved. Important problems remain, such as weak technical
and managerial skills within both local governments and
communities, and the lack of necessary external support,
particularly from national and departmental governments, to
strengthen local capacities. The overall policy context is
insufficient to allow local groups to exercise their legal rights
and responsibilities fully, and as a result has tended to stymie
local forest management initiatives.
Decentralization has sometimes given local communities
the means needed to protect their resources well, while on
other occasions it has enabled the misuse of power by local
groups and individuals which has sometimes led to forest
degradation.
76 STATE OF THE WORLD’S FORESTS 1999
efforts. As already indicated, mechanisms must beput in place to ensure that adequate financialresources are made available to responsibledecentralized institutions and that financial returnsfrom forestry activities are equitably distributed.An adequate central regulatory structure must alsobe in place to ensure that laws and regulations arefollowed.
Although it is still early for full assessment of theimpact of decentralization on management offorests and other natural resources, experience hasshown that when greater decision-making powerand more secure rights are transferred to the locallevel, with clear definition of roles andresponsibilities, natural resource managementtends to be more sustainable and effective.
TRENDS IN FORESTRY RESEARCH ANDTECHNOLOGY TRANSFERForestry research is being called upon to addressthe needs of a larger array of users in moretechnical fields than ever before. Variousinstitutional changes, however, are affecting theability of forestry research in both developing anddeveloped countries to meet these needs.
In many developing countries, research capabilityis inadequately developed, existing researchinstitutions are weak, access to information is poorand research tends to be fragmented and narrowlyfocused on traditional topics. Strengthening nationalforest research systems is more than ever animportant priority. Various economic and policyreforms, including structural adjustment,decentralization and privatization, however, riskhaving the opposite effect.
Ongoing structural adjustment efforts in manysub-Saharan African countries, as elsewhere, haveled to the downsizing of public institutions.National agricultural research systems (NARS), ofwhich forestry research is a component, have alsobeen restructured. The prevailing trend has been todecentralize agricultural research by transferringnational research staff to regional multidisciplinaryresearch programmes within the country. Whilejustified in principle, this decentralization may infact weaken national capacity in forestry research,at least over the short term, by diluting a body ofexpertise already below the critical mass.
• adequate administrative and technical capacityfor handling new responsibilities;
• reliable accountability mechanisms in place;• a clear definition of what should be transferred
and how, as well as to whom the transfershould be made.
With growing momentum for decentralization itis anticipated that local communities will havebetter opportunities for negotiating a greater role inmanaging and benefiting from local forestresources. The process is expected to allow localgovernments to be more responsive andaccountable to the needs of local stakeholders. Theunderlying assumption is that local institutions willhave a greater sense of responsibility forstewardship of forest resources, in part because thiswill be linked to a greater share of the benefits.Many cases today, such as the forest user groups inNepal, illustrate this point. Decentralization ofmanagement responsibilities to local groups hasresulted in rehabilitation of degraded lands,planting of new forests and improved forestmanagement efforts.
While decentralization is showing many positivesigns of leading to more efficient and sustainableforest management, particularly by providing moreopportunities for local involvement in decision-making, it carries potential risks. When rights andresponsibilities for forest management aretransferred to the district or municipal level, centralgovernment control and support are often reduced.The potential exists for the local élite or specialinterest groups to gain control of themanagement of forest resources. One way to guardagainst this result is to ensure that whererepresentative, equitable and accountable traditionalsystems of local governance exist, they are includedin decision-making on management of forestresources. It is also important that adequate localcapacity, information and trained personnel be inplace to ensure that new responsibilities areeffectively met at the local level.
Moreover, clear enabling policies are needed, andlegislative systems and institutions must becoordinated, to provide a supportive and well-understood framework to achieve sustainable forestmanagement and to create incentives at the locallevel to harmonize development and conservation
PART II POLICY, PLANNING AND INSTITUTIONAL ARRANGEMENTS 77
One way in which development projects havetried to compensate for weak national researchcapabilities is to include a research component intheir activities. Although this has an invigoratingeffect on the particular field of research during theproject’s life, the benefits are unsustainable ifpermanent national forest research institutions areunable to participate in the activities and tocapitalize on the results, as is often the case.
New institutional arrangements in forestryresearch are emerging in some developingcountries to help compensate for reducedgovernment support (FAO, 1997k; FAO/FORSPA,1998). Universities, which have been found to beimportant but underutilized reservoirs of expertise(Kowero and Spilsbury, 1997), NGOs and theprivate sector are becoming more active in forestryresearch. While these developments are positive inprinciple, whether they will result in greaterresearch efficiency and effectiveness will depend ongood coordination among these groups and theability to capitalize on their relative strengths andexpertise. Another significant change is thatresearch programmes are being forced to be moreaccountable to end users as users are becomingbetter organized and as governments increasinglyinsist on cost recovery or cost-sharing approaches.
Research is being privatized and decentralized insome industrialized countries as well. The resultshave been mixed. Decentralization often leads todecreased support for research because regionaland provincial governments tend to assign lowpriority to long-term activities. Privatization ofresearch in some countries, and the private sector’sinvolvement in an increasing proportion of researchin others, is resulting in a shift towards adaptiveresearch to meet immediate and commerciallyoriented needs. Partnerships between privatecompanies and universities are also changing thenature of university research programmes frombasic to more applied research. While a more needs-oriented targeting of research effort is a positivedevelopment, the risk is that insufficient supportwill be given to basic and long-term scientificresearch (needed as a foundation for appliedresearch) and to research addressing social andenvironmental needs.
At the international level, the forestry and
agroforestry research programmes of the Center forInternational Forestry Research (CIFOR), theInternational Centre for Research in Agroforestry(ICRAF) and the International Plant GeneticResources Institute (IPGRI) continue to developsteadily, while programmes of some otherinternational agricultural research centres (IARCs)of the Consultative Group on InternationalAgricultural Research (CGIAR) system haveexperienced major cuts. CIFOR, ICRAF and IPGRI,by mandate, focus on strategic and applied researchat the global level, which they carry out incollaboration with regional and national researchinstitutions. The results need to be adapted to localconditions by the national research systems. Weakresearch capacity at the national level, however, isrecognized by the IARCs as an important constraintto widespread application of their research results.
An important effort to mobilize the worldscientific community around agricultural researchand in turn to help strengthen national researchcapacity in developing countries resulted in theestablishment of the Global Forum on AgriculturalResearch (GFAR) in 1996. GFAR provides aframework for partnership between IARCs,research institutes (both public and private) inindustrialized countries and NARS in developingcountries. NARS are represented in GFAR byregional or subregional fora on agriculturalresearch. Although in principle these fora coverforestry research, they are still concerned almostexclusively with agricultural research in the narrowsense. GFAR could help strengthen forestryresearch at all levels, but only if adequate attentionis given to the forest and environment sector.
Although national, regional and internationalfora continue to discuss what research needs to do(i.e. priorities for research), questions on how to doit (i.e. institutional arrangements) have becomemore important in recent years. Increasingly,research institutions are involving research users inphases from programming through implementationof research and are developing improvedmethodologies to ensure effective and acceleratedtransfer of research results.
A major evolution in thought about technologytransfer has occurred over the past decade. It ismore commonly recognized that the solutions for

78 STATE OF THE WORLD’S FORESTS 1999
problems are not always technical. Not everyconstraint to sustainable forest management can bealleviated by the transfer of technology. Policyenvironments favourable to sustainable forestmanagement and to the implementation oftechnologies are as important as the technologiesthemselves.
Transfer of technology is no longer seen asunidirectional, e.g. from developed to developingcountries or from technical institutions to usercommunities. Means of encouraging lateral andeven upward transfer of technology andopportunities for more South-South exchange ofinformation are increasingly being sought. In somecases, participatory technology development (basedon the active participation of recipients indevelopment and adaptation of technology) may bemore effective and sustainable than the transfer oftechnology developed elsewhere. The value oftraditional forest-related knowledge is alsobecoming more widely recognized. Significantopportunities exist for transfer of this traditionalknowledge and environmentally sound localtechnologies. However, the lack of adequateprotection of intellectual property rights and thusof the means to reward the supplier of knowledgeis an important concern.
Participatory and problem-solving extensionsystems which accommodate the skills andknowledge of many partners are seen as essential totechnology and human resource development forresponsible forest management. In many countries,however, such systems for forestry are justemerging.
The Intergovernmental Panel on Forestsdeveloped proposals for action to improve researchand transfer of technology at the global andregional levels. Further discussion is beingundertaken by the Intergovernmental Forum onForests. The second session of IFF (Geneva,Switzerland, August to September 1998) addressedquestions of transfer of environmentally soundtechnologies. Issues that were stressed includedpartnerships among the public and private sectors,South-South collaboration, enabling policyenvironments, financing opportunities and bothindigenous and modern technologies. Discussion ofresearch issues is scheduled for IFF’s third session
(Geneva, May 1999). The points for considerationwill be based on the results of the InternationalConsultation on Research and Information Systems,an intersessional meeting held in Ort-Gmunden,Austria in September 1998. Issues addressed at thismeeting included prioritization of research topics,capacity building, financing, global and regionalresearch networks and global research systems.
The years to come will be crucial for forestryresearch and for the effectiveness with which theresults are used in development. The two majorcurrent international initiatives – the establishmentof GFAR and the international dialogue on forestsled by IFF – can significantly influence the directionof forestry research and development. The greatchallenges will be to ensure that mechanisms areput in place for strengthening research capacities atall levels; that technology transfer issues areaddressed; that research and technology transferare driven by need and not by supply; and thatinternational support is focused not on areas ofresearch perceived as “politically correct” but onresearch required to facilitate long-term capacitydevelopment.
PREPARING FORESTERS FOR CHANGE:ADAPTING EDUCATION AND TRAININGPROGRAMMES TO NEW DEMANDSTraditional forestry education has continued to beunder pressure to evolve in response to newemphases in forest management and to changes inthe job market. Educational institutions areexpected to produce forestry graduates with awider array of knowledge and skills than everbefore. The complex and dynamic nature ofsustainable forest management requires forestmanagers who have an expanded set of skills, areadaptable and are responsive to changingsituations. The private sector and NGOs, which areincreasingly important employers in the forestrysector, are looking for graduates with specific skillsthat were less needed in the past. Curriculumreform, expanded continuing educationopportunities and a reconceptualization of thelearning environment are some of the responses tothe new demands.
Curriculum reform is probably the most obviouschange in forestry education. A 1996 survey
PART II POLICY, PLANNING AND INSTITUTIONAL ARRANGEMENTS 79
showed that more than 200 of the 750 forestryeducation and training institutions surveyedrevised their curricula during the period 1989 to1995 (FAO, 1996d). Revised forestry curricula tendto place increased emphasis on such subjects asecology, environmental sciences, natural resourcemanagement, community forestry, agroforestry,marketing, management and administration. Someof the curriculum reform incorporates newtechniques, learning models and styles, such asinterdisciplinary problem-solving approaches, inaddition to new content. In Malaysia, curriculawere revised as part of a redesigning effort forforestry education which included the developmentof a strategic plan and the restructuring of facultyand departments. In the Czech Republic, as in othercountries in transition, forestry curricula are beingmodified in response to dramatic shifts in forestownership patterns and other changes broughtabout by economic and political restructuring. TheCzech Republic’s education system, which wasformerly nationally uniform, has been diversifiedand adjusted to individual regions so as to be moreapplicable to their respective circumstances.
Meaningful curriculum revision remains difficult,however. Traditional but still important subjects,such as harvesting and transport systems, must stillbe taught while new subjects are added. Difficulttrade-offs are necessary. In a survey of its graduatesconducted by the Tropical Agriculture Research andHigher Education Center (CATIE), 96 percentthought that the profession’s future lay in theprivate sector, while 91 percent stated that littletraining was received in management andadministration – skills in demand by the privatesector.
Adult learning and continuing educationprogrammes have become increasingly importantas a mechanism to fulfil demands for new skills.Employers of new graduates may need to providepreservice training programmes on specific subjectsnot covered by their formal training. There is also agrowing reliance on continuing education orin-service training to give mid-career personnelnew knowledge and skills.
Opportunities for learning outside the classroomare also increasing. Distance learning providesacademic structure but flexibility as to place and
time of learning. New information andcommunication technologies, such as the Internet,provide immediate access to unprecedentedquantities of information and education resources.They are contributing to a reassessment of time andspace in education, through concepts such asinstitutions without walls and learning as a lifelongendeavour. These technologies and their rapid paceof evolution, as well as other changes, arecontributing to an inversion of the traditionallearning pyramid, older professionals having tolook to younger ones for information, training andadvice.
Significant changes are coming about as a resultof both decreased public support for forestryeducation and training and increased involvementof the private sector and NGOs in these activities.New strategic alliances between public and privateinstitutions are emerging in some places. ForKom, aforestry forum in Indonesia involving private forestcompanies, government agencies, the ForestryTraining College and international donors, is anexample of informal coordination for humanresource development in the forestry sector. Insome places, private companies are co-sponsoringcourses with universities in subjects of interest tothem.
Despite the positive developments indicatedabove, overall education has been slow to adapt tonew demands and far more change is still needed.Traditional institutions will be forced to exploreways of being more flexible such as allowing coursework from a broader range of disciplines andgiving credit for work experience and training atdifferent institutions. Continuing education andin-service training programmes will have to bemore frequent and will have to be designed andimplemented better. Adult education and trainingapproaches that will help foresters continue to learnand to update their skills will be increasinglyimportant. Dynamic partnerships and alliancesamong a range of organizations – private sector,public sector and non-governmental – indevelopment of training and educationprogrammes, while becoming increasinglycommon, will require encouragement. ◆
STATE OF THE WORLD’S FORESTS 1999
PART IIITHE INTERNATIONALDIALOGUE ANDINITIATIVES ONFORESTS
PART III THE INTERNATIONAL DIALOGUE AND INITIATIVES ON FORESTS 81
UNCED follow-up: anupdate of the IPF/IFFprocess
Forests were among the most controversialissues considered at the United Nations
Conference on Environment and Development(UNCED) in Rio de Janeiro, Brazil in June 1992. Theprevailing North-South polarization concerningforests did not permit agreements beyond the textof the “Non-Legally Binding AuthoritativeStatement of Principles for a Global Consensus onthe Management, Conservation and SustainableDevelopment of All Types of Forests” (the so-called“Forest Principles”) and Chapter 11 of Agenda 21(“Combating deforestation”).
By contrast, the “post-Rio” period 1992 to 1995was one of confidence building and emergingNorth-South partnerships. This climate enabled theUnited Nations Commission on SustainableDevelopment (CSD) to establish theIntergovernmental Panel on Forests (IPF) at its thirdsession in April 1995. IPF was set up for a two-yearperiod and tasked with furthering the initiativesstarted at UNCED and encouraging internationalconsensus on key issues related to forests.
By the time IPF completed its work in February1997, it had developed over 100 negotiatedproposals for action on issues related to sustainableforest management, including national forestprogrammes; forest assessment; criteria andindicators; traditional forest-related knowledge;and underlying causes of deforestation. Theseproposals for action have received worldwiderecognition and endorsement by a large number ofintergovernmental and professional fora, including:the fifth session of CSD, Earth Summit +5 (theSpecial Session of the General Assembly to Reviewand Appraise the Implementation of Agenda 21 –UNGASS); the United Nations Economic and SocialCouncil (ECOSOC); the 1997 session of FAO’sCommittee on Forestry (COFO); the InternationalTropical Timber Council (ITTC); the fourthConference of the Parties to the Convention on
Biological Diversity; the meeting of theCommonwealth Heads of Government inEdinburgh, United Kingdom 1997; the G8 Summitin Birmingham, United Kingdom; and the thirdMinisterial Conference on the Protection of Forestsin Europe (see below for more details).
Other indirect effects of the IPF process included:• increasingly consistent instructions to
intergovernmental organizations from theirgoverning bodies on their forest-relatedactivities;
• strengthened international networks amongforesters, including English-, French- andPortuguese-speaking foresters’ associations;
• increased attention to the valuation ofenvironmental services of forests, as illustratedby the recognition of the significant role offorests in mitigating global climate change bythe Kyoto Protocol of the FrameworkConvention on Climate Change (see below);
• review by many countries (e.g. Australia,Canada, Costa Rica, Denmark andSwitzerland, as well as the co-sponsors of theSix-Country Initiative34) of their forest policiesand national forest programmes in the contextof IPF’s conclusions and proposals for action.
The outcome of IPF was endorsed by the fifthsession of CSD in April 1997. Various matters,however, were left pending, including issuesrelated to finance and transfer of technology, tradeand environment, institutions and legal
34 The Six-Country Initiative was an effort made in 1997-1998 byFinland, Germany, Indonesia, Honduras, Uganda and the UnitedKingdom to review the implementation of IPF proposals foraction at the national level. The initiative culminated at theInternational Expert Meeting on Putting the IPF Proposals forAction into Practice at the National Level, held in Baden-Baden,Germany in July 1998. The national case studies prepared andthe results of the Baden-Baden meeting have been noted by thesecond session of IFF.
82 STATE OF THE WORLD’S FORESTS 1999
instruments. In view of these remaining issues,UNGASS, held in June 1997, recommended acontinuation of the intergovernmental policydialogue on forests. Subsequently, ECOSOC, at itsmeeting in Geneva in July 1997, decided toestablish the ad hoc open-ended IntergovernmentalForum on Forests (IFF) under CSD. IFF will submita progress report to the seventh session of CSD in1999 and its final report to the eighth session ofCSD in 2000.
IFF’s first session (October 1997) established itsprogramme of work, which falls into three maincategories:
• implementation of IPF’s proposals for action;• addressing issues on which international
consensus has yet to be achieved, includingfinance and technology transfer, trade andenvironment, underlying causes of
deforestation and forest degradation,rehabilitation of forest cover and conservation,traditional forest-related knowledge, valuationof forests and the use of economic instruments;
• identification of possible elements of, and worktowards, consensus on internationalarrangements and mechanisms for themanagement, conservation and sustainabledevelopment of forests, such as a legallybinding instrument on all types of forests (seesection on issues and options for internationalinstruments, below).
Two bodies were instrumental in IPF’s work andcontinue to support the intergovernmental processthrough IFF: the Interagency Task Force on Forests(ITFF),35 set up in 1995 to ensure coherent supportto IFF by the UN system; and the Forestry AdvisersGroup (composed of forest advisers ofdevelopment agencies from donor countries),which helps ensure consistency betweeninternational cooperation programmes and IPFproposals.
To structure the support from the UN agencies,ITFF prepared and presented to UNGASS in June1997 an implementation plan for the IPF proposalsaddressed to international organizations. This plan,entitled “Interagency partnership on forests:implementation of IPF proposals for action by theITFF”, indicates the agency that will take the leadfor each proposal for action (see Box 24).
The Forestry Advisers Group has attempted tostructure international cooperation so that it isconsistent with IPF’s proposals for action. Inaddition, it has agreed to give high priority tosupporting national forest programmes.
The second session of IFF (Geneva, Switzerland,August to September 1998) included review ofprogress on implementation of IPF proposals;substantive discussions on trade and environment,transfer of technology and forest-related work of
BOX 24Lead agencies responsible for coordinating
follow-up to IPF proposals for action
• FAO: national forest and land use programmes; fragile
ecosystems affected by desertification and drought; impact
of airborne pollution on forests; assessment of the multiple
benefits of all types of forest; criteria and indicators for
sustainable forest management; technology transfer for
sustainable forest management (originally under
UNDP).
• United Nations Environment Programme (UNEP):
underlying causes of deforestation and land degradation;
needs and requirements of countries with low forest
cover.
• Secretariat of the Convention on Biological Diversity
(CBD): traditional forest-related knowledge.
• United Nations Development Programme (UNDP):
international cooperation in financial assistance.
• Center for International Forestry Research (CIFOR):
forestry research.
• World Bank: methodologies for the proper valuation of
the multiple benefits of forests.
• International Tropical Timber Organization (ITTO): trade
and environment relating to forest goods and services.
35 ITFF consists of the following organizations: the Center forInternational Forestry Research (CIFOR); FAO; the InternationalTropical Timber Organization (ITTO); the Secretariat of theConvention on Biological Diversity (CBD); the United NationsDepartment for Social and Economic Affairs; the United NationsDevelopment Programme (UNDP); the United NationsEnvironment Programme (UNEP); and the World Bank.
PART III THE INTERNATIONAL DIALOGUE AND INITIATIVES ON FORESTS 83
international and regional organizations and thatbeing carried out under existing instruments; andbackground discussions on the programmeelements scheduled for substantive discussion atIFF’s third session (May 1999). In addition, specialattention was paid to the needs of developingcountries with low forest cover. Many criticalissues, however, remained unresolved,including:
• the modalities of financial cooperation, transferof technology, the mutually supportive role oftrade and environment in the context ofsustainable forest management and addressingthe underlying causes of deforestation;
• mechanisms for mobilizing the best availableinformation and strengthening research todevelop innovative and effective approaches tomanaging forests as ecological systems;
• the adequacy of present institutions and
mechanisms for meeting the complexchallenges related to forests.
Various planned government-led initiativesrelated to these and other issues were announced.
Because of divergent views among countries, ageneral agreement regarding the need for a globallegally binding instrument on forests remainedelusive. A government-led initiative on the thirdcategory of IFF’s programme of work wasannounced by the governments of Costa Rica andCanada. This initiative will consist of expertmeetings and regional consultations oninternational arrangements and mechanisms topromote the management, conservation andsustainable development of all types of forests. Thefirst global meeting is scheduled to take place inCosta Rica in February 1999, to be followed byregional consultations and a final meeting inCanada in 2000. ◆

84 STATE OF THE WORLD’S FORESTS 1999
DEVELOPMENTS IN INTERNATIONALCONVENTIONS AND AGREEMENTS36
Framework Convention on Climate Change(FCCC)FCCC, which was adopted at UNCED in 1992, aimsat stabilizing the concentration of greenhouse gasesin the atmosphere in an effort to prevent human-caused disturbances of the global climatic system.The Convention commits its Parties to carry outnational inventories of greenhouse gas emissionsand sinks and to work towards meeting theirvoluntary emission reduction goals. Under FCCC, apilot phase for “activities implemented jointly”(AIJ) has been established to test and evaluate thefeasibility of achieving the Convention’s objectivesthrough cooperative projects between Parties,which are designed to avoid, sequester or reducegreenhouse gas emissions. As of 30 August 1998,there were 97 AIJ projects, of which 14 were in theforest sector.37
The Kyoto Protocol, adopted at the thirdConference of the Parties (Kyoto, December 1997)and awaiting ratification, has taken further steps byestablishing legally binding emission reductioncommitments for Annex I countries (developedcountries and countries with economies intransition). The Kyoto Protocol makes explicitreference to land use change and forestry underseveral of its articles. (See also the section onenvironmental and social services of forests inPart I.) The agreements reached give industrializedcountries incentives to invest in forestry activitiesthat increase carbon sequestration or reduce carbonemissions from forests. Under the Protocol, alimited list of activities in the land use change andforestry sector can be used to meet the nationalemissions commitments. Credit towards meetingnational commitments can also be given forinvestment in other countries. Annex I countriesmay transfer to, or acquire from, other Annex I
countries’ emission reduction units resulting fromprojects to reduce greenhouse gas emissions or toenhance greenhouse gas sinks (Article 6). Annex Icountries may also invest in emission reductionprojects in non-Annex I countries (most developingcountries) through the Clean DevelopmentMechanism (CDM) (Article 12), although the extentto which CDM will include land use change andforestry activities is not yet clear.
While many details of how these mechanismswill function remain to be clarified, the possibilitiesfor forestry investment appear promising. Underthe Kyoto Protocol, developed countries havecontinued motivation to reduce emissions fromdeforestation and to enhance carbon sequestration.Should the decision be taken to include land usechange and forestry activities under CDM, carbonoffset projects may offer opportunities todeveloping countries for increased investment inpriority forestry activities, technology transfer,reduced petroleum imports, job creation,institutional capacity development and local socialand environmental benefits.
By request of the FCCC Subsidiary Body forScientific and Technical Advice (SBSTA) at its eighthsession (June 1998), the Intergovernmental Panel onClimate Change (IPCC) will produce by June 2000 aspecial report on carbon emissions from sources andremovals by sinks from land use, land use changeand forestry, to help clarify the implications of theKyoto Protocol for land use sectors, including theforest sector.
Other global and regionalinitiatives in support ofsustainable forest management
36 The status of ratification of these international conventions andagreements is provided in Table 5 of Annex 3.37 These include all projects which have been accepted, approvedor endorsed. The forest-sector projects include those listed underthe project types “afforestation”, “reforestation” and “forestpreservation”, although some components of energy-sectorprojects may include forestry-related activities. The source of thisinformation is the FCCC website: http://www.unfccc.de.
PART III THE INTERNATIONAL DIALOGUE AND INITIATIVES ON FORESTS 85
Convention on Biological Diversity (CBD)The fourth Conference of the Parties to CBD washeld in Bratislava, Slovakia from 4 to 15 May 1998.Important agreements were reached oninternational work programmes related to forestbiological diversity and marine and coastal areaecosystems, and on the need to complete a protocolon biosafety. Decisions were also taken regardingthe assessment of ongoing activities inagrobiodiversity, the importance of the traditionalknowledge of indigenous peoples, the equitablesharing of benefits from the use of geneticresources, and the development of a clearing-housemechanism and incentives for the conservation andsustainable use of biological diversity.
The programme of work on forests, the result of athree-year planning effort in three phases,addresses the development of ecosystemapproaches to conservation and sustainable use ofbiodiversity; analysis of the influence of humanactivities; methodologies needed for elaborationand implementation of criteria and indicators;measures to mitigate biological diversity losses; andecological landscape models, including protectedareas.
Many delegations noted that the proposedprogramme framework needs further elaboration tobecome more action oriented. CBD’s SubsidiaryBody on Scientific, Technical and TechnologicalAdvice was requested to report to the sixthConference of the Parties on the status and trendsof forest biological diversity and options for theconservation and sustainable use of forestbiological diversity.
United Nations Convention to CombatDesertification (UNCCD)The first Conference of the Parties to UNCCD washeld in Rome from 29 September to 9 October 1997.The conference secured financial resources tosupport the secretariat, chose the host country andcity (Bonn, Germany), decided on the chair and themembers of the Committee on Science andTechnology, and designated the International Fundfor Agricultural Development (IFAD) as the host forthe Global Mechanism of UNCCD, a coordinatingand implementation-promoting body.
A number of countries, including Burkina Faso,
Cape Verde, Chile, China, Mali and Senegal, havebegun implementing their National Action Plans.Others (Mali, Tunisia and Uganda) have initiatedplanning of Convention-related initiatives. Thesecretariat has a portfolio of countries in Africa, Asiaand Latin America in which to promoteimplementation of the Convention. Several meetingsheld in preparation for the second Conference of theParties (Dakar, Senegal, November 1998) havesuggested setting up thematic networks to promoteinformation exchange and technical cooperationamong developing countries in the areas covered byUNCCD.
Convention on International Trade in EndangeredSpecies of Wild Fauna and Flora (CITES)Activities connected with CITES’s listing of someendangered forest tree species have continued to bediscussed in CITES meetings and in a number ofother fora. Although several tree species have beenlisted on CITES appendices for many years(including Swietenia humilis and Swietenia mahagoni),the subject has become increasingly controversial inrecent years with proposals for listing tree speciesof major commercial importance.
A proposal by Costa Rica to list big-leafmahogany (Swietenia macrophylla) on Appendix IIIof CITES took effect in 1995. Bolivia and Brazilfollowed suit; the listing of their populations ofS. macrophylla on Appendix III became effective in1998. Appendix III, in practice, implies that thecountry or countries listing the species must issueexport permits and others trading in the speciesmust issue a certificate of origin. As a result, otherexporting countries must now issue certificates oforigin for their exports of big-leaf mahoganysawlogs, sawnwood and veneers. At the tenthConference of the Parties to CITES (Harare,Zimbabwe, June 1997), Bolivia and the UnitedStates proposed that S. macrophylla be listed onAppendix II, which would imply stricter traderestrictions than Appendix III, but the proposal wasdefeated.
Concern has been expressed that the listing ofspecies under CITES will not, on its own, help saveendangered species or populations from extinction.Listing should help promote active protection ormanagement to conserve and enhance the genetic
86 STATE OF THE WORLD’S FORESTS 1999
resources under threat of extinction or geneticdepletion. Many member countries have stressedthat the listing of species should be based on factualand reliable information on threats, distribution,ecology and the genetic variation of speciesconcerned.
These and related concerns were addressed at aMahogany Working Group meeting held in June1998 in Brasilia, Brazil as follow-up to the tenthConference of the Parties. The meeting discussedimportant topics such as the status of mahogany inthe Amazon countries, policies and managementpractices for mahogany and internationalcooperation and trade. The meeting recommendeda number of actions that would improvecooperation, especially among the Amazoncountries.
International Tropical Timber Agreement (ITTA)The new ITTA 1994, which came into force on1 January 1997, has been signed by 28 producercountries, 25 consumer countries and the EuropeanUnion, giving the International Tropical TimberOrganization (ITTO) a total membership of 54 (seelisting in Table 5 of Annex 3). The agreementremains in force for four years (to 2001) with twothree-year extensions possible, which effectivelygive it a ten-year life.
The current agreement has a greater focus onsustainable forest management than did theprevious one (1985 to 1995). The central focus ofITTO’s work now is the “Year 2000 Objective”,under which all producer countries have made thecommitment to have their exports of tropical timberand tropical timber products come from sustainablymanaged sources by the year 2000. Consumermember countries have also made a commitment tohave their forests under sustainable managementby 2000. A new fund, the Bali Partnership Fund, hasbeen created to help producing member countriesimplement sustainable forest management. To date,members have committed about US$12 million (ofwhich US$11.5 million is from Japan); its paymentis pending the finalization of the rules foroperation.
Among the issues currently being addressed byITTO are the updating of ITTO’s criteria andindicators for sustainable management of natural
tropical forests; forest fires; market access; andmarket difficulties created by the current Asianeconomic crisis. There is concern that the Asiancrisis could hamper producers’ efforts to improveforest management practices, thus underminingattempts to achieve ITTO’s Year 2000 Objective.
DEVELOPMENTS IN CRITERIA ANDINDICATORS FOR SUSTAINABLE FORESTMANAGEMENTProgress in international processesCriteria and indicators are tools for assessingnational trends in forest conditions and forestmanagement. Whereas “criteria” define theessential components of sustainable forestmanagement, “indicators” are ways to measure ordescribe a criterion. Together they provide acommon framework for describing, monitoring andevaluating progress towards sustainable forestmanagement.
More than 150 countries are currentlyparticipating in international processes aimed at thedevelopment and implementation of national-levelcriteria and indicators for sustainable forestmanagement. These efforts are grouped into sevenregional and ecoregional initiatives, as follows:
• ITTO, covering the 28 tropical timberproducing members of ITTO;
• the Helsinki Process (or Pan-EuropeanProcess), covering temperate, boreal andMediterranean forests of 37 European countries(including the Russian Federation) and theEuropean Union;
• the Montreal Process, covering temperate andboreal forests in 12 non-European countries;
• the Tarapoto Proposal, covering tropical forestsin the eight member countries of the AmazonCooperation Treaty;
• the Dry-Zone Africa Process, for dry-zoneforests in 28 sub-Saharan countries;
• the Near East Process, for dry-zone forests in30 Near East countries;
• the Central American Process of Lepaterique,covering all types of forests in the sevenmember countries of the Central AmericanCommission on Environment andDevelopment (CCAD) and Cuba.
While the initiatives differ somewhat in content
PART III THE INTERNATIONAL DIALOGUE AND INITIATIVES ON FORESTS 87
and/or structure,38 they are similar in objectivesand approach. They all incorporate, in somefashion, the following fundamental elements ofcriteria for sustainable forest management: extent offorest resources; biological diversity; forest healthand vitality; productive functions of forests;protective functions of forests; socio-economicbenefits and needs; and legal, policy andinstitutional framework.
The initiatives are in various stages ofdevelopment and implementation, ranging frominitial data collection and reporting on indicators tofield testing and consideration of subnationalcriteria and indicators. Apart from the continuingefforts to refine indicators, the major emphasis ofmost of the initiatives over the past two years hasbeen the evaluation of the relevance of the criteriaand the applicability of the indicators in the light ofeconomic, ecological, social, political andinstitutional conditions and the needs of themember countries. A number of regional andnational meetings and validation workshops havebeen held for this purpose over the past two years.In addition, the Montreal Process released its firstapproximation report on implementation in 1997,which examines the relevance of the criteria andindicators to the individual countries.
Other recent developments include a review ofthe activities related to criteria and indicators forEuropean forests at the Third MinisterialConference on the Protection of Forests in Europe(Lisbon, Portugal, June 1998). The ministersformally adopted the six Pan-European criteria forsustainable forest management and agreed todevelop further the existing Pan-Europeanindicators. The voluntary framework ofrecommendations for sustainable forestmanagement for practical use (Pan-EuropeanOperational Level Guidelines for Sustainable ForestManagement) was endorsed, and a commitmentwas made to the implementation of furtheractivities in support of the Helsinki Process. It is
noteworthy that almost all the national reportspresented at the Lisbon conference explicitly linkedrecent changes in their laws and institutions (manypassed since 1993) to the Helsinki criteria. Theformulation of the criteria for good forestmanagement through the Helsinki Process seems tohave resulted in the convergence of Europeancountries regarding management goals andminimum standards.
ITTO, through an Expert Panel established in1997 by ITTC, has revised its criteria for sustainabletropical forest management in line with recenttrends and international developments in the field.ITTC finalized the draft document Criteria andindicators for the measurement of sustainablemanagement of natural tropical forests in Libreville,Gabon in May 1998.
Activities at the forest management unit levelNational and forest management unit (FMU) levelcriteria and indicators should be linked andcompatible with one another to ensure consistencyof approaches for improved forest management. Anumber of initiatives are under way to identifyindicators at the FMU level, including thefollowing.
• The Center for International Forestry Research(CIFOR) is coordinating a project on theidentification and testing of indicators forsustainable forest management at the FMUlevel, with field activities in Brazil, Cameroon,Côte d’Ivoire, India and Indonesia.
• ITTO has financed projects to test sustainableforest management indicators in Brazil,Cameroon, Colombia, Congo, Ecuador, Gabon,Kalimantan (Indonesia), Panama, PeninsularMalaysia, Peru and Sarawak.
• The African Timber Organization (ATO), in aneffort to promote sustainable forestmanagement in its member countries, hasidentified five principles, two subprinciples, 26criteria and 60 indicators for sustainable forestmanagement at the regional and nationallevels. It has supported the testing of theindicators at the FMU level in Cameroon, theCongo, Côte d’Ivoire, the Democratic Republicof the Congo, Gabon and Ghana.
The International Union of Forestry Research
38 Differences among the existing initiatives include the numberof national-level criteria (from six in the Helsinki Process to eightin the Central America Process); the level of assessmentconsidered (mostly national, but some initiatives include criteriaand indicators for the forest management unit level and/orregional or global level); and the number and array of indicators.
88 STATE OF THE WORLD’S FORESTS 1999
Organizations (IUFRO), in collaboration with FAOand CIFOR, organized an international conference,Fostering Stakeholder Input to AdvanceDevelopment of Scientifically Based Indicators, inMelbourne, Australia in August 1998. Theconference recommended ways of furtherdeveloping scientifically based indicators forsustainable forest management at the FMU level.
While work has progressed rapidly onconceptualization, elaboration and testing ofcriteria and indicators for sustainable forestmanagement at the regional and ecoregional levels,with adaption at the national level, additional effortis needed in national- and subnational-levelimplementation of the criteria and indicators.Opportunities exist for increased cross-initiativesupport, in which the more experienced processes(i.e. Montreal, Pan-European) could provideadditional advice and assistance to the more recentprocesses.
OTHER INITIATIVESThe G8 countries’ action programme on forestsThe Heads of State of the G8 countries (Canada,France, Germany, Italy, Japan, the RussianFederation, the United Kingdom and the UnitedStates) first proposed the creation of an actionprogramme on forests at their summit in Denver,United States in June 1997. It was subsequentlyapproved at the next summit, held in Birmingham,United Kingdom in May 1998. The actionprogramme commits the G8 countries to take actionin five programme areas:
• Monitoring and assessment of forests:monitoring and assessment of G8 forests usingagreed national criteria and indicators; supportof FRA 2000; working with partner countries tobuild national forest assessment capacity;improving access to remote sensing data andgeographic information system technology.
• National forest programmes: encouragingpartner countries to develop effective nationalprogrammes; focusing technical and financialassistance on countries that give priority tosustainable forest management; improvingin-country donor coordination.
• Protected areas: working to achieve consensuson the purposes and categories of protected
forest areas; identification of key forest typesnot sufficiently represented in protected areasystems; strengthening the effectiveness ofprotected area management.
• Private sector: encouraging the private sectorto develop voluntary codes of conduct thatsupport sustainable forest management;promoting private investment in sustainableforest management, including innovativefinancing mechanisms.
• Illegal logging: sharing information andassessments on the nature and extent ofinternational trade in illegally harvestedtimber; implementation of effective measuresto combat bribery and corruption ininternational business transactions.
Model and demonstration forestsWithin the framework of the International ModelForest Network, coordinated by Canada, “modelforest areas” have been established in severalcountries, including Canada, Mexico, the RussianFederation and the United States. Argentina,Austria, Chile, China, Ecuador, Indonesia, Japan,Malaysia, the Republic of Karelia in the RussianFederation and Viet Nam are also in the process ofestablishing model forests. These forests,representing diverse environmental, social andeconomic conditions, provide an opportunity forcomparing concepts and methods and for trainingin forest management. The network has continuedto develop local indicators for assessing the effectsof management actions and refining approaches toassessment of the costs and benefits of sustainableforest management.
Another network, which has similar objectives,has been developed by the Tropical AgricultureResearch and Higher Education Center (CATIE) inthe Central American region under theDemonstration Forest Management Areas initiative.
Eleventh World Forestry CongressThe eleventh World Forestry Congress, hosted byTurkey and organized by Turkey’s Ministry ofForestry, was held in Antalya from 13 to 22 October1997. The World Forestry Congress is held onaverage every six years, with the support of FAO,and serves as an important technical forum and
PART III THE INTERNATIONAL DIALOGUE AND INITIATIVES ON FORESTS 89
benchmark for developments in the forestry sector.The eleventh congress represented the largestglobal forestry meeting ever held, attended by over4 400 participants from 149 countries. The generaltheme was “Forestry for sustainable development:towards the twenty-first century”. An informalMinisterial Meeting, attended by ministers offorestry or their representatives from over50 countries, and three satellite meetings (conflictmanagement, the role of forestry in combatingdesertification, and the seventeenth session of SilvaMediterranea) were held before the congress. Theresults of the congress are recorded in the AntalyaDeclaration (see Box 25) and in the conclusions andrecommendations of the technical sessions.39
Silva Mediterranea: 50 years of regional forestrycollaborationSilva Mediterranea, which in 1998 celebrated itsfiftieth year as an FAO statutory body, serves as anexample of long-term regional collaboration in theforestry sector. As early as 1911 the idea of
Mediterranean forestry cooperation was discussed,and in 1922 a Mediterranean forestry league wasestablished under the name “Silva Mediterranea”.In 1948, Silva Mediterranea evolved into a statutorybody of FAO, officially called the Committee onMediterranean Forestry Questions. This committee,now consisting of 25 member countries borderingthe Mediterranean Sea, as well as the EuropeanUnion, provides a mechanism for theMediterranean countries to meet, share theirexperiences and set cooperative programmes.Among other activities, Silva Mediterranea hasdrafted a strategic framework – the MediterraneanForest Action Programme – to assist Mediterraneancountries in setting their forest policies. This bodynot only encourages coordinated efforts in themanagement of Mediterranean forests, but alsohelps raise their visibility, promoting awareness oftheir richness, fragility and susceptibility to threat.
The Antalya Declaration, which was endorsed by the
participants of the eleventh World Forestry Congress, called
upon countries to demonstrate increased political will to
overcome the obstacles to achieving sustainable forest
management; upon forestry professionals to respond to the
challenges to achieve sustainable forest management; and
upon countries and the international donor community to
mobilize financial resources and promote environmentally
sound and appropriate technology transfer.
The Declaration stressed the importance of raising public
awareness of the vital roles of forests to society and of the
problems facing them. It supported the implementation of the
IPF proposals for action and continued international forest
policy dialogue. The Declaration called upon countries to
adopt a more cross-sectoral approach to national policies, and
to prepare and implement both national forest programmes
and national plans for combating desertification. It endorsed
improved integration of non-traded forest benefits into markets
and the equitable distribution of related costs and benefits. It
called for increased attention to the role of women and youth
in forestry, and more open and participatory partnerships
between all interested parties.
The Declaration called upon research organizations to
identify and undertake priority research activities, upon
countries to develop and apply national-level criteria and
indicators for sustainable forest management and to strengthen
national forest inventory and monitoring systems, and upon
forest industries to adopt and implement voluntary codes of
conduct to contribute to sustainable forest management. It also
called for strengthened programmes and supportive policy
environments in many technical areas, including community
forestry and agroforestry programmes, fast-growing tree
plantations, prevention and response to wildfires, rehabilitation
of degraded forest land, and conservation and use of biological
diversity.
BOX 25The Antalya Declaration
39 The congress proceedings are available through FAO’s website(http://www.fao.org) as well as on CD-ROM.
90 STATE OF THE WORLD’S FORESTS 1999
International NGOs and private-sector initiativesPrivate sector. Industry has reacted to theglobalization of forestry and forest issues andheightened environmental awareness and concernin a number of ways. It is becoming increasinglyinvolved in initiatives at the national, regional andglobal levels (e.g. IFF, FCCC) which are likely tohave an impact on the forest industry’s financialposition and/or image. Industry is makingsignificant voluntary efforts to be responsive to thedemands of its customers and the public at large forimproved management of the forests under itscontrol and for environmentally soundmanufacturing technologies. Companies’ initiativesare being reported to the public and shareholdersthrough company and industry reports. Thesevoluntary initiatives represent an importantcontribution to efforts to achieve sustainable forestmanagement and illustrate industry’s efforts to beenvironmentally responsible. The following arethree examples of private-sector actions.
Industry-led forest management programmes areappearing in many countries around the world. Forexample, the American Forest and PaperAssociation’s Sustainable Forestry Initiative has seta recognized standard for the industry across theUnited States. In Canada, the industry hasundertaken a programme aimed at biologicaldiversity conservation through sound forestmanagement and protection of endangered andthreatened species. The private sector is alsoactively supporting sustainable forest managementinitiatives in various developing countries, asillustrated by some examples in Malaysia. TheMalaysian Timber Council (MTC), although notdirectly responsible for the formulation ofcertification standards in Malaysia, is contributingto the government’s certification efforts. MTC isrepresenting the interests of the Malaysian timberindustry and addressing the issues faced by theindustry in moving towards sustainable forestmanagement. BP Malaysia has adopted a nation-wide tree planting initiative, in line with theMalaysian national greening campaign. Freeseedlings are being distributed with the objective ofplanting 3 million trees by the year 2000, while anumber of parallel initiatives are being contractedout to private companies. In addition, private
bodies, such as the Malaysian Business Council forSustainable Development and the MalaysianInternational Chamber of Commerce and Industry,sponsor environmental awards to encourageimproved environmental performance of Malaysiancompanies.
ISO 14001, one of the environmentalmanagement system standards developed by theInternational Organization for Standardization(ISO) to assist companies in improving theirenvironmental performance, is rapidly beingadopted by industry in various countries (bothdeveloped and developing). These standards applyto both forest operations and forest productmanufacturing processes. When the ISO 14001standard is combined with a framework forsustainable forest management, such as criteria andindicators of the Helsinki, Montreal and otherregional processes (see preceding discussion in thissection), it can become an important globallyrecognized platform for independently auditedforest management certification. This is theconclusion of the ISO Working Group 2 reportrecently approved by ISO Technical Committee 207.An example of a certification system in line withthis thinking is the Canadian StandardAssociation’s system (CSA 808 and CSA 809). Othercountries are moving in similar ways (seediscussion on certification in Part I).
Industry representatives from around the worldare meeting with greater frequency to exchangeviews and are working together throughorganizations such as the World Business Councilfor Sustainable Development (WBCSD), the FAOAdvisory Committee on Paper and Wood Productsand other less formal fora. Industry representativesrecognize the need to portray their concerns in theinternational forest policy debate in a moreconcerted way, to the extent that financialconsiderations allow. There is no doubt, however,that the private sector will continue makingprogress towards responsible forest management,forest products production and trade.
NGOs. Non-governmental organizations arehaving an increasing influence on both global andnational forest policy by shaping public opinion,engaging in field programmes and lobbying in
PART III THE INTERNATIONAL DIALOGUE AND INITIATIVES ON FORESTS 91
decision-making fora. Conservation and ruraldevelopment NGOs now represent the opinions ofsignificant numbers of people in countriesthroughout the world. The NGOs vary widely, fromNorth-based conservation NGOs withmemberships numbering in the tens or hundreds ofthousands, to poorly funded grassrootsorganizations in developing countries working onlocal issues that often concern human rights asmuch as forest conservation.
NGOs represent a wide range of opinions, fromextremely radical to very conservative. Sometimesquite different NGOs collaborate. There have alsobeen disagreements. For example, organizationsinterested in human rights and others working onwildlife conservation have differed over issues ofindigenous people in protected areas.
Despite this diversity, there are somerecognizable trends in approaches taken by NGOs.Since the early 1990s, attention has broadened fromthe tropics to temperate and boreal forests, and to amore general concern with sustainable forestmanagement. Increasingly, NGOs are consciouslytrying to balance the needs of human populationswith environmental concerns, and many aremoving towards a solutions-based approach toforest conservation, rather than grounding theiractions in opposition to aspects of current practices.As a result, new partnerships – some which wouldhave seemed highly unlikely a decade ago – havearisen between NGOs and others, such asgovernments, private corporations and groups offorest dwellers. For example, the World Wide Fundfor Nature (WWF) and the World ConservationUnion (IUCN) recently spent two years drawing upa detailed picture of forests in the future and astrategy for realizing this vision, published asForests for life (Dudley, Gilmour and Jeanrenaud,1996). This strategy, which identifies clear targetsfor progress, has since received the backing of morethan 20 governments (with respect to protected areatargets), the World Bank and the G8 Summit inDenver, United States in June 1997. The recentsigning of an agreement between WWF and theWorld Bank is a significant example of an alliancebetween apparently unlikely partners. Thedevelopment of forest certification and the ForestStewardship Council is another example in which
NGOs have worked with forest industry and foresttrade (traditional “enemies”), along withgovernments, forestry workers and indigenouspeople, on policies that can benefit all partiesconcerned.
Not all NGOs support this approach. There iscurrently considerable debate about the extent towhich NGOs should ally themselves with otherbodies (e.g. industry through forest certification) orshould remain as “outsiders” to promote positivechange. While some are seeking greatercollaboration, others are intensifying direct action,such as groups blocking logging roads andoccupying offices of companies importingendangered timber species. Some of these lattergroups reject the more established NGOs. Anotherquestion is how much time to devote tointernational processes, such as CBD and IFF.Should NGOs become a part of the decision-making process or remain as a pressure on thisprocess? The enormous variety of NGOs aroundthe world ensures that different groups willcontinue to fill different roles.
The World Commission on Forests and SustainableDevelopment. The World Commission on Forestsand Sustainable Development (WCFSD), anindependent body of 25 scientists, policy-makersand international specialists from the North andSouth, was established in 1995. In 1996 and 1997WCFSD held regional public hearings in Africa,Asia, Europe, Latin America, North America andthe Russian Federation to gain a better idea ofperceptions about how forests should be managed,for what purposes and for whose benefit. Thehearings, which involved representatives from awide range of interest groups, focused on thepolitical constraints to implementing policy reformsaimed at sustainable forest management and on theinteractions among groups that determine forestmanagement outcomes in the political arena. Byinvolving civil society in the debate about globalforests, the hearings have provided a usefulcomplement to intergovernmental processes. Thework of the commission concluded in 1998. Itsreport was due to be released in late 1998 or 1999. ◆
92 STATE OF THE WORLD’S FORESTS 1999
BACKGROUNDThe notion of international forest regulation had itsroots in two proposals put forward in 1990: one fora global forest convention, and the other for a forestprotocol within the climate change convention.Support for a forest convention increased,particularly among the G7 countries. With this inmind, the Global Legislators Organization for aBalanced Environment (GLOBE) published a modelConvention for the Conservation and Wise Use ofForests in early 1992. The hope of various countriesthat UNCED would produce an international forestconvention later that year, however, provedpremature; long-running disagreements, especiallybetween developed and developing countries, hadbecome strongly polarized. Countries had – andstill have – very different perspectives on whatconstitute global issues. In part, a country’sviewpoint depends on the size of its forest assetsand its perceived developmental need to transformsome of these assets into other forms of capital. It isalso a function of how far the country wishes totreat forests as global commons, as opposed tosovereign domain.
Although a legally binding agreement on forestswas not secured, UNCED did produce several legalinstruments, both “soft” and “hard” (see Box 26),with direct – if not comprehensive – bearing on theuse and management of forests. The RioDeclaration establishes general principles to guideStates in a new “equitable global partnership” inmatters of environment and development. The Rioprinciples call for environmental protection to forman integral part of development and for theelimination of unsustainable patterns of production
and consumption. Agenda 21 highlights the cross-sectoral nature of forests and underlines theimportance of forests in providing socio-economicbenefits as well as environmental services. TheForest Principles reaffirm the sovereign right ofStates to use their forest resources to meet their ownneeds, while acknowledging that the incrementalcosts associated with sustainable developmentmust be shared equitably by the internationalcommunity. The Forest Principles do not, however,identify the global aspects of sustainable forestry. Inaddition to soft-law instruments, UNCED agreedon the terms of three conventions (CBD, FCCC andUNCCD) which are relevant to, but not solelyconcerned with, forests and forestry.
These international environmental agreementsheralded a period of consensus-building on forestswhich coalesced around the newly established UNCommission on Sustainable Development. CSDwas mandated by ECOSOC to promote theincorporation of the Forest Principles into theimplementation of Agenda 21. When CSDestablished IPF in 1995, it directed IPF to examinefuture legal instruments as one of its five categoriesof work. It was not until IPF’s final session inFebruary 1997, however, that this mandate wassubstantively addressed. It became clear then thatpositions on the subject had shifted somewhat;some countries which previously had been opposedto extending binding forest law were able toconsider and even support a legal instrument.Many, however, remained unconvinced. CSDsubsequently directed IFF to continue thedeliberations on the subject started by IPF, as one ofits three categories of work.
Issues and options forinternationalinstruments to supportsustainable forestmanagement
PART III THE INTERNATIONAL DIALOGUE AND INITIATIVES ON FORESTS 93
ANALYSIS OF THE ADEQUACY OF LEGALINSTRUMENTSWorldwide agreement on what constitutessustainable forest management at both the nationaland forest management unit levels has progressedconsiderably. Various international processescurrently working to develop and implementnational-level criteria and indicators of sustainableforest management and other efforts to identifyindicators for the forest management unit haveresulted in considerable convergence of opinion asto what sustainable forest management means inpractice. The progress at these two levels has
underscored the need to addressthe global dimensions ofsustainable forest management.Failure to ensure sustainable forestmanagement globally willundermine national andsubnational initiatives.
A priority at this stage is toaddress the following questions.What forest issues are best dealtwith by international law? Arecurrent instruments adequate? Dothey need to be improved? Are newinstruments required? If so, whatform or forms are mostappropriate?
The first step is to distinguishpurely global issues from those thatare local and national, which isoften difficult. Also, the“additionality” component needs tobe identified, i.e. what a nation (orcompany or group) has to do toprovide for regional or globalneeds, beyond what it would do tosecure national or local forest goodsand services. Reaching agreementon this may be difficult.
The next step is to considerwhich of the global issues identifiedcan be dealt with only by means ofinternational action. For thoseissues, the question is whetherexisting international law is
sufficient. If not, there are three broad options:• “hard law” – taking the form of either forest-
specific protocols which extend the obligationsdefined in related (environmental,developmental and social) conventions, or astand-alone agreement (i.e. a forest convention)– which would serve primarily to develop anddefine specific extranational obligations;
• “soft law”, such as the Forest Principles andmodalities of international cooperation, whichmight build on the IPF Proposals for Action;
• civil society movements, such as forestcertification.
BOX 26Definitions of ”hard” and “soft” law
The names of different types of “hard law” tend to reflect
negotiating procedure or degree of formality. For example,
terms such as “treaty”, “convention”, “protocol”, “agreement”,
“arrangement” and “statute” are often used interchangeably.
“Convention” refers to a formal legal instrument of a
multilateral character. The term also includes instruments
adopted by the organs of international institutions such as the
International Labour Conference. It is interchangeable with
“treaty”.
The Vienna Convention of Treaties defines “treaty” as “a
formal international agreement concluded between States in
written form and governed by international law, whether
embodied in a single instrument or in two or more related
instruments and whatever its particular designation”.
A “protocol” is normally treated as an instrument subsidiary
to a convention, or a supplementary treaty concluded at a
later date; it is of independent character and operation to the
convention and subject to independent ratification.
“Soft law” instruments such as intergovernmental principles
(e.g. the Forest Principles) or frameworks for action (e.g. IPF’s
Proposals for Action) are not legally binding. However, they
reflect consensus, negotiated agreement, political endorsement
and commitment. Obligations are no more than moral.
However, if extensively used, soft law can gain greater legal
weight by its cumulative impact on international customary law.
94 STATE OF THE WORLD’S FORESTS 1999
IDENTIFYING INTERNATIONAL FORESTISSUESTwo central issues that international forest law iswell placed to address are: security of globalservices and other benefits from forests; and cross-border activities and conditions which affect theprovision of, or access to, forest goods and services,whether of global, regional, national or local value.These global and cross-border issues can bedistinguished from those that are common to manycountries but have essentially a local or nationalnature.
The concept of security of specific forest goodsand services is important in clarifying the purposeof future international legal instruments. Whatpeople get from forests – and the equitabledistribution of associated costs and benefits –matters more than the amount of forest land ordeforestation statistics (which have dominatedmuch international discussion).
The security and maintenance of global servicesfrom forests are important for humanity as a whole.These services include:
• carbon storage/sequestration for mitigation ofglobal climate change;
• conservation of biological diversity;• maintenance of the hydrological cycle and soil
conservation;• maintenance of natural heritage and existence
value;• maintenance of forest-related cultural and
spiritual values and knowledge.Although forests fall under domestic jurisdiction,
in recent years nations have increasinglyacknowledged the “global commons” nature offorests, recognizing the global community’sdependence on certain forest functions.International agreements could define nationalobligations or create incentives for the provision ofglobal forest services, for which new “markets”could develop and which could provide the basisfor compensation payments. At present, it isdifficult to identify and harness individualcountries’ willingness to pay for these services.Markets for global services could tip the balance infavour of sustainable forestry, which often provides
these services anyway, but which (at present) is notalways rewarded for doing so by timber revenuesalone. Some markets for forest services, notably forcarbon offsets and bioprospecting, have recentlydeveloped, offering useful lessons.
A well-established tenet of international law isthat nations are responsible for ensuring thatactivities within their jurisdiction or control do notharm the environment of other nations. Cross-border activities – such as trade, aid, foreigninvestment, forest operations of foreign companiesand pollution – have huge potential to either helpor hinder the security of forest goods and servicesat any level, from local to global. The internationallegal means to ensure that such activities by onenation (or, indeed, one company) do not createnegative impacts in another country are currentlyinsufficient, especially in regard to environmentalservices of forests. The challenge is to determinewhat kinds of measures (e.g. agreed standards foroperations and procedures, such as environmentalimpact assessment and codes of practice) ormultilateral institutional arrangements might bemost effective to address the activities. Cross-border problems have tended to be most effectivelyaddressed through regional agreements in the firstinstance (e.g. the UN Economic Commission forEurope’s Long-Range Transboundary Air PollutionConvention).
PREREQUISITES FOR FURTHER PROGRESSFive prerequisites will facilitate further progress,regardless of which intergovernmental or civilsociety options (including the status quo) areselected.
Agreement on criteria and indicators ofsustainable forestryThis is necessary so that all relevant internationalinstruments, whatever their locus and form, can becalibrated meaningfully, so that protocols for theircommunication, payments (for services or ascompensation), planning, monitoring andverification can be consistent and can incorporatethe critical dimensions of sustainable forestry. Thus,continued support of current efforts to develop
PART III THE INTERNATIONAL DIALOGUE AND INITIATIVES ON FORESTS 95
criteria and indicators of sustainable forestmanagement at the national and forestmanagement unit level will be important.
Performance and/or gap analysis of internationalinstruments and institutions affecting forests andtheir links to national and local needsAny counterproductive policies and proceduresshould be especially noted.
Development of participatory national forestprogrammes and international mechanisms todisseminate information on themCountries need to be clear about what they seekfrom, and what they can offer to, the internationalcommunity, while also promoting sustainabilityand equitability within the nation itself. Strong,stakeholder-driven national forest programmes andassociated multistakeholder processes will befundamental to advancing intergovernmentaldiscussions. Until such national processes are underway and the trade-offs between interest groups areunderstood, countries will not be well prepared toagree upon analogous trade-offs at the global level.There is a need to ensure that such programmes arenot merely wish-lists, but rather that they buildupon promising local institutions and mechanismsto reconcile power and potentials for better forestry.
Continued and strengthened engagement inmacro- and extrasectoral national policyprocessesThe sustainability of forests is highly dependent onprocesses connected to causes of forest problemsbut emanating from outside the forest sector (e.g.trade and agricultural policy). Engagement withthem is essential, whatever mix of internationalmeasures is in place.
Involvement in broader trade and developmentagreements related to international causes offorest problemsProblems linked to trade, aid, foreign investmentand pollution have root causes which cannot betackled solely by international forest agreements.The global issue of indigenous and minority
people’s rights is a similar case. International forestinitiatives clearly need to provide specific inputs onthese important issues to bodies such as CSD, theOrganisation for Economic Co-operation andDevelopment (OECD) and the World TradeOrganization (WTO) and to coordinate fully withthem.
OPTIONS FOR AN INTERNATIONALFOREST REGIMEFour options are laid out here, with no judgementoffered on which would be most effective. Analysisand debate by nations as suggested above is criticalbefore any decisions can be made. The first threeoptions cover the status quo or modifications of it.The fourth option touches on the more ambitiousoption of a global forest convention.
Working through existing conventions andagreements to secure global services and tomitigate harmful cross-border activitiesThe maintenance and security of some global forestservices are provided for by existing globalenvironmental agreements, notably those coveringbiological diversity conservation (CBD and CITES),wilderness heritage (World Heritage Convention),carbon and climate moderation (FCCC) andprotection against desertification (UNCCD). Theseenvironmental agreements are increasingly havingdevelopmental implications.
CBD provides for forest conservation, notablythrough setting aside of representative protectedareas, but also in the context of sustainable use,rehabilitation and restoration, and equitable accessand benefit sharing. As such, the convention iscompatible with the requirements of sustainableforest management. Although forest-basedbiological diversity is only a part of its concerns, theconvention has many provisions that can supportglobal services provided by forests, irrespective ofwhether or not a special forests protocol beestablished under it. CBD confirms a country’ssovereign rights to access and use of biologicaldiversity in its territory, and calls for equitabledistribution of the benefits derived from usinggenetic resources. The convention requires national
96 STATE OF THE WORLD’S FORESTS 1999
plans and procedures to integrate biologicaldiversity concerns into sectoral activities. Althoughit confirms the “global commons” aspect ofbiological diversity, which paves the way for globalpayments, adequate incentive mechanisms relatedto forest use are yet to be established. There arelarge areas of overlap between the CBD provisionsand the Forest Principles, suggesting the possiblevalue of a forest protocol under CBD to solidifyobligations for forest conservation and someaspects of sustainable use.
FCCC emphasizes the role of forests as carbonsources and sinks. Through its JointImplementation projects and the CleanDevelopment Mechanism, the convention isdeveloping implementation and payment protocolscovering forest offsets paid for by parties in othercountries. Further development of criteria andindicators of sustainable forest management andimproved carbon accounting may help widen theoptions beyond large afforestation or set-asideschemes to include also more complex local forestmanagement and agroforestry schemes as carbonoffset projects. Although a protocol for forestsunder FCCC might be effective for regulatingbiomass and carbon issues, it would not covermany other forest services.
UNCCD is less focused on specific forest issues,but it emphasizes integrated approaches whichaddress the socio-economic, physical and biologicalaspects of desertification. By requiring nationalplans and calling for decentralized resourcemanagement, UNCCD has the potential to integratelocal and global forest needs. However, it is notapplicable to many countries and biomes, and itdoes not provide comprehensive coverage of allforest services on a global level.
The International Tropical Timber Agreement is alegally binding commodity agreement on tropicalforest product trade. As the first commodityagreement to incorporate principles, and nowtargets, for conserving the resource on which thecommodity depends (i.e. tropical forests), ITTA hasmany elements of a legal agreement on tropicalforest management (although reportingmechanisms are not rigorous and there are few realincentives or penalties).
Despite the obvious value of these conventionsfor forests, relying mainly on this option for aninternational regime on forests would havelimitations. Most of the environmental instrumentsare relatively new and are not yet fully operational.While several international agreements deal withmany global services from forests, they do notcover all of them. In addition, controls on cross-border activities (trade, aid, foreign investment,corporate forestry practices and pollution) are veryweak. Finally, there are differences in degree ofpolitical commitment, availability of resources forimplementation, willingness to pay for the globalforest services the instruments provide for,effectiveness and equity of obligations andincentives, and speed and timeliness of actions.
Many parties have been reluctant to let one of theexisting conventions (notably CBD and FCCC) takethe leading role in an international forest regimebecause they do not wish forests to be treatedprimarily as environmental concerns. Suchcountries (and corporations) – particularly thosethat value forests highly as economic assets to bemaintained, increased or transformed into otherforms of capital as best suits the nation – stress theneed to consider forests’ multiple benefits togetherso that they can be integrated or traded offaccording to complex needs. Furthermore, theprospect that parts of the spectrum of benefits andpurposes of forests could be divided up andgoverned by different international instrumentsand bodies is cause for concern to those whobelieve that forests have suffered from being treatedin a piecemeal fashion.
Relying on “soft law” and civil society processesNon-legally binding, or “soft law”, approaches tendto be employed where room is required tomanoeuvre and to experiment. Their main use is asframeworks for action. These approaches are usefulin times of rapid market and social change anduncertainty, where local conditions vary greatly andwhere consensus has not been reached. Theseconditions characterize many forest issues today,which explains why soft law has been over the pastdecade, and continues to be, the predominantapproach used. Even as soft law, the Forest
PART III THE INTERNATIONAL DIALOGUE AND INITIATIVES ON FORESTS 97
Principles and Agenda 21 have increasingly beenreferred to in conventions since UNCED and havebeen incorporated into some national laws. Hencethey are having an impact on internationalcustomary law.
Elaborating, adapting and/or enforcing compliancewith intergovernmental soft law, notably theForest Principles. It has been suggested that theForest Principles could be adapted and extended toform a basis for an international forest regime. Thisproposal would appear to have merit for tworeasons: unlike other examples of international law,the principles deal exclusively with forests; andthey represent a consensus view. However, whilethe principles focus on forests, they do not dealexclusively (or indeed very much) with globalforest issues. Instead, they embody a mix of global,national and local issues, and do not form a basisfor regulating global issues. Furthermore, theprinciples represent a consensus that was achievedprecisely because they are not, and were neverintended to be, legally binding. Their nature istherefore somewhat incompatible with enforcingcompliance, although they are helpful forestablishing future agendas and retain theadvantages of soft law.
Civil society initiatives. Civil society has alreadybegun to develop incentive systems for betterforestry. There are increasing numbers of bilateralmarkets for biological diversity conservation,bioprospecting and carbon storage (e.g. betweencorporations and/or NGOs in the industrializedcountries and governments in developingcountries). An important discussion point is theextent to which these may be alternatives toregulation, and conversely, how much regulationmight be needed to ensure their effective andequitable operation.
The forest certification movement has taken offrapidly in some countries through multistakeholderinitiatives, albeit driven largely by environmentalNGOs, retailers and (more recently) some forestrycompanies. Certification initiatives could be likenedto civil society “conventions” on what sustainableforestry is, how it should be achieved and how
managers should be held accountable. Whilecertification has focused on local impacts ofcommercial forest operations, certification of carbonoffset forests has also now begun. Localgovernments and some companies have alsoinstituted procurement or purchasing policies forforest products, which may or may not includecertification. There is certainly scope for theseinitiatives to give greater attention to global issues.However, there is also a need for national-levelframeworks to ensure that these localizedinitiatives are equitable.
Most civil society initiatives have stressed “bestpractice” and thereby tend to encourageprogressive forest managers. However, NGOs havealso called for exposure of bad practice; an exampleis the Forest Watch proposal to improvetransparency regarding corporate logging andforestry activities.
Many of the prevailing problems of internationallaw also apply to civil society initiatives, i.e.different degrees of commitment, resources forimplementation, willingness to pay, effectiveness,equity, speed and timeliness. The prerequisitessuggested above for further progress – agreementon criteria of sustainable forestry and strongnational forest programmes (which can give civilsociety initiatives a clear legal framework) – mustalso be in place for these options to be successful. Inaddition, questions of authority, representativeness,equity and compatibility are important. However,these initiatives are still young, andexperimentation and competition among themcould be productive for achieving sustainable forestmanagement goals.
The IPF Proposals for Action, representing theproduct of both nations and civil society, containthe ingredients for establishing ground rules for allsoft law activities, whether they beintergovernmental, national or civil.
Developing and/or elaborating regional forest-related legal agreementsRegional agreements have significant potential foraddressing cross-border problems, as has beendemonstrated in the Central American and Amazoncountries’ forest agreements and the Pan-European
98 STATE OF THE WORLD’S FORESTS 1999
Process. They can help to create politicalmomentum and institutional conditions that aresupportive of long-term investment in sustainableforest management. They also represent bottom-upforms of international cooperation that build onspecific shared concerns, i.e. they are very muchpurpose led and dependent on mutual support.Finally, they tend to make effective and practicallinks with national forest programmes, which arefundamental to progress in securing forest goodsand services at the local, national and global levels.Regional agreements themselves, however, do notaddress interregional issues and internationalcommitments which are essential for resourcetransfer between those who benefit from and thosewho are disadvantaged by forest interventions.
Negotiating a legally binding instrument on alltypes of forestsA separate forest convention has been proposed asan incentive for States to fulfil their various forest-related commitments under a holistic framework.These obligations would be treated togetherthrough a financial and legal mechanism whichwould allow for progress to be made, reported onand evaluated internationally. Arguments for aforest convention cite the need to deal with forestsin their entirety and to avoid fragmentation offorest issues among many initiatives, which canlead to their marginalization.
It seems, however, that it will be difficult in theshort term to reach consensus on a broad agendafor an international forest regime. Many issues aregenuinely not perceived as priorities by individualnations. In addition, those opposed to a legallybinding instrument on forests point out thatinternational agreements are time consuming tonegotiate and operate, have opportunity costs anddiminishing returns, will weaken other effortswhich have been negotiated and implemented atgreat cost and which need to be consolidated,and/or will promote unsustainable or inequitableobjectives.
Forest issues are so diverse and so tied to variedenvironmental, economic and social interests thathard and soft law, existing and new, will inevitablybe mixed. This diversity would call for a flexible
framework forest convention which wouldrecognize and support other existing initiatives andbring them together into a holistic picture. Such aconvention would not change existing legallybinding conventions; rather it would have a gap-filling role by incorporating, step by step,further obligations resulting from continuousinternational debate and review. The indications todate are that any such framework conventionwould have to be:
• global in scope;• non-discriminatory;• founded on principles of sustainable
development;• focused on the goal of security of goods and
services at the global level, and/or onminimizing the international causes of forestproblems that affect security of goods andservices at any level;
• based on agreed criteria and indicators andinvolving strong monitoring and learningsystems;
• linked to key international fora, but also opento civil society processes;
• complementary to, and harmonized with,other legal agreements;
• backed up by adequate financial andsecretariat resources, so that it can beeffectively implemented;
• supportive of bottom-up initiatives to developfurther and implement the convention.
SOME KEY QUESTIONS FORCONSIDERATIONThe following are some key questions which maybe considered in the context of intergovernmentaldeliberations on international legal instruments onforests.
• What are global forest issues, and how are theydistinguished from essentially local or nationalissues?
• Which global issues lend themselves tointernational regulation?
• Which global issues are covered by existinginternational legal instruments?
• Are there civil society alternatives (orcomplements) to these?

PART III THE INTERNATIONAL DIALOGUE AND INITIATIVES ON FORESTS 99
• How effective are existing agreements and civilsociety instruments, and what potential dothey have for improvement?
• What is the feasibility of meaningful consensuson further international regulation?
• What prerequisites need to be in place before
an international forest regime can be effectiveand equitable?
Consideration of these questions will helpstimulate analysis and determine whether there is aneed for further international law on forests and, ifso, what form(s) it might take. ◆
STATE OF THE WORLD’S FORESTS 1999
PART IVFORESTRY INREGIONALECONOMIC GROUPS
This section presents summary information on forest cover and forestproducts (production and trade) for the 11 regional economic groupslisted below. In each case, the figures for imports and exports takeinto account the value of international trade with all countries,including those within the regional group. The regional economicgroups covered are:
• European Union (EU)• Commonwealth of Independent States (CIS)• Economic Community of West African States (ECOWAS)• Common Market for Eastern and Southern Africa (COMESA)• League of Arab States• South Asian Association for Regional Cooperation (SAARC)• Association of Southeast-Asian Nations (ASEAN)• South Pacific Forum (SPF)• Latin American Economic System (SELA)• Caribbean Community and Common Market (CARICOM)• North American Free Trade Agreement (NAFTA)
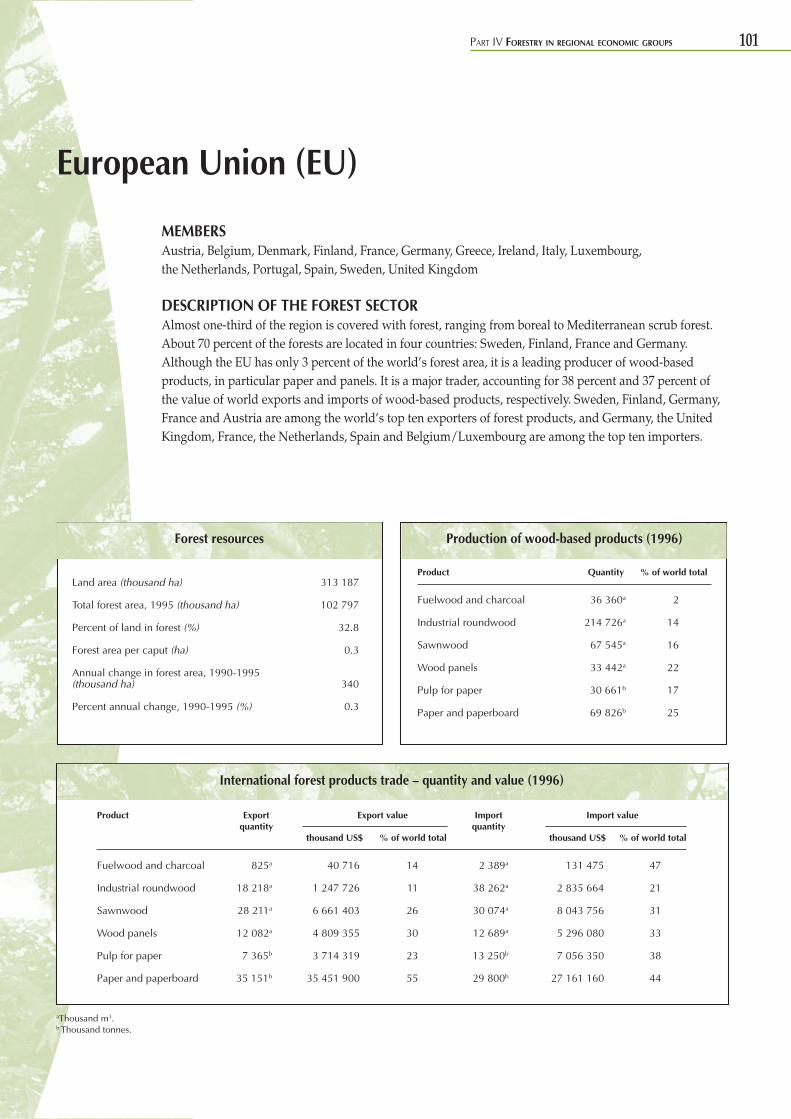
PART IV FORESTRY IN REGIONAL ECONOMIC GROUPS 101
aThousand m3.b Thousand tonnes.
European Union (EU)
MEMBERSAustria, Belgium, Denmark, Finland, France, Germany, Greece, Ireland, Italy, Luxembourg,the Netherlands, Portugal, Spain, Sweden, United Kingdom
DESCRIPTION OF THE FOREST SECTORAlmost one-third of the region is covered with forest, ranging from boreal to Mediterranean scrub forest.About 70 percent of the forests are located in four countries: Sweden, Finland, France and Germany.Although the EU has only 3 percent of the world’s forest area, it is a leading producer of wood-basedproducts, in particular paper and panels. It is a major trader, accounting for 38 percent and 37 percent ofthe value of world exports and imports of wood-based products, respectively. Sweden, Finland, Germany,France and Austria are among the world’s top ten exporters of forest products, and Germany, the UnitedKingdom, France, the Netherlands, Spain and Belgium/Luxembourg are among the top ten importers.
International forest products trade – quantity and value (1996)
Product Export Export value Import Import valuequantity quantity
thousand US$ % of world total thousand US$ % of world total
Fuelwood and charcoal 825a 40 716 14 2 389a 131 475 47
Industrial roundwood 18 218a 1 247 726 11 38 262a 2 835 664 21
Sawnwood 28 211a 6 661 403 26 30 074a 8 043 756 31
Wood panels 12 082a 4 809 355 30 12 689a 5 296 080 33
Pulp for paper 7 365b 3 714 319 23 13 250b 7 056 350 38
Paper and paperboard 35 151b 35 451 900 55 29 800b 27 161 160 44
Forest resources
Land area (thousand ha) 313 187
Total forest area, 1995 (thousand ha) 102 797
Percent of land in forest (%) 32.8
Forest area per caput (ha) 0.3
Annual change in forest area, 1990-1995(thousand ha) 340
Percent annual change, 1990-1995 (%) 0.3
Production of wood-based products (1996)
Product Quantity % of world total
Fuelwood and charcoal 36 360a 2
Industrial roundwood 214 726a 14
Sawnwood 67 545a 16
Wood panels 33 442a 22
Pulp for paper 30 661b 17
Paper and paperboard 69 826b 25
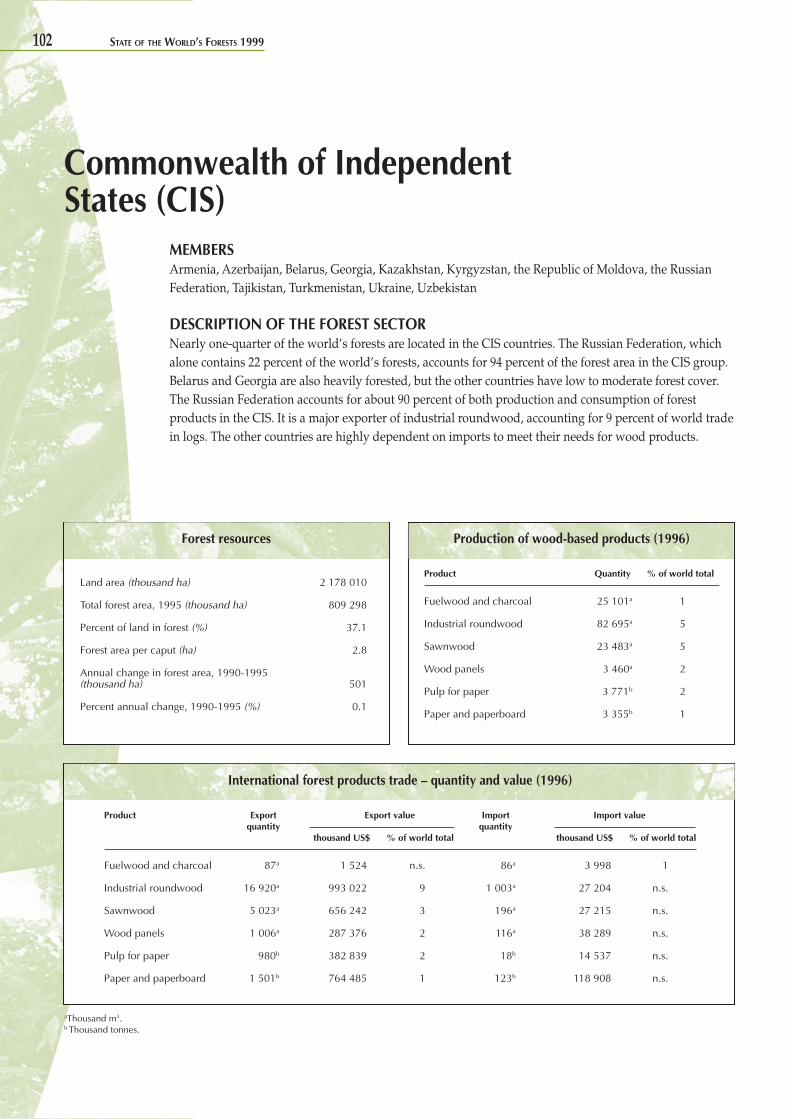
102 STATE OF THE WORLD’S FORESTS 1999
aThousand m3.b Thousand tonnes.
Commonwealth of IndependentStates (CIS)
MEMBERSArmenia, Azerbaijan, Belarus, Georgia, Kazakhstan, Kyrgyzstan, the Republic of Moldova, the RussianFederation, Tajikistan, Turkmenistan, Ukraine, Uzbekistan
DESCRIPTION OF THE FOREST SECTORNearly one-quarter of the world’s forests are located in the CIS countries. The Russian Federation, whichalone contains 22 percent of the world’s forests, accounts for 94 percent of the forest area in the CIS group.Belarus and Georgia are also heavily forested, but the other countries have low to moderate forest cover.The Russian Federation accounts for about 90 percent of both production and consumption of forestproducts in the CIS. It is a major exporter of industrial roundwood, accounting for 9 percent of world tradein logs. The other countries are highly dependent on imports to meet their needs for wood products.
Forest resources
Land area (thousand ha) 2 178 010
Total forest area, 1995 (thousand ha) 809 298
Percent of land in forest (%) 37.1
Forest area per caput (ha) 2.8
Annual change in forest area, 1990-1995(thousand ha) 501
Percent annual change, 1990-1995 (%) 0.1
International forest products trade – quantity and value (1996)
Product Export Export value Import Import valuequantity quantity
thousand US$ % of world total thousand US$ % of world total
Fuelwood and charcoal 87a 1 524 n.s. 86a 3 998 1
Industrial roundwood 16 920a 993 022 9 1 003a 27 204 n.s.
Sawnwood 5 023a 656 242 3 196a 27 215 n.s.
Wood panels 1 006a 287 376 2 116a 38 289 n.s.
Pulp for paper 980b 382 839 2 18b 14 537 n.s.
Paper and paperboard 1 501b 764 485 1 123b 118 908 n.s.
Production of wood-based products (1996)
Product Quantity % of world total
Fuelwood and charcoal 25 101a 1
Industrial roundwood 82 695a 5
Sawnwood 23 483a 5
Wood panels 3 460a 2
Pulp for paper 3 771b 2
Paper and paperboard 3 355b 1
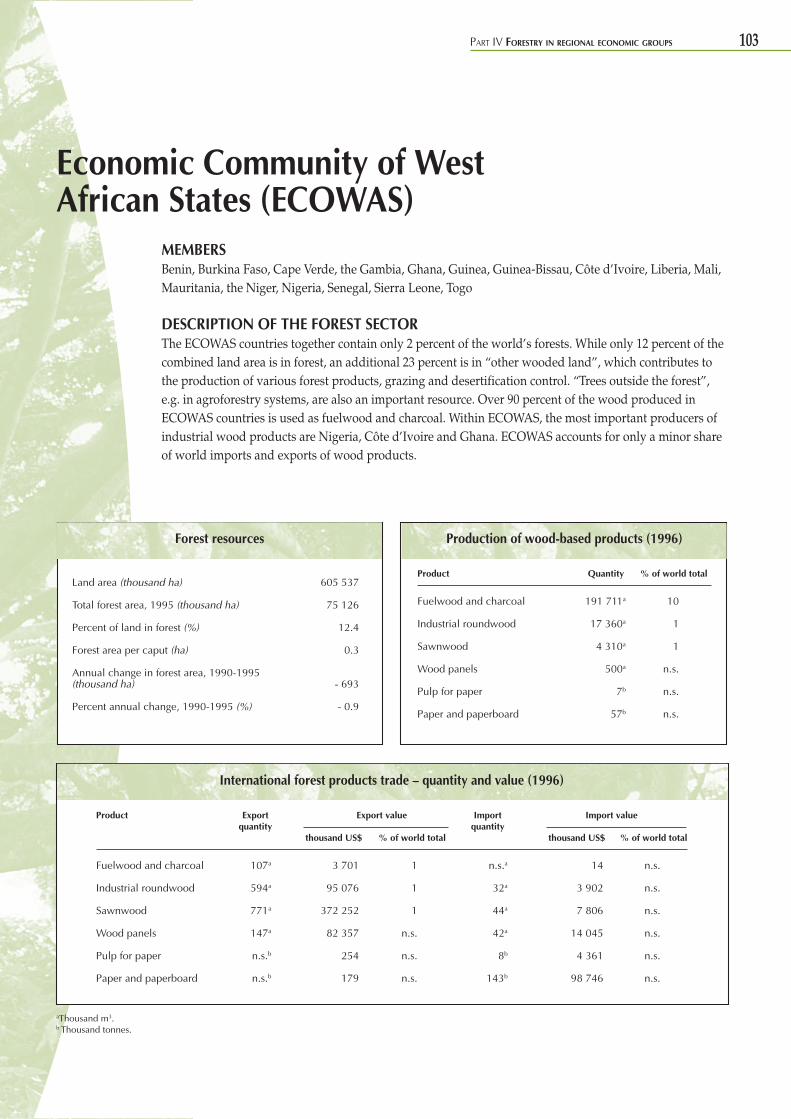
PART IV FORESTRY IN REGIONAL ECONOMIC GROUPS 103
aThousand m3.b Thousand tonnes.
Economic Community of WestAfrican States (ECOWAS)
MEMBERSBenin, Burkina Faso, Cape Verde, the Gambia, Ghana, Guinea, Guinea-Bissau, Côte d’Ivoire, Liberia, Mali,Mauritania, the Niger, Nigeria, Senegal, Sierra Leone, Togo
DESCRIPTION OF THE FOREST SECTORThe ECOWAS countries together contain only 2 percent of the world’s forests. While only 12 percent of thecombined land area is in forest, an additional 23 percent is in “other wooded land”, which contributes tothe production of various forest products, grazing and desertification control. “Trees outside the forest”,e.g. in agroforestry systems, are also an important resource. Over 90 percent of the wood produced inECOWAS countries is used as fuelwood and charcoal. Within ECOWAS, the most important producers ofindustrial wood products are Nigeria, Côte d’Ivoire and Ghana. ECOWAS accounts for only a minor shareof world imports and exports of wood products.
Forest resources
Land area (thousand ha) 605 537
Total forest area, 1995 (thousand ha) 75 126
Percent of land in forest (%) 12.4
Forest area per caput (ha) 0.3
Annual change in forest area, 1990-1995(thousand ha) - 693
Percent annual change, 1990-1995 (%) - 0.9
International forest products trade – quantity and value (1996)
Product Export Export value Import Import valuequantity quantity
thousand US$ % of world total thousand US$ % of world total
Fuelwood and charcoal 107a 3 701 1 n.s.a 14 n.s.
Industrial roundwood 594a 95 076 1 32a 3 902 n.s.
Sawnwood 771a 372 252 1 44a 7 806 n.s.
Wood panels 147a 82 357 n.s. 42a 14 045 n.s.
Pulp for paper n.s.b 254 n.s. 8b 4 361 n.s.
Paper and paperboard n.s.b 179 n.s. 143b 98 746 n.s.
Production of wood-based products (1996)
Product Quantity % of world total
Fuelwood and charcoal 191 711a 10
Industrial roundwood 17 360a 1
Sawnwood 4 310a 1
Wood panels 500a n.s.
Pulp for paper 7b n.s.
Paper and paperboard 57b n.s.
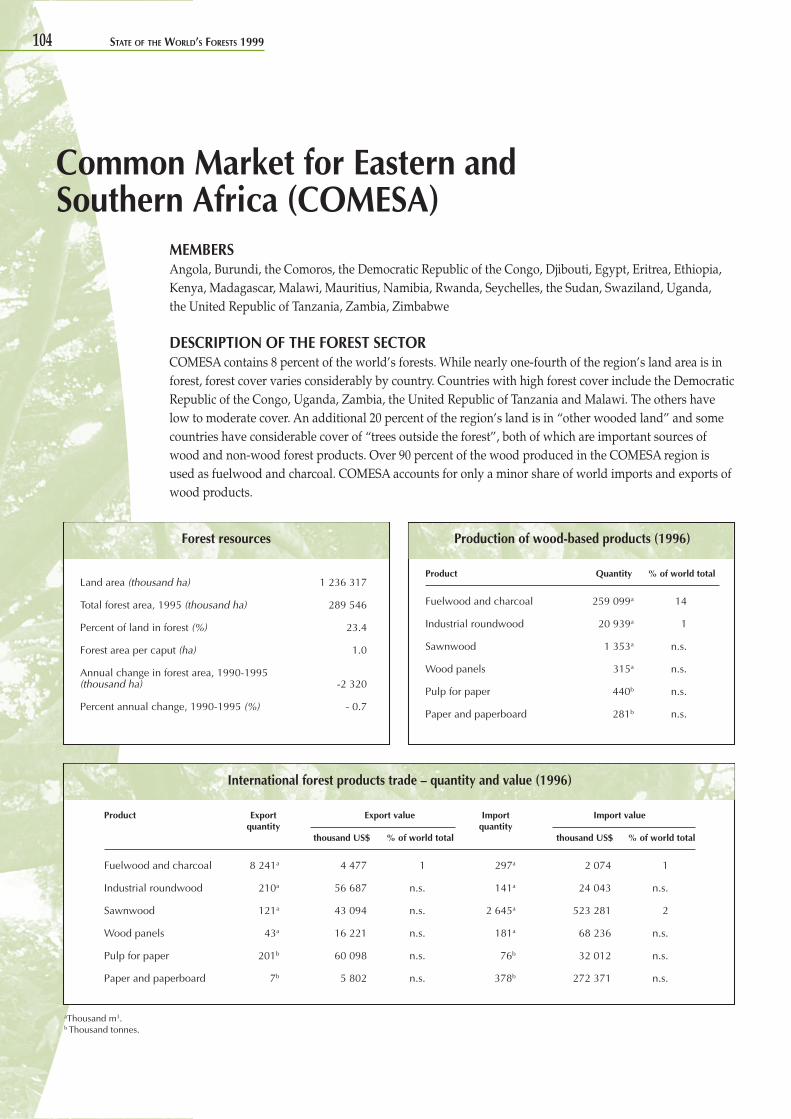
104 STATE OF THE WORLD’S FORESTS 1999
aThousand m3.b Thousand tonnes.
MEMBERSAngola, Burundi, the Comoros, the Democratic Republic of the Congo, Djibouti, Egypt, Eritrea, Ethiopia,Kenya, Madagascar, Malawi, Mauritius, Namibia, Rwanda, Seychelles, the Sudan, Swaziland, Uganda,the United Republic of Tanzania, Zambia, Zimbabwe
DESCRIPTION OF THE FOREST SECTORCOMESA contains 8 percent of the world’s forests. While nearly one-fourth of the region’s land area is inforest, forest cover varies considerably by country. Countries with high forest cover include the DemocraticRepublic of the Congo, Uganda, Zambia, the United Republic of Tanzania and Malawi. The others havelow to moderate cover. An additional 20 percent of the region’s land is in “other wooded land” and somecountries have considerable cover of “trees outside the forest”, both of which are important sources ofwood and non-wood forest products. Over 90 percent of the wood produced in the COMESA region isused as fuelwood and charcoal. COMESA accounts for only a minor share of world imports and exports ofwood products.
Common Market for Eastern andSouthern Africa (COMESA)
International forest products trade – quantity and value (1996)
Product Export Export value Import Import valuequantity quantity
thousand US$ % of world total thousand US$ % of world total
Fuelwood and charcoal 8 241a 4 477 1 297a 2 074 1
Industrial roundwood 210a 56 687 n.s. 141a 24 043 n.s.
Sawnwood 121a 43 094 n.s. 2 645a 523 281 2
Wood panels 43a 16 221 n.s. 181a 68 236 n.s.
Pulp for paper 201b 60 098 n.s. 76b 32 012 n.s.
Paper and paperboard 7b 5 802 n.s. 378b 272 371 n.s.
Production of wood-based products (1996)
Product Quantity % of world total
Fuelwood and charcoal 259 099a 14
Industrial roundwood 20 939a 1
Sawnwood 1 353a n.s.
Wood panels 315a n.s.
Pulp for paper 440b n.s.
Paper and paperboard 281b n.s.
Forest resources
Land area (thousand ha) 1 236 317
Total forest area, 1995 (thousand ha) 289 546
Percent of land in forest (%) 23.4
Forest area per caput (ha) 1.0
Annual change in forest area, 1990-1995(thousand ha) -2 320
Percent annual change, 1990-1995 (%) - 0.7
PART IV FORESTRY IN REGIONAL ECONOMIC GROUPS 105
aThousand m3.b Thousand tonnes.
MEMBERSAlgeria, Bahrain, the Comoros, Djibouti, Egypt, Iraq, Jordan, Kuwait, Lebanon, the Libyan ArabJamahiriya, Mauritania, Morocco, Oman, Palestine, Qatar, Saudi Arabia, Somalia, the Sudan, the SyrianArab Republic, Tunisia, the United Arab Emirates, Yemen
DESCRIPTION OF THE FOREST SECTORThe combined forest area of these countries accounts for only 1 percent of the world’s forests. Somecountries (Algeria, Morocco, Somalia, the Sudan, Yemen) have significant areas in “other wooded land”,which although not counted in the forest area figures are important for forest products, grazing anddesertification control. Fuelwood and charcoal are the major forest products. Production of industrialwood is very limited; about two-thirds of the demand for industrial roundwood and processed woodproducts is met by imports. Gum arabic is a major export of the Sudan.
League of Arab States
International forest products trade – quantity and value (1996)
Product Export Export value Import Import valuequantity quantity
thousand US$ % of world total thousand US$ % of world total
Fuelwood and charcoal 244a 4 603 1 438a 9 280 3
Industrial roundwood 9a 1 003 n.s. 690a 108 294 1
Sawnwood 14a 4 871 n.s. 5 654a 1 169 285 4
Wood panels 66a 40 041 n.s. 1 556a 632 367 4
Pulp for paper 80b 45 152 n.s. 433b 221 227 1
Paper and paperboard 32b 26 053 n.s. 1 696b 1 317 967 2
Production of wood-based products (1996)
Product Quantity % of world total
Fuelwood and charcoal 34 739a 2
Industrial roundwood 4 274a n.s.
Sawnwood 232a n.s.
Wood panels 347a n.s.
Pulp for paper 450b n.s.
Paper and paperboard 783b n.s.
Forest resources
Land area (thousand ha) 1 351 900
Total forest area, 1995 (thousand ha) 50 334
Percent of land in forest (%) 3.7
Forest area per caput (ha) 0.2
Annual change in forest area, 1990-1995(thousand ha) -405
Percent annual change, 1990-1995 (%) - 0.8
106 STATE OF THE WORLD’S FORESTS 1999
aThousand m3.b Thousand tonnes.
MEMBERSBangladesh, Bhutan, India, Maldives, Nepal, Pakistan, Sri Lanka
DESCRIPTION OF THE FOREST SECTORThese countries contain only 2 percent of the world’s forest area but support 22 percent of the Earth’spopulation. The region’s forest cover is relatively low (19 percent of total land area), but “trees outside theforest”, particularly on agricultural land, are an important source of wood and non-wood forest products,notably in Bangladesh, Sri Lanka, Pakistan and parts of India. Over 90 percent of all wood production isused as fuelwood and charcoal, three-quarters of which is consumed in India alone. SAARC accounts for20 percent of the world production of fuelwood and charcoal. International trade in wood products islimited. India is a major exporter of non-wood forest products, including medicinal plants, essential oils,bidi leaves and lac.
South Asian Association forRegional Cooperation (SAARC)
International forest products trade – quantity and value (1996)
Product Export Export value Import Import valuequantity quantity
thousand US$ % of world total thousand US$ % of world total
Fuelwood and charcoal 8a 447 n.s. 72a 1 582 n.s.
Industrial roundwood 24a 2 212 n.s. 477a 69 644 n.s.
Sawnwood 28a 6 602 n.s. 95a 16 698 n.s.
Wood panels 20a 10 185 n.s. 54a 23 283 n.s.
Pulp for paper 2b 1 896 n.s. 360b 167 640 1
Paper and paperboard 7b 4 839 n.s. 748b 445 002 1
Production of wood-based products (1996)
Product Quantity % of world total
Fuelwood and charcoal 370 889a 20
Industrial roundwood 29 038a 2
Sawnwood 19 453a 4
Wood panels 494a n.s.
Pulp for paper 2 173b 1
Paper and paperboard 3 559b 1
Forest resources
Land area (thousand ha) 412 917
Total forest area, 1995 (thousand ha) 77 137
Percent of land in forest (%) 18.7
Forest area per caput (ha) 0.1
Annual change in forest area, 1990-1995(thousand ha) -141
Percent annual change, 1990-1995 (%) - 0.2
PART IV FORESTRY IN REGIONAL ECONOMIC GROUPS 107
aThousand m3.b Thousand tonnes.
MEMBERSBrunei Darussalam, Indonesia, Laos, Malaysia, Myanmar, the Philippines, Singapore, Thailand, Viet Nam
DESCRIPTION OF THE FOREST SECTORNearly half of the ASEAN region is covered with tropical forest, accounting for about 6 percent of theforest area of the world. Three-quarters of the total wood production is used as fuelwood and charcoal.ASEAN is an important timber producing region (particularly of tropical hardwoods), accounting for6 percent of the world’s industrial roundwood production. More than 85 percent of this comes fromIndonesia and Malaysia. These two countries are major producers and exporters of wood-based panels(mainly plywood), together accounting for 34 percent (in value) of world export trade in panels. Theregion is rapidly developing a substantial pulp and paper industry. Many ASEAN countries are majorexporters of non-wood forest products, in particular rubber, rattan and bamboo. This region’s forests haveglobal significance in terms of biological diversity conservation.
Forest resources
Land area (thousand ha) 416 890
Total forest area, 1995 (thousand ha) 192 799
Percent of land in forest (%) 46.2
Forest area per caput (ha) 0.4
Annual change in forest area, 1990-1995(thousand ha) - 2 748
Percent annual change, 1990-1995 (%) - 1.3
Association of Southeast-AsianNations (ASEAN)
International forest products trade – quantity and value (1996)
Product Export Export value Import Import valuequantity quantity
thousand US$ % of world total thousand US$ % of world total
Fuelwood and charcoal 1 822a 81 403 28 273a 5 008 2
Industrial roundwood 9 526a 1 209 375 11 2 034a 854 250 6
Sawnwood 5 016a 1 868 729 7 4 104a 1 117 133 4
Wood panels 14 083a 5 733 889 35 1 378a 423 490 3
Pulp for paper 1 289b 529 847 3 1 177b 659 112 4
Paper and paperboard 1 683b 1 360 880 2 2 801b 2 754 334 4
Production of wood-based products (1996)
Product Quantity % of world total
Fuelwood and charcoal 294 542a 16
Industrial roundwood 97 738a 6
Sawnwood 17 854a 4
Wood panels 18 418a 12
Pulp for paper 3 532b 2
Paper and paperboard 8 141b 3
108 STATE OF THE WORLD’S FORESTS 1999
aThousand m3.b Thousand tonnes.
MEMBERSAustralia, Cook Islands, Fiji, Kiribati, Marshall Islands, Federated States of Micronesia, Nauru,New Zealand, Niue, Palau, Papua New Guinea, Samoa, Solomon Islands, Tonga, Tuvalu, Vanuatu
DESCRIPTION OF THE FOREST SECTORThe SPF countries together contain less than 3 percent of the world’s forest area. Although 86 percent of theregion’s forest area is located in Australia and Papua New Guinea, several countries are heavily forested –most notably Solomon Islands, Papua New Guinea and Vanuatu, and to a lesser extent Samoa and Fiji.Australia and New Zealand have large plantation programmes. The region (led by Australia, New Zealandand Papua New Guinea) is a significant exporter of industrial roundwood, accounting for 15 percent ofworld trade. Australia and New Zealand dominate the region’s production of industrial roundwood andprocessed wood products. The small island nations have abundant coconut trees which serve as sources ofwood, coconuts, copra and palm oil for local populations.
Forest resources
Land area (thousand ha) 846 637
Total forest area, 1995 (thousand ha) 89 997
Percent of land in forest (%) 10.6
Forest area per caput (ha) 3.3
Annual change in forest area, 1990-1995(thousand ha) - 92
Percent annual change, 1990-1995 (%) - 0.1
South Pacific Forum (SPF)
International forest products trade – quantity and value (1996)
Product Export Export value Import Import valuequantity quantity
thousand US$ % of world total thousand US$ % of world total
Fuelwood and charcoal 12a 1 007 n.s. n.s.a 55 n.s.
Industrial roundwood 18 346a 1 627 281 15 12a 2 775 n.s.
Sawnwood 1 067a 303 248 1 808a 318 289 1
Wood panels 809a 342 270 2 342a 113 732 1
Pulp for paper 680b 267 333 2 201b 152 054 1
Paper and paperboard 625b 459 198 1 1 299b 1 568 866 2
Production of wood-based products (1996)
Product Quantity % of world total
Fuelwood and charcoal 8 756a n.s.
Industrial roundwood 41 456a 3
Sawnwood 6 760a 1
Wood panels 2 158a 1
Pulp for paper 2 330b 1
Paper and paperboard 2 651b 1
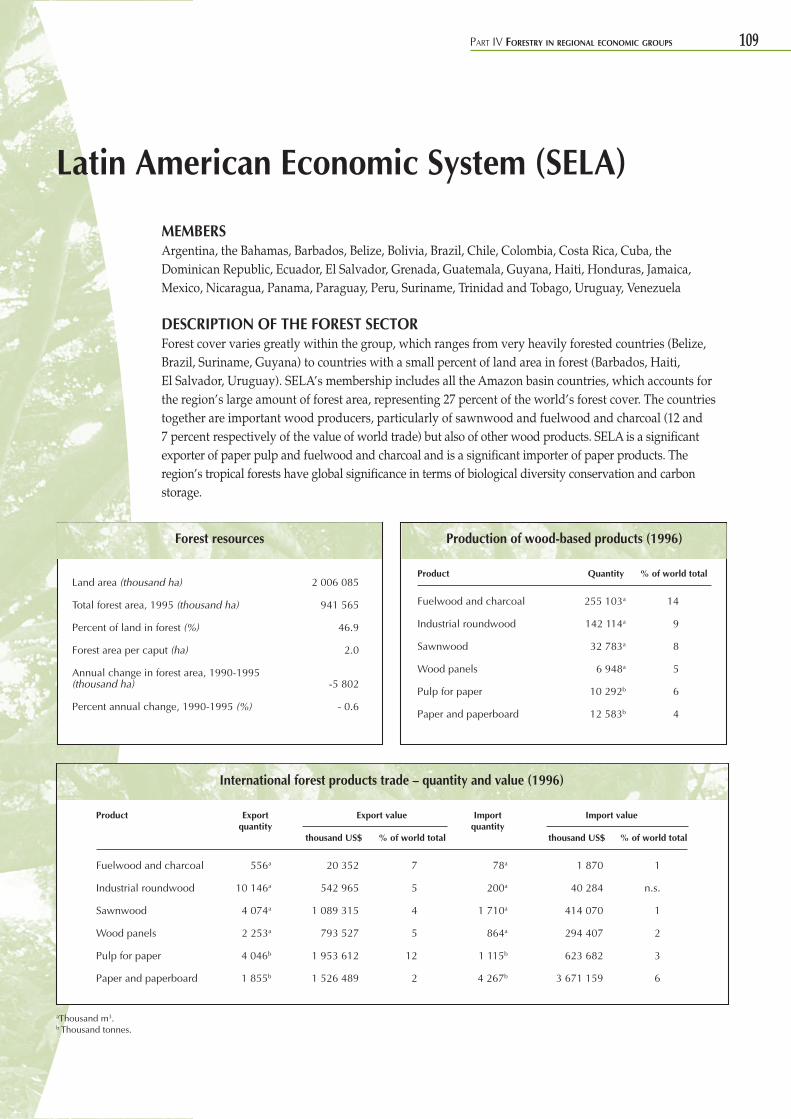
PART IV FORESTRY IN REGIONAL ECONOMIC GROUPS 109
aThousand m3.b Thousand tonnes.
MEMBERSArgentina, the Bahamas, Barbados, Belize, Bolivia, Brazil, Chile, Colombia, Costa Rica, Cuba, theDominican Republic, Ecuador, El Salvador, Grenada, Guatemala, Guyana, Haiti, Honduras, Jamaica,Mexico, Nicaragua, Panama, Paraguay, Peru, Suriname, Trinidad and Tobago, Uruguay, Venezuela
DESCRIPTION OF THE FOREST SECTORForest cover varies greatly within the group, which ranges from very heavily forested countries (Belize,Brazil, Suriname, Guyana) to countries with a small percent of land area in forest (Barbados, Haiti,El Salvador, Uruguay). SELA’s membership includes all the Amazon basin countries, which accounts forthe region’s large amount of forest area, representing 27 percent of the world’s forest cover. The countriestogether are important wood producers, particularly of sawnwood and fuelwood and charcoal (12 and7 percent respectively of the value of world trade) but also of other wood products. SELA is a significantexporter of paper pulp and fuelwood and charcoal and is a significant importer of paper products. Theregion’s tropical forests have global significance in terms of biological diversity conservation and carbonstorage.
Forest resources
Land area (thousand ha) 2 006 085
Total forest area, 1995 (thousand ha) 941 565
Percent of land in forest (%) 46.9
Forest area per caput (ha) 2.0
Annual change in forest area, 1990-1995(thousand ha) -5 802
Percent annual change, 1990-1995 (%) - 0.6
Latin American Economic System (SELA)
International forest products trade – quantity and value (1996)
Product Export Export value Import Import valuequantity quantity
thousand US$ % of world total thousand US$ % of world total
Fuelwood and charcoal 556a 20 352 7 78a 1 870 1
Industrial roundwood 10 146a 542 965 5 200a 40 284 n.s.
Sawnwood 4 074a 1 089 315 4 1 710a 414 070 1
Wood panels 2 253a 793 527 5 864a 294 407 2
Pulp for paper 4 046b 1 953 612 12 1 115b 623 682 3
Paper and paperboard 1 855b 1 526 489 2 4 267b 3 671 159 6
Production of wood-based products (1996)
Product Quantity % of world total
Fuelwood and charcoal 255 103a 14
Industrial roundwood 142 114a 9
Sawnwood 32 783a 8
Wood panels 6 948a 5
Pulp for paper 10 292b 6
Paper and paperboard 12 583b 4
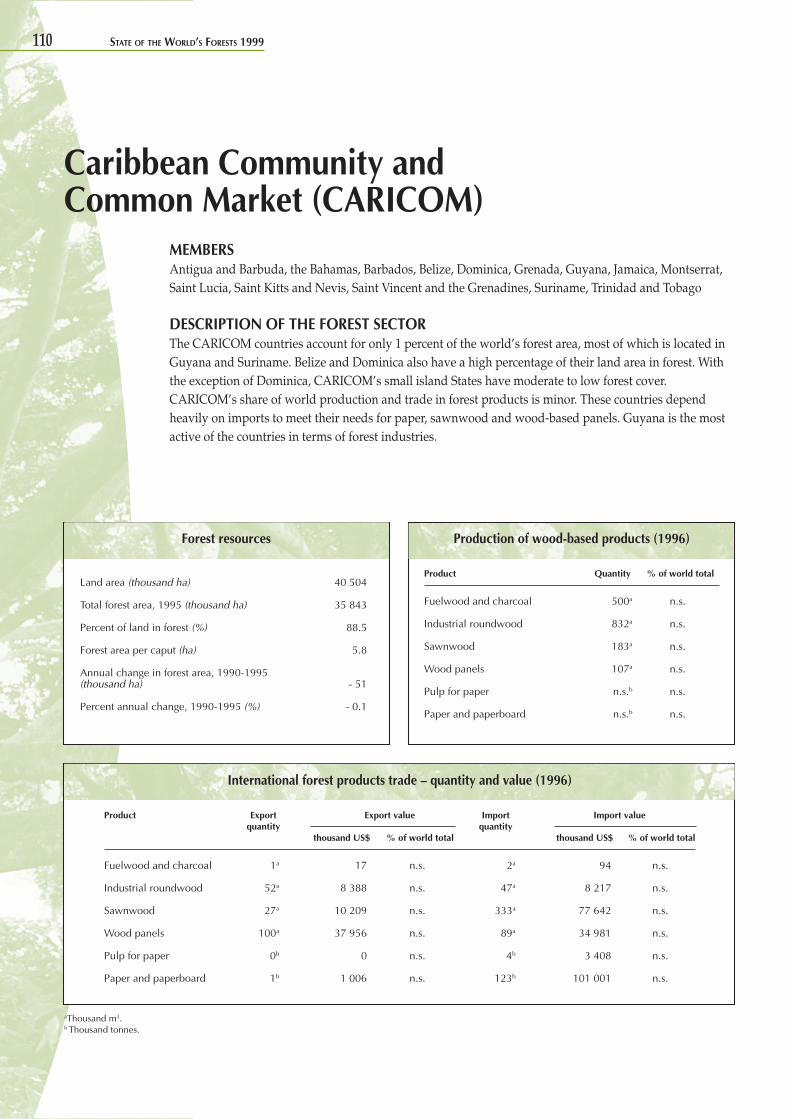
110 STATE OF THE WORLD’S FORESTS 1999
aThousand m3.b Thousand tonnes.
MEMBERSAntigua and Barbuda, the Bahamas, Barbados, Belize, Dominica, Grenada, Guyana, Jamaica, Montserrat,Saint Lucia, Saint Kitts and Nevis, Saint Vincent and the Grenadines, Suriname, Trinidad and Tobago
DESCRIPTION OF THE FOREST SECTORThe CARICOM countries account for only 1 percent of the world’s forest area, most of which is located inGuyana and Suriname. Belize and Dominica also have a high percentage of their land area in forest. Withthe exception of Dominica, CARICOM’s small island States have moderate to low forest cover.CARICOM’s share of world production and trade in forest products is minor. These countries dependheavily on imports to meet their needs for paper, sawnwood and wood-based panels. Guyana is the mostactive of the countries in terms of forest industries.
Caribbean Community andCommon Market (CARICOM)
International forest products trade – quantity and value (1996)
Product Export Export value Import Import valuequantity quantity
thousand US$ % of world total thousand US$ % of world total
Fuelwood and charcoal 1a 17 n.s. 2a 94 n.s.
Industrial roundwood 52a 8 388 n.s. 47a 8 217 n.s.
Sawnwood 27a 10 209 n.s. 333a 77 642 n.s.
Wood panels 100a 37 956 n.s. 89a 34 981 n.s.
Pulp for paper 0b 0 n.s. 4b 3 408 n.s.
Paper and paperboard 1b 1 006 n.s. 123b 101 001 n.s.
Production of wood-based products (1996)
Product Quantity % of world total
Fuelwood and charcoal 500a n.s.
Industrial roundwood 832a n.s.
Sawnwood 183a n.s.
Wood panels 107a n.s.
Pulp for paper n.s.b n.s.
Paper and paperboard n.s.b n.s.
Forest resources
Land area (thousand ha) 40 504
Total forest area, 1995 (thousand ha) 35 843
Percent of land in forest (%) 88.5
Forest area per caput (ha) 5.8
Annual change in forest area, 1990-1995(thousand ha) - 51
Percent annual change, 1990-1995 (%) - 0.1
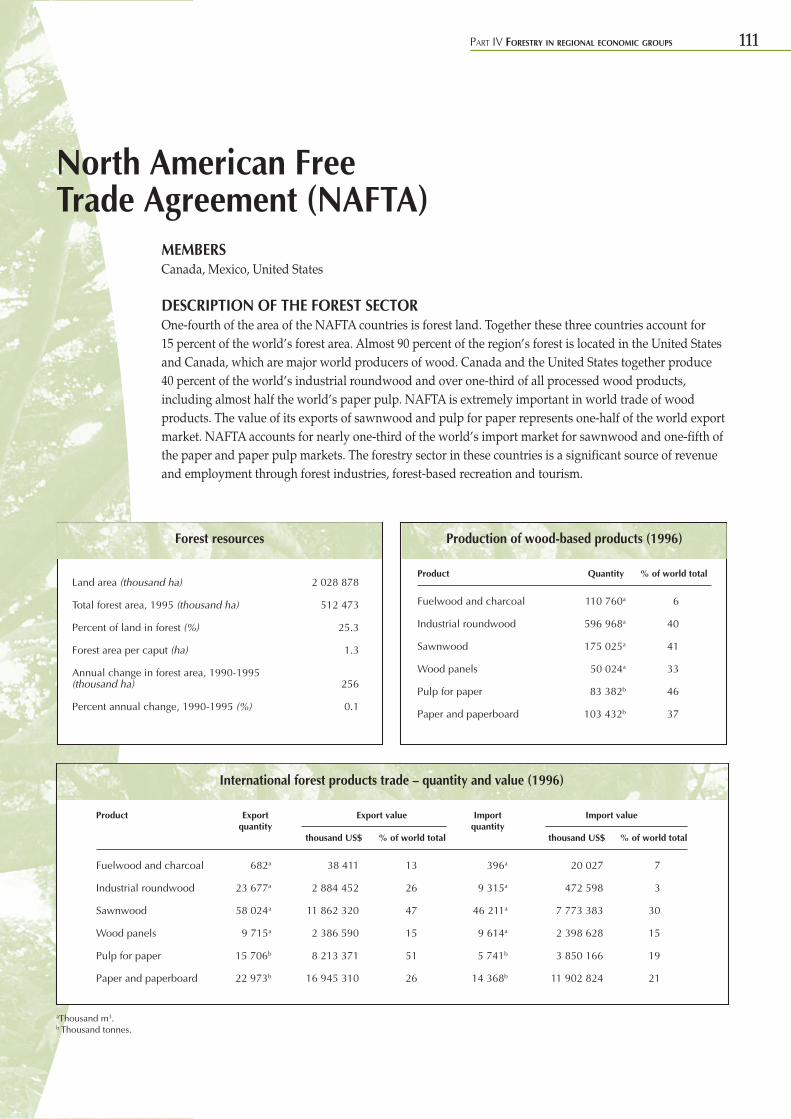
PART IV FORESTRY IN REGIONAL ECONOMIC GROUPS 111
aThousand m3.b Thousand tonnes.
MEMBERSCanada, Mexico, United States
DESCRIPTION OF THE FOREST SECTOROne-fourth of the area of the NAFTA countries is forest land. Together these three countries account for15 percent of the world’s forest area. Almost 90 percent of the region’s forest is located in the United Statesand Canada, which are major world producers of wood. Canada and the United States together produce40 percent of the world’s industrial roundwood and over one-third of all processed wood products,including almost half the world’s paper pulp. NAFTA is extremely important in world trade of woodproducts. The value of its exports of sawnwood and pulp for paper represents one-half of the world exportmarket. NAFTA accounts for nearly one-third of the world’s import market for sawnwood and one-fifth ofthe paper and paper pulp markets. The forestry sector in these countries is a significant source of revenueand employment through forest industries, forest-based recreation and tourism.
Forest resources
Land area (thousand ha) 2 028 878
Total forest area, 1995 (thousand ha) 512 473
Percent of land in forest (%) 25.3
Forest area per caput (ha) 1.3
Annual change in forest area, 1990-1995(thousand ha) 256
Percent annual change, 1990-1995 (%) 0.1
North American FreeTrade Agreement (NAFTA)
International forest products trade – quantity and value (1996)
Product Export Export value Import Import valuequantity quantity
thousand US$ % of world total thousand US$ % of world total
Fuelwood and charcoal 682a 38 411 13 396a 20 027 7
Industrial roundwood 23 677a 2 884 452 26 9 315a 472 598 3
Sawnwood 58 024a 11 862 320 47 46 211a 7 773 383 30
Wood panels 9 715a 2 386 590 15 9 614a 2 398 628 15
Pulp for paper 15 706b 8 213 371 51 5 741b 3 850 166 19
Paper and paperboard 22 973b 16 945 310 26 14 368b 11 902 824 21
Production of wood-based products (1996)
Product Quantity % of world total
Fuelwood and charcoal 110 760a 6
Industrial roundwood 596 968a 40
Sawnwood 175 025a 41
Wood panels 50 024a 33
Pulp for paper 83 382b 46
Paper and paperboard 103 432b 37
ANNEXES

114
Annex 1
ACRONYMS
ANZCERTA
Australia-New Zealand Closer Economic Relations Trade
Agreement
ASEAN
Association of Southeast-Asian Nations
ATO
African Timber Organization
CARICOM
Caribbean Community and Common Market
CATIE
Tropical Agriculture Research and Higher Education Center
CBD
Convention on Biological Diversity
CCAD
Central American Commission on Environment and
Development
CDM
Clean Development Mechanism
CGIAR
Consultative Group on International Agricultural Research
CIFOR
Center for International Forestry Research
CIS
Commonwealth of Independent States
CITES
Convention on International Trade in Endangered Species of
Wild Fauna and Flora
COFO
FAO’s Committee on Forestry
COMESA
Common Market for Eastern and Southern Africa
CSD
Commission on Sustainable Development
ECE
UN Economic Commission for Europe
ECOSOC
United Nations Economic and Social Council
ECOWAS
Economic Community of West African States
EU
European Union
FAG
Forestry Advisers Group
FCCC
Framework Convention on Climate Change
FORSPA
Forestry Research Support Programme for Asia and
the Pacific
FRA
Forest Resources Assessment
GATT
General Agreement on Tariffs and Trade
GDP
gross domestic product
GFAR
Global Forum on Agricultural Research
GFIS
Global Forest Information System
GFSM
Global Fibre Supply Model
GNP
gross national product
IARC
international agricultural research centre
ICDP
Integrated Conservation Development Project
ICRAF
International Centre for Research in Agroforestry
IFF
Intergovernmental Forum on Forests
ILO
International Labour Organisation
IPCC
Intergovernmental Panel on Climate Change
IPF
Intergovernmental Panel on Forests
IPGRI
International Plant Genetic Resources Institute
ISO
International Organization for Standardization
ITFF
Inter-Agency Task Force on Forests
115
ITTA
International Tropical Timber Agreement
ITTC
International Tropical Timber Council
ITTO
International Tropical Timber Organization
IUCN
International Union for Conservation of Nature and Natural
Resources (World Conservation Union)
IUFRO
International Union of Forestry Research Organizations
NAFTA
North American Free Trade Agreement
NARS
national agricultural research systems
NFP
national forest programme
NGO
non-governmental organization
NWFP
non-wood forest product
OECD
Organisation for Economic Co-operation and Development
SAARC
South Asian Association for Regional Cooperation
SELA
Latin American Economic System
SPARTECA
South Pacific Regional Trade and Economic Cooperation
Agreement
SPF
South Pacific Forum
UNCCD
Convention to Combat Desertification
UNCED
United Nations Conference on Environment and Development
UNCTAD
United Nations Conference on Trade and Development
UNDP
United Nations Development Programme
UNEP
United Nations Environment Programme
UNGASS
Special Session of the United Nations General Assembly
WCFSD
World Commission on Forests and Sustainable Development
WCMC
World Conservation Monitoring Centre
WRI
World Resources Institute
WTO
World Trade Organization
WWF
World Wide Fund for Nature
116
Afforestation/reafforestation
The establishment of a tree crop on an area from which it has
always or very long been absent. Where such establishment fails
and is repeated, the latter may properly be termed reafforestation.
Reforestation
Establishment of a tree crop on forest land.
FOREST AND RELATED LAND COVER DEFINITIONS –
DEFINITIONS APPLIED FOR DEVELOPED COUNTRIES
Forest
Includes natural forest and forest plantations. Land with tree crown
cover (stand density) of more than about 20 percent of the area;
continuous forest with trees usually growing to more than about
7 m in height and able to produce wood. This includes both closed
forest formations where trees of various storeys and undergrowth
cover a high proportion of the ground, and open forest formations
with a continuous grass layer in which tree synusia cover at least
10 percent of the ground.
Deforestation
Change of forest with depletion of tree crown cover to less than
20 percent.
Other wooded land
Land which has some forestry characteristics but is not forest as
defined above. It includes open woodland and scrub, shrub and
brushland (see below), whether or not used for pasture or range.
It excludes land occupied by “trees outside the forest”.
Open woodland
Land with tree crown cover (stand density of about 5 to 20 percent
of the area).
Scrub, shrub and brushland
Land with scrub, shrub or stunted trees, where the main woody
elements are shrubs (usually more than 50 cm and less than 7 m
in height), covering more than about 20 percent of the area, not
primarily used for agricultural or other non-forestry purposes, such
as grazing of domestic animals.
Annex 2
COUNTRY GROUPS
Reference to regions and subregions correspond to the country
groups indicated in Tables 1 and 2 of Annex 3. These in turn use
the definitions of the FAOSTAT country groups list of FAO.
Developed countries
Includes all industrialized countries and countries in transition.
Industrialized countries
Includes all countries in Europe except Eastern Europe (see country
listing in Table 2 of Annex 3) plus Australia, Canada, Israel, Japan,
New Zealand, South Africa and the United States.
Countries in transition
Includes all countries in Eastern Europe (see country listing in
Table 2 of Annex 3) and Armenia, Azerbaijan, Georgia,
Kazakhstan, Kyrgyzstan, Tajikistan, Turkmenistan and Uzbekistan.
Developing countries
Includes all countries other than developed countries.
Tropical countries
As indicated in Table 2 of Annex 3.
Temperate/non-tropical countries
As indicated in Table 2 of Annex 3.
FOREST AND RELATED LAND COVER DEFINITIONS
These definitions have been adopted for use in FAO’s Global Forest
Resources Assessment (FRA). They apply to FRA 1990 and the
1995 set of forest cover data provided in Tables 2 and 3 of
Annex 3. Some terms have two definitions, one when used in
conjunction with developing countries and another when applied
to developed countries, because of the different data collection
methods used by the two organizations involved: FAO (for
developing countries) and the UN Economic Commission for
Europe (ECE) Trade Division Timber Section (for developed
countries). FRA 2000 is using a common set of definitions, some
of which differ slightly from those given below. The new set of
definitions is available in the document UN-ECE/FAO Temperate
and Boreal Forest Resources Assessment 2000: terms and
definitions (UN, 1997b).
DEFINITIONS
117
Exploitable forest
Forest and other wooded land on which there are no legal,
economic or technical restrictions on wood production. It includes
areas where, although there are no such restrictions, harvesting is
not currently taking place, for example, areas included in long-
term utilization plans or intentions.
FOREST AND RELATED LAND COVER DEFINITIONS –
DEFINITIONS APPLIED FOR DEVELOPING COUNTRIES
Forest
Ecosystem with a minimum of 10 percent crown cover of trees
and/or bamboos, generally associated with wild flora and fauna
and natural soil conditions, and not subject to agricultural
practices. The term forest is further subdivided, according to its
origin, into two categories:
• Natural forests: a subset of forests composed of tree
species known to be indigenous to the area.
• Plantation forests: established artificially by afforestation
on lands which previously did not carry forest within
living memory, or established artificially by reforestation
of land which carried forest before, with replacement of
the indigenous species by a new and essentially different
species or genetic variety.
Deforestation
Change of forest with depletion of tree crown cover to less than
10 percent. (Changes within the forest class, e.g. from closed to
open forest, which negatively affect the stand or site and, in
particular, lower the production capacity, are termed forest
degradation and are considered apart from deforestation.)
Other wooded land
Includes the following:
• Forest fallow, consisting of all complexes of woody
vegetation deriving from the clearing of natural forest for
shifting agriculture. It consists of a mosaic of various
succession phases and includes patches of uncleared
forests and agricultural fields which cannot be
realistically segregated and accounted for area wide,
especially from satellite imagery. Forest fallow is an
intermediate class between forest and non-forest land
uses. Part of the area which is not under cultivation may
have the appearance of a secondary forest. Even the part
currently under cultivation sometimes has the appearance
of forest, because of the presence of tree cover. Accurate
separation between forest and forest fallow may not
always be possible.
• Shrubs, referring to vegetation types where the dominant
woody elements are shrubs with more than 50 cm and
less than 5 m height on maturity. The height limits for
trees and shrubs should be interpreted with flexibility,
particularly where the minimum tree and maximum
shrub heights may vary between 5 and 7 m
approximately.
FOREST PRODUCTS DEFINITIONS
These definitions are an abbreviated form of those used by the
FAO Yearbook of Forest Products. See a recent volume of that
publication for full details (e.g. FAO, 1998g).
Roundwood
Wood in its natural state as removed from forests and from trees
outside the forest; wood in the rough. Commodities include all
forms of industrial roundwood and fuelwood.
Fuelwood and charcoal
Includes “wood in the rough” (from trunks and branches of trees)
to be used as fuel such as cooking, heating or power production.
Wood for charcoal is included.
Woodfuel
An aggregate term including fuelwood, charcoal and black liquor.
Black liquor
The alkaline-spent liquor obtained from the digesters in the
production of sulphate or soda pulp during the process of paper
production.
Industrial roundwood
The commodities included are sawlogs or veneer logs, pulpwood
and other industrial roundwood. In the case of trade, chips and
particles and wood residues are also included.
Sawnwood
Wood (including sleepers) sawn lengthwise or produced by a
profile-chipping process, and planed wood.
Wood-based panels
An aggregate term including the following commodities: veneer
sheets, plywood, particle board and fibreboard. Particleboard
118
includes varieties such as oriented strand board and flakeboard.
Fibreboard includes hardboard, medium-density fibreboard and
insulation fibreboard.
Pulp for paper
Includes both wood pulp (mechanical, semi-chemical and
chemical) and other fibre pulp (straw, bamboo and bagasse, etc.).
Recovered paper
Used paper and paperboard or residues from paper conversion,
collected for reuse as a raw material for the manufacture of paper,
paperboard or other products.
Paper and paperboard
The following commodities are included in this aggregate:
newsprint, printing and writing paper, other paper and paperboard.
SPECIES DEFINITIONS
Coniferous species (softwoods)
All woods derived from trees classified botanically as
Gymnospermae. These are generally referred to as softwoods.
Non-coniferous species (hardwoods)
All woods derived from trees classified botanically as
Angiospermae. These are generally referred to as broadleaved or
hardwoods.
OTHER DEFINITIONS
FAO has no formally adopted definitions for the following terms.
These definitions are provided to clarify their meaning in the
context of the State of the World’s Forests 1999.
Civil society
Non-State organizations and movements, including citizen groups,
NGOs, citizens’ organizations (formal and informal), mass media,
business leaders, the research community and social and political
movements.
Pluralism
The existence within any society of a variety of groups with
different, autonomous and sometimes conflicting interests,
values and perspectives. These differing views cannot be reduced
to a common perspective by the reference to an absolute
standard.
Stakeholder
An individual, social group or institution that possesses a direct,
significant and specific interest in a resource or a service.
119
Annex 3
global data set on forest cover and forest cover change available.
The source of the data is the FAO Forest Resources Assessment
Project, which published them in the State of the World’s Forests
1997 (FAO, 1997d). The methods used for collecting these data
are described in that publication.
The Pacific Islands Trust Territory data in this table represent
the aggregate figures for Northern Mariana Islands, Micronesia,
the Marshall Islands and Palau. Although the Pacific Island Trust
Territories entity was dissolved in 1994, disaggregate figures for
the four components were not available at the time the table was
originally prepared. “Total forest” is the sum of natural forest and
plantations. Because of difficulties in drawing a clear distinction
between the two in many developed countries, only “total forest”
figures are provided for developed countries and “n.ap.” (not
applicable) is indicated under “natural forest”. The “world total”
figure for land area is greater than the sum of the land areas of the
listed countries, because not all countries of the world are included
in the table.
The subregional breakdown reflects ecofloristic zones, not
economic or political groupings.
TABLE 3: CHANGE IN FOREST COVER, 1990-1995
The table gives data for all regions, broken down by country and
by ecofloristic zone. See notes to Table 2.
TABLE 4: PRODUCTION, TRADE AND CONSUMPTION OF
FOREST PRODUCTS, 1996
The table gives data for all regions, broken down by country. The
source of these data is the FAO Yearbook of Forest Products 1996
(FAO, 1998g). The information is also available electronically
through FAO’s website: http://www.fao.org.
TABLE 5: INTERNATIONAL CONVENTIONS AND
AGREEMENTS AND NATIONAL FOREST PROGRAMMES
The table gives countries that have ratified the UNCED
conventions – the Convention on Biological Diversity (CBD),
the Framework Convention on Climate Change (FCCC) and
the Convention to Combat Desertification (UNCCD); countries
that are members under the International Tropical Timber
Agreement (ITTA); and countries that have national forest
programmes (NFPs).
The reference date for ratification status and the source of
information on the conventions and agreements are as follows:
GENERAL NOTES
Country nomenclature and regional groups used in the tables
The country names and order used in these tables follow standard
UN practice regarding nomenclature and alphabetical listing of
countries. Separate data are not given for “Taiwan Province of
China”, but are incorporated in the data for China, as consistent
with UN practice. The regional groups used in these tables
represent FAO’s standardized regional breakdown of the world
according to geographical (note: not economic or political) criteria.
Tables 2 and 3 further break down these regions into subregional
groups. This breakdown parallels ecofloristic zones and is used
to provide the user with additional information about forest
resources within a given region.
Totals
Numbers may not tally because of rounding.
Abbreviations
n.s. = not significant, indicating a very small value
n.a. = not available
n.ap. = not applicable
TABLE 1: BASIC COUNTRY DATA
The table gives data for all regions: Africa, Asia, Oceania, Europe,
North and Central America, and South America. The land area
figure refers to total area of the country, excluding areas under
inland water bodies. The source of these data is the FAO
Production Yearbook 1996 (FAO, 1998h). Population statistics
on total population, population density and annual rate of change
are taken from World population prospects – the 1996 revision
(UN, 1996). The source of percent rural population data is the
World urbanization prospects – the 1996 revision (UN, 1997a).
The source of the economic data is World development
indicators 1997 (World Bank, 1997). The gross national product
(GNP) per caput figure represents the GNP converted to United
States dollars using the World Bank Atlas method, divided by the
mid-year population. The annual growth rate figures for gross
domestic product (GDP) are calculated using constant price data
in local currency.
TABLE 2: FOREST COVER, 1995
The table gives data for all regions, broken down by country and
by ecofloristic zone. These 1995 figures represent the most current
DATA TABLES
120
• CBD: status as of 28 May 1998. The source of this
information is the CBD website: http://www.biodiv.org.
• FCCC: status as of 20 July 1998. The source of this
information is the FCCC website: http://www.unfccc.de.
• UNCCD: status as of 31 August 1998. The source
of this information is the UNCCD website:
http://www.unccd.ch/lite.
• ITTA 1994: status as of 7 September 1998. The source of
this information is ITTO, personal communication.
In addition to the countries indicated, the European Community
has ratified CBD, FCCC and UNCCD and the European Union
has signed ITTA 1994.
The regional breakdown reflects geographic rather than
economic or political groupings.
Abbreviations used in Table 5
FSR = Forestry Sector Review
MP = Forestry Sector Master Plan
NCS = National Conservation Strategy
NEAP = National Environmental Action Plan
NEMS = National Environmental Management Strategy
NFAP = National Forestry Action Programme (including Tropical
Forests Action Programme, TFAP)
NP = National Legal Policy or Planning Framework
NPCD = National Plan to Combat Desertification
* = Planning process interrupted, not completed
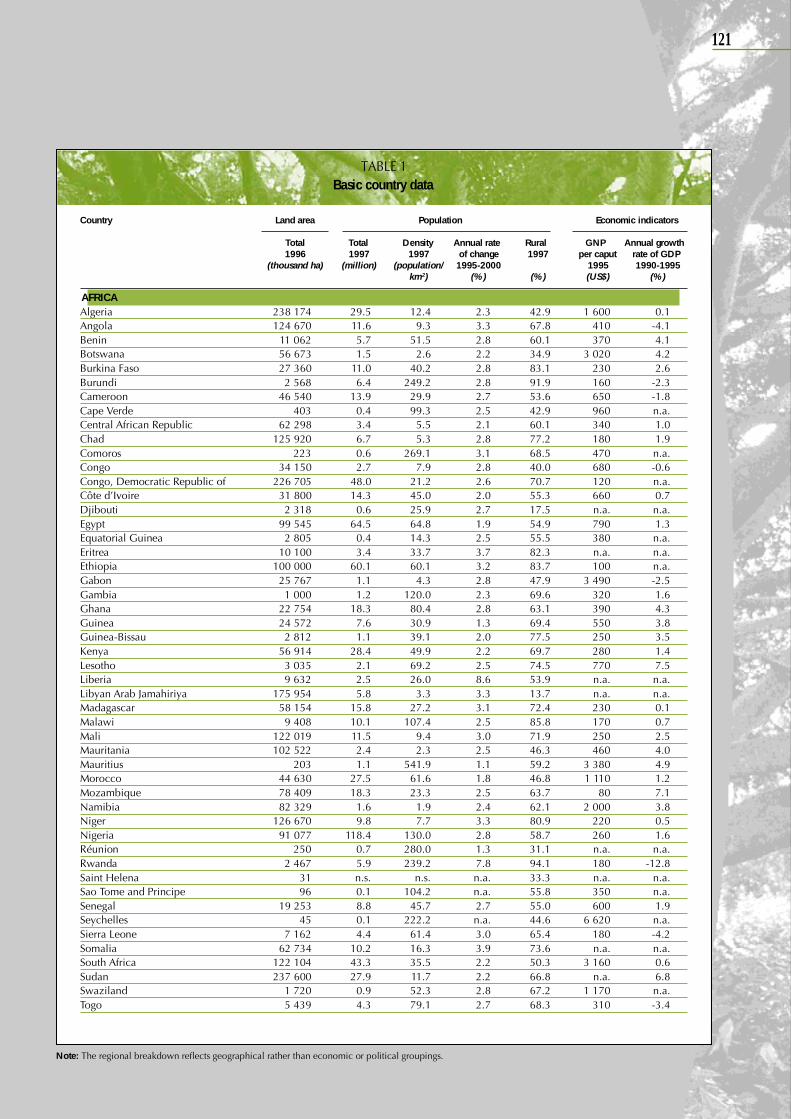
121
TABLE 1Basic country data
Country Land area Population Economic indicators
Total Total Density Annual rate Rural GNP Annual growth1996 1997 1997 of change 1997 per caput rate of GDP
(thousand ha) (million) (population/ 1995-2000 1995 1990-1995km2) (%) (%) (US$) (%)
AFRICAAlgeria 238 174 29.5 12.4 2.3 42.9 1 600 0.1Angola 124 670 11.6 9.3 3.3 67.8 410 -4.1Benin 11 062 5.7 51.5 2.8 60.1 370 4.1Botswana 56 673 1.5 2.6 2.2 34.9 3 020 4.2Burkina Faso 27 360 11.0 40.2 2.8 83.1 230 2.6Burundi 2 568 6.4 249.2 2.8 91.9 160 -2.3Cameroon 46 540 13.9 29.9 2.7 53.6 650 -1.8Cape Verde 403 0.4 99.3 2.5 42.9 960 n.a.Central African Republic 62 298 3.4 5.5 2.1 60.1 340 1.0Chad 125 920 6.7 5.3 2.8 77.2 180 1.9Comoros 223 0.6 269.1 3.1 68.5 470 n.a.Congo 34 150 2.7 7.9 2.8 40.0 680 -0.6Congo, Democratic Republic of 226 705 48.0 21.2 2.6 70.7 120 n.a.Côte d’Ivoire 31 800 14.3 45.0 2.0 55.3 660 0.7Djibouti 2 318 0.6 25.9 2.7 17.5 n.a. n.a.Egypt 99 545 64.5 64.8 1.9 54.9 790 1.3Equatorial Guinea 2 805 0.4 14.3 2.5 55.5 380 n.a.Eritrea 10 100 3.4 33.7 3.7 82.3 n.a. n.a.Ethiopia 100 000 60.1 60.1 3.2 83.7 100 n.a.Gabon 25 767 1.1 4.3 2.8 47.9 3 490 -2.5Gambia 1 000 1.2 120.0 2.3 69.6 320 1.6Ghana 22 754 18.3 80.4 2.8 63.1 390 4.3Guinea 24 572 7.6 30.9 1.3 69.4 550 3.8Guinea-Bissau 2 812 1.1 39.1 2.0 77.5 250 3.5Kenya 56 914 28.4 49.9 2.2 69.7 280 1.4Lesotho 3 035 2.1 69.2 2.5 74.5 770 7.5Liberia 9 632 2.5 26.0 8.6 53.9 n.a. n.a.Libyan Arab Jamahiriya 175 954 5.8 3.3 3.3 13.7 n.a. n.a.Madagascar 58 154 15.8 27.2 3.1 72.4 230 0.1Malawi 9 408 10.1 107.4 2.5 85.8 170 0.7Mali 122 019 11.5 9.4 3.0 71.9 250 2.5Mauritania 102 522 2.4 2.3 2.5 46.3 460 4.0Mauritius 203 1.1 541.9 1.1 59.2 3 380 4.9Morocco 44 630 27.5 61.6 1.8 46.8 1 110 1.2Mozambique 78 409 18.3 23.3 2.5 63.7 80 7.1Namibia 82 329 1.6 1.9 2.4 62.1 2 000 3.8Niger 126 670 9.8 7.7 3.3 80.9 220 0.5Nigeria 91 077 118.4 130.0 2.8 58.7 260 1.6Réunion 250 0.7 280.0 1.3 31.1 n.a. n.a.Rwanda 2 467 5.9 239.2 7.8 94.1 180 -12.8Saint Helena 31 n.s. n.s. n.a. 33.3 n.a. n.a.Sao Tome and Principe 96 0.1 104.2 n.a. 55.8 350 n.a.Senegal 19 253 8.8 45.7 2.7 55.0 600 1.9Seychelles 45 0.1 222.2 n.a. 44.6 6 620 n.a.Sierra Leone 7 162 4.4 61.4 3.0 65.4 180 -4.2Somalia 62 734 10.2 16.3 3.9 73.6 n.a. n.a.South Africa 122 104 43.3 35.5 2.2 50.3 3 160 0.6Sudan 237 600 27.9 11.7 2.2 66.8 n.a. 6.8Swaziland 1 720 0.9 52.3 2.8 67.2 1 170 n.a.Togo 5 439 4.3 79.1 2.7 68.3 310 -3.4
Note: The regional breakdown reflects geographical rather than economic or political groupings.
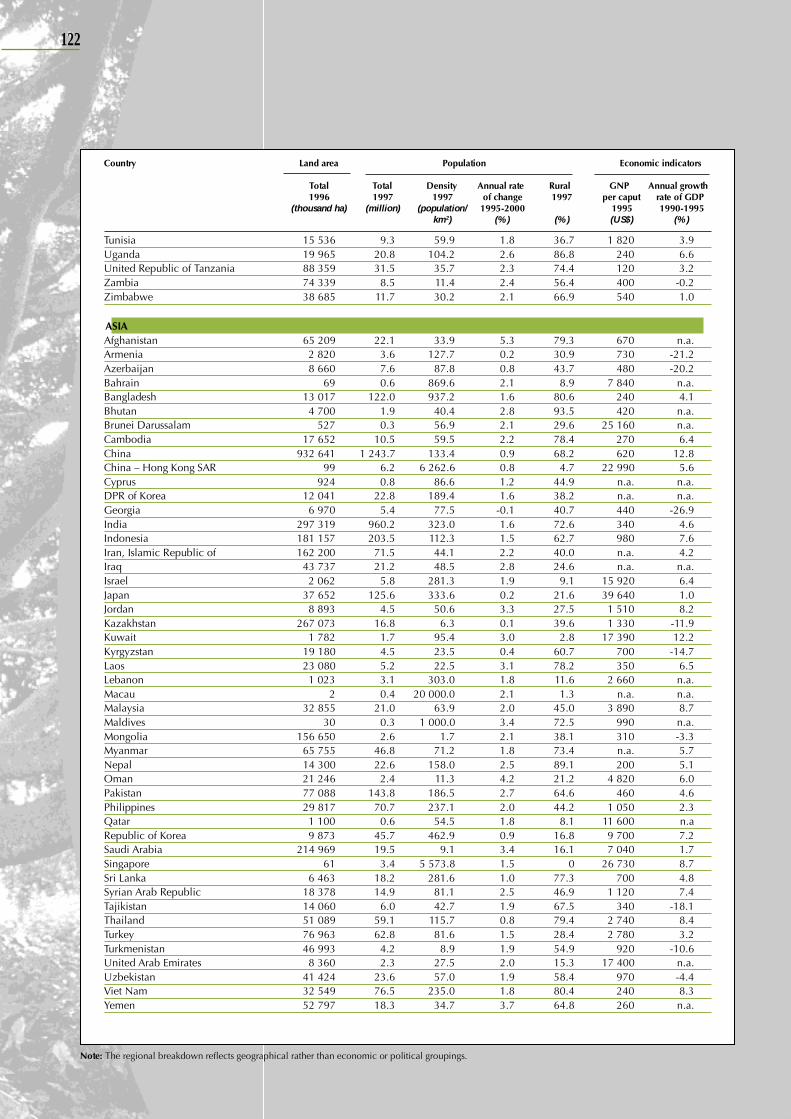
122
Tunisia 15 536 9.3 59.9 1.8 36.7 1 820 3.9Uganda 19 965 20.8 104.2 2.6 86.8 240 6.6United Republic of Tanzania 88 359 31.5 35.7 2.3 74.4 120 3.2Zambia 74 339 8.5 11.4 2.4 56.4 400 -0.2Zimbabwe 38 685 11.7 30.2 2.1 66.9 540 1.0
ASIAAfghanistan 65 209 22.1 33.9 5.3 79.3 670 n.a.Armenia 2 820 3.6 127.7 0.2 30.9 730 -21.2Azerbaijan 8 660 7.6 87.8 0.8 43.7 480 -20.2Bahrain 69 0.6 869.6 2.1 8.9 7 840 n.a.Bangladesh 13 017 122.0 937.2 1.6 80.6 240 4.1Bhutan 4 700 1.9 40.4 2.8 93.5 420 n.a.Brunei Darussalam 527 0.3 56.9 2.1 29.6 25 160 n.a.Cambodia 17 652 10.5 59.5 2.2 78.4 270 6.4China 932 641 1 243.7 133.4 0.9 68.2 620 12.8China – Hong Kong SAR 99 6.2 6 262.6 0.8 4.7 22 990 5.6Cyprus 924 0.8 86.6 1.2 44.9 n.a. n.a.DPR of Korea 12 041 22.8 189.4 1.6 38.2 n.a. n.a.Georgia 6 970 5.4 77.5 -0.1 40.7 440 -26.9India 297 319 960.2 323.0 1.6 72.6 340 4.6Indonesia 181 157 203.5 112.3 1.5 62.7 980 7.6Iran, Islamic Republic of 162 200 71.5 44.1 2.2 40.0 n.a. 4.2Iraq 43 737 21.2 48.5 2.8 24.6 n.a. n.a.Israel 2 062 5.8 281.3 1.9 9.1 15 920 6.4Japan 37 652 125.6 333.6 0.2 21.6 39 640 1.0Jordan 8 893 4.5 50.6 3.3 27.5 1 510 8.2Kazakhstan 267 073 16.8 6.3 0.1 39.6 1 330 -11.9Kuwait 1 782 1.7 95.4 3.0 2.8 17 390 12.2Kyrgyzstan 19 180 4.5 23.5 0.4 60.7 700 -14.7Laos 23 080 5.2 22.5 3.1 78.2 350 6.5Lebanon 1 023 3.1 303.0 1.8 11.6 2 660 n.a.Macau 2 0.4 20 000.0 2.1 1.3 n.a. n.a.Malaysia 32 855 21.0 63.9 2.0 45.0 3 890 8.7Maldives 30 0.3 1 000.0 3.4 72.5 990 n.a.Mongolia 156 650 2.6 1.7 2.1 38.1 310 -3.3Myanmar 65 755 46.8 71.2 1.8 73.4 n.a. 5.7Nepal 14 300 22.6 158.0 2.5 89.1 200 5.1Oman 21 246 2.4 11.3 4.2 21.2 4 820 6.0Pakistan 77 088 143.8 186.5 2.7 64.6 460 4.6Philippines 29 817 70.7 237.1 2.0 44.2 1 050 2.3Qatar 1 100 0.6 54.5 1.8 8.1 11 600 n.aRepublic of Korea 9 873 45.7 462.9 0.9 16.8 9 700 7.2Saudi Arabia 214 969 19.5 9.1 3.4 16.1 7 040 1.7Singapore 61 3.4 5 573.8 1.5 0 26 730 8.7Sri Lanka 6 463 18.2 281.6 1.0 77.3 700 4.8Syrian Arab Republic 18 378 14.9 81.1 2.5 46.9 1 120 7.4Tajikistan 14 060 6.0 42.7 1.9 67.5 340 -18.1Thailand 51 089 59.1 115.7 0.8 79.4 2 740 8.4Turkey 76 963 62.8 81.6 1.5 28.4 2 780 3.2Turkmenistan 46 993 4.2 8.9 1.9 54.9 920 -10.6United Arab Emirates 8 360 2.3 27.5 2.0 15.3 17 400 n.a.Uzbekistan 41 424 23.6 57.0 1.9 58.4 970 -4.4Viet Nam 32 549 76.5 235.0 1.8 80.4 240 8.3Yemen 52 797 18.3 34.7 3.7 64.8 260 n.a.
Country Land area Population Economic indicators
Total Total Density Annual rate Rural GNP Annual growth1996 1997 1997 of change 1997 per caput rate of GDP
(thousand ha) (million) (population/ 1995-2000 1995 1990-1995km2) (%) (%) (US$) (%)
Note: The regional breakdown reflects geographical rather than economic or political groupings.

123
OCEANIAAmerican Samoa 20 0 0 n.a. 49.1 n.a. n.a.Australia 768 230 18.2 2.4 1.1 15.3 18 720 3.5Cook Islands 23 0 0 n.a. 36.8 n.a. n.a.Fiji 1 827 0.8 43.8 1.6 58.7 2 440 n.a.French Polynesia 366 0.2 54.6 1.9 43.6 n.a. n.a.Guam 55 0.1 181.8 1.8 60.9 n.a. n.a.Kiribati 73 0.1 137.0 n.a. 64.2 920 n.a.New Caledonia 1 828 0.2 10.9 1.5 37.1 n.a. n.a.New Zealand 26 799 3.6 13.4 1.1 13.7 14 340 3.6Niue 26 n.s. n.s. n.a. 50.0 n.a. n.a.Pacific Islands (Trust Terr.) 178 n.s. n.s. n.a. n.a. n.a. n.a.Papua New Guinea 45 286 4.5 9.9 2.2 83.4 1 160 9.3Samoa 283 0.2 70.7 1.1 78.6 n.a. n.a.Solomon Islands 2 799 0.4 14.3 3.2 81.9 910 n.a.Tonga 72 0.1 138.9 n.a. 56.6 1 630 n.a.Vanuatu 1 219 0.2 16.4 2.5 80.9 1 200 n.a.
EUROPEAlbania 2 740 3.4 124.1 0.6 62.0 670 1.4Austria 8 273 8.2 99.1 0.6 35.5 26 890 1.9Belarus 20 748 10.3 49.6 -0.1 27.6 2 070 -9.3Belgium and Luxembourg 3 282 10.6 323.0 0.3 3.1 24 710 1.1Bosnia and Herzegovina 5 100 3.8 74.5 3.9 58.1 n.a. n.a.Bulgaria 11 055 8.4 76.0 -0.5 31.0 1 330 -4.3Croatia 5 592 4.5 80.5 -0.1 43.4 3 250 n.a.Czech Republic 7 728 10.2 132.0 -0.1 34.2 3 870 -2.6Denmark 4 243 5.2 122.6 0.2 14.6 29 890 2.0Estonia 4 227 1.4 33.1 -1.0 26.5 2 860 -9.2Finland 30 459 5.1 16.7 0.3 36.1 20 580 -0.5France 55 010 58.5 106.3 0.3 25.0 24 990 1.0Germany 34 927 82.2 235.3 0.3 13.1 27 510 n.a.Greece 12 890 10.5 81.5 0.3 40.4 8 210 1.1Hungary 9 234 10.0 108.3 -0.6 34.5 4 120 -1.0Iceland 10 025 0.3 3.0 1.0 8.4 24 950 n.a.Ireland 6 889 3.5 50.8 0.2 42.1 14 710 4.7Italy 29 406 57.2 194.5 n.a. 33.2 19 020 1.0Latvia 6 205 2.5 40.3 -1.1 26.6 2 270 -13.7Liechtenstein 16 n.s. n.s. n.a. 78.1 n.a. n.a.Lithuania 6 480 3.7 57.1 -0.2 27.0 1 900 -9.7Malta 32 0.4 1 250.0 0.6 10.2 n.a. n.a.Netherlands 3 392 15.7 462.9 0.5 10.9 24 000 1.8Norway 30 683 4.4 14.3 0.4 26.4 31 250 3.5Poland 30 442 38.6 126.8 0.1 35.6 2 790 2.4Portugal 9 150 9.8 107.1 -0.1 63.5 9 740 0.8Republic of Moldova 3 297 4.4 133.5 0.1 47.0 920 n.a.Romania 23 034 22.6 98.1 -0.2 43.2 1 480 -1.4Russian Federation 1 688 850 147.7 8.7 -0.3 23.4 2 240 -9.8Slovakia 4 808 5.4 112.3 0.1 40.3 2 950 -2.8Slovenia 2 012 1.9 94.4 -0.1 48.2 8 200 n.a.Spain 49 944 39.7 79.5 0.1 23.1 13 580 1.1Sweden 41 162 8.8 21.4 0.2 16.8 23 750 -0.1Switzerland 3 955 7.3 184.6 0.7 38.4 40 630 0.1The FYR of Macedonia 2 543 2.2 86.5 0.7 39.3 860 n.a.Ukraine 57 935 51.4 88.7 -0.4 28.9 1 630 -14.3
Country Land area Population Economic indicators
Total Total Density Annual rate Rural GNP Annual growth1996 1997 1997 of change 1997 per caput rate of GDP
(thousand ha) (million) (population/ 1995-2000 1995 1990-1995km2) (%) (%) (US$) (%)
Note: The regional breakdown reflects geographical rather than economic or political groupings.
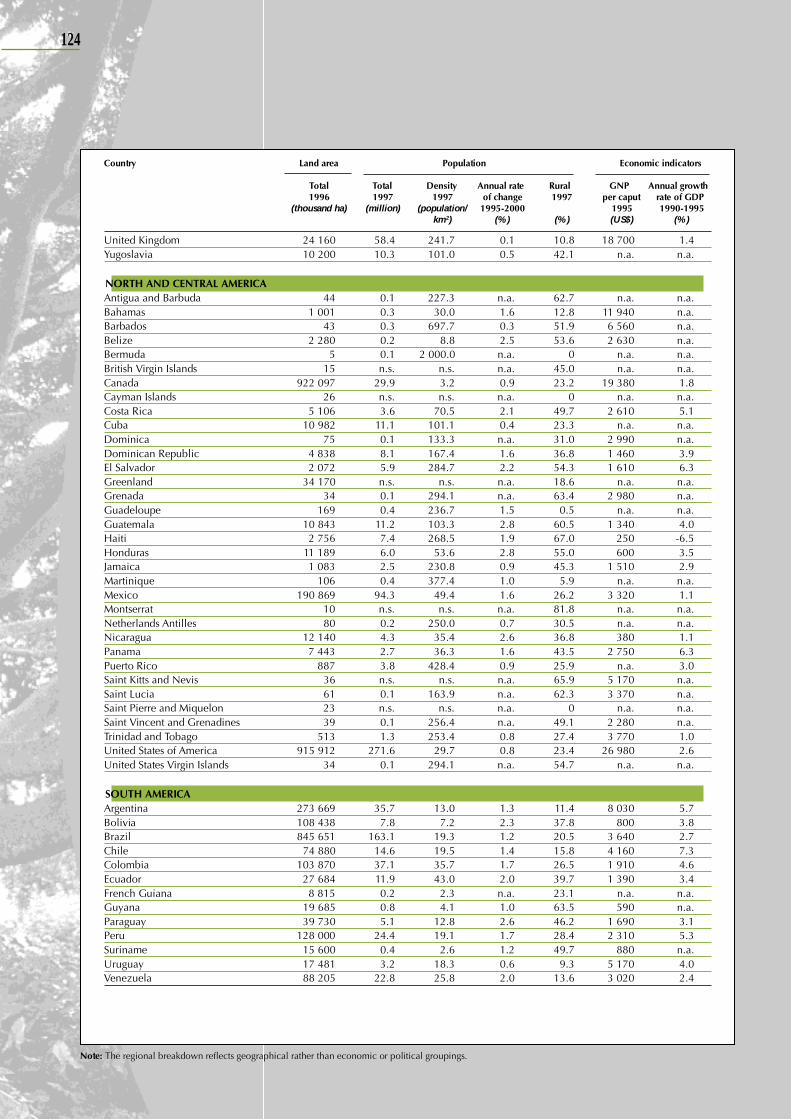
124
United Kingdom 24 160 58.4 241.7 0.1 10.8 18 700 1.4Yugoslavia 10 200 10.3 101.0 0.5 42.1 n.a. n.a.
NORTH AND CENTRAL AMERICAAntigua and Barbuda 44 0.1 227.3 n.a. 62.7 n.a. n.a.Bahamas 1 001 0.3 30.0 1.6 12.8 11 940 n.a.Barbados 43 0.3 697.7 0.3 51.9 6 560 n.a.Belize 2 280 0.2 8.8 2.5 53.6 2 630 n.a.Bermuda 5 0.1 2 000.0 n.a. 0 n.a. n.a.British Virgin Islands 15 n.s. n.s. n.a. 45.0 n.a. n.a.Canada 922 097 29.9 3.2 0.9 23.2 19 380 1.8Cayman Islands 26 n.s. n.s. n.a. 0 n.a. n.a.Costa Rica 5 106 3.6 70.5 2.1 49.7 2 610 5.1Cuba 10 982 11.1 101.1 0.4 23.3 n.a. n.a.Dominica 75 0.1 133.3 n.a. 31.0 2 990 n.a.Dominican Republic 4 838 8.1 167.4 1.6 36.8 1 460 3.9El Salvador 2 072 5.9 284.7 2.2 54.3 1 610 6.3Greenland 34 170 n.s. n.s. n.a. 18.6 n.a. n.a.Grenada 34 0.1 294.1 n.a. 63.4 2 980 n.a.Guadeloupe 169 0.4 236.7 1.5 0.5 n.a. n.a.Guatemala 10 843 11.2 103.3 2.8 60.5 1 340 4.0Haiti 2 756 7.4 268.5 1.9 67.0 250 -6.5Honduras 11 189 6.0 53.6 2.8 55.0 600 3.5Jamaica 1 083 2.5 230.8 0.9 45.3 1 510 2.9Martinique 106 0.4 377.4 1.0 5.9 n.a. n.a.Mexico 190 869 94.3 49.4 1.6 26.2 3 320 1.1Montserrat 10 n.s. n.s. n.a. 81.8 n.a. n.a.Netherlands Antilles 80 0.2 250.0 0.7 30.5 n.a. n.a.Nicaragua 12 140 4.3 35.4 2.6 36.8 380 1.1Panama 7 443 2.7 36.3 1.6 43.5 2 750 6.3Puerto Rico 887 3.8 428.4 0.9 25.9 n.a. 3.0Saint Kitts and Nevis 36 n.s. n.s. n.a. 65.9 5 170 n.a.Saint Lucia 61 0.1 163.9 n.a. 62.3 3 370 n.a.Saint Pierre and Miquelon 23 n.s. n.s. n.a. 0 n.a. n.a.Saint Vincent and Grenadines 39 0.1 256.4 n.a. 49.1 2 280 n.a.Trinidad and Tobago 513 1.3 253.4 0.8 27.4 3 770 1.0United States of America 915 912 271.6 29.7 0.8 23.4 26 980 2.6United States Virgin Islands 34 0.1 294.1 n.a. 54.7 n.a. n.a.
SOUTH AMERICAArgentina 273 669 35.7 13.0 1.3 11.4 8 030 5.7Bolivia 108 438 7.8 7.2 2.3 37.8 800 3.8Brazil 845 651 163.1 19.3 1.2 20.5 3 640 2.7Chile 74 880 14.6 19.5 1.4 15.8 4 160 7.3Colombia 103 870 37.1 35.7 1.7 26.5 1 910 4.6Ecuador 27 684 11.9 43.0 2.0 39.7 1 390 3.4French Guiana 8 815 0.2 2.3 n.a. 23.1 n.a. n.a.Guyana 19 685 0.8 4.1 1.0 63.5 590 n.a.Paraguay 39 730 5.1 12.8 2.6 46.2 1 690 3.1Peru 128 000 24.4 19.1 1.7 28.4 2 310 5.3Suriname 15 600 0.4 2.6 1.2 49.7 880 n.a.Uruguay 17 481 3.2 18.3 0.6 9.3 5 170 4.0Venezuela 88 205 22.8 25.8 2.0 13.6 3 020 2.4
Country Land area Population Economic indicators
Total Total Density Annual rate Rural GNP Annual growth1996 1997 1997 of change 1997 per caput rate of GDP
(thousand ha) (million) (population/ 1995-2000 1995 1990-1995km2) (%) (%) (US$) (%)
Note: The regional breakdown reflects geographical rather than economic or political groupings.
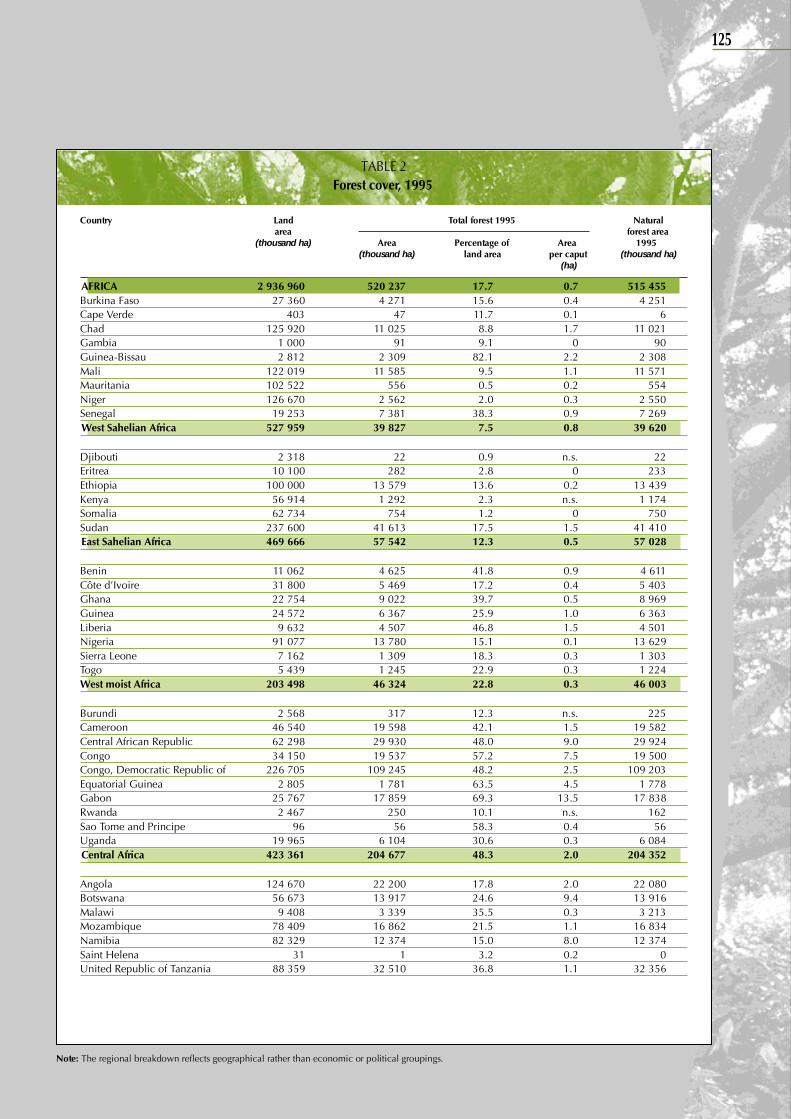
125
TABLE 2Forest cover, 1995
Country Land Total forest 1995 Naturalarea forest area
(thousand ha) Area Percentage of Area 1995(thousand ha) land area per caput (thousand ha)
(ha)
AFRICA 2 936 960 520 237 17.7 0.7 515 455Burkina Faso 27 360 4 271 15.6 0.4 4 251Cape Verde 403 47 11.7 0.1 6Chad 125 920 11 025 8.8 1.7 11 021Gambia 1 000 91 9.1 0 90Guinea-Bissau 2 812 2 309 82.1 2.2 2 308Mali 122 019 11 585 9.5 1.1 11 571Mauritania 102 522 556 0.5 0.2 554Niger 126 670 2 562 2.0 0.3 2 550Senegal 19 253 7 381 38.3 0.9 7 269West Sahelian Africa 527 959 39 827 7.5 0.8 39 620
Djibouti 2 318 22 0.9 n.s. 22Eritrea 10 100 282 2.8 0 233Ethiopia 100 000 13 579 13.6 0.2 13 439Kenya 56 914 1 292 2.3 n.s. 1 174Somalia 62 734 754 1.2 0 750Sudan 237 600 41 613 17.5 1.5 41 410East Sahelian Africa 469 666 57 542 12.3 0.5 57 028
Benin 11 062 4 625 41.8 0.9 4 611Côte d’Ivoire 31 800 5 469 17.2 0.4 5 403Ghana 22 754 9 022 39.7 0.5 8 969Guinea 24 572 6 367 25.9 1.0 6 363Liberia 9 632 4 507 46.8 1.5 4 501Nigeria 91 077 13 780 15.1 0.1 13 629Sierra Leone 7 162 1 309 18.3 0.3 1 303Togo 5 439 1 245 22.9 0.3 1 224West moist Africa 203 498 46 324 22.8 0.3 46 003
Burundi 2 568 317 12.3 n.s. 225Cameroon 46 540 19 598 42.1 1.5 19 582Central African Republic 62 298 29 930 48.0 9.0 29 924Congo 34 150 19 537 57.2 7.5 19 500Congo, Democratic Republic of 226 705 109 245 48.2 2.5 109 203Equatorial Guinea 2 805 1 781 63.5 4.5 1 778Gabon 25 767 17 859 69.3 13.5 17 838Rwanda 2 467 250 10.1 n.s. 162Sao Tome and Principe 96 56 58.3 0.4 56Uganda 19 965 6 104 30.6 0.3 6 084Central Africa 423 361 204 677 48.3 2.0 204 352
Angola 124 670 22 200 17.8 2.0 22 080Botswana 56 673 13 917 24.6 9.4 13 916Malawi 9 408 3 339 35.5 0.3 3 213Mozambique 78 409 16 862 21.5 1.1 16 834Namibia 82 329 12 374 15.0 8.0 12 374Saint Helena 31 1 3.2 0.2 0United Republic of Tanzania 88 359 32 510 36.8 1.1 32 356
Note: The regional breakdown reflects geographical rather than economic or political groupings.
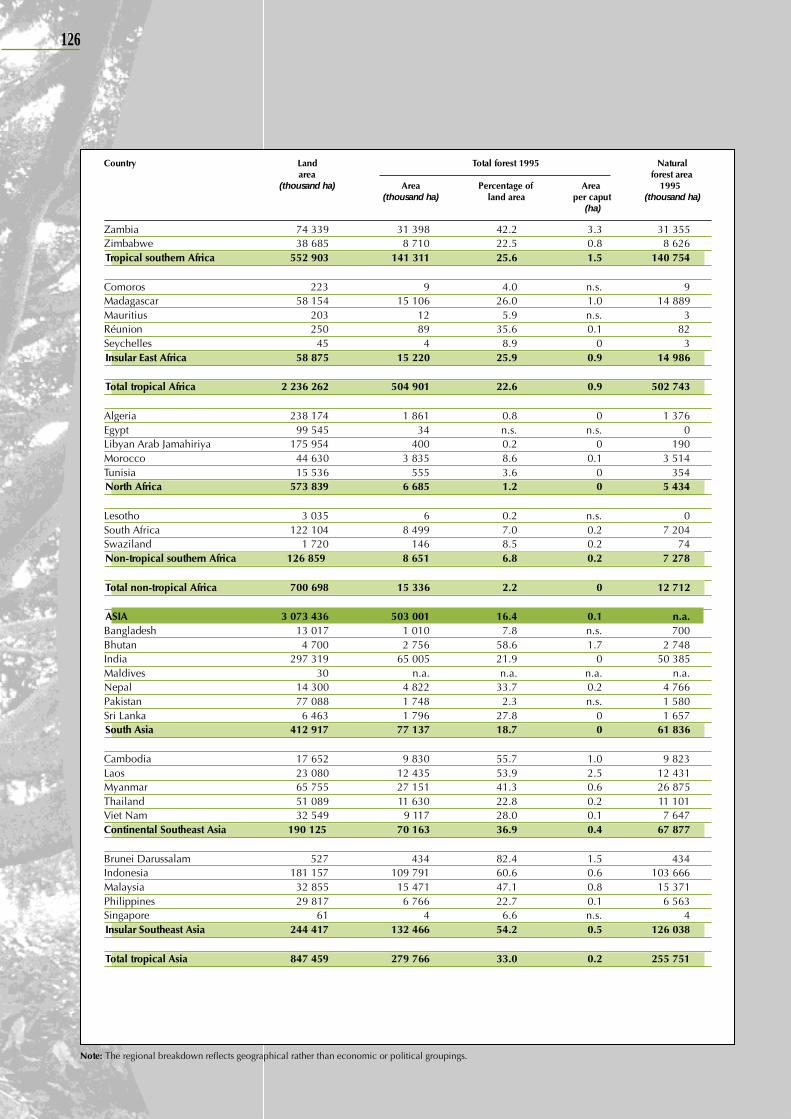
126
Zambia 74 339 31 398 42.2 3.3 31 355Zimbabwe 38 685 8 710 22.5 0.8 8 626Tropical southern Africa 552 903 141 311 25.6 1.5 140 754
Comoros 223 9 4.0 n.s. 9Madagascar 58 154 15 106 26.0 1.0 14 889Mauritius 203 12 5.9 n.s. 3Réunion 250 89 35.6 0.1 82Seychelles 45 4 8.9 0 3Insular East Africa 58 875 15 220 25.9 0.9 14 986
Total tropical Africa 2 236 262 504 901 22.6 0.9 502 743
Algeria 238 174 1 861 0.8 0 1 376Egypt 99 545 34 n.s. n.s. 0Libyan Arab Jamahiriya 175 954 400 0.2 0 190Morocco 44 630 3 835 8.6 0.1 3 514Tunisia 15 536 555 3.6 0 354North Africa 573 839 6 685 1.2 0 5 434
Lesotho 3 035 6 0.2 n.s. 0South Africa 122 104 8 499 7.0 0.2 7 204Swaziland 1 720 146 8.5 0.2 74Non-tropical southern Africa 126 859 8 651 6.8 0.2 7 278
Total non-tropical Africa 700 698 15 336 2.2 0 12 712
ASIA 3 073 436 503 001 16.4 0.1 n.a.Bangladesh 13 017 1 010 7.8 n.s. 700Bhutan 4 700 2 756 58.6 1.7 2 748India 297 319 65 005 21.9 0 50 385Maldives 30 n.a. n.a. n.a. n.a.Nepal 14 300 4 822 33.7 0.2 4 766Pakistan 77 088 1 748 2.3 n.s. 1 580Sri Lanka 6 463 1 796 27.8 0 1 657South Asia 412 917 77 137 18.7 0 61 836
Cambodia 17 652 9 830 55.7 1.0 9 823Laos 23 080 12 435 53.9 2.5 12 431Myanmar 65 755 27 151 41.3 0.6 26 875Thailand 51 089 11 630 22.8 0.2 11 101Viet Nam 32 549 9 117 28.0 0.1 7 647Continental Southeast Asia 190 125 70 163 36.9 0.4 67 877
Brunei Darussalam 527 434 82.4 1.5 434Indonesia 181 157 109 791 60.6 0.6 103 666Malaysia 32 855 15 471 47.1 0.8 15 371Philippines 29 817 6 766 22.7 0.1 6 563Singapore 61 4 6.6 n.s. 4Insular Southeast Asia 244 417 132 466 54.2 0.5 126 038
Total tropical Asia 847 459 279 766 33.0 0.2 255 751
Country Land Total forest 1995 Naturalarea forest area
(thousand ha) Area Percentage of Area 1995(thousand ha) land area per caput (thousand ha)
(ha)
Note: The regional breakdown reflects geographical rather than economic or political groupings.

127
Afghanistan 65 209 1 398 2.1 0 1 390Armenia 2 820 334 11.8 0 n.ap.Azerbaijan 8 660 990 11.4 0.1 n.ap.Bahrain 69 0 0 0 0Cyprus 924 140 15.2 0.2 n.ap.Georgia 6 970 2 988 42.9 0.5 n.ap.Iran, Islamic Republic of 162 200 1 544 1.0 n.s. 1 465Iraq 43 737 83 0.2 n.s. 69Israel 2 062 102 4.9 n.s. n.ap.Jordan 8 893 45 0.5 n.s. 22Kazakhstan 267 073 10 504 3.9 0.6 n.ap.Kuwait 1 782 5 0.3 n.s. 0Kyrgyzstan 19 180 730 3.8 0.2 n.ap.Lebanon 1 023 52 5.1 n.s. 39Oman 21 246 0 0 0 0Qatar 1 100 0 0 0 0Saudi Arabia 214 969 222 0.1 n.s. 221Syrian Arab Republic 18 378 219 1.2 n.s. 92Tajikistan 14 060 410 2.9 0 n.ap.Turkey 76 963 8 856 11.5 0.1 n.ap.Turkmenistan 46 993 3 754 8.0 0.9 n.ap.United Arab Emirates 8 360 60 0.7 n.s. 0Uzbekistan 41 424 9 119 22.0 0.4 n.ap.Yemen 52 797 9 n.s. n.s. 9Western and Central Asia 1 086 892 41 564 3.8 0.1 n.ap.
China 932 641 133 323 14.3 0.1 99 523China – Hong Kong SAR 99 n.a. n.a. n.a. n.a.DPR of Korea 12 041 6 170 51.2 0.3 4 700Japan 37 652 25 146 66.8 0.2 n.ap.Macau 2 n.a. n.a. n.a. n.a.Mongolia 156 650 9 406 6.0 3.9 9 406Republic of Korea 9 873 7 626 77.2 0.2 6 226East Asia 1 139 085 181 671 15.9 0.1 n.ap.
Total temperate Asia 2 225 977 223 235 10.0 0.1 n.ap.
OCEANIA 849 084 90 695 10.7 3.2 n.ap.American Samoa 20 0 0 0 0Cook Islands 23 n.a. n.a. n.a. n.a.Fiji 1 827 835 45.7 1.1 757French Polynesia 366 0 0 0 0Guam 55 0 0 0 0Kiribati 73 0 0 0 0New Caledonia 1 828 698 38.2 3.9 689Niue 26 6 23.1 3.0 6Pacific Islands (Trust Terr.) 178 0 0 0 0Papua New Guinea 45 286 36 939 81.6 8.6 36 909Samoa 283 136 48.1 0.8 127Solomon Islands 2 799 2 389 85.4 6.3 2 371Tonga 72 0 0 0 0Vanuatu 1 219 900 73.8 5.3 893Total tropical Oceania 54 055 41 903 77.5 6.3 41 752
Country Land Total forest 1995 Naturalarea forest area
(thousand ha) Area Percentage of Area 1995(thousand ha) land area per caput (thousand ha)
(ha)
Note: The regional breakdown reflects geographical rather than economic or political groupings.
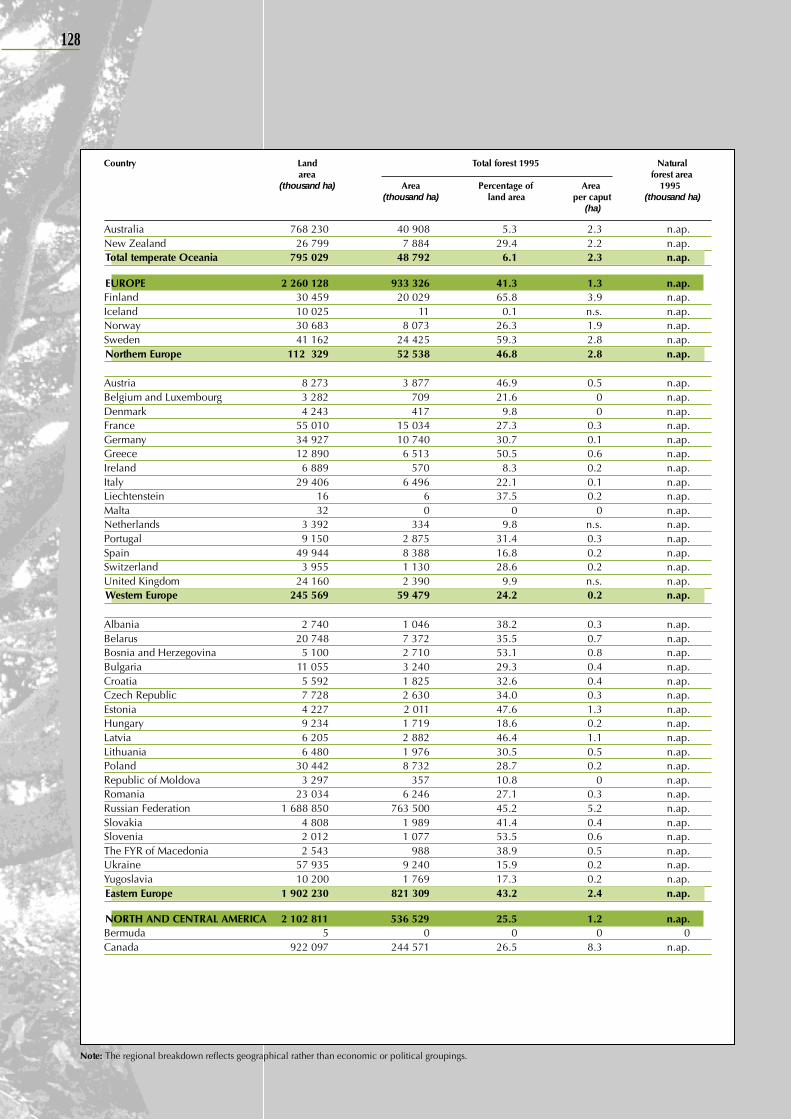
128
Australia 768 230 40 908 5.3 2.3 n.ap.New Zealand 26 799 7 884 29.4 2.2 n.ap.Total temperate Oceania 795 029 48 792 6.1 2.3 n.ap.
EUROPE 2 260 128 933 326 41.3 1.3 n.ap.Finland 30 459 20 029 65.8 3.9 n.ap.Iceland 10 025 11 0.1 n.s. n.ap.Norway 30 683 8 073 26.3 1.9 n.ap.Sweden 41 162 24 425 59.3 2.8 n.ap.Northern Europe 112 329 52 538 46.8 2.8 n.ap.
Austria 8 273 3 877 46.9 0.5 n.ap.Belgium and Luxembourg 3 282 709 21.6 0 n.ap.Denmark 4 243 417 9.8 0 n.ap.France 55 010 15 034 27.3 0.3 n.ap.Germany 34 927 10 740 30.7 0.1 n.ap.Greece 12 890 6 513 50.5 0.6 n.ap.Ireland 6 889 570 8.3 0.2 n.ap.Italy 29 406 6 496 22.1 0.1 n.ap.Liechtenstein 16 6 37.5 0.2 n.ap.Malta 32 0 0 0 n.ap.Netherlands 3 392 334 9.8 n.s. n.ap.Portugal 9 150 2 875 31.4 0.3 n.ap.Spain 49 944 8 388 16.8 0.2 n.ap.Switzerland 3 955 1 130 28.6 0.2 n.ap.United Kingdom 24 160 2 390 9.9 n.s. n.ap.Western Europe 245 569 59 479 24.2 0.2 n.ap.
Albania 2 740 1 046 38.2 0.3 n.ap.Belarus 20 748 7 372 35.5 0.7 n.ap.Bosnia and Herzegovina 5 100 2 710 53.1 0.8 n.ap.Bulgaria 11 055 3 240 29.3 0.4 n.ap.Croatia 5 592 1 825 32.6 0.4 n.ap.Czech Republic 7 728 2 630 34.0 0.3 n.ap.Estonia 4 227 2 011 47.6 1.3 n.ap.Hungary 9 234 1 719 18.6 0.2 n.ap.Latvia 6 205 2 882 46.4 1.1 n.ap.Lithuania 6 480 1 976 30.5 0.5 n.ap.Poland 30 442 8 732 28.7 0.2 n.ap.Republic of Moldova 3 297 357 10.8 0 n.ap.Romania 23 034 6 246 27.1 0.3 n.ap.Russian Federation 1 688 850 763 500 45.2 5.2 n.ap.Slovakia 4 808 1 989 41.4 0.4 n.ap.Slovenia 2 012 1 077 53.5 0.6 n.ap.The FYR of Macedonia 2 543 988 38.9 0.5 n.ap.Ukraine 57 935 9 240 15.9 0.2 n.ap.Yugoslavia 10 200 1 769 17.3 0.2 n.ap.Eastern Europe 1 902 230 821 309 43.2 2.4 n.ap.
NORTH AND CENTRAL AMERICA 2 102 811 536 529 25.5 1.2 n.ap.Bermuda 5 0 0 0 0Canada 922 097 244 571 26.5 8.3 n.ap.
Country Land Total forest 1995 Naturalarea forest area
(thousand ha) Area Percentage of Area 1995(thousand ha) land area per caput (thousand ha)
(ha)
Note: The regional breakdown reflects geographical rather than economic or political groupings.
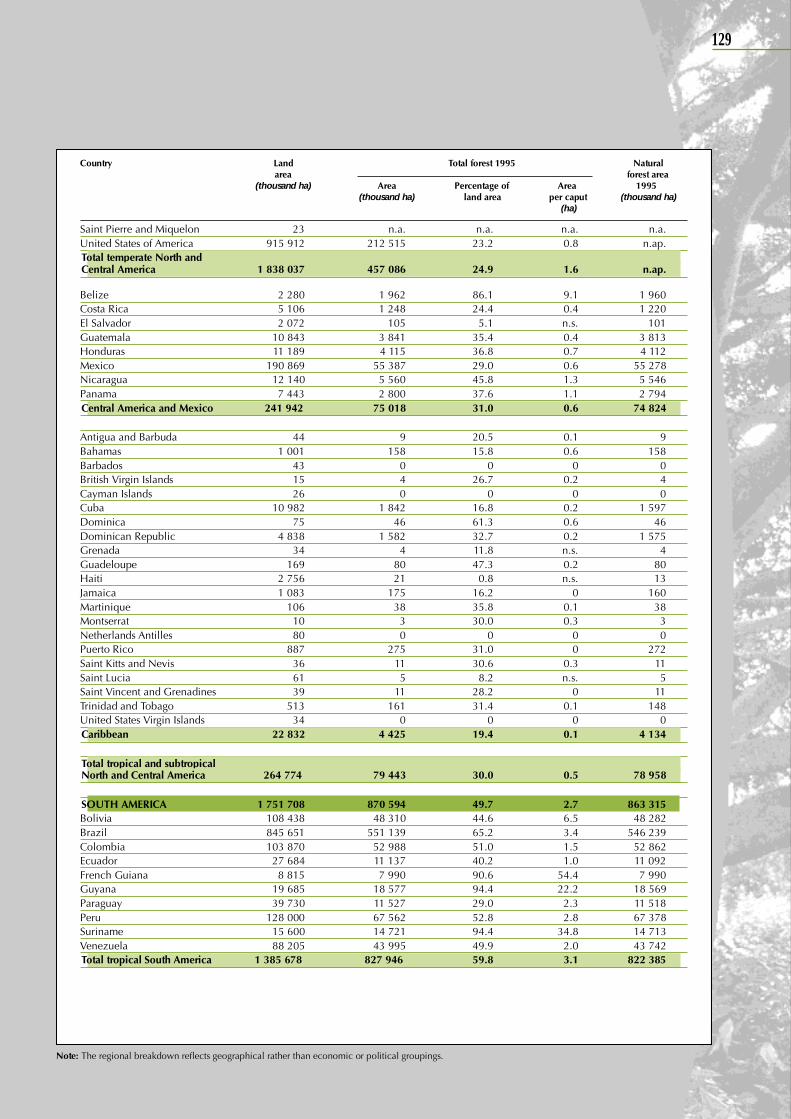
129
Saint Pierre and Miquelon 23 n.a. n.a. n.a. n.a.United States of America 915 912 212 515 23.2 0.8 n.ap.Total temperate North andCentral America 1 838 037 457 086 24.9 1.6 n.ap.
Belize 2 280 1 962 86.1 9.1 1 960Costa Rica 5 106 1 248 24.4 0.4 1 220El Salvador 2 072 105 5.1 n.s. 101Guatemala 10 843 3 841 35.4 0.4 3 813Honduras 11 189 4 115 36.8 0.7 4 112Mexico 190 869 55 387 29.0 0.6 55 278Nicaragua 12 140 5 560 45.8 1.3 5 546Panama 7 443 2 800 37.6 1.1 2 794Central America and Mexico 241 942 75 018 31.0 0.6 74 824
Antigua and Barbuda 44 9 20.5 0.1 9Bahamas 1 001 158 15.8 0.6 158Barbados 43 0 0 0 0British Virgin Islands 15 4 26.7 0.2 4Cayman Islands 26 0 0 0 0Cuba 10 982 1 842 16.8 0.2 1 597Dominica 75 46 61.3 0.6 46Dominican Republic 4 838 1 582 32.7 0.2 1 575Grenada 34 4 11.8 n.s. 4Guadeloupe 169 80 47.3 0.2 80Haiti 2 756 21 0.8 n.s. 13Jamaica 1 083 175 16.2 0 160Martinique 106 38 35.8 0.1 38Montserrat 10 3 30.0 0.3 3Netherlands Antilles 80 0 0 0 0Puerto Rico 887 275 31.0 0 272Saint Kitts and Nevis 36 11 30.6 0.3 11Saint Lucia 61 5 8.2 n.s. 5Saint Vincent and Grenadines 39 11 28.2 0 11Trinidad and Tobago 513 161 31.4 0.1 148United States Virgin Islands 34 0 0 0 0Caribbean 22 832 4 425 19.4 0.1 4 134
Total tropical and subtropicalNorth and Central America 264 774 79 443 30.0 0.5 78 958
SOUTH AMERICA 1 751 708 870 594 49.7 2.7 863 315Bolivia 108 438 48 310 44.6 6.5 48 282Brazil 845 651 551 139 65.2 3.4 546 239Colombia 103 870 52 988 51.0 1.5 52 862Ecuador 27 684 11 137 40.2 1.0 11 092French Guiana 8 815 7 990 90.6 54.4 7 990Guyana 19 685 18 577 94.4 22.2 18 569Paraguay 39 730 11 527 29.0 2.3 11 518Peru 128 000 67 562 52.8 2.8 67 378Suriname 15 600 14 721 94.4 34.8 14 713Venezuela 88 205 43 995 49.9 2.0 43 742Total tropical South America 1 385 678 827 946 59.8 3.1 822 385
Country Land Total forest 1995 Naturalarea forest area
(thousand ha) Area Percentage of Area 1995(thousand ha) land area per caput (thousand ha)
(ha)
Note: The regional breakdown reflects geographical rather than economic or political groupings.
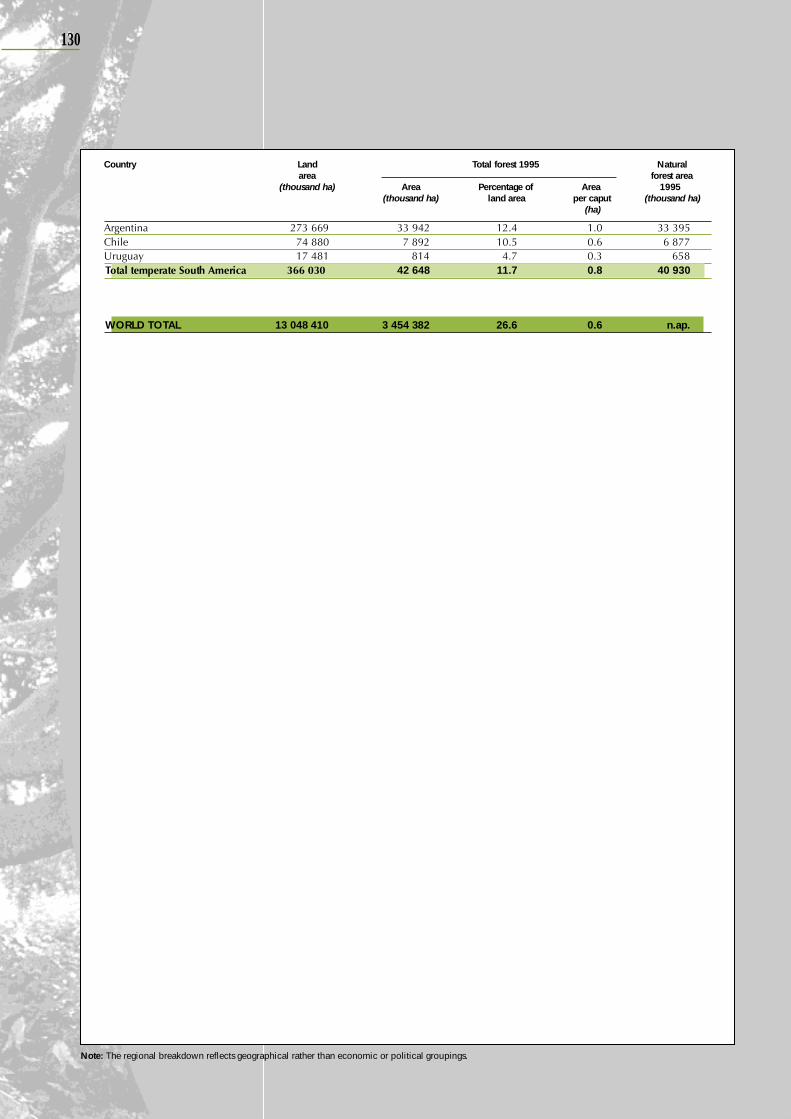
130
Argentina 273 669 33 942 12.4 1.0 33 395Chile 74 880 7 892 10.5 0.6 6 877Uruguay 17 481 814 4.7 0.3 658Total temperate South America 366 030 42 648 11.7 0.8 40 930
WORLD TOTAL 13 048 410 3 454 382 26.6 0.6 n.ap.
Country Land Total forest 1995 Naturalarea forest area
(thousand ha) Area Percentage of Area 1995(thousand ha) land area per caput (thousand ha)
(ha)
Note: The regional breakdown reflects geographical rather than economic or political groupings.
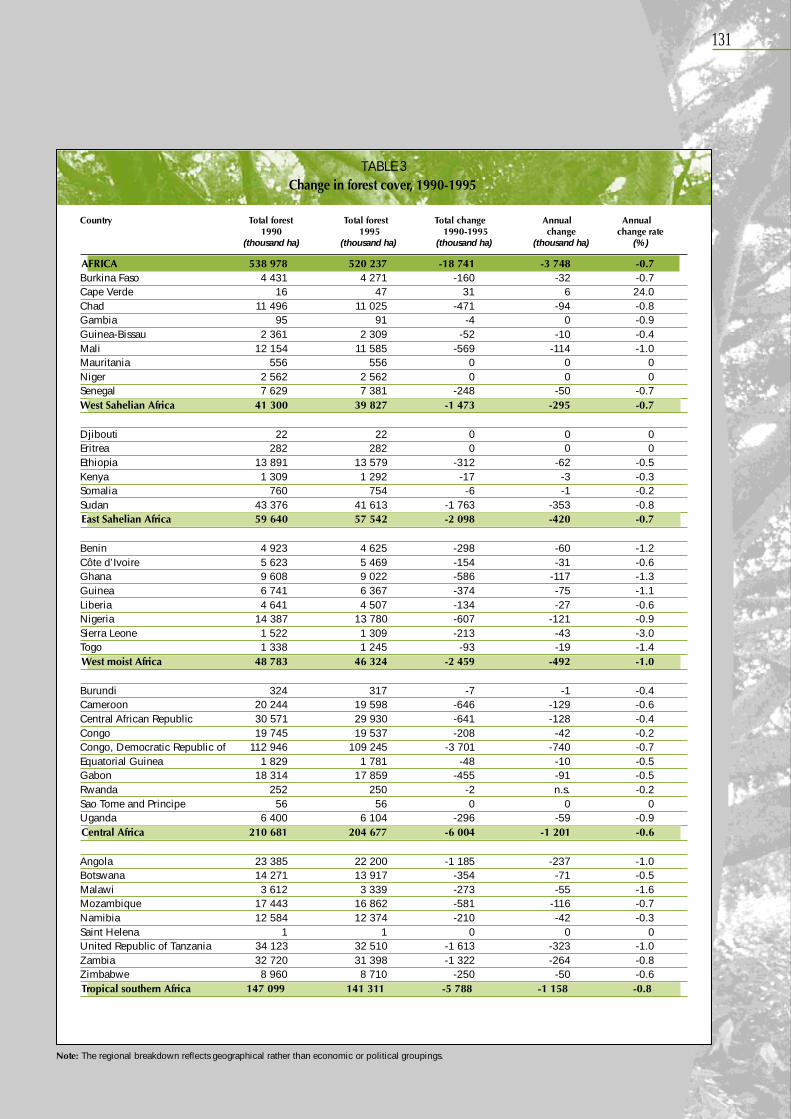
131
TABLE 3Change in forest cover, 1990-1995
Country Total forest Total forest Total change Annual Annual1990 1995 1990-1995 change change rate
(thousand ha) (thousand ha) (thousand ha) (thousand ha) (%)
AFRICA 538 978 520 237 -18 741 -3 748 -0.7Burkina Faso 4 431 4 271 -160 -32 -0.7Cape Verde 16 47 31 6 24.0Chad 11 496 11 025 -471 -94 -0.8Gambia 95 91 -4 0 -0.9Guinea-Bissau 2 361 2 309 -52 -10 -0.4Mali 12 154 11 585 -569 -114 -1.0Mauritania 556 556 0 0 0Niger 2 562 2 562 0 0 0Senegal 7 629 7 381 -248 -50 -0.7West Sahelian Africa 41 300 39 827 -1 473 -295 -0.7
Djibouti 22 22 0 0 0Eritrea 282 282 0 0 0Ethiopia 13 891 13 579 -312 -62 -0.5Kenya 1 309 1 292 -17 -3 -0.3Somalia 760 754 -6 -1 -0.2Sudan 43 376 41 613 -1 763 -353 -0.8East Sahelian Africa 59 640 57 542 -2 098 -420 -0.7
Benin 4 923 4 625 -298 -60 -1.2Côte d’Ivoire 5 623 5 469 -154 -31 -0.6Ghana 9 608 9 022 -586 -117 -1.3Guinea 6 741 6 367 -374 -75 -1.1Liberia 4 641 4 507 -134 -27 -0.6Nigeria 14 387 13 780 -607 -121 -0.9Sierra Leone 1 522 1 309 -213 -43 -3.0Togo 1 338 1 245 -93 -19 -1.4West moist Africa 48 783 46 324 -2 459 -492 -1.0
Burundi 324 317 -7 -1 -0.4Cameroon 20 244 19 598 -646 -129 -0.6Central African Republic 30 571 29 930 -641 -128 -0.4Congo 19 745 19 537 -208 -42 -0.2Congo, Democratic Republic of 112 946 109 245 -3 701 -740 -0.7Equatorial Guinea 1 829 1 781 -48 -10 -0.5Gabon 18 314 17 859 -455 -91 -0.5Rwanda 252 250 -2 n.s. -0.2Sao Tome and Principe 56 56 0 0 0Uganda 6 400 6 104 -296 -59 -0.9Central Africa 210 681 204 677 -6 004 -1 201 -0.6
Angola 23 385 22 200 -1 185 -237 -1.0Botswana 14 271 13 917 -354 -71 -0.5Malawi 3 612 3 339 -273 -55 -1.6Mozambique 17 443 16 862 -581 -116 -0.7Namibia 12 584 12 374 -210 -42 -0.3Saint Helena 1 1 0 0 0United Republic of Tanzania 34 123 32 510 -1 613 -323 -1.0Zambia 32 720 31 398 -1 322 -264 -0.8Zimbabwe 8 960 8 710 -250 -50 -0.6Tropical southern Africa 147 099 141 311 -5 788 -1 158 -0.8
Note: The regional breakdown reflects geographical rather than economic or political groupings.
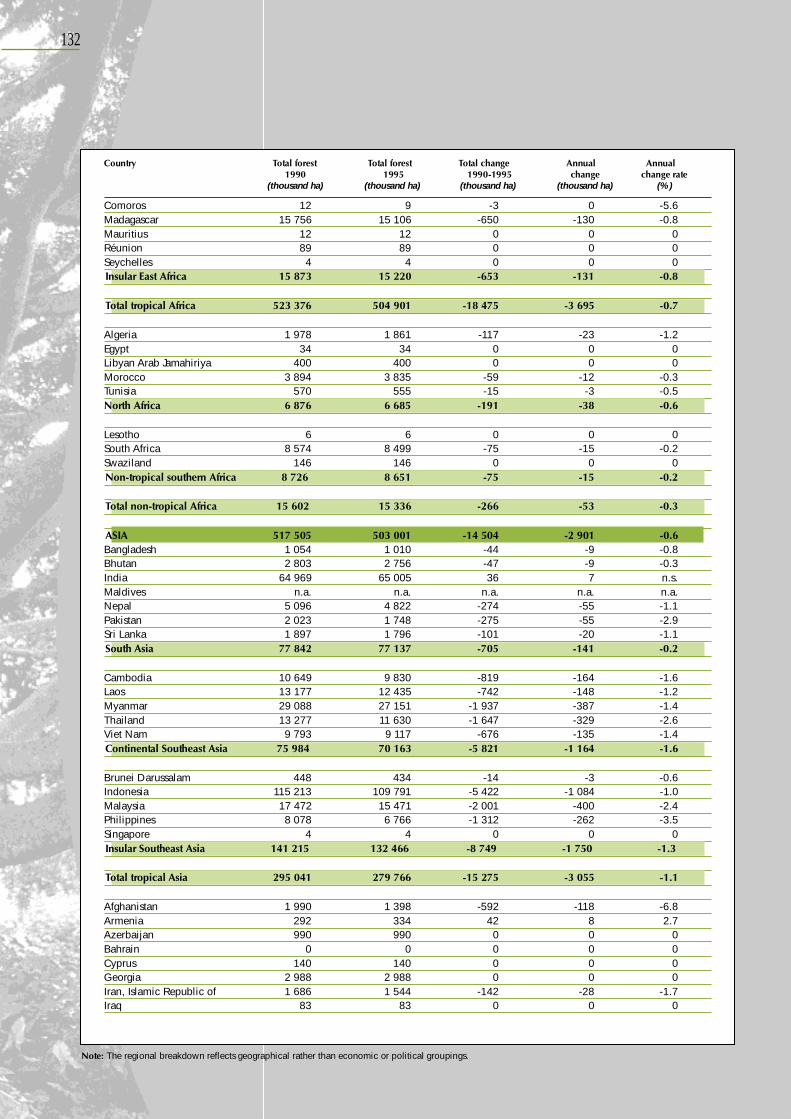
132
Comoros 12 9 -3 0 -5.6Madagascar 15 756 15 106 -650 -130 -0.8Mauritius 12 12 0 0 0Réunion 89 89 0 0 0Seychelles 4 4 0 0 0Insular East Africa 15 873 15 220 -653 -131 -0.8
Total tropical Africa 523 376 504 901 -18 475 -3 695 -0.7
Algeria 1 978 1 861 -117 -23 -1.2Egypt 34 34 0 0 0Libyan Arab Jamahiriya 400 400 0 0 0Morocco 3 894 3 835 -59 -12 -0.3Tunisia 570 555 -15 -3 -0.5North Africa 6 876 6 685 -191 -38 -0.6
Lesotho 6 6 0 0 0South Africa 8 574 8 499 -75 -15 -0.2Swaziland 146 146 0 0 0Non-tropical southern Africa 8 726 8 651 -75 -15 -0.2
Total non-tropical Africa 15 602 15 336 -266 -53 -0.3
ASIA 517 505 503 001 -14 504 -2 901 -0.6Bangladesh 1 054 1 010 -44 -9 -0.8Bhutan 2 803 2 756 -47 -9 -0.3India 64 969 65 005 36 7 n.s.Maldives n.a. n.a. n.a. n.a. n.a.Nepal 5 096 4 822 -274 -55 -1.1Pakistan 2 023 1 748 -275 -55 -2.9Sri Lanka 1 897 1 796 -101 -20 -1.1South Asia 77 842 77 137 -705 -141 -0.2
Cambodia 10 649 9 830 -819 -164 -1.6Laos 13 177 12 435 -742 -148 -1.2Myanmar 29 088 27 151 -1 937 -387 -1.4Thailand 13 277 11 630 -1 647 -329 -2.6Viet Nam 9 793 9 117 -676 -135 -1.4Continental Southeast Asia 75 984 70 163 -5 821 -1 164 -1.6
Brunei Darussalam 448 434 -14 -3 -0.6Indonesia 115 213 109 791 -5 422 -1 084 -1.0Malaysia 17 472 15 471 -2 001 -400 -2.4Philippines 8 078 6 766 -1 312 -262 -3.5Singapore 4 4 0 0 0Insular Southeast Asia 141 215 132 466 -8 749 -1 750 -1.3
Total tropical Asia 295 041 279 766 -15 275 -3 055 -1.1
Afghanistan 1 990 1 398 -592 -118 -6.8Armenia 292 334 42 8 2.7Azerbaijan 990 990 0 0 0Bahrain 0 0 0 0 0Cyprus 140 140 0 0 0Georgia 2 988 2 988 0 0 0Iran, Islamic Republic of 1 686 1 544 -142 -28 -1.7Iraq 83 83 0 0 0
Note: The regional breakdown reflects geographical rather than economic or political groupings.
Country Total forest Total forest Total change Annual Annual1990 1995 1990-1995 change change rate
(thousand ha) (thousand ha) (thousand ha) (thousand ha) (%)
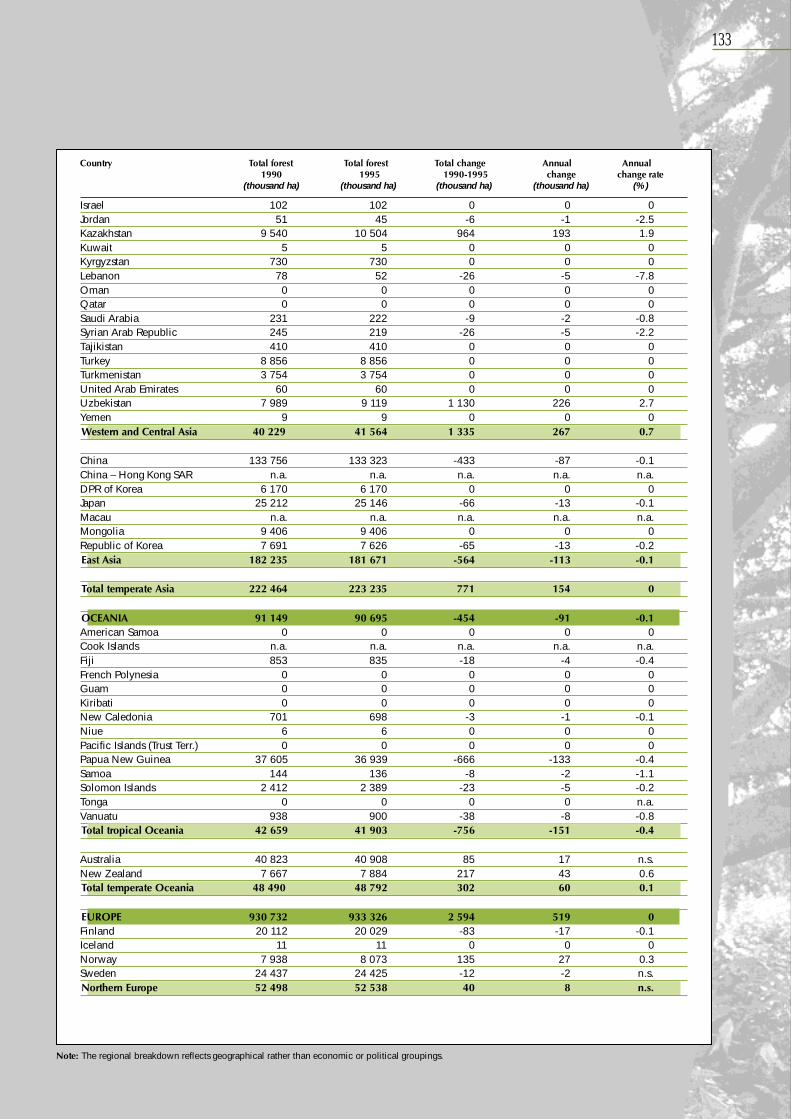
133
Israel 102 102 0 0 0Jordan 51 45 -6 -1 -2.5Kazakhstan 9 540 10 504 964 193 1.9Kuwait 5 5 0 0 0Kyrgyzstan 730 730 0 0 0Lebanon 78 52 -26 -5 -7.8Oman 0 0 0 0 0Qatar 0 0 0 0 0Saudi Arabia 231 222 -9 -2 -0.8Syrian Arab Republic 245 219 -26 -5 -2.2Tajikistan 410 410 0 0 0Turkey 8 856 8 856 0 0 0Turkmenistan 3 754 3 754 0 0 0United Arab Emirates 60 60 0 0 0Uzbekistan 7 989 9 119 1 130 226 2.7Yemen 9 9 0 0 0Western and Central Asia 40 229 41 564 1 335 267 0.7
China 133 756 133 323 -433 -87 -0.1China – Hong Kong SAR n.a. n.a. n.a. n.a. n.a.DPR of Korea 6 170 6 170 0 0 0Japan 25 212 25 146 -66 -13 -0.1Macau n.a. n.a. n.a. n.a. n.a.Mongolia 9 406 9 406 0 0 0Republic of Korea 7 691 7 626 -65 -13 -0.2East Asia 182 235 181 671 -564 -113 -0.1
Total temperate Asia 222 464 223 235 771 154 0
OCEANIA 91 149 90 695 -454 -91 -0.1American Samoa 0 0 0 0 0Cook Islands n.a. n.a. n.a. n.a. n.a.Fiji 853 835 -18 -4 -0.4French Polynesia 0 0 0 0 0Guam 0 0 0 0 0Kiribati 0 0 0 0 0New Caledonia 701 698 -3 -1 -0.1Niue 6 6 0 0 0Pacific Islands (Trust Terr.) 0 0 0 0 0Papua New Guinea 37 605 36 939 -666 -133 -0.4Samoa 144 136 -8 -2 -1.1Solomon Islands 2 412 2 389 -23 -5 -0.2Tonga 0 0 0 0 n.a.Vanuatu 938 900 -38 -8 -0.8Total tropical Oceania 42 659 41 903 -756 -151 -0.4
Australia 40 823 40 908 85 17 n.s.New Zealand 7 667 7 884 217 43 0.6Total temperate Oceania 48 490 48 792 302 60 0.1
EUROPE 930 732 933 326 2 594 519 0Finland 20 112 20 029 -83 -17 -0.1Iceland 11 11 0 0 0Norway 7 938 8 073 135 27 0.3Sweden 24 437 24 425 -12 -2 n.s.Northern Europe 52 498 52 538 40 8 n.s.
Note: The regional breakdown reflects geographical rather than economic or political groupings.
Country Total forest Total forest Total change Annual Annual1990 1995 1990-1995 change change rate
(thousand ha) (thousand ha) (thousand ha) (thousand ha) (%)
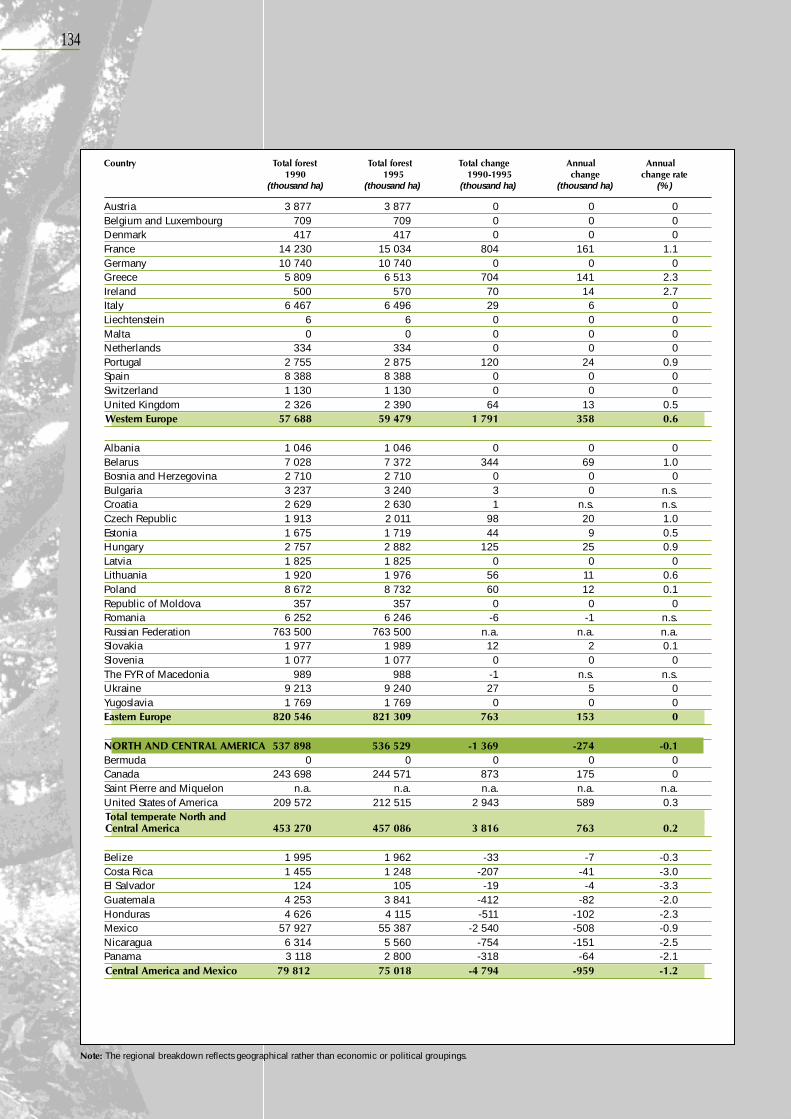
134
Austria 3 877 3 877 0 0 0Belgium and Luxembourg 709 709 0 0 0Denmark 417 417 0 0 0France 14 230 15 034 804 161 1.1Germany 10 740 10 740 0 0 0Greece 5 809 6 513 704 141 2.3Ireland 500 570 70 14 2.7Italy 6 467 6 496 29 6 0Liechtenstein 6 6 0 0 0Malta 0 0 0 0 0Netherlands 334 334 0 0 0Portugal 2 755 2 875 120 24 0.9Spain 8 388 8 388 0 0 0Switzerland 1 130 1 130 0 0 0United Kingdom 2 326 2 390 64 13 0.5Western Europe 57 688 59 479 1 791 358 0.6
Albania 1 046 1 046 0 0 0Belarus 7 028 7 372 344 69 1.0Bosnia and Herzegovina 2 710 2 710 0 0 0Bulgaria 3 237 3 240 3 0 n.s.Croatia 2 629 2 630 1 n.s. n.s.Czech Republic 1 913 2 011 98 20 1.0Estonia 1 675 1 719 44 9 0.5Hungary 2 757 2 882 125 25 0.9Latvia 1 825 1 825 0 0 0Lithuania 1 920 1 976 56 11 0.6Poland 8 672 8 732 60 12 0.1Republic of Moldova 357 357 0 0 0Romania 6 252 6 246 -6 -1 n.s.Russian Federation 763 500 763 500 n.a. n.a. n.a.Slovakia 1 977 1 989 12 2 0.1Slovenia 1 077 1 077 0 0 0The FYR of Macedonia 989 988 -1 n.s. n.s.Ukraine 9 213 9 240 27 5 0Yugoslavia 1 769 1 769 0 0 0Eastern Europe 820 546 821 309 763 153 0
NORTH AND CENTRAL AMERICA 537 898 536 529 -1 369 -274 -0.1Bermuda 0 0 0 0 0Canada 243 698 244 571 873 175 0Saint Pierre and Miquelon n.a. n.a. n.a. n.a. n.a.United States of America 209 572 212 515 2 943 589 0.3Total temperate North andCentral America 453 270 457 086 3 816 763 0.2
Belize 1 995 1 962 -33 -7 -0.3Costa Rica 1 455 1 248 -207 -41 -3.0El Salvador 124 105 -19 -4 -3.3Guatemala 4 253 3 841 -412 -82 -2.0Honduras 4 626 4 115 -511 -102 -2.3Mexico 57 927 55 387 -2 540 -508 -0.9Nicaragua 6 314 5 560 -754 -151 -2.5Panama 3 118 2 800 -318 -64 -2.1Central America and Mexico 79 812 75 018 -4 794 -959 -1.2
Note: The regional breakdown reflects geographical rather than economic or political groupings.
Country Total forest Total forest Total change Annual Annual1990 1995 1990-1995 change change rate
(thousand ha) (thousand ha) (thousand ha) (thousand ha) (%)
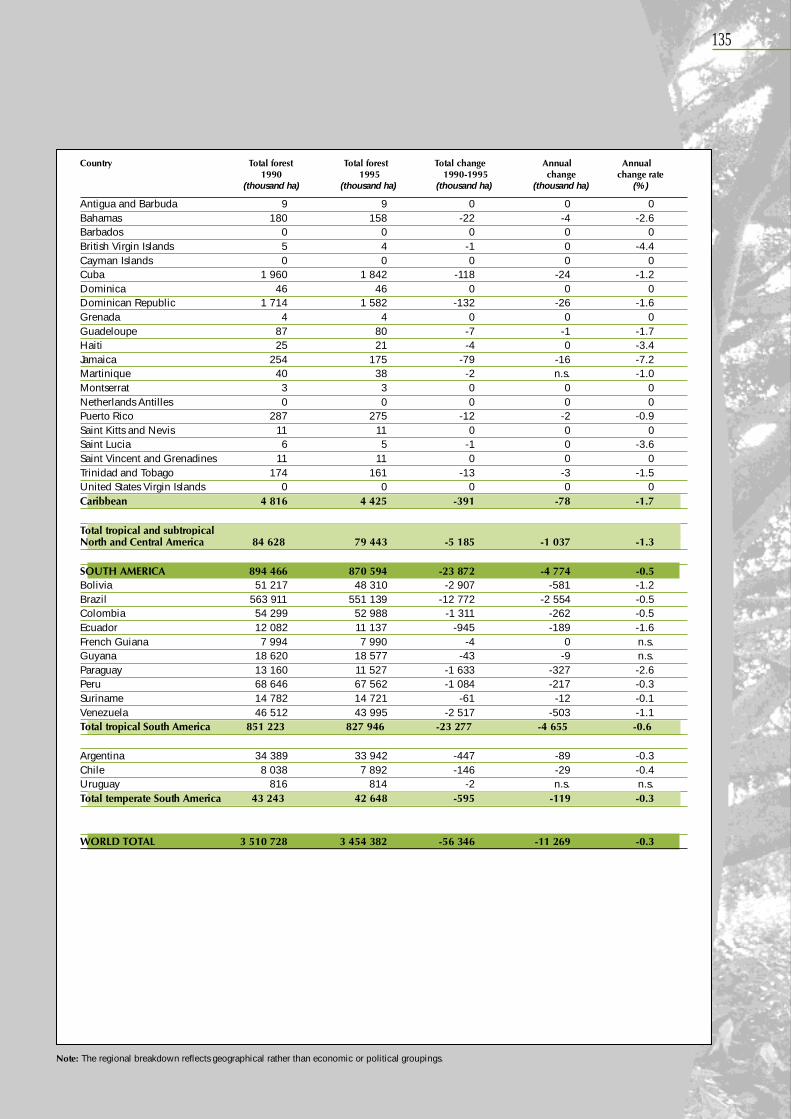
135
Antigua and Barbuda 9 9 0 0 0Bahamas 180 158 -22 -4 -2.6Barbados 0 0 0 0 0British Virgin Islands 5 4 -1 0 -4.4Cayman Islands 0 0 0 0 0Cuba 1 960 1 842 -118 -24 -1.2Dominica 46 46 0 0 0Dominican Republic 1 714 1 582 -132 -26 -1.6Grenada 4 4 0 0 0Guadeloupe 87 80 -7 -1 -1.7Haiti 25 21 -4 0 -3.4Jamaica 254 175 -79 -16 -7.2Martinique 40 38 -2 n.s. -1.0Montserrat 3 3 0 0 0Netherlands Antilles 0 0 0 0 0Puerto Rico 287 275 -12 -2 -0.9Saint Kitts and Nevis 11 11 0 0 0Saint Lucia 6 5 -1 0 -3.6Saint Vincent and Grenadines 11 11 0 0 0Trinidad and Tobago 174 161 -13 -3 -1.5United States Virgin Islands 0 0 0 0 0Caribbean 4 816 4 425 -391 -78 -1.7
Total tropical and subtropicalNorth and Central America 84 628 79 443 -5 185 -1 037 -1.3
SOUTH AMERICA 894 466 870 594 -23 872 -4 774 -0.5Bolivia 51 217 48 310 -2 907 -581 -1.2Brazil 563 911 551 139 -12 772 -2 554 -0.5Colombia 54 299 52 988 -1 311 -262 -0.5Ecuador 12 082 11 137 -945 -189 -1.6French Guiana 7 994 7 990 -4 0 n.s.Guyana 18 620 18 577 -43 -9 n.s.Paraguay 13 160 11 527 -1 633 -327 -2.6Peru 68 646 67 562 -1 084 -217 -0.3Suriname 14 782 14 721 -61 -12 -0.1Venezuela 46 512 43 995 -2 517 -503 -1.1Total tropical South America 851 223 827 946 -23 277 -4 655 -0.6
Argentina 34 389 33 942 -447 -89 -0.3Chile 8 038 7 892 -146 -29 -0.4Uruguay 816 814 -2 n.s. n.s.Total temperate South America 43 243 42 648 -595 -119 -0.3
WORLD TOTAL 3 510 728 3 454 382 -56 346 -11 269 -0.3
Note: The regional breakdown reflects geographical rather than economic or political groupings.
Country Total forest Total forest Total change Annual Annual1990 1995 1990-1995 change change rate
(thousand ha) (thousand ha) (thousand ha) (thousand ha) (%)
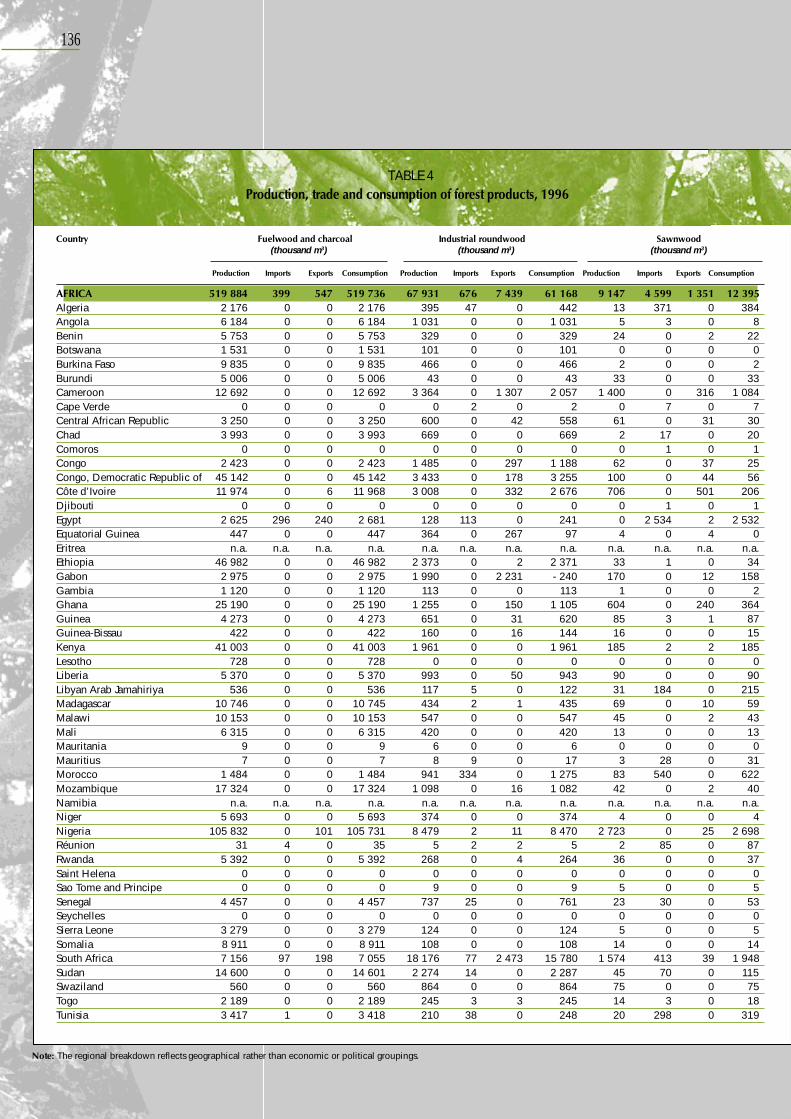
136
Note: The regional breakdown reflects geographical rather than economic or political groupings.
TABLE 4Production, trade and consumption of forest products, 1996
Country Fuelwood and charcoal Industrial roundwood Sawnwood (thousand m3) (thousand m3) (thousand m3)
Production Imports Exports Consumption Production Imports Exports Consumption Production Imports Exports Consumption
AFRICA 519 884 399 547 519 736 67 931 676 7 439 61 168 9 147 4 599 1 351 12 395Algeria 2 176 0 0 2 176 395 47 0 442 13 371 0 384Angola 6 184 0 0 6 184 1 031 0 0 1 031 5 3 0 8Benin 5 753 0 0 5 753 329 0 0 329 24 0 2 22Botswana 1 531 0 0 1 531 101 0 0 101 0 0 0 0Burkina Faso 9 835 0 0 9 835 466 0 0 466 2 0 0 2Burundi 5 006 0 0 5 006 43 0 0 43 33 0 0 33Cameroon 12 692 0 0 12 692 3 364 0 1 307 2 057 1 400 0 316 1 084Cape Verde 0 0 0 0 0 2 0 2 0 7 0 7Central African Republic 3 250 0 0 3 250 600 0 42 558 61 0 31 30Chad 3 993 0 0 3 993 669 0 0 669 2 17 0 20Comoros 0 0 0 0 0 0 0 0 0 1 0 1Congo 2 423 0 0 2 423 1 485 0 297 1 188 62 0 37 25Congo, Democratic Republic of 45 142 0 0 45 142 3 433 0 178 3 255 100 0 44 56Côte d’Ivoire 11 974 0 6 11 968 3 008 0 332 2 676 706 0 501 206Djibouti 0 0 0 0 0 0 0 0 0 1 0 1Egypt 2 625 296 240 2 681 128 113 0 241 0 2 534 2 2 532Equatorial Guinea 447 0 0 447 364 0 267 97 4 0 4 0Eritrea n.a. n.a. n.a. n.a. n.a. n.a. n.a. n.a. n.a. n.a. n.a. n.a.Ethiopia 46 982 0 0 46 982 2 373 0 2 2 371 33 1 0 34Gabon 2 975 0 0 2 975 1 990 0 2 231 - 240 170 0 12 158Gambia 1 120 0 0 1 120 113 0 0 113 1 0 0 2Ghana 25 190 0 0 25 190 1 255 0 150 1 105 604 0 240 364Guinea 4 273 0 0 4 273 651 0 31 620 85 3 1 87Guinea-Bissau 422 0 0 422 160 0 16 144 16 0 0 15Kenya 41 003 0 0 41 003 1 961 0 0 1 961 185 2 2 185Lesotho 728 0 0 728 0 0 0 0 0 0 0 0Liberia 5 370 0 0 5 370 993 0 50 943 90 0 0 90Libyan Arab Jamahiriya 536 0 0 536 117 5 0 122 31 184 0 215Madagascar 10 746 0 0 10 745 434 2 1 435 69 0 10 59Malawi 10 153 0 0 10 153 547 0 0 547 45 0 2 43Mali 6 315 0 0 6 315 420 0 0 420 13 0 0 13Mauritania 9 0 0 9 6 0 0 6 0 0 0 0Mauritius 7 0 0 7 8 9 0 17 3 28 0 31Morocco 1 484 0 0 1 484 941 334 0 1 275 83 540 0 622Mozambique 17 324 0 0 17 324 1 098 0 16 1 082 42 0 2 40Namibia n.a. n.a. n.a. n.a. n.a. n.a. n.a. n.a. n.a. n.a. n.a. n.a.Niger 5 693 0 0 5 693 374 0 0 374 4 0 0 4Nigeria 105 832 0 101 105 731 8 479 2 11 8 470 2 723 0 25 2 698Réunion 31 4 0 35 5 2 2 5 2 85 0 87Rwanda 5 392 0 0 5 392 268 0 4 264 36 0 0 37Saint Helena 0 0 0 0 0 0 0 0 0 0 0 0Sao Tome and Principe 0 0 0 0 9 0 0 9 5 0 0 5Senegal 4 457 0 0 4 457 737 25 0 761 23 30 0 53Seychelles 0 0 0 0 0 0 0 0 0 0 0 0Sierra Leone 3 279 0 0 3 279 124 0 0 124 5 0 0 5Somalia 8 911 0 0 8 911 108 0 0 108 14 0 0 14South Africa 7 156 97 198 7 055 18 176 77 2 473 15 780 1 574 413 39 1 948Sudan 14 600 0 0 14 601 2 274 14 0 2 287 45 70 0 115Swaziland 560 0 0 560 864 0 0 864 75 0 0 75Togo 2 189 0 0 2 189 245 3 3 245 14 3 0 18Tunisia 3 417 1 0 3 418 210 38 0 248 20 298 0 319
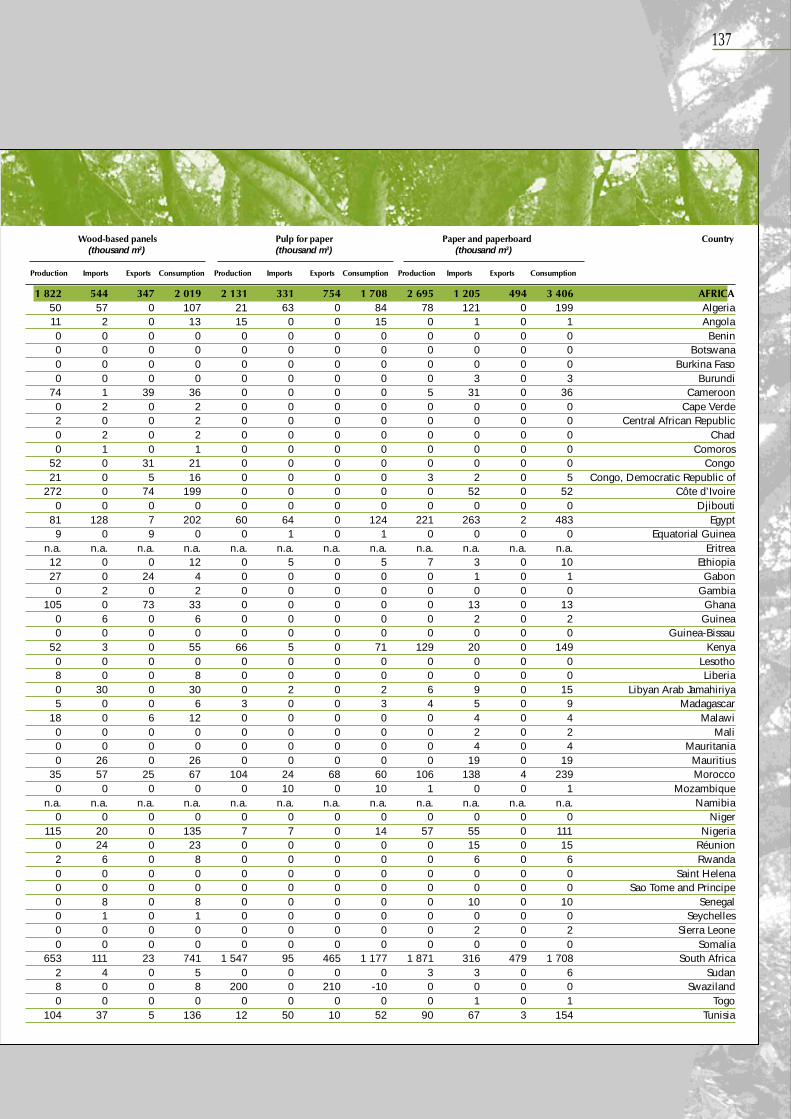
137
Wood-based panels Pulp for paper Paper and paperboard Country (thousand m3) (thousand m3) (thousand m3)
Production Imports Exports Consumption Production Imports Exports Consumption Production Imports Exports Consumption
1 822 544 347 2 019 2 131 331 754 1 708 2 695 1 205 494 3 406 AFRICA50 57 0 107 21 63 0 84 78 121 0 199 Algeria11 2 0 13 15 0 0 15 0 1 0 1 Angola0 0 0 0 0 0 0 0 0 0 0 0 Benin0 0 0 0 0 0 0 0 0 0 0 0 Botswana0 0 0 0 0 0 0 0 0 0 0 0 Burkina Faso0 0 0 0 0 0 0 0 0 3 0 3 Burundi
74 1 39 36 0 0 0 0 5 31 0 36 Cameroon0 2 0 2 0 0 0 0 0 0 0 0 Cape Verde2 0 0 2 0 0 0 0 0 0 0 0 Central African Republic0 2 0 2 0 0 0 0 0 0 0 0 Chad0 1 0 1 0 0 0 0 0 0 0 0 Comoros
52 0 31 21 0 0 0 0 0 0 0 0 Congo21 0 5 16 0 0 0 0 3 2 0 5 Congo, Democratic Republic of
272 0 74 199 0 0 0 0 0 52 0 52 Côte d’Ivoire0 0 0 0 0 0 0 0 0 0 0 0 Djibouti
81 128 7 202 60 64 0 124 221 263 2 483 Egypt9 0 9 0 0 1 0 1 0 0 0 0 Equatorial Guinea
n.a. n.a. n.a. n.a. n.a. n.a. n.a. n.a. n.a. n.a. n.a. n.a. Eritrea12 0 0 12 0 5 0 5 7 3 0 10 Ethiopia27 0 24 4 0 0 0 0 0 1 0 1 Gabon
0 2 0 2 0 0 0 0 0 0 0 0 Gambia105 0 73 33 0 0 0 0 0 13 0 13 Ghana
0 6 0 6 0 0 0 0 0 2 0 2 Guinea0 0 0 0 0 0 0 0 0 0 0 0 Guinea-Bissau
52 3 0 55 66 5 0 71 129 20 0 149 Kenya0 0 0 0 0 0 0 0 0 0 0 0 Lesotho8 0 0 8 0 0 0 0 0 0 0 0 Liberia0 30 0 30 0 2 0 2 6 9 0 15 Libyan Arab Jamahiriya5 0 0 6 3 0 0 3 4 5 0 9 Madagascar
18 0 6 12 0 0 0 0 0 4 0 4 Malawi0 0 0 0 0 0 0 0 0 2 0 2 Mali0 0 0 0 0 0 0 0 0 4 0 4 Mauritania0 26 0 26 0 0 0 0 0 19 0 19 Mauritius
35 57 25 67 104 24 68 60 106 138 4 239 Morocco0 0 0 0 0 10 0 10 1 0 0 1 Mozambique
n.a. n.a. n.a. n.a. n.a. n.a. n.a. n.a. n.a. n.a. n.a. n.a. Namibia0 0 0 0 0 0 0 0 0 0 0 0 Niger
115 20 0 135 7 7 0 14 57 55 0 111 Nigeria0 24 0 23 0 0 0 0 0 15 0 15 Réunion2 6 0 8 0 0 0 0 0 6 0 6 Rwanda0 0 0 0 0 0 0 0 0 0 0 0 Saint Helena0 0 0 0 0 0 0 0 0 0 0 0 Sao Tome and Principe0 8 0 8 0 0 0 0 0 10 0 10 Senegal0 1 0 1 0 0 0 0 0 0 0 0 Seychelles0 0 0 0 0 0 0 0 0 2 0 2 Sierra Leone0 0 0 0 0 0 0 0 0 0 0 0 Somalia
653 111 23 741 1 547 95 465 1 177 1 871 316 479 1 708 South Africa2 4 0 5 0 0 0 0 3 3 0 6 Sudan8 0 0 8 200 0 210 -10 0 0 0 0 Swaziland0 0 0 0 0 0 0 0 0 1 0 1 Togo
104 37 5 136 12 50 10 52 90 67 3 154 Tunisia
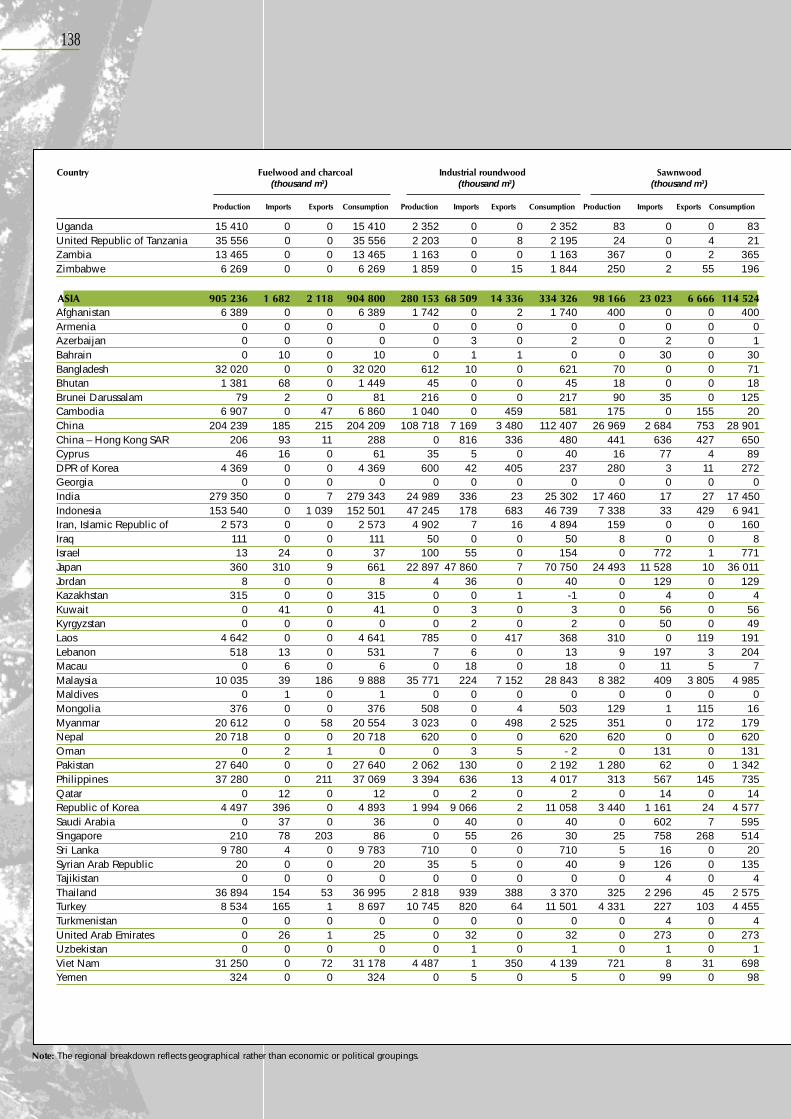
138
Uganda 15 410 0 0 15 410 2 352 0 0 2 352 83 0 0 83United Republic of Tanzania 35 556 0 0 35 556 2 203 0 8 2 195 24 0 4 21Zambia 13 465 0 0 13 465 1 163 0 0 1 163 367 0 2 365Zimbabwe 6 269 0 0 6 269 1 859 0 15 1 844 250 2 55 196
ASIA 905 236 1 682 2 118 904 800 280 153 68 509 14 336 334 326 98 166 23 023 6 666 114 524Afghanistan 6 389 0 0 6 389 1 742 0 2 1 740 400 0 0 400Armenia 0 0 0 0 0 0 0 0 0 0 0 0Azerbaijan 0 0 0 0 0 3 0 2 0 2 0 1Bahrain 0 10 0 10 0 1 1 0 0 30 0 30Bangladesh 32 020 0 0 32 020 612 10 0 621 70 0 0 71Bhutan 1 381 68 0 1 449 45 0 0 45 18 0 0 18Brunei Darussalam 79 2 0 81 216 0 0 217 90 35 0 125Cambodia 6 907 0 47 6 860 1 040 0 459 581 175 0 155 20China 204 239 185 215 204 209 108 718 7 169 3 480 112 407 26 969 2 684 753 28 901China – Hong Kong SAR 206 93 11 288 0 816 336 480 441 636 427 650Cyprus 46 16 0 61 35 5 0 40 16 77 4 89DPR of Korea 4 369 0 0 4 369 600 42 405 237 280 3 11 272Georgia 0 0 0 0 0 0 0 0 0 0 0 0India 279 350 0 7 279 343 24 989 336 23 25 302 17 460 17 27 17 450Indonesia 153 540 0 1 039 152 501 47 245 178 683 46 739 7 338 33 429 6 941Iran, Islamic Republic of 2 573 0 0 2 573 4 902 7 16 4 894 159 0 0 160Iraq 111 0 0 111 50 0 0 50 8 0 0 8Israel 13 24 0 37 100 55 0 154 0 772 1 771Japan 360 310 9 661 22 897 47 860 7 70 750 24 493 11 528 10 36 011Jordan 8 0 0 8 4 36 0 40 0 129 0 129Kazakhstan 315 0 0 315 0 0 1 -1 0 4 0 4Kuwait 0 41 0 41 0 3 0 3 0 56 0 56Kyrgyzstan 0 0 0 0 0 2 0 2 0 50 0 49Laos 4 642 0 0 4 641 785 0 417 368 310 0 119 191Lebanon 518 13 0 531 7 6 0 13 9 197 3 204Macau 0 6 0 6 0 18 0 18 0 11 5 7Malaysia 10 035 39 186 9 888 35 771 224 7 152 28 843 8 382 409 3 805 4 985Maldives 0 1 0 1 0 0 0 0 0 0 0 0Mongolia 376 0 0 376 508 0 4 503 129 1 115 16Myanmar 20 612 0 58 20 554 3 023 0 498 2 525 351 0 172 179Nepal 20 718 0 0 20 718 620 0 0 620 620 0 0 620Oman 0 2 1 0 0 3 5 - 2 0 131 0 131Pakistan 27 640 0 0 27 640 2 062 130 0 2 192 1 280 62 0 1 342Philippines 37 280 0 211 37 069 3 394 636 13 4 017 313 567 145 735Qatar 0 12 0 12 0 2 0 2 0 14 0 14Republic of Korea 4 497 396 0 4 893 1 994 9 066 2 11 058 3 440 1 161 24 4 577Saudi Arabia 0 37 0 36 0 40 0 40 0 602 7 595Singapore 210 78 203 86 0 55 26 30 25 758 268 514Sri Lanka 9 780 4 0 9 783 710 0 0 710 5 16 0 20Syrian Arab Republic 20 0 0 20 35 5 0 40 9 126 0 135Tajikistan 0 0 0 0 0 0 0 0 0 4 0 4Thailand 36 894 154 53 36 995 2 818 939 388 3 370 325 2 296 45 2 575Turkey 8 534 165 1 8 697 10 745 820 64 11 501 4 331 227 103 4 455Turkmenistan 0 0 0 0 0 0 0 0 0 4 0 4United Arab Emirates 0 26 1 25 0 32 0 32 0 273 0 273Uzbekistan 0 0 0 0 0 1 0 1 0 1 0 1Viet Nam 31 250 0 72 31 178 4 487 1 350 4 139 721 8 31 698Yemen 324 0 0 324 0 5 0 5 0 99 0 98
Country Fuelwood and charcoal Industrial roundwood Sawnwood (thousand m3) (thousand m3) (thousand m3)
Production Imports Exports Consumption Production Imports Exports Consumption Production Imports Exports Consumption
Note: The regional breakdown reflects geographical rather than economic or political groupings.
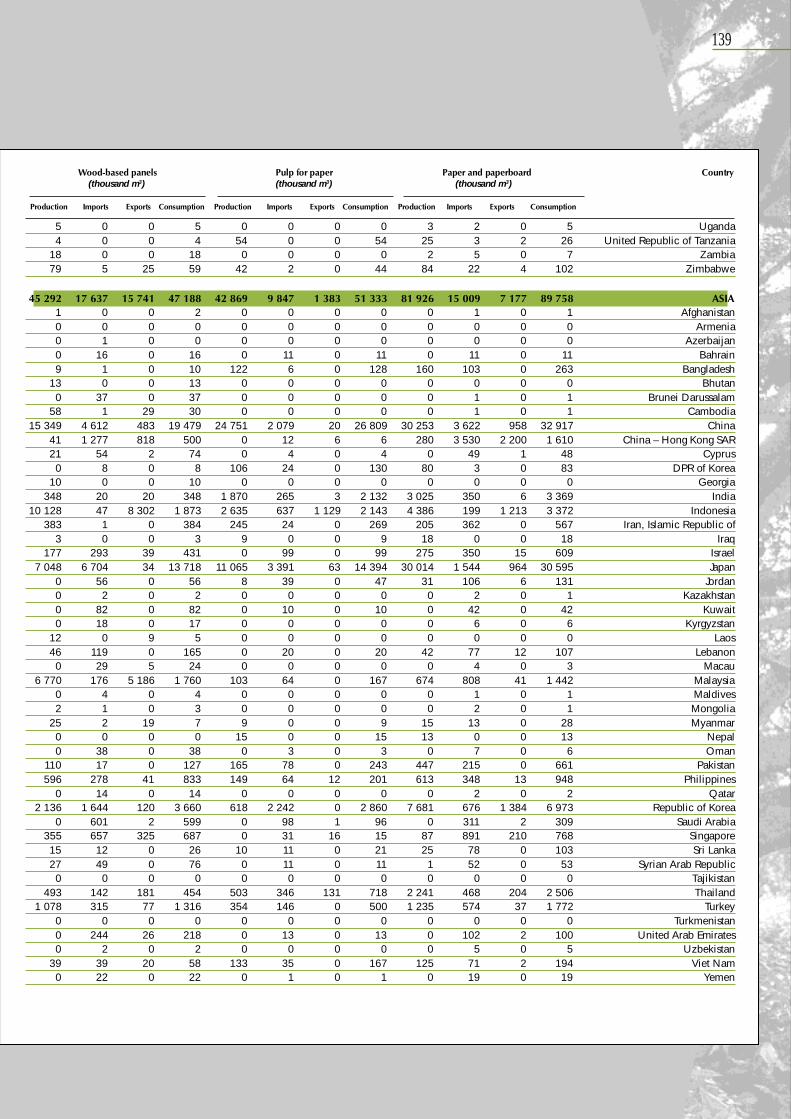
139
5 0 0 5 0 0 0 0 3 2 0 5 Uganda4 0 0 4 54 0 0 54 25 3 2 26 United Republic of Tanzania
18 0 0 18 0 0 0 0 2 5 0 7 Zambia79 5 25 59 42 2 0 44 84 22 4 102 Zimbabwe
45 292 17 637 15 741 47 188 42 869 9 847 1 383 51 333 81 926 15 009 7 177 89 758 ASIA1 0 0 2 0 0 0 0 0 1 0 1 Afghanistan0 0 0 0 0 0 0 0 0 0 0 0 Armenia0 1 0 0 0 0 0 0 0 0 0 0 Azerbaijan0 16 0 16 0 11 0 11 0 11 0 11 Bahrain9 1 0 10 122 6 0 128 160 103 0 263 Bangladesh
13 0 0 13 0 0 0 0 0 0 0 0 Bhutan0 37 0 37 0 0 0 0 0 1 0 1 Brunei Darussalam
58 1 29 30 0 0 0 0 0 1 0 1 Cambodia15 349 4 612 483 19 479 24 751 2 079 20 26 809 30 253 3 622 958 32 917 China
41 1 277 818 500 0 12 6 6 280 3 530 2 200 1 610 China – Hong Kong SAR21 54 2 74 0 4 0 4 0 49 1 48 Cyprus
0 8 0 8 106 24 0 130 80 3 0 83 DPR of Korea10 0 0 10 0 0 0 0 0 0 0 0 Georgia
348 20 20 348 1 870 265 3 2 132 3 025 350 6 3 369 India10 128 47 8 302 1 873 2 635 637 1 129 2 143 4 386 199 1 213 3 372 Indonesia
383 1 0 384 245 24 0 269 205 362 0 567 Iran, Islamic Republic of3 0 0 3 9 0 0 9 18 0 0 18 Iraq
177 293 39 431 0 99 0 99 275 350 15 609 Israel7 048 6 704 34 13 718 11 065 3 391 63 14 394 30 014 1 544 964 30 595 Japan
0 56 0 56 8 39 0 47 31 106 6 131 Jordan0 2 0 2 0 0 0 0 0 2 0 1 Kazakhstan0 82 0 82 0 10 0 10 0 42 0 42 Kuwait0 18 0 17 0 0 0 0 0 6 0 6 Kyrgyzstan
12 0 9 5 0 0 0 0 0 0 0 0 Laos46 119 0 165 0 20 0 20 42 77 12 107 Lebanon
0 29 5 24 0 0 0 0 0 4 0 3 Macau6 770 176 5 186 1 760 103 64 0 167 674 808 41 1 442 Malaysia
0 4 0 4 0 0 0 0 0 1 0 1 Maldives2 1 0 3 0 0 0 0 0 2 0 1 Mongolia
25 2 19 7 9 0 0 9 15 13 0 28 Myanmar0 0 0 0 15 0 0 15 13 0 0 13 Nepal0 38 0 38 0 3 0 3 0 7 0 6 Oman
110 17 0 127 165 78 0 243 447 215 0 661 Pakistan596 278 41 833 149 64 12 201 613 348 13 948 Philippines
0 14 0 14 0 0 0 0 0 2 0 2 Qatar2 136 1 644 120 3 660 618 2 242 0 2 860 7 681 676 1 384 6 973 Republic of Korea
0 601 2 599 0 98 1 96 0 311 2 309 Saudi Arabia355 657 325 687 0 31 16 15 87 891 210 768 Singapore15 12 0 26 10 11 0 21 25 78 0 103 Sri Lanka27 49 0 76 0 11 0 11 1 52 0 53 Syrian Arab Republic
0 0 0 0 0 0 0 0 0 0 0 0 Tajikistan493 142 181 454 503 346 131 718 2 241 468 204 2 506 Thailand
1 078 315 77 1 316 354 146 0 500 1 235 574 37 1 772 Turkey0 0 0 0 0 0 0 0 0 0 0 0 Turkmenistan0 244 26 218 0 13 0 13 0 102 2 100 United Arab Emirates0 2 0 2 0 0 0 0 0 5 0 5 Uzbekistan
39 39 20 58 133 35 0 167 125 71 2 194 Viet Nam0 22 0 22 0 1 0 1 0 19 0 19 Yemen
Wood-based panels Pulp for paper Paper and paperboard Country (thousand m3) (thousand m3) (thousand m3)
Production Imports Exports Consumption Production Imports Exports Consumption Production Imports Exports Consumption
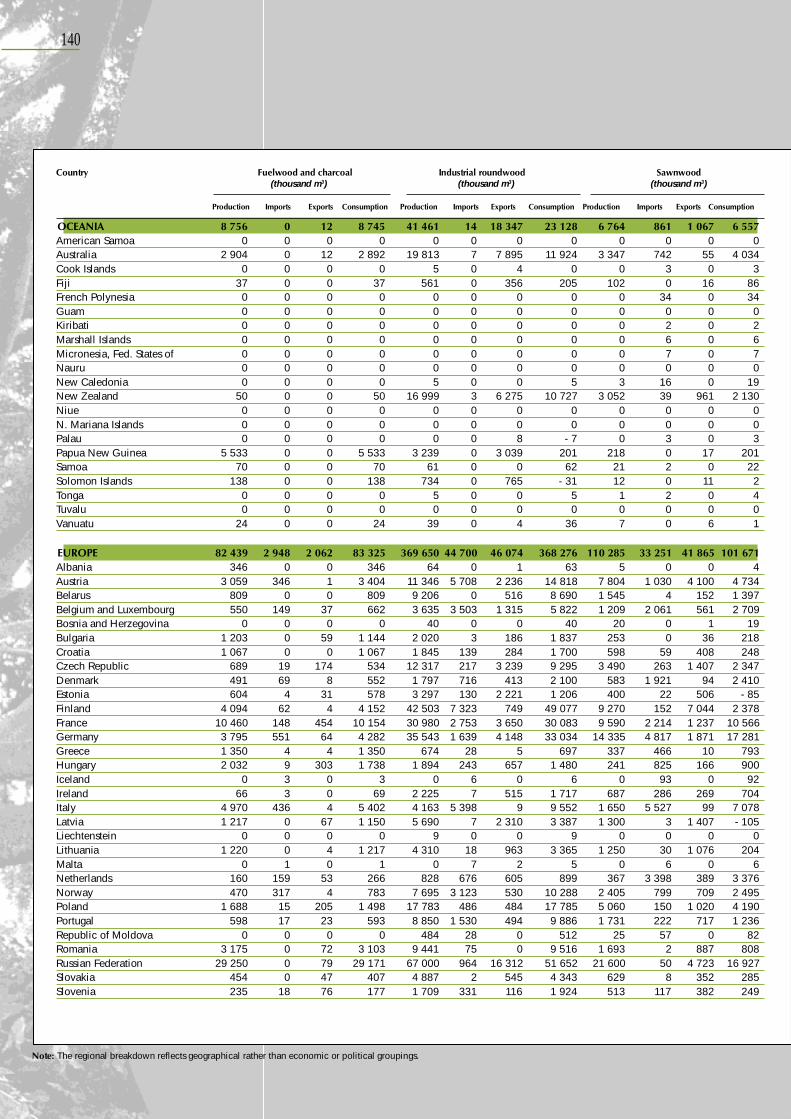
140
OCEANIA 8 756 0 12 8 745 41 461 14 18 347 23 128 6 764 861 1 067 6 557American Samoa 0 0 0 0 0 0 0 0 0 0 0 0Australia 2 904 0 12 2 892 19 813 7 7 895 11 924 3 347 742 55 4 034Cook Islands 0 0 0 0 5 0 4 0 0 3 0 3Fiji 37 0 0 37 561 0 356 205 102 0 16 86French Polynesia 0 0 0 0 0 0 0 0 0 34 0 34Guam 0 0 0 0 0 0 0 0 0 0 0 0Kiribati 0 0 0 0 0 0 0 0 0 2 0 2Marshall Islands 0 0 0 0 0 0 0 0 0 6 0 6Micronesia, Fed. States of 0 0 0 0 0 0 0 0 0 7 0 7Nauru 0 0 0 0 0 0 0 0 0 0 0 0New Caledonia 0 0 0 0 5 0 0 5 3 16 0 19New Zealand 50 0 0 50 16 999 3 6 275 10 727 3 052 39 961 2 130Niue 0 0 0 0 0 0 0 0 0 0 0 0N. Mariana Islands 0 0 0 0 0 0 0 0 0 0 0 0Palau 0 0 0 0 0 0 8 - 7 0 3 0 3Papua New Guinea 5 533 0 0 5 533 3 239 0 3 039 201 218 0 17 201Samoa 70 0 0 70 61 0 0 62 21 2 0 22Solomon Islands 138 0 0 138 734 0 765 - 31 12 0 11 2Tonga 0 0 0 0 5 0 0 5 1 2 0 4Tuvalu 0 0 0 0 0 0 0 0 0 0 0 0Vanuatu 24 0 0 24 39 0 4 36 7 0 6 1
EUROPE 82 439 2 948 2 062 83 325 369 650 44 700 46 074 368 276 110 285 33 251 41 865 101 671Albania 346 0 0 346 64 0 1 63 5 0 0 4Austria 3 059 346 1 3 404 11 346 5 708 2 236 14 818 7 804 1 030 4 100 4 734Belarus 809 0 0 809 9 206 0 516 8 690 1 545 4 152 1 397Belgium and Luxembourg 550 149 37 662 3 635 3 503 1 315 5 822 1 209 2 061 561 2 709Bosnia and Herzegovina 0 0 0 0 40 0 0 40 20 0 1 19Bulgaria 1 203 0 59 1 144 2 020 3 186 1 837 253 0 36 218Croatia 1 067 0 0 1 067 1 845 139 284 1 700 598 59 408 248Czech Republic 689 19 174 534 12 317 217 3 239 9 295 3 490 263 1 407 2 347Denmark 491 69 8 552 1 797 716 413 2 100 583 1 921 94 2 410Estonia 604 4 31 578 3 297 130 2 221 1 206 400 22 506 - 85Finland 4 094 62 4 4 152 42 503 7 323 749 49 077 9 270 152 7 044 2 378France 10 460 148 454 10 154 30 980 2 753 3 650 30 083 9 590 2 214 1 237 10 566Germany 3 795 551 64 4 282 35 543 1 639 4 148 33 034 14 335 4 817 1 871 17 281Greece 1 350 4 4 1 350 674 28 5 697 337 466 10 793Hungary 2 032 9 303 1 738 1 894 243 657 1 480 241 825 166 900Iceland 0 3 0 3 0 6 0 6 0 93 0 92Ireland 66 3 0 69 2 225 7 515 1 717 687 286 269 704Italy 4 970 436 4 5 402 4 163 5 398 9 9 552 1 650 5 527 99 7 078Latvia 1 217 0 67 1 150 5 690 7 2 310 3 387 1 300 3 1 407 - 105Liechtenstein 0 0 0 0 9 0 0 9 0 0 0 0Lithuania 1 220 0 4 1 217 4 310 18 963 3 365 1 250 30 1 076 204Malta 0 1 0 1 0 7 2 5 0 6 0 6Netherlands 160 159 53 266 828 676 605 899 367 3 398 389 3 376Norway 470 317 4 783 7 695 3 123 530 10 288 2 405 799 709 2 495Poland 1 688 15 205 1 498 17 783 486 484 17 785 5 060 150 1 020 4 190Portugal 598 17 23 593 8 850 1 530 494 9 886 1 731 222 717 1 236Republic of Moldova 0 0 0 0 484 28 0 512 25 57 0 82Romania 3 175 0 72 3 103 9 441 75 0 9 516 1 693 2 887 808Russian Federation 29 250 0 79 29 171 67 000 964 16 312 51 652 21 600 50 4 723 16 927Slovakia 454 0 47 407 4 887 2 545 4 343 629 8 352 285Slovenia 235 18 76 177 1 709 331 116 1 924 513 117 382 249
Country Fuelwood and charcoal Industrial roundwood Sawnwood (thousand m3) (thousand m3) (thousand m3)
Production Imports Exports Consumption Production Imports Exports Consumption Production Imports Exports Consumption
Note: The regional breakdown reflects geographical rather than economic or political groupings.

141
2 158 360 813 1 704 2 330 201 680 1 851 2 651 1 307 625 3 333 OCEANIA0 0 0 0 0 0 0 0 0 0 0 0 American Samoa
1 085 199 206 1 078 975 184 0 1 159 1 850 1 111 241 2 719 Australia0 0 0 0 0 0 0 0 0 0 0 0 Cook Islands
16 120 19 117 0 0 0 0 0 14 0 14 Fiji0 10 0 10 0 0 0 0 0 2 0 2 French Polynesia0 3 0 3 0 0 0 0 0 0 0 0 Guam0 0 0 0 0 0 0 0 0 0 0 0 Kiribati0 3 0 3 0 0 0 0 0 0 0 0 Marshall Islands0 0 0 0 0 0 0 0 0 0 0 0 Micronesia, Fed. States of0 0 0 0 0 0 0 0 0 0 0 0 Nauru0 5 0 5 0 0 0 0 0 5 0 5 New Caledonia
1 042 12 588 466 1 355 16 680 692 801 169 384 586 New Zealand0 0 0 0 0 0 0 0 0 0 0 0 Niue0 0 0 0 0 0 0 0 0 0 0 0 N. Mariana Islands0 1 0 1 0 0 0 0 0 0 0 0 Palau
15 2 0 16 0 0 0 0 0 6 0 5 Papua New Guinea0 1 0 1 0 0 0 0 0 0 0 0 Samoa0 0 0 0 0 0 0 0 0 0 0 0 Solomon Islands0 0 0 0 0 0 0 0 0 0 0 0 Tonga0 0 0 0 0 0 0 0 0 0 0 0 Tuvalu0 0 0 0 0 0 0 0 0 0 0 0 Vanuatu
44 167 15 270 15 759 43 678 38 047 14 283 9 290 43 040 80 936 33 213 41 236 72 913 EUROPE16 1 0 17 16 6 0 22 44 2 0 46 Albania
1 961 348 1 274 1 035 1 396 575 287 1 684 3 653 881 3 030 1 505 Austria374 26 52 348 31 5 0 36 131 9 7 133 Belarus
2 609 655 2 279 985 382 534 193 723 1 432 2 071 1 015 2 489 Belgium and Luxembourg34 0 0 34 0 0 0 0 0 0 0 0 Bosnia and Herzegovina
233 8 13 228 107 2 32 77 148 47 6 189 Bulgaria73 62 23 112 99 9 36 72 304 179 95 388 Croatia
975 151 454 672 490 99 225 364 616 273 249 641 Czech Republic432 570 116 886 180 52 69 162 345 1 044 242 1 148 Denmark313 206 312 207 28 0 0 28 21 36 8 49 Estonia
1 538 147 1 154 531 9 676 57 1 535 8 198 10 441 186 8 529 2 098 Finland4 150 1 221 1 954 3 416 2 516 2 037 359 4 194 8 531 3 097 2 523 9 105 France
10 428 3 700 2 088 12 040 1 816 3 456 332 4 940 14 733 6 770 6 319 15 184 Germany363 151 34 481 27 70 0 97 750 251 25 976 Greece459 65 187 337 21 29 19 31 363 288 129 522 Hungary
0 24 0 24 0 0 0 0 0 26 0 25 Iceland434 75 212 297 0 8 0 8 0 675 67 608 Ireland
3 922 819 504 4 237 563 2 866 20 3 409 6 954 3 023 1 790 8 187 Italy236 6 153 90 9 2 0 11 6 42 7 42 Latvia
0 0 0 0 0 0 0 0 0 0 0 0 Liechtenstein203 53 143 114 9 6 3 12 33 38 25 46 Lithuania
0 13 0 13 0 0 0 0 0 19 0 19 Malta99 1 398 228 1 270 128 1 024 265 887 2 987 2 142 1 915 3 214 Netherlands
535 170 237 468 2 269 103 390 1 983 2 096 519 1 832 783 Norway2 410 331 493 2 248 848 188 67 969 1 525 582 418 1 689 Poland1 170 115 647 638 1 608 89 1 000 697 1 026 491 630 887 Portugal
10 20 0 29 0 0 0 0 0 18 5 13 Republic of Moldova433 104 102 435 247 15 4 258 332 66 78 320 Romania
3 036 29 939 2 126 3 725 12 979 2 758 3 212 56 1 480 1 788 Russian Federation312 44 56 300 235 19 51 203 327 81 218 190 Slovakia361 92 150 303 101 139 49 192 460 85 177 368 Slovenia
Wood-based panels Pulp for paper Paper and paperboard Country (thousand m3) (thousand m3) (thousand m3)
Production Imports Exports Consumption Production Imports Exports Consumption Production Imports Exports Consumption
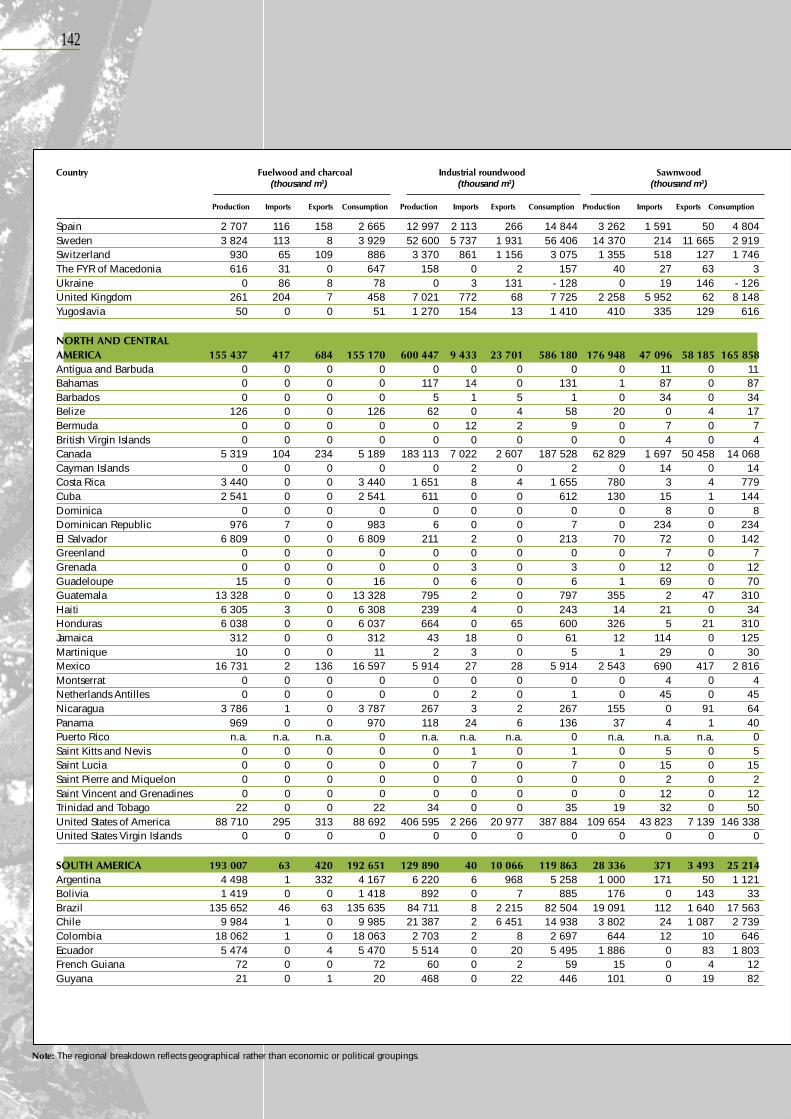
142
Spain 2 707 116 158 2 665 12 997 2 113 266 14 844 3 262 1 591 50 4 804Sweden 3 824 113 8 3 929 52 600 5 737 1 931 56 406 14 370 214 11 665 2 919Switzerland 930 65 109 886 3 370 861 1 156 3 075 1 355 518 127 1 746The FYR of Macedonia 616 31 0 647 158 0 2 157 40 27 63 3Ukraine 0 86 8 78 0 3 131 - 128 0 19 146 - 126United Kingdom 261 204 7 458 7 021 772 68 7 725 2 258 5 952 62 8 148Yugoslavia 50 0 0 51 1 270 154 13 1 410 410 335 129 616
NORTH AND CENTRALAMERICA 155 437 417 684 155 170 600 447 9 433 23 701 586 180 176 948 47 096 58 185 165 858Antigua and Barbuda 0 0 0 0 0 0 0 0 0 11 0 11Bahamas 0 0 0 0 117 14 0 131 1 87 0 87Barbados 0 0 0 0 5 1 5 1 0 34 0 34Belize 126 0 0 126 62 0 4 58 20 0 4 17Bermuda 0 0 0 0 0 12 2 9 0 7 0 7British Virgin Islands 0 0 0 0 0 0 0 0 0 4 0 4Canada 5 319 104 234 5 189 183 113 7 022 2 607 187 528 62 829 1 697 50 458 14 068Cayman Islands 0 0 0 0 0 2 0 2 0 14 0 14Costa Rica 3 440 0 0 3 440 1 651 8 4 1 655 780 3 4 779Cuba 2 541 0 0 2 541 611 0 0 612 130 15 1 144Dominica 0 0 0 0 0 0 0 0 0 8 0 8Dominican Republic 976 7 0 983 6 0 0 7 0 234 0 234El Salvador 6 809 0 0 6 809 211 2 0 213 70 72 0 142Greenland 0 0 0 0 0 0 0 0 0 7 0 7Grenada 0 0 0 0 0 3 0 3 0 12 0 12Guadeloupe 15 0 0 16 0 6 0 6 1 69 0 70Guatemala 13 328 0 0 13 328 795 2 0 797 355 2 47 310Haiti 6 305 3 0 6 308 239 4 0 243 14 21 0 34Honduras 6 038 0 0 6 037 664 0 65 600 326 5 21 310Jamaica 312 0 0 312 43 18 0 61 12 114 0 125Martinique 10 0 0 11 2 3 0 5 1 29 0 30Mexico 16 731 2 136 16 597 5 914 27 28 5 914 2 543 690 417 2 816Montserrat 0 0 0 0 0 0 0 0 0 4 0 4Netherlands Antilles 0 0 0 0 0 2 0 1 0 45 0 45Nicaragua 3 786 1 0 3 787 267 3 2 267 155 0 91 64Panama 969 0 0 970 118 24 6 136 37 4 1 40Puerto Rico n.a. n.a. n.a. 0 n.a. n.a. n.a. 0 n.a. n.a. n.a. 0Saint Kitts and Nevis 0 0 0 0 0 1 0 1 0 5 0 5Saint Lucia 0 0 0 0 0 7 0 7 0 15 0 15Saint Pierre and Miquelon 0 0 0 0 0 0 0 0 0 2 0 2Saint Vincent and Grenadines 0 0 0 0 0 0 0 0 0 12 0 12Trinidad and Tobago 22 0 0 22 34 0 0 35 19 32 0 50United States of America 88 710 295 313 88 692 406 595 2 266 20 977 387 884 109 654 43 823 7 139 146 338United States Virgin Islands 0 0 0 0 0 0 0 0 0 0 0 0
SOUTH AMERICA 193 007 63 420 192 651 129 890 40 10 066 119 863 28 336 371 3 493 25 214Argentina 4 498 1 332 4 167 6 220 6 968 5 258 1 000 171 50 1 121Bolivia 1 419 0 0 1 418 892 0 7 885 176 0 143 33Brazil 135 652 46 63 135 635 84 711 8 2 215 82 504 19 091 112 1 640 17 563Chile 9 984 1 0 9 985 21 387 2 6 451 14 938 3 802 24 1 087 2 739Colombia 18 062 1 0 18 063 2 703 2 8 2 697 644 12 10 646Ecuador 5 474 0 4 5 470 5 514 0 20 5 495 1 886 0 83 1 803French Guiana 72 0 0 72 60 0 2 59 15 0 4 12Guyana 21 0 1 20 468 0 22 446 101 0 19 82
Country Fuelwood and charcoal Industrial roundwood Sawnwood (thousand m3) (thousand m3) (thousand m3)
Production Imports Exports Consumption Production Imports Exports Consumption Production Imports Exports Consumption
Note: The regional breakdown reflects geographical rather than economic or political groupings.

143
2 735 765 645 2 856 1 462 493 655 1 300 3 767 2 175 515 5 427 Spain971 614 388 1 197 9 778 239 2 609 7 408 9 038 444 7 483 1 999 Sweden667 479 467 679 244 426 94 576 1 461 1 064 1 044 1 481 Switzerland
0 9 6 3 1 3 0 4 12 23 0 35 The FYR of Macedonia0 19 15 4 0 0 0 0 0 26 9 17 Ukraine
2 543 2 736 429 4 850 575 1 701 16 2 260 6 189 6 385 1 366 11 208 United Kingdom132 44 7 168 0 0 0 0 0 94 2 92 Yugoslavia
49 911 9 603 9 974 49 539 83 448 5 799 15 567 73 680 106 847 14 997 22 844 99 000 NORTH ANDCENTRAL AMERICA
0 4 0 4 0 0 0 0 0 0 0 0 Antigua and Barbuda0 15 0 15 0 0 0 0 0 4 0 4 Bahamas0 7 0 7 0 0 0 0 0 6 0 6 Barbados0 3 0 3 0 0 0 0 0 2 0 2 Belize0 2 0 2 0 0 0 0 0 5 0 5 Bermuda0 1 0 1 0 0 0 0 0 0 0 0 British Virgin Islands
9 966 1 096 6 860 4 202 24 403 267 10 133 14 537 18 414 1 584 13 393 6 605 Canada0 5 0 5 0 0 0 0 0 0 0 0 Cayman Islands
74 13 29 58 10 3 0 13 20 258 4 274 Costa Rica149 7 0 155 52 3 0 55 57 7 0 64 Cuba
0 3 0 3 0 0 0 0 0 4 0 4 Dominica0 38 0 38 0 1 0 1 21 95 0 116 Dominican Republic0 16 0 16 0 23 0 23 56 61 6 111 El Salvador0 5 0 5 0 0 0 0 0 0 0 0 Greenland0 3 0 3 0 0 0 0 0 0 0 0 Grenada0 22 0 22 0 0 0 0 0 6 0 6 Guadeloupe
43 14 10 47 0 3 0 3 31 131 2 160 Guatemala0 7 0 7 0 0 0 0 0 5 0 5 Haiti
14 8 2 19 0 0 0 0 0 92 0 91 Honduras0 21 0 21 0 0 0 0 0 49 0 49 Jamaica0 7 0 7 0 0 0 0 0 5 0 5 Martinique
606 270 112 764 511 398 23 887 3 047 752 305 3 494 Mexico0 0 0 0 0 0 0 0 0 0 0 0 Montserrat0 18 0 18 0 2 0 2 0 4 0 4 Netherlands Antilles5 5 0 10 0 0 0 0 0 6 0 6 Nicaragua
21 9 0 30 0 1 0 1 28 112 19 120 Panaman.a. n.a. n.a. 0 n.a. n.a. n.a. 0 n.a. n.a. n.a. 0 Puerto Rico
0 1 0 1 0 0 0 0 0 0 0 0 Saint Kitts and Nevis0 7 0 7 0 0 0 0 0 10 0 10 Saint Lucia0 0 0 0 0 0 0 0 0 0 0 0 Saint Pierre and Miquelon0 3 0 3 0 0 0 0 0 4 0 4 Saint Vincent and Grenadines0 21 0 21 0 3 0 3 0 38 0 38 Trinidad and Tobago
39 033 7 963 2 960 44 037 58 472 5 092 5 411 58 153 85 173 11 752 9 113 87 812 United States of America0 0 0 0 0 0 0 0 0 0 0 0 United States Virgin Islands
6 037 409 2 098 4 348 9 719 673 4 023 6 369 9 328 2 644 1 519 10 453 SOUTH AMERICA590 68 210 448 822 136 190 768 1 108 548 26 1 630 Argentina
2 1 0 3 0 8 0 8 2 52 0 53 Bolivia3 558 223 1 164 2 617 6 225 209 2 176 4 258 5 885 909 1 220 5 574 Brazil
844 20 418 446 2 123 11 1 655 479 597 151 142 606 Chile176 35 10 201 307 73 0 380 676 348 63 961 Colombia380 6 90 296 0 5 0 5 86 319 7 399 Ecuador
0 3 0 3 0 0 0 0 0 0 0 0 French Guiana100 0 97 3 0 0 0 0 0 2 0 2 Guyana
Wood-based panels Pulp for paper Paper and paperboard Country (thousand m3) (thousand m3) (thousand m3)
Production Imports Exports Consumption Production Imports Exports Consumption Production Imports Exports Consumption

144
Paraguay 6 524 0 18 6 506 3 877 6 1 3 882 400 0 386 14Peru 7 315 10 0 7 325 1 546 4 6 1 545 693 2 13 682Suriname 19 0 0 19 103 0 21 82 29 0 3 26Uruguay 3 050 4 0 3 054 1 043 2 298 747 269 43 54 258Venezuela 918 0 0 917 1 366 7 48 1 326 230 5 2 234
WORLD TOTAL 1 864 760 5 509 5 842 1 864 427 1 489 530123 372 119 963 1 492 939 429 645 109 200 112 612 426 233
Country Fuelwood and charcoal Industrial roundwood Sawnwood (thousand m3) (thousand m3) (thousand m3)
Production Imports Exports Consumption Production Imports Exports Consumption Production Imports Exports Consumption
Note: The regional breakdown reflects geographical rather than economic or political groupings.

145
96 2 98 0 0 0 0 0 13 26 1 38 Paraguay83 14 5 92 48 22 0 70 140 126 4 262 Peru
7 0 3 5 0 0 0 0 0 3 0 3 Suriname6 17 0 22 29 15 2 42 86 47 8 126 Uruguay
194 20 2 212 165 193 0 358 735 114 50 799 Venezuela
149 385 43 822 44 732 148 474 178 543 31 115 31 696 177 962 284 383 68 375 73 990 278 767 WORLD TOTAL
Wood-based panels Pulp for paper Paper and paperboard Country (thousand m3) (thousand m3) (thousand m3)
Production Imports Exports Consumption Production Imports Exports Consumption Production Imports Exports Consumption
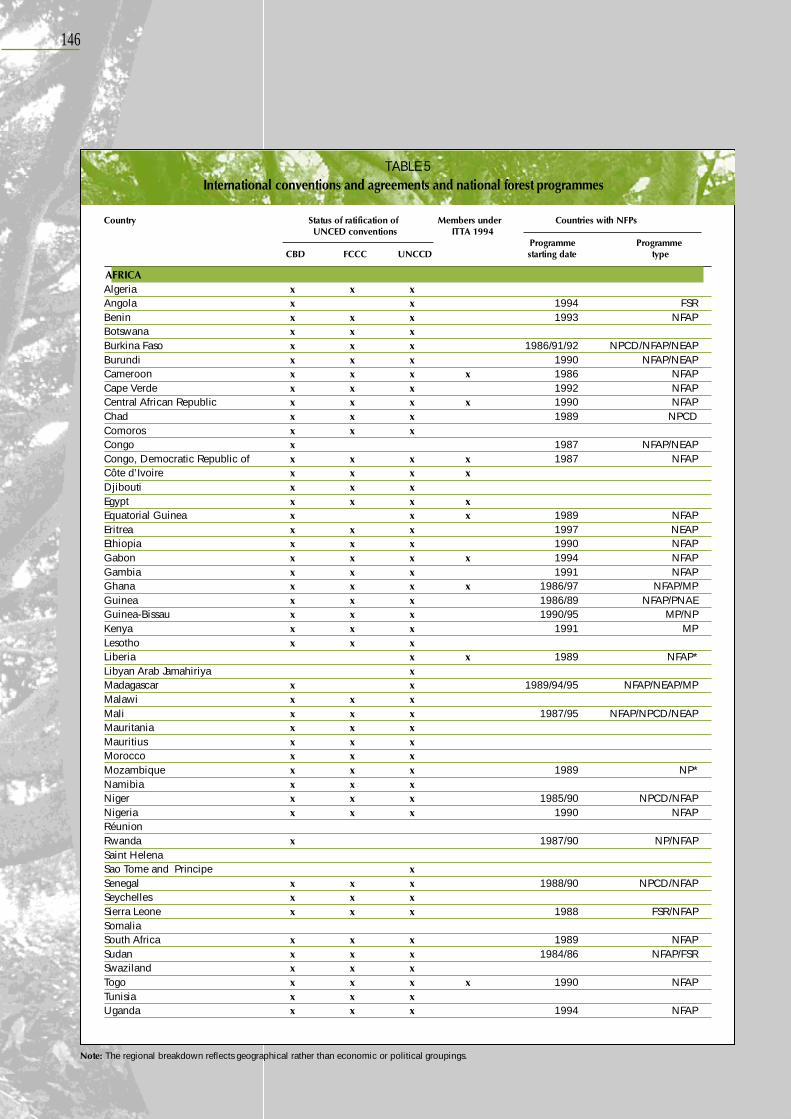
146
TABLE 5International conventions and agreements and national forest programmes
Country Status of ratification of Members under Countries with NFPsUNCED conventions ITTA 1994
Programme ProgrammeCBD FCCC UNCCD starting date type
AFRICAAlgeria x x xAngola x x 1994 FSRBenin x x x 1993 NFAPBotswana x x xBurkina Faso x x x 1986/91/92 NPCD/NFAP/NEAPBurundi x x x 1990 NFAP/NEAPCameroon x x x x 1986 NFAPCape Verde x x x 1992 NFAPCentral African Republic x x x x 1990 NFAPChad x x x 1989 NPCDComoros x x xCongo x 1987 NFAP/NEAPCongo, Democratic Republic of x x x x 1987 NFAPCôte d’Ivoire x x x xDjibouti x x xEgypt x x x xEquatorial Guinea x x x 1989 NFAPEritrea x x x 1997 NEAPEthiopia x x x 1990 NFAPGabon x x x x 1994 NFAPGambia x x x 1991 NFAPGhana x x x x 1986/97 NFAP/MPGuinea x x x 1986/89 NFAP/PNAEGuinea-Bissau x x x 1990/95 MP/NPKenya x x x 1991 MPLesotho x x xLiberia x x 1989 NFAP*Libyan Arab Jamahiriya xMadagascar x x 1989/94/95 NFAP/NEAP/MPMalawi x x xMali x x x 1987/95 NFAP/NPCD/NEAPMauritania x x xMauritius x x xMorocco x x xMozambique x x x 1989 NP*Namibia x x xNiger x x x 1985/90 NPCD/NFAPNigeria x x x 1990 NFAPRéunionRwanda x 1987/90 NP/NFAPSaint HelenaSao Tome and Principe xSenegal x x x 1988/90 NPCD/NFAPSeychelles x x xSierra Leone x x x 1988 FSR/NFAPSomaliaSouth Africa x x x 1989 NFAPSudan x x x 1984/86 NFAP/FSRSwaziland x x xTogo x x x x 1990 NFAPTunisia x x xUganda x x x 1994 NFAP
Note: The regional breakdown reflects geographical rather than economic or political groupings.
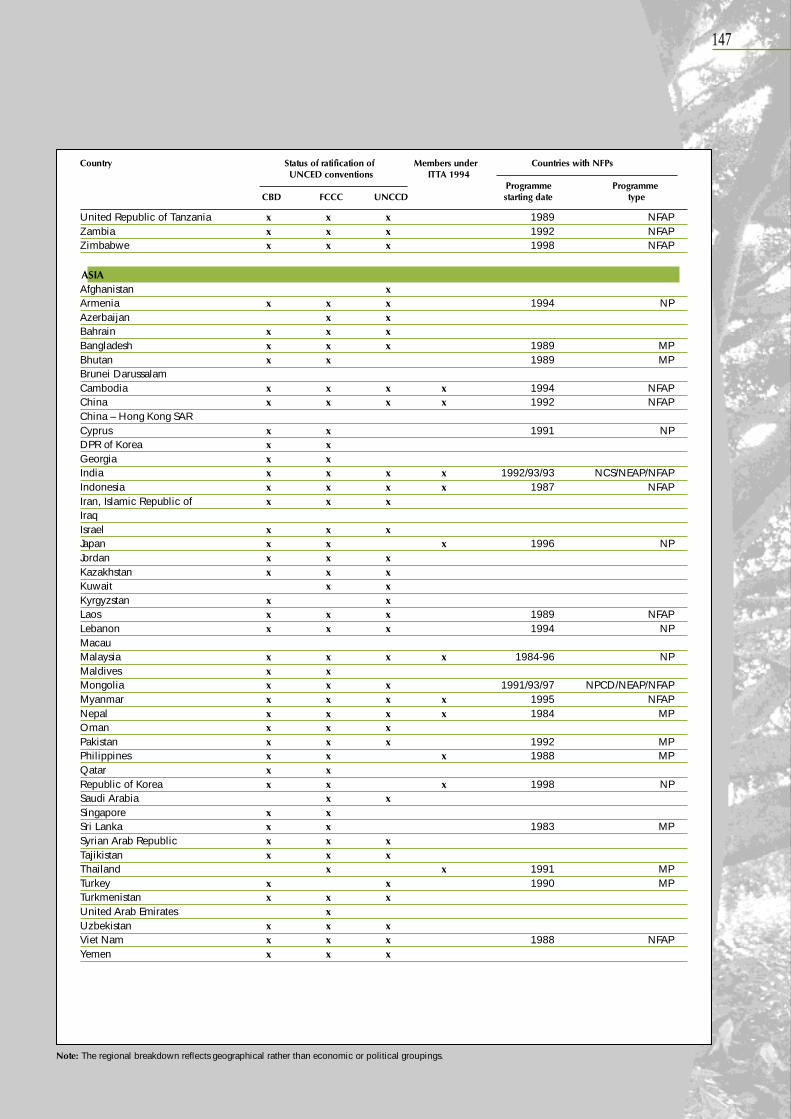
147
United Republic of Tanzania x x x 1989 NFAPZambia x x x 1992 NFAPZimbabwe x x x 1998 NFAP
ASIAAfghanistan xArmenia x x x 1994 NPAzerbaijan x xBahrain x x xBangladesh x x x 1989 MPBhutan x x 1989 MPBrunei DarussalamCambodia x x x x 1994 NFAPChina x x x x 1992 NFAPChina – Hong Kong SARCyprus x x 1991 NPDPR of Korea x xGeorgia x xIndia x x x x 1992/93/93 NCS/NEAP/NFAPIndonesia x x x x 1987 NFAPIran, Islamic Republic of x x xIraqIsrael x x xJapan x x x 1996 NPJordan x x xKazakhstan x x xKuwait x xKyrgyzstan x xLaos x x x 1989 NFAPLebanon x x x 1994 NPMacauMalaysia x x x x 1984-96 NPMaldives x xMongolia x x x 1991/93/97 NPCD/NEAP/NFAPMyanmar x x x x 1995 NFAPNepal x x x x 1984 MPOman x x xPakistan x x x 1992 MPPhilippines x x x 1988 MPQatar x xRepublic of Korea x x x 1998 NPSaudi Arabia x xSingapore x xSri Lanka x x 1983 MPSyrian Arab Republic x x xTajikistan x x xThailand x x 1991 MPTurkey x x 1990 MPTurkmenistan x x xUnited Arab Emirates xUzbekistan x x xViet Nam x x x 1988 NFAPYemen x x x
Country Status of ratification of Members under Countries with NFPsUNCED conventions ITTA 1994
Programme ProgrammeCBD FCCC UNCCD starting date type
Note: The regional breakdown reflects geographical rather than economic or political groupings.
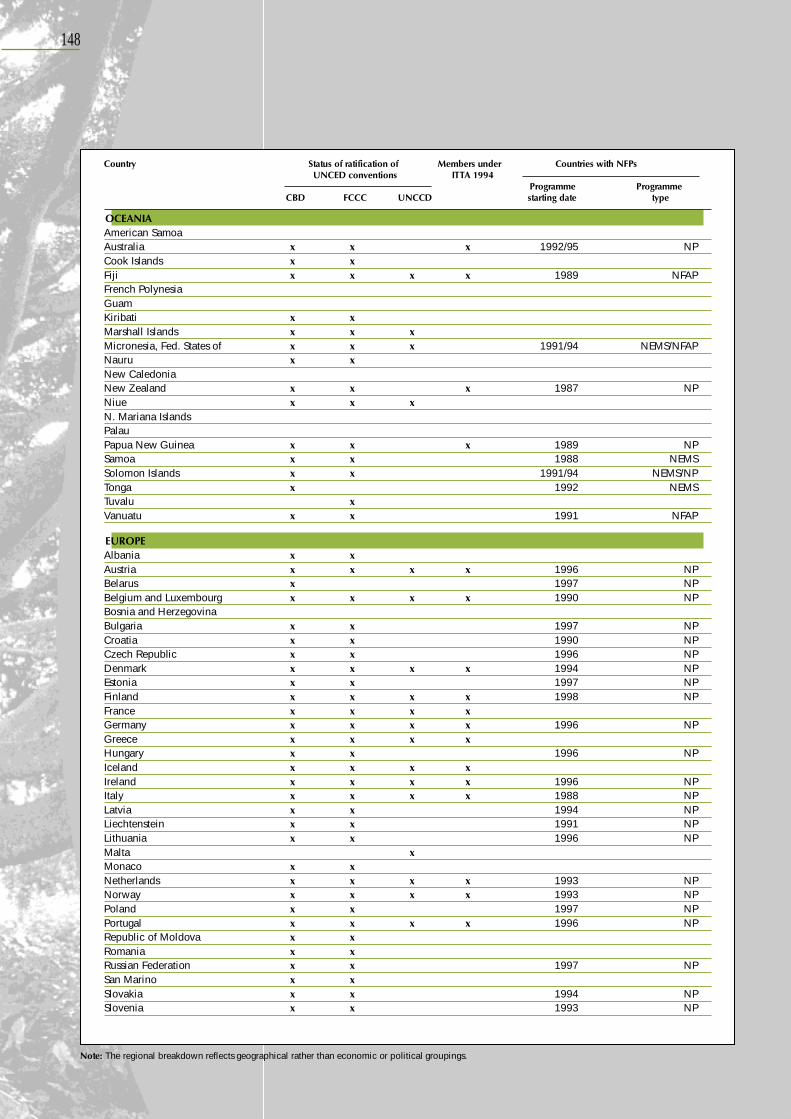
148
OCEANIAAmerican SamoaAustralia x x x 1992/95 NPCook Islands x xFiji x x x x 1989 NFAPFrench PolynesiaGuamKiribati x xMarshall Islands x x xMicronesia, Fed. States of x x x 1991/94 NEMS/NFAPNauru x xNew CaledoniaNew Zealand x x x 1987 NPNiue x x xN. Mariana IslandsPalauPapua New Guinea x x x 1989 NPSamoa x x 1988 NEMSSolomon Islands x x 1991/94 NEMS/NPTonga x 1992 NEMSTuvalu xVanuatu x x 1991 NFAP
EUROPEAlbania x xAustria x x x x 1996 NPBelarus x 1997 NPBelgium and Luxembourg x x x x 1990 NPBosnia and HerzegovinaBulgaria x x 1997 NPCroatia x x 1990 NPCzech Republic x x 1996 NPDenmark x x x x 1994 NPEstonia x x 1997 NPFinland x x x x 1998 NPFrance x x x xGermany x x x x 1996 NPGreece x x x xHungary x x 1996 NPIceland x x x xIreland x x x x 1996 NPItaly x x x x 1988 NPLatvia x x 1994 NPLiechtenstein x x 1991 NPLithuania x x 1996 NPMalta xMonaco x xNetherlands x x x x 1993 NPNorway x x x x 1993 NPPoland x x 1997 NPPortugal x x x x 1996 NPRepublic of Moldova x xRomania x xRussian Federation x x 1997 NPSan Marino x xSlovakia x x 1994 NPSlovenia x x 1993 NP
Country Status of ratification of Members under Countries with NFPsUNCED conventions ITTA 1994
Programme ProgrammeCBD FCCC UNCCD starting date type
Note: The regional breakdown reflects geographical rather than economic or political groupings.
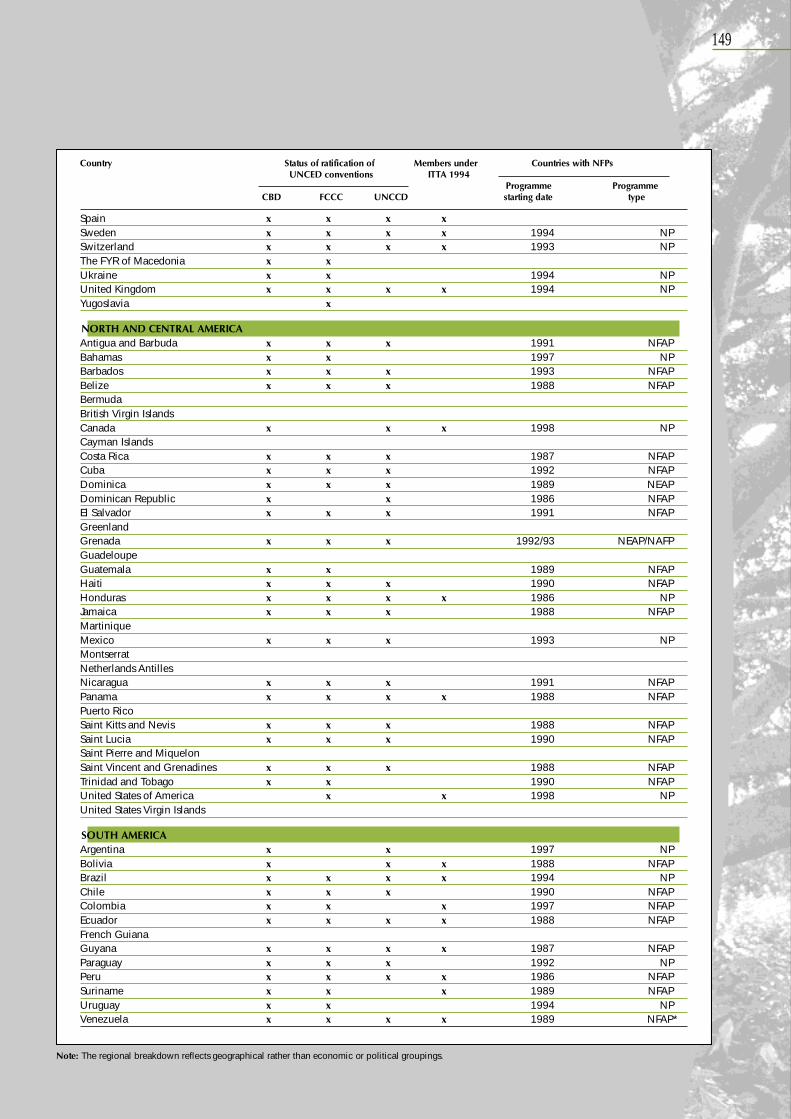
149
Spain x x x xSweden x x x x 1994 NPSwitzerland x x x x 1993 NPThe FYR of Macedonia x xUkraine x x 1994 NPUnited Kingdom x x x x 1994 NPYugoslavia x
NORTH AND CENTRAL AMERICAAntigua and Barbuda x x x 1991 NFAPBahamas x x 1997 NPBarbados x x x 1993 NFAPBelize x x x 1988 NFAPBermudaBritish Virgin IslandsCanada x x x 1998 NPCayman IslandsCosta Rica x x x 1987 NFAPCuba x x x 1992 NFAPDominica x x x 1989 NEAPDominican Republic x x 1986 NFAPEl Salvador x x x 1991 NFAPGreenlandGrenada x x x 1992/93 NEAP/NAFPGuadeloupeGuatemala x x 1989 NFAPHaiti x x x 1990 NFAPHonduras x x x x 1986 NPJamaica x x x 1988 NFAPMartiniqueMexico x x x 1993 NPMontserratNetherlands AntillesNicaragua x x x 1991 NFAPPanama x x x x 1988 NFAPPuerto RicoSaint Kitts and Nevis x x x 1988 NFAPSaint Lucia x x x 1990 NFAPSaint Pierre and MiquelonSaint Vincent and Grenadines x x x 1988 NFAPTrinidad and Tobago x x 1990 NFAPUnited States of America x x 1998 NPUnited States Virgin Islands
SOUTH AMERICAArgentina x x 1997 NPBolivia x x x 1988 NFAPBrazil x x x x 1994 NPChile x x x 1990 NFAPColombia x x x 1997 NFAPEcuador x x x x 1988 NFAPFrench GuianaGuyana x x x x 1987 NFAPParaguay x x x 1992 NPPeru x x x x 1986 NFAPSuriname x x x 1989 NFAPUruguay x x 1994 NPVenezuela x x x x 1989 NFAP*
Country Status of ratification of Members under Countries with NFPsUNCED conventions ITTA 1994
Programme ProgrammeCBD FCCC UNCCD starting date type
Note: The regional breakdown reflects geographical rather than economic or political groupings.

BIBLIOGRAPHY
152
Barthlott, W., Lauer, W. & Placke, A. 1996. Global
distribution of species diversity on vascular plants:
towards a world map of phytodiversity. Erdkunde, 50:
317-327.
Bibby, C.J., Collar, N.J., Crosby, M.J., Heath, M.F., Imboden,
C., Johnson, T.H., Long, A.J., Satterfield, A.J. &
Thirgood, S.J. 1992. Putting biodiversity on the map: priority
areas for global conservation. Cambridge, UK, ICBP.
Brockmann, K.L., Hemmelskamp, J. & Hohmeyer, O. 1996.
Certified tropical timber and consumer behaviour. Mannheim,
Germany, Centre for European Economic Research.
Brown, S., Sathaye, J., Cannell, M. & Kauppi, P. 1996.
Management of forests for mitigation of greenhouse gas
emissions. In R.T. Watson, M.C. Zinyowera & R.H. Moss,
eds. Climate change 1995 – impacts, adaptations and mitigation
of climate change: scientific-technical analyses. Contribution of
Working Group II to the Second Assessment Report of the
Intergovernmental Panel on Climate Change. Cambridge,
UK, Cambridge University Press.
Bureau of Resource Sciences. 1997. National forest inventory
(1997): national plantation inventory of Australia. Canberra,
Australia.
Chipeta, M.E. 1996. Forestry funding in Asia-Pacific, Africa and
Latin America/Caribbean regions: perceptions of main
opportunities and constraints. Information Note to the
UNDP/Denmark/South Africa Workshop on Financial
Mechanisms and Sources of Finance for Sustainable
Forestry, Pretoria, South Africa, June 1996. New York, NY,
USA, UNDP.
Commission on Sustainable Development (CSD). 1997.
Report of the ad hoc Intergovernmental Panel on Forests on its
fourth session, 20 March 1997. Document of the fifth session
of CSD, 7-25 April 1997. E/CN.17/1997/12. New York,
NY, USA.
Department of Agriculture of Northern Ireland (DANI),
Forestry Commission. 1998. The UK Forestry Standard. The
Government’s approach to sustainable forestry. Edinburgh,
UK, Forestry Commission for Great Britain and
Department of Agriculture for Northern Ireland.
Dudley, N., Gilmour, D. & Jeanrenaud, J.P. 1996. Forests for
life – the WWF/IUCN forest policy book. Godalming, UK,
WWF.
European Commission (EC) General Secretariat. 1997.
Energy for the future: Renewable sources of energy – A White
Paper for a community strategy and action plan. COM(97)
599/7.
FAO. 1982. Tropical forest resources. FAO Forestry Paper No. 30.
Rome.
FAO. 1995. Forest resources assessment 1990 – global synthesis.
FAO Forestry Paper No. 124. Rome.
FAO. 1996a. FRA 1990: survey of tropical forest cover and study of
change processes. FAO Forestry Paper No. 130. Rome.
FAO. 1996b. FAO model code of forest harvesting practice, by
D.P. Dykstra & R. Heinrich. Rome.
FAO. 1996c. Basic principles and operational guidelines.
Formulation, execution and revision of national forest
programmes. FAO, Rome.
FAO. 1996d. Directory of forestry education and training
institutions. Rome.
FAO. 1996e. Memoria – Reunión regional sobre generación de
electricidad a partir de biomasa. Montevideo, Uruguay, 23-27
October 1995. Serie Forestal No. 7. Santiago, Chile.
FAO. 1997a. Implications of sustainable forest management for
global fibre supply, by J. Williams, P.N. Duinker & G. Bull.
Working Paper GFSS/WP/03. Rome.
FAO. 1997b. Forest harvesting in natural forests of the Republic of
the Congo, by R. Scharpenberg. Forest Harvesting Case-
Study No. 7. Rome.
FAO. 1997c. Environmentally sound forest harvesting: testing the
applicability of the FAO Model Code in the Amazon in Brazil,
by N. Winkler. Forest Harvesting Case-Study No. 8. Rome.
FAO. 1997d. State of the World’s Forests 1997. Rome.
FAO. 1997e. In-depth country study – New Zealand. Asia-Pacific
forestry sector outlook study, by C. Brown. Working Paper
APFSOS/WP/05. Rome.
FAO. 1997f. Aménagement des forêts naturelles des zones
tropicales sèches, by R. Bellefontaine, R. Gaston &
Y. Petrucci. FAO Conservation Guide No. 32. Rome.
FAO. 1997g. Regional study – the South Pacific. Asia-Pacific
Forestry Sector Outlook Study. Working Paper APFSOS/
WP/01. Rome.
FAO. 1997h. The role of wood energy in Europe and OECD. Wood
energy today for tomorrow, by R. van den Broek. Rome.
FAO. 1997i. La generación de electricidad a partir de eucalipto y
bagazo en ingenios azucareros de Nicaragua. Informe final, by
R. van den Broek. Rome.
FAO. 1997j. Forest resources and roundwood supply in the Asia-
Pacific countries: situation and outlook to the year 2010, by
J. Blanchez. APFSOS Working Paper No. 17. Rome.
FAO. 1997k. New institutional trends in forestry research – case
studies from Africa. Rome.
FAO. 1997l. Update on sustainable forest management and
certification. Advisory Committee on Paper and Wood
Products, 38th session, Rome, 23-25 April 1997. ACPWP
97/5. Rome (http://www.fao.org/unfao/bodies/acpwp/
acpwp38/sfmabse.htm)
153
FAO. 1998a. Global Fibre Supply Model. Rome.
FAO. 1998b. Environmentally sound road construction in
mountainous terrain: applying advanced operating methods and
tools, by N. Winkler. Forest Harvesting Case-Study No. 10.
Rome.
FAO. 1998c. Reduced impact timber harvesting in the tropical
natural forest in Indonesia, by Elias. Forest Harvesting Case-
Study No. 11. Rome.
FAO. 1998d. Environmentally sound forest infrastructure
development and harvesting by long distance cable systems in
the Himalayan region in Bhutan, by N. Winkler. Forest
Harvesting Case-Study No. 12. Rome.
FAO. 1998e. Trade restrictions and their impacts on international
trade in forest products, by I.J. Bourke & J. Leitch. Rome.
FAO. 1998f. Asia-Pacific forestry – towards 2010: report of the
Asia-Pacific Forestry Sector Outlook Study. Rome.
FAO. 1998g. FAO Yearbook of Forest Products 1996. Rome.
FAO. 1998h. FAO Production Yearbook 1996. Rome.
FAO. 1999. Global Forest Products Outlook Study, by A.
Whiteman. Rome. (In press).
FAO/FORSPA. 1998. Emerging institutional arrangements for
forestry research.
Houghton, J.T., Meira Filho, L.G., Callander, B.A., Harris,
N., Kattenberg, A. & Maskell, K., eds. 1996. Climate
change 1995 – the science of climate change. Contribution of
Working Group I to the Second Assessment Report of the
Intergovernmental Panel on Climate Change. Cambridge,
UK, Cambridge University Press.
Intergovernmental Panel on Climate Change (IPCC). 1996.
Revised 1996 IPCC guidelines for national greenhouse gas
inventories. Vol. 1, Greenhouse gas inventory reporting
instructions. Vol. 2, Greenhouse gas inventory workbook. Vol.
3, Greenhouse gas inventory reference manual. Geneva,
Switzerland, IPCC/Paris, France, OECD, International
Energy Agency (IEA).
Intergovernmental Panel on Forests (IPF). 1996. Report of the
Secretary-General on Programme Element I.4: Fragile
ecosystems affected by desertification and the impact of air-borne
pollution on forests. E/CN.17/IPF/1996/3. Document
prepared for the 2nd session of IPF. New York, NY, USA.
International Tropical Timber Organization (ITTO). 1998.
Tropical Timber Market Report, 16-31 May.
Iremonger, S.I., Ravilious, C. & Quinton, T., eds. 1997. A
global overview of forest conservation. CD-ROM. Cambridge,
UK, WCMC and CIFOR.
Irland, L.C. 1998. Ice storms 1998 and the forests of the
Northeast. J. Forestry, 96(9): 32-40.
Joint ECE/FAO Agriculture and Timber Division. 1996.
European timber trends and prospects into the 21st century.
Geneva Timber and Forest Study Papers (ECE) No. 11.
New York, NY, USA, UN.
Kowero, G.S. & Spilsbury, M.J. 1997. Capacity for forestry
research in the Southern African Development Community.
Bogor, Indonesia, CIFOR.
Leach, G. 1993. Farm trees and wood markets: a review and
economic appraisal. Pakistan Household Energy Strategy
Study, UNDP/World Bank Energy Sector Management
Assistance Programme. Washington, DC, USA, World
Bank/Islamabad, Pakistan, Energy Wing, Government of
Pakistan.
Lininger, H., Weingartner, R. & Grosjean, M. 1998.
Mountains of the world: water towers for the 21st century.
Bern, Switzerland, Mountain Agenda.
Markopoulos, M. 1998. The impacts of certification on
community forest enterprises: a case study of the Lomerio
Community Forest Management Project, Bolivia. London, UK,
International Institute for Environment and Development.
Messerli, B. & Ives, J.D., eds. 1997. Mountains of the world. A
global priority. New York, NY, USA, Parthenon Publishing
Group, Inc.
New Zealand Ministry of Forestry. 1996. Forestry sector issues:
a post election briefing for the Ministry of Forestry. Wellington.
New Zealand Ministry of Forestry. 1997. A national exotic
forest description. Wellington.
Nousiainen, I.K. & Vesisenaho, T.J. 1998. Potential utilization
of woodfuels in Finland. In P. Hakkila, M. Heino &
E. Puranen, eds. Wood fuels from conventional forestry.
Proceedings of the Workshop on Woodfuels from
Conventional Forestry, Jasper, Alberta, Canada, 18 October
1997. Metsäntutkimuslaitoksen tiedonantoja 680 (Research
Papers No. 680). Helsinki, Finland, Finnish Forest
Research Institute.
Overseas Development Agency (ODA) (now Department
for International Development – DFID). 1996. Sharing
forest management: key factors, best practice and ways forward.
Findings from ODA’s review of participatory forest
management. London, UK.
Poschen, P. 1997. Forests and employment – much more than
meets the eye. In Proceedings of the XI World Forestry
Congress, Vol. 4, p. 61-79. Rome, FAO.
Preston, L., ed. 1997. Investing in mountains: innovative
mechanisms and promising examples for financing conservation
and sustainable development. Franklin, West Virginia, USA,
Mountain Forum/The Mountain Institute/FAO.
Price, M.F. 1998. Mountains: globally important ecosystems.
Unasylva, 49(195): 3-12.
154
Rametsteiner, E., Schwarzbauer, P., Juslin, H., Kaernae, J.,
Cooper, R., Samuel, J., Becker, M. & Kuehn, T. 1998.
Proceedings of the Conference on Potential Markets for Certified
Forest Products in Europe, Brussels, Belgium, 13 March 1998.
Joensuu, Finland, European Forestry Institute.
Reuters News Service. 1998. At least two dead in Russian
forest fires. 21 September.
Reuters News Service. 1998. New steps to protect New York
City drinking water. 8 August.
Schemo, D.J. 1998. Fires posing greater risk as Amazon rain
forest grows drier. New York Times, 13 September.
Schimel, D., Alves, D., Enting, I., Heimann, M., Joos, F.,
Raynaud, D. & Wigley, T. 1996. Radiative forcing of
climate change. In J.T. Houghton, L.G. Meira Filho, B.A.
Callander, N. Harris, A. Kattenberg & K. Maskell, eds.
Climate change 1995 – the science of climate change.
Contribution of Working Group I to the Second
Assessment Report of the Intergovernmental Panel on
Climate Change. Cambridge, UK, Cambridge University
Press.
Schwartzman, S. 1998. Burning up again in Brazilian
Amazon. INFOTERRA, 16 September.
Schweithelm, J. 1998. Public policies affecting forest fires in Asia-
Pacific. Paper presented to the Meeting on Public Policies
Affecting Forest Fires, Rome, 28-30 October 1998.
Sist, P., Dykstra, D. & Fimbel, R. 1998. Reduced-impact logging
guidelines for lowland dipterocarp forests in Indonesia. CIFOR
Occasional Paper No. 15. Bogor, Indonesia, CIFOR.
Sizer, N. 1996. Profit without plunder: reaping revenue from
Guyana’s tropical forests without destroying them.
Washington, DC, USA, World Resources Institute.
SkogForsk (Forestry Research Institute of Sweden). 1998.
CTI på virkesfordon ger bättre framkomlighet och större
dragkraft. Resultat No. 2. Uppsala, Sweden.
Third Ministerial Conference on the Protection of Forests in
Europe/Ministry of Agriculture, Rural Development and
Fisheries of Portugal. 1998a. Interim data of TBFRA 2000
as presented to the Third Ministerial Conference on
Protection of Forests in Europe. In Follow-up reports on the
Ministerial Conferences on the Protection of Forests in Europe,
Vol. 2. Lisbon, Portugal.
Third Ministerial Conference on the Protection of Forests in
Europe/Ministry of Agriculture, Rural Development and
Fisheries of Portugal. 1998b. Status of sustainable forest
management in Europe. In Follow-up reports on the
Ministerial Conferences on the Protection of Forests in Europe.
Lisbon, Portugal.
Thornqvist, T. 1998. Handling of woodfuel at Södra Skogsenergi
in Sweden. Paper presented at IEA, Task 25, Workshop,
Nokia, Finland, September 1998.
United Nations (UN). 1996. World population prospects – the
1996 revision. New York, NY, USA.
UN. 1997a. World urbanization prospects – the 1996 revision.
New York, NY, USA.
UN. 1997b. UN-ECE/FAO Temperate and Boreal Forest Resources
Assessment 2000: terms and definitions. New York, NY, USA
and Geneva, Switzerland.
United Nations Environment Programme (UNEP)/World
Conservation Monitoring Centre (WCMC). 1996.
Framework for information management in the context of the
Convention on Biological Diversity. Cambridge, UK, WCMC.
United States Department of Agriculture (USDA) Forest
Service. 1996. Activities related to poplar and willow
cultivation, exploitation and utilization, by J.G. Isebrands.
Report of the National Poplar Commission of the USA to
the 20th session of the International Poplar Commission,
Budapest, Hungary, 1-4 October 1996.
USDA Forest Service. 1998. Ice storm 1998. Interim status
report. Radnor, Pennsylvania, USA, Northeastern Area
State and Private Forestry.
World Bank. 1997. World development indicators 1997.
Washington, DC, USA.
World Conservation Monitoring Centre (WCMC). 1994.
Biodiversity data sourcebook, ed. B. Groombridge.
Cambridge, UK, World Conservation Press.
WCMC. 1996a. The WWF world forest map. Cambridge, UK.
WCMC. 1996b. 1996 IUCN red list of threatened animals, ed.
J. Baillie & B. Groombridge. Gland, Switzerland and
Cambridge, UK, IUCN/World Conservation Union.
WCMC. 1998a. The world list of threatened trees, ed. S. Oldfield,
C. Lusty, & A. MacKinven. Cambridge, UK, World
Conservation Press.
WCMC. 1998b. 1997 IUCN red list of threatened plants, ed. K.S.
Walter & H.J. Gillett. Gland, Switzerland and Cambridge,
UK, IUCN/World Conservation Union.
World Resources Institute (WRI)/UNEP/United Nations
Development Programme (UNDP)/World Bank. 1996.
World Resources 1996-1997. New York, NY, USA, Oxford
University Press.
World Trade Organization (WTO). 1998. Report on the CTE
meeting of 19-20 March 1998. Trade and Environmental
Bulletin, 14 May.
World Wide Fund for Nature (WWF)/World Conservation
Union (IUCN). 1994. Centres of plant diversity. A guide and
strategy for their conservation. 3 vols. Cambridge, UK,
IUCN. ◆