site scientific mission plan for the southern great plains...
TRANSCRIPT
Site Scientific MissionPlan for the SouthernGreat Plains CART Site
July-December 19!)7
Prepared for the U.S. Department of Energyunder Contract W-31-109-Eng-38
Site Program Manager OfficeEnvironmental Research DivisionArgonne National LaboratoryArgonne, IL 60439
Atmospheric Radiation Measurement

DISCLAIMER
This Rport was preparedas an accountof worksponsoredby an agencyof the United StatesGovernment.Neitherthe United StatesGovernmentnor an agencythereof,nor any of their employees,makesanywarranty,expressor implied,or assumesany legal liabilityor responsibilityfor the accuracy,completeness,or usefulnessof any information,apparatus,product,or processdisclosed,or representsthatits use wouldnot infringeprivatelyownedrights. Referencehereinto any specificcommercialproduct,process,or serviceby trade name,trademark,manufacturer,or otherwise,does not necessarilyconstituteorimply its endorsement,recommendation,or favoringby the United StatesGovernmentor any agencythereof. The viewsand opinionsof authorsexpressedhereindo not necessarilystateor reflect thoseof theUnited StatesGovernmentor anyagency thereof.
Publishingsupportserviceswereprovidedby Argonne’sInformationand PublishingDivision. (For moreinformation,see IPD’shome]page:http://www.ipd.anl.gov.)
Reproduceddirectlyfrom the best availablecopy.
Availableto DOEand DOEcontractorsfrom theOfficeof Scientificand TechnicalInformation,P.O. Box 62, Oak Ridge,TN 37831;pricesavailablefrom (423) 576-8401.
Availableto the public from the NationalTechnicalInformationService,U.S. Departmentof Commerce,5285Port RoyalRoad, Springfield,VA 22161.
DISCLAIMER
Portions of this document may be illegiblein electronic image products. Images areproduced from the best available originaldocument.

Distribution Category:Environmental Sciences (UC-402)
ARM-97-002
Site Scientific Mission Planfor the
Southern Great Plains CART Site
July-December 1997
July 1997
Randy A. Pepplerl, Douglas L. Sisterson2, and Peter J. Lambl
lCooperative Institute for Mesoscale Meteorological Studies,The University of Oklahoma, Norman, Oklahoma 73019
2Environmental Research Division, Argonne NationalLaboratory, Argonne, Illinois 60439
Work supported by United States Department of Energy,Office of Energy Research,
Office of Health and Environmental Research


CONTENTS
Acknowledgments ......................................................................................................................... v
Notation ........................................................................................................................................ vii
1
2
3
4
5
6
7
8
Introduction ............................................................................................................................... 1
Summary of Scientific Goals ....................................................................................................2.1 Programmatic Goals .......................................................................................................... ;2.2 Priorities for Site Activities ............................................................................................... 4
Routine Site Operations ............................................................................................................ 83.1 Overview ............................................................................................................................ 83.2 Routine Operations ........................................................................................................... 103.3 Instruments ........................................................................................................................ 163.4 Observations, Measurements, and External Data ............................................................. 243.5 Site Development Activities ............................................................................................. 243.6 Limiting Factors ................................................................................................................ 26
Data Quality .............................................................................................................................. 284.1 Instrument Mentors ...........................................................................................................4.2 Site Scientist Team ............................................................................................................ ::4.3 Value-Added Products and Quality Measurement Experiments ...................................... 314.4 Problem Review Board ..................................................................................................... 33
Scientific Investigations and Opportunities .............................................................................. 355.1 Intensive Observation Periods .......................................................................................... 355.2 Intensive Observation Periods for this Six-Month Period ................................................ 385.3 Collaborative Investigations .............................................................................................5.4 Geophysically Significant Phenomena ............................................................................. ;;5.5 Educational Outreach ........................................................................................................ 52
Distribution of Data .................................................................................................................. 54
Looking Ahead .......................................................................................................................... 55
References ................................................................................................................................. 61
Appendix: Status and Locations of Ins~ments .......................................................................... 63
FIGURES
1 Overall View of the SGP CART Site ........................................................................................ 11
2 SGP CART Instrumentation Implementation Flowchati .......................................................... 17
..W

TABLES
1 Instruments and Observational Systems Anticipated at the Central, Boundary,Extended, and Auxiliary Facilities on December 31, 1997 ...................................................... 12
2 Radiosonde Launch Schedule for July l-December31, 1997 .................................................. 15
3 Value-Added Products in Place at the SGP CART Site ........................................................... 32
4 Intensive Observation Periods .................................................................................................. 39
A. 1 Actual and Planned Locations of Instruments at the Central Facility ................................... 65
A.2 Locations and Status of Extended Facilities ......................................................................... 68
A.3 Locations and Status of Intermediate Facilities .................................................................... 72
A.4 Locations and Status of Boundary Facilities ......................................................................... 73
iv

ACKNOWLEDGMENTS
This research was supported by the Atmospheric Radiation Measurement Program of the
Environmental Sciences Division, Office of Health and Environmental Research, Office of
Energy Research, U.S. Department of Energy, under contract PNL 144880-A-Q1 at the
Cooperative Institute for Mesoscale Meteorological Studies, The University of Oklahoma
(Peppier and Lamb), and under contract W-31 -109-Eng-38 at Argonne National Laboratory
(Sisterson).
The authors wish to thank the following for their much appreciated contributions to this
report: Marvin Wesely, Argonne National Laboratory, for Section 3.3, Instruments; the VAP
Working Group for Section 4.3, Value-Added Products and Quality Measurement Experiments,
and Table 3; and Richard CederWall, Lawrence Livermore National Laboratory, for Section 5.1
and Table 4, Intensive Observation Periods.
v

w“
NOTATION
ABLEABRFCAERIAMMRANLAOSARESEARMASRCASTERASTIAVHRRAWSBAMSBBSSBCRBFBFVceilBLCBLXBORCALBRSBSRNCARCARTCASESCASHCCNCERESCIMMSCIMSS/SSEC
CIRACLASSCLEXCSPHOTCsuDIALDOEDQRDSITEBBRECMWFECOR
Argonne Boundary Layer ExperimentArkansas Basin Red River Forecast Centeratmospherically emitted radiance interferometeradvanced multispectral microwave radarArgonne National Laboratoryaerosol observation systemARM Enhanced Shortwave ExperimentAtmospheric Radiation MeasurementAtmospheric Sciences Research Centerair-surface turbulence exchange researchabsolute solar transmittance interferometeradvanced very-high-resolution radiometerautomated weather stationBulletin of the American Meteorological Societyballoon-borne sounding systembaseline change requestboundary facilityboundary facility Vaisala ceilometerBelfort laser ceilometerBoundary Layer ExperimentBroadband Outdoor Radiometer CALibrahonbroadband radiometer stationBaseline Surface Radiation NetworkCorrective Action ReportCloud and Radiation TestbedCooperative Atmosphere-Surface Exchange Studycommercial aviation sensing humiditycloud condensation nucleiClouds and Earth’s Radiant Energy SystemCooperative Institute for Mesoscale Meteorological StudiesCooperative Institute for Meteorological Satellite Studies/Space Scienceand Engineering Center-Cooperative Institute for Research in the Atmospherecross-chain loran atmospheric sounding systemCloud Layer ExperimentCimel sunphotometerColorado State UniversityDifferential Absorption LidarU.S. Department of EnergyData Quality ReportData and Science Integration Teamenergy balance Bowen ratioEuropean Centre for Medium Range Weather Forecastseddy correlation
vu

NOTATION (Cont.)
EFEOPETLFDDAFSBR
GCIPGCMGEWEXGFGRGISTGOESGPSGR4MSGSFCGVFAIDPIDPCIFIOP1PMIRIRFIRTISLSCPISM1SSITKSULANLLBLLBLRTMLLJLMSMAPSMFRMFRSRMIRMMCRMPLMSUMSXMWRNASA
extended facilityExperimental Operations PlanEnvironmental Technology Laboratoryfour-dimensional data assimilationfractional solar broadband radiometerfile transfer protocolGEWEX Continental-Scale International Projectgeneral circulation modelGlobal Energy and Water Cycle ExperimentGagarin, Farruggia, Gibisch, Reis, Inc.GEWEX Integrated System Testgeostationary orbiting Earth satelliteglobal positioning systemground radiation measurement systemGoddard Space Flight Centergeophysical variable focus areaInstrument Development Programintegrated data processing circuitintermediate facilityintensive observation periodinstrument performance modelinfraredinstantaneous radiative fluxinfrared thermometerInternational Satellite Land-Surface Climatology ProjectIntegrated Surface Mesonetintegrated sounding systemInstrument TeamKansas State UniversityLos Alamos National Laboratoryline by lineline-by-line radiative transfer modelLow-Level JetLockheed Missile and SpaceMesoscale Analysis and Prediction Systemmultifilter radiometermultifilter rotating shadowband radiometermicrowave imaging radarmillimeter cloud radarmicropulse IidarMillersville State UniversityMidcourse Satellite Experimentmicrowave radiometerNational Aeronautics and Space Administration
,..Vlu

NOTATION (Cont.)
NCARNCEPNCSUNEPANEXRADNFovNGM
NISTNOAANRELNSSLNwsOcsOKMORROuPARPARABOLA
PARCPBLPcPIPIFPNNLPRBPROFPRRPsuQMERAssRCFRLIDRSSRUCRWPSACSCMSDSSGPS1SIROSSIRS
National Center for Atmospheric ResearchNational Centers for Environmental PredictionNorth Carolina State UniversityNational Environmental Policy Actnext-generation radarnarrow-field-of-view zenith-pointing filtered radiometernested grid modelnormal-incidence pyrheliometerNational Institute of Standards and TechnologyNational Oceanic and Atmospheric AdministrationNational Renewable Energy LaboratoryNational Severe Storms LaboratoryNational Weather ServiceOklahoma Climatological SurveyOklahoma MesonetOperational Readiness ReviewUniversity of Oklahomaphotosynthetically active radiometerportable appartus for rapid acquisition of bidirectional observationsof the land and the atmospherePalo Alto Research Centerplanetary boundary layerpersonal computerprincipal investigatorProblem Identification FormPacific Northwest National LaboratoryProblem Review BoardprofilePre-Readiness ReviewPennsylvania State Universityquality measurement experimentradio acoustic sounding systemradiometer calibration facilityRaman lidarrotating shadowband spectrometerrapid update cycleradar wind profilerSite Advisory Committeesingle-column modelsite data systemSouthern Great PlainsInternational System of Unitssolar and infrared radiation observing systemsolar and infrared station
ix

SITACSMOSSNLSORTISSTSUCCESSSWATSSwsTBDTDDRTEMPTHWAPSTLcvT/RHTSBRTWPUAVUBCUIRUMUNAVCOUOMURLUSDAUSRUTCUuUV-AUV-B
VAPVceilVORTEXWPDNWPLWSI
NOTATION (Cont.)
Spectral Imagery Technology Applications Centersurface meteorological observation stationSandia National Laboratoriessolar radiance transmission interferometerSite Scientist TeamSubsonic Aircraft: Contrail and Cloud Effects Special Studysoil water and temperature systemshofiwave spectrometerto be determinedtotal direct diffuse radiometertemperaturetemperature, humidity, wind, and pressure sensortime-lapse cloud videotemperature and relative humidity sensortotal shortwave broadband radiometerTropical Western Pacificunmanned aerospace vehicleUniversity of British Columbiaupwelling infrared radiometerUniversity of MassachusettsUniversity NAVSTAR ConsortiumUniversity of Marylanduniversal resource locatorU.S. Department of Agricultureupwelling solar radiometeruniversal time coordinatedUniversity of Utahultraviolet Aultraviolet BUniversity of Wisconsinvalue-added productVaisala ceilometerVerification of the Origins of Rotation in Tornadoes ExperimentWind Profiler Demonstration NetworkWave Propagation Laboratorywhole-sky imagerWorld Wide Web
x

1
SITE SCIENTIFIC MISSION PLAN
FOR THE SOUTHERN GREAT PLAINS CART SITE
JULY-DECEMBER 1997
1 INTRODUCTION
The Southern Great Plains (SGP) Cloud and Radiation Testbed (CART) site is designed
to help satisfy the data needs of the Atmospheric Radiation Measurement (ARM) Program
Science Team. This document defines the scientific priorities for site activities during the six
months beginning on July 1, 1997, and looks forward in lesser detail to subsequent six-month
periods. The primary purpose of this Site Scientific Mission Plan is to provide guidance for the
development of plans for site operations. It also provides information on current plans to the
ARM functional teams (Management Team, Data and Science Integration Team ~SITl,
Operations Team, Instrument Team [ITl, and Campaign Team) and serves to disseminate the
plans more generally within the ARM Program and among the members of the Science Team.
This document includes a description of the operational status of the site and the primary site
activities envisioned, together with information concerning approved and proposed intensive
observation periods (IOPS). The primary users of this document are the site operator, the Site
Scientist Team (SST), the Science Team through the ARM Program science director, the ARM
Program Experiment Center, and the aforementioned ARM Program functional teams. This plan
is a living document that is updated and reissued every six months as the observational facilities
are developed, tested, and augmented and as priorities are adjusted in response to developments
in scientific planning and understanding.
This report is available on the SGP CART site World Wide Web (WWW) home page at
http://www.am.gov/docs/sites/sgp/sgp .html
under the heading “Site Scientific Mission Plan. ”
A distilled version of this document is currently being written for publication in the
Bulletin of the American Meteorological Society and will be published either during this
six-month period or in 1998.
2
2 SUMMARY OF SCIENTIFIC GOALS
2.1 Programmatic Goals
The primary goal of the SGP CART site activities is to produce data adequate to support
significant research addressing the objectives of the ARM Program. These overall objectives, as
paraphrased from the ARM Program Plan, 1990 (U.S. Department of Energy 1990), are the
following:
● To describe the radiative energy flux profile of the clear and cloudy
atmosphere
● To understand the processes determining the flux profile
● To parametrize the processes determining the flux profile for incorporation
into general circulation models (GCMS)
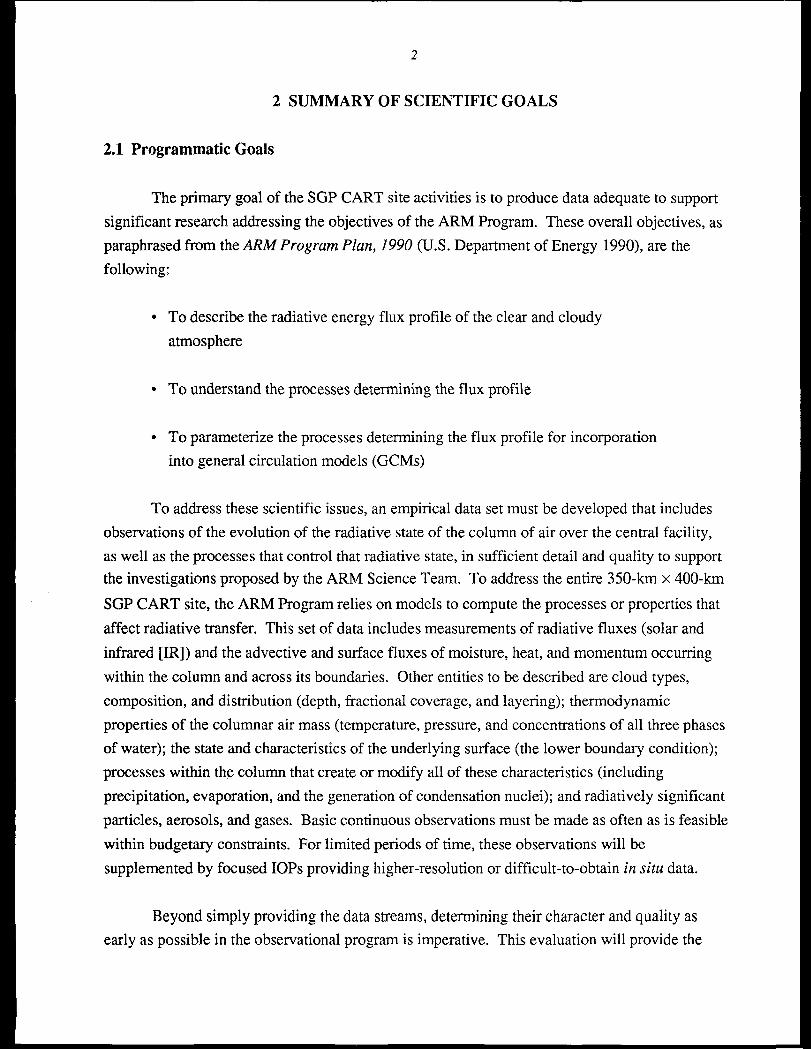
To address these scientific issues, an empirical data set must be developed that includes
observations of the evolution of the radiative state of the column of air over the central facility,
as well as the processes that control that radiative state, in sufficient detail and quality to support
the investigations proposed by the ARM Science Team. To address the entire 350-km x 400-km
SGP CART site, the ARM Program relies on models to compute the processes or properties that
affect radiative transfer. This set of data includes measurements of radiative fluxes (solar and
infrared [IR]) and the advective and surface fluxes of moisture, heat, and momentum occurring
within the column and across its boundaries. Other entities to be described are cloud types,
composition, and distribution (depth, fractional coverage, and layering); thermodynamic
properties of the columnar air mass (temperature, pressure, and concentrations of all three phases
of water); the state and characteristics of the underlying surface (the lower boundary condition);
processes within the column that create or modify all of these characteristics (including
precipitation, evaporation, and the generation of condensation nuclei); and radiatively significant
particles, aerosols, and gases. Basic continuous observations must be made as often as is feasible
within budgetary constraints. For limited periods of time, these observations will be
supplemented by focused IOPS providing higher-resolution or difficult-to-obtain in situ data.
Beyond simply providing the data streams, determining their character and quality as
early as possible in the observational program is imperative. This evaluation will provide the
3
basic operational understanding of the data necessary for an ongoing program of such scope.
Although both reason and ample opportunity will exist to develop a further understanding of the
ARM observations over the course of the program, the task of investigating and ensuring the data
quality is extremely important. In this regard, routine instrument mentor and SST data quality
assessments, definitive quality measurement experiments (QMEs), and value-added products
(VAPS) will help establish confidence in the measurements.
The SGP CART site is the frost of three global locations chosen and instrumented for data
collection. As summarized in the Science Plan for the ARM Program (U.S. Department of
Energy 1996), the scientific issues to be addressed by using data from a midlatitude continental
CART observatory include the following:
●
●
●
●
●
●
Radiative transfer in cloudless, partly cloudy, and overcast conditions
Cloud formation, maintenance, and dissipation
Nonradiative flux parameterizations
The role of surface physical and vegetative properties in the column energy
balance
Other complications in the radiative balance in the atmosphere, particularly
those due to aerosols, cloud condensation nuclei (CCN), and cloud-aerosol
radiative interactions
Feedback processes between different phenomena and different domains
The variety, surface density, and atmospheric volumetric coverage of the SGP instrumentation
will be more comprehensive than those at any other ARM site, and the SGP site will experience
a wider variety of atmospheric conditions than will any other ARM site. The resulting data will
accordingly support a greater range and depth of scientific investigation than data from any other
location, making it imperative for the ARM Program to develop and maintain a high-quality,
continuous data stream from the SGP site.
The measurements required by Science Team proposals, the DSIT, and the science
director are incorporated into geophysical variable focus areas (GVFAS). The DSIT and other

4
teams coordinate activities to develop these integrated, well-focused data sets. The GVFAS
include shortwave radiation, water vapor, longwave radiation, aerosols, clouds, surface fluxes,
and the single-column model (SCM). A goal is to facilitate algorithm development that
prescribes geophysical phenomena as products of multiple data streams rather than focusing on
individual data streams.
2.2 Priorities for Site Activities
As the construction of the SGP CART site nears completion, the primary scientific goal
has shifted from the establishment of routine observations to addressing the specific science
issues related to the site. In descending order, we rank the priorities of site activities for July
through December 1997 as follows:
1.
2.
3.
4.
5.
Support all data quality assessment efforts, particularly those focused on
shortwave radiation, including implementation of QMEs and VAPS.
Complete establishment and. sustain high quality of routine site operations.
Plan and implement key IOPS and campaigns.
Finish implementation of extended facilities.
Support the Instrument Development Program (IDP).
Within this ranking, the differences in relative importance between adjacent items are not large.
The categorization is also somewhat artificial because many site activities have multiple
purposes. For example, IOP activities can simultaneously support Science Team, IDP, and
campaign requirements. Even so, this ranking reflects our scientific assessment of the activities
that should receive the most support during this period.
The IOPS focus on providing critical data sets on an episodic basis to the Science Team,
as well as field support for instrument development and testing and for collaborative campaigns.
The IOPS scheduled for this six-month period are detailed in Section 5.2.
To assist the SST with scientific issues, a Site Advisory Committee (SAC), consisting of
seven scientists (approximately half from outside the ARM Program), provides scientific
5
guidance for the SGP CART site. The SAC works directly with the SST and the site program
manager. A report from a second SAC meeting held on June 11 and 12, 1996, in Norman,
Oklahoma, became available in April 1997. That meeting followed up on the first SAC meeting
(November 27-29, 1995), which included a visit to the SGP CART site. Another meeting is
scheduled for late 1997.
Routine radiosonde observations will continue to include five daily balloon-borne
sounding system (BBSS) launches on Monday through Friday (including holidays) at the central
facility. One routine daily launch will continue on Monday through Friday (including holidays)
at each of the four boundary facilities. Three SCM IOPS, each lasting for three weeks, are now
conducted each year. Spring and summer SCM IOPS are scheduled annually, while fall and
winter SCM IOPS alternate between years. Single-column model IOPS are scheduled for
June-July and September-October 1997. Other IOPS will be going on during these two SCM
periods, including the U.S. Department of Agriculture (USDA)/National Aeronautics and Space
Administration (NASA) SGP ’97 (Hydrology) IOP in the summer and the ARM Fall 1997
Integrated IOP. See Sections 5.1 and 5.2 and Table 4 for more details.
During the last six-month period of 1996, the 915-MHz profilers with radio acoustic
sounding systems (RASSS) were successfully deployed at locations between the central and
boundary facilities; these locations are known as intermediate facilities. These profilers will
enhance the boundary layer monitoring across the SGP CART site.
A unique opportunity to supplement the existing CART instrumentation was proposed by
the SST and has been funded by the Global Energy and Water Cycle Experiment (GEWEX)
Continental-Scale International Project (GCIP), housed within the National Oceanic and
Atmospheric Administration (NOAA) Office of Global Programs. This support has permitted
sensors for the profiling of soil water and temperature systems (SWATSS) to be installed at the
central facility and the extended facilities during the last six-month period, with the network
essentially completed in the spring of 1997. These additional sensors will support water and
energy budget analyses, diagnostic studies, and model validation efforts of ARM and GCIP
investigators.
Operation of the radiometer calibration facility (RCF) has started, with personnel from
the National Renewable Energy Laboratory (NREL) currently performing most of the work,
assisted by site operations personnel. Although plans for overall operation of this facility are
being formulated, successful calibration was first carried out in September 1996. Routine

6
operations of the RCF are expected to be implemented during this period, with another
calibration beginning in June 1997.
The emphasis on deployment in this six-month period will be on the split of the solar and
infrared radiation observing system (SIROS) into a solar and infrared station (SIRS) and a
multifilter rotating shadowband radiometer (MFRSR) at each of the extended facilities and on
the new radiometers at the central facility. The number of radiometers to be installed at the
central facility led to an expansion of the central cluster and a new area called the optical trailer
cluster, which is located south of the optical trailer and north of the central cluster. Priority
instruments to be installed during this time period include the time-lapse cloud video (TLCV),
the rotating shadowband spectrometer (RSS), and the ground radiation measurement system
(GRAMS) in the optical trailer cluster, and the Cimel sunphotometer (CSPHOT) in the expanded
southern area of the central cluster. All, but the SIROS split will be completed before the Fall
1997 Integrated IOP.
The phased implementation of the Okmulgee extended facility (the wooded site) has
begun. The walk-up tower, shelter, and infrastructure are expected to be in place during this
period. In addition, a Memorandum of Understanding with the USDA in support of GEWEX
studies will allow the costs of installation to be shared with ARM for phased implementation and
completion of a fully instrumented extended facility at El Reno during this six-month period.
This energy balance Bowen ratio (EBBR) site will be used in support of the GEWEX studies. A
solar-powered EBBR and SWATS with cellular phone data communications have been installed
temporarily in support of the Hydrology IOP.
The IDP millimeter cloud radar (MMCR) is expected to become a CART instrument
during this six-month period. It was successfully tested during a validation IOP during the
period of April 2-22, 1997. In addition, four Vaisala 25-km ceilometers and
four atmospherically emitted radiance interferometers (AERIs) are expected to be installed at
boundary facilities this fall. A single AERI, the first of four, will be installed at the Purcell
boundary facility. The disposition of the eddy correlation (ECOR)-based Ft. Cobb is yet to be
determined. Establishment of one auxiliary facility will be needed to accommodate the
installation of a second day-night whole-sky imager (WSI),
In addition, one office trailer is expected to be added to the compound area of the central
facility, and a phased implementation of IDP No. 4 and storage area will begin at the area

7
formerly occupied by the abandoned farmhouse at the extreme southeast corner of the central
facility. This area is expected to be minimally operational by the Fall 1997 Integrated IOP.
Finally, a master’s-degree-level on-site scientist will be hired and will reside full time at
the central facility during this period. The primary function of this position is to support the SST
data-quality-modules development activities and also to provide assistance to site operations
functions that may improve the overall quality of the data streams generated at the SGP CART
site.
In summary, our goals for this six-month period continue to be to provide the Science
Team with a suite of measurements that will support a wide range of research, to establish solid
procedures for instrument calibration and maintenance (particularly for broadband radiometry),
to operate the series of QMEs, to provide input for the GVFAS, and to install required
instrumentation and facility support. Quality assessment efforts are central to the success of the
entire program. Section 4 further describes this emphasis.

8
3 ROUTINE SITE OPERATIONS
3.1 Overview
The overwhelming majority of the measurements with the highest priority, on which the
existing experimental designs are based, are regular (i.e., routine) observations, as specified in
the ARM Program Plan, 1990 (U.S. Department of Energy 1990). Scientifically and
logistically, routine operations will also serve as the basis and background for all nonroutine
operations, including instrument development activities, IOPS, and collaborative campaigns
directed toward obtaining difficult-to-gather or expensive in situ data. Consequently,
development and validation of the basic observations remain high priorities. Site development
has progressed sufficiently to support IOPS addressing key scientific questions. The IOPS are an
opportunity to provide more focused data sets to the Science Team and the scientific communit y
at large.
The SST will continue to work to ensure the scientific productivity of the site by
providing guidance to the site operations manager and his staff on scientific matters related
instrument performance via the quality of the data stream, by answering questions from
to
operations personnel concerning potential instrument problems, by reviewing schedules and
procedures for instrument maintenance and calibration, by reviewing designs for infrastructure
supporting new instruments, by contributing to the design of the standard operating procedures,
by reviewing and developing plans for IOPS, and by helping to obtain near-real-time data
displays for IOPS. The SST, in cooperation with instrument mentors and the DSIT, will continue
to lead the data quality assessment effort at the CART site, an ongoing activity that includes
monitoring of the CART data streams in collaboration with the staff at the central facility and the
development of data quality performance metrics and graphical tools that will address the data
originating at the SGP site. A special focus during this six-month period will continue to be on
shortwave radiation data or anticipation of the Clouds and Earth’s Radiant Energy System
(CERES) launch in August 1997. These activities are discussed in more detail in Section 4 of
this report.
Routine operations are considered to be the activities related to the operation and
maintenance of instruments, the gathering and delivery of the resulting data, and the planning for
scientific investigations, including IOPS, campaigns, and QMEs. Although the site is essentially
complete, instrumentation will be evaluated continuously to assess the need for possible
elimination of instruments or replacement with updated or new sensors. The process that leads
9
to implementation of CART instruments continues to be the Pre-Readiness Review (PRR). The
PRR includes the identification of requirements for instrument design and installation and the
development of the documentation, procedures, and training needed to maintain CART
instrumentation and integrate data streams into the site data system (SDS). The PRR also
provides a forecast of when these instruments will be fully operational (i.e., operational handoff
to site operations via the Operational Readiness Review [ORR]) and delivering data to the
Experiment Center and the Archive.
The design expectation for the routine operation of instruments is that they will require
servicing by site operators only once every two weeks. The exception to this is the central
facility and the boundary facilities, which are staffed. If an instrument fails during a two-week
period at an extended facility, data streams could be lost, although every effort is made to ensure
adequate data-logging capacity at each remote site. Such loss of data is unfortunate but deemed
acceptable to the ARM Program because of manpower and budget constraints. The data
collected at all extended and boundary facilities by the end of this period are expected to be
polled frequently each day by the SDS at the central facility and then packaged and delivered to
the Experiment Center and the Archive once daily. The Experiment Center generally delivers
data to Science Team members and other data requesters once weekly via an Experimental
Operations Plan (EOP).
Site operations staff conduct instrument triage during IOPS and campaigns. The triage
plan calls for IOP scientists to identify instruments, individual sensors, and communication links
that are critical to the operation and goals of the IOP so that these instruments will receive more
frequent servicing than that prescribed by routine operational requirements mentioned above.
The priority of triage efforts is determined by the SST and IOP scientists and the site program
manager, who take into consideration the scientific importance of a particular data stream and its
expense. The triage plan has been very successful, as demonstrated during the recent IOPS for
the ARM Enhanced Shortwave Experiment (ARESE), for the Subsonic Aircraft: Contrail and
Cloud Effects Special Study (SUCCESS), and for the f~st Water Vapor IOP. The triage plan
will continue to be an ongoing effort during IOPS in the upcoming six months.
Handling of instruments that must be returned to the vendor for calibration and servicing
is also part of routine operation. Replacement instruments and sensors will be rotated regularly
to meet these requirements. Calibration and maintenance information is being compiled by the
SST in conjunction with the site program manager, site operations manager, and instrument
mentors in order both to properly operate and maintain site instruments and to provide pertinent

10
information to data users. Changeouts of all sensors and instrumentation are recorded in the site
operations log.
The initial checks on data quality after instrument installation are provided by the
instrument mentors. After the mentor reviews the data stream to ensure that the acquired
instrument is performing properly and that the data are identified accurately by the Experiment
Center, the mentor approves a “beta” release of the data. The beta release provides data to
selected Science Team members who have requested them and are willing to work with the
instrument mentor on data quality issues. Beta releases are established after the instrument
mentor and an appropriate member of the DSIT create a general statement on data quality for the
Experiment Center. Beta releases are also available to other Science Team members who are
willing to work in conjunction with the instrument mentor. When the data quality relative to
proper instrument functionality is consistently acceptable and well documented, the mentor
approves a full release of the data.
3.2 Routine Operations
3.2.1 Functional Instruments and Observational Systems
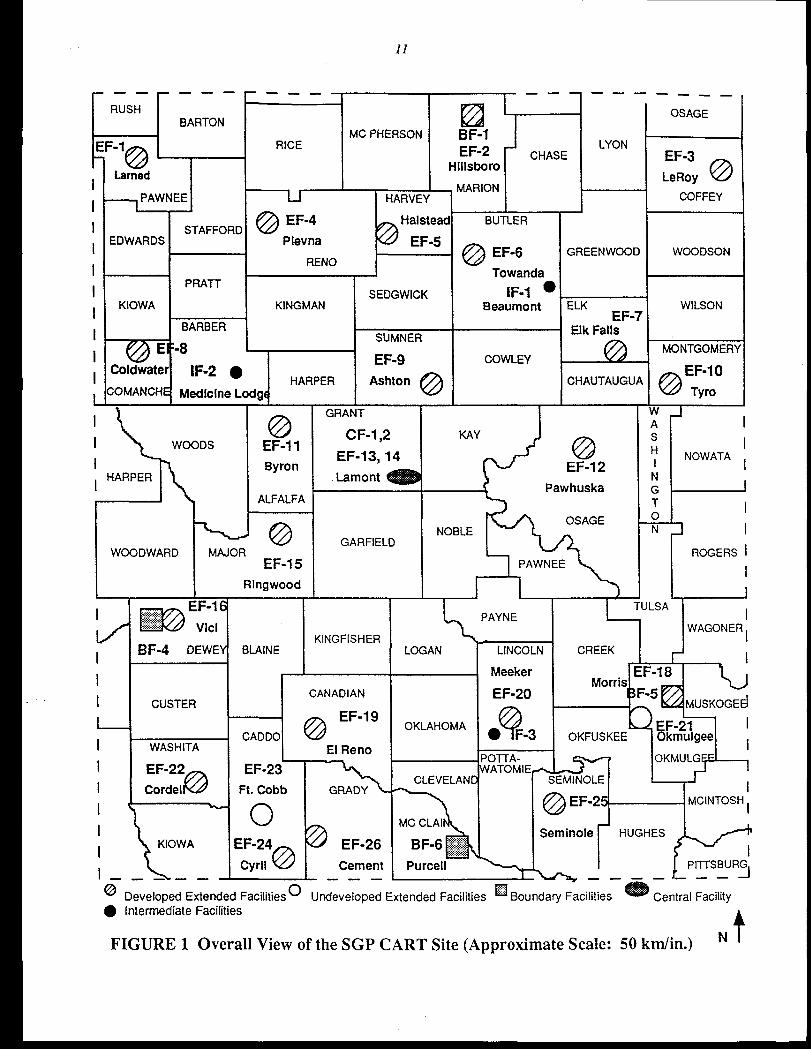
Figure 1 is a map of the SGP site showing the locations of the developed extended,
intermediate, and boundary facilities. The status of the systems and instruments anticipated by
December 31, 1997, is summarized in Table 1.
Accomplishments in the area of site development are most evident at the central facility
(Table A. 1 in the Appendix), with its functioning power, fiber-optic infrastructure, and near-
complete array of instruments. Of the 26 planned extended facilities (Table A.2 in the
Appendix), 22 (including one at the central facility and one at the Cement location) are
operational at the beginning of this period, two (Okmulgee, the wooded site; and El Reno) are
expected to be operational by the end of this six-month period, one (Ft. Cobb) is yet to be
identified, and one is a placeholder site for possible expansion, if required.
In addition, ARM is developing a mission critical database (metadata) that will make it
possible to provide a common location for all information (other than instrument data streams)
that enhances the scientific utility of the individual instrument data streams. Any information
11
M—————
RUSHBARTON
-— __
I~——l— —
IzzlBF-IEF-2
HillsboronCHASE-u-L-MCPHERSON
RICE
HARVE
F’-’’”IT LYON
=BUTLER
@EF-6Towanda
BeaI!~jnt ●
GREENWOOTPAWNEE
STAFFOR[:DWARDS
PRATT’
KIOWA
BARBER
0 EF-4
L
Halsteat
Plevna EF-5RENO
I
I
I
I
I
I
L
I
I SEDGWICKKINGMAN ELK
.
Elk Falls
G
CHAUTAUGL
t-==---
7E -8
Coldwater IF-2 ●
/HARPER
:OMANCH Medicine Lodg I ‘s”on @
~ EF-9 I COWLEY
1 ,
@
GRANT
EF-11C’-l,2EF-13,14
ByronLament _
I
KAY
d@E’-l2
HARPER 1/ /’ PawhuskaI \
@ GARFIELDWOODWARD MAJOR I‘OBLEWAGE
EF-I5Ringwood
m
EF-1d“<;.::~.~.;*::,,,z:::S?WVici
BF-4 DEWEYKINGFISHER
BLAINE
I ] PAWNEE \
II
1I
+
CREEK
-+
Morris
OKFUSKEE
~:MINOLE
I
I./I
I
I
I
I
%PAYNE
‘“AN 7-==-
OKLAHOMA1?● F-3
@
~ m rEF-2MC CLAI
Seminole HU~~_6 ~~.::f.&,::*
Purcell ““”——.—.
@ Developed Extended Facilities o Undeveloped Extended Facilities IZ!I-QBoundary Facilities● Intermediate Facilities
FIGURE 1 Overall View of the SGP CART Site (Approximate Scale: 5(

12
TABLE 1 Instruments and Observational Systems Anticipatedat the Central, Boundary, Extended, and Auxiliary Facilities
on December 31, 1997~
CentralFacility
RadwmetricObservationsAERIAER1 xSORTIEmsBSRN
Pyranometer(ventilated)Pyranometer(ventilated,shaded)Pyrgeometer(ventilated,shaded)NIP on trackerMFRSR
MRS (formallySIROS)Pyranometer(ventilated)Pyranometer(ventilated,shaded)Pyrgeometer(ventilated,shaded)NIP on trackerPyranometer(upwelling,abovepastureat 10m)Pyrgeometer(upwelling,abovepastureat 10m)
MFRSRMFR (upwelling,abovepastureat 10m)Pyranometer(upwelling,abovewheatat 25 m on 60-m tower)Pyrgeometer(upwelling,abovewheatat 25 m on 60-m tower)MFR (upwelling,abovewheatat 25 m on 60-m tower)CSPHOTRSSGRAMSSws
Wind,Temperature,andHm”ditySoundingSystemsBBSS915-MHzprofilerwithRASS50-MHzprofilerwithRASS
Heimarn IR thermometerRamanlidar
Cloud ObservationsWSI (daytime/night[ime)BLC (interim)MPL (IDP)ceilometerMMCRVceilTLcv

13
TABLE 1 (Cont.)
OthersTemperatureand humidityprobesat 25-mand 60-m levelson towerHeat,moisture,and momentumflux at 25-mand 60-m levelson towerEBBRECORSMOSAOS (samplesat 10m)RCF
Extended FacilityComponents
SIROSPyranometer(ventilated)Pyranometer(ventilated,shaded)Pyrgeometer(ventilated,shaded)NIP on trackerMFRSRPyranometer(upwelIing,at 10m)Pyrgeometer(upwelling,at 10m)
EBBR or ECORSMOSSWATS
AuxiliaryFacilities
None in preparation
Boundary Facilities
BBSS
BFVceil
IntermediateFacilities
915-MHzprofilerandRASS
a AERI,atmosphericallyemittedradianceinterferometer AOS, aerosolobservationsystem;BBSS,balloon-bornesoundingsystem;BFVceil,boundaryfacilityVaisalaceilometenBLC, BelfortlaserceilometefiBRS,broadbandradiometerstation;BSRN,BaselineSurfaceRadiationNetwork;CSPHOT,Cimel sunphotomete~EBBR, energybalanceBowenratio;ECOR,eddy correlation GRAMS,groundradiationmeasurementsystem;IDP,InstrumentDevelopmentProgram;IR, infrarw MFR, multifilterradiometefiMFRSR, multifilterrotatingshadowbandradiometer;MMCR,millimetercloudradr, MPL, micropulselidar;MWR,microwaveradiometer NIP,normal-incidencepyrheliometer;RASS, radioacousticsoundingsystem;RCF, radiometercalibrationfacility; RSS, rotatingshadowbandspectrometerSIROS,solarand infraredradiationobservingsystem;SIRS,solarandinfraredstation;SMOS,surfacemeteorologicalobservationstation; SORTI,solar radiancetransmissioninterferometer SWATS,soil waterandtemperaturesystem;SWS,shortwavespectrometer TLCV, time-lapsecloudvideq Vceil,VaisalaceilometeuWSI, whole-skyimager.
14
that improves the scientific utility of the data is available at the ARM metadata WWW site:
http://www.db.arrn. gov/ARM/MDS/mds. html .
Currently, such information only includes the site operation logs and maintenance records.
Considerable interaction will take place within the ARM infrastructure during this six-month
period to integrate other ARM Program databases.
3.2.2 Launch Schedule for Balloon-Borne Sounding Systems
Until the full suite of remote sensing systems is deployed to perform deep, detailed
soundings of the wind, temperature, and moisture of the troposphere under a wide range of
conditions, the BBSS will continue to be an expensive workhorse owing to the cost of the
expendable and manpower associated with an ambitious schedule of radiosonde launches. The
number of BBSS launches sitewide may eventually be reduced to a minimum needed to support
routine cross-checks on the remotely sensed measurements. The frequency of routine launches
at the central facility during this six-month period will be the same as in the previous six months.
Routine operations (see Table 2) will include five daily launches at the central facility and one
daily launch at each of the four boundary facilities.
The current routine radiosonde launch times at the central facility were chosen to
facilitate instantaneous radiative flux (IRF) and lDP research, and the launch times at the
boundary facilities were chosen to support the microwave radiometer (MWR) and the nearby
NOAA 404-MHz profilers with their recent or imminent RASS deployment and to complement
the wider network of National Weather Service (NWS) radiosonde launches. Remote sensing of
virtual temperature profiles at all boundary facilities is provided by the nearby NOAA profilers,
which are being outfitted with ARM-provided RASS units. The RASS units have already been
installed at the Purcell, Oklahoma, and at the Haviland, Kansas, NOAA profilers. The Lament,
Oklahoma, NOAA profiler will not receive a RASS unit because it would be located too close to
a residence, but the nearby SGP CART site central facility collects a relative abundance of
thermodynamic data. In addition, global positioning system (GPS) instruments were recently
installed at the Purcell, Vici, Morris, and Hillsboro NOAA profiler locations to provide estimates
of precipitable water. This information is expected to become available to the ARM Program
during this period as external data, along with the NOAA profiler data.

15
TABLE2 Radiosonde Latmch Schedule
for July l-December 31,1997 (Times in UTC)a
Central Facilitv Boundarv Facilities
S(X and l?ydrology IOP Operations, July I-,luly 18; andthe Fall 1997 Integrated IOP Operations,September 15-October 3, Monday-Sunday
03000600
12001500180021002400
03000600090012001500180021002400
Routine Operations, July 19-September 14 and October 4-December 31, Monday-Friday
060012001500 180018002100
a IOP, intensiveobservationperiod;SCM, single-columnmodel;UTC,universaltimecoordinated. Launch timeis 30 min earlier the statedtimerepresentsthe approximatemidpointof the flight.
The four boundary facilities routinely launch radiosondes once daily at 1800 universal
time coordinated or noon local time. Boundary facilities will continue to be staffed only during
the period of 1030-1430 local time, Monday through Friday (including holidays). During
appropriate IOPS, the boundary facilities will be staffed 24 hours per day for 21 consecutive days
(including holidays) to facilitate releases every 3 hours (Table 2).
The central facility will be staffed from 0430 to 1630 and from 2230 to 0230 local time,
Monday through Friday (including holidays). During SCM IOPS, the central facility will be
staffed 24 hours per day, 7 days per week (including holidays), to facilitate round-the-clock
radiosonde releases every 3 hours. Hours vary for other IOPS or campaigns, depending on the
operational requirements for the central facility.
3.3 Instruments
A CART instrument is any instrument that is approved by the ARM Program and for
which the site operations management has accepted responsibility for operation and
maintenance. The PRR and ORR forms are requests for information that facilitates the
installation and operation of instruments or facilities at the SGP CART site. The purpose of
these reviews is to achieve an efficient handoff of instruments and facilities from instrument
mentors to site operators. Figure 2, the SGP CART instrumentation implementation flowchart,
contains information obtained from the PRR and ORR documentation. When all procedures,
operation manuals, and training pertaining to an instrument have been completed, the instrument
is accepted by the site operations management. If sufficient documentation is available to
operate an instrument, even though more will ultimately be required for full acceptance, the
instrument may be operated in a degraded mode.
Once site operations personnel have accepted instruments, their design and configuration
are “locked in” by using a configuration management system that is controlled by site operations.
Any modifications to instruments or data systems require a baseline change request (BCR). The
BCR process has been upgraded to a secure Web-based system. A request for a change is an
E-mail narrative of the issues and potential impact. Such requests usually come from the
instrument mentors. The site program manager is the control for the BCR process and assigns
infras@ucture for review and approval. Those participating in the review and approval process
are provided with passwords to gain access to the BCR database.
Instruments recently installed or expected to be installed include the following:
● Millimeter Cloud Radar, Installed. Installation of an MMCR was completed
in December 1996 and passed on-site tests. During April 1997, a Cloud Radar
IOP was held. Development of ingest routines is a high priority, and
considerable documentation has been developed and received by site
operations for review.
● Soil Water and Temperature Systems for Measuring Vertical Profiles of Soil
Water Content and Temperature (a Joint Venture between GCIP and ARM),
Installed at Existing Extended Facilities. Data ingest and delivery to the
Experiment Center are expected to be completed during this summer.

PRR m Site program manager (S PM) initiates processand sends blank PRR checklist and
PHASE & deployment schedule model.
v Mentor completes draft information
m~”~)~ZZ5e?
SPIM(GFGR Eng.)
on PRR
SPM distributes mentor’s
draft PRR checklist andschedule for review and
7comments. SPM collectsand consolidatescomments.
Mentor reviews andresponds to reviewcomments and sends
final PRR checklist andschedule to S PM.
DESIGNPHASE
P
SITE INTEGRATION >DRAFT DESIGN
FacilitiesPower
Building modificationsShelters
Site data system (SDS)
CommunicationsDa~ n /
DESIGN REVIEWI
SITE INTEGRATION?
FINAL DESIGN
Facilities
PowerBuilding modifications
SheltersSDS
Communications
Products includeEngineering drawingsStatements of work, if requiredMaterials list
Communications and data
ingestion design
ParticipantsSPM
DSITSite operatiorrs
Site developmentIT leader “
Products includeEngineering drawingsStatements of work, if requiredMaterials listCommunications and data
ingestion design
I
I
I)ESIGN‘HASECont.) 1
‘FACILITY PREPARATION
ConstructionPower installationData communication
I
INSTRUMENT
INSTALLATION
6JITIAL CHECKOUTInstrument tests and SDS data
ORRPHASE
EOPERATIONSTRAINING
Validate operations and
maintenance documents
OPERATIONS TEST,QJD EVALUATION
QOPERATIONS
READINESS
REVIEW
-
/l&No Yes
DEGRADED-
MODE FULL
OPERATIONS HANDOFF
FIGURE 2 SGP CART Instrumentation Implementation Flowchart

18
● Extra High-Resolution AERI X, Installed. A need was stated during early
phases of CART planning to have at least two IR interferometers running
routinely at the central facility. Two systems were said to be needed to
improve evaluation of the uncertainties of the radiance observations. Because
the AERI X has a resolution about 10 times greater than the AERI and would
provide the best available emission observations for comparison with
line-by-line calculations, it could be considered an enhancement or new
observation, in addition to contributing to completion of the site
instrumentation. The high-resolution system provides a more independent
check of radiance readings than would a second AERI of standard resolution
because a different type of interferometer is used. A prototype AERI X has
run successfully at the central facility on several occasions. Acquisition of an
AERI X for routine operation at the central facility became a reality in early
1997, and data monitoring continues.
* Addition of Rain Gauges at Six SWATS Locations Where No Su#ace
Meteorological Observation Station Exists, Installed. These rain gauges are
needed in proximity to SWATS to learn more about the flux of water from the
near-surface atmosphere through the layers of soil measured by SWATS for
realistic soil water balance estimations. The data are necessary for
determining soil moisture characteristics for distributed surface models and
for building empirical relationships between soil water status and surface
energy and water partitions. Studies have shown that antecedent precipitation
is a dominant cause of spatial variation in surface exchanges across a wide
area like the CART site, working its way through into a convective response
in the atmosphere, perhaps influencing cloud formation. This work was
completed in early 1997.
● Temperature and Humidity Observations on the 60-m Tower, Installed. An
additional level of temperature and humidity observations was added at the
25-m level of the 60-m tower at the central facility. As a result of the Water
Vapor IOP in September 1996, improvements in selection, handling, and
calibration of sensor elements have been implemented. Additional
temperature and humidity sensors for both the 25-m and 60-m levels have
been installed.
19
● Improved Solar and Infrared Radiation Observing System Data Logging at
Extended Facilities, in Progress. New data loggers and associated data
equipment have been acquired to provide an independent data logger for the
non-MFRSR components of SIROSS and for the central facility Baseline
Surface Radiation Network (BSRN). The new platforms will be named SIRS
and broadband radiometer station (BRS) for “solar and infrared station” and
“broadband radiometer station,” and the MFRSRS will have independent
“MFRSR’ platform names. A schedule for implementation calls for
conversion to be completed by August 1997, but this scheduled date will
likely be pushed back until later in 1997. The new SIRS platform is expected
to have considerably greater reliability than that achieved with the MFRSR-
logger-based platform, and the computations will allow data capture that
meets international standards.
● Radiometer Calibration Facili~, Installed. During the first six-month period
of 1996, the construction of the RCF was completed. Fully operational, the
facility includes a calibration deck; a site reference cavity radiometer a
program reference cavity radiomete~ a site working-standard cavity
radiomete~ automatic solar trackers for direct and diffuse solar
measurements; reference diffuse pyranometers; working-standard
pyranometers, pyrheliometers, and pyrgeometers; and computer hardware and
software support. The RCF will greatly aid the ARM Program in its ability to
collect the best radiometric data possible. The fiist Broadband Outdoor
Radiometer Calibration (BORCAL) was held successfully at the RCF in
September 1996, and the second will take place in July 1997.
● Time-Lapse Cloud Video, in Progress. Implementation of a video camera and
reflector to obtain time-lapse video views of cloud conditions above the
central facility is taking place. The instrument for this TLCV is expected to
be installed in the optical trailer cluster and become operational this summer.
● Cimel Sunphotometer at the Central Facility, in Progress. A CSPHOT is
being acquired for installation at the central facility. The CSPHOT will
provide measurements of aerosol optical depth to supplement the MFRSR and
to tie in with a global network of each sunphotometer supported in part by
NASA. In addition to measuring optical depths, the system will be used to

20
observe the sky radiance along the solar almucantar and along the solar
principal plane, including the solar aureole. The resulting data can be used for
research on inferring aerosol size distribution and the scattering phase
function. This instrument is expected to be installed in the expanded central
cluster and become operational this summer.
● The UV-B and Photo~nthetically Active Radiation Sensors, in Progress. A
set of sensors and a data logger have been acquired to measure the
downwelling hemispheric solar radiation in the ultraviolet B (UV-B) and
photosynthetically active radiometer (PAR) bands at the central facility.
Making these observations is an efficient means of increasing collaborations
with other programs. Implementation has been delayed because of the
potential need to include additional relatively simple sensors to this platform
(e.g., a transmissometer). These sensors are planned to be installed in the
central cluster.
* Narrow-Field-of-View Zenith Sky Radiance in the Near Infrared, in Progress.
An uplooking near-IR shortwave radiance instrument with a field of view
overlapping or nearly coincident with the MWR and possibly the cloud radar
is being developed. The wavelengths detected are in a fairly narrow band near
0.9 pm. Such a device is needed to improve understanding of the
relationships between the liquid water path and shortwave radiation.
● Ground Radiation Measurement System, in Progress. The design and
assembly are underway. Two sets of GRAMS sensors will be used, one for
installation at the optical trailer cluster and the other on the deck of the RCF.
Each set has a total shortwave broadband radiometer (TSBR), a fractional
solar broadband radiometer (FSBR), and a total direct diffuse radiometer
(TDDR). Both sets will be installed this summer.
* Optical Transmissometer, in Progress. A commercially available
transmissometer will be acquired to detect fog, dust, and drizzle too light to be
recorded by rain gauges. Such phenomena are best detected by open-path
devices rather than through a large sampling stack such that as being used
with the aerosol observation system (AOS). The data will be useful for
evaluation of signals from radars, lidars, and the MWR.

21
“ Establishment of Instruments at an Extended Facility at a Forested Site, in
Progress. A walk-up scaffolding tower (approximately 55 ft) for supporting
an ECOR system, a surface meteorological observation station (SMOS), and a
SIRS above the forest canopy at the Okmulgee extended facility is being
acquired. Phased implementation will begin with the installation of an access
road, power, and the walk-up tower this summer. This site may not be fully
operational until spring 1998.
● Ceilometers and AERIs at Boundary Facilities, in Progress. Four Vaisala
ceilometers have been acquired for installation at the boundary facilities this
year. These ceilometers are capable of detecting cloud base to a height of
about 7.5 km. These ceilometers are intended primarily to provide data for
algorithms to retrieve temperature and humidity profiles in the lower
troposphere from AERI data. Delivery and phased installation of the AERIs
are to begin with the first AERI installed at Purcell this fall.
● Solar Spectral Radiometer, in Progress. A field spectroradiometer system for
wavelength ranges of 350-2,500 nm in three wave bands is being acquired.
Initially, only global radiation will be detected. Installation is expected this
summer.
“ Occasional Tethersonde and Kite Measurements of Humidity Profiles at the
Central Facility, in Progress. A tethersonde system and a kite system
outfitted with a high-quality humidity sensor repeatedly made measurements
of temperature and relative humidity profiles in the lower 1 km of the
atmosphere above the central facility during the Water Vapor IOP in
September 1996. These systems will be used in future IOPS.
● Upgrades of the Radiosonde System, in Progress. Steps have been taken to
upgrade the CART BBSSS to use GPS-based rather than loran-based tracking
for determining position, which will be necessary during the next few years as
Loran-C transmitters are phased out. In addition, a new type of Vaisala
radiosonde, which uses the RS-90 sonde instead of the RS-80 version
presently used, is expected to become available within a year. The humidity
sensor on the RS-90 sondes is reported to have a faster response and to
recover more quickly after emerging from clouds. The temperature sensors
22
are smaller and thus probably considerably faster in response and less
susceptible to the effects of heating by solar radiation. In addition, reference
temperature, humidity, wind, and pressure sensors (THWAPSS) were installed
at the balloon launch site at the central facility to provide surface reference
values. A THWAPS will be installed at each of the boundary facilities during
this six-month period.
● Rotating Shadowband Spectrometer, in Progress. An INS was tested at the
SGP central facility during the fall of 1996 after extensive development and
testing at the Atmospheric Sciences Research Center (ASRC) at the State
University of New York. Steps are being taken by ASRC and site operations
to implement the RSS on a long-term basis at the SGP central facility, to
measure the solar spectrum between approximately 350 and 1,050 pm for the
direct, diffuse, and global components. Installation is expected during the
summer of 1997.
Measurement issues currently being considered but unresolved by the ARM
infrasu-ucture include the following:
“ Continuous Direct-Beam Solar Irradiance Measurements with a Cavity
Radiometer. Documentation for the BSRN specifies that an all-weather
windowless cavity radiometer be operated at the BSRN site. This task is not
feasible at the SGP CART site central facility because of dust conditions.
Operation of a windowed cavity radiometer, one of which has already been
purchased for this purpose, might be possible at the RCF, but considerable
effort would be necessary for continuous operation. Some compromise for
part-time or discontinuous operation might have to be developed.
● Absolute Solar Transmittance Interferometer and Solar Radiance
Transmission Interferometer. Support of absolute solar transmittance
interferometer (ASTI) development is occurring in the IOP mode for the
shortwave portion of the Fall 1997 Integrated IOP. Solar radiance
transmission interferometer (SORTI) implementation at the central facility is
proceeding. Data are being collected, but ingest has not been achieved.

23
● Local Observations of Sutj$aceVegetative Conditions at Extended Facilities.
The interpretation of data on, and the modeling of, surface latent and sensible
heat fluxes at extended facilities would be assisted with routine observation of
leaf area index and surface optical reflectance properties represented by the
nondimensional vegetative index. Local leaf area index measurements might
be too variable to be of much use, but local measures of nondimensional
vegetative index were believed to be particularly important for interpretation
of nondimensional vegetative index values derived from remote sensing data
from satellites. The satellite could.then be used to help infer the values and
variability of surface heat fluxes for the overall SGP CART site. Relatively
simple devices that obtain a measure of nondimensional vegetative index can
be obtained at a modest cost and are currently being investigated.
● Additional Extended Facilities at the SGP CART Site. Some concern has been
expressed that the spatial coverage of extended facilities for measuring air-
surface exchange rates of heat and moisture seems to be incomplete,
particularly to the south and southeast of the central facility. A review of the
current site distribution needs to be carried out.
● Su#ace Bidirectional Reflectance. Measurements of surface bidirectional
reflectance have been suggested at times for the SGP CART site, and a
commercial source of the portable apparatus for rapid acquisition of
bidirectional observations of the land and the atmosphere (PARABOLA) is
available. Such an observation would be quite useful in the interpretation of
solar reflectance seen from satellites. A commercial system is available but
is not suitable for routine observations. Currently, a new Science Team
project is addressing this observational need.
● Profiling with Passive Microwave Systems. A passive MWR for obtaining
profiles of temperature through clouds could augment or supplant profile
measurements made with the AERI at the boundary facilities. The primary
advantage of microwave profiling is that it penetrates through clouds, which is
not accomplished with any of the water vapor remote sensing systems
currently in operation at the SGP CART site. Radiometries has been
developing such a radiometer. Vertical resolution appears to be about 100 m
near the surface and increases gradually to over 2 km at a height of about
24
10 km near its maximum range. A less expensive Russian system with
slightly greater vertical resolution and a maximum range of about 600 m is
currently being evaluated. If funding were provided, a passive system for
water vapor profiling might also be successfully developed.
3.4 Observations, Measurements, and External Data
The ARM observations being delivered to the Experiment Center from the SGP CART
site as of June 30, 1997, can be found cm the WWW at
http://www.ec.arm. gov/data/sgpmeasurement.html ,
External data being delivered to the ARM Program can be found on the WWW at
http://arrn3.das. bnl. gov/sisg/ext.html
The availability of data from a particular platfomn on any given day is a function of quality
control, with some segments temporarily unavailable during evaluation or correction of
problems.
A summary that includes both the measurements derived from the SGP CART data and
data streams from sources external to ARM (e.g., the gridded data from the National Centers for
Environmental Prediction model [ETAI) can be found on the WWW at
http://www.ec.arm. gov/data/sgpavailability .html .
3.5 Site Development Activities
3.5.1 Facilities
Full implementation of the El Reno extended facility will not take place until after the
Hydrology IOP, pending the approval of a Memorandum of Understanding between Argonne
National Laboratory and the USDA. A temporary setup of a solar-powered EBBR and SWATS
with cellular phone data communications is in place for this IOP.

25
Implementation of the Okmulgee extended facili& willt&e place in fivephases. The
first will bean access roadway and power. The second will be the installation of the walk-up
tower. The third phase will include the installation of the infrastructure (cement pads, data
communication lines, gravel, etc.). The fourth phase will be the installation of the shelter and
security fence. The fifth phase is the installation of the instruments. Full implementation is not
expected until the end of this six-month period.
The number of radiometers to be deployed at the central cluster has required expansion
and an additional area designated as the optical trailer cluster. Instruments critical to the Fall
1997 Integrated IOP will be installed and operational therein August 1997. They include the
GIU4MS, TLCV, RSS, and CSPHOT. In addition, the ultraviolet A (UV-A), UV-B, and PAR
sensors will be located on one of the spare posts in the SIROS array. A narrow-field-of-view
zenith-pointing filtered radiometer (NFOV) will be deployed near the EBBR. The shortwave
spectrometer (SWS) and the ASTI will be considered for installation in the optical trailer. Each
of the cluster areas has been upgraded to allow for expansion of yet unspecified instruments.
In anticipation of additional IDP area facilities, IDP No. 4 is being implemented. This
150-ft x 175-ft graveled area will be located at the site formerly occupied by the farmhouse at
the extreme southeast corner of the central facility. This area will have a double-wide trailer
(24 ft x 55 ft) for storage and a 12-ft x 50-ft office trailer. This IDP area is anticipated to be
available for the Fall 1997 Integrated IOP.
3.5.2 Development of the Site Data System
Several of the installed instruments and all new instruments will require creation of
software to transfer the data from the instrument platforms to the SDS via a pathway referred to
as the integrated data processing circuit (IDPC). The IDPC includes communications between
the instrument and data loggers, as well as data ingest (described more fully in Section 4.1),
instrument status to site operations and others, and, finally, transmission of data to the
Experiment Center and the Data Archive. Usually, transfer of data is accomplished by coded
switches at the extended facilities and intermediate facilities or by T- 1 lines at the boundary
facilities. Most of the ARM SGP instruments have their data collected (or delivered) to the SDS
regularly, with data processed through the IDPC and passed onto the Experiment Center and the
ARM Archive, Some exceptions to this pattern will continue to occur during the next
six months.

26
The IDPC development schedule and status for instruments can be found at the WWW
site:
http://kombo.dis. anl.gov/armtrack ,
To access this database, log in as “guest”; and type in “guest” for the password, and specify
“IllPC” as type. Further work is being undertaken to facilitate routine operations and
particularly to assess instrument performance, by including a broader suite of data display
capabilities. Once the SDS is near completion, procedures for system management and
maintenance need to be written and transferred to site operations staff. In 1996, site operations
management hired a site computer systems administrator, who facilitates local SDS
development, operation, and maintenance.
In addition, the SDS continues to address the ongoing need to make near-real-time data
available for selected scientists during IOPS and campaigns and for educational outreach efforts
in conjunction with the Oklahoma Climatological Survey’s EARTHSTORM project. A
successful prototype system for delivering near-real-time data to scientists was used during the
Water Vapor IOP of September 1996. This Web-based system, known as the R1 or Research
System, has been formalized recently for use in future IOPS.
3.6 Limiting Factors
The most basic of limiting factors is the amount of resources available to continue site
development, expand operations, and provide necessary support for the IT and DSIT. Shortfalls
result in delays in implementation. Shortfalls in vendor supplies, delays in obtaining information
for PRRs, and budgeting problems have also been hindrances. Other significant limiting factors
are the time lags inherent in the procurement process and the calibration of radiometers before
installation, though the latter should be relieved by the presence of the new calibration facility.
All systems awaiting construction or installation go through a formal design review of
structural and mechanical systems. These reviews frequently identify deficiencies in plans and
drawings related to engineering requirements, procurement details, safety, and quality control.
This review activity was expanded to include large or complex IOPS (e.g., the ARESE IOP in
September 1995) in an effort to integrate the exceptionally wide variety of IDP instrument
support requirements for cost-effective and safe implementation. Neither construction nor
installation can begin until the design review process has been successfully completed.

27
The costs associated with BBSS launches (primarily expendable) will continue to be a
burden on the operations budget until these systems are replaced by continuous, unmanned
remote sensing systems, if ever. These expenses are a strong constraint on the total number and
frequency of launches, making impossible the routine provision of all of the requested launches
(eight per day at the central and boundary facilities), defined as the optimal sounding strategy for
SCM requirements by the DSIT (M. Bradley and R. CederWall, unpublished information).

28
4 DATA QUALITY
Data quality issues are addressed at several levels within the ARM Program and at the
SGP CART site. One of the goals of the ARM Program is to provide data streams of known and
reasonable quality. Maintaining data quality for a program of this size and complexity is a
significant challenge. Data quality assurance within the ARM Program infrastructure has
matured over the past few years and will continue to evolve, with the SST continuing to develop
the stronger role that it assumed during past years.
4.1 Instrument Mentors
Instrument mentors are charged with developing the technical specifications for
instruments procured for the ARM Program. The instrument mentor then tests and operates the
instrument system (either at his or her location or at the SGP CART site). In addition, the
mentor works with SDS personnel on ingestion software requirements as part of the IDPC. Data
ingestion involves the conversion of data streams to the International System of Units (S1), as
well as the acquisition of parameters that can be used to monitor instrument performance
(e.g., monitoring an instrument’s output voltage for a 5-V power supply or the continuity of the
wire in a hot-wire anemometer). Data collection and ingestion, then, are the focus of the first
level of data quality assurance. Quality at this level is monitored routinely by site operators and
instrument mentors.
The next level of data quality assurance involves beta release of data streams from
individual instruments. The mentor receives the data from the instrument to determine whether
the technical specifications of the instrument are being met. When the mentor is satisfied that
the instrument is functioning properly and that the technical specifications have been met, the
data are formally released to the Science Team and other data users. After this release, the
instrument mentor is also charged with reviewing the instrument data streams at least once every
two weeks, an action monitored at the Experiment Center. This information is forwarded to the
SST.
Instrument mentors also provide all operations and maintenance documents and lists of
spare parts to site operations. Typically, the mentor provides additional detailed documentation
and hands-on training so that appropriate support can be provided by site operators. This activity
is part of the ORR process.

29
4.2 Site Scientist Team
The SST helps to ensure that the scientific productivity of the SGP CART site is
maximized by both the routine and special (IOP) operations at the site. The SST acts as a
resource for the site operations manager and his staff on scientific matters related to instrument
data streams by doing the following:
● Fielding and answering questions from site operations personnel concerning
potential instrument problems
● Reviewing proposed instrument siting and deployment strategies, including
the needs of the instrument mentors and instrument requirements for IOPS and
campaigns
● Reviewing schedules and procedures for instrument calibration and
maintenance
● Providing an early assessment of suspected instrument or data problems
through the use of performance metrics, graphic display techniques, and data
quality research investigations, and distributing their findings so that
corrective actions can be taken
These activities require constant communication with site operations staff, including routine
visits to the central facility and occasional trips to extended, intermediate, and boundary
facilities. These activities are also highly coordinated with the site program manager and, when
appropriate, with instrument mentors and DSIT personnel. Ongoing focus activities of the SST
will contribute to the goals of data quality assessment for the SGP CART site and ensure that the
operation of the site meets, as nearly as possible, the overall scientific goals of the ARM
Program.
Recently, the SST placed an announcement to hire an on-site representative to help
perform first-line-of-defense quality data assurance, develop tools to perform data quality
assurance, perform data quality investigation research on problems that require special attention,
interact closely with the on-site operations manager and his staff at the central facility on all
science-related activities, help in the planning and operation of IOPS, and help conduct on-site
outreach activities. This newest member of the SST is anticipated to be on-site by summer.

30
In the past, data quality assessment efforts of the SST largely involved evaluation of
individual and multiple sets of data streams as needed, on an exploratory or developmental basis
(data quality investigations); participation in QMEs; and participation in the creation and
workings of the VAP Working Group.
Now that operational activities have shifted from deployment to support of ongoing,
continuous operation of a wide variety of instrumentation at many locations, a more
comprehensive, systematic data quality assessment effort has been undertaken by the SST. This
effort is manifested in several ways, including the evaluation of the calibration and maintenance
information, the development and use of automated, graphic display techniques for use by the
SST and site operators in daily monitoring of data quality (work began in October 1995), and the
development of performance metrics that systematically determine what percentage of the
collected data falls within given quality tolerances (work began in February 1996).
The development of performance metrics is aimed at systematically determining the data
“health” of the site via time series (numerical and graphic) of the metrics. The ultimate format of
this presentation is under development. In late 1996, the SST began issuing SIROS data
assessments with the goal of attaining quicker resolution of instrument and data quality
problems. In spring 1997, this weekly data quality assessment, currently available via E-mail,
was expanded to include all data streams, with input not only from the SST, site operations, and
instrument mentors, but also from DSIT staff, who look at VAP and QME performance and data
existence. Plans for this six-month period and beyond include development of graphic display
technique scripts for more data streams, the development of explicit guidance materials to allow
site operations staff to use the display techniques effectively, continued development of
performance metrics, and continued evaluating of the calibration and maintenance information,
with an eye on developing presentation formats for use by different groups such as site
operations and actual data users. Thus, with the assistance of the site operations staff and
instrument mentors, the SST will be able to serve the ARM Program goals better by laying a
foundation for improving data credibility.
Finally, a new ARM-wide initiative aimed at ensuring the quality of shortwave radiation
data began during the latter half of 1996. The backbone of this tracking system will be
performance metrics developed by the Site Scientist and SIROS instrument mentor and produced
and packaged in near real-time by the IX$IT. Components of this tracking system cover
10 measurement components: downward hemispheric flux, direct broadband component, diffuse
broadband component, direct spectral component, diffuse spectral component, optical depth, net

31
shortwave surface radiation, broadband albedo, spectral albedo, and calculated quantities (zenith
angle, effective top of atmosphere horizontal flux). Performance metrics for some of these
components already exis~ others do not. The hope is to have an analysis product up and running
by August 1997.
4.3 Value-Added Products and Quality Measurement Experiments
Unlike many other scientific projects, ARM collects data in an ongoing, continuous
manner. Because of the volume of these perpetual data streams, traditional case study methods
for analyzing these data are not very effective. To fit the need for an automatic analytical
approach, the concept of a VAP (value-added product) has been defined. A VAP creates a
“second-generation” data stream by using existing ARM data streams and inputs and applying
algorithms or models to them. A VAP is run continuously in the ARM Experiment Center, and
the output generated is treated as a new ARM data stream.
Many of the scientific needs of the ARM project are met through VAPS. Physical models
that use ARM instrument data as inputs are implemented as VAPS and can help fill some of the
unmet measurement needs of the program. A speciaI class of VAPS called QMEs compare
different data streams for consistency and allow for continuous assessment of the quality of the
ARM data streams. These data streams may come from direct measurements, measurements
derived from instrument observations via other VAPS, or model output that is currently created
by other VAPS,
New VAPS or suggestions of improvements or modifications to existing VAPS come
from all aspects of the ARM program: the Science Team, instrument mentors, the DSIT, the
Archive, the SST, etc. However, because of the limited resources available, VAP development
must be prioritized in a meaningful matter. To this end, the VAP Working Group was
established. This group consists of members of the infrastructure that crosscut the program, with
representatives from each of the major scientific areas of ARM. This group discusses the
scientific objectives of each VAP in the development queue, looks for common threads among
them, assigns priorities, estimates completion dates, and assists in the development of the VAPS.
The SST is represented on the VAP Working Group. Value-added products currently available
are given in Table 3. More information is available on the WWW at
http://www.am.gov/docs/resemch/vap_homepage/vap.html .

32
TABLE 3 Value-Added Products in Place at the SGP CART Sitea
Value-AddedProduct Description
LBLRTM Line-by-lineradiativetransfermodel; used for longwave and
QMEAERULBLRTM
QMEMWR/LBLRTM
QMEAERI/LBLCLOUDS
RWP TEMP
MWR PROF
Comparisonsof observed(MWR)vs. calculated(LBLRTM)
microwaveradianceat two frequencies
State-of-the-atmospheredata to facilitateQMEAERI/LBLRTM
analysis
Mergedand quality-controlledRASS virtual temperatureprofiles
Retrievalsof watervapor, liquid water,and temperatureprofiles from
a suite of ground-basedinstruments
Comparisonsof retrievedwatervaporand temperatureprofiles from
MWRPROF with BBSSprofiles
Retrievalsof temperatureandwater vapor fromthe AERI data
Comparisonsof retrievedwatervaporand temperatureprofiles from
AERI PROF with in situ measurements
QME MWR COL Comparisons of the MWR with an instrument performance model
QMEm PROF
AERIPROF
QMEAERIPROF
microwaveradiancecalculations
Comparisonsof observed(AERI)
longwavedownwellingradiation
vs. calculated (LBLRTM)
a AERI, atmosuhencallyemittedradianceinterferometer BBSS,balloon-bornesoundin~system;LBL, line byline; LBLRTM, line-by-line radiative transfer model; MWR, microwave radiometer; PkOF, profile; QME,quality measurementexperiment;RASS, radioacousticsoundingsystem; RWP, radar wind profiler; TEMP,temperature.

33
4.4 Problem Review Board
For a hi.rge data collection program, procedures must be in place to facilitate the
documentation of problems and their associated resolutions. The ARM Program is tasked with
creating data of “known and reasonable” quality. To achieve this quality, the Problem Review
Board (PRB) facilitates the resolution of problems identified by “anyone” involved in the ARM
data pipeline. The Problem Identification Form (PIF) and Corrective Action Report (CAR) are
reports that allow a formal mechanism for capturing information about potential problems, the
potential impact on the quality of the data, and the correction action needed to resolve the
problem.
The goal of the PIF/CAR system is to provide “end-to-end” problem management. No
single person has the expertise to correctly resolve all classes of problems that might be
identified in the ARM Program. The PRB technically reviews all incoming PIFs for their
immediate impact on data connection and quality and assigns responsibilities for their correction
and response (i.e., CAR).
The PRB is a small multilaboratory team with a broad base of membership. It is
composed of a chairman, an oversight individual, and a representative from each of three teams:
the IT, the Site Operation Team, and the DSIT. The PRB oversees the assignment of problem-
solving actions as triggered by PIFs and the resolution of the problems as documented in CARS.
A PIF should document anything that impacts the data system or that more than one
person needs to know or learn from. Not every PIF will identify a real problem. In some cases,
the PIF will identify a misunderstanding or someone’s need for more information. Some
problems will have an obvious solution, but the timing of the corrective action may need to be
coordinated with other subsystems within the project. Some problems will require further
analysis to be understood, and some problems may just require documentation because no clear
solution can be identified at the time. A review of the PIF is required before the PIF is accepted
as a problem and before it is actually scheduled for resolution. The CAR documents the details
of the resolving action. The corrective action required is an end-to-end problem solution, not
just a fix in a software module.
In addition, a Data Quality Report (DQR) may be required. A DQR is a statement about
the quality of data from a particular instrument. Usually, a DQR is generated by an instrument
mentor. If not generated by the mentor, it must be reviewed by the mentor. The DQR

34
information could be quite simple (e.g., stating that an instrument system was turned off during
certain time periods because of unexpected hardware problems), but it could also be quite
complex, giving detailed analysis and equations that should be used to adjust the instrument’s
observational data. One advantage of the DQR in comparison with a PIF is that the DQR form is
simpler. It is easier to fill out and less cumbersome to incorporate into a data stream. If a large
amount of processing of data is implied or requested in the DQR, reprocessing could be delayed
for a long time. Hence, the description of the problem and the fix must be complete, so that
someone can accurately reprocess the data several months after the date of the DQR submission,
if required.
The PIFs should continue to be used to request action by others, or oneself, to find a
solution to a problem or generate information on it. A borderline case might be to state that data
should be flagged during data ingest as a result of quality control algorithms provided as part of
the form submitted. In this case, a PIF rather than a DQR is favored because a specific type of
implementation is being requested. On the other hand, application of data quality control
algorithms to data already collected and resident in the Experiment Center or the Archive would
be best handled with a DQR. DQRs tend to be retrospective.
In case of doubt on whether to use a PIF or a DQR, using a PIF is better because it will
automatically be examined by the PRB to see if the PIF should be converted to a DQR. If data
flagging of an algorithm needs to be implemented both retrospectively and on the current data
ingest, consider splitting the request into two parts: a PIF and a DQR.
The PIF/CAR/DQR database can be found at
http://www.db.arm. gov/ARM/PIFCARDQR/ .

35
5 SCIENTIFIC INVESTIGATIONS AND OPPORTUNITIES
In 1994, the ARM Program identified a need for the creation of a SAC to provide
assistance to the ARM Program Science Team, the SGP CART SST, and the SGP CART site
program manager. The SACS charter is to
● Evaluate the SGP CART site scientific mission,
● Provide scientific mission guidance for SGP CART site operations,
● Evaluate the research program of the site scientist,
● Evaluate the potential for collaboration with other research programs, and
● Provide recommendations for the SGP CART site educational outreach
program.
The seven-member SAC is composed of ARM and non-ARM Program scientists who meet
formally at least once per year. The first such meeting was held in November 1995 at the
University of Oklahoma (OU), and a second follow-up meeting was held in June 1996. A
written report summarizing the SAC’s recommendations on the basis of the first meeting was
distributed in early 1996 to the ARM Management Team, the SST, the site operations manager,
and the site program manager and was responded to in writing by the SST. The report from the
June meeting was finalized in early 1997. Individual committee memberships last for three
years.
5.1 Intensive Observation Periods
The SGP CART site operates a vast suite of instrumentation that routinely provides
continuous data streams at a prescribed rate. These rates, however, can be changed upon request.
Requests from inside and outside the ARM Program can be made through the SGP CART site
program manager’s office either (1) to operate an ARM instrument or instruments at a different
data collection rate or mode of operation or (2) to support and compare non-ARM instruments
with ARM instruments. Those periods are referred to as IOPS.

36
The requests can be made by the ARM Science Team, ARM Program infrastructure, or
the scientific community at large. Preference for IOPS is given to the ARM Science Team and
infrastructure. The ARM Program has a limited budget for IOP support. However, funding from
sources other than the ARM Program can be accepted to support IOPS.
The BBSS is the instrument most frequently requested to operate in an accelerated data
collection rate and is the primary driver of IOP requests. The SGP CART site has five locations
where BBSS instruments are operated routinely. When operated in an accelerated data-rate
mode, simultaneous radiosonde launches can be made every three hours at all five locations for a
21-day period or longer.
The ARM Program provides funding for a total of 3 three-week-long, accelerated BBSS
launch periods per year, which are referred to as SCM IOPS. Two SCM IOPS are held at fixed
time periods, one in spring and one in summer. The third SCM IOP alternates between winter
and fall. Although the ARM Program supports and encourages multiple, concurrent IOPS
during SCM IOP periods, IOPS involving accelerated BBSS launches at other times of the year
will be considered as budget allows.
Requests for IOPS come through the SGP CART site program manager’s office. The
initial requests can be made informally, but an abstract of the goal(s) of the experiment(s) being
requested, a list of the potential instruments and platforms involved, and the time period of the
experiment(s) must be provided for approval. Requester coordination points of contacts are
identified.
Approval of an IOP is an external process that requires (1) review for resources and
relevancy and (2) approval by the ARM Program Technical Director, the SGP CART site
program manager, the SST, and site operations. Once approved, the management of the detailed
planning, setup, conduct, and shutdown of the IOP is the responsibility of the site program
manager.
An IOP is given a title and assigned a DSIT representative. The DSIT representative has
the responsibility to obtain the relevant scientific information about the proposed activity, which
is typically obtained in a science plan. ‘The DSIT representative has the responsibility to inform
ARM Science Team members of the proposed activity for the purpose of potential collaboration.

37
The site program manager obtains a list of potential principal investigators (PIs) and the
instrument or systems that are intended to be located at the SGP CART site from the DSIT
representative. The site program manager then sends the IOP questionnaire to the PIs to collect
information critical to the operation, safety, and data requirements for the IOP. The IOP
questionnaire is returned to the site program manager’s office and distributed to the appropriate
ARM infrastructure for review. The IOP questionnaire can be entered directly by a PI at the
WWW site:
http://www.arm. gov/stdocs/intemal/iop_form.html .
The ARM infrastructure groups include the SGP CART site program manager, the SGP
CART site SDS team, the DSIT representative, the SST, and site operations. Each of the ARM
infrastructure groups has a specific role in the planning and implementation of the IOP.
The DSIT representative assesses the data requirements: those requested by the
participating PI from ARM and those to be provided to ARM by the PI. A schedule of data
delivery is determined. Also, the DSIT will maintain a Web site that provides information about
IOP planning and status, as well as day-to-day operations activities during the IOP. The main
elements of this new Web site will include a science plan, each P1’s IOP questionnaire, the IOP
operations plan, and a daily log during the IOP that identifies and discusses each day’s scientific
mission.
The SGP CART site SDS team assists PIs that have requested Internet connections at the
SGP CART site central facility. The SDS team assists with the actual interface, as well as
establishing limitations to the size of data files and the actual time of data file transfers so that
the PI data transfers do not impact the SGP CART site data transfer schedule.
The SST has the overall responsibility for coordinating scientific interactions at the SGP
CART site. The SST personnel work with the DSIT representative to identify IOP scientists.
The SST assists the site program manager and site operations in locating instrumentation at the
SGP CART site. The SST personnel assist in identifying real-time display requirements during
IOP operations and identify mission-critical data streams that must be maintained during the
IOP.
site operations personnel provide IOP safety oversight and support installation of all
guest instruments in accordance with requirements identified in the 10P questionnaire. The site
38
operations personnel maintain the operational status of SGP CART site instrumentation and
provide triage (quick-response maintenance) for those instruments with data that have been
identified as critical to the IOP. The operations staff provide PIs with additional logistical
support (e.g., liquid nitrogen supplies, phone lines, safety briefings, and power) in accordance
with requirements identified in the 10P questionnaire.
The site program manager’s office manages the coordination of all activities associated
with the IOP. The site program manager’s office produces an IOP operations plan that will
identify all of the activities associated with IOPS, including roles and responsibilities,
identification of mission-critical instruments and an instrument triage plan, the locations of
instruments and use of SGP CART site facilities, safety and emergency actions, IOP termination
and start-up procedures, and a list of participants.
The progress of IOP planning activities is monitored via the weekly SST conference call
that takes place on Tuesdays at 11:00 a.m. central time and through other as-needed conference
calls with IOP participants and ARM infrastructure personnel. The IOP Web interface page
functions as a tool to facilitate the coordination and flow of information during all phases of 10P
planning, implementation, and operation. The site program manager will provide monthly
updates in his internal monthly reports. Past, present, and known future IOPS are listed in
Table 4.
5.2 Intensive Observation Periods for this Six-Month Period
The IOPS of key scientific interest during this upcoming six-month period (or which will
be occurring partially at the beginning of this six-month period) are discussed in the following
paragraphs (also see Table 4).
The Spectral Imagery Technology Applications Center IOP. The purpose of this IOP is
to acquire data to obtain ground truth measurements and to improve atmospheric compensation
models. The primary goal is to analyze approaches to atmospheric compensation on
hyperspectral and ultraspectral image data obtained from satellite platforms. Two independent
five-day activities have been scheduled. The first took place December 6-10, 1996, and the
second five-day activity took place the week of June 23, 1997. The Spectral Imagery
Technology Applications Center (SITAC) IOP involves an aircraft and support provided by
SITAC participants. The DSIT representative for this IOP is Don Slater, Pacific Northwest
National Laboratory (PNNL), who can be reached at (509) 372-6049.

TABLE 4 Intensive Observation Periods
ScienceTeam DSIT
Date Name Members 1 Contactb Description status
11/92 Field Test of NCARFlux Profiler
4/93 AERI Field Test
5193- Using the GPS for the6/93 Measurement of
Atmospheric WaterVapor
6/93 Warm-Season DataAssimilation and 1SSTest
D. Parsons (NCAR) R. Cc(icrwaf]
H. Rcvcrcomb (UW) J. Liljcgrcn
Collaborative J. Liljegren(UNAVCO and NCSU)
D. Parsons (NCAR) R. CederWall
Enhanced soundings at the centralfacility and profiler site were made11/10-11/19; boundary layer flightswere atso conducted on a few days.
Enhanced soundings at the centralfacility were requested during the fieldacceptance test of the AERIinstrument.
The purpose was to test theinvestigators’ technique for inferringtotal precipitable water vapor in theatmosphere column by using GPSsignals.
This test was an enhanced sampling(in time and space) of the SGPdomain for a 10-d period with profilersand sondes. The primary goals of theIOP were (1) to study the performanceof FDDA under thermodynamicconditions typical of the continentalwarm season and (2) to evaluate theestimates of divergence and vorticityfrom the prototype NCAR 1SS withinterferometric techniques, the triangleof three 9 15-MHz profilers, and theresults of FDDA.
Completed; data available
Completed 4f2Y/93
Completed6/8/93;(iataavailable
CompleteL all dataavailable at theExWriment Center exceptfor FDDA, which isavailable upon request atNCAR

TABLE 4 (Cont.)
Science Team DSITDate Name Member’ Contactb Description status
1/94;4/94;7/94;10/94;4/95;7/95;9/95;4/96;7/96;4/97;6/97;9197-10/97
4/94;9/95-10/95;4/96;9/96;9/97-10/97
4/94-5194;4J95-5/95
Seasonal SCM IOP D. Randall (CSU) R. CederWall Seasonal IOP withenhancedfrequencyof observations,particularlyverticalsoundingsof temperature,watervapor,and windsat centralfacilityandboundaryfacilitiesforperiodsof 21 d;therequiredsoundingfrequencyis 8/d.Thedataare requiredfor quantifyingboundary forcing and columnresponse.
IOP being planned for9197
ARlvl UAV B. Ellingson (UOM) D. Rodriguez Measurements of clear-sky fluxprotles acquired by a UAV and surfacesupport data are to be used tounderstand clear-sky heating rates andthe ability of models to reproduce theobservations.
First IOP conductedsuccessfully in 4/94;flight for ARESE IOP in9/95- 10@5; first 24-hUAV flight in 10I%
Remote Cloud Sensing R. McIntosh (UM);Field Evaluation B. Kropfli (NOAA);
T. Ackerman (PSU);K. Sassen (U-J);A. Heymsfield(NCAR); J. Goldsmith(SNL); and others
C. Flynn The primary purpose was the fieldevaluation and calibration of severalremote sensing cloud-observinginstruments (some from the IDPproject). In situcloud observationswere critical to the success of thisIOP. Enhanced soundings werere@red at the central facility.
Completed; data analysisin progress

TABLE 4 (Cont.)
Science Team DSITDate Name Member Contactb Description status
5/94 WB-57 Overflight for Collaborative J. Liljegren The purpose was to attempt to infer Completed; preliminary
the Measurement of (Visi(tyncand Lockheed [he vcrtictd distribution of watervapor lmnsrnission spectraAtmospheric Water PARC) at high ahiu-rdes from solar delivered to ARMVapor at High Altitude transmission spectra.
5/94 voR’rEx 10P E. Rtismusscn (NSSL) D. Sltitcr Spccitd lwmchcs were made in support Complckd 5/3 1/94of VORTEX,testing hypothesesonthe developmentand dissipationofseverestorms.
8/94 GEWEX/GCIP/GIST Collaborative T. CressIOP
Special launches were made in support Successfully conducted inof the GCIP and GIST as part of an 8/94effort to improve climate models byimproving parameterizations ofhydrologic and energy cycles.
9/94- Sampling of Coherent R. Coulter (ANL) R. CederWall Fluctuations in the vertical wind and Completed
10/94; Structures with the index of refraction were observed by
6J95- 915-MHz profiler operating the 915-MHz profiler with
7/95 RASS in a special mode during theafternoon hours to sample convectiveplume structures.

TABLE 4 (Cont.)
Science Team DSIT
Dale Name Member Contacl’ Description status
4/95. Simultaneous Ground- W. Wiscombe (NASA.
5/95 Based, Airborne, and GSFC); E. WcstwatcrSatellite-Borne (NOAA-ETL)Microwave Radiometricand In ,WuObservations01 Cloud OplictiIProperties and SurfaceEmissivi!ies
4J95- VORTEX-ARM E. Wes[water(NOAA-5195 WPL);W. Wiscombe
(NASA-GSFC);G. Stephens andP. Gabriel (CSU);J. Schneider(CIMMS/NSSL)
6/95- Surface Energy7/95 Exchange IOP
C. Doran(PNNL);R. Coulter (ANL);R. Stun (UBC)
D. Slatcr Observations of cloud opticatproperlicx were obtained over theCART Sile simuhaneously fromground-based, insi(u,and satellitc-bornc sensors; spatial variability ofsurface emissivities was assessed toattempt retrieval of total precipitablewater and cloud liquid water from thespecial sensor microwave imager.
Completed; involvedcollabomlion bctwccnWiscombe and L. FcdoratNOAA
D. Slater A joint VORTEX-ARMproposalwasapprovedfor45 h of P-3 aircrafttimeto study stmtocumulusclouds. Workwas coordinated with Remote CloudSensing IOP.
R. CederWall Detailed observations of thetemperature and moisture profiles inthe PBLobtained within a radius of75-125 km of the centml facility byusing airsondes and profilers toevaluate the variations of the PBLstructure in relation to underlyingsurface fluxes.
Data exchange completed12/95
Completi, airsonde dataavailable as beta releasefrom C. Doran
I

TABLE 4 (Cont.)
ScienceTeam DSITDate Name Member Contactb Description status
9/95. ARESE Collaborative T. Cress10/95
The purpose was to study the
anomalous absorption of sokirradiation by clouds. The phenomenonwas first noticed when satellitemeasurements of solar radiationabsorbed by the surface atmospherewere compared with solar radiationmeasured at collocated surface sites.
Completed; data areavailable
4/96- SUC!CESS5/96
6/96 MSX SatelliteOverflights
6/96- CLEXIOP7/96
Collaborative R. Peppier
Collaborative 1-1.Foote
G. Stephens R. CederWall(CSU/CIRA);J. Davis (CSU/CIRA)
The purpose is to determine theimpact of the current and the futuresubsonic aircraft fteet on Earth’sradiation budget and climate.
The purpose is to provide ground truthsupport for the MSX satellite. NineMSX sensors operate in the range of0.12-0.9 ~m, A spectral IR imagingtelescope also operates.
Intensified satellite data collection (byCSU), airborne cloud radar and in situmicrophysical observations, and anarray of ground-based measurementswill be carried out for betterunderstanding of the nature and role ofmiddle-level, nonprecipitating cloudsystems.
Completed
Launched on 4/24fltiSGP CART site flyoverson 6/17, 7/15, 8/12, and9/9, and TWP CART siteflyover on 10/13/96; dataexchange in process
Complet@ data exchangein process

TABLE 4 (Cont.)
Science Team DSIT
Date Name Member’ Contactb Description status
7/96- LLJ IOP8/96
9/96; Water Vafmr IOP9/97-10/97
7/96- BLX IOP R. StuIl (UBC) R.CedcrwalI Remote sensing surface fluxes with
8/96 instrumentation on the University ofWyoming King Air; CASES site andNCAR mobile profiler involved; inconjunction with 7196-8/96 SCMIOP.
D. Whiteman (PNNL) R. Cederwall The purpose is 10 investigateoscillations in the characteristics ofthe LLJ over the SGP.
Completed; aircrafl daiir 10bc available in 1997;BAMS article submitted
Completed; data from 915-MHz profiler run inmodified mode will beingested in 1997 (availablenow from R. Coulter atANL); Wyoming KingAir data, in collaborationwith R. Clark (MSU),will be available in 1997
H. Revercomb (UW) R. Peppier/ First of a series of IOPS to takeM. Splitt/D. measurements of water vapor profilesTurner using many instrument systems to
attempt to define water vapor profileof the site in support of IRF researchefforts, First in series focused onlowest kilometeu second in series tofocus on upper altitudes (4-12 km).
Completed; data to beavailable in 4/97;planning underway for9/97-10/97 pmiod; inconjunction with UAVand SCM IOPS

TABLE 4 (Cont.)
Science Team DSITDate Name MembeF Contactb Description status
12/96; LMS/SITAC IOP B. Dillman (Lockheed) D. Slater To analyze approaches to atmospheric Completed6/97 compensation on hyperspcctml and
uhraspectral image data obtained fromsatellite platforms.
4/97 Cloud Radar IOP B. Martncr (ETL); P. D. Rodri&IeL/ Designed to validate retrieval of cloud CompletedDaum (BNL) M.-D. Cheng microphysics on the basis of newly
installed ARM zenith-pointingMMCR (developed by NOAA/ETL);ETL to operate collocated scanningNOAA/K-band cloud rati, high-altitude and low-altitude sampling tobe done by two aircrafc aerosolcomponents to be flown in clear-skyconditions by low-altitude aircraft.
6/97- SGP ’97(Hydrology) T. Jackson (USDA); R. CederWall Conducted as part of USDA and In process as of this
7/97 IOP M.-Y. Wei (NASA) NASA campaign to study 3 “recharge” writingevents; additionalARMinsuumentswill be installed at USDA El Renoextended facility; non-ARM aircraftwith microwave radiometry will besensing soil moisture.

TABLE 4 (Cont.)
ScienceTeam DSITDate Name Member’ Contactb Description status
9/97- Cloud IOP G. Mace (PSU) D. Rodriguez.
10/97 P. Daum(aircriillcoordinator)
9/97- AemsolIOP S. Schwartz(BNL) M.-D. Cheng/10/97 P. Daum
(aircraftcoordinator)
9J9’l- Shortwave Radiation G. Stephens (CSU) D. Slater/10/97 IOP B. McCOy
9/97- Fall 1997IntegratedIOP TBD10/97
R. Peppier/R. Cederwall
ObIain on-site measurements of cloudand aerosol properties in cloudy andclear-sky conditions; singlemicrophysics aircraft to be flown inconjunction wi[h ARM UAVhigh/low set of airborne plalformsmeasuring radiometric properties;unprecedented opportunity to quantifycloud/aerosoi/radiation interactions.
Planning underway; inconjunction with UAV ,SCM, and Aerosol 101’s
See above for Cloud IOP. Phuming underway; inconjunction with UAV,SCM, and Cloud IOPS
To focus on both broadband andspectrally resolved shortwavemeasurements, including emphasis oninstrument calibration andintercomparison; will also evaluateGRAMS and have UAV/aircraftcomponent.
Planning underway; inconjunction with UAVand Water Vapor IOPS
Name for the ensemble UAV, SCM,Water Vapor, Cloud, Aerosol, andShortwave Radiation IOPS.
Planning underway

TABLE 4 (Cont.)
Science Team DSITDate Name Member Contactb Description status
10/98 CO, DIAL IOP J. Jolin (LANL) D. Slater CO, DIAL on aircraft will overfly the Site visit complete;sitty has potential benefit for water planning underwayvapor and aerosols measurements.
Affiliations: ANL, Argonne National Laboratory; BNL, Brookhaven National Laboratory; CIMMS, Cooperative Institute for MesoscaleMeteorological Studies; CIRA, Cooperative Institute for Research in the Atmosphere; CSU, Colorado State University; ETL, EnvironmentalTechnology Laboratory; GSFC, Goddard Space Flight CenteC LANL, Los Alamos National Laboratory; MSU, Millersville State University; NASA,National Aeronautics and Space Administration; NCAR, National Center for Atmospheric Research; NCSU, North Carolina State University; NOAA,National Oceanic and Atmospheric Administration; NSSL, National Severe Storms Laboratory; PARC, Palo Alto Research Centeu PNNL, PacificNorthwest National Laboratory; PSU, Pennsylvania State University; SNL, Sandia National Laboratories; UBC, University of British Columbia;UM, University of Massachusetts; UOM, University of Maryland; UNAVCO, University NAVSTAR Consortium; USDA, U.S. Department ofAgriculture W, University of Utah; UW, University of Wisconsin; and WPL, Wave Propagation Laboratory.
Other definitions: AERI, atmospherically emitted radiance interferomete~ ARESE, ARM Enhanced Shortwave Experiment ARM, AtmosphericRadiation Measurement (Program); BAMS, Bulletin of theAmerican Meteorological Society; BLX, Boundary Layer Experiment; CART, Cloud andRadiation Testbed; CASES, Cooperative Atmosphere-Surface Exchange Study; CLEX, Cloud Layer Experiment DIAL, Differential AbsorptionLidM DSIT, Data and Science Integration Team; EBBR, energy balance Bowen ratiq ECOR, eddy correlation; FDDA, four-dimensional dataassimilation; GCIP, GEWEX Continental-Scale International Project; GEWEX, Global Energy and Water Cycle Experimen~ GIST, GEWEXIntegrated System TesC GPS, global positioning system; GRAMS, ground radiation measurement system; IDP, Instrument Development Program;IOP, intensive observation period; IR, infrared; IRF, instantaneous radiative flux; 1SS, integrated sounding system; LLJ, Low-Level Jeq LMS,Lockheed Missile and Space; MSX, Midcourse Satellite Experiment PBL, planetary boundary laye~ RASS, radio acoustic sounding system; SCM,single-column model; SGP, Southern Great Plains; SITAC, Spectral Imagery Technology Applications Cemteq SUCCESS, Subsonic AircrafhContrail and Cloud Effects Special Study; TBD, to be determind, TWP, Tropical Western Pacific; UAV, unmanned aerospace vehiclty VORTEX,Verification of the Origins of Rotation in Tornadoes Experiment.

48
The Summer 1997 Single-Column Model IOP. An SCM is a physical parameterization
package extracted from a GCM or other large-scale model. The SCM is a primary test of our
current understanding of clouds and radiative transfer. The SCM IOPS are designed to provide,
as boundary conditions, the advective tendencies and vertical velocities that are the dynamic
forcing normally calculated with a GCM. The BBSS is the only technology currentIy capable of
providing the range and resolution of observations of winds and thermodynamic quantities
necessary to estimate these boundary conditions. Because derivatives are needed in both
horizontal directions, BBSS data from the central facility and the four boundary facilities are the
minimum required for reliable estimates. Although this IOP has always taken place during
mid-July through early August, it was rescheduled to coincide with the SGP ’97 (Hydrology) IOP
from June 18 to July 18, 1997.
The SGP 97 (Hydrology) IOP. This joint NASA/USDA effort is a hydrology and
boundary layer experiment to map out soil moisture at satellite temporal and spatial scales in the
SGP. The key remote sensing instrument during the SGP ’97 (Hydrology) IOP will be the
L-band electronically scanned thinned-array radiometer aboard a P-3 aircraft. An attempt will be
made to carry out a daily soil moisture mapping of the SGP (1,000-km x 1,000-km area) over a
period of one month. Crucial to the project are the extensive in situ observing programs of the
USDA Micronet, the Oklahoma Mesonet (OKM), and the U.S. Department of Energy (DOE)
SGP CART site. In addition, data will be validated by a gravimetric sampling program. A
boundary layer component was added, and a Twin Otter aircraft will provide for area-averaged
fluxes within the boundary layer over the southwest section of the SGP CART site domain. This
activity occurred June 18-July 18, 1997. Please contact Tom Jackson (USDA) for details at
(202) 358-0771 or Ming-Ying Wei (NASA) at (202) 358-0771.
The Fall 1997 Integrated IOP. This IOP will occur approximately during the period of
September 15-October 3, 1997, primarily at the central facility, and will comprise six individual
IOPS that have overlapping interests:
Single-Column Model IOP. This SCM IOP is identical to the summer SCM IOP
but will occur during the fall season to coincide with the other components during
fall 1997.
ARM UAVIOP. This continuation of an 10P series that began in April 1994 will
include both the Altus unmanned aerospace vehicle (UAV) and the Twin Otter
aircraft. The science focus of this IOP will mainly be on shortwave radiation and

49
clear and cloudy absorption, but the UAV will support the other ongoing IOPS to
the extent possible. Early plans call for the Altus to hover around 14-15 km in a
butteffly pattern from sunrise to sunset with 8-rein legs, and for the Twin otter to
serve as an escort and to perform stacked flights.
Water Vapor IOP. This IOP, the second in a series of three devoted to water
vapor, will build upon the knowledge learned during the first such IOP in
September 1996. It will continue the capabilities of the CART instruments for
characterizing water vapor and will increase the emphasis on water vapor at
higher levels (the first Water Vapor IOP primarily studied the lowest 1,000 m).
This IOP will utilize the @M UAV and aircraft along with an array of guest
instrumentation.
Shortwave Radiation IOP. A shortwave radiation IOP series is being planned.
The emphasis of this IOP would be on spectrally resolved and broadband
measurements of the shortwave, especially the diffuse component. Emphasis will
also be placed on instrument calibration, characterization, and intercomparison
and on evaluation of the new GRAMS radiometers (formerly called Valero
radiometers). One question to be addressed concerns whether or not there is
enhanced shortwave absorption in clear and cloudy skies and, if so, how it is
partitioned between the near IR and the visible. The first of a planned series of
three IOPS has several goals: compare measurements of spectral fluxes from an
array of spectrometers to assess our current ability to measure spectral fluxes;
contrast spectral and broadband fluxes to determine the level of consistency
between them; characterize measurements in terms of other parameters such as
columnar water content and aerosol optical depth; and promote the development
of a baseline-spectral solar transfer model and compare this model against
measurements. This IOP will also heavily rely on the UAV and guest
instrumentation.
Cloud 10P. This IOP (along with the Aerosol IOP) provides an unprecedented
(for ARM) opportunity to quantify cloud and radiation interactions and will serve
as a follow-up to the April 1997 Cloud Radar IOP. A main thrust will be to
validate cloud property retrieval algorithms that use surface-based remote sensor
and satellite measurements. A number of such algorithms will someday be
applied to operational CART data streams, but the algorithms need validation,

50
streamlining, and possible modification before such application can be done (thus
the need for the IOP). The IOP should provide the requisite data to (1) ensure that
the most accurate set of targeted algorithms will be implemente& (2) quantify the
uncertainty associated with the retrieval of cloud properties from algorithms;
(3) provide absolute calibration and intercalibration for MMCRS used for this type
of cloud research; and (4) provide guidance on operational modes of the CART
MMCR. This IOP will rely on the UAV, aircraft, and guest instrumentation. The
aircraft proposed for this IOP is the Wyoming King Air.
Aerosol IOP. This IOP (along with the Cloud IOP) will serve as a follow-up to
the April 1997 Cloud Radar IOP, in which data were collected to validate the new
CART MMCR. The Aerosol IOP will (1) include a more thorough aerosol
measurement program to support algorithm development for micropulse lidar
(MPL) and Raman lidar profiles and to support basic research; (2) conduct in situ
measurements for comparing lidar (thin cloud) and radar microphysical retrievals;
(3) conduct in situ measurements important to cloud radiative properties; and
(4) compare ARM UAV collections of upwelling radiation above the in situ
measurement area with aircraft downwelling radiation below the clouds. As with
the other Fall 1997 Integrated IOP components, this IOP will depend on UAV and
aircraft flights and on the guest instrumentation at the surface.
The C02 Differential Absorption Lidar IOP. John Jolin, Los Alamos National
Laboratory (LANL), anticipates conducting a DOE-funded experiment at the SGP CART site.
His experiment uses a 10-kHz tunable-frequency lidar system for the 9- to 1 l-~m wavelength
region of interest. The C02 Differential Absorption Lidar (DIAL) system can be mounted in
aircraft or be ground-based. Currently, the aircraft system is being considered. The COZ DIAL
system will be used to identify trace chemical species, as well as to measure water vapor. The
system on board a U.S. Air Force KC-135 aircraft can be used to make spectrally resolved
albedo measurements. This IOP has been delayed until October 1998.
5.3 Collaborative Investigations
Argonne National Laboratory has developed a new research facility within the existing
boundaries of the SGP CART site to be devoted to studies of the planetary boundary layer
(PBL). The Argonne Boundary Layer Experiment (ABLE) cover an area approximately 50 km x
50 km within the Walnut River watershed in ButIer County, Kansas, about 50 km (30 mi) east of

51
Wichita and near the Towanda extended facility. New techniques of observation and data fusion
will be developed and used to study the nocturnal low-level wind maximum and its relation to
the synoptic jet features; to develop methods for spatial integration of air-surface exchange of
heat, gases, and momentum, and to study horizontal and vertical dispersion in the PBL. The
initial set of instrumentation currently available at ABLE includes two 915-MHz profilers with
RASS, three minisodars, one surface ECOR flux station, one soil moisture and temperature
station, three automated weather stations (AWSS), and one satellite data receiver processor. One
central location will house data collection equipment and instrumentation and will provide
accommodations for visiting scientists. The data obtained are being provided in real time to a
user community of atmospheric scientists and ecologists.
The 915-MHz profilers with RASS and the minisodars have been installed at Oxford and
Whitewater, Kansas. A minisodar and an AWS have been added to the ARM Program’s
Beaumont, Kansas, intermediate facility, which is shared by and provides data streams for both
the ARM Program and ABLE. In addition, an extensive automated high-spatial-resolution soil
moisture and temperature network will be installed and remain in place, located in the Towanda
subbasin. A second network (not automated) with larger spacing may also remain in place. All
are within the footprint of the Wichita next-generation radar (NEXRAD).
The Cooperative Atmosphere-Surface Exchange Study (CASES) is a collaborative effort
to obtain measurements over the entire Walnut River watershed (approximately
100 km x 100 km) in and around Butler County, Kansas, about 50 km (30 mi) east of Wichita.
The CASES initiative will obtain measurements over a somewhat larger domain than ABLE.
CASES will include hydrologic, ecological, and atmospheric chemistry studies, in addition to
ABLE research,
Several PIs have been funded as part of CASES to do boundzuy layer research over the
CASES/ABLE domain. The principal contacts for CASES are Peggy LeMone, National Center
for Atmospheric Research (NCAR), and Bob Grossman, University of Colorado. The CASES
experiment period was April 22-May 19, 1997, and the types of investigations included the
diurnal variation of the PBL for different surface evaporation conditions; validation of the ABLE
profilers surface flux measurements, including C02 and 03; soil moisture measurements;
validation of radar rainfall estimates; boundary layer flux measurements; low-level jet studies;
etc. The types of instrumentation include eight surface flux stations and the air-surface
turbulence exchange research (ASTER) system; the University of Wyoming King Air and
NOAA Twin Otter C02 and 03 flux instruments; a 35 tipping-bucket rain-gauge network and

52
20 sites for manual time-domain refractometry to get soil moisture within the Wichita NEXRAD
radar footprint; a 10-cm polarization radw, an all-sky camera; and three cross-chain loran
atmospheric sounding systems (CLASS S).
5.4 Geophysically Significant Phenomena
The ARM Program has transitioned toward the GVFA, which focuses on the study of
geophysically significant phenomena (e.g., water vapor profiles, aerosols, clouds, temperature
profiles, and radiation). Algorithm development that describes these phenomena is a current
primary focus.
The algorithm products represent a merging of appropriate instrument measurements into
a cohesive product defining a particular geophysical state, for use by the Science Team. These
products specifically address problems posed in the Science Plan and by various working groups.
A product example currently under construction is one prescribing water vapor over the SGP
CART site sought by the IRF Working Group. As noted above, such an effort involves three
IOPS obtaining multiple water vapor measurements at the central facility (e.g., additional
measurements on the 60-m towe~ use of a tethersonde system, use of guest instruments and
additional instruments, such as chilled mirrors and frost-point hygrometers) and comparison of
these measurements with routine BBSS, Raman lidar, MWR, and 915- and 50-MHz RASS water
vapor profiles. The end result of such comparisons will be the generation of an ensemble, site-
representative water vapor profile for use in GCMS.
5.5 Educational Outreach
The educational outreach program for the SGP CART site, coordinated by Dr. Ken
Crawford, Director of the Oklahoma Climatological Survey (OCS), combines a range of
resources available at OU. Outreach efforts are focused at the precollege, undergraduate, and
graduate levels. Efforts in this six-month period will be focused on continuing the integration of
ARM and NWS data (as nearly in real time as possible) into the EARTHSTORM project, a
program conducted by the OCS to integrate real-time data into classroom activities in
kindergarten through grade 12 (McPherson and Crawford 1996), The EARTHSTORM project
currently accesses data from the OKM, a high-density network of surface meteorological
stations, and provides the data to students in real time. EARTHSTORM has created learning
modules and has provided teacher workshops to enhance the use of OKM data. Extension of
these activities to include SGP ARM data is now beginning to occur at a significant level. In

53
addition, an ARM/Kansas teachers’ workshop will take place at OU in July 1997. Further
extension of these efforts to the Tropical Western Pacific and North Slope of Alaska ARM sites
will be investigated.

54
6 DISTRIBUTION OF DATA
Most of the data being requested are received from the SGP CART site or external data
sources and are then repackaged for daily and weekly distribution to individual users. In some
cases, users can log into the Experiment Center or the R 1 System at the central facility and
extract data by anonymous file transfer protocol (FTP). All data are sent to the Data Archive,
where they are accessible to anyone at the WWW site:
The current status of CART and
http://www.archive. arm.gov .
external data streams can be accessed at the uniform resource
locators (URLs) provided in Sections 3.4 and 3.5.2 of this report.
The status of data streams from CART instruments or external sources has been classified
as releasable (released upon request for the data stream), developmental (released only to SDS
personnel for development of ingestion programs), under evaluation (released to an investigator
for an initial data quality check), beta release (for releasable data of known and reasonable
quality), collecting (when raw data are being collected for future processing and distribution),
mentor only (when the data stream is provided only to the instrument mentor at the request of the
mentor), analysis (if the data stream is released for further processing and/or analysis, such as for
graphic display), or defunct (due to replacement of a prototype instrument data stream with the
CART instrument data stream).

55
7 LOOKING AHEAD
The essentially fully mature SGP CART site now provides the full range of data streams
needed to support the DSIT’S “building block” algorithm development effort and a broad
spectrum of Science Team research. These activities, in turn, are increasingly drawing on
multiple SGP data streams to focus strongly on geophysically significant phenomena (water
vapor profiles, clouds, aerosols, temperature profiles, radiation, surface fluxes). The operational
challenges that will be of greatest importance during 1998 and beyond will therefore include
maintaining the performance of the basic instrumentation suite at the highest possible level,
improving that performance where possible, enhancing the original CART design through the
permanent addition of new instruments, and mounting focused IOPS involving temporary
additional instrumentation. Through this mix of activities, the evolving scientific requirements,
challenges, and opportunities for the SGP CART will be met. The present chapter outlines the
path ahead, to the extent that it can be identified in mid-1997.
The key developments that are expected to occur at the central facility during the present
six-month period and the following 18 months include the achievement of the routine,
unattended, continuous operation of the Raman lida~ use of the recently completed RCF,
upgrading of the Vaisala BBSS sondes (see below); and the installation of several new
instruments (CSPHOT, TLCV, UV-B sensor, PAR, optical transmissometer, GRAMS, and a
solar spectral radiometer). The solar spectral radiometer will provide solar spectral observations
at the central facility that are needed for the testing and improving of solar radiation models. A
narrow-field-of-view zenith sky radiance sensor in the near IR has also been suggested for that
location. The sensor would have the advantage of a field of view that overlaps or nearly
coincides with that of the MWR and possibly MMCR. Another central facility measurement
issue now under consideration includes the possibility of acquiring continuous direct-beam solar
irradiance measurements with a cavit y radiometer.
The utility of the Raman lidar to characterize the lower half of the troposphere
(e.g., water vapor, clouds, aerosols) more accurately and with a finer vertical resolution than is
possible with the original suite of instruments (BBSSS, MWRs) has been strongly advocated by
the IRF Working Group. The routine, unattended, continuous operation of the Raman lidar
remains an ongoing goal, following the installation in spring 1997 of a permanent hail shield.
The operation of the Raman lidar and its measurements strategy are being closely monitored for
improvements. Also, the recent installation of the MMCR is already enhancing the algorithm
development efforts of the VAP Working Group to improve the definition of cloud

56
characteristics (fractional coverage, as well as base and top heights) above the central facility, in
coordination with key Science Team members. The MMCR is equipped to map the vertical
extent of cloud boundaries up to a height of approximately 20 km. Coincident measurements of
vertical wind speed will be obtained from Doppler analysis. The system will operate only in the
vertically pointing position.
Improved specifications of the water vapor, temperature, and cloud conditions above the
boundary facilities are expected to result from several observational enhancements and additions
during 1997 and 1998. First, the addition of ceilometers is primarily intended to provide data for
algorithms that will retrieve lower tropospheric temperature and humidity profiles from the
output of new, planned AERI instruments. Second, higher quality BBSS soundings should result
from a planned upgrade of the Vaisala sensors being used (from RS-80 to RS-90). The RS-90
humidity sensor has a faster response time and thus recovers more quickly than its predecessor
after emerging from clouds. Its temperature counterpart is also smaller and has a faster response
time than the RS-80 and, in addition, is less susceptible to solar heating. An identical BBSS
upgrade will occur at the central facility. Under consideration for the boundary facilities is a
capability to profile with passive microwave systems, which would augment the AERI
measurements.
By the end of 1997, with the completion of extended facilities at Seminole (over pasture)
and El Reno (pasture) and at a wooded Okmulgee site, the basis for the spatial integration of the
turbulent and radiative fluxes over the entire SGP CART site will have been firmly established
through the completion (according to their original design) and upgrading of all 23 extended
facilities. A key feature of that upgrading is the present near completion of SWATS at all
extended facilities. The SWATS data will contribute significantly to completing the
characterization of the land surface and subsurface that is essential for investigating surface heat
and moisture exchanges. In a closely related development, approximately 40 additional identical
SWATSS are being installed at OKM sites within the SGP CART site domain during a two-year
period that began in mid-1996. The SWATSS that existed in midsummer 1997 (approximately
40) were the centerpiece of an ARM/USDA/NASA Hydrology IOP conducted in June and July
1997, which also made use of satellite and aircraft data and focused in particular on soil
moisture. The second half of 1997 should see the completion of improved SIROS data logging
at the central and extended facilities. This improvement is involving both (1) the introduction of
independent data logging systems for the SIROS broadband sensors, which will henceforth be
known as SIRS (solar and infrared station), and (2) the MFRSRS becoming the sole users of the
original systems that were previously shared with the SIROS instrument suites. Improved

57
reliability of the SIROS/SIRS data gathering should result. A similar logging system
subsequently will be introduced for the BSRN (to be renamed BRS [broadband radiometer
station]). Measurement issues under consideration at the extended facilities include local
observations of surface vegetative conditions and measurements of surface bidirectional
reflectance.
The capability for monitoring land-atmosphere interactions recently was enhanced further
with the establishment and operation of three ARM intermediate facilities containing 9 15-MHz
profilers with RASS, which are being used to quantify structures and processes in the PBL.
Stabilization of these systems will occur during the rest of 1997, and significant scientific
dividends will begin to accrue in late 1997 and 1998.
Perhaps the largest of all ARM IOPS planned and conducted to date will occur during
mid-September to early October of the present six-month period. This IOP will not only include
the originally planned second Water Vapor IOP, SCM IOP, and UAV IOP, but also IOPS
concentrating on shortwave radiation, clouds, and aerosols. The six IOPS are collectively being
called the Fall 1997 Integrated IOP. The Water Vapor IOP will use knowledge learned from its
September 1996 forerunner to guide its operations, which will include a higher-altitude focus on
water vapor distributions. The Shortwave Radiation IOP will focus on both spectrally resolved
and broadband instrumentation assessments and intercomparisons. The Cloud and Aerosol IOPS
will concentrate on in situ measurements in clear and cloudy sky conditions, to validate cloud
property algorithms and compare microphysical retrievals. The UAV IOP aims to focus on
radiation and support the efforts of all of the other IOPS, and the SCM IOP should have strong
synergy with the Cloud and Aerosol IOPS, because the in situ measurements of cloud and aerosol
properties are valuable for assessment of SCM parameterizations. A coordination meeting for all
of these IOPS is scheduled to occur in July 1997. Key planning issues include maximizing the
mutual benefits between IOPS while minimizing the inevitable conflicts. Careful logistical
planning will be required for designing the timing and location of airborne IOP resources and for
locating ground-based instruments at the central facility. Most of the analysis of the data
obtained will occur in 1998, which, in turn, may lead to follow-up IOPS. Certainly, further water
vapor, shortwave, and SCM IOPS are already planned for 1998.
The SGP CART site activities during 1998 will continue to capitalize on the 1996
installation of the aerosol instrumentation and the RCF at the central facility. The data from the
aerosol instruments are filling a significant gap in the specification of the radiative state of the
near-surface atmosphere. Indeed, the importance for ARM of aerosol effects is likely to grow in

58
the next two years. The establishment of the RCF is a key element in the total quality control
effort addressing the wide variety of radiometers at the central facility and the more limited
SIROS/SIRS radiometer suites at the extended facilities. Establishment of the RCF was
accomplished during the latter half of 1996 and will be augmented by the development and
implementation of a comprehensive integrated RCF Operations Plan as the SGP CART site
moves from the establishment of routine operations to the maintenance of routine operations,
with inherent instrument-aging problems. BORCALS are planned for summer 1997.
The SST will continue to assist in the calibration and maintenance areas during late
1997-1998, when it will also contribute further to the quality control and assurance of the
ever-expanding SGP CART data bank through the further development and use of graphic data
quality display modules and performance metrics. As noted in earlier chapters, the graphic
displays, which plot actual data against modeled expectations, are intended for use by site
operations staff (and the SST) to aid in their efforts to perform “first-line-of-defense”
near-real-time quality assurance relative to instrument operation. The performance metrics are
intended to give a broader view of instrument performance and data quality over the CART site
relative to how data fall within or outside of specified quality tolerances, such as range and
consistency checks, and already include platform intercompansons. Both efforts represent a
major step forward toward achieving a comprehensive end-to-end quality control system for
instrument performance and data. Further in that regard, in spring 1997, the SST began issuing
weekly data quality assessments, using input from other groups within ARM as well as its own
assessment tools.
During 1998, the SGP CART site observational capabilities are expected to continue to
benefit from ongoing interactions between the ARM Program and several other federal and state
research programs having an interest in the SGP in general. The federal agency interactions,
which until now have particularly involved the GCIP component of GEWEX, are currently being
broadened through the leadership of NASA and the USDA in the aforementioned midsummer
1997 Hydrology IOP. These interactions are also currently manifest in the approximately
biannual meeting of a joint ARM-GCIP-ISLSCP Working Group (on which ARM is represented
by J.C. Doran, R.G. Ellingson, and P.J. Lamb); the aforementioned implementation of the
SWATS at the ARM extended facilities, with significant financial support from GCIP; and the
USDA’s facilitation and partial funding of the above El Reno extended facility. The Joint
Working Group will be concerned not only with fostering the most cost-effective and efficient
observational strategies for the SGP CART site for 1998 and subsequent years, but also with
formulating the best possible scientific use of the resulting data among their programs.
59
Consistent with this latter goal, the Working Group’s May 1997 meeting focused on “Value-
Added Science,” which will likely be a continuing theme of that forum. Interactions with the
OKM, which has been an important source of external data for the SGP for several years, are
expected to increase with the OKM’S aforementioned parallel deployment of approximately
40 SWATSS. Finally, a joint effort between the NWS and ARM has now resulted in ARM
radiosonde data being made available to the meteorological community at large via the Global
Telecommunications System. This availability will be especially valuable for the NWS short-
range prediction efforts during the tornado seasons of the next few years.
The integration of ARM UAV operations into the SGP CART site scientific mission was
initiated successfully during the April 1994 IOP, which used a small UAV (GNAT) that could
ascend only to 6.7 km (about 22,000 ft). However, delays in developing, testing, and gaining
operational approval for the larger UAVS needed for radiation measurements at higher elevations
precluded their subsequent use over the SGP CART site for the next two years. Manned aircraft
were used instead, as during the ARESE IOP. Fortunately, this situation was rectified with the
deployment of the Altus UAV during the September 1996 Water Vapor IOP, which permitted
the valuable operation of highly stable UAV-mounted radiation and other instruments over the
SGP CART site. Indeed, this operation constituted a great step forward for the use of UAVS in
scientific research in general, because it included a record-breaking 26-hour mission. The use of
UAVS is therefore expected to be an essential ingredient of planned and future IOPS, such as the
Fall 1997 Integrated IOP and its 1998 follow-ups. All UAV operations will continue to be
supported by climatological analyses by the SST of historical cloud and wind data for the SGP
vicinity.
Throughout 1998, the scientific operation of the SGP CART site should benefit
significantly from guidance provided by the SAC. The fundamental role of the SAC is to ensure
that the operation of the site addresses the goals and objectives of the ARM Program (published
in the 1996 Science Plan) to the fullest possible extent, including through successful adaptation
to changing circumstances and opportunities. Such performance will ensure that the flows of
data to the Science Team members are appropriate to their needs, of consistently high quality,
and as continuous as possible. For example, the recent redoubling of efforts by the SST to help
ensure the quality of SGP data is consistent with the strong encouragement offered by the
November 1995 SAC Review. Because the membership of the SAC is divided approximately
equally between ARM Science Team members and nonmembers, its guidance reflects both the
inherently more parochial concerns of the ARM Science Team and the broader global-change
perspective of the others. The recommendations from the November 1995 and June 1996 SAC
60
meetings are now being acted upon by the SST and will be reflected in the scientific capability of
the site during 1998 and beyond. Those recommendations included the aforementioned need for
increased attention to quality assurance and quality control of the SGP instruments and data
streams, the necessity of making midcourse corrections (including those of personnel
assignments and funding priorities) to ensure that the configuration and operation of the SGP
CART site are in full consonance with the ARM Science Plan priorities, the desirability of
converting the Site Scientific Mission Plan into an article for publication in the Bulletin of the
American Meteorological Society that would publicize the scientific potential of the site (to be
completed during the present six-month period); and the inauguration of an SST “Visitor
Program” that would particularly involve cloud and radiation data analyses and simulations with
the goal of enhancing the site’s observational capabilities in those crucial areas. Thus, fi-om now
onward, the SAC guidance will have a continuing effect on the scientific mission of the SGP
CART site. This fact, coupled with the recent maturation of the site, should result in optimal
operation of this ARM locale with respect to the goals and objectives of the overall ARM
Program during 1998 and subsequent years. A further SAC review is scheduled for fall 1997.

61
PREFERENCES
McPhemon, R.A., mdK.C. Crawford, 1996, ''~e EAR~STORMRoject: Encouraging theUse of Real-Time Data from the Oklahoma Mesonet in K-12 Classrooms,” Bulletin of theAmerican Meteorological Society 77:749-761.
Schneider, J.M., P.J. Lamb, and D.L. Sisterson, 1993, Site Scientific Mission Plan for theSouthern Great Plains CART Site: January-June 1994, ARM-94-001, Argonne NationalLaboratory, Argonne, Illinois.
U.S. Department of Energy, 1990, ARM Program Plan, 1990, DOE/ER-0441, Washington, D.C.
U.S. Department of Energy, 1996, Science Plan for the Atmospheric Radiation MeasurementProgram, DOE/ER-0670T, Washington, D.C.

62

63
APPENDIX:
STATUS AND LOCATIONS OF INSTRUMENTS

64
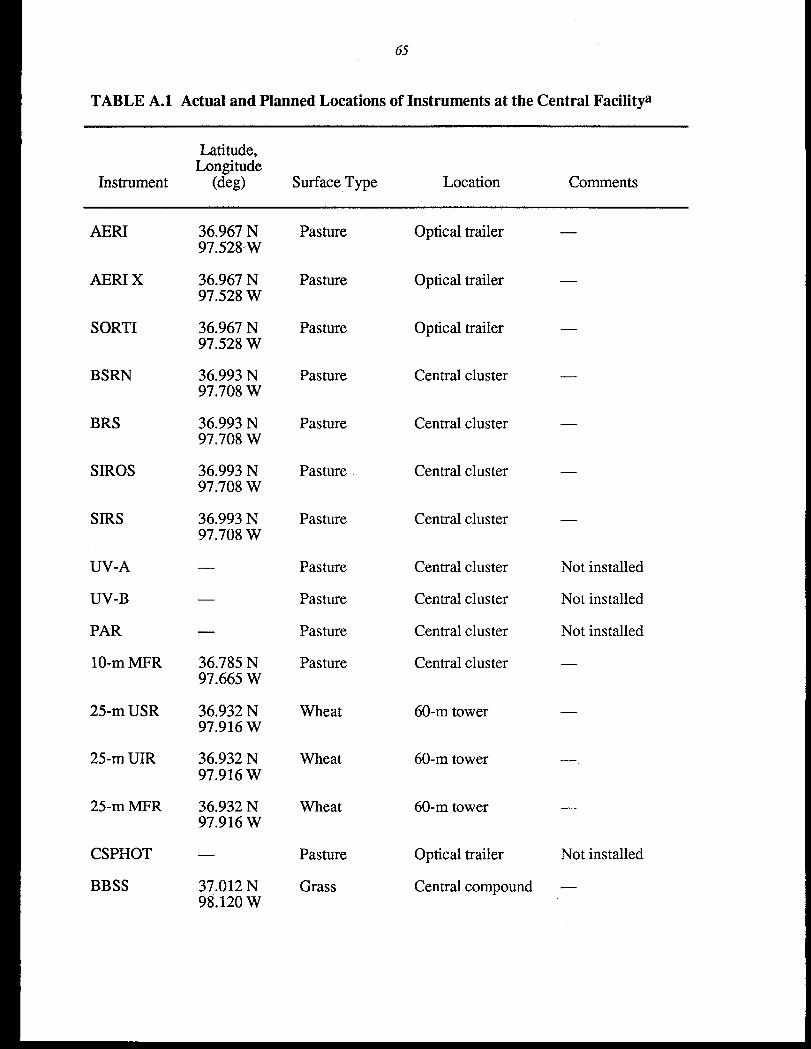
65
TABLE A.1 Actual and Planned Locations of Instruments at the Central Facilitya
Latitude,Longitude
Instrument (deg) Surface Type Location Comments
AERI
AERI x
SORTI
BSRN
BRS
SIROS
SIRS
UV-A
UV-B
PAR
10-m MFR
25-m USR
25-m UIR
25-m MFR
CSPHOT
BBSS
36.967 N97.528-W
36.967 N97.528 W
36.967 N97.528 W
36.993 N97.708 W
36.993 N97.708 W
36.993 N97.708 W
36.993 N97.708 W
—
—
—
36.785 N97.665 W
36.932 N97.916 W
36.932 N97.916 W
36.932 N97.916 W
—
37.012 N98.120 W
Pasture
Pasture
Pasture
Pasture
Pasture
Pasture
Pasture
Pasture
Pasture
Pasture
Pasture
Wheat
Wheat
Wheat
Pasture
Grass
Optical trailer
Optical trailer
Optical trailer
Central cluster
Central cluster
Central cluster
Central cluster
Central cluster
Central cluster
Central cluster
Central cluster
60-m tower
60-m tower
60-m tower
Optical trailer
Central compound
—
—
—
—
Not installed
Not installed
Not installed
—
—
Not installed
—

66
TABLE A.1 (Cont.)
Latitude,Longitude
Instrument (deg) Surface Type Location Comments
915-MHZRWP
50-MHZRWP
MWR
RLID
W!N
BLC
MPL
MMCR
TLcv
25-m T/RH
60-m T/RH
ECOR
25-m ECOR
60-m ECOR
EBBR
36.677 N97.686 W
36.630 N97.706 W
37.105 N97.765 W
38.052 N97.741 w
36.842 N97.608 W
36.697 N97.528 W
36.967 N97.528 W
36.885 N97.591 w
—
36.932 N97.916 W
36.932 N97.916 W
36.857 N97.631 W
36.932 N97,916 W
36.932 N97.916 W
36.887 N
Shale,pasture
Shale,pasture
Pasture
Pasture,wheat
Pasture
Pasture
Pasture
Pasture,wheat
Pasture
Wheat
Wheat
Wheat,pasture
Wheat
Wheat
Pasture
Profiler trailer
Profiler trailer
Optical trailer
IDP 3
Optical trailer
Optical trailer
Optical trailer
IDP 2
Optical trailercluster
60-m tower
60-m tower
Aerosol trailer
60-m tower
60-m tower
Central cluster
—
—
—
.
Not installed
—
97.531 w

67
TABLE A.1 (Cont.)
Latitude,Longitude
Instrument (deg) Surface Type Location Comments
SMOS 36.785 N97.665 W
AOS 36.927 N97.828 W
RCF 36.958 N97.653 W
RSS —
Sws
GRAMS —
Pasture
Pasture,wheat
Pasture,wheat
Pasture
Pasture
Pasture
Central cluster —
Aerosol trailer —
Calibration trailer —
Optical trailer Not installedcluster
Optical trailer Not installed
Optical trailer Not installedcluster
a AERI, atmospherically emitted radiance interferomete~ AOS, aerosol observationsystem; BBSS, balloon-borne sounding system; BLC, Belfort laser ceilometer; BRS,broadband radiometer station; BSRN, Baseline Surface Radiation Network; CSPHOT,Cimel sunphotometeq EBBR, energy balance Bowen ratio; ECOR, eddy correlation;GRAMS, ground radiation measurement system, IDP, Instrument Development Program,MFR, multifilter radiomete~ MMCR, millimeter cloud radw, MPL, micropulse lidw,MWR, microwave radiomete~ PAR, photosynthetically active radiomete~ RCF,radiometer calibration facility; RLID, Raman lidw, RSS, rotating shadowbandspectromete~ RWP, radar wind profile~ SIROS, solar and infrared radiation observingsystem; SIRS, solar and infrared station; SMOS, surface meteorological observationstation, SORTI, solar radiance transmission interferometer, SWS, shortwavespectrometer TLCV, time-lapse cloud video; T/RH, temperature and relative humiditysensoq UIR, upwelling infrared radiometer; USR, upwelling solar radiometer UV-A,ultraviolet A; UV-B, ultraviolet B; Vceil, Vaisala ceilometeq WSI, whole-sky imager.
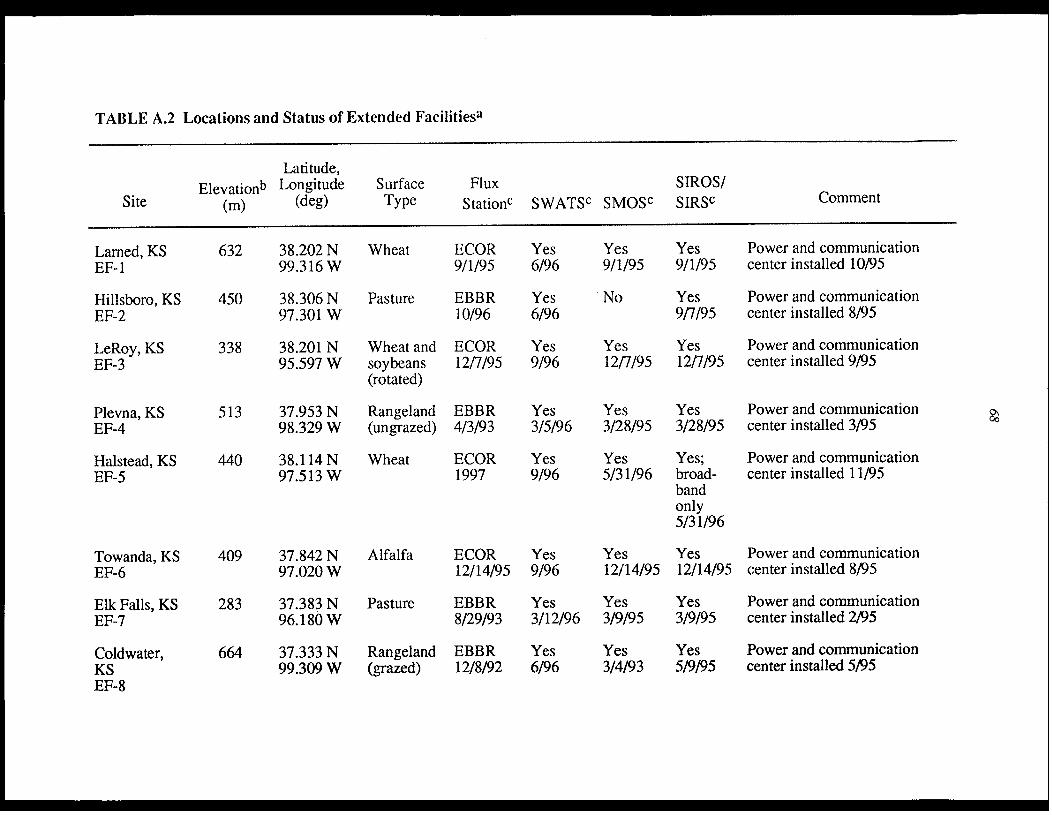
TABLE A.2 Locations and Status of Extended Facilitiesa
Latitude,
Elevationb ‘O&~~de Surface Flux SIROS/Site (m) Type StationC SWATSC SMOSC SIRSc Comment
Yes6/96
Yes6/96
Yes9/96
Yes3/5/96
Yes9/96
Yes9/96
Yes3/12/96
Yes6/96
Yes Yes9/1/95 9/1/95
No Yes9/7/95
Yes Yes12/7/95 12/7/95
Power and communicationcenter installed 10/95
38.202 N99.316 W
38.306 N97.301 w
38.201 N95.597 w
37.953 N98.329 W
38.114N97.513 w
37.842 N97.020 W
37.383 N96.180 W
37.333 N99.309 w
Wheat ECOR9/1/95
Lamed, KSEF- 1
Hillsboro, KSEF-2
LeRoy, KSEF-3
Plevna, KSEF-4
Halstead, KSEF-5
Towanda, KSEF-6
Elk Falls, KSEF-7
Coldwater,KSEF-8
632
450
338
513
440
409
283
664
Power and communicationcenter installed 8/95
Pasture EBBR10/96
Power and communicationcenter installed 9/95
Wheat andsoybeans(rotated)
ECOR12/7/95
Yes3/28/95
EBBR4/3/93
Yes3/28/95
Power and communicationcenter installed 3/95
Rangeland(ungrazed)
Yes5/3 1/96
ECOR1997
Yes;broad-bandonly5/3 1/96
Power and communicationcenter installed 11/95
Wheat
Yes12/’14/95
Yes12/14/95
Power and communicationcenter installed 8/95
Alfalfa ECOR12/14/95
Pasture EBBR8/29/93
Rangeland EBBR(grazed) 12/8/92
Yes3/9/95
Yes3/9/95
Power and communicationcenter installed 2/95
Yes3/4/93
Yes5/9/95
Power and communicationcenter installed 5/95

TABLE A.2 (Cont.)
Latitude,
Elevation Longitude Sutidce Flux SIROS/Site (m) (deg) Type StationC SWATSC SMOSC SIRS~ Comment
Ashton, KSEF-9
Tyro, KSEF- 10
Byron, OKEF- 11
Pawhuska,OKEF- 12
Lament, OKEF-13, 14
Ringwood,OKEF- 15
Vici, OKEF- 16
EF- 17d
386
248
360
331
318
418
602
—
37.133 N97.266 W
37.068 N95.788 W
36.881 N98.285 W
36.841 N96.427 W
36.605 N97.483 W
36.431 N98.284 W
36.061 N99.134 w
—
Pasture
Wheat
Alfalfa
Nativeprdirie
Pasture,wheat
Pasture
Wheat
—
EBBR12/10/92
ECOR7/21/95
ECOR6/26/95
EBBR8/29/93
EBBR9/14/92ECOR5/30/95
EBBR9/16/92
ECOR5/30/95
—
Yes2/27/96
Yes7/96
Yes6/96
Yes9/97
Yes2/5/96
Yes2/21/96
Yes7/96
—
Yes3/13/90
No
Yes6/26/95
No
Yes4/9/93
Yes3/29/93
No
—
Yes10/5/93
Yes7/2 1/95
Yes6/26/95
Yes6/30/95
Yes10/15/93BSRN5/15/92
Yes10/12/93
Yes5/30/95
—
Power and communicationcenter installed 10/93
Power and communicationcenter installed 6/95
Power and communicationcenter installed 6/95
Power and communicationcenter installed 6/95 ~
Power and communicationcenter installed 6/93
Power and communicationcenter installed 10/93
Power and communicationcenter installed 5B5
—
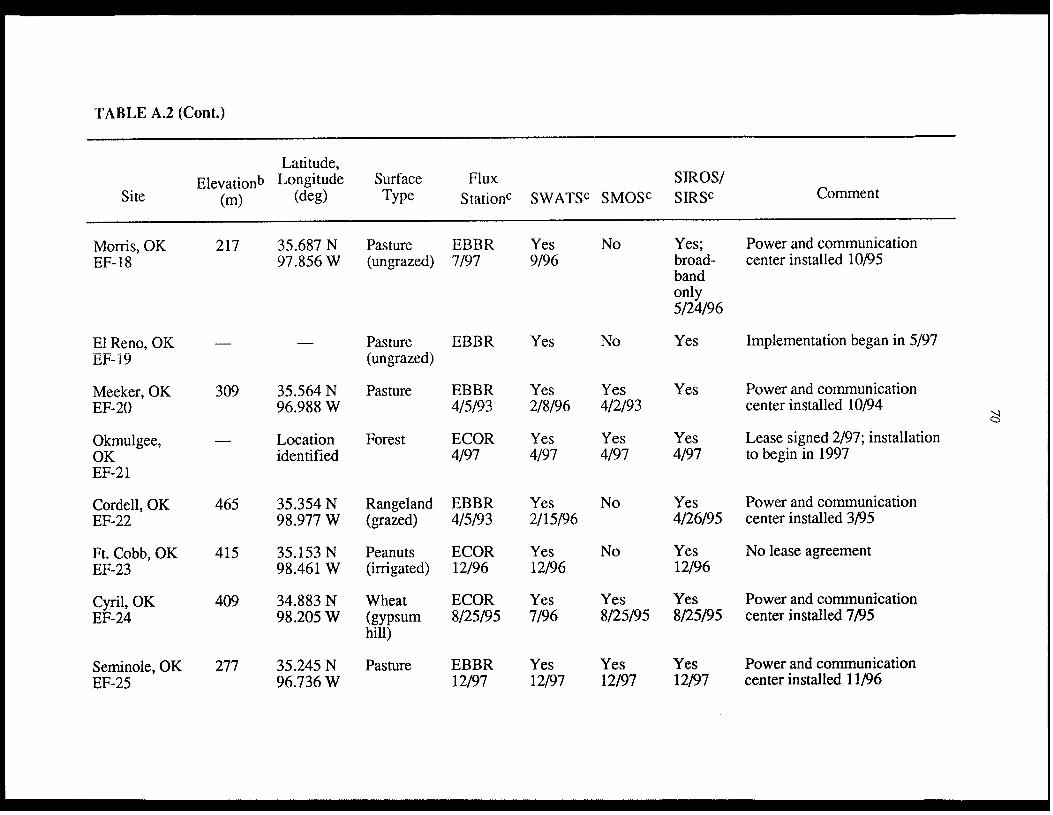
TABLE A.2 (Cont.)
Latitude,
Elevation Longitude Surface Flux SIROS/Site (m) (deg) Type StationC SWATS~ SMOS~ SIRSC Comment
Morris, OKEF- 18
El Reno, OKEF- 19
Meeker, OKEF-20
Okmulgee,OKEF-21
Cordell, OKEF-22
Ft. Cobb, OKEF-23
Cyril, OKEF-24
Seminole, OKEF-25
217
—
309
—
465
415
409
277
35.687 N97.856 W
—
35.564 N96.988 W
Locationidentified
35.354 N98.977 W
35.153 N98.461 W
34.883 N98.205 W
35.245 N96.736 W
Pasture EBBR(ungrazed) 7/97
Pasture EBBR(ungrazed)
Pasture EBBR4/5/93
Forest ECOR4/97
Rangeland EBBR(grazed) 4/5/93
Peanuts ECOR(irrigated) 12/96
Wheat ECOR(gYPsum 8/25/95hill)
Pasture EBBR12/97
Yes9/96
Yes
Yes2/8/96
Yes4/97
Yes2/15/96
Yes12/96
Yes7/96
Yes12/97
No
No
Yes4/2/93
Yes4/97
No
No
Yes8/25/95
Yes12/97
Yes;broad-bandonly5/24/96
Yes
Yes
Yes4/97
Yes4/26/95
Yes12/96
Yes8/25/95
Yes12/97
Power and communicationcenter installed 10/95
Implementation began in 5/97
Power and communicationcenter installed 10/94
Lease signed 2/97; installationto begin in 1997
Power and communicationcenter installed 3/95
No lease agreement
Power and communicationcenter installed 7P5
Power and communicationcenter installed 11/96

TABLE A.2 (Cont.)
Latitude,
Elevation Longitude Surface Flux SIROS/Site (m) (deg) Type StationC SWATS’J SMOSc SIRSc Comment
Cement, OK 400 34.957 N Pdsture EBBR — No No Phone line (only) installedEF-26 98.076 W 6/10/92 1()/92
a
b
c
d
BSRN, Baseline Surface Radiation Network; EBBR, energy balance Bowen ratio; ECOR, eddy correlation; EF, extended facility;NEPA, National Environmental Policy Act; SIROS, solar and infrared radiation observing system; SIRS, solar and infrared station;SMOS, surface meteorological observation station; SWATS, soil water and temperature system.
Above sea level.
Date indicates actual or scheduled installation date.
This extended facility is a placeholder site, for possible expansion, if required.
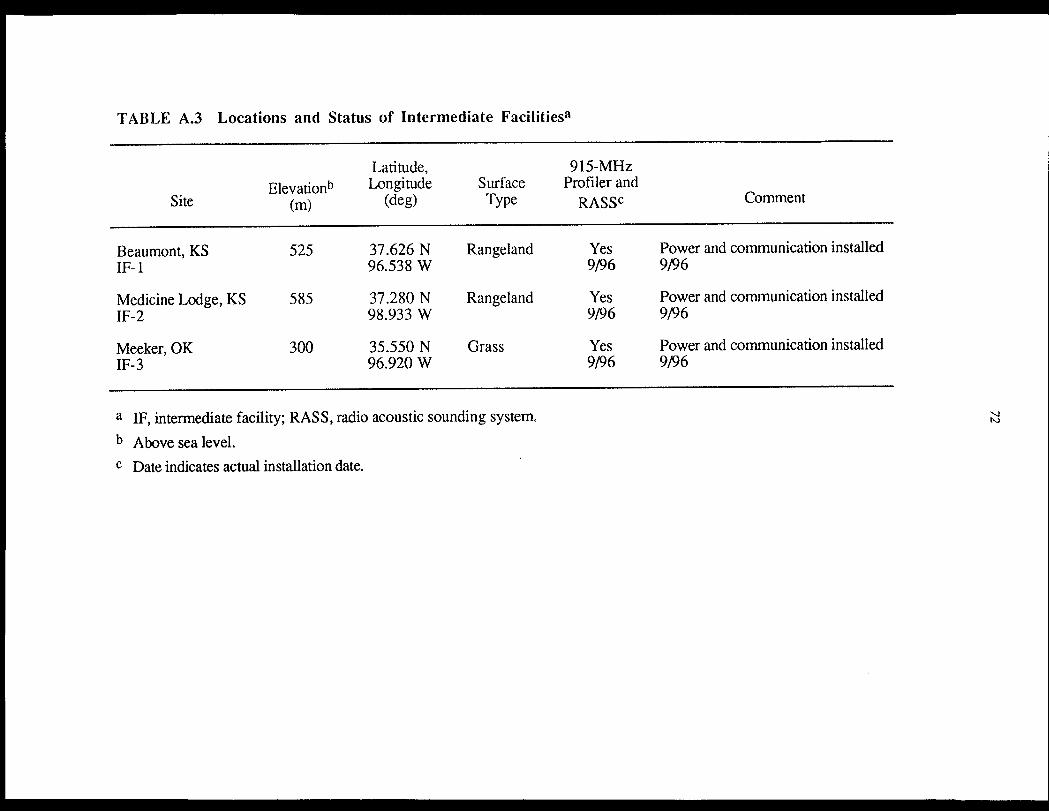
TABLE A.3 Locations and Status of Intermediate Facilities~
Latitude, 915-MHZ
Elevationb Longitude Surface Profiler andSite (m) (deg) Type RASSc Comment
Beaumont, KS 525 37.626 N Rangeland Yes Power and communication installedIF- 1 96.538 W 9196 9/96
Medicine Lodge, KS 585 37.280 N Rangeland Yes Power and communication installedIF-2 98.933 W 9P6 9/96
Meeker, OK 300 35.550N Grass Yes Power and communication installedIF-3 96.920 W 9/96 9/96
a IF, intermediate facility; RAS S, radio acoustic sounding system,
b A~Ve sea level.
c Date indicates actual installation date.
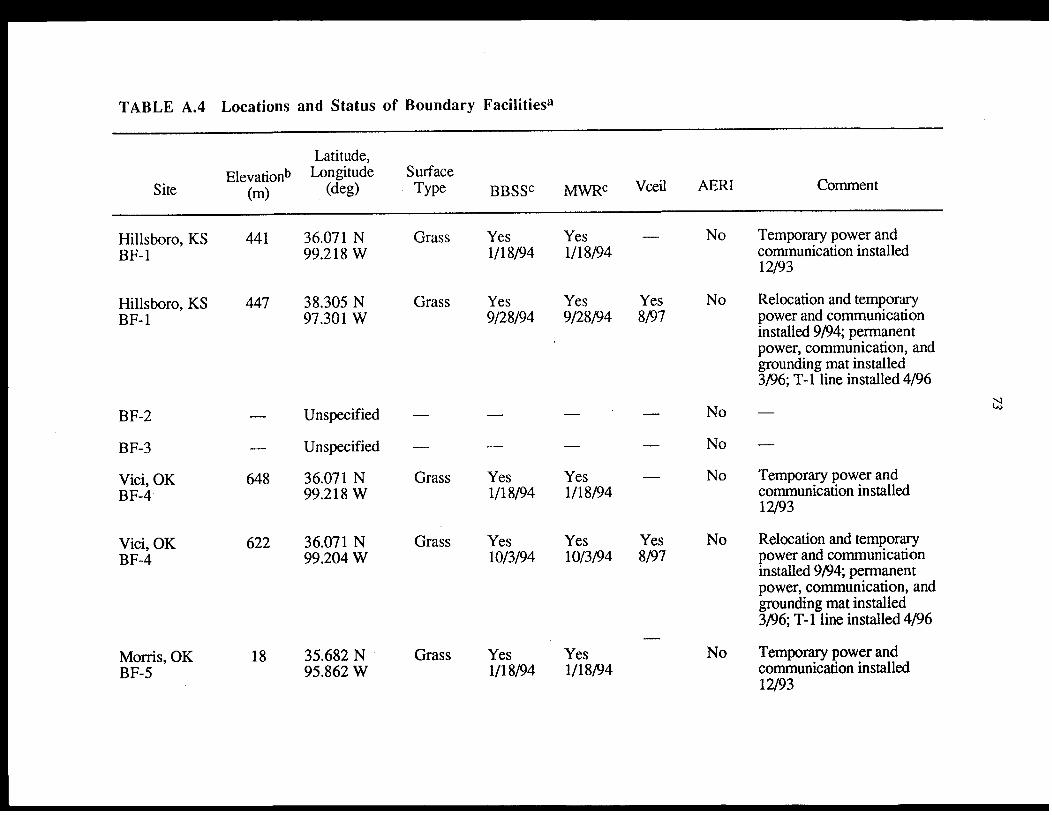
TABLE A.4 Locations and Status of Boundary Facilitiesa
Latitude,
Elevationb ‘n@ude SurfaceSite (m) (deg) Type BBSSC MWRc Vceil AERI Comment
Hillsboro, KSBF- 1
Hillsboro, KSBF- 1
BF-2
BF-3
Vici, OKBF-4
Vici, OKBF-4
Morris, OKBF-5
441
447
—
—
648
622
18
36,071 N99.218 W
38.305 N97.301 w
Unspecified
Unspecified
36.071 N99.218 W
36.071 N99.204 W
35.682 N95.862 W
(hss
Grdss
—
—
Grass
Grass
Grass
Yes1/18/94
Yes9/28/94
—
—
Yes1/18/94
Yes10/3/94
Yes1/18/94
Yes1/18/94
Yes9/28/94
—
—
Yes1/18/94
Yes10/3/94
Yes1/18/94
—
Yes8/97
—
—
—
Yes8/97
—
No
No
No
No
No
No
No
Temporary power andcommunication installed12/93
Relocation and temporarypower and communicationinstalled 9/9q permanentpower, communication, andgrounding mat installed3/96; T-1 line installed 4/96
d
—
Temporary power andcommunication installed12/93
Relocation and temporarypower and communicationinstalled 9/94, permanentpower, communication, andgrounding mat installed3/96; T-1 line installed 4/96
Temporary power andcommunication installed12/93

TABLE A.4 (Cont.)
Latitude,
Elevation ~~~~de SurfaceSite (m) Type BBSSC MWRC Vceil AERI Comment
Morris, OK 217 35.688 N Grass Yes Yes Yes No Relocation and temporaryBF-5 95.856 W 10/6/94 10/6/94 8/97 power and communication
installed 9/94; permanentpower, communication, andgrounding rn~t installed3/96; T-1 line installed 4/96
Purceli, OK 344 34.969 N Grass Yes Yes Yes Yes Permanent power,BF-6 97.415 w 9/23/94 9/23/94 8/97 10/97 communication, and
grounding mat installed3/96; T-1 line installed 4/96 w
a
b
c
AERI, atmospherically emitted radiance interferomete~ BBSS, balloon-borne sounding system; BF, boundary facility;MWR, microwave radiometer Vceil, Vaisala ceilometer.
Above sea level.
Date indicates actual installation date.