site effects evaluation in catania (italy) by means …
TRANSCRIPT

ANNALS OF GEOPHYSICS, 61, 2, SE224, 2018; doi: 10.4401/ag-7708
1
“SITE EFFECTS EVALUATION IN CATANIA (ITALY) BY MEANS OF 1-DNUMERICAL ANALYSIS„Antonio Ferraro1, Salvatore Grasso1,*, Maria Rossella Massimino1
(1) Department of Civil Engineering and Architecture (DICAr), University of Catania, Catania, Italy
1. INTRODUCTION
In the period 2014-2016, a Project financed by theEuropean Community was carried out to investigate theseismic hazard of some areas in eastern Sicily. Withinthis project, four strategic test sites in Messina [1) andCatania (3) have been studied, because of the fact thatthese cities are at high seismic risk [Abate et al., 2006;2017]. Messina suffered the destructive earthquake of
1908 that caused thousands of deaths, injured and dis-placed, while Catania suffered, since 1169, a number ofdestructive earthquakes, among which we mainly re-member the earthquakes of 1169, 1693, 1818 and 1990[De Rubeis et al., 1991].
In order to study the dynamic characteristics ofsoils in three Catania test sites, laboratory and in situinvestigations have been carried out to obtain soil pro-files with special attention being paid to the variation
Article historyReceveid July 27, 2017; accepted February 23, 2018.Subject classification:Site response analysis; Scenario earthquakes; Catania; Messina.
ABSTRACTA probabilistic seismic hazard analysis (PSHA) determines the probability rate of exceeding of various levels of ground motion in a speci-
fied period of time, in a given area. On the other hand, the neo-deterministic seismic hazard assessment (NDSHA) is based on modeling tech-
niques, developed from physical knowledge of the seismic source process and of the propagation of seismic waves, which can realistically
simulate the ground motion due to an earthquake by means of synthetic seismograms. The NDSHA confirms that peak ground acceleration
values are larger than those given by the PSHA in areas where large earthquakes are observed and in areas identified as prone to large earth-
quakes, such as in the case of the city of Catania (Italy). The city of Catania, located on the eastern part of Sicily, is one of the most seismi-
cally active areas of Italy. The Val di Noto earthquake of January 11, 1693 is considered one of the biggest earthquakes which occurred in
Italy. Site response analyses have been developed for a group of 3 test sites in the city of Catania (Italy). On the sites are localised some strate-
gic buildings to upgrade against seismic risk. The analysis of seismic ground response at the sites was conducted using a numerical method,
which is developed in three main phases: the definition of the geometric, geological and geotechnical model of the subsurface, the defini-
tion of the seismic input (synthetic or recorded), the choice of one or more computer codes to use and process the results. The reconstruc-
tion of the geological and geotechnical model of the subsurface has highlighted a morphology quite irregular especially with regard to the
covers. One-dimensional local site response analyses have been performed assuming that all geologic boundaries are horizontal and the re-
sponse of soil deposits is predominantly caused by waves propagating vertically from the underlying bedrock. Equivalent linear analysis
using EERA code has been performed in this study. One of the targets of the paper is the development of measures for the seismic retrofitting
of buildings. Seismic retrofitting and/or improving have to be definitely considered a multidisciplinary subject, which depends in fact on
many factors, such as: local site effects and the dynamic interaction between the foundation soil and the structure. The accurate investiga-
tion on the structure and the surrounding soil is the first fundamental step for a realistic evaluation of the structure seismic performance.
of the shear modulus G and damping ratio D with depth.Seismic Dilatometer Marchetti Tests (SDMT) have been alsocarried out in the area of the “National Institute of Geo-physics and Volcanology” building (INGV) and in the“Madre Teresa di Calcutta” building school (CD MTC),with the aim of an accurate geotechnical characterisation,including the evaluation of the shear wave velocity Vs pro-file, as well as the profile of the horizontal stress index Kd.
Shear wave velocity has been measured by differenttests. The soil profiles in terms of the shear modulus G0 andin terms of the shear wave velocity Vs have been evalu-ated and compared by different in situ tests.
The redundancy of measurements is very useful, for in-stance, for site response and liquefaction analyses, whichcan be based either on Vs values or Kd values.
Boreholes were driven and undisturbed samples wereretrieved for laboratory tests. Because of their relevance onthe estimation of local ground shaking and site effects,data from in-hole geophysical surveys (Down-Hole andSeismic Dilatometer Marchetti Test) have been examinedwith special attention, particularly for S wave velocitymeasurements. It must be noted that the shear wave ve-locity Vs was evaluated on the basis of both empiricalcorrelations with in situ or laboratory tests and a fewdirect measurements.
One-dimensional local site response analyses havebeen performed assuming that all geologic boundaries arehorizontal and the response of soil deposits is predomi-nantly caused by waves propagating vertically from theunderlying bedrock. Among the programs that adopt theequivalent linear analysis EERA code [Bardet et al., 2000]has been used in this study.
The three test sites in Catania are two school buildingsin the province of Catania, the Catania division of the Na-tional Institute of Geophysics and Volcanology (indicatedby the INGV acronym) and finally the fourth test site is theMessina’s Regional Department of Civil Defence (indicatedby the DRPC acronym). In this paper, the results of localseismic response analysis at the INGV site in Catania andat the DRPC site in Messina are presented.
2. THE STUDY AREAS
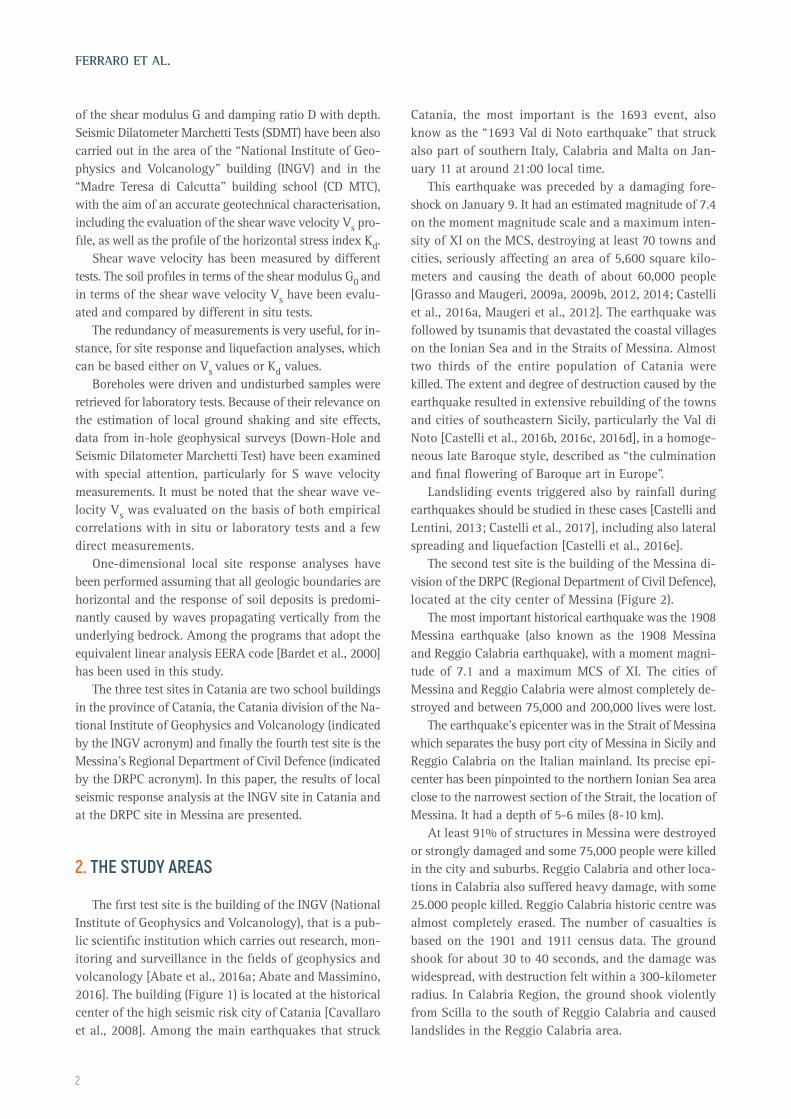
The first test site is the building of the INGV (NationalInstitute of Geophysics and Volcanology), that is a pub-lic scientific institution which carries out research, mon-itoring and surveillance in the fields of geophysics andvolcanology [Abate et al., 2016a; Abate and Massimino,2016]. The building (Figure 1) is located at the historicalcenter of the high seismic risk city of Catania [Cavallaroet al., 2008]. Among the main earthquakes that struck
Catania, the most important is the 1693 event, alsoknow as the “1693 Val di Noto earthquake” that struckalso part of southern Italy, Calabria and Malta on Jan-uary 11 at around 21:00 local time.
This earthquake was preceded by a damaging fore-shock on January 9. It had an estimated magnitude of 7.4on the moment magnitude scale and a maximum inten-sity of XI on the MCS, destroying at least 70 towns andcities, seriously affecting an area of 5,600 square kilo-meters and causing the death of about 60,000 people[Grasso and Maugeri, 2009a, 2009b, 2012, 2014; Castelliet al., 2016a, Maugeri et al., 2012]. The earthquake wasfollowed by tsunamis that devastated the coastal villageson the Ionian Sea and in the Straits of Messina. Almosttwo thirds of the entire population of Catania werekilled. The extent and degree of destruction caused by theearthquake resulted in extensive rebuilding of the townsand cities of southeastern Sicily, particularly the Val diNoto [Castelli et al., 2016b, 2016c, 2016d], in a homoge-neous late Baroque style, described as “the culminationand final flowering of Baroque art in Europe”.
Landsliding events triggered also by rainfall duringearthquakes should be studied in these cases [Castelli andLentini, 2013; Castelli et al., 2017], including also lateralspreading and liquefaction [Castelli et al., 2016e].
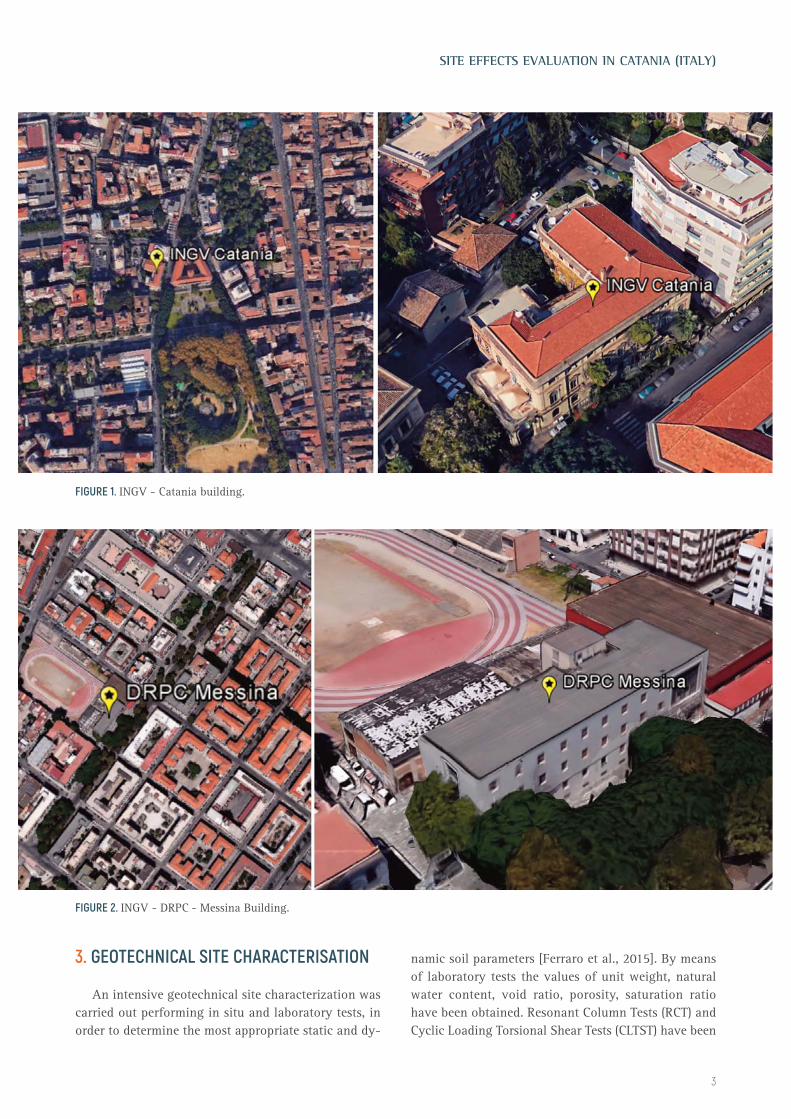
The second test site is the building of the Messina di-vision of the DRPC (Regional Department of Civil Defence),located at the city center of Messina (Figure 2).
The most important historical earthquake was the 1908Messina earthquake (also known as the 1908 Messinaand Reggio Calabria earthquake), with a moment magni-tude of 7.1 and a maximum MCS of XI. The cities ofMessina and Reggio Calabria were almost completely de-stroyed and between 75,000 and 200,000 lives were lost.
The earthquake’s epicenter was in the Strait of Messinawhich separates the busy port city of Messina in Sicily andReggio Calabria on the Italian mainland. Its precise epi-center has been pinpointed to the northern Ionian Sea areaclose to the narrowest section of the Strait, the location ofMessina. It had a depth of 5-6 miles (8-10 km).
At least 91% of structures in Messina were destroyedor strongly damaged and some 75,000 people were killedin the city and suburbs. Reggio Calabria and other loca-tions in Calabria also suffered heavy damage, with some25.000 people killed. Reggio Calabria historic centre wasalmost completely erased. The number of casualties isbased on the 1901 and 1911 census data. The groundshook for about 30 to 40 seconds, and the damage waswidespread, with destruction felt within a 300-kilometerradius. In Calabria Region, the ground shook violentlyfrom Scilla to the south of Reggio Calabria and causedlandslides in the Reggio Calabria area.
FERRARO ET AL.
2
3. GEOTECHNICAL SITE CHARACTERISATION
An intensive geotechnical site characterization wascarried out performing in situ and laboratory tests, inorder to determine the most appropriate static and dy-
namic soil parameters [Ferraro et al., 2015]. By meansof laboratory tests the values of unit weight, naturalwater content, void ratio, porosity, saturation ratiohave been obtained. Resonant Column Tests (RCT) andCyclic Loading Torsional Shear Tests (CLTST) have been
3
SITE EFFECTS EVALUATION IN CATANIA (ITALY)
FIGURE 2. INGV - DRPC - Messina Building.
FIGURE 1. INGV - Catania building.
also performed [Cavallaro et al., 2012; Caruso et al.,2016; Castelli et al., 2016f; Cavallaro et al., 2016a; 2016b].
The types of tests performed are the same for bothsites (INGV and DRPC), in fact, for each site, three
boreholes were carried out, with undisturbed soil sampling.The three surveys were also equipped in order to performDown Hole (D-H) and Cross Hole (C-H) tests according tothis sequence: S1 and S2 boreholes for the execution of a
FERRARO ET AL.
4
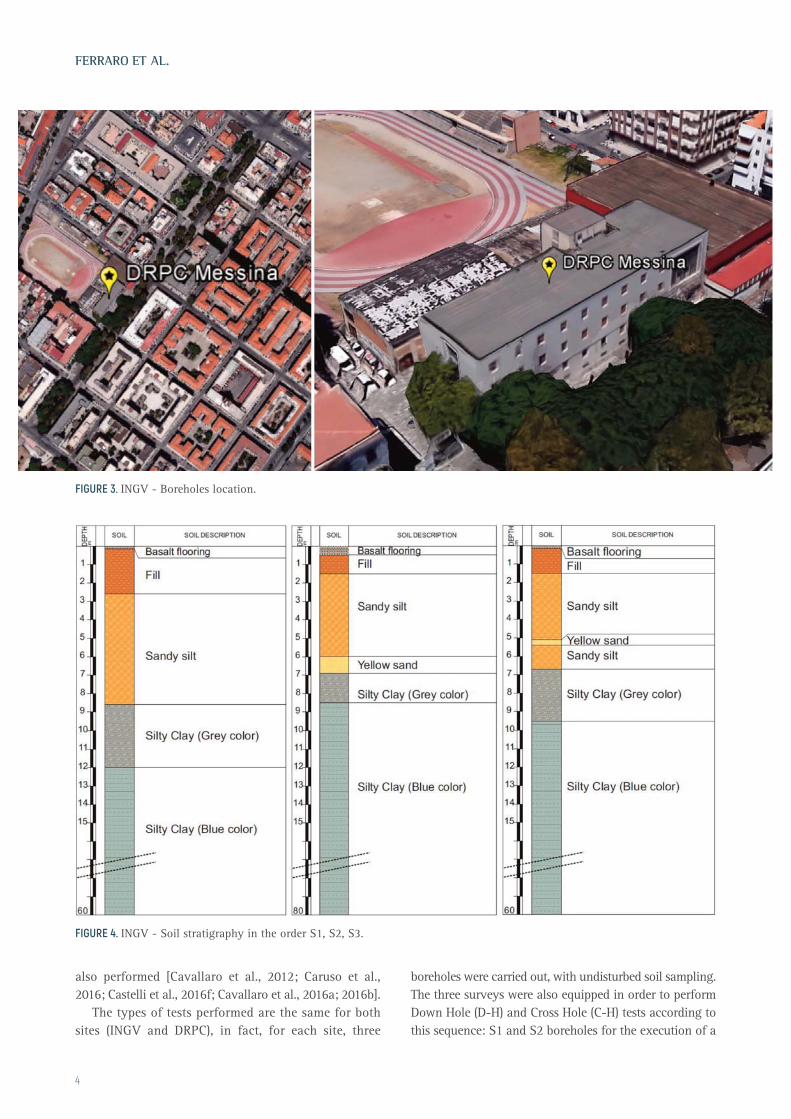
FIGURE 3. INGV - Boreholes location.
FIGURE 4. INGV - Soil stratigraphy in the order S1, S2, S3.
Cross Hole test and S3 boreholes for the execution of theDown Hole test. Seismic Dilatometer Marchetti TestsSDMTs have been also performed in each site.
INGV CATANIA TEST SITEFigure 3 shows the location of the three boreholes
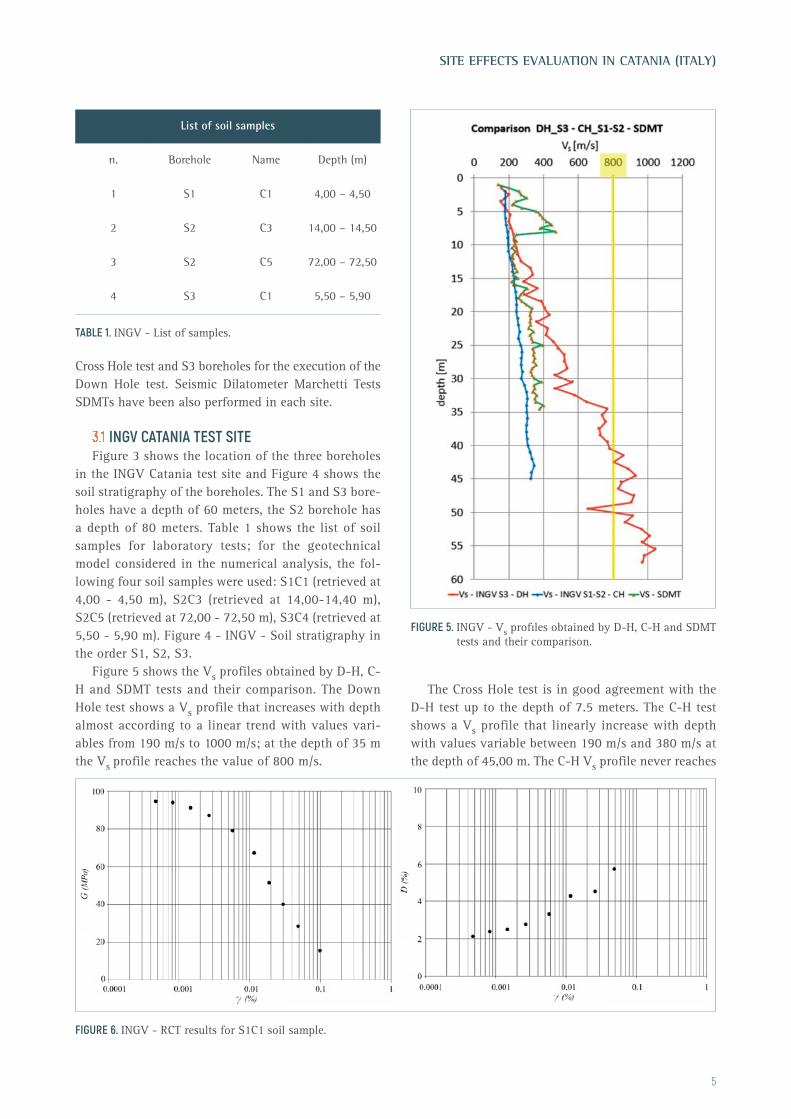
in the INGV Catania test site and Figure 4 shows thesoil stratigraphy of the boreholes. The S1 and S3 bore-holes have a depth of 60 meters, the S2 borehole hasa depth of 80 meters. Table 1 shows the list of soilsamples for laboratory tests; for the geotechnicalmodel considered in the numerical analysis, the fol-lowing four soil samples were used: S1C1 (retrieved at4,00 - 4,50 m), S2C3 (retrieved at 14,00-14,40 m),S2C5 (retrieved at 72,00 - 72,50 m), S3C4 (retrieved at5,50 - 5,90 m). Figure 4 - INGV - Soil stratigraphy inthe order S1, S2, S3.
Figure 5 shows the Vs profiles obtained by D-H, C-H and SDMT tests and their comparison. The DownHole test shows a Vs profile that increases with depthalmost according to a linear trend with values vari-ables from 190 m/s to 1000 m/s; at the depth of 35 mthe Vs profile reaches the value of 800 m/s.
The Cross Hole test is in good agreement with theD-H test up to the depth of 7.5 meters. The C-H testshows a Vs profile that linearly increase with depthwith values variable between 190 m/s and 380 m/s atthe depth of 45,00 m. The C-H Vs profile never reaches
5
SITE EFFECTS EVALUATION IN CATANIA (ITALY)
List of soil samples
n. Borehole Name Depth (m)
1 S1 C1 4,00 – 4,50
2 S2 C3 14,00 – 14,50
3 S2 C5 72,00 – 72,50
4 S3 C1 5,50 – 5,90
TABLE 1. INGV - List of samples.
FIGURE 5. INGV - Vs profiles obtained by D-H, C-H and SDMTtests and their comparison.
FIGURE 6. INGV - RCT results for S1C1 soil sample.

the 800 m/s value. The SDMT test shows a dual be-haviour: up to the depth of 7.5 m it seems to overes-timate Vs values compared to D-H and C-H tests, whilefrom 7.5 m to 45 m it shows a linear trend with val-ues that lie in the middle between the results of the D-H test and the C-H test results. This apparatus was alsoused in offshore condition by Cavallaro et al. [2013a,2013b]. Results of Resonant Column Tests (RCT) andCyclic Loading Torsional Shear Tests (CLTST) are pre-sented in Figures 6-8 to evaluate the shear modulus Gand damping ratio D variation with the shear strainlevel γ. These tests are fundamental for the accurateevaluation of local site response analyses, as well asfor the evaluation of the dynamic behavior of full-coupled soil-structure systems [Abate et al., 2007;2015; Massimino et al., 2015]. The specimen wasanisotropically reconsolidated to the best estimate ofthe in situ effective vertical and horizontal stress. Thesame specimen was first subjected to RCT, then toCLTST after a rest period of 24 hrs with openeddrainage. CLTSTs were performed under stress control
condition by applying a torque with triangular timehistory at a frequency of 0.1 Hz.
DRPC MESSINA TEST SITEFigure 9 shows the location of the three boreholes in
the DRPC Messina site while Figure 10 shows the soilstratigraphy of the boreholes. Table 2 shows the list ofthe soils samples involved in the RCTs and CLTSTs. Forthe geotechnical model considered in the numerical anal-ysis, the following five soil samples were used: S2C1 (re-trieved at 3,00 - 3,50 m), S1C1 (retrieved at 7,00-7,40 m),S3C2 (retrieved at 14,60 - 15,00 m), S2C3 (retrieved at18,00 - 18,50 m), S3C4 (retrieved at 27,00 - 27,50 m).
Results of Resonant Column Tests (RCT) and CyclicLoading Torsional Shear Tests (CLTST) are presented inFigures 11-15 to evaluate the shear modulus G anddamping ratio D. The specimen was anisotropically re-consolidated to the best estimate of the in situ effectivevertical and horizontal stress. The same specimen wasfirst subjected to RCT, then to CLTST after a rest periodof 24 hrs with opened drainage. CLTSTs were performed
FERRARO ET AL.
6
FIGURE 7. INGV - RCT results for S2C3 soil sample.
FIGURE 8. INGV - RCT results for S2C5 soil sample.

under stress control condition by applying a torque withtriangular time history at a frequency of 0.1 Hz.
Figure 16 shows the Vs profiles obtained by D-H, C-H and SDMT tests and their comparison. The Down Holetest shows a Vs profile that increase with depth almostaccording to a linear trend with values variables from190 m/s to 1000 m/s; at the depth of about 50 m the Vsprofile reaches the value of 800 m/s. The Cross Hole testis in good agreement with the Down Hole test. The C-Htest shows a Vs profile that linearly increase with depthwith values variable between 190 m/s and 800 m/s at
the depth of about 50,00 m. The SDMT test shows Vsvalues which are in good agreement if compared to D-H and C-H tests, up to the depth of 30 m.
4. NUMERICAL ANALYSES IN THE TEST SITES
One-dimensional local site response analyses as-sume that all geologic boundaries are horizontal andthe response of soil deposits is predominantly caused bywaves propagating vertically from the underlying
7
SITE EFFECTS EVALUATION IN CATANIA (ITALY)
FIGURE 9. DRPC - Messina building.
FIGURE 10. DRPC - Soil stratigraphy in the order S1, S2, S3.

bedrock. So, one-dimensional numerical codes are validfor modelling plane-parallel layers along a verticalcolumn, assuming laterally-homogeneous stratigraphy.Under these assumptions, the main factors responsiblefor seismic motion amplifications are: 1) impedancecontrasts between ground layers, particularly withbedrock; 2) resonance effects due to the closeness be-tween the frequencies of the motion at the substrate andthe natural vibration of the deposit. Calculation proce-dures consider, in the solution of the dynamic equilib-rium of the system, the non-linear relation through twotypes of analyses: equivalent linear and nonlinear anal-yses. The equivalent linear analysis consists in the ex-ecution of a sequence of complete linear analysis withsubsequent update of the parameters of stiffness anddamping until the satisfaction of a predetermined con-vergence criterion. There parameters depend on thestate of deformation of the ground. The nonlinear anal-ysis consists in the integration step-by-step of theequations of motion, simultaneously changing the pa-rameter values of stiffness and damping.
FERRARO ET AL.
8
FIGURE 11. DRPC RCT results for S2C1 soil sample.
FIGURE 12. DRPC RCT results for S1C1 soil sample.
List of soil samples
n. Borehole Name Depth (m)
1 S1 C1 7,00 – 7,40
2 S1 C2 19,50 – 19,90
3 S2 C1 3,00 – 3,50
4 S2 C3 18,00 – 18,50
5 S3 C1 5,50 – 6,00
6 S3 C2 14,60 – 15,00
7 S3 C4 27,00 – 27,50
TABLE 2. DRPC - List of soil samples.

The first analysis provides satisfactory results at notexcessive deformation of the ground, less than 1%, forhigher deformation is necessary to use non-linear in-cremental analysis. Among the programs that adopt theequivalent linear analysis the best known and most fre-
quently used is the computer code SHAKE [Schnabel etal., 1972a, 1972b; Idriss and Sun, 1992] and later revi-sions like EERA [Bardet et al., 2000], which has beenused in this study. They work in the total stresses fieldusing the Kelvin-Voigt physical model (continuous and
9
SITE EFFECTS EVALUATION IN CATANIA (ITALY)
FIGURE 13. DRPC RCT results for S3C2 soil sample.
FIGURE 14. DRPC RCT results for S2C3 soil sample.
FIGURE 15. DRPC RCT results for S3C4 soil sample.

homogeneous layers with linearized visco-elastic be-haviour).
It consists of flat and parallel layers of infinite hori-zontal extension on an outcropping half-space corre-
sponding to the bedrock, on which the input motionis applied.
Each layer is considered to be homogeneous andisotropic and characterized by the thickness h, the den-sity, the shear modulus G and the damping ratio ξ. Theinput motion propagates in the direction perpendicular tothe free surface. Figure 17 shows the calculation schemefor N layers with these properties: shear modulus G,damping ratio ξ, thickness h. The amplitude of incidentand reflected waves in each layer, and reflected waves FNat the bedrock are unknown. The incident wave EN at thebedrock is given. The calculation method considers themotion equations applied in each layer under two con-ditions: 1) the congruence between displacements andstresses at the interfaces; 2) equilibrium between incidentand reflected waves at the surface.
Finally, in order to take into account the non linear soilbehaviour, an iterative procedure is carried out by con-sidering the behaviour of the shear modulus G and of thedamping ratio D, as functions of shear strain γ. The mainsteps of the iterative procedure are: 1) estimation for Gand ξ in each layer; 2) ground response calculation ineach layer; 3) effective shear strain calculation based onthe maximum shear strain; 4) new iteration based on Gand ξ new values and new ground response calculationuntil the desired convergence value is reached.
The results are presented in terms of acceleration timehistory, Fourier spectra, response spectra at the surfaceand in terms of maximum acceleration profiles as func-tion of the depth [Ferraro et al., 2009].
One dimensional equivalent linear analyses have beencarried out at the Catania INGV test site with differentbedrock depths (200 m, 300 m, 400 m, 600m) and at theMessina DRPC test site (DRPC-S1S2 and DRPC-S3).
FERRARO ET AL.
10
FIGURE 16. DRPC - D-H, C-H and SDMT Vs profiles and theircomparison.
FIGURE 17. One-dimensional layered soil deposit system [after Schnabel et al., 1972].
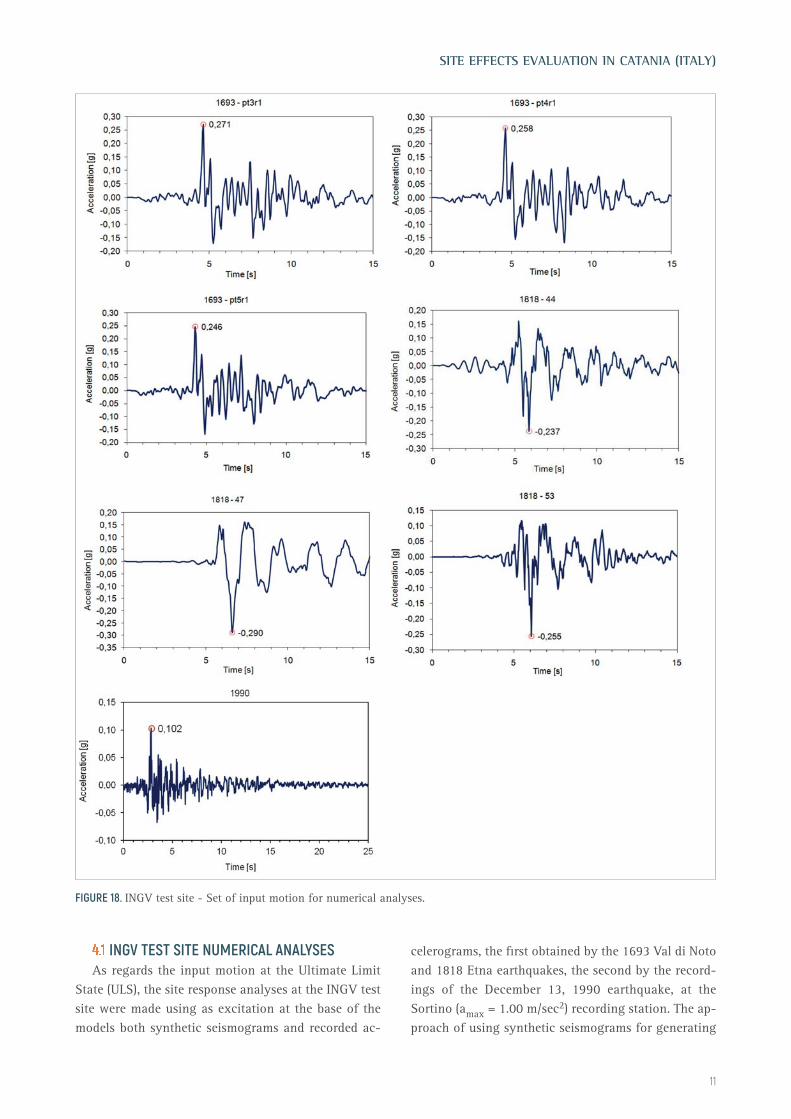
INGV TEST SITE NUMERICAL ANALYSESAs regards the input motion at the Ultimate Limit
State (ULS), the site response analyses at the INGV testsite were made using as excitation at the base of themodels both synthetic seismograms and recorded ac-
celerograms, the first obtained by the 1693 Val di Notoand 1818 Etna earthquakes, the second by the record-ings of the December 13, 1990 earthquake, at theSortino (amax = 1.00 m/sec2) recording station. The ap-proach of using synthetic seismograms for generating
11
SITE EFFECTS EVALUATION IN CATANIA (ITALY)
FIGURE 18. INGV test site - Set of input motion for numerical analyses.

FERRARO ET AL.
12
FIGURE 19. Soil model with bedrock at the depth of 200 m. Time history of surface acceleration (a), amplification ratio (b), spec-tral acceleration (c).
(a)
FIGURE 20. Soil model with bedrock at the depth of 300 m. Time history of surface acceleration (a), amplification ratio (b), spec-tral acceleration (c).
(c)
(b)
(a)
(c)
(b)

13
SITE EFFECTS EVALUATION IN CATANIA (ITALY)
FIGURE 21. Soil model with bedrock at the depth of 400 m. Time history of surface acceleration (a), amplification ratio (b), spec-tral acceleration (c).
FIGURE 22 Soil model with bedrock at the depth of 600 m. Time history of surface acceleration (a), amplification ratio (b), spectralacceleration (c).
(a)
(c)
(b)
(a)
(c)
(b)
a seismic ground motion scenario at the bedrock has beenso used in the present work. The reference events werethe catastrophic earthquakes that struck Eastern Sicily:on January 11, 1693, assumed as a level I maximumcredible earthquake scenario; on February 20, 1818, as-sumed as a level II base operative earthquake scenario.
The epicentre of the source in the case of 1693 sce-nario is about 13 km far from the coast, which is con-sidered as the coordinate system source. A magnitudeM = 7.0, corresponding to the destructive event whichstruck Catania in 1693, has been taken into account.The source has been simulated through the overlayingof 5 sources placed at different depths and activated atdifferent times, simulating approximately the propaga-tion of the rupture on the segment fault. Seismograms
FERRARO ET AL.
14
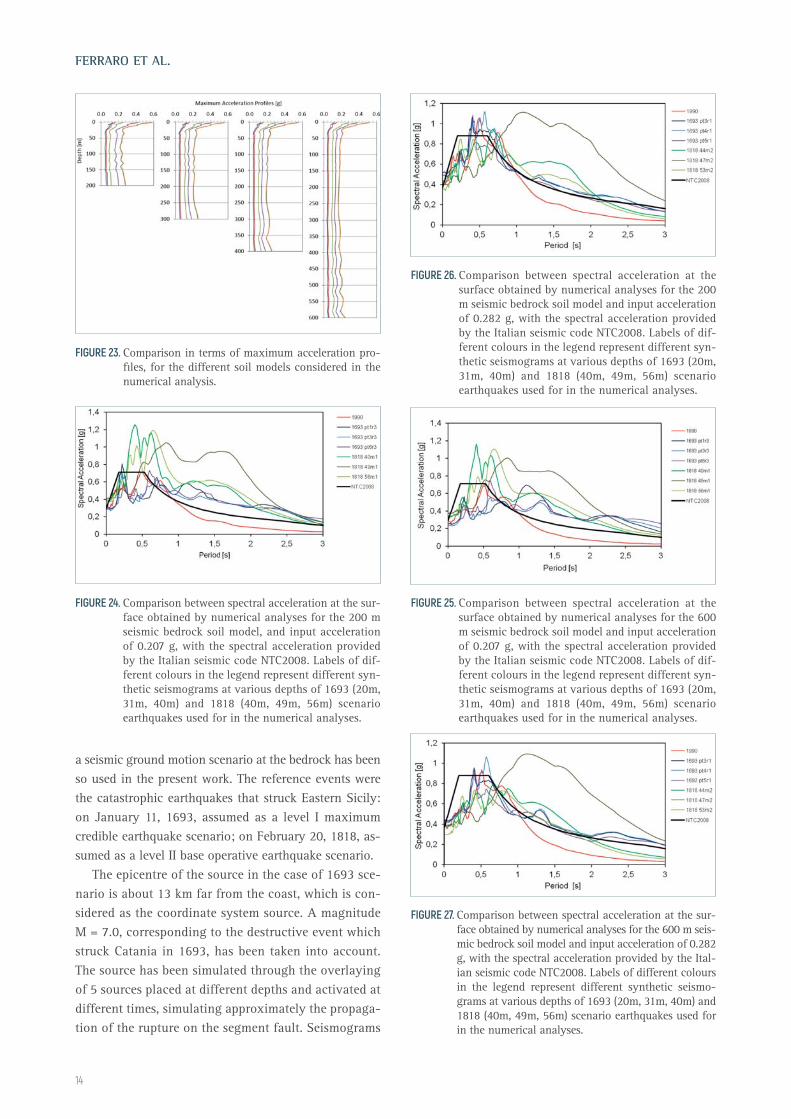
FIGURE 23. Comparison in terms of maximum acceleration pro-files, for the different soil models considered in thenumerical analysis.
FIGURE 24. Comparison between spectral acceleration at the sur-face obtained by numerical analyses for the 200 mseismic bedrock soil model, and input accelerationof 0.207 g, with the spectral acceleration providedby the Italian seismic code NTC2008. Labels of dif-ferent colours in the legend represent different syn-thetic seismograms at various depths of 1693 (20m,31m, 40m) and 1818 (40m, 49m, 56m) scenarioearthquakes used for in the numerical analyses.
FIGURE 25. Comparison between spectral acceleration at thesurface obtained by numerical analyses for the 600m seismic bedrock soil model and input accelerationof 0.207 g, with the spectral acceleration providedby the Italian seismic code NTC2008. Labels of dif-ferent colours in the legend represent different syn-thetic seismograms at various depths of 1693 (20m,31m, 40m) and 1818 (40m, 49m, 56m) scenarioearthquakes used for in the numerical analyses.
FIGURE 27. Comparison between spectral acceleration at the sur-face obtained by numerical analyses for the 600 m seis-mic bedrock soil model and input acceleration of 0.282g, with the spectral acceleration provided by the Ital-ian seismic code NTC2008. Labels of different coloursin the legend represent different synthetic seismo-grams at various depths of 1693 (20m, 31m, 40m) and1818 (40m, 49m, 56m) scenario earthquakes used forin the numerical analyses.
FIGURE 26. Comparison between spectral acceleration at thesurface obtained by numerical analyses for the 200m seismic bedrock soil model and input accelerationof 0.282 g, with the spectral acceleration providedby the Italian seismic code NTC2008. Labels of dif-ferent colours in the legend represent different syn-thetic seismograms at various depths of 1693 (20m,31m, 40m) and 1818 (40m, 49m, 56m) scenarioearthquakes used for in the numerical analyses.

15
SITE EFFECTS EVALUATION IN CATANIA (ITALY)
200 m soil model
1693pt1r3
1693pt3r3
1693pt6r3
181840m1
181849m1
181856m1
1990
PGANTC 2008 soil A 0,207 0,207 0,207 0,207 0,207 0,207 0,207
PGAoutput_EERA 0,300 0,282 0,296 0,387 0,411 0,372 0,315
R = PGAoutput_EERA/PGANTC 2008 1,45 1,36 1,43 1,87 1,99 1,80 1,52
600m soil model
1693pt1r3
1693pt3r3
1693pt6r3
181840m1
181849m1
181856m1
1990
PGANTC 2008 soil A 0,207 0,207 0,207 0,207 0,207 0,207 0,207
PGAoutput_EERA 0,255 0,236 0,257 0,335 0,374 0,346 0,283
R = PGAoutput_EERA/PGANTC 2008 1,45 1,36 1,43 1,87 1,99 1,80 1,52
200 m soil model
1693pt3r1
1693pt4r1
1693pt5r1
181844m2
181847m2
181853m2
1990
PGANTC 2008 soil A 0,282 0,282 0,282 0,282 0,282 0,282 0,282
PGAoutput_EERA 0,519 0,493 0,492 0,434 0,401 0,354 0,429
R = PGAoutput_EERA/PGANTC 2008soil A 1,84 1,75 1,74 1,54 1,42 1,26 1,52
S2 - bedrock 600 m
1693pt3r1
1693pt4r1
1693pt5r1
181844m2
181847m2
181853m2
1990
PGANTC 2008 soil A 0,282 0,282 0,282 0,282 0,282 0,282 0,282
PGAoutput_EERA 0,439 0,446 0,430 0,382 0,393 0,300 0,380
R = PGAoutput_EERA/PGANTC 2008soil A 1,56 1,58 1,52 1,35 1,39 1,06 1,35
TABLE 6. Results in terms of maximum acceleration at the surface and soil amplification factor R, for the 600 m soil model, usingas input ag = 0.282 g acceleration value.
TABLE 3. Results in terms of maximum acceleration at the surface and soil amplification factor R, for the 200 m soil model, usingas input ag = 0.207 g acceleration value.
TABLE 4. Results in terms of maximum acceleration at the surface and soil amplification factor R, for the 600 m soil model, usingas input ag = 0.207 g acceleration value.
TABLE 5. Results in terms of maximum acceleration at the surface and soil amplification factor R, for the 200 m soil model, usingas input ag = 0.282 g acceleration value.
have been drawn for each site long a set of six receiversplaced at different depths, starting from the surface up
to almost 170 m [Grasso et al., 2005].
In the case of level II 1818 earthquake scenario seis-
FERRARO ET AL.
16
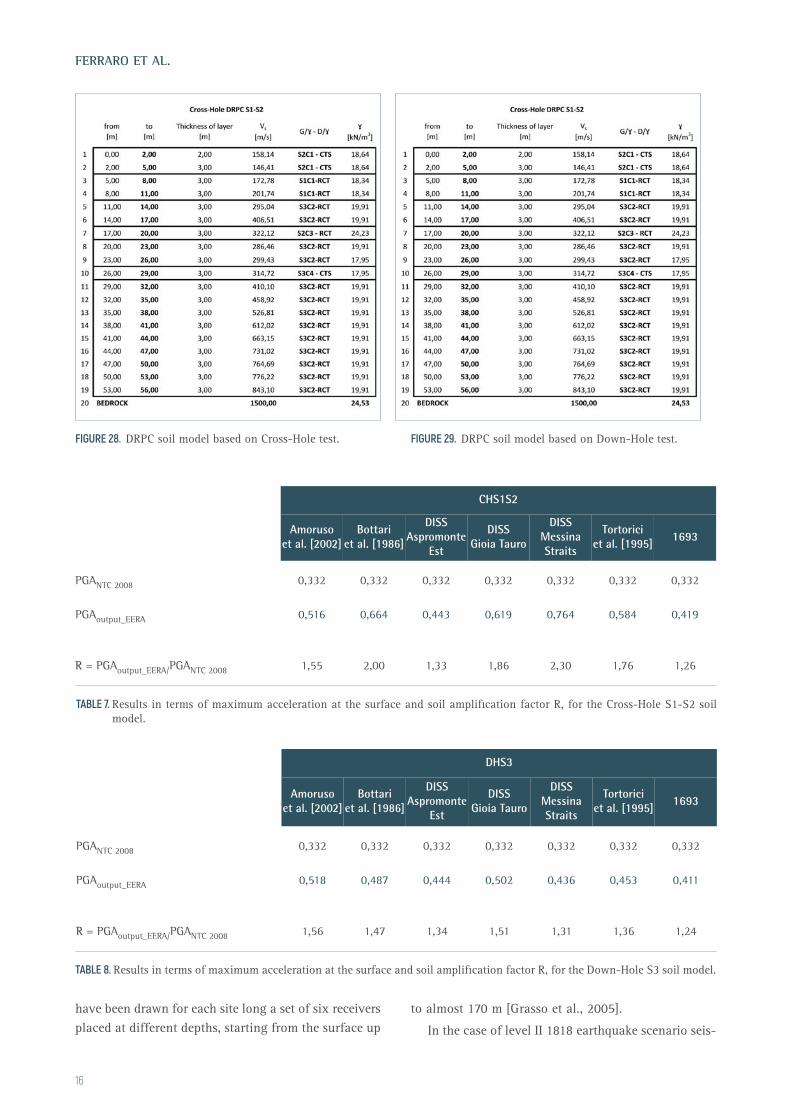
FIGURE 28. DRPC soil model based on Cross-Hole test. FIGURE 29. DRPC soil model based on Down-Hole test.
CHS1S2
Amorusoet al. [2002]
Bottariet al. [1986]
DISSAspromonte
Est
DISSGioia Tauro
DISSMessinaStraits
Tortoriciet al. [1995]
1693
PGANTC 2008 0,332 0,332 0,332 0,332 0,332 0,332 0,332
PGAoutput_EERA 0,516 0,664 0,443 0,619 0,764 0,584 0,419
R = PGAoutput_EERA/PGANTC 2008 1,55 2,00 1,33 1,86 2,30 1,76 1,26
DHS3
Amorusoet al. [2002]
Bottariet al. [1986]
DISSAspromonte
Est
DISSGioia Tauro
DISSMessinaStraits
Tortoriciet al. [1995]
1693
PGANTC 2008 0,332 0,332 0,332 0,332 0,332 0,332 0,332
PGAoutput_EERA 0,518 0,487 0,444 0,502 0,436 0,453 0,411
R = PGAoutput_EERA/PGANTC 2008 1,56 1,47 1,34 1,51 1,31 1,36 1,24
TABLE 7. Results in terms of maximum acceleration at the surface and soil amplification factor R, for the Cross-Hole S1-S2 soilmodel.
TABLE 8. Results in terms of maximum acceleration at the surface and soil amplification factor R, for the Down-Hole S3 soil model.
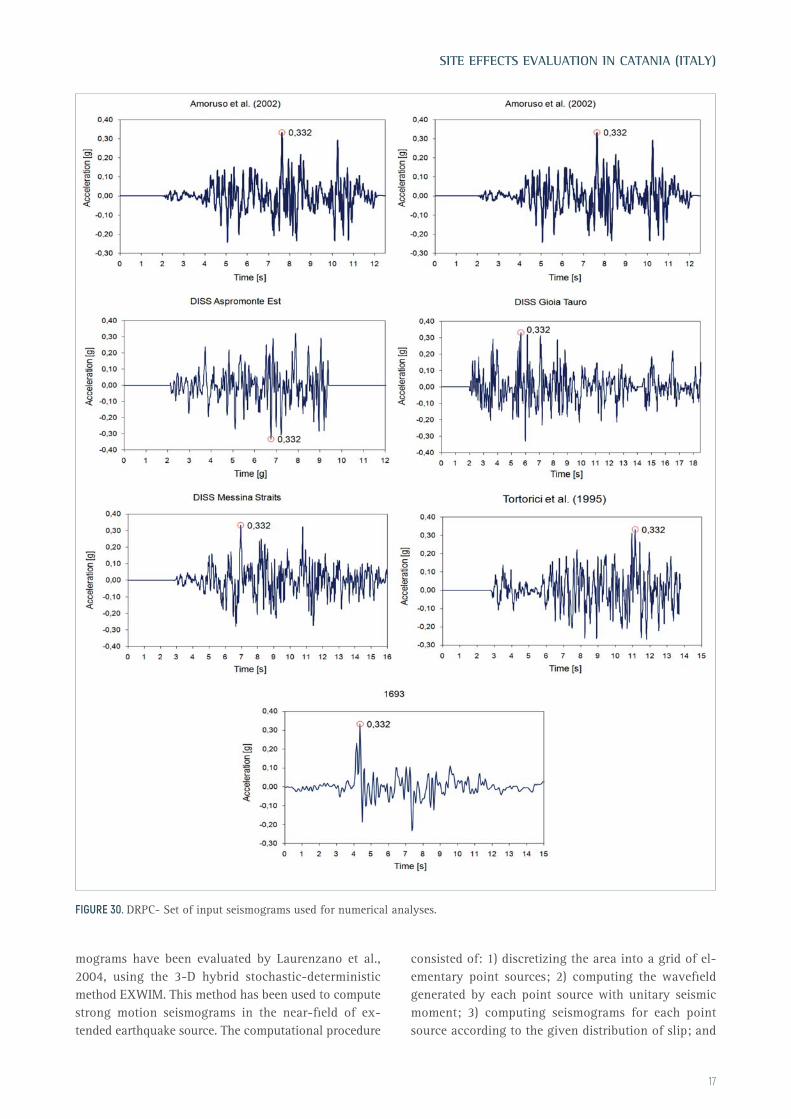
mograms have been evaluated by Laurenzano et al.,2004, using the 3-D hybrid stochastic-deterministicmethod EXWIM. This method has been used to computestrong motion seismograms in the near-field of ex-tended earthquake source. The computational procedure
consisted of: 1) discretizing the area into a grid of el-ementary point sources; 2) computing the wavefieldgenerated by each point source with unitary seismicmoment; 3) computing seismograms for each pointsource according to the given distribution of slip; and
17
SITE EFFECTS EVALUATION IN CATANIA (ITALY)
FIGURE 30. DRPC- Set of input seismograms used for numerical analyses.

4) summing up each contribution synchronized in timeto simulate the propagation of the rupture. Seismo-grams have been computed up to a maximum fre-quency of 20 Hz. The deterministic-stochastic transitionhas been set at 1.5-2 Hz. The maximum fault size hasbeen set at 26.6 km x 16.6 km, and it has been dis-cretized into 4895 elementary sources, with inter-spac-ing of 300 m. The ground motion has been computedat a regular grid of receivers covering the Catania mu-nicipal area. This area is sampled with 470 receivers,with inter-spacing of 300 m. The use of advancedmethods capable of generating of synthetic seismo-grams can give a valuable insight into the evaluationof a seismic ground motion scenario.
Recorded accelerograms of December 13, 1990 earth-quake and synthetic seismograms by 1693 and 1818have been scaled to different values of the PGA at thebedrock corresponding to different return periods in thecurrent Italian seismic code “seismic hazard and seismicclassification criteria for the national territory” obtainedby a probabilistic approach at ULS in the interactive seis-mic hazard maps.
Figure 18 shows some of the synthetic seismogramsby 1693 and 1818 scenario earthquakes and the recordedaccelerogram of December 13, 1990 earthquake used asinput for seismic response analyses.
Preliminary numerical analyses have been carried
FERRARO ET AL.
18
FIGURE 31. DRPC - CH-S1-S2 model. Results at the surface in terms of acceleration time history (a), amplification ratio (b) and spec-tral acceleration (c). Labels of different colours in the legend represent different synthetic seismograms obtained fromdifferent source models.
FIGURE 32. DRPC- CH-S1-S2 model. Maximum accelerationprofiles. Labels of different colours in the legendrepresent different synthetic seismograms obtainedfrom different source models.
(a)
(c)
(b)
out based on the 1990 recorded input motion scaled tosix different values of PGA provided by the current Ital-ian seismic code for different ULS and the different re-turn periods of 60, 101, 475, 949, 1898 and 1950 years:0.083 g; 0.102 g; 0.207 g; 0.282 g; 0.392 g; 0.397 g. InFigures 19-22 the results of site response analyses arepresented, for different bedrock depths (200 m, 300 m,400 m, 600m), in terms of time history of surface accel-eration, amplification ratio and spectral acceleration[Caruso et al., 2016]. Finally, the Figure 23 shows thecomparison in terms of maximum acceleration profiles,for the different soil models considered in the numericalanalysis. Additional seismic response analyses have beencarried out [Ferraro et al., 2016] for the 200 m and 600m seismic bedrock soil models, by using the same inputseismograms of Figure 18, scaled to the different valuesof acceleration of 0.207 g and 0.282 g provided by theItalian seismic code (ultimate limit state with return pe-riods of 475 and 949 years). The numerical analyses re-sults are shown in terms of response spectra at surface(Figures 24-27), and in terms of surface maximum ac-celeration and amplification ratio (Tables 3-6).
4.2 DRPC TEST SITE NUMERICAL ANALYSESNumerical analyses have been carried out
considering two soil models, based on the Cross-Holetest results (Figure 28) performed in the S1 and S2
19
SITE EFFECTS EVALUATION IN CATANIA (ITALY)
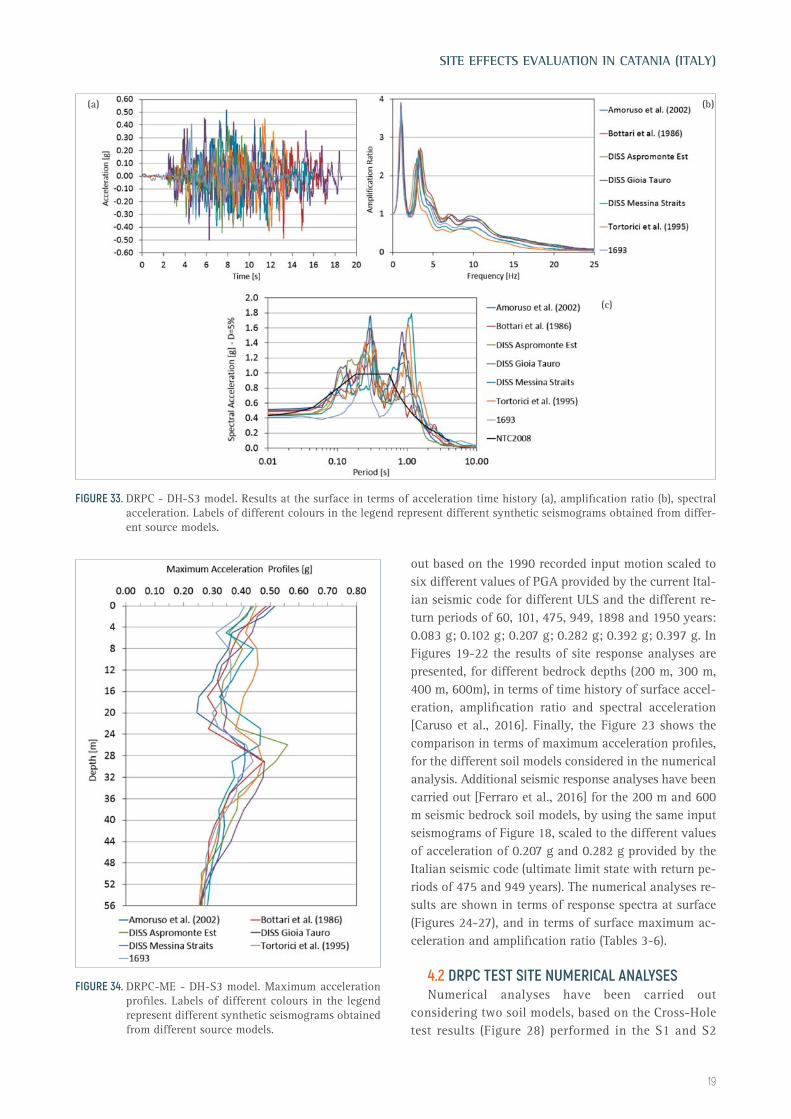
FIGURE 33. DRPC - DH-S3 model. Results at the surface in terms of acceleration time history (a), amplification ratio (b), spectralacceleration. Labels of different colours in the legend represent different synthetic seismograms obtained from differ-ent source models.
FIGURE 34. DRPC-ME - DH-S3 model. Maximum accelerationprofiles. Labels of different colours in the legendrepresent different synthetic seismograms obtainedfrom different source models.
(a)
(c)
(b)

boreholes, and on the Down-Hole test results (Figure29) performed in the S3 borehole, by using the seveninput seismograms [Amoruso et al., 2002] shown inFigure 30 obtained by a source modeling of 1908Messina and Reggio Calabria earthquake and 1693 Valdi Noto earthquake, scaled to the value of 0.332 g,provided by the Italian seismic code NTC2008(ultimate state limit with a return period of 949 years).
The numerical analyses results are shown inFigures 31-34 in terms of time history of surfacemaximum acceleration, amplification ratio andresponse spectra, and in terms of surface maximumacceleration and soil amplification factor R values(Tables 7-8).
5. CONCLUSIONS
In this study it was benefited of a great availabilityof borehole data, geophysical surveys and laboratorytests carried out from various campaigns of geologicalsurveys that, in different phases, have interested thearea of two tests sites in the cities of Catania andMessina seismic areas. In order to study the dynamiccharacteristics of soils in the test sites, in situ and lab-oratory investigations have been carried out to obtainsoil profiles with special attention being paid to thevariation of the shear modulus G and damping ratio Dwith depth.
Local site response analyses have been brought forthe site area at Ultimate Limitation State ULS by 1-Dlinear equivalent computer codes for the evaluation ofthe amplification factors of the maximum acceleration.Results of the site response analysis show high valuesin soil amplification effects of the soil. The horizontalacceleration at the surface obtained by the site re-sponse analysis is in some cases higher than 0.500 g,with soil amplification factors up to 2.30, higher thanthe soil amplification factor Ss on the basis of the av-erage shear waves velocity (Vs30) according to thecurrent Italian seismic code. The difference between thetwo soil amplification factors is due to the fact that(Vs30) is not a key parameter in the evaluation of soilamplification. Through 1-D performed numerical anal-yses it has been possible to evaluate the influence ofstratigraphic effects in seismic response of the site.
Finally elastic pseudo-acceleration response spectraat the ground surface have been compared (graphically)with the reference ones, provided by the NTC 2008 Ital-ian seismic code at ULS.
Seismic retrofitting and/or improving have to be def-initely considered a multidisciplinary subject, which de-
pends in fact on many factors, such as: local site effectsand the dynamic interaction between the foundationsoil and the structure. The accurate investigation on thestructure and the surrounding soil is the first funda-mental step for a realistic evaluation of the structureseismic performance.
Abate, G., Massimino, M.R. (2016): “Dynamic soil-struc-ture interaction analysis by experimental and nu-merical modelling”. Rivista Italiana di Geotecnica.Volume 50, Issue 2, 2016, Pages 44-70.
Abate G., Bosco M., Massimino M.R., Maugeri M.,(2006): “Limit state analysis for the Catania fire-station (Italy)”. 8th US National Conference onEarthquake Engineering 2006. San Francisco, CA;United States; 18 - 22 April 2006; Code 92446.ISBN: 978-161567044-4. 11(2006): 6532-6541.
Abate G., Caruso C., Massimino M.R., Maugeri M.,(2007): “Validation of a new soil constitutive modelfor cyclic loading by FEM analysis”. Solid Mechan-ics and its Applications. 146(2007): 759-768. ISSN:09250042.
Abate G., Massimino M.R., Maugeri M., (2015): “Numer-ical modelling of centrifuge tests on tunnel-soilsystems”. Bulletin of Earthquake Engineering. DOI:10.1007/s10518-014-9703-0. ISSN: 1570-761X.13(7): 1927-1951.
Abate G., Massimino M.R., Romano S., (2016): “Finite el-ement analysis of DSSI effects for a building ofstrategic importance in Catania (Italy)”. VI ItalianConference of Researchers in Geotechnical Engi-neering - Geotechnical Engineering in Multidisci-plinary Research: from Microscale to RegionalScale, CNRIG2016. Procedia Engineering. ISSN:1877-7058. 158(2016): 374-379.
Abate G., Massimino M.R., (2017): “Numerical modellingof the seismic response of a tunnel-soil-above-ground building system in Catania (Italy)”. Bulletinof Earthquake Engineering. ISSN 1570-761X. DOI10.1007/s10518-016-9973-9. 15(1): 469-491.
Amoruso, A., L. Crescentini, and R. Scarpa, (2002):“Source parameters of the 1908 MessinaStraits, Italy, earthquake from geodetic and seismicdata”, J. Geophys. Res., 107(B4), doi:10.1029/2001JB000434, 2002.
Bardet, J.P., Ichii, K., Lin, C.H., (2000): “EERA - A Com-puter Program for Equivalent-Linear EarthquakeSite Response Analyses of Layered Soil Deposits”;University of Southern California, Dept of Civil Eng.
FERRARO ET AL.
20

Bottari, A., Carapezza, E., Carapezza, M., Carveni, P., Ce-fali, F., Lo Giudice, E., & Pandolfo, C. (1986): “The1908 Messina Strait earthquake in the regionalgeostructural framework”. Journal of geodynamics,5(3), 275-302.
Caruso, S., Ferraro A., Grasso, S., Massimino, M.R.,(2016): “Site Response Analysis In Eastern SicilyBased On Direct And Indirect Vs Measurements”.1st Imeko Tc-4 International Workshop On Metrol-ogy For Geotechnics. Benevento (Italy). March 17-18, 2016. Isbn: 978-92-990075-0-1, Pp. 115-120.
Castelli, F., Lentini, V., (2013): “Landsliding events trig-gered by rainfalls in the Enna area (South Italy)”.Proceedings Second World Landslide Forum, WLF22011, October 3 - 7 2011, Rome, Springer eds., Vol.2, pp.39-47, ISBN 978-3-642-31444-5.
Castelli, F., Cavallaro, A., Grasso, S., Lentini, V. (2016a):“Seismic Microzoning from Synthetic Ground Mo-tion Earthquake Scenarios Parameters: the CaseStudy of the City of Catania (Italy)”. Soil Dynamicsand Earthquake Engineering, vol. 88 (Sept.), pp307-327. 10.1016/j.soildyn.2016.07.010.
Castelli, F., Cavallaro, A., Grasso, S. and Ferraro, A.,(2016b): In Situ and Laboratory Tests for Site Re-sponse Analysis in the Ancient City of Noto (Italy);Proceedings of the 1st IMEKO TC4 InternationalWorkshop on Metrology for Geotechnics, Ben-evento, 17 - 18 March 2016, pp. 85 - 90.
Castelli, F., Cavallaro, A., Ferraro, A., Grasso, S. andLentini, V., (2016c): A Seismic Geotechnical HazardStudy in the Ancient City of Noto (Italy); Proceed-ings of the 6th Italian Conference of Researchersin Geotechnical Engineering (CNRIG), Bologna, 22- 23 September 2016, Procedia Engineering (2016),Vol. 158, pp. 535 - 540.
Castelli, F., Castellano, E., Contino, F., Lentini, V. (2016d):“A Web-based GIS system for landslide risk zona-tion: the case of Enna area (Italy)”. Proceedings of12TH International Symposium on Landslides,Napoli, Italy, June 12 - 19, 2016 ISBN9781138029880.
Castelli, F., Grasso, S., Lentini, V., Massimino, M.R.(2016e): “In situ measurements for evaluating liq-uefaction potential under cyclic loading”. 1stIMEKO TC4 International Workshop on Metrologyfor Geotechnics, MetroGeotechnics 2016. 2016,Pages 79-84.
Castelli, F., Cavallaro, A., Grasso, S., (2016f): “SDMT SoilTesting For The Local Site Response Analysis”. 1stIMEKO TC-4 International Workshop On MetrologyFor Geotechnics. Benevento (Italy). March 17-18,2016. ISBN: 978-92-990075-0-1, Pp. 143-148.
Castelli, F., Freni, G., Lentini, V., Fichera A. (2017): “Mod-elling of a debris flow event in the Enna area forhazard assessment. Proceedings of 1st InternationalConference on the Material Point Method, MPM2017, Delft, January 10-13, 2017, Procedia Engi-neering 175 (2017), 287 - 292. DOI: 10.1016/j.pro-eng.2017.01.026.
Cavallaro, A., Ferraro, A., Grasso, S. and Maugeri, M.,(2008): Site Response Analysis of the Monte Po Hillin the City of Catania; Proceedings of the 2008Seismic Engineering International Conference Com-memorating the 1908 Messina and Reggio CalabriaEarthquake MERCEA’08, Reggio Calabria andMessina, 8 - 11 July 2008, pp. 240 - 251. AIP Con-ference Proceedings, Volume 1020, Issue PART 1,2008, pp. 583 - 594.
Cavallaro, A., Ferraro, A., Grasso, S., Maugeri, M., (2012):“Topographic effects on the Monte Po Hill in Cata-nia (Italy)”. Soil Dynamics and Earthquake Engi-neering. 43, 2012: 97-113.
Cavallaro, A., Grasso, S., Maugeri, M. and Motta, E.,(2013a): “An Innovative Low-Cost SDMT MarineInvestigation for the Evaluation of the Liquefac-tion Potential in the Genova Harbour (Italy) “; Pro-ceedings of the 4th International Conference onGeotechnical and Geophysical Site Characterization,ISC’4, Porto de Galinhas, 18 - 21 September 2012,Geotechnical and Geophysical Site Characterization4, Vol. 1, 2013, pp. 415 - 422.
Cavallaro, A., Grasso, S., Maugeri, M. and Motta, E.,(2013b): “Site Characterisation by in Situ and Lab-oratory Tests of the Sea Bed in the Genova Har-bour (Italy)”; Proceedings of the 4th InternationalConference on Geotechnical and Geophysical SiteCharacterization, ISC’4, Porto de Galinhas, 18 - 21September 2012, Geotechnical and Geophysical SiteCharacterization 4, Vol. 1, 2013, pp. 637 - 644.
Cavallaro, A., Grasso, S., Ferraro, A., (2016a): “Study onSeismic Response Analysis in “Vincenzo Bellini”Garden area by Seismic Dilatometer MarchettiTests”. 5th International Conference on Geotechni-cal and Geophysical Site Characterisation ISC’5. 5-9 September 2016, Queensland, Australia. ISBN:978-0-9946261-0-3.
Cavallaro, A., Grasso, S. and Ferraro, A., (2016b): “AGeotechnical Engineering Study for the Safeguard,Restoration and Strengthening of Historical Her-itage”; Proceedings of the 6th Italian Conferenceof Researchers in Geotechnical Engineering(CNRIG), Bologna, 22 - 23 September 2016, Proce-dia Engineering (2016), Vol. 158, pp. 134 - 139.
De Rubeis, V., Gasparini, C., Maramai, A. and Anzidei, M.,
21
SITE EFFECTS EVALUATION IN CATANIA (ITALY)

(1991): “Il Terremoto Siciliano del 13 Dicembre1990” (in italian); Proc. Contributi allo studio delTerremoto della Sicilia Orientale del 13 Dicembre1990. National Institute of Geophysics, Roma.
Ferraro, A., Grasso, S., Maugeri, M., (2009): “Seismic vul-nerability of a slope in central Italy”. WIT Transac-tions on the Built Environment, 110, pp. 345-355.
Ferraro, A., Grasso, S., Massimino, M.R., Maugeri, M.,(2015): Influence of geotechnical parameters andnumerical modelling on local seismic response anal-ysis. Geotechnical Engineering for Infrastructureand Development - Proceedings of the XVI Euro-pean Conference on Soil Mechanics and Geotech-nical Engineering, ECSMGE 2015, 4, pp.2183-2188.
Ferraro, A., Grasso, S., Maugeri, M., Totani, F. (2016):Seismic response analysis in the southern part ofthe historic centre of the City of L’Aquila (Italy). SoilDynamics and Earthquake Engineering, 88, pp.256-264.
Grasso, S., Maugeri, M., (2009): “The Road Map for Seis-mic Risk Analysis in a Mediterranean City”. Soil Dy-namics and Earthquake Engineering. ISSN:0267-7261. 29 (6), 2009: 1034-1045.
Grasso, S., Maugeri, M., (2009): “The Seismic Micro-zonation of the City of Catania (Italy) for the Max-imum Expected Scenario Earthquake of January 11,1693”. Soil Dynamics and Earthquake Engineering,29 (6), 2009: 953-962.
Grasso, S., Maugeri, M., (2012): “The Seismic Micro-zonation of the City of Catania (Italy) for the EtnaScenario Earthquake (M=6.2) of February 20,1818”. Earthquake Spectra. 28 (2), 2012: 573-594.ISSN: 8755-2930.
Grasso, S., Maugeri, M., (2014): “Seismic microzonationstudies for the city of Ragusa (Italy)”. Soil Dynam-ics and Earthquake Engineering. ISSN: 0267-7261.2014, (56): 86-97.
Idriss, I.M., Sun, J.I., (1992): User’s Manual for SHAKE91.Center for Geotechnical Modeling, Dept. of Civil &Environmental Engineering, Univ. of California,Davis, California.
Massimino M.R., Biondi G., (2015): “Some experimentalevidences on dynamic soil-structure interaction”.5th ECCOMAS Thematic Conference on Computa-tional Methods in Structural Dynamics and Earth-quake Engineering, COMPDYN 2015. M.Papadrakakis, V. Papadopoulos, V. Plevris (eds.).Crete Island, Greece, 25-27 May 2015. Code113952. ISBN: 978-960-99994-7-2. pp. 2761-2774.
Maugeri M., Abate G., Massimino M.R., (2012): “Soil-
Structure Interaction for Seismic Improvement ofNoto Cathedral (Italy)”. Geotechnical, Geologicaland Earthquake Engineering, 16(2012): 217-239.
Schnabel, P, Seed, H.B,, Lysmer, J., (1972a): Modificationof Seismograph Records for Effects of Local SoilConditions. Bulletin of the Seismological Society ofAmerica; 62 (6): 1649-1664.
Schnabel, P,B,, Lysmer, J., Seed, H,B., (1972b): SHAKE: AComputer Program for Earthquake Response Anal-ysis of Horizontally Layered Sites. College of Engi-neering, University of California, Berkeley,California. Report No. EERC 72-12.
Tortorici, L., Monaco, C., Tansi, C., & Cocina, O. (1995):“Recent and active tectonics in the Calabrian arc(Southern Italy)”. Tectonophysics, 243(1), 37-55.
*CORRESPONDING AUTHOR: Salvatore GRASSO,
Department of Civil Engineering and Architecture (DICAr)
University of Catania, Catania, Italy;
email: [email protected]
© 2018 the Istituto Nazionale di Geofisica e Vulcanologia.
All rights reserved.
FERRARO ET AL.
22