sistema pjsfc financial results 1q 2018 · 7 45.8 supplies 3.0 0.3 -0.6 -0.4 -0.1 0.7 49.2 0.7...
TRANSCRIPT

Sistema PJSFC Financial Results 1Q 2018 Andrey Dubovskov President and CEO Vladimir Travkov Vice President and Chief Financial Officer
June 2018

2
DISCLAIMER
Certain statements in this presentation may contain assumptions or forecasts in respect to forthcoming events within Sistema PJSFC. The words “expect”, “estimate”, “intend”, “will”, “could” and similar expressions identify forward-looking statements. We wish to caution you that these statements are only predictions and that actual events or results may differ materially. We do not intend to update these statements to reflect events and circumstances occurring after the above-mentioned date or to reflect the occurrence of unanticipated events. Many factors could cause Sistema’s actual results to differ materially from those contained in our projections or forward-looking statements, including, among others, deteriorating economic and credit conditions, our competitive environment, risks associated with operating in Russia, rapid technological and market change in our industries, as well as many other risks specifically related to Sistema and its operations.

3
From January 1st 2018, Sistema has adopted new IFRS standards:
• IFRS 9, Financial Instruments;
• IFRS 15, Revenue from Contracts with Customers;
• IFRS 16, Leases.
In accordance with the accounting policy the financial results of previous comparative periods were nor reconciled with the effect of new standards. Therefore, here
and hereafter in this presentation Sistema’s consolidated results and results of its subsidiaries for 1Q 2018 are presented in accordance with new accounting
standards IFRS 9, 15 and 16 if not specified otherwise. The results for 1Q 2017 are presented without the impact of new IFRS standards 9, 15 and 16.
For comparison purpose, Sistema also presents 1Q 2018 financial results excluding the impact of new standards in all of the distribution materials. In this presentation
we use the following terms:
Old IFRS standards – excluding impact of IFRS 9, 15 and 16;
New IFRS standards – including impact of IFRS 9, 15 and 16.
IFRS 9, Financial Instruments.
IFRS 9 regulates the classification and measurement of financial assets and liabilities and requires certain additional disclosures. The primary changes relate to the assessment of hedging arrangements and provisioning for potential future credit losses on financial assets as well as recognition of modification gain or loss for all revisions of estimated payments or receipts, including changes in cash flows arising from a modification or exchange of a financial liability, that does not result in its derecognition.
IFRS 15, Revenue from Contracts with Customers.
This standard provides a single, principles-based five-step model for the determination and recognition of revenue to be applied to all contracts with customers. It replaced the existing standards IAS 18, Revenue, and IAS 11, Construction Contracts. The core principle of IFRS 15 is that an entity should recognize revenue to depict the transfer of promised goods or services to customers in an amount that reflects the consideration to which the entity expects to be entitled in exchange for those goods or services. Under the standard, an entity recognizes revenue when (or as) a performance obligation is satisfied, i. e. when “control” of the goods or services underlying the particular performance obligation is transferred to the customer. Far more prescriptive guidance has been added in IFRS 15 to deal with specific scenarios than exists in the current guidance. The main effect of the standard on the Group’s consolidated financial statements related to the deferral of certain incremental costs incurred in acquiring or fulfilling a contract with a customer. Such contract costs are amortized over the period of benefit.
IFRS 16, Leases.
This standard principally requires lessees to recognize assets and liabilities for all leases and to present the rights and obligations associated with these leases in the statement of financial position. The standard also includes new provisions on the definition of a lease and its presentation, on disclosures in the notes, and on sale and leaseback transactions.
NEW REPORTING STANDARDS

4
FINANCIAL REVIEW 1Q 2018

5
160.9 170.9
1Q 2017 1Q 2018
CASH POSITION AT CORPORATE CENTRE2 NET FIN LIABILITIES AT CORP CENTRE2,3
45.8 49.2
1Q 2017 1Q 2018
160.9 170.7
1Q 2017 1Q 2018
45.8 59.5
1Q 2017 1Q 2018
FASTEST GROWING ASSETS (BY REVENUE, YOY)
20.5 13.6
14.9
1Q 2017 4Q 2017 1Q 2018
107.8
213.4 217.7
1Q 2017 4Q 2017 1Q 2018
+30.0% +7.5% +6.2% +6.1%
110.6%
38.5% 27.8% 21.7% 21.1%
KEY HIGHLIGHTS 1Q 2018
Strong portfolio performance in 1Q 2018
- Revenue growth driven by publicly-traded assets (MTS and Detsky Mir), Segezha, Steppe and Medsi, with modest positive impact from the adoption of the new IFRS 15 standard
- Increase in adj. OIBDA level reflecting healthy performance of the key assets and impact of the new IFRS 15 and IFRS 16 standards
Settlement with Rosneft/Bashneft
- Settlement Agreement (SA) fulfilled and RUB 100 bn paid out to Bashneft
- Net financial liabilities at Corporate Centre totaled RUB 217.7 bn, reflecting payments made under the settlement agreement and debt raised to fulfill these obligations
Cash position at comfortable level
- Cash position at Corporate Centre increased by 9.9%, impacted by payments under the Settlement Agreement, debt raised in order to make these payments, dividends from Detsky Mir received in 1Q 2018 and investments in funds
1Here and hereafter in this press-release Sistema’s consolidated results for 1Q 2017 and full year 2017 are restated to reflect deconsolidation of SG-Trading JSC and disposal of operating business of Sistema Shyam TeleServices Ltd. (SSTL)Here and hereafter 1Q 2018 results for MTS-Bank and Binnopharm are presented with the impact of the new standards only. However, Sistema estimates that the impact on the consolidated Group results of these subsidiaries’ transition to the new IFRS standards is not material. 2Source: Management accounts 3Total borrowings, liability to Rosimushchestvo, liability to Rusnano (repaid at YE 2017), finance lease and liability under Settlement Agreement less cash at the Corporate Centre level
REVENUE1 ADJ OIBDA
+2.0% +9.9%
RUB bn RUB bn
RUB bn RUB bn
RUB bn
New IFRS Old IFRS Old IFRS New IFRS Old IFRS Old IFRS

6
160.9
170.7
3.8
3.0 2.1
1.3 1.0 -1.4
0.1
Revenue1Q 2017
Growth atMTS
Growth atDetsky Mir
Growth atSegezha
Growth atSteppe
Growth atMedsi
Declineat RTI
Growth netof declineat otherassets
Revenue1Q 2018
160.9
170.9
3.2 3.0
2.1 1.3
1.0 -1.4 0.8
Revenue1Q 2017
Growth atMTS
Growth atDetsky Mir
Growth atSegezha
Growth atSteppe
Growth atMedsi
Declineat RTI
Growth netof declineat otherassets
Revenue1Q 2018
FINANCIAL REVIEW: REVENUES
• MTS: strong mobile service revenue in Russia
• Detsky Mir: 5.1% like-for-like sales growth, opening and ramp-up of new stores (104 stores opened YoY)
• Segezha Group: strong growth in sales due to increased volume of paper and packaging sales as well growing price for Segezha products across all key business segments and positive impact of rouble weakening vs Euro
• Steppe: revenue jumped 110% due to sales in 1Q 2018 of the 2017 inventory carryover, increased wheat prices and rouble weakening
• Medsi: increased vertical integration, ramp-up of new clinics and higher capacity utilisation in the in-patient segment as well as the impact of M&A
• RTI: rescheduling of contract work
REVENUE 1Q 2018
RUB bn
RUB bn
New IFRS Old IFRS
Old IFRS Old IFRS
REVENUE 1Q 2018

7
45.8 49.2 3.0 0.3 0.7 0.6 -0.4 -0.1 -0.7
OIBDA1Q 2017
Growth at MTS
Growth atDetsky Mir
Growth atSegezha
Growth atSteppe
Decline atMedsi
Declineat RTI
Decline net ofgrowthat otherassets
OIBDA1Q 2018
45.8
59.5 10.5
2.4 0.9 0.6 -0.3 -0.1 0.3
OIBDA1Q 2017
Growth at MTS
Growth atDetsky Mir
Growth atSegezha
Growth atSteppe
Decline atMedsi
Declineat RTI
Growth netof declineat otherassets
OIBDA1Q 2018
FINANCIAL REVIEW: OIBDA
ADJ. OIBDA 1Q 2018
RUB bn
RUB bn
• MTS: OIBDA growth due to increased
share of high-margin data services in
the revenue mix, sustained cost
control and the positive impact of the
new IFRS standards
• Detsky Mir: surge in OIBDA as a
result of the transition to IFRS 16 as
well as continued focus on business
efficiency
• Segezha Group: strong increase in
OIBDA due to strong topline growth,
rising prices for products across key
business segments, reduction of
logistics costs and the impact of the
IFRS 16 standard
• Steppe: OIBDA increase driven by
revenue growth
• Medsi: decline in OIBDA driven by
increased expenses on medical
supplies as a result of increase in in-
patient services, as well as the impact
of the divestiture of the wellness-
centre Cascade in 1Q 20127, which
was partially mitigated by a decline in
maintenance costs and the positive
impact of IFRS 16
• RTI: decline driven by topline
dynamics
ADJ. OIBDA 1Q 2018
New IFRS Old IFRS
Old IFRS Old IFRS

8
13.6 14.9
4.8
80.0
4.0
1.2
4.5
2.5
31-Dec2017
Proceeds fromportfolio
assets
Debt raised netof repayments
Paymentsunder Settlement
Agreement
Investments SG&A costs,taxes and other
Interestexpenses
31-March2018
CASH FLOWS AT THE CORPORATE CENTRE IN 1Q 2018
• Dividends and cash returns from portfolio assets are mainly comprised of proceeds from buy-back of MTS’s shares and dividends from Detsky Mir totaling RUB 1.1 bn unfrozen in 1Q 2018
• During the quarter, Sistema successfully secured financing for repayment of its liabilities under its settlement agreement with Rosneft, Bashneft and the Republic of Bashkortostan and completed all necessary payments
• Largest investments of 1Q 2018 include capital calls at funds and investment platforms, as well as investments in high-tech
Dividends and cash returns
MTS share buyback 86.3
1Numbers may not add up precisely to the outgoing balance due to rounding
Management accounts, RUB bn
1
6.0

9
Net financial liabilities at Corporate Centre at the end of Q1 2018 amounted to RUB 217.7 bn, reflecting payments made under the settlement agreement and debt raised to fulfill these obligations
Bank loans and other
55%
RUB bonds 26%
Liabilities on SSTL shares
9%
Eurobonds 10%
20.6 15.2 28.1
5.4
59.2 4.8
24.6 16.1
15.0
23.3
6.7
6.7
6.7
2Q'18-4Q'18 2019 2020 2021 2022 Thereafter
MATURITY PROFILE AND STRUCTURE ANALYSIS
CORPORATE CENTRE’S FINANCIAL LIABILITIES
90.5
179.2 33.4
33.2
23.0
86.3 80.0 0.9
20.2 80.0
31 Dec 2017 31 Mar 2018
CORPORATE CENTRE’S FINANCIAL LIABILITIES
Management accounts, RUB bn
232.6
Debt raised net of repayments
FX revaluation
69.8
32.1
50.9
1FX-Debt and USD-denominated liability to Rosimuschestvo are presented at RUB/USD exchange rate as of 31 March 2018. FX-Debt includes finance lease 2Eurobonds with maturity in May 2019. RUB bonds 001Р-01 contain put options that as of October 2018; 001Р-07 and 001Р-08 as of February and September 2019, respectively; 001Р-04 and 001Р-05 as of 2020; 001Р-06 as of 2022
227.0
Liability under SA
USD debt1 Liability to Rosimuschestvo1 RUB debt Liabilities under SA
Debt (USD, RUB)
Liability to Rosimushchestvo Eurobonds2
RUS bonds that contain put options2
Management accounts, RUB bn

10
Bank loans and other 63%
RUB bonds 24%
Eurobonds 10%
Liabilities on SSTL shares 3%
80% 65% 74%
20% 22%
26% 13%
1Q 2017 4Q 2017 1Q 2018
Long-term Short-term Settlement Agreement
STRUCTURE ANALYSIS
CONSOLIDATED FINANCIAL LIABILITIES1: COMPOSITION BY BORROWERS AND MATURITY PROFILE
CONSOLIDATED FINANCIAL LIABILITIES
280.0 303.6 302.6
128.3 147.0
232.6 26.5 38.3
39.9 80.0 74.1
69.9 77.3
1Q 2017 4Q 2017 1Q 2018
MTS Corp Centre Segezha Settlement Agreement Other
137.8 155.1 132.2
70.7 46.4
110.0
2Q'18-4Q'18 2019 2020 2021 2022 Thereafter
Debt and other liabilities
31% 23% 18%
66% 60% 77%
3% 4%
5% 13%
1Q 2017 4Q 2017 1Q 2018
Settlement Agreement Other RUB USD
Management accounts, RUB bn 652.4
508.9
Consolidated financial liabilities up 2.1% in 1Q 2018 QOQ impacted by borrowings made to fulfill obligations under the Settlement Agreement as well as borrowings at Detsky Mir, Segezha and other assets.
1Include financial liabilities at Corporate Centre, finance lease and total borrowings at portfolio companies in accordance with IFRS
638.8
Management accounts, RUB bn

11
22.7%
18.4% 21.5%
Group SG&A/Revenue
• Consolidated SG&A/Revenue ratio down YOY to 18.4% from 22.7% under impact of new IFRS standards. On a LFL basis, SG&A remained flat YOY with SG&A/revenue ratio declining 1.2 p.p.
• Under new IFRS SG&A/Revenue declined at:
- Detsky Mir: from 25.4% to 15.0%
- Binnopharm: from 35.8% to 28.8%
- MTS: from 21.3% to 17.2%
- Segezha: from 19.2% to 15.6%
21.7
5.7
1.9 1.5
5.9
1Q 2018
22.3 18.6
5.3
3.6
1.8
1.8
1.7
1.5
5.4
5.9
1Q 2017 1Q 2018
MTS Detsky Mir
Segezha Corporate Centre
Other
11.1
18.0
2.1
1.4
2.9
3.3
16.1
22.7
1Q 2017 1Q 2018
MTS Segezha Other assets
SG&A EXPENSES AND CAPEX
1.7
1.5
1.1%
0.9%
1Q 2017 1Q 2018
SG&A at Corporate Centre
Corporate SG&A/Group revenue
• SG&A down YOY, reflecting reduction in management compensation
• Corporate Centre’s SG&A/Revenue ratio decreased from 1.1% in 1Q 2017 to 0.9% in 1Q 2018
IFRS, RUB bn
• Group CAPEX increased by 41.0% YoY, driven mainly by MTS (+62.4% YoY) due to investments in network roll-out in Russia
IFRS, RUB bn
Management accounts, RUB bn
GROUP SG&A EXPENSES CORPORATE CENTRE’S SG&A EXPENSES GROUP CAPEX
36.7
31.4
36.5
New IFRS Old IFRS Old IFRS

12
KEY PORTFOLIO ASSETS

13
41.0
51.2 52.0 52.0 52.0 52.0
2013 2014 2015 2016 2017 2018E
Strong operational and financial results
> Revenue increased by 3.1% YoY thanks to a 3.7% increase in Russian mobile service revenue as a result of higher data usage
> Excluding the effects of new IFRS standards, revenue increased by 3.7% YoY
> OIBDA increased by 25.4% as a result of the adoption of new standards as well as increased usage of data and higher-margin products.
> Excluding the effects of new IFRS standards, OIBDA increased by 7.1% YoY
Digital strategy
> MTS launched the first commercial broadband LTE network with Licensed Assisted Access (LAA) technology in Eastern Europe
> MTS entered the event e-ticketing market (acquired Ticketland.ru and Ponominalu.ru, two leading players in the industry)
> MTS and Medsi partnered to launch a telemedicine platform, SmartMed
> MTS placed commercial bonds using blockchain smart contracts, the first transaction of its kind in Russia
Stable dividend payout
> MTS’s Board of Directors recommended a dividend for 2017 of RUB 23.4 per ordinary share (RUB 46.8 per ADR) subject to approval by the Annual General Meeting of the Shareholders.
MTS: SUCCESSFUL ROLL-OUT OF DIGITAL STRATEGY AND STRONG FINANCIAL RESULTS
1Here and hereafter profit is presented in Sistema’s share 2Here and hereafter net debt includes finance lease
STRUCTURE OF REVENUE IN RUSSIA
RUB 101.1 bn
1Q 2018 1Q 2017
RUB 97.1 bn
*Including revenue from event e-ticketing operators and e-sport
DIVIDENDS RUB bn
RUB bn
New IFRS Old IFRS Old IFRS
RUB bn 1Q 2018 1Q 2017 YoY 1Q 2018 YoY
Revenue 107.9 104.7 3.1% 108.5 3.7%
OIBDA 52.1 41.5 25.4% 44.5 7.1%
OIBDA margin 48.3% 39.7% 1.0p.p. 41.0% 1.3p.p.
Profit1 7.7 6.2 23.5% 8.2 32.1%
Net debt2 245.6 254.7 (3.6%)
CAPEX 18.0 11.1 62.4% 74.3
15.1
1.4 13.1
0.2 Mobile service
Fixed line
Integrated services
Sales of goods
Others*
71.7
15.2
1.4 11.3

14
596 604 631 688 686
521 528 557 622 625
31-Mar-17 30-Jun-17 30-Sep-17 31-Dec-17 31-Mar-18
Retail space, thsd sq m Stores
25.4%
15.0%
1Q'17 1Q'18
21.1
24.0
1Q'17 1Q'18
5.3%
14.5%
1Q'17 1Q'18
SELLING SPACE AND NUMBER OF STORES1
Revenue and OIBDA margin growth
> In 1Q 2018, revenue grew YoY thanks to the roll-out of new retail space and due to a 5.1% YoY increase in LfL sales, driven by a competitive pricing policy and improved product range.
> E-commerce remained the company’s fastest-growing sales channel, with revenue rising by 64.9% YoY in 1Q 2018. Online sales accounted for 6.2% of total sales in 1Q 2018. Developing the e-commerce platform remains one of management’s top priorities for 2018.
> Adj. OIBDA increased by 214.6% as a result of the adoption of new IFRS 16 Leases. Excluding the change in standards, adj. OIBDA increased by 29.9%.
> Adj. OIBDA margin improved by 9.2p.p. in 1Q 2018 as result of adj. OIBDA growth under IFRS 16. Excluding the effect of this factor, the adj. OIBDA margin amounted to 6.0%, driven by improvements to operational efficiency including higher labour productivity and strict control of rental costs. Adj. SG&A/revenue ratio declined by 10.4 percentage points to 15.0%
Business expansion and growth plans
> Detsky Mir plans to open at least 250 new Detsky Mir stores in 2018-2021, including apx. 70 new stores in 2018, with a targeted internal rate of return of ≈40%. Detsky Mir also aims to be Russia’s leading children’s goods retailer in 2018 in terms of Lfl sales growth.
DETSKY MIR: SECTOR LEADERSHIP AND REDUCTION OF OPERATIONAL COSTS
1In 1Q 2018г. Detsky Mir closed 4 stores including 2 closed because of fire event 2Like-for-like (LfL) growth in RUB terms. LfL growth includes only DM stores in Russia that have been in operations for at least 12 full calendar months
ADJ. SG&A/REVENUE ADJ. OIBDA MARGIN
REVENUE ADJ. OIBDA
14.0%
1.1 3.5
1Q'17 1Q'18
214.6%
9.2p.p. -10.4p.p.
RUB bn RUB bn
New IFRS Old IFRS Old IFRS
RUB bn 1Q 2018 1Q 2017 YoY 1Q 2018 YoY
Revenue 24.0 21.1 14.0% 24.0 14.0%
Adj. OIBDA 3.5 1.1 214.6% 1.4 29.9%
Adj. OIBDA margin 14.5% 5.3% 9.2p.p 6.0% 0.7p.p.
Adj. profit 0.2 0.1 137.3% 0.2 206.5%
SGA/revenue 15.0% 25.4% (10.4 p.p.) 23.5% (1.9 p.p.)
Net debt 16.3 15.8 3.2%
Like-for-like growth2 5.1% 11.2% (6.1p.p.)
Traffic growth 8.8% 13.3% (4.5p.p.)
Average ticket dynamics (3.4%) (1.9%) (1.5p.p.)
CAPEX 0.3 0.3 25.7%

15
180 191
1Q'17 1Q'18
21 23
1Q'17 1Q'18
45 55
1Q'17 1Q'18
240 279
1Q'17 1Q'18
Results and key events of 1Q 2018
˃ Revenue increased in 1Q 2018 thanks to higher sales of paper and paper sacks, as well as higher prices for sawn timber, paper, paper sacks, house framing and glulam. The increase in paper production volumes (+14% YoY) was due to the launch in 4Q 2017 of a new paper machine at Segezha Pulp & Paper Mill. The weakening of the RUB against the EUR had a positive impact on revenue, given that ≈27% of the company’s revenue is denominated in EUR.
˃ OIBDA increased as a result of revenue growth, as well as higher prices on key products and optimisation of logistics costs. The impact on OIBDA from the adoption of the new IFRS 16 standard amounted to RUB 219 mln.
˃ The loss in 1Q 2018 was mainly due to FX-rate pressures.
˃ The volume of paper sacks produced increased by 5.7% (to 307.9 mln), mainly due to growth of demand in Russia.
˃ Plywood production volume increased by 6% to 25,600 cu m thanks to the installation of new equipment and increased efficiency of existing equipment. 70% of Segezha’s plywood is exported, with key export destinations being Germany and the Netherlands.
˃ Sales of sawn timber increased by 6.3% in 1Q 2018 to 191,000 cu m, driven by an increase in sales to existing clients. Nearly 99% of sawn timber is exported, with key export destinations including China, Egypt, the UK and France.
˃ In 1Q 2018, commissioning work at the plywood mill in Kirov region continued, with the launch planned for 2Q 2018. The new mill will double plywood production capacity and will allow the company to expand sales channels.
6.7
2.9
1.2 0.7 1.6
0.4 0.2
-0.3 Paper&
papersacksWood
processingPlywood Other
Revenue
Adj. OIBDA
SEGEZHA GROUP: SALES GROWTH ON THE BACK OF IMPROVED MARKET
1Including sales of paper and paper board 2Metrics in the tables hereinafter are presented as of 01 April 2018
+16.4% +23.2%
+6.3% +9.5%
SALES
SAWN TIMBER PLYWOOD
REVENUE AND ADJUSTED OIBDA BY BUSINESS SEGMENTS IN 1Q 2018
PAPER SACKS SACK PAPER1
thsd tonnes mn
thsd cu m thsd cu m
Exports destinations
88 countries
Leased forest fund2
6.8 mln ha
Capacity in paper sacks
1.5 bn pcs
Capacity in sack paper
360 thsd tonnes
Capacity in plywood
99.5 thsd m3
New IFRS Old IFRS Old IFRS
RUB bn 1Q 2018 1Q 2017 YoY 1Q 2018 YoY Revenue 11.5 9.5 21.7% 11.5 21.7% OIBDA 2.2 1.3 70.9% 2.0 53.7% OIBDA margin 18.9% 13.4% 5.5p.p. 16.9% 3.5p.p. Loss/(profit) (0.5) 0.1 n/a (0.5) n/a Net debt 36.3 25.7 41.2% CAPEX 1.4 2.1 (33.4%) Share of FX-denom. revenues 68.1% 65.0% 3.1p.p. Own forestry consumption 56.3% 57.0% (0.7p.p.) Total forestry, ‘000 m3 1,386 1,345 3.0%
REVENUE AND ADJUSTED OIBDA BY BUSINESS SEGMENTS IN 1Q 2018

16
Field crop production Apple orchards
• Land bank of 380,000 hectares: - Steppe: 274,000 hectares - RZ Agro: 106,000 hectares
• Advanced technologies and high business standards
• Planted orchard land: 780 hectares
• Fruit storage of 21,000 tonnes
Vegetable production
• Greenhouses with total area of 144 ha
• Infrastructure:
‒ bio-laboratory
‒ agro-chemical laboratory
‒ boiler-house, etc.
Dairy farming
• 5 dairy farms
• Livestock: >10 000
(≈4,400 dairy cows)
8.8 9.8 10.9
23.2 29.1 25.3
1Q'16 1Q'17 1Q'18
Production Price per liter, RUB
6.2 5.3
5.9
0.2 0.7 0.1
1Q'16 1Q'17 1Q'18Cucumbers Tomatoes
AGROHOLDING STEPPE: STRONG FINANCIAL RESULTS AND OPERATIONAL EFFICIENCY
VEGETABLE PRODUCTION
MILK PRODUCTION thsd tonnes
thsd tonnes
2Excluding the results of the RZ Agro joint venture, where Steppe owns 50%. ). RZ Agro’s revenues , OIBDA and profit in 1Q 2018 were RUB 0.7 bn, RUB 0.3 bn and RUB 0.2 bn, respectively.
Results and key events of 1Q 2018
> In 2018, positive trends across all business divisions resulted in strong revenue and OIBDA growth
> The field crop segment saw growth driven by sales of carryover inventory from 2017 at higher prices.
> The dairy segment grew on the back of continuous expansion of the herd (+10% YoY) and increased milk production per head (+2% YoY).
> In March 2018, the first line of Steppe’s new dairy farm was opened. At present the farm has 907 cows, with plans to grow to 1,800 cows as a result of the facility’s own breeding programme.
> The fruit production segment saw revenue increase 143% YoY and OIBDA increase 270% YoY thanks to optimisation of the sales system and higher average sale prices for apples.
> The vegetable production segment is currently implementing a programme to boost operational efficiency that is having a positive impact on revenue.
> The moderate loss in 1Q 2018 was primarily a result of the increased amortisation costs due to transition to the new IFRS standards.
> Investments in the new farm represented the core part of Steppe’s CAPEX in 1Q 2018 (RUB 90 mn of a total RUB 185 mn). The other half of capex was accounted for by the purchase of new agricultural equipment.
New IFRS Old IFRS Old IFRS
RUB bn 1Q 2018 1Q 2017 YoY 1Q 2018 YoY
Revenue 2.5 1.2 110.6% 2.5 110.6%
OIBDA 0.7 0.1 517.7% 0.7 510.7%
OIBDA margin 27.2% 9.3% 17.9p.p. 27.0% 17.7p.p.
(Loss)/Profit (0.1) (0.3) n/a 0.01 n/a
Net debt 12.5 9.7 29.0%
CAPEX 0.2 0.1 52.4%

17
1.9 2.0
1Q 2017 1Q 2018
2.9 3.2
1Q 2017 1Q 2018
48.3% 43.0%
1Q 2017 1Q 2018
223.9 233.1
1Q 2017 1Q 2018
58% 35%
4% 3% Insurance
Individuals
Corporate
Other
8.1% 8.2%
FLOOR SPACE
5.3 p.p. 4.1%
% CAPACITY UTILISATION
PATIENT VISITS SERVICES PROVIDED
1Metrics in the tables hereinafter are presented as of 31 March 2018 2Capacity metric, calculated as the number of possible ambulance visits of Medsi’s facilities
mn mn
thsd
By clients By assets
> In 1Q 2018 revenue increased on the back of 113% revenue growth from the Clinical-Diagnostic Centre (CDC) at Krasnaya Presnya as well as higher revenue from the in-patient segment. Medsi grew operational volumes under the mandatory health insurance programme (MHI), which accounted for 13.0% of revenue in 1Q 2018 compared to 5.6% in 1Q 2017. Medsi also increased the share of revenue from individuals by 2.5 p.p. (from 32.3% in 1Q 2017). The Medlife and Medem clinics, which Medsi acquired in 2017 and which together account for 6.8% of total revenue, contributed 9 p.p. to revenue growth.
> Decrease in OIBDA and OIBDA margin was due to an increase of 3.6 p.p. (to 9.9%) in the share of expenses on materials as a result of expanded operational volumes at in-patient facilities. This was partially offset by a reduction in the share of operating costs. OIBDA and OIBDA margin in Q1 2017 were impacted by a one-time positive effect of the disposal of wellness center Cascade (net of this effect OIBDA margin amounted to 8,9% in Q1 2017). In Q1 2018, the introduction of the IFRS 16 standard had a positive effect on OIBDA of +33%
> Medsi’s net loss was due to increased amortisation costs as a result of new clinic openings at Leninsky Avenue, 3rd Khoroshevsky Passage and Leninskaya Village, as well as higher interest costs on loans and borrowings. IFRS 16 had a negative effect on profit of RUB -38 mn. Capacity utilisation decreased as a result of the opening of new clinics as well as expanded capacity for out-patient visits and closing down of the clinic on Derbenevskaya Embankment.
> 1n 1Q 2018 Medsi invested in expanding and renewing its inventories of medical equipment, as well as in creating a new high-tech multi-disciplinary hospital on Michurinsky Avenue.
38%
21%
17%
11%
8% 5% Clinics
Hospitals
CDC at Belorusskaya
Children clinics
CDC at Krasnaya Presnya
Other
MEDSI: SIGNIFICANT CAPACITY INCREASE AND DOUBLE-DIGIT REVENUE GROWTH
REVENUE IN 1Q 2018
Services provided (capacity)
27,000 thsd
Out-patient visits2
17,784 thsd
Doctors employed
2.5 thsd
Number of facilities1
39
New IFRS Old IFRS Old IFRS
RUB bn 1Q 2018 1Q 2017 YoY 1Q 2018 YoY
Revenue 3.5 2.5 38.5% 3.5 39.0%
OIBDA 0.5 0.7 (36.2%) 0.3 (52.1%)
OIBDA margin 13.2% 28.7% (15.4p.p.) 9.9% (18.8p.p.)
Profit/(Loss) (0.1) 0.3 n/a (0.1) n/a
Net debt/(cash) 1.0 (0.8) n/a
Patient visits, ‘000 2,005 1,856 8.1%
Services provided, ‘000 3,165 2,925 8.2%
Average bill, ‘000 RUB 1,721 1,343 28.1%

18
MTS BANK: SUSTAINED INCREASE IN PROFITABILITY AND SUCCESFUL EXECUTION OF STRATEGY
MTS MONEY CARDS ISSUANCE (ALL TYPES OF CARDS)
ISSUANCE OF POS LOANS: ENHANCED RISK MANAGEMENT IN PLACE
ACTIVE RETAIL CUSTOMERS
1Loans classified as 90 days+ NPLs within 12 months after issuance (2017 numbers are based on the model forecast) 2Metrics in the table exclude results of East-West United Bank (EWUB). 1Q 2018 results for MTS-Bank are not presented excluding the impact of the new IFRS standards 3Metrics hereinafter are presented as of 31 March 2018 in accordance with IFRS
˃ Revenue grew primarily by a 26.2% increase in fee and commission income as a result of growth of transaction products, the roll-out of digital services and higher sales of non-credit products such as insurance.
˃ Interest income also boosted revenue, increasing by 9.1% year-on-year thanks to a larger share of higher-margin credit card and general purpose consumer loans in the Bank’s retail loan book.
˃ MTS Bank won a five-year contract as the exclusive provider of payment services for the City of Moscow’s online portal, mos.ru, which has a client base of more than two million active users.
˃ The Bank continues to develop projects in line with its strategy of building a digital bank in partnership with MTS. A pilot project has been launched to sell the Bank’s products of remote servicing via digital channels, primarily targeting MTS subscribers.
˃ The Cost of Risk (COR) on the Bank’s retail loans was a comfortable less than 3% during the reporting period.
0
500
1,000
1,500
2,000
2,500
0%5%
10%15%20%25%30%
01.
04.2
01
2
01.
07.2
01
2
01.
10.2
01
2
01.
01.2
01
3
01.
04.2
01
3
01.
07.2
01
3
01.
10.2
01
3
01.
01.2
01
4
01.
04.2
01
4
01.
07.2
01
4
01.
10.2
01
4
01.
01.2
01
5
01.
04.2
01
5
01.
07.2
01
5
01.
10.2
01
5
01.
01.2
01
6
01.
04.2
01
6
01.
07.2
01
6
01.
10.2
01
6
01.
01.2
01
7
01.
04.2
01
7
01.
07.2
01
7
01.
10.2
01
7
01.
01.2
01
8
01.
04.2
01
8
3.64 3.73 3.95 4.29 4.58
1Q 2017 2Q 2017 3Q 2017 4Q 2017 1Q 2018
+25.9%
Issuance, RUB mn (right scale)
Share of NPL 90+ within 12 months (left scale)1
mn
1.18 1.26 1.37 1.45 1.54
1Q 2017 2Q 2017 3Q 2017 4Q 2017 1Q 2018
+30.3%
2
mn cards
Customer deposits
RUB 105.6 bn
Total loan book, gross
RUB 87.0 bn
Total assets3
RUB 132.4 bn
Retail deposits
RUB 70.0 bn
New IFRS
2
Old IFRS
RUB bn 1Q 2018 1Q 2017 YoY
Revenue 5.2 4.3 21.1%
Profit 0.3 0.1 321.5%
Interest income 3.7 3.4 9.1%
Commission income 1.1 0.9 26.2%
Net assets 20.2 20.1 0.5%
Capital adequacy ratio (N1.1) 9.1% 8.3% 0.8 p.p.
19
49%
51%
BC Dekart inMoscow
BCInturavtoservisin Saint-Petersburg
Rental assets
84%
16%
ATS
Other
86%
14% Housing
Commercialproperties
39%
59%
2%
Comfort
Business
Premium
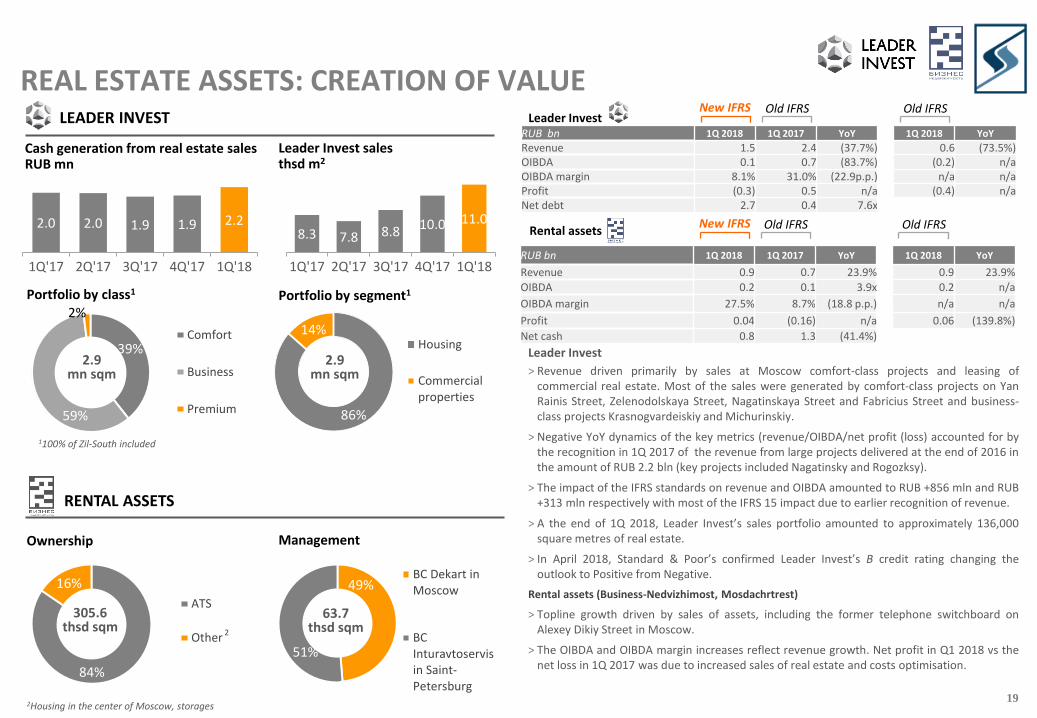
REAL ESTATE ASSETS: CREATION OF VALUE
2.9 mn sqm
2.9 mn sqm
1100% of Zil-South included
2 2
RENTAL ASSETS
Ownership Management
305.6 thsd sqm
63.7 thsd sqm
2Housing in the center of Moscow, storages
8.3 7.8 8.8 10.0 11.0
1Q'17 2Q'17 3Q'17 4Q'17 1Q'18
2.0 2.0 1.9 1.9 2.2
1Q'17 2Q'17 3Q'17 4Q'17 1Q'18
Cash generation from real estate sales RUB mn
Leader Invest sales thsd m2
LEADER INVEST
Portfolio by class1 Portfolio by segment1
Leader Invest
Leader Invest
> Revenue driven primarily by sales at Moscow comfort-class projects and leasing of commercial real estate. Most of the sales were generated by comfort-class projects on Yan Rainis Street, Zelenodolskaya Street, Nagatinskaya Street and Fabricius Street and business-class projects Krasnogvardeiskiy and Michurinskiy.
> Negative YoY dynamics of the key metrics (revenue/OIBDA/net profit (loss) accounted for by the recognition in 1Q 2017 of the revenue from large projects delivered at the end of 2016 in the amount of RUB 2.2 bln (key projects included Nagatinsky and Rogozksy).
> The impact of the IFRS standards on revenue and OIBDA amounted to RUB +856 mln and RUB +313 mln respectively with most of the IFRS 15 impact due to earlier recognition of revenue.
> A the end of 1Q 2018, Leader Invest’s sales portfolio amounted to approximately 136,000 square metres of real estate.
> In April 2018, Standard & Poor’s confirmed Leader Invest’s B credit rating changing the outlook to Positive from Negative.
Rental assets (Business-Nedvizhimost, Mosdachrtrest)
> Topline growth driven by sales of assets, including the former telephone switchboard on Alexey Dikiy Street in Moscow.
> The OIBDA and OIBDA margin increases reflect revenue growth. Net profit in Q1 2018 vs the net loss in 1Q 2017 was due to increased sales of real estate and costs optimisation.
New IFRS Old IFRS Old IFRS
New IFRS Old IFRS Old IFRS
RUB bn 1Q 2018 1Q 2017 YoY 1Q 2018 YoY
Revenue 1.5 2.4 (37.7%) 0.6 (73.5%) OIBDA 0.1 0.7 (83.7%) (0.2) n/a OIBDA margin 8.1% 31.0% (22.9p.p.) n/a n/a Profit (0.3) 0.5 n/a (0.4) n/a Net debt 2.7 0.4 7.6x
RUB bn 1Q 2018 1Q 2017 YoY 1Q 2018 YoY
Revenue 0.9 0.7 23.9% 0.9 23.9%
OIBDA 0.2 0.1 3.9x 0.2 n/a
OIBDA margin 27.5% 8.7% (18.8 p.p.) n/a n/a
Profit 0.04 (0.16) n/a 0.06 (139.8%)
Net cash 0.8 1.3 (41.4%)
2

20
2.30 2.84
1Q 2017 1Q 2018
Revenue, RUB bn
HIGH-TECH (RTI) AND ELECTRIC POWER GRIDS (BPGC) RTI
1Debt relating to government procurement (effectively zero interest rate) 2 “Radar” and “Manufacturing” segments as well JSC “Radio manufacturing plant in Yaroslavl” («Aircraft solutions») were previously included in the “Radio-technical systems” segment, current structure results from redistribution of the business units with an aim of increasing vertical integration within the Group
Segment ‘Radar’2
> RTI’s revenue declined in the first quarter of 2018 due to work being shifted to other quarters across a number of contracts in the Microelectronics and in the Manufacturing segment2, which was partially mitigated by revenue growth in the Radar segment.
> In the reporting quarter, RTI booked an inventory provision of RUB 0.2 billion, which led to a 0.5 percentage point decrease in the OIBDA margin.
> RTI Group’s net debt decreased by 4.7%, chiefly as a result of reduced borrowing in connection with the Defence Ministry’s gradual transition away from credit financing for defence procurements. RTI also has on its accounts additional funds earmarked for state defence orders amounting to RUB 12.1 billion that are not included in the net debt calculation.
> In February 2018, Yaroslavl Radio Factory began preparations for the initial production of aerospace equipment for Thales Alenia Space France, one of the leading global manufacturers of multiple types of satellites, payloads and equipment for spacecraft.
1.40% 1.40%
10.49% 10.84%
1Q'17 1Q'18
Transmission
Distribution
> BPGC’s revenue increased in 1Q 2018 due to indexation of tariffs for electricity transmission services that came into effect on 1 July 2017. In addition, as a result of legislative changes, the company began to receive income and to pay wholesale market load losses, whereas previously this amount was offset.
> On a like-for-like basis, OIBDA increased due to a one-off effect of payments under a court settlement. Net of this effect , we saw a decline in OIBDA and OIBDA margin as operating costs increased at a faster pace than revenue. These costs included an increase in prices and volumes of losses in distribution networks, costs for services provided by PJSC Federal Grid Company of Unified Energy System, wage indexation in 2017, and higher tax rates and the abolition of preferential treatment for movable property.
> Net profit increased by 11.7% to RUB 887 million and was affected by factors including an increase in amortisation (implementation of the investment programme) and a decrease in income from the placement of free cash. Nevertheless, growth of OIBDA led to an improvement in this indicator.
> As part of the Smart Grid project, six distribution points were reconstructed during the reporting period, 1.8 kilometres of new cable was laid and 4,700 smart meters were installed.
> Increase in capital expenditure was impacted by rollover work from 2017 on the reconstruction of the Ufa distribution network as well as costs related to technical connections of consumers.
Losses on distribution and transmission grids
BPGC New IFRS Old IFRS Old IFRS New IFRS Old IFRS New IFRS
RUB bn 1Q 2018 1Q 2017 YoY 1Q 2018 YoY
Revenue 6.6 8.0 (17.6%) 6.6 (17.6%)
OIBDA 0.1 0.2 (34.1%) 0.1 (66.5%)
OIBDA margin 2.2% 2.7% (0.5p.p.) 1.1% (1.6p.p.)
Profit/(loss) (1.3) (1.4) (5.8%) (1.4) (5.6%)
Net debt 28.6 28.9 (1.0%)
Share of debt related to state defence contracts1 0% 11.4% (11.4 p.p.)
RUB bn 1Q 2018 1Q 2017 YoY 1Q 2018 YoY
Revenue 5.0 4.6 9.6% 5.1 10.3%
OIBDA 1.7 1.6 7.5% 1.8 7.0%
OIBDA margin 34.6% 35.3% (13.4p.p.) 35.8% 0.5p.p.
Profit 0.9 0.8 11.7% 1.0 21.2%
CAPEX 0.6 0.6 (7.5%)
New connections, ‘000 4,061 3,791 7.1%
Connected power, MVt 78.9 66.2 19.2%

21
1 777 1 777 1 841 1 847 153 153
1Q 2017 1Q 2018
Abroad
Russia
Cosmos hotel
HOSPITALITY ASSETS AND PHARMACEUTICALS (BINNOPHARM) Hospitality assets
> Revenue at Sistema’s hospitality assets increased mainly due to the opening of the 243-room Holiday Inn Express Paveletskaya in November 2017 as well as a 10% revenue increase at Regional Hotel Chain (RHC) properties and a 12% increase in revenue at Hotel Cosmos
> Adoption of the new IFRS 16 standard, which requires the recognition of assets and liabilities for all leases, had a positive effect of RUB 10.4 million on OIBDA
> The group’s net loss increased to RUB 341 million following the opening of the Holiday Inn
Express Paveletskaya, as it has not yet reached full operational capacity.
> Sistema’s hospitality business continues to grow organically with a focus on the development of its own hotel brands. Working in partnership with Business Nedvizhimost, the company is developing CosmoStay-branded apartment hotels, with the first openings planned for the end of 2018. Cosmos Group’s first own-branded hotel is already under construction on Moscow’s Profsoyuznaya Street. Additionally, the opening of the 134-room Alabuga hotel in Tatarstan is planned for the second half of 2018
> In February 2018, Christian Meyer was promoted to the position of President of Cosmos Group. Mr. Meyer has more than 25 years of experience in hospitality industry, proceeded his career working with industry leaders such as Marriott Hotels International, InterContinental Hotels Group, Le Meridien Hotels & Resorts, and The Rezidor Hotel Group in Germany, England and Russia.
Number of hotel rooms by regions
4 049 3 771
69.0% 73.0%
31.0% 27.0%
1Q 2017 1Q 2018
Hospital
Commercial
Binnopharm
Revenue mix dynamics
> Revenue grew on the back of higher sales of the company's existing product portfolio such as interferon products as well as newly registered product Moxifloxacin.
> Sales of products from third-party manufacturers, such as Dorithricin, also continued to rise.
> The share of revenue accounted for by sales of own products was in line with 2017 performance at approximately 75%.
> Strong OIBDA dynamics in 1Q 2018 thanks to new product sales and increased sales of Binnopharm’s own products, notably Moxifloxacin and interferon products.
> As planned, Binnopharm made the final RUB 400 million payment in February 2018 toward the acquisition of Alpharm, which produces two over-the-counter (OTC) products, Kipferon and Prosopin. The payment did not require additional external borrowing.
> Binnopharm’s research and development unit developed and submitted for registration several new drugs, the first of which will be available for sale by the end of 2018.
New IFRS Old IFRS New IFRS Old IFRS Old IFRS
1
11Q 2018 results for Binnopharm are not presented excluding the impact of the new IFRS standards
RUB bn 1Q 2018 1Q 2017 YoY 1Q 2018 YoY
Revenue 1.0 0.8 16.6% 1.0 16.6%
OIBDA 0.08 0.07 7.5% 0.07 (6.8%)
OIBDA margin 8.2% 8.9% (0.7pp) 7.1% (1.8p.p.)
Loss (0.3) (0.2) n/a (0.4) n/a
Net debt 4.5 3.7 22.0%
Room capacity 4,049 3,771 7.4%
RUB bn1 1Q 2018 1Q 2017 YoY
Revenue 0.4 0.3 27.8%
OIBDA 0.12 0.04 208.2%
OIBDA margin 28.4% 11.8% 16.6p.p.
Profit 0.00 (0.03) 100.5%
Net debt 1.9 1.7 6.8%

22
IR Department Tel. +7 (495) 730 66 00
www.sistema.ru